Super A&P-2004
108
Super A&P-2004 Ready for the Leap Annual Report 2003 For The Year Ended March 31, 2003
-
Upload
khangminh22 -
Category
Documents
-
view
1 -
download
0
Transcript of Super A&P-2004
Super A&P-2004Ready for the Leap
Annual Report 2003For The Year Ended March 31, 2003

1 | ITOCHU Corporation.
ITOCHU Corporation
ContentsTwo-Year Financial Highlights ............................................................................................................. 001Dear Stockholders and Customers ...................................................................................................... 002Final Review of the Mid-term Plan, A&P-2002 .................................................................................... 007New Mid-term Plan, Super A&P-2004 ................................................................................................. 009Special Feature:
Roles of ITOCHU Corporation .......................................................................................................... 012ITOCHU’s China Strategy ................................................................................................................. 013Commercialization of Innovative Technologies ................................................................................ 014New Management Benchmark ......................................................................................................... 016Retirement Pension Plan Reform ...................................................................................................... 017
Division Companies at a Glance .......................................................................................................... 018Division Companies ............................................................................................................................. 020Overseas Operations ........................................................................................................................... 034Headquarters ....................................................................................................................................... 036Corporate Governance ........................................................................................................................ 038Environmental Conservation Activities and Social Contribution ......................................................... 040Major Subsidiaries and Associated Companies .................................................................................. 042Global Network/Bank List .................................................................................................................... 046Corporate Officers ............................................................................................................................... 048Organization ......................................................................................................................................... 050Financial Section .................................................................................................................................. 051Stock Information ................................................................................................................................ 102Corporate Information .......................................................................................................................... 103
Since its foundation in 1858, ITOCHU Corporation has expanded the scope of its
business from the import, export, and wholesale of textiles and to a wide range of
businesses from natural resource development to consumer goods, and including
investment and project planning. Recently, in response to rapid changes in the eco-
nomic and business environment, ITOCHU has also undertaken fundamental reforms
to its profit and financial structure.
From April 2001 to March 2003, we implemented the A&P-2002 Mid-term Plan,
under which we aggressively promoted the “selection and concentration” of busi-
nesses and improved our financial structure based on our A&P (Attractive and
Powerful) strategy.
Following the progress made under A&P-2002, we started Super A&P-2004, a new
mid-term plan for the period from April 2003 to March 2005, which aims for a big leap
in profitability. The basic policy of the new plan is to continue strengthening our profit-
driving A&P segments. With this in mind, we will focus on the “consumer and retail
related” sector including textiles and food where ITOCHU has a strong market pres-
ence, as well as the China business, information and media, solutions, and natural
resources. Furthermore, to drive growth in the future, we intend to develop new busi-
nesses relating to innovative technologies in fields such as biotechnology and nan-
otechnology.
Corporate Profile
※Forward Looking Statements (P103)

Net Income (Loss)
Billions of Yen
‘99 ‘00 ‘01 ‘03 ‘02
100
-100
50
-50
0
Total Assets and Net Interest-Bearing Debts
Billions of Yen
‘99 ‘00 ‘01 ‘03 ‘02
8,000
0
6,000
2,000
4,000
Total Assets Net Interest-Bearing Debts
Gross Trading Profit
Billions of Yen
‘99 ‘00 ‘01 ‘03 ‘02
800
0
600
200
400
Trading Income*
Billions of Yen
‘99 ‘00 ‘01 ‘03 ‘02
120
0
100
60
40
20
80
For the year:Total trading transactions ..............................................................................Gross trading profit ........................................................................................Gross trading profit ratio (%) ..........................................................................Selling, general and administrative expenses .................................................Provision for doubtful accounts .....................................................................Trading income* ............................................................................................Net income ....................................................................................................
At year-end:Total assets ...................................................................................................Stockholders’ equity ......................................................................................Net interest-bearing debts** ...........................................................................
Per ten shares (Yen, U.S. dollars):Net income ....................................................................................................Cash dividends ..............................................................................................
Ratio:Asset turnover (Times) ...................................................................................ROA(%) .........................................................................................................ROE (%) ........................................................................................................Ratio of stockholders’ equity to total assets (%) .............................................Net debt-to-equity ratio (Times) .....................................................................Interest coverage (Times) ...............................................................................
ITOCHU Corporation | 1.
Two-Year Financial HighlightsITOCHU Corporation and SubsidiariesYears ended March 31
$87,0354,709
(3,731)(140)838167
37,3253,546
16,847
1.090.42
11,400,471578,867
5.08(465,519)(16,831)96,51730,191
4,752,319397,668
2,296,398
21250
2.30.68.48.45.82.1
(8.2)%(2.2)
(3.7)0.14.4
(33.5)
(5.6)7.2
(11.8)
(38.2)0.0
¥10,461,620566,037
5.41(448,473)(16,845)
100,71920,078
4,486,405426,220
2,025,048
13150
2.30.44.99.54.82.7
Millions of Yen Millions ofU.S. dollars
In/Decrease%
2003 20032002 2003/2002
The Japanese yen amounts for the year ended March 31, 2003, have been translated into United States dollar amounts, solely for the convenience of the reader, at the rate of¥120.20 = U.S.$1, the official rate of The Bank of Tokyo-Mitsubishi, Ltd., as of March 31, 2003.All figures are for fiscal years, which begin on April 1 of the years preceding and extend through March 31.Total trading transactions and trading income are represented in accordance with Japanese accounting practice.Total trading transactions in the consolidated statements of income consist of sales with respect to transactions in which the companies act as principal and the total amount oftransactions in which the companies act as agent.
* Trading income = Gross trading profit + Selling, general and administrative expenses + Provision for doubtful accountsThroughout this report, except for the Financial Section, all trading income asterisked refers to that defined by this calculation formula.
**Net interest-bearing debts = Interest-bearing debts - Cash, cash equivalents and time deposits

2 | ITOCHU Corporation.
Consolidated Results for the Year Ended March2003 —Trading income* again surpasses ¥100billion, adjusted profit hits record high The Japanese economy in fiscal year 2003 endedMarch 31, 2003 showed some signs of a turn-around in the first half, but in the second half experi-enced a downturn. Reflecting deepening deflation,nominal domestic GDP declined 0.7% over the pre-vious term, the second straight year of negativegrowth. In overseas economies, Asia continued itsrobust performance, but the U.S. was lackluster onthe whole and Europe remained sluggish.
Our performance in fiscal year 2003 was not satis-factory, but even in such a harsh economic environ-ment, we were able to set the stage for futuregrowth.
Total trading transactions decreased by ¥938.9
billion, or 8.2%, compared to the previous fiscalyear. The Aerospace, Electronics & MultimediaCompany witnessed a drop off in sales due to theslump in the domestic IT industry. Sales of the Plant,Automobile & Industrial Machinery Company; theEnergy, Metals & Minerals Company; and theConstruction & Realty Division also decreased year-on-year due to stagnant markets and our efforts toreduce less profitable transactions. Total tradingtransactions were further adversely affected by thetransfer of our steel business in the previous fiscalyear to equity-method affiliate Marubeni-ItochuSteel, Inc. Gross trading profit decreased by ¥12.8billion, or 2.2%, to ¥566.0 billion compared to theprevious fiscal year, but we were able to boost thegross trading profit ratio by 0.33 percentage pointto 5.41%. Our continuing efforts in recent years to
Dear Stockholders and Customers

ITOCHU Corporation | 3.
reduce less profitable transactions and under-per-forming assets have brought about solid improve-ments to our gross trading profit ratio.
Reductions in selling, general and administrativeexpenses of ¥17.0 billion, or 3.7%, have contributedto an increase in trading income* of ¥4.2 billion, up4.4% year-on-year to ¥100.7 billion recovering trad-ing income* to the ¥100 billion mark. We also post-ed improvements in net financial expenses and equi-ty in earnings of associated companies. A sharpdrop in stock prices near the fiscal year-end, howev-er, forced us to take considerable devaluation anddisposal losses on marketable securities totaling¥44.7 billion, which led to a net income of ¥20.1billion, down by ¥10.1 billion, or 33.5%, from theprevious fiscal year.
In addition to the above, we also pay close atten-tion to another indicator of profitability, adjustedprofit (gross trading profit + selling, general, andadministrative expense + net financial expenses +equity in earnings (losses) of associated companies).This key indicator hit an all-time high, increasing by¥12.8 billion to ¥115.5 billion, as we have continuedto steadily boost our basic earning power.
Resource Allocation Prioritized Based on A&PStrategy Under our previous mid-term plan, A&P-2002, whichcovered the period from April 2001 to March 2003,we worked to reform our profit structure based onour A&P strategy. We worked to strengthen overallprofitability by allocating assets to priority areas inwhich ITOCHU can offer “attractive” products andservices for customers and in which we exhibit“powerful” capabilities. Specifically, we prioritized asA&P segments four business segments—informa-tion and multimedia, consumer and retail related,natural resource development, and financial servicesas well as the two regions of North America andAsia.
During this two-year period, the ratio of A&Passets to total assets increased from 44% to 50%.And, under the tough economic conditions notwith-standing, consolidated net income from A&Psegments grew by ¥5.2 billion compared to the pre-vious fiscal year to ¥50.7 billion. Thus, A&P seg-
ments have grown to become the unquestionabledrivers of ITOCHU’s profits.
Maximization of Group Value by StrengtheningGroup Companies and Financial PositionITOCHU is strengthening its group companies tomake them the key players in our overall profit.
To achieve this objective, under A&P-2002, weworked to maximize the value of the entire group;restructuring unprofitable companies and withdrawalof under-performing operations were one initiative.During the two-year period, the number of consoli-dated companies decreased by 89 to 651. Thisnumber represents less than two-thirds of the totalas of March 1999, which was 1,027. Over the two-year period of A&P-2002, net income from sub-sidiaries and affiliates, excluding overseas tradingsubsidiaries, grew from ¥23.1 billion (net of ¥64.7billion in profits from companies in the black and¥41.6 billion in losses from those in the red) to ¥47.4billion (net of ¥62.1 billion in profits and ¥14.7 billionin losses). During the same period, the ratio ofprofitable companies, including overseas tradingsubsidiaries, to the total number of consolidatedcompanies jumped from 73.5% to over 80%(80.2%).
Additionally, we have made steady progress instrengthening our consolidated financial positionover the past two years. We have reduced totalassets and interest-bearing debts largely ahead ofour original plan. Total assets have been reducedby around ¥670 billion to ¥4,486.4 billion, while netinterest-bearing debts have been reduced by over¥500 billion to almost ¥2 trillion. At the same time,stockholders’ equity increased by over ¥100 billionto ¥426.2 billion at the end of March 2003, as weaccumulated retained earnings and offered newshares in July 2002 with an effect of ¥54.8 billionincrease in stockholders’ equity. As a result of theseactivities, the stockholders’ equity ratio increasedfrom 6.1% to 9.5% and our net DER (net debt-to-equity ratio) improved from 8.0 to 4.8. Nevertheless,we are not satisfied with the current level of stock-holders’ equity. We plan to increase it further byretaining earnings, while maintaining consistent andstable dividend payments to our stockholders.

4 | ITOCHU Corporation.
Doubling Profits with Super A&P StrategyBased on the progress made under A&P-2002, webegan implementing Super A&P-2004, a new two-year mid-term plan covering the period from April1, 2003 to March 31, 2005.
Under the new plan, we will further enhance thestrategies laid out in the previous A&P plan in orderto more fully satisfy our customers, stockholders,employees and society as a whole. We plan to con-tinue strengthening our existing designated profit-driving A&P segments (information and multimedia,consumer and retail related, natural resource relat-ed, financial services, North America and Asia).
With the new plan, at the same time, we alsoregard the consumer and retail related sector as a“super powerful” segment in which ITOCHU has astrong market presence, and the China business,information and media, solutions, and naturalresources as “attractive” businesses to strengthen.Further, as a driving tool for the future, we intend todevelop new businesses that are related to innova-tive technologies in fields such as biotechnologyand nanotechnology.
For the two-year period under the new plan,we intend to increase the ratio of A&P assets tototal assets from 50% to 74% including assetsin the newly nominated “highly-efficient” seg-ment from fiscal year 2004, and consolidatednet income from A&P segments from ¥50.7 bil-lion to ¥88.0 billion. To reach these goals, we willadvance our “selection and concentration” strategyby analyzing the business efficiency of 120 busi-ness units and applying one of three strategies:“profit doubling,” “2% & 8%” (for semi-core busi-ness units in which we target an ROA of 2% and arisk return index (RRI) of 8%), or “reduction or exit.”We intend to both increase profits and strengthenour financial position by reducing total assets and
aggressively reallocating assets.
Initiatives to Bolster Super A&P Strategy We have set out four major initiatives for SuperA&P-2004.
Executive Vice President, Makoto Kato, has takenon the responsibility for supervising the consumerand retail related sector, our designated “superpowerful” segment in which ITOCHU enjoys anoverwhelming competitive advantage. He will man-age a cross-company project system that encom-passes the three fields of textiles; foods; andchemicals, forest products, and general merchan-
dise; and will work to inte-grate all businesses that areclosely related to daily con-sumer needs. ITOCHU isadmittedly one of the largesttextile companies in theworld. Our food businessboasts a top-tier domestic
distribution and wholesale network, and our forestproducts and general merchandise business has astrong presence in the construction and housingmaterials market. In addition, each of these busi-nesses is characterized by a vertical synthesis ofupstream, midstream and downstream business-es; that is, the integration of raw materials procure-ment and production, wholesaling, distribution andprocessing, and retailing. We have decided that itis time for us to leverage the sizable synergies thatpotentially exist in the three fields, and to strength-en horizontal syntheses through inter-segmentconsumer related projects.
For our second initiative, we set up the ChinaMarket Global Development Office to bolster ouroverall China-related business. The word “global”was included in the department name to indicatethat our global strategy is centered on China. Inother words, all ITOCHU teams in Japan, the U.S.,and Europe come together as one to tackle busi-nesses related to China. This approach differs con-siderably from the conventional business model oftrading companies, which has been based onbilateral trade between Japan and China. ITOCHUhas a longer history in China than any other
We also regard the consumer and retail related sec-tor as a “super powerful” segment in whichITOCHU has a strong market presence.

ITOCHU Corporation | 5.
Japanese trading company, and boasts a networkof 14 local offices and more than 200 companiesin which we have invested. We will develop ourglobal business based on a “leveraged growthstrategy” in which partners in global alliance mutu-ally utilize strengths of the others, and will therebycapitalize on our strength in China to promotelarge-scale businesses on a global basis togetherwith powerful partners.
Our third initiative involves developing innovativetechnologies, including biotechnology and nan-otechnology. We already have in place theInnovative Technology Business DevelopmentOffice, and it plays a central role in gathering andanalyzing information on promising technologiesfrom all over the world. Our focus here is on creatingnew businesses based on new technologies thatleverage ITOCHU’s strengths, an approach to applynewly developed technologies into businesses,which differs from simply developing new technolo-gies. Although many promising fields exist, we seea tremendous business opportunities in the con-sumer and retail related sector. In addition to a vari-ety of potential applications of biotechnology tomedicine and food, webelieve we will be able to cre-ate a number of truly innova-tive businesses. For instance,we have an alliance withHitachi Ltd. to develop appli-cations for their “µ-chip,” theworld’s smallest wireless ICtag. We see a great potentialto develop new businesses that combine the µ-chipwith the nearly 120 brands we handle. We havealready experimented with applications for severalsports and fashion brands that would improveinventory efficiency and prevent counterfeiting. Iexpect such initiatives will demonstrate ITOCHU’screativity and ambition in taking on innovative tech-nologies.
Our final initiative represents an evolution fromthe previous mid-term plan. We have significantlyincreased the scale of funds available for strategicinvestments because of the current imperative toobtain quality assets in order to strengthen busi-
nesses with high growth potential in the future.Specifically, we have increased the fund for strate-gic investments from ¥40 billion to ¥200 billion interms of assets. In addition, the Super A&PStrategic Investment Committee helps make timelyand appropriate decisions regarding strategicinvestments, including mergers and acquisitions toreinforce businesses, acquisitions of new technolo-gies, and business expansion in the Asian region.Priority areas for fund allocation will be A&P seg-ments that are expected to contribute to our targetof profit doubling and mid- to long-term develop-ment projects. At the same time, we will unhesitat-ingly reduce the assets of or withdraw from busi-ness units that exhibit little growth potential andthose that fail to enhance efficiency.
Aiming to Become the Strongest CorporateGroupOur full-scale reforms began with the Global-2000,which was executed from April 1999 to March2001. In fiscal year 2000 under this plan, wewrote off large bad debts and other negative lega-cies totaling ¥303.9 billion. After that, under A&P-
2002, we reorganized our profit structure andrestructured our management system. Owing tothese reforms, we substantially improved bothprofitability and financial position, elevatingemployees’ sensibility to return against risks. Now,I have the sense that the big gears inside ITOCHUthat were long covered with rust are beginning toinch forward, which resulted from four years ofeffort by our employees and group companies.These huge, heavy gears are regaining their fueland beginning to enter a phase of acceleration.Riding on this momentum, we are ready to take abig leap toward higher profitability.
These huge, heavy gears are regaining their fuel andbeginning to enter a phase of acceleration. Ridingon this momentum, we are ready to take a big leaptoward higher profitability.

6 | ITOCHU Corporation.
With strong business foundations in such high-growth areas as the consumer and retail relatedsegment and China-related business, ITOCHU isaiming to become the strongest group by collabo-rating internally and optimizing business structures.We have an ambitious goal ofcreating a group whose com-panies rank at the top of theirrespective industries andwhich generates a consoli-dated net income of ¥100 bil-lion. Originally, we planned toachieve this goal by March2005. However, givenincreasing uncertainties in theglobal economy, lingeringdeflation in Japan and theindeterminate impact ofSARS, we have decided to revise this plan back oneyear. In fiscal year 2005, we will strive to produceconsolidated net income of ¥75 billion, prior tothis final goal.
Corporate Governance and ComplianceIn order to promote greater transparency in man-agement, we set up an Advisory Board andstrengthened the role of the Board of CorporateAuditors. We also have in place a Group AuditCommittee, which is composed of auditors frommajor group companies, to more effectively monitorthe activities of the ITOCHU Group. A ComplianceCommittee led by the Chief Compliance Officer wasalso established to ensure compliance with all laws,regulations and policies.
We will not, however, become complacent. Theessence of corporate governance and faithful com-pliance does not lie in formality. Every executive andemployee must practice strict self-control, and beaware that people tend to prioritize their own bene-
fit. Without this in mind, eventhe best system would notguarantee real improvement.
Since assuming the posi-tion of president, I have con-tinuously emphasized theimportance of a “clean, hon-est and beautiful” businessattitude. We are now enteringa growth stage in whichethics will play greater rolethan ever before. I will striveto imprint this idea firmly in
the DNA of ITOCHU.
Thank you very much for the trust you have placedin us. To reward this trust, I promise to makeITOCHU a more attractive company to our cus-tomers and a more powerful company for our stake-holders.
July 2003
Uichiro NiwaPresident and Chief Executive Officer
Since assuming theposition of president, Ihave continuouslyemphasized the impor-tance of a “clean, honestand beautiful” businessattitude.

Final Review of the Mid-term Plan, A&P-2002
ITOCHU Corporation | 7.
From April 2001 to March 2003, ITOCHU executedA&P-2002 to aggressively tackle reforms that wouldmove it to reach beyond conventional trading compa-ny’s business models and develop new businessesthrough the A&P strategy**. In A&P-2002, we set spe-cific numerical goals, some of which we met, othersthat we fell short of. However, overall we believe it isfair to say that we have consistently enhanced ourfinancial position and basic earning power.
Specifically, we exceeded our targets for reductionsin total assets and interest-bearing debts. We did notreach net income goal mainly due to severe economicconditions including the stagnant stock market inJapan.
Creating a New Business Model – “Reorganizationof the Profit Structure”As a result of a large amount of disposal and devalua-tion losses on marketable securities caused by a sharpdrop in stock prices around the end of the fiscal year,our net income in fiscal year 2003 stood at ¥20.1 billion,which represented approximately 40% of our goal of¥50 billion. Despite this, our inherent earning power hasbeen steadily strengthened, which is witnessed by ahigh-level of trading income and a record-high adjustedprofit. ITOCHU enjoys top-class profitability amongmajor trading companies.
1) Continued Implementation of A&P StrategyTo reduce total assets and optimize our business port-folio, we focused on reducing under-performing assetsto aggressively shift to A&P assets. However, A&Passets remained at the same level, while Non-A&Passets decreased by ¥662.9 billion to ¥2,235.5 billionduring the two-year period. The ratio of A&P assets tototal assets steadily increased from 44% to 50%,though it did not reach our stated goal of 55%.
Consolidated net income earned from our A&P seg-ments, excluding one-time profits, increased by ¥5.2 bil-lion to ¥50.7 billion over the previous fiscal year, thoughit did not make the final step to attain our goal of ¥62.0billion due to the slump in our business in North Americaand the domestic deflationary conditions. On the otherhand, among the non-A&P assets, during the two year-period, we successfully reduced a total of ¥272.2 billionof under-performing assets in areas such as Plant, auto-mobile & industrial machinery; Chemicals, forest prod-ucts & general merchandise; and Construction & realty
Trading Income* and Adjusted Profit
Adjusted profit: Gross trading profit + Selling, general and administrative expense + Net financial expenses + Equity in earnings (losses) of associated companiesYears ended March 31
Trading IncomeBillions of Yen
‘99 ‘00 ‘01 ‘02 ‘03
Adjusted Profit120
0
40
60
80
20
100
59.4
37.3
70.8
108.1 102.8115.5
44.7
108.696.5 100.7
P/L (For fiscal years):Net income ....................
B/S (As of March 31):Total assets ....................Interest-bearing debts ....Net interest-bearing
debts*** .......................Stockholders’ equity .......
Ratio (For fiscal years):ROA**** ..........................ROE**** ..........................Net DER .........................Equity ratio .....................
Billions of Yen
Starting Point
2001
The First Year
2003
The Second Year(Plan at FY2003 start)
2002
20.1 (50.0)
4,486.4 (4,650.0)2,574.4 (2,750.0)
2,025.0 (2,250.0)426.2 (440.0)
0.43% (1.1%)4.9% (11.4%)
4.8 times (5.1 times)9.5% (9.5%)
30.2
4,752.32,794.7
2,296.4397.7
0.61%8.4%
5.8 times8.4%
70.5
5,157.53,070.5
2,536.8316.9
1.26%23.6%
8.0 times6.1%
Results of A&P-2002 (Consolidated-basis)
**A&P StrategyStrategy aimed at enhancing profitability by intensivelyallocating assets to the business areas in which ITOCHUcan offer “Attractive” products and services for our cus-tomers, and shows “Powerful” capabilities. In A&P-2002,we selected as A&P segments four business segments:Information and multimedia, Consumer and retail related,Natural resource development, Financial services; and twogeographic regions: North America and Asia.
Gross trading profit ..................
Gross trading profit ratio (%) ....
Trading income before provision for doubtful accounts
Trading income* ...
Adjusted profit .....
Billions of Yen
ITOCHUCorporation
MitsubishiCorporation
Mitsui &Co., Ltd.
SumitomoCorporation
MarubeniCorporation
718.6
5.39
123.2
100.6
177.2
569.8
4.30
112.0
97.7
138.8
496.4
5.38
90.1
89.3
100.3
424.6
4.83
79.0
73.4
75.7
566.0(-2.2%)
5.41%(+0.33)
117.6(+3.7%)
100.7(+4.4%)
115.5(+12.4%)
( ): Increase/Decrease from the previous fiscal yearAdjusted profit: Gross trading profit + Selling, general and administrative expense + Net finan-cial expenses + Equity in earnings (losses) of associated companies
*** Net interest-bearing debts = Interest-bearing debts - Cash, cash equivalents and timedeposits
**** ROA and ROE were calculated from average amounts of total assets and stockholders’equity at the beginning of year and at the end of year. Five Major General Trading Companies’ Financial
Results in Fiscal Year 2003

8 | ITOCHU Corporation.
2) Maximization of Group ValueNet income from subsidiaries and associates, excludingoverseas trading subsidiaries, doubled from ¥23.1 bil-lion in fiscal year 2001 to a record-high of ¥47.4 billion,net of a ¥62.1 billion profit from profitable companiesand a ¥14.7 billion loss from unprofitable companies.During the two-year period, the ratio of profitable com-panies, including overseas trading subsidiaries, to totalnumber of consolidated companies increased by 6.7percentage points to 80.2%. As a result of our aggres-sive restructuring for two years, the total number ofconsolidated companies including overseas tradingsubsidiaries decreased by 89 to 651, consisting of 468subsidiaries and 183 associated companies as ofMarch 2003.
3) Improvement of Consolidated Financial PositionOver two years we have reduced our consolidated totalassets by ¥671.1 billion and net interest-bearing debtsby ¥511.8 billion. We made substantial strides in finan-cial position, well ahead of schedule, and our net DER(net debt-to-equity ratio) improved from 8.0 times to4.8 times. Our consolidated stockholders’ equityreturned to over ¥400 billion for the first time in fiveyears, standing at ¥426.2 billion as of March 2003,despite not reaching our goal of ¥440 billion. Althoughthere was a ¥54.8 billion increase in stockholders’ equi-ty due to our issue of new shares in July 2002, it waspartly offset by the decrease from the previous fiscalyear in accumulated other comprehensive incomemainly due to a ¥20.6 billion deterioration in foreign cur-rency translation adjustments, which resulted from astronger yen at the end of the fiscal year, and a ¥17.8billion deterioration in unrealized gains/losses on securi-ties due to the stagnant stock market in Japan.
4) Promotion of Overseas Regional and MarketStrategies
We have strengthened the regions of North Americaand Asia, positioning them as A&P segments (see page34 for details). Our business in North America for fiscalyear 2003 shrank in net income compared to that twoyears earlier. Despite good business results in suchfields as distribution of tires and wholesale of buildingmaterials, the slumps in auto leasing and small-sizepower generator businesses and a change in account-ing methods for goodwill adversely affected overallresults. On the other hand, we successfully strength-ened the highly efficient machine maintenance businessfor power plants and bottlers. In Asia, although theconsumer financing business decreased its growthrate, we were able to expand local and regional tradingand reinforce our base for growth centering on China(see page 13 for details).
Building Management Structure to Support a NewITOCHU Group – “Reorganization of theManagement System”Along with reorganizing our profit structure, we havedevoted ourselves to innovating our management sys-tem.
First, we improved a divisional management systemto establish autonomous management in each DivisionCompany. In the area of human resource strategy, weallocated valuable human resources to group compa-nies to include them as a core part of ITOCHU’s groupprofit structure. We further promoted training programsto train capable overseas national staff for managementpositions, most notably through our Asian LeadershipProgram. We also made steady progress both in cor-porate governance (see page 38-39 for details) and inrisk management (see page 16 for details).
Allocation of Resources to A&P Segments (Assets)
Consolidated Net Income Earned from A&P Segments
Information and Multimedia ..............Consumer and Retail Related ...........Natural Resource Development ........Financial Services .............................North America ..................................Asia .................................................Total A&P .........................................Total A&P to total assets ..................Other “highly-efficient” segments ......Total A&P and other “highly-efficient”
segments to total assets ...............Total non-A&P .................................
Billions of Yen
518.61,080.0
242.9233.2184.4
—2,259.1
44%—
—2,898.4
486.11,025.2
354.5163.1154.269.7
2,252.850%
—
—2,235.5
430.01,160.0
410.0180.0200.080.0
2,460.055%
410.0
64%1,580.0
500.01,240.0
460.0220.0280.080.0
2,780.063%
460.0
74%1,160.0
As of March 31
Results Results
2001 2003 2004 2005Plan Plan
Information and Multimedia ..............Consumer and Retail Related ...........Natural Resource Development ........Financial Services .............................North America ..................................Asia .................................................Total A&P .........................................Total A&P to net income ..................Other “highly-efficient” segments ......
Billions of Yen
23.615.47.53.06.0—
55.579%
—
14.322.39.24.0
-2.02.9
50.7252%
—
8.030.010.05.02.03.0
58.0129%
8.0-10.0
14.038.013.010.08.05.0
88.0117%
10.0-15.0
Years ended March 31
Results Results
2001 2003 2004 2005Plan Plan
and logistics services, largely improving net income(loss) from these areas from a loss of ¥51.5 billion to aprofit of ¥0.7 billion.
ITOCHU Corporation | 9.
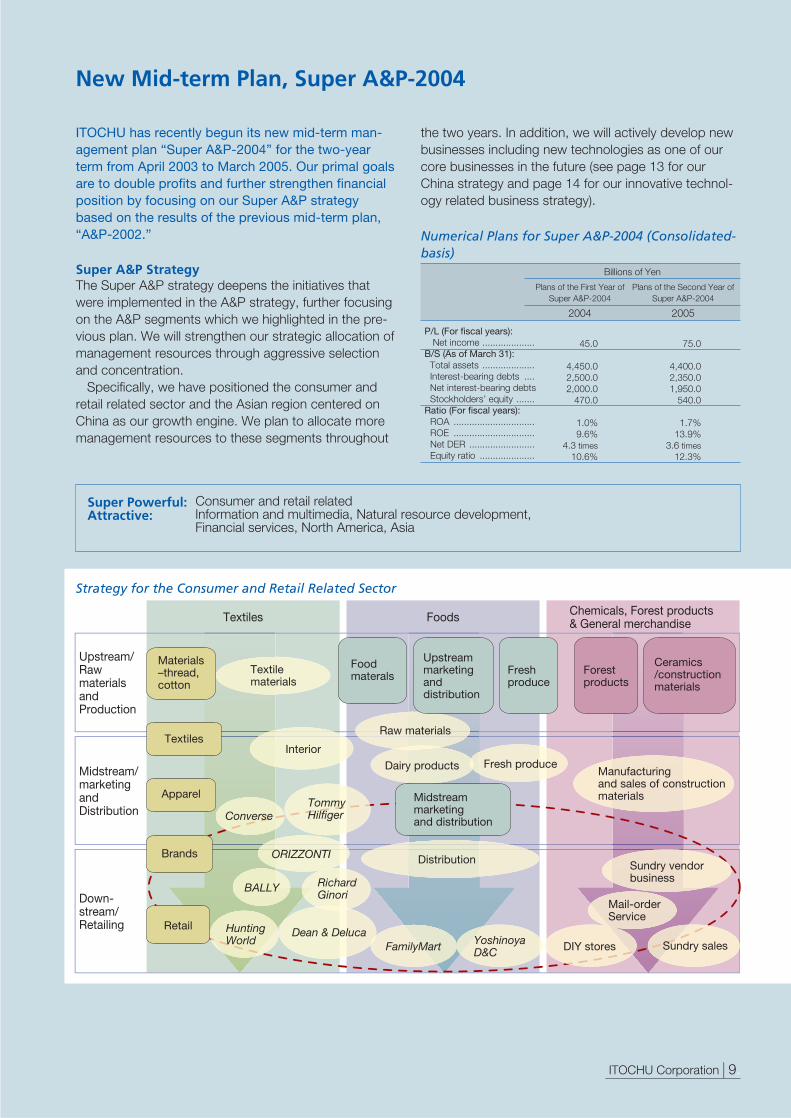
ITOCHU has recently begun its new mid-term man-agement plan “Super A&P-2004” for the two-yearterm from April 2003 to March 2005. Our primal goalsare to double profits and further strengthen financialposition by focusing on our Super A&P strategybased on the results of the previous mid-term plan,“A&P-2002.”
Super A&P StrategyThe Super A&P strategy deepens the initiatives thatwere implemented in the A&P strategy, further focusingon the A&P segments which we highlighted in the pre-vious plan. We will strengthen our strategic allocation ofmanagement resources through aggressive selectionand concentration.
Specifically, we have positioned the consumer andretail related sector and the Asian region centered onChina as our growth engine. We plan to allocate moremanagement resources to these segments throughout
the two years. In addition, we will actively develop newbusinesses including new technologies as one of ourcore businesses in the future (see page 13 for ourChina strategy and page 14 for our innovative technol-ogy related business strategy).
New Mid-term Plan, Super A&P-2004
Super Powerful: Consumer and retail relatedAttractive: Information and multimedia, Natural resource development,
Financial services, North America, Asia
P/L (For fiscal years):Net income ....................
B/S (As of March 31):Total assets ....................Interest-bearing debts ....Net interest-bearing debtsStockholders’ equity .......
Ratio (For fiscal years):ROA ...............................ROE ...............................Net DER .........................Equity ratio .....................
Billions of Yen
Plans of the First Year ofSuper A&P-2004
2004
Plans of the Second Year ofSuper A&P-2004
2005
75.0
4,400.02,350.01,950.0
540.0
1.7%13.9%
3.6 times12.3%
45.0
4,450.02,500.02,000.0
470.0
1.0%9.6%
4.3 times10.6%
Numerical Plans for Super A&P-2004 (Consolidated-basis)
Upstream/Raw materials and Production
Midstream/ marketing and Distribution
Down-stream/Retailing
Strategy for the Consumer and Retail Related Sector
Foodmaterals Fresh
produce
Yoshinoya D&CFamilyMart
Mail-order Service
Textile materials
ORIZZONTI
BALLY Richard Ginori
Interior
Raw materials
Dairy products Fresh produce
Forest products
Dean & Deluca
Converse
Sundry salesDIY stores
Sundry vendor business
Midstream marketing and distribution
Distribution
Tommy Hilfiger
Ceramics /construction materials
Manufacturing and sales of construction materials
Hunting World
Textiles Foods Chemicals, Forest products & General merchandise
Materials–thread,cotton
Textiles
Apparel
Brands
Retail
Upstream marketing and distribution

10 | ITOCHU Corporation.
Acceleration of Reallocation of Assets and OptimalUse of Funds for Strategic InvestmentsIn Super A&P-2004, we will more dynamically imple-ment selection and concentration. In order to do this,we have methodically analyzed our 120 business units,classifying them into three groups: “highly-efficient”units (with over 2% of ROA and 8% of RRI), “semi-effi-cient” units (with over 2% of ROA or 8% of RRI) and“low-efficient” units. We will apply the “profit doubling”strategy to the highly-efficient units, the “2%&8%” strat-egy to the semi-efficient units to be improved to meetboth criteria. Low-efficient units are to be further classi-fied into either the “2% & 8%” or the “reduction or exit”strategy. Businesses to be fostered mid- to long-termincluding natural resource development will be sepa-rately dealt with. This process will be applied to all busi-ness units in ITOCHU including ones in A&P segments.Thus, there is a possibility of any units in A&P segmentsbeing reduced or exited, and vice versa, aiming to allo-cate more assets to efficient units.
“Profit doubling” StrategyThis strategy is to be applied to the highly-efficientunits. Focus will be on increasing profits, through anincreased asset base.
These units will have a top priority in the allocation offunds for strategic investments, which consist of a¥200 billion of total assets. Strengthening will includeacquisition of high quality assets by M&As and supportof new projects.
“2% & 8%” StrategyThe 2% & 8% strategy is to be applied to the semi-effi-cient units and relatively higher bracket of the low-effi-cient units with over 1% of ROA and over 4% of RRI.Primary focus will be on improving efficiency of currentassets. At the same time, these units will seek to reach2% in ROA and 8% in RRI by reducing current assetsand increasing alternative assets. New investments willbe allowed only as a replacement to the low-efficientassets, thus without increasing in the unit’s assets.
“Reduction or exit” StrategyThe reduction or exit strategy is to be applied to thelow-efficient units.
The headquarters will continuously monitor asset effi-ciency to ensure the reduction in assets and interest-bearing debts.
Funds for strategic investments: We have prepared fundsfor strategic investments composed of ¥200 billion of totalassets. By accelerating our investments in highly strategicareas, we aim to promote intensive allocation of manage-ment resources.
Goals of Super A&P-20041) Optimization of our Asset Portfolio and ProfitGrowth in A&P SegmentsOur target is to increase the ratio of A&P assets to totalassets from the current 50% as of March 31, 2003 to63% as of March 31, 2005, with consolidated netincome earned from A&P segments increasing from thecurrent ¥50.7 billion to ¥88 billion.
As a result of our efforts to reorganize the non-A&Passets, we have seen some “highly-efficient” assetsemerging from the non-A&P segments. We will pursuegrowth in profit from these assets, positioning them asgrowth areas next to A&P segments (see page 8 forresults and plans).
Highly-efficient Semi-efficient Low-efficient
Analysis by Segments
(RRI:Risk Return Index)8%
2%
(ROA)
2% & 8%
Profit doubling
Reduction or exit
-20.0% -10.0% 0.0% 20.0% 30.0%10.0% 40.0% 50.0%
15.0%
-10.0%
10.0%
0.0%
-5.0%
5.0%
Risk Return Index (RRI) = Net Income / Risk assetsRisk Assets = Asset book value x Risk weight for each asset

ITOCHU Corporation | 11.
2) Consolidated Net Income Structure with SpecialEmphasis on Net Income from Group CompaniesSince we have to a great extent achieved the restruc-turing of unprofitable companies during the period ofA&P-2002, our current focus is shifting to the maxi-mization of profit from profitable companies. To achievethis, we will strengthen the businesses of core compa-nies with profit contribution of over ¥1 billion, and semi-core companies from ¥0.3 to ¥1 billion. At the sametime, we will consolidate the overall profitability of over-seas trading subsidiaries, by recovering profitability ofbusinesses in North America, particularly in the fields ofconsumer and retail related and other services as wellas expanding profits from Asian operations. ITOCHUalso plans to continue to ensure an adequate level ofprofitability on a non-consolidated basis to pay divi-dends consistently and stably.
Structure of Consolidated Net Income
Non-Consolidated
Billions of Yen
Group CompaniesConsolidation Adjustments
Overseas Trading SubsidiariesConsolidated Net Income
‘01 ‘02 ‘03 ‘04 Plan
‘05 Plan
100
-50
0
50
70.5
30.220.1
45.0
75.0
15.0
8.02.5
3.731.7
10.2 8.2
47.4 50.0
10.0 15.0
70.028.5
23.1
25.5
-6.6-15.4
-38.0
-23.0 -25.0
Years ended March 31
Net Income from Group Companies
Profitable Companies Unprofitable CompaniesNet Income from Subsidiaries and Associates
Billions of Yen
‘01 ‘02 ‘03 ‘04 Plan
‘05 Plan
80
-60
-40
-20
0
40
20
6064.7
53.3
62.1 62.077.0 70.0
50.047.4
31.723.1
-41.6
-21.6
-14.7 -12.0 -7.0
Years ended March 31
Total Assests, Interest-Bearing Debts and Net DERBillions of Yen Times
Total Assets Interest-Bearing Debts
Net Intrest-Bearing Debts Net DER
‘00 ‘01 ‘02 ‘03 ‘05 Plan
‘06 Vision
‘04 Plan
0
4,000
2,000
6,000
0
10
5
156,067
12.0
8.05.8
4.84.3
3.6 2.9
5,1584,752
4,486 4,450 4,400 4,350
691
534498
2,296
549 500 400 4001,9001,950
2,0002,025
2,537
3,382
As of March 31
Cash, Cash Equivalents and Time Deposits
Billions of Yen %800
0
400
200
600
20
0
10
5
15
Stockholders’ equity
281317
398426
470
540
650
14.9
12.310.6
9.58.4
6.1
4.6
Ratio of stockholders’ equity to total assetsAs of March 31
‘00 ‘01 ‘02 ‘03 ‘05 Plan
‘06 Vision
‘04 Plan
Stockholders’ Equity and Ratio of Stockholders’ Equity to Total Assets
3) Improving the Financial PositionWe plan to improve the net DER to 3.6 times, byreducing total assets to ¥4,400 billion and net interest-bearing debts to ¥1,950 billion as of March 2005, andon the other hand, increasing stockholders’ equity to¥540 billion by retaining earnings.
12 | ITOCHU Corporation.
Because of our financing functions, general trading companiesare now frequently compared to venture capital (VC) firms andinvestment banks. Unlike VC firms, however, we do not just seekout promising new businesses to invest in, and unlike investmentbanks, we do more than enhance corporate value using variousM&A methods such as mergers, acquisitions and spinoffs. Ageneral trading company enhances value from the inside byproactively being involved in the businesses of the companies inwhich it invests. As part of its involvement, a general tradingcompany seeks the most appropriate business model for eachcompany and provides concrete solutions in a range of areas,from procurement of materials, to sales of products, aiming toimplement the best business model. A general trading companyworks comprehensively to enhance the value of the companies inwhich it has a stake not only by supporting their production andlogistics, but also by cooperating in product development andmarketing and occasionally by arranging front-line personnel.Having strengthened management expertise in recent years, wealso post management personnel as needed.
TradeThis proactive involvement in businesses is possible with the trad-ing know-how that general trading companies have built up overmany years. Having started as traders, general trading compa-nies kept up with the times by gradually expanding our activitiesfrom raw material procurement to processing, logistics, and retail.This has not been, however, a simple shift to downstream. Byestablishing retail bases in department and convenience storesand rebuilding the logistical, processing, and raw material pro-curement supply chain management to fit consumer needs, wevertically integrate the upstream, midstream, and downstreamsegments of our businesses. The synergy between the vastamount of business data that this provides and the global net-work creates an advantage in securing the suppliers and salesroutes best suited for our portfolio companies.
Having started in textiles and clothing, which are characterizedby low volumes and a large variety of products, ITOCHU is partic-ularly strong in terms of the large number of product items it han-dles and the breadth of its customer base. In the retail business,which must respond to increasingly specific and diversified con-sumer needs, our expertise in supplying the best-suited item fromthe best-suited place in the best-suited way is a major strength.In addition, ITOCHU has used its own resources to launch proj-ects in every area. The experience we have accumulated in thismanner has fostered our pioneering spirit, our prominent busi-ness know-how, and our sophisticated risk management.
Diversified FunctionsThere are also businesses that only become possible with themultiple functions and business areas that general, as opposedto specialized, trading companies possess. One example is ourPlant Division’s US$450 million financing of a plant constructionproject for a gas field development business in Indonesia. Bysigning a long-term off-take contract under which the borrower
paid back in crude oil which was a substitute for gas, the PlantDivision made risk hedge scheme for such a financing and theEnergy Division was able to be involved in oil trading business atthe same time. Providing a variety of settlement options that arenot possible with conventional financing functions creates impor-tant business opportunities for us.
InvestmentFurthermore, by pursuing a comprehensive involvement, fromproduction to logistics to sales, ITOCHU has enhanced the cor-porate value of many of its portfolio companies and reinforcedoverall group profitability.
One example is our investment in the major convenience storechain FamilyMart. ITOCHU acquired the expertise to handle avariety of consumer needs through this investment, as it enabledus to grasp changes in consumer needs in real time and redirectthis information to raw material procurement as well as process-ing and logistics. At the same time, by providing our diversefunctions to FamilyMart as a business partner, we were able toincrease our profits both from trading activities with FamilyMartand from equity in earnings from associates.
Examples of joint development with FamilyMart include ourFood Division’s procurement of optimal ingredients for the devel-opment of lunch box and other food products, the RealtyDivision’s presentation of properties for store development, the ITand Telecommunications Division’s contribution of e-businessknow-how for new business development, and the FinancialServices Division’s cooperation in the credit card business. Inmerchandising, we have been contributing to a sharp reduction inexpenses by revising the procurement structure and logisticsprocess. For ITOCHU, this revision simultaneously contributed torationalizing its upstream to downstream flow including groupcompanies. In addition, our continuous efforts to supportFamilyMart’s overseas development, in Asia in particular, havecontributed to Taiwan FamilyMart Co., Ltd.’s business growthand stock market listing.
SynergyTo summarize, ITOCHU has enjoyed a great synergy betweeninvestment and trading when we invest in businesses, whichenables us to pursue greater merits than either investment ortrading offers by itself. For the companies in which we invest,there is the advantage not only of receiving financing, but also ofgaining a powerful business partner for lightening risk burden. Itis a way of doing business that enables the building of a win-winrelationship for both parties.
Looking ForwardITOCHU has expanded business by proactively applying this typeof business investment in A&P segments. Going forward, we willalso apply it to such new technologies as Bio and Nano and tosuch emerging markets as China. We believe that one of thegreatest roles expected of us today is to work with manufacturersto build new business models especially in cutting-edge areas.
Roles of ITOCHU Corporation
Special Feature
ITOCHU Corporation | 13.
The Potential of the Chinese Market In the high-growth region of Asia, China in particular is poised for anew round of economic development stimulated by fast growingdomestic demand, the deregulation and opening of markets result-ing from its entry into the World Trade Organization (WTO). As aresult, China is transforming itself from an “export and processingbase” into a “promising market.” International events such as theOlympic Games, which will be held in Beijing in 2008 and the 2010Shanghai Expo are likely to accelerate this trend.
As illustrated by the ambitious goal put forth at last year’sPlenary Session of the Communist Party of increasing GDP 4-foldbetween 2000 and 2020, China has taken many steps towardsbecoming an economic superpower.
ITOCHU’s StrengthsITOCHU had taken the lead on other Japanese trading companiesby beginning trades with China before the normalization of diplo-matic relations between Japan and China in 1972. Through ourconsistent trade with China, we have built a solid relationship withits central and local governments ahead of other companies.
In addition, we maintain and reinforce interpersonal exchangeswith the upper echelons of government agencies including theEconomic Adviser to the Mayor of Beijing (C.E.O., Uichiro Niwa),the Economic Adviser to Qingdao City (Sokichi Sasaki, GeneralManager for China), and the Economic Adviser to Fujian Province(Fumiaki Fujino, Adviser). With many years of interpersonalexchanges, our China business know-how, and participation ininfrastructure construction and important national projects,ITOCHU has built a strong position from which it can gain the trustof the Chinese government. In recognition of ITOCHU’s strengths,in December 2002 we received a request from the City of Beijingfor comprehensive logistical cooperation. Specifically, this willinclude proposals for logistical models that can cope with thegrowth in distribution and transportation volume, the constructionof the most advanced distribution centers, and providing know-how. In May 2002, we entered into a comprehensive economicand trade alliance with the Shandong Provincial government. Weare making a major contribution to revitalizing regional economiesthrough cooperation that takes full advantage of our functions as a
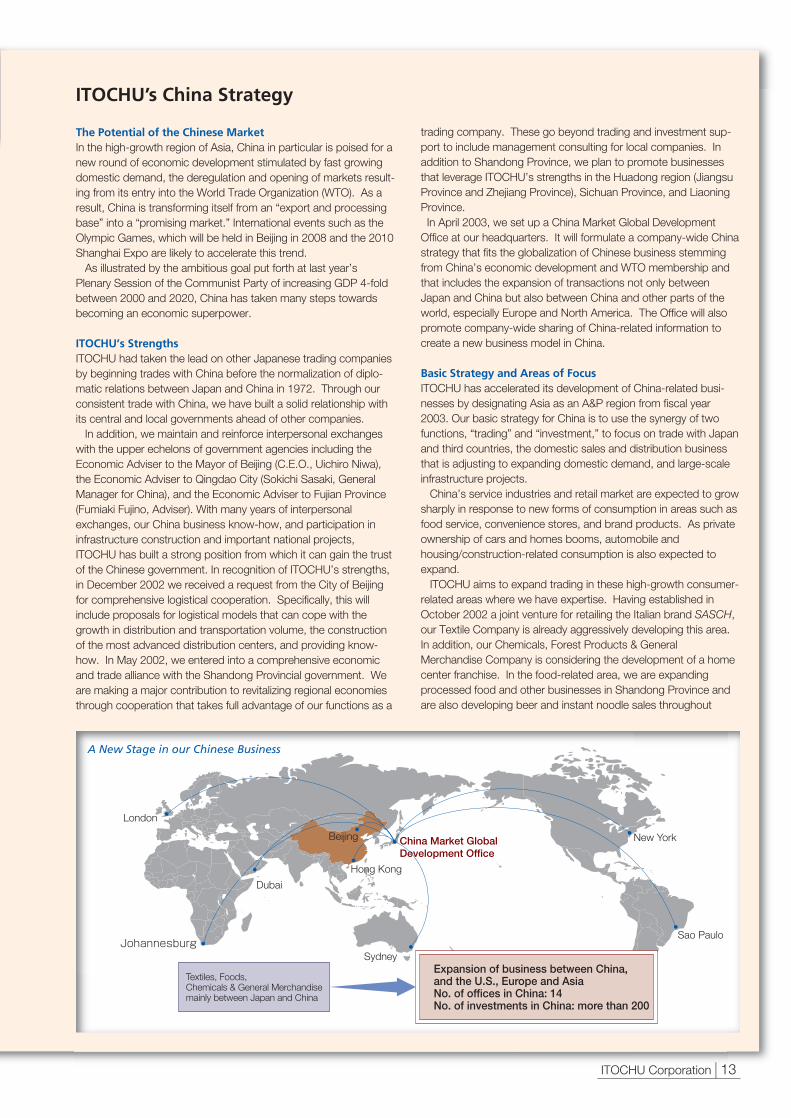
trading company. These go beyond trading and investment sup-port to include management consulting for local companies. Inaddition to Shandong Province, we plan to promote businessesthat leverage ITOCHU’s strengths in the Huadong region (JiangsuProvince and Zhejiang Province), Sichuan Province, and LiaoningProvince.In April 2003, we set up a China Market Global Development
Office at our headquarters. It will formulate a company-wide Chinastrategy that fits the globalization of Chinese business stemmingfrom China’s economic development and WTO membership andthat includes the expansion of transactions not only betweenJapan and China but also between China and other parts of theworld, especially Europe and North America. The Office will alsopromote company-wide sharing of China-related information tocreate a new business model in China.
Basic Strategy and Areas of FocusITOCHU has accelerated its development of China-related busi-nesses by designating Asia as an A&P region from fiscal year2003. Our basic strategy for China is to use the synergy of twofunctions, “trading” and “investment,” to focus on trade with Japanand third countries, the domestic sales and distribution businessthat is adjusting to expanding domestic demand, and large-scaleinfrastructure projects.
China’s service industries and retail market are expected to growsharply in response to new forms of consumption in areas such asfood service, convenience stores, and brand products. As privateownership of cars and homes booms, automobile andhousing/construction-related consumption is also expected toexpand.
ITOCHU aims to expand trading in these high-growth consumer-related areas where we have expertise. Having established inOctober 2002 a joint venture for retailing the Italian brand SASCH,our Textile Company is already aggressively developing this area.In addition, our Chemicals, Forest Products & GeneralMerchandise Company is considering the development of a homecenter franchise. In the food-related area, we are expandingprocessed food and other businesses in Shandong Province andare also developing beer and instant noodle sales throughout
ITOCHU’s China Strategy
China Market GlobalDevelopment Office
SydneyJohannesburg
Dubai
A New Stage in our Chinese Business
Beijing
Hong Kong
Sao Paulo
New York
London
Expansion of business between China, and the U.S., Europe and AsiaNo. of offices in China: 14No. of investments in China: more than 200
Textiles, Foods, Chemicals & General Merchandisemainly between Japan and China

14 | ITOCHU Corporation.
China. We are supporting the development of the Chinese marketby Ito Yokado Co., Ltd., which currently runs two stores in Beijingand one in Chengdu, and plan to open new stores.
As demand expands and types of retailing change in China, theneed to expand and enhance logistics becomes more and morecritical. Moreover, there is also increasing demand for moresophisticated logistics to facilitate exports to Japan, Europe and
North America. Capitalizing on this opportunity, ITOCHU isexpanding logistics-related businesses in China through our sub-sidiaries, Beijing Pacific Logistics Co., Ltd. and Guangzhou GlobalLogistics Corp., and exporting and importing activities throughsubsidiary i-LOGISTICS CORP. As part of this expansion, inSeptember 2002, ITOCHU built China’s largest chilled and frozenlogistics center in Shandong Province as an export base for frozenfoods headed for Japan.
Investments in prominent projects are also crucial for furthergrowth. We are considering investing in infrastructure businessesin Beijing related to the Olympics. We are also involved inJapanese government ODA and other large-scale projects forregional transportation, environment infrastructure, and energy andnatural resource development.
Numerical TargetsIn fiscal year 2003, our trading volume with China was US$4.5 bil-lion and we had approximately 210 joint ventures in the country.While we have always been a step ahead of competitors in termsof trading and investments there, we will focus more on capital effi-ciency from now. Our consolidated net income from China (sub-sidiaries, associated companies, and overseas trading subsidiaries)including Hong Kong exceeded ¥2.0 billion in fiscal year 2003, andour target in fiscal year 2005 is to generate half of our expected¥12.0 billion consolidated net income for the Asian region fromChina.
The ITOCHU Group is accelerating its drive to develop new rev-enue sources through the commercialization of innovative tech-nologies. A company-wide, cross-divisional organization, theInnovative Technology Business Development Office, plays thekey role in identifying promising technologies worldwide and pur-sues the commercialization of new businesses in collaborationwith the Division Companies.
Global expectations are high for the manufacturing of machineryon the nanometer (10–9 meter) scale and for developing applica-tions ranging from information and telecommunications to medi-cine; biotechnology possesses the potential to administer person-alized medicine, having no side-effects and optimized for individualgenetic make-ups, and tissue engineering, generating cells andtissues to repair or replace damaged human organs. In Japanalone the size of the nanotech market is anticipated to grow to¥27 trillion, and the biotech to ¥25 trillion, in the year 2010.
However, innovative technologies will not grow into big busi-nesses on their own. It is necessary to adapt them strategicallyinto new products and services that become parts of our dailylives. ITOCHU, a highly diversified company, leverages its multi-functionality to generate business from potential technologiesdeveloped at research institutions it has strategic relationshipswith. ITOCHU’s strong presence in IT and in consumer and retail-related sectors presents us with a tremendous business opportu-nity.
Bioinformatics CenterThe ITOCHU Group demonstrates its strength in the field of bioin-formatics where IT and biotechnology meld, through its leadinggroup companies, ITOCHU TECHNO-SCIENCE Corporation(CTC) and CRC Solutions Corp. In April 2002, we established theBioinformatics Center to provide data analysis and managementservices to support genomic drug discovery of pharmaceuticalcompanies. Currently, major pharmaceutical companies such asShionogi & Co., Ltd. and Tanabe Seiyaku Co., Ltd. have joined thecenter.
Wireless IC Chip “µ-chip”ITOCHU teamed up with Hitachi Ltd. in March 2003 for the devel-opment of practical applications for Hitachi’s “µ-chip,” the world’ssmallest wireless IC chip. With our strong presence in IT and foodsand textiles, among other consumer goods, we will be able to out-pace the competition in the dissemination of “µ-chip” and establishthem as the de facto industrial standard. Currently we are testingthe effectiveness of “µ-chip” in brand protection, distribution andinventory control, by embedding the chips in ITOCHU handledapparel products or price tags. In the steel sector, Marubeni-ItochuSteel Inc. has co-developed and begun sales of trial products of asteel materials inventory management system using these chips.
Commercialization of Innovative Technologies – Creating New Businesses –
Financial Results of China Segment
Do not include associated companies. Years ended March 31
Total trading transactionsBillions of Yen
2002 2003
1,500
0
500
1,000
3
0
1
21,059.8
3.0
1.4
1,229.1
Trading income*

(Name, Country, Date of alliance)Los Alamos National Laboratory Lawrence Livermore National Laboratory
USA (Autumn 2002)
CSIROAustralia(September 2002)
MPM CapitalUSA(June 2002)
VTT BiotechnologyFinland(February 2002)
CSIRO, AIMS, IMBAustralia(March 2001)
Pennsylvania State University Intellectual Property Office
USA(December 2001)
Institut PasteurFrance(December 2001)
Japanese University TLO**s(2001-2003)
**A TLO (Technology Licensing Organization) patents university inventions, transfers them to companies, devotes related income to further research, and generates new inventions, therebycreating a cycle of intellectual creation. In Japan, the establishment of TLOs is supported through the Law promoting Technology Transfer from Universities to Industry which was enacted inAugust 1998.
(Features and ITOCHU’s strategy)Core laboratories of the U.S. Department of Energy’s eight national laboratories. Reputed as thebrains of the U.S., they cover a broad area of research, developing technologies for the future 20years ahead. ITOCHU will introduce these technologies to Japanese companies and function as theintermediary for their commercialization. We may also consider investments in the national laborato-ries’ innovative technologies or joint ownership of intellectual properties, as well as investmentsand/or collaborative businesses with their spin-off ventures. ITOCHU, having worked with Australia’s largest research organization, CSIRO, since 1996, hasentered into a five-year letter of intent to form a closer long-term strategic alliance focusing on innova-tive technologies.World’s largest biotech venture capital firm. ITOCHU, as a Special Limited Partner, has committed a$20 million investment to a MPM biotech fund, which is operated as part of a $900 million fund.ITOCHU seeks to develop biotech businesses in the Japanese market based on highly promisingdeal flows. Largest biotech research institute in the Nordic countries, operated under Finland’s Ministry of Tradeand Industry. VTT Biotechnology is leader in the study of functional ingredients derived from wheatsand berries. Their research focuses include maintenance and improvement of gut health and antioxi-dants. ITOCHU will mediate between VTT Biotechnology and Japanese food manufacturers for jointdevelopment of novel functional food products. Our alliance with these three Australian research institutes in biotechnology focuses on commercializ-ing their research in the fields of agricultural and food related biotechnology, marine resources andbioinformatics. Pennsylvania State University is among the top five or six American universities in the fields ofbiotechnology and nanotechnology. Our alliance with its intellectual property office aims at utilizingUniversity proprietary technologies in the development of new businesses.
World’s most prestigious bioscience research institute, ranks second in the number of technologytransfers to industry in the field of microbiology. Our focus is on bringing the institute’s technologiesto the Japanese market. We have formed alliances with five regional TLOs, representing a total of 30 major universities, for thecommercialization of their technologies.
Functional Foods BusinessITOCHU has a competitive advantage in the food related sectorwhere we are focusing on the development of functional foods inresponse to the growing importance of preventive medicine associety continues to age. We are developing functional foodsbusiness in cooperation with Australia’s largest research organi-zation, CSIRO, and Finland’s VTT Biotechnology.
ITOCHU is securing access to “seeds” of innovative technolo-gies through strategic alliances with overseas partners, and withinJapan, serving as a one-stop channel to the Japanese market forour partners around the world. ITOCHU promotes the develop-ment of new joint businesses by matching our partners’ “seeds”to the “needs” of the market in each and every industry.
ITOCHU Corporation | 15.
VTT Biotechnology
Los Alamos National LaboratoryLawrence Livermore Nat. Lab.
CSIRO(Commonwealth Scientific & Industrial Research Organisation)
AIMS(Australian Institute of Marine Science)
IMB(Institute for Molecular Bioscience)
Pennsylvania State Univ. IP Office
MPM Capital
Hokkaido TLOOsaka TLOKansai TLOChubu TLOYamanashi TLO
Institut Pasteur
Strategic Partnerships

16 | ITOCHU Corporation.
New Management Benchmark – Promoting Risk Capital Management –
By introducing Risk Capital Management (RCM), a managementtool focusing on risk as its key concept, ITOCHU is exiting frominefficient assets and allocating resources to efficient assets toenhance corporate value. RCM is designed to control total riskvolume by quantifying risks as risk assets (note 1), and to meas-ure asset efficiency in Risk Return Index (RRI) (note 2), which isreturn on risk assets.
By segmenting the business areas of Division Companies intobusiness units according to the each business’s attributes, wemeasure and analyze the asset efficiency of each business byusing the RCM method. In addition to estimated market growthpotential, RRI is used as a criterion for optimizing resource alloca-tion.
Specifically, for each Division Company, we create a graph(note 3), whose example is shown in Graph 1. This grapharranges segments in descending order of efficiency from the left,showing risk asset volume, return (net income), and asset effi-ciency (RRI = diagonal line) for both each business unit and the
Note 1: Risk AssetsRisk assets represent the maximum amount of the possible losscaused by the held assets. Statistical methods are used to meas-ure risk weight of each asset according to its attributes and riskassets are then calculated by multiplying asset amount by riskweight. Not only assets on the balance sheet, but guarantees,foreign exchange balances and other off-balance sheet items aresubject to this risk asset evaluation and included in the total riskassets.(Examples)•Trade receivables: Each customer is assigned a credit ratingbased on its financial data, and a risk weight is assigned to eachcustomer based on the credit rating, which is linked with itsdefault rate. Risk assets are then calculated in consideration ofcollateral and other security. The same method is applied toloans and guarantees.
•Listed stocks/Land: Risk weight is calculated based on thevolatility of stock prices or land prices.
•Associated company investment: Risk assets are calculated bymultiplying risk asset volume of the associated company, which
Graph1: Example of a Division Company
Division Company as a whole. In this example, inefficient busi-nesses (ex. G, H) on the right of the graph will basically be subjectto a strategy of downsizing or withdrawal, unless growth isexpected. Eventually we will reduce assets or exit from inefficientbusinesses. The resources that are recovered through thisprocess will then be reallocated to new strategic projects toincrease the efficient assets (ex. A, B) on the left. By shiftingassets in unprofitable business areas to new strategic businessareas, we aim to improve overall profitability and enhance corpo-rate value. At the same time, setting a risk asset limit as acovenant, or item to be monitored, for each Division Company,we control total risk volume (risk asset amount), for new invest-ments as well as for existing businesses.
By doing the above activities, we are promoting the Super A&Pstrategy, in which we accelerate reallocation of assets to shiftmanagement resources selectively to more efficient businessareas.
is calculated by each asset account, by ITOCHU’s share.•Inventories: Risk assets are calculated for the book balance ofthe item by assigning risk weight based on market price volatili-ty. Risk assets for inventories with sales contracts are calculatedby assigning risk weight that considers the probability of cancel-lation, as well as market price volatility.
Note 2: Risk Return Index (RRI)Risk Return Index (RRI) = Net income ÷ Risk assetsRRI is used to measure efficiency in comparison with cost ofequity. Cost of equity is currently set at 8%. Units with RRI over8% and ROA over 2% are considered efficient segments.
Note 3: GraphThis graph plots returns (net income) on the vertical axis and riskassets on the horizontal axis. The diagonal line shows RRI.
Please see page 66 of Financial Section for the overallCompany’s risk management system and methods for managingmarket, credit, country, and investment risk.
Risk assets (100 millions of yen)0
A
CAllocate resources to efficient assets
Reduce or exit from inefficient assets
E
D
B
F GH
Risk assets (100 millions of yen)0
A
C
Control total risk volume→
Improve asset quality
Increase return
E
D
B
F
G HReturn (100 m
illions of yen)
Return (100 m
illions of yen)
Decrease risk assets

ITOCHU Corporation | 17.
Retirement Pension Plan Reform
In the two years since fiscal year 2001, ITOCHU’s consolidatednet cost of retirement and severance benefits increased from¥12.4 billion to ¥22.7 billion, heavily impacting ITOCHU’s consol-idated financial performance. As ITOCHU Corporation (non-con-solidated basis) accounts for most of this, we decided to revisethe retirement and severance plan for ITOCHU Corporationemployees as follows.
ITOCHU Corporation’s retirement and severance plan consistsof two pension plans: an employee pension fund and a tax-quali-fied pension fund. As of the end of fiscal year 2003, projectedbenefit obligations (PBO) totaled approximately ¥290 billion,assets under management totaled approximately ¥160 billion,and pension trusts totaled approximately ¥130 billion. (Non-consolidated Japan Accounting Standard: Hereinafter all figuresare based on non-consolidated Japan Accounting Standard.)
In order to cope with the deterioration in the fund operatingenvironment and with changes such as the introduction of retire-ment benefit accounting, ITOCHU took steps to ensure thehealth of pension finances. These steps included the reductionof PBO by, in October 1999, lowering the defined interest ratefor the future benefit payment (from 5.5% to 3.5%) and extend-ing the guarantee period (from 15 to 20 years); in September2000, the establishment of a pension trust in order to make aone-time amortization of the underfunding resulting from theintroduction of retirement benefit accounting (¥45.8 billion of netprojected benefit obligation (actuarial difference) caused by achange in accounting standard), and the additional contributionto pension trust.
Subsequently, however, due to the prolonged slump in theasset management environment, operated pension asset result-ed in negative returns for three years in a row. Also, because ofthe lowered interest rate, ITOCHU changed the discountrate. In addition, the prices of the stocks in the trust fell. Thus,from fiscal year 2001 through fiscal year 2003, these factorsresulted in a total unrecognized actuarial loss (unamortized obli-gation) of more than ¥200 billion. Judging that there should belimits to how long the retirement and severance plan could last inits existing scheme, given the harshness of the environment, wedecided to make a fundamental review of the system.
In fiscal year 2000, we introduced a new human resourcesmanagement system with remuneration packages based on jobresponsibility and performance. The retirement and severanceplan, however, continued to be based on “years of employment”and “age.” It remained a major issue to revise the plan into amore flexible system based on the principles of the new humanresources management system.
From fiscal year 2002, in response to the increased number ofoptions for retirement and severance plans by the expectedenactment of a series of bills related to retirement and pensionsystems, ITOCHU began a full-fledged study for a revision of theplan.
The aim of this revision is to minimize the impact of the retire-ment and severance plan on our management by reducing PBOor lowering PBO risk. In terms of specific changes to the plan,we aim to develop a structure that incorporates the principles ofthe new human resources management system and respond tothe diversification of employees’ values.
Negotiations with the labor union on revision of the retirementand severance plan began in August 2002 and culminated in anagreement in March 2003. The agreement seeks to reduce therisk that has hitherto been entirely on the Company’s shouldersby dividing it; a portion of the risk will return to the government, aportion will be carried by each employee, and the concept of“market linkage” will be introduced to the portion that theCompany continues to bear. Specifics are as follows.
1. Returning the public pension portion held by theemployee pension fund to the government: Returning thefuture portion has already been authorized and relevantrecords are being prepared for returning the current and pastportions. Returning the public pension portion to the govern-ment will eliminate risk for approximately ¥37 billion worth ofPBO (as of end of fiscal year 2003).
2. Revising the supplementary portion of the employeepension fund: When the past public benefit portion isreturned to the government, we will introduce a “cash balanceplan” that links benefit amounts to market interest rates. Thiswill lower interest rate sensitivity and enable the lowering ofasset management hurdles for about ¥190 billion worth ofPBO (as of end of fiscal year 2003) for the supplementary por-tion of the employee pension fund, and thus will minimize therisk for the maintenance and operation of the plan. In addi-tion, although benefits are currently paid entirely as perpetualannuities, we plan to make some portion terminable, expect-ing to reduce PBO and lower asset management risk.
3. Revising tax-qualified pension: After reducing the futureportion of the tax-qualified pension, in July 2003 we will intro-duce an “optional defined contribution pension plan.” Thisgives employees the option of receiving the Company’s con-tribution through the “defined contribution pension” thatemployees manage on their own or as an addition to theirmonthly salary. The introduction of this new system will notbear PBO.
Summary of ITOCHU Corporation’s Retirement Pension Plan RevisionOld Plan New Plan
1. Employee Pension Fund Perpetual Returned to government(Public Pension Portion)
2. Employee Pension Fund Perpetual annuity guaranteed for 20 years Introduction of Cash Balance Plan(Supplementary Portion) Defined interest rate: 3.5% Some portion changed to be terminable
3. Tax-Qualified Pension Terminable annuity guaranteed for 20 years Some portion changed to defined contribution pensionDefined interest rate: 3.5%

18 | ITOCHU Corporation.
Division Companies at a Glance
Plant, Automobile & Industrial Machinery Company
Aerospace, Electronics & Multimedia Company
Energy, Metals & Minerals Company
Chemicals, Forest Products & General Merchandise Company
Food Company
Finance, Realty, Insurance & Logistics Services Company
Years ended March 31 (Unit: Billions of Yen)
** Trading transactions with unaffiliated customers and associated companies
Textile Company
Trading Transactions** Gross Trading Profit Trading Income* Net Income Total Assets
2002
2003
2002
2003
2002
2003
2002
2003
2002
2003
2002
2003
2002
2003
880.1
871.7
1,937.3
1,746.6
960.3
809.2
2,740.0
2,216.2
1,735.8
1,799.8
2,445.2
2,522.5
455.3
269.4
83.5
93.5
50.2
48.6
112.6
102.5
52.7
33.0
80.7
87.1
126.9
130.1
34.4
33.8
18.1
20.8
(4.7)
1.1
28.2
25.9
17.2
14.5
15.8
20.3
24.5
23.8
(7.9)
(1.3)
8.3
10.4
1.3
2.4
36.3
14.3
9.5
10.0
(0.2)
10.7
9.6
11.9
(9.8)
(8.4)
384.1
370.8
588.1
490.1
526.2
484.3
401.6
391.6
532.7
524.6
665.1
654.4
773.4
692.7

2002 2003
ITOCHU Corporation | 19.
Major Subsidiaries and AssociatesNet Income (Loss)*** Division Company Highlights in Fiscal Year 2003
•Prominent Apparel Ltd. .................. ¥0.6 0.4•Leilian Co., Ltd. ............................. (0.5) 0.2
• ITOCHU Sanki Corporation ............ ¥0.2 0.2•MCL Group Ltd. ............................. 0.1 0.3•Century Leasing System, Inc. ......... 1.0 1.0
•ITOCHU TECHNO-SCIENCE Corporation ................................. ¥5.7 2.8
•CRC Solutions Corp. ...................... 0.5 0.6
•ITOCHU Coal Resources Australia Pty., Ltd. ....................... ¥3.3 3.0
• ITOCHU Oil Exploration Co., Ltd. ... 1.9 5.1• ITOCHU Petroleum Co., Ltd. .......... 0.6 0.6•Marubeni-Itochu Steel Inc. .............. 1.0 3.3
• ITOCHU Kenzai Corp. .................... ¥0.6 0.9• ITOCHU Pulp & Paper Corp. .......... 0.3 0.5•ITOCHU CHEMICAL
FRONTIER Corporation ............... 0.1 1.2• ITOCHU PLASTICS INC. ................ 0.5 1.1
•Nishino Trading Co., Ltd. ................ ¥0.6 0.9•Japan Foods Co., Ltd. ................... 0.5 0.2•FamilyMart Co., Ltd. ....................... (0.1) 3.2
• ITOCHU Finance Corporation ........ ¥(0.8) 1.2•CENTURY 21 REAL ESTATE
OF JAPAN LTD. ......................... 0.1 0.1•kabu.com Securities Co., Ltd. ....... (0.5) 0.0
•Acquired exclusive import and sales contracts with Bally and Pollini•Signined an exclusive contract with a gourmet supermarket, DEAN & DELUCA•Established a joint venture in China with the Italian casual brand, SASCH•Magaseek.com, a fashion search and purchase site expanded•Formed a joint venture with the Shandong Weiqiao Textile Group in China•Expanding sales of a high performance material, compact spun yarn•Riche La Riche, a home furnishing brand achieved a favorable performance
•Established an LNG transportation export joint venture in Algeria•Awarded an offshore oil transportation project in Brazil•Acquired an engineering company specializing in biomass energy in Europe•Formed an alliance with Yanase, the largest imported car retailer in Japan•Established an automobile financing company in Indonesia•A subsidiary, EneSol expanded energy-saving and power retailing businesses • Invested in Mystar Engineering specializing in mechanical maintenance
•Formed an alliance with Hitachi in IT-related solution business field•Made CRC a subsidiary to strengthen synergies with ITOCHU TECHNO-SCIENCE •Reorganized mobile internet content companies•Established a set top box sales company, T.T. Nexyz, for SKY PerfecTV!•Promoted cyber security business by a subsidiary, iDEFENSE Japan •Established the Bioinformatics Center and a protein analysis firm, Proteome
Systems Japan
•Ohanet Natural Gas Project in Algeria entered the final stage for production•Participated in an oil pipeline project linking the Caspian and the Mediterranean•Decided to participate in a new coal mine development project in Australia• Invested in an iron ore mine development project in Australia•Promoted global sales of refrigeration units for transportation containers•An associate, Marubeni-Itochu Steel achieved a favorable performance•Promoted recycling business, development of DME and other eco-businesses
•Acquired ownership of a large-scale car parts and accessory store•Started an acrylic sheets manufacturing business in Thailand•Started an anhydrous fluoric acid manufacturing business in China•Added capacity at manufacturers of compound and packaging in Thailand•Expanded global pulp sales network produced by an associate, CENIBRA•Integrated paper and paper products business in ITOCHU Pulp & Paper
•Became the largest shareholder of YUKIJIRUSHI ACCESS•Invested in Compass Group Holding (Japan) for food contract business•Invested in SNOW BRAND MILK PRODUCTS•Acquired three sugar-producing companies including DAIICHI-TOGYO•Acquired Japan California Products, a food wholesaler in California•Decided to make Prima Meat Packers an associated company
•An associate, Famima Credit started accepting applications for Jupi Card•Promoted private equity business by forming Raffia Fund and IDA Fund•Commissioned PFI business for Chiba City Nature House for Youth•Started corporate benefit package creation and operation support service•Started handling a new type of group credit insurance•Promoted third party logistics business for pharmaceutical makers
(Unit: Billions of Yen)
*** The above figures represent the ITOCHU’s share of their net income.

20 | ITOCHU Corporation.
Textile Company
Message from the Division Company President
Under our A&P-2002 Mid-term Plan, in addi-tion to expanding earnings in the materials,textile, sewing and other manufacturingareas where our traditional strengths lie, wecultivated customer-driven businesses suchas retail, where brands are of key signifi-cance, and focused our efforts on consumermarkets in China and other parts of Asia.Under the Super A&P-2004 Plan, our goal isto evolve into a “lifestyle proposal business”by promoting the following growth strate-gies.1. Acquire superior brands (proactive M&A),
use brands to expand the scope of busi-ness into a full lifestyle range, and pro-mote a full-scale brand business in China
2. Complement functions for leading apparelmakers and expand transactions by pro-viding them with a full range of servicesfrom material supply to product develop-ment, distribution and fashion trend infor-mation
3. Develop and strengthen sales of differenti-ated materials
China, we established a China joint venture with theItalian casual brand SASCH.
In the retail area of the apparel business, we decid-ed to expand the business of MAGAseek, a fashionproduct search and purchase site to form it into a newcompany.
In the high performance material field, we devotedefforts to expanding sales of compact spun yarn, whichhas the luster and smoothness of silk. Thus, in fiscalyear 2003 we achieved a 10% share of global produc-tion and 50% share of sales in Japan. We also formeda joint venture with the Shandong Weiqiao Textile GroupCo., Ltd., which is China’s largest spinning company, toutilize Japanese advanced technology. Not limited toraw material supply, this business envisions sales inChina, and exports to Europe and North America.
In the home furnishing area, ITOCHU Home FashionCorp.’s Riche La Riche has achieved favorable perform-ance. In March 2003 it opened its fifth store and isdeveloping a distinctive business that utilizes the fabricsITOCHU Home Fashion handles.
Makoto KatoPresident, Textile Company
Business Performance in Fiscal Year 2003Trading transactions decreased by ¥8.4 billion com-pared with the last fiscal year, owing to a decline in mar-ket prices under the deflationary low-pricing trend andour efforts to eliminate inefficient transactions. On theother hand, gross trading profit increased by ¥9.9 billionsupported by the contribution from such new brand-related subsidiaries as ORIZZONTI CO., LTD., BallyJapan, Ltd. and CONVERSE JAPAN Co., Ltd. As aresult, despite an increase in expenses, trading income*grew ¥2.7 billion and with the contribution from associ-ated companies, net income rose ¥2.1 billion.
What We Did in Fiscal Year 2003Among our brand-related achievements, we signedexclusive import and sales contracts with a number ofbrands including BALLY and POLLINI. In June 2002,we signed an exclusive long-term contract with the NewYork based high-end gourmet supermarket DEAN &DELUCA. In addition to promoting the same type ofstores in Japan as DEAN & DELUCA has in New York,we have undertaken the development of a new type ofbusiness that merges “food” with “fashion.” We openedthe first DEAN & DELUCA store in Tokyo in June 2003.Also, we expanded our brand business in Asia. As astrategic step towards developing our brand business in
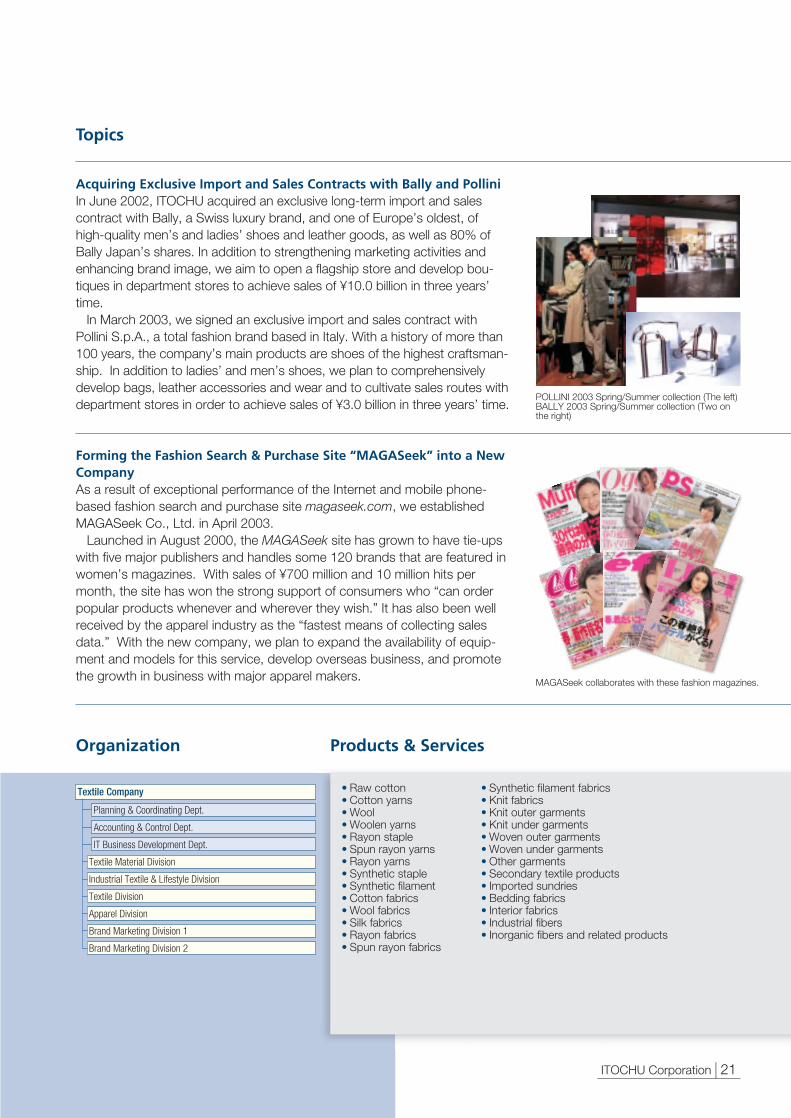
ITOCHU Corporation | 21.
Topics
Organization
Acquiring Exclusive Import and Sales Contracts with Bally and PolliniIn June 2002, ITOCHU acquired an exclusive long-term import and salescontract with Bally, a Swiss luxury brand, and one of Europe’s oldest, ofhigh-quality men’s and ladies’ shoes and leather goods, as well as 80% ofBally Japan’s shares. In addition to strengthening marketing activities andenhancing brand image, we aim to open a flagship store and develop bou-tiques in department stores to achieve sales of ¥10.0 billion in three years’time.
In March 2003, we signed an exclusive import and sales contract withPollini S.p.A., a total fashion brand based in Italy. With a history of more than100 years, the company’s main products are shoes of the highest craftsman-ship. In addition to ladies’ and men’s shoes, we plan to comprehensivelydevelop bags, leather accessories and wear and to cultivate sales routes withdepartment stores in order to achieve sales of ¥3.0 billion in three years’ time.
Forming the Fashion Search & Purchase Site “MAGASeek” into a NewCompanyAs a result of exceptional performance of the Internet and mobile phone-based fashion search and purchase site magaseek.com, we establishedMAGASeek Co., Ltd. in April 2003.
Launched in August 2000, the MAGASeek site has grown to have tie-upswith five major publishers and handles some 120 brands that are featured inwomen’s magazines. With sales of ¥700 million and 10 million hits permonth, the site has won the strong support of consumers who “can orderpopular products whenever and wherever they wish.” It has also been wellreceived by the apparel industry as the “fastest means of collecting salesdata.” With the new company, we plan to expand the availability of equip-ment and models for this service, develop overseas business, and promotethe growth in business with major apparel makers.
• Raw cotton• Cotton yarns• Wool• Woolen yarns• Rayon staple• Spun rayon yarns• Rayon yarns• Synthetic staple• Synthetic filament• Cotton fabrics• Wool fabrics• Silk fabrics• Rayon fabrics• Spun rayon fabrics
• Synthetic filament fabrics• Knit fabrics• Knit outer garments• Knit under garments• Woven outer garments• Woven under garments• Other garments• Secondary textile products• Imported sundries• Bedding fabrics• Interior fabrics• Industrial fibers• Inorganic fibers and related products
Products & Services
Textile Company
Planning & Coordinating Dept.
Accounting & Control Dept.
Textile Material Division
Textile Division
Brand Marketing Division 1
Brand Marketing Division 2
IT Business Development Dept.
Industrial Textile & Lifestyle Division
Apparel Division
POLLINI 2003 Spring/Summer collection (The left) BALLY 2003 Spring/Summer collection (Two onthe right)
MAGASeek collaborates with these fashion magazines.

Plant, Automobile & Industrial Machinery Company
22 | ITOCHU Corporation.
Message from the Division Company President
Akira YokotaPresident, Plant, Automobile &Industrial Machinery Company
Business Performance in Fiscal Year 2003Trading transactions in fiscal year 2003 declined by¥190.7 billion compared to the previous year, mainlydue to the withdrawal from less profitable businessesand an unexpected under-performance in the construc-tion equipment business in North America. Gross trad-ing profit, however, decreased only by ¥1.6 billion dueto an increase of auto exports to China and the MiddleEast. A reduction of selling, general and administrativeexpenses and provision for doubtful accounts con-tributed to a ¥5.8 billion improvement in trading income*and a ¥1.1 billion increase in net income.
What We Did in Fiscal Year 2003The oil and gas development and related trans-portation market is in a growth phase and highly prof-itable. It is an area where we can utilize our strongknow-how in organizing and financing projects. In fiscalyear 2003, ITOCHU was awarded an LNG transporta-tion project in Algeria and an offshore oil transportationproject in Brazil. As a strategic investment in the renew-able energy sector, ITOCHU acquired an engineeringcompany specializing in biomass energy in Europe.
ITOCHU’s automotive-related services business isan area that stands to grow through the vertical andhorizontal development of ITOCHU’s existing finance,retail, and distribution businesses. In fiscal year 2003,we expanded our new- and used-car dealer network inthe U.S. and U.K., formed a business and capital tie-upwith Yanase, the largest domestic retailer of importedcars, and established an automobile financing company
in Indonesia.The domestic deregulation and services related
market is also growing fast, particularly in power sup-ply, distribution and outsourcing services. EneSol Inc.(formerly “ITOCHU Energy Solution Co., Ltd.”), anITOCHU Group company that provides energy-savingand power retailing services, expanded its businessesto strengthen its position in this fast-growing field. Inorder to further develop its business platform for thefuture, ITOCHU also acquired 20% of the shares ofMystar Engineering Corp., a company specializing in 3rdparty mechanical maintenance.
In addition, we have continuously strengthened theexport of automobiles and auto parts to developingcountries. This is an area where we have a high marketshare and expect further growth in demand. We alsocontinue to strengthen the medical field, which offersopportunities for business expansion and stable growth;the electronic and semiconductor field, where we havean advantage in flat panels; and the new technologyfield, where we deal in advanced laser technology andnew urban-transit systems.
As the result of a two-year intensive restruc-turing following the ¥10.0 billion net loss infiscal year 2001, we reported a net incomein fiscal year 2002. Furthermore, in fiscal2003, trading income returned to profit fol-lowing the trading loss the year before.During the last two fiscal years, we disposedof non-performing assets, restructuredunder-performing group companies, andaccelerated the collection of outstandingdebts. As a result, not only did we reduceassets by ¥158.9 billion, but net incomeimproved sharply from a ¥10.0 billion loss toa ¥2.4 billion profit. Under the Super A&P-2004 Mid-term Plan, our challenge is todevelop and materialize new businesses andfurther improve asset efficiency. Our key-words are; “new technology,” “service andsolution,” “strategic investment,” and “inte-grated function.”
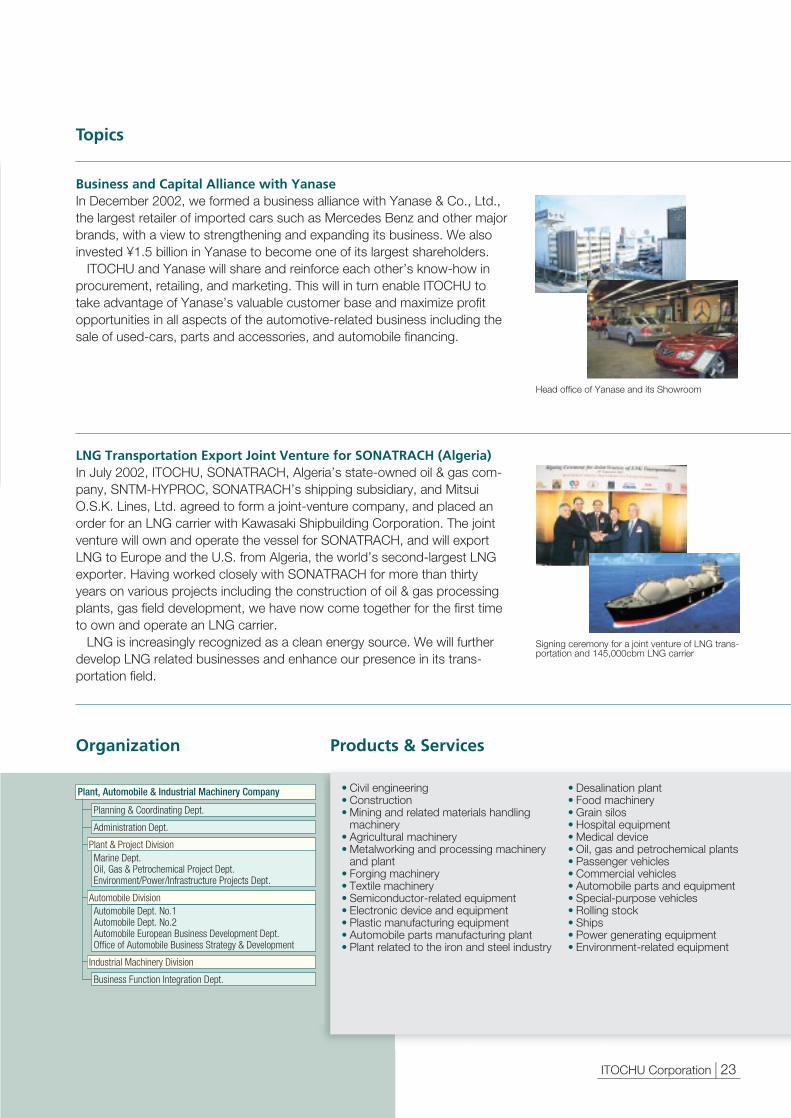
ITOCHU Corporation | 23.
Topics
Organization
Business and Capital Alliance with YanaseIn December 2002, we formed a business alliance with Yanase & Co., Ltd.,the largest retailer of imported cars such as Mercedes Benz and other majorbrands, with a view to strengthening and expanding its business. We alsoinvested ¥1.5 billion in Yanase to become one of its largest shareholders.
ITOCHU and Yanase will share and reinforce each other’s know-how inprocurement, retailing, and marketing. This will in turn enable ITOCHU totake advantage of Yanase’s valuable customer base and maximize profitopportunities in all aspects of the automotive-related business including thesale of used-cars, parts and accessories, and automobile financing.
LNG Transportation Export Joint Venture for SONATRACH (Algeria)In July 2002, ITOCHU, SONATRACH, Algeria’s state-owned oil & gas com-pany, SNTM-HYPROC, SONATRACH’s shipping subsidiary, and MitsuiO.S.K. Lines, Ltd. agreed to form a joint-venture company, and placed anorder for an LNG carrier with Kawasaki Shipbuilding Corporation. The jointventure will own and operate the vessel for SONATRACH, and will exportLNG to Europe and the U.S. from Algeria, the world’s second-largest LNGexporter. Having worked closely with SONATRACH for more than thirtyyears on various projects including the construction of oil & gas processingplants, gas field development, we have now come together for the first timeto own and operate an LNG carrier.
LNG is increasingly recognized as a clean energy source. We will furtherdevelop LNG related businesses and enhance our presence in its trans-portation field.
• Civil engineering• Construction• Mining and related materials handling
machinery• Agricultural machinery• Metalworking and processing machinery
and plant• Forging machinery• Textile machinery• Semiconductor-related equipment• Electronic device and equipment• Plastic manufacturing equipment• Automobile parts manufacturing plant• Plant related to the iron and steel industry
• Desalination plant• Food machinery• Grain silos• Hospital equipment• Medical device• Oil, gas and petrochemical plants• Passenger vehicles• Commercial vehicles• Automobile parts and equipment• Special-purpose vehicles• Rolling stock• Ships• Power generating equipment• Environment-related equipment
Products & Services
Plant, Automobile & Industrial Machinery Company
Planning & Coordinating Dept.
Administration Dept.
Plant & Project DivisionMarine Dept.Oil, Gas & Petrochemical Project Dept.Environment/Power/Infrastructure Projects Dept.
Industrial Machinery Division
Business Function Integration Dept.
Automobile DivisionAutomobile Dept. No.1Automobile Dept. No.2Automobile European Business Development Dept.Office of Automobile Business Strategy & Development
Head office of Yanase and its Showroom
Signing ceremony for a joint venture of LNG trans-portation and 145,000cbm LNG carrier

Aerospace, Electronics & Multimedia Company
24 | ITOCHU Corporation.
Message from the Division Company President
Yoichi OkudaPresident, Aerospace, Electronics &Multimedia Company
Business Performance in Fiscal Year 2003In our consolidated results for fiscal year 2003, grosstrading profit reached ¥102.5 billion and trading income*¥25.9 billion, although domestic IT-related transactiondecreased due to lowered IT-related investment from asluggish economy. Net income was ¥14.3 billion, due toa decrease in gain on sale of investments in securities.
What We Did in Fiscal Year 2003In the Total Solutions business, in an alliance withHitachi, Ltd., we worked together to further strengthenIT services and develop new businesses utilizing cut-ting-edge technologies such as Bio and Nano technolo-gies. Together with ITOCHU TECHNO-SCIENCECorporation (CTC), we acquired the domestic marketingrights for an integrated high-end Linux server that ishighly reliable and largely cuts system maintenancecosts. In order to strengthen this area, we made CRCSolutions Corp. (CRC), which is strong in developingand operating office application systems and in handlingoutsourced operations, into a consolidated subsidiaryand organized a system to promote our business cen-tering on CTC and CRC.
In the e-business area, Excite Japan Co., Ltd. madea full-scale entry in the broadband-related business withthe BB.Excite content distribution service and WomanExcite café, a broadband café that specifically targetswomen.
In the mobile phone business, we enhanced bothhardware/software competitiveness and profitability bystrengthening mobile phone sales and service companyITC NETWORKS CORPORATION and by establishingNANO Media, Inc. to supervise entire mobile internetcontent business.
In the media content sector, mainly to increase thenumber of subscriber households of CS broadcasterSKY PerfecTV!, we established a set top box salescompany, T.T. Nexyz. Corporation.
In the aerospace field, in addition to efforts toincrease profitability on a collaboration base withITOCHU Aviation Co., Ltd. and other group companies,we worked to strengthen the cyber security businesswith iDEFENSE Japan Inc.
In the new business area, in addition to establishingthe Bioinformatics Center making the best use of IT andBio technologies for strengthening our foothold in theBio business, we established a protein analysis firm,Proteome Systems Japan, in conjunction with anAustralian biotechnology firm.
Under our A&P-2002 Mid-term Plan, inwhich we are working to “expand corporatevalue as an industry leading businessgroup,” we reinforced the base of our exist-ing businesses and reformed our profitstructure while concentrating on new busi-ness areas such as Bio and Nano technolo-gies.
Under our Super A&P-2004 Mid-termPlan, we will strengthen profitability in theface of a rapidly changing market, industryand technology with a “frontier spirit for con-sistent creation of new businesses.” Toachieve this, we will implement two meas-ures, “laying the ground work for the future”by undertaking new technology and newbusinesses and “strengthening subsidiariesand affiliates and expanding consolidatednet income” through increasing our groupcompanies’ corporate value.

ITOCHU Corporation | 25.
Topics
Organization
Reorganization of Mobile Internet Content Companies Focused onNANO Media, Inc.Having implemented a reorganization of our mobile internet content companiesin fiscal year 2003, in April 2003 we made Interactive Radio & Television Guide,Inc. (Irate), an Electronic Program Guide (EPG) distributor, and Navi-p.comCorporation, a location and map information distributor, subsidiaries of NANOMedia, Inc.
Along with enhanced functions of mobile phones and development ofInternet home appliances, NANO Media, Inc. aims to become the top firm inthe mobile internet content distribution and service provision area not only byproviding content for mobile phone and other personal media, but by providingmachine communication services such as the remote control of home appli-ances and services linked to other media.
Development of Cyber Security Business by iDEFENSE Japan Inc.iDEFENSE Japan Inc., which provides cyber security services to customers,is steadily increasing contracts by receiving confidence of clients includinggovernmental organizations for its expanded services.
Intrusion detection software is presently not effective enough againstincreasingly-sophisticated cyber attacks. For this reason, iDEFENSE JapanInc., in alliance with U.S.-based iDEFENSE Inc. and Foundstone Inc., pro-vides the latest cyber threat intelligence information in Japanese languagenear real time. As a part of comprehensive cyber security intelligence infor-mation services, the company offers the most advanced vulnerabilityassessment and management system along with security training and con-sulting services which enable customers to protect their valuable assetsfrom cyber threat.
• Broadcasting and communicationbusiness
• Electronics systems• Equipment for broadcasting and
communication systems• Programing supply and entertainment
business• Mobile telecommunication equipment
and services• Systems and related equipment for
computer and information processing• Semiconductor equipment• Aircraft and in-flight equipment• Air Transportation Management
Systems• Space-related equipment• Security equipment
Products & Services
Aerospace, Electronics & Multimedia Company
Planning & Coordinating Dept.
Accounting & Control Dept.
Aerospace & Electronic Systems DivisionAerospace Dept.Commercial Aerospace Dept.
Media Business DivisionNetwork & Content Business Dept.Mobile Business Dept.
Affiliates Administration & Credit Dept.
IT & Telecommunication DivisionInformation Technology Business Dept.Business Solutions Dept.IT & Telecommunications Business Dept.
iDEFENSE Japan Inc.’s cyber security informationservices
Electronic Program Guide (left) and location and map information (right)

Energy, Metals & Minerals Company
26 | ITOCHU Corporation.
Message from the Division Company President
Business Performance in Fiscal Year 2003Mainly due to the spin-off of the Iron & Steel Divisioninto an equity-method affiliate, trading transactionsdecreased by ¥523.8 billion and gross trading profit fellby ¥19.7 billion compared to the previous fiscal year.Net income, however, increased ¥0.5 billion to exceed¥10.0 billion, mainly thanks to increased earnings in nat-ural resource development at ITOCHU Oil ExplorationCo., Ltd. and other affiliates, and favorable performanceof Marubeni-Itochu Steel Inc.
What We Did in Fiscal Year 2003In energy resource development, the Ohanet NaturalGas Development Project in Algeria has steadily pro-gressed and will start production in fiscal 2004. TheSakhalin-I Project is moving along well in Phase I and ison target to start oil production at the end of fiscal2006. Sakhalin-I’s recoverable reserves are estimated at2.3 billion barrels of crude oil and 17,000 billion cubicfeet of natural gas. As a new project, we have partici-pated in a US$2.3 billion large-scale crude oil pipelineproject that will link the Caspian and MediterraneanSeas. We plan to use this pipeline for the transportationand sale to the worldwide crude oil market from the vastAzerbaijani oil fields in which our subsidiary, ITOCHU OilExploration Co., Ltd., has interests.
In mineral resource development, we decided toparticipate in a new coal mine development project inAustralia. Also, a project for developing new coal minesin Indonesia and one for developing an iron ore mining
area and expanding shipping capacity in Australia areprogressing smoothly. In addition, we are conductingfeasibility studies for new coal mine development, par-ticularly in China.
In the trading sector, we further reinforced our globalenergy trading formation mainly by strengtheningITOCHU Petroleum Japan Ltd.’s alliances with ChemoilCorp. in the U.S. and Galaxy Energy Group Ltd. inEurope. In addition to this, we are expanding our inter-national trading activities for coal, iron ore, and non-fer-rous metals businesses. Particularly in the non-ferrousbusiness, we succeeded in obtaining substantial marketshare in a Europe and Asia-focused global sales ofrefrigeration units for transportation containers.
In the steel products business, Marubeni-ItochuSteel Inc.’s performance was favorable, supported bythe contribution from overseas steel pipe transactionsand other overseas earnings, mainly from North Americaand Asia.
New fields, with our emphasis on the environmentalconservation-oriented business, include expansion ofthe recycling business and development of DME(dimethyl ether), which is attracting attention as a cleanenergy source.
Hiroshi SumiePresident, Energy, Metals & Minerals Company
Our objective has been to maximize earningsby actively participating in projects for devel-oping natural resources with growth poten-tial and linking resources produced by theseprojects with trading. We have alsoimproved efficiency of our organization andassets, as in the example of spinning off ourIron & Steel Division. As a result, during thetwo-year period, we achieved the ¥10.0 bil-lion net income targeted by our A&P-2002Mid-term Plan. Under our Super A&P-2004Mid-term Plan, we are targeting ¥15.0 billionin net income in two years by pursuing orga-nizational efficiency and by further strength-ening our earnings base through naturalresource development and trading.

ITOCHU Corporation | 27.
Topics
Organization
Ohanet Natural Gas Development Project (Algeria)The Ohanet Project in Algeria, in which ITOCHU Oil Exploration Co., Ltd. isparticipating through Japan Ohanet Oil and Gas Co., Ltd., has entered thefinal stage of construction for fiscal 2004 production start. Planned produc-tion is for 3 trillion cubic feet of natural gas, 9 million tons of LPG, and 11million tons of condensate. As the largest private sector investment inAlgeria by a Japanese corporation to date, this project will cost aboutUS$1.0 billion in total and is being cooperatively financed by JBIC (JapanBank for International Cooperation) and Japanese commercial banks.ITOCHU Oil Exploration Co., Ltd. has a 35% equity stake in the Japaneseconsortium Japan Ohanet Oil and Gas Co., Ltd., which has a 30% interest inthis project.
Ashton Coal Mine Development Project (Australia)We have decided to participate in the Ashton Project for developing newcoal resources in New South Wales, Australia. We control a 20% interest inthis project. Ashton is being developed as an open-pit coal mine with annu-al production of 2 million tons, which is expected to be expanded to 4 milliontons by developing underground mining. From fiscal 2004, the coal pro-duced by this mine will be sold in Asia including Japan, Europe, and the U.S.as semi coking coal for coke production and as thermal coal for power gen-eration. We are in charge of marketing for this project and are actively pro-moting sales on a global basis.
• Iron ore• Direct reduced iron• Coking coal• Coke• Thermal coal• Ferro alloy and
its materials• Ferrous scrap• Pig iron• Metal powder• Electrodes• Activated carbon• Steel plates• Hot & cold rolled sheets
and coils• Galvanized steel• Steel for machinery• Stainless steel• High tensile steel• Special steel
• Construction materials• Welded steel pipes• Seamless steel pipes• Steel wires• Marine steel structures• Bridges• Prefabricated steel for
buildings• Rails• Non-ferrous metals• Aluminum products• Precious metals• Rare metals• Aluminum• Alumina• Rolled aluminum
products• Molded aluminum• Electric cable• Optical cable
• Electronic material• Crude oil• Natural gas liquid• Gasoline• Naphtha• Kerosene• Jet fuel• Gas oil• Fuel oil• Marine fuel• Lubricant• Asphalt• Liquefied petroleum gas• Liquefied natural gas• Dimethyl ether• Nuclear fuel and Nuclear
power related equipment
Products & Services
トピックス写真
Energy, Metals & Minerals Company
Corporate Planning & Administration Dept.
Control Dept.
Metals & Mineral Resources DivisionIron Ore Dept.Coal Dept.Metal Materials Dept.Non-Ferrous & Light Metal Dept.
Energy DivisionEnergy Business Development Dept.International Energy Trading Dept.Energy Sales & Supply Dept.
Sakhalin Project Dept.
Steel Business Administration Dept.
Coal loading port
Gas production facility
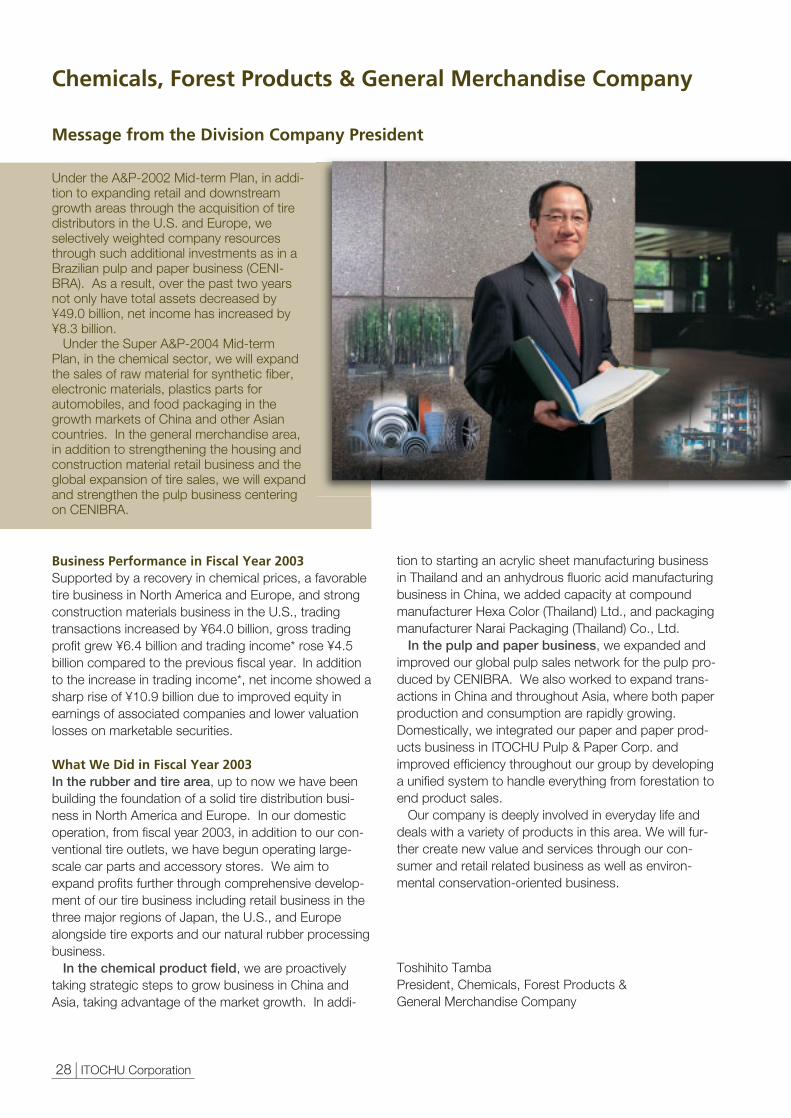
Chemicals, Forest Products & General Merchandise Company
28 | ITOCHU Corporation.
Message from the Division Company President
Business Performance in Fiscal Year 2003Supported by a recovery in chemical prices, a favorabletire business in North America and Europe, and strongconstruction materials business in the U.S., tradingtransactions increased by ¥64.0 billion, gross tradingprofit grew ¥6.4 billion and trading income* rose ¥4.5billion compared to the previous fiscal year. In additionto the increase in trading income*, net income showed asharp rise of ¥10.9 billion due to improved equity inearnings of associated companies and lower valuationlosses on marketable securities.
What We Did in Fiscal Year 2003In the rubber and tire area, up to now we have beenbuilding the foundation of a solid tire distribution busi-ness in North America and Europe. In our domesticoperation, from fiscal year 2003, in addition to our con-ventional tire outlets, we have begun operating large-scale car parts and accessory stores. We aim toexpand profits further through comprehensive develop-ment of our tire business including retail business in thethree major regions of Japan, the U.S., and Europealongside tire exports and our natural rubber processingbusiness.
In the chemical product field, we are proactivelytaking strategic steps to grow business in China andAsia, taking advantage of the market growth. In addi-
tion to starting an acrylic sheet manufacturing businessin Thailand and an anhydrous fluoric acid manufacturingbusiness in China, we added capacity at compoundmanufacturer Hexa Color (Thailand) Ltd., and packagingmanufacturer Narai Packaging (Thailand) Co., Ltd.
In the pulp and paper business, we expanded andimproved our global pulp sales network for the pulp pro-duced by CENIBRA. We also worked to expand trans-actions in China and throughout Asia, where both paperproduction and consumption are rapidly growing.Domestically, we integrated our paper and paper prod-ucts business in ITOCHU Pulp & Paper Corp. andimproved efficiency throughout our group by developinga unified system to handle everything from forestation toend product sales.
Our company is deeply involved in everyday life anddeals with a variety of products in this area. We will fur-ther create new value and services through our con-sumer and retail related business as well as environ-mental conservation-oriented business.
Toshihito TambaPresident, Chemicals, Forest Products &General Merchandise Company
Under the A&P-2002 Mid-term Plan, in addi-tion to expanding retail and downstreamgrowth areas through the acquisition of tiredistributors in the U.S. and Europe, weselectively weighted company resourcesthrough such additional investments as in aBrazilian pulp and paper business (CENI-BRA). As a result, over the past two yearsnot only have total assets decreased by¥49.0 billion, net income has increased by¥8.3 billion.
Under the Super A&P-2004 Mid-termPlan, in the chemical sector, we will expandthe sales of raw material for synthetic fiber,electronic materials, plastics parts for automobiles, and food packaging in thegrowth markets of China and other Asiancountries. In the general merchandise area,in addition to strengthening the housing andconstruction material retail business and theglobal expansion of tire sales, we will expandand strengthen the pulp business centeringon CENIBRA.

ITOCHU Corporation | 29.
Topics
Organization
Strengthening the Tire Retail BusinessIn October 2002, I.C.S. Co., Ltd., which handles auto parts such as tiresand aluminum wheel, acquired ownership of the large-scale car parts andaccessory store Pit 100 Fujioka. We plan to open more stores, mainly in thenorthern Kanto area, as it expands the business to provide total automotiveservice.
Overseas, we will reinforce our tire retail business in Japan, North America,and Europe by developing our franchisee network and by acquiring distribu-tors through our subsidiaries, such as Am-Pac Tire Distributors in NorthAmerica and Stapleton’s (Tyre Services) in Europe.
Proactive Development of Resin Product Business in AsiaJointly with Sumitomo Chemical Co., Ltd., we established Sumipex(Thailand) Co., Ltd. as a manufacturer and retailer of acrylic sheets. It beganoperations in August 2002. With annual production capacity of 8,400 tons,we expect sales to reach ¥2.5 billion in one to two years. Acrylic sheetscarry superb characteristics of transparency and weather resistance and arewidely used in signboards and soundproof walls. The demand for acrylicsheets is increasing particularly in Asia. Having developed a supply systemin Asia ahead of other competitors, we are proactively developing this busi-ness.
We also plan to add capacity to compound manufacturer Hexa Color(Thailand) Ltd. and polypropylene film manufacturer Shanghai Jinpu PlasticPackaging Material Co., Ltd. (China) as we respond to the growth indemand for synthetic resins in Asia.
• Logs• Lumber• Wooden building materials• Wood chips• Wood pulp• Recycled paper• Paper• Paper products• Natural rubber• Tires• Furniture• Shoes• Glass• Cement• Olefin• Aromatics
• Raw materials for synthetic resins• Raw materials for synthetic fibers• Organic chemicals• Methanol• Ethanol• Solvents• Specialty chemicals• Inorganic chemicals• Chemical fertilizers• Polyvinyl chloride• Polyolefin• Synthetic rubbers• Carbon black• Thermoplastic and thermosetting
resins• Resin additives
Products & Services
Chemicals, Forest Products & General Merchandise Company
Planning & Coordinating Dept.
Accounting, Affiliates Administration & Credit Control Dept.
Forest Products & General Merchandise DivisionWood Products & Materials Dept.Paper Materials & Products Dept.Tire & Rubber Dept.General Merchandise Dept.
Chemicals DivisionOrganic Chemicals Dept.Inorganic Chemicals Dept.Plastics Dept.
Aquarium display using acrylic sheet
Opening “Pit 100 Fujioka”

30 | ITOCHU Corporation.
Food Company
Message from the Division Company President
Business Performance in Fiscal Year 2003Higher prices for feed and fresh produce and increased vol-ume in commercial food products led to a ¥77.3 billionyear-on-year rise in trading transactions. Although therewas a negative factor in the marine product business, grosstrading profit grew ¥3.3 billion due to a favorable perform-ance in commercial distribution. While trading income* wasdown ¥0.7 billion due to a rise in expenses for increasedconsumer merchandise transactions, a change in account-ing principles for goodwill amortization and a large improve-ment in equity in earnings from associated companiesresulted in a ¥2.3 billion increase in net income.
What We Did in Fiscal Year 2003In the commercial distribution field, in order to strengthenour across-the-country all-temperature distribution network,we increased our stake in YUKIJIRUSHI ACCESS, INC., thetop-ranked company in the domestic chilled and frozenfood distribution market, becoming its largest shareholder.
In the industrial distribution area, we acquired inAugust 2002 a 20% stake in Compass Group Holding(Japan) K.K., a subsidiary of the world’s largest food con-tract firm, Compass Group PLC of the U.K., with a view tostrengthening our position in the domestic chain restaurantand food contract market, where considerable growth isexpected. This move is aimed at building an industrial dis-tribution system that leverages the Compass Group’sexpertise and at expanding the ITOCHU Group’s trading.Also, in order to strengthen our position in dairy products,an area where we lagged behind industry peers, in March
2003, we made a ¥3.0 billion (8.07%) capital investment inSNOW BRAND MILK PRODUCTS CO., LTD. ITOCHU willnot only expand its trading in dairy materials, but will moveinto new business fields that leverage Snow Brand’s dairytechnology and will develop dairy businesses overseas bytaking advantage of the ITOCHU Group’s network. Theseinitiatives represent our full-fledged entry into dairy prod-ucts.
In the convenience store area, having already estab-lished its presence in Taiwan, Korea and Thailand,FamilyMart Co., Ltd. will open its first store in China in fiscalyear 2004, as it continues its overseas expansion concen-trating on Asia. In the food materials area, ITOCHUacquired three sugar-producing companies including DAI-ICHI-TOGYO Co., Ltd., which puts us in the number threeposition in the sugar-producing industry. In perishablefood products, ITOCHU decided to acquire a 39.9% stakein Prima Meat Packers, Ltd. and in April 2004 made it anassociated company.
In order to appropriately address the recent heighteningof consumer concerns regarding food safety, in April 2002we established the Food Safety Management Office toboost employee awareness, improve operations, and bol-ster our risk management system.
Kouhei WatanabePresident, Food Company
The Food Company has focused on theintegration of all domestic and overseas foodrelated businesses, from raw material devel-opment to production and processing, inter-mediary distribution, and retailing. We aregrowing them based on our StrategicIntegrated System (SIS) to establish an opti-mum supply chain originating in the needs ofconsumers. Under the A&P-2002 Mid-termPlan, we emphasized expansion andimprovement of the intermediary distributionfield, the backbone of SIS, and investedheavily in the industrial distribution field inorder to promote SIS in industrial markets.
Under the Super A&P-2004 Mid-termPlan, we aim to become the food industry’sleading company with net income of ¥20.0billion by completing our domestic SIS strat-egy by making these large investments prof-itable and by developing SIS in essentialoverseas regions including China and otherparts of Asia.
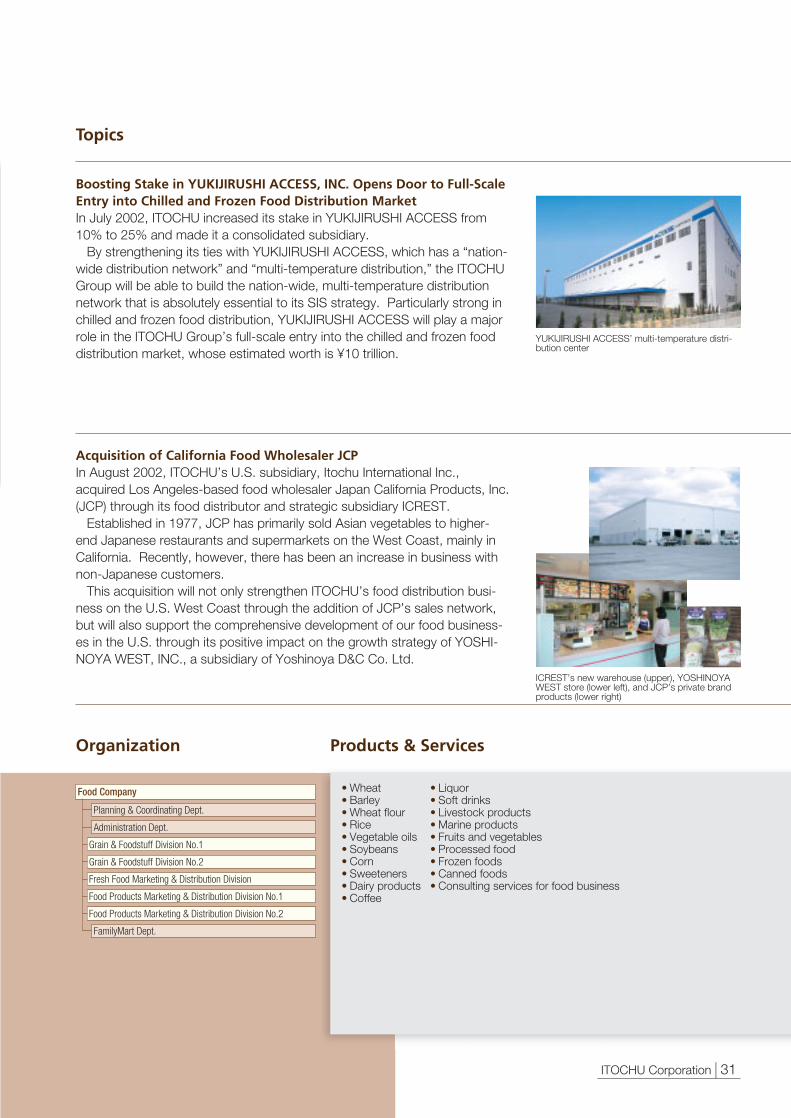
ITOCHU Corporation | 31.
Topics
Organization
Boosting Stake in YUKIJIRUSHI ACCESS, INC. Opens Door to Full-ScaleEntry into Chilled and Frozen Food Distribution MarketIn July 2002, ITOCHU increased its stake in YUKIJIRUSHI ACCESS from10% to 25% and made it a consolidated subsidiary.
By strengthening its ties with YUKIJIRUSHI ACCESS, which has a “nation-wide distribution network” and “multi-temperature distribution,” the ITOCHUGroup will be able to build the nation-wide, multi-temperature distributionnetwork that is absolutely essential to its SIS strategy. Particularly strong inchilled and frozen food distribution, YUKIJIRUSHI ACCESS will play a majorrole in the ITOCHU Group’s full-scale entry into the chilled and frozen fooddistribution market, whose estimated worth is ¥10 trillion.
Acquisition of California Food Wholesaler JCPIn August 2002, ITOCHU’s U.S. subsidiary, Itochu International Inc.,acquired Los Angeles-based food wholesaler Japan California Products, Inc.(JCP) through its food distributor and strategic subsidiary ICREST.
Established in 1977, JCP has primarily sold Asian vegetables to higher-end Japanese restaurants and supermarkets on the West Coast, mainly inCalifornia. Recently, however, there has been an increase in business withnon-Japanese customers.
This acquisition will not only strengthen ITOCHU’s food distribution busi-ness on the U.S. West Coast through the addition of JCP’s sales network,but will also support the comprehensive development of our food business-es in the U.S. through its positive impact on the growth strategy of YOSHI-NOYA WEST, INC., a subsidiary of Yoshinoya D&C Co. Ltd.
• Wheat• Barley• Wheat flour• Rice• Vegetable oils• Soybeans• Corn• Sweeteners• Dairy products• Coffee
• Liquor• Soft drinks• Livestock products• Marine products• Fruits and vegetables• Processed food• Frozen foods• Canned foods• Consulting services for food business
Products & Services
Food Company
Planning & Coordinating Dept.
Administration Dept.
Grain & Foodstuff Division No.1
Fresh Food Marketing & Distribution Division
Food Products Marketing & Distribution Division No.2
FamilyMart Dept.
Grain & Foodstuff Division No.2
Food Products Marketing & Distribution Division No.1
YUKIJIRUSHI ACCESS’ multi-temperature distri-bution center
ICREST’s new warehouse (upper), YOSHINOYAWEST store (lower left), and JCP’s private brandproducts (lower right)

32 | ITOCHU Corporation.
Finance, Realty, Insurance & Logistics Services Company
Message from the Division Company President
Business Performance in Fiscal Year 2003Despite active condominium sales, trading transactionsdecreased by ¥185.9 billion due to withdrawal from inef-ficient transactions in housing lot sales business andgross trading profit was down ¥0.5 billion due to valua-tion losses on residential land compared with the lastfiscal year. Due to the provision for doubtful accountsthat occurred in the previous fiscal year and the effect ofcost-cutting, trading loss* improved ¥6.6 billion and thenet loss improved ¥1.4 billion.
What We Did in Fiscal Year 2003In the consumer finance business, Famima CreditCorporation made its full-scale entry into the credit cardbusiness when it started accepting applications for itsJupi Card in May 2002. In the PE business, inSeptember 2002 ITOCHU formed the Raffia Fund, abuyout fund targeting all types of businesses, withShinsei Bank; and the IDA Fund, a specialized buyoutfund aimed at information system companies, withAozora Bank. In March 2003, the Raffia Fund made itsfirst acquisition with the purchase of the JASDAQ-listedROKI TECHNO Co., Ltd., the largest manufacturer ofcartridges for liquid filtration. In the construction andrealty field, we withdrew from inefficient assetsand devoted energy to efficient condominiums and solu-tion businesses such as PFI** and securitization.
In the insurance field, we started a service of cre-ation and operation support of employees benefit pack-age with the goal of evolving from a traditional insurancebrokerage business into a risk solution provider. Also,we started handling group credit insurance that dispers-es underwriters’ risks and offers eased conditions forsigning up by grouping corporations and nonlife insur-ance companies respectively.
In the logistics area, we promoted our 3PL businessfor pharmaceutical makers and a total of seven compa-nies are using our six domestic distribution centers. Weare also promoting the logistics business in China andother overseas locations through our subsidiaries, i-LOGISTICS CORP., China based Beijing PacificLogistics Co., Ltd. and Hungary based Eurasia SpedKFT. We will continue to expand our 3PL business goingforward, concentrating on the key areas of pharmaceuti-cals, consumer products and automobile industry.
Hiroshi UedaPresident, Finance, Realty, Insurance &Logistics Services Company
By exiting from inefficient assets and devel-oping new businesses under our A&P-2002Mid-term Plan, during its two years wereduced assets by ¥134.4 billion andimproved the net loss from ¥40.9 billion to¥8.4 billion. Although the segment remainsin the deficit overall, the A&P segment offinancial services related is generatingsteady profit.
Under the Super A&P-2004 Mid-termPlan, we plan to further reinforce our earn-ings base by continuing to promote newbusinesses in our core areas. These includethe consumer finance business and privateequity (PE) business, insurance business,and the 3rd Party Logistics (3PL). We aim torestore profitability on a trading income*basis in fiscal year 2005 by further reducinginefficient assets in the construction andrealty fields.
ITOCHU Corporation | 33.
Topics
Organization
“Chiba City Nature House for Youth” PFI** CommissionedIn the term under review, Chiba City commissioned us with the PFI for“Chiba City Nature House for Youth” PFI in December 2002. This undertak-ing includes construction of a 13,715 m2 educational facility as well as main-tenance of the facility and management of the social education businessover a 15-year period.
In addition to organizing the overall scheme of the PFI as representative ofthe corporate consortium and project manager, ITOCHU will raise the fundsfor the project. We will also take advantage of the ITOCHU Group’s integra-tion, by putting ITOCHU Urban Community Ltd. in charge of maintaining thefacility.
**PFI: Private Finance InitiativeConstruction, maintenance, and operation of the social infrastructure by the private sector.
Corporate Benefit Package Creation and Operation Support ServiceStartedIn October 2002, we initiated the “Life Planning Comprehensive SupportProgram,” which conducts corporate benefit package organization and opera-tion support. We are accelerating diffusion of the program through an alliancewith Misawa Resort Co., Ltd., the owner of “Life Support Club,” which hasmore than 1,000 member companies (total of 500,000 employees).
Its core feature is its program for guaranteeing income to employees whotake an extended amount of time off due to illness or injury. Advantage RiskManagement Group, which jointly offers the service, boasts a dominant 30%share of the domestic market currently estimated at approximately ¥5.0 billion.We are committed to this service as a core business in our retail strategy.
• Foreign exchange and securities trading• Securities investment• Asset management for financial products• Loan business• Online stock broking• Other financial services• Planning, developing, consulting, broker-
ing, constructing, contracting, managing,operating, selling facilities and materialsfor residential housing, office buildings,golf courses, industrial parks, hotels, andshopping malls
• Insurance agency
• Broking of insurance and reinsurance
• Consulting of insurance and reinsurance
• Warehousing and trucking• Logistics centers• Ship chartering business• International intermodal transport• Air cargo• Freight forwarding• Travel services• Distribution processing• Harbor transport business
Products & Services
Finance, Realty, Insurance & Logistics Services Company
Planning & Coordinating Dept.
Administration Dept.
Financial Services DivisionForex & Securities Dept.Financial Solution BusinessesFinancial Businesses Development Dept.
Construction & Realty DivisionConstruction & Realty Dept.Overseas Construction & Realty Dept.Osaka Construction & Realty Dept.
Insurance Services DivisionInsurance Business Development Dept.Marine Insurance Dept.
Logistics Services DivisionLogistics Dept. No.1Logistics Dept. No.2
Completion drawing of “Chiba City Nature Housefor Youth”
The tie-up with Misawa Resort and AdvantageRisk Management Group

34 | ITOCHU Corporation.
The environment surrounding overseas markets andregions is rapidly changing on a global scale due tothe deregulation, the liberalization of capital move-ment, the sharing of commercial trading and technol-ogy standards, and the enhanced availability of infor-mation made possible by information technology.After carefully examining such changes in the busi-ness environment, ITOCHU is focusing managementresources on those markets where the Group’s capa-bilities can be fully utilized. In other words, by pro-moting our A&P strategy through selection and con-centration of markets and regions, we aim to reinforceprofitability in overseas markets and regions.
A&P RegionsIn promoting our A&P strategy, we have designatedoverseas regions that are expected to become coreprofit generators as A&P regions. By designating NorthAmerica (since fiscal year 2002) and Asia (since fiscalyear 2003) as A&P regions and focusing our manage-ment resources on them, we aim to further expandoverseas profit, particularly in these two regions.
1. North AmericaDespite the slump in a few businesses such as autoleasing, small-size power generator sales, and fencesales, ITOCHU International Inc. (III), the center of ourNorth American operations, achieved a strong perform-ance overall in the textile, general merchandise, andchemical product businesses. Profits in textiles weredriven by domestic apparel and raw material sales, andprofits in general merchandise and chemical productswere propelled by nail and construction material salesthrough PrimeSource Building Products, Inc. and tiresales through Am-Pac Tire Distributors, Inc.
In the consumer-related field, we acquired the LosAngeles-based food wholesaler Japan CaliforniaProducts, Inc. (JCP). JCP is the largest among the fooddistributors selling fresh vegetables to high-endJapanese restaurants and supermarkets in the U.S. Thisacquisition marks our full-fledged entry into the food dis-tribution industry in the U.S.
In addition to its development in food distribution, III isenlarging its machinery maintenance and operationbusiness. The core companies of III’s machinery main-tenance business are its subsidiary EnprotechCorporation, the industry’s top repairer of large-scale
presses for automobile manufacturing and manufacturerof spare parts, and North American Energy Services(NAES), the world’s largest independent power plantoperation and maintenance firm. In November 2002,Enprotech expanded the scope of its business byacquiring BevCorp L.L.C., which provides maintenancefor bottling machines. In June 2003, III acquired TyrEnergy, Inc., which consults on electricity and gaswholesaling, and NAES acquired Connective OperatingService Company, which maintains power plants,enhancing its system for providing comprehensive serv-ices in the power generation field.
Playing an important role in introducing promisingoverseas businesses to ITOCHU Corporation, III mediat-ed the development of the high-end gourmet storeDean & Deluca for the Japanese market.
Aiming to go beyond the conventional business modelcentered on trading, we will further develop our existingbusinesses and promote mergers and acquisitions ingrowth areas. With a proactive growth strategy andlarge-scale strategic investment focused on the threecore fields: consumer and retail related, logistics, andthe field of maintenance, operation and service, we planto earn several tens of millions of dollars from these newsources of profit.
2. AsiaSince fiscal year 2002, we have reinforced our systempromoting our Asian strategy by establishing the AsianStrategic Committee, the Office for Promoting AsianStrategy, and a Chief Officer for Asian Region Strategy.
By defining areas of focus and allocating managementresources, our Asian strategy implements such impor-tant policies as the expansion of local and regionaltrade, new investments in efficient projects, and the pro-motion of company-wide and specific market develop-ment projects.
Regarding local and regional trade, we are expandingtrade, mainly of chemicals, general merchandise, tex-tiles, and food within the Asian region and other regions.New investments during the A&P-2002 Mid-term Plan(from April 2001 to March 2003) include such prominentprojects as LPG (Liquefied Petroleum Gas) production inIndonesia and refrigerated warehousing and fruit juiceproduction in China. Company-wide and specific mar-ket development projects include our involvement inmedium- to long-term projects in China and India.
Overseas Operations

ITOCHU Corporation | 35.
We continue to take measures to expand profit in theA&P areas of consumer and retail related businesses(particularly textiles and foods), natural resource devel-opment, and chemical products. Within Asia, ITOCHUhas a strong focus on China and we will continue topromote the development of business in this crucialmarket by expanding local trade and investing in localbusinesses through alliances with powerful Chinese cor-porations (see page 13 for our China strategy).
In addition, we promote local trade and investment byenhancing personnel and developing national staffmembers in Thailand, Singapore, Indonesia, India, andVietnam.
Other RegionsIn Europe, ITOCHU Europe PLC. is expanding basicprofitability by concentrating on the main sales groupsof textiles, chemicals, general merchandise, and food.We aim to further enhance profitability by expanding ourregional market trade through core companies such asProminent (Europe) Ltd. (textiles), Stapleton’s (TyreServices) Ltd., and Reifen Gundlach GmbH (tire-relatedbusinesses), and by cultivating the Central and EasternEuropean markets that will be encompassed in anexpanded European Union.
In Oceania, we are sharply expanding profit in the nat-
ural resource field through ITOCHU Coal ResourcesAustralia Pty., Ltd. (coal) and CI Minerals Australia Pty.,Ltd. (iron ore). We also aim to grow profit in the areas ofwool, food, and general merchandise.
Human Resource Strategies for Regional andMarket StrategiesIn order to promote regional and market strategies, thehuman resources capable of achieving those goalsmust be secured and developed. To promote localbusinesses, we will develop and place human resourcesin accordance with the characteristics of each regionand market. We will carry this out by strengthening theabilities of our employees through overseas on-the-jobtraining, utilizing retired employees through our systemfor posting specialists overseas, and enhancing thequality of national staff through our training system.In Asia in fiscal year 2002, we introduced the AsianLeadership Program (ALP) as a training system for theprospective national staff executives and began promot-ing the Asian Scholarship Program (ASP) as a trainingsystem for future mid-level managers of national staff.In fiscal year 2003, six national staff personnel partici-pated in ALP and 14 in ASP. Going forward, we will fur-ther reinforce the development and education of ournational staff, particularly in Asia.
Changes in Net Income in North America and Asia as A&P RegionsBillions of Yen
2002 2004(Plan)
2005(Plan)
2003
14
-2
4
6
8
10
1.1
-0.8
6.0
13.0
12.0
6.0
4.9
5.6
12
2
North America Asia
0
Years ended March 31
36 | ITOCHU Corporation.
Finance, Accounting, Credit & Human Resources
Headquarters
In addition, subsidiaries that support the above operationsinclude ITOCHU Shared Management Services, Inc. a spinoffwhich handles finance and accounting functions previouslyadministrated by headquarters, and ITOCHU Human ResourceServices, Inc., a company which provides human resource con-sulting and personnel management services to group companies.
PoliciesIn the financial area, we are reinforcing the consolidated financialmanagement system through our Group Finance Committee. Inparticular, we are implementing a financial strategy that focuseson reinforcing the system for managing interest-rate volatility risk,diversifying fund raising sources by setting commitment lines, andfurther reducing financing costs. In addition, we enhanced stock-holders’ equity by ¥54.8 billion through a public offering in July2002. Further, by introducing the enterprise resource planningpackage SAP, we completed restructuring of basic operatingsystem of the entire organization. In addition to speeding upfinancial results announcement by introducing an SAP systemthroughout the organization, we promoted tax saving measuressuch as introduction of a consolidated income tax return.
One of the key issues of our A&P-2002 was enhancing riskmanagement. In this regard, we aim to reinforce risk manage-ment for the entire Group by thoroughly bringing risk capital man-agement methods to our subsidiaries including those overseasand reviewing our country risk management system.
In the human resources area, we promoted a strategy ofmatching human resources to each Division Company’s busi-ness, enriched training programs such as our Asian LeadershipProgram for developing future managers for the Asian region, andrevitalized human resources with a “right person in the rightplace” approach. In addition, we fundamentally revised our retire-ment and severance plan (please see page 17) by introducingeffective measures such as the defined contribution pension plan,which lead to the minimization of risks on management of risingretirement benefit costs.
Sumitaka FujitaExecutive Vice President, C.F.O. and C.C.O.
Organization
Contents of OperationsThe executive vice president for finance, accounting, credit andhuman resources leads four divisions at Headquarters: Finance;General Accounting Control; Risk Management; and HumanResources. His responsibilities for the entire Group include devis-ing financial strategies and raising funds in the Finance area;financial reporting in the Accounting area; maintaining and moni-toring the risk management system in the Risk Management area;and making plans and proposals for the overall human resourcessystem and hiring and training personnel in the HumanResources area.
Organization Directly Under the President and C.E.O.The Secretariat and the Internal Audit Division directly report to the President and C.E.O.
The Secretariat provides secretarial functions to top management including the president andfacilitates smooth communication amongst top management both inside and outside of theCompany.
The Internal Audit Division focuses on contributing to management by providing 1) a monitoringfunction to ensure that internal control continues to operate effectively and 2) consulting activitiesdesigned to add value and improve management operations. It evaluates the effectiveness of
Finance Division
General Accounting Control Division
Risk Management Division
Human Resources Division
ITOCHU Shared Management Services Inc.
ITOCHU Human Resource Services Inc.
Finance, Accounting, Credit & Human Resources
ITOCHU Corporation | 37.
Corporate Planning, Affiliate Administration, General Affairs & Legal
Organization
Organization
Contents of OperationsThe managing director for corporate planning, affiliate administration,general affairs and legal leads six divisions at Headquarters:Corporate Planning & Administration; Corporate Communications; ITPlanning; Affiliate Administration; General Affairs; and Legal. Hisresponsibilities for the entire Group include devising managementplans, allocating management resources, monitoring the progress ofmanagement plans and evaluating performance in the CorporatePlanning and Administration area; Public relations for inside and out-side organization in the Corporate Communications area; devising ITstrategy and establishing infrastructure in Information System area;
internal control and management resources, and reports important subjects and recommenda-tions to top management by auditing of business divisions which include subsidiaries, overseasregional operations, headquarter administrative divisions and the entire organization’s specificthemes.
In addition, it is striving to cooperate with corporate auditors, exchange information with inde-pendent external auditors, and enhance its function to the ITOCHU Group through collaborationwith the internal audit section of the group companies. It also develops professionalism andexpertise through internal staff recruiting.
President and C.E.O.
Internal Audit Division
Secretariat
devising group company strategy and monitoring and evaluatinggroup company management in the Affiliate Administration area;operation and management of corporate infrastructure, and imple-menting measures for environmental issues and social contributionsin the General Affairs area; handling contracts and lawsuits and coor-dinating international trade security policy in the Legal area.
In addition, as subsidiaries for supporting the above operations,there are ITOCHU Management Consulting Co., Ltd., whichresearches and supports overseas operations, and ITOCHU GeneralServices Inc., which provides general affairs-related services.
PoliciesIn regard to the group company strategy that supports our profitabili-ty on a consolidated basis, we are using our Group ProfitsImprovement Committee to promote the reform of subsidiaryexpense structure. Furthermore, we are using GMC (GroupManagement Committee) to devise strategies to expand profit fromthe group companies mainly by further reinforcing profitable compa-nies.
ITOCHU takes very seriously its social responsibility as a corpora-tion for global environmental problems and is involved in variousrelated projects. In June 2002, ITOCHU Taiwan Corporationreceived ISO14001 certification, following our Headquarters anddomestic branches. As evidenced by such efforts to win certificationby our overseas subsidiaries and our promotion of environmentalconservation-oriented businesses, it is our policy to contribute to therealization of a sustainable society and construction of a recycling-oriented society. Further, as part of our efforts to contribute to socie-ty and coexist with the local communities, in addition to the ITOCHUFoundation’s activities for “the sound upbringing of children,” wehave a broad range of involvement supporting employees’ volunteerefforts to contribute to local communities. Furthermore, as a mem-ber of international society, in addition to conducting internationaltrade in conformance with international agreements, we are reinforc-ing our management system and educating employees in order tobe in full compliance with laws and regulations.
In addition, our Corporate Development Office, InnovativeTechnology Business Development Office, and China Market GlobalDevelopment Office are laying the groundwork for long-term orcross-company involvement in promising business areas. Going for-ward, in addition to further enhancing corporate functions and build-ing a management system characterized by flexibility and speed andinfrastructure to support the new ITOCHU Group, we will endeavorto enhance corporate disclosure and be fully accountable.
Eizo KobayashiManaging Director and C.I.O.
Corporate Planning, Affiliate Administration, General Affairs & Legal
ITOCHU Management Consulting Co., Ltd.
ITOCHU General Services Inc.
Corporate Planning and Administration Division
Corporate Communications Division
IT Planning Division
Affiliate Administration Division
General Affairs Division
Legal Division
Corporate Development Office
Innovative Technology Business Development Office
China Market Global Development Office

38 | ITOCHU Corporation.
Corporate Governance
ITOCHU proactively works to reinforce corporate gover-nance, recognizing it as one of the most important issuesfor management. Our basic policy is to establish a highlytransparent management system that benefits stakehold-ers, primarily stockholders, through the followingapproaches:(1) Enhancing transparency in decision-making processes;(2) Strengthening corporate information disclosure and
management accountability;(3) Thoroughly managing risk, which includes compliance
with laws and regulations; (4) Maintaining business ethics through the strict applica-
tion of rewards and punishments.
Enhancing Management TransparencyTo establish a more efficient and transparent managementsystem, ITOCHU has moved forward with the streamlining ofthe Board of Directors. Specifically, we reduced the numberof board members from 45 as of fiscal year 1999 to 12 as offiscal year 2003 and plan a further reduction to 11 in fiscalyear 2004. Also, we introduced the executive officer positionfrom fiscal year 2000 and the managing executive officerposition from fiscal year 2002. As of April 2003, we have 32executive and managing executive officers. Not only has thestreamlining of the Board of Directors speeded up decisionmaking, it also helps directors fulfill their essential roles ofmaking corporate decisions and supervising operations,which allows executive officers to devote themselves to theexecution of their own duties.
We have introduced a new compensation system for direc-tors and executive officers, following the revisions of the sys-tem in fiscal years 2002 and 2003. By evaluating how welldirectors and executive officers have fulfilled their requiredfunctions, it is more closely tied to business performance.
In fiscal year 2001 we established an Advisory Board com-posed of outside experts from various fields. Its independ-ence allows us to obtain useful opinions on managementfrom an objective point of view.
From April 2003, following a revision to the CommercialCode, companies have the option of adopting Company withCommittees system. However, for the time being, we havedecided to continue to reinforce our existing corporate gover-nance system, which is predicated on management supervi-sion by the Board of Corporate Auditors, an organization thatis independent of the Board of Directors, because we believeit is well suited to ensuring adequate independent monitoring.
While studying examples of best practice in other devel-oped countries, we will continue to pursue a system of cor-porate governance that best suits the Company.
The Headquarters Management Committee and OtherInternal CommitteesEstablished as a support body to the President, theHeadquarters Management Committee (HMC) discussesgeneral management policy and important issues relating tomanagement. We have also created other internal commit-tees that assist the decision making of the President andBoard of Directors through the careful examination and dis-cussion of management issues in their particular areas(please see the table on the next page).
Reinforcing Disclosure and AccountabilityAmid a growing awareness of the importance of disclosure,we are not only maintaining our accountability to stakehold-ers, but are also proactively promoting disclosure. In fiscalyear 2001 we became the first Japanese general tradingcompany to announce quarterly financial statements andsince fiscal year 2002 we have been reinforcing investor rela-
Board of Directors11 Directors
Election and superviseMonitoring
Financial audit
President and C.E.O.
Headquarters Management Committee
Division Companies
General Meeting of Stockholders
Election and dismissalElection and dismissal
Election and dismissal
Board of Corporate Auditors 5 Corporate AuditorsIncluding 2 Outside Corporate Auditors
ITOCHU’s Corporate Governance System
Independent External Auditors
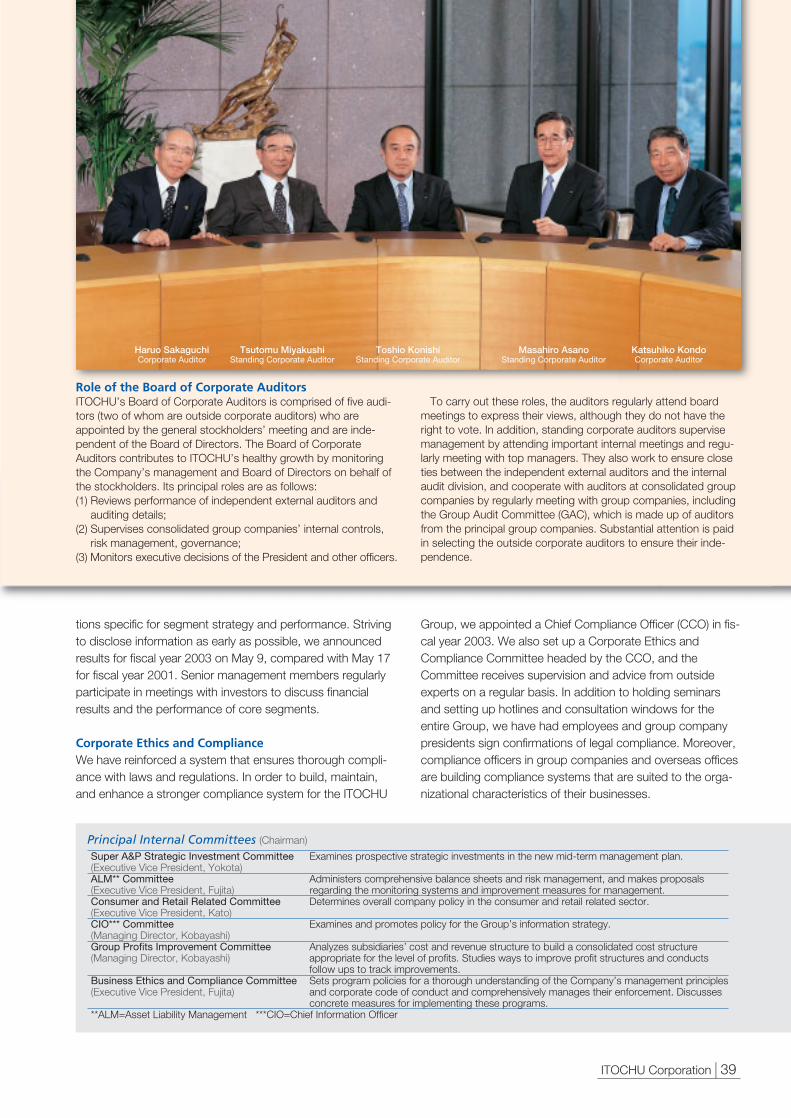
ITOCHU Corporation | 39.
tions specific for segment strategy and performance. Strivingto disclose information as early as possible, we announcedresults for fiscal year 2003 on May 9, compared with May 17for fiscal year 2001. Senior management members regularlyparticipate in meetings with investors to discuss financialresults and the performance of core segments.
Corporate Ethics and ComplianceWe have reinforced a system that ensures thorough compli-ance with laws and regulations. In order to build, maintain,and enhance a stronger compliance system for the ITOCHU
Role of the Board of Corporate AuditorsITOCHU’s Board of Corporate Auditors is comprised of five audi-tors (two of whom are outside corporate auditors) who areappointed by the general stockholders’ meeting and are inde-pendent of the Board of Directors. The Board of CorporateAuditors contributes to ITOCHU’s healthy growth by monitoringthe Company’s management and Board of Directors on behalf ofthe stockholders. Its principal roles are as follows:(1) Reviews performance of independent external auditors and
auditing details;(2) Supervises consolidated group companies’ internal controls,
risk management, governance; (3) Monitors executive decisions of the President and other officers.
To carry out these roles, the auditors regularly attend boardmeetings to express their views, although they do not have theright to vote. In addition, standing corporate auditors supervisemanagement by attending important internal meetings and regu-larly meeting with top managers. They also work to ensure closeties between the independent external auditors and the internalaudit division, and cooperate with auditors at consolidated groupcompanies by regularly meeting with group companies, includingthe Group Audit Committee (GAC), which is made up of auditorsfrom the principal group companies. Substantial attention is paidin selecting the outside corporate auditors to ensure their inde-pendence.
Haruo Sakaguchi Tsutomu Miyakushi Toshio Konishi Masahiro Asano Katsuhiko KondoCorporate Auditor Standing Corporate Auditor Standing Corporate Auditor Standing Corporate Auditor Corporate Auditor
Group, we appointed a Chief Compliance Officer (CCO) in fis-cal year 2003. We also set up a Corporate Ethics andCompliance Committee headed by the CCO, and theCommittee receives supervision and advice from outsideexperts on a regular basis. In addition to holding seminarsand setting up hotlines and consultation windows for theentire Group, we have had employees and group companypresidents sign confirmations of legal compliance. Moreover,compliance officers in group companies and overseas officesare building compliance systems that are suited to the orga-nizational characteristics of their businesses.
Principal Internal Committees (Chairman)
Super A&P Strategic Investment Committee Examines prospective strategic investments in the new mid-term management plan.(Executive Vice President, Yokota)ALM** Committee Administers comprehensive balance sheets and risk management, and makes proposals (Executive Vice President, Fujita) regarding the monitoring systems and improvement measures for management.Consumer and Retail Related Committee Determines overall company policy in the consumer and retail related sector.(Executive Vice President, Kato)CIO*** Committee Examines and promotes policy for the Group’s information strategy.(Managing Director, Kobayashi)Group Profits Improvement Committee Analyzes subsidiaries’ cost and revenue structure to build a consolidated cost structure (Managing Director, Kobayashi) appropriate for the level of profits. Studies ways to improve profit structures and conducts
follow ups to track improvements. Business Ethics and Compliance Committee Sets program policies for a thorough understanding of the Company’s management principles (Executive Vice President, Fujita) and corporate code of conduct and comprehensively manages their enforcement. Discusses
concrete measures for implementing these programs.**ALM=Asset Liability Management ***CIO=Chief Information Officer

40 | ITOCHU Corporation.
Environmental Conservation Activities and Social Contribution
Environmental Report 2003In June 2003, we published afourth edition of our environ-mental report, EnvironmentalReport 2003. It summarizesour environmental activitiesfor fiscal year 2003 and pres-ents the concept of environ-mental conservation-orientedbusinesses, including theactivities of some of ourgroup companies.
Environmental Risk ManagementWe manage environmental risk that may occur in the daily con-duct of business, evaluate in advance the environmental impactof new investment and development projects, and maintainpreparedness for accidents and emergency situations. In fiscalyear 2003 there were no accidents or violations of laws or reg-ulations that caused major impact on the environment.
Promoting Environmental Conservation-OrientedBusinessesIn April 2002, we established the Sub-Committee onEnvironmental Businesses Promotion, under the umbrella ofthe Global Environment Committee, which has begun studyingand promoting cross-division businesses. Currently, we havefour task forces with personnel from related divisions seekingnew business opportunities in their respective areas (please seethe table below).
Environmentally Friendly OfficesIn addition to our installation of energy-saving equipment andfacilities, we are promoting energy saving, waste reduction andsorting by all employees by posting environmental managersand “eco-leader” at all levels of the Company. Since its com-pletion in 1980, our Tokyo headquarters building has beenequipped to treat and recycle rain water collected from thebuilding site and kitchen waste water from the employee cafe-teria to flush toilets. This system enhances water saving whileheightening individual employees’ awareness of the environ-ment.
As a company engaged in natural resource development, investment, productand service provision and other areas on a global scale, ITOCHU is keenlyaware of its responsibility to the global environment and society, and considersenvironmental conservation and social contribution to be among the mostimportant management issues.
Environmental Conservation In fiscal year 2003, the ITOCHU Group as a whole continued to promote environ-mental risk assessment and prevention. In addition to making testing for soil con-tamination obligatory when buying land, we conducted on-site interviews to surveythe observance of laws and regulations by group companies that have a highimpact on the environment, and held seminars on related laws and regulations.
Environmental Management SystemSince acquiring ISO14001 certification in December 1997,ITOCHU Corporation has promoted the expansion of thisenvironmental certification. In June 2002, ITOCHU TaiwanCorporation became our first overseas trading subsidiary toinclude itself among the ISO certified. The number of groupcompanies awarded with their own ISO certification increasedby 11 to 33 during fiscal year 2003. Furthermore, in additionto assigning environmental coordinators in group companiesand overseas offices, we are taking measures to improveenvironmental conservation and risk management by imple-menting voluntary environmental management audits at ourdomestic branches, overseas offices, and group companiesthat have not acquired ISO certification.
Sub-Committee on Environmental Businesses PromotionTask force Activities Task force membersGlobal Warming Task Force
Heat Island Task Force
Automobile Recycling Task Force
Thermal Recycling Task Force
Investigates the Kyoto Mechanism—joint implementa-tion (JI), clean development mechanism (CDM) andemissions trading (ET).Examines measures on heat-resistant paints, rooftopgreening programs, etc. to address the heat islandissue facing large cities.Examines ways to deal with shredder dust generatedfrom used cars.
Investigates appropriate methods of incineration forindustrial waste, including construction waste materials.
Selected from Plant, Automobile & Industrial MachineryCompany; Energy, Metals & Minerals Company andChemicals, Forest Products & General Merchandise CompanySelected from Energy, Metals & Minerals Company andChemicals, Forest Products & General Merchandise Company
Selected from Plant, Automobile & Industrial MachineryCompany; Energy, Metals & Minerals Company andAerospace, Electronics & Multimedia CompanySelected from Plant, Automobile & Industrial MachineryCompany

ITOCHU Corporation | 41.
Introduction of Environmental AccountingIntroduced from the second edition of our EnvironmentalReport published in June 2001, “environmental accounting” isan itemized report of environmental conservation costs andinvestments and their effect. As a general trading company,ITOCHU has relatively little impact on the environment com-pared with a manufacturing company. For this reason, per-
Wind-Generated Power Sales BusinessITOCHU, Horonobe Town, JFE Engineering Corporation, and others,jointly established the Otonrui Wind Power Plant (750kW x 28 turbines= 21,000kW) of Horonobe Wind Power Generation in Hokkaido. InMarch 2003, the plant was approved by the Minister of Economy,Trade, and Industry as a “new energy power generation facility” underthe RPS** Law, which requires power companies to use a certainamount of renewable energy. The yearly output is equivalent toapproximately 50 million kWh (12,000 households’ consumption).Compared with a heavy-oil-fired thermal plant, this can save about58,000 barrels of heavy oil and about 35,000 tons of CO2. HokkaidoElectric Power Company uses electricity generated by this plant inaccordance with the RPS law. (**Renewable Portfolio Standard.)
sonnel expenses account for most of the costs associatedwith achieving environmental objectives and targets includingcompliance with laws and regulations. In fiscal year 2003,however, charter costs for double-hull ships for transportingcrude and heavy oil increased sharply as a result of the rein-forcing of measures to prevent marine pollution.
Social Contribution ActivitiesIn order to achieve “Societal Benefits” that are the foundation of our corporate philosophy, in addition to our broad contributions to society at the corporate level, we actively support individual employees’ efforts to contribute to society.
Activities at the Corporate Level•Support for Basic Research•Since establishing the financially assisted research divisionat the University of Tokyo’s Center for Climate SystemResearch in 1991, in cooperation with 17 group companieswe have continued to support basic research on climatechange, including studies on global warming.
•ITOCHU Foundation•Established in 1974 to “make contributions to the soundupbringing of children,” the ITOCHU Foundation is involvedin a variety of activities including operating the TokyoElementary and Junior High School Student Center andassisting the children’s library.
•Supporting Employee Contributions to Society•Introduced in 1992, the “volunteer time-off system” sup-ports employees’ efforts to contribute to society. It pro-vides opportunities for volunteer activities, including “sum-mer school programs on the environment,” which assistlocal elementary school students with their summer vaca-tion studies, and “ITOCHU Corporation lobby concerts,”which are held for employees, families, local citizens, andresidents of facilities for the physically challenged.
Employees’ Volunteer ActivitiesIndividual employees are exercising their volunteer spiritthrough “Fureai no Network,” our employee volunteer organ-ization. Activities include the holding of regular meetings fornature watching, disaster relief, and reading to the blind,monthly cleanups of the area around ITOCHU’s Tokyoheadquarters, participation in blood donation (over 1,500donors to date), and bone marrow bank donor registration.
Employees’ nature watching activity

As of March 31, 2003Major Subsidiaries and Associated Companies
42 | ITOCHU Corporation.
Sub
sidiaries
Associates
Sub
sidiaries
Associates
Textile Company Name Voting Shares(%) Operations
Domestic CI Fabric Ltd. 100.0 Manufacture and wholesale of fabrics for apparel and home furnishingsITOCHU Home Fashion Corp. 100.0 Manufacture and wholesale of home furnishingsSAKASE ADTECH CO.,LTD. 90.0 Manufacture and wholesale of textile fabrics for industry and home fur-
nishingsRoy-ne Co., Ltd. 75.2 Manufacture and wholesale of woven and knitted productsMarusan-Ai Corporation 75.0 Dyeing and finishing of polyester fabricsITOCHU Modepal Co., Ltd. 99.9 Manufacture and wholesale of apparelUNICO Corporation 100.0 Manufacture and wholesale of uniformsTOMMY HILFIGER JAPAN, INC. 60.0 Sale of Tommy Hilfiger brand productsLiondor Co., Ltd. 100.0 Manufacture and wholesale of men’s apparelCI GARMENT SERVICE CO., LTD. 100.0 Retail of men’s and ladies’ apparel and sale of garment materialHunting World Japan Co., Ltd. 100.0 Import and sale of Hunting World brand productsJOI’X CORPORATION 100.0 Sale of men’s apparelORIZZONTI CO.,LTD. 100.0 Sale of Interplanet brand and Vivienne Westwood brand apparelSTRENESSE JAPAN LTD. 75.0 Import and sale of Strenesse brand productsCONVERSE JAPAN CO., LTD. 100.0 Comrehensive control of CONVERSE brand businessITOCHU Fashion System Co., Ltd. 100.0 Comprehensive consulting in the fashion industryRichard-Ginori Japan Corporation 50.0 Import and sale of Richard Ginori & Pagnossin Group brand productsBALLY JAPAN LTD. 80.0 Sale of BALLY brand productsITOCHU Textile Institute, Inc. 100.0 Research, developing, and consultingCI Shopping Service Co., Ltd. 100.0 Sale of everyday items aimed at ITOCHU Group employees and fami-
liesOverseas ITOCHU Wool Ltd. (Australia) 100.0 Purchase and wholesale of wool and animal hair
ITOCHU Textile Materials (Asia) Ltd. 100.0 Wholesale of chemical fibers, filament yarns and cotton yarns(Hong Kong S.A.R., China)HANGZHOU FUJITOMI 80.0 Manufacture, export and wholesale of textile productsSILK GARMENTS CO., LTD.(China)Prominent Apparel Ltd. (Hong Kong S.A.R., China) 100.0 Production control and wholesale of textile and apparelTianjin Huada Garment Co., Ltd. (China) 92.0 Manufacture of uniformsUNIMAX SAIGON CO., LTD. (Vietnam) 80.0 Manufacture of uniformsQingdao Tri-Gents Clothing Co., Ltd. (China) 80.0 Manufacture of men’s suitProminent USA Inc. (U.S.A.) 100.0 Import, export and wholesale of garments and fabricsProminent (Europe) Ltd. (U.K.) 100.0 Import and wholesale of garments and fabricsITOCHU Textile (Shanghai) Co., Ltd. (China) 100.0 Production control and wholesale of textile materials, fabrics and
apparelDomestic Leilian Co., Ltd. 25.9 Retail of ladies’ apparel
DEAN & DELUCA JAPAN CO., LTD. 34.0 Operation of cafeteria chain and other new businessAyaha Corporation 33.5 Manufacture of tire cords, etc.
Overseas Thai Shikibo Co., Ltd. (Thailand) 30.0 Manufacture of cotton yarnHangzhou Asahikasei Textiles Co., Ltd. (China) 30.0 Knitting and dyeing of spandexBULGARI KOREA LTD. (Republic of Korea) 49.0 Import and sale of BVLGARI brand products
Plant, Automobile & Industrial Machinery CompanyDomestic ITOCHU Plant & Machinery Corporation 100.0 Export and import of small-to-medium-scale plant and equipment
IMECS Co., Ltd. 100.0 Ownership and operation of ship, chartering, ship machinery andadministration management of overseas shipping companies
ITOCHU Energy Solution Co., Ltd. 90.0 Sale of equipment and systems for energy conservation, and On May1, company name changes to EneSol Inc. distributed power generation servicesITOCHU Automobile Corporation 100.0 Export/import and domestic sale of parts and plantsITOCHU Construction Machinery Co., Ltd. 100.0 Wholesale of construction machineryITOCHU Sanki Corporation 100.0 Wholesale of industrial machineryITOCHU Texmac Corporation 100.0 Wholesale of textile machineryCentury Medical, Inc. 100.0 Wholesale of medical equipment and materials
Overseas MCL Group Ltd. (U.K.) 60.0 Retail of motor vehicles / Warehouse (Parts) / Retail financeITOCHU Automobile America, Inc. (U.S.A.) 100.0 Holding company for auto-related businessAuto Investment Inc. (U.S.A.) 100.0 Holding company for car dealers PROMAX Automotive, Inc. (U.S.A.) 100.0 Third-party logistics servicesMA International, Inc. (U.S.A.) 100.0 Distribution of portable construction equipmentNorth American Energy Services Inc. (U.S.A.) 100.0 Power Plant Operation & Maintenance Services Provider for
Domestic Century Leasing System, Inc. 26.3 Lease of machinery and equipmentOverseas Mazda Canada Inc. (Canada) 40.0 Wholesale of motor vehicles
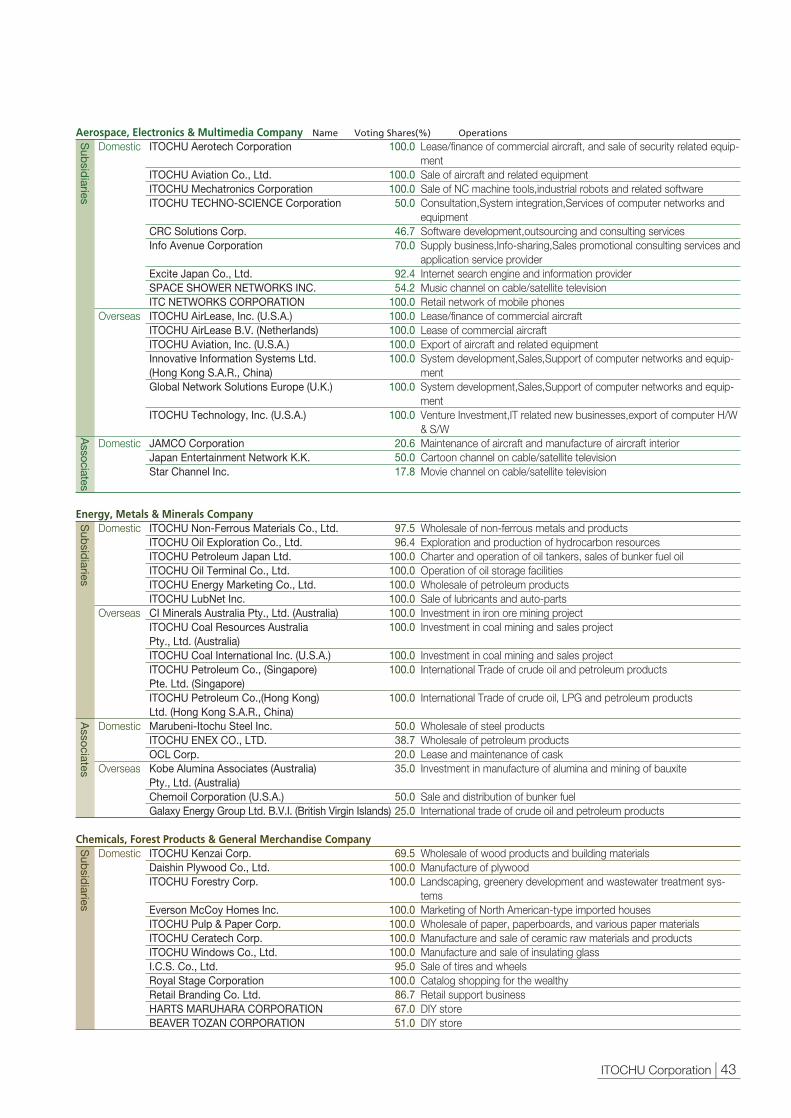
Associates
ITOCHU Corporation | 43.
Sub
sidiaries
Associates
Sub
sidiaries
Sub
sidiaries
Aerospace, Electronics & Multimedia Company Name Voting Shares(%) Operations
Domestic ITOCHU Aerotech Corporation 100.0 Lease/finance of commercial aircraft, and sale of security related equip-ment
ITOCHU Aviation Co., Ltd. 100.0 Sale of aircraft and related equipmentITOCHU Mechatronics Corporation 100.0 Sale of NC machine tools,industrial robots and related softwareITOCHU TECHNO-SCIENCE Corporation 50.0 Consultation,System integration,Services of computer networks and
equipmentCRC Solutions Corp. 46.7 Software development,outsourcing and consulting servicesInfo Avenue Corporation 70.0 Supply business,Info-sharing,Sales promotional consulting services and
application service providerExcite Japan Co., Ltd. 92.4 Internet search engine and information providerSPACE SHOWER NETWORKS INC. 54.2 Music channel on cable/satellite televisionITC NETWORKS CORPORATION 100.0 Retail network of mobile phones
Overseas ITOCHU AirLease, Inc. (U.S.A.) 100.0 Lease/finance of commercial aircraftITOCHU AirLease B.V. (Netherlands) 100.0 Lease of commercial aircraft ITOCHU Aviation, Inc. (U.S.A.) 100.0 Export of aircraft and related equipmentInnovative Information Systems Ltd. 100.0 System development,Sales,Support of computer networks and equip-(Hong Kong S.A.R., China) mentGlobal Network Solutions Europe (U.K.) 100.0 System development,Sales,Support of computer networks and equip-
mentITOCHU Technology, Inc. (U.S.A.) 100.0 Venture Investment,IT related new businesses,export of computer H/W
& S/WDomestic JAMCO Corporation 20.6 Maintenance of aircraft and manufacture of aircraft interior
Japan Entertainment Network K.K. 50.0 Cartoon channel on cable/satellite televisionStar Channel Inc. 17.8 Movie channel on cable/satellite television
Energy, Metals & Minerals CompanyDomestic ITOCHU Non-Ferrous Materials Co., Ltd. 97.5 Wholesale of non-ferrous metals and products
ITOCHU Oil Exploration Co., Ltd. 96.4 Exploration and production of hydrocarbon resourcesITOCHU Petroleum Japan Ltd. 100.0 Charter and operation of oil tankers, sales of bunker fuel oilITOCHU Oil Terminal Co., Ltd. 100.0 Operation of oil storage facilitiesITOCHU Energy Marketing Co., Ltd. 100.0 Wholesale of petroleum productsITOCHU LubNet Inc. 100.0 Sale of lubricants and auto-parts
Overseas CI Minerals Australia Pty., Ltd. (Australia) 100.0 Investment in iron ore mining projectITOCHU Coal Resources Australia 100.0 Investment in coal mining and sales projectPty., Ltd. (Australia)ITOCHU Coal International Inc. (U.S.A.) 100.0 Investment in coal mining and sales projectITOCHU Petroleum Co., (Singapore) 100.0 International Trade of crude oil and petroleum productsPte. Ltd. (Singapore)ITOCHU Petroleum Co.,(Hong Kong) 100.0 International Trade of crude oil, LPG and petroleum productsLtd. (Hong Kong S.A.R., China)
Domestic Marubeni-Itochu Steel Inc. 50.0 Wholesale of steel products ITOCHU ENEX CO., LTD. 38.7 Wholesale of petroleum productsOCL Corp. 20.0 Lease and maintenance of cask
Overseas Kobe Alumina Associates (Australia) 35.0 Investment in manufacture of alumina and mining of bauxitePty., Ltd. (Australia)Chemoil Corporation (U.S.A.) 50.0 Sale and distribution of bunker fuelGalaxy Energy Group Ltd. B.V.I. (British Virgin Islands) 25.0 International trade of crude oil and petroleum products
Chemicals, Forest Products & General Merchandise CompanyDomestic ITOCHU Kenzai Corp. 69.5 Wholesale of wood products and building materials
Daishin Plywood Co., Ltd. 100.0 Manufacture of plywoodITOCHU Forestry Corp. 100.0 Landscaping, greenery development and wastewater treatment sys-
temsEverson McCoy Homes Inc. 100.0 Marketing of North American-type imported housesITOCHU Pulp & Paper Corp. 100.0 Wholesale of paper, paperboards, and various paper materialsITOCHU Ceratech Corp. 100.0 Manufacture and sale of ceramic raw materials and productsITOCHU Windows Co., Ltd. 100.0 Manufacture and sale of insulating glassI.C.S. Co., Ltd. 95.0 Sale of tires and wheelsRoyal Stage Corporation 100.0 Catalog shopping for the wealthyRetail Branding Co. Ltd. 86.7 Retail support businessHARTS MARUHARA CORPORATION 67.0 DIY storeBEAVER TOZAN CORPORATION 51.0 DIY store
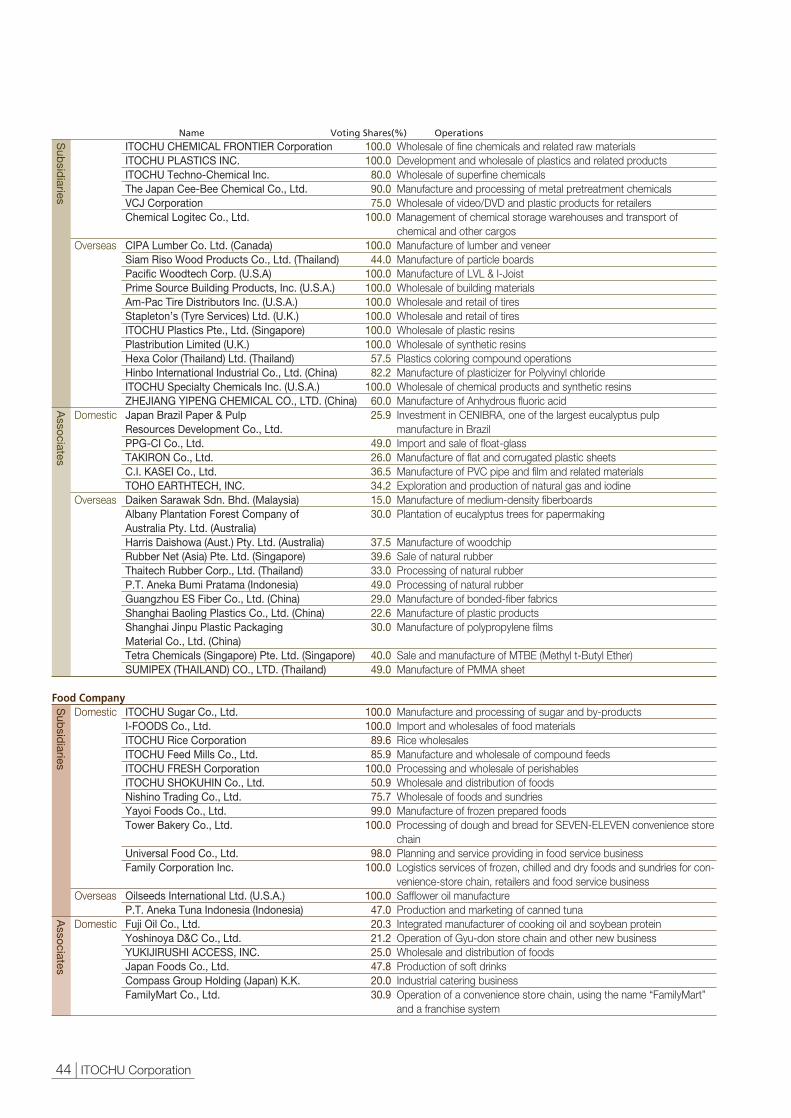
44 | ITOCHU Corporation.
Sub
sidiaries
Sub
sidiaries
Associates
Associates
Name Voting Shares(%) Operations
ITOCHU CHEMICAL FRONTIER Corporation 100.0 Wholesale of fine chemicals and related raw materialsITOCHU PLASTICS INC. 100.0 Development and wholesale of plastics and related productsITOCHU Techno-Chemical Inc. 80.0 Wholesale of superfine chemicalsThe Japan Cee-Bee Chemical Co., Ltd. 90.0 Manufacture and processing of metal pretreatment chemicalsVCJ Corporation 75.0 Wholesale of video/DVD and plastic products for retailersChemical Logitec Co., Ltd. 100.0 Management of chemical storage warehouses and transport of
chemical and other cargosOverseas CIPA Lumber Co. Ltd. (Canada) 100.0 Manufacture of lumber and veneer
Siam Riso Wood Products Co., Ltd. (Thailand) 44.0 Manufacture of particle boardsPacific Woodtech Corp. (U.S.A) 100.0 Manufacture of LVL & I-JoistPrime Source Building Products, Inc. (U.S.A.) 100.0 Wholesale of building materialsAm-Pac Tire Distributors Inc. (U.S.A.) 100.0 Wholesale and retail of tiresStapleton’s (Tyre Services) Ltd. (U.K.) 100.0 Wholesale and retail of tiresITOCHU Plastics Pte., Ltd. (Singapore) 100.0 Wholesale of plastic resinsPlastribution Limited (U.K.) 100.0 Wholesale of synthetic resinsHexa Color (Thailand) Ltd. (Thailand) 57.5 Plastics coloring compound operationsHinbo International Industrial Co., Ltd. (China) 82.2 Manufacture of plasticizer for Polyvinyl chlorideITOCHU Specialty Chemicals Inc. (U.S.A.) 100.0 Wholesale of chemical products and synthetic resinsZHEJIANG YIPENG CHEMICAL CO., LTD. (China) 60.0 Manufacture of Anhydrous fluoric acid
Domestic Japan Brazil Paper & Pulp 25.9 Investment in CENIBRA, one of the largest eucalyptus pulp Resources Development Co., Ltd. manufacture in BrazilPPG-CI Co., Ltd. 49.0 Import and sale of float-glassTAKIRON Co., Ltd. 26.0 Manufacture of flat and corrugated plastic sheetsC.I. KASEI Co., Ltd. 36.5 Manufacture of PVC pipe and film and related materialsTOHO EARTHTECH, INC. 34.2 Exploration and production of natural gas and iodine
Overseas Daiken Sarawak Sdn. Bhd. (Malaysia) 15.0 Manufacture of medium-density fiberboardsAlbany Plantation Forest Company of 30.0 Plantation of eucalyptus trees for papermakingAustralia Pty. Ltd. (Australia)Harris Daishowa (Aust.) Pty. Ltd. (Australia) 37.5 Manufacture of woodchipRubber Net (Asia) Pte. Ltd. (Singapore) 39.6 Sale of natural rubberThaitech Rubber Corp., Ltd. (Thailand) 33.0 Processing of natural rubberP.T. Aneka Bumi Pratama (Indonesia) 49.0 Processing of natural rubberGuangzhou ES Fiber Co., Ltd. (China) 29.0 Manufacture of bonded-fiber fabricsShanghai Baoling Plastics Co., Ltd. (China) 22.6 Manufacture of plastic productsShanghai Jinpu Plastic Packaging 30.0 Manufacture of polypropylene filmsMaterial Co., Ltd. (China)Tetra Chemicals (Singapore) Pte. Ltd. (Singapore) 40.0 Sale and manufacture of MTBE (Methyl t-Butyl Ether)SUMIPEX (THAILAND) CO., LTD. (Thailand) 49.0 Manufacture of PMMA sheet
Food CompanyDomestic ITOCHU Sugar Co., Ltd. 100.0 Manufacture and processing of sugar and by-products
I-FOODS Co., Ltd. 100.0 Import and wholesales of food materialsITOCHU Rice Corporation 89.6 Rice wholesalesITOCHU Feed Mills Co., Ltd. 85.9 Manufacture and wholesale of compound feedsITOCHU FRESH Corporation 100.0 Processing and wholesale of perishablesITOCHU SHOKUHIN Co., Ltd. 50.9 Wholesale and distribution of foodsNishino Trading Co., Ltd. 75.7 Wholesale of foods and sundriesYayoi Foods Co., Ltd. 99.0 Manufacture of frozen prepared foodsTower Bakery Co., Ltd. 100.0 Processing of dough and bread for SEVEN-ELEVEN convenience store
chainUniversal Food Co., Ltd. 98.0 Planning and service providing in food service businessFamily Corporation Inc. 100.0 Logistics services of frozen, chilled and dry foods and sundries for con-
venience-store chain, retailers and food service businessOverseas Oilseeds International Ltd. (U.S.A.) 100.0 Safflower oil manufacture
P.T. Aneka Tuna Indonesia (Indonesia) 47.0 Production and marketing of canned tunaDomestic Fuji Oil Co., Ltd. 20.3 Integrated manufacturer of cooking oil and soybean protein
Yoshinoya D&C Co., Ltd. 21.2 Operation of Gyu-don store chain and other new businessYUKIJIRUSHI ACCESS, INC. 25.0 Wholesale and distribution of foodsJapan Foods Co., Ltd. 47.8 Production of soft drinksCompass Group Holding (Japan) K.K. 20.0 Industrial catering businessFamilyMart Co., Ltd. 30.9 Operation of a convenience store chain, using the name “FamilyMart”
and a franchise system
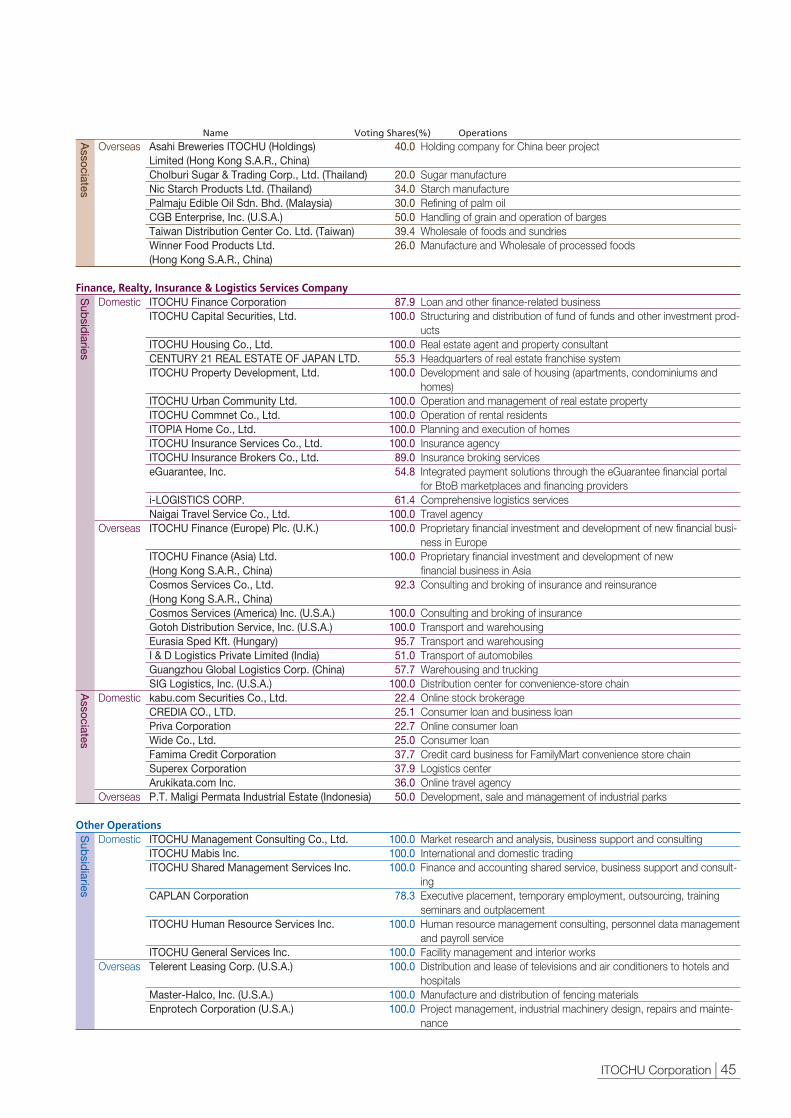
Sub
sidiaries
ITOCHU Corporation | 45.
Associates
Associates
Sub
sidiaries
Name Voting Shares(%) Operations
Overseas Asahi Breweries ITOCHU (Holdings) 40.0 Holding company for China beer projectLimited (Hong Kong S.A.R., China)Cholburi Sugar & Trading Corp., Ltd. (Thailand) 20.0 Sugar manufactureNic Starch Products Ltd. (Thailand) 34.0 Starch manufacturePalmaju Edible Oil Sdn. Bhd. (Malaysia) 30.0 Refining of palm oilCGB Enterprise, Inc. (U.S.A.) 50.0 Handling of grain and operation of bargesTaiwan Distribution Center Co. Ltd. (Taiwan) 39.4 Wholesale of foods and sundriesWinner Food Products Ltd. 26.0 Manufacture and Wholesale of processed foods(Hong Kong S.A.R., China)
Finance, Realty, Insurance & Logistics Services CompanyDomestic ITOCHU Finance Corporation 87.9 Loan and other finance-related business
ITOCHU Capital Securities, Ltd. 100.0 Structuring and distribution of fund of funds and other investment prod-ucts
ITOCHU Housing Co., Ltd. 100.0 Real estate agent and property consultantCENTURY 21 REAL ESTATE OF JAPAN LTD. 55.3 Headquarters of real estate franchise systemITOCHU Property Development, Ltd. 100.0 Development and sale of housing (apartments, condominiums and
homes) ITOCHU Urban Community Ltd. 100.0 Operation and management of real estate propertyITOCHU Commnet Co., Ltd. 100.0 Operation of rental residentsITOPIA Home Co., Ltd. 100.0 Planning and execution of homesITOCHU Insurance Services Co., Ltd. 100.0 Insurance agencyITOCHU Insurance Brokers Co., Ltd. 89.0 Insurance broking serviceseGuarantee, Inc. 54.8 Integrated payment solutions through the eGuarantee financial portal
for BtoB marketplaces and financing providersi-LOGISTICS CORP. 61.4 Comprehensive logistics servicesNaigai Travel Service Co., Ltd. 100.0 Travel agency
Overseas ITOCHU Finance (Europe) Plc. (U.K.) 100.0 Proprietary financial investment and development of new financial busi-ness in Europe
ITOCHU Finance (Asia) Ltd. 100.0 Proprietary financial investment and development of new (Hong Kong S.A.R., China) financial business in AsiaCosmos Services Co., Ltd. 92.3 Consulting and broking of insurance and reinsurance(Hong Kong S.A.R., China)Cosmos Services (America) Inc. (U.S.A.) 100.0 Consulting and broking of insuranceGotoh Distribution Service, Inc. (U.S.A.) 100.0 Transport and warehousingEurasia Sped Kft. (Hungary) 95.7 Transport and warehousingI & D Logistics Private Limited (India) 51.0 Transport of automobilesGuangzhou Global Logistics Corp. (China) 57.7 Warehousing and truckingSIG Logistics, Inc. (U.S.A.) 100.0 Distribution center for convenience-store chain
Domestic kabu.com Securities Co., Ltd. 22.4 Online stock brokerage CREDIA CO., LTD. 25.1 Consumer loan and business loanPriva Corporation 22.7 Online consumer loanWide Co., Ltd. 25.0 Consumer loanFamima Credit Corporation 37.7 Credit card business for FamilyMart convenience store chainSuperex Corporation 37.9 Logistics centerArukikata.com Inc. 36.0 Online travel agency
Overseas P.T. Maligi Permata Industrial Estate (Indonesia) 50.0 Development, sale and management of industrial parks
Other OperationsDomestic ITOCHU Management Consulting Co., Ltd. 100.0 Market research and analysis, business support and consulting
ITOCHU Mabis Inc. 100.0 International and domestic tradingITOCHU Shared Management Services Inc. 100.0 Finance and accounting shared service, business support and consult-
ingCAPLAN Corporation 78.3 Executive placement, temporary employment, outsourcing, training
seminars and outplacementITOCHU Human Resource Services Inc. 100.0 Human resource management consulting, personnel data management
and payroll serviceITOCHU General Services Inc. 100.0 Facility management and interior works
Overseas Telerent Leasing Corp. (U.S.A.) 100.0 Distribution and lease of televisions and air conditioners to hotels andhospitals
Master-Halco, Inc. (U.S.A.) 100.0 Manufacture and distribution of fencing materialsEnprotech Corporation (U.S.A.) 100.0 Project management, industrial machinery design, repairs and mainte-
nance
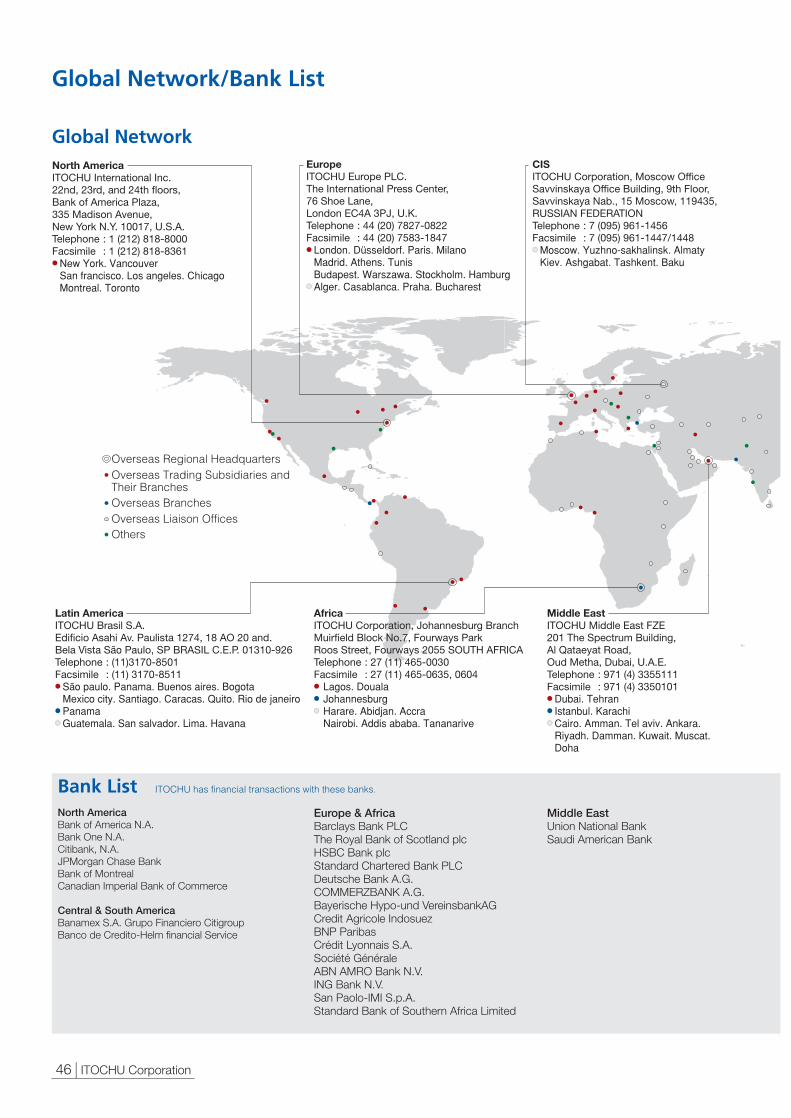
Global Network/Bank List
46 | ITOCHU Corporation.
North AmericaITOCHU International Inc.22nd, 23rd, and 24th floors, Bank of America Plaza,335 Madison Avenue, New York N.Y. 10017, U.S.A.Telephone : 1 (212) 818-8000Facsimile : 1 (212) 818-8361● New York. Vancouver San francisco. Los angeles. Chicago Montreal. Toronto
Latin AmericaITOCHU Brasil S.A.Edificio Asahi Av. Paulista 1274, 18 AO 20 and.Bela Vista São Paulo, SP BRASIL C.E.P. 01310-926Telephone : (11)3170-8501Facsimile : (11) 3170-8511● São paulo. Panama. Buenos aires. Bogota Mexico city. Santiago. Caracas. Quito. Rio de janeiro● Panama● Guatemala. San salvador. Lima. Havana
EuropeITOCHU Europe PLC.The International Press Center, 76 Shoe Lane,London EC4A 3PJ, U.K.Telephone : 44 (20) 7827-0822Facsimile : 44 (20) 7583-1847● London. Düsseldorf. Paris. Milano Madrid. Athens. Tunis Budapest. Warszawa. Stockholm. Hamburg● Alger. Casablanca. Praha. Bucharest
AfricaITOCHU Corporation, Johannesburg BranchMuirfield Block No.7, Fourways ParkRoos Street, Fourways 2055 SOUTH AFRICATelephone : 27 (11) 465-0030Facsimile : 27 (11) 465-0635, 0604● Lagos. Douala● Johannesburg● Harare. Abidjan. Accra Nairobi. Addis ababa. Tananarive
Middle EastITOCHU Middle East FZE201 The Spectrum Building, Al Qataeyat Road, Oud Metha, Dubai, U.A.E.Telephone : 971 (4) 3355111Facsimile : 971 (4) 3350101● Dubai. Tehran● Istanbul. Karachi● Cairo. Amman. Tel aviv. Ankara. Riyadh. Damman. Kuwait. Muscat. Doha ●
●
●
CISITOCHU Corporation, Moscow OfficeSavvinskaya Office Building, 9th Floor, Savvinskaya Nab., 15 Moscow, 119435, RUSSIAN FEDERATIONTelephone : 7 (095) 961-1456Facsimile : 7 (095) 961-1447/1448● Moscow. Yuzhno-sakhalinsk. Almaty Kiev. Ashgabat. Tashkent. Baku
Bank ListNorth AmericaBank of America N.A.Bank One N.A.Citibank, N.A.JPMorgan Chase BankBank of MontrealCanadian Imperial Bank of Commerce
Central & South AmericaBanamex S.A. Grupo Financiero Citigroup Banco de Credito-Helm financial Service
Global Network
Europe & AfricaBarclays Bank PLCThe Royal Bank of Scotland plc HSBC Bank plcStandard Chartered Bank PLCDeutsche Bank A.G.COMMERZBANK A.G.Bayerische Hypo-und VereinsbankAGCredit Agricole IndosuezBNP ParibasCrédit Lyonnais S.A.Société GénéraleABN AMRO Bank N.V.ING Bank N.V.San Paolo-IMI S.p.A.Standard Bank of Southern Africa Limited
Middle EastUnion National BankSaudi American Bank
Overseas BranchesOverseas Liaison OfficesOthers
Overseas Trading Subsidiaries and Their Branches
Overseas Regional Headquarters
ITOCHU has financial transactions with these banks.

ITOCHU Corporation | 47.
●
●
●
●
OceaniaITOCHU Australia Ltd.Level 29, Grosvenor Place, 225 George Street, Sydney,N.S.W. 2000, AUSTRALIATelephone : 61 (2) 9239-1500Facsimile : 61 (2) 9241-3955● Sydney. Auckland Melbourne● Port moresby
AsiaITOCHU Hong Kong Ltd.28th Floor, United Centre, 95 Queensway, HONG KONGTelephone : 852-2529-6011Facsimile : 852-2865-4631● Singapore. Taipei. Seoul. Manila Kuala lumpur. Bangkok. Jakarta● Manila. Kuala lumpur. Davao. Kota kinabalu ● Yangon. Jakarta. Surabaya. Bandung Hanoi. Ho chi minh city. Phnom penh. New delhi. Mumbai. Kolkata. Chennai. Dhaka. Colombo
ChinaITOCHU(China)Holding Co., Ltd.Unit 401, 4F West Wing Office, China World Trade Center, No.1 Jian Guo Men Wai Avenue, Beijing,THE PEOPLE’S REPUBLIC OF CHINA (Post Code: 100004)Telephone : (10)6505-1122Facsimile : (10)6505-1148/1149● Beijing. Shanghai. Dalian. Tianjin. Qingdao Hong Kong. Guangzhou. Shenzhen● Sichuan. Ulaanbaatar
●
OceaniaWestpac Banking CorporationAustralia and New Zealand Banking Group Limited
AsiaThe Hongkong and Shanghai Banking Corporation LimitedBank of ChinaIndustrial and Commercial Bank of ChinaBank of CommunicationsBangkok Bank Public Company LimitedKasikornbank Public Company LimitedBankthai Public Company LimitedMalayan Banking BerhadRHB Bank Berhad
JapanMizuho Corporate Bank, Ltd.The Sumitomo Mitsui Banking CorporationThe Bank of Tokyo-Mitsubishi, Ltd.UFJ Bank LimitedShinsei Bank, Ltd.Aozora Bank, Ltd.The Sumitomo Trust & Banking Co., Ltd.The Chuo Mitsui Trust & Banking Co., Ltd.The Mitsubishi Trust & Banking CorporationUFJ Trust Bank LimitedJapan Bank for International CooperationDevelopment Bank of JapanThe Norinchukin BankShinkin Central Bank
Japan
HeadquartersTokyo5-1, Kita-Aoyama 2-chome, Minato-ku, Tokyo, 107-8077, JAPANTelephone : 81-03-3497-2121Facsimile : 81-03-3497-4141Osaka1-3, Kyutaro-machi 4-chome, Chuo-ku, Osaka, 541-8577, JAPANTelephone : 81-06-6241-2121Facsimile : 81-06-6241-3220
Nagoya. Kyushu. Cyugoku. HokkaidouTouhoku. Niigata. Sizuoka. ToyamaKanazawa. Fukui. Koube. Sikoku. NahaOoita. Imabari. Tochio
As of July 1, 2003

48 | ITOCHU Corporation.
Chairman of The Board,President and C.E.O.
Uichiro Niwa1962 Joined ITOCHU Corporation1998 President and C.E.O.
Chairman
Minoru Murofushi 1956 Joined ITOCHU Corporation1996 Chairman
Executive Vice Presidents
Hiroshi Sumie President, Energy, Metals & MineralsCompany
1961 Joined ITOCHU Corporation1997 Executive Vice President
Makoto KatoPresident, Textile Company;Supervisory Officer for Consumer andRetail-Related
1964 Joined ITOCHU Corporation2001 Executive Vice President
Sumitaka FujitaChief Financial Officer; ChiefCompliance Officer; SupervisoryOfficer for Administrative Divisions;Finance, Accounting, Credit & HumanResources
1965 Joined ITOCHU Corporation2001 Executive Vice President
Akira Yokota President, Plant, Automobile &Industrial Machinery Company
1967 Joined ITOCHU Corporation2003 Executive Vice President
Managing Directors
Yoichi OkudaPresident, Aerospace, Electronics &Multimedia Company
1970 Joined ITOCHU Corporation2003 Managing Director
Hiroshi UedaPresident, Finance, Realty, Insurance& Logistics Services Company
1967 Joined ITOCHU Corporation2002 Managing Director
Kouhei Watanabe President, Food Company
1971 Joined ITOCHU Corporation2002 Managing Director
Eizo KobayashiCorporate Planning, AffiliateAdministration, General Affairs &Legal; Chief Information Officer
1972 Joined ITOCHU Corporation2003 Managing Director
Toshihito TambaPresident, Chemicals, Forest Products& General Merchandise Company
1972 Joined ITOCHU Corporation2003 Managing Director
Board of Directors
Corporate Officers
Note:The above biographies are lists of the year of employ-ment, except corporate auditors from outside, and theyear of the assumption of the current position.
President and C.E.O.
Uichiro Niwa
ExecutiveVice PresidentSumitaka Fujita
ExecutiveVice PresidentHiroshi Sumie
ExecutiveVice PresidentMakoto Kato
ExecutiveVice PresidentAkira Yokota
ChairmanMinoru Murofushi

ITOCHU Corporation | 49.
Corporate Auditors
Toshio Konishi1968 Joined ITOCHU Corporation2001 Standing Corporate Auditor
Masahiro Asano 1970 Joined ITOCHU Corporation2001 Standing Corporate Auditor
Tsutomu Miyakushi 1968 Joined ITOCHU Corporation2003 Standing Corporate Auditor
Katsuhiko Kondo 1996 President, Dai-Ichi Kangyo Bank,
Limited(currently Mizuho Financial Group,Inc.)
1997 Corporate Advisor2000 Corporate Auditor, ITOCHU Corporation
Haruo Sakaguchi 1989 Vice Chairman, Japan Federation of Bar
AssociationChairman, Osaka Bar Association
2001 President, Public Bid MonitoringCommittee
2003 Corporate Auditor, ITOCHU Corporation
Managing Executive Officers
Sokichi SasakiGeneral Manager for China; Chairman& General Manager for ITOCHU(China) Holding Co., Ltd.
Nobuyoshi UmenoDeputy Chief Financial Officer; GeneralManager, General Accounting ControlDivision
Takeshi TanimuraGeneral Manager of Nagoya Area
Akira KoderaExecutive Vice President, TextileCompany
Jiro TakemoriExecutive Vice President, Plant,Automobile & Industrial MachineryCompany
Hiroyuki IsakaExecutive Vice President, FoodCompany; Advisory Officer, CorporateCommunication Division
Shigeki NishiyamaGeneral Manager, Corporate Planning& Administration Division
Executive Officers
Satoshi TaniokaSenior Vice President, TextileCompany (Material Group)
Masayoshi ArayaGeneral Manager for Oceania;Managing Director & C.E.O., ITOCHUAustralia Ltd.; Managing Director &C.E.O., ITOCHU New Zealand Ltd.
Tadao NakamuraDeputy Chief Administrative Officer,Human Resources & AffiliateAdministration
Tetsuo MoriGeneral Manager, General AffairsDivision
Akihisa MatsumotoExecutive Vice President, Energy,Metals & Minerals Company; ChiefOperating Officer, Energy Division
Etsuro NakanishiChief Operating Officer, Textile Division
Masao KasamaChief Executive for EuropeanOperation; C.E.O., ITOCHU EuropePLC.
Kiyoshi SasakiGeneral Manager, Finance Division
Toru OtaGeneral Manager, Secretariat
Shigeru TsujimuraChief Operating Officer, Construction& Realty Division
Ryota HonjoChief Executive Representative forASEAN & South-West Asia; Chairman& Managing Director, ITOCHU HongKong Ltd.
Hiroshi TomitaGeneral Manager, Human ResourcesDivision
Yoshio AkamatsuChief Officer for Asian RegionStrategy; General Manager, ChinaMarket Global Development Office
Masahiro OkafujiSenior Vice President, TextileCompany (Brand Marketing Group)
Masahiro NakagawaExecutive Vice President, Aerospace,Electronics & Multimedia Company
Yosuke MinamitaniChief Operating Officer, ChemicalsDivision
Shigeharu Tanaka Senior Vice President, FoodCompany; Chief Operating Officer,Food Products Marketing &Distribution Division No.1
Tsuneharu TakedaChief Operating Officer, Kansai DistrictOperations
Saichi NakazawaAssistant, Chief Administrative Officer
Hiroshi KitamuraPresident & C.E.O., ITOCHUInternational Inc.
Nobuo KuwayamaChief Operating Officer,Textile MaterialDivision
Minoru AkimitsuGeneral Manager, IT Planning Division
Takanobu FurutaChief Operating Officer, Plant &Project Division
Hiroshi AraiGeneral Manager of CorporatePlanning & Administration Department,Energy, Metals & Minerals Company
Yoshihisa AokiSenior Vice President, FoodCompany; Chief Operating Officer,Grain & Foodstuff Division No.2
Hiroo InoueChief Operating Officer, IT &Telecommunication Division
Yoshihisa SuzukiChief Operating Officer, Aerospace &Electronic Systems Division
(As of July 1, 2003)
Board of Corporate Auditors Executive Officers
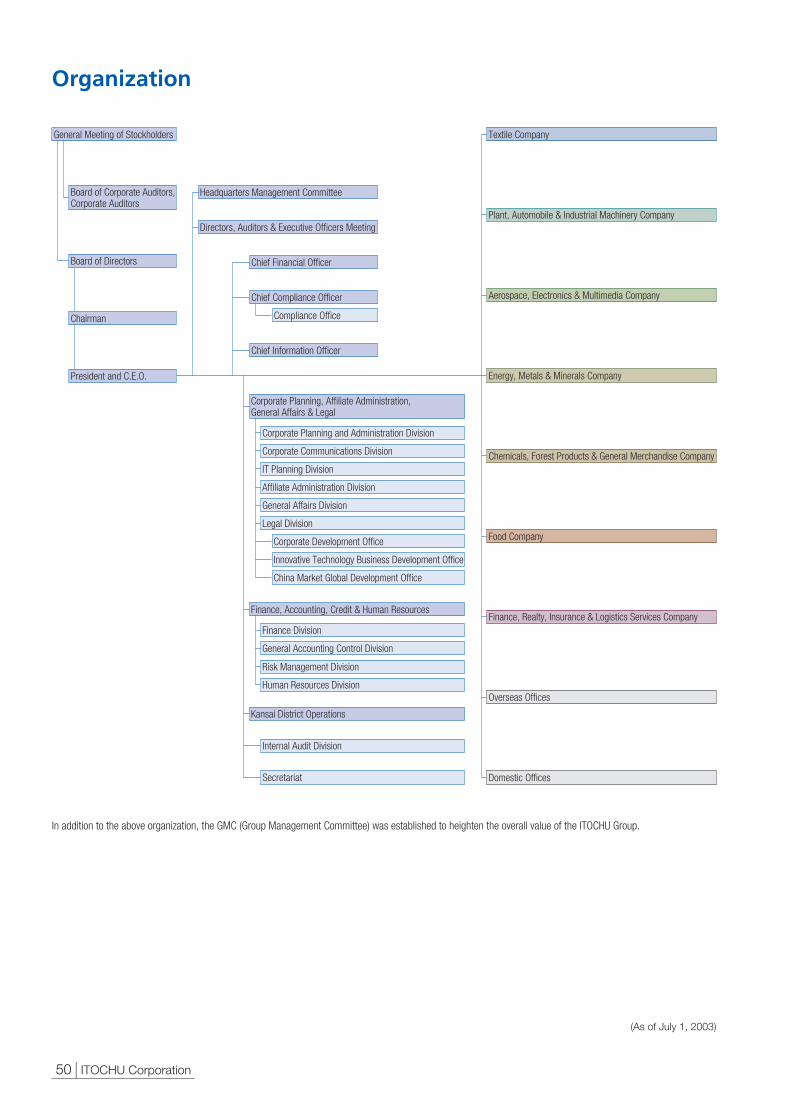
General Meeting of Stockholders
Board of Corporate Auditors, Corporate Auditors
Board of Directors
Chairman
President and C.E.O.
Directors, Auditors & Executive Officers Meeting
Headquarters Management Committee
Chief Financial Officer
Chief Information Officer
Secretariat
Textile Company
Plant, Automobile & Industrial Machinery Company
Aerospace, Electronics & Multimedia Company
Energy, Metals & Minerals Company
Chemicals, Forest Products & General Merchandise Company
Food Company
Finance, Realty, Insurance & Logistics Services Company
Overseas Offices
Domestic Offices
Chief Compliance Officer
Compliance Office
Internal Audit Division
Corporate Planning, Affiliate Administration,General Affairs & Legal
Corporate Planning and Administration Division
Corporate Communications Division
IT Planning Division
Affiliate Administration Division
General Affairs Division
Legal Division
Corporate Development Office
Innovative Technology Business Development Office
China Market Global Development Office
Finance Division
General Accounting Control Division
Risk Management Division
Human Resources Division
Finance, Accounting, Credit & Human Resources
Kansai District Operations
Organization
50 | ITOCHU Corporation.
In addition to the above organization, the GMC (Group Management Committee) was established to heighten the overall value of the ITOCHU Group.
(As of July 1, 2003)

Att
Financial Section
ContentsSix-Year Summary ....................................................................... 052Management’s Discussion and Analysis of Financial Condition
and Results of Operations ........................................................ 053Consolidated Balance Sheets ...................................................... 072Consolidated Statements of Income ........................................... 074Consolidated Statements of Stockholders’ Equity ...................... 075Consolidated Statements of Cash Flows ..................................... 076Notes to Consolidated Financial Statements .............................. 077Independent Auditors’ Report ...................................................... 101

P/L (For the year):Total trading transactions ..............................Gross trading profit ........................................Gross trading profit ratio (%) ..........................Net income (loss) ...........................................Per ten shares (Yen, U.S. dollars):
Net income (loss) ........................................Cash dividends ...........................................
B/S (At year-end):Total assets ...................................................Short-term interest-bearing debts ..................Long-term interest-bearing debts ..................Interest-bearing debts ...................................Net Interest-bearing debts .............................Long-term debt, excluding
current installments ....................................Stockholders’ equity ......................................
Cash flows:Cash flows from operating activities ...............Cash flows from investing activities ................Cash flows from financing activities ...............Cash and cash equivalents at year-end .........
Ratio:ROA (%) ........................................................ROE (%) ........................................................Ratio of stockholders’ equity to total assets (%) Net debt-to-equity ratio (times) ......................Interest coverage (times) ................................
Common stock information:Stock price (Yen, U.S. dollars):
Opening price .............................................High ...........................................................Low ............................................................Closing price ..............................................
Market capitalization (Yen in billions and U.S. dollars in billions) ...
Trading volume (yearly, million shares) ...........
Exchange rates into U.S. currency:(Federal Reserve Bank of New York)At year-end ...................................................Average for the year ......................................Range:
Low ............................................................High ...........................................................
Number of Employees (At year-end, Non-consolidated) .....................
$87,035.14,709.1
167.0
$ 1.090.42
$37,324.58,244.1
13,173.721,417.816,847.3
13,626.63,545.9
$ 1,404.743.7
(948.8)4,443.9
$ 3.544.211.652.40
3.79
Six-Year SummaryITOCHU Corporation and SubsidiariesYears ended March 31
52 | ITOCHU Corporation.
Millions of Yen
20032001 2000 1999 19982003
15,544,508596,678
3.84(91,931)
(645)60
7,531,1252,564,9582,684,1285,249,0864,877,879
2,738,901412,520
22,029(181,231)214,430155,579
——
5.511.80.9
600655182320
456595
133.20123.56
133.99111.42
6,675
12,144,445612,348
5.04(88,271)
(619)—
6,067,1251,553,2512,520,1274,073,3783,382,326
2,574,964281,325
224,816197,658(320,418)264,187
——
4.612.00.9
251625250547
7801,832
102.73110.02
124.45101.53
5,306
12,135,261611,600
5.0470,507
49550
5,157,5191,263,7141,806,7943,070,5082,536,840
1,868,185316,940
160,335564,707(717,602)274,936
1.323.66.18.01.5
547566395445
634887
125.54111.65
125.54104.19
5,012
2002
11,400,471578,867
5.0830,191
21250
4,752,319991,410
1,803,3212,794,7312,296,398
1,863,629397,668
216,503214,008(232,047)479,734
0.68.48.45.82.1
444520269430
613847
132.70125.64
134.77115.89
4,580
¥10,461,620566,037
5.4120,078
¥ 13150
¥ 4,486,405990,939
1,583,4812,574,4202,025,048
1,637,916426,220
¥ 168,8435,253
(114,041)534,156
0.44.99.54.82.7
¥ 425506198288
4551,221
¥ 118.07121.10
133.40115.71
4,355
13,900,567641,713
4.62(34,088)
(239)—
6,733,0261,851,8892,811,1624,663,0514,185,200
2,861,338305,514
128,320306,405(418,241)168,123
——
4.513.71.0
300368168246
351663
118.43128.10
147.14108.83
5,775
Millions ofU.S. dollars
The Japanese yen amounts for the year ended March 31, 2003, have been translated into United States dollar amounts, solely for the convenience of the reader, at the rate of¥120.20=U.S.$1, the official rate of The Bank of Tokyo-Mitsubishi, Ltd., as of March 31, 2003.
Years ended March 31

Management’s Discussion and Analysis of Financial Conditionand Results of Operations
ITOCHU Corporation | 53.
All the financial information provided herein is based on theconsolidated financial statements included in this annual report.These consolidated financial statements were made according toUnited States generally accepted accounting principles (U.S.GAAP).
Overview
Figures in yen for fiscal 2003 have been converted into U.S.dollars, solely for the convenience of the reader, using anexchange rate of ¥120.20 = U.S.$1 which was the exchange rateas of March 31, 2003, as announced by The Bank of Tokyo-Mitsubishi, Ltd.
To improve and reform its profit structure and financial strength,ITOCHU has intensively allocated management resources to A&P(Attractive & Powerful) segments to increase profits in theseparticular areas, while it has also reduced total assets andinterest-bearing debts by closing unprofitable businesses andoperations. Furthermore ITOCHU has tried to maximize groupvalue using its A&P strategy by improving the profitability of groupcompanies. As a result, ITOCHU’s profitability has increasedsteadily, and its financial strength has been significantly improved.
These improvements, and the outlook for fiscal 2004, arediscussed further in the following sections. These forecasts are forward-looking statements based on anumber of assumptions and beliefs made by management in lightof information currently available and thus involve certain risksand uncertainties. Actual results may differ materially dependingon a number of factors, including changing economic conditionsin major markets and fluctuations in currency exchange rate.
During fiscal 2003, ended March 31, 2003, the Japaneseeconomy showed the sign of a slight recovery in domesticproduction that was mainly due to an increase in exports and on-going adjustments to inventories. On the other hand, falling wagelevels meant that private consumption remained depressed, and,although declines in capital investment seemed to have bottomedout, the domestic economy continued to suffer from worseningdeflation. Furthermore, a sharp decline in stock prices during theyear greatly weakened the financial condition of many Japanesecompanies. Overseas, U.S. economic growth remained weak onthe whole, as the effects of large-scale tax cuts and easy-moneypolicy lessened. Economies in Europe remained sluggish whilethose in Asia continued to grow steadily.
During fiscal 2002 and 2003, ITOCHU’s mid-term managementplan “A&P-2002” aimed to discard conventional business modelsand to develop new businesses focused on an A&P (Attractiveand Powerful) strategy. During fiscal 2003, the final year of A&P-2002, ITOCHU accelerated the reorganization of its profitstructure and restructuring of its management system.
Reorganization of the Profit Structure ITOCHU intensively allocated assets and management resourcesto the A&P segments: information and multimedia; consumer andretail; natural resources development; financial services; NorthAmerica and Asia. At the same time, ITOCHU has also paved away to secure future growth by investing in new and innovativefields such as biotechnology and nanotechnology.
Specifically, in information and multimedia sector, ITOCHUsecured a strategic alliance with Hitachi in IT-related field.ITOCHU also strengthened the product lines and service menusof ITC Network, which handles sales of and provides services forcellular phones. In the consumer and retail sectors, ITOCHUbecame the largest shareholder of Yukijirushi Access, Inc., aimingto reinforce the multi-temperature distribution network. ITOCHUalso signed contracts with prestigious European and Americanfashion brands such as BALLY, gaining exclusive import andsales rights for their products. In the natural resourcesdevelopment sector, ITOCHU has decided to develop a coalminein Australia and also to participate in the construction of a pipelinethat will transport oil from the Caspian Sea to the Mediterranean. ITOCHU strengthened its capital base through a public offering inJuly 2002, which allowed the Company to increase shareholders’equity, while reducing total assets and interest-bearing debts. Asa result, our net DER (Debt-to-Equity Ratio) improved by 1.0 pointto 4.8 times from the end of the year before.
Restructuring of the Management SystemITOCHU thoroughly implemented a risk management program fordomestic and overseas group companies, enhanced trainingprograms for employees, including national staff, and positionedhuman resources based on a policy of “right person in the rightplace.” ITOCHU also reinforced the compliance system for groupcompanies, placing them under the direction of the ChiefCompliance Officer.
Transition of Profitability and Improvement of Financial Strength

Provision for Doubtful Accounts
Billions of Yen
‘00 ‘01 ‘03 ‘02 ‘04 Plan
100
0
50
* For fiscal years
92
17 17 15
50
54 | ITOCHU Corporation.
Gross Trading ProfitGross trading profit in fiscal 2003 fell ¥12.8 billion, or 2.2%, yearon year to ¥566.0 billion (US$4,709 million). However, this wasprincipally due to an approximately ¥21.0 billion decline in grosstrading profit following the transfer of the steel operations toMarubeni-Itochu Steel Inc., an affiliate accounted for by the equitymethod. If this sum had not been subtracted from gross tradingprofit, then gross trading profit would actually have risen by ¥8.2billion. Despite harsh business environments in Japan andoverseas, underlying gross trading profit remains solid because ofpositive results in the fashion brand business, tire retail and thehousing materials business in the U.S. and Europe, and the retailproduct business. The positive results in these areas allowedITOCHU to offset the negative effects of domestic IT subsidiariesdue to IT recession. In fiscal 2004, ITOCHU expects gross tradingprofit to rise ¥34.0 billion to around ¥600.0 billion from the yearbefore because of growth in the textile business in the consumerand retail sectors, increased automobile trading volume, and arise in the trading volume of food materials.
Trading Profit after Selling, General and AdministrativeExpenses *Gross Trading Profit + Selling, General and AdministrativeExpenses
Trading profit after selling, general and administrative expenses infiscal 2003 rose ¥4.2 billion, or 3.7%, from the year before to¥117.6 billion (US$978 million). Trading profit after selling, generaland administrative expenses would have actually increased byabout ¥11.2 billion if the ¥7.0 billion negative impact of thetransfer of the steel operations to a new equity-method affiliatehad been ignored. This performance was due mainly to stablegross trading profit as well as cost cutting efforts, particularly atdomestic IT subsidiaries. Amid a harsh business environment,ITOCHU’s earning power remains relatively high compared to thatof its competitors. In fiscal 2004, ITOCHU expects trading profitafter selling, general and administrative expenses of around¥125.0 billion, a ¥7.4 billion increase from the previous year. Thisrise will be due to an increase in gross trading profit which willoffset the effects of a temporary expense that will occur followingthe transfer to the Japanese Government of the substitutionalportion of its Employee Pension Fund Plan.
Provision for Doubtful AccountsProvision for doubtful accounts in fiscal 2003 was ¥16.8 billion(US$140 million), the same level as the previous year. ITOCHU’songoing efforts to improve its financial strength, including asignificant reduction in unprofitable businesses and thereinforcement of risk management, have resulted in a decrease inprovision for doubtful accounts from fiscal 2000, when it was¥92.1 billion, and from fiscal 2001, when it was ¥49.8 billion.ITOCHU will continue to strengthen its risk management to lowerprovision for doubtful accounts even further. In fiscal 2004,ITOCHU forecasts provision for doubtful accounts of around¥15.0 billion.
Gross Trading Profit
Gross Trading ProfitBillions of Yen
‘99 ‘00 ‘01 ‘03 ‘02 ‘04 Plan
700%6
5
4
3
00
500
600
400
Gross Trading Profit Ratio
* For fiscal years
5.045.04
5.08
5.41
6.00
642
612
4.62
612600
566579
Trading Profit after Selling, General and Administrative Expenses
Gross Trading ProfitBillions of Yen
‘99 ‘00 ‘01 ‘03 ‘02 ‘04 Plan
Selling, General and Administrative Expenses
* For fiscal years
Trading Profit after Selling, General and Administrative Expenses
750
0
250
500
642
544
98 125118113159136
612 612 600
475
566
448
579
476 453 466

ITOCHU Corporation | 55.
Net Financial Expenses
Billions of Yen
‘99 ‘00 ‘01 ‘03 ‘02 ‘04 Plan
100
0
50
* For fiscal years
69
5863
56
22 21
64
3531 33
26
72
Net Interest Expenses Net Financial Expenses
Net Income from Subsidiaries and Associated Companies
Profitable Companies Billions of Yen
‘99 ‘00 ‘01 ‘03 ‘02 ‘04 Plan
100
-100
0
50
-50
Unprofitable Companies
Net Income from Subsidiaries and Associated Companies
* For fiscal years
41
70 6553
62 625047
3223
6
-57
-16
-64
-42
-21-15 -12
Net Interest-Bearing Debts, Stockholders’ Equity and Net DER (Debt-to-Equity Ratio)
Net Interest-Bearing DebtsBillions of Yen
‘98 ‘00 ‘01 ‘03 ‘02 ‘04 Plan
5,000Times
25
20
15
10
5
00
3,000
4,000
1,000
2,000
Stockholders’ Equity
Net DER
* For fiscal years
‘99
3,382
2,2962,537
2,025 2,000
470426317281306413
11.8
13.7
12.0
8.0
5.8
398
4.84.3
4,878
4,185
Net Financial ExpensesNet interest expenses in fiscal 2003 improved ¥4.3 billion year onyear to ¥30.7 billion (US$255 million). This was due to a decreaseof about ¥250.0 billion in the average outstanding balance ofinterest-bearing debts from the year before, in addition to thelowered average interest rate of the Group by about 0.6% fromthe previous year. Despite a decrease in dividends received froman LNG-related investment, overall net financial expensesimproved year on year by ¥1.4 billion to ¥20.6 billion (US$171million). In fiscal 2004, ITOCHU forecasts net financial expensesto rise to around ¥26.0 billion because higher interest rates and adecrease in dividends received are expected.
Net Income from Subsidiaries and Associated CompaniesITOCHU recognizes that it is important to increase the proportionof profits from group companies in consolidated net income inorder to improve the profit structure of the Group. As a result ofITOCHU’s efforts to maximize group value based on its A&Pstrategy and to reinforce the management of group companies,net income from subsidiaries and associated companiesimproved substantially to a profit of ¥47.4 billion (excludingoverseas trading subsidiaries) in fiscal 2003. This figure is a net ofa ¥62.1 billion profit from profitable companies and a loss of¥14.7 billion from unprofitable companies. By contrast, in fiscal1999, net income from subsidiaries and associated companieswas a loss of ¥15.8 billion (excluding overseas tradingsubsidiaries), a net of a ¥40.8 billion profit from profitablecompanies and a loss of ¥56.6 billion from unprofitablecompanies. This improvement can be attributed to the steadygrowth of profitable businesses and ITOCHU’s aggressivewithdrawal from unprofitable businesses. Consequently, the ratioof profitable companies to total group companies was 80.2%, thefirst time that it has exceeded 80%. In fiscal 2004, ITOCHUforecasts net income from subsidiaries and associatedcompanies of around ¥50.0 billion (excluding overseas tradingsubsidiaries). This will be a net of a ¥62.0 billion profit fromprofitable companies and a ¥12.0 billion loss from unprofitablecompanies.
Net Interest-Bearing Debts, Stockholders’ Equity and NetDER (Debt-to-Equity Ratio)As a result of ITOCHU’s efforts to reduce unprofitable assets andinterest-bearing debts with its A&P strategy, its financial positionsignificantly improved. Interest-bearing debts, a net of cash, cashequivalents and time deposits, stood at ¥2,025.0 billion(US$16,847 million) at the end of fiscal 2003, a significantimprovement from the end of fiscal 1998 when they were¥4,878.0 billion. Stockholders’ equity has also steadily recovered,mainly due to the continued accumulation of retained earningssince the management restructuring in fiscal 2000 and to a publicoffering of common stock in July 2002 to increase stockholders’equity. This resulted in an improvement of net DER (Debt-to-Equity Ratio) by 1.0 point year on year to 4.8 times as of the endof fiscal 2003. In fiscal 2004, interest-bearing debts will remainroughly the same in spite of a rise because of the plan for fundsfor strategic investments in selected growth areas such as theconsumer and retail related sector, while ITOCHU will accelerateits exit from unprofitable businesses and assets. At the end offiscal 2004, ITOCHU expects about ¥2 trillion of net interest-bearing debts and net DER of 4.3 times.
56 | ITOCHU Corporation.
Business Results for Fiscal 2003 - A Comparison between fiscal 2003 and fiscal 2002
Total trading transactions in fiscal 2003 were ¥10,461.6 billion(US$87,035 million), down ¥938.9 billion, or 8.2%, from the yearbefore. Domestic transactions decreased in Aerospace,Electronics & Multimedia due to the slump in the IT sector. Adecline in market prices and a cut back in inefficient transactionsalso resulted in a fall in domestic transactions in Plant,Automobile & Industrial Machinery, Energy, Metals & Minerals,and Construction & Realty. Import transactions increased in theenergy sector due to a rise in crude oil prices. Export transactionsfell compared to the year before when exports of large plantbusiness contributed significantly. Offshore transactionsincreased in Plant, Automobile & Industrial Machinery and Food.On the other hand, the transfer of the steel operations to a newequity-method affiliate, Marubeni-Itochu Steel Inc., on October 1,2001 reduced total trading transactions by about ¥380.0 billion.
Gross trading profit in fiscal 2003 decreased ¥12.8 billion, or2.2%, year on year to ¥566.0 billion (US$4,709 million). Grosstrading profit increased in Textiles due to contributions by newlyconsolidated companies, as well as in Chemicals, ForestProducts & General Merchandise sector, thanks to robust salesof living and housing materials in the U.S. and Europe, and in theFood sector owing to increased transaction volume of retailproduct. However, overall gross trading profit fell due to thetransfer of the steel operations, which had a negative impact ongross trading profit of about ¥21.0 billion, and a fall in profits atdomestic IT subsidiaries.
Selling, general and administrative expenses in fiscal 2003decreased by ¥17.0 billion or 3.7% from the year before to¥448.5 billion (US$3,731 million), mainly due to the transfer of thesteel operations to a new equity-method affiliate, which reducedthese expenses by ¥14.0 billion as well as ITOCHU’s cost cuttingefforts, particularly in its domestic IT subsidiaries. As the decreasein selling, general and administrative expenses exceeded the fallin gross trading profit, trading profit after selling, general andadministrative expenses in fiscal 2003 rose ¥4.2 billion, or 3.7%,from the year before to ¥117.6 billion (US$978 million).
Interest expenses in fiscal 2003 fell ¥4.3 billion year on year to
¥30.7 billion (US$255 million), mainly due to ITOCHU’s ongoingefforts to reduce interest-bearing debts and a decline in interestrates in the U.S. Although dividends received decreased ¥2.9billion year on year to ¥10.1 billion (US$84 million) primarilybecause of a decreased dividend contribution from an LNG-related investment, overall net financial expenses improved yearon year by ¥1.4 billion to ¥20.6 billion (US$171 million).
Despite a ¥26.0 billion gain on disposal of marketablesecurities, ITOCHU posted a ¥13.2 billion (US$110 million) losson disposal of investments and marketable securities, net ofwrite-downs, resulting from devaluation and disposal losses of¥44.7 billion for stocks, especially bank stocks, and a ¥5.8 billionloss for liquidating affiliated companies. Compared to theprevious year, the figure deteriorated by ¥26.7 billion due to adecline in gains on disposals of investments and marketablesecurities. Loss on property and equipment-net came to ¥0.8billion (US$6 million), as a result of ¥1.5 billion impairment lossesfor long-lived assets. Other-net was a loss of ¥8.5 billion (US$71million) in fiscal 2003, ¥6.3 billion worse than in fiscal 2002. Thiswas mainly because ITOCHU posted exchange losses for foreigncurrency at the end of fiscal 2003 owing to a stronger yen, whileit posted exchange gains for foreign currency at the end of fiscal2002.
As a result, income before income taxes, minority interestsand equity in earnings (losses) stood at ¥57.7 billion (US$480million), down by ¥20.5 billion, or 26.2%, from the year before.On the other hand, equity in earnings (losses) of associatedcompanies increased by ¥7.2 billion, or 63.2%, to ¥18.5 billion(US$154 million) from the year before, largely owing to a ¥2.3billion increase in profits at Marubeni-Itochu Steel Inc. and togood performances at equity-method companies in the Foodsector. However, the increase in equity in earnings (losses) ofassociated companies was not enough to offset a ¥17.9 billion,or 59.8%, decrease in income before minority interests andequity in earnings (losses), and, as a result, net income fell¥10.1 billion, or 33.5%, to ¥20.1 billion (US$167 million) from theyear before.
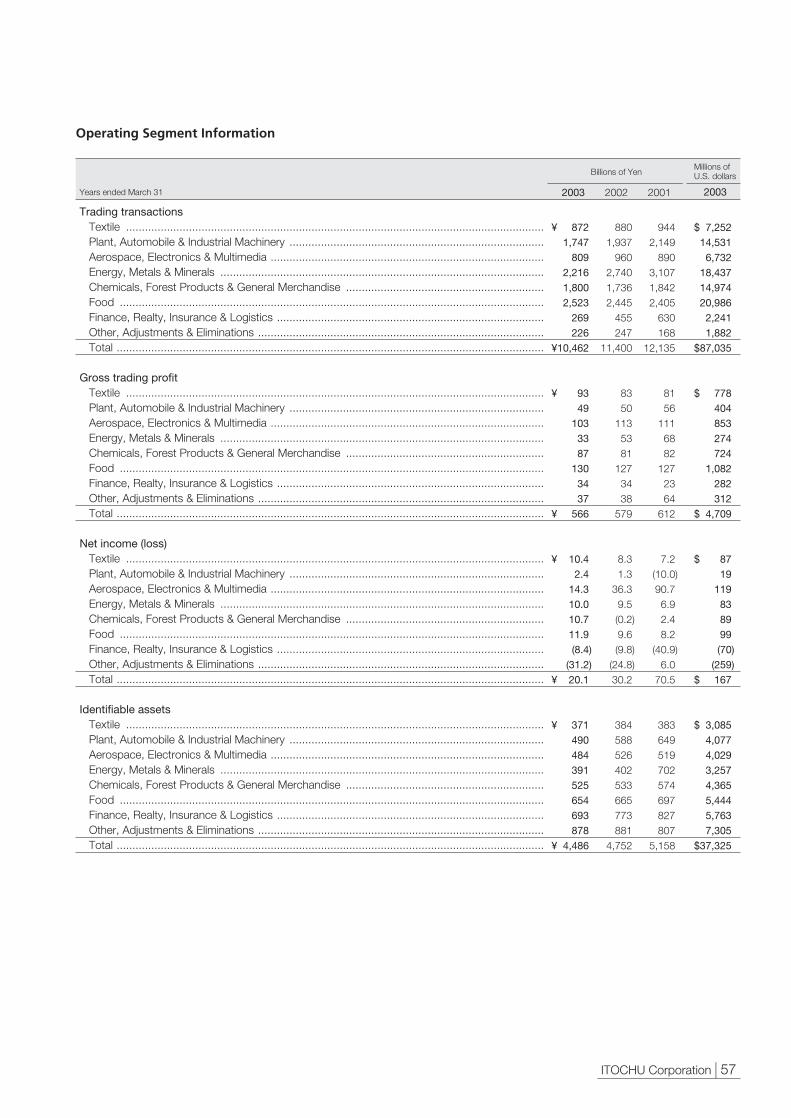
ITOCHU Corporation | 57.
Operating Segment Information
Trading transactionsTextile .....................................................................................................................................Plant, Automobile & Industrial Machinery .................................................................................Aerospace, Electronics & Multimedia .......................................................................................Energy, Metals & Minerals .......................................................................................................Chemicals, Forest Products & General Merchandise ...............................................................Food .......................................................................................................................................Finance, Realty, Insurance & Logistics .....................................................................................Other, Adjustments & Eliminations ...........................................................................................Total ........................................................................................................................................
Gross trading profitTextile .....................................................................................................................................Plant, Automobile & Industrial Machinery .................................................................................Aerospace, Electronics & Multimedia .......................................................................................Energy, Metals & Minerals .......................................................................................................Chemicals, Forest Products & General Merchandise ...............................................................Food .......................................................................................................................................Finance, Realty, Insurance & Logistics .....................................................................................Other, Adjustments & Eliminations ...........................................................................................Total ........................................................................................................................................
Net income (loss)Textile .....................................................................................................................................Plant, Automobile & Industrial Machinery .................................................................................Aerospace, Electronics & Multimedia .......................................................................................Energy, Metals & Minerals .......................................................................................................Chemicals, Forest Products & General Merchandise ...............................................................Food .......................................................................................................................................Finance, Realty, Insurance & Logistics .....................................................................................Other, Adjustments & Eliminations ...........................................................................................Total ........................................................................................................................................
Identifiable assetsTextile .....................................................................................................................................Plant, Automobile & Industrial Machinery .................................................................................Aerospace, Electronics & Multimedia .......................................................................................Energy, Metals & Minerals .......................................................................................................Chemicals, Forest Products & General Merchandise ...............................................................Food .......................................................................................................................................Finance, Realty, Insurance & Logistics .....................................................................................Other, Adjustments & Eliminations ...........................................................................................Total ........................................................................................................................................
9442,149
8903,1071,8422,405
630168
12,135
8156
1116882
1272364
612
7.2(10.0)90.76.92.48.2
(40.9)6.0
70.5
383649519702574697827807
5,158
$ 7,25214,5316,732
18,43714,97420,9862,2411,882
$87,035
$ 778404853274724
1,082282312
$ 4,709
$ 8719
119838999(70)
(259)$ 167
$ 3,0854,0774,0293,2574,3655,4445,7637,305
$37,325
8801,937
9602,7401,7362,445
455247
11,400
8350
1135381
1273438
579
8.31.3
36.39.5(0.2)9.6(9.8)
(24.8)30.2
384588526402533665773881
4,752
¥ 8721,747
8092,2161,8002,523
269226
¥10,462
¥ 9349
1033387
1303437
¥ 566
¥ 10.42.4
14.310.010.711.9(8.4)
(31.2)¥ 20.1
¥ 371490484391525654693878
¥ 4,486
Billions of YenMillions ofU.S. dollars
2003 2001 20032002Years ended March 31

3,000
0
1,000
2,000
880
1,937
2,740
1,736
2,445
455
247226269
2,523
1,800
2,216
809
1,747
872960
Total Trading Transactions by Operating Segment
Textile Food
Aerospace, Electronics & Multimedia
Plant, Automobile & Industrial Machinery
Energy, Metals & Minerals
Chemicals, Forest Products & General Merchandise
Finance, Realty, Insurance & Logistics
Other, Adjustments & Eliminations
Billions of Yen 2003 2002
150
0
50
100
83
50
113
53
81
127
3438
93
49
103
33
87
130
34 37
Gross Trading Profit by Operating Segment
Textile Food
Aerospace, Electronics & Multimedia
Plant, Automobile & Industrial Machinery
Energy, Metals & Minerals
Chemicals, Forest Products & General Merchandise
Finance, Realty, Insurance & Logistics
Other, Adjustments & Eliminations
Billions of Yen 2003 2002
58 | ITOCHU Corporation.
Textile: Trading transactions decreased by ¥8.4 billion, or 1.0%, to¥871.7 billion (US$7,252 million) due to the streamlining ofinefficient transactions and to stagnant consumer pricing resultingfrom consumers’ prevailing preference for low prices. Grosstrading profit increased by ¥9.9 billion, or 11.9%, to ¥93.5 billion(US$778 million) due to an increase in contributions from newlyconsolidated subsidiaries, in particular from those handlingfashion brands. Net income increased by ¥2.1 billion, or 25.5%,to ¥10.4 billion (US$87 million) due to increased profits primarilyin transactions relating to brand retail and to an increase in equityin earnings. Identifiable assets fell by ¥13.3 billion, or 3.5%, to¥370.8 billion (US$3,085 million) mainly because of a decrease intrade receivables.
Plant, Automobile & Industrial Machinery: Trading transactions fell ¥190.7 billion, or 9.8%, to ¥1,746.6billion (US$14,531 million) due to the streamlining of inefficienttransactions and a decrease in vessel transactions. Gross tradingprofit fell ¥1.6 billion, or 3.3%, to ¥48.6 billion (US$404 million)mainly due to stagnant sales in construction equipment in NorthAmerica, despite increased exports of automobiles to China andthe Middle East. Net income rose ¥1.1 billion, or 82.0%, to ¥2.4billion (US$19 million) due to decreases in provision for doubtfulaccounts and devaluation losses for listed stocks, despite thedecreased gross trading profit. Identifiable assets fell ¥98.0billion, or 16.7%, to ¥490.1 billion (US$4,077 million) mainly dueto debt collection and disposal, a reduction in the assets of groupcompanies, and a devaluation of assets caused by anappreciation in the value of the yen.
Aerospace, Electronics & Multimedia: Trading transactions decreased by ¥151.1 billion, or 15.7%, to¥809.2 billion (US$6,732 million) because of the decline in the ITsector. Gross trading profit decreased by ¥10.0 billion, or 8.9%,to ¥102.5 billion (US$853 million) due to a decline in tradingtransactions. Net income fell ¥22.1 billion, or 60.7%, to ¥14.3billion (US$119 million) as a result of a lower gain on disposal ofmarketable securities in addition to the fall in gross trading profit.Identifiable assets fell ¥41.9 billion, or 8.0%, to ¥484.3 billion(US$4,029 million) mainly due to the decrease in tradereceivables following the decline in trading transactions and areduction in marketable securities following a disposal.
Energy, Metals & Minerals: Trading transactions fell ¥523.8 billion, or 19.1%, to ¥2,216.2billion (US$18,437 million). This was due to a decrease indomestic energy sales in addition to a decrease of about ¥380.0billion following a transfer of the steel operations to Marubeni-Itochu Steel Inc. Gross trading profit fell ¥19.7 billion, or 37.4%,to ¥33.0 billion (US$274 million), with the transfer of steeloperations reducing gross trading profit by about ¥21.0 billion,despite an increase in offshore transactions of energy following arise in oil prices. Net income, however, remained roughly thesame as that of the year before, increasing slightly by ¥0.5 billion,or 5.1%, to ¥10.0 billion (US$83 million) due to an increase inequity in earnings of Marubeni-Itochu Steel Inc. and to the solidperformance of group companies in the energy field. Identifiableassets fell ¥10.1 billion, or 2.5%, to ¥391.6 billion (US$3,257million) mainly due to their devaluation following an appreciation in
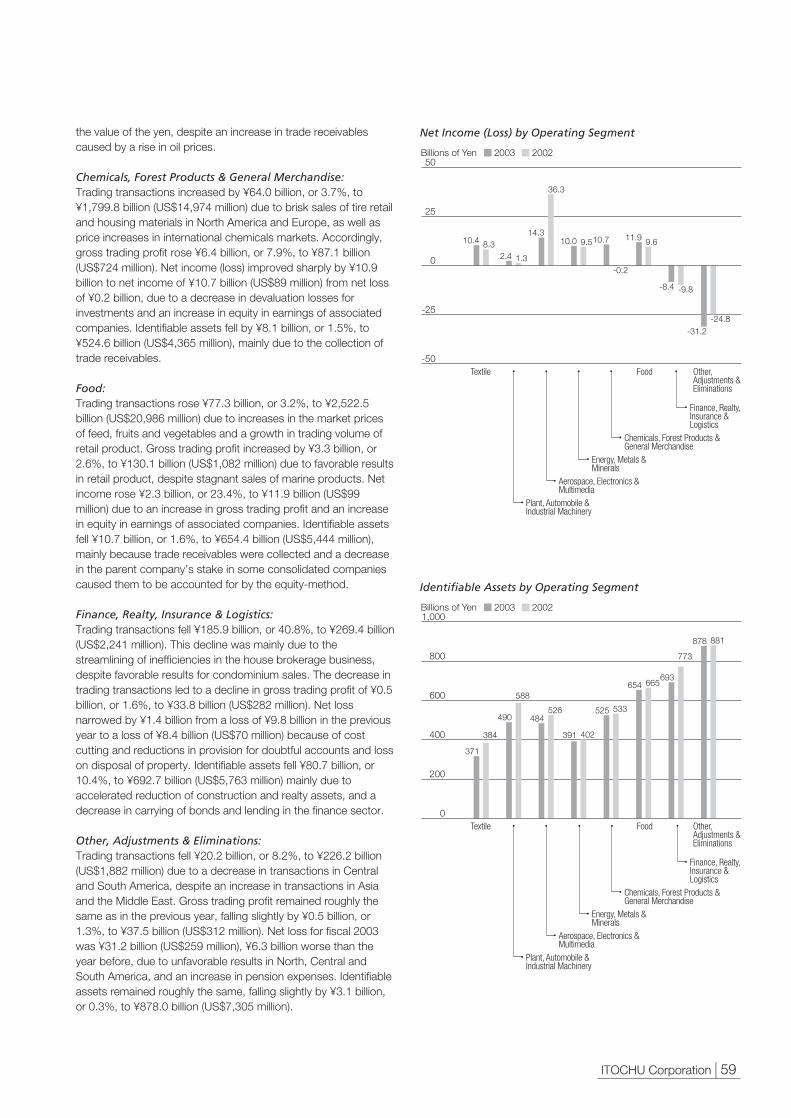
50
25
-50
-25
0
10.4
2.4
14.310.0 10.7 11.9
-8.4
-31.2
8.3
1.3
36.3
9.5 9.6
-9.8
-24.8
-0.2
Net Income (Loss) by Operating Segment
Textile Food
Aerospace, Electronics & Multimedia
Plant, Automobile & Industrial Machinery
Energy, Metals & Minerals
Chemicals, Forest Products & General Merchandise
Finance, Realty, Insurance & Logistics
Other, Adjustments & Eliminations
Billions of Yen 2003 2002
Identifiable Assets by Operating Segment
1,000
800
0
400
200
600
384
588
526
402
533
665
773
881878
693654
525
391
484490
371
Textile Food
Aerospace, Electronics & Multimedia
Plant, Automobile & Industrial Machinery
Energy, Metals & Minerals
Chemicals, Forest Products & General Merchandise
Finance, Realty, Insurance & Logistics
Other, Adjustments & Eliminations
Billions of Yen 2003 2002
ITOCHU Corporation | 59.
the value of the yen, despite an increase in trade receivablescaused by a rise in oil prices.
Chemicals, Forest Products & General Merchandise: Trading transactions increased by ¥64.0 billion, or 3.7%, to¥1,799.8 billion (US$14,974 million) due to brisk sales of tire retailand housing materials in North America and Europe, as well asprice increases in international chemicals markets. Accordingly,gross trading profit rose ¥6.4 billion, or 7.9%, to ¥87.1 billion(US$724 million). Net income (loss) improved sharply by ¥10.9billion to net income of ¥10.7 billion (US$89 million) from net lossof ¥0.2 billion, due to a decrease in devaluation losses forinvestments and an increase in equity in earnings of associatedcompanies. Identifiable assets fell by ¥8.1 billion, or 1.5%, to¥524.6 billion (US$4,365 million), mainly due to the collection oftrade receivables.
Food: Trading transactions rose ¥77.3 billion, or 3.2%, to ¥2,522.5billion (US$20,986 million) due to increases in the market pricesof feed, fruits and vegetables and a growth in trading volume ofretail product. Gross trading profit increased by ¥3.3 billion, or2.6%, to ¥130.1 billion (US$1,082 million) due to favorable resultsin retail product, despite stagnant sales of marine products. Netincome rose ¥2.3 billion, or 23.4%, to ¥11.9 billion (US$99million) due to an increase in gross trading profit and an increasein equity in earnings of associated companies. Identifiable assetsfell ¥10.7 billion, or 1.6%, to ¥654.4 billion (US$5,444 million),mainly because trade receivables were collected and a decreasein the parent company’s stake in some consolidated companiescaused them to be accounted for by the equity-method.
Finance, Realty, Insurance & Logistics:Trading transactions fell ¥185.9 billion, or 40.8%, to ¥269.4 billion(US$2,241 million). This decline was mainly due to thestreamlining of inefficiencies in the house brokerage business,despite favorable results for condominium sales. The decrease intrading transactions led to a decline in gross trading profit of ¥0.5billion, or 1.6%, to ¥33.8 billion (US$282 million). Net lossnarrowed by ¥1.4 billion from a loss of ¥9.8 billion in the previousyear to a loss of ¥8.4 billion (US$70 million) because of costcutting and reductions in provision for doubtful accounts and losson disposal of property. Identifiable assets fell ¥80.7 billion, or10.4%, to ¥692.7 billion (US$5,763 million) mainly due toaccelerated reduction of construction and realty assets, and adecrease in carrying of bonds and lending in the finance sector.
Other, Adjustments & Eliminations: Trading transactions fell ¥20.2 billion, or 8.2%, to ¥226.2 billion(US$1,882 million) due to a decrease in transactions in Centraland South America, despite an increase in transactions in Asiaand the Middle East. Gross trading profit remained roughly thesame as in the previous year, falling slightly by ¥0.5 billion, or1.3%, to ¥37.5 billion (US$312 million). Net loss for fiscal 2003was ¥31.2 billion (US$259 million), ¥6.3 billion worse than theyear before, due to unfavorable results in North, Central andSouth America, and an increase in pension expenses. Identifiableassets remained roughly the same, falling slightly by ¥3.1 billion,or 0.3%, to ¥878.0 billion (US$7,305 million).

60 | ITOCHU Corporation.
Japan:Trading transactions fell ¥834.4 billion, or 9.2%, to ¥8,242.8billion (US$68,575 million) following the transfer of steeloperations to Marubeni-Itochu Steel Inc., and decreases in salesin Machinery, Energy, Construction & Realty and IT-relatedbusinesses. Identifiable assets fell ¥106.4 billion, or 2.7%, to¥3,884.2 billion (US$32,314 million), due to accelerated debtcollection and a decrease in trade receivables following adecrease in sales.
North America:Trading transactions fell ¥132.1 billion, or 21.4%, to ¥484.6 billion(US$4,031 million) due to a decrease in energy transactions anda decrease following the transfer of steel operations to Marubeni-Itochu Steel Inc. Identifiable assets fell ¥59.5 billion, or 13.8%, to¥372.4 billion (US$3,099 million), due to a decrease in tradereceivables following a decrease in sales.
Europe:Trading transactions fell ¥17.4 billion, or 9.8% to ¥159.6 billion(US$1,328 million), following the transfer of steel operations toMarubeni-Itochu Steel Inc. Identifiable assets fell ¥21.8 billion, or11.1%, to ¥174.4 billion (US$1,451 million), due to decreases inbonds held by the finance sector as well as automobile inventory.
Asia:Trading transactions rose ¥31.5 billion, or 2.4%, to ¥1,362.6billion (US$11,336 million) because of an increase in energy-related transactions, despite the effect of the transfer of steeloperations to Marubeni-Itochu Steel Inc. Identifiable assetsremained roughly the same, falling ¥5.0 billion, or 2.4%, to¥202.0 billion (US$1,681 million).
Other Areas:Trading transactions increased by ¥13.5 billion, or 6.8%, to¥212.2 billion (US$1,765 million) due to an increase in vessel-related transactions. Identifiable assets fell ¥53.5 billion, or18.7%, to ¥233.3 billion (US$1,941 million), mainly due to adecrease in the assets of subsidiaries in Central and SouthAmerica.
Please note that there are consolidation adjustments ofidentifiable assets that are not included in any of the abovesegments.
Geographical Segment Information
10,000
0
6,000
8,000
4,000
2,000
9,077
617177
1,331
199
8,243
485160
1,363
212
Total Trading Transactions by Geographical Segment
Japan North America Europe Asia Other Areas
Billions of Yen 2003 2002
Identifiable Assets by Geographical Segment
Billions of Yen4,000
0
2,000
3,000
1,000
432196 207 287233202174
372
3,884
2003 2002
Japan North America Europe Asia Other Areas
3,991

ITOCHU Corporation | 61.
For the fiscal year ended March 31, 2003, ITOCHU’sconsolidated results included 468 consolidated subsidiaries (228domestic and 240 overseas) and 183 equity-method associated
Performance of Consolidated Subsidiaries and Associated Companies
companies (90 domestic and 93 overseas) totaling 651companies. The following table presents information regardingthe profitability of these companies.
Share of Profitable Group Companies
Profit of Profitable Companies and Loss of Unprofitable Companies
Major Profitable Group Companies
Profitable companies .........................................................................................Group companies ..............................................................................................Profitable ratio ...............................................................................................................
263318
82.7%
259333
77.8%
522651
80.2%
262331
79.2%
249340
73.2%
511671
76.2%
Domestic Overseas Total Domestic Overseas Total
2003 2002
Group companies excluding overseas trading subsidiaries ............................
Overseas trading subsidiaries ...............................Total .....................................................................
53.3 4.6
57.9
(21.6) (0.9)
(22.5)
31.7 3.7
35.4
¥62.1 4.7
¥66.8
(14.7) (2.2)
(16.9)
47.4 2.5
49.9
8.8 0.1 8.9
6.9(1.3) 5.6
15.7 (1.2)
14.5
ProfitableYears ended March 31 Unprofitable TotalProfitable Unprofitable Total Profitable Unprofitable Total
2003 Changes2002
Billions of Yen
DomesticITOCHU Oil Exploration Co., Ltd. ....................Marubeni-Itochu Steel Inc. ..............................
FamilyMart Co., Ltd. .......................................ITOCHU Techno-Science Corporation ............Japan Brazil Paper & Pulp Resources
Development Co., Ltd. .................................Yoshinoya D&C Co., Ltd. ................................
ITOCHU Sugar Co., Ltd. .................................
ITOCHU Chemical Frontier Corporation ..........
ITOCHU Finance Corporation .........................ITC Networks Corporation ..............................ITOCHU Plastics Inc. ......................................
OverseasITOCHU Coal Resources Australia Pty., Ltd. ...Prime Source Building Products, Inc. ..............ITOCHU Europe PLC. .....................................ITOCHU Hong Kong Ltd. ................................ITOCHU Australia Ltd. ....................................ITOCHU (Thailand) Ltd. ...................................ITOCHU (China) Holding Co., Ltd. ..................
97.79%50.00%
30.53%32.92%
25.94%21.19%
100.00%
99.90%
88.32%100.00%100.00%
100.00%100.00%100.00%100.00%100.00%100.00%100.00%
1.9 1.0
(0.1) 5.7
(0.2) 0.5
0.7
0.1
(0.8) 0.0 0.5
3.3 1.0 1.0 1.4 0.7 0.4 0.5
¥5.1 3.3
3.2 2.8
2.7 1.7
1.5
1.2
1.2 1.1 1.1
¥3.0 2.1 1.0 0.9 0.6 0.6 0.5
Recorded gains on disposal of rights and interests
Steady growth of overseas, and an increase in full-year net
income in fiscal 2003 because only 2nd-half net income was
earned in fiscal 2002
Steady growth and ceasing amortization of goodwill in fiscal 2003
Dull condition in IT sector
Increase in full-year net income in fiscal 2003 because only 2nd-
half net income was earned in fiscal 2002
Exemption of liabilities in subsidiaries and ceasing amortization of
goodwill in fiscal 2003
Recorded earnings from new subsidiaries and gains through a
share sale
Acquired business from parent company and recorded a
provision for doubtful accounts in fiscal 2002
Recorded a provision for doubtful accounts in fiscal 2002
Reduced expenses and acquired business from parent company
Merged with ITOCHU POLYMER INC. and acquired business
from parent company
Decreased mainly due to changes in foreign exchange rates
Steady growth in house construction
—
Worse performances of associated companies
Recorded gains on disposal of subsidiaries in fiscal 2002
Steady growth in chemical sector
—
Years ended March 31 2003 2002
Shares Reasons for changes
*Net income (loss)Billions of Yen
Years ended March 31

62 | ITOCHU Corporation.
Major Unprofitable Companies
DomesticFamima Credit Corporation .............................
Tokyo Humania Enterprise Inc. .......................Nishimuromi Development Co., Ltd. ................
OverseasITOCHU Latin America S.A. ............................
Luisita Industrial Park Corporation ..................ITOCHU Technology, Inc. ...............................
ITOCHU Coal International Inc. .......................
ITC Ventures VIII, Inc. .....................................
45.83%
35.17%100.00%
100.00%
56.00%100.00%
100.00%
97.64%
(0.1)
(0.3) (0.4)
(0.7)
0.0 0.2
0.1
(0.2)
¥(0.4)
(0.4)(0.3)
¥(1.8)
(1.3)(0.8)
(0.6)
(0.4)
Recorded start-up expenses associated with business
establishment
Recorded operating losses
Sales declined
Sluggish performance by subsidiaries and decline in automobile
sector
Recorded losses on resale of land under development
Recorded losses on disposal of stocks, and dull condition in IT
sector
Failed to reach production plans, and suffered from a drop in
market price
Recorded appraisal losses on investments
Years ended March 31 2003 2002
Shares Reasons for changes
*Net income (loss)Billions of Yen
Basic Policy of Fund RaisingITOCHU’s basic policy of fund raising aims to ensure flexibility soit can quickly respond to changes in the capital markets, andlower its overall financing costs. It also aims to enhance thestability of its financing. In particular, ITOCHU aims to find theoptimum balance in its funding structure including improvementof long-term funding balance, and also diversify its fundingsources and methods.
In Japan, most corporations’ funding still depends on indirectfinancing, mostly from domestic banks. In recent years, theaccelerated disposal of problem loans by Japanese banks hasundermined their financial strength and increased their aversionto risk, which has made it more difficult for corporations toborrow from banks. Despite such unstable funding conditions,financial institutions, including ITOCHU’s main commercial banks,have shown a favorable attitude towards lending to ITOCHU,which is a positive market endorsement of its improved financialposition.
Recently, ITOCHU has conducted the following fundingactivities:
ITOCHU raised about ¥55.0 billion through a public offering of158 million common shares in July 2002. It also issued two ¥10.0billion straight corporate bonds with three-year maturities, once inDecember 2002 and once in January 2003.
In addition, ITOCHU is capable of carrying out a flexible bondissuance after it registered for bond issuance with a maximum
Liquidity and Capital Resources
amount of ¥300.0 billion for two years from August 2001 to July2003. Further, the Company, ITOCHU International Inc. (U.S.A.),and a finance subsidiary in the U.K. own a total of US$5 billion ofMedium Term Note Program (MTN) in order to be flexible infulfilling short- and long-term funding needs. The outstandingbalance of corporate bonds issued by the Company was ¥348.1billion and that of the MTN was about US$0.4 billion as of March31, 2003.
Interest-Bearing DebtsGross interest-bearing debts as of March 31, 2003 decreased by¥220.3 billion from March 31, 2002 to ¥2,574.4 billion(US$21,418 million), and net interest-bearing debts, a net ofcash, cash equivalents and time deposits, decreased by ¥271.4billion from March 31, 2002 to ¥2,025.0 billion (US$16,847million) as of March 31, 2003. This resulted from an increase infunds following the public stock offering, the repayment of loanspayable and a redemption of debentures, along with a reductionof total assets to enhance asset efficiency, in a continued effort toreinforce its consolidated financial position. Consequently, netDER (Debt-to-Equity Ratio) improved by 1.0 point to 4.8 timesfrom 5.8 times at the end of the last fiscal year. Also, averageinterest rate of borrowing, or interest expenses divided by theaverage balance of interest-bearing debts, improved by 0.58percentage point from 2.35% in fiscal 2002 to 1.77% in fiscal2003.
*The above figures represent the group companies’ share of the net income.

ITOCHU Corporation | 63.
Financial Position - A Comparison between March 31, 2003and March 31, 2002Total assets as of March 31, 2003 decreased by ¥265.9 billionfrom March 31, 2002 to ¥4,486.4 billion (US$37,325 million), as aresult of disposal of inefficient assets to improve asset efficiency, aswell as asset devaluations caused by a decline in stock prices andan appreciation of the yen at the end of the fiscal year.
Trade receivables (less allowance for doubtful receivables)decreased by ¥72.6 billion to ¥1,028.3 billion (US$8,555 million),as a result of increased debt collection mainly in the Textile,Machinery and Food sectors.
Inventories decreased by ¥23.8 billion to ¥402.2 billion(US$3,346 million), due to reductions in inventories mainly in theMachinery and Construction sectors.
Other current assets decreased by ¥47.0 billion to ¥196.1billion (US$1,631 million), mainly due to the collection of short-termlending.
Other investments decreased by ¥83.0 billion to ¥339.5 billion(US$2,825 million), due to falls in stock prices, sales of listedstocks, and the early redemption of debentures.Other non-current receivables (less allowance for doubtful
items) decreased by ¥74.8 billion to ¥259.5 billion (US$2,159million), as a result of the promotion of sales and collection of long-term receivables, additional appropriation of provision for doubtfulaccounts, and an appreciation in the value of the yen as of the endof the fiscal year.
Property and equipment, at cost (less accumulateddepreciation) decreased by ¥36.2 billion to ¥592.5 billion(US$4,929 million), due to changes by some subsidiaries to equity-method affiliates following lowered share holding by ITOCHU, inaddition to a decrease caused by appreciation of yen at the end ofthe fiscal year.
Prepaid pension cost rose ¥68.6 billion to ¥225.7 billion(US$1,878 million), as a result of additional contributions to anemployee pension trust.
Trade payables fell ¥50.3 billion to ¥937.7 billion (US$7,801million), with decreases particularly in Textile, Machinery and Foodsectors.
Gross interest-bearing debts as of March 31, 2003 decreasedby ¥220.3 billion from March 31, 2002 to ¥2,574.4 billion(US$21,418 million) after the Company raised funds through a
public offering of common stock, repaid some loans payable andredeemed debentures following reduction of total assets toenhance asset efficiency, in an ongoing effort to reinforce itsconsolidated financial position.
Stockholders’ equity increased by ¥28.6 billion to ¥426.2 billion(US$3,546 million). This increase resulted from a ¥20.1 billionincrease in the accumulation of net income and a public offering ofcommon stock which increased stockholders’ equity by around¥55.0 billion. These gains were partly offset by a deterioration offoreign currency translation adjustments of ¥20.6 billion followingan appreciation of the value of the yen at the end of the fiscal yearand a deterioration of unrealized gain (losses) on securities of ¥17.8billion, which represents an unrealized gain for listed stocks,following the decline in stock prices.
Reserves for LiquidityAs a basic policy, ITOCHU maintains “liquidity reserves” (anadequate amount of liquidity) to cover “necessary liquidity” (short-term interest-bearing debts and contingent liabilities due withinthree months from a certain point of time). This policy is based ona scenario where new funding may be unavailable for about threemonths because of a market turmoil. In such a case, ITOCHUmust maintain adequate reserves to repay liabilities in order to becapable of coping with unpredictable events.
Primary liquidity reserves increased by ¥161.1 billion from March31, 2002 to ¥1,009.4 billion, which consisted of ¥549.4 billion ofcash, cash equivalents and time deposits, and ¥250.0 billion ofshort-term commitment line agreements and ¥210.0 billion of long-term commitment line agreements. The main reason that primaryliquidity reserves increased was that ITOCHU increased the totalamount of commitment lines by setting up additional commitmentline agreements and increased cash, cash equivalents and timedeposits to prepare for the scheduled redemption of debentures infiscal 2004.
The total amount of liquidity reserves, or primary liquidity reservesand secondary liquidity reserves (other assets that can be changedinto cash in a short period of time), stood at about ¥1,440.0 billionas of March 31, 2003. ITOCHU believes that this amountconstitutes adequate reserves of liquidity, since it is more thanthree times necessary liquidity, which amounted to about ¥420.0billion as of March 31, 2003.
The breakdown of interest-bearing debts as of March 31, 2003 and those as of March 31, 2002 were as follows:
Short-term loans payable .....................................................................................................................Current installments of long-term debt .................................................................................................Commercial paper ................................................................................................................................Current installments of debentures .......................................................................................................Short-term total ....................................................................................................................................Long-term loans payable ......................................................................................................................Debentures ..........................................................................................................................................Long-term total ....................................................................................................................................Total interest-bearing debts ..................................................................................................................Effect of SFAS 133 adoption (Note) ......................................................................................................Adjusted total interest-bearing debts ....................................................................................................Cash, cash equivalents and time deposits ............................................................................................Net interest-bearing debts ....................................................................................................................
Billions of YenMillions ofU.S. dollars
2003 20032002
$ 3,869 2,816
0 1,559 8,244
11,122 1,809
12,931 21,175
243 21,418 (4,571)
$16,847
494.6 335.6 10.0
151.2 991.4
1,420.9 344.8
1,765.7 2,757.1
37.6 2,794.7
(498.3) 2,296.4
¥ 465.1 338.5
0.0 187.3 990.9
1,336.9 217.4
1,554.3 2,545.2
29.2 2,574.4 (549.4)
¥2,025.0
(Note) Increase in interest-bearing debts as a result of the adoption of SFAS (Statement of Financial Accounting Standards) No.133The differences between carrying amounts and estimated fair value of interest rate SWAP agreements are posted on the balance sheet as derivative assets/liabilities. Forborrowings, which are hedged with derivatives, fair value is used as an amount posted in the balance sheet.

64 | ITOCHU Corporation.
Short-term interest-bearing debts .................................................................................................
Current installments of long-term interest-bearing debts ..............................................................
Contingent liabilities (Guarantees [substantial risk] for monetary indebtedness of associated companies and customers) .....................
Total .............................................................................................................................................
March 31
1. Cash, cash equivalents and time deposits .....................................................................................................................2. Commitment line agreements ........................................................................................................................................Total primary liquidity reserves ...........................................................................................................................................
3. Available portion of O/D for the Company’s cash management service ..........................................................................4. Available-for-sale securities (Fair value on consolidated basis) ........................................................................................5. Notes receivable ............................................................................................................................................................Total secondary liquidity reserves ......................................................................................................................................
Total liquidity reserves ........................................................................................................................................................
¥465.1
525.8
227.4
¥232.5(465.1/6 months x 3 months)
131.4(525.8/12 months x 3 months)
56.9(227.4/12 months x 3 months)
¥420.8
2003 Necessary liquidity
Billions of Yen
¥ 549.4460.0
¥1,009.4
Liquidity reserves
Billions of Yen
¥ 120.0167.4145.8
¥ 433.2
¥1,442.6
Liquidity reserves
Billions of Yen
Net cash provided by operating activities .............................................................................................Net cash provided by investing activities ..............................................................................................Net cash used in financing activities .....................................................................................................Effect of exchange rate changes on cash and cash equivalents ...........................................................Net increase in cash and cash equivalents ...........................................................................................Cash and cash equivalents at beginning of year ...................................................................................Cash and cash equivalents at end of year ............................................................................................
Billions of YenMillions ofU.S. dollars
2003 20032002
$1,405 44
(949)(47)
4533,991
$4,444
216.5214.0(232.0)
6.3204.8274.9479.7
¥168.85.3
(114.0)(5.6)
54.4479.7
¥534.2
Necessary Liquidity
Primary Liquidity Reserves
Secondary Liquidity Reserves
Capital ResourcesITOCHU’s basic policy on capital resources is that new money forinvestments should be financed by the sale and recouping byinvesting activities or by net cash provided by operating activities.Cash surplus after dividend payments should be used for therepayment of interest-bearing debts.
Cash and cash equivalents was ¥534.2 billion (US$4,444million) as of March 31, 2003, ¥54.4 billion, or 11.3%, higher thanthe level on March 31, 2002. This increase is the result ofpreparing for the scheduled redemption of corporate bonds infiscal 2004.
The following table shows a summary of cash flows for the fiscal years ended March 31, 2003 and March 31, 2002.
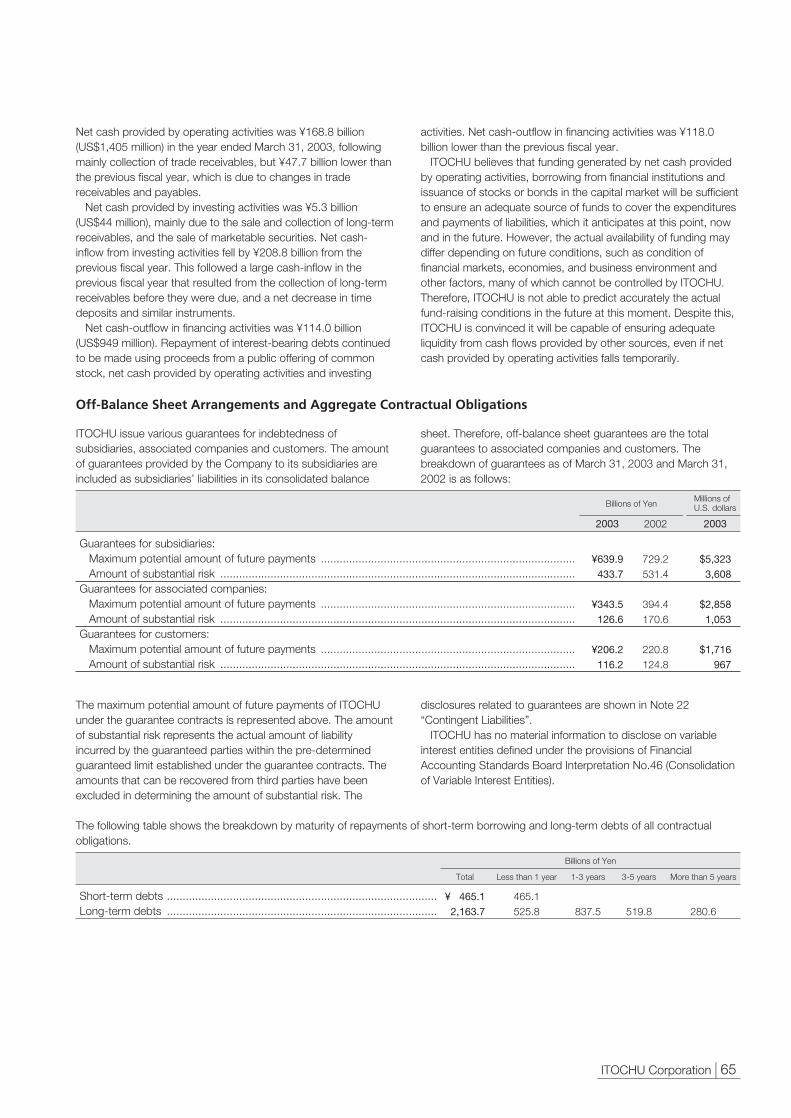
ITOCHU Corporation | 65.
Guarantees for subsidiaries: Maximum potential amount of future payments .................................................................................Amount of substantial risk .................................................................................................................
Guarantees for associated companies: Maximum potential amount of future payments .................................................................................Amount of substantial risk .................................................................................................................
Guarantees for customers: Maximum potential amount of future payments .................................................................................Amount of substantial risk .................................................................................................................
Billions of YenMillions ofU.S. dollars
2003 20032002
$5,3233,608
$2,8581,053
$1,716967
729.2531.4
394.4170.6
220.8124.8
¥639.9433.7
¥343.5126.6
¥206.2116.2
Short-term debts ......................................................................................Long-term debts ......................................................................................
Billions of Yen
Total More than 5 years3-5 yearsLess than 1 year 1-3 years
280.6465.1525.8 837.5 519.8
¥ 465.12,163.7
Net cash provided by operating activities was ¥168.8 billion(US$1,405 million) in the year ended March 31, 2003, followingmainly collection of trade receivables, but ¥47.7 billion lower thanthe previous fiscal year, which is due to changes in tradereceivables and payables.
Net cash provided by investing activities was ¥5.3 billion(US$44 million), mainly due to the sale and collection of long-termreceivables, and the sale of marketable securities. Net cash-inflow from investing activities fell by ¥208.8 billion from theprevious fiscal year. This followed a large cash-inflow in theprevious fiscal year that resulted from the collection of long-termreceivables before they were due, and a net decrease in timedeposits and similar instruments.
Net cash-outflow in financing activities was ¥114.0 billion(US$949 million). Repayment of interest-bearing debts continuedto be made using proceeds from a public offering of commonstock, net cash provided by operating activities and investing
activities. Net cash-outflow in financing activities was ¥118.0billion lower than the previous fiscal year.
ITOCHU believes that funding generated by net cash providedby operating activities, borrowing from financial institutions andissuance of stocks or bonds in the capital market will be sufficientto ensure an adequate source of funds to cover the expendituresand payments of liabilities, which it anticipates at this point, nowand in the future. However, the actual availability of funding maydiffer depending on future conditions, such as condition offinancial markets, economies, and business environment andother factors, many of which cannot be controlled by ITOCHU.Therefore, ITOCHU is not able to predict accurately the actualfund-raising conditions in the future at this moment. Despite this,ITOCHU is convinced it will be capable of ensuring adequateliquidity from cash flows provided by other sources, even if netcash provided by operating activities falls temporarily.
ITOCHU issue various guarantees for indebtedness ofsubsidiaries, associated companies and customers. The amountof guarantees provided by the Company to its subsidiaries areincluded as subsidiaries’ liabilities in its consolidated balance
sheet. Therefore, off-balance sheet guarantees are the totalguarantees to associated companies and customers. Thebreakdown of guarantees as of March 31, 2003 and March 31,2002 is as follows:
The maximum potential amount of future payments of ITOCHUunder the guarantee contracts is represented above. The amountof substantial risk represents the actual amount of liabilityincurred by the guaranteed parties within the pre-determinedguaranteed limit established under the guarantee contracts. Theamounts that can be recovered from third parties have beenexcluded in determining the amount of substantial risk. The
disclosures related to guarantees are shown in Note 22“Contingent Liabilities”.
ITOCHU has no material information to disclose on variableinterest entities defined under the provisions of FinancialAccounting Standards Board Interpretation No.46 (Consolidationof Variable Interest Entities).
The following table shows the breakdown by maturity of repayments of short-term borrowing and long-term debts of all contractualobligations.
Off-Balance Sheet Arrangements and Aggregate Contractual Obligations

66 | ITOCHU Corporation.
ITOCHU is exposed to various risks such as market risks, creditrisks and investment risks, due to the nature of its business.These risks include unpredictable events that may have adverseeffects on its future business and financial performance. ITOCHUhas enhanced its risk management system and risk managementmethods to monitor and manage these risks.
Since the introduction of a “Division Company System” in 1997,ITOCHU has reinforced the concept of self-management in whicheach Division Company manages the risks associated withindividual projects, while the Headquarters has continued todevelop sophisticated risk management methods. ITOCHU hasalso established the ALM (Asset Liability Management)Committee as an advisory body to the HMC (HeadquartersManagement Committee), the highest decision-making body inITOCHU. The ALM Committee plays a central role in managingthe balance sheets of the whole ITOCHU Group and proposingimprovements, and in analyzing the risk management acrossITOCHU and proposing various risk management methods andimprovements. Specifically, it manages risk exposure for eachindividual product and service by setting internal covenants formajor balance sheet items and segmenting products andservices in detail to set exposure limits, criteria to undertake, andstandards for return.
Furthermore, ITOCHU has introduced RCM (Risk CapitalManagement), a risk management method based on RAROC(Risk-adjusted Return on Capital) to thoroughly manage itsbusiness portfolio through the utilization of two managementbenchmark: Risk Assets and Risk Return Index.
Market RisksITOCHU is exposed to market risks such as foreign exchangerate risk, interest rate risk, commodity price risk and stock pricerisk. ITOCHU aims to minimize risks relating to marketfluctuations such as changes in foreign exchange rates andinterest rates by establishing a risk management system usingbalance limit and other such measures and by utilizing a variety ofderivative instruments for hedging purposes. Please refer toITOCHU’s accounting policy for derivative instruments in notes toconsolidated financial statements “2. Summary of SignificantAccounting Policies” and “19. Financial Instruments.”
Foreign Exchange Rate RiskITOCHU is exposed to foreign exchange rate risk regardingtransactions denominated in foreign currencies due to itssignificant involvement in import/export trading. ITOCHU usesforward exchange contracts and currency swap contracts tominimize risks for these transactions. Also, to manage foreigncurrency balance, ITOCHU sets limits on foreign exchange raterisks (limit of balance and that of loss), whereby it manages itsbalance of foreign currency by contract amount, the amount ofits own/others’ risk, and short-term/long-term. Since ITOCHUengages in businesses involving foreign currencies with anumber of overseas trading subsidiaries and other overseasgroup subsidiaries, the figures denominated in Japanese yen onits consolidated balance sheet are also exposed to so-calledforeign currency translation risk. ITOCHU does not hedge thetranslation risk, which does not have an impact on its financialand business performance denominated in foreign currencies.
Interest Rate RiskITOCHU is exposed to interest rate risk in fund raising or usingby its lending, investing, and operating activities. Interest raterisk refers to the risk of income fluctuation caused by changesto interest rates, when mismatches in interest rates anddurations occur. Interest rate risk is, on the whole, expressedby the equation of “balance x magnitude of interest rate changex duration.”
To control interest rate risk in a concrete and objectivemanner, ITOCHU has grappled with quantification of interestrate risk by measuring interest rate risk with a newmethodology, “Earning at Risk (EaR).” Based on the results ofEaR, ITOCHU sets a certain limit (Loss Cut Limit) as the highestacceptable interest payment, and executes hedgingtransactions to maintain the loss cut limit. ITOCHU mainlyutilizes interest rate swaps to minimize interest rate risk. EaR ismonitored every month and a review of the loss cut limitsituation is carried out regularly.
Commodity Price RiskITOCHU is exposed to commodity price risk on commodityproducts that it trades such as crude oil and grain. In ITOCHU,each Division Company sets its own risk management policyand manages purchase contracts, inventories and salescontracts including off-balance sheet items. In addition,particularly for products that have high price volatilities and mayhave a large impact on ITOCHU’s management, ITOCHUdesignates them as “specified important products” and eachDivision Company sets and manages a balance limit and losscut limit for each individual product. The loss cut limits forproducts with a large amount of trading are examined by theALM Committee and approved by the HMC. The tradingvolumes of specified important products are regularly reviewedand reported to the ALM Committee along with their productmanagement standards and methods. ITOCHU is reducingcommodity price risk by minimizing the balance of productsand by utilizing futures or forward contracts. For pricefluctuation risk of ship charter fares regarding shipping balanceITOCHU owns for its own use, like specified importantproducts, it sets and manages balance limit and loss cut limit.
Stock Price RiskITOCHU holds available-for-sale marketable securities whichare vulnerable to price fluctuation. As for stock price risk,ITOCHU aims to optimize the amount of investments byapplying exit rules for inefficient and less meaningfulinvestments, because hedging by derivative instruments is noteffective for available-for-sale marketable securities held forlong-term. Fair value of the available-for-sale marketablesecurities held by ITOCHU was ¥167.4 billion as of March 31,2003 and ¥256.1 billion as of March 31, 2002. In cases wherethe aggregate prices of these investments had fluctuated by10%, fair value would also have fluctuated by ¥16.7 billion as ofMarch 31, 2003 and by ¥25.6 billion as of March 31, 2002.
Risk Management

ITOCHU Corporation | 67.
Credit RiskITOCHU manages credit risks that are involved when operating ina wide range of transactions with domestic and overseasbusiness partners including customers and suppliers. The creditdepartment of each Division Company, which is independent ofthe business departments of each Division Company, managesand evaluates credit risk from both quantitative and qualitativeperspectives, monitoring regularly the credit limit and the statusquo of trade receivables and reviewing regularly the status quo ofdebt collection and delinquency to discuss and record therequired provision for doubtful accounts.
1. Registration System of Business Partners ITOCHU selects corporations eligible to be business partnersbased on the registration criteria.
2. Credit Analysis, Credit Limit and Reviewing System1) Repeated and Continued Transactions: ITOCHU sets
appropriate credit limits after credit analysis based on financialanalysis and a credit survey, and regularly reviews and renewsthem.
2) Medium- to Long-Term Projects: Besides the above process,ITOCHU sets transaction criteria for each individual project,taking into consideration contract conditions and life-timeprofitability.
3. Quantitative Management of Credit RiskIn addition to a financial analysis scoring system, ITOCHUconducts quantitative management of credit risk by using itsproprietary credit rating model.
4. Large Volume Accounts and Problem AccountsITOCHU conducts in-depth research of the creditcharacteristics for specified applicable accounts, reviewstransaction policy from time to time, and, when necessary,discusses and records provision for doubtful accounts.
Country RiskIn transactions with developing countries, besides takingappropriate countermeasures against country risk for eachtransaction, ITOCHU has strengthened its credit riskmanagement, utilizing the following systems to avoidconcentration of exposure in specific countries;a) Drawing basic policies for transactions with developing
countriesb) Setting total limit guidelines and limits for each countryc) Providing in-house country credit ratings and drawing credit
policies by country
ITOCHU also conducts reviews of country ratings, credit policiesand limits by country from time to time, taking into considerationthe status quo of risk exposure of ITOCHU, which is regularlyrecognized based on the analysis of information on developingcountries garnered from inside and outside ITOCHU.
Investment RiskInvesting in a variety of businesses is one of the major businessactivities of ITOCHU. Investments are ITOCHU’s largest riskassets and therefore, careful judgment is required whenmanaging a strategic investment portfolio, investing in a businessthat is expected to earn profit commensurate to its risk, or exitingfrom a business unable to earn profit commensurate to its risk.ITOCHU uses the concept of RCM as its basic policy forinvestment. To consider a new investment, ITOCHU assessesprofitability relative to investment risk based on NPV (Net PresentValue) on a Risk Asset basis. To monitor an existing investment,for a timely exit decision, it utilizes strict exit criteria that take intoaccount growth potential, and regularly reviews efficiency in termsof a risk return index.
*RCM: ITOCHU uses Risk Assets and Risk Return Index (RRI) as managementbenchmark.
*Risk Assets = Asset book value x Risk weight for each asset*Risk Return Index (RRI) = Net income / Risk assets
ITOCHU’s consolidated financial statements are prepared inconformity with United States generally accepted accountingprinciples (U.S. GAAP). In preparation of the consolidatedfinancial statements, the management of ITOCHU is required tomake a number of estimates, judgments and assumptions thataffect the reported amounts of assets, liabilities, contingentassets and liabilities as of each balance sheet date, and revenuesand expenses in each reporting period. The managementperiodically verifies and makes a decision of its estimates,judgments and assumptions based on the available informationthat is considered to be reasonable by judging from historicalexperiences and circumstances. These estimates, judgments andassumptions, however, which are often accompanied byuncertainties, may differ from actual results. These differencesmay have an effect on ITOCHU’s consolidated financialstatements and performances of every operating segment. Thefollowing accounting policies related to estimates, judgments andassumptions that management believes may materially affectconsolidated financial statements.
Evaluation of InvestmentsInvestment balance and profit from investments are importantfactors in ITOCHU’s consolidated financial statements andtherefore, accounting judgment on evaluation of investments hasa substantial impact on ITOCHU’s consolidated financialstatements.
ITOCHU evaluates marketable securities based on their fairvalues. The difference between carrying amount and fair value isreported in the consolidated statements of income for tradingsecurities, while, for available-for-sale securities, differences net oftax, are reported in stockholder’s equity as unrealized gains(losses) on securities. When ITOCHU judges that the price declineof marketable securities is other than temporary, impairmentlosses are recognized for the devaluation of this value. The criteriaused to judge an other-than-temporary price decline are thelength of time the marketable securities have been below carryingamount and the magnitude of the decline.
For the impairment of non-marketable securities, judgment ofan other-than-temporary price decline is conducted after a
Critical Accounting Policies

68 | ITOCHU Corporation.
comprehensive consideration of the magnitude of the decline interms of net asset value, the financial conditions of the investedcompanies, and the outlook for their future performance.
For the impairment of marketable investments in associatedcompanies, in accordance with U.S. Accounting Principles BoardOpinions No.18, as is the case for impairment of long-livedassets, ITOCHU judges whether or not a price decline is otherthan temporary not only by measuring the magnitude of thedecline in market value but also comprehensively considering thepossibility of collection based on the estimated future cash flowsgenerated from the investment.
The management of ITOCHU believes these investmentevaluations are rational. However, difference in estimates such asestimated future cash flows due to unforeseen changes inbusiness conditions may impair the value of investments andhave a material impact on ITOCHU’s consolidated financialstatements.
Provision for Doubtful Accounts Trade receivables including notes and accounts, in addition toloans, represent a large amount in ITOCHU’s consolidatedbalance sheets, and provision for doubtful accounts is animportant factor in ITOCHU’s consolidated statements of income.Therefore, accounting judgment on evaluation of receivables hasa substantial impact on ITOCHU’s consolidated financialstatements.
In ITOCHU, the credit department of each Division Company,which is independent of business departments of each DivisionCompany, manages and evaluates credit risk from bothquantitative and qualitative perspectives, monitoring regularly thecredit limit and the status quo of trade receivables, and reviewingregularly the status quo of debt collection and delinquency todiscuss and record the required provision for doubtful accounts.ITOCHU estimates the recoverable amount and records therequired provision for doubtful accounts, after comprehensivelyconsidering the status quo of collection, past insolvency record,financial conditions of debtors and value of collateral.
The management of ITOCHU believes that these estimations ofprovisions for doubtful accounts are rational. However,deterioration of the debtors’ financial conditions and declines inestimated collateral value due to unpredictable changes inbusiness conditions may reduce the recoverable amounts fromthe latest estimation, and an increase in provision for doubtfulaccounts may have a material impact on ITOCHU’s consolidatedfinancial statements.
Deferred Income TaxesDeferred income taxes reported on the assets are an importantfactor in ITOCHU’s consolidated balance sheets. Therefore,accounting judgment on evaluation of deferred income taxes hasa substantial impact on ITOCHU’s consolidated financialstatements. To consider record of allowance for deferred incometaxes, ITOCHU reports the realizable amount of deferred incometaxes, taking into consideration future taxable income andfeasible tax planning. To evaluate realizable amount, it considersinformation such as historical records and any availableinformation related to the future.
The management of ITOCHU believes these estimations ofrealizable amount of deferred income taxes are rational. However,allowance for deferred income taxes may increase or decreasedepending on changes in taxable income during the tax planningperiod and changes in tax planning standards, which may have amaterial impact on ITOCHU’s consolidated financial statements.
Impairment of Long-Lived AssetsIf a part of the carrying amount is determined to be unrecoverabledue to changes in the situation for long-lived assets used forbusiness and intangible assets whose useful lives are definite,ITOCHU recognizes the impairment of long-lived assets based onfair value by calculating the sum of the outcome of the use of thelong-lived asset and future cash flows (before discounts) resultingfrom its sale, and in case the sum falls below the carryingamount.
The management of ITOCHU believes these calculations ofestimated future cash flows and fair value have been done in arational manner. However, fluctuations in estimated future cashflows and fair value due to unpredictable changes in businessconditions may reduce the evaluation of long-lived assets, whichmay have a material impact on ITOCHU’s consolidated financialstatements.
Goodwill and Other Intangible AssetsGoodwill and non-amortizable intangible assets with indefiniteuseful lives are no longer amortized, but instead tested forimpairment at least annually. Fair value, which is indispensable forthe impairment test, is estimated by discounted future cash flowsbased on the business plan.
The management of ITOCHU believes these calculations ofestimated future cash flows and fair value have been done in arational manner. However, fluctuations in estimated future cashflows and fair value due to unpredictable changes in businessconditions may reduce the evaluation of goodwill and otherintangible assets, which may have a material impact onITOCHU’s consolidated financial statements.

ITOCHU Corporation | 69.
Cost of Retirement and Severance BenefitsITOCHU calculates the cost of its employees’ retirement andseverance benefits and pension obligations based on the sametypes of assumptions used in actuarial calculations, which includesuch important estimations as discount rates, retirement rates,death rates, increase rates of salary and long-term expectedrates of return on plan assets. To determine each of theseassumptions, ITOCHU comprehensively judges all availableinformation including market trends such as interest ratechanges.
The management of ITOCHU believes the determination ofthese assumptions has been done in a rational manner. However,any difference between the assumptions and the actualconditions may influence the future retirement benefit costs andpension liabilities, which may have a material impact onITOCHU’s consolidated financial statements.
New Accounting StandardsIn June 2001, the FASB issued Statement of FinancialAccounting Standards No.143, “Accounting for Asset RetirementObligations” (SFAS 143), which addresses financial accountingand reporting for obligations associated with the retirement oftangible long-lived assets and the associated asset retirementcosts. SFAS 143 applies to legal obligations associated with theretirement of long-lived assets that result from the acquisition,construction, development and (or) normal use of the asset.SFAS 143 requires that the fair value of a liability for an assetretirement obligation be recognized in the period in which it isincurred if a reasonable estimate of fair value can be made. TheCompany and its subsidiaries will adopt the provision of SFAS143 on April 1, 2003. Currently, the effect on consolidatedfinancial statements by adopting SFAS 143 has not beenreasonably estimated.
In April 2002, the FASB issued Statement of FinancialAccounting Standards No.145, “Rescission of FASB StatementsNo.4, 44, and 64, Amendment of FASB Statement No.13 andTechnical Corrections” (SFAS 145). SFAS 145 amends orrescinds a part of the existing Statements of Financial Accounting
Standards, and also amends other existing authoritativepronouncements to make various technical corrections. TheCompany and its subsidiaries will adopt the provision of SFAS145 on April 1, 2003. Currently, the effect on consolidatedfinancial statements by adopting SFAS 145 has not beenreasonably estimated.In January 2003, the Emerging Issues Task Force reached a
final consensus on Issue 03-2, “Accounting for the Transfer to theJapanese Government of the Substitutional Portion of EmployeePension Fund Liabilities” (EITF 03-2). EITF 03-2 addressesaccounting for a transfer to the Japanese government of asubstitutional portion of an Employees’ Pension Fund plan (EPF)which is a defined benefit pension plan established under theWelfare Pension Insurance Law. EITF 03-2 requires employers toaccount for the entire separation process of a substitutionalportion from an entire plan (including a corporate portion) uponcompletion of the transfer to the government of the substitutionalportion of the benefit obligation and related plan assets as theculmination of a series of steps in a single settlement transaction.Under this approach, the difference between the fair value of theobligation and the assets required to be transferred to thegovernment should be accounted for and separately disclosed asa subsidy. In March 2003, the applications which were submittedby the Company, were approved by the government for anexemption from the obligation to pay benefits for future employeeservice related to the substitutional portion. The Company plansto submit another application for separation of the remainingsubstitutional portion (that is, the benefit obligation related to pastservices) during fiscal year 2003. After this application isapproved by the government, the remaining benefit obligation ofthe substitutional portion (that amount earned by past services)as well as the related government-specified portion of the planassets of the EPF will be transferred to the government. TheCompany anticipates that this transfer will have a material impacton the consolidated financial statements, however, the specificamounts can not be confirmed at the moment, because theimpact will vary depending on the application date and otherpremises.

70 | ITOCHU Corporation.
Gross trading profit ............................................................Total trading transactions:
2003 20021st Quarter ¥2,402.8 2,731.42nd Quarter ¥2,672.1 3,163.63rd Quarter ¥2,559.7 2,582.94th Quarter ¥2,827.0 2,922.6
Selling, general and administrative expenses .....................Provision for doubtful accounts ..........................................Interest income ..................................................................Interest expense ................................................................Dividends ...........................................................................Profit (loss) on disposal of investments and
marketable securities, net of write-downs .......................Profit (loss) on property and equipment-net .......................Other-net ...........................................................................Income (loss) before income taxes, minority interests and
equity in earnings (losses) ...............................................Income taxes .....................................................................Income (loss) before minority interests and
equity in earnings (losses) ...............................................Minority interests ................................................................Equity in earnings (losses) of associated companies ..........Net income (loss) ...............................................................
Net income (loss) per ten shares: (Yen) ..............................
Stock price (Yen)High ................................................................................Low ................................................................................
157.5
(123.0)(8.5)9.1
(17.7)5.8
17.8(3.8)(2.4)
34.8(22.7)
12.1(4.9)5.9
13.1
92
509282
144.6
(112.5)(1.7)4.7
(11.7)2.6
(0.3)0.3(1.6)
24.4(12.9)
11.5(2.7)5.5
14.3
90
346198
142.7
(113.8)(1.4)6.4
(15.8)2.7
4.1(0.2)3.9
28.6(18.0)
10.6(3.2)3.5
10.9
77
397269
¥125.3
(112.7)(0.4)5.4
(12.9)3.1
5.40.2(4.1)
9.3(5.6)
3.7(1.3)6.8
¥ 9.2
¥ 65
¥ 506396
138.3
(112.8)(0.9)
10.4(22.1)
2.6
7.20.11.2
24.0(10.3)
13.7(1.9)0.4
12.2
85
520427
148.5
(111.8)(2.5)4.4
(12.5)1.7
4.2(1.0)(0.5)
30.5(18.8)
11.7(2.6)3.9
13.0
85
448276
147.7
(111.5)(12.3)
2.4(10.5)
2.7
(22.5)(0.3)(2.3)
(6.6)(8.3)
(14.9)(3.9)2.3
(16.5)
(104)
316249
140.4
(115.8)(6.1)8.0
(13.3)2.0
(15.5)(3.8)(5.0)
(9.1)2.7
(6.4)(1.1)1.5(6.0)
(42)
477276
2002Years ended March 31 2003 20022003 2002 2003 2003 2002
1st Quarter 4th Quarter3rd Quarter2nd Quarter
Billions of Yen (excluding net income (loss) per ten shares and stock price)
Quarterly financial data and the Company’s stock price performance during fiscal 2003 and 2002 are as follow.
Quarterly Financial Data and Stock Price
The above figures have not been audited by independent auditors, except for the aggregate figures from the first quarter to the second quarter, and from the first to fourth.
In fiscal 2004 ITOCHU will start its two-year mid-termmanagement plan “Super A&P-2004”. This plan will take furtherthe reorganization of its profit structure and the restructuring of itsmanagement system that ITOCHU started to implement in A&P-2002. We will focus on “A&P” segments to strengthen ourprofitability and financial position. In particular, we will focus onthe following key measures: 1) In the Super A&P strategy, of all the A&P segments (consumer
and retail; information and multimedia; natural resourcesdevelopment; financial services; North America and Asia), wehave identified the consumer and retail sectors, where we havea particularly strong presence, as key driving forces. We aim toallocate assets to the most efficient areas through a process ofaccelerated selection and concentration. We also aim toincrease profits generated by group companies bystrengthening core subsidiaries and associated companies aswell as increasing profits from overseas operations.Furthermore, we aim to develop innovative technologies for the
Management Policy for Fiscal 2004, ending March 2004
future in areas such as biotechnology and nanotechnology,and we will create new businesses centering on thesetechnologies.
2) We will improve our financial position; specifically, we will shiftassets to more profitable areas, reduce interest-bearing debts,and improve our debt-to-equity ratio and other key measuresof performance.
3) ITOCHU will build a solid management system. Havingdiscussed the pros and cons of introducing “the Company withCommittees system”, we have decided to further enhance thetransparency of our existing corporate governance systembased on the board of directors and corporate auditors, whichis highly rated by our stockholders. We will also furtherstrengthen our risk management system.
4) We aim to establish a flexible personnel strategy and willreinvigorate our human resources system to extract individuals’potential to the fullest. We will make personnel changes basedon the concept of “right person in the right place”.

ITOCHU Corporation | 71.
Gross trading profit ..............................................................................................Total trading transactions:2004 full year forecasts ¥10,0002003 full year results ¥10,4622004 half year forecasts ¥ 4,8002003 half year results ¥ 5,075
Selling, general and administrative expenses ........................................................Provision for doubtful accounts ............................................................................Net interest expenses ..........................................................................................Dividends .............................................................................................................Other-net .............................................................................................................Income before income taxes, minority interests and equity in earnings (losses) .......Income taxes .......................................................................................................Income before minority interests and equity in earnings (losses) ...........................Minority interests ..................................................................................................Equity in earnings (losses) of associated companies .............................................Net income ..........................................................................................................
Total assets ...........................................................................................................Gross interest-bearing debts .................................................................................Net interest-bearing debts .....................................................................................Total stockholders’ equity ......................................................................................
¥ 600
(475)(15)(33)
7(3)
81(44)37(13)21
¥ 45
¥4,4502,5002,000
470
566
(448)(17)(31)10(22)58(46)12(11)1920
4,4862,5742,025
426
290
(232)(8)
(16)2(1)
35(22)13(5)7
15
274
(224)(3)
(16)54
40(24)15(4)
1122
2004 Forecasts 2003 Results 2004 Forecasts 2003 Results
Full year Half year
Billions of Yen
Yen to U.S. dollars rate ....................................Crude oil price (U.S.dollars per BBL) ................
120.0020-22
122.8527.19
Forecasts(Note) Results
2004 2003
Years ended March 31
The business environment for ITOCHU in fiscal 2004 is expectedto largely depend on the U.S. economy, which is still fluid.Japan’s economy continues to suffer from the effects of deflationand thus it is difficult to expect any sort of rapid recovery. Thestock market also is unlikely to make any significant gains.
Under these circumstances, ITOCHU expects consolidatedtotal trading transactions of 10 trillion yen for the fiscal year
Fiscal 2004 consolidated forecasts (April 2003 - March 2004)
Outlook for Fiscal 2004, ending March 2004
ending March 2004, with net income of 45.0 billion yen.These forecasts are forward-looking statements based on a
number of assumptions and beliefs made by management in lightof information currently available and thus involve certain risksand uncertainties. Actual results may differ materially dependingon a number of factors, including changing economic conditionsin major market and fluctuations in currency exchange rate.
ITOCHU will pay a total dividend of 5 yen per share for the fiscalyear ended March 2003. The dividend for the first half of the yearwas 2.5 yen per share. For the fiscal year ending March 2004,
Distribution of the last and current fiscal year’s profit
ITOCHU also intends to pay a total dividend of 5 yen per share,with the dividend for the first half of the year yet to be determined.
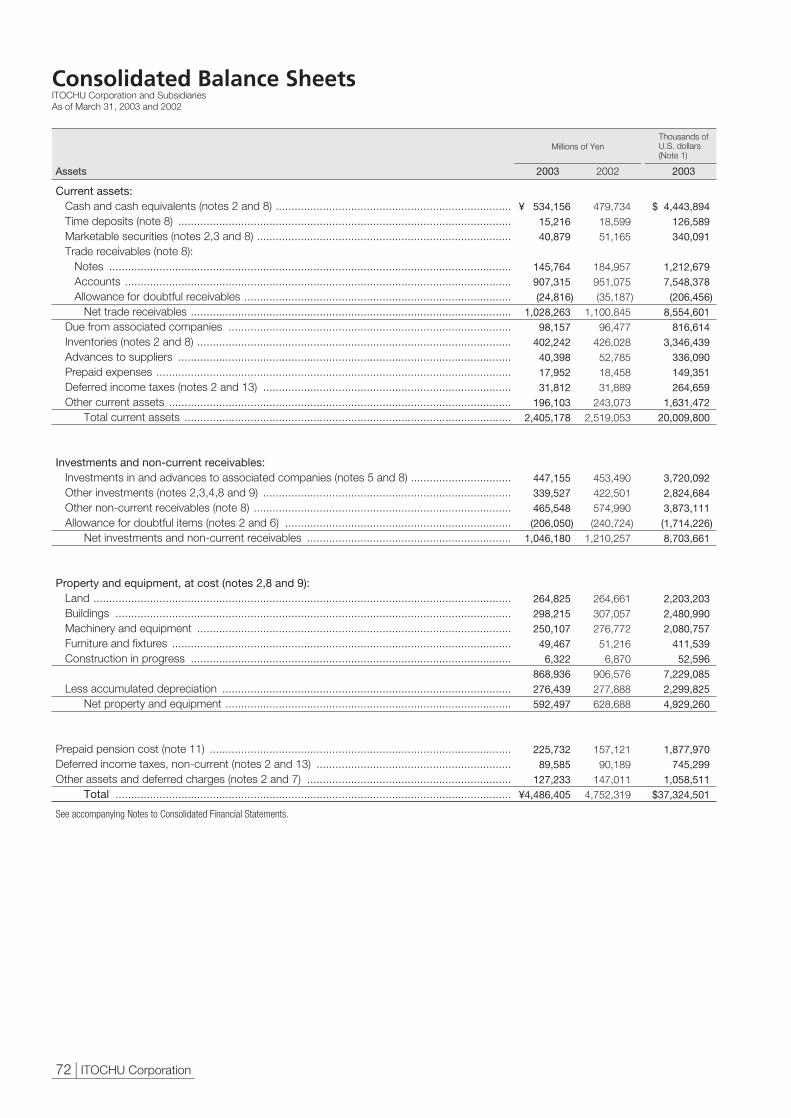
72 | ITOCHU Corporation.
Consolidated Balance SheetsITOCHU Corporation and SubsidiariesAs of March 31, 2003 and 2002
Current assets:Cash and cash equivalents (notes 2 and 8) ...........................................................................Time deposits (note 8) ..........................................................................................................Marketable securities (notes 2,3 and 8) .................................................................................Trade receivables (note 8):
Notes ................................................................................................................................Accounts ...........................................................................................................................Allowance for doubtful receivables .....................................................................................
Net trade receivables ......................................................................................................Due from associated companies ..........................................................................................Inventories (notes 2 and 8) ....................................................................................................Advances to suppliers ..........................................................................................................Prepaid expenses .................................................................................................................Deferred income taxes (notes 2 and 13) ...............................................................................Other current assets .............................................................................................................
Total current assets ........................................................................................................
Investments and non-current receivables:Investments in and advances to associated companies (notes 5 and 8) ................................Other investments (notes 2,3,4,8 and 9) ...............................................................................Other non-current receivables (note 8) ..................................................................................Allowance for doubtful items (notes 2 and 6) ........................................................................
Net investments and non-current receivables .................................................................
Property and equipment, at cost (notes 2,8 and 9):Land .....................................................................................................................................Buildings ..............................................................................................................................Machinery and equipment ....................................................................................................Furniture and fixtures ............................................................................................................Construction in progress ......................................................................................................
Less accumulated depreciation ............................................................................................Net property and equipment ...........................................................................................
Prepaid pension cost (note 11) ................................................................................................Deferred income taxes, non-current (notes 2 and 13) ..............................................................Other assets and deferred charges (notes 2 and 7) .................................................................
Total ..............................................................................................................................
$ 4,443,894126,589340,091
1,212,6797,548,378
(206,456)8,554,601
816,6143,346,439
336,090149,351264,659
1,631,47220,009,800
3,720,0922,824,6843,873,111(1,714,226)8,703,661
2,203,2032,480,9902,080,757
411,53952,596
7,229,0852,299,8254,929,260
1,877,970745,299
1,058,511$37,324,501
479,73418,59951,165
184,957951,075(35,187)
1,100,84596,477
426,02852,78518,45831,889
243,0732,519,053
453,490422,501574,990(240,724)
1,210,257
264,661307,057276,77251,2166,870
906,576277,888628,688
157,12190,189
147,0114,752,319
¥ 534,15615,21640,879
145,764907,315(24,816)
1,028,26398,157
402,24240,39817,95231,812
196,1032,405,178
447,155339,527465,548(206,050)
1,046,180
264,825298,215250,10749,4676,322
868,936276,439592,497
225,73289,585
127,233¥4,486,405
Millions of YenThousands ofU.S. dollars(Note 1)
2003Assets 20032002
See accompanying Notes to Consolidated Financial Statements.

ITOCHU Corporation | 73.
Current liabilities:Short-term debt (notes 8 and 10) .........................................................................................Current installments of long-term debt (notes 8 and 10) ........................................................Trade payables:
Notes and acceptances (note 8) ........................................................................................Accounts ...........................................................................................................................
Total trade payables .......................................................................................................Due to associated companies ..............................................................................................Income taxes payable (note 13) ............................................................................................Accrued expenses ................................................................................................................Advances from customers ....................................................................................................Deferred income taxes (notes 2 and 13) ...............................................................................Advances and deposits received ..........................................................................................
Total current liabilities .....................................................................................................
Long-term debt, excluding current installments (notes 8 and 10) ..........................................
Accrued retirement and severance benefits (note 11) ............................................................
Deferred income taxes, non-current (notes 2 and 13) ............................................................
Minority interests ....................................................................................................................
Stockholders’ equity:Common stock:
Authorized 3,000,000,000 shares;issued and outstanding1,583,487,736 shares 20031,425,487,736 shares 2002 (note 16) ............................................................................
Capital surplus (notes 16 and 17) .........................................................................................Retained earnings (note 17)
Legal reserve .....................................................................................................................Other retained earnings .....................................................................................................
Accumulated other comprehensive income (loss) (notes 2,3,11 and 18) ...............................Treasury stock ......................................................................................................................
Total stockholders’ equity ...............................................................................................
Contingent liabilities (note 22)
Total ....................................................................................................................................
$ 3,869,4514,374,634
1,400,2506,401,0237,801,273
299,983162,271735,499367,421
9,5591,192,155
18,812,246
13,626,589
186,215
79,268
1,074,260
1,682,5371,138,453
26,7221,189,800
(485,923)(5,666)
3,545,923
$37,324,501
504,616486,794
196,301791,713988,01436,79920,05099,58759,126
11148,567
2,343,564
1,863,629
18,366
12,600
116,492
174,749111,348
3,410128,468(20,264)
(43)397,668
4,752,319
¥ 465,108525,831
168,310769,403937,71336,05819,50588,40744,1641,149
143,2972,261,232
1,637,916
22,383
9,528
129,126
202,241136,842
3,212143,014(58,408)
(681)426,220
¥4,486,405
Millions of YenThousands ofU.S. dollars(Note 1)
2003Liabilities and Stockholders’ Equity 20032002

74 | ITOCHU Corporation.
Consolidated Statements of IncomeITOCHU Corporation and SubsidiariesYears ended March 31, 2003, 2002 and 2001
Gross trading profit (note 15) .........................................................................Total trading transactions (notes 2,5 and 15):
2003: ¥10,461,620 million ($87,035,108 thousand) 2002: ¥11,400,471 million 2001: ¥12,135,261 million
Selling, general and administrative expenses ...................................................Provision for doubtful accounts .......................................................................Interest income ...............................................................................................Interest expense .............................................................................................Dividends ........................................................................................................Profit (loss) on disposal of investments and
marketable securities, net of write-downs (notes 3,9 and 20) .......................Profit (loss) on property and equipment-net (note 9) ........................................Other-net (note 2) ...........................................................................................
Income before income taxes, minority interests and equity in earnings (losses)
Income taxes (notes 2 and 13): Current ........................................................................................................Deferred .......................................................................................................
Income before minority interests and equity in earnings (losses) ..................
Minority interests (note 2) ................................................................................Equity in earnings (losses) of associated companies (note 5) ...........................
Net Income ....................................................................................................
$ 4,709,126
(3,731,057)(140,141)140,923(395,957)
83,827
(109,667)(6,281)
(70,948)
479,825
260,291119,509379,800
100,025
(87,222)154,235
$ 167,038
578,867
(465,519)(16,831)33,895(68,834)12,997
13,502(7,622)(2,260)
78,195
38,22710,04648,273
29,922
(11,093)11,362
30,191
611,600
(453,221)(49,759)51,848
(115,848)8,465
117,0652,611
333
173,094
67,11731,90699,023
74,071
(8,789)5,225
70,507
¥ 566,037
(448,473)(16,845)16,939(47,594)10,076
(13,182)(755)
(8,528)
57,675
31,28714,36545,652
12,023
(10,484)18,539
¥ 20,078
Millions of YenThousands ofU.S. dollars(Note 1)
2003 20032002 2001
Net income per ten common shares (notes 2 and 14):Basic ...........................................................................................................Diluted .........................................................................................................
$ 1.09$ 1.09
212212
495459
¥ 131¥ 131
YenU.S. dollars(Note 1)
2003 20032002 2001
See accompanying Notes to Consolidated Financial Statements.

Consolidated Statements of Stockholders’ EquityITOCHU Corporation and SubsidiariesYears ended March 31, 2003, 2002 and 2001
ITOCHU Corporation | 75.
Common stock:Balance at beginning of year ........................................................................................Issuance of common stock ..........................................................................................Conversion of convertible bonds ..................................................................................Balance at end of year (note 16) ..................................................................................
Capital surplus:Balance at beginning of year ........................................................................................Issuance of common stock ..........................................................................................Conversion of convertible bonds ..................................................................................Transfer to retained earnings (deficit) ...........................................................................Redistribution arising from sale by parent of common
stock of subsidiaries and associated companies ......................................................Balance at end of year (notes 16 and 17) .....................................................................
Retained earnings (deficit) (note 17):Legal reserve:
Balance at beginning of year .....................................................................................Transfer from (to) other retained earnings (deficit) ......................................................Redistribution arising from sale by parent of common
stock of subsidiaries and associated companies ...................................................Balance at end of year ..............................................................................................
Other retained earnings (deficit):Balance at beginning of year .....................................................................................Net income ...............................................................................................................Cash dividends .........................................................................................................Transfer from capital surplus .....................................................................................Transfer from (to) legal reserve ..................................................................................Redistribution arising from sale by parent of common
stock of subsidiaries and associated companies ...................................................Balance at end of year ..............................................................................................
Accumulated other comprehensive income (loss) (notes 2,3,11 and 18):Balance at beginning of year ........................................................................................Other comprehensive income (loss) .............................................................................Balance at end of year .................................................................................................
Treasury stock:Balance at beginning of year ........................................................................................Net charges in treasury stock ......................................................................................Balance at end of year .................................................................................................
Total .........................................................................................................................
Comprehensive income (loss):Net income ..................................................................................................................Other comprehensive income (loss) (notes 2,3,11 and 18) ...........................................
Total .........................................................................................................................
$1,453,818228,719
—$1,682,537
$ 926,356226,997
——
(14,900)$1,138,453
$ 28,369133
(1,780)$ 26,722
$1,068,785167,038(62,571)
—(133)
16,681$1,189,800
$ (168,585)(317,338)
$ (485,923)
$ (358)(5,308)
$ (5,666)
$3,545,923
$ 167,038(317,338)
$ (150,300)
174,749——
174,749
112,691———
(1,343)111,348
2,6141,180
(384)3,410
108,42130,191(10,691)
—(1,180)
1,727128,468
(81,535)61,271(20,264)
—(43)(43)
397,668
30,19161,27191,462
¥174,74927,492
—¥202,241
¥111,34827,285
——
(1,791)¥136,842
¥ 3,41016
(214)¥ 3,212
¥128,46820,078(7,521)
—(16)
2,005¥143,014
¥ (20,264)(38,144)
¥ (58,408)
¥ (43)(638)
¥ (681)
¥426,220
¥ 20,078(38,144)
¥ (18,066)
Millions of YenThousands ofU.S. dollars(Note 1)
20022003 20032001
See accompanying Notes to Consolidated Financial Statements.
174,721—28
174,749
222,462—28
(109,799)
—112,691
20,243(17,506)
(123)2,614
(89,514)70,507
—109,79917,506
123108,421
(46,587)(34,948)(81,535)
———
316,940
70,507(34,948)35,559
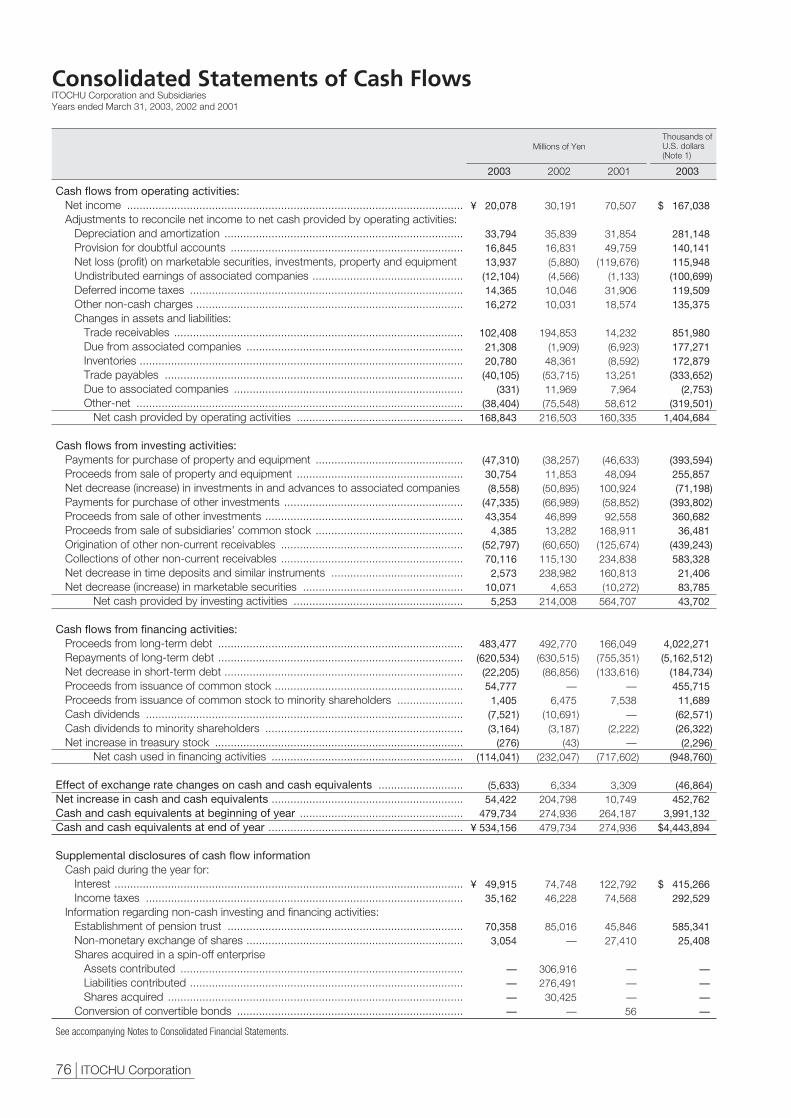
76 | ITOCHU Corporation.
Cash flows from operating activities: Net income ...........................................................................................................Adjustments to reconcile net income to net cash provided by operating activities:
Depreciation and amortization ............................................................................Provision for doubtful accounts ..........................................................................Net loss (profit) on marketable securities, investments, property and equipmentUndistributed earnings of associated companies ................................................Deferred income taxes .......................................................................................Other non-cash charges .....................................................................................Changes in assets and liabilities:
Trade receivables ............................................................................................Due from associated companies .....................................................................Inventories .......................................................................................................Trade payables ...............................................................................................Due to associated companies .........................................................................Other-net ........................................................................................................
Net cash provided by operating activities .....................................................
Cash flows from investing activities: Payments for purchase of property and equipment ...............................................Proceeds from sale of property and equipment .....................................................Net decrease (increase) in investments in and advances to associated companies Payments for purchase of other investments .........................................................Proceeds from sale of other investments ...............................................................Proceeds from sale of subsidiaries’ common stock ...............................................Origination of other non-current receivables ..........................................................Collections of other non-current receivables ..........................................................Net decrease in time deposits and similar instruments ..........................................Net decrease (increase) in marketable securities ...................................................
Net cash provided by investing activities ......................................................
Cash flows from financing activities: Proceeds from long-term debt ..............................................................................Repayments of long-term debt ..............................................................................Net decrease in short-term debt ............................................................................Proceeds from issuance of common stock ............................................................Proceeds from issuance of common stock to minority shareholders .....................Cash dividends .....................................................................................................Cash dividends to minority shareholders ...............................................................Net increase in treasury stock ...............................................................................
Net cash used in financing activities .............................................................
Effect of exchange rate changes on cash and cash equivalents ...........................Net increase in cash and cash equivalents .............................................................Cash and cash equivalents at beginning of year ....................................................Cash and cash equivalents at end of year ..............................................................
Supplemental disclosures of cash flow information Cash paid during the year for:
Interest ...............................................................................................................Income taxes .....................................................................................................
Information regarding non-cash investing and financing activities: Establishment of pension trust ...........................................................................Non-monetary exchange of shares .....................................................................Shares acquired in a spin-off enterprise
Assets contributed ..........................................................................................Liabilities contributed .......................................................................................Shares acquired ..............................................................................................
Conversion of convertible bonds ........................................................................
Consolidated Statements of Cash FlowsITOCHU Corporation and SubsidiariesYears ended March 31, 2003, 2002 and 2001
$ 167,038
281,148140,141115,948(100,699)119,509135,375
851,980177,271172,879(333,652)
(2,753)(319,501)
1,404,684
(393,594)255,857(71,198)
(393,802)360,68236,481
(439,243)583,32821,40683,78543,702
4,022,271(5,162,512)
(184,734)455,71511,689(62,571)(26,322)(2,296)
(948,760)
(46,864)452,762
3,991,132$4,443,894
$ 415,266292,529
585,34125,408
————
30,191
35,83916,831(5,880)(4,566)
10,04610,031
194,853(1,909)
48,361(53,715)11,969(75,548)
216,503
(38,257)11,853(50,895)(66,989)46,89913,282(60,650)
115,130238,982
4,653214,008
492,770(630,515)(86,856)
—6,475
(10,691)(3,187)
(43)(232,047)
6,334204,798274,936479,734
74,74846,228
85,016—
306,916276,49130,425
—
¥ 20,078
33,79416,84513,937(12,104)14,36516,272
102,40821,30820,780(40,105)
(331)(38,404)
168,843
(47,310)30,754(8,558)
(47,335)43,3544,385
(52,797)70,1162,573
10,0715,253
483,477(620,534)(22,205)54,7771,405(7,521)(3,164)
(276)(114,041)
(5,633)54,422
479,734¥ 534,156
¥ 49,91535,162
70,3583,054
————
Millions of YenThousands ofU.S. dollars(Note 1)
2003 20032002
70,507
31,85449,759
(119,676)(1,133)
31,90618,574
14,232(6,923)(8,592)
13,2517,964
58,612160,335
(46,633)48,094
100,924(58,852)92,558
168,911(125,674)234,838160,813(10,272)
564,707
166,049(755,351)(133,616)
—7,538
—(2,222)
—(717,602)
3,30910,749
264,187274,936
122,79274,568
45,84627,410
———56
2001
See accompanying Notes to Consolidated Financial Statements.

Notes to Consolidated Financial StatementsITOCHU Corporation and Subsidiaries
ITOCHU Corporation | 77.
The Company and its subsidiaries in Japan maintain their books ofaccount in conformity with financial accounting standards ofJapan. The consolidated financial statements presented herein areexpressed in yen and have been prepared in a manner that reflectsthe adjustments which are necessary to conform with UnitedStates generally accepted accounting principles (U.S. GAAP).
Supplementary, the Japanese yen amounts as of and for theyear ended March 31, 2003 have also been translated into UnitedStates dollar amounts, solely for the convenience of the reader, atthe rate of ¥120.20=U.S.$1 (official rate of The Bank of Tokyo-Mitsubishi, Ltd.) on March 31, 2003.
2. Summary of Significant Accounting Policies
Description of BusinessITOCHU Corporation is one of the major Japanese “sogo shosha”, orgeneral trading companies. As a “Globally Integrated Corporation”,ITOCHU and its subsidiaries purchase, distribute and market a widevariety of commodities including raw materials, capital goods, andconsumer goods, whether for Japanese domestic trade, trade betweenJapan and other nations, or trade between third-party nations.Approximately 53% of the Company’s total trading transactions in fiscalyear 2003 amounting to ¥10,462 billion ($87,035 million), weregenerated through Japanese domestic trade, with 12% in imports toJapan, 12% in exports from Japan, and 23% in offshore trade. Byprincipal products, total trading transactions were distributed as follows:textile-8%, plant, automobile & industrial machinery-17%, aerospace,electronics & multimedia-8%, energy, metals & minerals-21%,chemicals, forest products & general merchandise-17%, food-24%,and realty & other-5%.
The Company and its subsidiaries not only operate worldwidethrough trading in various commodities but also provide variousservices, such as financing arrangements for customers and suppliers,planning and coordinating industrial projects, and gathering extensiveinformation. To provide these services, ITOCHU operates in a widerange of business activities-developing market potential, providingservices for logistics and transportation and for information andcommunications, engaging in construction, developing resources,functioning as an organizer, investing in the growing high-technologyand multimedia fields, and promoting environmental protection.
Principles of ConsolidationThe consolidated financial statements include the accounts of theCompany and its foreign and domestic subsidiaries. The accounts ofthe subsidiaries are included on the basis of their respective fiscalperiods, which end mainly on or near March 31. Significant transactionsoccurring between subsidiaries’ fiscal year-end (if not March 31) andMarch 31 are properly adjusted in the consolidated financialstatements.
The assessment of whether a company is recognized as a subsidiaryis based on a calculation that includes contributed shares to a pensiontrust in voting shares. The Company maintains the right to vote forcontributed shares to a pension trust, but the right to dispose of them isexecuted by the trustee. This equity in contributed shares to a pensiontrust is included in minority interests in the consolidated financialstatements.
Investments in associated companies (generally companies owned20% to 50%) are recorded at cost plus the companies’ equity inundistributed earnings and losses of such companies since acquisition.The excess of cost over the net assets acquired is allocated toidentifiable assets based on fair values at the date of acquisition. Theunassigned residual value of the excess of the cost over the net assetsis not amortized and is required to be tested for impairment at leastannually.
Trading TransactionsThe Company and certain subsidiaries act as either principal or agentin their trading transactions. Title to and payment for the goods passthrough the companies without physical acquisition and delivery incertain transactions in which the companies act as principal.
Total trading transactions in the consolidated statements of incomeconsist of sales with respect to transactions in which the companiesact as principal, including sales of real estate, and the total amount oftransactions in which the companies act as agent.
Total trading transactions in the consolidated statements of incomeis presented in accordance with Japanese accounting practice, and isnot meant to represent sales or revenues in accordance with U.S.GAAP. Total trading transactions is a non-GAAP measure commonlyused by similar Japanese trading companies and should not beconstrued as equivalent to, or a substitute or proxy for, revenues, oras an indicator of the companies’ operating performance, liquidity orcash flows generated by operating, investing or financing activities.
Gross trading profit represents gross margins with respect totransactions as principal and commissions with respect totransactions as agent.
Income TaxesThe Company and its subsidiaries utilize the asset and liability methodof accounting for income taxes in accordance with Statement ofFinancial Accounting Standards No.109.
Deferred tax assets and liabilities are recognized for the estimatedfuture tax consequences attributable to differences between thefinancial statement carrying amounts of existing assets and liabilitiesand their respective tax bases. Deferred tax assets and liabilities aremeasured using enacted tax rates expected to apply to taxableincome in the years in which those temporary differences areexpected to be recovered or settled. The effect of a change in rateson deferred tax assets and liabilities is recognized in income in theperiod that includes the enactment date.
Cash EquivalentsFor the purpose of the statements of cash flows, the Company andits subsidiaries consider highly liquid investments with insignificant riskof changes in value to be cash equivalents.
Marketable Securities and Other InvestmentsThe Company and its subsidiaries have adopted Statement ofFinancial Accounting Standards No.115, “Accounting for CertainInvestments in Debt and Equity Securities” (SFAS 115). SFAS 115requires that certain investments in debt and equity securities beclassified as held-to-maturity, trading and available-for-sale. Thosesecurities classified as held-to-maturity are reported at amortizedcost. Unrealized holding gains and losses for trading securities areincluded in earnings. Unrealized holding gains and losses for
1. Basis of Financial Statement Presentation and Translation

78 | ITOCHU Corporation.
available-for-sale securities are excluded from earnings and reportedin other comprehensive income (loss) net of taxes. The cost ofsecurities is determined using the average-cost method. Otherinvestments other than marketable securities are stated at cost orless.
InventoriesInventories are stated at the lower of cost or market, cost beingdetermined principally by the specific identification method.
Impaired Loans and Allowance for Doubtful ItemsThe Company and its subsidiaries have measured certain loansbased on the present value of expected future cash flows discountedat the loan’s effective interest rate, or based on the loan’s observablemarket price or the fair value of the collateral if the loan is collateraldependent, and a valuation allowance is created if the measure of theloan is less than the recorded amounts, in accordance withStatement of Financial Accounting Standards No.114 and No.118.
The Company and its subsidiaries have recognized interest incomeon impaired loans principally on a cash basis.
In addition, the allowance for doubtful items was established oncertain loans which were not recognized as impaired at the date ofthe fiscal year-end, determined based on management’s assessmentof past experiences, economic conditions, and other pertinentindicators.
Goodwill and Other Intangible AssetsIn June 2001, the Financial Accounting Standards Board (FASB)issued Statement of Financial Accounting Standards No.141,“Business Combinations” (SFAS 141), and Statement of FinancialAccounting Standards No.142, “Goodwill and Other IntangibleAssets” (SFAS 142). SFAS 141 requires that the purchase method ofaccounting be used for all business combinations completed afterJune 30, 2001. SFAS 141 also specifies the types of acquiredintangible assets that are required to be recognized and reportedseparately from goodwill and those acquired intangible assets that arerequired to be included in goodwill. SFAS 142 requires that goodwillno longer be amortized, but instead tested for impairment at leastannually. SFAS 142 also requires recognized intangible assets beamortized over their respective estimated useful lives and reviewed forimpairment in accordance with Statement of Financial AccountingStandards No.144, “Accounting for the Impairment or Disposal ofLong-Lived Assets” (SFAS 144). Any recognized intangible assetdetermined to have an indefinite useful life is not to be amortized, butinstead tested for impairment in the same manner as goodwill.
The Company and its subsidiaries adopted the provisions of SFAS141 and SFAS 142 on April 1, 2002. SFAS 141 requires to evaluatetheir existing intangible assets and goodwill and to make anynecessary reclassifications in order to conform to new separationrequirements at the date of adoption. The Company and itssubsidiaries accomplished to reassess the useful lives and residualvalues of all intangible assets and make any necessary amortizationperiod adjustments by June 30, 2002. In connection with thetransitional goodwill impairment evaluation, SFAS 142 requires toperform an assessment of whether there was an indication thatgoodwill is impaired as of the date of adoption. To accomplish this,the Company and its subsidiaries (1) identified their reporting units, (2)determined the carrying value of each reporting unit by assigning theassets and liabilities, including the existing goodwill and intangibleassets, to those reporting units, and (3) determined the fair value ofeach reporting unit. To the extent the carrying amount of a reporting
unit exceeded the fair value of the reporting unit, the Company and itssubsidiaries compared the implied fair values of the reporting units’goodwill with the carrying amounts of the reporting units’ goodwill.The implied fair values of goodwill were determined by allocating thefair values of the reporting units to all of the assets (recognized andunrecognized) and liabilities of the reporting units in a manner similarto a purchase price allocation, in accordance with SFAS 141. Theresidual fair value after this allocation was the implied fair values of thereporting units’ goodwill. The Company and its subsidiariesrecognized impairment losses amounting to ¥1,077 million ($8,960thousand) in the year ended March 31, 2003 since the carryingamounts of goodwill exceeded their implied fair values.
Derivative Financial Instruments (prior to adoption of SFAS 133and SFAS 138)Derivative financial instruments are utilized by the Company andcertain subsidiaries to hedge interest rate and foreign exchange risksthat may be adversely affected by changes in interest rates andexchange rates.
Foreign exchange contracts (inclusive of currency swapagreements)Market value gains and losses are recognized on monetary itemsand included in foreign exchange gains or losses.
Interest rate swap agreementsThe amounts of interest income or expense under the swapagreements are accrued and recognized as interest related to theassets and liabilities over the contract period.
Interest rate option agreementsPremiums paid or received for interest rate option agreements areamortized or accumulated to interest expense or interest receivedover the terms of interest rate option agreements.
Derivative Instruments (subsequent to adoption of SFAS 133 andSFAS 138)The Company and its subsidiaries adopted Statement of FinancialAccounting Standards No.133, “Accounting for Derivative Instrumentsand Hedging Activities” (SFAS 133) and Statement of FinancialAccounting Standards No.138,“Accounting for Derivative Instrumentsand Hedging Activities, an Amendment of SFAS 133” (SFAS 138) atthe beginning of the first half of fiscal 2001 on April 1, 2001.
SFAS 133 and SFAS 138 require that all derivative instruments,such as foreign exchange contracts, interest rate swap contracts andcommodity price contracts, be recognized in the financial statementsand measured at fair value, regardless of the purpose or intent forholding them, as either assets or liabilities.
The accounting for changes in cash flow or fair value depends onthe intended use of the derivative instrument and resulting hedgeeffectiveness.
All derivative instruments are recognized on the balance sheet attheir fair value. The Company and its subsidiaries designate andaccount for derivative instruments as follows:
• “Fair value hedge”: a hedge of the fair value of a recognized asset orliability or of an unrecognized firm commitment. The changes in fairvalue of recognized assets or liabilities or unrecognized firmcommitments and related derivative instruments that are designatedand qualify as fair value hedges are recorded in earnings if thehedges are considered highly effective.

ITOCHU Corporation | 79.
• “Cash flow hedge”: a hedge of the variability of cash flow to bereceived or paid related to an unrecognized forecast transaction ora recognized asset or liability. The changes in fair value of derivativeinstruments that are designated and qualify as cash flow hedges arerecorded in accumulated other comprehensive income (loss) if thehedges are considered highly effective.
This treatment is continued until earnings are affected by thevariability in cash flows to be received or paid related to theunrecognized forecast transactions or the recognized assets orliabilities designated as the hedged items. The ineffective portion ofthe hedge is reported in earnings.
• “Foreign currency hedge”: a hedge of foreign-currency fair value orcash flow. The changes in fair value or cash flow of recognizedassets or liabilities, unrecognized firm commitments or forecasttransactions and derivatives that are designated and qualify asforeign-currency fair value or cash flow hedges are recorded ineither earnings or accumulated other comprehensive income (loss) ifthe hedges are considered highly effective.
Recognition in earnings or accumulated other comprehensiveincome (loss) is dependent on the treatment of foreign currencyhedges as fair value hedges or cash flow hedges.
The Company and its subsidiaries meet the documentationrequirements as prescribed by SFAS 133 and SFAS 138, whichinclude their risk-management objective and strategy for undertakingvarious hedge transactions.
In addition, a formal assessment is made at the hedge’s inceptionand periodically on an on-going basis, as to whether the derivativesused in hedging activities are highly effective in off-setting changes infair values or cash flows of hedged items.
Hedge accounting is discontinued for ineffective hedges, if any. Thechanges in fair value of derivative instruments related to discontinuedhedges are recognized in earnings currently. The changes in fair valueof derivative instruments for trading purposes are recorded in earnings.
Costs Associated with Exit or Disposal ActivitiesIn June 2002, the FASB issued Statement of Financial AccountingStandards No.146, “Accounting for Costs Associated with Exit orDisposal Activities” (SFAS 146). SFAS 146 requires that a liability berecognized for those costs related to exit or disposal activitiesperformed after December 31, 2002 only when the liability is incurred,that is, when it meets the definition of a liability in the conceptualframework of the FASB. SFAS 146 also establishes fair value as theobjective for initial measurement of liabilities related to exit or disposalactivities. The adoption of SFAS 146 did not have a material effect onthe consolidated financial position and results of operations.
Issuance of Stock by Subsidiaries or Associated CompaniesWith respect to such transactions as a subsidiary or an associatedcompany issuing its shares to third parties, the resulting gains orlosses arising from the change in interest of the Company arerecorded in income or loss for the period when such shares areissued.
DepreciationDepreciation of property and equipment (including property leased toothers) is computed principally by the straight-line method using ratesbased upon the estimated useful lives of the related units of property.
Net Income (Loss) Per Ten SharesNet income (loss) per ten shares is computed based on the weightedaverage number of shares of common stock outstanding. Diluted netincome (loss) per ten shares is computed reflecting potentially dilutivesecurities.
Comprehensive Income (Loss)The Company and its subsidiaries have adopted Statement ofFinancial Accounting Standards No.130, “Reporting ComprehensiveIncome” (SFAS 130). This statement establishes standards for thereporting and display of comprehensive income (loss) and itscomponents (revenues, expenses, gains and losses) in a full set ofgeneral-purpose financial statements and requires that all items bereported in a financial statement that is displayed with the sameprominence as other financial statements. Comprehensive income(loss) consists of net income (loss), foreign currency translationadjustments, change in minimum pension liability adjustments,change in net unrealized gains or losses on marketable securities andother investments, and change in net unrealized gains or losses onderivative instruments.
GuaranteesIn November 2002, the FASB issued FASB Interpretation No.45,“Guarantor’s Accounting and Disclosure Requirements forGuarantees, Including Indirect Guarantees of Indebtedness of Others”(FIN 45). FIN 45 requires that a liability be recorded in the guarantor’sbalance sheet upon issuance of a guarantee. The Company and itssubsidiaries adopted the recognition provisions of FIN 45 prospectivelyto guarantees issued after December 31, 2002. The disclosuresrelated to guarantees are shown in Note 22 “Contingent Liabilities”.
Variable Interest EntitiesIn January 2003, the FASB issued FASB Interpretation No.46,“Consolidation of Variable Interest Entities” (FIN 46). FIN 46 defines theentities of which equity has specified characteristics as variable interestentities, and also requires that the primary beneficiary which owns amajority of the variable interests consolidate the variable interestentities. Variable interests are rights and obligations that conveyeconomic gains or losses from changes in the values of the variableinterest entities’ assets and liabilities. The Company and itssubsidiaries adopted FIN 46 for variable interest entities establishedafter January 31, 2003, and will also adopt FIN 46 on July 1, 2003 forvariable interest entities established before February 1, 2003. Onadoption of FIN 46, the Company and its subsidiaries have no materialmatters to disclose as of March 31, 2003.
Use of EstimatesManagement of the Company has made a number of estimates andassumptions that affect the reported amounts of assets, liabilities,revenues and expenses, and the disclosure of contingent assets andliabilities to prepare these financial statements in conformity withgenerally accepted accounting principles. Actual results could differfrom those estimates.
Change in Presentation on the Consolidated Statements ofIncome“Minority interests”, which were previously included in “Other-net”, havebeen separately stated below “Income taxes” in the consolidatedstatements of income since fiscal year 2003. Accordingly, theconsolidated statements of income before fiscal year 2002 have beenrestated.

80 | ITOCHU Corporation.
New Accounting StandardsIn June 2001, the FASB issued Statement of Financial AccountingStandards No.143, “Accounting for Asset Retirement Obligations”(SFAS 143), which addresses financial accounting and reporting forobligations associated with the retirement of tangible long-lived assetsand the associated asset retirement costs. SFAS 143 applies to legalobligations associated with the retirement of long-lived assets thatresult from the acquisition, construction, development and (or) normaluse of the asset. SFAS 143 requires that the fair value of a liability foran asset retirement obligation be recognized in the period in which it isincurred if a reasonable estimate of fair value can be made. TheCompany and its subsidiaries will adopt the provision of SFAS 143 onApril 1, 2003. Currently, the effect on consolidated financialstatements by adopting SFAS 143 has not been reasonablyestimated.
In April 2002, the FASB issued Statement of Financial AccountingStandards No.145, “Rescission of FASB Statements No.4, 44, and64, Amendment of FASB Statement No.13 and TechnicalCorrections” (SFAS 145). SFAS 145 amends or rescinds a part of theexisting Statements of Financial Accounting Standards, and alsoamends other existing authoritative pronouncements to make varioustechnical corrections. The Company and its subsidiaries will adopt theprovision of SFAS 145 on April 1, 2003. Currently, the effect onconsolidated financial statements by adopting SFAS 145 has not beenreasonably estimated.
In January 2003, the Emerging Issues Task Force reached a finalconsensus on Issue 03-2, “Accounting for the Transfer to theJapanese Government of the Substitutional Portion of Employee
Pension Fund Liabilities” (EITF 03-2). EITF 03-2 addresses accountingfor a transfer to the Japanese government of a substitutional portionof an Employees’ Pension Fund plan (EPF) which is a defined benefitpension plan established under the Welfare Pension Insurance Law.EITF 03-2 requires employers to account for the entire separationprocess of a substitutional portion from an entire plan (including acorporate portion) upon completion of the transfer to the governmentof the substitutional portion of the benefit obligation and related planassets as the culmination of a series of steps in a single settlementtransaction. Under this approach, the difference between the fairvalue of the obligation and the assets required to be transferred to thegovernment should be accounted for and separately disclosed as asubsidy. In March 2003, the applications which were submitted bythe Company, were approved by the government for an exemptionfrom the obligation to pay benefits for future employee service relatedto the substitutional portion. The Company plans to submit anotherapplication for separation of the remaining substitutional portion (thatis, the benefit obligation related to past services) during fiscal year2003. After this application is approved by the government, theremaining benefit obligation of the substitutional portion (that amountearned by past services) as well as the related government-specifiedportion of the plan assets of the EPF will be transferred to thegovernment. The Company anticipates that this transfer will have amaterial impact on the consolidated financial statements, however,the specific amounts can not be confirmed at the moment, becausethe impact will vary depending on the application date and otherpremises.
3. Marketable Securities and Investments
Marketable securities and investments consist of trading, available-for-sale and held-to-maturity securities. The cost, gross unrealizedholding gains, gross unrealized holding losses, and fair value for such securities by major security type as of March 31, 2003 and 2002were as follows:
Current:Trading:
Equity securities ...........................................................................................................Debt securities .............................................................................................................
Available-for-sale:Equity securities ...........................................................................................................Debt securities .............................................................................................................
Held-to-maturity:Debt securities .............................................................................................................
Non-current:Available-for-sale:
Equity securities ...........................................................................................................Debt securities .............................................................................................................
Held-to-maturity:Debt securities .............................................................................................................
30,7513,663
34,414
— 6,4656,465
—
149,05911,879
160,938
849
76— 76
— 580580
—
15,80124
15,825
—
1,559—
1,559
— 11
—
18,08654
18,140
—
¥ 29,2683,663
¥ 32,931
¥ — 7,044
¥ 7,044
¥ —
¥146,77411,849
¥158,623
¥ 849
Millions of Yen
Cost
GrossUnrealizedHoldingGains
GrossUnrealizedHoldingLosses
Fair Value
2003

ITOCHU Corporation | 81.
Current:Trading:
Equity securities ...........................................................................................................Debt securities .............................................................................................................
Available-for-sale:Equity securities ...........................................................................................................Debt securities .............................................................................................................
Held-to-maturity:Debt securities .............................................................................................................
Non-current:Available-for-sale:
Equity securities ...........................................................................................................Debt securities .............................................................................................................
Held-to-maturity:Debt securities .............................................................................................................
40,1643,441
43,605
—897897
6,590
223,76231,398
255,160
420
17—17
———
73
20,5151,817
22,332
—
4,071—
4,071
—1010
—
58,06842
58,110
—
¥ 36,1103,441
¥ 39,551
¥ —887
¥ 887
¥ 6,663
¥186,20933,173
¥219,382
¥ 420
Millions of Yen
Cost
GrossUnrealizedHoldingGains
GrossUnrealizedHoldingLosses
Fair Value
2002
Current:Trading:
Equity securities ...........................................................................................................Debt securities .............................................................................................................
Available-for-sale:Equity securities ...........................................................................................................Debt securities .............................................................................................................
Held-to-maturity:Debt securities .............................................................................................................
Non-current:Available-for-sale:
Equity securities ...........................................................................................................Debt securities .............................................................................................................
Held-to-maturity:Debt securities .............................................................................................................
255,83230,474
286,306
—53,78553,785
—
1,240,09298,826
1,338,918
7,063
632—
632
—4,8254,825
—
131,456200
131,656
—
12,970—
12,970
—88
—
150,466449
150,915
—
$ 243,49430,474
$ 273,968
$ —58,602
$ 58,602
$ —
$1,221,08298,577
$1,319,659
$ 7,063
Thousands of U.S. dollars
Cost
GrossUnrealizedHoldingGains
GrossUnrealizedHoldingLosses
Fair Value
2003

Available-for-sale:Due within one year .....................................................................................................Due after one year through five years ...........................................................................Due after five years ......................................................................................................Equity securities ...........................................................................................................
Held-to-maturity:Due within one year .....................................................................................................Due after one year through five years ...........................................................................Due after five years ......................................................................................................
53,78549,19349,633
1,240,0921,392,703
— 3,8683,1957,063
$ 58,60248,86049,717
1,221,082$1,378,261
$ — 3,8683,195
$ 7,063
6,4655,9135,966
149,059167,403
— 465384849
¥ 7,0445,8735,976
146,774¥165,667
¥ — 465384
¥ 849
Millions of Yen
Cost Fair Value Cost Fair Value
Thousands of U.S. dollars
Securities ...........................................................................................................................................Long-term deposits ...........................................................................................................................Insurance reserve, etc. .......................................................................................................................
$2,041,689354,343428,652
$2,824,684
343,56739,77839,156
422,501
¥245,41142,59251,524
¥339,527
Millions of YenThousands ofU.S. dollars
2003 20032002
The contractual maturities of marketable securities and investments classified as available-for-sale and held-to-maturity as of March 31,2003 were as follows:
The gross realized gains and losses on sale of available-for-salesecurities for the years ended March 31, 2003, 2002 and 2001were gains of ¥20,028 million ($166,622 thousand), ¥19,428
million and ¥16,894 million, and losses of ¥9,319 million ($77,529thousand), ¥1,450 million and ¥6,933 million, respectively.
Other investments at March 31, 2003 and 2002 consisted of the following:
4. Other Investments
82 | ITOCHU Corporation.
Current assets ........................................................................................................Other assets, principally property and equipment ....................................................
Current liabilities ......................................................................................................Other liabilities, principally long-term debt ...............................................................Net assets ..............................................................................................................
$14,081,47316,203,59430,285,06713,181,59810,754,201
$ 6,349,268
1,576,4051,948,9613,525,3661,498,0271,281,534
745,805
¥1,692,5931,947,6723,640,2651,584,4281,292,655
¥ 763,182
Millions of YenThousands ofU.S. dollars
2003 20032002
5. Investments in Associated Companies
Certain financial information in respect of associated companies as of March 31, 2003 and 2002, and for the years ended March 31,2003, 2002 and 2001 was shown below:
Net sales ................................................................................................................Net earnings ...........................................................................................................Companies’ equity in net earnings ..........................................................................Cash dividends received by the companies ............................................................
$38,238,453360,957154,23553,536
3,021,77640,19211,3626,796
¥4,596,26243,38718,5396,435
Millions of YenThousands ofU.S. dollars
2003 20032002 2001
2,305,65125,3955,2254,092
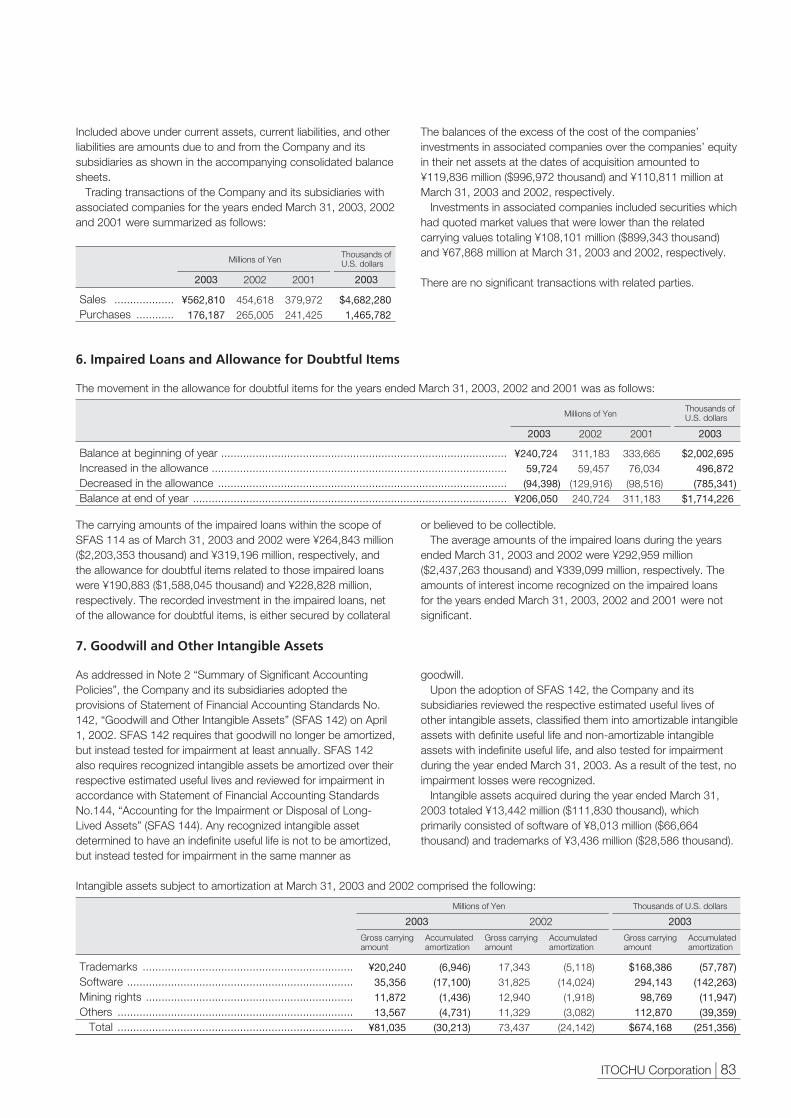
ITOCHU Corporation | 83.
Sales ...................Purchases ............
$4,682,2801,465,782
454,618265,005
¥562,810176,187
Millions of YenThousands ofU.S. dollars
2003 20032002
379,972241,425
2001
Included above under current assets, current liabilities, and otherliabilities are amounts due to and from the Company and its subsidiaries as shown in the accompanying consolidated balancesheets.
Trading transactions of the Company and its subsidiaries withassociated companies for the years ended March 31, 2003, 2002and 2001 were summarized as follows:
The balances of the excess of the cost of the companies’investments in associated companies over the companies’ equityin their net assets at the dates of acquisition amounted to¥119,836 million ($996,972 thousand) and ¥110,811 million atMarch 31, 2003 and 2002, respectively.
Investments in associated companies included securities whichhad quoted market values that were lower than the relatedcarrying values totaling ¥108,101 million ($899,343 thousand)and ¥67,868 million at March 31, 2003 and 2002, respectively.
There are no significant transactions with related parties.
Balance at beginning of year ...........................................................................................Increased in the allowance ..............................................................................................Decreased in the allowance ............................................................................................Balance at end of year ....................................................................................................
$2,002,695 496,872 (785,341)
$1,714,226
311,18359,457
(129,916)240,724
333,66576,034(98,516)
311,183
¥240,724 59,724 (94,398)
¥206,050
Millions of YenThousands ofU.S. dollars
2003 20032002 2001
6. Impaired Loans and Allowance for Doubtful Items
The movement in the allowance for doubtful items for the years ended March 31, 2003, 2002 and 2001 was as follows:
Intangible assets subject to amortization at March 31, 2003 and 2002 comprised the following:
The carrying amounts of the impaired loans within the scope ofSFAS 114 as of March 31, 2003 and 2002 were ¥264,843 million($2,203,353 thousand) and ¥319,196 million, respectively, andthe allowance for doubtful items related to those impaired loanswere ¥190,883 ($1,588,045 thousand) and ¥228,828 million,respectively. The recorded investment in the impaired loans, netof the allowance for doubtful items, is either secured by collateral
or believed to be collectible.The average amounts of the impaired loans during the years
ended March 31, 2003 and 2002 were ¥292,959 million($2,437,263 thousand) and ¥339,099 million, respectively. Theamounts of interest income recognized on the impaired loansfor the years ended March 31, 2003, 2002 and 2001 were not significant.
7. Goodwill and Other Intangible Assets
As addressed in Note 2 “Summary of Significant AccountingPolicies”, the Company and its subsidiaries adopted theprovisions of Statement of Financial Accounting Standards No.142, “Goodwill and Other Intangible Assets” (SFAS 142) on April1, 2002. SFAS 142 requires that goodwill no longer be amortized,but instead tested for impairment at least annually. SFAS 142also requires recognized intangible assets be amortized over theirrespective estimated useful lives and reviewed for impairment inaccordance with Statement of Financial Accounting StandardsNo.144, “Accounting for the Impairment or Disposal of Long-Lived Assets” (SFAS 144). Any recognized intangible assetdetermined to have an indefinite useful life is not to be amortized,but instead tested for impairment in the same manner as
goodwill.Upon the adoption of SFAS 142, the Company and its
subsidiaries reviewed the respective estimated useful lives ofother intangible assets, classified them into amortizable intangibleassets with definite useful life and non-amortizable intangibleassets with indefinite useful life, and also tested for impairmentduring the year ended March 31, 2003. As a result of the test, noimpairment losses were recognized.
Intangible assets acquired during the year ended March 31,2003 totaled ¥13,442 million ($111,830 thousand), whichprimarily consisted of software of ¥8,013 million ($66,664thousand) and trademarks of ¥3,436 million ($28,586 thousand).
Trademarks ...................................................................Software ........................................................................Mining rights ..................................................................Others ...........................................................................
Total ...........................................................................
(6,946)(17,100)(1,436)(4,731)
(30,213)
¥20,24035,35611,87213,567
¥81,035
Thousands of U.S. dollars
20032003
Accumulatedamortization
(5,118)(14,024)(1,918)(3,082)
(24,142)
Accumulatedamortization
Gross carryingamount
17,34331,82512,94011,32973,437
2002
Gross carryingamount
(57,787)(142,263)(11,947)(39,359)
(251,356)
Accumulatedamortization
$168,386294,14398,769
112,870$674,168
Gross carryingamount
Millions of Yen

84 | ITOCHU Corporation.
The aggregate amortization expense for intangible assets for theyear ended March 31, 2003 was ¥9,800 million ($81,531thousand). The estimated aggregate amortization expense forintangible assets for the next five years is as follows:
Upon the adoption of SFAS 142, the Company and itssubsidiaries ceased amortization of goodwill on April 1, 2002, andtested for impairment during the year ended March 31, 2003. Asa result, impairment losses amounting to ¥1,077 million ($8,960
Net income and net income per ten shares for the years endedMarch 31, 2003, 2002 and 2001 when adjusted to exclude theamortization expense related to goodwill and non-amortizable
intangible assets, which were previously incurred based on theaccounting standard prior to the adoption of SFAS 142, were asfollows:
The changes in the carrying amount of goodwill by operating segment for the year ended March 31, 2003 were as follows:
The carrying amount of intangible assets not subject toamortization with indefinite useful life at March 31, 2003 and2002 comprised the following:
2004 .....................................2005 .....................................2006 .....................................2007 .....................................2008 ....................................
¥9,2988,0797,1464,1923,153
Millions of Yen
$77,35467,21359,45134,87526,231
Thousands of U.S. dollars
Leasehold ...............................Trademarks and others ..........
Total ....................................
$ 9,30931,165
$40,474
4,8403,8918,731
¥1,1193,746
¥4,865
Millions of YenThousands ofU.S. dollars
2003 20032002
Balance at March 31, 2002 ............................................Acquired ......................................................................Impairment losses .......................................................Others .........................................................................
Balance at March 31, 2003 ............................................
123,61532,831(1,077)(6,386)
148,983
4,0821,667(1,077)
(397)4,275
84,85428,868
—20
113,742
28,845783
—(5,767)
23,861
—1,358
—4
1,362
¥2,626155
—(246)
¥2,535
3,208———
3,208
Millions of Yen
TotalOtherFood
Chemicals,Forest Products &GeneralMerchandise
Energy,Metals &Minerals
Aerospace,Electronics &Multimedia
Plant,Automobile &IndustrialMachinery
Net income .........................................................................................Add back:
Goodwill amortization ......................................................................Intangible assets amortization ..........................................................
Adjusted net income ..........................................................................
$167,038
——
$167,038
30,191
3,608247
34,046
Millions of Yen Thousands of U.S. dollars
2002
70,507
3,158208
73,873
2001
251,173
30,0172,055
283,245
2002
586,581
26,2731,730
614,584
2001
¥20,078
——
¥20,078
2003 2003
Net income per ten shares .................................................................Add back:
Goodwill amortization ......................................................................Intangible assets amortization ..........................................................
Adjusted net income per ten shares ...................................................
$1.09
——
$1.09
212
252
239
Yen U.S. dollars
2002
495
221
518
2001
1.76
0.210.021.99
2002
4.12
0.180.014.31
2001
¥131
——
¥131
2003 2003
Years ending March 31
thousand) were recognized in the year ended March 31, 2003since the carrying amounts of goodwill exceeded the implied fairvalues.
Balance at March 31, 2002 ............................................Acquired ......................................................................Impairment losses .......................................................Others .........................................................................
Balance at March 31, 2003 ............................................
1,028,411273,136
(8,960)(53,128)
1,239,459
33,96013,868(8,960)(3,303)
35,565
705,940240,166
—167
946,273
239,9756,514
—(47,978)
198,511
—11,298
—33
11,331
$21,8471,290
—(2,047)
$21,090
26,689———
26,689
Thousands of U.S. dollars
TotalOtherFood
Chemicals,Forest Products &GeneralMerchandise
Energy,Metals &Minerals
Aerospace,Electronics &Multimedia
Plant,Automobile &IndustrialMachinery
Note: Others primarily consists of translation adjustments and reclassification from (to) other accounts.

ITOCHU Corporation | 85.
Cash and cash equivalents and time deposits ....................................................................................Marketable securities .........................................................................................................................Trade receivables ...............................................................................................................................Inventories .........................................................................................................................................Investments and non-current receivables ...........................................................................................Property and equipment, at cost ........................................................................................................
$ 333549
506,19812,229
1,169,143936,714
$2,625,166
2,26960
111,9597,374
283,944133,783539,389
¥ 4066
60,8451,470
140,531112,593
¥315,545
Millions of YenThousands ofU.S. dollars
2003 20032002
8. Pledged Assets
The following assets were pledged as collateral at March 31, 2003 and 2002:
Collateral was pledged to secure the following obligations at March 31, 2003 and 2002:
In addition, acceptances payable were secured by trust receiptson merchandise and the proceeds from the sale thereof. Theamount of such assets pledged was not calculable.
Both short-term and long-term loans are generally madepursuant to agreements which customarily provide that, upon therequest of the lender, collateral or guarantors (or additionalcollateral or guarantors) will be furnished with respect to the loansunder certain circumstances, and that the lender may treat any
collateral, whether furnished for specific loans or otherwise, ascollateral for present and future indebtedness to such lender. Asubstantial portion of the companies’ bank loan agreements alsoprovide that the lending bank has the right to offset cash of thecompanies deposited with it against any debt (including debtarising out of contingent obligations) of the companies to thebank that has become due at stated maturity or earlier.
9. Impairment of Long-lived Assets
The Company and its subsidiaries recognized impairment lossesof ¥2,150 million ($17,887 thousand), ¥6,992 million and ¥5,679million for the years ended March 31, 2003, 2002 and 2001,respectively, which were included in the profit (loss) on propertyand equipment-net account. The impaired assets includeddomestic commercial buildings for rent and domestic buildingsfor self-use.
The Company also recognized impairment losses of ¥583
million ($4,850 thousand) and ¥11,888 million for the years endedMarch 31, 2003 and 2001, respectively, which were included inthe profit (loss) on disposal of investments and marketablesecurities, net of write-downs account. The impaired assetsincluded certain domestic land for development purpose.
Fair value was based on appraisals or estimates of valuationbased on mainly road rating price for land and replacement costfor buildings and structures.
10. Short-term and Long-term Debt
Short-term debt at March 31, 2003 and 2002 consisted of the following:
Short-term debt .................................................................................................................................Long-term debt ..................................................................................................................................Guarantees of contracts, etc. .............................................................................................................
$ 169,8841,854,459
502,820$2,527,163
18,581421,00584,249
523,835
¥ 20,420222,90660,439
¥303,765
Millions of YenThousands ofU.S. dollars
2003 20032002
Short-term loans, mainly from banks ..................................................................................................Commercial paper .............................................................................................................................
$3,869,451—
$3,869,451
494,61610,000
504,616
¥465,108—
¥465,108
Millions of YenThousands ofU.S. dollars
2003 20032002

86 | ITOCHU Corporation.
Banks and financial institutions: Secured:
Japan Bank for International Cooperation, due 2002-2013, interest mainly 1%-7% ............................................................................
Other, due 2002-2015, interest mainly 1%-9% ............................................................................
Unsecured: Due 2002-2023,
interest mainly 0%-15% ....................................................................................................Debentures:
Unsecured bonds and notes: Issued in 1996, 3.00% Yen Bonds due 2002 ....................................................................Issued in 1996, 3.15% Yen Bonds due 2003 ....................................................................Issued in 1997, 2.45% Yen Bonds due 2009 ....................................................................Issued in 1998, 2.45% Yen Bonds due 2003 ....................................................................Issued in 1998, 3.10% Yen Bonds due 2008 ....................................................................Issued in 1998, 2.00% Yen Bonds due 2002 ....................................................................Issued in 1998, 3.00% Yen Bonds due 2008 ....................................................................Issued in 1999, 2.00% Yen Bonds due 2003 ....................................................................Issued in 1999, 2.00% Yen Bonds due 2003 ....................................................................Issued in 1999, 2.20% Yen Bonds due 2004 ....................................................................Issued in 1999, 1.93% Yen Bonds due 2004 ....................................................................Issued in 1999, 1.93% Yen Bonds due 2004 ....................................................................Issued in 1999, 2.13% Yen Bonds due 2004 ....................................................................Issued in 1999, 3.19% Yen Bonds due 2009 ....................................................................Issued in 2001, 1.00% Yen Bonds due 2005 ....................................................................Issued in 2001, 1.00% Yen Bonds due 2005 ....................................................................Issued in 2001, 0.84% Yen Bonds due 2005 ....................................................................Issued in 2001, 1.02% Yen Bonds due 2006 ....................................................................Issued in 2002, 0.84% Yen Bonds due 2005 ....................................................................Issued in 2003, 0.84% Yen Bonds due 2006 ....................................................................Issued in and after 1998,
Medium-Term Notes etc., maturing through 2009 ......................................................
Others .......................................................................................................................................
Less current installments ...........................................................................................................
$ 580,699
1,273,760
12,326,606
— 166,38983,195
582,363249,584
— 83,195
166,389249,58483,19583,19575,70683,19583,195
166,389249,58483,19583,19583,19583,195
629,350
452,87018,001,2234,374,634
$13,626,589
111,827
309,178
1,373,099
50,00020,00010,00070,00030,00010,00010,00020,00030,00010,00010,0009,100
10,00010,00020,00030,00010,00010,000
— —
126,911
60,3082,350,423
486,7941,863,629
¥ 69,800
153,106
1,481,658
— 20,00010,00070,00030,000
— 10,00020,00030,00010,00010,0009,100
10,00010,00020,00030,00010,00010,00010,00010,000
75,648
54,4352,163,747
525,831¥1,637,916
Millions of YenThousands ofU.S. dollars
2003 20032002
2004 .................................................2005 .................................................2006 .................................................2007 .................................................2008 .................................................2009 and thereafter ..........................
$ 4,374,6342,962,1634,005,2662,743,8941,580,4162,334,850
$18,001,223
¥ 525,831356,052481,433329,816189,966280,649
¥2,163,747
Millions of YenYears ending March 31Thousands ofU.S. dollars
Long-term debt at March 31, 2003 and 2002 was summarized below:
Certain agreements with Japan Bank for International Cooperationrequire that the Company, upon request of the lender, apply all or aportion of its operating income or the proceeds from the sale of anydebentures or common stock to the reduction of outstanding loanswhen the lender considers that the Company is able to reduce suchloans through increased earnings or otherwise and further provide thatthe lender may request that any proposed distribution of earnings besubmitted to the lender for review and approval before presentation tothe stockholders. The Company has never received such a requestand does not expect that any such request will be made.
The Company and certain subsidiaries have entered into interestrate swap agreements for certain long-term debts as a means ofmanaging their interest rate exposure. The total long-term debtshedged by such swap agreements were ¥1,108,184 million($9,219,501 thousand) and ¥1,598,260 million at March 31, 2003 and2002, respectively.
Reference is made to note 8 for a description of collateral andcertain customary provisions of long-term and short-term bank loanagreements relating to collateral and other rights of such lenders.
The aggregate annual maturities of long-term debt after March 31,2003 are as follows:

ITOCHU Corporation | 87.
Change in benefit obligations: Projected benefit obligations at beginning of year ...................................................................Service cost ...........................................................................................................................Interest cost ...........................................................................................................................Plan participants’ contributions ..............................................................................................Actuarial loss .........................................................................................................................Benefits paid ..........................................................................................................................Foreign currency translation adjustments ...............................................................................Other .....................................................................................................................................Projected benefit obligation at end of year .............................................................................
Change in plan assets: Fair value of plan assets at beginning of year .........................................................................Actual return on plan assets ...................................................................................................Employer contributions ..........................................................................................................Plan participants’ contributions ..............................................................................................Benefits paid ..........................................................................................................................Foreign currency translation adjustments ...............................................................................Other .....................................................................................................................................Fair value of plan assets at end of year ...................................................................................
Projected benefit obligations in excess of plan assets ...............................................................Unrecognized actuarial loss ......................................................................................................Unrecognized prior service cost arising from changes in pension plans .....................................Net amount recognized ............................................................................................................
Adjustments to recognize minimum pension liability:Accumulated other comprehensive loss, gross of tax .............................................................
Net amount recognized in the consolidated balance sheets ......................................................Prepaid pension cost ................................................................................................................Accrued retirement and severance benefits recognized in the consolidated balance sheets ......
Actuarial present value of accumulated benefit obligations at end of year ..................................Actuarial assumptions:
Discount rate .........................................................................................................................Expected long-term rate of return on plan assets ...................................................................
$2,724,459 91,240 65,141 13,677 (20,083)(73,145)
1,165 (5,066)
2,797,388
2,605,965 (712,787)733,736 13,677 (73,145)
(566)(3,635)
2,563,245 234,143
(2,181,897)228,087
(1,719,667)
27,912 (1,691,755)(1,877,970)
186,215
$2,705,474
272,335 10,868 8,996 1,457
46,423 (10,615)
333 (2,317)
327,480
217,996 (24,857)
130,168 1,457
(10,615)285
(1,197)313,237 14,243
(184,774)30,157
(140,374)
1,619 (138,755)(157,121)
18,366
320,901
2.40%3.50%
¥ 327,480 10,967 7,830 1,644 (2,414)(8,792)
140 (609)
336,246
313,237 (85,677)88,195 1,644 (8,792)
(68)(437)
308,102 28,144
(262,264)27,416
(206,704)
3,355 (203,349)(225,732)
22,383
¥ 325,198
2.40%3.50%
Millions of YenThousands ofU.S. dollars
2003 20032002
11. Retirement and Severance Benefits
The Company and certain subsidiaries have funded retirementpension plans covering substantially all of their employees.Benefits under these pension plans are based on length ofservice and certain other factors and plan assets are comprisedprimarily of listed stock, bonds and other interest-bearing
securities.Certain other subsidiaries have unfunded retirement and
severance plans providing lump-sum payment benefits to theiremployees.
Changes in the benefit obligations and the fair value of the plan assets for the years ended March 31, 2003 and 2002 were as follows:
Service cost-benefits earned during the year .........................................................................Interest cost on projected benefit obligation ...........................................................................Expected return on plan assets .............................................................................................Net amortization ....................................................................................................................
Net periodic pension cost ...................................................................................................
$ 91,24065,141(58,286)90,923
$189,018
10,8688,996(6,576)6,104
19,392
¥10,9677,830(7,006)
10,929¥22,720
Millions of YenThousands ofU.S. dollars
2003 20032002
9,2818,502(6,601) 1,196
12,378
2001
The net cost of retirement and severance benefits for the years ended March 31, 2003, 2002 and 2001 consisted of the following:
Employer contributions for the years ended March 31, 2003 and2002 included contribution of equity securities to an employeepension trust. The fair value of those securities at the time of
contribution was ¥54,761 million ($455,582 thousand) and¥85,016 million for the years ended March 31, 2003 and 2002,respectively.

88 | ITOCHU Corporation.
Japanese normal income tax rate ....................................................................................................................Expenses not deductible for tax purposes .......................................................................................................Difference of tax rates for foreign subsidiaries ..................................................................................................Tax benefits not recognized on operating losses of subsidiaries ......................................................................Tax on dividends .............................................................................................................................................Effect on deferred tax assets and deferred tax liabilities from a change in the tax regulations ...........................Deduction for foreign taxes ..............................................................................................................................Other ...............................................................................................................................................................
42.0%2.6(3.0)1.5
10.0—
6.71.9
61.7%
42.0%2.8(3.0)(3.6)
20.53.85.3
11.479.2%
2003 2002
42.0%2.2(1.5)1.65.7—
2.44.8
57.2%
2001
Deferred tax assets:Inventories, property and equipment ......................................................................................Allowance for doubtful accounts ............................................................................................Net operating loss carryforwards ...........................................................................................Accrued retirement and severance benefits ...........................................................................Marketable securities and other investments ..........................................................................Other .....................................................................................................................................Total gross deferred tax assets ..............................................................................................Less valuation allowance ........................................................................................................Net deferred tax assets ..........................................................................................................
Deferred tax liabilitiesInstallment sales ....................................................................................................................Accrued retirement and severance benefits ...........................................................................Marketable securities and other investments ..........................................................................Other .....................................................................................................................................Total gross deferred tax liabilities ...........................................................................................
Net deferred tax assets .............................................................................................................
$ 400,940526,223461,01544,642
363,361304,310
2,100,491(498,852)
1,601,639
(7,097)(467,537)
(7,421)(198,453)(680,508)
$ 921,131
¥ 48,19363,25255,4145,366
43,67636,578
252,479(59,962)
192,517
(853)(56,198)
(892)(23,854)(81,797)
¥110,720
Millions of YenThousands ofU.S. dollars
2003 20032002
54,62373,32948,7813,875
38,70017,929
237,237(51,919)
185,318
(1,223)(51,320)(14,936)(8,372)
(75,851)
109,467
12. Foreign Exchange Gains and Losses
Net foreign exchange losses of ¥5,164 million ($42,962 thousand),gains of ¥10,108 million and ¥11,967 million for the years ended
March 31, 2003, 2002 and 2001, respectively, were included inthe accompanying consolidated statements of income.
13. Income Taxes
The Company and its domestic subsidiaries are subject to anumber of taxes based on income, which in aggregate result in anormal tax rate of approximately 42%.
In accordance with a change in the tax regulations in fiscal2003, the normal tax rate decreases to 41% in aggregate witheffect for the fiscal year ended March 31, 2005.
Foreign subsidiaries are subject to income taxes of the
countries where they operate.The Company adopted a consolidated taxation system in fiscal
2003. A reconciliation of the Japanese normal tax rate and the
effective tax rate as a percentage of income before income taxes,minority interests and equity in earnings (losses) was as follows:
The tax effects of temporary differences that give rise to significant portions of deferred tax assets and deferred tax liabilities at March 31,2003 and 2002 were presented below:
The net changes in the total valuation allowance for the yearsended March 31, 2003, 2002 and 2001 were an increase of¥8,043 million ($66,913 thousand), and decreases of ¥3,104million, ¥19,998 million, respectively.
Net operating loss carryforwards are available to reduce futureincome taxes. A certain portion of the net operating losses willexpire by 2008 and the remainder may be utilized indefinitely.
Income taxes have not been accrued on a part of undistributedearnings of foreign affiliated companies in the amount of ¥27,627million ($229,842 thousand), ¥35,163 million and ¥36,005 millionat March 31, 2003, 2002 and 2001, respectively, because theundistributed earnings are considered to be permanentlyinvested.
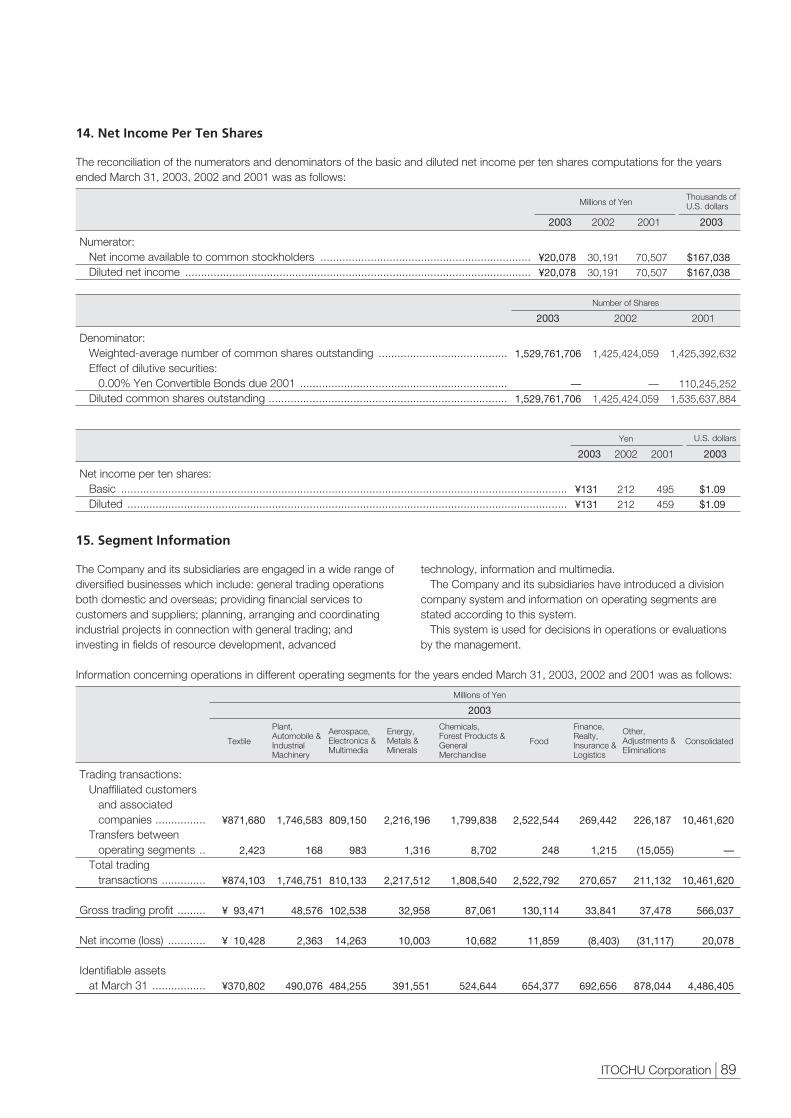
ITOCHU Corporation | 89.
Denominator:Weighted-average number of common shares outstanding .........................................Effect of dilutive securities:
0.00% Yen Convertible Bonds due 2001 ..................................................................Diluted common shares outstanding ............................................................................
Numerator:Net income available to common stockholders ...................................................................Diluted net income ..............................................................................................................
$167,038$167,038
30,19130,191
¥20,078¥20,078
Millions of YenThousands ofU.S. dollars
2003 20032002
70,50770,507
2001
1,425,424,059
—1,425,424,059
1,529,761,706
—1,529,761,706
Number of Shares
2003 2002
1,425,392,632
110,245,2521,535,637,884
2001
14. Net Income Per Ten Shares
The reconciliation of the numerators and denominators of the basic and diluted net income per ten shares computations for the yearsended March 31, 2003, 2002 and 2001 was as follows:
Net income per ten shares:Basic ..............................................................................................................................................Diluted ............................................................................................................................................
212212
¥131¥131
$1.09$1.09
Yen U.S. dollars
2003 20032002
495459
2001
15. Segment Information
The Company and its subsidiaries are engaged in a wide range ofdiversified businesses which include: general trading operationsboth domestic and overseas; providing financial services tocustomers and suppliers; planning, arranging and coordinatingindustrial projects in connection with general trading; andinvesting in fields of resource development, advanced
technology, information and multimedia.The Company and its subsidiaries have introduced a division
company system and information on operating segments arestated according to this system.
This system is used for decisions in operations or evaluationsby the management.
Information concerning operations in different operating segments for the years ended March 31, 2003, 2002 and 2001 was as follows:
Trading transactions:Unaffiliated customers
and associatedcompanies ................
Transfers betweenoperating segments ..
Total tradingtransactions ..............
Gross trading profit .........
Net income (loss) ............
Identifiable assetsat March 31 .................
10,461,620
—
10,461,620
566,037
20,078
4,486,405
226,187
(15,055)
211,132
37,478
(31,117)
878,044
269,442
1,215
270,657
33,841
(8,403)
692,656
2,522,544
248
2,522,792
130,114
11,859
654,377
1,799,838
8,702
1,808,540
87,061
10,682
524,644
2,216,196
1,316
2,217,512
32,958
10,003
391,551
1,746,583
168
1,746,751
48,576
2,363
490,076
¥871,680
2,423
¥874,103
¥ 93,471
¥ 10,428
¥370,802
809,150
983
810,133
102,538
14,263
484,255
Millions of Yen
2003
ConsolidatedOther,Adjustments &Eliminations
Finance,Realty,Insurance &Logistics
Food
Chemicals,Forest Products &GeneralMerchandise
Energy,Metals &Minerals
Aerospace,Electronics &Multimedia
Plant,Automobile &IndustrialMachinery
Textile
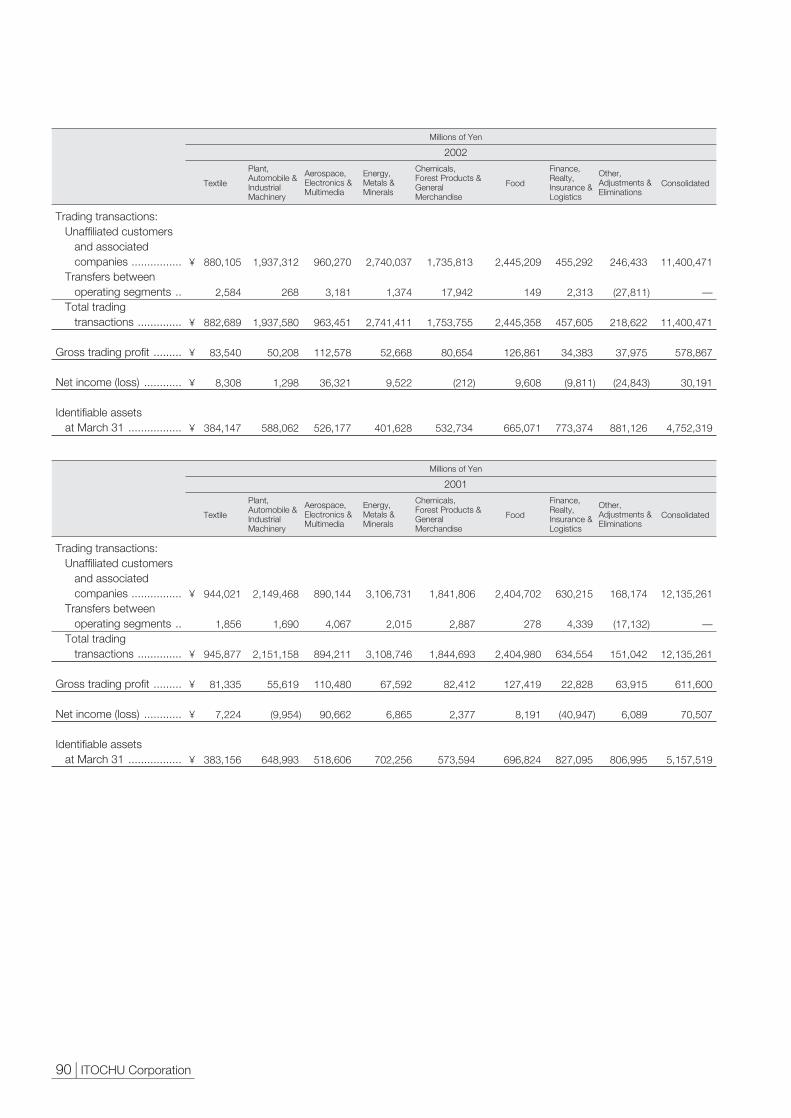
90 | ITOCHU Corporation.
Trading transactions:Unaffiliated customers
and associatedcompanies ................
Transfers betweenoperating segments ..
Total tradingtransactions ..............
Gross trading profit .........
Net income (loss) ............
Identifiable assetsat March 31 .................
11,400,471
—
11,400,471
578,867
30,191
4,752,319
246,433
(27,811)
218,622
37,975
(24,843)
881,126
455,292
2,313
457,605
34,383
(9,811)
773,374
2,445,209
149
2,445,358
126,861
9,608
665,071
1,735,813
17,942
1,753,755
80,654
(212)
532,734
2,740,037
1,374
2,741,411
52,668
9,522
401,628
1,937,312
268
1,937,580
50,208
1,298
588,062
¥ 880,105
2,584
¥ 882,689
¥ 83,540
¥ 8,308
¥ 384,147
960,270
3,181
963,451
112,578
36,321
526,177
Millions of Yen
2002
ConsolidatedOther,Adjustments &Eliminations
Finance,Realty,Insurance &Logistics
Food
Chemicals,Forest Products &GeneralMerchandise
Energy,Metals &Minerals
Aerospace,Electronics &Multimedia
Plant,Automobile &IndustrialMachinery
Textile
Trading transactions:Unaffiliated customers
and associatedcompanies ................
Transfers betweenoperating segments ..
Total tradingtransactions ..............
Gross trading profit .........
Net income (loss) ............
Identifiable assetsat March 31 .................
12,135,261
—
12,135,261
611,600
70,507
5,157,519
168,174
(17,132)
151,042
63,915
6,089
806,995
630,215
4,339
634,554
22,828
(40,947)
827,095
2,404,702
278
2,404,980
127,419
8,191
696,824
1,841,806
2,887
1,844,693
82,412
2,377
573,594
3,106,731
2,015
3,108,746
67,592
6,865
702,256
2,149,468
1,690
2,151,158
55,619
(9,954)
648,993
¥ 944,021
1,856
¥ 945,877
¥ 81,335
¥ 7,224
¥ 383,156
890,144
4,067
894,211
110,480
90,662
518,606
Millions of Yen
2001
ConsolidatedOther,Adjustments &Eliminations
Finance,Realty,Insurance &Logistics
Food
Chemicals,Forest Products &GeneralMerchandise
Energy,Metals &Minerals
Aerospace,Electronics &Multimedia
Plant,Automobile &IndustrialMachinery
Textile

ITOCHU Corporation | 91.
Note: The “Other, Adjustments & Eliminations” column includes trading transactions, gross trading profit, net income (loss), and identifiable assets not allocated to operatingsegments in domestic and foreign areas, eliminations and adjustments, etc.
Trading transactions:Unaffiliated customers
and associatedcompanies ................
Transfers betweenoperating segments ..
Total tradingtransactions ..............
Gross trading profit .........
Net income (loss) ............
Identifiable assetsat March 31 .................
87,035,108
—
87,035,108
4,709,126
167,038
37,324,501
1,881,755
(125,249)
1,756,506
311,797
(258,877)
7,304,859
2,241,614
10,108
2,251,722
281,539
(69,908)
5,762,529
20,986,223
2,063
20,988,286
1,082,479
98,661
5,444,068
14,973,694
72,396
15,046,090
724,301
88,868
4,364,759
18,437,571
10,948
18,448,519
274,193
83,220
3,257,496
14,530,641
1,397
14,532,038
404,127
19,659
4,077,171
$7,251,913
20,159
$7,272,072
$ 777,629
$ 86,755
$3,084,875
6,731,697
8,178
6,739,875
853,061
118,660
4,028,744
Thousands of U.S. dollars
2003
ConsolidatedOther,Adjustments &Eliminations
Finance,Realty,Insurance &Logistics
Food
Chemicals,Forest Products &GeneralMerchandise
Energy,Metals &Minerals
Aerospace,Electronics &Multimedia
Plant,Automobile &IndustrialMachinery
Textile
Trading transactions:Unaffiliated customers and
associated companies .............................Transfers between geographical areas ........Total trading transactions ............................
Identifiable assets at March 31 .......................
10,461,620—
10,461,620
4,486,405
212,157392,989605,146
233,304
1,362,552971,614
2,334,166
202,014
159,58434,901
194,485
174,403
484,551202,224686,775
372,447
—(2,628,732)(2,628,732)
(379,929)
¥8,242,7761,027,004
¥9,269,780
¥3,884,166
Information concerning operations in different geographical areas for the years ended March 31, 2003, 2002 and 2001 was as follows:
Millions of Yen
2003
ConsolidatedEliminations orUnallocated
OtherAreasAsiaEurope
NorthAmericaJapan
Trading transactions:Unaffiliated customers and
associated companies .............................Transfers between geographical areas ........Total trading transactions ............................
Identifiable assets at March 31 .......................
Millions of Yen
2002
ConsolidatedEliminations orUnallocated
OtherAreasAsiaEurope
NorthAmericaJapan
11,400,471—
11,400,471
4,752,319
198,682465,711664,393
286,810
1,331,048816,777
2,147,825
207,049
176,94947,701
224,650
196,171
616,618225,282841,900
431,938
¥ 9,077,174961,602
¥10,038,776
¥ 3,990,540
—(2,517,073)(2,517,073)
(360,189)

92 | ITOCHU Corporation.
Trading transactions:Unaffiliated customers and
associated companies .............................Transfers between geographical areas ........Total trading transactions ............................
Identifiable assets at March 31 .......................
Trading transactions:Unaffiliated customers and
associated companies .............................Transfers between geographical areas ........Total trading transactions ............................
Identifiable assets at March 31 .......................
87,035,108—
87,035,108
37,324,501
—(21,869,651)(21,869,651)
(3,160,807)
1,765,0333,269,4605,034,493
1,940,965
11,335,7078,083,311
19,419,018
1,680,649
1,327,654290,358
1,618,012
1,450,940
4,031,2061,682,3965,713,602
3,098,561
$68,575,5088,544,126
$77,119,634
$32,314,193
Thousands of U.S. dollars
2003
ConsolidatedEliminations orUnallocated
OtherAreasAsiaEurope
NorthAmericaJapan
Note: The amounts of unallocated common assets included in the “Eliminations or Unallocated” column were ¥73,112 million ($608,253 thousand), ¥82,131 million and ¥83,693million for the years ended March 31, 2003, 2002 and 2001, respectively.
17. Capital Surplus and Retained Earnings
There have been no trading transactions with a single major external customer for the years ended March 31, 2003, 2002 and 2001.
The Japanese Commercial Code required that an amount equalto at least 10% of appropriations paid in cash by the Companyand its domestic subsidiaries be appropriated to a legal reserveuntil the reserve equaled 25% of common stock. The JapaneseCommercial Code, amended effective on October 1, 2001,requires that an amount equal to at least 10% of appropriationspaid in cash be appropriated to a legal reserve until anaggregated amount of capital surplus and the legal reserveequals 25% of common stock.
The amount of retained earnings available for dividends underthe Japanese Commercial Code is based on the amountrecorded in the Company’s books of account in accordance withfinancial accounting standards of Japan. The adjustmentsincluded in the accompanying consolidated financial statementsto conform with United States generally accepted accountingprinciples, but not recorded in the books of account, have no
effect on the determination of retained earnings available fordividends under the Japanese Commercial Code. Retainedearnings available for dividends amounted to ¥17,875 million ($148,710 thousand) at March 31, 2003.
During the year ended March 31, 2001, as permitted by theJapanese Commercial Code, the Company’s stockholdersapproved the elimination of an accumulated deficit of ¥109,799million ($913,469 thousand) by charging it to capital surplus. Hadthe Company followed the accounting used by United Statescompanies for similar transactions, capital surplus at March 31,2003, 2002 and 2001 would be ¥109,799 million ($913,469thousand) more than the amount included in the accompanyingconsolidated balance sheets, and retained earnings at March 31,2003, 2002, and 2001 would be ¥109,799 million ($913,469thousand) less than the amount included in the accompanyingconsolidated balance sheets.
12,135,261—
12,135,261
5,157,519
—(2,885,936)(2,885,936)
(382,161)
177,437503,896681,333
286,317
1,259,163980,711
2,239,874
266,058
212,19752,106
264,303
213,885
672,568260,441933,009
459,601
¥ 9,813,8961,088,782
¥10,902,678
¥ 4,313,819
Millions of Yen
2001
ConsolidatedEliminations orUnallocated
OtherAreasAsiaEurope
NorthAmericaJapan
16. Common Stock
The Company issued new shares by public offering on July 25,2002. During the years ended March 31, 2003, the Companyissued 158,000,000 shares of common stock. In accordance
with the provisions of the Japanese Commercial Code, one-halfof the conversion proceeds have been allocated to the commonstock account and the remainder to the capital surplus account.

ITOCHU Corporation | 93.
Foreign currency translation adjustments:Balance at beginning of year ...........................................................................................Change for the year .........................................................................................................Balance at end of year ....................................................................................................
Minimum pension liability adjustments:Balance at beginning of year ...........................................................................................Change for the year .........................................................................................................Balance at end of year ....................................................................................................
Unrealized gains (losses) on securities:Balance at beginning of year ...........................................................................................Change for the year .........................................................................................................Balance at end of year ....................................................................................................
Unrealized gains (losses) on derivative instruments:Balance at beginning of year ...........................................................................................Change for the year .........................................................................................................Balance at end of year ....................................................................................................
Accumulated other comprehensive income (loss):Balance at beginning of year ...........................................................................................Change for the year .........................................................................................................Balance at end of year ....................................................................................................
$(254,959)(171,073)(426,032)
(6,147)(5,732)
(11,879)
145,141 (148,311)
(3,170)
(52,621)7,779
(44,842)
(168,586)(317,337)
$(485,923)
(65,972)35,326(30,646)
(37,668)36,929
(739)
22,105(4,659)
17,446
—(6,325)(6,325)
(81,535)61,271 (20,264)
¥(30,646)(20,563)(51,209)
(739)(689)
(1,428)
17,446 (17,827)
(381)
(6,325)935
(5,390)
(20,264)(38,144)
¥(58,408)
Millions of YenThousands ofU.S. dollars
2003 20032002
(94,539)28,567(65,972)
(11,010)(26,658)(37,668)
58,962(36,857)22,105
———
(46,587)(34,948)(81,535)
2001
18. Other Comprehensive Income (Loss)
Change in accumulated other comprehensive income (loss) was as follows:
Foreign currency translation adjustments:Amount arising during the year on investments in foreign entities .......................................................Reclassification adjustments for gains and losses realized
upon sale or liquidation of investments in foreign entities .................................................................Net change in foreign currency translation adjustments during the year ..............................................
Minimum pension liability adjustments ...................................................................................................
Unrealized gains (losses) on securities:Amount arising during the year on available-for-sale securities ...........................................................Reclassification adjustments for gains and losses realized in net income ............................................Net change in unrealized gains (losses) on securities during the year ..................................................
Unrealized gains (losses) on derivative instruments:Amount arising during the year on derivative instruments for cash flow hedges ..................................Reclassification adjustments for gains and losses realized in net income ............................................Net change in unrealized gains (losses) on derivative instruments during the year ..............................
Other comprehensive income (loss) .......................................................................................................
(20,155)
(408)(20,563)
(689)
(21,605)3,778
(17,827)
(1,871)2,806
935
(38,144)
(224)
— (224)
785
15,220 (2,633)
12,587
1,189 (2,032)
(843)
12,305
¥(19,931)
(408)(20,339)
(1,474)
(36,825)6,411
(30,414)
(3,060)4,838 1,778
¥(50,449)
Tax effects allocated to each component of other comprehensive income (loss) and reclassification adjustments were as follows:
Millions of Yen
2003
Net-of-TaxAmount
Tax Benefit(Expense)
Before-TaxAmount
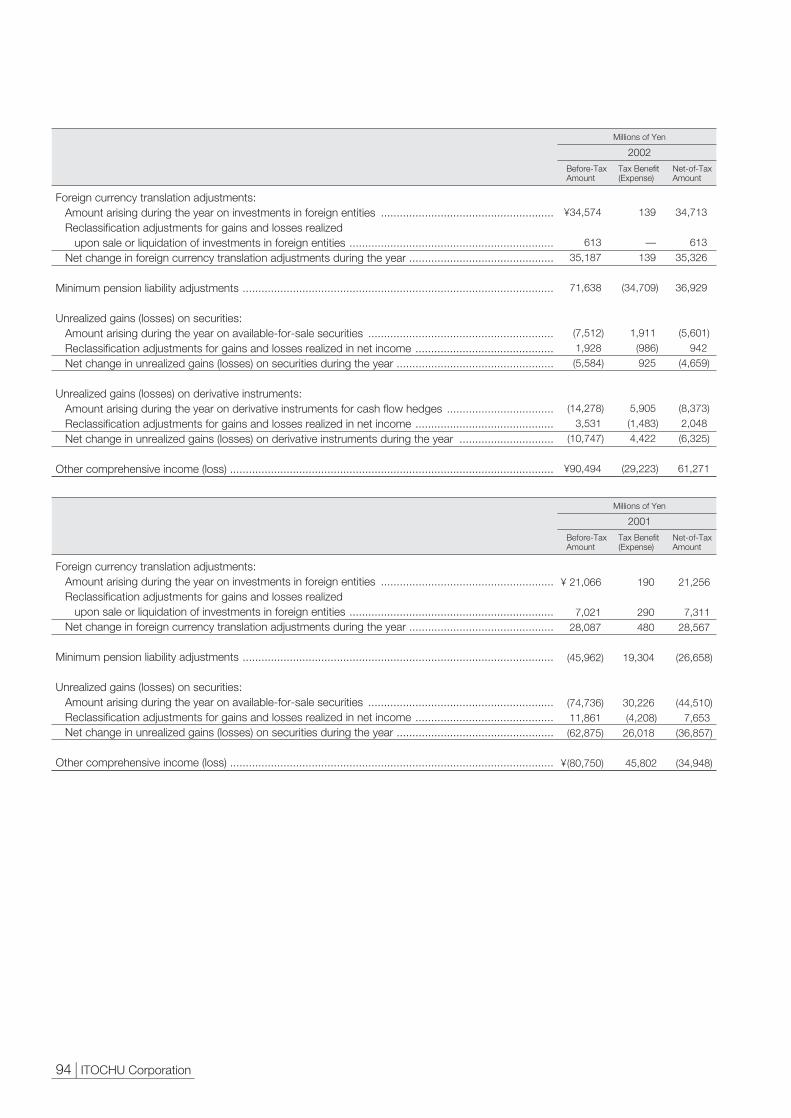
94 | ITOCHU Corporation.
Foreign currency translation adjustments:Amount arising during the year on investments in foreign entities .......................................................Reclassification adjustments for gains and losses realized
upon sale or liquidation of investments in foreign entities .................................................................Net change in foreign currency translation adjustments during the year ..............................................
Minimum pension liability adjustments ...................................................................................................
Unrealized gains (losses) on securities:Amount arising during the year on available-for-sale securities ...........................................................Reclassification adjustments for gains and losses realized in net income ............................................Net change in unrealized gains (losses) on securities during the year ..................................................
Other comprehensive income (loss) .......................................................................................................
21,256
7,31128,567
(26,658)
(44,510)7,653
(36,857)
(34,948)
190
290480
19,304
30,226(4,208)
26,018
45,802
¥ 21,066
7,02128,087
(45,962)
(74,736)11,861(62,875)
¥(80,750)
Millions of Yen
2001
Net-of-TaxAmount
Tax Benefit(Expense)
Before-TaxAmount
Foreign currency translation adjustments:Amount arising during the year on investments in foreign entities .......................................................Reclassification adjustments for gains and losses realized
upon sale or liquidation of investments in foreign entities .................................................................Net change in foreign currency translation adjustments during the year ..............................................
Minimum pension liability adjustments ...................................................................................................
Unrealized gains (losses) on securities:Amount arising during the year on available-for-sale securities ...........................................................Reclassification adjustments for gains and losses realized in net income ............................................Net change in unrealized gains (losses) on securities during the year ..................................................
Unrealized gains (losses) on derivative instruments:Amount arising during the year on derivative instruments for cash flow hedges ..................................Reclassification adjustments for gains and losses realized in net income ............................................Net change in unrealized gains (losses) on derivative instruments during the year ..............................
Other comprehensive income (loss) .......................................................................................................
34,713
61335,326
36,929
(5,601)942
(4,659)
(8,373)2,048(6,325)
61,271
139
—139
(34,709)
1,911(986)925
5,905(1,483)4,422
(29,223)
¥34,574
61335,187
71,638
(7,512)1,928(5,584)
(14,278)3,531
(10,747)
¥90,494
Millions of Yen
2002
Net-of-TaxAmount
Tax Benefit(Expense)
Before-TaxAmount

ITOCHU Corporation | 95.
Foreign currency translation adjustments:Amount arising during the year on investments in foreign entities .......................................................Reclassification adjustments for gains and losses realized
upon sale or liquidation of investments in foreign entities .................................................................Net change in foreign currency translation adjustments during the year ..............................................
Minimum pension liability adjustments ...................................................................................................
Unrealized gains (losses) on securities:Amount arising during the year on available-for-sale securities ...........................................................Reclassification adjustments for gains and losses realized in net income ............................................Net change in unrealized gains (losses) on securities during the year ..................................................
Unrealized gains (losses) on derivative instruments:Amount arising during the year on derivative instruments for cash flow hedges ..................................Reclassification adjustments for gains and losses realized in net income ............................................Net change in unrealized gains (losses) on derivative instruments during the year ..............................
Other comprehensive income (loss) .......................................................................................................
(167,679)
(3,394)(171,073)
(5,732)
(179,742)31,431
(148,311)
(15,566)23,345 7,779
(317,337)
(1,864)
— (1,864)
6,531
126,622 (21,905)
104,717
9,892 (16,905)(7,013)
102,371
$ (165,815)
(3,394)(169,209)
(12,263)
(306,364)53,336
(253,028)
(25,458)40,250 14,792
$ (419,708)
Thousands of U.S. dollars
2003
Net-of-TaxAmount
Tax Benefit(Expense)
Before-TaxAmount
Assets:Marketable securities ......................................................Other investments ..........................................................Other non-current receivables
and advances to associated companies ......................Liabilities:
Long-term debt ..............................................................
40,879289,557
315,247
2,165,274
¥ 40,879289,557
313,826
¥2,163,747
Thousands of U.S. dollars
200320022003
EstimatedFair Value
51,092376,508
405,735
2,352,642
EstimatedFair Value
CarryingAmount
51,165376,508
404,512
2,350,423
CarryingAmount
340,0922,408,960
2,622,687
18,013,927
EstimatedFair Value
$ 340,0922,408,960
2,610,865
$18,001,223
CarryingAmount
Millions of Yen
19. Financial Instruments
The Company and its subsidiaries have various financialinstruments, which are exposed to credit-related losses in theevent of non-performance by counterparties.
The companies utilize numerous counterparties to ensure thatthere are no significant concentrations of credit risk with anyindividual counterparty or groups of counterparties.
Fair Values of Financial InstrumentsThe estimated fair values of financial instruments as of March 31, 2003 and 2002 were as follows:
Cash and Cash Equivalents, Time Deposits, Trade Receivables(payables), Due from (to) Associated Companies, Short-termDebt and Accrued Expenses:The carrying amounts as of March 31, 2003 and 2002approximated fair values because of the short maturity of theseinstruments.
Marketable Securities:The fair values of marketable securities are based on quotedmarket prices.
Other Investments:The fair values of marketable investment securities are based onquoted market prices. The carrying amounts of non-marketable
investment securities and others approximated fair values.
Other Non-current Receivables and Advances to AssociatedCompanies:The fair values of other non-current receivables and advances toassociated companies are based on the present value of futurecash flows discounted using the current rates at which similarloans or receivables would be made to borrowers or customerswith similar credit ratings and for comparable maturities.
Long-term Debt:The fair values of long-term debt are based on the present valueof future cash flows discounted using the current borrowing ratesof similar debt instruments having comparable maturities.

96 | ITOCHU Corporation.
Assets for derivative financial instruments:Foreign exchange contracts (inclusive of currency swap agreements) ...Interest rate swap agreements ..............................................................Interest rate option agreements .............................................................
Liabilities for derivative financial instruments:Foreign exchange contracts (inclusive of currency swap agreements) ...
The fair values of derivative financial instruments reflect theestimated amounts that the Company and its subsidiaries wouldreceive or pay to terminate the contracts at the reporting dates.
Foreign Exchange Contracts (Inclusive of Currency SwapAgreements): The fair values of foreign exchange contracts are estimatedbased on the quoted market prices of comparable contracts.
Interest Rate Swap Agreements:The fair values of interest rate swap agreements are estimatedusing discounted cash flow analyses, based on the currentswap rates for interest rate swap agreements with similarterms and remaining periods.
Interest Rate Option Agreements:The fair values of interest rate option agreements areestimated using option pricing model.
Limitations:Fair value estimates are made at a specific point in time, basedon relevant market information and information about thefinancial instruments. These estimates are subjective in natureand involve uncertainties and matters of significant judgementand therefore cannot be determined with precision. Changesin assumptions could significantly affect the estimates.
Derivative Instruments and Hedging Activities
Overall Risk ProfileThe Company and certain subsidiaries operate internationallyand are exposed to market risks such as from changes in foreignexchange rates, interest rates and commodity prices.
The Company and certain subsidiaries utilize certain derivativeinstruments principally in order to reduce these market risks.
The Company and certain subsidiaries are exposed to foreignexchange rate risk resulting from transactions internationally andenter into derivative financial instruments, such as foreignexchange contracts (inclusive of currency swap agreements),primarily to hedge foreign exchange rate risk.
The Company and certain subsidiaries are exposed to interestrate risk resulting from holding a variety of interest rate-sensitiveassets and liabilities and enter into derivative financialinstruments, such as interest rate swap agreements, primarily to
hedge interest rate risk.The Company and certain subsidiaries are exposed to
commodity price risk and enter into derivative instruments, suchas commodity price contracts, (commodity future and forwardcontracts), primarily to hedge commodity price risk.
The Company and its subsidiaries have various derivativeinstruments, which are exposed to credit-related losses in theevent of non-performance by counterparties. Numerouscounterparties are utilized to ensure that there is no significantconcentration of credit risk with any individual counterparty orgroups of counterparties. Derivative instruments are entered intowith limited major counterparties to minimize credit riskexposure. The policies of the Company and its subsidiariesprescribe monitoring of creditworthiness and exposure on acounterparty-by-counterparty basis.
Foreign Exchange Rate Risk ManagementThe Company and certain subsidiaries have assets and liabilitieswhich are exposed to foreign exchange rate risk and, as a result,they enter into foreign exchange contracts (inclusive of currencyswap agreements) for the purpose of hedging these risks.
Foreign exchange contracts are used principally to manageforeign exchange exposure between U.S. dollar and Japaneseyen.
These contracts are primarily used to fix future net cash flowsfrom recognized receivables and payables and unrecognizedfirm commitments denominated in foreign currencies.
The Company and its subsidiaries measure the volume and duedate of future net cash flows by currency.
In accordance with their policy, a certain portion of measurednet cash flows is covered by using foreign exchange contracts(inclusive of currency swap agreements).
Most hedging relationships between the derivative financialinstruments and hedged items are highly effective in off-settingchanges in foreign exchange rates.
Interest Rate Risk ManagementThe Company and certain subsidiaries’ exposure to interest raterisk is related principally to debt obligations.
These debt obligations expose the Company and certainsubsidiaries to variability in future cash outflows of interestpayments or to fluctuations in fair value due to changes ininterest rates.
The Company and certain subsidiaries principally enter into
3,77619,749
335
480
¥ 3,77619,749
335
¥ 480
Thousands of U.S. dollars
20032003
EstimatedFair Value
7,72226,141
223
2,355
EstimatedFair Value
CarryingAmount
7,72226,141
223
2,355
2002
CarryingAmount
31,414164,301
2,787
3,993
EstimatedFair Value
$ 31,414164,301
2,787
$ 3,993
CarryingAmount
Millions of Yen
Fair Values of Derivative Financial InstrumentsThe estimated fair values of derivative financial instruments as of March 31, 2003 and 2002 were as follows:

ITOCHU Corporation | 97.
Foreign exchange contracts (inclusive of currency swap agreements)To sell foreign currencies .....................................................................................................To buy foreign currencies .....................................................................................................
Interest rate swap agreements ................................................................................................Interest rate option agreements ..............................................................................................
$ 839,5591,902,937
14,794,725908,436
105,439263,723
1,882,335110,842
Millions of YenThousands ofU.S. dollars
2002
¥ 100,915228,733
1,778,326109,194
2003 2003
interest rate swap agreements to manage fluctuations in cashflows or in fair values resulting from changes in interest rates.
Interest rate swaps are used to change floating rates on debtobligations to fixed rates by entering into receive-floating, pay-fixed interest rate swaps under which the Company and certainsubsidiaries receive floating interest rate proceeds and makefixed interest rate payments, thereby creating fixed-rate debt.
On the other hand, interest rate swaps are used to changefixed rates on debt obligations to floating rates by entering intoreceive-fixed, pay-floating interest rate swaps under which theCompany and certain subsidiaries receive fixed interest rateproceeds and make floating interest rate payments, therebycreating floating-rate debt.
Most hedging relationships between the derivative financialinstruments and hedged items are highly effective in off-settingchanges in cash flows or in fair values resulting from interest raterisk.
Commodity Price Risk ManagementThe Company and certain subsidiaries enter into derivativeinstruments for commodities, such as crude oil and grain,principally to hedge fluctuation in cash flows or in fair values dueto changes in commodity prices.
Derivative instruments for commodities do not have a materialeffect on the financial statements.
Most hedging relationships between the derivative instrumentsand hedged items are highly effective in off-setting changes incash flows or in fair values resulting from commodity price risk.
Risk Management PolicyThe Company and its subsidiaries assess foreign exchange raterisk, interest rate risk and commodity price risk by continuallymonitoring changes in exposure and by evaluating hedgingopportunities.
The Company and its subsidiaries manage to limit the level ofexposure to derivative instruments based on the purpose ofholding derivative instruments.
The risk management policy of the Company and itssubsidiaries states that derivative instruments for the most partare held for hedging purposes.
The Company and its subsidiaries meet the documentationrequirements as prescribed by SFAS133 and SFAS138, which
The contract or notional amounts of derivative financial instruments held as of March 31, 2003 and 2002 were summarized as follows:
includes their risk-management objective and strategy forundertaking various hedge transactions.
In addition, a formal assessment is made at the hedge’sinception and periodically on an on-going basis, as to whetherthe derivatives used in hedging activities are highly effective inoff-setting changes in fair values or cash flows of hedged items.
Fair Value HedgeChanges in the fair value of both recognized assets and liabilitiesand unrecognized firm commitments and derivative instrumentsthat are designated and qualify as fair value hedges of theseassets and liabilities and firm commitments are recognized inearnings.
The sum of the amount of the hedge ineffectiveness and netgain or loss excluded from the assessment of hedgeeffectiveness is not material for the years ended March 31, 2003and 2002.
Cash Flow HedgeChanges in the fair value of derivative instruments that aredesignated and qualify as cash flow hedges of unrecognizedforecast transactions and recognized assets and liabilities arereported in accumulated other comprehensive income (loss)(referred to as AOCI).
These amounts are reclassified into earnings in the sameperiod as hedged items affect earnings.
The sum of the amount of the hedge ineffectiveness and netgain or loss excluded from the assessment of hedgeeffectiveness is not material for the years ended March 31, 2003and 2002. ¥2,806 million ($ 23,344 thousand) and ¥2,048 millionof net losses were reclassified from AOCI into earnings duringthe years ended March 31, 2003 and 2002, respectively, as netgains or losses relating to the hedged items affected earnings.¥2,286 million ($19,018 thousand) of net losses in AOCI atMarch 31, 2003 are expected to be reclassified to earningswithin the next 12 months.
As of March 31, 2003, the maximum length of time over whichthe Company and its subsidiaries are hedging their exposure tovariability in future cash flows is approximately 54 months.
Held or issued derivative instruments for trading purposeswere insignificant.

98 | ITOCHU Corporation.
20. Issuance of Stock by Subsidiaries or Associated Companies
CENTURY21 REAL ESTATE OF JAPAN LTD., a consolidatedsubsidiary, issued 500 shares of common stock in a publicoffering to third parties on November 21, 2001, the date of itslisting on the JASDAQ market. The offering price per share was¥564,000, which was in excess of the Company’s carrying valueper share of the subsidiary stock.
This issuance decreased the Company’s ownership of thesubsidiary from 69.6% to 61.9%. The issuance of these sharesfor ¥282 million was regarded as a sale of a part of theCompany’s interest in the subsidiary and the Companyrecognized a gain of ¥102 million for the year ended March 31,2002, which is included in the profit (loss) on disposal ofinvestments and marketable securities, net of write-downsaccount.
SPACE SHOWER NETWORKS INC., a consolidated subsidiary,issued 2,000 shares of common stock in a public offering tothird parties on April 18, 2001, the date of its listing on theJASDAQ market. The offering price per share was ¥376,000,which was in excess of the Company’s carrying value per shareof the subsidiary stock.
This issuance decreased the Company’s ownership of thesubsidiary from 70.6% to 64.8%. The issuance of these sharesfor ¥752 million was regarded as a sale of a part of theCompany’s interest in the subsidiary and the Companyrecognized a gain of ¥383 million for the year ended March 31,2002, which is included in the profit (loss) on disposal ofinvestments and marketable securities, net of write-downsaccount.
In addition, the company issued 2,466 shares of commonstock in connection with the allocation of new shares to thirdparties and 200 shares of common stock in connection withbusiness acquisition on January 16, 2002. The offering price pershare was ¥288,348, which was in excess of the Company’scarrying value per share of the subsidiary stock.
This issuance decreased the Company’s ownership of thesubsidiary from 59.9% to 53.7%. The issuance of these sharesfor ¥769 million was regarded as a sale of a part of theCompany’s interest in the subsidiary and the Companyrecognized a gain of ¥270 million for the year ended March 31,2002, which is included in the profit (loss) on disposal ofinvestments and marketable securities, net of write-downsaccount.
ITOCHU SHOKUHIN Co., Ltd., a consolidated subsidiary, issued1,200,000 shares of common stock in a public offering to thirdparties on March 13, 2001, the date of its listing on the firstsection of the Tokyo Stock Exchange. The offering price pershare was ¥4,324, which was in excess of the Company’scarrying value per share of the subsidiary stock.
This issuance decreased the Company’s ownership of thesubsidiary from 60.1% to 54.6%. The issuance of these sharesfor ¥5,189 million was regarded as a sale of a part of theCompany’s interest in the subsidiary and the Companyrecognized a gain of ¥1,153 million for the year ended March 31,2001, which is included in the profit (loss) on disposal ofinvestments and marketable securities, net of write-downsaccount.
Japan Foods Co., Ltd., which had been a consolidatedsubsidiary, issued 600,000 shares of common stock in a publicoffering to third parties on August 10, 2000, the date of its listingon the JASDAQ market. The offering price per share was ¥752,which was in excess of the Company’s carrying value per shareof the subsidiary stock.
This issuance decreased the Company’s ownership of thesubsidiary from 87.5% to 77.2%. The issuance of these sharesfor ¥451 million was regarded as a sale of a part of theCompany’s interest in the subsidiary and the Companyrecognized a gain of ¥163 million for the year ended March 31,2001, which is included in the profit (loss) on disposal ofinvestments and marketable securities, net of write-downsaccount.
JSAT Corporation, which had been an associated company,issued 45,000 shares of common stock in a public offering tothird parties on August 4, 2000, the date of its listing on the firstsection of the Tokyo Stock Exchange. The offering price pershare was ¥665,000, which was in excess of the Company’scarrying value per share of the associated company’s stock.
This issuance decreased the Company’s ownership of theassociated company from 23.2% to 20.5%. The issuance ofthese shares for ¥29,925 million was regarded as a sale of a partof the Company’s interest in the associated company and theCompany recognized a gain of ¥4,606 million for the year endedMarch 31, 2001, which is included in the profit (loss) on disposalof investments and marketable securities, net of write-downsaccount.
21. Reclassification
Certain account classifications were changed in 2003, thereforethe 2002 and 2001 financial statements were reclassified toconform to the 2003 presentation.

ITOCHU Corporation | 99.
22. Contingent Liabilities
As addressed in Note 2 “Summary of Significant AccountingPolicies”, in November 2002, the FASB issued FASBInterpretation No.45, “Guarantor’s Accounting and DisclosureRequirements for Guarantees, Including Indirect Guarantees ofIndebtedness of Others” (FIN 45). FIN 45 requires a guarantorto recognize, at the inception of a guarantee, a liability for theguarantee on the guarantor’s balance sheets. The Companyand its subsidiaries adopted the recognition provisions of FIN45 prospectively to guarantees issued after December 31,2002.
The Company and its subsidiaries issue various guarantees
for indebtedness of subsidiaries, associated companies andcustomers. The maximum potential amount of future paymentsand the amount of substantial risk at March 31, 2003 and2002 were summarized below.
The amount of substantial risk at March 31, 2003 and 2002represents the actual amount of liability incurred by theguaranteed parties within the pre-determined guaranteed limitestablished under the guarantee contracts. The amounts thatcan be recovered from third parties have been excluded indetermining the amount of substantial risk.
Guarantees for subsidiaries:Maximum potential amount of future payments ..........................................................Amount of substantial risk ..........................................................................................
Guarantees for associated companies:Maximum potential amount of future payments ..........................................................Amount of substantial risk ..........................................................................................
Guarantees for customers:Maximum potential amount of future payments ..........................................................Amount of substantial risk ..........................................................................................
Total:Maximum potential amount of future payments ..........................................................Amount of substantial risk ..........................................................................................
639,869433,669
343,543126,621
206,247116,184
1,189,659676,474
113,90274,285
147,46910,041
6,0675,350
267,43889,676
¥525,967359,384
196,074116,580
200,180110,834
¥922,221586,798
Millions of Yen
2003
TotalOtherGuarantees
Guarantees for Monetaryindebtedness
Guarantees for subsidiaries:Maximum potential amount of future payments ..........................................................Amount of substantial risk ..........................................................................................
Guarantees for associated companies:Maximum potential amount of future payments ..........................................................Amount of substantial risk ..........................................................................................
Guarantees for customers:Maximum potential amount of future payments ..........................................................Amount of substantial risk ..........................................................................................
Total:Maximum potential amount of future payments ..........................................................Amount of substantial risk ..........................................................................................
729,247531,379
394,374170,642
220,766124,769
1,344,387826,790
140,196140,156
142,2786,522
6,9762,442
289,450149,120
¥ 589,051391,223
252,096164,120
213,790122,327
¥1,054,937677,670
Millions of Yen
2002
TotalOtherGuarantees
Guarantees for Monetaryindebtedness

100 | ITOCHU Corporation.
Guarantees for subsidiaries:Maximum potential amount of future payments ..........................................................Amount of substantial risk ..........................................................................................
Guarantees for associated companies:Maximum potential amount of future payments ..........................................................Amount of substantial risk ..........................................................................................
Guarantees for customers:Maximum potential amount of future payments ..........................................................Amount of substantial risk ..........................................................................................
Total:Maximum potential amount of future payments ..........................................................Amount of substantial risk ..........................................................................................
5,323,3693,607,895
2,858,0951,053,419
1,715,865966,589
9,897,3295,627,903
947,604618,012
1,226,86483,535
50,47444,509
2,224,942746,056
$4,375,7652,989,883
1,631,231969,884
1,665,391922,080
$7,672,3874,881,847
Thousands of U.S. dollars
2003
TotalOtherGuarantees
Guarantees for Monetaryindebtedness
The carrying amount of the liability recognized for guarantees was¥1,469 million ($12,221 thousand) and ¥688 million at March 31,2003 and 2002, respectively.
Other than the above guarantees, some guarantees are issuedbetween the Company and its subsidiaries for the purpose ofsharing the risks, of which the maximum potential amount offuture payments was ¥38,893 million ($323,569 thousand) and¥51,428 at March 31, 2003 and 2002, respectively.
The Company and its subsidiaries were contingently liable relatingto ¥4,538 million ($37,754 thousand) and ¥3,342 million of tradenotes receivable endorsed to suppliers in the settlement ofaccounts payable and ¥54,750 million ($455,491 thousand) and¥54,720 million of export bills of exchange discounted with banksin the ordinary course of business at March 31, 2003 and 2002,respectively.
The Company issued in Japan 0.79% Yen Bonds due 2008 in anaggregate principal amount of ¥15,000 million ($124,792thousand) on April 30, 2003, 0.41% Yen Bonds due 2006 in anaggregate principal amount of ¥10,000 million ($83,195thousand) on May 27, 2003, 0.87% Yen Bonds due 2010 in an
The amounts that can be recovered from third parties havebeen included in determining maximum potential amount of futurepayments. The amounts recoverable were ¥138,990 million($1,156,323 thousand) and ¥114,105 million at March 31, 2003and 2002, respectively.
Guarantees with the longest term for indebtedness ofsubsidiaries, associated companies and customers issued by theCompany and its subsidiaries will expire on December 31, 2037.
The major associated companies and customers guaranteed and substantial risk of the guarantees for monetary indebtedness atMarch 31, 2003 and 2002 were as follows:
Marubeni-Itochu Steel Inc. ...........................Marubeni-Itochu Steel America Inc. .............Japan Brazil Paper and
Pulp Resources Development Co., Ltd. .....Tokyo Humania Enterprise Inc. ....................Quatro World Maritime S.A. .........................P.T. PANTJA MOTOR .................................Digital Telecommunications Phils. ................Chemoil Corporation ...................................Bontang Train • G Project .............................Kawasaki Kisen Kaisha, Ltd. ........................
$322,404138,686
100,01779,31853,50249,91748,49439,87538,62726,747
¥38,75316,670
12,0229,5346,4316,0005,8294,7934,6433,215
Millions of YenThousands ofU.S. dollars
2003
Marubeni-Itochu Steel Inc. ...........................Marubeni-Itochu Steel America Inc. .............Japan Brazil Paper and
Pulp Resources Development Co., Ltd. ....Tokyo Humania Enterprise Inc. ....................Quatro World Maritime S.A. .........................Digital Telecommunications Phils. ................STAR CHANNEL, INC. .................................P.T. PANTJA MOTOR ..................................Bontang Train • G Project .............................Tycoon Corporation .....................................
Millions of Yen
¥70,70022,585
14,4179,5587,1297,0996,0006,0005,9815,811
2002
23. Subsequent Events
In July 2001, Citibank, N.A. and Citibank Canada filed a lawsuit inthe federal district court in New York City against ITOCHUInternational Inc. (the Company’s U.S. subsidiary), with regards tosale of all the stock of Copelco Capital, Inc., an ultimate subsidiaryof ITOCHU International Inc., to the plaintiffs in May 2000. Becauseof the early stage of the proceedings and the inherent uncertaintyof litigation, it is not possible to predict the ultimate outcome.
aggregate principal amount of ¥10,000 million ($83,195thousand) on May 27, 2003 and 0.47% Yen Bonds due 2007 inan aggregate principal amount of ¥10,000 million ($83,195thousand) on June 23, 2003, in accordance with an approvedresolution of the Board of Directors held on July 5, 2002.
ITOCHU Corporation | 101.
The Board of Directors
ITOCHU Corporation :
We have audited the accompanying consolidated balance sheets of ITOCHU Corporation and subsidiaries as of
March 31, 2003 and 2002, and the related consolidated statements of income, stockholders’ equity, and cash flows
for each of the years in the three-year period ended March 31, 2003, all expressed in yen. These consolidated
financial statements are the responsibility of the Company’s management. Our responsibility is to express an opinion
on these consolidated financial statements based on our audits. We did not audit the financial statements of certain
associated companies, the investments in which are recorded at the companies’ equity in their net assets. The
companies’ investment in such companies as of March 31, 2003 and 2002 was ¥15,886 million ($132,163 thousand)
and ¥16,828 million, respectively, and their equity in the earnings of such companies for each of the years in the
three-year period ended March 31, 2003 was ¥1,694 million ($14,093 thousand), ¥2,946 million and ¥8,158 million,
respectively. Those statements were audited by other auditors, whose reports have been furnished to us, and our
opinion, insofar as it relates to the amounts included for such companies, is based solely on the reports of the other
auditors.
We conducted our audits in accordance with auditing standards generally accepted in the United States of
America. Those standards require that we plan and perform the audit to obtain reasonable assurance about whether
the financial statements are free of material misstatement. An audit includes examining, on a test basis, evidence
supporting the amounts and disclosures in the financial statements. An audit also includes assessing the accounting
principles used and significant estimates made by management, as well as evaluating the overall financial statement
presentation. We believe that our audits and the reports of other auditors provide a reasonable basis for our opinion.
In our opinion, based on our audits and the reports of other auditors, the consolidated financial statements referred
to above present fairly, in all material respects, the financial position of ITOCHU Corporation and subsidiaries as of
March 31, 2003 and 2002, and the results of their operations and their cash flows for each of the years in the three-
year period ended March 31, 2003 in conformity with accounting principles generally accepted in the United States
of America.
The consolidated financial statements as of and for the year ended March 31, 2003, have been translated into
United States dollars solely for the convenience of the reader. We have recomputed the translation and, in our
opinion, the consolidated financial statements expressed in yen have been translated into United States dollars on
the basis set forth in note 1 to the consolidated financial statements.
Tokyo, Japan
May 23, 2003
except for note 23, as to which the date is June 27, 2003
Independent Auditors’ Report

102 | ITOCHU Corporation.
Japan Trustee Services Bank, Ltd. (trust account) .........................................................The Master Trust Bank of Japan, Ltd. (trust account) ....................................................Mizuho Corporate Bank, Ltd. ........................................................................................Mitsui Sumitomo Insurance Co., Ltd. .............................................................................The Sumitomo Mitsui Banking Corporation ....................................................................Nippon Life Insurance Company ....................................................................................NIPPONKOA Insurance Co, Ltd. ...................................................................................The Tokio Marine and Fire Insurance Co., Ltd. ..............................................................Shinsei Bank, Limited ....................................................................................................Asahi Mutual Life Insurance Company ...........................................................................
Stock Information
Transfer Agent of Common Stock:The Chuo Mitsui Trust & Banking Co., Ltd.
Stock Listings: Tokyo, Osaka, Nagoya, Fukuoka, Sapporo
General Meeting of Stockholders: June 27, 2003
Number of Common Stock Issued:1,583,487,736
Number of Stockholders: 150,823
7.58%5.104.353.242.982.652.632.512.171.83
120,04680,68568,84251,34347,16942,02241,56639,79734,38229,024
Major Stockholders
Stockholders Shareholding ratio (%)Number of shares held (1,000 shares)
Note1: Japan Trustee Services Bank, Ltd. was jointly established by The Sumitomo Trust & Banking Co., Ltd., Resona Bank, Limited and others to specialize in securitiesprocessing of entrusted assets centering on pension and investment trust.
Note2: The Master Trust Bank of Japan, Ltd. was jointly established by The Mitsubishi Trust and Banking Corp., Nippon Life Insurance Company, UFJ Trust Bank Limited, Meiji LifeInsurance Company, and Deutsche Bank AG to specialize in securities processing of entrusted assets centering on pension and investment trust.
(As of March 31, 2003)
Breakdown of Stockholders:
% (Number of Stockholders)Types of Stockholders
Financial Institutions56.71% (180)
5,000,000 or more58.75% (41)
1,000,000 or more9.19% (73)
100,000 or more6.88% (398)
10,000 or more10.34% (9,250)
1,000 or more14.53% (111,102)
Less than 1,0000.31% (29,959)
Individuals and Other25.78% (147,975)
Foreign Investors11.65% (451)
Domestic Corporations4.76% (2,144)
Number of Shares
Securities Companies1.03% (72)
Treasury Stock0.07% (1)
120 8,000
6,000
4,000
2,000
100
60
40 0
80
Stock Performance of ITOCHU Corporation and Average Trading Volume Per Day
1,000 Shares
Share price on April 1, 2002 (¥419) = 100
ITOCHU Corporation TOPIX
’02/4 5 6 7 8 9 10 11 12 ’03/1 2 3
Opening PriceHighLowClosing PriceTrading Volume/Day(Unit: thousands)
¥425472408410
3,876
415506413472
5,333
487498396420
4,763
421448341365
7,858
367369305317
5,131
313354276341
4,990
337346236254
5,720
253285198282
5,766
283284237257
3,599
262316249292
4,720
289308272282
4,348
284292251288
3,244
Trading Volume
ITOCHU Corporation | 103.
Corporate Information
Forward Looking Statements
Statements in this annual report with respect toITOCHU’s plans, strategies, forecasts and otherstatements that are not historical facts are forward-looking statements that are based on management’sassumptions and beliefs based on information currentlyavailable and involve risks and uncertainties. Factors thatcould cause actual results to differ materially from suchstatements include, without limitation, global economicconditions, demand for and competitive pricing pressureon products and services, ITOCHU’s ability to continue towin acceptance for its products and services in highlycompetitive markets, and currency exchange ratefluctuations.
Additional Copies of This Annual Report and OtherInformation May be Obtained by Contacting:
Investor Relations Department,Corporate Communications Division,ITOCHU Corporation
5-1, Kita-Aoyama 2-chome, Minato-ku, Tokyo 107-8077, JapanTelephone: 81 (3) 3497-7295Facsimile: 81 (3) 3497-7296
ITOCHU Corporation
Founded: 1858
Incorporated: 1949
Tokyo Head Office:5-1, Kita-Aoyama 2-chome, Minato-ku, Tokyo 107-8077, JapanTelephone: 81 (3) 3497-2121Facsimile: 81 (3) 3497-4141
Osaka Head Office: 1-3, Kyutaromachi 4-chome, Chuo-ku, Osaka 541-8577, JapanTelephone: 81 (6) 6241-2121
Homepage: http: //www.itochu.co.jp
Offices: Domestic / 19Overseas / 138
Number of Employees:4,355
Paid-in Capital: ¥202,241 million
(As of March 31, 2003)

ITOCHU Corporation5-1, Kita-Aoyama 2-chome, Minato-ku,Tokyo 107-8077, JapanTelephone: 81(3)3497-2121Facsimile: 81(3)3497-4141Homepage: http://www.itochu.co.jp
100% Recycled-content level100% Recycled-content level

Revision of Annual Report 2003 (For The Year Ended March 31, 2003)
Please kindly be informed that several items in the Annual Report 2003 (For The Year Ended March 31, 2003) should be revised,which are shown as follows, with the underline " ".
P.65 Off-Balance Sheet Arrangements and Aggregate Contractual Obligations
(The preceding paragraph is omitted)
Millions of Millions of
U.S. dollars U.S. dollars
2003 2002 2003 2003 2002 2003
Guarantees for subsidiaries:
Maximum potential amount of future payments ……………………………………………………………… ¥639.9 729.2 $5,323 ¥639.9 729.2 $5,323
Amount of substantial risk ……………………………………………………………………………… 433.7 531.4 3,608 433.7 531.4 3,608
Guarantees for associated companies:
Maximum potential amount of future payments ……………………………………………………………… ¥343.5 394.4 $2,858 ¥208.9 258.7 $1,738
Amount of substantial risk ……………………………………………………………………………… 126.6 170.6 1,053 126.6 170.6 1,053
Guarantees for customers:
Maximum potential amount of future payments ……………………………………………………………… ¥206.2 220.8 $1,716 ¥206.2 220.8 $1,716
Amount of substantial risk ……………………………………………………………………………… 116.2 124.8 967 116.2 124.8 967
(The following paragraphs and table are omitted)
P.76 Consolidated Statements of Cash FlowsITOCHU Corporation and Subsidiaries
Years ended March 31, 2003, 2002 and 2001
Thousands of Thousands of
U.S. dollars U.S. dollars
(Note 1) (Note 1)
2003 2002 2003 2003 2002 2003
Supplemental disclosures of cash flow information
Cash paid during the year for:
Interest ……………………………………………………………………………… ¥49,915 74,748 $415,266 ¥49,915 74,748 122,792 $415,266
Income taxes ……………………………………………………………………………… 35,162 46,228 292,529 35,162 46,228 74,568 292,529
Information regarding non-cash investing
and financing activities:
Establishment of pension trust ……………………………………………………………………………… 70,358 85,016 585,341 52,358 85,016 45,846 435,591
Non-monetary exchange of shares ……………………………………………………………………………… 3,054 - 25,408 3,054 - 27,410 25,408
Shares acquired in a spin-off enterprise
Assets contributed ……………………………………………………………………………… - 306,916 - - 306,916 - -
Liabilities contributed ……………………………………………………………………………… - 276,491 - - 276,491 - -
Shares acquired ……………………………………………………………………………… - 30,425 - - 30,425 - -
Conversion of convertible bonds ……………………………………………………………………………… - - - - - 56 -
P.87 11. Retirement and Severance Benefits
(The Preceding paragraphs and table of "Changes in the benefit obligations and the fair value of the plan assets" are omitted)
Employer contributions for the years ended March 31, 2003 and 2002 Employer contributions for the years ended March 31, 2003 and 2002
included contribution of equity securities to an employee pension trust. included contribution of equity securities to an employee pension trust.
The fair value of those securities at the time of contribution was ¥54,761 The fair value of those securities at the time of contribution was ¥52,358
million ($455,582 thousand) and ¥85,016 million for the years ended million ($435,591 thousand) and ¥85,016 million for the years ended
March 31, 2003 and 2002, respectively. March 31, 2003 and 2002, respectively.
(The following paragraph and table are omitted)
-
-
56
Original Revised
74,568
45,846
27,410
-
Original Revised
2001
122,792
Millions of Yen Millions of Yen
2001
Original Revised
Billions of Yen Billions of Yen
1
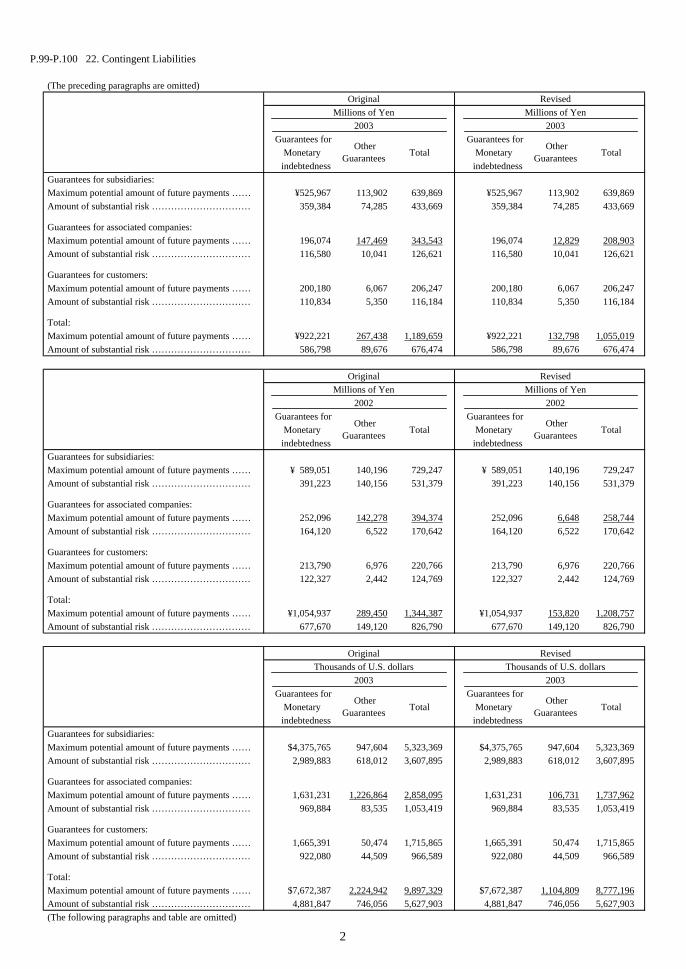
P.99-P.100 22. Contingent Liabilities
(The preceding paragraphs are omitted)Original Revised
Millions of Yen Millions of Yen2003 2003
Guarantees for Guarantees forMonetary Total Monetary Total
indebtedness indebtednessGuarantees for subsidiaries:Maximum potential amount of future payments ……………………………………………………………… ¥525,967 113,902 639,869 ¥525,967 113,902 639,869 Amount of substantial risk ……………………………………………………………………………… 359,384 74,285 433,669 359,384 74,285 433,669
Guarantees for associated companies:Maximum potential amount of future payments ……………………………………………………………… 196,074 147,469 343,543 196,074 12,829 208,903Amount of substantial risk ……………………………………………………………………………… 116,580 10,041 126,621 116,580 10,041 126,621
Guarantees for customers:Maximum potential amount of future payments ……………………………………………………………… 200,180 6,067 206,247 200,180 6,067 206,247 Amount of substantial risk ……………………………………………………………………………… 110,834 5,350 116,184 110,834 5,350 116,184
Total:Maximum potential amount of future payments ……………………………………………………………… ¥922,221 267,438 1,189,659 ¥922,221 132,798 1,055,019Amount of substantial risk ……………………………………………………………………………… 586,798 89,676 676,474 586,798 89,676 676,474
Original RevisedMillions of Yen Millions of Yen
2002 2002Guarantees for Guarantees for
Monetary Total Monetary Totalindebtedness indebtedness
Guarantees for subsidiaries:Maximum potential amount of future payments ……………………………………………………………… ¥ 589,051 140,196 729,247 ¥ 589,051 140,196 729,247 Amount of substantial risk ……………………………………………………………………………… 391,223 140,156 531,379 391,223 140,156 531,379
Guarantees for associated companies:Maximum potential amount of future payments ……………………………………………………………… 252,096 142,278 394,374 252,096 6,648 258,744Amount of substantial risk ……………………………………………………………………………… 164,120 6,522 170,642 164,120 6,522 170,642
Guarantees for customers:Maximum potential amount of future payments ……………………………………………………………… 213,790 6,976 220,766 213,790 6,976 220,766 Amount of substantial risk ……………………………………………………………………………… 122,327 2,442 124,769 122,327 2,442 124,769
Total:Maximum potential amount of future payments ……………………………………………………………… ¥1,054,937 289,450 1,344,387 ¥1,054,937 153,820 1,208,757Amount of substantial risk ……………………………………………………………………………… 677,670 149,120 826,790 677,670 149,120 826,790
Original RevisedThousands of U.S. dollars Thousands of U.S. dollars
2003 2003Guarantees for Guarantees for
Monetary Total Monetary Totalindebtedness indebtedness
Guarantees for subsidiaries:Maximum potential amount of future payments ……………………………………………………………… $4,375,765 947,604 5,323,369 $4,375,765 947,604 5,323,369 Amount of substantial risk ……………………………………………………………………………… 2,989,883 618,012 3,607,895 2,989,883 618,012 3,607,895
Guarantees for associated companies:Maximum potential amount of future payments ……………………………………………………………… 1,631,231 1,226,864 2,858,095 1,631,231 106,731 1,737,962Amount of substantial risk ……………………………………………………………………………… 969,884 83,535 1,053,419 969,884 83,535 1,053,419
Guarantees for customers:Maximum potential amount of future payments ……………………………………………………………… 1,665,391 50,474 1,715,865 1,665,391 50,474 1,715,865 Amount of substantial risk ……………………………………………………………………………… 922,080 44,509 966,589 922,080 44,509 966,589
Total:Maximum potential amount of future payments ……………………………………………………………… $7,672,387 2,224,942 9,897,329 $7,672,387 1,104,809 8,777,196Amount of substantial risk ……………………………………………………………………………… 4,881,847 746,056 5,627,903 4,881,847 746,056 5,627,903 (The following paragraphs and table are omitted)
OtherGuarantees
OtherGuarantees
OtherGuarantees
OtherGuarantees
OtherGuarantees
OtherGuarantees
2