Nagaland 2004
298
-
Upload
khangminh22 -
Category
Documents
-
view
0 -
download
0
Transcript of Nagaland 2004


Cover Design: Rokovor Vihienuo

Government of Nagaland

Nagaland State Human Development Report
© Department of Planning & Coordination Government of Nagaland
First Published: October 2004
All rights reserved. No part of this publication may be reproduced, stored, or transmitted in any form or by any means without the prior permission from the Publisher
Published byDepartment of Planning & CoordinationGovernment of Nagaland
Designed, Typeset and Printed by New Concept Information Systems Pvt. Ltd., New Delhi. Phone: +91 11 26972748, 26973246 Fax: +91 11 26972743 Email: [email protected]
PriceRs 750.00
While every care has been taken to present accurate data, oversights may have occurred. Please convey errors, if any, to the Planning & Coordination Department, Government of Nagaland

MessageIt is a matter of great joy and pride that the first Human Development Report (HDR) of Nagaland State is being published after more than 40 years of the inception of the State. I take this opportunity to extend my heartiest congratulations to all those, including the United Nations Development Programme (UNDP), a source of inspiration behind this document, for the initiative and pains they have taken to produce this historic document.
The HDR has brought out not only the socio-economic and cultural background of the State of Nagaland but also the immense potentiality of its human and natural resources to emerge out of its economic backwardness. Though the State has a history mired in long periods of conflict and violence, it has not lagged behind in terms of parameters of human development. This innate strength of the State needs to be harnessed and developed by the “will to toil, deliver and govern”. The HDR has sought to chart a course for development of the State, focussing attention on the need for further strengthening of the human capital, which in conjunction with rich social capital available in the State in the form of vibrant democratic institutions, can work wonders.
Over the years, the development paradigms have changed along with changing times. The gaps and disparities in the development outcomes across the State and vis-á-vis their quality as brought out by the HDR, will help the government in re-assessing and re-orienting its priorities while drawing up policies to tackle the problems of poverty, health, education and rural development.
A major handicap faced during the preparation of the HDR has been the lack of data for which some of the estimates are tentative and outcome in the realm of probability. The HDR has, therefore, felt the imperative need for regular collection and collation of data and the evolution of a well defined system and mechanism in the government for fine-tuning of the development programmes and proper monitoring of their implementation on the ground. I am sure, the policy makers of the State and other stakeholders will make full use of the HDR and draw extensively on its findings and recommendations to chalk out and implement the future plans aimed at improving the quality of life of the people of Nagaland.
(Shyamal Datta)
RAJ BHAVAN KOHIMA
GOVERNOR OF NAGALAND

MessageNagaland has, since its formation in the year 1963, achieved significant progress in the various parameters that contribute towards the all round development and progress of the State. This has been largely possible, despite the challenges due to insurgency and remoteness, because of the vibrant people-centred traditions and the strong, traditional social base of the Naga populace of the State. It is a matter of great happiness that the State Human Development Report documenting the State’s experience with human development and economic progress is being brought out.
This first ever comprehensive attempt to assess the status of human development in the State, Nagaland State Human Development Report is an important document which looks into and examines the achievements and shortfall of largely government based interventions in various sectors affecting human development in the State. The Report also pioneers for Nagaland the estimation of District incomes for the State, thus providing the first ever quantification of the extent of disparity among the different districts of the State. The disparities in the development outcomes across the State, vis-á-vis the aspired standards, as brought out by the Report will help the Government in reassessing and reorienting its priorities and formulate policies to tackle the challenges in providing equitable incomes, employment and access to health and education. The underlying theme of the Report is to take stock of the progress in the State since Statehood, and to evolve concrete ways towards becoming a prosperous State by 2020. I am confident that the Report will provide the stakeholders with an effective policy planning instrument not only to allocate resources for human development in the best possible manner, but also to leverage greater resources to these sectors.
I would like to thank the UNDP and the Planning Commission for their support in preparing the Nagaland State Human Development Report. I am sure this partnership will continue in the future endeavours of the State in bringing human development to the centrestage in policy formulation, resource allocation and other initiatives. I also commend the hard work of the State’s Planning Department in bringing out this document.
(NEIPHIU RIO)
CHIEF MINISTERNAGALAND
KOHIMA 15th September, 2004
MessageWe congratulate the Government of Nagaland for preparing its first Human Development Report.
This Report enhances the understanding of the dynamics of growth and human development linkages in the State. It also highlights the challenge of promoting human security and development, including effective provision of basic services, in Nagaland.
The Report makes an important contribution to the discussion on governance. It points out that the traditional socio-political structures of family, clan and community interact in a meaningful manner with formal structures of local democracy.
The Report highlights some of the government initiative towards equitable and sustainable human development. It documents the State Government's efforts towards environmental conservation and provides glimpses of Nagaland's experience with Communitisation of essential services such as health, education, power, rural tourism and rural power supply.
We once again felicitate the Government of Nagaland for this exercise, which reflects its commitment towards sustainable human development. We look forward to the follow-up which is important for achieving human development goals.
Rohini Nayyar Maxine OlsonAdviser (RD), Planning Commission UNDP Resident Representative &Government of India UN Resident Coordinator
Planning Commission

vi
ForewordThe Nagaland State Human Development Report (NSHDR) aims at drawing attention to issues pertaining to human development by reviewing the progress made in the areas of sustainable income and livelihood, health, education and other correlates, which are critical for quality of life of the people. The Report has attempted to identify strengths as well as gaps and deficiencies, thereby signalling areas that require specific policy interventions. This way, the NSHDR serves simultaneously as a programming tool and a monitoring instrument for the interventions and an advocacy device for raising more resources for the State to invest in its people.
Nagaland has made impressive strides in the last few decades, particularly, in areas such as attainments in literacy, health related indicators, health care services, water and sanitation, power, governance, women in development, and fiscal reforms. The unique initiative of ‘Communitisation’ of public institutions and services, in the sectors of education, health care and power distribution, has enhanced accountability and involvement of both the community and the Government towards greater effectiveness. Enormous potential exists in the State for eco-tourism. It is time when the strengths, richness and abundance of natural and human resources and the social capital of Nagaland are harnessed. There is an air of hope and expectation among the people of Nagaland. The need is to change the mindset, which generally looks at the various structural handicaps of Nagaland, like its remoteness and backwardness, as blocks or limitations, and begin to view them as challenges and potentials waiting to be channelled and realised.
A major deficiency in the State needing urgent attention is the poor statistical base on Nagaland, both from State and central agencies. This has serious implications for planning and resource allocation. The quantification of the inferences and the analysis in this document, too, has been something of a challenge due to non-availability of reliable data. Therefore, the statistical computations may not be wholly precise.
This Report presents the status in different sectors which have a bearing on human development in the State and a strategy to ‘hop, step and jump’ so as to realise the vision of emerging as a front-runner among the states of the country in the next 15–20 years. There is absolutely no doubt that proper utilisation and harnessing of the strengths in the society as well as in the State’s environment, and the implementation of the strategies enumerated in different chapters of this Report will take the State on a high growth path and help in attaining this goal.
The Report captures the status as on January 2004. There have been significant developments since then in 2004. A special reference may be
vii
made of the creation of three new districts of Kiphire, Longleng and Peren in the underdeveloped areas of the State. This is a major exercise in taking administration closer to the people, particularly the poverty stricken ones. In the year 2004, new economic initiatives have been embarked on through setting up the State Bamboo Mission, a Board to promote organic farming and the State Agriculture Marketing Board. In the social sector, too, important initiatives have been taken in 2004. These include setting up an autonomous Board for the Naga Hospital, which is expected to develop it as an institution of excellence. Communitisation of elementary education has been extended to all the elementary schools in the State. In terms of qualitative improvement, the number of nil result high schools has come down to 5 from the figure of 35 in 2003. All these would indicate that the process of realising the Vision has already begun.
This Report is the first State Human Development Report for Nagaland. It is the result of a tremendous amount of co-operation, collaboration and combined efforts in search of clear perspectives and goals. These efforts went beyond inter-sectoral and inter-departmental cooperation and reached out to various stakeholder groups in Naga society. A special mention has to be made about the painstaking and consistent efforts made by Mrs Aparna Bhatia, IES, in steering this Report through its various stages over a period of 18 months. She has made ceaseless efforts in, not only coordinating with all the stakeholders, but in steering the preparation process through its different stages, from preparation of background papers, supervision of field survey, to actual drafting of the Report and incorporation of the comments and suggestions of a wide spectrum of representatives from the State Government, acedemicia, and civil society. Mr Charles Chasie and Mr V. Shashank Shekhar, IAS, who provided critical inputs in drafting the Report, have ably assisted her in this endeavour. Mr Charles Chasie has also edited the Report. The Report in its present form, which is the result of colossal efforts by many individuals and organisations, presents the achievements and gaps in the development path of the State in the first ever attempt to provide comprehensive quantitative and qualitative insight into the rich diversity and uniqueness of Nagaland. It is hoped that this Report will help to streamline the development process and strategise key interventions so as to fulfil our cherished dream of emerging as a front-runner among the states in the country by harnessing the immense cultural, social and natural resources.
R.S. Pandey, IASChief Secretary
Government of Nagaland
viii
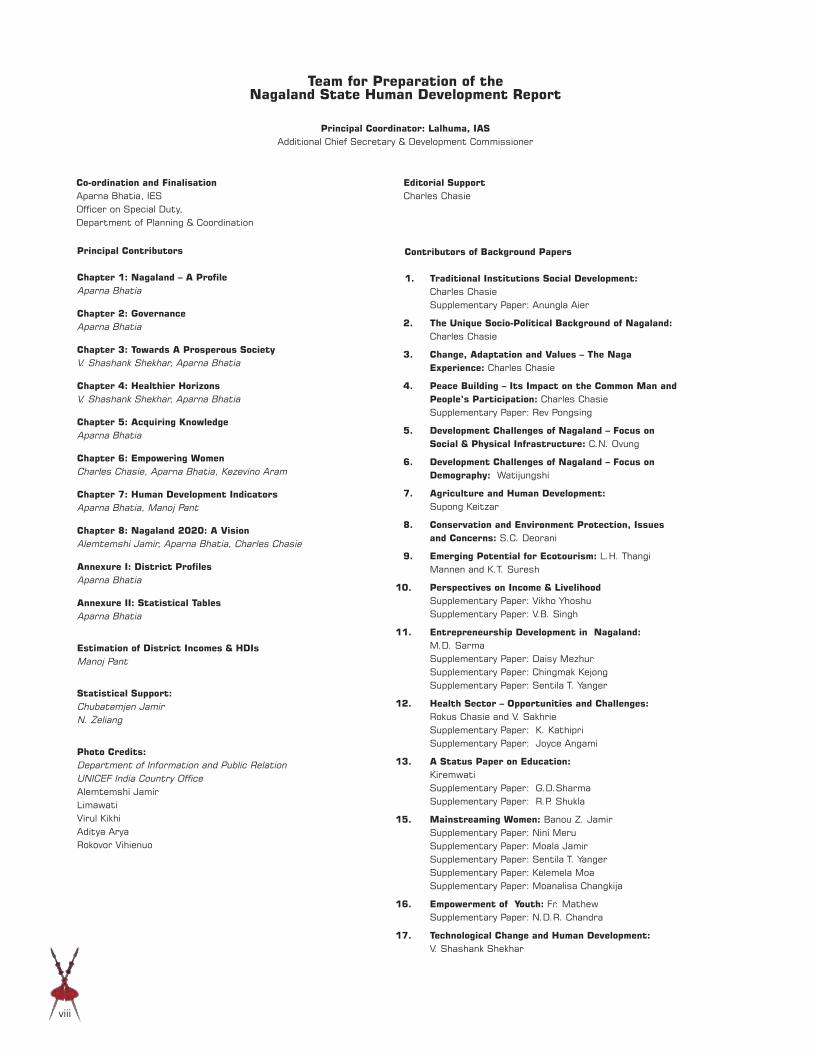
Team for Preparation of the Nagaland State Human Development Report
Principal Coordinator: Lalhuma, IASAdditional Chief Secretary & Development Commissioner
Co-ordination and Finalisation Editorial Support Aparna Bhatia, IES Charles ChasieOfficer on Special Duty, Department of Planning & Coordination
Contributors of Background Papers 1. Traditional Institutions Social Development: Charles Chasie Supplementary Paper: Anungla Aier
2. The Unique Socio-Political Background of Nagaland: Charles Chasie
3. Change, Adaptation and Values – The Naga Experience: Charles Chasie
4. Peace Building – Its Impact on the Common Man and People’s Participation: Charles Chasie Supplementary Paper: Rev Pongsing
5. Development Challenges of Nagaland – Focus on Social & Physical Infrastructure: C.N. Ovung
6. Development Challenges of Nagaland – Focus on Demography: Watijungshi
7. Agriculture and Human Development: Supong Keitzar
8. Conservation and Environment Protection, Issues and Concerns: S.C. Deorani
9. Emerging Potential for Ecotourism: L.H. Thangi Mannen and K.T. Suresh
10. Perspectives on Income & Livelihood Supplementary Paper: Vikho Yhoshu Supplementary Paper: V.B. Singh
11. Entrepreneurship Development in Nagaland: M.D. Sarma Supplementary Paper: Daisy Mezhur Supplementary Paper: Chingmak Kejong Supplementary Paper: Sentila T. Yanger
12. Health Sector – Opportunities and Challenges: Rokus Chasie and V. Sakhrie Supplementary Paper: K. Kathipri Supplementary Paper: Joyce Angami
13. A Status Paper on Education: Kiremwati Supplementary Paper: G.D.Sharma Supplementary Paper: R.P. Shukla
15. Mainstreaming Women: Banou Z. Jamir Supplementary Paper: Nini Meru Supplementary Paper: Moala Jamir Supplementary Paper: Sentila T. Yanger Supplementary Paper: Kelemela Moa Supplementary Paper: Moanalisa Changkija
16. Empowerment of Youth: Fr. Mathew Supplementary Paper: N.D.R. Chandra
17. Technological Change and Human Development: V. Shashank Shekhar
Principal Contributors
Chapter 1: Nagaland – A ProfileAparna Bhatia
Chapter 2: GovernanceAparna Bhatia
Chapter 3: Towards A Prosperous SocietyV. Shashank Shekhar, Aparna Bhatia
Chapter 4: Healthier HorizonsV. Shashank Shekhar, Aparna Bhatia
Chapter 5: Acquiring KnowledgeAparna Bhatia
Chapter 6: Empowering WomenCharles Chasie, Aparna Bhatia, Kezevino Aram
Chapter 7: Human Development IndicatorsAparna Bhatia, Manoj Pant
Chapter 8: Nagaland 2020: A VisionAlemtemshi Jamir, Aparna Bhatia, Charles Chasie
Annexure I: District ProfilesAparna Bhatia
Annexure II: Statistical TablesAparna Bhatia
Estimation of District Incomes & HDIsManoj Pant
Statistical Support:Chubatemjen JamirN. Zeliang
Photo Credits:Department of Information and Public RelationUNICEF India Country OfficeAlemtemshi Jamir LimawatiVirul KikhiAditya AryaRokovor Vihienuo

ix
The first Nagaland State Human Development Report is an initiative of the Government of Nagaland, supported by the Planning Commission, Government of India and the United Nations Development Programme (UNDP). The Report has been prepared, under the supervision of the Chief Secretary, Nagaland, by the State’s Planning and Coordination Department.
The chapters of the Report are based on background papers and supplementary papers, contributed by policy makers and academicians within and outside the State. Extensive discussions were held with officials and departments of the Government of Nagaland. Mr V. Shashank Shekhar, IAS, and Mr Charles Chasie assisted in conceptualisation of the chapters and tirelessly reviewed the draft chapters to ensure readability and factual correctness. Mr Charles Chasie also provided editorial support. A special mention needs to be made of the guidance and support of Mr Lalhuma, IAS, Mr Alemtemshi Jamir, IAS, and Mrs Banuo Z. Jamir, IAS, who provided valuable inputs and spared time to go through to the numerous drafts of the chapters. Many others assisted in the preparation by providing comments and suggestions: Mr Lalthara,IAS, Mr H.K. Khulu, IAS, Dr S.C. Deorani, IFS, Mr Temjen Toy, IAS, Mrs Thangi Mannen, Mr Keppen Rengma , Mr Meren Aier, Mr Rokus Chasie and Mr Kiremwati. Ms Anu Aggarwal, IAS, went over the draft chapter on Empowering Women and gave valuable suggestions. Mr Rokovor Vihienuo, a young promising entrepreneur, designed the separator for the section on district profiles.
Dr Manoj Pant, Professor, Jawaharlal Nehru University, New Delhi estimated the Human Development Indicators and prepared the Technical Note for the Report. Dr Kezevino Aram and Prof. Subramanian from Shanti Ashram, Coimbatore, assisted in initial conceptualisation of the structure, interactions with the contributors of background papers and the consolidation of the background papers. The officers and staff of Directorate of Economics and Statistics provided the database and undertook a sample survey to estimate the district incomes. We would like to especially thank Mr Chubatemjen, Mr N. Zeliang and Mr Remchemkangba of DES for their assistance in collection and validation of data for the Report.
We gratefully acknowledge the support and encouragement provided by His Excellency the Governor of Nagaland, and the Council of Ministers, who took keen interest in the preparation of the Report and actively participated in commenting on the draft chapters and provided critical inputs, which have enriched and enhanced the quality of the Report.
Acknowledgements

x
The Planning Commission, Government of India, has provided additional central assistance for the Report. We wish to thank Dr Rohini Nayyar and Mr B.N. Nanda for their encouragement and suggestions.
The Human Development Resource Centre (HDRC) at the UNDP India Country Office supported the endeavour since its inception till completion. Dr Maxine Olson, Resident Representative and Mr Maurice Dewulf, Senior Deputy Resident Representative, took a personal interest to ensure that the Report was prepared without delays. The inputs and advice of Dr Seeta Prabhu, Dr Suraj Kumar, Ms Ritu Mathur, Ms Meenakshi Kathel and Mr V. Srinivasan have been extremely valuable in the finalisation of the Report.
Aparna Bhatia, IES Co-ordinator Team NSHDR
xi
ANM Auxiliary nurse midwifeAPMC Agriculture Productions Marketing Committee ARI Acute respiratory infection BPL Below poverty lineCBR Crude birth rateCDR Credit deposit ratio CDR Crude death rateCHC Community health centreCLASS Computer Literacy and Studies in School DDI District domestic incomeDDP District domestic productDES Department of Economics and StatisticsDIET District Institute of Educational TrainingDONER Development of North-East RegionDPDB District Planning and Development Board DWCRA Development of Women and Children in Rural AreasEBRC Educational Block Resource Centre ECS Eleutheros Christian Society EDP Entrepreneurship Development ProgrammeEQUIP Educational Quality Improvement ProgrammeFFLP Farmers’ Functional Literacy ProgrammeGDI Gender-related development index GDP Gross domestic product GEM Gender empowerment measure GNRC Guwahati Neurological Research CentreHDI Human development indexHDR Human Development ReportHPI Human poverty indexHSLC High school leaving certificateICDS Integrated Child Development ServicesICMR Indian Council of Medical ResearchIDD Iodine deficiency disorderIEC Information, education, communicationIMP Indigenous medicine practitionerIMR Infant mortality rate ISM & H Indigenous system of medicine and homoeopathy IUD Intra-uterine deviceIVD Intra-venous drugMDG Millenium Development GoalsMMR Maternal mortality rateMPW Multi-purpose worker NABARD National Bank for Agriculture and Rural DevelopmentNACO National AIDS Control OrganisationNSACS Nagaland State AIDS Control SocietyNASSCOM National Association for Software and Service CompaniesNBCC Nagaland Baptist Church Council
Abbreviations

xii
NBSE Nagaland Board of School EducationNDO Nagaland Development OutreachNEEPCO North Eastern Electric Power CorporationNEFA North-East Frontier AgencyNEHU North-Eastern Hill UniversityNEPED Nagaland Environment Protection and Economic Development NFHS National Family Health SurveyNHDR National Human Development ReportNHTA Naga Hills-Tuensang Area NMA Naga Mothers’ AssociationNSACS Nagaland State AIDS Control Society NSCN National Socialist Council of Nagaland NSDCF Nagaland State Dairy Cooperative Federation LtdNSDCF Nagaland State Dairy Cooperative Federation NSHDR Nagaland State Human Development ReportNSSO National Sample Survey OrganisationPHC Primary health centrePHED Public Health and Engineering DepartmentPLWHA People living with HIV/AIDS RAP Restricted Area PointRD Rural Development RFLP Rural Functional Educational Programme SC Sub-centreSCERT State Council of Educational Research and Training SDP State domestic productSHG Self-help groupSSA Sarva Shiksha Abhiyan STD Sexually transmitted diseaseSUDA State Urban Development AgencyTFR Total fertility rateTRC Terraced rice cultivationUFS Urban frame survey UNDP United Nations Development Programme VDB Village Development BoardVEC Village Education CommitteeVHC Village Health Committee VPC Village Power CommitteeWDC Women’s Development Committee
xiii
Overview 1
CHAPTER 1
Nagaland – A Profile 11 Demography 14 Traditions and Historical Evolution 19 Overall Economy and Sectoral Contributions 22 The Way Ahead 33
CHAPTER 2
Governance 35 Evolution of Governance Systems 37 New Governance Systems 43 Building on Social Capital 51 General Administration…Beginnings of Change 54 Governance and Development 55 The Way Ahead 57
CHAPTER 3
Towards a Prosperous Society 59 Economic Performance 61 Natural Resources to Build on 69 Sectors for Growth and Employment: Agriculture & Allied 73 Sectors for Growth and Employment: Industry 80 The Way Ahead 86
CHAPTER 4
Healthier Horizons 89 Demographic and Health Status 92 Burden of Disease 96 Access to Health Care and Related Issues 102 Some Policy Issues 108 Health Correlates 111 The Way Ahead 113
Contents

xiv
CHAPTER 5
Acquiring Knowledge 117 Education and Society 121 Access to Education 130 Quality of Educational Experience 134 Policy Initiatives and Implications 137 The Way Ahead 142
CHAPTER 6
Empowering Women 145 Status of Women: An Overview 147 Traditions and Gender Based Roles 152 New Changes and Policy Influences 154 Strategies for Better Income and Livelihood 157 The Way Ahead 164
CHAPTER 7
Human Development Indicators 167 Human Development Reports 169 Nagaland’s Human Development Indices 175 Technical Note 180
CHAPTER 8
Nagaland 2020 – A Vision 189 The Will to Excel 191 Peace: The Basic Pre-requisite for Inspiration and Hope 192 Population Stabilisation: A Pre-requisite for Fast Paced 195 Progress and Equitable Development National and International Connectivity 196 Transforming a Tribal Society 196 People and Wealth: Issues of Per Capita Income 196 Sustainable Agriculture 198 Industrialisation: The Emerging Area of Dynamic Growth 200 Services 202 Infrastructure Reference Points: Technology, Connectivity, 202 Communication and Power Social Sector 203 Action-oriented Mission for Developed Nagaland 208

xv
ANNEXURE 1
District Profiles 211
ANNEXURE 2
Statistical Tables 229
Bibliography 272
Boxes
1.1 Nagaland at a Glance 161.2 Census in Nagaland 181.3 Battle of Kohima 241.4 Intrinsic Strengths 342.1 Traditional Institutions and Social Development 402.2 Structure for Administration of Justice 442.3 Good Governance Project: Powering Change through DPDBs 452.4 The Press 462.5 Powers and Duties of the Village Development Board 482.6 Urban Local Bodies under Nagaland Municipal Act 2001 502.7 The ‘Triple T’ of Communitisation Process 522.8 Partners in Human Development 532.9 Rightsizing the Organisation in PHED 542.10 Imagine Nagaland: Shaping Development Priorities 56 through Youth’s Aspirations3.1 Our Forest Wealth 703.2 Bamboo—the Wonder Plant 723.3 Jhum 763.4 NEPED Experience 793.5 KOMUL 813.6 Entrepreneurs’ Associates 833.7 Tuophema Experience 843.8 Celebrating the Naga Heritage 844.1 Major disease/ailment patterns seen among the 97 population of the region4.2 Nagaland's Success in Alleviating Iodine Deficiency 994.3 AIDS Scenario: Strengths & Weaknesses 1014.4 Tuensang's Success in Combating HIV/AIDS 102
Contents

xvi
4.5 Nagaland Legislative Forum 1034.6 Communitisation: Responsibilities of Government & 109 Community5.1 Morung or Thehu/Kichuki 1215.2 Centres for Higher Learning in North-Eastern States 1315.3 What Stakeholders of Education in Nagaland Think 1385.4 Rusoma’s Success Story 1405.5 Objectives of Sarva Shiksha Abhiyan 1416.1 Positive Sex Ratio: Mokokchung’s Achievements 1506.2 Traditional Position of Women in Ritual Celebrations 1526.3 Naga Traditions 1536.4 Inspiring Leadership 1616.5 Weaving Dreams on Handloom 1636.6 Mothers’ Journey from Despair to Hope 1657.1 How do the Human Development Goals relate to the 173 Millennium Development Goals7.2 UNDP—Millennium Development Goals 1747.3 Level of Human Poverty in the Millennium Development 178 Goals8.1 Developed Nagaland: Swot Analysis 1928.2 An Agenda For Peace & Development 1938.3 2004: Year of Youth Empowerment 1948.4 Strategies for Population Stabilisation 1958.5 Per Capita Incomes: Middle or Fore Ranking State In 2020? 1978.6 Conservation of Biodiversity—A Responsibility & 198 Potential Wealth8.7 Agriculture: Engine for Growth and Rural Transformation 1998.8 Strategy for Dividends from Industrialisation 2028.9 The ‘X Road’ 2038.10 Global Strategies for Universalisation of Elementary 204 Education8.11 Hon’ble President Sets Agenda for Excellence in Higher 206 Education8.12 Global Strategies for Achieving Better Health for all People 207
Tables
1.1 Demographic Profile of Nagaland 171.2 Tribes and Festivals of Nagaland 191.3 Progress Made During 40 Years of Statehood 231.4 Land Use Pattern 27

xvii
Contents
2.1 Spread of Village Development Boards 482.2 Distribution of Urban Population 493.1 Composition of Public Spending 673.2 District-wise Average Jhum Cycle 773.3 Area and Production of Principal Crops in Nagaland 774.1 Nagaland’s Health Profile 924.2 Mortality Profile Disaggregated by Gender 954.3 Nutritional Status of Children in Nagaland 964.4 Morbidity Patterns 974.5 Child Morbidity 984.6 Profile of Drug Users 1004.7 Number of Health Centres Communitised 1084.8 Status of Sub-Centres 1094.9 Analysis of Health Sector Expenditure 1104.10 Rural Drinking Water Supply Status 1125.1 Indicators of Educational Attainments 1205.2 Literacy Rate Across Districts 1235.3 Enrolment Percentage 1255.4 Reasons for Children Not Attending School in Nagaland 1265.5 Early Educational Journey 1275.6 Status of Child Development Services 1285.7 HSLC Examination Pass Percentage 1295.8 Growth of Educational Institutions 1315.9 Colleges Affiliated to Nagaland University 1325.10 Enrolment Status 2000–2002 1325.11 Engineering and Medical Colleges in North-Eastern States 1326.1 Comparative Fact Sheet on Women 1486.2 Distribution of Women by Employment Characteristics 1506.3 NEPED’s SHG Experience 1597.1 Human Development Indices 1767.2 Human Development Indices for North-Eastern States 1797.3 Sample Size 1888.1 Current Growth Rates in Various Sectors of the Economy 197
Figures
1.1 Nagaland 151.2 Population 171.3 Per Capita Incomes Estimated by Sample Survey 271.4 Mineral Belts 29

xviii
Contents
2.1 Patterns of Urbanisation 493.1(a) India’s Net Domestic Product by Economic Activity 63 (2001–02)3.1(b) Nagaland’s NSDP by Economic Activity (2000–01) 633.1(c) NSDP Per Capita at Constant (1992–93) prices (in Rs.) 633.2 Employment Patterns 643.3 Nagaland's Employment Strategy 653.4 Area Under Various Types of Agriculture (2000-01) 733.5 Potential Crop Zones 754.1 Pyramid of Age Distribution 934.2 Total Fertility Rate 934.3 Extent and Use of Contraceptives 944.4 Percent Distribution of Currently Married Women by 94 Contraceptive Method Used 4.5 HIV/AIDS: Transmission Routes 1004.6 The 'Golden Triangle': Proximity to North-East India 1014.7 Healthcare Infrastructure: Coverage and Gaps 1044.8 Reach of Health Education 1064.9 Open Defecation 1114.10 Access to Sanitation Facilities 1114.11 Housing Characteristics by Districts 1125.1 Literacy Status in 1961 1235.2 Pattern of Enrolment 1255.3 District Wise Enrolment Rates 1265.4 Trend in Dropout Rates 1275.5 Pass Percentage in HSLC Examination 1295.6 Comparative Results of XII Standard 1305.7 Adequacy of Facilities in Elementary Schools 1355.8 Public Expenditure on Education 1426.1 Female Literacy Rate Pattern 1496.2 Anaemia Among Naga Women 1496.3 Number of Workers by Occupation, Sex and Place of 154 Residence7.1 Calculating the Human Development Indices 1727.2 Human Development Indices 1767.3 Human Development Indicators 1777.4 Comparison of Selected Indicators of GDI 1778.1 Nagaland's Growth Trajectory 1978.2 The Virtuous Circle of Rural Transformation 2008.3 Educational Quality Improvement Programme – 'EQUIP' 205

1Overview
OverviewIn the years before 1990, development was viewed with the uni-dimensional lens of economic development and inter-country comparisons on development rested on comparing the national per capita incomes. The first global Human Development Report (HDR), prepared by the United Nations Development Programme (UNDP) in 1990 under the leadership of Dr. Mahbub-ul-Haq and Dr. Amartya Sen, argued that income alone does not capture all dimensions of human development and that a composite index of health, education and income is a much more comprehensive measure of development. The first HDR broadened the concept of development, taking into cognisance the multidimensional and multifaceted aspects of human development.
The HDRs state that the process of human development must transmit itself, essentially by means of enlarging the choices of all persons concerned. The most critical of these wide ranging choices are the ability to lead a long and healthy life, to be educated and to have access to resources required for a decent standard of living.
Following the example of the global HDR, several countries began preparing HDRs at the national and even sub-national (state) levels, in order to enable human development analysis at a more disaggregated level, relevant for policy and action on the ground. The state HDRs aim to present and analyse the status of human development at the district level. They highlight existing intra-state disparities and focus the attention of policy makers on issues needing urgent attention.
The Nagaland State Human Development Report (NSHDR) aims to present the status of human development in Nagaland. It analyses the enabl ing and constrain ing factors towards sustainable human development within the unique socio-cultural settings of the State. The NSHDR could be a useful tool for future development planning. It advocates allocating greater resources towards human development sectors on a priority basis. Another important aspect of the NSHDR is that it presents district level data for many of the indicators for the first time. It is hoped that the data presented in the NSHDR would be useful to development planners and researchers globally.
Nagaland
If India is a country that boasts of ‘unity in diversity’, then the North-East is its most visible embodiment. Among the North-Eastern states, Nagaland stands out as a land of diverse tribes, systems of governance,
The Nagaland State Human Development Report (NSHDR) analyses the enabling and constraining factors towards sustainable human development within the unique socio-cultural settings of the State.

2 Nagaland State Human Development Report
cultures, sheer colour and variety. As its 16 major tribes hold their festivals each calendar month of the year, Nagaland is often referred to as the ‘land of festivals’. Nagaland represents sociological and anthropological gold mines because it is still scientifically unexplored.
Nagaland emerged as a State, out of the Naga Hills district of Assam and NEFA province, in 1963. This late start meant that the State lost out on the benefits of the first three Five Year Plans. What is more, the State has had to confront insurgency on a continuous basis, committing much of its scarce resources to administrative and related expenditures. Though Nagaland has been confronted with special constraints and challenges in the areas of politics, economics, geographical terrain, and development, especially of infrastructure, the ‘social capital’ and resilience of the Naga village communities are not only giving hope but also beginning to help overcome the other difficulties. Indeed, in spite of its many constraints and challenges, Nagaland has continued to chart new developmental paths for itself and has shown a unique model for the country. The Village Councils, the Village Development Boards, and the recently introduced Communitisation of Public Institutions and Services Act, 2002, in areas like education, health, power, etc., which have already been acknowledged as successful, are a case in point.
Income and livelihood, health and education constitute the thrust areas of a Human Development Report. This is because they influence and affect the quality of life of the people the most. The very concept of human development demands an all-round interface between these three elements. Apart from these, this Report looks at the evolution and status of governance system in the State and its impact on development. The status of women in Nagaland is looked at through the lens of education, health and income and livelihood. The Report also discusses the human development indices and the Millennium Development Goals for Nagaland. Finally, an attempt has been made to provide a perspective for a developed Nagaland by 2020, through a conceptual basis, rooted in what is possible and practical on the ground. The NSHDR has in this way tried to identify and prioritise the core strategies and programmes that will help create a developed Nagaland.
Governance
Naga traditional life revolved around the village. The formation of Nagaland State in 1963 was a critical step in the evolution of Nagaland, which gave the people the opportunity for peace, stability, accelerated investment and economic development. The Naga people have had a very distinct and complex relationship with modern democracy. So far, they have participated in ten general elections, and seen 17 chief ministers.
Nagaland emerged as a State, from out of the Naga Hills district of Assam and NEFA province, in 1963. This late start meant that the State lost out on the benefits of the first three Five Year Plans.

3Overview
In the past four decades there has been remarkable extension of the administrative reach to the far-flung corners of Nagaland. Today, in partnership with the State Government, Village Councils are an important component of modern governance system in Nagaland. While the District Planning and Development Boards provide the needed flexibility to ensure a responsive and holistic approach towards development for the district, linkages to the grassroots through the Village Development Boards have been established for delivering the rural developmental objectives.
The present administrative framework in Nagaland is essentially similar to that in other states of the country. However, within this larger framework, Nagaland has distinct characteristics, imparting uniqueness to the governance experience in the State. Article 371 (A) of the Indian Constitution remains a cornerstone to policy making in the State, and has ensured protection and preservation of the unique traditions and customary laws of the State. On the other hand, it has also contributed to depriving the State of economic benefits of institutional credit, inflow of private investment, etc.
A major strength that contemporary Naga society has inherited is the 'social capital' that has stemmed out of traditional institutions and practices. There is strong social bonding and community spirit, and absence of caste and social discrimination. The State has initiated the unique concept of Communitisation of public institutions and services in order to build partnership between Government and the people through delegation of management responsibilities to the community so that the performance of the public utilities improve. The Nagaland experience of Communitisation is the first in the world. Thus, with the introduction of Village Councils, the Village Development Boards, and Communitisation of essential services in the areas of health, education, power, rural tourism, rural water supply, etc., the Government is gradually reserving for itself the role of facilitator and enabler. With this, the ‘trickling down’ concept of development has been effectively abandoned and it is hoped that there would be a ‘bubbling up’ of development from the grassroots, that is equitable and suitable to the unique context of Nagaland.
Economic Well-Being
The developmental experience of Nagaland has been full of challenges. Apart from its late start, geographical remoteness and inaccessibility, hilly terrain, lack of infrastructure, population composition, and scarce resource base, the State also had to face continuous insurgency, spending much of its resources on administration and related costs at the expense of development.
One of the biggest concerns of the State now is the burgeoning numbers of educated unemployed youth which, if not tackled effectively, could
A major strength that contemporary Naga society has inherited is the ‘social capital’ that has stemmed out of traditional institutions and practices. There is strong social bonding and community spirit, and absence of caste and social discrimination.

4 Nagaland State Human Development Report
lead to a vitiating of the whole developmental environment. In recent years, there has also been a noticeable rise in under-employment and disguised unemployment. Two of the measures taken at the political level have been the declaration of 2004 as the Year of Youth Empowerment and the setting up of the Chief Minister’s Corpus Fund to generate self-employment for unemployed youth.
The majority of the workforce of the State is either in the rural areas or in the unorganised urban sector. Naga society was and continues to be predominantly agrarian. Agriculture (27.48% ), construction (15.43%), transport and communication (18.14%) and public administration (12.73%) comprise three-fourths of the State’s NSDP. The near absence of contribution from manufacturing (0.74%) and banking and insurance (1.32%) reflects the lack of industrial activity in Nagaland and the weak supporting environment.
The State is making efforts to exploit its natural resources and tap into other potential areas. As a hilly State, with so many constraints, Nagaland cannot compete with others in conventional areas of development, especially in the primary and secondary sectors. The State has to plan intelligently and strategise its efforts, concentrating on its areas of strength and available resources. Some of these strengths are: Nagaland is richly endowed with mineral resources, including oil and
natural gas, limestone, marble, as well as metals like nickel, cobalt and chromium. The ownership of the resources is an issue that has to be resolved by the Government of India and Nagaland, keeping in mind the special provisions under Article 371(A) of the Constitution before optimum commercial exploitation of these hydrocarbon resources can be made.
Nagaland has tremendous forest resources. Its forest cover is above 80 percent while forest area is 56 percent, way above the recommended minimum. It is located in the Indo-Burma biodiversity hot spot, part of the South-East Asian environment that contributed the flowering plant to the world. The richness of Nagaland is shown by the fact that, even without any formal scientific study of its resources in general, two of the species from the State are mentioned in the Guinness Book of World Records. For the geographical size of a State like Nagaland, this is not to be taken lightly. Therefore, biotechnology, which also represents one of the sunshine sectors, presents Nagaland with a unique opportunity. There is great urgency, therefore, in this age of globalisation, for the government to immediately institute measures of protection for these riches and also to find adequate funding for research and documentation in order to reap benefits for the people.
Blessed with fertile soil and agreeable climate, Nagaland has great potential in the area of organic production/farming. Even without
The richness of Nagaland is shown by the fact that, even without any formal scientific study of its resources in general, two of the species from the State are mentioned in the Guinness Book of World Records.

5Overview
much effort, the State is already richly endowed with so many natural gifts such as wild fruits, variety of wildlife, herbal medicines and aromatic plants, bamboo, etc. Bamboo, the fastest growing and highest yielding renewable natural resource, growing extensively all over the State, constitutes one of the most important resources of Nagaland, The State is trying exploit these resources. One of the steps it has taken recently is setting up a Bamboo Mission.
The other sunshine sector, IT, also has potential for Nagaland. One of the advantages the State has is that its medium of instruction in schools is English. With adequate and appropriate training programmes, the State could take advantage of this sector.
With all the natural advantages and beauty of Nagaland, including cultural diversity of the tribes, eco- and community-based tourism present great potential. The creation of Naga Heritage Village, the annual Hornbill Festival, the Tourist Village at Tuophema, and adoption of Khonoma as the first Green Village in the country, with sponsorship from the Ministry of Tourism, Government of India, are ways in which the State Government is tapping into this potential. However, for long term success of the venture, and protection of the heritage of the people, research and documentation are urgently needed. In the meantime, the concept of maintaining People’s Bio-diversity Registers (PBR) could be put into effect with official support.
Harnessing of the resources and potentials—mineral, forest, agriculture, land, industry—and the opportunities in trade, the new sectors of IT or biotechnology require not only investments but also policy interventions to encourage such investments. Government’s role in making the investments cannot be understated but the limited availability of financial resources with the Government necessitates that private investment, both from within and outside the State, are encouraged. By focusing on economic growth, Nagaland can expect to reap benefits through increased levels of income, employment generation and reduction in economic disparities within the different regions of the State and the populace.
Health
Despite challenges such as insurgency and conflict, the indicators for health in Nagaland are impressive. The life expectancy at birth has been calculated at 73.4 years, way above the national average of 62.3 years, and much closer to the figures in developed countries. Infant mortality rate (IMR) at 42.2 per 1000 is also much better than the national average of 68 per 1000 live births. Similarly, under-five mortality rate, per 1000 live births, is 63.8 as against the national figure of 96. In terms of maternal mortality rate (MMR), the State’s figure of less than 1 per 1000 live births, against the national average of 5.4, is much closer to the figures in developed countries at 6–8 range.
Harnessing of the resources and potentials—mineral, forest, agriculture, land, industry—and the opportunities in trade, the new sectors of IT or biotechnology require not only investments but also policy interventions to encourage such investments.

6 Nagaland State Human Development Report
However, the total fertility rate (TFR) of Nagaland, at 3.77, is a cause for concern. The last decadal growth rate (1991–2001) at 64.4 percent, for instance, is the highest in the country, and 10–15 times higher than in developed countries. This poses a great demographic challenge for planners and policy makers in the State.
As of March 31, 2000, over 60 percent of the villages in Nagaland are still to be covered by any kind of basic health care such as dispensaries, etc. Based on population norms, as per 2001 Census, the State requires 25 CHCs, 100 PHCs and 666 sub-centres. Nagaland also requires improvements in secondary and tertiary health care. Specialised services are very limited and available only in Kohima, Mokokchung and Dimapur. The State has eight STD clinics, two TB hospitals, one mental hospital and DTCs for a population of 20 lakh. Most existing facilities are also ill-equipped and without access to modern diagnostic and therapeutic aids. There is only one CT scan machine in the whole state, at a private hospital. High-end investigations and immunology, as well as complicated cases of neurology, cardiology, cancer, etc., are all referred outside the State. This results not only in much inconvenience to the people but also tremendous financial losses to the State.
Strengthening and streamlining the areas of strength of the communities, while at the same time, carrying out awareness and education programmes and building infrastructure are required. Nagaland has a rich tradition of herbal and ethno-medicines with many indigenous medicine practitioners (IMPs). This is further bolstered by the presence of the State’s rich biodiversity and availability of herbal plants. Official recognition and incentives could extend health care coverage to all villages.
Traditions and culture, food security, social norms and societal environment, etc., play important roles in the promotion of health in a given society. In Nagaland, the potentials are enormous if the State can work out a plan of action suited to it, taking advantage of its rich traditional knowledge system and the resources that are easily and locally available.
Acquiring Knowledge
The educational journey of Nagaland, despite seemingly insurmountable problems, is an impressive experience. From a mere 17.91 percent in 1961, out of a population of a few lakh, the state literacy figures have climbed to 67.11 percent, above the national average, when only a few decades earlier, almost the entire Naga population was illiterate! Even female literacy has reached 61.92 percent. Today, Nagaland has the courage and confidence to think about reaching the standards achieved by developed countries.
From a mere 17.91 percent in 1961, out of a population of a few lakh, the state literacy figures have climbed to 67.11 percent, above the national average, when only a few decades earlier, almost the entire Naga population was illiterate!

7Overview
Prolonged insurgency/nationalism has left Naga society deeply wounded and hurting. Insurgency also constituted the single biggest hurdle in the path of education. It affected administration, appointment and posting of teachers, infrastructure development, proper monitoring and supervision as movement became restricted, and affected classes as even school buildings were occupied by fighting forces. The social capital and natural resilience of Naga communities have withstood all these, and today, the State is poised to make a unique contribution to education everywhere through the concept of Communitisation.
However, Nagaland still faces many problems and infrastructural needs. Among these are easy access to educational institutions, quality of education in schools, formulation of an adequate education policy for the State, etc. While management and governance issues may be largely tackled through the Communitisation process, at least at lower levels of education, educational policy for higher education must be in tune with the needs of society and the available resources and strengths of the communities. In other words, educational policy and higher planning and long-term development strategy of the State must go hand in hand. It is a sad commentary on the state of affairs that till date Nagaland has not been able to formulate an adequate education policy for the State.
Education is vital to the process of sustainable development in Nagaland. The Communitisation initiative has created the policy framework for bringing about substantial improvement in the quality of education. The focus of Nagaland’s endeavours should centre on providing education to all children in the State. It must also ensure, through innovative ideas and experiments, that the educational experience not only remains a tool of learning but also contributes to growth and development of the students as individuals and prepares them to contribute towards prosperity of the State and society.
Empowering Women
Nagaland is a State that does not conform to the general perception of women’s status in India. Apart from traditional practices that have generally cared for women and the girl child, the State has successful achievements in the fields of literacy, increasing sex ratio, health and entrepreneur development. The literacy rate of women and the enrolment rates for girls in Nagaland are higher than the national average. In the area of health, the positive achievements are improving sex ratios, absence of female foeticides and low maternal mortality rate. There are almost no cases of malnourishment among women and children. However, the very high fertility rate is a cause of concern.
The vast majority of Naga women are engaged in agriculture and allied sectors, such as minor forest produce and cultivating cereals,
The Communitisation initiative has created the policy framework for bringing about substantial improvement in the quality of education.

8 Nagaland State Human Development Report
vegetables, etc. Women’s participation in the manufacturing sector is as low as 6 percent. Participation in the services sector is only 14 percent, out of which only around 7 percent are professionals. In recent times, in the wake of education and exposure, women have started entering other sectors, such as trading, cottage industries, floriculture, restaurants, etc.
There are also areas where interventions are required like employment generation, higher education for women, financial support for women’s development, social problems, including violence against women, health problems, including HIV/AIDS and substance abuse. Naga women’s exclusion from land rights, and from formal decision-bodies are areas of concern. The absence of women legislators in all the 10 State Legislative Assemblies since statehood in 1963 is significant.
The State policy for empowerment of women has been formulated and a new department of women has been established. The reservation of seats and earmarking of 25 percent of funds for women in the Village Development Boards have been the first steps in the State for empowerment of women and their participation in the governance and development of their communities. With the participation of women in local bodies, and even greater numbers in the self-help groups, the scenario could change as more women become familiar with governance.
Empowerment of women will be vital as Nagaland marches towards its vision of a peaceful, developed and secure society. New opportunities are coming the way of Naga women through education, policy interventions in governance, economic development and greater interaction within and outside the State. The focus must now shift to development of the human being in its totality, and enabling each one to realise his/her highest potentials.
Nagaland’s Human Development Indicators
The conventional measure of gross domestic product or per capita income is insufficient to capture the wider aspects of welfare and the contingent process of development. In line with the country’s National Human Development Report, 2001 the following three indices have been constructed for Nagaland: human development index (HDI); gender-related development index (GDI); and human poverty index (HPI).
The HDI (2001) of Nagaland was 0.62, as compared to 0.472 (2001) for India, reflecting the State’s good performance in terms of the constituents of the indices and the factors that influence them, including literacy, health status and income levels. The per capita income of Nagaland during 2000–2001 was almost equal to the national average.
Empowerment of women will be vital as Nagaland marches towards its vision of a peaceful, developed and secure society. New opportunities are coming through education, policy interventions in governance, economic development and greater interaction.

9Overview
GDI for Nagaland is 0.45 against HDI of 0.54. Gender disparity index is a useful summary measure to compare human development between sexes. Nagaland has consistently maintained a GDI of 0.7 and above in comparison to the national average of 0.6. This is mainly because of the Naga culture of equal care for the girl child. Naga tribal values and practices have provided a unique framework of gender relations and access to health and nutrition. The contributing factors to the notable GDI in Nagaland are education and the improving opportunity for livelihood.
The HPI for the State is 35.58 percent. The index has come down from 42.07 percent in 1991 and 49.37 percent in 1981, as estimated for the State in the National Human Development Report, 2001.
Nagaland 2020: A Vision
The four decades since statehood have been very eventful for Nagaland. Although, in comparison to other developed parts of the country, there are many areas in which the State is deficient, there are also extraordinary changes, especially in governance and development outreaches, which have taken place with remarkable rapidity. These human experiences, in the span of a mere 40 years of statehood, have meant a tremendous leap from the traditional to the modern in the race to attain development. Given Nagaland’s overall background, it is nothing less than astonishing that in certain areas of human development indicators, Nagaland has surpassed the Indian national average. Furthermore, such achievements have taken place in an atmosphere surcharged with prolonged and relentless insurgency. They indicate the inner reservoir of resilience of the people and ability to adapt, their zest for life, and their fierce determination to survive and succeed in the midst of adversity.
Nagaland is ranked 11th among the states as per the human development index (1991). The State can legitimately aspire to emerge as a frontrunner among the states by 2020, if its natural wealth —land, water, forests, environments, oil, minerals—are sustainably exploited and marketed; the social capital invested into resuscitating and energising the public utility systems such as schools, health institutions, power utilities, tourism assets, water supply system, rural roads, ICDS network; if connectivity within the State, with the rest of the country and with the outside world in terms of road, rail, waterways, air, telecommunication is improved; and if the State’s human capital is enriched in terms of technical skills.
By 2020, it is possible to see a developed Nagaland—with the population under control; the economy growing at accelerated pace; infrastructure such as transport, communication and power improved to modern levels;
By 2020, it is possible to see a developed Nagaland —with the population under control; the economy growing at accelerated pace; infrastructure such as transport, communication and power improved to modern levels; and qualitative health care being provided to the people.

10 Nagaland State Human Development Report
and qualitative health care being provided to the people. It would indeed be a Nagaland moving into the future full of hope and expectations, and reaching the aspired position among the fore-ranking states in the country, in terms of prosperity, development and happiness.
Lalhuma, IAS Additional Chief Secretary & Development Commissioner

Chapter 1
Nagaland – A Profile

Nagaland State Human Development Report12
I DEMOGRAPHY 14
Decadal Growth 16
Urban-Rural Distribution 17
Literacy 18
The Gender Dimension: Reversing the Sex Ratio 18
Workforce 18
II TRADITIONS AND HISTORICAL EVOLUTION 19
Cultural and Linguistic Traditions 19
History 20
Political Process 22
III OVERALL ECONOMY AND SECTORAL CONTRIBUTIONS 22
Regional Disparities 25
State Domestic Product 26
Agriculture Development 27
Industrial Development 28
Infrastructure Development 29
Sustaining Development—Health and Education 31
IV THE WAY AHEAD 33
Nagaland – A Profile 13
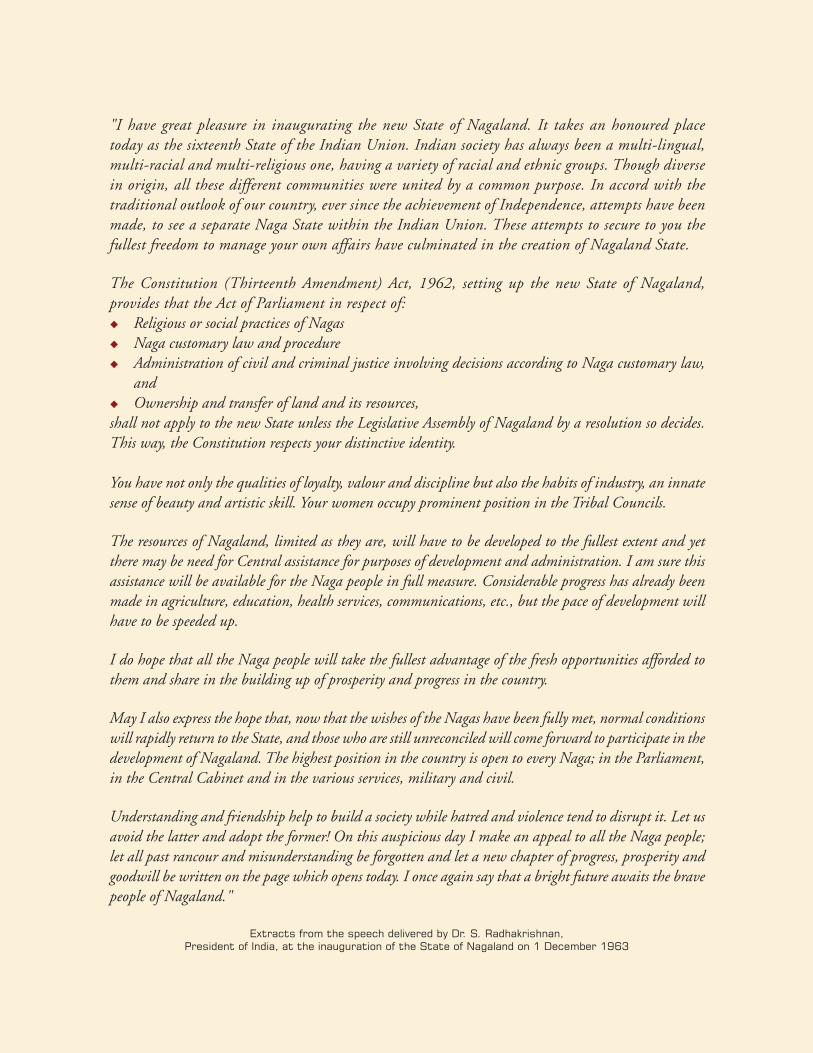
"I have great pleasure in inaugurating the new State of Nagaland. It takes an honoured place today as the sixteenth State of the Indian Union. Indian society has always been a multi-lingual, multi-racial and multi-religious one, having a variety of racial and ethnic groups. Though diverse in origin, all these different communities were united by a common purpose. In accord with the traditional outlook of our country, ever since the achievement of Independence, attempts have been made, to see a separate Naga State within the Indian Union. These attempts to secure to you the fullest freedom to manage your own affairs have culminated in the creation of Nagaland State.
The Constitution (Thirteenth Amendment) Act, 1962, setting up the new State of Nagaland, provides that the Act of Parliament in respect of: Religious or social practices of Nagas Naga customary law and procedure Administration of civil and criminal justice involving decisions according to Naga customary law,
and Ownership and transfer of land and its resources, shall not apply to the new State unless the Legislative Assembly of Nagaland by a resolution so decides. This way, the Constitution respects your distinctive identity.
You have not only the qualities of loyalty, valour and discipline but also the habits of industry, an innate sense of beauty and artistic skill. Your women occupy prominent position in the Tribal Councils.
The resources of Nagaland, limited as they are, will have to be developed to the fullest extent and yet there may be need for Central assistance for purposes of development and administration. I am sure this assistance will be available for the Naga people in full measure. Considerable progress has already been made in agriculture, education, health services, communications, etc., but the pace of development will have to be speeded up.
I do hope that all the Naga people will take the fullest advantage of the fresh opportunities afforded to them and share in the building up of prosperity and progress in the country.
May I also express the hope that, now that the wishes of the Nagas have been fully met, normal conditions will rapidly return to the State, and those who are still unreconciled will come forward to participate in the development of Nagaland. The highest position in the country is open to every Naga; in the Parliament, in the Central Cabinet and in the various services, military and civil.
Understanding and friendship help to build a society while hatred and violence tend to disrupt it. Let us avoid the latter and adopt the former! On this auspicious day I make an appeal to all the Naga people; let all past rancour and misunderstanding be forgotten and let a new chapter of progress, prosperity and goodwill be written on the page which opens today. I once again say that a bright future awaits the brave people of Nagaland."
Extracts from the speech delivered by Dr. S. Radhakrishnan, President of India, at the inauguration of the State of Nagaland on 1 December 1963

Nagaland State Human Development Report14
Nagaland, part of Assam and North East Frontier Agency (NEFA) in 1947, became the 16th State of India in 1963. Statehood came
as a result of a political agreement. In this respect Nagaland’s case is unique and special constitutional protection was also provided under Article 371(A) of the Indian Constitution to safeguard the culture, traditions and way of life of the Nagas. One of the smaller hill states of India, Nagaland is known for its myriad tribes with their rich culture and traditions. The State has a distinct character both in terms of its social composition as well as in its developmental history.
Location
Nagaland is one of the ‘seven sisters’ of the North-East. The State is bounded by Assam in the west, Myanmar on the East, Manipur in the south and Arunachal Pradesh and part of Assam on the north. It lies between 25O6’ and 27O4’ northern latitudes and between 93O20’ and 95O15’ eastern longitudes. The State has an area of 16,579 sq. km (which constitutes 0.5% of the country’s geographical area) with a population of 19,88,636 (0.2% of the country’s population) as per 2001 Census. The number of households in the State was 1.49 lakh in 1981, which increased to 2.17 lakh in 1991. The State is predominantly rural, with 82.26 percent of the population living in villages, generally situated on high hilltops or slopes overlooking verdant valleys.
Till January 2004, Nagaland consisted of eight administrative districts, with 52 blocks, nine census towns and 1286 inhabited villages. Each district generally has predominant concentration of one of the major/minor tribes of the State, making the districts distinct in their socio-political, traditional, cultural and linguistic characteristics. Of the eight districts, Tuensang is the largest, occupying 25.5 percent of the total area of the State, followed by Kohima with 18.79 percent.
In January 2004, three new districts were inaugurated by the State Government, viz., Longleng, Kiphire and Peren. At the time of preparing this Report, Longleng and Kiphire were sub-divisions of Tuensang district and Peren was a sub-division of Kohima district. Therefore, the analysis for Tuensang includes information/statistics for Kiphire and Longleng and that of Kohima includes the data of Peren.
I. Demography
The total population of Nagaland as per 2001 Census is 19.88 lakh, of which males form 10.42 lakh and females 9.47 lakh. Among the various districts, Tuensang has the largest population (4.14 lakh), followed by Kohima (3.14 lakh). The least populated district is Phek (1.48 lakh). Nagaland witnessed the highest growth rate in population over the last decade. This unprecedented growth rate of population is a cause of
This chapter gives an overview of the State of Nagaland, its demographic, cultural, economic and social profile. It also highlights Nagaland's primary resource base, as well as industrial and infrastructural base.

Nagaland – A Profile 15
Mon
Tuensang
Mokokchung
Longleng
WokhaZunheboto
Kiphire
PhekKohima
Dimapur
Peren
Arunachal Pradesh
MYANMAR
Assam
Manipur
serious concern to the demographers and policy planners in the State. A total fertility rate (TFR) of 2.1 is considered to be the replacement level of fertility, which needs to be achieved in all states for population stabilisation. As per the National Family Health Survey, Nagaland had a TFR of 3.77 during 1998, amongst the highest in the country. There is thus a need for policy intervention to tackle this spiralling population growth, which can seriously hamper the planning process and development aspirations of the State. The density of population is another factor of concern in Nagaland because of the alarming increase in the population. The density, which was 47 per sq. km in 1981, increased to 73 in 1991 and 120 per sq. km in 2001. This will have serious implications on the ability of the State to meet the infrastructure requirements of its people, especially in the fledgling urban areas.
Nagaland
Source: Nagaland GIS and RS Development Team
Figure 1.1
At the time of preparing this Report, Longleng, Kiphire and Peren were sub-divisions.

Nagaland State Human Development Report16
Box 1.1
Nagaland at a Glance
Total Area 16,579 sq.km
State Capital Kohima (1,444.12 m. above sea level)
State Boundaries East – Myanmar West – Assam North – Assam & South – Manipur Arunachal Pradesh
Population 19,88,636 (2001 census)
Rural Population 16,35,815 (82.26%) (2001 census)
Urban Population 3,52,821 (17.74%) (2001 census)
Density of Population 120 per sq.km. (2001 census)
Sex Ratio 909:1000 Female : Male (2001 census)
Literacy Rate Persons: 67.11% Male : 71.77% Female : 61.92%
Districts with HQs (1) Kohima, (2) Mokokchung (3) Tuensang (4) Mon (5) Wokha (6) Zunheboto (7) Phek (8) Dimapur
Newly created districts (1) Longleng (2) Kiphire (3) Peren
Number of Villages 1286 (2001 census)
Number of Census towns 9 (2001 census)
Biggest Village Kohima village (3965 households; 13,705 persons)
Official Language English
Average Rainfall 2500 mm
Highest Peak Mount Saramati, 3840 metres (Tuensang district)
Other Important Peaks Mount Japfu, 3015 metres (Kohima district)
Mount Zanubou, 2750 metres (Phek District)
Mount Kupamedzu, 2650 metres (Phek district)
Forest Cover 13,345 sq. km (80.49% of State’s Geographical Area)
Main Rivers Dhansiri Doyang Dikhu Tizu Melak
Railway Head Dimapur
Airport Dimapur
Commercial Centre Dimapur
Decadal Growth
Nagaland has recorded progressively high decadal growth in population, increasing from 39.9 percent in 1979 to 64.4 percent in 2001. This decadal growth has been one of the highest in the country. The population grew by 5.0 percent per annum during 1971–81, which increased to 5.6 percent per annum during 1981–91, which again increased to 6.4 percent per annum during 1991–2001. During the decade 1991–2001 Wokha

Nagaland – A Profile 17
district registered a maximum growth rate of 95 percent, followed by Tuensang (78 percent). The district of Mokokchung registered the lowest growth rate of 43 percent during the period. The high growth rates over the decades have impacted the percentage of young people who form part of Naga society. Close to 40 percent of the population are below the age of 18. As a result, the dependency ratio has also increased.
Urban-Rural Distribution
People living in rural areas constituted 82.3 percent of Nagaland’s population in 2001, as against 90 percent in 1971. This is an indication of the migration that is taking place in the State from rural to urban areas. Though growth of urbanisation and economic growth are generally accepted as having a positive correlation, the high rate of migration into urban areas also implies a need for policy focus on the creation of employment opportunities as well as urban infrastructure to meet the requirements of the growing urban population. During the decade 1991–2001, there was a decrease in the percentage of urban population in the towns of Mon, Mokokchung and Tuensang. This is indicative of migration of urban population from these towns to other towns, possibly for access to better urban amenities and entrepreneurial opportunities. An urban management strategy, specific to local needs is required for Dimapur and Kohima, which play host to majority (36% and 21.6% respectively) of the urban population of the State. Besides, there is the usual presence of a floating urban population, which the two regions attract because one is the main commercial centre while the other is
Sl. No. Particulars 1961 1971 1981 1991 2001
1 Total Population (’000) 369 516 775 1210 1989
2 Decennial Growth of Population (%) -- 39.88 50.05 56.08 64.41
3 Density of Population (per sq. km) 22 31 47 73 120
4 Percentage of Rural Population 94.80 90.00 84.48 82.79 82.26
5 Level of Urbanization (%) 5.20 10.0 15.52 17.21 17.74
6 Growth of Urbanization (%) 16.6 10.4 8.9 5.6 5.4
7 Literacy Rate (%) 20.40 27.40 42.57 61.65 67.11
8 Literacy Rate : Male (%) 27.2 35.02 50.1 67.52 71.8
9 Literacy Rate : Female (%) 13.0 18.65 33.9 61.65 61.9
10 Sex Ratio (females per 1000 males) 933 871 863 886 909
11 Percentage of Workers NA NA 48.23 42.68 42.74
Source: Census of India; National Family Health Survey, 1998–99
Demographic Profile of Nagaland Table 1.1
Figure 1.2Population of Nagaland
2000
1500
1000
500
0
19611971
19811991
2001
Census Years
Pop
ulat
ion
(’0
00
)
Source: Census of India

Nagaland State Human Development Report18
the State capital. It is, at the same time, necessary to explore ways to develop the smaller towns as growth centres for uniform development in the State.
Literacy
The literacy rate, which was 20.4 percent in 1961, increased to 42.57 percent in 1981, and further increased to 67.11 percent in 2001. A positive element here is the increase in the female literacy level, which was 13 percent in 1961 but steadily increased to 39.9 percent in 1981 and to 61.92 percent in 2001. Among the various districts, Mokokchung and Wokha had the highest literacy rates of 84.27 percent and 81.28 percent respectively. These districts also achieved female literacy levels of more than 75 percent during 2001. Mon and Tuensang ranked the least with literacy rates of 42.25 percent and 51.30 percent respectively.
The Gender Dimension: Reversing the Sex Ratio
The sex ratio in Nagaland, which had steadily declined from 933 in 1961 to 863 in 1981, showed a positive, reverse trend during the last two decades. From 863 in 1981, it rose to 886 in 1991 and finally, to 909 in 2001. This is a welcome feature as far as the demographic pattern is concerned. Among the various districts, Zunheboto and Kohima had the highest sex ratio of 945 and 944 respectively. The State’s socio-cultural practices, which value the girl child, have contributed to the success of reversing the sex ratio, besides governmental and civil society interventions.
Workforce
The workforce constitutes 42.74 percent of the population in Nagaland. Though in absolute numbers, the total number of workers has increased from 5.16 lakh in 1991 to 8.49 lakh in 2001, the percentage of workers to the population has remained at 42.7 percent. However, among the workers, the share of main workers has fallen from 42.29 percent to 35.62 percent, while the share of marginal workers has increased from 0.39 percent in 1991 to 7.12 percent in 2001. The near stagnant proportion of workers and increasing share of marginal workers is indicative of increased prevalence of unemployment and disguised unemployment in the State. In Mon, Tuensang, Zunheboto, Wokha and Dimapur, there was a fall in the percentage of workers in the districts over the period 1991–2001. Among the workers, 68.03 percent were engaged in agricultural activities while only 2.12 percent were engaged in household industry and 29.18 percent constituted other workers during 2001.
Box 1.2
Census in Nagaland
The first official census in Naga Hills was taken in 1891, that is, two decades after the first official census of India was taken in 1871. The first census covering the entire area of Naga Hills district was conducted in 1961, two years before it became the 16th State of India. Census of Nagaland State commenced from 1971 and, thereafter, successive censuses have been held in 1981, 1991 and 2001.
It is necessary to explore ways to develop the smaller towns as growth centres for uniform development in the State.

Nagaland – A Profile 19
II. Traditions and Historical Evolution
Cultural and Linguistic Traditions
Nagaland is inhabited by 16 major tribes along with a number of sub-tribes. Ao, Angami, Chang, Konyak, Lotha, Sumi, Chakhesang, Khiamniungam, Kachari, Phom, Rengma, Sangtam, Yimchungrü, Kuki, Zeliang and Pochury are the major tribes. Each tribe is distinct and unique in character from the others in terms of customs, language and attire. The colourful and intricately designed costumes and ornaments, that were traditionally worn, can easily distinguish each of the tribes and sub-tribes.
The multiplicity of tribes, within such a limited space, could be due to the fact that the Naga ancestors migrated to the present location in different groups and they remained confined to their ridges and mountainous terrain. This, subsequently, resulted in their unique characteristic of appearing to be both one people and many tribes, displaying both unity and diversity in their customs, traditions, attire and political systems.
Table 1.2
Tribe Subdivision / District Main Festival Celebrated during
Angami Kohima Sekrenyi February
Ao Mokokchung Moatsu, Tsungremong May, August
Chakhesang Phek Tsukhenyie, Sukrenyi April/May, January
Chang Tuensang Kundanglem, Nuknyu Lem April, July
Kachari Dimapur Bushu Jiba, Baisagn January, April
Khiamniungam Noklak in Tuensang Miu Festival, Tsokum May, October
Konyak Mon Aoleang Monyu April
Kuki Dimapur; Peren Mimkut January
Lotha Wokha Tokhu Emong November
Phom Longleng Monyu, Moha, Bongvum April, May, October
Pochury Meluri in Phek Yemshe October
Rengma Tseminyu in Kohima Ngadah September
Sangtam Kiphire; Tuensang Amongmong September
Sumi Zunheboto Ahuna, Tuluni November, July
Yimchungru Shamator in Tuensang and Kiphire
Metumniu, Tsungkamniu August, January
Zeliang Peren Hega, Langsimyi/Changa Gadi, and Mileinyi
February, October, March
Tribes and Festivals of Nagaland

Nagaland State Human Development Report20
The State is replete with festivities throughout the year, as all tribes celebrate their own festivals with a pageantry of colour, music and dance. A common feature is that the festivals revolve around agriculture, the mainstay of Naga economy. These festivals hark back to times prior to the advent of Christianity. The predominant theme of the festivals is offering prayers to the Supreme Being, known by different names in different Naga tribal languages.
Nagaland has a rich linguistic tradition with as many languages as there are tribes, each exclusive to itself. What is even more remarkable is that even within the language of a particular tribe, there are dialects mutually unintelligible. For instance, in some tribes like the Angami, every village has a slightly different variation even within the same dialect—this variance progressively increasing with the geographical distance. This makes inter-tribe and intra-tribe communication very difficult. In the circumstances, English has come to serve as the State language while Nagamese, a kind of pidgin Assamese, has become the common lingua. Each of the languages continues to be spoken and used. The music, ballads, knowledge systems, art and colour combinations of the beautiful Naga shawls, etc., represent times of leisure and the fact that at least some of the tribes may have belonged to an ancient civilisation.
History
The early history of the Nagas is sketchy. Ancient Sanskrit scriptures mention Kiratas, golden skinned people of the sub-Himalayan region, with distinct culture, who migrated from their original home to the Himalayan slopes and mountains of the East. Another view is that the Nagas belong to the Mongoloid race, and they migrated and settled in the north-eastern part of present India and established their respective sovereign village-states although when they came and how they came to their present habitations are still unsettled questions. The only things that are clear is that all the tribes say their ancestors came from the east and that they were settled in the area before the arrival of the Ahoms in 1228 A.D. Even the origin of the word ‘Naga' is yet to be settled finally. Many scholars have made an attempt to define the word ‘Naga’. A popularly accepted view is that it originated from the Burmese word ‘Naka’, meaning people with earrings. It is believed that as the British came to this part of the country through Burma and asked questions about the people living therein, the reply of ‘Naka’ from their Burmese guides was recorded as ‘Naga’, and thus used subsequently.
In the years before Indian independence, the Nagas of North-East India came to exemplify an exotic society. People of the hills, radically different in culture and beliefs, were renowned for their fierce resistance to British rule and their past practice of head taking. Their frequent raids into the plains of Assam prompted the British to penetrate into the
The word ‘Naga’ originated from the Burmese word ‘Naka’ meaning people with earrings

Nagaland – A Profile 21
dense forests of Naga Hills in the nineteenth century to establish their control over the region.
The first Europeans to enter the hills were Captains Jenkins and Pemberton, who marched across the land in 1832. The early British relations with the tribes were one of perpetual conflict. Between 1839 and 1850, 10 military expeditions were led to the hills, to explore the region, punish the Nagas for their raids and to establish British control. The policy of military expeditions and involvement in Naga affairs was changed after the bloody battle at Kikrüma in 1852 and the British adopted a policy of non-interference with the hill men. However, this policy did not bear fruit. During 1851 to 1865 there were persistent raids by the Nagas on British subjects in the plains.
Therefore, the British India Government, reviewing its earlier policy, in 1866, decided to form a new district, with its headquarters at Samaguting, present Chümukedima. Establishment of the British post at Samaguting was a landmark in the history of British-Naga relations. It signified the Government’s determination to control the Nagas effectively. Captain Butler, who was appointed to this charge in 1869, did much to consolidate the British presence in the hills. These advances were resisted by the tribesmen. In 1878, the headquarters of the district was transferred to Kohima with the objective of effectively controlling and influencing the Naga Hills.
During 1879, Political Officer Damant was determined to control the powerful village of Khonoma. He marched on to Khonoma with his troops, where he was shot dead with 35 of his escorts. The whole countryside then rose and proceeded to besiege the stockade at Kohima, and the garrison was under severe attack before it was relieved. The subsequent defeat of Khonoma marked the end of serious trouble and hostility in the Naga Hills. Between 1880 and 1922, the British consolidated their position over a large area of the Naga Hills. Those Nagas who still remained outside British administration were referred to as ‘Free Nagas’ in the ‘Unadministered Areas’. These ‘Free Nagas’ included the tribes now living in Mon and Tuensang districts of present day Nagaland.
When India won independence, the Naga Hills was a district in the State of Assam. The Naga People’s Convention in 1957 proposed the formation of a separate administrative unit by merging the Tuensang Frontier Division of the North East Frontier Agency (NEFA—present Arunachal Pradesh) with the Naga Hills district of Assam. The Government of India accepted this proposal and on December 1, 1957, the Union Government took over the administration of Naga Hills district of Assam and Tuensang division of NEFA to form a separate administrative unit called ‘Naga Hills–Tuensang Area (NHTA)’.
Those Nagas who remained outside British administration were referred to as ‘Free Nagas’ in the ‘Unadministered Areas’. These ‘Free Nagas’ included the tribes now living in Mon and Tuensang districts of present day Nagaland.
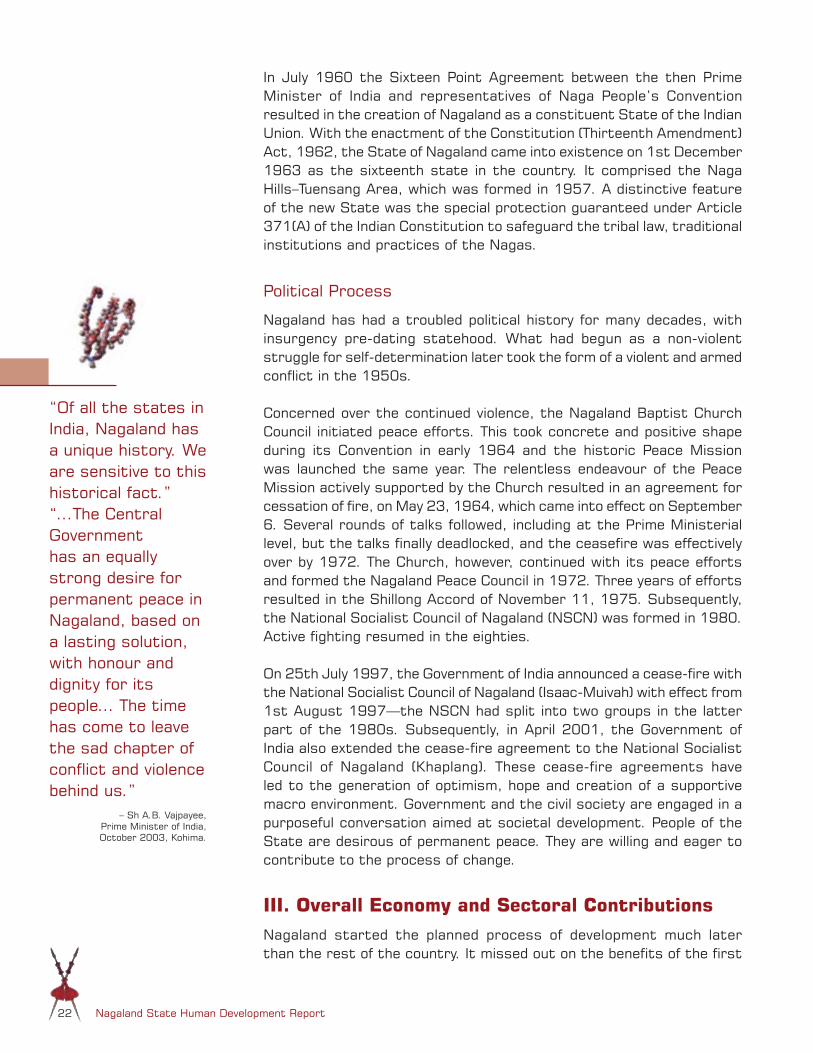
Nagaland State Human Development Report22
In July 1960 the Sixteen Point Agreement between the then Prime Minister of India and representatives of Naga People’s Convention resulted in the creation of Nagaland as a constituent State of the Indian Union. With the enactment of the Constitution (Thirteenth Amendment) Act, 1962, the State of Nagaland came into existence on 1st December 1963 as the sixteenth state in the country. It comprised the Naga Hills–Tuensang Area, which was formed in 1957. A distinctive feature of the new State was the special protection guaranteed under Article 371(A) of the Indian Constitution to safeguard the tribal law, traditional institutions and practices of the Nagas.
Political Process
Nagaland has had a troubled political history for many decades, with insurgency pre-dating statehood. What had begun as a non-violent struggle for self-determination later took the form of a violent and armed conflict in the 1950s.
Concerned over the continued violence, the Nagaland Baptist Church Council initiated peace efforts. This took concrete and positive shape during its Convention in early 1964 and the historic Peace Mission was launched the same year. The relentless endeavour of the Peace Mission actively supported by the Church resulted in an agreement for cessation of fire, on May 23, 1964, which came into effect on September 6. Several rounds of talks followed, including at the Prime Ministerial level, but the talks finally deadlocked, and the ceasefire was effectively over by 1972. The Church, however, continued with its peace efforts and formed the Nagaland Peace Council in 1972. Three years of efforts resulted in the Shillong Accord of November 11, 1975. Subsequently, the National Socialist Council of Nagaland (NSCN) was formed in 1980. Active fighting resumed in the eighties.
On 25th July 1997, the Government of India announced a cease-fire with the National Socialist Council of Nagaland (Isaac-Muivah) with effect from 1st August 1997—the NSCN had split into two groups in the latter part of the 1980s. Subsequently, in April 2001, the Government of India also extended the cease-fire agreement to the National Socialist Council of Nagaland (Khaplang). These cease-fire agreements have led to the generation of optimism, hope and creation of a supportive macro environment. Government and the civil society are engaged in a purposeful conversation aimed at societal development. People of the State are desirous of permanent peace. They are willing and eager to contribute to the process of change.
III. Overall Economy and Sectoral Contributions
Nagaland started the planned process of development much later than the rest of the country. It missed out on the benefits of the first
“Of all the states in India, Nagaland has a unique history. We are sensitive to this historical fact.” “…The Central Government has an equally strong desire for permanent peace in Nagaland, based on a lasting solution, with honour and dignity for its people… The time has come to leave the sad chapter of conflict and violence behind us.”
– Sh A.B. Vajpayee,
Prime Minister of India, October 2003, Kohima.

Nagaland – A Profile 23
three Five Year Plans. The State has also been inhibited in its growth because of insurgency and much of its scarce resources had to be spent on establishment costs. Given these constraints, the State’s rapid strides in planned socio-economic development, especially in the fields of infrastructure and development indicators, are commendable. Table 1.3 gives an indication of the progress made.
Despite the progress made in a span of 40 years, Nagaland’s economy still confronts many developmental challenges. Foremost among them are relative isolation, the difficult terrain, inaccessibility to the rest of the world and continued insurgency. These handicap the State’s endeavours towards industrial and entrepreneurial development, private sector partnership in spearheading development initiatives and all-round regional planning. Remoteness and inaccessibility are also the predominant cause for regional disparities in the State. An Index for Social and Economic Infrastructure by the Eleventh Finance Commission, during 1999, ranked Nagaland, with an index of 76.14, as the seventh most remote State in the country. (Arunachal Pradesh, with an index of 69.71, was adjudged the most inaccessible while Goa, with an index of 200.57, was given the highest index).
Progress Made During 40 Years of Statehood Table 1.3
Sl. No. Item Unit 1962–63 2002–03
1. Total Length of Roads Km 837 9860
2. Villages Connected with Roads Number NA 1092 (79.4 %)
3. Water Supply Provided No. of Villages/ Habitations Nil 1304 (94.77 %)
4. Generation of Electric Power MW 0.20 29.00 (98.2 %)
5. Villages Electrified Number 6 1216
6. Literacy Percent 17.91 67.11
7. Life Expectancy Years NA 73.4
8. Primary Schools Number 592 1311
9. Middle Schools/High Schools Number 22 121
10. Government Hospitals Number 8 13
11. Dispensaries/Sub-centres Number 3 422
12. Hospital Beds Number 613 2065
13. Area under Irrigation ’000 Ha 1.51 65.63
14. Foodgrain Production ’000 tonnes 61.82 386.30
Source: Directorate of Economics & Statistics, Nagaland

Nagaland State Human Development Report24
Box 1.3
Battle of Kohima
' The Battle of Kohima will probably go down as one of the greatest battles in history.' –Lord Mountbatten, Supreme Commander of the Allied Forces in the Asian Theatre of World War II.
Echoing Lord Mountbatten’s words, Field Marshall Wavell stated, ‘When the history of the War comes to be written, the fight here will be put down as the turning point of the War, when the Japanese were routed and their downfall really began.'
As a turning point of World War II, the Battle of Kohima has often been compared with Stalingrad in Europe and El Alamein in the desert because it was in Kohima that the Japanese advance was finally halted. The battle of nearly three months was bitter and the Nagas played a decisive role in turning the tide of the battle by gathering intelligence, providing guides, carrying loads, capturing the enemy and even sacrificing their homes by burning to deny them to the Japanese forces.
On March 6th 1944, the Japanese had launched their U-Go offensive from northern Burma. U-Go had two objectives: to prevent the Allies from retaking Burma and to break into India. The Japanese were confident of victory, but were soon to be taught a terrible lesson. The immediate gateway to India, at the time, lay through Imphal but Kohima, 130 miles (210 km) to the north, with its railhead at Dimapur, could prove even more strategically important to reach the mainland.
The British were aware of the Japanese thrust. But even they were surprised by its initial speed. By April 4, the Japanese had not only entered Kohima, through the east, but also cut off the only link road to Imphal. It seemed that Kohima, on its saddle ridge, was the last barrier for the Japanese forces before they reached the plains.
Unfortunately for the Japanese forces, due to differences of perception of strategic importance of Imphal and Kohima, between General Sato and General Mutaguchi, his immediate superior, General Sato was forced to order withdrawal of his forces from Kohima on May 31. Decimated by fighting, disease and hunger, Japanese soldiers still fought a valiant withdrawal. Only 20,000 of the 85,000 Japanese who had come to invade India were left standing. The cost to the Allies had been 17,857 British and Indian troops killed, wounded and missing. Before leaving Kohima, the British erected a moving memorial in memory of their fallen comrades: ‘When you go home, tell them of us, and say: ‘For your tomorrow, we gave our today.’
Nagaland’s remoteness is one of the factors that has adversely impacted the spread of banking infrastructure, availability of credit, and consequently, industrial development in the State. During 2001, credit deposit ratio (CDR) for Nagaland was only 13.6, the lowest in the country. The low CDR has hampered the ability of the State to break the vicious cycle of remoteness and inability and attract capital flows due to overall resource-deficiency, which is made worse by the presence of continuous insurgency. Thus, Nagaland has been unable to effect key investments (government and private) to develop infrastructure and accelerate the growth of the economy.

Nagaland – A Profile 25
Neither the Japanese nor the British could forget the Battle of Kohima. Long after the battle, a Japanese General still could not bring himself to talk about it. ‘Not that great, bitter battle' was his response. The British veterans and contemporary soldiers of the 2nd Division, on the other hand, always participated in the annual reunions to remember their fallen comrades but did not allow others to attend the functions. These were moments too private to include others.
During the 40th anniversary of the Battle of Kohima, in 1984, Captain Richard de Channer, who won the Military Cross in the Battle of Kohima–Imphal, made crosses out of seasoned bamboo from Kohima and presented them to the surviving battalion and regimental commanders of the Battle of Kohima. Earlier in 1973, Captain Channer, along with Col Brandford Hartland of the 10th Gurkhas, who was seconded as Adjutant to Assam Regiment Battalion in Kohima in the 1930s, and helped to build the now famous Tennis Court, in the centre of the Cemetery, had paid a special pilgrimage to the Kohima War Cemetery to remember fallen comrades. Before coming, they wrote and asked if the Japanese veterans would like them to lay a wreathe at the Kohima War Cemetery in memory of the Japanese dead. General Ichiji Sugita, Chief of Staff of the Japanese Defence Forces in 1962 and leading member of the All Burma Veterans Association of Japan, arranged for a wreathe to be ready in Kohima. This wreathe Col Hartland and Captain Channer laid in memory of the Japanese dead at the Cherry Tree, on the edge of the Tennis Court, from where a Japanese sniper fought. The Cherry Tree marks the limit of the Japanese advance in Kohima. Later, Captain Channer and some of his veteran-friends went to Japan on a journey of reconciliation. The reconciliation effort was sustained and, finally, British and Japanese veterans came back to Kohima, the scene of battle in 1944, and effected a reconciliation ceremony according to Naga custom at the Kohima Cathedral. (The war veterans had contributed towards the building of the Cathedral).
Most veterans of the Battle of Kohima are now dead or getting very old. The re-union of the British veterans of this great battle will be held in July 2004. But they are still not ready to part with the memory of Kohima or forget the debt of gratitude to the Nagas they carry in their hearts. They wished that the friendship and help given to them by the Nagas should never be forgotten. And that a people-to-people link between Kohima and York—many soldiers of the British 2nd Division, which fought in Kohima, were from York and its vicinity—should be maintained. Therefore, in 2003, the surviving veterans instituted the Kohima Educational Trust ‘to help Nagas with the education of their children in any ways appropriate and possible within the Trust’s means and to establish links between the schools, colleges and the University of York and their counterparts in Kohima'. To the veterans, this ‘is a debt of honour’ .
Sources: ‘Peace in Nagaland’ ; ‘Kohima’ ; ‘The Naga Imbroglio’ ; ‘The Kohima Educational Trust’, UK
Regional Disparities
On the whole, the level of socio-economic development in the western regions of Nagaland is higher than in the eastern side. This is because contiguity to Assam provides better connectivity while on the Myanmarese side accessibility still presents formidable problems.
It must, however, be mentioned that dynamics of poverty in Nagaland are quite different from other parts of the country. Due to strong community spirit and social capital, the poor are looked after, and cared for, by kith
Kohima Cathedral.
World War II Cemetry, Kohima.

Nagaland State Human Development Report26
and kin and the community. As a result, there is no case of starvation deaths and no one is shelterless.
The State has identified Mon and Tuensang districts as well as Meluri subdivision in Phek, Bhandari in Wokha, Peren in Kohima and Pughoboto in Zunheboto as its backward areas. These areas were ‘traditionally’ remote and inaccessible. Present Mon and Tuensang districts were also part of the ‘un-administered areas' during the British period.
In order to expedite the process of development in the less developed and remote areas, the State Government has created a new department for underdeveloped areas. It has also decided to create three new districts, viz. Longleng, Kiphire (erstwhile sub-divisions of Tuensang district) and Peren (under Kohima district). The Government hopes the new status for these regions would result in focused attention so as to bring them to the level of the more developed areas.
State Domestic Product
The net state domestic product (NSDP) of Nagaland has shown an increase from Rs. 10,547 lakh in 1980–81 to Rs. 57,898 lakh in 1990–91 (at constant 1980–81 prices) and to Rs. 223,042 lakh during 2000–01 (at constant 1993–94 prices). The per capita income in the State increased from Rs. 1361 during 1980–81 to Rs. 5520 during 1990–91. During 2000–01, per capita income was Rs. 11,473 (at constant 1993–94 prices) as against Rs. 10,306 for the country as a whole.
An estimation of district incomes (district domestic product) has not been carried out by the State Government or other agencies of the Government of India. In order to quantify the achievements of the different districts in income generation, sample survey was conducted to determine the district domestic products. The results of the survey quantify that the per capita income of the State is Rs. 11,119, with Dimapur having the highest per capita income among the districts (Rs 16,837) and Mon having the least (Rs. 4,500).
A look at the share of the various sectors in the NSDP during the last two decades shows that the share of the primary sector declined from 32.5 percent in 1980–81 to 31.01 percent in 2000–01. Among the primary sectors, agriculture formed the major component and its share declined from 28.65 percent to 27.48 percent during the above period. During the same period, the share of secondary sector rose from 14.13 percent to 15.18 percent. These figures show that Nagaland’s economy has not witnessed many structural changes in the past two decades.
The share of the tertiary sector has shown some fluctuations—it increased from 53.4 percent in 1980–81 to 58.14 percent in 1995–1996, and
In order to quantify the achievements of the different districts in income generation, sample survey was conducted to determine the district domestic products.
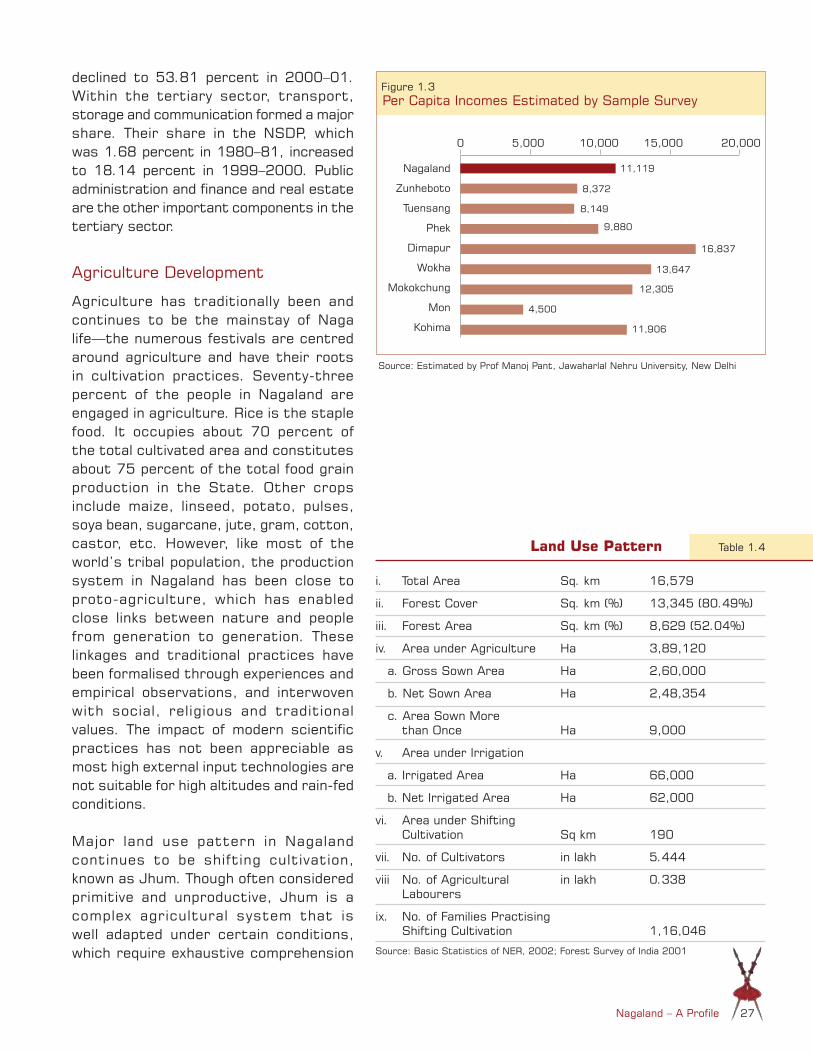
Nagaland – A Profile 27
declined to 53.81 percent in 2000–01. Within the tertiary sector, transport, storage and communication formed a major share. Their share in the NSDP, which was 1.68 percent in 1980–81, increased to 18.14 percent in 1999–2000. Public administration and finance and real estate are the other important components in the tertiary sector.
Agriculture Development
Agriculture has traditionally been and continues to be the mainstay of Naga life—the numerous festivals are centred around agriculture and have their roots in cultivation practices. Seventy-three percent of the people in Nagaland are engaged in agriculture. Rice is the staple food. It occupies about 70 percent of the total cultivated area and constitutes about 75 percent of the total food grain production in the State. Other crops include maize, linseed, potato, pulses, soya bean, sugarcane, jute, gram, cotton, castor, etc. However, like most of the world’s tribal population, the production system in Nagaland has been close to proto-agriculture, which has enabled close links between nature and people from generation to generation. These linkages and traditional practices have been formalised through experiences and empirical observations, and interwoven with social, religious and traditional values. The impact of modern scientific practices has not been appreciable as most high external input technologies are not suitable for high altitudes and rain-fed conditions.
Major land use pattern in Nagaland continues to be shifting cultivation, known as Jhum. Though often considered primitive and unproductive, Jhum is a complex agricultural system that is well adapted under certain conditions, which require exhaustive comprehension
Land Use Pattern Table 1.4
i. Total Area Sq. km 16,579
ii. Forest Cover Sq. km (%) 13,345 (80.49%)
iii. Forest Area Sq. km (%) 8,629 (52.04%)
iv. Area under Agriculture Ha 3,89,120
a. Gross Sown Area Ha 2,60,000
b. Net Sown Area Ha 2,48,354
c. Area Sown More than Once Ha 9,000
v. Area under Irrigation
a. Irrigated Area Ha 66,000
b. Net Irrigated Area Ha 62,000
vi. Area under Shifting Cultivation Sq km 190
vii. No. of Cultivators in lakh 5.444
viii No. of Agricultural in lakh 0.338 Labourers
ix. No. of Families Practising Shifting Cultivation 1,16,046
Source: Basic Statistics of NER, 2002; Forest Survey of India 2001
Source: Estimated by Prof Manoj Pant, Jawaharlal Nehru University, New Delhi
0 10,000 20,0005,000 15,000
Nagaland
Zunheboto
Tuensang
Phek
Dimapur
Wokha
Mokokchung
Mon
Kohima
Figure 1.3Per Capita Incomes Estimated by Sample Survey
8,372
8,149
9,880
16,837
13,647
12,305
4,500
11,906
11,119

Nagaland State Human Development Report28
of the environment to succeed. The major challenge continuing to face Nagaland is how to adapt its land use pattern and production systems to the increased population and changing lifestyles, making them biologically and economically sustainable. Shifting cultivation covers over 73 percent of the total arable area of the State. It is mostly concentrated in the districts of Mokokchung, Tuensang, Wokha, Zunheboto and Mon. In other areas, terraced rice cultivation (TRC) or combined Jhum and TRC are practised.
During the last four decades, the food grain production in Nagaland has shown an upward trend from 62,000 metric tonnes in 1964–65 to 386,390 tonnes in 2001–02. The productivity increased from 700 kg per hectare to 1300 kg per hectare over the period. However, the State is not self-sufficient in production of food grains. Non-traditional crops such as wheat, barley, spices, rubber and sugarcane are also gaining popularity in recent years, promising to convert agriculture from subsistence farming to commercially viable activity. The land is extremely fertile and can produce the best quality of agro-based, horticulture and floriculture products through organic farming. The potential of Nagaland becoming an ‘organic state’, and for exports and foreign exchange, is real. Strategic initiatives in the fields of animal husbandry, fishery and sericulture could result in generation of resources and overall development of the rural economy.
Forest Cover
As shown in Table 1.4, forest cover is 80.49 percent of the total area of Nagaland. As such, forests represent the richest natural resource of the State. Nagaland is also very rich in biodiversity with abundance of animal, insect and plant species. The State has a wealth of herbal, medicinal and aromatic plants with tremendous economic potentials. The rich forest cover holds tremendous potential for bio-technological manipulations and also indicates strength for a sustainable timber industry, especially through tree cultivation.
Industrial Development
The industrial base of Nagaland is narrow. The majority of the industrial units/village industries are based on local forest products, agro-products and traditional handloom and cottage industries. The State has established six growth centres for industrial development. However, they have not been able to satisfactorily meet the objectives for which they were envisioned. Nagaland had only 73 industrial units including small-scale industries, government emporiums, district industrial centres and specialised farms in 1980. This increased to 1160 in 1999–2000. This includes 1064 small-scale units. The paper mill established at Tuli in Mokokchung district and sugar mill in Dimapur faced serious difficulties. The sugar mill has since been closed down. New initiatives are necessary after careful survey of the developmental potentials of different regions.

Nagaland – A Profile 29
Mineral Wealth
Coal, limestone, nickel, cobalt, chromium, magneitite, copper, zinc, and recently discovered platinum, petroleum and natural gas are the major minerals available in Nagaland. The State has huge caches of unutilised and unexploited limestone, marble, granite, petroleum and natural gas. Coal is found in Nazira, Borjan and Teru valley of Mon district. Limestone of grey to whitish grey colour is found at Wazeho and Satuza in Phek district and at Nimi belt in Tuensang district. Ores of nickeliferrous chromite-magnetite occur in the Ultra Basic Belt at Pokhpur in Tuensang district. Nagaland is yet to fully explore its huge estimated reserves of natural oil.
The hydrocarbons are found in the western portion of Nagaland, where connectivity is available in the foothills. The metallic and non-metallic minerals are located in the remote and backward eastern parts bordering Myanmar, ideal for export to the South East Asian region. If the discovered minerals are economically exploited, these would turn out to be a rich resource base and the mineral-related trade can make a huge contribution to the State economy. Unfortunately, though the potential exists, not much has been achieved so far due to funding and planning process constraints. In this connection, the proposed ‘X Road’ of the Government could provide good connectivity for exploiting the mineral wealth of the State and for trade and commerce both in the State and the country and with South East and East Asian countries.
Infrastructure Development
The strategy and approach of the State Government have been to provide the basic infrastructure requirements of the people such as roads, water supply, power supply, schools, hospitals, etc. The State has been largely successful in this and a large part of the infrastructure is now in place. The achievements of the State in providing infrastructure showed that 13.96 percent of the villages had pucca roads as on 31 March 1986, which increased to 29.24 percent as on 31 March 2000. Similarly, the percentage of villages having primary schools increased from 92.0 percent to 96.6 percent during the above period. There was an increase in the percentage of villages with primary health centre from 18.0 percent to 26.3 percent. The percentage of villages having facilities for potable drinking water increased from 67.6 percent to 75.2 percent during the same period. However, the State has been grappling with challenges to maintain the assets created in this hilly, geologically fragile, high-rainfall State.
Though significant progress has been made, Nagaland still remains under-developed and inaccessible. The High Level Commission on Transforming the North-East constituted under Sh R.P. Shukla, Member of Union Planning Commission, during 1996 estimated that the infrastructure
Belt of Schuppen—priority area for petroleum exploration Disang Belt—economically barren except building and dimensional stonesOphiolite Belt—priority area for metals, limestones and marbleLow Grade Metamorphic Belt—priority area for high grade limestone, marble and noble metals
Mineral Belts
Figure 1.4
Geological index
The strategy and approach of the State Government have been to provide the basic infrastructure requirements of the people such as roads, water supply, power supply, schools, hospitals.

Nagaland State Human Development Report30
gap for North-East India was Rs. 97,000 crore. For Nagaland, the estimate was Rs. 11,000 crore. These figures reflect the extent of further investments required to come at par with other states of India. Such requirement of funds cannot be met from plan funding or assistance from Central Government alone. The State will also have to evolve a model of development, which will require people’s participation and willingness to be partners with the Government in the process of development, change and prosperity.
Transportation
The rail network in Nagaland is nominal (13 km). The only airport in the State is at Dimapur. Surface transport is the main method of communication in this land-locked hilly State. This has resulted in the development of an impressive network of public and private sector road transport system. The road length of national highways is 365.38 km and of state roads is 1094 km. During 1996–97, the road density was 1107 per thousand sq. km as against the all India road density of 749 per thousand sq. km.
However, road transport has been handicapped by inadequate development and poor maintenance of roads. All-weather roads linking the scattered villages are a prerequisite for development of potential areas. This holds true for agriculture, social, industrial, entrepreneurial and mineral development. As many villages are still not covered by all-weather roads, the villagers have been deprived of proper socio-economic development in education, primary health care, and ready access of farmers’ products to the market.
Power
Nagaland is not self-sufficient in power, generating only 29 MW (2001). The State purchases power from neighbouring states to meet its requirement. The annual energy consumption of 225 MU (2001) provides a very low per capita consumption of about 130 units per year only compared to an Indian average of 370 units. The current peak demand is estimated at about 75 MW but it is restricted to only 50 MW. The quality too is low, with frequent curtailment and interruption, transformer failures and low voltage.
The bulk of the power in Nagaland is purchased from the North-Eastern Grid, which is expected to be power surplus, with large hydel projects coming on-stream in other states. The total existing installed State generation capacity is 29 MW, all based on hydropower. Current mean availability from this is about 90MU (2002 onwards). Under the central sector there is an operational 75 MW hydel plant, from which the State receives a share of 12 percent of the generated power. The 24 MW Likimro Hydro Electric Project has been commissioned and a few mini-hydro projects are under construction, which will add about 3 MW to
The bulk of the power in Nagaland is purchased from the North-Eastern Grid, which is expected to be power surplus, with large hydel projects coming on-stream in other states.

Nagaland – A Profile 31
the existing generation. A thermal power plant is planned to be set up at Dimapur within the next two years.
Power generation, transmission and distribution are managed by the Nagaland Department of Power (DoP). The DoP’s current financial situation is dire with a revenue collection of Rs. 19 crore against a power purchase bill of Rs. 36 crore (2001). The State suffers from high transmission and distribution (T&D) losses, estimated at 58 percent. Due to old and overloaded T&D infrastructure, technical losses form a significant fraction. In this regard, it may be mentioned that the State Power Department does not have the facility to undertake an audit of power transmission or distribution. Consequently, no detailed projection or analysis of segment-wise demand is available in the State. However, an investment projection of Rs. 4,500 crore (US$ 900 million) has been made to raise the generating capacity of the State to 450 MW, based on a notional per capita consumption target of 1,000 units.
Water Supply
Most of the Naga villages are located on hilltops, which make supply of drinking water a challenging task. Therefore, water has to be normally supplied, through gravity, from a source located at a higher altitude than the village. The number of villages having protected water supply sources in 1963 was only 59. Now, 1304 (fully covered–261, partially covered–1043) of the 1376 villages/habitations (approximately 95%) have been provided with drinking water supply. Under the ongoing water supply schemes, the remaining 72 villages/habitations will also be covered during 2004. Efforts are also being made to augment the water supply/distribution in the State, both in the rural and urban areas, to keep pace with the increasing requirement of water as the population grows. The objective is to achieve the recommended norm of 40 lpcd (litres per capita per day). Attempts are being made to involve the community in implementation and maintenance of the water supply schemes.
Sustaining Development: Health and Education
Health
In spite of the high decadal growth rate in population, the health profile of Nagaland has shown tremendous success, particularly in the expansion of primary health care system, the progressive increase in the number of trained health providers and the low infant mortality rate. Nagaland’s crude birth rate is higher than the all India figures but the State’s infant mortality rate is much lower. The vital statistics of every married woman producing four children during her productive phase has resulted in a total fertility rate of 3.77. The couple protection rate, i.e.
Most Naga villages are located on hilltops, which makes supply of drinking water a challenging task.
Nagaland State Human Development Report32
use of contraceptives, is 30.3 percent. This shows there is need for improvement in the health profile indicators in the State.
The programmes carried out during the last 40 years have resulted in fairly good infrastructure facilities for health for the people of Nagaland. During 1980, the State had 204 health centres, including urban hospitals, rural hospitals, primary health centres and sub-centres with a total of 1367 beds and 156 doctors. By 1999–2000, the number of health centres increased to 425, with 1633 beds and 394 doctors. The coverage was roughly 20 doctors and 30 hospitals/health centres per lakh population. The health professional to total population ratio was 1: 4000, against the recommended ratio of 1: 3500. This showed inadequacy of health facilities to meet the requirements of the State. Specialised services were even more limited. The State has, so far, not taken full advantage of its vast potential of indigenous medicines, readily available, to take health to all its citizens. Ethno-medicinal practitioners too enjoy the confidence of the people, who often go to them first before approaching modern health providers.
During 1999–2000, 37.1 percent of rural households approached government hospitals for health care whereas 34 percent went to private clinics. The corresponding figures for urban areas were 34.8 percent and 57 percent. This showed that people, especially in urban areas, were willing to pay for good health facilities.
Communitisation of health services has been initiated since July 2002 to delegate powers for management of the health centres to the community. The initiative has resulted in a marked improvement in the quality of health care facilities available in the villages.
Education
There has been a phenomenal increase in the levels of literacy, which was 67.11 percent in 2001 as compared to 21 percent in 1963. However, against a national increase of 21.39 percent in the literacy rate during the period 1991 to 2001, the State witnessed an increase of only 8.86 percent in the same period. Consequently, there was lead of a mere 3.73 percent above the national average in the State’s literacy during 1991–2001 as compared to a lead of 9.24 percent during 1971–81.
In spite of the laudable achievements made by Nagaland in terms of the educational infrastructure and the improvements in literacy percentage, the quality of education being made available is a matter of concern. Improvement of existing educational infrastructure, extensive human resource development and support for teachers’ training will be vital. The pass percentage in the matriculation examination is only 48.6 percent, whereas in higher secondary it is 76.5 percent. The dropout rates
Ethno-medicinal practitioners enjoy the confidence of the people, who often go to them first before approaching modern health providers.

Nagaland – A Profile 33
at class 10 and 12 levels are considerable. Unfortunately, vocational training and entrepreneurial skills building still remain weak.
There is need for at least one college each for medicine and engineering. At the moment, the Government of Nagaland nominates and sends students on stipend, annually, to various institutions in the country as per allotment of seats made by the Union Government. Other sectors like IT, biotechnology and environmental studies need to be built up, considering the inherent strengths of the State in these areas. The existing two government polytechnics (a third polytechnic is in the offing) need to be revitalised by inculcating the spirit and attitude towards work, introducing relevant trades, and by providing adequate support for physical facilities and equipment.
With a view to revitalising education, the Government passed an Act in 2002, communitising elementary school education in the State. Under this initiative, the management and development of elementary schools have been transferred to the community. It is anticipated that community involvement and participation would not only ensure universalisation of education but also yield quality results.
IV. The Way Ahead
Development in Nagaland started under very challenging circumstances. Besides near absolute lack of any infrastructure, its remoteness and inaccessibility, the State was also engulfed in protracted and violent insurgency, which disrupted development efforts at every stage.
Nevertheless, in 40 years of statehood, Nagaland has made significant progress. The administrative reach has extended to the far corners of the State, which is one way of addressing the problem of ‘remoteness'. Important infrastructure has been laid and connectivity within the State has improved. Nagaland has also made tremendous progress in all major sectors of human development. Its literacy rate has reached 67.11 percent from a mere 20.40 percent in 1961. Its sex ratio, CBR, CDR, IMR and MMR rates are better than the national average. Life expectancy is 73.4 years. The per capita income has also climbed above the national average as per 2001 figures. However, the major challenges which confronted the State in the beginning still remain. Because of this, in most cases, the figures and statistics, even though impressive, do not reveal the complete picture. For instance, while the literacy rate is encouraging, the quality of education has suffered and the unemployment rates, especially of educated youth, are a real cause for concern. Problems related to infrastructure remain. There is also the question of mobilisation of internal resources, especially through exploitation of the State’s natural resources. Strategic planning and intelligent investments will be as important as finding sources of funding.
Improvement of existing educational infrastructure, extensive human resource development and support for teachers’ training are vital for educational development.

Nagaland State Human Development Report34
The State is at a crucial stage in its trajectory of growth. The rich social capital of Naga communities, the general resilience of the society, the varied and rich environmental capital and the mineral wealth are the inherent strengths to build upon for a faster and sustainable progress. Through various innovative policy interventions, the State Government is making efforts to tap into this rich social capital and to bring the people back into the centre of decision-making. One of them is the Nagaland Communitisation of Public Institutions and Services Act, 2002, where management of Government assets is being turned over to the village communities. The people have responded favourably although the initiative is still in its infancy.
As Nagaland looks forward, the following areas have to be addressed: Conditions to overcome the immediate impacts of violence. Development initiatives to improve infrastructure, living and working
conditions. Special attention for the youth of Nagaland in the fields of technical
education, recreation and gainful employment. New strategies for a ‘Developed Nagaland’. A purposeful model of interaction between the people, administrators
and political leadership has to achieve this vision of a ‘Developed Nagaland’.
The last few years of ceasefire have given the people renewed hope. Naga society is now poised at a critical juncture. The time to build is now.
Box 1.4
Intrinsic Strengths
Social Capital—clan, village, tribal bonds• Social Capital—village
governance systems and network
• Absence of beggary, dowry, caste system, female infanticide
• High literacy rate of 67.11%
• Abundant fertile land• High land: man ratio• Resilient and hospitable
people
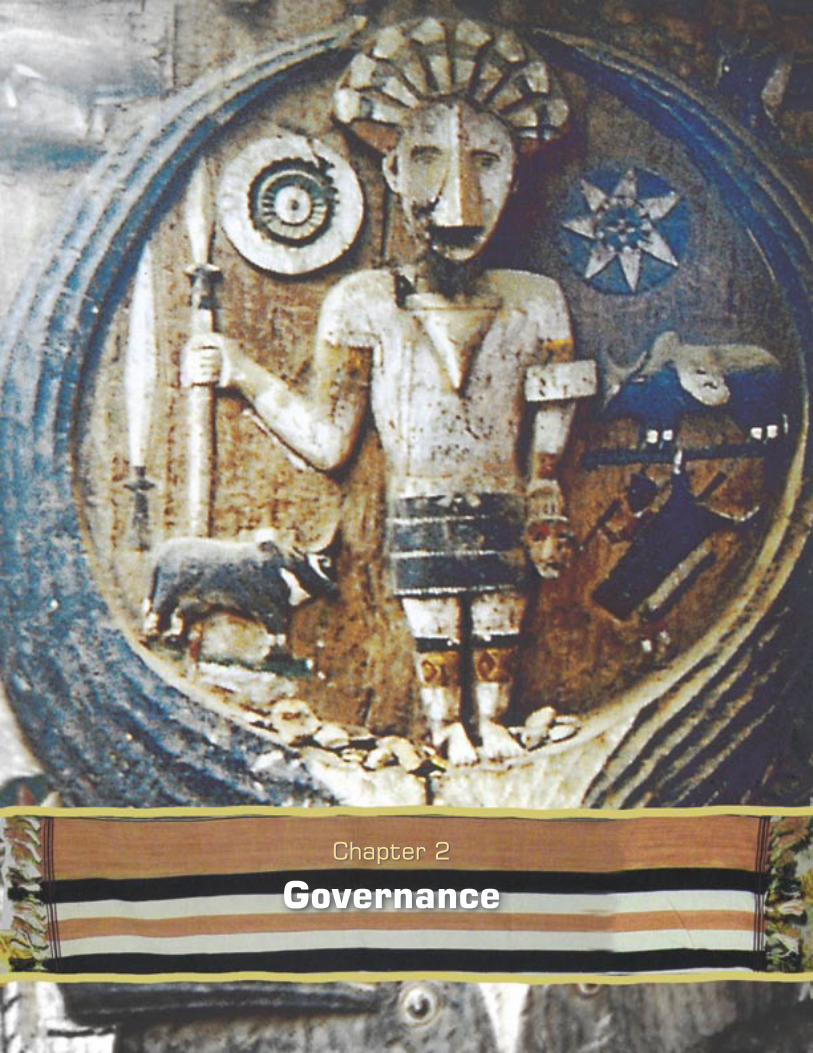
Chapter 2
Governance

Nagaland State Human Development Report36
I EVOLUTION OF GOVERNANCE SYSTEMS 37
Naga Traditional Society 37
British Influence on Traditional Institutions 38
Nagaland’s Democratic Experience: 1963–2003 42
II NEW GOVERNANCE SYSTEMS 43
New Systems and Linkages 46
Village Councils 46
Nagaland Village Development Model: 47 Village Development Boards
Urban Governance 49
III BUILDING ON SOCIAL CAPITAL 51
Churches 51
Voluntary Organisations 52
Communitisation 52
IV GENERAL ADMINISTRATION…BEGINNINGS OF CHANGE 54
V GOVERNANCE AND DEVELOPMENT 55
VI THE WAY AHEAD 57

Governance 37
Many contextual elements have influenced Nagaland’s governance experience. For one, the diversity of tribal
systems makes this experience unique. Other hurdles had to be encountered, especially in the backdrop of decades of violent insurgency. Nevertheless, Naga society managed to continue its important interface with traditional institutions of governance on the one side and, on the other, a stable association with modern democracy through the electoral process. This chapter looks at the traditional institutions of governance in Nagaland, the democratic experience since statehood and the critical linkages that have been created between the two through innovative interventions like the Village Development Boards and Communitisation of Public Institutions and Services.
I. Evolution of Governance Systems
Naga Traditional Society
Naga traditional life revolved around the village. The family, clan, khel and village represented the extent of a Naga’s concern, and there was very little inter-village, and even less inter-tribe, interaction. The village was the highest political unit and the sameness of culture and shared concerns for security gave a broad common framework of meaning and loosely held the members of the tribe together. Because of this, the term ‘village-state’ is often used in contradistinction with the Greek ‘city-state’. Not surprisingly, a person’s identity was inseparable with that of his family, clan, khel and village. Inter-village feuds were very common because the village would avenge any wrong committed against a member by a person from a different village, and any member of the culprit village was a target in seeking vengeance. Within the village, a culture of caring among fellow villagers was assiduously nurtured and the bonds of kinship were usually very strong in the village.
Duties and responsibilities to family, clan, khel and village were stressed almost to the exclusion of individual rights. Individual feats were mostly
“Good governance is perhaps the single most important factor in eradicating poverty and promoting development.” UN Secretary General, Kofi Annan, Human Development Report 2002

Nagaland State Human Development Report38
The notion of electing leaders was alien; leaders were recognised and accepted for their qualities and abilities through an informal but stringent process.
for social acclaim and to please the gods. For instance, a successful hunter did not partake of his own kill. It would be distributed to kinsmen and relatives, especially the womenfolk and the old, while the hunter would be prepared some other food.
Commenting on the unusual nature of the tribes, Verrier Elwin said, ‘Naga society presented a varied pattern of near-dictatorship and extreme democracy. There was a system of hereditary chieftainship among the Semas and Changs. The Konyaks had very powerful Chiefs or Angs, who were regarded as sacred and whose word was law. The Aos had bodies of elders who represented the main family groups in the village and the Angamis, Lothas, Rengmas and others are so democratic that noted writer, J.H. Hutton, has remarked that in the case of the Angamis, it is difficult to comprehend how, in view of their peculiar independence of character, their villages held together at all before the coming of the British Government.’
The sense of justice was highly honed. But justice was tempered by self-respect and honour, not just of oneself but of the other party as well. Care was taken to see that the self-respect and honour of the guilty person was not injured. Among the tribes that practised ‘extreme democracy’, disputes were usually settled by arbitration, by other clans/khels or in village meetings, in case the involved families/clans were unable to settle them. The arbitrators usually mediated between the parties to the dispute. But these were ad-hoc courts, as no regular judicial courts were in existence. In matters of serious crime such as murder, banishment from the village was automatic. But often revenge was quicker. Even for killings by mistake, such as when out on hunting, seven years’ exile was prescribed.
Decision-making among those tribes with chiefship system was quite straightforward. Among those following a republican system, members of the Village Council, elected/nominated by the various clans/khels, decided together. While among those where ‘extreme democracy’ prevailed, it was a complicated and long-drawn affair because the search for broad consensus was the norm. Here, no ‘leader’ spoke on behalf of the village community without thorough deliberation and decision by the entire community. Frequently, the specific issues would be passed down to the khels, clans and families before the village could come to a decision. The notion of electing leaders was alien; leaders were recognised and accepted for their qualities and abilities through an informal but stringent process.
British Influence on Traditional Institutions
The advent of the British in 1832 changed the world of Nagas forever. For the next 50 years, the Naga tribesmen violently and bitterly resisted the authority of the British until the fall of Khonoma village in 1880.

Governance 39
Thereafter, the British gradually established their administration over a sizeable area of Naga territory. However, the British largely left the Nagas alone so long as they did not create trouble. The British administration did not extend to all Naga tribes and those Nagas who remained outside British administration were referred to as ‘Free Nagas’ in the ‘Unadministered Areas’. Among these ‘Free Nagas’ are the various tribes in present-day Mon and Tuensang districts of Nagaland. British relations with these tribes were confined mainly in preventing them from creating trouble for the administration. This and the fact that they were later grouped under the North East Frontier Agency (NEFA), until 1957, were major causes for their late start in the development process and this is why Mon and Tuensang are, today, more backward than the rest of the State.
The advent of the British, and exposure of the Nagas to the outside world ushered in profound changes, especially in their worldview. The following are some of them:
During World War I, the British mobilised Naga tribesmen into the Allied Labour Corps and sent about 2000 Nagas to France. This was the first time that Nagas from different tribes stayed together in close proximity under war conditions, far away from home. Their exposure to the West strengthened their feeling of ̀ collective separateness’ as well as the belief that they were not inferior to anyone else. On their return from France, in 1918, some of these veterans formed the Naga Club in Kohima, which later played a pivotal role in the organised search for a common Naga identity.
The carving up of Naga territory, through the Treaty of Yandabo in 1826, and the later effects on the Indian side, for administrative convenience, actually helped to accelerate the process of the diverse tribes coming together and building a common Naga identity as the Nagas sensed the need to do so quickly for their collective survival.
The establishment of a central British rule with different tiers of administration such as Gaonburas, Dobashis and district administration led to profound changes although the British also recognised traditional leadership and sought to disturb these as little as possible. Nevertheless, traditional institutions were sought to be integrated into the larger colonial political framework. In the process, the effective independence of the Naga village-states and traditional leadership began to disappear.
The introduction of money as the medium of exchange, and for trade and commerce left behind far-reaching consequences on the concept of values the Nagas had so far lived by. In the pre-money period, the Nagas lived in an egalitarian society, where the poor did not hate the rich and the rich shared their wealth with the poor. This was possible because the difference between rich and poor was a matter
The British administration did not extend to all Naga tribes and those Nagas who remained outside British administration were referred to as ‘Free Nagas’ in the ‘Unadministered Areas’.
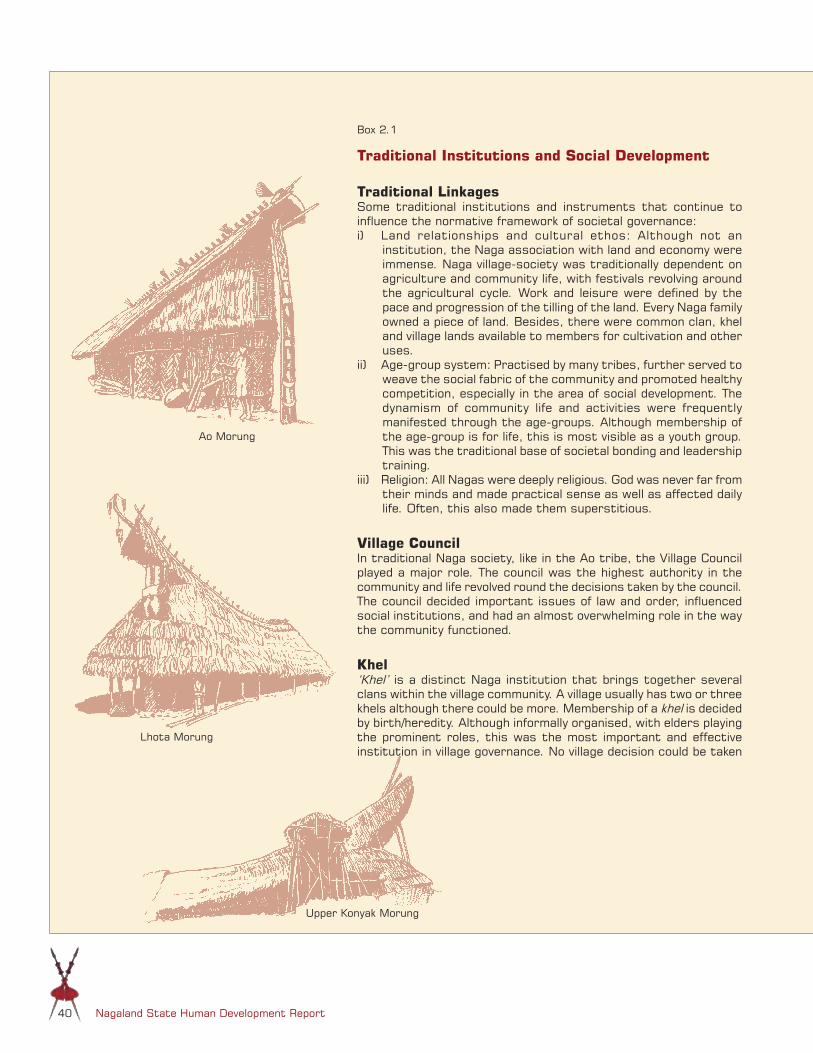
Nagaland State Human Development Report40
Box 2.1
Traditional Institutions and Social Development
Traditional LinkagesSome traditional institutions and instruments that continue to influence the normative framework of societal governance:i) Land relationships and cultural ethos: Although not an
institution, the Naga association with land and economy were immense. Naga village-society was traditionally dependent on agriculture and community life, with festivals revolving around the agricultural cycle. Work and leisure were defined by the pace and progression of the tilling of the land. Every Naga family owned a piece of land. Besides, there were common clan, khel and village lands available to members for cultivation and other uses.
ii) Age-group system: Practised by many tribes, further served to weave the social fabric of the community and promoted healthy competition, especially in the area of social development. The dynamism of community life and activities were frequently manifested through the age-groups. Although membership of the age-group is for life, this is most visible as a youth group. This was the traditional base of societal bonding and leadership training.
iii) Religion: All Nagas were deeply religious. God was never far from their minds and made practical sense as well as affected daily life. Often, this also made them superstitious.
Village Council In traditional Naga society, like in the Ao tribe, the Village Council played a major role. The council was the highest authority in the community and life revolved round the decisions taken by the council. The council decided important issues of law and order, influenced social institutions, and had an almost overwhelming role in the way the community functioned.
Khel ‘Khel’ is a distinct Naga institution that brings together several clans within the village community. A village usually has two or three khels although there could be more. Membership of a khel is decided by birth/heredity. Although informally organised, with elders playing the prominent roles, this was the most important and effective institution in village governance. No village decision could be taken
Ao Morung
Lhota Morung
Upper Konyak Morung

Governance 41
without the inclusion and approval of all the khels in the village. The khel also had power to overrule individual clan decisions although this was avoided because of the harmful consequences for khel unity. This is so even today despite the growth of so many community level organisations/groups and the over-arching authority of the Government.
Morung‘Morung’, or communal dormitory, separate for young men and women, was the most important and primary traditional institution of the Naga tribes within the village community. There was a Morung for every khel (cluster of clans). In some tribes like Angami, every clan would have its own Morung. It was the primary educational institution that nurtured and prepared the young of every clan for life and living. All the clan/khel/village history, folklores and legends, songs, traditional practices, including the laws governing community living, were taught here. In some tribes, it also served as the fortress of the village where the young unmarried men used to sleep and guard the village.
Tribal CourtsTraditionally, Nagas did not have regular courts. Later, with the advent of the British, tribal courts were set up and judges were appointed from among reputed persons within the tribal community to decide cases. Thus, the first regular courts were started. The British also created the posts of ‘Gaonburas’ (village elders) and ‘Dobashis’ (interpreters) to assist them in the administration. While the Gaonburas were charged with responsibility of good behaviour by their villages and soon also became the spokesmen of the village community, the Dobashis, in the course of interpreting for British administrators, were liaisons between the British Government and their local people. Having been accredited with the authority of the Government, the Dobashis enjoyed the respect of the native people. Being knowledgeable about customary laws, the Dobashis advised the British officers in the settlement of cases. Subsequently, the Dobashis courts evolved to decide cases according to Naga customary laws. However, the British administrator remained the Sessions Judge, thus combining the executive and judiciary responsibilities in one person. This system was followed till recently, with the Deputy Commissioner combining in himself both executive and judicial responsibilities.
Sources: Charles Chasie, ‘Traditional Institutions and Social Development’; Sema, Piketo, ‘British Policy and Administration in Nagaland 1881–1947; Aglaja Strin and Peter van Ham; ‘The Hidden World of the Naga—Living Traditions in Northeast India and Burma’
Phom Morung (Tamlu)
Sema Morung
Chang Morung (Tuensang)
Nagaland State Human Development Report42
of degrees. With the introduction of money, the earlier concept of prosperity became immeasurable and egalitarianism began to disappear. The advent of World War II would accentuate the situation further for a people who were yet to grasp the basics of an economy based on money.
The social and cultural adaptation of the Nagas from a rural-based traditional set-up to a modernist urban-based structure went deeper than the visible external structure. According to Dr Anungla Aier, an anthropologist, ‘though the British spoke about a policy of non-interference and allowing village autonomy and traditional customs, in effect, they had a strong presence and were instrumental in breaking down the customary powers of the traditional elites such as the chiefs and village elders by introducing a higher authority over the village’. The political restructuring initiated by the British was, subsequently, ‘reaffirmed’ in the wake of Indian independence and formation of the Nagaland State. Thus, urban-based centralised political and economic structures introduced completely non-traditional modes of achievements and opportunities.
Nagaland’s Democratic Experience:1963–2003
The year 1963 was a milestone in the history of Nagaland. With statehood, modern democratic institutions and practices were also ushered in. This critical step in the evolution of Nagaland gave the Naga people the opportunity for peace, stability, accelerated investment and economic development.
The Naga people have had a very distinct and complex relationship with modern democracy. So far, they have participated in ten general elections. The first general election in Nagaland was held in January 1964. Of the total 46 seats, 40 were filled by direct election and the remaining six were filled by persons chosen by the members of Tuensang District Regional Council. The tenth general election was held in February 2003 and the assembly now has 60 directly elected members from the eight districts of Nagaland. However, since statehood in 1963, only three governments have managed to complete their terms, the last two being in the last decade.
In 40 years of statehood, Nagaland has seen 17 Chief Ministers. The early two decades were dominated by regional parties while the last two decades have seen the building of alliances with Indian national parties. The era of planned development and government initiatives for improving the quality of life during these 40 years has brought about tremendous positive changes in various dimensions of life. Development initiatives of the State have been responsible for a whole new generation of human resources and improved life conditions.
The era of planned development and government initiatives for improving the quality of life during these 40 years has brought about tremendous positive changes in various dimensions of life.

Governance 43
II. New Governance Systems
The British followed a policy of minimal interference in the affairs of the Nagas. They, accordingly, built up an administration in the Naga-inhabited areas suited to this policy. This legacy of the British continued even after India attained independence and adopted its own constitution. The administrative structure in the State constituted of a judicial-executive framework vesting powers in the Deputy Commissioner or his representatives, as contained in the Rules for Administration of Justice and Police in Nagaland1, 1937. The administration pursued a policy of protection and preservation of the tribal and unique identity of the people of the State using the provisions of the Bengal Eastern Frontier Regulation, 1873. Over a period of time, however, the traditional structures and institutions of governance as in the rest of the country were also introduced, especially after Nagaland became a separate State. The emphasis also shifted from providing basic administration, control and maintenance of law and order to bringing all round development in the State.
The present administrative framework in Nagaland is essentially similar to that in other states of the country and consists of the Secretariat—Directorate structure of governance at the State level, with the districts being the main unit for implementation of development programmes and maintenance of law and order. Though the judicial and executive powers in the district are still exercisable by the Deputy Commissioner, the process of separation of the executive and judiciary is already in an advanced stage. A separate bench of the Guwahati High Court at Kohima provides an easier and closer access to the higher justice systems. The State has its own legislature, which is a witness to some keen debates among the representatives of the people of the State.
Nagaland has come a long way from being a district of another State to being a full-fledged State with its own legislature and development machinery. The depth and coverage of administration has also expanded with the earlier unadministered areas of Tuensang and Mon being provided with the full gamut of administrative machinery and the number of districts in the State increasing to 11 with numerous subdivisions and administrative outposts. The developmental arms of the Government have also expanded concurrently with district-specific programmes being executed, suiting the needs of specific areas with sensitivity, familiarity and skill.
However, within this larger framework, Nagaland has distinct characteristics, imparting uniqueness to the governance experience in the State. Article 371 (A) of the Indian Constitution provides that any act of the parliament, relating to religious, social and customary practices of the Nagas and those relating to land and its resources shall not apply to Nagaland unless it is ratified by the State Assembly. This provision remains
1 Originally Naga Hills District
Article 371 (A) of the Indian Constitution provides that any act of the parliament, relating to religious, social and customary practices of the Nagas and those relating to land and its resources shall not apply to Nagaland unless it is ratified by the State Assembly.
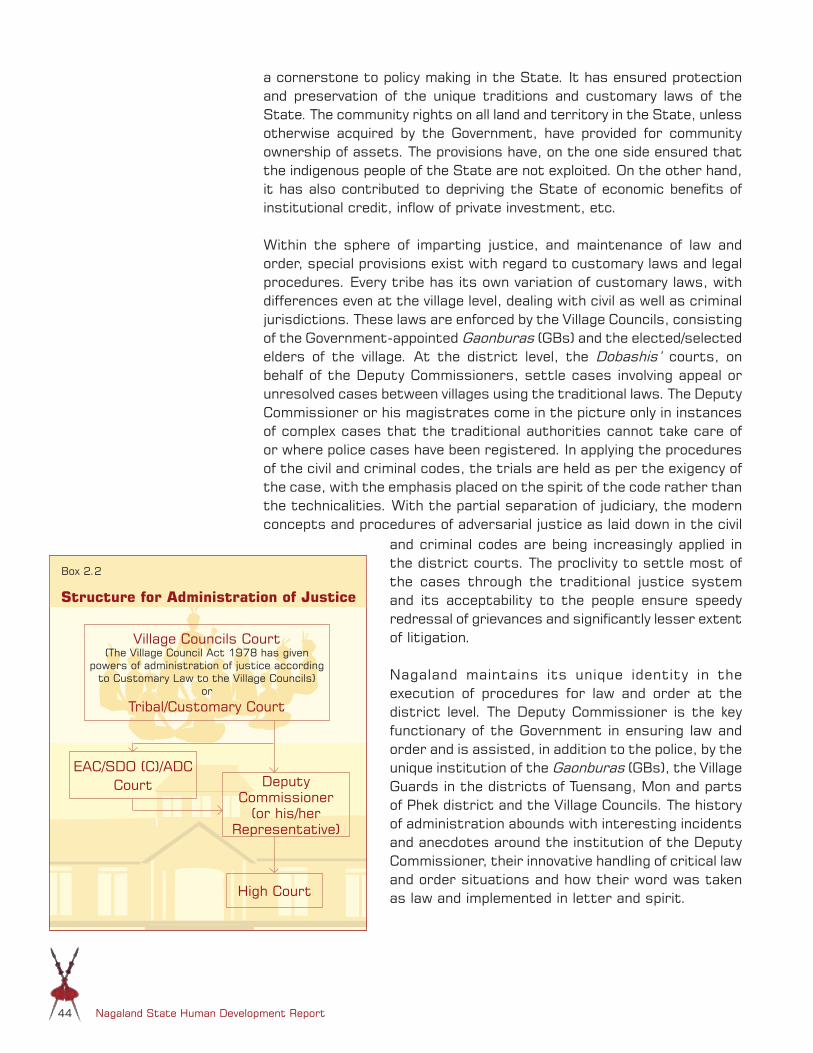
Nagaland State Human Development Report44
and criminal codes are being increasingly applied in the district courts. The proclivity to settle most of the cases through the traditional justice system and its acceptability to the people ensure speedy redressal of grievances and significantly lesser extent of litigation.
Nagaland maintains its unique identity in the execution of procedures for law and order at the district level. The Deputy Commissioner is the key functionary of the Government in ensuring law and order and is assisted, in addition to the police, by the unique institution of the Gaonburas (GBs), the Village Guards in the districts of Tuensang, Mon and parts of Phek district and the Village Councils. The history of administration abounds with interesting incidents and anecdotes around the institution of the Deputy Commissioner, their innovative handling of critical law and order situations and how their word was taken as law and implemented in letter and spirit.
a cornerstone to policy making in the State. It has ensured protection and preservation of the unique traditions and customary laws of the State. The community rights on all land and territory in the State, unless otherwise acquired by the Government, have provided for community ownership of assets. The provisions have, on the one side ensured that the indigenous people of the State are not exploited. On the other hand, it has also contributed to depriving the State of economic benefits of institutional credit, inflow of private investment, etc.
Within the sphere of imparting justice, and maintenance of law and order, special provisions exist with regard to customary laws and legal procedures. Every tribe has its own variation of customary laws, with differences even at the village level, dealing with civil as well as criminal jurisdictions. These laws are enforced by the Village Councils, consisting of the Government-appointed Gaonburas (GBs) and the elected/selected elders of the village. At the district level, the Dobashis’ courts, on behalf of the Deputy Commissioners, settle cases involving appeal or unresolved cases between villages using the traditional laws. The Deputy Commissioner or his magistrates come in the picture only in instances of complex cases that the traditional authorities cannot take care of or where police cases have been registered. In applying the procedures of the civil and criminal codes, the trials are held as per the exigency of the case, with the emphasis placed on the spirit of the code rather than the technicalities. With the partial separation of judiciary, the modern concepts and procedures of adversarial justice as laid down in the civil
Village Councils Court(The Village Council Act 1978 has given
powers of administration of justice according to Customary Law to the Village Councils)
or
Tribal/Customary Court
EAC/SDO (C)/ADCCourt Deputy
Commissioner(or his/her
Representative)
High Court
Box 2.2
Structure for Administration of Justice

Governance 45
The prolonged insurgency and periods of violent conflict have left their mark on the governance experience. A visible effect has been the widespread presence of armed forces in the region, which has influenced the development experience and worldview of the society. It also hampered the State’s efforts at decentralisation of development administration and weakened the monitoring mechanisms. The administration has had to spend much energy and resources to deal with political and insurgency-related problems. Officials, particularly in the field, in the distant areas far away from the capital, have had to perform under the most difficult of circumstances. Caught between the imperative of asserting the rule of law while at the same time having to face the consequences of the continuous insurgency, it has not been easy to maintain the balance between ensuring development and also maintaining peace.
The institutions developed during periods of peace have often been undermined during the periods of conflict. The situation can be made use of advantageously as it provides vast spaces of opportunity to the Government agencies to innovate and perform without being bound by rigid structures of bureaucracy. With lasting peace in the horizon, there is tremendous scope for building institutions and governance systems by drawing upon and merging together democracy with traditional systems and development aspirations of the people. The Village Development Boards and the Communitisation experience are two such successful initiatives in the State.
Box 2.3
Good Governance Project: Powering Change through DPDBs
With the aim of making an assessment on the manner in which governance has improved the condition of human development and to suggest measures for improvement, the State Government developed its Good Governance Project with support of UNICEF during 2002. The project was taken to four of the districts (Tuensang, Mokokchung, Phek and Kohima), to those working in the field, and to the people. It was carried out in three phases – 1. Needs Assessment. 2. Perspectives and practices of governance through four thematic workshops. 3. Review and Reflection.
The objectives of the project were: To evolve working models of good governance and actualise
them through pilot projects. To strengthen structural linkages to ensure delivery of
development. Improving infrastructure of Government systems—such as
simplifying procedures, checks and balances, monitoring tools, best management practices, etc.
Updating skills, attitudes and new responsibilities of Government officials.
The project utilised the District Planning and Development Boards (DPDBs), at the district level, to evolve working models of good governance. The thematic workshops were held exclusively at this level although there were opportunities for interface at higher levels with Secretaries and heads of departments as well as the Steering Group of the project. The project had great impact as communication gaps were replaced by clarity and purposefulness, compartmentalisation gave way to departmental inter-relatedness and individual-driven efforts gave in to collectively set agenda. The district officers also experienced a sense of belonging and empowerment as their views were heard and given importance.
The Steering Group of the good governance project, based on recommendations from the various district level workshops, adopted the following action points: Timely allocation and release of funds. Transparent and fair tenure, transfer, posting policies. Maintain flow of information from top to bottom. Maintain clarity in job and role descriptions and rationalised
work allocation. Proactive steps by HoDs/Secretaries to support/build
capacity at DPBD levels.

Nagaland State Human Development Report46
Box 2.4
The Press
“Civilisation has produced one idea more powerful than any other and that is the notion that people can govern themselves. And it related a theory of information called journalism to sustain that idea. The two rise and fall together.’
– Bill Kovach, Chairman of the Committee of Concerned Journalists, USA
Steeped in oral history and communication, one of the new experiences of modern democracy in Naga society is the emergence of the media. The Fourth Estate of government, viz. the press, in Nagaland has begun to play a significant role in providing and disseminating information as well as in moulding public opinion. This was not always so. The press in Nagaland, with little training and support, has had to suffer a prolonged and painful infancy. This sad situation was further worsened by the conflict situation, frequent intolerance for contrary opinion, and the atmosphere of fear besides lack of support from the small reading public.
Now, the situation is turning around. The readership is rising, the Government and the public have become more sensitive and participatory, and recognition of the role of the press, through better understanding, is gradually coming from both the public and the Government. In turn, this has helped the press through investments in infrastructure and personnel, wider participation and coverage throughout the State, and improvement in quality of the product in general through competition and market forces. However, the press in Nagaland still needs nurturing. A free and thriving press is essential to sustain modern democracy, especially one that is just emerging from a long period of insurgency and conflict. The press here has still much need for investments in infrastructure, especially in the areas of reach and coverage, training of personnel and better pay, and more official and public support and participation.
Contributed by Charles Chasie
New Systems and Linkages
In the past four decades there has been remarkable extension of the administrative reach to the far-flung corners of Nagaland. In many ways, the organisation of the districts along general tribe geographical boundaries has provided continuity of traditional tribal practices and linguistic affiliations. All the eight districts except Dimapur and Tuensang can be identified with particular tribes. Today, in partnership with the State Government, Village Councils are an important component of modern governance system in Nagaland. While the District Planning and Development Boards provide the needed flexibility to ensure a responsive and holistic approach towards development for the district, linkages to the
grassroots through the Village Development Boards have been established for delivering the rural developmental objectives. These linkages have become vital for decentralising governance and decision-making in the post-independence and statehood era.
Village Councils
In order to restore the esteem of the traditional village authority systems, weakened due to the gradual introduction of the hitherto unknown systems of modern democracy, the Government codified the powers and functions of the Village Councils, recognising the traditional village bodies like the Putu Menden of the Aos, through the Nagaland Village and Area Councils Act, 1978. This law, applicable to the entire State, included the following important elements:
1. Every recognised village shall have a Village Council. The tenure of Village Council shall be five years.
2. Village Council members to be chosen by villagers in accordance with the prevailing customary practices and usages. Hereditary Village Chiefs, Gaonburas and Angs shall be ex-officio members with voting right. A member of the Village Council has to be an Indian and not less than 25 years of age.
3. Village Council chairman and secretary to be chosen from among the members. In the case of secretary, the person can

Governance 47
be a non-member, provided that in such case he/she will have no voting right.
4. The Village Council will meet once every three months or more frequently if requisitioned by one-third of the members.
Special Powers
The Village Council has special powers to maintain law and order and administer justice within the village limits in accordance with the customary laws and usages as accepted by the canons of justice established in Nagaland. Section 15(1) of the Village Council Act provides that ‘the village shall … have full powers to deal with internal administration of the village’. The Councils act as the village courts in accordance with the powers entrusted under the Rules for Administration of Justice and Police in Nagaland, 1937. In disputes between villages, two or more Village Councils can settle the dispute in a joint session. These provisions have helped in decentralising governance and placing the power of change in the hands of the people.
Nagaland Village Development Model: Village Development Boards
The Nagaland Village and Area Councils Act, 1978, also strived to exploit the traditional administration abilities of Village Councils for decentralisation of developmental responsibilities to the local bodies. The Act consolidated the provisions empowering the Village Councils to formulate Village Development Schemes and implement developmental works in the villages. As envisaged in the Act, the constitution of Village Development Boards (VDBs) to take on these responsibilities of the Village Council was formalised through the Village Development Boards Rules notified in 1980.
The Village Development Board formulates development priorities for the village, prepares action plans and executes them, using the village community or other funds. All residents of the village are members of the General Body of the Village Development Board. Two General Body meetings are held in a financial year, where the Secretary of the Board presents his reports, along with detailed audited financial statements.
The Deputy Commissioners, in their ex-officio capacity, are the chairpersons of the VDBs in their respective districts. A VDB is managed by a committee chosen by the Village Council and includes traditional leaders. The maximum total membership of the management committee is fixed at 25 but it should not be less than five. Twenty-five percent of the membership is reserved for women. The tenure of the Management Committee is three years.
The Village Development Board formulates development priorities for the village, prepares action plans and executes them, using the village community or other funds.

Nagaland State Human Development Report48
Today, the VDBs have become integral to the development discussions in Nagaland. The Village Development Board has power to mobilise resources from internal and external sources. Government assistance to the VDBs includes grants-in-aid, matching cash grants, Jawahar Rozgar Yojana, and other development and welfare programmes.
The VDBs have become the cornerstone of decentralised planning and development in Nagaland. In many places, VDBs’ performance has been exemplary. They have played a pivotal role in creation and maintenance of infrastructure in the villages – community halls, village roads, schools, water tanks, toilets, granaries, rice mills, community fishery ponds, community wells/tanks, culverts and suspension bridges, etc. Many VDBs have purchased buses and ply them from the village to the district headquarters, serving both as an income generating activity and facilitating connectivity with the village. The State Government has been encouraging internal resource mobilisation by the VDBs through different schemes. These endeavours have resulted in the VDBs having collective
Box 2.5
Powers and Duties of the Village Development Board
Formulation of Village Development Schemes;
Supervising proper maintenance of water supply, roads, power, forest, education and other welfare activities;
Helping various Government agencies in carrying out development works in the village;
Initiating development works on its own or on request by the Government;
Facilitate borrowing from Government, banks or financial institutions for development and welfare works;
Authority to receive grant-in-aid, donations and subsidies from Government or other agencies;
The VDB can provide security for repayment of loan by any permanent resident of the village from the Government, bank or financial institution; it can also forfeit security of borrower on default;
The VDB can lend money to deserving permanent residents;
Authority to enter into loan agreements with the Government, bank or financial institutions or a permanent resident of the village.
Table 2.1 Spread of Village Development Boards
District/State No. of VDBs Number of Households
Total Time Deposits in Banks* (in Rs.)
Kohima 157 32102 3,07,33,721
Dimapur 189 33461 2,53,52,058
Phek 79 19310 2,22,51,850
Mokokchung 75 20871 2,19,29,512
Wokha 110 14672 1,42,14,970
Zunheboto 156 17656 2,10,61,597
Tuensang 193 44204 4,05,42,134
Mon 94 25910 2,87,53,239
Nagaland 1053 208186 20,48,38,081
* As on 1.4.00Source: State Rural Development Department

Governance 49
savings of Rs 20.48 crore in time deposit and over Rs 10 crore in fixed deposit by the end of 1999–2000. To aid them further, the Government has declared some of the VDBs as non-banking financial institutions. Building on the rich social capital of the village communities and benefiting from this structural linkage, the VDBs continue to pioneer micro-level development in imaginative, culturally appropriate and resource-efficient ways. The Planning Commission’s High Level Commission Report to the Prime Minister for Transforming the North East, headed by Shri S.P. Shukla, has commended the achievements of the VDBs and recommended their replication in other states.
Urban Governance
Urban growth in Nagaland is a relatively recent phenomenon. The growth of towns in Nagaland has been largely associated with the establishment of new administrative headquarters as the Government created more districts and subdivisions to extend its reach.
The Census figures indicate that 17.74 percent of the State’s population lives in nine urban centres. This figure does not, however, include the population of 10 other towns, which were not classified as urban centres in the last Census but which have been notified as Town Council areas by the Government. The spatial pattern of growth of urban towns has been extremely skewed in Nagaland. For instance, while there has been a disproportionate increase in the population of Dimapur and Kohima, the proportion of population in other urban centres of the State has either increased marginally, or has actually declined. This is indicative
Patterns of Urbanisation
Figure 2.1
6.216.21 - 7.157.15 - 8.388.66 - 13.7313.73 - 14.7214.12 - 23.423.4 - 25.125.1 - 40.17
Density of Urban Population (per sq. km.)
Distribution of Urban Population Table 2.2
District/State 1981 1991 2001
Urban Population
Percentage of Urban
Population
Urban Population
Percentage of Urban
Population
Urban Population
Percentage of Urban
Population
Kohima 67218 55.91 117396 56.38 78584 22.27
Dimapur - - 123892 35.11
Phek - - 8366 4.02 12863 3.65
Mokokchung 18060 15.02 24803 11.91 31204 8.84
Wokha 8180 6.80 14377 6.90 37696 10.68
Zunheboto 7678 6.39 11473 5.51 22809 6.46
Tuensang 12200 10.15 21018 10.09 29654 8.40
Mon 6898 5.74 10790 5.18 16119 4.57
Nagaland 120234 100.00 208223 100.00 352821 100.00
Source: Census 1981, 1991, 2001Note: Dimapur district was part of Kohima during 1981 and 1991 census

Nagaland State Human Development Report50
of in-migration of people to Dimapur and Kohima from the rural areas as well as the smaller urban centres of the State. An underlying cause for this out-migration from smaller towns is the inadequacy of urban infrastructure and employment opportunities.
The urban growth experience in the rest of the country shows that the urban areas act as growth engines for the region and contribute a major share to the state domestic product. It is therefore, necessary that the development strategies for the urban areas of Nagaland take care of the needs of the faster expanding towns of Dimapur and Kohima, which have become important centres of trade and commercial activities, and at the same time also focus on developing the other towns. The impact of sustained migration to places like Dimapur and Kohima, which has put a strain on the limited urban services and infrastructure in these towns and has resulted in increased urban poverty and unemployment levels, needs also to be kept in mind while planning out strategies of urban governance.
Unlike the villages, there has been an absence of traditional administrative structures in the towns. Over the years, the district headquarter towns in the eight districts and Kiphire town have seen establishment of Town Committees, under the Naga Hills (Constitution of Town Committees) Rules, 1954, to look after urban governance in addition to other governmental agencies. These elected Town Committees in the nine urban centres have been unable to adequately address the magnitude of diverse urban issues due to limited powers and finances. The absence of adequate investment from the Government in the towns in terms of planning and finances has also resulted in deterioration of urban amenities. As a result, the State is grappling with serious issues relating to haphazard growth of main urban centres, traffic congestion, pollution, inadequacy of water and sanitation facilities, sewerage systems, drainage and solid waste management.
To address these issues in a sustained manner, the Nagaland Municipal Act, 2001, has been enacted to strengthen the urban local self-Government institutions. The process of implementation of this Act is in progress and the municipal bodies as provided under this Act are likely to be in place in 2004. On the basis of criteria based on population and level of economic activity, the urban centres in the state will have three categories of urban local bodies viz., three Municipal Councils, 16 Town Councils and Urban Station Committees. The Government is in the process of preparing master plans for the development of the major towns and has also focused on tapping Central Government and multilateral agency funding for urban development programmes to improve amenities in the towns.
Box 2.6
Urban Local Bodies under Nagaland Municipal Act 2001
A. Municipal Councils 1. Dimapur 2. Kohima 3. Mokokchung
B. Town Councils 1. Phek 2. Wokha 3. Zunheboto 4. Mon 5. Tuensang 6. Chumukedima 7. Medziphema 8. Jalukie 9. Tseminyu 10. Tuli 11. Changtongya 12. Longleng 13. Kiphire 14. Peren 15. Naginimora 16. Pfutsero
C. Urban Station CommitteesIdentification of urban centres under this category not yet completed.
Governance 51
III. Building on Social Capital
A major strength that contemporary Naga society has inherited is the ‘social capital’ that has stemmed out of traditional institutions and practices. There is strong social bonding and community spirit, and absence of caste and social discrimination. The established and empowered local governance institutions like Village Councils and Village Development Boards, a strong religious bond, and active tribal, youth and women’s bodies enrich the State’s governance experience. The unique initiative of Communitisation of socially critical areas further strengthens the role of the community in governance. The Hon’ble Prime Minister, Shri A.B. Vajpayee, acknowledged the strengths of the civil society during his visit to the State this year:
“There are many good things that others should learn from Nagaland. For example, the practice of broad-based debate and consensual decision-making in Naga Hohos is the very kernel of democracy. It deserves to be emulated at all levels—from the village level to the global level…. I would like to commend the State’s reforms efforts, particularly the Communitisation of social service institutions, such as schools and rural health centres. Yours is indeed a model for other states to follow.”
Churches
In socio-cultural fields the advent of the Christian missionaries had a great impact on Naga tribal society. On the positive side, the missionaries brought education, introduced the Roman script, and to some extent, helped in the integration of different Naga tribes through membership of the church. On the other hand, the general attitude of early Christian missionaries to treat all tribal traditional practices and culture as ‘pagan’ created much confusion. Primacy of membership of the Church over clan and village affiliation and loyalty also began to create a new identity for the convert. The stress on personal salvation introduced a new individualism.
The Church today enjoys overwhelming influence over the Naga population. Its reach effectively extends to every village in the State. It has played vital roles in peace building in the long history of conflict and insurgency in Nagaland. Church organisations continue to work for peace, like the Nagaland Baptist Church Council (NBCC) through its Peace Affairs Committee. The recent coming together of the different church denominations under the Nagaland Christian Forum (NCF) and joining issue on the question of peace in the State has been a significant development. Since first introducing education, the churches have continued to contribute very significantly to education, health and human resource building in Nagaland. The women’s and youth wings and other structures within the Church have been involved in social activities aimed at empowering the society. The Church has also been involved in activities
The established and empowered local governance institutions like Village Councils and Village Development Boards, a strong religious bond, and active tribal, youth and women’s bodies enrich the State’s governance experience.

Nagaland State Human Development Report52
Trust Training
Transfer ofPower andResources
aimed at preventing the spread of HIV/AIDS. Different churches also have their frontal organisations involved in welfare and development of the people. The Church has, today and in the future, an important role to play in bringing meaningful change in Naga society and leading the individuals towards contributing positively in the changing society.
Voluntary Organisations
The Naga Mothers’ Association, Naga Hoho, the Naga Students’ Federation and several tribal, student and other organisations at the State and district levels have been acting in public interest and exerting pressure on the Government on issues of public importance, and at times assisting in governance. The participation of these voluntary organisations has made the administration of the State more democratic and transparent. The growth of voluntary organisations and the NGO sector in the field of development has been recent. The majority of them were born out of social concern. With their flexible structures and ability to deliver even in the remotest places, NGOs can provide solutions where the relatively rigid structures of the Government fail to deliver. The work of NGOs in the field of spreading awareness about HIV/AIDs and its prevention has been commendable in Nagaland. NGOs have also come up in the fields of education, development and environment. There is a need to coordinate the efforts of the NGOs with the development efforts of the Government. A need is felt to develop a comprehensive policy for NGOs. This was voiced at the seminar of the State NGOs, sponsored by the Department of DONER and the State Government, in October 2002, which was attended by 70 NGOs and Church associations.
Communitisation
Public institutions and facilities in Nagaland have expanded considerably since attainment of statehood in 1963. Almost every village has institutions for primary education and facilities of water supply and power. These were owned and managed by the Government. The performance of many of these institutions has been much below what is desired. Now, the State has initiated the unique concept of Communitisation of these public institutions and services in order to build partnership between Government and the people through delegation of management responsibilities to the community so that the performance of the public utilities improve.
The salient features of the Communitisation process are: A representative committee of the community to own and manage
the communitised institutions. The community’s responsibilities include checking attendance of staff,
repair and maintenance works, purchase of books/medicines, receiving funds from Government for salaries of the staff and disbursing the same after operating the principal of ‘No work, no pay.’
Box 2.7
The ‘Triple T’ of Communitisation Process

Governance 53
Box 2.8
Partners in Human Development
Longleng is a small town perched at the top of a hill in Tuensang district of Nagaland. One of the more backward areas, it had no modern means of communication, no proper roads, health care or educational infrastructure and was ecologically undernourished as well. It presented a haunting picture of deprivation when Reverend Anjo Keikung arrived in the 1980s. The surrounding villages were in an even worse state.
A pastor by profession, Rev. Keikung was determined to turn things around. He initiated the first community planting of bamboo saplings on a four-acre plot of wasteland in the village. This became successful in meeting the local needs as well as in generating gainful employment. He next set up nurseries to meet the growing need of planting seeds with assistance from government and private donors. Side by side, he started leadership training programmes and by 1996, 500 village leaders of Tuensang district were given training, including women. ‘That was a very satisfying experience’, he says.
Rev. Keikung next introduced rooftop water-harvesting on a large scale in schools, in the local orphanage and in the Baptist Mission quarters in Longleng, which comprised around 50 to 60 households. Soon, neighbouring villages followed suit. ‘Before he brought rooftop rainwater- harvesting to Longleng, the area used to suffer from severe water crisis,’ says H.Heong, the then vice-chairman of the town committee. ‘Since the town is situated on the hill top it was difficult to collect and store water, so the inhabitants of the village had to walk daily as far as three to four km to fetch water’. Now, even during the driest months, rainwater collected in huge tanks sustains the village.
In 1993, Rev. Keikung organised women’s groups in each village and encouraged them to participate in the decision-making process. A weaving centre for women was also set up in Longleng town and provided the much needed space for women’s enterprise.
On Rev Keikung’s recommendations, the State Government established an intensive care unit of the Leprosy Mission in Nagaland. It has to its credit the highest leprosy eradication rate in Nagaland. As a result of his ceaseless work, many villages are now economically stable. The town now has a health care centre, an orphanage, schools and a college. Pisciculture has become a thriving business and a number of commercial buildings have come up in the town. The perennial water shortage problem has been greatly alleviated through rain-water harvesting and the social sector has seen significant investments and gains. Of his hopes, Rev. Keikung says, ‘I would l ike to introduce more health camps and plant more trees.’ He serves as a member of the Nagaland Public Service Commission, bringing with him micro-level experience that can help shape the Government-civil partnership.
Source : ‘Moses of Longleng’ Down to Earth, November 15, 1999.
Longleng town
Nagaland State Human Development Report54
The committee is empowered to receive contributions and realise fees. The committee would maintain registers and accounts. Departmental
officers would inspect these and also conduct annual audits. The Government has the right to issue directions to the committee and
to over-ride the committee’s decisions in case of serious defaults.
The Nagaland Communitisation of Public Institutions and Services Act has enlarged the scope of community participation in development and welfare programmes in areas such as education, health, power, rural water supply, rural tourism, roads, forest, sanitation, rural childcare, etc.
IV. General Administration…Beginnings of Change
The emergence of ‘governance’ as a priority area for sustaining peace and supporting development has given rise to society-wide dialogue and collaboration. While articulating the State’s vision at the ‘Imagine Nagaland’ workshop, the Chief Secretary, Mr R.S. Pandey, said,“……The Government is very visible in Nagaland. As an
Box 2.9
Rightsizing the Organisation in PHED
The excessive number of work-charged employees has been a major problem in the engineering departments like Public Health and Engineering Department (PHED). Once hired, it is difficult to fire a work-charged employee. For PHED the problem assumed menacing proportions with the annual wage bill touching Rs 21 crore in 1998–99. Precious resources were pre-empted on a bloated work force of 7504 work-charged employees. Alarmed, the Department issued a code number and a photo-identity-card to weed out ghost employees. By 2002–03, there was marginal reduction in the number of work-charged employees to 6618 and the annual wage bill had declined to Rs. 19.20 crore. But this was not enough. To meet the challenge of downsizing, PHED worked out an innovative severance package. The scheme drew a good response with 3143 work-charged employees opting to avail of the package. This ‘golden handshake’, supported with loan from the Central Government, is expected to save over Rs 9 crore annually for the Government. The PHED is in the process of implementing a similar package for another 736 employees.
Taking a leaf out of PHED’s book, the Works and Housing Department is preparing a similar package to reduce its 13,291 strong work-charged force.
employer, the Government is perhaps the largest. Nagaland has one of the highest proportions of government employees to civilian population ratio in the country. What is critical in such a context is how to utilise such a large human capital base to best serve the needs of society and to make the bureaucracy responsive to the needs of the people and the imperative of development.’
The State Government has taken a number of initiatives to improve efficiency and bring in greater transparency and accountability in its governance systems. Some of the important initiatives during the past few years are given below. Vision Groups have been set up in al l
departments in order to improve the functioning of the departments and provide a vision for the future.
There is a meeting of Secretaries and heads of departments on 20th of every month, bringing together their combined knowledge and experience in a forum for improving governance mechanisms of the Government.
All government departments observe the first Wednesday of the month as ‘Clean and Clear Day’. All officials of the Government, irrespective of rank, are expected to use the day to clear off all pending files so that the rest of the month can be devoted to addressing fresh issues.

Governance 55
The programmes and schemes of various departments are publicised through the media for information of the people.
Citizen’s Charters have been formulated for the Departments of Rural Development, Food & Civil Supplies, Health & Family Welfare, Public Health & Engineering and Nagaland Police. The main objective of the charter is to provide information regarding departmental activities and programmes and the rights of the people to avail the schemes.
Nagaland is one of the first states of the country to set up a Civil Services Board to rationalise transfers and postings of administrative officers. A Police Establishment Board was also constituted for police officers.
Training of Government employees at all levels has been accorded high priority in order to upgrade their skills and build up their capacity.
State-Level Programme Implementation Committee, headed by the Chief Minister, has been constituted to review the implementation of all major development projects in the State.
V. Governance and Development
Governance encompasses the influence of the State and civil society institutions on the political, social and economic domains to provide a mosaic of opportunities aimed at development of individuals, society and nations. In this complex matrix of various players and realms, Nagaland has seen important roles being played by the Government and traditional institutions to take the State on the path of development. The necessity of building efficient institutions to deliver the fruits of development has seen various innovations and strategies to converge traditional strengths with modern development paradigms and requirements.
In comparison with the rest of the country, Nagaland started the planned process of development at a later stage. In spite of this, the State has made rapid strides in planned socio-economic development since attainment of statehood in 1963. The progress made in the fields of development of physical infrastructure and improvements in development indicators, such as literacy levels, life expectancy, and combating mortality rates are creditable.
The basic strategy and approach of the State till the Ninth Five Year Plan had been to provide the basic infrastructure needs of the people such as roads, water supply, power, schools, hospitals, etc. An analysis of each of the sectors, its pace and direction of growth, etc., are discussed in various chapters of this Report. While the development of infrastructure has laid the foundation for setting a faster pace of development, the mismatch with the requirements and the available financial resources, the need for increase in productivity and improvement in efficiencies have necessitated a change in direction. The Tenth Five Year plan aims
The necessity of building efficient institutions to deliver the fruits of development has seen various innovations and strategies to converge traditional strengths with modern development paradigms.

Nagaland State Human Development Report56
to consolidate the gains made in the earlier years by focusing on increasing the productivity of the economy, with an aim to double the per capita income of the State during the Tenth Plan period. There has been a major change in strategy—the State Government has taken over the mantle of being the facilitator, rather than provider of all services and resources. Emphasis on involvement of people, private sector and non-governmental agencies for delivering on the development priorities requires a higher level of leadership and vision from the ‘captains’ of the State. As Nagaland looks forward to breaking free from the shackles of prolonged insurgency and remoteness to reap the dividends of peace and make the State into a fore-runner amongst the states in the Indian Union, inspiration can be taken from the South-East Asian countries, which have achieved rapid and equitable growth during the last two decades by following these principles.2
Maintaining a high rate of growth by achieving high levels of savings and investments, and encouraging private investments.
Box 2.10
Imagine Nagaland: Shaping Development Priorities through Youth’s Aspirations
UNICEF-supported ‘Imagine Nagaland’ was initiated in January 2001. It was based on the premise that hope can be cultivated through constructive dialogue, community engagement and the forging of meaningful intergenerational connections.
A series of ‘Appreciative Enquiry’ workshops, following the Discovery, Dream/Design and Destiny phases, spread over a span of one year, were organised. The participants consisted of children and youth from schools and colleges, Government servants, NGO
members, legislators, media persons, teachers, doctors, human rights activists, etc., from all over the State. The initiative was aimed at consolidating earlier efforts in overcoming the general ‘fatigue mentality’, giving expression to common aspirations and building a united vision for all stakeholder groups in the State.
The Discovery exercises led to identification of six themes which ‘give life to Nagaland’—Unity, Peace and Respect for all; Education and Employment; Ecology and Development; Equitable Development; Respect for Rule of law; and Nagaland of our future.
The Dream/Design exercises created the district wise Trees of Achievement—a broad-based prioritisation of development programmes that the participants felt were essential for each of the districts, with the children’s dreams forming the basic foundation. Participants from all districts prioritised quality education and health care among the ten ‘fruits’ in the trees of achievements for their districts. Participants from Mon, Tuensang, and Phek also sought more focus on development of better communication and tourism. Other pointers of expectations of youth from the agencies of governance were creation of employment opportunities and urban infrastructure, and provision of safe drinking water and sports and recreation facilities in their districts.
The pulling together of these ‘trees’ into a ‘Garden of Achievement’ has remained a guiding principle for the State Government in its subsequent development and good governance initiatives and prioritisation of development programmes.
2 ‘Halving World Poverty by 2015: Economic Growth, Equity and Security’, DFID, 2000

Governance 57
Ensuring efficient use of resources with private participation and use of technology.
Egalitarian societies: This allowed for a large proportion of the population to participate in the development process.
Participation of the rural sector in the growth and development process, with continued focus on agriculture sector and development of agriculture markets.
Dividends of growth to be invested in education, health and research. Investment in health enhances economic opportunities of the workers. Health investments reduced the burden of disease and research, especially agriculture research facilitated rural growth.
Finally, politicians generally avoided the temptation to meddle in the micro-economic management of the economy.
VI. The Way Ahead
As can be seen from this chapter, the Government has played an over-arching role in governance. This situation was brought about largely by historical factors and events as they took place. The predominant investment in the Nagaland context has been by the Government. The influence of the Government on the development process has been all-embracing and stands close to cent percent. With the ushering in of peace, the Government is making innovative attempts to tap into the rich social capital of the community by returning, as much as possible, the decision-making process to the villages and to make the civil society participate in governance of the State. Thus, with the introduction of Village Councils, the Village Development Boards, and Communitisation of essential services in the areas of health, education, power, rural tourism, rural water supply, etc., the Government is gradually reserving for itself the role of facilitator and enabler. With this, the ‘trickling down’ concept of development has been effectively abandoned. People and the community are no longer seen as passive recipients of development but rather as initiators of change. The initial response from the people has been positive. It is hoped that there would be a ‘bubbling up’ of development, from the grassroots, that is equitable and suitable to the unique context of Nagaland.
Some important goals to be aspired for include: Remove the distance and barriers between the people and the
governance systems, through wider participation of people and the community in the democratic institutions of governance, to enable the feeling of ownership.
Promote transparency, foster institutions of the civil society and professional bodies as means to improve governance.
Focus on equitable development of infrastructure and basic amenities to ensure that while the urban areas act as growth engines, the potential for sustainable exploitation of abundant available resources in the rural areas is not neglected.
The ‘trickling down’ concept of development has been effectively abandoned and it is hoped that there would be a ‘bubbling up’ of development, from the grassroots, that is equitable and suitable to the unique context of Nagaland.

Nagaland State Human Development Report58
Explore possibilities for private partnerships in delivery of services. Encourage E–governance. Tap modern technology to improve the
governance mechanisms and for faster economic growth. Examine ways of expanding the resource base and continue monitoring
public expenditure. Extend the Communitisation initiative to other sectors and services.
The aim should be to bring the community participation levels from the grassroots up to the highest decision-making levels to realise the potentials for an ideal democratic society.
Facilitate interventions by community and NGO bodies in the development process.
Streamline recruitment procedure and improve work culture of the Government.
Chapter 3
Towards a Prosperous Society

Nagaland State Human Development Report60
I ECONOMIC PERFORMANCE 61 Early Days 61
State Domestic Product 62
Employment and Changing Vocation 63
Poverty and Inequality Measures 64
Structure of Trade 65
Priorities in Public Spending 66
Status of Infrastructure Development 67
II NATURAL RESOURCES TO BUILD ON 69 Mineral Resources 69
Rich Forest Cover 70
Biodiversity 71
Potential for Bamboo 71
III SECTORS FOR GROWTH AND EMPLOYMENT: AGRICULTURE & ALLIED 73 Agriculture in Nagaland 73
Rural Infrastructure and Market Linkages 75
Organic Farming – New Market Space 75
Horticulture 78
Livestock and the Phek Experience 78
Allied Activities 80
IV SECTORS FOR GROWTH AND EMPLOYMENT: INDUSTRY 80 Industrial Growth – Trends 80
Small-Scale Industries 81
Entrepreneurial Development 82
Micro-Credit Initiatives 82
Constraints to Industrial Development 82
Eco-tourism 84
IT Enabled Services 85
Biotechnology 85
Knowledge-Based Economy: Where Do We Stand? 86
V THE WAY AHEAD 86 Economic Performance 87
Natural Resources to Build On 87
Agriculture and Allied Sectors 88
Industry 88

Towards a Prosperous Society 61
A s the State looks forward to its vision of a developed Nagaland, it faces the formidable challenge of ensuring a
poverty-free and prosperous society. This requires accelerated economic growth and narrowing of disparities—no mean task in the intensely competitive world of today. Mere production of goods and services is no longer enough. The products have to be of high quality; the costs have to be competitive; and there must be a strong market network. Ability to produce high quality goods at competitive prices requires favourable conditions such as peace and stability, availability of natural resources, physical infrastructure (water, road transport, power, telecommunications), education and health systems, land, appropriate technology and skilled manpower (at all levels), and financial resources. This chapter is begins with the basics by taking stock of the present status of Nagaland’s economy, its potentials and then, towards the end, makes some recommendations.
I. Economic Performance: Some Indicators
Early Days
Before the advent of the British the people of Nagaland lived in numerous independent villages and their governance unit was the ‘village state’. What they cultivated and collected from their rich forest reserves influenced the lifestyle of the different Naga tribes. Self-sufficient local economies existed. Salt was a scarce commodity until the advent of the British, when it was imported from the western part of the country. The exchange of goods was through the barter of products such as chilli, ginger, Naga shawls, and forest produce.
It was in the last quarter of the 19th century that changes in the social and cultural practices of the Nagas began. The advent of Christianity, followed by the entry of the British administration, marked the introduction of currency into the Naga economy. Zeliang and Angami traders went to Calcutta and East Bengal to trade indigenous products

Nagaland State Human Development Report62
like honey, wax and ivory and bring back raw materials like yarn and beads. They also bought cowrie shells and semi-precious stones from far off places like Cambay, Ceylon and the Andamans. Some of the principal imports of Nagas included salt, iron and iron implements.
Such commercial activities were made possible by British administration and the rule of law. Before British arrival, according to Sentila Yanger, an entrepreneur, ‘the head hunting practice hindered outsiders from trading in the hills and prevented the development of a culture of entrepreneurship’. The banning of the head hunting practice by the British, and the ushering of modern education changed the socio-cultural milieu of the Naga society.
The first significant exposure, and movement, of the Nagas to the outside world was during the First World War. About 5000 Nagas went to France to work as commissioned labour and returned with money, which they invested in housing, construction and infrastructure development. This marked the beginning of monetary circulation in the Naga society.
World War II was the second major exposure to the outside world for the Nagas. The end of the war marked the beginning of the participation of Naga people in different sectors, including trade and business. The post-war reconstruction work provided new avenues of employment to the people of Nagaland. Increasing mobility of outside people, mostly soldiers, in and out of Naga areas, increased their familiarity with Naga items. New opportunities for trade were available. Later, the creation of the Naga Hills-Tuensang Area as a separate unit in December 1957, and statehood in 1963, further boosted opportunities for income and livelihood.
State Domestic Product
Nagaland’s net state domestic product (NSDP at 1993–94 prices) was Rs 223,042 lakh (2000–01). The per-capita income was Rs 11,473 (2000–01). The sectoral comparison of the NSDP shows that the contributions of the primary, secondary and tertiary sectors to the State’s economy have remained relatively unchanged during the last two decades. In 2000–2001, the share of the primary sector was 31.01 percent while that of the secondary sector was 15.18 percent and tertiary sector contributed 53.81 percent to the NSDP. During 2001–02, the contributions of the primary, secondary and tertiary sectors in the net national domestic product were 28.29 percent, 21.14 percent, and 50.57 percent respectively. Across the three sectors, agriculture (27.48%), construction (15.43%), transport and communication (18.14%) and public administration (12.73%) comprise three-fourths of the State’s NSDP. The near absence of contribution from manufacturing (0.74%) and banking and insurance (1.32%) reflects the lack of industrial activity in Nagaland and the weak supporting environment.
Agriculture (27.48%), construction (15.43%), transport and communication (18.14%) and public administration (12.73%) comprise three-fourths of the State’s NSDP.

Towards a Prosperous Society 63
Employment and Changing Vocation
Naga society was and continues to be predominantly agrarian. In the early days all communities were dependent on agriculture and the customs and traditions revolved around the agricultural cycle. With the introduction of formal education, additional areas of vocation opened up. The expansion of employment opportunities was influenced by two major players, the Government and indirectly, by the Church through education. Since statehood and up to the 1990s most employment opportunities were government-defined. In recent times, the Government has restricted the creation of new posts. Private entrepreneurship is being encouraged, especially in the secondary and tertiary sectors, although most people continue to be engaged in the primary sector.
Source : Statistical Abstract India 2002, CSO; Directorate of Economics & Statistics, Nagaland
Figure 3.1(a)
Economic Performance: A Comparative Picture
Agriculture, Forestry and Fishing 27%Mining & Quarrying 2%Manufacturing 13%Electricity, Gas, etc. 1%Construction 6%Trade Hotels & Restaurants 16%Transport, Storage & Communication 7%Financing, Insurance, Real Estate, etc. 13%Community, Social & Personal Service 15%
India’s Net Domestic Product by Economic Activity (2001–02)
Nagaland’s NSDP by Economic Activity(2000–01)
Agriculture 27%Forestry Logging 3%Fishing 1%Manufacturing 0.3%Electricity, Gas etc. 1%Construction 15%Trade Hotel, etc. 5%Transport, Storage & Communication 18%Real Estate & Business 9%Public Administration 13%Other Services 8%
Figure 3.1(b)
12000
10000
8000
91299410
96469880
10287
9118
8726
11473
1993–94 1994–95 1995–96 1996–97 1997–98 1998–99 1999–00 2000–01
Figure 3 .1(c)
Years
Per
cap
ita
inco
me
(Rs)
NSDP Per Capita at Constant (1992–93) Prices (in Rs.)

Nagaland State Human Development Report64
The majority of the workforce of the State is either in the rural areas or in the unorganised urban sector (Figure 3.2). As per NSSO estimates, the growth of employment in the State from 1993–94 to 1999–2000 was at the rate of 8.6 percent per annum. Despite this commendable rate of growth in employment, the incidence of unemployment increased from 2.4 percent of the labour force to 3.5 percent of the labour force during the same period. The Census figures for 2001 show that even though there was an increase in the total number of workers, the percentage of marginal workers to the total population increased from 0.39% in 1991 to 7.12% in 2001. This is indicative of a rising trend towards under-employment in the State.
As on March 2000, the live register of the State employment exchange showed there were about 35,000 job seekers, of which about 27,000 were males. These included 3000 graduates and postgraduates, 5000 undergraduates, 13,000 matriculates and 14,000 under-matriculates. These statistics do not represent the extent of unemployment, as a large number of unemployed do not get themselves registered; all those who are registered may not actually be unemployed; and the applicants generally belong to the urban areas. The above figures reflect the aspirations of the youth of the State to be employed in the government sector. It also brings out the fact that the majority of the registered unemployed in the State are not even graduates, indicating the quality of the workforce available.
In order to effectively tackle the situation, the State Government has developed an employment strategy to generate gainful employment opportunities in the organised and unorganised sectors keeping in mind the nature of workforce available. The State Government, in collaboration with the Central Government, is in the process of preparing an action plan for facilitating employment and self-employment opportunities for the unemployed youth in the State.
Poverty and Inequality Measures
Nagaland presents a unique situation in terms of poverty levels. The traditional practices and norms have helped create a largely egalitarian society. The community shares the responsibility of taking care of the basic needs of the disadvantaged, for instance the landless are provided opportunity to cultivate the community-owned land. This ensures that there are no destitutes, shelterless and famished in the society. This has also meant that the usual measures of poverty are not readily applicable to the State.
However, this does not mean that there is widespread prosperity. As per the NSSO (55th Round), 1999–00, 32.67 percent of the State’s population lives below the poverty line. Some alternative indicators,
Regular Wages/self employed 64%Casual Labour 3%Self Employed 12%Others 21%
Source : Employment and Unemployment Situation in India, 1999–2000, NSS 55th Round, NSSO
Figure 3.2 (a)
Employment Patterns
Self Employed in Agriculture 56.9% Self Employed in Non agri. Activities 4.8%Agricutural Labour Households 1%Other Labour Households 2%Others 35.3%
Rural Areas
Figure 3.2 (b) Urban Areas
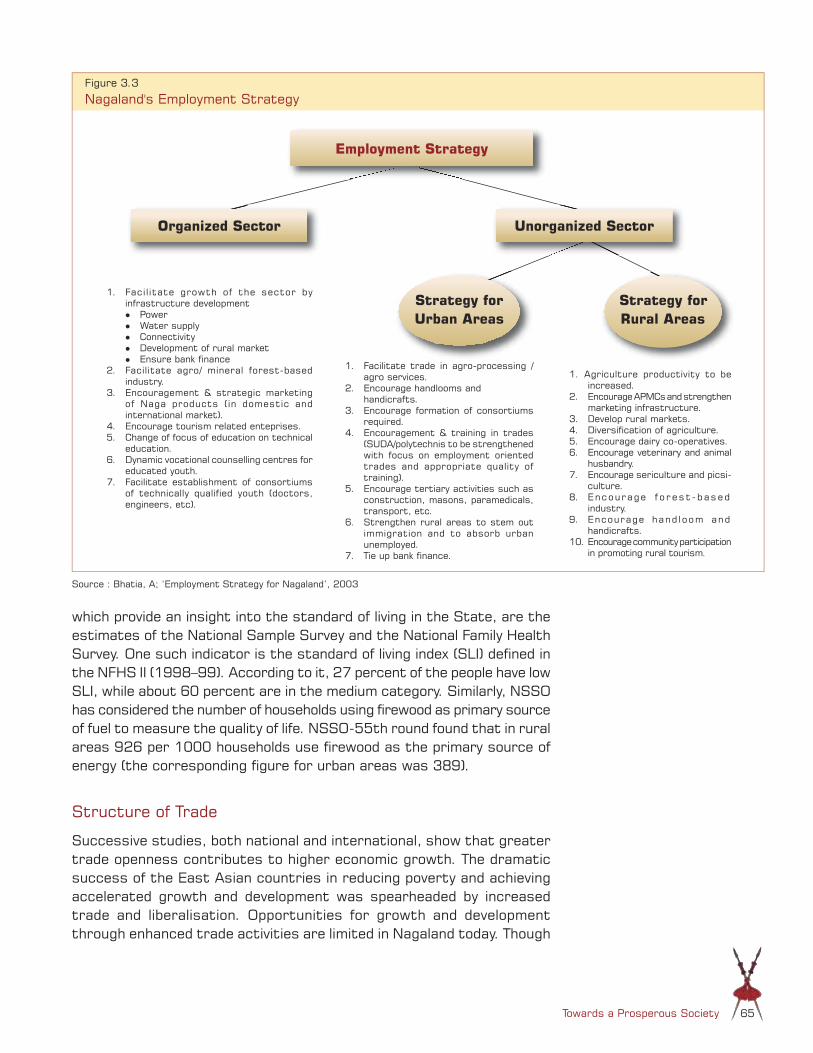
Towards a Prosperous Society 65
which provide an insight into the standard of living in the State, are the estimates of the National Sample Survey and the National Family Health Survey. One such indicator is the standard of living index (SLI) defined in the NFHS II (1998–99). According to it, 27 percent of the people have low SLI, while about 60 percent are in the medium category. Similarly, NSSO has considered the number of households using firewood as primary source of fuel to measure the quality of life. NSSO-55th round found that in rural areas 926 per 1000 households use firewood as the primary source of energy (the corresponding figure for urban areas was 389).
Structure of Trade
Successive studies, both national and international, show that greater trade openness contributes to higher economic growth. The dramatic success of the East Asian countries in reducing poverty and achieving accelerated growth and development was spearheaded by increased trade and liberalisation. Opportunities for growth and development through enhanced trade activities are limited in Nagaland today. Though
Figure 3.3
Nagaland's Employment Strategy
Employment Strategy
Organized Sector Unorganized Sector
Strategy for Rural Areas
Strategy for Urban Areas
1. Facil itate growth of the sector by infrastructure development Power Water supply Connectivity Development of rural market Ensure bank finance
2. Facilitate agro/ mineral forest-based industry.
3. Encouragement & strategic marketing of Naga products (in domestic and international market).
4. Encourage tourism related enteprises. 5. Change of focus of education on technical
education.6. Dynamic vocational counselling centres for
educated youth.7. Facilitate establishment of consortiums
of technically qualified youth (doctors, engineers, etc).
1. Agriculture productivity to be increased.
2. Encourage APMCs and strengthen marketing infrastructure.
3. Develop rural markets.4. Diversification of agriculture. 5. Encourage dairy co-operatives.6. Encourage veterinary and animal
husbandry.7. Encourage sericulture and picsi-
culture.8. Encourage f o r es t - b ased
industry.9. Encourage hand loom and
handicrafts.10. Encourage community participation
in promoting rural tourism.
1. Facilitate trade in agro-processing / agro services.
2. Encourage handlooms and handicrafts.
3. Encourage formation of consortiums required.
4. Encouragement & training in trades (SUDA/polytechnis to be strengthened with focus on employment oriented trades and appropriate quality of training).
5. Encourage tertiary activities such as construction, masons, paramedicals, transport, etc.
6. Strengthen rural areas to stem out immigration and to absorb urban unemployed.
7. Tie up bank finance.
Source : Bhatia, A; ‘Employment Strategy for Nagaland’, 2003
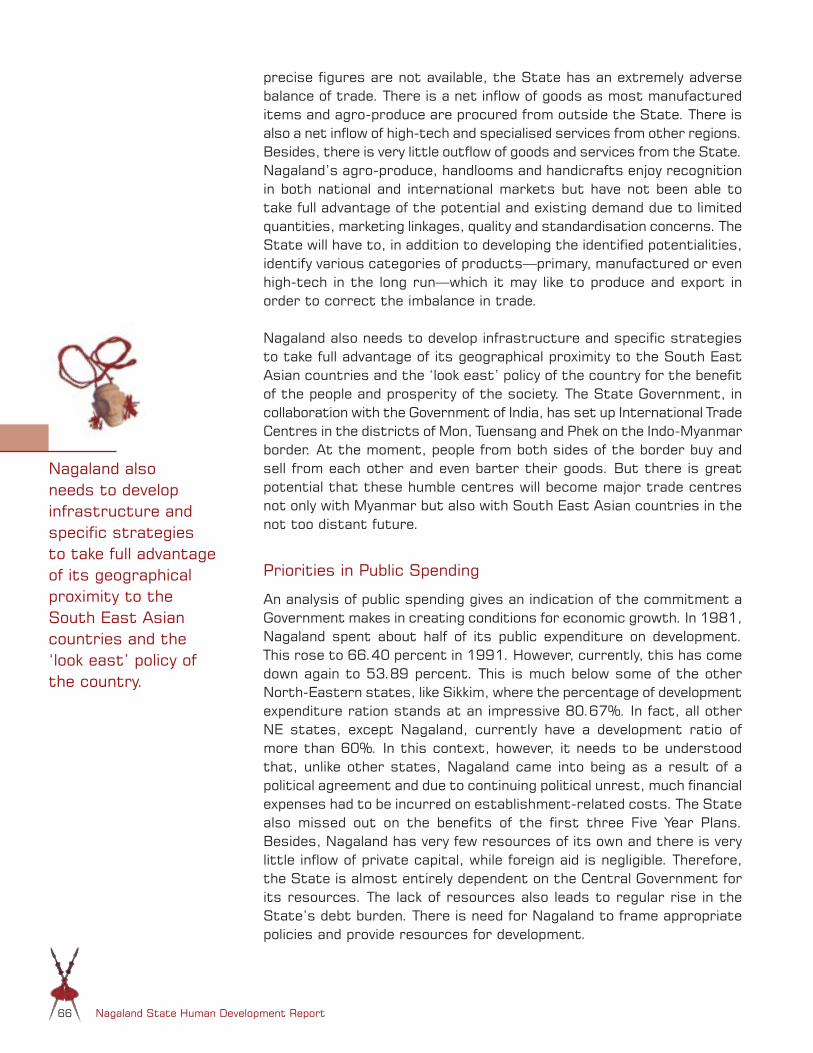
Nagaland State Human Development Report66
precise figures are not available, the State has an extremely adverse balance of trade. There is a net inflow of goods as most manufactured items and agro-produce are procured from outside the State. There is also a net inflow of high-tech and specialised services from other regions. Besides, there is very little outflow of goods and services from the State. Nagaland’s agro-produce, handlooms and handicrafts enjoy recognition in both national and international markets but have not been able to take full advantage of the potential and existing demand due to limited quantities, marketing linkages, quality and standardisation concerns. The State will have to, in addition to developing the identified potentialities, identify various categories of products—primary, manufactured or even high-tech in the long run—which it may like to produce and export in order to correct the imbalance in trade.
Nagaland also needs to develop infrastructure and specific strategies to take full advantage of its geographical proximity to the South East Asian countries and the ‘look east’ policy of the country for the benefit of the people and prosperity of the society. The State Government, in collaboration with the Government of India, has set up International Trade Centres in the districts of Mon, Tuensang and Phek on the Indo-Myanmar border. At the moment, people from both sides of the border buy and sell from each other and even barter their goods. But there is great potential that these humble centres will become major trade centres not only with Myanmar but also with South East Asian countries in the not too distant future.
Priorities in Public Spending
An analysis of public spending gives an indication of the commitment a Government makes in creating conditions for economic growth. In 1981, Nagaland spent about half of its public expenditure on development. This rose to 66.40 percent in 1991. However, currently, this has come down again to 53.89 percent. This is much below some of the other North-Eastern states, like Sikkim, where the percentage of development expenditure ration stands at an impressive 80.67%. In fact, all other NE states, except Nagaland, currently have a development ratio of more than 60%. In this context, however, it needs to be understood that, unlike other states, Nagaland came into being as a result of a political agreement and due to continuing political unrest, much financial expenses had to be incurred on establishment-related costs. The State also missed out on the benefits of the first three Five Year Plans. Besides, Nagaland has very few resources of its own and there is very little inflow of private capital, while foreign aid is negligible. Therefore, the State is almost entirely dependent on the Central Government for its resources. The lack of resources also leads to regular rise in the State’s debt burden. There is need for Nagaland to frame appropriate policies and provide resources for development.
Nagaland also needs to develop infrastructure and specific strategies to take full advantage of its geographical proximity to the South East Asian countries and the ‘look east’ policy of the country.

Towards a Prosperous Society 67
Status of Infrastructure Development
Nagaland lags behind most other states of India in terms of infrastructure. As per a survey by the Planning Commission, the State stands seventh from below in terms of its social and economic infrastructure. Most of the low ranking states in the survey are from the North-East.
Connectivity
Road connectivity can contribute to trade and economic initiatives. One of the significant achievements of Nagaland has been the consistent expansion of roads. This improved connectivity not only facilitates better communication within the State but also enables human mobility and accelerated development. While India’s road connectivity increased from 21.7 km/million population in 1981 to 25.8 km/million population in 1997, the connectivity in Nagaland, in the same period, went up from 75.4 to 122.4 km/million population. Lack of financial resources has been a constraint in the maintenance of the road network, resulting in deterioration of the quality of this essential communication infrastructure.
Energy Consumption
Electricity is the other major infrastructure component needed for industrial development and for improved quality of life. Nagaland draws its power requirements from the North Eastern Grid. Its share in the existing generation capacity of NEEPCO, on which it is dependent, is not sufficient for its power requirements. High transmission and distribution loss (58%), transformer failures and low voltage impact significantly on
Composition of Public Spending Table 3.1
States
1980–1981 1990–91 1998–99
Public Expenditure
Ratio
DevelopmentExpenditure
Ratio
Public Expenditure
Ratio
DevelopmentExpenditure
Ratio
Public Expenditure
Ratio
Development Expenditure
Ratio
Arunachal Pradesh - - 78.30 75.72 65.09 72.98
Manipur 72.90 53.29 55.17 73.58 42.84 63.37
Meghalaya 50.85 63.59 45.58 74.7 33.63 69.10
Mizoram - - 147.26 55.80 - 71.16
Nagaland 138.19 50.93 84.30 66.40 - 53.89
Sikkim 82.73 85.43 78.30 80.67 208.40 28.13
Tripura 49.98 65.50 59.43 72.81 44.52 62.50
All India - 70.42 - 69.57 - 61.76
Source: National Human Development Report, 2001

Nagaland State Human Development Report68
the quality of power supply in the State. The quantum of power generated up to 1999–2000 is 37 MKWH as against the power consumption of 1636 MKWH. The potential for power generation from mini and micro hydro projects, natural gas-based power generation and wind energy needs further exploitation. With increased industrialisation and expansion of the service sector, the absolute use of electricity could become an indicator of the pace of development in the State.
Financial Services
Easy availability of credit is an essential component for industrial and trade-related activities to flourish. Nagaland had 70 bank branches in 1989, which increased to 71 after a decade. The growth in deposit value increased substantially from Rs 21,4265 lakh to Rs 264,114 lakh in the same period. Similarly, the amount of credit provided increased from Rs 8252 lakh to Rs 45,902 lakh during the period under review. The 71 bank branches of the State have a skewed distribution—45 percent serve Kohima and Dimapur districts alone. The credit deposit ratio for Nagaland is only 17 percent as against the national average of 58 percent. The North-East has a credit deposit ratio of 23 percent. On a low deposit base, this indicates a near absence of credit facilities for local business and enterprises. From the bankers’ perspective credit recovery is an area of concern. In overcoming the bankers’ concern, one of the first initiatives taken by the Government has been the enacting of a legislation to relax the transfer of land in the industrial zone at Dimapur. The possibility of involving village councils to help in credit recovery is being explored.
Telecommunication and IT Services
Nagaland had 219 post offices and 2223 telephone connections during 1980–81. This increased to 323 post offices and 25,193 telephone connections during 1999–2000. Telephone exchanges have been established in 46 towns and three villages in the State. The three towns of Kohima, Dimapur, and Mokokchung have more than 50 percent of these facilities. The telephone density is very low and the quality of services is still poor, especially in the other towns and in the rural areas. The rural coverage in districts other than Kohima and Dimapur is minimal or non-existent.
Though Internet usage is growing, at present it is largely confined to the district headquarters and mainly in Kohima and Dimapur. Roughly there are about 40 Internet cafes in the State. In an important project, the Government of India, in collaboration with the State Government, has set up community information centres (CICs) in all 52 blocks of the State. These centres provide Internet connectivity through V-Sat at the block level.
The North-East has a credit deposit ratio of 23 percent. On a low deposit base, this indicates a near absence of credit facilities for local business and enterprises.

Towards a Prosperous Society 69
II. Natural Resources to Build on
Mineral Resources
Nagaland is richly endowed with mineral resources. An estimate of the mineral reserves provided by the Nagaland State Mineral Development Corporation is given below:
Limestone 1000 million tonnes
Marble & Decorative Stone Substantial reserves
Petroleum & Natural Gas 600 million tonnes
Nickel, Cobalt, Chromium Substantial reserves
Basalt, Chert, Dunite, Gabbro, Granodiorite, Serpentine, Spilite, Pyroxenite, Quartzite
Substantial reserves
The entire belt along the Assam-Nagaland border is rich in oil and natural gas deposits, while the Nimi Limestone Belt in Tuensang and Phek districts has substantial deposits of high-grade limestone. The location of the hydrocarbons allows for its easier exploitation in view of the availability of connectivity in the foothills. The Oil & Natural Gas Commission (ONGC) has carried out exploration for petroleum production, with commercial production from Champang area of Wokha district. The ownership of the resources is an issue that has to be resolved by the Government of India and Nagaland keeping in mind the special provisions under Article 371(A) of the Constitution before optimum commercial exploitation of these hydrocarbon resources can be made. A balance has to be drawn between the rights of the individual, the State and the economies of production. The metallic and non-metallic economic minerals are located in the remote and backward eastern parts bordering Myanmar.
The State Government has set up a 50 TPD cement plant at Wazeho in Phek district. The setting up of the plant has brought in tremendous improvement in the living conditions of the people in this remote area by way of road infrastructure, power, and increased economic activities. The plant is at present shut down for planned modernisation and upgradation. The future plans to set up large cement plants for the exploitation of the resources with an eye on exports to the South East Asian region requires the building of connectivity and communications infrastructure on the Indian and Myanmar side. The eastern parts of Nagaland are comparatively underdeveloped. Therefore, exploitation of the rich mineral resources appears to be the ray of hope for the people of these remote and lesser developed areas for improving their lives—towards better income and livelihoods.
Another area of exploitation is being encouraged through the setting up of the decorative and dimensional stones units—the marble, sandstone
Dimensional stones

Nagaland State Human Development Report70
and other stone products from the units have a ready market in the State’s flourishing construction sector. It is expected that mineral-based industries will generate productive employment for considerable number of people and also catalyse economic activities in ancillary, secondary and tertiary sectors in the State.
Rich Forest Cover
Out of Nagaland’s total area of 16,57,583 hectare, forests occupy an area of approximately 8,62,930 ha (52 percent of total area). The share of tree cover is even higher at 80.49 percent of the total area. In view of the unique land ownership system in the State, 88.3 percent of the forests are community or privately owned. Sixty-three percent of this community forest is virgin, while the remaining 37 percent is degraded. There has been a decrease in the dense forest cover over the last two decades. However, the trend has been reversed over the last few years. The State of Forest Reports 1997 and 1999, published by the Ministry of Environment & Forests, indicate that in Nagaland the forest cover
Box 3.1
Our Forest Wealth
Though Nagaland is a small state it is endowed with a wide variety of forest types on account of its unique geographical location and wide range of physiographic terrain.
Northern tropical wet evergreen forest – It is found only in Mon district. The dominant species in this type of forests are Hollock, Maksik and Nahor.
Northern tropical semi-ever green forest – It is found in the foothills bordering Mokokchung, Wokha and Kohima districts. These forests have deciduous species like Bhelu, Paroli and Jutuli.
Northern subtropical broad-leafed wet hill forest – It is found in hilly areas below 1800 metres and above 500 metres in all the districts of Nagaland. The important timber species are Koroi, Pomo, Sopos, Gamari, Gogra, Hollock, Khokan, Sam, Am, Badam and Betula.
Northern subtropical pine forest – These are found in hills with elevations of 1000 to 1500 metres. The species are Pine, Quercus, Schima, Prunus, Betula and Rhododendron.
Northern montane wet temperate forest – These are found in elevations above 2000 metres. The species are Gurcus, Michelia, Magnolia, Prunus, Schima, Alnus, and Betula.
Temperate forest – These are found in areas above 2500 metres. The species grown are Rhododendron, patches of Jhuniperus coxie and Birch.
Agro-forestry and social forestry are two important strategies which can help in striking a balance between providing livelihoods, sustainable exploitation of the forests and forest conservation.
decreased by 70 sq. km. in 1997 and by 57 sq. km. in 1999 but there was an increase in the dense forest cover by 1650 sq. km. and a decrease in the open forest cover by 1707 sq. km. during the same period.
Nagaland had a thriving timber-based industry. The ban imposed by the Supreme Court on export of timber from the North-East in view of the overexploitation of the forests seriously affected the industry and impacted the employment opportunities. Ever since the ban, a policy of sustainable use of the plantations created in the community and private lands has been evolved and the activities in this sector are getting revived.
Forests p lay an important ro le in environmental stability and provide a variety of livelihoods to the Naga people. The measures taken by the State Government for promoting tree plantations have started giving dividends. The area of concern continues to be the Jhum practices and the decreasing Jhum cycles due to the pressures of increasing population. Agro-forestry and social forestry are two important strategies which can help in striking a balance between

Towards a Prosperous Society 71
providing livelihoods, sustainable exploitation of the forests and forest conservation.
Biodiversity
India is one of the world’s richest countries in terms of its biological diversity. The Western Ghats and North-East India are among the 25 international biodiversity hotspots. It has been estimated that over 81,000 species of fauna and 47,000 species of flora are found here. Nearly 15,000 flowering species are endemic to India. Nagaland, though a small state in terms of area, has a rich and varied heritage of biodiversity. It varies from tropical rain forest to alpine vegetation, and from evergreen forest to sub-tropical climatic vegetation.
Nagaland already boasts of the tallest rhododendron and the tallest rice plant in the Guinness Book of World Records. Naga King Chilli is a contender for being the hottest in the world. There are numerous rare and endangered species of plant and animal life in Nagaland’s forests. The Blythe’s Tragopan Pheasant, the State bird, and the Mithun, the State mascot, are themselves rare species in the world. The State has a great wealth of herbal medicinal and aromatic plants. However, limited documentation has been done so far. Biotechnology and environmental research facilities need to be created on an urgent basis because Nagaland’s biodiversity, although very rich, is also fragile and endangered due to increasing population and the pressure to bring more areas under cultivation. The potential of Nagaland’s biodiversity contributing to the State’s economy is immense.
Potential for Bamboo
The Naga people have survived through the centuries with the diverse and varied uses of bamboo and its products. From the cutting of the umbilical cord to the mats that wrap the dead for burial, bamboo has been integral to the life of the Nagas. It continues to play a predominant role in every walk of life, ranging from agricultural tools and implements to shelter, food and livelihood.1
Bamboo, the fastest growing and highest yielding renewable natural resource, growing extensively all over the State, constitutes one of the most important resources of Nagaland, which has to be put to use in the present day context for the benefit, growth and development of the people. It occurs as a predominant plant in portions of the districts of Dimapur, Peren, Mon and Mokokchung and readily found mixed with other forest species in all other districts of the State. The growing stock of bamboo is estimated to be around 8.96 million hectares in the country, out of which about 5 percent of the growing stock is assessed
1 Vision Statement, Nagaland Bamboo Policy
Mithun, the State mascot.
Cane and bamboo products.

Nagaland State Human Development Report72
to be available in Nagaland, which works out to be about 0.448 million ha or 4,48,000 Ha. With over 22 species, the annual yield of bamboo in Nagaland is over 835,000 metric tonnes.
At present, bamboo is used mainly for handicrafts, paper-making and other traditional uses. The potential of bamboo for various end uses are limitless with value-added applications; as food, as medicinal products, as wood substitute, as building and construction material like ply-board, flooring, furniture, and so on. A planned, scientific and holistic approach to the cultivation and management of bamboo on sustained basis can be an inexhaustible source of goods and services and can play a significant role in the rejuvenation of rural economy and the overall economic development of the State. Bamboo can also become an export earner for the State. The Government of Nagaland, recognising the immense economic potentials of bamboo, has framed the Nagaland Bamboo Policy. A Nagaland Bamboo Mission is being set up to achieve the aims and objectives outlined in the Nagaland Bamboo Policy. The following are the broad areas identified for promoting various bamboo-based industries:
i. Finished industrial bamboo products in the form of bamboo ply, bamboo timber, flooring tiles, shuttering, curtains, etc.
ii. Bamboo mat boards and bamboo ply boards can be promoted as wood substitute for the growing construction needs within and outside the State. This will not only result in a value addition to bamboo products but will also be a wood substitute reducing the use of timber.
iii. Intermediary bamboo industrial and semi-finished products for production of chopsticks, toothpicks, skewers, incense sticks, etc.
iv. Bamboo craft, handicraft and art.v. Bamboo charcoal and bamboo charcoal industrial
products in the form of active bamboo charcoal filter products.
vi. Bamboo food products in the form of: (a) Raw bamboo shoot food products.(b) Finished bamboo shoot food products.
vii. Bamboo medicine and chemical products/alcoholic beverages.
Box 3.2
Bamboo—the Wonder Plant
The bamboo plant’s usefulness and beauty, especially its economic value as a cheap, strong, fast growing and renewable material with untapped industrial potential, has brought bamboo to the forefront among resources. The plant has the following versatile features: The fastest growing plant on this
planet
A viable replacement of wood
Versatile with a short growth cycle
A cr it ica l e lement of the rura l economy—source of self-employment opportunities
A multiple use material that ensures wider distribution of income
An essential structural material in low-cost housing and earthquake-resistant architecture
A natural shelter and windbreak for farm lands
An ancient medicine and edible item – for pickles, vegetables, and as health food
Part of the rural cultural milieu and the traditional arts
An ideal material for bamboo ply and bamboo board for wall panelling, flooring and packaging corrugated bamboo sheets and furniture
An ideal raw material for paper pulp
An enduring natural resource for sustainable development
Towards a Prosperous Society 73
viii. Bamboo-related ancillary activities such as tourism
With the policy reforms in regard to management, harvesting, utilisation of natural bamboo resources in the State and promoting bamboo plantation development, it is expected that bamboo trade shall receive a fillip. With increased bamboo harvesting and establishment of bamboo industries and with support incentive framework, the trade in bamboo and bamboo products within and outside the State will grow.
III. Sectors for Growth and Employment: Agriculture & Allied
Agriculture in Nagaland
Agriculture is one of the significant contributors to the net state domestic product and is the largest employer of the workforce in the State. It was the mainstay of the people of Nagaland during 1950s, when almost 96.5 percent of the population was dependent on agriculture. Though the dependency for employment on agriculture since declined to 70 percent in the 1970s and further to 65 percent by 2000, it continues to be the main source of livelihood. Shifting and terrace cultivations remain the dominant forms of land use practice in the State.
The traditional form of shifting cultivation i.e. Jhum, is the method of cultivation that is widely practised across Nagaland. This form of cultivation has been devised over generations through the innate experience and knowledge gained by the local tribes over the land, labour, environment resources available and the cropping requirements. Sometimes the ill effects of Jhum have been exaggerated due to lack of in-depth understanding of this traditional practice. However, local efforts are being made to document indigenous practices of inter-cropping, study the dimension of organic farming and understand the experiences of local farmers in seed collection, raising of saplings, etc. The environmental sustainability and economic viability due to increased pressures of population and modern lifestyles have been major concerns.
Terrace rice cultivation has been practised for decades now in pockets of Kohima and Phek districts. Government promoted terracing as an alterative to Jhum by providing monetary and material incentives. But it was found that once the incentives were withdrawn, the farmers returned to Jhum cultivation. The drawbacks in terrace cultivation are infiltration of the land due to very porous soil and quick deterioration of the physical and chemical properties of the soil due to continued cropping. It also requires high capital input and is more labour-intensive. These factors have ensured that this form of cultivation is practised in limited areas only.
Jhum – 90%TRC/WRC – 8%Horticulture/Cash Crops – 2%
Figure 3.4
Area Under Various Types of Agriculture (2000–01)

Nagaland State Human Development Report74
The possible adverse implications of Jhum on the ecology prompted the Government of Nagaland in the 1960s to promote wet rice cultivation and other practices suitable to the hilly terrains of the State. This was done primarily as an effort to wean away the people from Jhum to a more permanent way of cultivation. Baghty, in Wokha district, was the first instance where the Government provided subsidy for reclamation and adoption of wet rice cultivation, besides supplying fertilisers, seeds, and pesticides at 50 percent subsidised prices. Wet rice cultivation is mostly done in the plain areas of Dimapur, Wokha, Mokokchung, and Mon districts although parts of Kohima also practise the system.
Though Nagaland has heavy rainfall, it lacks water storage facilities. This infrastructural limitation means greater challenges in bringing more areas under irrigation. The net area irrigated to the total cropped area was only 30% during 1990–91, which increased to about 43% during 2000–2001. This shows that over 50% of the agriculture in the State is being carried out under rain-fed condition. This also means higher risk and unpredictability due to the vagaries of nature. The terrain of the State also acts as a constraint. As a result, the area sown more than once formed only 10.8 percent of the net sown area during 1990–91, which marginally increased to 11.6 percent during 2000–2001. During the last decade the cropping intensity remained constant at about 110 percent.
Use of technological interventions in terms of improved seeds, fertilisers, and better implements has been limited. The mechanisation of agricultural operations is poor because of the nature of terrain in the State and the low purchasing power of the farmers. The use of improved seeds for various crops during 2002–03 involved only 100 ha each in wheat, paddy and kolar and 200 ha in soyabean and rice bean. The share of potato was 372 ha. The consumption of fertilisers and pesticides was not uniform and almost negligible until recently. Nagaland is trying to turn this into an advantage by accessing markets for ‘organic foods’. The State department of agriculture has established a research station at Mokokchung with three other sub-stations in the State to adapt technological innovations for local use. Innovations in low-cost plastic culture and production of potato through TPS have proved quite successful.
The farmers generally prefer to cultivate local varieties of rice, particularly the ‘Nagaland Special’. However, the yield of this variety is low. Except for the plain areas and the parts of Kohima, Wokha and Phek districts where terrace cultivation is practised, agriculture has failed to produce beyond subsistence levels. Agriculture still revolves around the practice of meeting the requirements of the community, with the individual at its centre.
The unique Naga situation of land ownership by the community, if harnessed and influenced in the areas of modified techniques, crop
Though Nagaland has heavy rainfall, it lacks water storage facilities. This infrastructural limitation means greater challenges in bringing more areas under irrigation.

Towards a Prosperous Society 75
selection and area brought under cultivation, can become an area of comparative advantage. Contract farming in horticulture/agro-produce, through private sector initiatives, and agro-processing industries can facilitate development.
Local traditions have ensured the very limited use of fertilisers and pesticides. The level of fertiliser consumption in Nagaland was only 6 kg per ha of net sown area in 1990–91, which decreased to 4 kg during 2000–2001. This practice of harmony with nature and non-interference of the environment through artificial inputs gives Nagaland the experience and advantage to explore organic farming. In the backdrop of globalisation, the market space for organically grown agricultural produce is increasing. This opens up a new area of income and livelihood for the people of Nagaland.
Rural Infrastructure and Market Linkages
Lack of marketing linkages has been one of the key disincentives to Naga farmers in producing surplus. In order to meet these needs, the Department of Agriculture is in the process of creating agricultural marketing infrastructure through private sector and cooperatives. This should incorporate grading, storage and transport. Linkages are also being explored with markets outside the State. The department has taken up identification of viable commercial crops, identified through crop zoning maps. The initiatives at marketing of local varieties of ginger outside the State, through NEPED programme, have been quite successful and have resulted in increasing realisation to the farmers. Agricultural Produce Market Committees (APMCs) are being set up to market the surplus produce and enter into contract farming kind of practices. Identification of Trade Centres will further strengthen the marketing infrastructure for commercial crops. The improvement of other rural infrastructure, especially roads, better communications will greatly help in strengthening the agriculture marketing network in the State.
Organic Farming – New Market Space
The farmers of the Nagaland have followed the practice of raising crops under organic conditions since time immemorial. In the context of the globalisation of agriculture, organic products have higher market value. Nagaland is in a unique position to take advantage of this. The critical elements in exploring this market will include estimation of the collective potential of production capacity for organic produce, creation of a collection and supply chain and the establishment of storage and processing units for agricultural produce. Certification processes will have to be identified. The State can earn significant income both in the country and through export to other countries.
Figure 3.5
Potential Crop Zones
Paddy
Maize
Oil Seeds
Kholar
Cardamom
Tea
Passion Fruit
Ginger
Soyabean
Potato
Vegetable

Nagaland State Human Development Report76
Box 3.3
Jhum
Shifting cultivation
Shifting cultivation (Jhum) covers over 73% of the total arable land of Nagaland, with average Jhum area cultivated by households varying from 0.52 to 5 ha. This is mostly concentrated in the districts of Mokokchung, Tuensang, Wokha, Zunheboto and Mon.
Shifting cultivation is a system that has been practised over time and revolves around an agro-ecosystem of cultivation based on traditional knowledge and indigenous practices. Jhum, or shifting cultivation, is characterised by shifting of the primary site of cultivation in cycles, the choice of crops influenced by local needs, experience and availability of planting materials locally.
Burning of Jhum field
This is considered to be one of the most important operations for the success of shifting cultivation. Proper burning of field requires a good deal of skill, knowledge, and expertise and is believed to keep the area weed-free for a long period. It is also believed that burning adds more nutrients to the soil, enhances fertility, and reduces the time required for de-weeding.
Special care is taken to ensure that the fire does not spread into adjoining forests. This is done by clearing an area of about 5 metres between the cleared Jhum and the forest, normally a week before the burning operation. After burning, the poorly/partially burnt plants, logs and vegetations are collected and put in piles at one place and then burnt again. This secondary burning site makes a good nursery bed. This practice, particularly the burning of forests, is critically viewed because of its possible impact on the land and environment.
Sowing
Prior to the commencement of sowing, the village priest would be invited to initiate the formal sowing on any day after the tenth day following the new moon. There is a distinct socio-cultural link here. Dibbling and broadcast methods of sowing are generally practised by farmers in Jhum.
Inter-cultural operation
Naga farmers consider inter-culture as one of the most essential operations for the success of Jhum cultivation, in which weeding is an important aspect. The use of common salt as a weedicide is popular in shifting cultivation.
The harvest
In the Jhum system of agriculture, harvesting is usually a continuous process and lasts almost the whole year. Many crops, especially vegetables, sown before and during the sowing of the main crop, mature early and are harvested continuously. The main crop is usually harvested sometime in September-October.
Fallowing
Once the primary crop is harvested in October, the field is rested for a very short period. And then it is cleared again for the second year crop. Normally farmers crop for two years after which the land is left fallow for 7–9 years. The fallow period used to be 15–20 years but because of pressure of land and population the average Jhum cycle in recent years has

Towards a Prosperous Society 77
reduced to 8 and even 5 years in some areas.
Cropping pattern
The crops sown by the shifting cultivators of Nagaland are based on tradition. Mixed cropping is the main cropping system. In mixed cropping system crops are sown in irregular fashion or random planting. There are no definite crop mixtures. Every cultivator follows his own system of crop combination according to his family requirements. Naga Jhum farmers normally grow as many crops as possible, as decided by the community.
Soil conservation practices
There is a misconception that traditional Jhum cultivators do not practise any soil conservation measures. The farmers of Nagaland, in spite of the difficult terrain,
Crops Years Area in hectare
Production in tonnes
Productivity kg/ ha
1. Jhum Paddy
1995–96
1996–97
1997–98
1998–99
1999–00
2000–01
78,000
77,700
82,450
82,200
84,800
86,200
89,000
80,000
94,740
102,600
110,850
115.200
1140
1030
1150
1250
1350
1335
2. TRC Paddy
1995–96
1996–97
1997–98
1998–99
1999–00
2000–01
62,000
62,300
62,750
63,050
63,700
64,200
93,000
93,000
92,510
107,350
109,850
115,360
1500
1490
1475
1700
1725
1795
Source: Supong Keitzar, Agriculture and Human Development 1999
have adapted well to the conditions. They have developed a number of mechanical and vegetative barriers to sustain cultivation in these conditions. For instance, Angami and Chakhesang tribes construct boulder and stone barriers. They also plant nitrogen-fixing alder trees in the fields to check soil erosion.
Economic yield pattern under Jhum
Though specific data is not available on the economic yield under shifting cultivation production is used as a proxy for looking at it from the viewpoint of benefits generated.
Districts Average Jhum cycle(years)
Kohima
Mokokchung
Wokha
Mon
Dimapur
Phek
Zunheboto
Tuensang
9.35
10.20
7.87
8.41
4.73
9.71
8.13
8.79
Average for Nagaland 8.40
Source: Village Profile 2001, Department of Agriculture, Nagaland
District-wise Average Jhum Cycle
Table 3.2
Area and Production of Principal Crops in Nagaland Table 3.3

Nagaland State Human Development Report78
Horticulture
Nagaland has a highly congenial agro-climatic condition for cultivation of a wide range of fruits, vegetables, plantation crops and flowers. Currently, the area under horticulture forms only 5% of the total cropped area. Among the commercial vegetables, nearly 90% of the area is occupied by potato, tapioca and sweet potato. Ginger, chillies and turmeric are the major spices grown in the State. Meanwhile, it has been estimated that the State imports 60% to 70% of the vegetable requirements. Systematic harnessing of this environment for growing high value crops will open up new dimensions for improving the income and livelihood of the farmers.
Turmeric and large cardamom are being cultivated in certain pockets of the State on a small scale, except in Mokokchung district, where it has been taken up as a commercial enterprise. The warmer parts of Nagaland have ample scope to increase the area under other commercial spices like cinnamon, bay leaf and black pepper. The farmers also grow different types of herbal plants used in adding flavour to food.
Pineapple, orange, papaya, guava, passion fruit and banana are popularly cultivated and limited local marketing and processing facilities exist. Among plantation crops, tea, coffee and rubber are prominent and cashew has recently been introduced. The major constraints in the development of fruit crops are the inadequate availability of planting materials, high initial investment and poor knowledge in production technology. The State has better potential to grow ginger, turmeric, chillies, black pepper, large cardamom and cinnamon. And the climatic conditions are very favourable for growing quality flowers. Medicinal and aromatic plants too have great potential.
Livestock and the Phek Experience
Livestock provides additional income and employment to the farmers. Nagaland has a large population of pigs, cattle, goat, and Mithun. Traditional mixed farming practices, dietary behaviour and social habits have influenced this animal stock reserve.
The Department of Animal Husbandry has estimated that Nagaland requires Rs 605 crore worth of meat and eggs annually for local consumption. Currently the production is worth only Rs 230 crore. Import of meat and meat products not only increases the cost of food but also results in outflow of resources.
In January 2000, the Village Development Boards of Phek took a collective decision not to import any meat or meat products into the district to meet their consumption needs. Meat protein requirement per head per day was calculated at around 150 gm. This meant that the meat requirement of the district was 5475 tonnes. To meet the demand of the district, each household needed to produce around 100 kg of pork
Pineapple, orange, papaya, guava, passion fruit and banana are popularly cultivated and limited local marketing and processing facilities exist.

Towards a Prosperous Society 79
Box 3.4
NEPED Experience
The NEPED project was initiated in February 1995. Its objectives were to increase agro-based industries, preserve the natural habitat, increase forest cover, introduce competitive methods of agriculture and enhance food security. The project initially involved over 6000 farmers in 1794 test plots across 854 villages, covering about 5500 ha of land. This was the first major project with a coverage as high as 70 percent of the 1286 inhabited villages of Nagaland. Seven million trees were planted in the first phase of this project.
The first phase (1995–2001) was called Nagaland Environment Protection and Economic Development (NEPED) project. The second phase, which commenced on 1st April 2001, is called Nagaland Empowerment of People through economic development, thus bringing out the new thrust areas while retaining the acronym which has attained visibility and credibility throughout the State.
The concept and experience of this project is innovative. It responds to the critical need for income generation through a multi-dimensional agro-forestry initiative.
NEPED-pioneered activities include: Introduction of new crops like cardamom, ginger, black pepper, betel vine, and passion fruit.
An estimated 1362 ha has been brought under cash crop plantation during 2001. Setting up of revolving fund; 25 percent of this fund (Rs 2.25 crore) is exclusively earmarked
for women to take up their own schemes and programmes. Complementing the resources of the Village Development Boards by way of capacity
building, training and exposure trips. Investments in monitoring, research and setting up processing equipment and production
infrastructures over the five-year period. The annual receipt of funds from donors increased from Rs 56 lakh to Rs 3.92 crore
(2002–2003). During April–November 2001, Rs 190.75 lakh was transferred to 105 villages’ bank account with an average of Rs 23.75 lakh in each district. This distribution pattern has resulted in better sharing of resources.
Micro business plans are formulated with each loaner to ensure that loaned amount is commensurate with his/her requirement.
For the first time, women are being allowed access to land, either by purchase or long-term lease. Modalities vary from tribe to tribe, but with a very definitive tilt in benefit sharing in favour of the women who are organising themselves in small formal groups to undertake development activities.
Farmers are organising themselves into formal groups for creating marketable surplus and accessing markets.
Selected farmers in all districts are actively involved in attempting to induce a third year of Jhum cropping (intensification) by introducing leguminous cover crops that would increase the Jhum cycle by 1/3rd number of years. In Settsü village of Mokokchung district, all 45 households have resolved to undertake this experiment.
Based on the premise that as the project evolves, so will the needs of the participants, NEPED has expended sufficient resources in capacity building of all partners. Moreover, due to the international significance attained by NEPED through its networking, several external donor agencies in the development world have also provided financial aid in order to learn more about the project, its innovations and experiences. Through this, an ‘open window to Nagaland’ for the outside world has been established. As a result, several researchers, scientists, and development practitioners have visited Nagaland and used the valuable knowledge and experiences gained for strategic planning and development.
The high level commission led by Shri. S.P. Shukla on ‘Transforming the North-East’ has commended the activities of NEPED as a lead programme.
25% of NEPED fund is given to women in all NEPED villages.

Nagaland State Human Development Report80
per year. This ban on meat imports compelled the people to improve their own livestock production to meet their requirement. The Phek model of self-sufficiency has relevance for the entire State because it puts in perspective the unique opportunities for self-employment, improved income and livelihood and better utilisation of resources.
Allied Activities
Sericulture is an agro-based industry, which involves both agriculture and industrial sectors. It fits the Nagaland conditions suitably for generation of large-scale employment, particularly in rural areas. The nature of the industry is low investment and effective utilisation of family members, particularly women and aged people. Keeping in view the advantages and prevailing potentials the sericulture department is laying emphasis on private sector participation by organising private farmers/rears.
Nagaland is endowed with a good rainfall of around 2000 mm, spread over 145 rainy days. The rainfall is also evenly distributed throughout the year. This has enabled the rearing of fish and maintenance of fish ponds in the villages. The State has 1600 km stretch of rivers/streams, which can be harnessed for preservation and conservation/protection of natural breeding grounds. The existing lakes/reservoirs are capable of yielding adequate quantity of fish. It is estimated that about 3000 tonnes of fish are imported from other states. A considerable local market exists and can be tapped through proper harnessing of the inland water bodies in the State.
IV. Sectors for Growth and Employment: Industry
Industrial Growth – Trends
Since attainment of statehood in 1963, the Government has been making strenuous efforts for industrial development. From mid–1970s to early 90s a number of forest- and agriculture-based industries such as paper, plywood and sugar were started. But the long-drawn insurgency not only affected the daily lives of the people but also the spirit of industry. Further, there were limitations of managerial skills, overstaffing and lack of adequate direction. As a result, the potential for industrial growth and its lateral benefits of employment generation and income have remained largely untapped. The current situation has improved, marked by peace and stability. This will help revive the spirit of entrepreneurship and give necessary momentum to industrial growth. Signs of interest, both from the Government as well as from the private sector are visible today.
The number of industries has gone up in the past two decades. As per the State records on employment, by the end of March 2000, there were 1014 establishments in the organised sectors, of which 851 were in the public sector and the remaining 163 (32 large and 131 small units) in the private sector. The total employment provided by them was
Nagaland is endowed with a good rainfall of around 2000 mm, spread over 145 rainy days.

Towards a Prosperous Society 81
Box 3.5
KOMUL
The Kohima District Milk Producers’ Union Limited, popularly known by its brand name, KOMUL, was established during 1985–86 by the State Department of Veterinary and Animal Husbandry, ‘to promote dairying and related sustainable economic activities to facilitate the emergence of a dignified and equitable society in rural Nagaland through value based democratic institutions’. It was to be a farmers’ movement through cooperative dairying.
Today, it has become a success story and a household name. But at the start, no one wanted to take charge of this department’s dairy development programme. When Dr Akho Yhokha, armed with a Ph.D. from Nottingham University, UK, took over as managing director, in a dilapidated office on the outskirts of Dimapur, with no proper road connectivity, people laughed at him as he walked to his work through flooded drains. Official apathy was not far behind. Remarks like ‘Nagaland is no Gujarat’ and ‘…Nothing works in Nagaland, will this work?’ were hurled at him. By 1987, unimpressed with the slow progress of the project, the National Dairy Development Board (NDDB), which had funded the project, also left the scene and the state had little resources.
Dr Yhokha’s response was, 'Give us a chance'. And he and his team, with a meagre daily collection of only 100–200 litres, and a mini plant, refused to give up. They quietly went on establishing more cooperatives. By 1989–90, the daily milk collection reached 1000 litres. The skeptics now began to turn around. The State Government began to take more active interest. And, with the start of the 8th Plan, in 1992, the Central Government gave a one-time grant to set up the Union’s Central Dairy Plant, with an installed daily capacity of 10,000 litres. But the real breakthrough came when KOMUL products like curd and lassi hit the market.
KOMUL today handles about 5000 litres of milk per day. A fleet of milk vans traverses a total of over 500 km twice daily just to collect milk. Its diversified products are sold all over Nagaland and in neighbouring states as well, especially Assam, through a dozen dealers and 150 retailers. KOMUL has over 3300 registered farmer-members and 106 primary level Dairy Cooperative Societies (DCS). Among them are 18 women' societies.
With the creation of Dimapur District, the name has been changed to Dimapur District Cooperative Milk Producers Union Ltd but the brand name, KOMUL, has been retained. In 2002, the Nagaland State Dairy Cooperative Federation Ltd (NSDCF Ltd) was established as parent State level body to replicate the programme of cooperative dairying in all potential districts. The Mokokchung District Cooperative Milk Producers Union has since been established. And both these district unions operate under the NSDFC Ltd, using the brand name KOMUL.
During 1998–2000, Nagaland Dairy Industry was declared one of the top 10 fastest growing dairies in India. On 26th January, 2003, Dr Akho Yhokha was honoured with the Governor’s Medal.
Source: Katalyst, ‘The Road Less Travelled’ and interviewsContributed by Charles Chasie
76,938. Out of this, the share of the public sector was 72,834 and the remaining 4,104 came from the private sector. The employment of women in the above period was 11,375 in the public sector and 1,213 in the private sector. When disaggregated by districts, Kohima/Dimapur had 313 organised sector establishments. This was followed by Mokokchung district, with 196 establishments and Zunheboto with 120.
Small-scale Industries
In 1981–82, Nagaland had only 305 small-scale industries. This increased to 1360 in 2000–2001. The distribution of the small-scale units is, however, very uneven. Among the various districts of the State, Dimapur has the largest number of small-scale industries, followed by Mokokchung. While good connectivity of Dimapur has contributed to the district’s growth, the reasons for very thin distribution in other districts include

Nagaland State Human Development Report82
lack of communication infrastructure, high overhead costs, lack of trained personnel, inadequacy of raw materials and limited support services.
Entrepreneurial Development
The development of entrepreneurship depends on economic, social, political, and psychological factors. Among the economic factors, capital is crucial. In Nagaland, however, capital formation and supply are very limited. On the other hand, the unique situation of land ownership restricts availability of bank credit while private sources of funding become unrealistic due to very high interest rates. Labour is the other principal economic cost which affects entrepreneurship. Though absolute labour is available, dearth of skilled labour is a great limitation.
In an effort to build capacity of the people, the Small Industries Service Unit (SISI) and the North Eastern Consultants Limited (NECON) have been conducting entrepreneurship development programmes in the State. So far, they have conducted five entrepreneurship development programmes involving over 200 potential entrepreneurs. A review of past programmes shows that the major areas of self-employment include weaving, tailoring, printing press, bakery, carpentry, steel fabrication, automobile repairing and communication services.
One of the major constraints identified by the participating entrepreneurs was the lack of institutional arrangements for financial resource mobilisation. The annual credit plan of the State Bank of India in Nagaland achieved Rs 1658 lakh against Rs 1668 lakh earmarked for industrial development in 2002. The performance in agriculture and service sectors were, however, poor. Nagaland’s entrepreneurship development programme (1990–1996) has shown a mere 14% success rate as against the regional average of 25 percent. One of the reasons is that most of the trainees were first generation entrepreneurs.
Micro-credit Initiatives
A major development constraint in Nagaland, as indicated earlier, has been lack of credit linkages. This is further aggravated by the small size of land holdings, which pose serious challenges in accessing financial resources and scaling up productivity. Various Government departments, including rural development, social welfare, and agriculture, have initiated micro-credit programmes, especially for women, and established self-help groups (SHGs). The initiative has been very well received and success stories have been documented.
Constraints to Industrial Development
Nagaland’s hilly terrain is a big constraint on the availability of land as well as building infrastructure. In addition, the legal land ownership
The unique situation of land ownership restricts availability of bank credit while private sources of funding become unrealistic due to very high interest rates.
Maize handicraft products

Towards a Prosperous Society 83
pattern does not allow the use of land as collateral to access funds because people from outside the State cannot own land in Nagaland. These have become real constraints in the march towards human and economic development. An exception to this general rule has recently been made in the case of Dimapur. If successful, the viability of applying the provisions to other areas can be explored.
The tribal roots of the society have cultivated the attitude of taking life on a day-to-day basis. While this has given tremendous strength to the people in their ability to be cheerful and not be burdened by undue worries about the future, it has also contributed to a disinterest in savings. Availability of credit is already low in the State. This is compounded by a history of low recovery rates in various Government schemes.
While the proportion of trained human resources is going up in the State, the unavailability of technically qualified labour force is an area of concern. In the areas of unskilled and semi-skilled labour, immigrant populations have increasingly replaced local people, in meeting market demands. This trend/pattern also speaks of the changing work culture within Naga society and the high immigration rate that Nagaland has witnessed in recent years.
Box 3.6
Entrepreneurs’ Associates
Neichute Duolo is a young man, first-generation literate, from the Chakhesang–Naga tribe of Phek District. Not too long ago, he was lecturer in Baptist College, Kohima. But he could not forget the young unemployed men and women he knew. He gave up his prestigious job and, with 16 of his friends, as core members, founded an NGO called Entrepreneurs Associates (EA). With support of 650 people in the community, who were enrolled as members, the EA launched a micro-credit system in the year 2000 with the express purpose of helping unemployed youth to establish their own businesses. In three years, the EA has helped 48 first generation entrepreneurs to set up their own business establishments— beauty parlours and hair-cutting saloons, tea stalls, grocery shops, carpentry and readymade garment shops—in Kohima, Phek and Dimapur districts. They, in turn, gave employment to 120 unemployed people.
The EA evolved a simple but practical mechanism. Members of the public are invited to invest a minimum sum of Rs 1000/- to the EA corpus for at least one year at interest rate of 8 percent per annum. The EA then used this money to advance loans, to those who wished to set up their businesses, at 16 percent annual interest rates. Meticulous interviews and study of the business potential in the area are conducted by EA. Selected candidates are given training in running their business. Other forms of support continue. EA Core Members contribute one day’s wage every month while other members contribute annual membership fee for EA office and other expenses. No government or external funding is involved.
Jane, (not real name) aged 19, dropped out of school due to family poverty. She wanted to start a readymade garment shop and approached the EA. After interviewing her, EA was prepared to advance a loan of Rs 20,000/- to help her launch her business. However, she was apprehensive and took only Rs 10,000/-. Today, she runs a thriving business in Pfutsero town, Phek district, with a monthly income of about Rs 7000/- and a stock of over Rs 40,000/-. She has fully repaid her loan. She now supports her elder brother’s studies and she is also able to send money home to her village.
NB: Loans from banks and public institutions in Nagaland are difficult to get due to provisions to safeguard the Naga identity, which does not permit landed property to be transferred to other than the tribals. Private loans are unregulated and charged per mensem from 5% to 20%. Reasonable yearly interest rates by EA make possible for poor unemployed people to take loans. Involvement of the public/community ensures business success and recovery of loans.Contributed by Charles Chasie

Nagaland State Human Development Report84
Box 3.7
Tuophema Experience
Tuophema is an Angami Naga village situated North of Kohima. Established in 1431 AD the village was originally named after the Erithrina tree. The presence of the tree in the village was linked to the belief that its presence will help the village triumph over its enemies in war. From the main village, today, two villages have come into being.
The Village Development Board of Tuophema has found a very innovative way of conserving its culture and enriching its village economically. They have created a space for visitors and tourists in the centre of their own living space. Well-planned tourist accommodations, with meeting facilities, have been created by the VDB. Currently, there are 12 cottages, built by the various clans. There is also a well-equipped Seminar Hall, a museum, a working shed for artisans, a craft workshop and a Community Centre. Besides providing the unique experience of staying at a Naga village, the visitors also get the opportunity to interact and see first-hand, the functioning of the Village Development Boards. These have meant not only additional attractions for tourists but also increased employment and income for the villagers. A further attraction is that the present Chief Minister of Nagaland hails from Tuophema.
The Tourism Department and the tour operators provide the needed link between tourists and the hosts. Around 1000 tourists have been visiting and staying at Tuophema every year since 2001. A significant percentage of the tourist flow is from abroad.
The Tuophema experience reflects people’s initiative and active participation in promoting human development in the changing socio-political environment.
Eco-tourism
The focus on tourism in Nagaland is recent. It is based on areas of strength that the department of tourism and representatives of the people jointly identified as part of a State initiative to promote eco-tourism. Some of the advantages Nagaland enjoys include comparatively unexplored destinations, scenic beauty, strong existence of local community networks, abundant natural resources, unique eco-system and cultural diversity.
One of the key features of Nagaland today is the involvement of the traditional village councils and village development boards in the promotion of tourism. This community-based involvement has led to more ownership and innovativeness. In the midst of many constraints the general perception about the potential of tourism is positive. The improving law and order condition is also contributing to this new avenue for better income and livelihood.
The Government has declared tourism as a core industry under the State Industrial Policy, and in 2000, adopted the Nagaland Tourism Policy. This policy has come as a response to growing tourist interest in Nagaland and the desire of Naga communities to explore innovative livelihood opportunities. Heritage conservation is becoming an important influencing factor of the Naga dialogue on eco-tourism. On 1st December 2003, the State Government inaugurated the Naga Heritage Complex at Kisama village, Kohima, on the occasion of the opening ceremony of the fourth Hornbill Festival. The Complex, where an amphitheatre, a Naga garden, World War II museum and an auditorium are also envisaged, is a fine example of collaborative efforts of
Box 3.8
Celebrating the Naga Heritage
The Hornbill festival of Nagaland organised by the State Government is an annual tourism promotional event to showcase Nagaland’s traditional and cultural heritage in all its ethnicity, diversity and grandeur. It is organised every year from 1st December, the
Statehood Day, for a period of for five days. It is the coming together of all the elements that make up the total Nagaland. The Hornbill festival is a collaborative celebration by all the citizens of Nagaland. The festival is a tribute to the great ‘Hornbill’, revered by the Nagas for its qualities of alertness and grandeur. The majestic bird is closely identified with the social and cultural life of Nagas as reflected in various tribal folklore, dances and songs. The awe and admiration for the bird is symbolically displayed through traditional head-gears of the different tribes, worn during the festivals, and is indicative of the commonness of the Nagas. The hornbill festival of Nagaland is a cultural extravaganza, serving two purpose – it gives the exotic and rich experience of what is ‘Naga’ to the visitor while also helping to revive, protect and preserve the uniqueness of Naga culture and heritage.
Towards a Prosperous Society 85
the Government departments, administrative units, tribal groups and voluntary organisations resulting in success of government initiatives. The creation of the Naga Heritage Village, the annual Hornbill Festival, the Tourist Village at Tuophema, and adoption of Khonoma as the first Green Village in the country, with sponsorship from the Ministry of Tourism, Government of India, are ways in which the State Government is tapping into this potential. These, combined with the natural advantages and beauty of Nagaland, including cultural diversity of the tribes, present opportunities for successful eco- and community-based tourism.
Prior to 1998–99 it was estimated that not more than 200 foreign tourists and 15,000–20,000 domestic tourists visited Nagaland annually. However, since 2000, after relaxation of the restricted area permit (RAP), there has been a steady increase in the arrival of international tourists to nearly 1500, in 2002. The number of domestic tourists remained constant primarily because many of them are and continue to be those engaged in trade and business. The revenue generated in Nagaland through tourism in the last four years was estimated at Rs 10 to 12 lakh per year.
Information Technology Enabled Services
Information technology, especially IT-enabled services (ITES) industry, is growing rapidly across the globe. As per a NASSCOM survey it is expected to generate $21 to $24 billion dollars in exports and employ 68,000 people in the country. ITES consists of several components like call centre (customer care), human resource outsourcing (payroll processing, technical helpdesks, etc.), business process management in airlines, insurance, medical transcription, GIS and engineering design service, multimedia, graphics and animation, etc.
Nagaland enjoys certain advantages because of the use of English as the medium of instruction. However, much investment is required in some basic infrastructure like power, availability of bandwidth, and related areas of development for the growth of IT industry in the State. The efforts in this direction are still in their infancy. The Government recently signed an MoU with a private investor for setting up a call centre in the State. Ten district computer centres have also been established through public-private partnership, a proven experience in manpower training and providing employment.
Biotechnology
Biotechnology has the potential to revolutionalise human societies. The major areas of impact are agriculture, health (medicine) and industrial products. Nagaland has a great natural advantage in this sector because of its wealth of biodiversity. But strategic interventions are
The revenue generated in Nagaland through tourism in the last four years was estimated at Rs 10 to 12 lakh per year.
Nagaland State Human Development Report86
required to benefit from it. These are projected in the following three broad areas: Agriculture, plant and animal biotech Document plants, animals and microbes, set up gene banks and biome
maps, set up bio-monitoring system, tissue culture for medicinal and aromatic plants, protect bio-reserves.
Health and Industry Encourage development of new vaccines, encourage stem cell
research, contract R&D services, drug development (including bio-informatics).
Policy and infrastructure Evolve a biotech policy, set up task forces for guidance on policy
issues, establish bio–parks, facilitate basic research.
Knowledge-based Economy: Where do we Stand?
A knowledge-based economy would require, among other things, the following: international quality telecommunication facilities; institutions for higher education, especially technical education; an open and democratic society, open to innovation; IPR protection and a financial sector that can fund high-risk projects. Nagaland has to invest a lot in each of these aspects. The quality and spread of the telecom infrastructure needs to be increased tremendously. Naga society has traditionally been a democratic society. However, it may need to become more open. The absence of a vibrant financial sector needs to be addressed urgently.
Developed countries have made use of technology to improve the standards of living of their people. It has served them well as a tool for economic growth in two ways—it has enhanced efficiency in the production of goods and services and helped to bring out new and innovative products. In its march towards a developed Nagaland, the State will also need to use technology in a big way.
V. The Way Ahead
Human development and economic growth are interlinked. By focusing on economic growth, Nagaland can expect to reap benefits through increased levels of income, employment generation and reduction in economic disparities within the different regions of the State and the populace. The need to build on the available resources and opportunities has been emphasised throughout this chapter. Harnessing of the resources and potentials—mineral, forest, agriculture, land, industry —and the opportunities in trade, the new sectors of IT or biotechnology require not only investments but also policy interventions to encourage such investments. Government’s role in making the investments cannot be understated but the limited availability of financial resources with the Government necessitates that private investment, both from within

Towards a Prosperous Society 87
and outside the State, are encouraged. The caution to be exercised while embarking on the path of economic development is to ensure that the resources available are used efficiently and in a sustainable and planned manner for equitable economic growth within a reasonable time-frame. Some of the suggestions to take the State on this path are given below.
Economic Performance
Develop strategies to produce goods to take advantage of existing local markets and exploit the demand for indigenous products outside the State in order to reduce the trade gap, resource drain and to benefit from the income and livelihood opportunities thereof.
Innovate to mobilise the large investments required for the infrastructure sector. Prepare a database of the available infrastructure and a comprehensive road map for building the infrastructure and plan public spending with a clear focus to execute this plan.
The limited prospects for expansion of Government activities necessitate the encouragement of private investment for accelerating economic growth in the State and also for creating employment opportunities.
The limited resources available with the State and the dependence on Central Government assistance limit the flexibility of the State to plan its own course of development. The State Government has to generate sufficient resources of its own in the near future.
Natural Resources to Build on
Prioritise development of infrastructural requirements for enabling extraction of mineral wealth and industrial development to exploit the mineral reserves in a planned manner to accelerate economic growth and reduce unemployment. Similarly, oil exploration and extraction can be a major source of revenue for the State Government and for the economic upliftment of the society.
Manage forests in a planned manner not only for timber but also for developing industry and leveraging investments on the basis of more than minimum required forest assets.
The agro-forestry concepts built upon traditional practices through NEPED programme efforts and the encouragement of tree plantations by Government should become a normal feature in order to ensure regeneration of forests, improvement on the Jhum practices and enhancement of farmers’ income.
Maintain eco-balance through eco-restoration measures and environmental protection programmes.
In situ conservation, management, and cultivation of biodiversity by involving people through forest extension and education. Collection, compilation and documentation of the State’s biodiversity and
Harnessing of the resources and potentials —mineral, forest, agriculture, land, industry—and the opportunities in trade, the new sectors of IT or biotechnology require not only investments but also policy interventions to encourage such investments.

Nagaland State Human Development Report88
patenting the unique knowledge and uses of this biodiversity may be a first step towards using it for generating economic wealth.
Harness the wide range of uses, great versatility and potential of bamboo as alternative to timber in a planned, scientific manner to give fillip to the rural agricultural economy, raise the village level incomes and boost the economy of the State.
Agriculture and Allied Sectors
Develop a comprehensive agriculture policy for the State. Focus on diversification of agriculture and allied activities from
subsistence to commercial and market-oriented with emphasis on generation of surplus and improvement of farmers’ incomes.
Increase productivity and profitability through use of appropriate technology, replicating success stories created through NEPED and other programmes such as agro-climatic zoning.
Strengthen micro-credit and marketing infrastructures through the medium of APMCs and introduce concepts of contract farming and other marketing support mechanisms.
Continue with capacity building programmes, extension service and raising of high quality planting materials.
Identify areas and crops, markets and potential and set up accreditation, certification and regulatory mechanisms to cultivate and market organic produce.
Replicate the success of Phek experience for capturing the existing local markets for livestock and fishery products through local produce in the rest of the State to enhance income and generate livelihoods.
Industry Promote agro-, forest- and mineral-based industries in accordance
with the available natural resources. Create success stories to learn from and replicate. Encourage private sector partnership in big industrial projects.
Plan on a growth centre approach providing strengthened infrastructure of roads, power and communication to attract investments for industry.
Provide the necessary support to handicrafts and handloom to tap existing markets outside the State by assisting through marketing linkages and networking of producers to create production capacities.
Take advantage of IT and biotech potential. Develop tourism that reflects and reinforces the uniqueness of
Nagaland’s rich history and its natural and cultural resources. Tourism development strategies should stress on the importance of environmental regeneration and ensure preservation of the natural heritage. Effective marketing and integration of the State’s tourism resources with the other North-Eastern states will be required. Being part of the region’s ‘tourism circuits’ will help access the wider tourism market.
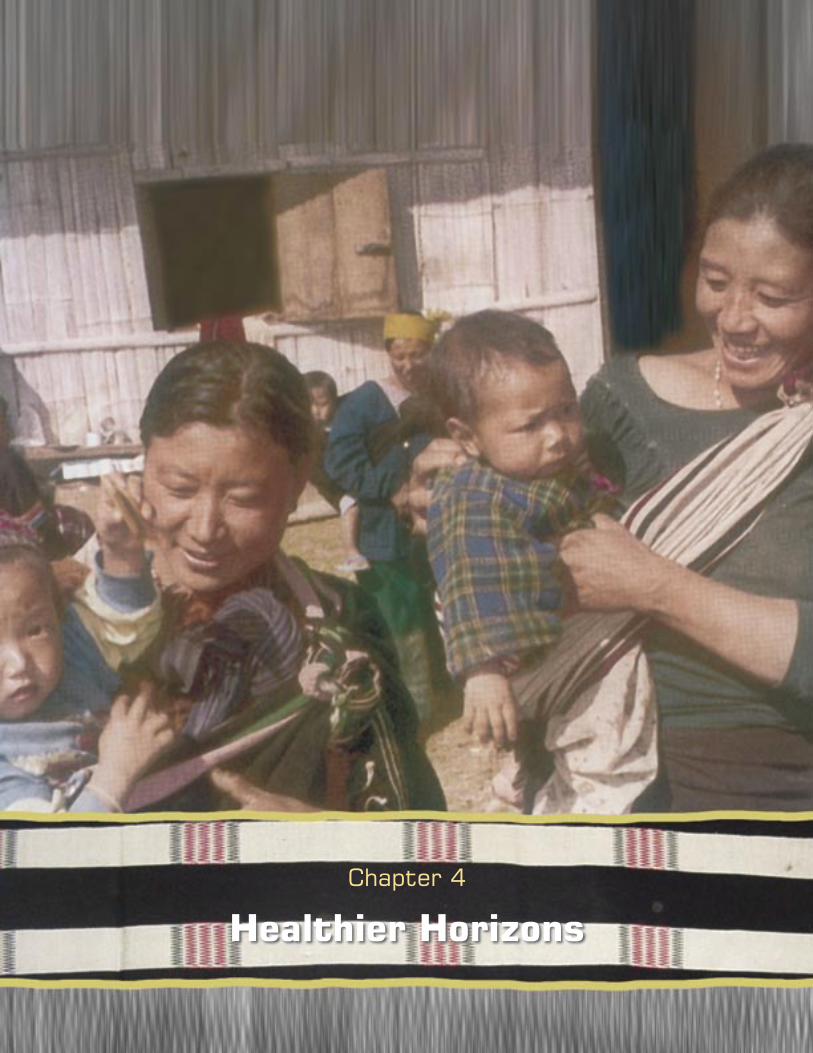
Chapter 4
Healthier Horizons

Nagaland State Human Development Report 90
I DEMOGRAPHIC AND HEALTH STATUS 92 Rapid Rise in Population 92
Fertility Patterns 93
What the Other Indicators (MMR, IMR, Life Expectancy) Tell 95
Immunisation Status 95
II BURDEN OF DISEASE 96 Nutritional Profile 96
Morbidity Patterns 97
Child Morbidity 98
People Living with HIV/AIDS 99
III ACCESS TO HEALTH CARE AND RELATED ISSUES 102 Traditional Institutions 102
Infrastructure 104
Quality of Health Care 105
Health Care Providers 105
Client-Oriented Health Care 106
Role of Private Sector and NGOs 107
IV SOME POLICY ISSUES 108 Communitisation: An Innovative Health Policy Intervention 108
Role of the Community 108
Funding Communitisation of Health Institutions 110
Commitment to Health: Public Sector Expenditure 110
V HEALTH CORRELATES 111 Lifestyle Indicators 111
Water and Sanitation 111
Housing Characteristics 112
School Health Programme 113
VI THE WAY AHEAD 113 Demographic Status 113
Burden of Disease 114
Access to Health Care 114
Some Policy Issues 115
Health Correlates 116
Healthier Horizons 91
As the State strives to achieve its vision of a disease-free society, this chapter looks at the health status of the
people, gauges the achievements made so far and the distance still to travel to reach the desired goals.
The analysis seeks to bring further clarity by comparing Nagaland’s basic health and demographic indicators with the all India average as well as the general range reached by developed countries.
This chapter examines the demographic, mortality and morbidity profiles of the State and the major health challenges it faces. An analysis of the health infrastructure and personnel is presented for assessment of people’s access to proper health care facilities. It also takes stock of the policy interventions and financial provisions that facilitate health promotion. Finally, suggestions have been made to improve the health situation and to carry the State forward in its pursuit of a developed Nagaland.
A look at Nagaland’s demographic, mortality and morbidity profile reveals that the mortality status, including maternal and infant mortality rates, is better than the national average, but the morbidity profile is fast changing and causes concern. The prevalence of infectious diseases is not only high but the increasing incidence of lifestyle-related systemic diseases contributes to creation of double burden of disease. The State has had great success in expanding the health care infrastructure in the four decades since statehood. The quality of health care has, however, been a cause of concern because of inadequate number of trained health care providers. About 500 doctors, including specialists, along with nursing support and paramedical staff, serve a population of 20 lakh. This gap is further accentuated by the concentration of specialists in the towns of Dimapur, Kohima and the other doctors in the district headquarters. Increase in the number of trained health personnel will be crucial in ensuring quality of health care at the nearly 500 health centres functioning at different levels across the State. Nagaland’s current experience—of low levels of assisted deliveries, poor immunisation coverage, substance abuse, alcoholism and HIV/AIDS—needs to be reversed. The correlates of health (including social environment, physical infrastructure in sanitation and water supply, etc.) have to be addressed to create a conducive environment. The Communitisation of health services gives Naga society a unique opportunity, today, to improve its health status through preventive and curative primary health care, better management of the health infrastructure and efficient use of resources.
“For most individuals, the choice to live a healthy life—free from illness and ailments—and a reasonable lifespan are crucial attributes in the notion of personal well being. It is only natural, then, that indicators on health as well as indicators that variously capture demographic concerns of a society are important constituents in the framework for evaluating the development process under the Human Development approach.”
National Human Development Report,
2001.

Nagaland State Human Development Report 92
I. Demographic and Health Status
The health profile of Nagaland impresses when compared with the rest of the country. For instance, against an all India maternal mortality rate (MMR) of 4:1000, the figure for Nagaland is 1:1000 live births. Similarly, while the all India infant mortality rate (IMR) stands at 68 per 1000 live births the corresponding figure for Nagaland is 42.1 per thousand live births. On the other hand, the State represents the highest decadal growth of population in the country (64.4 percent), with a total fertility rate of 3.77, a demographic challenge for anyone. The comparative figures below, especially those with developed countries, provide an interesting and challenging picture. It shows the distance Nagaland has still to travel to reach its goal of providing long and healthy lives to the people.
Rapid Rise in Population
The decadal growth rate between 1991–2001 in Nagaland (64.4 percent) has been identified as the highest in the country. This rate is much higher than in developed countries. The high population growth rate puts tremendous pressure on the State’s resources for providing accessible and quality health care.
Table 4.1 Nagaland’s Health Profile
Health Indicators Nagaland All India Range for developed countries**
Total Population (millions) 1.99# 1027.02# -
Annual Exponential Population Growth Rate (percent) 5.0# 1.9# 0.3–1.3
Population under age 15 (% of total) 39.7* 36.1* 14.7–23.3
Population aged 65 and above (% of total) 4.4* 5.0* 11.7–17.4
Total Fertility Rate (TFR) 3.77* 2.85* 1.4–2.0
Life expectancy at birth (years) 73.4^ 60.7# 76.5–80.5
Infant Mortality Rate (IMR) (per 1000 live births) 42.1* 68.0* 4–7
Under-five Mortality Rate (per 1000) 63.8* 95* 4–8
Maternal Mortality Rate (MMR) (per 1000 live births) <1 4.07# 0.06–0.08
Crude Birth Rate (CBR) 30.4 25.8$ -
Crude Death Rate (CDR) 6.9* 9.7* -
Contraceptive prevalence (percent) 30.3* 48.2* -
Source: *National Family Health Survey (NFHS-II 1998–99); # National Human Development Report 2001; ** Human Development
Report 2002;^ Estimated for this Report (2002) $Statistical Abstract India 2002, CSO, 2001(I) figures
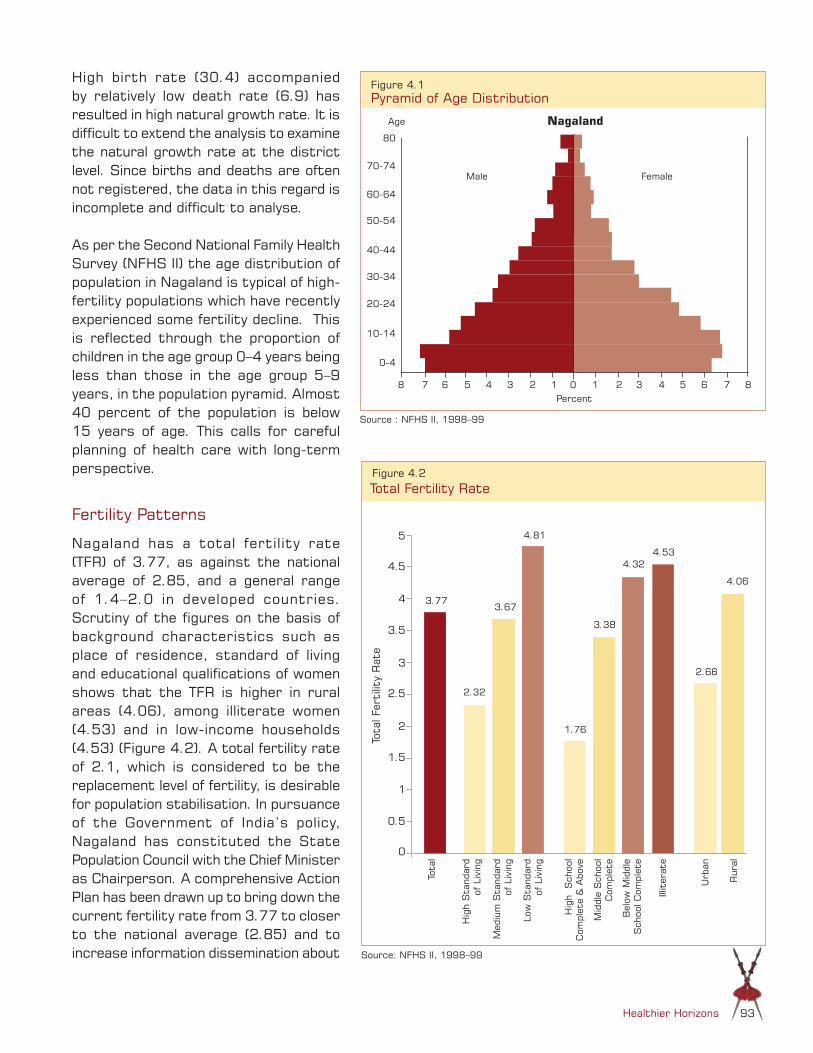
Healthier Horizons 93
High birth rate (30.4) accompanied by relatively low death rate (6.9) has resulted in high natural growth rate. It is difficult to extend the analysis to examine the natural growth rate at the district level. Since births and deaths are often not registered, the data in this regard is incomplete and difficult to analyse.
As per the Second National Family Health Survey (NFHS II) the age distribution of population in Nagaland is typical of high-fertility populations which have recently experienced some fertility decline. This is reflected through the proportion of children in the age group 0–4 years being less than those in the age group 5–9 years, in the population pyramid. Almost 40 percent of the population is below 15 years of age. This calls for careful planning of health care with long-term perspective.
Fertility Patterns
Nagaland has a total fertility rate (TFR) of 3.77, as against the national average of 2.85, and a general range of 1.4–2.0 in developed countries. Scrutiny of the figures on the basis of background characteristics such as place of residence, standard of living and educational qualifications of women shows that the TFR is higher in rural areas (4.06), among illiterate women (4.53) and in low-income households (4.53) (Figure 4.2). A total fertility rate of 2.1, which is considered to be the replacement level of fertility, is desirable for population stabilisation. In pursuance of the Government of India’s policy, Nagaland has constituted the State Population Council with the Chief Minister as Chairperson. A comprehensive Action Plan has been drawn up to bring down the current fertility rate from 3.77 to closer to the national average (2.85) and to increase information dissemination about
Source : NFHS II, 1998–99
Figure 4.1 Pyramid of Age Distribution
Nagaland
0 1 2 3 4 5 6 7 8 8 7 6 5 4 3 2 1
0-4
10-14
20-24
30-34
40-44
50-54
60-64
70-74
80
Percent
Age
Male Female
Source: NFHS II, 1998–99
Figure 4.2Total Fertility Rate
Tota
l
Urb
an
Tota
l Fer
tilit
y R
ate
1
2
3
4
5
3.77
4.53
4.06
2.66
Rur
al
Hig
h S
tand
ard
of L
ivin
g
Low
Sta
ndar
d of
Liv
ing
4.81
3.67
2.32
Med
ium
Sta
ndar
d of
Liv
ing
0
Illit
erat
e
Hig
h S
choo
l C
ompl
ete
& A
bove
Bel
ow M
iddl
e S
choo
l Com
plet
e
1.76
3.38
4.32
Mid
dle
Sch
ool
Com
plet
e
0.5
1.5
2.5
3.5
4.5

Nagaland State Human Development Report 94
and utilisation of family welfare programmes. This action plan is awaiting the approval of the Council. This will be one of the first integrated responses to the demographic challenge.
The poor contraceptive coverage in the State is a major influence on fertility patterns. Data on use of contraceptives by currently married women shows that 69 percent do not use any contraceptive, underlining that health education, particularly in the reproductive health area, is an urgent requirement. The current use of contraception has increased from 13 percent to 30 percent between NFHS I and NFHS II. Percentage of currently married women who have ever used contraceptive is 40 percent, which is lower than the national average of 48 percent (NFHS II). The most frequently mentioned single reason for not using contraceptive techniques is that the woman wants as many children as possible (30 percent). Religion (6 percent), health concerns (9 percent) and fear/ dislike of available contraceptive methods (10 percent) were the other most cited reasons.
Female sterilisation is the most used method with 12.3 percent of current users of any method preferring female sterilisation. No woman reported male sterilisation as the contraceptive method. Spacing methods such as IUD and oral contraceptive pill are less popular—used by 7.7 percent and 2.5 percent women respectively. It is however heartening to see more men beginning to participate in the spacing methods; 20.8 percent of women in age group 25–29 years currently using modern contraceptive methods reported use of condoms.
The contraceptive use rises steadily with women’s age, increasing till the age of 35–40 years, and the number of living children, implying that women tend to adopt family planning only after they have achieved their desired family size. This situation thus demands appropriate family welfare and reproductive health programmes to be formulated to cater to diverse age groups.
Figure 4.3Extent and Use of Contraceptives
Source : NHFS II—1998–99
Not using any method 69%Pill 3%IUD 8%Condom 2%Female sterilisation 12%Rhythm/safe period 5%Withdrawal 1%Male sterilisation 0%
Per
cent
dis
trib
utio
n of
w
omen
sur
veye
d
Source: Second National Family Health Survey, 1998–99
Figure 4.4 Percent Distribution of Currently Married Women by Contraceptive Method Used
Not Using Any Method
Any Traditional Method
Any Modern Method
Age
100
80
60
40
20
0
20–2
4
15–1
9
25–2
9
30–3
4
35–3
9
40–4
4
45–4
9
Tota
l
1.51
00 10.4
88.1
2.8
20.8
31.6
11.3
57.1
53.7
59.2
69.9
69.7
76.4
9.7 7.2 5
.5
5.9
36.6
32.6
24.2
24.6
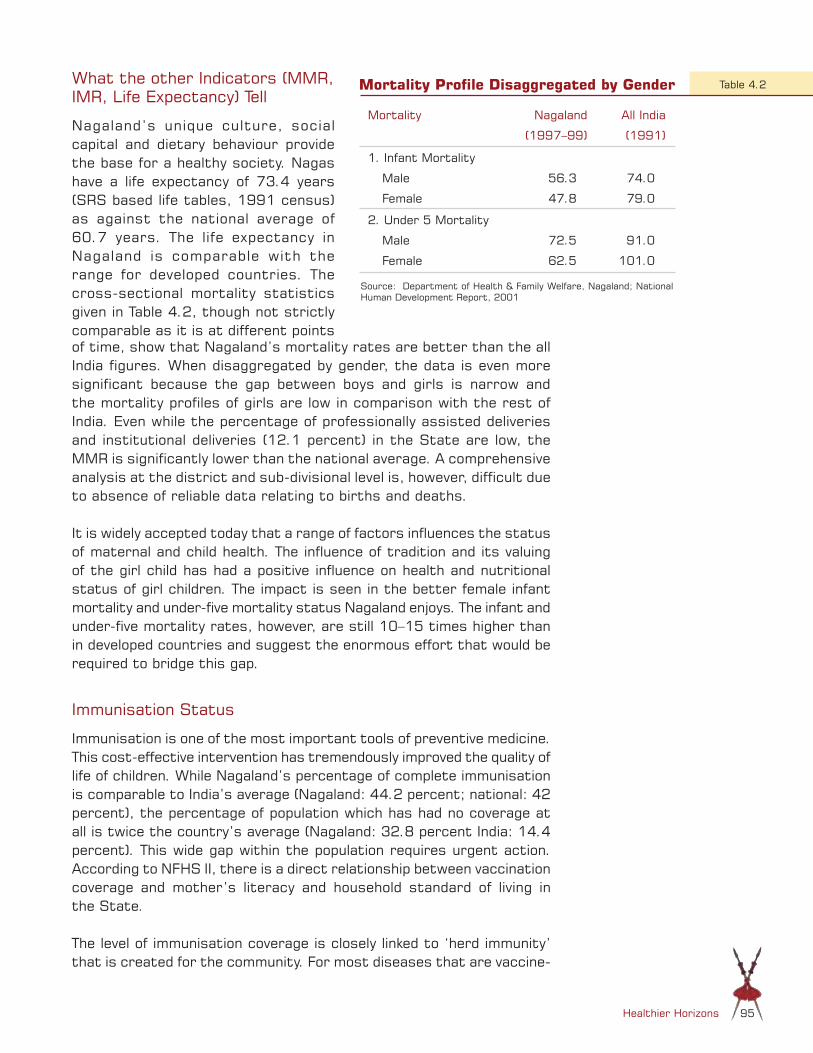
Healthier Horizons 95
What the other Indicators (MMR, IMR, Life Expectancy) Tell
Nagaland’s unique culture, social capital and dietary behaviour provide the base for a healthy society. Nagas have a life expectancy of 73.4 years (SRS based life tables, 1991 census) as against the national average of 60.7 years. The life expectancy in Nagaland is comparable with the range for developed countries. The cross-sectional mortality statistics given in Table 4.2, though not strictly comparable as it is at different points of time, show that Nagaland’s mortality rates are better than the all India figures. When disaggregated by gender, the data is even more significant because the gap between boys and girls is narrow and the mortality profiles of girls are low in comparison with the rest of India. Even while the percentage of professionally assisted deliveries and institutional deliveries (12.1 percent) in the State are low, the MMR is significantly lower than the national average. A comprehensive analysis at the district and sub-divisional level is, however, difficult due to absence of reliable data relating to births and deaths.
It is widely accepted today that a range of factors influences the status of maternal and child health. The influence of tradition and its valuing of the girl child has had a positive influence on health and nutritional status of girl children. The impact is seen in the better female infant mortality and under-five mortality status Nagaland enjoys. The infant and under-five mortality rates, however, are still 10–15 times higher than in developed countries and suggest the enormous effort that would be required to bridge this gap.
Immunisation Status
Immunisation is one of the most important tools of preventive medicine. This cost-effective intervention has tremendously improved the quality of life of children. While Nagaland’s percentage of complete immunisation is comparable to India’s average (Nagaland: 44.2 percent; national: 42 percent), the percentage of population which has had no coverage at all is twice the country’s average (Nagaland: 32.8 percent India: 14.4 percent). This wide gap within the population requires urgent action. According to NFHS II, there is a direct relationship between vaccination coverage and mother’s literacy and household standard of living in the State.
The level of immunisation coverage is closely linked to ‘herd immunity’ that is created for the community. For most diseases that are vaccine-
Mortality Profile Disaggregated by Gender Table 4.2
Mortality Nagaland
(1997–99)
All India
(1991)
1. Infant Mortality
Male
Female
56.3
47.8
74.0
79.0
2. Under 5 Mortality
Male
Female
72.5
62.5
91.0
101.0
Source: Department of Health & Family Welfare, Nagaland; National Human Development Report, 2001

Nagaland State Human Development Report 96
preventable a minimum coverage of 80 percent and more is required to create an immunity wall for the community. Nagaland has been affected by measles epidemics frequently in the past decades, a situation that could be prevented along with the residual morbidity, if immunisation coverage was around 80 percent. The disaggregated morbidity profiles of Mokokchung and Kohima reveal the presence of whooping cough, another vaccine-preventable disease. Morbidity profiles are also closely linked to children’s development, performance in education and eventual quality of productive work forces within communities. Nagaland aspires to have 100 percent of immunisation coverage. However, with a large number of children having no vaccination coverage, the task ahead is an enormous one.
II. Burden of Disease
Nutritional Profile
Nagaland’s tribal customs, cultural norms and cultivation practices find expression in the dietary behaviour of the people. One of the direct results is a higher calorie intake than the average citizen of the country. The calorie intake per capita per day is 2398 in rural areas and 2165 in urban areas, according to the National Sample Survey, 55th Round, 1999–2000. The corresponding all India figure is 2149 and 2156. Macro-nutrient deficiency is not visible in most of Naga society. Nonetheless, presence of anaemia is common among the women and children of the State, as in the rest of the country. Some micro-nutrient deficiencies, as evidenced by prevalence of diseases like night blindness, however, are seen amongst children. Vitamin A deficiency not only leads to ocular problems but also contributes to increased susceptibility to infections and malnutrition.
Nutritional Status of Children in NagalandTable 4.3
Indicators Rural Urban
Percentage of children under 5 weighed at birth 5.8 22.2
Percentage of children under 5 who weighed less than 2 kg at birth 5.1 9.4
Proportion of children in age group 2 to 3 having night blindness (per 1000) 1.8 8.4
Percentage of children age 12 to 23 who received vitamin A supplementation 22.2 50.7
Percentage of households using iodised salt 67.5 88.3
Source: Department of Health & Family Welfare, Government of Nagaland; Human Development Report, 2002
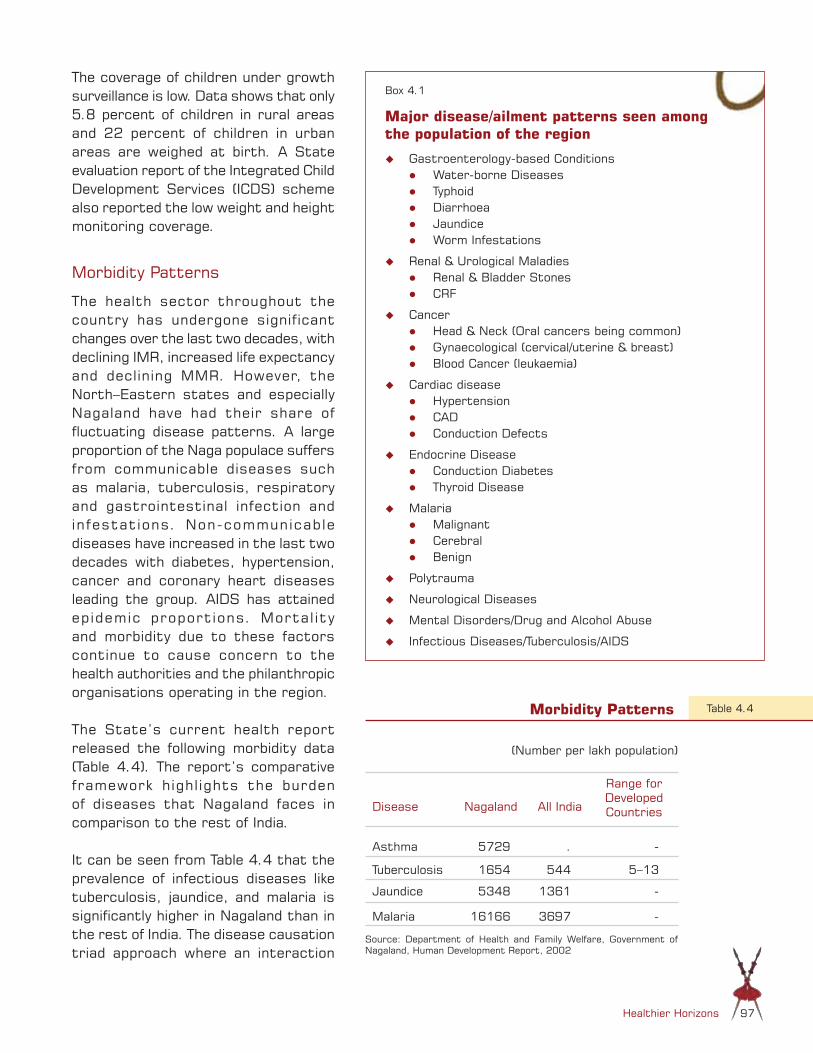
Healthier Horizons 97
The coverage of children under growth surveillance is low. Data shows that only 5.8 percent of children in rural areas and 22 percent of children in urban areas are weighed at birth. A State evaluation report of the Integrated Child Development Services (ICDS) scheme also reported the low weight and height monitoring coverage.
Morbidity Patterns
The health sector throughout the country has undergone significant changes over the last two decades, with declining IMR, increased life expectancy and declining MMR. However, the North–Eastern states and especially Nagaland have had their share of fluctuating disease patterns. A large proportion of the Naga populace suffers from communicable diseases such as malaria, tuberculosis, respiratory and gastrointestinal infection and infestations. Non-communicable diseases have increased in the last two decades with diabetes, hypertension, cancer and coronary heart diseases leading the group. AIDS has attained epidemic proportions. Mortal ity and morbidity due to these factors continue to cause concern to the health authorities and the philanthropic organisations operating in the region.
The State’s current health report released the following morbidity data (Table 4.4). The report’s comparative framework highlights the burden of diseases that Nagaland faces in comparison to the rest of India.
It can be seen from Table 4.4 that the prevalence of infectious diseases like tuberculosis, jaundice, and malaria is significantly higher in Nagaland than in the rest of India. The disease causation triad approach where an interaction
(Number per lakh population)
Disease Nagaland All India
Range for Developed Countries
Asthma 5729 . -
Tuberculosis 1654 544 5–13
Jaundice 5348 1361 -
Malaria 16166 3697 -
Source: Department of Health and Family Welfare, Government of Nagaland, Human Development Report, 2002
Morbidity Patterns Table 4.4
Box 4.1
Major disease/ailment patterns seen among the population of the region
Gastroenterology-based Conditions Water-borne Diseases Typhoid Diarrhoea Jaundice Worm Infestations
Renal & Urological Maladies Renal & Bladder Stones CRF
Cancer Head & Neck (Oral cancers being common) Gynaecological (cervical/uterine & breast) Blood Cancer (leukaemia)
Cardiac disease Hypertension CAD Conduction Defects
Endocrine Disease Conduction Diabetes Thyroid Disease
Malaria Malignant Cerebral Benign
Polytrauma
Neurological Diseases
Mental Disorders/Drug and Alcohol Abuse
Infectious Diseases/Tuberculosis/AIDS

Nagaland State Human Development Report 98
between agent, host and environment leads to the evolution of the disease will help us understand this situation better. The continuing high prevalence of infectious diseases, environmental conditions influenced by natural terrain/monsoon, and living conditions have made the host quite vulnerable.
Tuberculosis, which is resurgent worldwide, has shown a three-fold increase in prevalence between NFHS-I and NFHS-II (a period of around 6 years). The resurgence of tuberculosis is also linked with the emergence of the HIV/AIDS epidemic. Table 4.4 also shows the high prevalence of bronchial asthma in Nagaland. The prevalence rate of asthma is higher than tuberculosis. Chronic diseases linked to lifestyle and changing environment are also beginning to affect the morbidity profile. These diseases, besides being related to activity pattern, stress levels and dietary behaviour, are also associated with living conditions like housing, ventilation, sanitation facilities and air quality.
Child Morbidity
Three problems cause considerable mortality in young children—acute respiratory infection (ARI), fever and diarrhoea. Table 4.5 shows the prevalence of these in Nagaland. ARI, primarily pneumonia, is reportedly the leading cause of childhood mortality worldwide. Early diagnosis and treatment with antibiotics can prevent a large proportion of the deaths by ARI. The NFHS found that respiratory infections affect all strata of society in Nagaland and other North-Eastern states irrespective of their socio-economic background. The percentage of children who were taken to a health facility for ARI was very small. Fever was the most common of the three problems among children and, as with ARI, it was found to strike young children irrespective of their demographic and socio-economic background. Diarrhoea has proved to be the second biggest killer of children under five years worldwide, following ARI. Deaths from acute diarrhoea are mostly caused by dehydration due to loss of water and electrolyses. Nearly all dehydration-related deaths can be prevented by prompt administration of rehydration solutions. Table 4.5 shows the
Percentage of children suffering from*
Percentage with ARI taken to a
health facility or provider
Percentage with diarrhoea taken to a health facility or
provider
Oral Rehydration Therapy (ORT) not given for
diarrhoea (percent)
ARI Fever Diarrhoea
18.4 34.0 21.7 28.0 23 38.4
* Children suffering from these in the two weeks preceding the survey Source: NFHS II
Child MorbidityTable 4.5

Healthier Horizons 99
Box 4.2
Nagaland's Success in Alleviating Iodine Deficiency
Iodine deficiency is one of the world’s leading preventable causes of mental retardation. Both clinical and sub-clinical manifestations of iodine deficiency are collectively known as iodine deficiency disorder (IDD). Iodine’s linkage to normative endocrinal function and its resultant impact on all stages of human growth and development are widely acknowledged today beginning with the foetus, the newborn up to adulthood. A child born with neo-natal hypothyroidism does not realise optimum mental and physical growth.
A baseline survey conducted by the Indian Council of Medical Research (ICMR) in the early 1960s showed an IDD prevalence rate of 34.3 percent in Nagaland. A random sample survey conducted in 5 districts of the State has shown a prevalence rate today of 0.9 percent among children (0–19 years) and 2.4 percent to 3 percent among the adult population, which indicates a remarkable improvement in the prevalence of IDD. Health care personnel here share one such experience from Kijumetouma:
Kijumetouma is a small Angami-Naga village situated about 47 km from Kohima, in the same range with that of Dihoma village. The village has about 120 households with a total population of about 800, men outnumbering women by a very small margin.
Goitre was common in this small village in the past. It was said that almost every family had one or more member suffering from goitre. The village links this high endemicity to a natural pond near the village from where they got their water for drinking. It was said that some learned people from outside prompted them to believe that they got goitre because they used water from that particular pond.
In the past, villagers from Kijumetouma seldom participated in wrestling competitions, a favourite Naga traditional sport. They also lagged behind in the field of education. The situation was so grim that the people of the village worried as to why they did not have any young person with good education and vocation.
Things began to change in 1990…. school performance began to improve, goitre began to reduce amongst the population…and the village has entrants for wrestling today.
An important change that has contributed to this is the introduction of iodised salt and the work by the health department that has gone in to provide health education and behaviour change. The villagers used to buy loose common salt from Kohima in the past, and store them in baskets near the traditional area around fireplaces for the whole year. A decade ago iodised salt came to the village from Kohima. People are getting used to this new salt with increase in the cost from Rs 4/- to Rs 7/-.
In Kijumetouma, of the total of 111 people examined, only two cases of iodine deficiency disorders were detected in the age group of 19–45 years. This changing epidemiology means a better chance for children to lead healthy and productive lives.
need for awareness about ORT use in Nagaland.
People Living with HIV/AIDS
The HIV/AIDS pandemic is one of the biggest challenges facing the world today. The United Nations Secretary General, Mr. Kofi Annan, has described it as a security threat because it has impacted nearly all facets of life. According to National AIDS Control Organisation (NACO) estimates, India had about 3.82 —4.58 million people living with HIV/AIDS as of July 2003.
Nagaland is one of the six high prevalent states in the country with a prevalence rate of over 1.25 percent. Out of the 28,000 people screened in the past decade, 1,517 tested HIV positive and of the 349 reported cases of AIDS, 235 were men and 114 women. The epidemic has spread across all districts of Nagaland, with Tuensang, Kohima and Dimapur being the most affected.
The Nagaland State AIDS Control Society (NSACS) has reported that while sexual transmission is the predominant route, intravenous drug abuse has also significantly contributed to the spread of the epidemic. According to NSACS, 41 percent of the cases in the State have been transmitted through intravenous drug use, against 4.2 percent nationally (Figure 4.5). NSACS also calculated that the economic drain on the State by about 20,000 drug users was nearly Rs 36.5 crore. Differentials between patterns of drug use and profile of drug users of the North-Eastern region and rest of the country are given in Table 4.6. High rates of

Nagaland State Human Development Report 100
literacy, coupled with unemployment and substance abuse, are some of the distinctive factors that have contributed to the problem in the North-East. These differentials underscore the need for modifying the environment to make it more conducive to control HIV/AIDS.
A cause for great concern is the spread of AIDS from mother to child. Between 1999 and 2002, antenatal screening of mothers showed a persistent prevalence rate of 1.25 percent. This requires targeted education and intervention as well as specialised obstetric and paediatric services.
The National AIDS Control Programme launched in Nagaland during 1991–92 is implemented through the Nagaland State AIDS Control Society. A focused, multi-pronged strategy has resulted in reduction of HIV prevalence among intravenous drug users from 39 percent to 6.5 percent between 1994 and 2001. Through a vigorous programme people’s attitudes are being changed. Drug abuse is increasingly seen as a social and health problem rather than a crime. Advocacy with police department, especially excise/narcotic branch, jail authorities and police stations has led to humane treatment of addicts by the police. All these measures have resulted in a decreasing rate of relapse among addicts.
The harm reduction programme started by the Nagaland State AIDS Control Society has resulted in new partnerships between the Government and civil society led by the churches in creating more structural opportunities for prevention and care. The Government-NGO partnerships have helped in exploring medical and social rehabilitation of the young people affected by the epidemic. Since mid-eighties, Naga Mothers’ Association (NMA) and Kripa Foundation have endeavoured to create awareness about drug addiction as a disease
(in Percentage)
Particulars National North Eastern States
Illiteracy rate 21 6–7
Occupation (unemployed) 19.7 59.3
Drug used Others Heroin
Route (IDU) 43 90
Alcohol use (daily) 11.7 61.9
Level of awareness of HIV/AIDS/STD
76.1 >90
HIV prevalence 0.8 >1 in Manipur
and Nagaland
Source: Nagaland State AIDS Control Society, 2002
Profile of Drug UsersTable 4.6
Note: Figures in parentheses are number of cases during 2002
Source: Nagaland State AIDS Control Society, 2002
Figure 4.5
HIV/AIDS: Transmission Routes
Sexual IDU Blood Transfusion
Per
cent
age
of C
ases
100
80
60
40
20
0National (39,742)
Nagaland (270)
Manipur (1,280)
Others, not specified
86.3
4.245.5
47
41
3.89
72.76
18.73
4.62
1
11

Healthier Horizons 101
which is treatable. The NMA has also established the first hospice for people living with HIV/AIDS. NGO targeted intervention project saw the abolition of community jails for drug addicts in Tuli, Mokokchung. The Eleutheros Christian Society (ECS) began pioneering initiatives in Tuensang, one of the worst HIV/AIDS affected districts. The adoption of a human rights approach by the Society has led to significant gains in the areas of rehabilitation, prevention and environment modification for youth.
In addressing the various factors that influence the HIV/AIDS epidemic, inter-sectoral collaboration, both within the Government and between the Government and non-governmental organisations, is absolutely critical. Moreover, since this epidemic has spread across the North-Eastern region, an inter-state collaboration is also required.
A State level ‘Committee of Concern‘ has been established for interaction, coordination and strategic response to issues related to drug abuse and HIV/AIDS.
Strengths Weaknesses
Traditional network of community support system
Active support of NGOs
Active involvement of existing Church platforms
Higher literacy rate
Full support and monitoring by NACS
PLWA network established and proactive
Government sensitised and supportive
Proximity to Golden Triangle
Drug trafficking route—National Highway 39
Resource constraints
High unemployment
High migrant population
Sensitive area
Psycho-social instability of youth
Minimal recreational outlets
Inadequate health infrastructure
Box 4.3
AIDS Scenario: Strengths & Weaknesses
The 'Golden Triangle': Proximity to North-East India
Figure 4.6

Nagaland State Human Development Report 102
Box 4.4
Tuensang’s Success in Combating HIV/AIDS
Tuensang district is home to the Changs, the Khiamungams, the Sangtams, the Yimchungers, the Phoms, and some other minor tribes. The district has the largest area coverage of 4,228 sq. km and a population of 4,14,801 according to the 2001 provisional census. Agriculture is the main activity. As many as 84.48 percent of the rural households are engaged in farming and 52 percent of the total area cultivated is under jhum cultivation. With an average rain of 250 cm, abundant forests mark the terrain. During off-season, people engage themselves in weaving, local handicrafts and other income generating activities. Unfortunately, due to remoteness, there is no direct linkage to bigger markets.
Along with the challenges of inaccessibility, poor infrastructure, low literacy, insurgency and poverty, Tuensang now faces new problems of drug addiction, STD infection and HIV/AIDS. The porous 159 km international border along the Golden Triangle has placed the young men and women at great risk. Tuensang, today, has one of the highest prevalence of STD, IVD use and HIV/ AIDS in the State.
Mr Chingmak Kejong and his wife, Phutoli, are a young couple dedicated to reversing this trend in Tuensang. Mr Kejong had served as pastor of the Chang Baptist Church in Tuensang. But in 1993, he gave up his respected position, and together with his wife and friends, formed the Eleutheros Christian Society (ECS). “Our cemetery is littered with teenagers, even infants, who have fallen victim to drugs and AIDS,” he said. His background as a church leader and his commitment made affected families open up and ask for help in dealing with substance abuse and HIV/AIDS in their families.
The Kejongs took a human rights approach to the HIV/ AIDS epidemic, adequately appreciating the multi-factorial causation that has led to this situation in Tuensang. The underlying factors including poverty, low literacy levels, drug trafficking, etc., were addressed through their ‘change-maker’ strategy and their successful micro-credit programme, which has 210 SHGs, established over four years.
In March 2000, after seeing the success of the rehabilitation centre for drug addicts and HIV/AIDS affected persons, the Nagaland State AIDS Control Society (NSACS), urged the Kejongs and the ECS to run a hospice for HIV positive persons. They established a community-based care system, sensitive to local needs. What resulted was a comprehensive and determined response from the community and the churches. In 2001, the ‘Churches Alliance for Community Support’ was launched to care for HIV positive persons. Leading from the front were the church leaders and elders. Each church pastor also took specific responsibility to care for people living with HIV/AIDS. The Churches Alliance today serves as the care component of the Eleutheros Christian Society in the community. This is the largest and only community-based care-giver in Nagaland.
In 2003, Mr Chingmak Kejong was awarded the Governor’s Medal for his contribution to the society. On January 26, 2004, his wife, Phutoli, was similarly recognised by the State.
Compiled by Charles Chasie
One of the immediate and significant outcomes has been ownership of the School AIDS programme by the School Education Department. Recognising the seriousness of the problem of HIV/AIDS, the School Education Department has initiated a module on AIDS and related issues in the curriculum of all classes from fifth standard onwards. A second outcome was the formation of a ‘Legislative Forum’ on HIV/AIDS, to give political leadership to the fight against HIV/AIDS in the State.
III. Access to Health Care and Related Issues
In the wake of the National Policy of 1983 and subsequent support, the State was able to add several primary health centres (PHCs), sub-centres and community health centres (CHCs) to its health delivery infrastructure. In addition, much needed medicines, equipment and other support, in terms of training and capacity building, became available.
This expansion of health infrastructure must be seen in the context of the tremendous challenges faced by the State, particularly in the backdrop of insurgency. Health care personnel worked under very difficult conditions and the movement of medical supplies was limited. The restoration of peace and stability has given the Government a new opportunity for review, planning and effective functioning.
Traditional Institutions
Nagaland has a rich tradition of indigenous medicinal practice.

Healthier Horizons 103
Traditional healers and doctors still occupy positions of respect in rural communities. Every village has at least one acknowledged ethno-medicinal practitioner for treating various ailments. Besides, there would be other traditional healers like bone-setter, midwife, chiropractor, etc. Many villages have persons who are believed to be able to communicate with spirits and who heal people. What is more, most Naga villagers are well-versed in the knowledge of indigenous ‘first aid’, using herbs and materials available locally.
Even today, indigenous medicine practitioners (IMPs) are the largest health providers in the State. With modern allopathic medicines having a reach of only about 40 percent of the villages in Nagaland, the vast majority of the population depends on the IMPs. Even where modern medicinal coverage is available, many people first go to the IMPs. They go to modern health providers and hospitals only if their ailments are not cured by the IMPs. The IMPs provide the following advantages: Easy accessibility at all hours: Hospitals and doctors are at a
distance, usually provide fixed hours only and even within those hours they are, sometimes, absent.
Affordable prices: The IMPs charge reasonable prices for medicines they provide and usually do not take consultation fees.
Box 4.5
Nagaland Legislative Forum
Even today, indigenous medicine practitioners (IMPs) are the largest health providers in the State. With modern allopathic medicines having a reach of only about 40 percent of the villages in Nagaland, the vast majority of the population depends on the IMPs.
Following the advocacy workshop on HIV/AIDS for legislators held on 19th August 2003, the Nagaland Legislative Forum has been constituted comprising members both from the ruling and opposition parties. The main objectives of the forum are: To give political leadership to fight against HIV/AIDS To ensure that HIV/AIDS is kept on the political agenda To have a State HIV/AIDS policy To facilitate a holistic, comprehensive and coordinated response of the
State to the epidemic To strengthen existing services To identify and address gaps in the programme To use every opportunity to disseminate correct information on HIV/AIDS and
related issues to the people, thereby facilitating development of ownership by different stakeholders.
Resolutions passed in the first meeting of the Nagaland Legislative Forum, held in September 2003:1. All MLAs of Nagaland who are also members of the Forum will be
requested to hold awareness programmes on HIV/AIDS in their respective constituencies.
2. Constituency Committees to be constituted in all the constituencies in the State.
3. State Government to be requested to exempt all local taxes on HIV/AIDS related drugs.
4. The Forum will seek active involvement of the Church and NGOs in the fight against HIV/AIDS.
5. All ex-MLAs to be invited to be members of the Forum.

Nagaland State Human Development Report 104
People have faith in them and in the efficacy of their medicines. Moreover, their medicines are considered to have no side-effects. The medicines are also easily available locally.
The absence of a scientific approach and study is a disadvantage. There is still a general lack of knowledge of the medicinal properties on why a particular medicine is effective. Even the dosage is more a matter of conjecture, based on experience of the practitioners.
In its effort to expand the reach of health care to the people Nagaland, the Government needs to tap into this rich and readily available resource. In some parts of the State traditional healers like bone setters have been given time and space in the village health centres. Concerted efforts are required to fill the scientific gaps in the methods of treatment and improve this reservoir of health care. Apart from ensuring greater health care, such a venture will have added advantages of preservation of traditional medicinal knowledge system in the State, protection and conservation of biodiversity and generation of income and employment.
Infrastructure
The programmes carried out during the last 40 years have resulted in the creation of considerable health infrastructure facilities in Nagaland. For instance, the focus on strengthening primary health care has proved successful. And since Nagaland is a mountainous State, this spread and reach of the health care chain is significant.
Nagaland had 204 health centres—including urban hospitals, rural hospitals, primary health centres, and sub-centres—with 1367 beds and 156 doctors in 1980. This health care infrastructure and personnel helped achieve a doctor:population ratio of 20 doctors per 1 lakh population and 30 hospitals for every 1 lakh people. By 1999–2000, the number of health centres increased to 425, with 1633 beds and 394 doctors. As on 31st March 2000, 36.95 percent of the villages in the State were served by dispensaries, while 26.28 percent had primary health centres, and 33.33 percent had sub-centres. However, even as per national patterns, the achievements are still far short of the actual requirements. Based on population-related norms, as per 2001 census, the State requires 25 CHCs, 100 PHCs and 666 sub-centres.
Specialised health services are limited and concentrated in the State capital and two other district headquarters—Mokokchung and Dimapur. The State has 8 STDs clinics, 2 TB hospitals, one mental hospital and 5 DTCs for a population of around 20 lakh. Two Regional Diagnostic Centres at Mokokchung and Tuensang are nearing completion. Improvement and up-gradation efforts are on in all the districts. A major effort is the upgradation of the Naga Hospital, Kohima, to an ‘Institution of Excellence’ by a special Act of the Nagaland Legislative Assembly. This will strengthen
Nagaland had 204 health centres —including urban hospitals, rural hospitals, primary health centres, and sub health centres —with 1367 beds and 156 doctors in 1980.
Cov
erag
e/N
umbe
r (in
per
cent
age) 100
80
60
40
20
0
Figure 4.7
Healthcare Infrastructure: Coverage and Gaps
Current Status, 2003
Requirement Based on Norms
Community Health Centre
Primary Health Centre
Sub Centre
25 100 666
3506814

Healthier Horizons 105
the health care infrastructure and provide linkage to the primary health care infrastructure that already exists in the State.
Quality of Health Care
Existing health facilities, though widespread, are underdeveloped and chiefly in the primary and secondary stages. Most existing facilities are ill equipped and devoid of access to modern diagnostic and therapeutic aids. General patient amenities and service rendering facilities are poor. The civil hospitals are overcrowded and the basic amenities of general hygiene and recovery-promoting ambience are inadequate. Not surprisingly, given the low population density and the terrain, inadequate emergency facilities, etc., the ratio of preventable deaths has increased in recent times.
The practice of medicine has been and continues to be conservative, clinical based, non-interventional and non-proactive. Laboratories and other associated ancillary diagnostic facilities are at a premium —few and primarily outdated. There is only one CT-scan machine in the whole State, at a private hospital in Kohima. Patients requiring high-end investigations, immunology, etc., are sent to Mumbai, Kolkata and Guwahati. Complicated cases of neurology, cardiology, cancer and other serious ailments are similarly referred outside the State. The total quantum of government referrals, at actual treatment cost reimbursement, has been calculated at 20 crore annually. Besides, there are those non-government servants who have to fend for themselves without any reimbursements.
Health Care Providers
The current position of Nagaland with regard to doctor: population ratio stands at 1:4000 as against the recommended ratio of 1:3500. Inadequate number of health personnel in general, and lack of specialists in different medical disciplines in particular, have been a major handicap in providing quality health services. Currently, there are only about 500 doctors, including 98 specialists, in the State. This gap has contributed to limited access and compromise in the quality of care, particularly at the secondary and tertiary levels. The lack of adequate specialty services also means people have to go outside the State to seek health care. The numbers of health care providers and specialists have to increase to increase access and build effective linkages between primary, secondary and tertiary care.
The increasing number of Naga students opting for medicine in the joint entrance examinations is a reflection of interest amongst Naga youth in pursuing medicine. Unfortunately, Nagaland does not have any institution for higher medical education. This adversely affects availability of trained

Nagaland State Human Development Report 106
Per
cent
age
of C
ases
50
40
30
20
10
0
Figure 4.8
Reach of Health Education
Rural Urban Total
Immunization Breast Feeding Complementary Feeding
Caring for a Child during
Illness
29
38.7
30.7
31.6
17.3 19.8
23.2
16.7
15.3
29.3 3
2.1
45.2
A number of serious reproductive health problems continue to take their toll on Naga women. Complications of pregnancy and childbirth occur owing to lack of supervised antenatal, natal and postnatal care.
doctors and specialists to provide quality health care services to the people of the State.
Client-Oriented Health Care
The International Conference on Population and Development in Cairo in 1994 called upon governments to make programmes more client-oriented in order to provide quality services and care.
The second NFHS provides an insight into the quality of health care by looking at the sources of health care for households, home visits by health and family planning workers, etc. The survey reveals that less than 2 percent of the surveyed women in the State had received a home visit from a health or family planning worker. The absence of interaction with health providers impacts the quality and decision-making with regard to nutrition and disease prevention, immunisation, child care, family planning, sanitation and cleanliness.
Role of trained health care providers in safe motherhood
A number of serious reproductive health problems continue to take their toll on Naga women. Complications of pregnancy and childbirth occur owing to lack of supervised antenatal, natal and postnatal care—due in part to the low density population characteristic of the region and the poor access to efficient organised transport systems in emergency situations. Birth injuries leading to complications add to the morbidity. Childbirth-related deaths and unsafe abortions are also on the rise.
The percentage of assisted deliveries in Nagaland is only 32.8 percent as against the national figure of 42.8 percent. This means not only increased risk to expectant mothers but also ‘missed opportunity’ for interaction between health care providers and users. Studies have shown that antenatal, intra-natal and the immediate postnatal periods represent the most impressionable periods for health education. Such missed opportunities could perpetrate the low percentage of assisted deliveries and poor immunisation coverage, in a kind of vicious cycle.
A case for increased health education
As per a study carried out under the Nagaland State Plan of Action for Children, the number of mothers receiving health education and information in the areas of immunisation, breastfeeding, complementary feeding and caring for a child is

Healthier Horizons 107
still limited. Only one-third of mothers in rural areas have been covered through health education. Health awareness is comparatively higher in urban areas, though the coverage is still less than 50 percent. This low awareness has contributed to the low utilisation of immunisation services as well as services provided by pre-school programmes like ICDS.
Role of Private Sector and NGOs
A survey undertaken in 1999–2000 found that 37.1 percent of the rural households approached government/municipal hospitals for health care whereas 34 percent went to private clinics. The corresponding data for urban areas was 34.8 percent and 57.0 percent. This reflects the increasing role of the private sector in Nagaland.
So far, growth in the private sector is based largely on individual practitioners/consultants, with single speciality private nursing homes. A few polyclinics and hospitals cater to a wider range of specialty services. The private sector services are also concentrated in the major towns like Kohima and Dimapur. But the potential role the private sector can play is very great. Therefore, the Government has to play the dual role of ensuring delivery of quality services and also encouraging private sector partnership in providing health care.
The State Government has already taken the first step in this regard. The Nagaland State Health Care Establishment Act, 1997, was passed with a view to streamlining, regulating and ensuring quality control of health care services provided by the private sector. Rules have been framed and proper regulation authority has been designated. The Act came into force in January 2004, and all privately run health care establishments are now required to be registered under the Act.
In Nagaland, NGOs have also been playing a significant role in health education and health care services, especially through organising health camps, immunisation drives, providing mobile vans, etc. They have been involved in providing both preventive and curative services. Voluntary agencies such as Red Cross, Rotary Club, Lions Club, etc., have rendered significant yeomen services. An important collaboration between the Government and the non-governmental sector is in the area of reproductive health. Under the Reproductive and Child Health (RCH) programme, the Mother NGO (MNGO) scheme is in operation in the State since 2000. Although there is, so far, only one MNGO in the State, looking after the three districts of Kohima, Phek and Wokha, the intensity of coverage and services rendered, especially in the area of education, has been significant.
In the meantime, the Government has set up a State-level NGO committee, headed by the Secretary (Health & Family Welfare), and district NGO committees, headed by respective District Collectors, have
NGOs have also been playing a significant role in health education and health care services, especially through organising health camps, immunisation drives, providing mobile vans, etc. They have been involved in providing both preventive and curative services.

Nagaland State Human Development Report 108
also been formed in all districts. It is expected that these initiatives of the Government would have positive impact on the health care scenario in the State.
IV. Some Policy Issues
Communitisation : An Innovative Health Policy Intervention
The Nagaland Communitisation of Public Institutions and Services Act, 2002, was intended to fully take advantage of the traditional social capital of the Naga communities for development of the State. The Act defines Communitisation as ‘that which is made a property of the community’. In the health sector, it means making the management and maintenance of the health institutions the property of
the community. It means the active participation of the community. It recognises the community as the backbone of public welfare programmes. As a start, all primary health care institutions have been transferred to village communities.
Initially, 302 sub-centres (SCs) were communitised. Since then 48 SCs, one CHC and seven PHCs have been added. The Communitisation process has now extended to all the districts, concentrating first at the sub-centre and PHC levels.
Role of the Community
Under Communitisation, each village community has set up its Village Health Committee (VHC) to manage, coordinate and monitor the functioning of its health services. The committee consists of members representing the main stakeholder groups such as the Village Council, the Village Development Board, etc.
The responsibilities of the Government and the community have been clearly defined. Excerpts from the State health plan are given below:
While curiosity and apprehension were the first reactions to the process of Communitisation, today, the village communities have expressed satisfaction at the way this new system is evolving. Immediate outcomes have been improvement in attendance of health care providers, better utilisation of services, availability of essential medicines, regular submission of health reports and focus on public health issues. Communitisation has also brought out participation and ingenuity of the people. Above all, the sense of ownership has been striking. Simple but innovative measures by the communities, such as collecting Rs 10 per household in the village, growing vegetables and fruits to get income
Districts SC CHC PHC
Kohima 48 – 1
Mokokchung 49 – 1
Tuensang 61 – 1
Mon 49 – 1
Wokha 30 – 1
Dimapur 39 1 –
Phek 34 – 1
Zunheboto 40 – 1
Total 350 1 7Source: Department of Health and Family Welfare, Nagaland
Number of Health Centres CommunitisedTable 4.7
Communitisation recognises the community as the backbone of public welfare programmes. As a start, all primary health care institutions have been transferred to village communities.

Healthier Horizons 109
Government’s Responsibilities Community’s Responsibilities
Ensure deployment of health workers in every sub-centre.
Provision of yearly funds for purchase of medicines, salaries of Sub-centre staff and other recurring expenditure.
Provision of funds, whenever possible, for maintenance of buildings.
Provision of technical guidance, support, direction and supervision in all matters.
Assist the Village Health Committees to promote indigenous health care systems.
Take total ownership of health institutions and services.
Payment of salary to Government staff in the communitised institutions; Principle of ‘No work, no pay’ is applicable.
As a partner, understand that it must contribute its share of resources in cash or kind to supplement the resources given by the Govt.
Assess the health needs of the community and prepare action plan for preventive health care in the village.
Maintain records of disease profiles, demographic records and monitor implementation of different health programmes.
Procure medicines from the funds provided by the Department and own resources.
Devise a system of making transport available for referral of serious patients and emergency cases to the nearest higher medical facility.
Take Communitisation as an opportunity for self-help and a revival of traditional community action/spirit.
Box 4.6
Communitisation: Responsibilities of Government & Community
Districts Communitised Sub Centres
(SCs)
Number of SCs to which Funds
Released (17.10.2002)
Number of SCs to which Funds
Released (30.6.2003)
Number of VHCs which Purchased Medicines
Kohima 48 22 37 37
Mokokchung 49 34 42 42
Tuensang 61 34 60 60
Mon 49 31 48 48
Wokha 30 29 29 29
Dimapur 39 17 17 17Phek 34 33 33 33
Zunheboto 40 30 36 36
Total 350 230 302 302
Source: Department of Health and Family Welfare, Nagaland
Status of Sub-Centres Table 4.8
Peducha VHC meeting in progress.

Nagaland State Human Development Report 110
to buy medicines, fixing days for village cleanliness drives, donating community-built houses for sub-centres and staff quarters, private medical practitioners volunteering their services free on fixed days in the week at the health centre have been reported. The pressure from the community as well as obligation of the State department to post trained manpower to all health centres has enabled uniform deployment of health workers in the rural areas. Though the experiment is recent, it is already clear that capacity building and training, especially of health care providers and VHC members, will be vital for even better results. Mid-term reviews and mid-course corrections will help in strengthening the process
Funding Communitisation of Health Institutions
Table 4.8 gives an indication of the financial flow through the VHCs. The immediate effect of routing financial resources through the VHC is the improvement of availability of medical supplies at the health centres. Each VHC has an allocated amount to buy essential drugs. The sustainability of this initiative is dependent on efficient management and availability of sufficient finances. In spite of Communitisation and decentralisation, health remains the primary responsibility of the State Government. Continued Government support is needed to ensure sustainable partnership in health promotion.
Commitment to Health: Public Sector Expenditure
Expenditure on health sector as a proportion of the total public expenditure for the country has been consistently decreasing in the period 1980–1999. The decrease in this proportion for Nagaland
S.No States Health Sector Expenditure as a Proportion of the Total Expenditure (%)
1980–81 1990–91 1998–99
1 Arunachal Pradesh - 4.51 5.43
2 Manipur 8.66 4.40 4.67
3 Meghalaya 15.34 6.18 7.22
4 Mizoram - 3.39 4.93
5 Nagaland 9.57 6.30 5.39
6 Sikkim 5.65 5.93 2.84
7 Tripura 4.57 5.91 4.69
All India 7.10 5.88 5.78
Source : National Human Development Report, 2001
Analysis of Health Sector ExpenditureTable 4.9

Healthier Horizons 111
has, however, been severe, showing a decline from 9.57 percent to 5.39 percent during the same period. The health care system and its expansion, both in terms of personnel, infrastructure and materials, require more investment. The priority for increased investment in health arises also because of the newer challenges that Nagaland faces with the HIV/AIDS epidemic, mental health problems and chronic diseases related to lifestyle and environment.
V. Health Correlates
Lifestyle Indicators
The second NFHS examined certain aspects of people’s lifestyle, which can have detrimental effects on health. Though the results need to be interpreted with caution due to the possibility of under-reporting, they show wide prevalence of use of paan masala, tobacco and alcohol in the State. Fifty percent of men and 27 percent of women reported that they smoked, 27 percent men and 15 percent women used alcoholic drinks, and 45 percent men and 31 percent women chewed paan masala/tobacco. The consumption/use of these injurious products was more common among middle-aged adults and those with low standard of living.
Mon
Dimapur
Kohima
WokhaTuensang
Zunh
ebot
o
Mok
ochu
ng
Phek
Figure 4.9Open Defecation
Less than 15%
15% - 50%
50% - 70%
More than 70%
Per
cent
age
of H
ouse
hold
s
100
80
60
40
20
0
Figure 4.10Access to Sanitation Facilities
Own Toilet Common Toilet
Source: Sample Survey carried out during preparation of NSHDR, 2003
Open Defecation
Mon
Zunh
ebot
o
Dimap
ur
Mok
okch
ung
Tuen
sang
Kohim
a
Wok
haPh
ek
71
2.9
7
10.6
5
26.7
8
12.3
2
36.6
1
39.7
322.2
638.0
1
59.8
4
52.1
535.5
3
28.1
445.0
8
96.5
7
66.5
422.8
1
86.6
7
6.4
017.9
6
10.3
6
3.5
4
Water and Sanitation
Nagaland has a significant burden of infectious diseases that is closely linked to sanitation and water facilities. According to the National Family Health Survey of India, 1998–99, only 24.8 percent of the households in Nagaland have flush toilets and 49.5 percent have pit toilets. Nearly one-fourth of the population have no sanitation facility. While Nagaland does better than the national average of 30 percent in terms of availability of toilets, much has to be done to improve this status. The district level sample survey conducted during preparation of this report by the State Government to assess district level amenities found 57 percent of the households having own toilets. The access was 100 percent in Mokokchung but only 17 percent in Mon. The State Government has taken up Total Sanitation Campaigns (TSCs) in Dimapur, Kohima, Mokokchung and Zunheboto districts. Plans are afoot for covering all the districts.
3.4
3

Nagaland State Human Development Report 112
Among the total households, the availability of drinking water for Nagaland in 1991 was 53.37 percent. Table 4.10 gives an indication of the very significant expansion that has taken place in providing drinking water. Today the coverage is almost at 95 percent. However, the majority of the villages are only partially covered with safe water supply. One of the key areas of action, identified in the Nagaland State Plan of Action for Children, was to improve drinking water supply.
Housing Characteristics
Housing characteristics affect health as well as the general quality of life. The sample survey conducted during the course of preparation of the Nagaland State Human Development Report (NSHDR) revealed that majority of the sampled households across districts lived in semi pucca and kutcha structures. The figures for kutcha houses were: Mon (78 percent), Phek (55 percent), Kohima (50 percent) and Tuensang (45 percent). Housing and environmental conditions provide the underlying causes for the high prevalence of infectious and lifestyle diseases. Enormous efforts and investment will be required to provide healthy living conditions to the people of the State.
The Second National Family Health Survey also calculated a standard of living index in terms of facilities for housing, toilet, lighting, main fuel for cooking, source of drinking water, ownership of house, land, etc., and found that 10.7 percent of the sampled persons enjoyed high standard of living. Nearly 60 percent were categorised as having medium and 30 percent as having low standard of living. Improvement of living conditions will have a beneficial effect not only on the health of the society but also on the overall development of the State.
(As on 1.4.03)
Name of the District
Villages provided with water supply
Not Covered
Partially Covered
FullyCovered
Percentage of PC & FC
Villages
Kohima 6 159 35 97.00
Dimapur 27 165 28 87.73
Phek 6 67 46 94.96
Wokha 9 104 9 92.62
Zunheboto 8 144 70 96.40
Mokokchung 3 83 30 97.41
Tuensang 12 213 34 95.37
Mon 1 108 9 99.15
Total 72 1043 261 94.77
Source: Rural Water Supply Evaluation Report 2003, prepared by Department of Public Health & Engineering, Government of Nagaland
Rural Drinking Water Supply StatusTable 4.10
Per
cent
age
of H
ouse
hold
s
100
90
80
70
60
50
40
30
20
10
0
Figure 4.11
Housing Characteristics by Districts
Pucca Semi Pucca Kutcha
Mon
Zunh
ebot
o
Dimap
ur
Mok
okch
ung
Tuen
sang
Kohim
a
Wok
haPh
ek
Source: Sample Survey carried out during preparation of NSHDR, 2003
0.5
07
8.0
0
10.3
64
2.7
9
21.6
73
7.2
6
18.6
32
3.0
4
5.7
44
5.0
8
6.0
25
0.1
4
18.9
02
2.0
5
11.6
45
4.7
9
45
.95
39
.16
58
.33
44
.26
42
.12
59
.06
32
.19
19
.00

Healthier Horizons 113
School Health Programme
In order to promote the health of the school going population and to ensure early detection and treatment of diseases in school children, Nagaland runs the School Health Programme. Health check-up of school children, preventive health education and school immunisation are the main activities under this programme. This also serves as the base platform for sensitisation, education, and intervention in the pioneering work that Nagaland has initiated to combat the epidemic of substance abuse and HIV/AIDS. The Nagaland State AIDS Control Society and the Department of School Education are engaged in developing courses on HIV/AIDS, drug addiction and alcoholism for students of 5th standard and above. This programme will be the first of its kind in the country. A parallel teachers’ training programme is also being conceptualised. This pioneering work can contribute significantly and add a new dimension to the application of preventive medicine in Nagaland.
VI. The Way Ahead
Traditions and culture, food security, social norms and societal environment, etc., play important roles in the promotion of health in a given society. The Nagaland experience has been enriched by the enormous social capital of Naga tribal communities, the rich bio-diversity of the State and knowledge of traditional medicines. On the other hand, it has been adversely affected by its remoteness, protracted insurgency and conflict situation.
So, as Nagaland strives to promote health among the people, it must take pride in its considerable achievements since statehood. It must also humbly accept the challenges before it. A comparison with the rest of the country and developed countries shows the enormity of the task that lies ahead. But the potentials are also enormous if Nagaland can work out a plan of action suited to it, taking advantage of its rich traditional knowledge system and the resources that are easily and locally available. Some of the priority areas which can significantly impact human development through health promotion in Nagaland are given below.
Demographic and Health Status
A comprehensive policy has to be developed to address the demographic challenge that Nagaland faces today. Sustained efforts are required to bring down the current fertility rate closer to the national average and subsequently to a population stabilising level.
Health personnel have to play a key role in dissemination of information about reproductive choices available and promoting greater acceptance of contraceptive methods.
Health databases and surveillance mechanisms have to be strengthened, particularly at the district level for more informed

Nagaland State Human Development Report 114
action. Periodic surveys and studies for impact assessment of the health programmes and services must be encouraged.
Create greater awareness to improve the registration of births and deaths.
Training of health care providers—traditional birth attendants, ANMs, MPWs, Anganwadi workers, etc. – in ante- and postnatal check-ups and basic health care. IEC campaigns have to be intensified to ensure safe motherhood for Naga women and lower incidence of neo-natal, infant, child mortality.
Improve coverage of institutional deliveries and deliveries assisted by trained persons.
Have an integrated plan for reproductive health. Explore possible strategies for increasing immunisation coverage.
Burden of Disease
Encourage preventive health services, including immunisation, health education and early recognition of epidemiological changes through building up community knowledge and participation.
Improve access to essential drugs, especially in district headquarters, small urban towns and rural areas.
Address the issues of drug addiction and alcoholism through a multi-pronged strategy by intensively involving NGOs and community. Capacity building and development of skills of health care providers, NGOs and dissemination of information to the community, establishment of after-care ‘Composite Centres’ consisting of vocational training, income generation for self-sustenance and social reintegration of recovered addicts, innovative mechanisms to check cross border drug trafficking can be part of the strategy.
Intensify the prevention and care components for tackling the menace of HIV/AIDS through greater education on prevention of drug abuse and its intervention, capacity building of NGOs and communities as well as sustainable community care and support of people living with AIDS. Build a network of support services to empower people living with HIV/AIDS (PLWHAs).
Ensure efficient handling of anti-retroviral (ARV) therapy. Mainstream HIV care and support into the PHCs. Develop recreational outlets, career-counselling centres, and explore
avenues of employment for the unemployed youth.
Access to Health Care
Provide adequate health care infrastructure. The quality of existing infrastructure needs to be improved. Even civil hospitals in the district headquarters do not have ICUs, trauma care units, etc. Emergency obstetric services need to be strengthened. This is an area where the chasm between reality and vision is enormous.

Healthier Horizons 115
Address inadequacy of health personnel and specialists to improve quality of health care institutions. Absence/ inadequacy of doctors restricts coverage of heath services in rural areas. Lack of medical specialists limits the reach of secondary and tertiary health care.
Develop more projects like tele-medicine to suit hilly terrain and sparse population of the State, and also provide mobile units.
Rationalise posting of doctors and specialists to achieve uniform accessibility of quality health care in all districts of Nagaland.
Develop strategy to combat insufficient reach of quality health care in rural areas. Encourage frequent organisation of medical camps and awareness campaigns.
Coverage of primary health care across the State must increase. Each block/sub division should have at least one CHC. All efforts have to be made to achieve the requirement of CHCs, PHCs, and SCs as per the national norms.
Improve service delivery outlets at the secondary and tertiary levels. Establish mechanisms for participatory monitoring and evaluation of
health care at the primary, secondary, and tertiary levels. Encourage periodical surveys and studies, for impact assessment of health programmes/services.
Encourage private sector partnership in providing quality health care, especially in smaller urban centres.
Establish medical college of national/international standards, in association with key players from the private health care sector in the country, to act as the apex referral centre as well as a centre for medical education for aspiring youth.
Some Policy Issues
Continue Communitisation of all CHCs, PHCs and sub-centres. Integrate traditional healing practices into the health care framework
by: a) Giving adequate recognition to the IMPs. This recognition could
be in the form of incentives and platforms for their practice. Quality of health services provided by the IMPs could be ensured by licensing only those who are genuine.
b) Fill the scientific gaps in the methods of treatment through provision of research facilities.
c) Biotechnological studies in this field have immense potential for bringing wealth to the practitioners and to the State. Already there is a big market for medicinal plants. And there is urgency in documenting the rich bio-diversity of Nagaland in order to protect Naga heritage.
Considerable investment in infrastructure, equipment, capacity building of personnel, etc., are needed to meet the health requirements of the State. The State Government has to focus the available financial resources for providing quality services in areas

Nagaland State Human Development Report 116
where private investment is unlikely while at the same time creating conditions conducive for private investments in the State, especially in district headquarters and smaller urban towns.
Health has, as its determinants, various factors and lifestyle areas, such as literacy, economic stability, social amenities, etc. Encourage inter-department collaboration and NGO/community partnerships to promote health in the State.
Health Correlates
Create awareness for clean water supply, sanitation and adequate nutrition, as health per se is incomplete without a congenial environment.
Strengthen the implementation of housing by-laws to ensure better and healthier living conditions for the people.
Plan and implement adequate sewerage and solid waste disposal systems in all urban centres.
Carry out extensive replication of the Sulabh experiment in the State.

Chapter 5
Acquiring Knowledge

Nagaland State Human Development Report118
I EDUCATION AND SOCIETY 121 From Traditions to Modernity 121
Literacy 123
Enrolment Ratios 124
Dropout rates 127
Early Childhood Experiences 127
The Vicious Cycle of Failure 128
Education and Employment 130
II ACCESS TO EDUCATION 130 Creating the Educational Base 130
Higher Education 131
Research and Documentation 133
Role of Private Sector 133
Non-formal Education 134
III QUALITY OF EDUCATIONAL EXPERIENCE 134 Minimum Levels of Learning for Educators 135
School Infrastructure 135
Medium of Education 136
Vocationalisation of Education 136
IV POLICY INITIATIVES AND IMPLICATIONS 137 Communitisation of Education 139
Communitisation: A Vehicle for Sarva Shiksha Abhiyan 141
Expenditure on Education 141
V THE WAY AHEAD 142 Education and Society 143
Access to Education 143
Quality of Educational Experience 144
Policy Initiatives 144

Acquiring Knowledge 119
A s the State looks forward to its vision of a developed Nagaland and endeavours to ensure universal functional
literacy for its people, this chapter looks at the State’s remarkable success in the field of literacy and educational accomplishments despite a late beginning of formal education. It also examines the challenges of imparting quality education through the prism of enrolment, dropout and retention experiences as well as availability of infrastructure, access to services and quality teaching. It elaborates on the new opportunities of Communitisation and suggests possible interventions to further the State’s objectives of building a responsible, informed, and strong, knowledge-based society.
The National Human Development Report regards education as the single most important means for individuals to improve personal endowments, build capability levels, overcome constraints and in the process, enlarge their available set of opportunities and choices for a sustained improvement. It is not only a means to enhance human capital, productivity and hence the compensation to labour. But it is equally important for enabling the process of acquisition, assimilation and communication of information and knowledge, all of which augments a person’s quality of life.
Between 1961 and 2001, Nagaland’s literacy rate increased from 17.91 percent to 67.11 percent. While Nagaland’s literacy rate was higher than the national average in the period 1981 to 2001, the extent of improvement has not been as high as in some of the other North-Eastern states like Mizoram (literacy rate 88 percent). When disaggregated by gender, the literacy rate is higher amongst men than women. Naga women’s literacy rates are comparable with the all India literacy rates. The enrolment rate in the State is 64 percent as against 95 to 100 percent in the developed nations. This, of course, is not to belittle the remarkable achievements of the State but to establish the ideal and to map out the extent of the journey still to travel to be at par with the best in the world.
The educational infrastructure, particularly at the primary level, has expanded considerably, with nearly 1500 schools serving the children of Nagaland. The proportionate increase in trained teachers, however,
The destiny of a nation is shaped in her classrooms. Kothari Commission Report, 1966
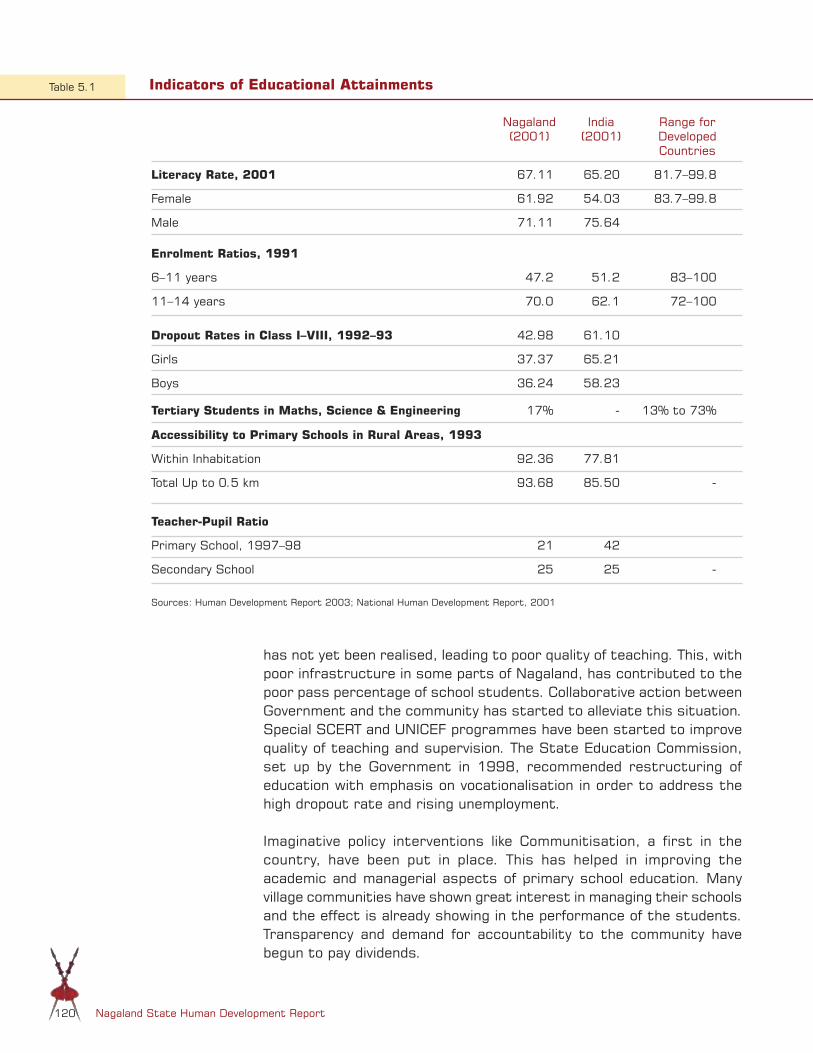
Nagaland State Human Development Report120
has not yet been realised, leading to poor quality of teaching. This, with poor infrastructure in some parts of Nagaland, has contributed to the poor pass percentage of school students. Collaborative action between Government and the community has started to alleviate this situation. Special SCERT and UNICEF programmes have been started to improve quality of teaching and supervision. The State Education Commission, set up by the Government in 1998, recommended restructuring of education with emphasis on vocationalisation in order to address the high dropout rate and rising unemployment.
Imaginative policy interventions like Communitisation, a first in the country, have been put in place. This has helped in improving the academic and managerial aspects of primary school education. Many village communities have shown great interest in managing their schools and the effect is already showing in the performance of the students. Transparency and demand for accountability to the community have begun to pay dividends.
Nagaland(2001)
India(2001)
Range forDeveloped Countries
Literacy Rate, 2001
Female
Male
67.11
61.92
71.11
65.20
54.03
75.64
81.7–99.8
83.7–99.8
Enrolment Ratios, 1991
6–11 years
11–14 years
47.2
70.0
51.2
62.1
83–100
72–100
Dropout Rates in Class I–VIII, 1992–93
Girls
Boys
42.98
37.37
36.24
61.10
65.21
58.23
Tertiary Students in Maths, Science & Engineering 17% - 13% to 73%
Accessibility to Primary Schools in Rural Areas, 1993
Within Inhabitation
Total Up to 0.5 km
92.36
93.68
77.81
85.50 -
Teacher-Pupil Ratio
Primary School, 1997–98
Secondary School
21
25
42
25 -
Sources: Human Development Report 2003; National Human Development Report, 2001
Indicators of Educational AttainmentsTable 5.1

Acquiring Knowledge 121
Nagaland’s secondary and higher education institutions have also expanded in the last decade. This provides the youth of Nagaland the opportunity to pursue higher education within the State. Nagaland University, the only university in the State, now has 42 affiliated colleges and offers undergraduate and postgraduate courses through its three campuses, at Lumami, Kohima and Medziphema.
The development process in Nagaland will be closely linked to the quality of workforce and technology linkages available in the State. Initiatives are underway to offer more technical training through the polytechnics and new institutes of technology. Research, documentation and dissemination of study findings, in various sectors, are still limited. The strengthening of this area will help develop a culture of enquiry and understanding. Intellectual capacity building will help develop a new attitude towards learning, development of work ethics and gainful employment.
I. Education and Society
The type of education a society has reflects the needs and aspirations of the particular society and has a great bearing on its social order. This reciprocal relationship between education and the needs and aspirations of society provide focus and perspective to the people and they, in turn, shape society for harmonious and progressive living.
From Traditions to Modernity
The mode of education prevalent in Nagaland before the coming in of the Church was centred around the Morung. This institution served Naga society for centuries and incorporated in its functioning time-honoured tribal values, life-centred learning and exposure to customary practices and experiences. Here, young men and women grew up under the supervision of the community elders. For the young men the Morungs were khel- or clan-based. The girls met in informal groups usually in the home of a respected senior woman. The youth, through community living and working together, also got to know each other in a natural way and forged relationships that extended from the personal to the social domain. This innovative approach to education,
Box 5.1
Morung or Thehu/Kichuki
The Morung, or communal dormitory, was the most important and primary traditional institution of the Naga tribes within the village community. The Morung refers to the building in which the communal dormitory was housed. Among some tribes, such as the Ao, one Morung served as the dormitory for all the young unmarried men of the khel (cluster of clans). A similar one, called the ‘Tsuki’, was maintained for the young unmarried women. In this case, the Morung was the common property of the khel. In the case of other tribes like the Angami, Chakhesang, etc., each clan in the village had a Morung, called ‘Kichuki’, of its own, located within the building of a respected member of the clan who also acted as the principle host. Attached to the ‘Kichuki’ was the ‘Thehu’, or meeting place, of the clan. The clan ‘Thehu’ and ‘Kichuki’ were inseparable.
The Morung was the informal school of the Naga child. All the clan, khel and village history, folklores and legends, songs, traditional practices, including the laws governing community living, were taught there. Mundane daily existential problems and successes were sorted out and shared; each learned from the experiences of the others. Any questions could be asked and answered in the privacy of this fraternal environment. Likewise, the girls did the same in their own dormitories. The disciplining of unruly behaviour was also largely done here although parents also did it in their homes. From the Thehu/Kichuki emerged the pride of the clan, fully prepared for life and living and to play their roles in society. They would already know politics, diplomacy and the various ways of conducting oneself with others, ready to compete with anyone in any field for the sake of the honour of the clan/khel/village. The Thehu/Kichuki was considered a sacred institution and any unbecoming behaviour within its precincts was taken very seriously by the entire village community. Crimes committed within it resulted in immediate exile from the village.
With the spread of Christianity along with modern system of education the importance of this age-old system of imparting knowledge diminished and lost its applications.

Nagaland State Human Development Report122
leadership building and societal training contributed much to Naga life, history and functioning. With the advent of Christianity, English and formal education were introduced. This led to far-reaching changes in the educational and social framework of Nagaland.
The new schools were first sponsored by the American Christian Missionaries and later by the British. Anecdotal reports state that in the first years when the Church made education compulsory for at least one child from every family, domestic helpers were sent to school to satisfy this norm. It was only later that societal acknowledgement of education came. The first primary English medium school in the Naga Hills was established by Mrs. Mary Mead Clark in Molungyimsen, Mokokchung
district, in 1878. Originally intended for women only, this school became a pioneer institution, producing teachers, leaders, evangelists and pastors.
According to senior Naga thinkers who have been part of the State’s educational landscape and associated with the discussion on education for this Human Development Report, “The objective of these educational endeavours was to enable the Naga people to read and write the Bible and to man the offices. The people also were eager to become pastors or teachers. It was during this period that two trends were unintentionally set—first, the teacher elite and secondly, the schooled elite. Community participation in education during those days was in the form of construction of school buildings with local materials and sending their children to schools, at times even on compulsion.”
After India got independence, primary schools were opened in many villages. A few colleges followed. The Nagaland Campus of the North-Eastern Hill University (NEHU) was established in 1978. Subsequently, in 1994, the Nagaland University was established. It is interesting to note the continuing experience of community participation in education across the State. In the beginning the communities initiated most of the work for the institutions not so much with understanding of education, but for the pride of having one. Political compulsions prompted the Government to take over a large number of these schools, including those run by the Church. Consequently, rapid quantitative expansion took place during 1961–97 without proper planning and sufficient qualified teachers. Quality of education became an area of great concern. The concern for quality education and the increasing demand for education, paved the way for increased participation by private institutions, non-governmental agencies and specialised educational agencies of the Government.
Memorabilia dating back to 1872 record the arrival of the first missionaries in the Naga Hills. Rev. Dr. E.W. Clark and his wife, Mrs. Mary Mead Clark established the first American Baptist Mission at Molungyimsen.

Acquiring Knowledge 123
Literacy Rate Across Districts Table 5.2
State / Districts
Literacy Rate in 1981 (Percentage)
Literacy Rate in 1991 (Percentage)
Literacy Rate in 2007 (Percentage)
Persons Male Female Persons Male Female Persons Male Female
Kohima 48.94 57.04 38.69 69.58 77.24 60.60 74.28 81.44 66.64
Phek 37.99 49.09 25.27 62.59 72.28 51.34 71.35 78.97 63.08
Wokha 45.60 55.49 34.82 73.92 81.06 65.99 81.28 85.69 76.46
Zunheboto 45.59 52.81 38.10 64.36 70.76 57.63 69.73 73.43 65.80
Mokokchung 61.78 65.95 57.18 77.85 80.52 74.88 84.27 86.14 82.20
Tuensang 30.49 36.89 23.32 48.39 53.98 41.98 51.30 55.97 46.12
Mon 19.89 26.45 12.33 36.02 41.90 29.10 42.25 46.70 37.12
Dimapur - - - 68.65 73.64 64.42 78.15 82.16 73.34
Nagaland 42.57 50.06 39.89 61.65 67.62 54.76 67.11 71.77 61.92
India 43.60 56.30 29.70 52.21 64.13 39.29 63.38 75.85 54.16
Source: Statistical Handbook of Nagaland, State Directorate of Economics and Statistics
Literacy
The UN General Assembly in its special session on children observed that, “A world fit for children is one in which all children get the best possible start in life, have access to quality basic education, including primary education that is compulsory and available free to all, and all children, including adolescents, have ample opportunity to develop their individual capacities in a safe and supporting environment. We will promote the physical, psychological, spiritual, social, emotional, cognitive and cultural development of children as a matter of national and global priorities.”
Nagaland’s literacy rate has progressively improved over time from 17.91 percent in 1961 to 67.11 percent in 2001. However, the percentage of increase during 1991–2001 was not as much as in the previous decades. When disaggregated by gender, this trend continues amongst women. Female literacy rate increased from 33.72 percent in 1981 to 55.70 percent in 1991 and to 61.92 percent in 2001. The male literacy rate, which increased steadily over time, was higher than the all India level in 1991, but stood below the national average in 1981 and 2001.
The baseline literacy levels available from the then three districts in 1961 give us a point of reference. Between then and now the progression in literacy has been positive in general, the highest decadal improvement being in the decade 1981–1991.
Kohima Mokokchung Tuensang Nagaland
40
35
30
25
20
15
10
5
0
Figure 5.1
Literacy Status in 1961
Total Male Female
20
.91
29
.87
10
.81
29
.63
37
.08
21
.84
4.4
7 6.9
71
.84
17
.91 20
.04
11
.34

Nagaland State Human Development Report124
Nagaland’s literacy rates, disaggregated by districts, range from 42.25 percent to 84.27 percent. Mokokchung has been the leading district till today with literacy rate increasing from 29.63 percent in 1961 to 84.27 percent in 2001. This represents one of the highest literacy rates in the country. Another district, which has shown rapid rise is Wokha, with literacy rates increasing from 45.60 percent to 81.28 percent between 1981 and 2001, a 78 percent rise. These two districts also have the distinction of being the first districts in the State to have literacy rates above 80 percent. The literacy rates for males in Kohima, Mokokchung, Wokha and Dimapur were more than 80 percent during 2001. Mon, which started off with much lower levels of literacy at 19.89 percent in 1961, stands today at 42.25 percent, thus showing a 112 percent rise. This is the only district which has a literacy level less than 50 percent. Geographical remoteness, difficult accessibility, poor infrastructure and inadequate quality of teaching have contributed to this. The educational backwardness in Mon and Tuensang districts can also be attributed to their late start in the framework of formal education due to late arrival of missionaries and the fact that these regions were in the ‘unadministered areas’ outside British administration. They came under effective administration only after formation of the Naga Hills-Tuensang Area (NHTA) in 1957. It is, however, noteworthy that the highest increase in literacy rates in the State during the decade 1981–91 has been in Mon (27.58 percent increase for women and 17.3 percent increase in combined literacy rates).
Female Literacy Rates
The literacy rate amongst women in all the districts, except Mon and Tuensang, is much higher than the national average. Nagaland’s female literacy rate ranges from 37.12 percent in Mon to 82.4 percent in Mokokchung as against the all India range of 34 percent in Bihar to 95 percent in Mizoram. The female literacy rates in Mokokchung, Wokha and Dimapur are comparable with the literacy rates in some of the developed countries. Mon and Tuensang, in line with the overall literacy rates in these districts, had much lower female literacy rates in 2001. The male literacy rates have been consistently higher than the female literacy rates in all districts. Over the last four decades, there has been a difference of 10 percent or more in the literacy accomplishments of men and women in all the districts. These differentials are linked with the lower levels of enrolment of girls in comparison to boys.
Enrolment Ratios
The enrolment ratio in the age group of 6–11 years was higher than the all India level during 1981. It however declined during 1991. In the age group of 11–14 years, the enrolment was higher than the all India level and it has improved over the years. On a comparative framework, there is a drop in absolute enrolment percentages in 6–11 years and
Nagaland’s female literacy rate ranges from 37.12 percent in Mon to 82.4 percent in Mokokchung as against the all India range of 34 percent in Bihar to 95 percent in Mizoram.

Acquiring Knowledge 125
11–14 years age groups. At the high school and higher levels, there is an efflux of students outside the State, particularly among the socio-economically advantaged families. But non-pursuance of higher education has been an area of concern. Successful role models can inspire more Naga youth to participate in higher education.
The enrolment, including that at the higher secondary level, across the districts showed a rate of more than 70 percent in Kohima, Dimapur, Phek and Zunheboto districts. Mon and Tuensang are the only districts in the Nagaland with enrolment ratios less than 50 percent. The low enrolment ratios are indicative of economic circumstances, poor quality of teaching and school infrastructure, lack of interest in formal education and higher dropout and failure rates in these districts.
The school enrolment ratios are higher for boys than for girls at all ages, across the districts, except for Mon and Tuensang. The enrolment ratios are equal for boys and girls in Mon, and higher for girls in Tuensang. Lack of interest in studies, cost of education and requirement to work were the main reasons stated for not attending school in the State, according to the National Family Health Survey II, 1999–2000. In the sample survey, NFHS-II also found that, in the age-group 6–17 years, the number of girls who never attended school was twice that of boys.
Nagaland has initiated steps towards universalisation of elementary education and cent percent enrolment ratios. To be successful in these endeavours the factors impacting the enrolment behaviour have to be tackled effectively. Some of the main areas where concerted efforts and State intervention will be essential are reducing dropout rates, introducing interesting curriculum, vocational education, improving quality of teaching, infrastructure and success rates in examinations.
Particulars 1981 1991
Nagaland India Nagaland India
Age 6–11
Boys
Girls
All Children
52.1
46.4
49.3
55.3
38.5
47.2
48.9
45.4
47.2
56.6
45.4
51.2
Age 11–14
Boys
Girls
All Children
73.1
63.9
68.6
62.0
36.7
50.0
71.7
68.2
70.0
71.1
52.2
62.1
Enrolment Percentage Table 5.3
Mon
Dimapur
Kohima
WokhaTuensang
Zunh
ebot
o
Mok
ochu
ng
Phek
Figure 5.2Pattern of Enrolment
Less than 60%
60% – 80%
More than 80%
Source: National Human Development Report 2001

Nagaland State Human Development Report126
Figure 5.3
District Wise Enrolment Rates
Kohima
100
80
60
40
20
0Mon Mokokchung Wokha Dimapur Phek Tuensang Zunheboto
Enr
olm
ent
Rat
es
Male Female Total
Reason Never Attended School Currently Not Attending School
Male(percent)
Female(percent)
Male(percent)
Female(percent)
School too far away
Transport not available
Education not considered necessary
Required for household work
Required for work on farm/family business
Required for outside work for payment in cash or kind
Costs too much
No proper school facilities for girls
Required for care of siblings
Not interested in studies
Repeated failures
Got married
Other
Don’t know/missing
5.8
1.8
5.1
10.1
11.8
4.5
24.7
0.0
0.0
16.0
-
-
7.8
12.4
4.0
5.2
1.7
24.2
9.4
5.6
18.6
0.0
1.7
12.9
-
-
10.7
6.2
2.3
0.0
10.7
4.6
7.7
7.6
9.6
0.0
0.0
27.7
0.0
2.3
17.1
10.3
0.0
2.0
2.0
25.5
2.6
5.2
10.2
0.0
2.1
18.3
6.1
2.1
21.4
2.6
Total Percent 100.0 100.0 100.0 100.0
Number of children 66 133 41 47
Source: Second National Family Health Survey, 1999–2000
Table 5.4 Reasons for Children Not Attending School in Nagaland
92
79 8
5
49 49
49
65
60 63
56
53 54
81
79 80
80
76 78
36
44
40
73 75
73

Acquiring Knowledge 127
Dropout Rates
Nagaland’s dropout rate was higher than the all India average of 72.1 percent during 1981–82. Today, it is lower than the all India average dropout rate of 56.82 percent. The educational journey of children at the primary level shows a dropout rate of 46.8 percent in 1984–85, which was significantly reduced to 20 percent in 1994–95. If the middle school experience is added the dropout rate was 58.45 percent in 1984–85, which decreased to 35 percent in 1996–97, showing a 23 percent decrease. Better awareness about education, improved infrastructure and peace and stability contributed to this achievement. This reversal in dropout rates provides the State an opportunity to address other issues to enrich the students’ experience at school.
Some factors that have led to students’ dropout in the past include: Economic reasons Inadequate infrastructure Quality of teaching School and teaching curriculum Interest levels amongst students and parents Location and distance of educational institutions Lack of peace and security
Early Childhood Experience
Educationists and child health experts alike believe that pre-school experience has a bearing on the growth, development and educational performance of the child. The three important areas of intervention that influence the quality of life in this age group are health, nutrition and education. Programmes like the Integrated Child Development Scheme aim to achieve better levels for children in all the above areas. Table 5.5 shows that only one-third of the children are reached by child development services.
As discussed in chapter four, the general nutritional status of children is good. Though macro-nutrient deficiencies are uncommon in Nagaland, micro-nutrient deficiencies among children exist. The increase in minor illnesses because of micro-nutrient deficiencies and resultant infections can lead to frequent absenteeism and poor
100
80
60
40
20
Source: National Human Development Report 2001
Figure 5.4
Trend in Dropout Rates
1981–82 1998–99
89.287.886.8
46.4642.9838.95
Male Female All children
Early Educational Journey Table 5.5
S.No Category Dropout Rates (percent)
1984–85 1994–95 1996–97
1 Class I–V 46.80 20.0 -
2 Class I–VIII 58.45 46.8 35.0
Source: Nagaland State Plan of Action for Children

Nagaland State Human Development Report128
performance. Both factors are interconnected with student retention and dropout experience.
The Vicious Cycle of Failure
Two independent cycles in education, one at the individual level and the other at the community level, influence the educational experience and its impact on development. At the individual level, failure in educational performance leads to poor progression to higher education. Poor educational attainments can lead to dropping out of school or entry into compromised employment opportunities, leading to lesser income and relatively poor quality of living. In Nagaland too, with the poor pass rate at the Class X level, this vicious cycle of failure, with lower levels of education, leading to lower livelihood opportunities and lower income, has set in.
At the class X level, the pass percentage was only 35 percent for government schools in 1999, although this represents an improvement over the pass percentages of 14 percent in 1997 and 13 percent in 1998—in earlier years, the pass percentage of government schools in Mon, Tuensang and Wokha has been less than 10 percent. Only one out of three Naga students who appeared for the HSLC examination could pass and went for higher education. The performance of private schools was better, with pass percentage of 70 percent in 1999, nearly two times that of the pass percentage of government schools.
Though there has been improvement in the performance of both government and private schools, there were still 35 schools with nil pass results in the HSLC, during 2003. Among the ‘nil result schools’ Tuensang district recorded the highest with a total of 12 such schools. Phek (both government and private schools) and Zunheboto (private schools) were the only districts which did not record nil pass results. Most of the schools, reporting nil pass results had poor enrolment without feeder (middle) schools nearby. The involvement of the public was negligible. None of the schools had libraries. Managing Committee meetings were not held regularly. In response, the department has formulated a special 25-point intervention programme to reverse the trend.
Indicators Rural Urban Male Female Total
Percentage of children aged 36–59 months attending any pre-school learning centre
26.6 35.8 28.0 28.6 28.3
Percentage of children age 36–59 months attending any Anganwadi centre
25.1 1.7 18.6 21.0 19.9
Source: MICS, 2000. State Plan of Action for Children
Table 5.6 Status of Child Development Services

Acquiring Knowledge 129
When disaggregated by gender, boys have generally performed better than girls. Many in the State feel that vocational education should be re-introduced. The old streams of carpentry, needlework, weaving and black-smithy can be expanded to include subjects like nursing, agriculture and computer science, etc. This will allow the learning framework to be life skills related and will give students a wider choice of employment opportunities. Newer vocational education programmes need to be developed as an alternative to regular college-based education.
It is interesting to note that, as opposed to matriculation pass percentages, the percentage of students who pass at higher secondary level ranges from 60 percent to 80 percent. The arts and commerce stream students in private colleges perform better than those in government colleges. However, in the science stream, the performance of students in government colleges is much better. This
Year Appeared Pass Percentage
Male Female Male Female
1998 5894 4613 50.18 43.76
2000 6624 5536 51.76 44.74
2002 7747 7010 48.75 42.15
2003 3316 2470 59.77 65.42
HSLC Examination Pass Percentage Table 5.7
Source: Report of the Education Commission of Nagaland, 1999
Figure 5.5
Pass Percentage in HSLC Examination
100
80
60
40
20
0
Pass
Per
cent
age
Kohima Dimapur Mokokchung Mon Phek Tuensang Wokha Zunheboto State
1997 Govt Schools 1997 Private Schools 1999 Govt Schools 1999 Private Schools
18
.72
57
.38
48
.20
82
.17
45
.95
72
.66
47
.77
20
.8
37
.02
58
.7
42
.35
6.1
2
19
.92
69
.35
48
.62
25
.32
50
.44
70
.77
8.3
25
3.7
6
24
.65
69
.28
43
.78
10
.64
29
.92
60
29
.55
1.8
8
21
.43
50 5
2.6
21
3.8
4
35
.02
70
.21
Source: Nagaland State Education Board

Nagaland State Human Development Report130
could be linked to the quality of infrastructure and teaching available in both government and private sectors. With increasing expansion of educational infrastructure in the State, it will be crucial to ensure quality in government institutions and developing instruments of institutional monitoring in the private sector.
Education and Employment
Nagaland has had major success in improving its literacy rate. However, the high dropout rates at the high school and higher secondary levels is an area of concern. The success rate of students passing SSLC and higher secondary examinations has only been around 50 percent. This has created a situation of high unemployment on the one hand and stagnation in the higher education framework on the other hand. Of the total employed in Nagaland in the organised sector, the Government employs nearly 90 percent. However, the Government has restricted creation of more posts now in its efforts to ‘right-size’ its structure. At the same time, the private sector is still in its infancy and the lack of infrastructure and industry is unable to ensure sufficient employment opportunities for the youth. Vocationalisation of education and intelligent exploitation of inherent local talents and resources will help improve opportunities for better livelihoods and a return of work ethics and culture, which is so closely linked to productivity and quality of work.
II. Access to Education
Creating the Educational Base
Nearly five decades ago, the Constitution of India assured all children the right to free and compulsory education up to the age of 14 years. This milestone, to be achieved within 10 years of independence, still remains an unfinished goal and an area of concern. Article 46 of the Indian Constitution states, “the State shall promote with special care the education and economic interests of the weaker sections of the people, and in particular, of the Scheduled Castes and Scheduled Tribes”.
Since statehood in 1963, the Government of Nagaland has taken a number of steps to strengthen the educational base. The establishment of educational institutions on priority basis, provision of incentives for learning like scholarships, reservation of seats in higher educational centres, construction of hostels and development of libraries are some of the components that the Government has built into its integrated approach to promote education.
The growth in the number of educational institutions after the creation of Nagaland State has been significant. Table 5.8 reflects the growth between 1961 and 2000. At the beginning of the 21st century, Nagaland has nearly 1500 primary schools, 500 middle schools, 300 high schools and 16 higher secondary schools.
Source: Directorate of Higher & Technical Education, Nagaland, 2000
80
70
60
50
40
30
20
10
0
Figure 5.6
Comparative Results of XII Standard
Pass
Per
cent
age
Arts Commerce Science
Government Private
40
52
45
60
69
56

Acquiring Knowledge 131
The institutional framework has expanded particularly at the primary, middle and high school levels. Urban migration and demographic changes, however, have left many rural areas with fewer students and multiple schools. Hence, there is now a discussion about consolidation of primary schools in the rural areas.
At the same time, further expansion and strengthening has to be done to increase the reach at the higher secondary and college levels. This will ensure that added costs and dislocation due to distances do not hinder access to higher education for the school passouts and thus allow a better prospect for gainful employment and productive contributions to the society.
Higher Education
The first centre of higher education in Nagaland was the Fazl Ali College in Mokokchung, which was established in 1959. The Nagaland Campus of the North Eastern Hill University (NEHU) was established in 1978. It was only in 1994 that a full-fledged Central University was established to serve Nagaland. This university has seven postgraduate departments located at its Lumami campus, six departments in its Kohima campus, and 12 departments at the Medziphema campus. Nagaland University has come to provide the much-needed impetus to higher education, particularly in the areas of quality enhancement, research and diversification of specialty. The university has 42 affiliated colleges reaching out to over 15,000 students. A sum of Rs 25 crore has been sanctioned for development of infrastructure at Lumami, and for developing Kohima campus of the university as part of the PM’s economic package for Nagaland, announced by the Hon’ble Prime Minister during his visit to the State in October 2003.
The Government’s policy to provide one government college for each district came through in the Sixth and Seventh Plans, with the Government taking over six private colleges during the period. This expansion meant greater accessibility and educational coverage across the State. Greater demand for higher education has also led to an increase in the number of private colleges. The decadal growth of colleges has been the highest during 1991–2000. In 2000–2001 the State had nine government colleges and 33 private colleges. The district-wise distribution of private colleges is skewed, with most of the colleges concentrated in Dimapur and Kohima.
Growth of Educational Institutions Table 5.8
Particulars 1961–62 2000–01
University - 1
Colleges 1 42
Higher Secondary Schools
- 16
High Schools 13 315
Middle Schools 61 469
Primary Schools 522 1491
Source: Directorate of Economics and Statistics
Box 5.2
Centres for Higher Learning in North-Eastern States
North-East as a whole has l imited opportunities for higher education. The North-Eastern Hill University, Meghalaya, had till the establishment of the Nagaland University, covered Nagaland. Meghalaya, Assam and Manipur also are major centres for higher education in the North-East. While Assam has a major share of seven universities in the region, Manipur has two. The other North-Eastern states have only one university each.

Nagaland State Human Development Report132
While the choice of the students is mostly arts and humanities, the interest in science and technology is increasing. In terms of overall student distribution, 77 percent of the students are studying in private colleges. The streams available in different colleges show that 33 colleges have arts, 8 colleges have commerce and only three colleges have science, law and B Ed. subjects.
Nagaland has a large number of arts and humanities graduates with low percentage marks. An analysis of the examination result indicates that less than 5 percent students pass in first class in the arts and law streams while less than 10 percent pass in first class in science and commerce.
Technical Education
Technical education in Nagaland is still limited. Only two government polytechnics provide training to youth in the entire State. Nagaland is the only state in the North-East that does not have a medical or engineering college. It does not have any management institute either. The potential in information technology (IT) has still not been fully tapped. The absence of avenues for these technical streams in the State has translated into greater focus on non-technical streams and outflow of students to other centres of learning. It has also resulted in inadequacy of trained manpower in the State on the one hand, and high levels of educated unemployed on the other. The Central Government has agreed to the State’s proposal for a regional institute for IT in Kohima as part of the Prime Minister’s economic package for the State.
Students Seeking Higher Education Outside Nagaland
As per 2001 figures available with the Directorate of Higher and Technical Education, 24,000 students in the State were pursuing higher education. Of this number, nearly 10,000 students were studying outside Nagaland. This
Faculty Undergraduate Postgraduate
Men Women Men Women
Arts 5076 3968 161 134Science 503 207 75 16Commerce 679 129 14 7Education 81 83 12 45Law 199 81 - -Agriculture 145 80 43 23
Source : Nagaland University, 2003
Enrolment Status 2001–2002Table 5.10
State Number of Colleges
Engineering Medical
Arunachal Pradesh 1 ..
Assam 3 3Manipur 1 1Meghalaya 1 1
Mizoram 1 -
Nagaland - -
Sikkim 1 1
Tripura 1 -
Engineering and Medical Colleges in North-Eastern States
Table 5.11
District Number of Colleges
Government Private
Kohima 2 11
Dimapur 1 14
Tuensang 1 3
Mokokchung 1 3
Wokha 1 1
Phek 1 1
Zunheboto 1 -
Mon 1 -
Total 9 33
Source: Directorate of Higher and Technical Education
Colleges Affiliated to Nagaland UniversityTable 5.9

Acquiring Knowledge 133
has not only meant a significant number of students being away from the State for long periods but also the enormous financial resources that are being invested in pursuing education outside. This causes a drain on resources and a missed opportunity for utilisation of this resource domestically. Affordability and access to better education are creating a gap in the social fabric of Naga society. A big challenge that also comes with this is the lack of employment opportunities in the state. Better access to education directly influences opportunities for income and livelihood.
Research and Documentation
Research is one of the most significant dimensions of education, particularly higher education. There exists a symbiotic relationship between research and specialisation of knowledge and skills. Socially relevant research can bring solutions to the current problems of the society, which in turn, can assist the society to march ahead. This requires proper infrastructure, qualified researchers and social support. Research and documentation is an area which is limited today in Nagaland. Colleges are yet to undertake research work. Nagaland University has undertaken 121 researches during the last eight years of its existence, of which 43 were carried out by teachers. Lack of specialised courses and specialised papers within a course at college and university levels are major deterrents.
For quality improvement, the university has to undertake more research, teaching and teachers’ training at higher levels. SCERT, DIET and NBSE can benefit from research and strengthen their work in improving the educational experience in schools. At the higher education level, the involvement of students and teachers in research will help in documenting Nagaland’s history, current experience and needs in different sectors. Efforts should be taken to publish postgraduate and Ph.D theses of Naga students for wider use by the community. The interface between academia and the civil society can help in studying more accurately the development constraints in Nagaland.
Role of Private Sector
The private sector has played a pioneering role in the field of education. Beginning with the establishment of the first school and college in the State, it has also in recent years contributed to diversification of educational services. It has built on the rich social capital the Naga society possesses and continues to provide a benchmark for quality.
At college and secondary school levels, private institutions outnumber public institutions and enrich the educational infrastructure of the State. Some Indian states like Tamil Nadu, Karnataka, Maharashtra, Andhra Pradesh and Kerala have strengthened their educational infrastructure and quality by encouraging investments in the private sector. This has
For quality improvement, the university has to undertake more research, teaching and teachers’ training at higher levels.

Nagaland State Human Development Report134
allowed the creation of more opportunities for students and built better linkages between industry and education. Government support to the private sector institutions has been limited so far in Nagaland. It has mainly been involved in quality control and regulations. The Government of Nagaland could consider creating a model appropriate for the State, which allows for the increased participation of the private sector across different educational levels, including medical, engineering and business management.
Non-formal Education
Adult education covers the population in the age group 15–35 years. Nagaland, in line with the national programme, also launched the Farmers’ Functional Literacy Programme (FFLP), which was later revised as the Rural Functional Educational Programme (RFLP) in 1979, targeting the rural population. The State also established its Institute of Adult Education. This was one of the first areas of cooperation between the governmental and non-governmental organisations. However, due to dependency on Central programmes and funds, the activities in this sphere have been limited.
III. Quality of Educational Experience
“Education – A dream?”
“Parents want their children to be educated, but economy is a constraint.
Children want to be educated, but for what, is the big question.
Teachers try to impart education, but on quality and purpose they wander.
Government aims at the best education, but the best of what type?
Social environment should be congenial, but the present demotivates education.
Economic environment should be so sound, but working environment is missing.
Political environment should be stable, but uncertainty prevails everywhere.”
This reflection by a Naga youth provides a wider and deeper framework for taking stock of where education stands today and the many challenges it faces. Nagaland is in the midst of collective thinking and action to overcome some of these challenges to education.
School enrolment and academic performance are areas of concern. Close monitoring of schools and improvement in the quality of education are a must, particularly in interior areas like Mon and Tuensang. The role of teachers is critical in human development. Their competency needs to be developed and enhanced to the maximum. Given right training and incentives, the teaching community can produce the required results.
In a survey conducted by the State Education Commission, both the teachers and students felt that the syllabus was too vast. They also felt the school calendar should have at least 200 working days. In the past, the school was the first casualty of any law and order problem.
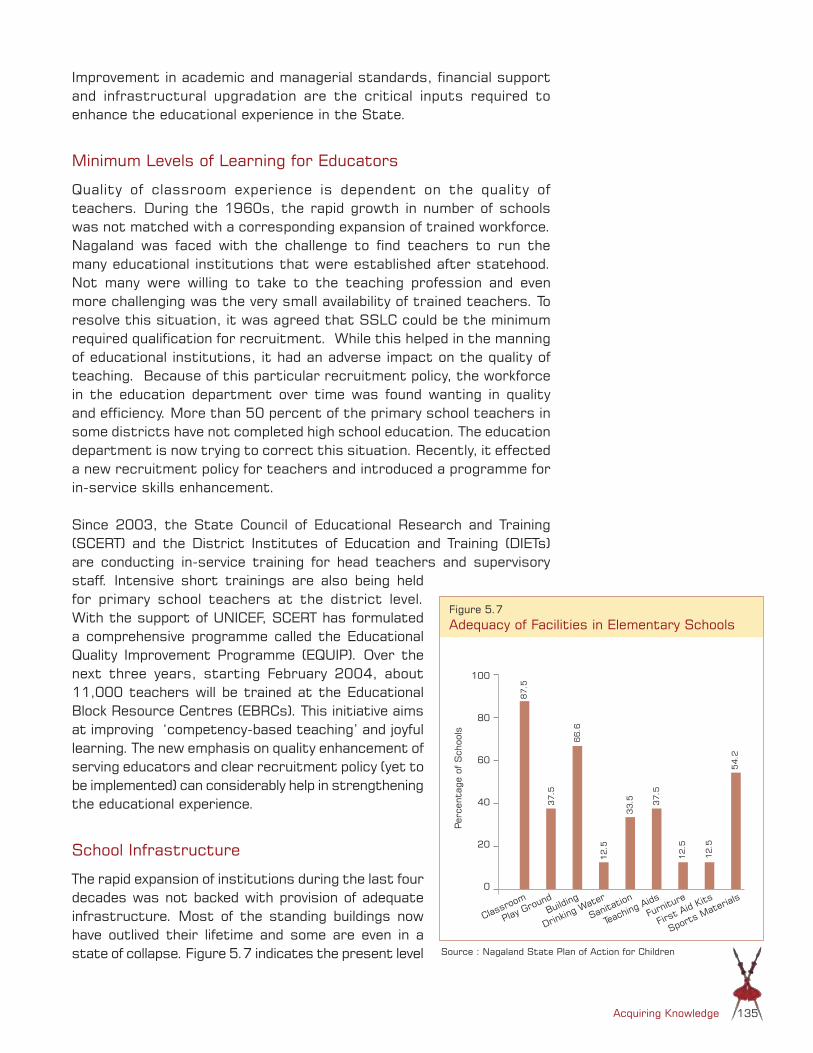
Acquiring Knowledge 135
Improvement in academic and managerial standards, financial support and infrastructural upgradation are the critical inputs required to enhance the educational experience in the State.
Minimum Levels of Learning for Educators
Quality of classroom experience is dependent on the quality of teachers. During the 1960s, the rapid growth in number of schools was not matched with a corresponding expansion of trained workforce. Nagaland was faced with the challenge to find teachers to run the many educational institutions that were established after statehood. Not many were willing to take to the teaching profession and even more challenging was the very small availability of trained teachers. To resolve this situation, it was agreed that SSLC could be the minimum required qualification for recruitment. While this helped in the manning of educational institutions, it had an adverse impact on the quality of teaching. Because of this particular recruitment policy, the workforce in the education department over time was found wanting in quality and efficiency. More than 50 percent of the primary school teachers in some districts have not completed high school education. The education department is now trying to correct this situation. Recently, it effected a new recruitment policy for teachers and introduced a programme for in-service skills enhancement.
Since 2003, the State Council of Educational Research and Training (SCERT) and the District Institutes of Education and Training (DIETs) are conducting in-service training for head teachers and supervisory
Figure 5.7Adequacy of Facilities in Elementary Schools
Source : Nagaland State Plan of Action for Children
100
80
60
40
20
0
Per
cent
age
of S
choo
ls
Classroom
Play Ground
Building
Drinking Water
Sanitation
Teaching Aids
Furniture
First Aid Kits
Sports Materials
87.5
37.5
66.6
12.5
33.5 37.5
12.5
12.5
54.2
staff. Intensive short trainings are also being held for primary school teachers at the district level. With the support of UNICEF, SCERT has formulated a comprehensive programme called the Educational Quality Improvement Programme (EQUIP). Over the next three years, starting February 2004, about 11,000 teachers will be trained at the Educational Block Resource Centres (EBRCs). This initiative aims at improving ‘competency-based teaching’ and joyful learning. The new emphasis on quality enhancement of serving educators and clear recruitment policy (yet to be implemented) can considerably help in strengthening the educational experience.
School Infrastructure
The rapid expansion of institutions during the last four decades was not backed with provision of adequate infrastructure. Most of the standing buildings now have outlived their lifetime and some are even in a state of collapse. Figure 5.7 indicates the present level

Nagaland State Human Development Report136
of infrastructure facilities—87.5 percent of the schools have adequate classrooms and only 37.5 percent schools have playgrounds. The support facilities, in terms of sanitation and water supply, are very limited. The lack of sports facilities, recreation opportunities and space are major concerns.
Special focus is needed on maintenance, infrastructure repair, renovation, extension, and construction of new buildings and other physical facilities as well as equipment, libraries, laboratories, etc. The centrally sponsored Sarva Shiksha Abhiyan (SSA) is beginning to provide the much needed funding for buildings and other facilities.
Physical Education Facilities
In addition to the general school and classroom environment, an important dimension of co-curricular programmes is the provision of physical education opportunities. Nagas have always shown keen interest in physical activities and sports. Physical education teachers are currently provided to middle, high and higher secondary schools. While personnel have been provided, playgrounds have not been provided to a significant number of institutions. There is only one sports school in the State, run by the Sports Authority of India, in association with the Directorate of Youth Resources and Sports. Enhanced physical education facilities will not only open up new avenues for recreation, talent tapping and recognition but also help in weaning away the youth from the deleterious consequences of alcoholism and drug addiction. Nagaland also has a long tradition of indigenous games and sports. Special programmes must be conceptualised to nurture and promote this tradition.
Medium of Education
One of the major issues in education is the medium of education. Nagaland faces a unique complexity in the sense that it has many languages and dialects in spite of a relatively small population. For instance, the Konyak tribe in Mon district is reported to have as many as 29 dialects. Ideally, at the primary level, children should be taught in the mother tongue and not through a common medium of instruction. This has a bearing on the recruitment, transfer and posting policies for primary teachers, as they should know the language or dialect of the village or town where the school is located. For the sake of uniformity, English is being encouraged as the medium of instruction at the primary levels.
Vocationalisation of Education
The provision of time and space for co-curricular activities aimed at skill enhancement can help nurture work culture. In the past, needle-work, gardening, carpentry and weaving formed part of the classwork in many schools. The revival of such activities will make the learning experience more life-related and help reconnect with traditional skills. Along with
Enhanced physical educational facilities will not only open up new avenues for recreation, talent tapping and recognition but also help in weaning away the youth from the deleterious consequences of alcoholism and drug addiction.

Acquiring Knowledge 137
these, introduction of computer science, nursing, agriculture and other vocational streams even in classes XI and XII can help the students get early exposure to vocational streams. This could also influence their performance and higher education choices. The existing two polytechnics must be revitalised and more trades introduced.
World Bank assisted Third Technician Project
Initiated in January 2001, the project covers two existing and one new polytechnic in Nagaland. The project has three components: Capacity building and expansion to provide increased access to
technician education; Quality enhancement of education to produce better trained
technicians; and Efficiency improvement through better planning, granting institutional
autonomy and networking.
The progress made so far includes introduction of new curriculum for Diploma in Civil Engineering, Electrical Engineering, Mechanical Engineering and Modern Office Practice. A new Institute of Communication and Information Technology has been established and a programme for Diploma in Computer Application has been introduced. Under the staff development programme, 61 staff have been trained so far. In collaboration with the Indian Institute of Entrepreneurship, the state project-implementing unit has finalised an entrepreneurial development programme to encourage self-employment. Network partners from outside Nagaland have also been identified for the Khelhoshe and Atoizu polytechnics.
Nagaland enjoys the advantage of familiarity with the English language. Most students at the higher education levels are well versed in English. This comparative strength, along with technical know-how in computers, can open employment opportunities in the services sector. Even within the State, there is wide scope for employment opportunities in medical and nursing sector, higher education, management, computer science, electronics, biotech, engineering, law, teaching, technology-based service sector, tourism and engineering-based industries. The academic and research fields will also greatly benefit if more Nagas are encouraged to join this stream.
IV. Policy Initiatives and Implications
The Department of School Education employs over 18,000 people and another 300 are employed by the Department of Higher and Technical Education. This number is second only to the staff strength of the State Police Department. Management and administration of educational institutions and personnel is an important area of attention and action. Restructuring of the administrative machinery is being done in tandem with Communitisation. Training of administrators and community representatives engaged in the field of education will be crucial in improving efficiency.
Most students at the higher education levels are well versed in English. This comparative strength, along with technical know-how in computers, can open employment opportunities in the services sector.

Nagaland State Human Development Report138
Box 5.3
What Stakeholders of Education in Nagaland Think
A survey carried out by the Education Commission of Nagaland recorded the following responses from the three important stakeholders in education: people, teachers and administrators.
People’s response
External interference in teachers’ recruitment and transfers, including that by the political leaders, should be stopped.
Lack of familiarity with local mother tongue amongst primary school teachers be remedied by appointment of teachers from the local areas.
Students’ participation in too many social and religious activities results in the neglect of studies. Education Board be set up for each school. Textbooks are changed too often and are not uniform. Parents’ participation should be increased. Social status of teachers should be raised. NGOs like student bodies should be represented in school management. Monitoring and evaluation of schools should be carried out. Teachers should be recruited through competitive examinations. Hostels should be constructed. Mid-day meal programme should be properly implemented. Competitive spirit amongst students needs to be promoted. Provision should be made for vocational subjects, physical education and cultural activities. Conduct examinations more regularly.
Teachers’ response
Only one-third of the teachers felt that the curriculum was good in class 1–8. This percentage decreased as the class levels increased.
50 percent of the teachers were satisfied with the present textbooks while one-third said that the textbooks were unsatisfactory.
Nearly two-third said that examinations should be held thrice a year. Around 15 percent supported the idea of monthly internal assessment of students.
20 percent of the teachers felt that the medium of instruction should be the mother tongue till Class 4 25 percent of the teachers felt that under language study, mother tongue should be taught till Class 10. 50 percent favoured the possibility of students taking additional private tuitions.
Administrators’ response
More coordination between the three Directorates, the SCERT and the NBSE. The general response from rural areas has been neglected and lack of focus on educational administration in
the villages and small towns. Slow implementation of projects. Parallel cells for vocational education, science and mathematics exist in both SCERT and DSE. The inter-departmental meeting that was organised by the Commission showed that the agency had its own
grievances as well. The areas of concern included facilities to get grants, the policy on opening, upgrading and de-recognition of schools, development and production of institutional packages, policy dissemination and policy follow-up, supervision and evaluation.
Source: Education Commission Report, 1999
The State Council of Educational Research and Training (SCERT) is the apex academic body in Nagaland and has been functioning as an independent directorate since 1986. It acts as the agent of change and improvement of school and teacher education. The SCERT prescribes the curriculum, provides textbooks to schools and teacher institutes as well as conducts pre-service and in-service training for teachers. Its role is to ensure quality of education in schools. It has 11 cells for operational purposes.

Acquiring Knowledge 139
In nearly two decades of its existence, it has developed 50 textbooks for primary and elementary levels of education as well as a number of guidebooks for teachers. It has also been able to train about 50 percent of in-service teachers in the State. Part of the training has involved Computer Literacy and Studies in School (CLASS). Two of the more significant achievements of the SCERT have been the standardisation of textbooks and fixing their costs. Since SCERT’s intervention, the costs of textbooks have come down by about 50 percent. Assisting the SCERT are the DIETs and the Nagaland College of Teacher Education, especially in the areas of revising curriculum, standardising textbooks and teacher training at elementary and secondary levels.
Communitisation of Education
Qualitative improvement in Nagaland’s educational landscape is a priority area of the Government. The State sees the participation of the community as a major resource in making this vision possible. Therefore, the Government has introduced the Communitisation initiative, under the Nagaland Communitisation of Public Institutions and Services Act, 2002, in the field of education. Under this Act, certain responsibilities like management of academic, administrative and financial resources of the communitised schools have been transferred to the village communities through the Village Education Committees (VECs). The objective is to help create a sense of ownership of public institutions and better management of resources. The main goal of this initiative is to “develop institutions of excellence with the active participation of the community, the teachers and the support of the Government”.
Building up of a synergistic relationship between the Government and the community to spur growth and development of institutions is one of the anticipated outcomes. The VEC is empowered to control teachers in a variety of ways, including the operation of the principle of ‘no work, no pay’. The community gets funds for key purposes, such as purchase of textbooks, furniture, repair of school buildings, etc. The Government continues to supervise, support and supplement the activities. Communitisation, thus, ensures investment of community’s social capital for betterment of the schools and improvement of education through better management of Government’s resources and its personnel with community participation and empowerment.
The salient features of the Communitisation of elementary education are: In every communitised village, a VEC has been constituted. Communitisation empowers the village community to own and
to develop the government elementary schools in the village as their own. The VEC is the legal local authority for management of elementary education in the village.
Salaries of school employees are deposited in the VEC account by the Government, in advance, to enable the VEC to make payment
The VEC is empowered to control teachers in a variety of ways, including the operation of the principle of ‘no work, no pay’.

Nagaland State Human Development Report140
on the first of every month. Other funds for purchase of textbooks, furniture, repair of buildings, etc., are, likewise, deposited in the VEC account by the Government. For other needs, the VEC mobilises funds independently.
VEC ensures discipline of the students and regularity of teachers. It is empowered to deduct salaries for absences of teachers after observing prescribed formalities. Any such deduction is utilised for needs of the school.
VEC may arrange for inter-school utilisation of teachers and other resources, such as building, within the village schools, including the private one.
VEC is empowered to select and recommend appointment of substitute teachers against long-term vacancies.
VEC may engage local craftsmen/artisans or experts in folk songs and games on voluntary basis or on payment of a token honorarium for teaching in the schools.
VEC is responsible for universal enrolment and retention of children up to the age of 14 years.
Government retains power to supervise/support the VEC, and whenever deemed necessary, to issue directives which will be binding on the VEC.
A new culture of social audit of public institutions is thus, being established. Each VEC has to compile an annual report of activities and have its finances audited. This platform for local leadership has also seen sharing of facilities between private and public schools. While the Government is still the formal employer of teachers, the VEC’s new power has begun to impact the quality of education. The extension of financial responsibility to the VEC has also meant more accountability amongst teachers to local village communities and efficient utilisation of resources.
Mobilising people’s resources, the education sector has opened up opportunities to improve the reach and quality of education. The VECs’ monitoring at the micro-level includes areas like annual planning and execution of academic and co-curricular school activities. It has the power to deal with problems linked to administration, supervision and management of the school. This day-to-day participatory monitoring is already beginning to show results. Attendance of teachers and students is better. Enrolment and examination results show tremendous improvement. Other achievements include availability of textbooks, community contributions through cash and kind, evening tuition to students free of cost, regular tests, renovation of buildings, furniture, footsteps, school grounds and compounds, construction of teachers’ common room and initiatives for dropouts to rejoin
Box 5.4
Rusoma’s Success Story
The village is well known for the legend of Sopfunuo, who turned into a stone. Rusoma, which is 11 km away from Kohima, has a population of 2000, with 403 households. Despite the existence of three schools, education did not make an impact on the village because of neglect and lack of proper management.
Since communitisation in September 2002, the following changes were observed: 1. The village community is much more
involved in educational activities today. The VEC has shown sincerity and dedication in its work.
2. Enrolment has increased in the Government Middle School
from 13 in 2001 to 38 in 2002 and to 62 in 2003.
in Government Primary Schools at Thephezou , from 20 in 2002 to 52 in 2003 and at Ruso Bawe from 37 in 2002 to 73 in 2003.
3. Annual ESL examination results showed remarkable progress: 2001: nil result. 2002 result showed 80 percent
success.4. Attendance of staff and students
improved.5. As per resolution of VEC, school
uniform has been compulsorily introduced in all the three schools.
6. Applying the principle of ‘no work, no pay’, the VEC deducted from the salary of errant teachers and the money so deducted was utilised for repair work of the schools.
7. Renovation and repairs of the school buildings were undertaken by the community through contribution of money, materials and free labour.
Source: First Year of Communitisation of Elementary Education in Nagaland 2002–03; Government of Nagaland

Acquiring Knowledge 141
school. In view of the overwhelming support and response from the communities and record of success in its first year, the State Government has decided to communitise all elementary schools in the State.
The President of India, Dr A.P.J. Abdul Kalam, visited Khuzama (Kohima district) during October 2003. He expressed happiness over the successful implementation of the Communitisation programme. He said that the initiative would bring greater accountability, sense of responsibility and belongingness among the people. He went on to say, “Once the whole State is brought under the Communitisation programme, it would be a model for the whole country to follow.”
Communitisation: A Vehicle for Sarva Shiksha Abhiyan
The Sarva Shiksha Abhiyan (SSA) is a national effort to universalise elementary education through community-based quality education. A centrally sponsored programme, SSA’s objective is to fulfil the constitutional obligation of universalisation of elementary education by 2010. SSA finds mention in the UNICEF’s State of the World’s Children Report, 2004, in the list of best practices across the world as one of the more successful steps towards improvement of education of the girl child.
The SSA does not aim to create new structures, but to reinforce the existing ones of the Government. It is a funding agency of the Government for timely support to elementary schools through the village communities. The Communitisation of educational institutions has put in place an effective local educational authority, i.e., the Village Education Committee, which represents the community and has legal sanction. Thus, the SSA and the system of Communitisation create synergies for strengthening and enriching the process of universalisation of elementary education, and quality upgradation through people’s participation.
Expenditure on Education
Public spending on education is critical for improving literacy levels. Successive studies have shown that expenditure on education, and its intra-allocation, has a direct bearing on the literacy level. Government of India, therefore, recommends expenditure of 6 percent of the GDP at the national level as the desirable level of public investment in education. The recommended share of elementary education is 65–70 percent to achieve universal literacy. During 2002–03, out of a total budget of Rs 2060.41 crore, the Government of Nagaland spent Rs 218.41 crore on school, college, and technical education. This worked out to be 10.6 percent of the total budget outlay. Of this amount, Rs 191.48 crore were on school education, and Rs 26.95 crore on higher and technical education. In the school sector, the biggest component of the expenditure was on salaries. Similar is the position in the sectors of higher and technical education.
“Once the whole State is brought under the Communitisation programme, it would be a model for the whole country to follow.”
– Dr A.P.J.Abdul Kalam, President of India,
October 2003, Kohima.
Box 5.5
Objectives of Sarva Shiksha Abhiyan
All children in school by 2003.
All children complete five years of primary schooling by 2007.
All children complete eight years of elementary schooling by 2010.
Focus on elementary education of satisfactory quality with emphasis on education for life.
Universal retention by 2010.
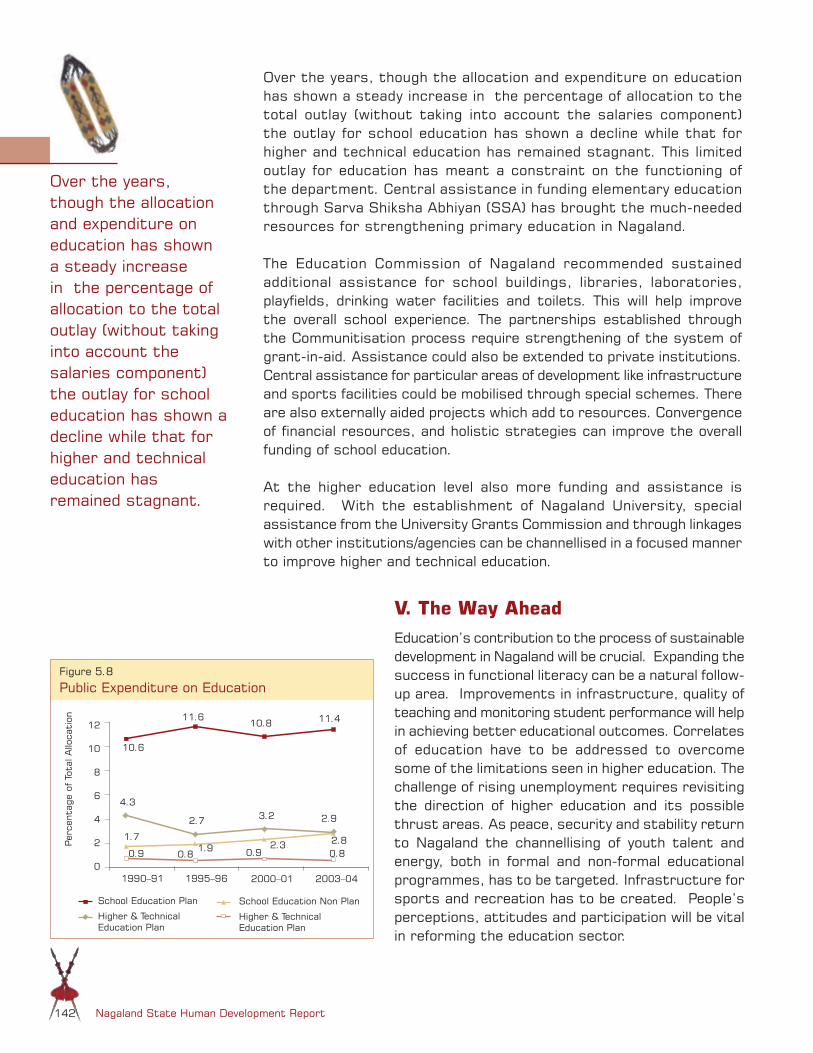
Nagaland State Human Development Report142
12
10
8
6
4
2
0
Per
cent
age
of T
otal
Allo
cati
on
2000–01 2003–04
School Education Non Plan
Higher & Technical Education Plan
10.8 11.4
3.2 2.9
2.80.8
2.30.9
Figure 5.8
Public Expenditure on Education
1990–91 1995–96
School Education Plan
Higher & Technical Education Plan
10.6
11.6
4.3
2.7
1.90.8
1.7
0.9
Over the years, though the allocation and expenditure on education has shown a steady increase in the percentage of allocation to the total outlay (without taking into account the salaries component) the outlay for school education has shown a decline while that for higher and technical education has remained stagnant. This limited outlay for education has meant a constraint on the functioning of the department. Central assistance in funding elementary education through Sarva Shiksha Abhiyan (SSA) has brought the much-needed resources for strengthening primary education in Nagaland.
The Education Commission of Nagaland recommended sustained additional assistance for school buildings, libraries, laboratories, playfields, drinking water facilities and toilets. This will help improve the overall school experience. The partnerships established through the Communitisation process require strengthening of the system of grant-in-aid. Assistance could also be extended to private institutions. Central assistance for particular areas of development like infrastructure and sports facilities could be mobilised through special schemes. There are also externally aided projects which add to resources. Convergence of financial resources, and holistic strategies can improve the overall funding of school education.
At the higher education level also more funding and assistance is required. With the establishment of Nagaland University, special assistance from the University Grants Commission and through linkages with other institutions/agencies can be channellised in a focused manner to improve higher and technical education.
V. The Way Ahead
Education’s contribution to the process of sustainable development in Nagaland will be crucial. Expanding the success in functional literacy can be a natural follow-up area. Improvements in infrastructure, quality of teaching and monitoring student performance will help in achieving better educational outcomes. Correlates of education have to be addressed to overcome some of the limitations seen in higher education. The challenge of rising unemployment requires revisiting the direction of higher education and its possible thrust areas. As peace, security and stability return to Nagaland the channellising of youth talent and energy, both in formal and non-formal educational programmes, has to be targeted. Infrastructure for sports and recreation has to be created. People’s perceptions, attitudes and participation will be vital in reforming the education sector.
Over the years, though the allocation and expenditure on education has shown a steady increase in the percentage of allocation to the total outlay (without taking into account the salaries component) the outlay for school education has shown a decline while that for higher and technical education has remained stagnant.
Acquiring Knowledge 143
The Communitisation initiative has created the policy framework for bringing about substantial improvement in the quality of education. It has also raised the expectations of people. Sustaining this framework of collaboration through maintaining people’s interest over time will be key to its success. Meanwhile, the Government has formulated an elaborate training and capacity building exercise for the VEC members. Familiarisation of all involved with the process and a participatory framework of monitoring and evaluation will be central to ensuring its forward progression.
The focus of Nagaland’s endeavours should centre on providing education to all children in the State. It must also ensure, through innovative ideas and experiments, that the educational experience not only remains a tool of learning but also contributes to growth and development of the students as individuals and prepares them to contribute towards prosperity of the State and society.
Some important initiatives envisaged in the area of education are described below:
Education and Society
Develop strategies to raise literacy levels to 100 percent. Focused approach for increasing literacy levels in the districts lagging behind, such as Mon and Tuensang.
Develop retention strategies to change the present dropout experience.
Create Social Action Groups to support youth and children in difficult circumstances.
Probe into and reduce the inter-district disparities in the quality of educational experience.
Encourage the school authorities to make regular assessment of the students’ performance and share it with parents.
Encourage innovations and develop system for reward/recognition for innovative headmasters/headmistresses.
Encourage regular assessment of students’ performance and share with parents.
Access to Education
Rationalise the existing structure of education system. Merger and consolidation of educational institutions in areas where unplanned establishment/upgradation of institutions has taken place.
Encourage research at university/higher education levels and facilitate dissemination of the findings within and outside the State.
Strengthen knowledge and database. Strengthen the existing polytechnics. A variety of skills are needed
and the training courses have to be more dynamic and incorporate training in industries. Linkages need to be built for placement and providing employment on completion of courses.
He who learns from the past is wise.He who draws inspiration from success is enlightened. He with a vision for his people is motivated. He who is motivated pursues until the goal is reached.
‘First Year of Communitisation of
Elementary Education in Nagaland’; Government of Nagaland

Nagaland State Human Development Report144
Colleges and technical institutes need to re-orient with the changing environment. They have to initiate linkages with national institutes to help reduce their burden of expenditures on specialised infrastructure.
Building synergies between the public and private sector. Establish technical institutions such as medical and engineering colleges,
biotech engineering, and management institutes in the State.
Quality of Educational Experience
Develop strategies for enriching quality of classroom experience. Implement recruitment policies for teachers. Motivate and improve deployment of teachers, inspection and
supervision of schools, especially in remote areas. Enhance teachers’ training and evaluation, update curriculum and
textbooks on regular basis. Sustained intervention to build infrastructure in the existing
institutions; higher expenditure on capital account to be provided for buildings, libraries, laboratories, playfields, drinking water, toilets, etc.
Capacity building of the community to be encouraged for better management and to create informed and vigilant communities who act as pressure groups to ensure that their wards are provided with adequate physical, social and academic environment in schools and colleges.
Promote vocationalisation of education through establishment of technical schools/vocational education centres for work-oriented training in multiple courses with multiple entry points, and multiple duration for students on completion of class VIII course and above.
Encourage private sector to participate in vocational training endeavours.
Reorient attitude of students and develop professional ethics to fit into the world of work.
Create avenues of employment in both public and private sectors and for self-employment.
Policy Initiatives
Develop an Education Policy for the State. Sustained support for three-pronged strategy of Communitisation,
EQUIP and SSA . Strengthen coordination among concerned education departments. Develop channels of evaluation, monitoring and feedback by VECs to
improve quality of education. Build competence of supervisory officers to strengthen Government-
community partnership. Increase real investments in education. The norm of earmarking 6
percent of State outlay for education sector, with 50 percent for primary education, should be adhered to.

Chapter 6
Empowering Women

Nagaland State Human Development Report146
I STATUS OF WOMEN: AN OVERVIEW 147 Literacy 149
Health 149
Income and Livelihood 150
Women and Marriage 151
Violence Against Women 151
II TRADITIONS AND GENDER BASED ROLES 152 Traditional Governing System 152
Land and Inheritance 152
Naga Women’s Views on Land 153
III NEW CHANGES AND POLICY INFLUENCES 154 Democratic Governance 154
Representation of Women in Governance 155
Policy Interventions 156
Nagaland State Policy for Empowerment of Women, 2003 156
IV STRATEGIES FOR BETTER INCOME AND LIVELIHOOD 157 Strengthening Agricultural Practices 157
Small Scale Industry 159
Women’s Entrepreneurship 160
Education Linked Opportunities 161
Role of Non-Government Organisations 163
V THE WAY AHEAD 164 Conflict and Peace Building 164
HIV/AIDS 164
The Road Map 165
Education 165
Health 165
Income and Livelihood 165
Crime Against Women 166
Governance 166

Empowering Women 147
T his chapter on women’s empowerment gives a broad overview on the status of women in Nagaland through the
lenses of education, health, income and livelihood. It revisits the past and looks at the traditional roles of Naga women in order to give a clearer perspective. It examines the changes and new opportunities before them, policy interventions of the Government and the special challenges facing Naga women.
Empowering women has become integral to the new approach in promoting sustainable human development. At the historic Millennium Development Summit in September 2000, world leaders pledged to promote gender equality and empowerment of women as a goal for sustainable development as well as an instrument to achieve all the other Millennium Development Goals. The Global Human Development Report 2003 advocates that “Gender equality is at the core of whether the Millennium Development Goals will be achieved—from improving health and fighting disease, to reducing poverty and mitigating hunger, to expanding education and lowering child mortality, to increasing access to safe drinking water, to ensuring environmental sustainability.”
I. Status of Women: An Overview
The discourse on the status of women in India is both interesting and complex. There are discussions on the honoured position of women in Indian religions and culture, and at the same time, concerns about the poor status of Indian women in education, health, income and livelihood, and decision-making. While both these streams of view can form part of the spectrum on the status of women in India, it will be important to look at this generalised information in a disaggregated way. While statistics do not say everything, they reflect experiences and trends. For instance, the declining sex ratio has been a concern for India. Modern technology and education have not been able to reverse this trend. Some, in fact, argue that selective technologies have assisted in perpetuating some of these age-old practices, which are adverse to the girl child and infants. Each state of India combines in it distinctive linguistic roots, cultural practices, social norms and gender-centred experiences. India’s North-East provides an even more spectacular scenario because it is the meeting point of two important races of the world. The tribal composition too is multiple and multi-faceted. What this can mean to the country is a subject still to be properly explored.
Nagaland is a State that does not conform to the general perception of women’s status in India. Apart from traditional practices that have generally cared for women and the girl child, the State has successful achievements in the fields of literacy, increasing sex ratio, health and entrepreneur development. It is in this context that Mrs Nini
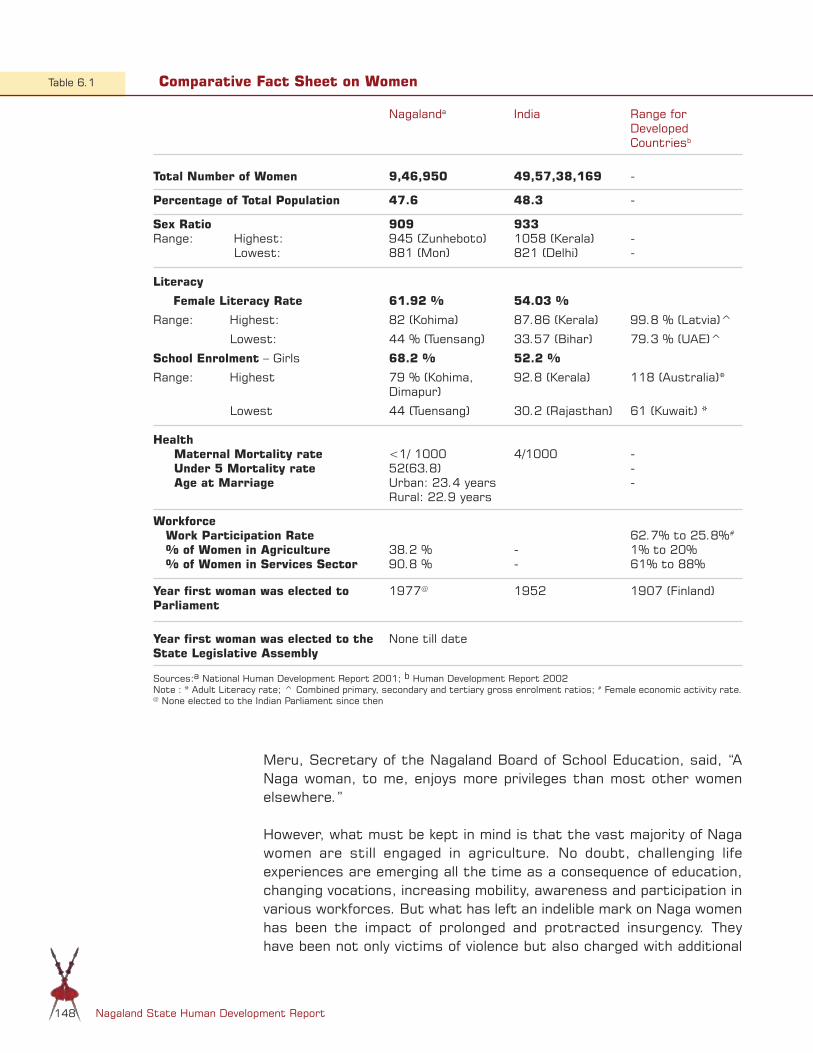
Nagaland State Human Development Report148
Meru, Secretary of the Nagaland Board of School Education, said, “A Naga woman, to me, enjoys more privileges than most other women elsewhere.”
However, what must be kept in mind is that the vast majority of Naga women are still engaged in agriculture. No doubt, challenging life experiences are emerging all the time as a consequence of education, changing vocations, increasing mobility, awareness and participation in various workforces. But what has left an indelible mark on Naga women has been the impact of prolonged and protracted insurgency. They have been not only victims of violence but also charged with additional
Nagalanda India Range for Developed Countriesb
Total Number of Women 9,46,950 49,57,38,169 -
Percentage of Total Population 47.6 48.3 -
Sex RatioRange: Highest: Lowest:
909945 (Zunheboto)881 (Mon)
9331058 (Kerala)821 (Delhi)
--
Literacy
Female Literacy Rate
Range: Highest:
Lowest:
School Enrolment – Girls
Range: Highest
Lowest
61.92 %
82 (Kohima)
44 % (Tuensang)
68.2 %
79 % (Kohima, Dimapur)
44 (Tuensang)
54.03 %
87.86 (Kerala)
33.57 (Bihar)
52.2 %
92.8 (Kerala)
30.2 (Rajasthan)
99.8 % (Latvia)^
79.3 % (UAE)^
118 (Australia)*
61 (Kuwait) *
Health Maternal Mortality rate Under 5 Mortality rate Age at Marriage
<1/ 100052(63.8)Urban: 23.4 years Rural: 22.9 years
4/1000 ---
Workforce Work Participation Rate % of Women in Agriculture % of Women in Services Sector
38.2 %90.8 %
- -
62.7% to 25.8%#
1% to 20%61% to 88%
Year first woman was elected to Parliament
Year first woman was elected to the State Legislative Assembly
1977@
None till date
1952 1907 (Finland)
Sources:a National Human Development Report 2001; b Human Development Report 2002Note : * Adult Literacy rate; ^ Combined primary, secondary and tertiary gross enrolment ratios; # Female economic activity rate. @ None elected to the Indian Parliament since then
Table 6.1 Comparative Fact Sheet on Women

Empowering Women 149
responsibilities of supporting their families and communities to cope with the adverse impact of violence. Naga women have played a pivotal role, individually and collectively, in helping their communities survive and in enabling human development across Naga society.
The fact sheet above shows some of the areas of strength with high literacy rates, low maternal mortality, rising sex ratio and a quality of life in general better than the national average. However, there are also areas where interventions are required like employment generation, higher education for women, financial support for women’s development, social problems, including violence against women, health problems, including HIV/AIDS and substance abuse.
Literacy
While the female literacy rate of Nagaland is above the national average, it is still far behind those of developed countries where almost entire populations can read and write. Within the State itself, there is a wide disparity in the literacy rates. Districts like Mon and Tuensang have female literacy rates of 37.12 percent and 46.12 percent only as per 2001 figures, in sharp contrast to districts like Mokokchung, Wokha and Dimapur (82.20%, 76.46% and 73.34%). Some of the reasons for this growth in literacy, in a short span of time, include the introduction and subsequent social acceptance of education in the wake of Christian missionaries, who laid equal emphasis on education, irrespective of gender. It is noteworthy that the first primary school opened by the Christian missionary Mrs. Mary Mead Clark at Molungyimsen was for girls.
The school enrolment rates for girls in Nagaland is higher than the national average, although it is still not comparable with the most literate states in the country. This reflects on the potential of Naga women to attain better educational qualifications and hence better economic and social status. However, the lack of vocational education at school and college levels is a cause of serious concern.
Health
Though the age at marriage among Naga women is much higher than in other states, the high fertility rate causes concern. There is a strong gender bias in the use of contraceptives. For instance, the terminal methods are usually used by women only. NFHS II found that none of the sampled women reported male sterilisation as the method of contraception. Use of contraceptives is essential for spacing and has a direct bearing on the health of women. Compounding the problem, most deliveries are still home-based without assistance of trained health personnel. Anaemia, due to worm infestations and frequent pregnancies, is common among women of childbearing age. There are other areas of concern such as the high infant and under-five mortality rates and
Mon
Dimapur
Kohima
WokhaTuensang
Zunh
ebot
o
Mok
ochu
ng
Phek
Figure 6.1
Female Literacy Rate Pattern
Less than 60%
More than 80%
60% –80%
Source: National Family Health Survey, 1998–99
Figure 6.2
Anaemia Among Naga Women
No Anaemia 61%
Severe Anaemia 1%
Moderate Anaemia 10%
Mild Anaemia 28%

Nagaland State Human Development Report150
Box 6.1
Positive Sex Ratio: Mokokchung’s Achievements
The Registrar General of Census Operations of India in a recent release on Children’s Day informed that the deficit of women in India’s population had risen from 3 million in 1901 to 35 million in 2001. In the last decade alone the child sex ratio decreased from 945 in 1991 to 927 in 2001. Sex ratio is defined as the number of females per 1000 males in the population. The faster pace of decrease in the sex ratio, particularly in the 0 to 6 age group is a matter of great concern. The report also listed the top ten districts of the country which demonstrated healthy child sex ratios. Mokokchung district with a child sex ratio of 1004 was one of the top ten districts in India with a positive sex ratio.
low coverage of preventable medicines. HIV/AIDS and substance abuse have now brought their own dangers, affecting not just individuals but entire families.
On the positive side are improving sex ratios, absence of female foeticides and low maternal mortality rate. There are almost no cases of malnourishment among women and children. They are not discriminated against as far as availability of food and access to them are concerned.
Income and Livelihood
The vast majority of Naga women are engaged in agriculture and allied sectors, such as minor forest produce (MFP) and cultivating various kinds of cereals, vegetables, etc. Most village women, many of them single-parents, have few resources of their own and no other source of earning hard cash, except through whatever they collect from the forest or the little extra they get from cultivation, which they bring to the towns and sell.
Around 70 percent of women are involved in agriculture. Generally, all the sowing, harvesting, etc., in the field are done by women, who also do the household chores. Women’s participation in the manufacturing sector is as low as 6 percent. Participation in the services sector is 14 percent, out of which only around 7 percent are professionals.
Nevertheless, women’s contribution to family earnings, in financial terms, is lesser and not commensurate with the amount of work they do. This is because their work is usually not calculated as income. The nature of their work is mainly household or they work in their own fields, for which no financial remuneration is given. In the tertiary
Distribution of Women by Employment Characteristics
Table 6.2
Employment Characteristics Percentage distribution of ever married women in age 15–49 years
Employment Status
Currently working 62.8
Worked in past 12 months (not currently working) 1.1
Not worked in the past 12 months 36.1
Type of Earning
Cash only 27.7
Cash & kind 12.1
Kind only 14.3
Not paid 46.0
Occupation (for currently working and women who worked in past 12 months)
Professional 7.3
Sales worker 5.2
Service worker 1.0
Production worker 6.7
Agriculture worker 72.8
Other worker 7.0
Source: National Family Health Survey, 1998–99

Empowering Women 151
sector also, they normally work at the lower rungs of the employment ladder and, frequently, what they receive is not commensurate with the amount of work they do. What is encouraging is that the number of those launching out with their own business initiatives is increasing in recent years.
In recent times, in the wake of education and exposure, women have started entering other sectors, such as trading, cottage industries, floriculture, restaurants, etc. A handful of them have also entered the highly competitive export market. Now, with the opening up of the tourism sector, new opportunities will become available.
Women and Marriage
The average age of girls at marriage in Nagaland is 22–23 years. However, in some interior areas it is still common to have girls married at 15–16 years of age. Early marriage and high fertility rate have contributed to very high decadal growth rate in Nagaland. Women traditionally married within their own tribes, a practice that is still common today. Men traditionally paid dowry to the family of the bride at the time of marriage in the form of livestock. This practice is different from most parts of India, where the bride’s family pays dowry. Rooted in this tradition and governed by a general culture of care, the valuing of the girl child has continued till today. There is no prevalence of female foeticide in Nagaland.
Violence against Women
There has been increasing concern across the world about violence against women, especially within the home, which usually goes as unreported. This global concern arises because this is not only an issue of human rights violation but also creates health burdens with intergeneration and demographic consequences. During the past five decades Naga society has been a witness to conflict and violence. Insurgency has taken a heavy toll, with women receiving the brunt of the consequences. Often, women themselves have been victims of violence and conflict, and many of them also had to take care of their families single-handedly. The survival, health and growth of the society were almost entirely entrusted to their care.
Incidents of dowry deaths, female infanticides, and neglect of the girl child are absent in Naga culture. However, other forms of violence like wife beating, rape and molestation are on the increase and are being reported in recent years. There were 33 reported cases of crime against women in the State during 2000–2003, out of which 24 were rape, 5 molestations, 2 wrongful restraints, an abduction and a murder case. This rising negative trend is a matter of serious concern for a tribal society where such crimes were unheard of till recent times.

Nagaland State Human Development Report152
As in other patriarchal societies and in some tribal communities, which practised patriarchy, women were socialised into being silent about their experience of violence. Traditional norms teach them to accept, tolerate and rationalise domestic violence. This has been a significant barrier to the empowerment of women as it lowers their self-esteem. The National Family Health Survey (NFHS) made a study to assess whether women viewed wife beating as justified and to measure the prevalence of violence against women, including that committed by their husband. The incidence of beating or physical maltreatment was found to be more in rural than in urban areas. Also, the percentage of violence involving husbands was much more than others, viz. in-laws and other relatives.
II. Traditions and Gender-based Roles
Women down the centuries, have cultivated the fields, raised families, woven cloth, provided food and marketed local produce. The impact of all these on Naga society from then to now has been significant. They continue to do so, but are also participating in newer areas and in changing environment. This has meant some new challenges and called for newer understandings.
Traditional Governing Systems
The traditional governing system of the Nagas was either chieftainship, under the Village Council or an informal council of elders. Only male members were included in these decision-making bodies. Women were excluded from formal decision-making processes. Some tribes, like Angami, have had informal spaces for women to be consulted. In their homes, the women had wide latitude in making decisions. In cultural ceremonies and rituals too, the women had specifically assigned roles.
Land and Inheritance
In Nagaland, cultivable land is the most valued form of property for its economic, political and symbolic significance. It is a productive, wealth-creating and livelihood-sustaining asset. It also provides a sense of identity and rootedness because it has a durability and permanence, which no other asset possesses. Over and above this, in the Naga context, ancestral land has a symbolic meaning, which purchased land does not. What is more, there are different rules for the devolution of ancestral and self-acquired land.
Box 6.2
Traditional Position of Women in Ritual Celebrations
“There used to be two main ritual arenas of the Naga tribes. These were feasting and head hunting. Both tended to centre around the exploits of men. Whereas head hunting was a totally male preserve, women had better social status as far as feasting was concerned.
Head hunting used to be predominantly a male cult. Men used to be separated from their women before, during and after coming back from an expedition. Though it was the women who encouraged men to undertake head-hunting as a prerequisite to marriage, however, a man did not need to be married to take part in the cult. Head-hunting, on the whole, did not confer a right to ornaments for the woman as it did for the man. It was a cult which continued without much involvement of women.
The status of women was slightly different as far as feasts of merit were concerned. Though, women did not themselves give feasts, they played an important role and there was emphasis on male-female cooperation and interdependence. First, a man had to be married in order to throw a feast because it was his wife who brewed the beer which he was supposed to offer to the guests. Secondly, the man and his wife got rights to ornaments equally. This was in recognition of the fact that women played a vital role in production of agricultural produce. Hence, the feasts could not happen without their contribution. Men dominated in economic areas of distribution and exchange, and women were vital in production.
Source: Jacobs, Juliana; “The Nagas–Hill People of North East India’, 1990

Empowering Women 153
In Naga societies, at birth both boys and girls take their social identity from their father and are placed in his agnatic group and familial unit. A female child’s membership of her father’s agnatic unit is neither permanent nor complete. Gender differences in group membership and social identity are closely connected with the patterns of inheritance and resource distribution. In Naga societies, property is inherited by the male heirs and transmitted through them. They have coparcenary rights in ancestral property. The women have no share in such inheritance although acquired properties can be gifted to daughters also. It is widely believed that the daughters after their marriage come under the care of the husband’s clan and family. Largely because of this, in practice, no landed property was gifted to women although most of the work on the land was done by the womenfolk. Even though a man cannot leave land in perpetuity to a daughter and no woman can permanently inherit land of any sort, temporary ownership of land during her lifetime, is allowed for daughters as well as widows. In recent times, a few pioneering initiatives, both private and official, are being taken to allow women to own land.
Naga Women’s Views on Land
There is a broad debate amongst Naga women around rights to land. Listed below are the opinions of Naga women leaders, who interacted on this issue as part of the preparatory work for this Report. Among poor households, land rights could reduce women’s and their
households’ risk of poverty and destitution. Giving women access to economic resources has resulted in poverty alleviation.
Notable differences have been found in how men and women of poor households spend the incomes under their control. Research findings suggest women typically spend almost their total income on the family’s basic needs. Children’s nutritional status tends to be much more linked to the mother’s earnings than the father’s. The physical well being of women, their children and family can greatly benefit if they have access to better income and productive assets such as land.
Access to land has direct advantages in encouraging women-led production in agriculture and related vocations. The success of the NEPED experience also demonstrates this.
Even women from rich parental or marital homes can be economically vulnerable without independent resources in case of marital breakdown or widowhood.
Better economic status can help in increasing women’s bargaining power within the household and can contribute to redistribution of power. This makes for a strong case for supporting women’s economic rights in private as well as public domain.
Rural women almost totally depend on the agricultural sector and they also form the main workforce. Moreover, more men than women migrate from rural to urban areas.
Box 6.3
Naga Traditions
In Favour of Women
Equal care for girl child
No dowry deaths
Right to divorce husband anytime
Specified roles in rituals/ceremonies
Female foeticide unheard of
No starvation deaths
Against Women
Excluded from decision- making process
No inheritance of landed ancestral property
No independent income

Nagaland State Human Development Report154
In the wake of protracted armed conflict, and with the emergence of the HIV/AIDS scourge in recent times, women-led households are on the increase. Access to land could not only offer better choices of livelihood but also provide a sense of security to women.
Entitling women with land would empower them economically and enable them to address other inequities.
III. New Changes and Policy Influences
Democratic Governance
Though slow in coming, changes are taking place both through societal action and through official policy interventions. Indeed, moving on from traditional institutions of governance, Nagaland today is in the midst of a very innovative experience in democratic governance. Traditional ‘men only’ institutions have given way to democratic practices with provisions for women’s participation.
Provisions in the Constitution of India not only grant equality to women but also empower the State to adopt measures of positive discrimination in favour of women for neutralising the cumulative socio-economic disadvantages faced by them over the years. This has to be seen in the backdrop of Article 371(A) of the Indian Constitution, wherein Naga
Source: Census of India, 2001
Other Workers
Household Industry Workers
Agricultural Labourers
Cultivators
Figure 6.3
Number of Workers by Occupation, Sex and Place of Residence
0 50,000 100,000 150,000 200,000 250,000 300,000
Urban Females
Urban Males
Rural Females
Rural Males
83,98517,659
44,477107,504
1,7641,606
9,7794,923
542468
15,16917,673
3,5043,068
269,321
268,540

Empowering Women 155
customary laws have been given special safeguards. Customary law is intrinsic to the culture and tradition of Naga society although it has also been subjected to socio-cultural change. There have been times when the interpretation was not women-friendly. However, the continuing practice of Christianity and wider interactions have all brought changes in customary practices. Women have benefited out of some of these social changes.
Representation of Women in Governance
Naga women have played a limited role in institutional politics. At present there are no women in either the State Assembly or in the Parliament. However, women have remained active participants in the electoral process since statehood. Although no proper figures are available, women’s participation both in terms of voter turnout and in canvassing has been significant in all the elections—local/municipality, state and parliament. Another public sphere where women have played a central role is in the arena of peace. The peace movements, if not led by women, are overwhelmingly supported by them.
National Parliament
Nagaland has two parliamentary seats, one each in the Rajya Sabha and Lok Sabha. Nagaland sent a woman, Mrs. Rano Shaiza, to the 6th Lok Sabha in 1977. Since then, no woman has represented the State in either House of Parliament. Hopefully, the increasing participation of women in the local bodies will have an impact.
State Legislature
The absence of women legislators in all the 10 State Legislative Assemblies since statehood in 1963 is significant. Till date, four women have contested the assembly elections, three of them in the February 2003 elections. However, none of them could win. With the participation of women in local bodies, and even greater numbers in the self-help groups (SHGs), the scenario could change as more women become familiar with governance.
Local Bodies
The participation of women in the local bodies, especially at the village level, is increasing. The Nagaland Village Development Board (VDB) Act has reserved 25 percent for women’s representation. This directive was to first ensure women’s participation in village development and local bodies. This positive empowerment policy has produced some very successful women VDB Secretaries. Active women’s participation in the Village Councils, traditionally a male domain, has been reported from some villages, for instance in Longitham village in Wokha district. A first
Women’s participation both in terms of voter turnout and in canvassing has been significant in all the elections. The peace movements, if not led by women, are overwhelmingly supported by them.

Nagaland State Human Development Report156
case has also been reported from Zunheboto district where a woman has been elected to the post of Gaonbura (village elder), another traditional male domain. This points toward the possibility of women’s participation in traditional institutions in larger numbers in the future.
Policy Interventions
The 8th Five Year Plan marks a definite shift from development to empowerment of women. Empowerment of women across sectors is recognised as the central issue in determining the status of women. However, there is still a gap between the goal enunciated in the Constitution, legislations, policies, plans, and programme implementation and outcomes. While structural and institutional arrangements have been put in place, the situational reality in terms of attitudes and practices leaves much to be desired.
A separate Ministry of Social Welfare was established in the Government of India in 1967 to look into issues relating to women, children and disabled persons. In Nagaland too, women’s development was under the working of the State Ministry of Social Welfare till 2003. In 2003, the Government of Nagaland established a separate Department of Women’s Development.
The reservation of seats and earmarking of 25 percent of funds for women in the Village Development Boards have been the first steps in the State for empowerment of women and their participation in the governance and development of their communities. In addition to the Central Government programmes implemented by the State, the innovations brought about through NEPED and Communitisation have had considerable impact. The various village committees constituted for Communitisation in the areas of health and education, which have positions for women, have further enabled their participation in the development process.
The State Level Working Committee on Women’s Empowerment has asked that a minimum of one-third women be made mandatory in the Village Councils, Village Development Boards, Women Dobashis, Town Committees/Municipal Boards, State and District Planning and Development Boards, Nagaland Public Service Commission and all other recruitment boards.
Nagaland Draft State Policy for the Empowerment of Women, 2003
The draft State Policy on Empowerment of Women, 2003, was declared after extensive and broad-based consultations. This draft policy aims to bring about advancement, development and empowerment of women. The policy statement provides comprehensive guidelines for the upliftment of

Empowering Women 157
women in Nagaland. Some of the important recommendations contained in the policy are given below: Setting up of a State Commission for Women to promote the
interests of women. Setting up of Women’s Development Corporations (WDCs) to channel
financial assistance for promotion of economic enterprises by women, poverty alleviation and employment generation to be considered for Nagaland.
Provision of financial resources for training and advocacy for women’s participation at all levels of decision-making process.
The judicial system be made more responsive and gender sensitive especially in cases of domestic violence and personal assault.
Changes in the personal laws related to marriage, divorce, maintenance, inheritance, guardianship, etc., to eliminate discrimination against women.
To make the laws relating to ownership and inheritance of property gender just.
Women police cells in all the districts. Vocational education and gender sensitivity be incorporated in the
school curriculum. Social, developmental and health consequences of HIV/AIDS to be
tackled from a gender perspective. Women’s health care and counselling centres be set up at the village
level. Special efforts to tackle the macro- and micro-nutrient deficiencies,
especially amongst pregnant and lactating women. Institutions/mechanisms for prevention of crimes against women be
established. Steps to tackle the menace of trafficking in women and girls. Access to credit and training for women to set up self-employment
ventures. Quota for girls in institutions of higher and technical education. Encouraging women to participate in developmental process by
providing support services like child care facilities at work places, homes for short stay and free legal aid.
IV. Strategies for Better Income and Livelihood
Strengthening Agricultural Practices
The vast majority of Naga women are engaged in agriculture. Till recently, they had followed the traditional homestead model where the agriculture produce was according to what the family required. Any excess was shared with neighbours and relatives or sold in local markets. To strengthen and build upon the traditional agricultural practices, the State Government a few years ago, launched a pilot initiative called the ‘Nagaland Empowerment of People through Economic Development’ (NEPED). Through innovative strategies which included providing financial
The draft State Policy on Empowerment of Women, 2003, aims to bring about advancement, development and empowerment of women.

Nagaland State Human Development Report158
assistance to farmers through village administered revolving funds, organising women’s SHGs, capacity building of women by technical training, etc., NEPED has ensured greater space, empowerment and involvement of women.
Some experiences from these pilot initiatives in agriculture are given below:
Financial assistance to women was provided through mandatory provision of 25 percent of the allocated funds to participate in the project, establishing revolving funds and credit link assistance with local financial institutions. Besides financial assistance, the project helped women explore their access to land in newer ways.
i. During the bridging period one of the villages in the test cluster, namely, Awotsakilimi, readily consented to break with tradition by allowing women to purchase land through the use of women’s share of the VDB grant-in-aid. This gave rise to the possibility of replicating such practices in other villages all over the State. Today, nearly 20 SHGs have been able to buy land over the past two years.
ii. NEPED coordinated with the State Department of Rural Development to allow VDB to use its funds for purchase of land by women. The Rural Development Department issued an order allowing women to purchase land with financial assistance from the VDB grant-in-aid and NEPED.
iii. ‘Long term lease’ of community land to women for agriculture has also been facilitated.
iv. Family owned land was made available to individual members of SHGs by their families.
v. Women have creatively come up with various types of mortgages in order to secure loans from the revolving funds.
Table 6.3 gives an indication of the growth of SHGs across the districts of Nagaland. The range of financial assistance provided through the revolving fund is Rs 5–11 lakh. What augurs well is that the repayment rate of loans has been very high. The choices of crops reflect the successful continuation of locally used produce. But new crops have also been introduced following market survey and analysis. The inclusion of animal husbandry and poultry into the income generating initiative is particularly relevant. The Animal Husbandry department has projected a domestic market requirement of several crores for meat and meat products. Currently, Nagaland imports meat and meat products. This dimension enables adoption of newer agricultural models and raised incomes.
The high participation of women in the capacity building workshops organised by NEPED allowed for good preparation at the field level. The
Through innovative strategies which included providing financial assistance to farmers through village administered revolving funds, organising women’s SHGs, capacity building of women by technical training, etc., NEPED has ensured greater space, empowerment and involvement of women.
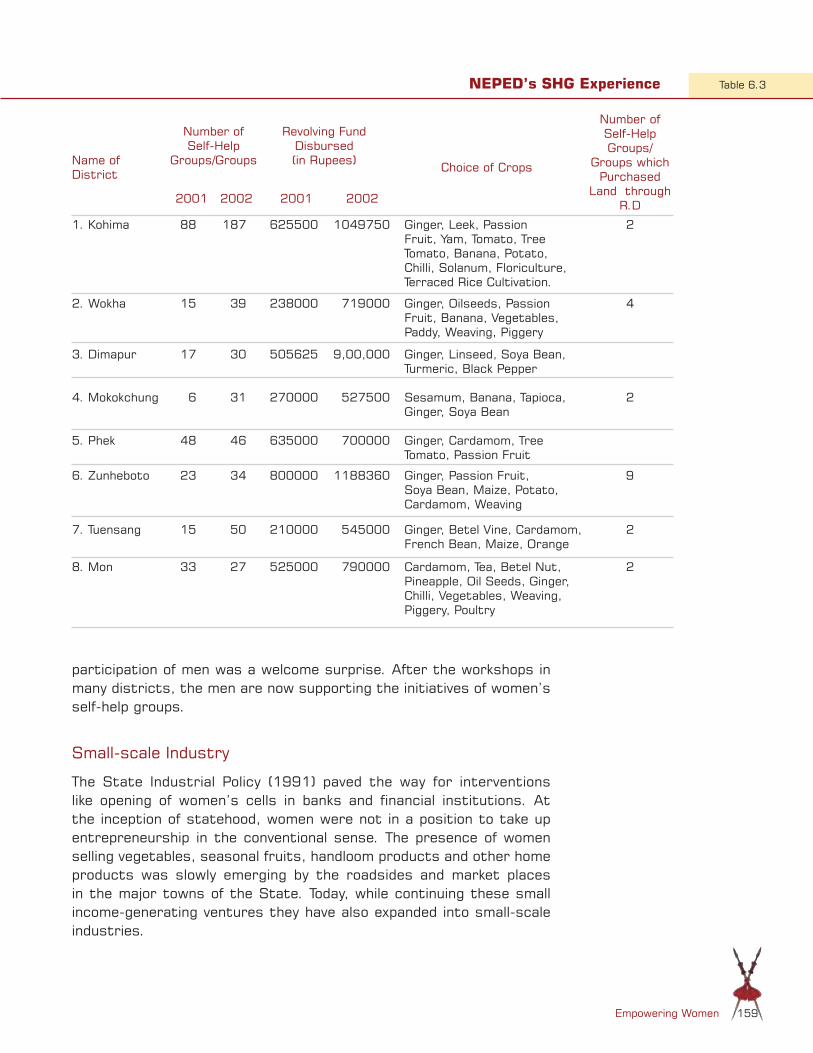
Empowering Women 159
participation of men was a welcome surprise. After the workshops in many districts, the men are now supporting the initiatives of women’s self-help groups.
Small-scale Industry
The State Industrial Policy (1991) paved the way for interventions like opening of women’s cells in banks and financial institutions. At the inception of statehood, women were not in a position to take up entrepreneurship in the conventional sense. The presence of women selling vegetables, seasonal fruits, handloom products and other home products was slowly emerging by the roadsides and market places in the major towns of the State. Today, while continuing these small income-generating ventures they have also expanded into small-scale industries.
Name of District
Number of Self-Help
Groups/Groups
Revolving Fund Disbursed (in Rupees) Choice of Crops
Number of Self-Help Groups/
Groups which Purchased
Land through R.D2001 2002 2001 2002
1. Kohima 88 187 625500 1049750 Ginger, Leek, Passion Fruit, Yam, Tomato, Tree Tomato, Banana, Potato, Chilli, Solanum, Floriculture, Terraced Rice Cultivation.
2
2. Wokha 15 39 238000 719000 Ginger, Oilseeds, Passion Fruit, Banana, Vegetables, Paddy, Weaving, Piggery
4
3. Dimapur 17 30 505625 9,00,000 Ginger, Linseed, Soya Bean, Turmeric, Black Pepper
4. Mokokchung 6 31 270000 527500 Sesamum, Banana, Tapioca, Ginger, Soya Bean
2
5. Phek 48 46 635000 700000 Ginger, Cardamom, Tree Tomato, Passion Fruit
6. Zunheboto 23 34 800000 1188360 Ginger, Passion Fruit, Soya Bean, Maize, Potato, Cardamom, Weaving
9
7. Tuensang 15 50 210000 545000 Ginger, Betel Vine, Cardamom, French Bean, Maize, Orange
2
8. Mon 33 27 525000 790000 Cardamom, Tea, Betel Nut, Pineapple, Oil Seeds, Ginger, Chilli, Vegetables, Weaving, Piggery, Poultry
2
NEPED’s SHG Experience Table 6.3

Nagaland State Human Development Report160
“Cottage industry is part of the working culture of Naga women,” according to Ms. Kilemla Moa, a noted educationist. It has its roots in traditional spinning and weaving. These practices were adopted by women to provide clothing for their families. They slowly extended this outside their families to increase their income. The expertise of Naga women in the use of cane and plant fibre is another area that can be exploited advantageously. National and international markets exist today for these hand made products. These labour-intensive industries can prove successful both in urban and rural areas, and provide employment and improved income to Naga women and their families. Some strategies which have been adopted to make home-based practices of weaving, cane craft and other handicrafts become successful small-scale industries include mapping skills and expertise, awareness building, technological inputs to improve efficiency, financial support, market linkages and establishing weavers’ societies. ‘Special sales days’ are becoming more regular and popular in a range of settings, beginning with daily markets to tourist attractions like the ‘Hornbill Festival’. The Departments of Rural Development and Social Welfare, and the State and District Urban Development Agencies have linked their awareness programmes with these dimensions with considerable success.
Women’s Entrepreneurship
Creating opportunities and space for women is crucial for sustainable development. Due to traditional practices in most societies the entry of women into entrepreneurship has been only a recent phenomenon. In the developed countries, women joined the entrepreneurial field in the sixties and now play a powerful role in the economy of their countries. In India, official and non-official agencies initiated efforts to promote women’s entrepreneurship in the seventies. In a State like Nagaland, with its long history of insurgency, the effort is being made only very recently. Even the International Decade for Women (1975–85) and the first Convention of Women Entrepreneurs (November 1981) did not create any ripples in Nagaland. Only through the gradual official trickle-down process, some benefit has reached women in the State. One of these schemes is the Development of Women and Children in Rural Areas (DWCRA) programme started during the Sixth Five Year Plan.
One of the women pioneers in the State was Ruth Angami, who successfully commercialised handloom products. Following in her footsteps, in the second half of the 1970s, Naga women started to break out of the wall of tradition and began engaging in trade, bringing goods sourced from as far away as Nepal, Myanmar, etc. Now, others have followed suit and expanded the trading business into retailing, paan shops, restaurants, etc. Some have also entered the export market. Naga women are also fully engaged in meeting the demands of an emerging clientele for indigenous goods and many have thriving businesses in the markets of
Cottage industry has its roots in traditional spinning and weaving. These practices were adopted by women to provide clothing for their families.

Empowering Women 161
Box 6.4
Inspiring Leadership
Nancy Kikon came into the limelight in the Nagaland Baptist Church Council (NBCC) circles during the convention on “Naga Women in the 21st Century”, in 2001, when she and her finance committee, through some novel initiatives, raised more than double the estimated budget requirements from nothing.
Nancy and her committee were given a target of raising Rs 10 lakh to organise the convention. They had no seed money and had to come up with a strategy to achieve this target. She fell to her knees and prayed. The Bible verse, “My grace is sufficient for you, for my strength is made perfect in weakness” came to her. “From that day, ideas kept popping up all the time!” says Nancy.
For start up capital, the organising committee decided to collect a nominal amount of Rs 2/- from each member of the Churches affiliated to the NBCC. They then toured the entire State, including remote areas of Mon and Tuensang and asked the Church women to contribute from whatever they had in plenty. The response was spontaneous and all kinds of contributions in kind poured in. These included agricultural produce like potatoes, wild orchids, jungle plants and loofahs. They also collected all kinds of waste plastics. These were distributed to various churches, cut into long strips and woven into doormats, or stitched into cushions and pillows. They were later sold at special sales events.
At the end of all their efforts, Nancy and her committee had raised Rs 26,99,353/- against a target of Rs 10,00,000/-. “There were no requests for monetary donations, no going to officers and VIPs with begging bowls and no complaints!” After meeting all the expenses of organising the convention of 10,000 delegates, the committee had a surplus fund of Rs 15,39,353/- left over.
This experience generated confidence and pride amongst the thousands of Church women who participated in this unique preparation for a convention that was discussing their future. It helped in locally mapping resources, developing products of marketable quality, building women-led alliances and raising financial resources through the involvement of many.
After news of her fund-raising and organising abilities got out, Nancy Kikon, who did not complete her intermediate studies because she was so anxious to realise her dream of becoming a perfect mother, was in great demand. She became the only woman to be nominated on the board of trustees of the Nagaland Development Outreach (NDO), the NBCC’s developmental wing. The State Government was not far behind. The Nagaland Government requested the NDO to depute her as NGO representative to the State Urban Development Agency (SUDA). Today, as a trustee of NDO and member of SUDA, she continues to tour the entire State, sharing her dream of women’s empowerment. The people’s response to her heartfelt appeal is spontaneous and full-throated. Recently, she was in Mon district, near the Myanmar border, speaking at a special camp for women when an old man came up to her and said, “Young woman, in my 82 years, for the first time, I have heard someone speak sense!” She replied, “Sir, had traditional culture not been in the way, I would have hugged you”. There were smiles all round.
Dimapur, Kohima, and Mokokchung. Many women have opened up flower nurseries and make a good living out of this. The growing market for home-made processed foods like dehydrated fruits, fruit juices, jam and pickles is providing new opportunities. In the area of entrepreneurship, unlike their counterparts across India, the traditional equal value placed on the girl child gives Naga women a mobility factor that enables them to set up independent business enterprises.
Education Linked Opportunities
In the list of livelihood opportunities for women, education-linked special vocations could be pursued as a strategy. These vocations could be taken

Nagaland State Human Development Report162
up in such specialised areas as health, textile/fashion designing, event management, teaching, tourism, IT, biotechnology, art and culture, media, etc. For instance, a medical institution of national repute recruited a batch of nurses trained by Nagaland’s Department of Health and Family Welfare. Such ‘demand-guided special training’ can open up more tangible employment opportunities within and outside Nagaland.
The live register of the State employment exchange shows that out of 35,463 work seekers nearly one-fifth are women. However, among them, 65 percent are matriculate and below. Making use of private sector and self-employment opportunities in the sphere of information technology, desktop publishing, call centres, horticulture, mushroom farming, floriculture, rural, agro-based industries, etc., need to be explored.
Box 6.5
Weaving Dreams on Handloom
Analysis of women entrepreneurship would be incomplete without looking into the larger picture which includes the vibrant tradition of Naga handloom, the mainstay activity of Naga women. The potentials of the handloom sector are immense. The high-end market, including international market appreciation and acknowledgement of ‘handmade’, are applicable to Naga handloom products.
Some challenges faced by the handloom industry: Sourcing of raw materials Use of inferior dyes Limited choice of yarn Lack of information on emerging trends to target a larger market Limited products Ignorance of colour trends Unrealistic labour cost contributing to high overheads Elaborate designs which are not cost-effective
Handlooms have been the mainstay of women’s activity and yet it does not enjoy a commercial status, while the craft of dyeing has gained the status of a languishing craft. The absence of women in setting up industrial units in this sector can be related to some of the following factors: The risk factor Lack of awareness of technological innovations Unwillingness to invest large capital Dual responsibility of home and enterprise Lack of market knowledge and procurement of raw materials Lack of awareness of various Government development schemes Absence of organizational structures connecting women’s groups Excessive paper work and formalities of Government department
The role of the private sector will be critical in establishing viable market linkages. Some successful women entrepreneurs in Nagaland have already entered national and international markets. Emphasis on cottage and home-based industries can help women build on traditional handicrafts and explore newer markets. The shift in scale and customer profile will however require changes in knowledge, attitudes and practice. It will require: Continuation of the Entrepreneurship Development Programme (EDP) training by the Department of Industries,
NABARD and other agencies working for the economic development of women Familiarising local weavers with market needs in terms of design, quality, work culture Providing financial assistance through micro-credit programmes and bank linkages Government support for creating “strategic sale points”

Empowering Women 163
With the increasing contribution of the tertiary sector to the economy, as opposed to the primary sector, the status of women is bound to change. With a shift towards the tertiary sector, direct dependence of the economy on land decreases. Thus, the extent to which the social status accrues from land ownership also reduces. Moreover, the tertiary sector depends upon the skill levels of the individuals. Skill upgradation, enhanced by credit and marketing support, will facilitate increased proportion of employment of women outside the non-remunerative agriculture sector. Special career guidance and counselling for girl school and college students have to be organised. It is important to inform and educate them on the vast world of entrepreneurship, to build their self-esteem and self-confidence and nurture their inherent entrepreneurial skills and talents.
Within the existing Government services, incorporation of women can add sensitivity and provide a gender perspective. An example is the police force. Currently, the Nagaland Police has around 377 women in its 20,000 strong force. This translates to 1.84 percent as against the current national average of 3.5 percent.
Role of Non-government Organisations
The various success stories and case studies in this Report reflect the important role of NGOs and their great potential in Nagaland. Many SHGs and women’s societies also successfully dot the landscape of Nagaland. Indeed, in Nagaland’s experience, these groups have proved to be among the most successful. In many towns, there are buildings built by women’s SHGs, which are fetching handsome income.
A major participant in this sector is the Church in Nagaland, comprising Baptist, Catholic, Revival, Assembly of God, Pentecostal Mission, etc. Several denominations have their own developmental organisations. Among them, the Nagaland Development Outreach (NDO), the developmental wing of the Nagaland Baptist Church Council (NBCC), is one of the better-known organisations.
Naga women know that building a society to live in peace would mean creating a climate that is conducive. Women’s organisations like the NBCC women’s wing and the Naga Mothers’ Association (NMA) have been working for peace, human rights issues, environment conservation, women’s empowerment and on health issues like alcoholism, drug addiction and AIDS.
The NMA has also contributed significantly towards forging the peace process and has been working on human rights issues, afforestation, environmental conservation and empowerment of women. The NMA had also, along with the Church, spearheaded the successful movement for imposition of prohibition in Nagaland. Even before the ceasefire agreement,
The live register of the State employment exchange shows that out of 35,463 work seekers nearly one-fifth are women.
Nagaland State Human Development Report164
it had been working with other organisations to reduce violence and cruelty in Naga society. Their activities related to the peace process have concentrated primarily in three areas, viz., peace and reconciliation, participation in capacity building and the people-to-people dialogue with civil society. Women’s intervention has helped greatly to reduce tensions and violence in society. They have also started projects such as hospice for people living with AIDS to provide care, support and space.
V. Special Challenges and Way Ahead
While traditional society valued the girl child equally, as all children are accepted as divine blessing, the peculiar situation of Nagaland, with its protracted violent insurgency, had frequently placed Naga women in especially difficult circumstances and confronted them with enormous challenges. A few areas of special challenges are discussed below:
Conflict and Peace Building
For over five decades, Naga society has been a witness to violent conflict. Insurgency has taken a heavy toll on society as a whole. Frequently, the women had to face the brunt of violence by being forced into a situation where they had to take care of the families single-handed in the absence of male members, either falling prey to violence or going underground for years. This extraordinary situation stunted their emotional and psychological growth. The survival, health and growth of the society were almost entirely entrusted to their care, in the midst of environment not conducive to normal living. There has been no proper documentation on Naga women’s experiences and needs during the conflict period. Thus, the value of their experiences and their relevance to the society and the State are yet to be compiled and assessed.
The contribution of Naga women to peace building has been multi-dimensional. They have been preparing for ‘life in peace’ based on shared compassion and empathy within and across the society. The first steps have been to take stock of social and economic resource bases and addressing structural issues, including women’s rights in order to help establish peace and stability. To this, they have integrated development, encouraging gainful employment for youth in order to develop a just and productive society.
HIV/AIDS
Nagaland is addressing the growing HIV/AIDS epidemic with resolve and responsibility. A cause for great concern is the spread of AIDS from mother to child. Between 1999 and 2002, antenatal screening of mothers showed a persistent prevalence rate of 1.25 percent. This requires targeted education and intervention as well as specialised obstetric and paediatric services. Increasing awareness is resulting in
The NMA has also contributed significantly towards forging the peace process and has been working on human rights issues, afforestation, environmental conservation and empowerment of women.

Empowering Women 165
Box 6.6
Mothers’ Journey from Despair to Hope
The Naga Mother’s Association (NMA) was formed on February 14, 1984, as a State level voluntary organisation with the objective of combating social evils confronting the society in various forms. It also provides a common platform for women, where women’s issues and interests could be addressed, and to uphold the dignity of motherhood. Its motto is ‘Human Integrity’.
The NMA soon found itself combating the problem of drug abuse. Heroin, the killer drug, was easily available in the region because of Nagaland’s contiguity to the ‘Golden Triangle’ and good connectivity provided by National Highway 39. The NMA started checking the rampant drug trafficking by going after drug peddlers in various localities of the State and assisting the law enforcing agencies. As a result, may drug peddlers, especially in Kohima and Dimapur, were apprehended. One of the benefits was the creation of a high level of awareness although the problem itself did not disappear.
The NMA recognised the need to help those afflicted by drug addiction and decided to set up a de-addiction-cum-rehabilitation centre for them. Thus, on February 12, 1989, the Mount Gilead Home, in Zubza, Kohima, was inaugurated as one of the first de-addiction-cum-rehabilitation centres in the North East. Its counsellors and recovering addicts became active apostles in spreading awareness in the State.
The NMA later set up Cradles Ridge, an AIDS Care Hospice, to look after the body, mind and spirit of the victims and to provide them with a dignified life. The emphasis shifted from cure to care. The NMA’s HIV/AIDS Care Hospice (community residential care) was dedicated in 2001 as a 10-bedded facility.
The Times of India survey on social indicators, taken by women’s groups all over India, reported that the NMA’s role was ‘an excellent example’ of producing positive results in fighting against drugs in North-East India.
Courtesy: Naga Mothers’ Association
partnership with the community to take care of people living with AIDS. The classic example of dedicated community-based care is the Eleutheros Christian Society.
The Road Map
Empowerment of women will be vital as Nagaland marches towards its vision of a peaceful, developed and secure society. New opportunities are coming the way of Naga women through education, policy interventions in governance, economic development and greater interaction within and outside the State. The focus must now shift to development of the human being in its totality, and enabling each one to realise his/her highest potentials. Some areas of possible intervention include:
Education
More focus on improving literacy rates and vocationalisation of education.
Provision of life skills and health education to young girls.
Building knowledge and information base on women and issues connected with them in the State.
Research studies on women’s issues and special needs in the context of Nagaland.
Initiate institute of excellence on Naga women’s issues with a view to making contributions.
Health
Provision of health education particularly in reproductive and child health & HIV/AIDS.
Improve women’s access to antenatal, natal and postnatal care.
Create greater awareness on reproductive health through special campaigns and health awareness days.
Income and Livelihood
Ensure opportunity and build capacity of women to enjoy secure livelihoods.
Encourage poverty alleviation and income generating activities.

Nagaland State Human Development Report166
Encourage entrepreneurship development. Access to micro-credit: women also need to be trained to access
credit and to form self-help groups as well as generate micro-credit on their own.
Ensure greater access and equal land rights to women.
Crime Against Women
Introduce gender sensitisation modules in educational institutions for both boys and girls.
Criminal cases involving women should be dealt with by women police force. For this a special women’s cell should be attached to all the district police headquarters.
Affirmative action, through reservations, for women judges should be explored. This will make the law enforcing machinery more gender-sensitive.
Governance
Spread awareness and education about importance of women’s participation.
Strengthen leadership of women at all levels. Leverage/Lobby political and financial support for women. Forge new partnerships with Government, NGOs/private sector and
women’s organisations. Introduce innovative approaches for women’s empowerment and
gender mainstreaming. Create support structures for women’s development and facilitate
networking. Explore possibilities of reservation for women candidates to ‘kick-
start’ their participation in democratic political institutions at all levels of governance.

Chapter 7
Human Development Indicators

Nagaland State Human Development Report168
I HUMAN DEVELOPMENT REPORTS 169
National Human Development Reports 170
Human Development Indices 170
Millennium Development Goals 171
II NAGALAND’S HUMAN DEVELOPMENT INDICES 175
Human Development Index 175
Gender Related Development Index 175
Human Poverty Index 176
MDGs: Priority Areas and Districts 177
Human Development Indices for North-Eastern States 177
III TECHNICAL NOTE 180
The Indices 180
Further Suggestions 186
Sample Survey for NSHDR 187
Rural Areas 187
Urban Areas 187

Human Development Indicators 169
T his chapter traces the purpose and framework of the Human Development Reports. It discusses the human development
indices and the Millennium Development Goals for Nagaland. It presents the values of the indices and discusses them in a disaggregated and comparative framework. A technical note describes the computing elements, processes and sampling methodology adopted, data gaps and other challenges faced in preparing the human development indices for Nagaland.
As the State looks forward to its vision of a developed Nagaland, the human development indices, based on a set of comprehensive indicators, provide the benchmark to assess the performance of the State in the field of growth and development. Improvement in the performance is reflected by access to choices, improved longevity, knowledge, a decent standard of living, etc. The Millennium Development Goals provide the ‘building blocks’ to reach this aspired vision of a developed State.
I. Human Development Reports
The development of a country was earlier measured only in terms of gross domestic product (GDP) and subsequently per capita income also became an important indicator. This, however, was not found to be adequate, for growth in income did not necessarily result in direct improvement in the quality of life of an individual or community. The search for a comprehensive measure to capture the various dimensions of human development led to the definition and formulation of the human development index (HDI) by the United Nations Development Programme (UNDP) in its first Human Development Report (HDR).
The UNDP has been pioneering the compilation of Human Development Reports since 1990. The reports focus on the broader attributes of human well being and define human development as a process of enlarging people’s choices and raising their standard of living. They emphasise the potential of long and healthy lives, the acquiring of knowledge and education, and the resources needed for a decent level of living. These three factors have been identified as critical for human development. They also form the inputs for computing the HDI. The HDI, along with the human poverty index (HPI), the gender-related development index
The potential of long and healthy lives, the acquiring of knowledge and education, and the resources needed for a decent level of living. These three factors have been identified as critical for human development.

Nagaland State Human Development Report170
(GDI) and gender empowerment measure (GEM), serve as the basis of the Human Development Reports.
The primary purpose of the Human Development Reports has been to assess the state of human development across countries and provide critical analysis of a specific theme each year. Fourteen global Human Development Reports have been published so far, combining thematic policy reviews with analysis of accomplishments in human well being across the globe.
National Human Development Reports
National Human Development Reports aim to bring about conceptual and methodological consensus on the use of the human development approach in the country. Attempts have been made to map the state of human development through outcome indicators and composite indices that reflect the collective social valuation and development priorities of the nation. They also explore the framework for building composite human development indices at the state level. An important concern in building databases at the state level has been to identify indicators that are readily available, even disaggregated to the district level. The indicators also serve as tools for guiding public policies and programmes towards higher development goals. Over 400 national and regional HDRs on a range of themes have been prepared since 1994 by over 155 countries around the world.
Human Development Indices
The realisation of expanded choices is mediated largely through personal means and access to public provisions and transfers. This prompts people to look at the broader development framework. Social and political processes are important for translating the available means to desirable outcomes. Therefore, it is necessary to view the process of development in terms of socially desirable outcomes as opposed to mere material benefits. The conventional measure of gross domestic product or per capita income is insufficient to capture these wider aspects of welfare and the contingent process of development. The Human Development Reports put together indicators and composite indices to evaluate the development process in terms of its outcomes rather than in terms of available means or inputs alone. The conglomerate perspective captures advances made by the society as a whole and the derivational perspective assesses status of the deprived in a society.
The HDI, along with the three supplementary indices—HPI, GDI and GEM—capture the broad status of development. These indices are used as key points of reference for growth and development nationally and internationally.
The conventional measure of gross domestic product or per capita income is insufficient to capture these wider aspects of welfare and the contingent process of development.

Human Development Indicators 171
1. Human development index (HDI) has three vital dimensions —longevity, measured by life expectancy at birth; educational attainment, measured by adult literacy rate and gross enrolment ratio; and standard of living or command over resources, measured by per capita GDP.
A healthy life, free from illness, is essential in the notion of well being. Education is important for realising one’s highest potentials and enlarging the available set of opportunities and choices. Adequate income, for a decent standard of living, is necessary for all dimensions of human development, including health and education. Income is a part of HDI as a proxy/surrogate for all dimensions of human development not reflected in a long and healthy life and in knowledge
2. Human poverty index (HPI): Human Development Report, 1997, introduced the concept of HPI. The HPI measures the levels of deprivation in the three essential dimensions of human life reflected in the human development index. It reflects the distribution of progress and measures the backlog of deprivations that still continue to exist.
3. Gender-related development index (GDI) and Gender empowerment measure (GEM), introduced in the Human Development Report, 1995, are composite measures reflecting gender inequalities in human development.
While the HDI measures average achievements, the GDI adjusts average achievements to reflect the inequalities between men and women in the dimensions of longevity, education and command over resources. Human Development Report, 2003, elucidates, “the gender-related development index (GDI) measures achievements in the same dimensions and using the same indicators as the HDI, but captures inequalities in achievement between men and women.” GDI is simply the HDI adjusted downward to measure gender inequality. The greater the gender disparity in basic human development, the lower is a country’s GDI compared with its HDI.
According to Human Development Report, 2003, GEM reveals whether women can take active part in economic and political life. It focuses on participation, measuring gender inequality in key areas of economic and political participation and decision-making. Differing from the GDI, it exposes inequality in opportunities in selected areas.
Millennium Development Goals
In September 2000, at the historic United Nations Millennium Summit, world leaders from 189 countries adopted the United Nations Millennium
GEM focuses on participation, measuring gender inequality in key areas of economic and political participation and decision-making.

Nagaland State Human Development Report172
Figure 7.1
Calculating the Human Development Indices
Source: Human Development Report, 2003

Human Development Indicators 173
Declaration, and agreed to a set of eight quantifiable goals and 11 monitorable targets for development and poverty alleviation by 2015. Global Human Development Report 2003 again brought the Millennium Development Goals (MDGs) centrestage and proposed a Millennium Development Compact for collaboration between rich and poor countries for achievement of these goals. These MDGs are vital for triumphs in the arena of human development, as defined by successive Human Development Reports (See Box 7.1).
Human Development Report 2003 advocates that “the Goals not only support human development, they are also achievable with the right policies and sufficient resources. But the real power of the Goals is political. They are a development manifesto for ordinary citizens around the world; time-bound and measurable, they seek to hold the governments and wider international community accountable for their achievement.”
A comparison of the achievements of Goals and targets, between Nagaland and India, shows the gap that the State must make up in the areas of sustainable development, productivity, equity and empowerment. Orientation and time-bound strategies to achieve these Goals can hasten the process of human development and economic prosperity.
Box 7.1
How do the Human Development Goals relate to the Millennium Development Goals
Key Capabilities for Human Development Corresponding Millennium Development Goals
Living a long and healthy life Goal 4, 5, 6: reducing child mortality, improving maternal health and combating major diseases.
Being educated Goal 2 and 3: achieving universal primary education, promoting gender equality (especially in education) and empowering women.
Having a decent standard of living Goal 1: reducing poverty and hunger
Enjoying political and civil freedoms to participate in the life of one’s community
Not a Goal but an important global objective included in the Millennium Declaration
Essential Conditions for Human Development Corresponding Millennium Development Goals
Environment sustainability Goal 7: ensuring environmental sustainability
Equity – especially gender equity Goal 3: promoting gender equality and empowering women
Enabling global economic environment Goal 8: strengthening partnership between rich and poor countries
A comparison of the achievements of Goals and targets, between Nagaland and India, shows the gap that the State must make up in the areas of sustainable development, productivity, equity and empowerment.
Source: Human Development Report 2003

Nagaland State Human Development Report174
Box 7.2
UNDP—Millennium Development Goals
The Global Challenge: Goals and TargetsThe Millennium Development Goals are an ambitious agenda for reducing poverty and improving lives that world leaders agreed upon at the Millennium Summit in September 2000. For each goal one or more targets have been set, most using 2015 as a benchmark.
Current Status
1. Eradicate Extreme Poverty and HungerTarget for 2015: Halve the proportion of people living on less than a dollar a day.
2. Achieve Universal Primary EducationTarget for 2015: Ensure that all boys and girls complete primary school.
3. Promote Gender Equality and Empower Women Targets for 2005 and 2015: Eliminate gender disparities in primary and secondary education preferably by 2005 and at all levels by 2015.
4. Reduce Child MortalityTarget for 2015: Reduce by two-thirds mortality rate (under 5) among children.
5. Improve Maternal Health Target for 2015: Reduce by three-quarters the ratio of women dying in childbirth.
6. Combat HIV/AIDS, Malaria and Other DiseasesTarget for 2015: Halt and begin to reverse the spread of HIV/AIDS and the incidence of malaria and other major diseases.
7. Ensure Environmental StabilityTargets • Integrate the principles of sustainable development into country policies and programmes and reverse the loss of environmental resources. • By 2015 reduce by half the proportion of people without access to safe drinking water. lives of at least 100 million slum dwellers.
8. Develop a Global Partnership for DevelopmentTargets • Develop further an open trading and financial system that includes a commitment to good governance, development and poverty reduction – nationally and internationally.• Address the least developed countries’ special needs and the special needs of landlocked and small island developing states.• Deal comprehensively with developing countries’ debt problems
Population Below Poverty Line, 1999–2000India 26.10% Nagaland 32.67%
School Enrolment Rate (6–11 years), 1991India 68.3 %Nagaland 65.5%
GDI, 1991India 0.676Nagaland 0.729
Under 5 Mortality Rate, 1991India 94 Nagaland 67
Maternal Mortality Rate, 1998–99India 5.4 per 1000Nagaland <1 per 1000
HIV PrevalenceIndia 0.8 %Nagaland >1 %
Incidence of MalariaIndia 3.7 %Nagaland 16.2%
Access to Safe Drinking Water, 1991India 62.3 %Nagaland 53.3 %
Source: National Sample Survey Organisation Survey 55th Round, National Human Development Report 2001, National Family Health Survey 1998–1999
Human Development Indicators 175
II. Nagaland’s Human Development Indices
In line with the country’s National Human Development Report, 2001 the following three indices have been constructed for Nagaland:
Human Development Index (HDI) Gender-related Development Index (GDI) Human Poverty Index (HPI)
One of the major problems in the estimation of these indices was the non-availability of data on district domestic product (DDP). Therefore, a sample survey was conducted to gather the needed information at the district level. The estimates of DDP thus derived were verified with the net state domestic product of Nagaland. The details of the components and the process of computing these indices are given in the technical note that follows this section. The human development indices developed for the State of Nagaland are given in Table 7.1.
Human Development Index
The HDI (2001) of Nagaland was 0.62, as compared to 0.472 (2001) for India. The State’s good performance and ranking can be best understood by looking at the constituents of the indices and the factors that influence them, including literacy, health status and income levels. The per capita income of Nagaland during 2000–2001 is almost equal to the national average. The 2001 State literacy rate is 67 percent as against the national average of 65.2 percent. The social framework of Nagaland has placed education as a valued asset since its introduction nearly 130 years ago along with the ushering in of Christianity. The unique framework of care and provision of Naga society finds expression in the better performance of the State, as against the national average, in terms of longevity/mortality status (see Table 4.1).
Within Nagaland, the HDI was highest in Dimapur (0.73), followed by Mokokchung (0.71). Mon district had the lowest HDI (0.45). However, only one district, Mon, had HDI less than 0.47, the national HDI. The ranking of districts is directly related to the position of the districts with DDP, and with the educational attainments. This indicates a positive relationship between the income levels, the educational attainments and human development in the State. Tuensang and Mon have been consistent underachievers in all the indicators of the HDI, except in the case of infant mortality rate (IMR) in Mon [Figure 7.3 (c)], reinforcing the need for special focus and policy intervention in these remote districts.
Gender-related Development Index
GDI for the State is 0.42 as against an HDI of 0.62. Adjusted for gender inequality, Kohima’s performance is better than all other districts in
The Human Development Index was highest in Dimapur (0.73), followed by Mokokchung (0.71). Mon district had the lowest HDI (0.45).
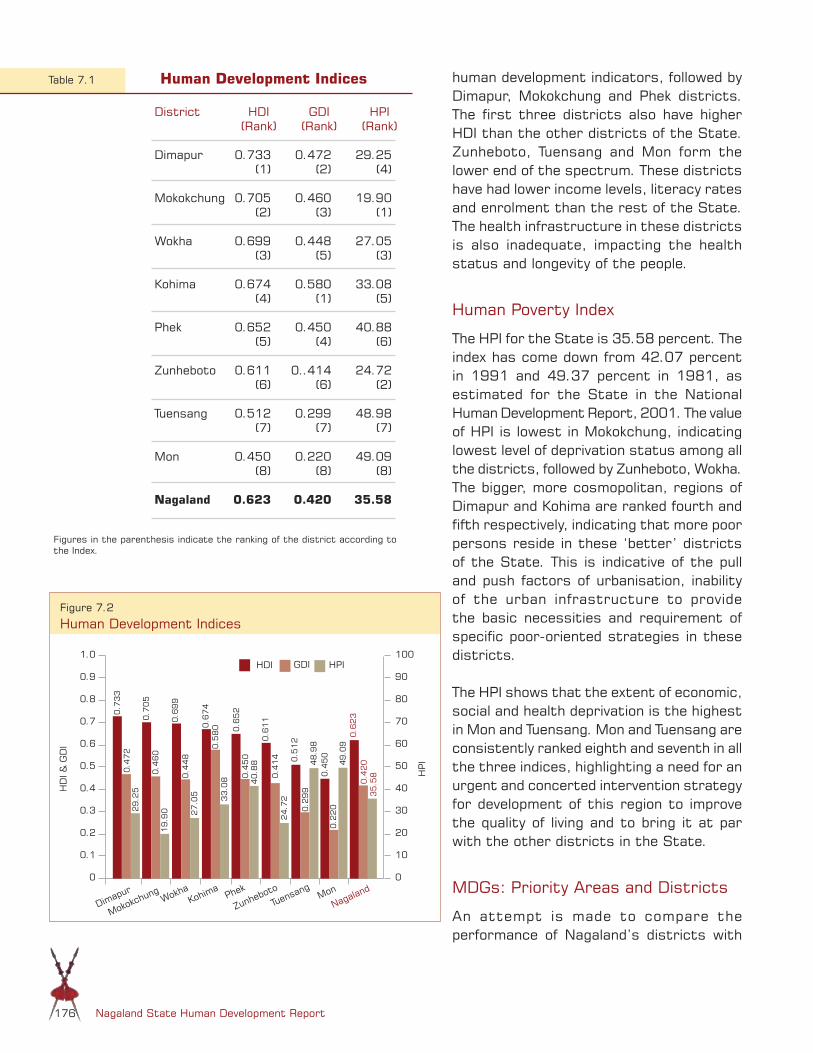
Nagaland State Human Development Report176
human development indicators, followed by Dimapur, Mokokchung and Phek districts. The first three districts also have higher HDI than the other districts of the State. Zunheboto, Tuensang and Mon form the lower end of the spectrum. These districts have had lower income levels, literacy rates and enrolment than the rest of the State. The health infrastructure in these districts is also inadequate, impacting the health status and longevity of the people.
Human Poverty Index
The HPI for the State is 35.58 percent. The index has come down from 42.07 percent in 1991 and 49.37 percent in 1981, as estimated for the State in the National Human Development Report, 2001. The value of HPI is lowest in Mokokchung, indicating lowest level of deprivation status among all the districts, followed by Zunheboto, Wokha. The bigger, more cosmopolitan, regions of Dimapur and Kohima are ranked fourth and fifth respectively, indicating that more poor persons reside in these ‘better’ districts of the State. This is indicative of the pull and push factors of urbanisation, inability of the urban infrastructure to provide the basic necessities and requirement of specific poor-oriented strategies in these districts.
The HPI shows that the extent of economic, social and health deprivation is the highest in Mon and Tuensang. Mon and Tuensang are consistently ranked eighth and seventh in all the three indices, highlighting a need for an urgent and concerted intervention strategy for development of this region to improve the quality of living and to bring it at par with the other districts in the State.
MDGs: Priority Areas and Districts
An attempt is made to compare the performance of Nagaland’s districts with
District HDI(Rank)
GDI(Rank)
HPI(Rank)
Dimapur 0.733(1)
0.472(2)
29.25(4)
Mokokchung 0.705(2)
0.460(3)
19.90(1)
Wokha 0.699(3)
0.448(5)
27.05(3)
Kohima 0.674(4)
0.580(1)
33.08(5)
Phek 0.652(5)
0.450(4)
40.88(6)
Zunheboto 0.611(6)
0..414(6)
24.72(2)
Tuensang 0.512(7)
0.299(7)
48.98(7)
Mon 0.450(8)
0.220(8)
49.09(8)
Nagaland 0.623 0.420 35.58
Table 7.1 Human Development Indices
Figure 7.2
Human Development Indices
HD
I & G
DI
Dimapur
Mokokchung MonPhek
TuensangWokha
Zunheboto
Nagaland
HDI GDI HPI
0.7
33
1.0
0.9
0.8
0.7
0.6
0.5
0.4
0.3
0.2
0.1
0
100
90
80
70
60
50
40
30
20
10
0
Kohima
0.4
72
29.2
50.7
05
0.6
99
0.6
74
0.6
52
0.6
11
0.5
12
0.4
50
0.6
23
0.4
60
0.4
48
0.5
80
0.4
50
0.4
14
0.2
99
0.2
20
0.4
20
19.9
0 27.0
5 33.0
8 40.8
8
24.7
2
48.9
8
49.0
9
35.5
8 HPI
Figures in the parenthesis indicate the ranking of the district according to the Index.
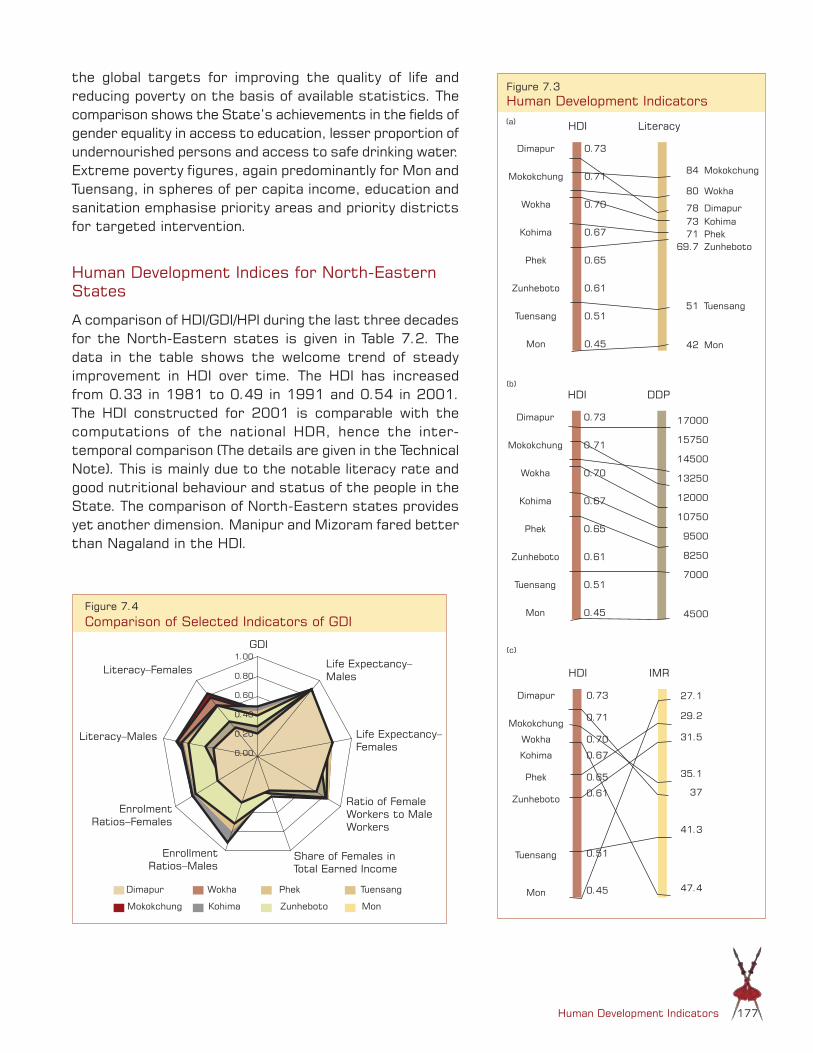
Human Development Indicators 177
Figure 7.4 Comparison of Selected Indicators of GDI
Literacy–Females
Literacy–Males
Enrolment Ratios–Females
Enrollment Ratios–Males
Share of Females in Total Earned Income
GDI
Life Expectancy–Males
Life Expectancy–Females
Ratio of Female Workers to Male Workers
1.00
0.80
0.60
0.40
0.20
0.00
Dimapur
Mokokchung
Wokha
Kohima
Phek
Zunheboto
Tuensang
Mon
the global targets for improving the quality of life and reducing poverty on the basis of available statistics. The comparison shows the State’s achievements in the fields of gender equality in access to education, lesser proportion of undernourished persons and access to safe drinking water. Extreme poverty figures, again predominantly for Mon and Tuensang, in spheres of per capita income, education and sanitation emphasise priority areas and priority districts for targeted intervention.
Human Development Indices for North-Eastern States
A comparison of HDI/GDI/HPI during the last three decades for the North-Eastern states is given in Table 7.2. The data in the table shows the welcome trend of steady improvement in HDI over time. The HDI has increased from 0.33 in 1981 to 0.49 in 1991 and 0.54 in 2001. The HDI constructed for 2001 is comparable with the computations of the national HDR, hence the inter-temporal comparison (The details are given in the Technical Note). This is mainly due to the notable literacy rate and good nutritional behaviour and status of the people in the State. The comparison of North-Eastern states provides yet another dimension. Manipur and Mizoram fared better than Nagaland in the HDI.
Figure 7.3Human Development Indicators
0.73
0.71
0.70
0.67
0.65
0.61
0.51
0.45
84
80
787371
69.7
51
42
Dimapur
Mokokchung
Wokha
Kohima
Phek
Zunheboto
Tuensang
Mon
Mokokchung
Wokha
DimapurKohimaPhekZunheboto
Tuensang
Mon
HDI Literacy
(b)
0.73
0.71
0.70
0.67
0.65
0.61
0.51
0.45
17000
15750
14500
13250
12000
10750
9500
8250
7000
4500
Dimapur
Mokokchung
Wokha
Kohima
Phek
Zunheboto
Tuensang
Mon
HDI DDP
0.73
0.71
0.70
0.67
0.65
0.61
0.51
0.45
27.1
29.2
31.5
35.1
37
41.3
47.4
Dimapur
Mokokchung
Wokha
Kohima
Phek
Zunheboto
Tuensang
Mon
HDI IMR
(c)
(a)

Nagaland State Human Development Report178
Box 7.3
Level of Human Poverty in the Millennium Development Goals
Target Indicator Level of Human Poverty (x= value of indicator)
Extreme Medium Low
Halve the proportion of people whose income is less than $1 a day
GDP per capita (PPP US$)
Nagaland: Per capita DDP; (Sample survey)
x < 3,500(x< Rs 21,175)*
Nagaland
3500<x<7000(Rs 21,175<x< Rs42,350)*
x>7000(x>Rs 2,350)*
Halve the proportion of people who suffer from hunger
Under nourished people (%)Nagaland: Under nourishment in children (at % below –3 SD); (NFHS II)
x>25 10<x<25 x<10Nagaland
Ensure that children everywhere will be able to complete a full course of primary schooling
Net primary enrolment ratio (%)
Nagaland: enrolment ratios
x<75Tuensang, MonMokokchungWokha
75<x<90Kohima, Dimapur Phek, Zunheboto
x>90
Achieve gender equality in education
Ratio of girls to boys in primary and secondary education (%)
x<80 80<x<90Kohima
x>90Mon, TuensangPhek MokokchungWokha DimapurZunheboto
Reduce under five mortality by two-thirds
Under five mortality rates (per 1000 live births)
Nagaland : Infant Mortality rates (computed for this Report)
x>100 30<x<100TuensangDimapurMokokchungWokhaKohimaZunheboto
x,<30PhekMon
Halve the proportion of people without sustainable access to safe drinking water
Population with sustainable access to an improved water source (%)
Nagaland: Percentage of Fully & Partially covered villages with safe drinking water (State PHED)
x<75 75<x<90
Dimapur
x>90TuensangMokokchungWokhaKohimaZunhebotoPhekMon
Halve the proportion of people without access to improved sanitation
Population with sustainable access to improved sanitation (%)
Nagaland: Proportion of households with own toilets (sample survey for this Report)
x<75TuensangWokhaKohimaPhekMonDimapur
75<x<90Zunheboto
x>90Mokokchung
Source: Human Development Report 2003Note: Indicators used for Nagaland and their sources given in Column 2
* Estimated using PPP Conversion Factor 2001 for India (7.8) as in World Development Indicators and Exchange Rate of Rs 47.19 per $

Human Development Indicators 179
Gender disparity index is a useful summary measure to compare human development between sexes. Nagaland has consistently maintained a GDI of 0.7 and above in comparison to the national average of 0.6. This is mainly because of the Naga culture of equal care for the girl child. Naga tribal values and practices have provided a unique framework of gender relations and access to health and nutrition. The contributing factors to the notable GDI in Nagaland are education and the improving opportunity for livelihood. However, a decline in the GDI, and consequently the ranking of the State, was witnessed during the decade 1981–91. The figures of 2001 are not comparable with those of 1981 and 1991, as different methodologies have been used to construct the gender disparity indices in NHDR and the gender-related development index in NSHDR. Policy intervention and mobilisation of public opinion for removal of gender differentials, especially in employment and education, will be vital to ensure parity in the conditions and achievements of men and women.
The comparison of HPI of the various North-Eastern states as also all India HPI during 1981 and 1991, shows that there is an improvement in the indices. This reveals a reduction in the percentage of people deprived of the minimum needs over the past two decades. The HPI for Nagaland, which was 49.37 percent in 1981 was reduced to 42.02 percent in
States Human Development Index Gender Disparity Index Human Poverty Index
1981 1991 1981 1991 1981 1991
Arunachal Pradesh
0.242(31)
0.328(29)
0.537(28)
0.776(18)
59.86(32)
49.62(30)
Manipur 0.461(4)
0.536(9)
0.802(3)
0.815(3)
50.82(21)
41.63(21)
Meghalaya 0.317(21)
0.365(24)
0.799(12)
0.807(12)
54.02(26)
49.19(28)
Mizoram 0.411(8)
0.548(7)
0.502(18)
0.770(6)
47.97(18)
32.20(14)
Nagaland 0.328 (20)
0.486(11)
0.783 (16)
0.729 (21)
49.37(19)
42.07(22)
Sikkim 0.342(18)
0.425(18)
0.643(23)
0.647(20)
52.76(25)
34.84(17)
Tripura 0.287(24)
0.389(22)
0.422(31)
0.531(29)
51.86(22)
44.89(24)
All India 0.302 0.381 0.620 0.676 47.33 39.36
Source : National Human Development Report, 2001Note: Figures in parentheses are the ranks for respective indices. States arranged in alphabetic order
Human Development Indices for North-Eastern States Table 7.2
Nagaland State Human Development Report180
1991. Among the various states, the rank of Nagaland in HPI stood at 19 in 1981 and slid to 22 in 1991. Though there was a reduction in the value of index in the last decade, the values were higher than the all India average. This highlights the need to provide for the minimum basic requirements of the people in the State. Among the North-Eastern states, Manipur and Mizoram were better off than Nagaland in HPI.
III. Technical Note
In working out the methodology for constructing the indices for Nagaland, the major constraint was the unavailability of data, especially at the disaggregated district level. This was particularly relevant given that the emphasis here has been on constructing the indices at the district level. Unlike some of the other well-established states, very few secondary sources of data were available for statistics on demographic indicators at the district level for Nagaland. Hence, in constructing the indices we have largely relied on data provided by the Department of Economics and Statistics (DES), Government of Nagaland. While most of the data relates to 2001, some of the data is taken from the survey conducted by the DES in April 2003. Where neither of these sources were sufficient, we have used district level data available in Census, 1991, and extrapolated, wherever possible, to obtain the numbers for 2001. Since Dimapur was a part of Kohima district in 1991, we have used the figures of Kohima for Dimapur district.
The Indices
Human Development Index
The HDI is a summary measure of the income, education and health achievements of the districts. In calculating the HDI, the non-availability of data, as mentioned above, was a major problem. Ideally, the district domestic product (DDP) would be calculated, like the SDP or the country’s GDP, by using a combination of methods. For instance, in some sectors, the income approach would be suitable while for others (agriculture in particular) the production method would be considered appropriate. A third way is the expenditure approach but this is generally considered unsuitable for underdeveloped economies because consumers and small producers alike usually don’t keep records of transactions.
Nagaland’s economy is largely an agriculture-based subsistence economy, with the agricultural sector accounting for about 30 percent to SDP and employing nearly 70 percent of the population. In addition, the dominant sector in industry is the construction sector, and in services, public administration. Unfortunately, even for these three sectors, no data was available at the district level. Hence, a survey was commissioned in April 2003, for all the districts of the State for the purpose of this Report. The survey was conducted by the DES staff.
In working out the methodology for constructing the indices for Nagaland, the major constraint was the unavailability of data, especially at the disaggregated district level.

Human Development Indicators 181
Due to time constraints only a one-off survey was conducted. Hence, comparability with the Census data, where both 7- and 30-day recall periods are used, is limited. However, a stratified, purposive sample of about 9716 respondents was selected. The sample was constructed district-wise and by using rural and urban segments. In stratification, the size of villages was the basis of selection in the rural areas. In urban areas the corresponding unit was the block. The random sample within each strata included 10 percent of the villages (or blocks). However, very small villages were left out of the sample.
To compute the DDP, the average income of the respondent in a district was first noted. This was multiplied by the total actual population of the district to arrive at a figure for the total district income, which was used as a proxy for the DDP. For cross-checking a comparison was made between the implied income of the State (alternatively by adding DDPs of all the districts) and the figures available for NSDP of Nagaland for the latest year from the Draft Tenth Five Year Plan document and the Handbook of Statistics of Nagaland, 2001. The survey figures proved to be an underestimation by only about 10 percent when compared with the figures in the Draft Tenth Five Year Plan document and were almost the same as the DES figures. Hence the survey figures (with some adjustment) were used for the DDPs.
Once the district DDPs, YD, were calculated, they were converted to indices, X1, for use in constructing the HDI. In some other state reports (for example, HDR in Karnataka, 1999) Atkinson’s method of discounting incomes above a certain level was used along with estimates of purchasing power parity to relate the incomes to global incomes. This was not suitable for imperfectly integrated agrarian economies like Nagaland. Similarly, no data was available to calculate the inflation adjusted, consumption inequality index suggested by the Planning Commission. Therefore, we have used a simple method of indexation by defining
X1i= (log YDi – log Ymin )/( log YMax– log Ymin),
where i= 1 to 8, for the eight districts of Nagaland and Ymin is taken as the minimum per capita income level to define the poverty line. The per capita poverty consumption level for Assam was taken from the NHDR, 2001, Planning Commission, and converted to per capita poverty level of income assuming an average propensity of consumption to be 0.8 (Rs 4,200/-). Finally, the YMax was taken to be the per capita income of Delhi in 2001 (Rs 38,864/-). The use of logs in defining X1i eliminates the need to use price indices to convert nominal to real variables. In this, we have followed the approach used in the Rajasthan Human Development Report, 2002.
In calculating the HDI indices for earlier years, the NHDR 2001 uses the inflation and inequality adjusted monthly per capita consumption expenditure instead of the district domestic income (DDIs) which we have
Nagaland State Human Development Report182
used. The adjustment for inequality was done using the Gini measure of inequality. This implies that greater weightage is given to per capita incomes of states (districts) with more equally distributed consumption expenditure.
The adjustment for inflation was based on the state-specific poverty lines (see, NHDR, Table 2.5). However, in the NHDR the poverty lines used for Nagaland were calculated assuming the poverty ratios for Assam.
In district level analyses, these adjustments could not be used. The calculation of the Gini coefficient required the NSS district level data on individual per capita consumption. This was not available. In addition, the Assam poverty level data used in the NHDR was an overestimate for Nagaland. Hence, the NHDR calculations of the HDI for Nagaland would tend to have a downward bias. To put it another way, since we were not adjusting the district incomes to reflect income inequalities, our index would give excessive weight to districts with high per capita incomes.
To illustrate this we calculated the HDI for Nagaland for 1991 using data given in the NHDR and our methodology. The calculated figure for 1991 was 0.51 as compared to the NHDR figure of 0.486 for that year. The upward bias in the present figure came from the lack of any data on life expectancy for 1991. And the estimated figures used for 2001 became somewhat high compared to the national average. Hence, the HDI figure of 0.56 for 2001 is an overestimate in comparison to the NHDR methodology.
The educational achievements are summarised by the literacy rate LE and the intensity of formal education, FE. For FE we have used the school enrolment ratio for population in the age group 6–18 on the basis of data supplied by the DES, Nagaland. While we had actual data according to districts and sex as per enrolments up to higher secondary level for 2002, the district level data on total population by sex and age group were available only for 1991. Hence, we calculated the proportion of population 6–18 by sex for 1991 and applied this proportion to the total population of 2001 to get district and sex wise data for 2001. This was used in the denominator for calculating the enrolment ratios for 2001.
The indices for literacy and enrolment are defined as
LIi = LEi/100 and FIi=FEi/100
where i is indexation for the 8 districts of Nagaland.

Human Development Indicators 183
The educational index is then defined as
X2i = 0.35*LIi + 0.65*FIi and i= 1…8.
Finally, the health achievements were summarised using the indicator life expectancy at age one EH and the IMR, MH. District level figures were unavailable for these indicators. So the 1991 Census life tables on the number of children born and surviving to every married woman were obtained. Using the software, MORTPAK LITE, we then obtained district-wise data on EI and MI using what is known as the South Asian model. These numbers were used as estimates of life expectancy at age one. In the case of the IMR, we looked at the aggregate changes in IMR between 1991 and 2001 and applied the same proportion reduction to district level data for 1991 to arrive at district-wise figures for IMR for 2001. Assumption was made that all districts have been equally efficient in reducing their IMR during the nineties. To calculate aggregate IMR, the male IMR and female IMR figures were weighted by their share in total population.
In converting the E’s and the MI’s to indices we used the minimum and maximum levels suggested by the NHDR, 2001, Planning Commission. Hence we have
EIi = (EHi – 50)/(80–50) and
MIi = (MHi – 20)/100–20)
and i indexes the districts.
However, in calculating the composite index X3 one cannot use MIi as the index must be inversely proportional to the level of MHi, the IMR. Hence we have,
X3= 0.65*EIi + 0.35*(1–MIi ) for each of the i districts.
Then we have ,
HDIi =1/3 * (X1i + X2i + X3i) for each district i.
Gender-related Development Index
In calculating the GDI, we have followed the procedure laid down in the Human Development in Karnataka, 1999. The objective was to convert the HDI into an index which adjusted for differences between males and females in the various indicators. For each of the income, education, and health indices this adjustment was done to derive the GDI.

Nagaland State Human Development Report184
Adjustment for Income Index:
It is usual in indices calculated by the UNDP to use the relative wages of male and female workers (agricultural, non-agricultural or overall) to make corrections to HDI. Let the wages of male and female workers be WM and WF. Then we can define the average wage, W, as
W = PF E * WF + PM E * WM, where the P’s represent the proportion
of females (PF E ) and males (PM E) in the economically active work force.
Then it follows that
WF /WM * PF E + PM E = W/WM
Also WF/W = (WF /WM)/(W/WM)
So if we know the proportion of males and females in the economically active population and the relative wage rates we can find out the shares of males and females in average wage. Given this the shares of females and males in the total earned income is given by
IF = WF /W * PF E and IM = WM /W * PM E
To obtain the correction Factor IY to the DDPs we use the distribution function given below.
IY = [ PF * IF (1-e) + PM * IM (1-e) ] (1-e) ………………………..(A)
Where PF and PM are the population shares of females and males respectively. The distribution parameter, e, is taken to be 2 as in other studies. It is clear, in the above function, that if WF= WM and the P’s .are the same for the two populations, then IF=IM , there is no gender discrimination and Iy =1. Hence, the gender corrected incomes are calculated by applying IY to the DDPs calculated for the HDI.
In our calculations we were unable to obtain any estimates of the relative wage rates. However, economic studies generally show a close relation between the literacy levels and the income levels. Hence, as a proxy for relative wages we have used the relative literacy rates of females and males available by districts.
Similarly, the other indicators of health and education were calculated separately for males and females as done in the aggregate for the HDI. Once again, these separately calculated indices were combined using the distribution function (A). In calculating the health indices for men and women, we used separate numbers for the minimum and maximum levels of life expectancy for men and women. Following the UNDP guidelines we used the maximum and minimum values for males to be 87.5 and 27.5 years and for women, 82.5 and 22.5.

Human Development Indicators 185
Human Poverty Index
Here we have followed the procedure laid down in the UN Global Human Development Report. The formulation was also given in the Planning Commission’s National Human Development Report cited earlier. This index aggregates the deprivation in health, education and economic dimensions of the people. The index is calculated as
HPIi = [1/n * (P1a + P2
a + P3a + …. Pn
a )]1/a
In general the measure is defined for three indicators of deprivation of health, education and economic well being. In the above formula the various P’s are used in percentage form. As is clear from the definition above, if there is no deprivation so that Pi = 100 for all i, then HPI equals 100. Hence high values of the HPI indicate greater levels of deprivation. The range of the index is 0 to 100. Here the exponent a measures the weightage given to the largest deprivation factor. If a=1 then the HPI becomes a simple average of the deprivation factors, P1, P2 , etc. As a tends to infinity, the value of the index tends towards the value of the largest deprivation factor. Following the Planning Commission’s Human Development Report and suggestions of the UNDP’s Global Human Development Report, we have used a=3 in our calculations. This gives some but not undue weightage to the largest deprivation factor.
In our calculations, P1 measures the health deprivation, P2 the educational deprivation and P3 the economic deprivation/ population below poverty line.
The UNDP and the Planning Commission have suggested that P1 be approximated by the proportion of persons not expected to survive to 40 years. We have already noted that all figures on demography from Census 2001 were not available at the time of writing. Since no data on P1 was available we have ignored this in our calculation. P2, the composite indicator on educational deprivation, is defined as
P2= .35*(1–LI) + .65*(1–FE)
Where LI and FE have already been defined earlier. Hence, P2 is a composite measure of the degree of illiteracy and the non-enrolment of children in schools.
Finally, P3, the indicator for economic deprivation, is defined as the simple average of the proportion of population below poverty line, P31, the proportion of children denied basic medical facilities at birth, P32, the proportion of population living in kutcha houses, P33, and the proportion of population not having basic amenities, P34. Figures for P31 and P32
were provided by the DES. It should be clarified that our figures on P31 reflect the proportion of BPL population. This information was supplied

Nagaland State Human Development Report186
by the State Urban Development Agency and the Rural Development department for urban and rural areas, respectively. In the rural areas the BPL population is defined as those getting an annual household income of Rs. 22,000 and in the urban areas, those with per capita annual income of Rs.6000. Figures for P33 and P34 were obtained from the survey of 2003 referred to earlier. For P34 we used figures on lack of access to own toilet as our proxy for basic amenities.
The district-wise estimates for HDI, GDI and HPI have been provided in the main text of the report. It would have been ideal to present estimates for 1991 and 2001 for comparability over time. However, non-availability of data on DDPs precluded such a venture. Hence, our estimates give a relative picture of the districts at a point of time. Second, because of definitional problems, inter-state comparisons must be conducted with some degree of caution. However, our estimates do give a definite indication as to which districts need special attention in the near future. Finally, at the aggregate levels, our estimates suggest comparability with aggregate indices for Nagaland calculated by agencies like the Planning Commission.
The primary difference from the NHDR estimates lies in the calculation of the HDI. The NHDR used per capita monthly expenditure adjusted for inequality and inflation. However, for 2001, no NSS figures for per capita monthly expenditure were available at the district level. These are necessary to calculate the Gini coefficient for inequality in per capita consumption expenditure. In addition, NHDR used poverty levels to estimate inflation. Since, the NHDR has used the Assam poverty line figures for Nagaland, there would tend to be an underestimation of the HDI for Nagaland. In any case, in the absence of data we have not adjusted the per capita DDP figures used by us for inequality in this report. This might impart an upward bias to estimates for both HDI and GDI. Consequently, intertemporal comparisons of figures must be done with some degree of caution.
However, since the estimates present HDI and GDI figures at the district level for the first time they would serve as benchmarks for evaluation in future work on human development.
Further Suggestions
The main constraint to calculating the indices for Nagaland has been the paucity of statistics available at the district level. It is also unfortunate that crucial Census data compilations are not available except after unacceptably long time lags. Similarly, the NSSO estimates are particularly a problem for small states like Nagaland, where the state sample size is too small to generate statistically reliable information. Thus, except for Census figures, data on DDPs and demographic indicators were not available on a comparable time series basis. Even

Human Development Indicators 187
at the aggregate level, Central agencies have generally used the figures of Assam as applicable to the State of Nagaland. This was true even for important indicators like the poverty level. While this may present a distorted picture of socio-economic developments in the State, an unfortunate consequence has been that the State statistical agencies have not appreciated the need to collect such data on a continuing basis at the State level. In addition, even secondary data sources were not available to obtain proxy figures where possible.
The principal problem seems to be the somewhat secondary status given to data collecting agencies at the State level. It is crucial to upgrade the status of the DES so that such statistics may be available on a continuing basis. This is particularly crucial for statistics like the DDPs, where little information is still available. At the very least, periodic surveys must be conducted on this crucial economic indicator.
The need to upgrade the status of the DES is particularly urgent as many of the statistical staff still lack computer training and most calculations are still conducted on hand held calculators. Where organised collection and availability of district level data is concerned, there is no option but to computerise the data collection process. This would involve not merely provision of the relevant hardware but also upgrading the statistical and computer skills of the specialised statistical staff up to the district level.
Prof. Manoj Pant, the Economic Adviser to the Government of Nagaland, who computed the Human Development Indices for this NSHDR, has prepared the Technical Note.
Sample Survey for NSHDR
Sample survey was conducted both in urban and rural areas of Nagaland for estimating the district domestic product. Ten percent of villages and 15 urban blocks in the State were selected through purposive random sampling. The procedure adopted for the rural and urban areas is given below.
Rural Areas
The sample for rural areas covered 10 percent of the villages of each district. In each block of the district 10 percent of the villages were selected. Villages with less than 50 households were not selected. In each village, 10% of the households were selected for survey.
Urban Areas
For the purpose of carrying out surveys, NSSO prepares urban frame survey (UFS) maps. In the UFS maps, each town is bifurcated into blocks.
The principal problem seems to be the somewhat secondary status given to data collecting agencies at the State level. It is crucial to upgrade the status of the DES so that such statistics may be available on a continuing basis.

Nagaland State Human Development Report188
Urban samples were selected by random method taking one or more of the UFS map blocks depending on the size of the town. Ten percent of the households in each urban block were selected.
District Total Number of
Villages Selected Urban Blocks Selected
Households Selected
Population Size Selected
Mokokchung 11 1 204 901
Mon 11 1 185 959
Wokha 11 1 254 1279
Zunheboto 19 1 224 837
Tuensang 22 1 365 1779
Phek 10 1 292 1127
Kohima 19 6 416 3239
Dimapur 19 3 272 1369
Total 122 15 2212 11490
Table 7.3 Sample Size

Chapter 8
Nagaland 2020 – A Vision

Nagaland State Human Development Report190
“Nagaland of our future”
“An evergreen State, the Switzerland of the East, “an Eden on Earth”, where people live free from fear with all the “-isms” and divisions never to rise again. Living peacefully ever, becoming a model State, where education is a continuous process in the pursuit of excellence in every field, that the people become not only self-reliant but the State becomes a giving State. Our education system provides the highest quality education to produce statesmen of international stature, peacemakers, Nobel Prize winners and Oscar awardees. People who are bench-markers in all professional fields.
“We envision a confident, sincere and vigorous people who are god fearing, constructive, appreciative, full of enthusiasm and committed to the fulfillment of our dreams. Deeply rooted in our culture, we envision our tradition and customs as a window to the world.
“Health for all, where every village is equipped to battle any disease through highly dedicated doctors and nurses. Future Nagaland has no discrimination between men and women.
“We envision the churches in Nagaland to be strong enough to withstand all evil forces to keep the institution pure and acceptable to go out and be a catalyst for change.
“Finally, Nagaland emerges not only as the top economically sound State with its people enjoying the highest standard of living, but also as the epicentre of trade for the whole
of South-East Asia.”
–Vision Statement for Nagaland by young participants, as developed during the Imagine Nagaland workshops, 2001

Nagaland 2020 – A Vision 191
“Where there is no vision, the people perish.”
Proverbs 29:18
D reams that are converted into visions and visions transformed into action create the reality in which the
people prosper and progress... is the philosophy based on which our Honourable President Dr APJ Abdul Kalam has written India 2020—A Vision for the New Millennium. His document has stimulated thinking, discussion and action across the country. The central theme of his vision is “Can India become a developed country?” To answer this question adequately, it is necessary for all of India to ask similar questions and develop new visions and paradigms to attain our dreams of becoming a developed country. Nagaland also needs to have such futuristic perspectives. It is with such intention that this chapter has been added to the Nagaland State Human Development Report.
The Will to Excel
Nagaland attained statehood in December 1963 and became the 16th State of the Indian union. The past four decades have been very eventful for Nagaland. In the preceding chapters of this first Nagaland State Human Development Report, attempts have been made to capture the significant areas of Naga history and tradition, governance, income and livelihood, education, health and women’s participation. There is a common thread that connects these human experiences with the overall quality of life. Although, in comparison to other developed parts of the country, there are many areas in which the State is deficient, there are also extraordinary changes, especially in governance and development outreaches, that have taken place with a rapidity which is difficult to articulate adequately. These human experiences, in the span of a mere 40 years of statehood, have affected the overall quality of life of the people. They have meant a tremendous leap from the traditional to the modern in the race to attain development. Given Nagaland’s overall background, it is nothing less than astonishing that in certain areas of human development indicators, Nagaland has surpassed even the Indian national average. Furthermore, such achievements have taken place in an atmosphere surcharged with prolonged and relentless insurgency. They indicate the inner reservoir of resilience of the people and ability to adapt, their zest for life, and their fierce determination to survive and succeed in the midst of adversity.

Nagaland State Human Development Report192
This chapter is an attempt to provide a perspective for a ‘Developed Nagaland’, by 2020, through providing a conceptual basis, rooted in what is possible and practical on the ground. This requires strategic thinking and holistic planning, pooling together of resources, fusing available/future structures within connected frameworks, etc. The chapter has, therefore, tried to identify and prioritise the core strategies and programmes that will create a developed Nagaland.
Peace: The Basic Pre-requisite for Inspiration and Hope
Violent insurgency has not only pre-dated statehood but also played a major role in the very formation of Nagaland State. Throughout the State’s existence, insurgency has been a part of life in Nagaland. Not surprisingly, the vast majority of the Nagas deeply long for peace and security. Slowly, this deep desire of the people built into a groundswell and has led to the present peace process, finding culmination in the signing of the cease-fire agreements with the NSCN-IM in 1997 and the NSCN-K in 2001.
It is hoped that the peace process would culminate into a settlement of the long-standing, over half a century old Naga political issue. With the freedom of peace, the mind without fear, and beliefs without confusion of violence, the Naga people, with their tremendous potential, will embark on a focused journey into the future.
Box 8.1
Developed Nagaland: SWOT AnalysisSTRENGTHS Abundant fertile land Agro-climatic conditions for diversified cropping Organic by default Rich biodiversity Abundance of oil, gas and mineral reserves Presence of strong village level institutions Widespread use of English
WEAKNESSES Uncertain political environment Subsistence agriculture Traditional land holding Poor State finances and inadequate taxation Inadequate road, power & telecom infrastructure Lack of effective credit mechanism Weak market linkages for agro-products Under-developed trading and marketing centres Educated unemployed youth
OPPORTUNITIES Organic farming for international markets Timber and non-timber forest produce Spices, horticulture and agro-processing Medicinal, aromatic plants and floriculture Animal husbandry and fisheries Mineral and other natural resources International trade regimes Physical proximity to ASEAN countries
THREATS Perceived food insecurity Possible increase in rural unemployment Market-related cash crops – Pricing and demand Delayed development of infrastructure Continued uncertainty in peace process Migrant labour in foothills International trade regimes
Source: Analysis on Nagaland by LEAD India

Nagaland 2020 – A Vision 193
Box 8.2
An Agenda for Peace and Development
“How do we bring peace?” is a crucial issue for Naga society. What is of even more immediate relevance is, “How do we prepare our society for life in peace?” The changeover from conflict to peace takes a lot more than rhetoric. As Nagaland looks forward, the following areas will be crucial.
Overcoming the immediate impact of prolonged violence, especially in the areas of trauma and psycho-social well-being of the people.
Rebuilding and reconstruction are most crucial, especially in the areas of revival of traditional institutions and providing a sense of security about cultural identity, as well as emotional and psychological well-being.
Visions and ideals linked to the unique traditional setting of Nagaland and preparation for a more peaceful, economically viable and just society. For this, multiple Think Tanks must be promoted.
Provide facilities/amenities to rural areas not only to arrest unemployment but a lso to promote economic growth and sustainable development. This will also ease urban pressure.
Identify areas of strength and weaknesses, especially in the areas of natural resources like biodiversity and forest cover and build on them. These will protect the Naga legacy and bring ‘real’ wealth.
The Fruits of Peace
With peace, the reforms and restructuring process, both in civil society and the Government, would take place at a rapid pace. The various efforts at governance reforms initiated in the late nineties and the early 2000 through various exercises like the Imagine Nagaland and Good Governance workshops, Transparency & Accountability Seminar, motivational workshops, PRA exercises, capacity building programmes and so on, would take roots and the processes would bring about many positive changes in the Government, giving it a direction and purpose. The governance of the State would be rationalised to meet the imperatives of globalisation and market economy. Transparency, accountability and responsiveness would be a premium in Government.
Within the society, the growing awareness among the people regarding their own roles in the development of the land would mature, shifting the onus of development away from the Government to the people and adding to the rapid pace of growth and development. The emerging third sector—the voluntary sector—would have been transformed to play a crucial role in the development processes of the State. The policy of Communitisation would gain full momentum and the involvement of the people in their own welfare would transfigure the course of development. The VDBs and the APMCs would go into commercial mode and the private sector would bloom, with the eighties’ and nineties’ generation evolving their own paradigms of survival and growth. This generation would set in motion a process of ‘re-inventing’ Nagaland.
The people who were born in the eighties and the nineties provide a signal of hope, and in the years to come, this generation will shoulder more responsibility and will particularly and substantially contribute to the vision of development and prosperity. The talents represented by artists, poets and authors are also growing in number. This trend will continue with a greater momentum. The Government will pursue policies to enable the youth to acquire scientific and technical knowledge, which is a pre-requisite for development in a globalised world. Such talents will help realise the vision of a developed and prosperous Nagaland.
To quote the Hon’ble Chief Minister, Shri Neiphiu Rio, “The priority areas for the Government are peace and development. There is mass support from the civil society today for this agenda. The Naga youth are extremely talented. We hope to invest in nurturing their talent and energy. We want everyone to work, including the youth. This will give us a chance to build a new work culture and give up the gun culture. A positive experience in life and work will help

Nagaland State Human Development Report194
Box 8.3
2004: Year of Youth Empowerment
The role of youth and their contribution are vital for the development of Nagaland. All efforts have to be made to provide every youth of the State with the opportunity and the motivation to be socially and morally good, intellectually competent and disciplined, full of hope for the future and determination to succeed, to be physically strong, spiritually faithful and deeply anchored in the traditional values of the Naga society. With this objective, 2004 has been declared as the Year of Youth Empowerment by the State.
For the youth to play a pivotal role in the development of the State, it has to be ensured that every young man and woman is gainfully employed and provided with opportunities to develop his/her capacities and functional capabilities. Further, a large population of unemployed or dissatisfied youth has the potential to create a socially tense situation. To wean away the youth from possible frustrations due to unemployment, which could lead to substance abuse and antisocial activities, and to bring them towards remunerative and productive activities is a priority of the Government.
Recognising that the focus of future employment generation will be less in the Government sector, and more in the organised and unorganised private sectors, the Government is trying to play the role of facilitator. The Chief Minister’s Corpus Fund for Generation of Self-employment attempts to supplement the efforts of the various departments for developing the capacities of the youth to earn sustainable livelihoods for themselves in the State. The Hon’ble Prime Minister, during his visit in October 2003, had graciously announced an employment package for unemployed youth, and Rs 250 crore have been earmarked for assisting 25,000 youth to be self-employed in various activities which generate sustainable income.
The State Government is in the process of drawing up a comprehensive employment strategy to facilitate the creation of employment opportunities in different sectors. Focus areas are agriculture and allied sectors; small-scale industries, including the traditional handloom and handicraft sectors and the sunrise sectors such as IT; strengthening the industrial base of the State based on local resources; developing the employment potentials of tourism and specific strategies for tertiary sector and unorganised sector. In carrying out its role as facilitator of creation of self-employment opportunities, the State Government ensures proper utilisation of assistance through sizeable loan components from banks and financial institutions and limited but focused subsidy grants.
Other areas for empowerment of the youth entail:1. Mobilisation of both student and non-student rural youth.2. Providing adequate educational opportunities and capacity building.3. Promote women welfare and provide opportunities for self-employment.4. Access to information in respect of employment opportunities, including entrepreneurial guidance and financial
credit; technological support and marketing linkages.5. Facilitate the formation of consortiums—in diverse range of activities from construction, masonry, repair
of roads, agricultural services, medical services, veterinary services, insurance, etc.6. Involvement of youth in the Communitisation initiatives and State interventions such as APMCs. 7. Promoting healthy lifestyle amongst youth by building a social environment and infrastructure which prevents
drug abuse and alcoholism. Dissemination of information and creation of awareness about issues of health, hygiene and nutrition, the increasing dangers of HIV/AIDS.
8. Promotion of sports and games, with special attention to indigenous sports through State Sports Policy.9. Promotion of scientific and technological talent among youth.
Nagaland 2020 – A Vision 195
us value the opportunity we have to transform Nagaland. This will also give the youth hope for the future. Good governance and participation of people will be vital in working for a developed Nagaland”.
Population Stabilising: A Pre-requisite for Fast Paced Progress and Equitable Development
The State Population Council is already in place with the Chief Minister as the Chairperson and it is expected that a rational and scientific State Population Policy would be adopted through the Council at the earliest. By 2020 the total fertility rate (TFR) would be brought down to below 2.1, the replacement level, and the population levelled off to about 30 lakh, growing at the rate of 1.5 as at the national level envisaged by the President in his vision for the country. This could be brought about with a set of comprehensive measures adopted at the earliest (See Box. 8.4).
Box 8.4
Strategies for Population Stabilisation
Address the unmet needs for basic reproductive health services, infrastructure and contraceptive supplies through various outlets, such as
Government agencies (Health Centres) Private sector/practitioners, including those practising the indigenous system of medicine and homoeopathy
(ISM & H) Community and NGOs in the form of setting up depots/centres for contraceptives and social marketing
Promote delayed marriage for girls, not earlier than 18 years and preferably after 20 years of age; Bring about universal access to information, counselling and services for fertility regulation and contraception
with a wide basket of choices. Promote vigorously the small family norm through all available communication channels, including the Church
forums, Village Health Committees and other community-based organisations and village authorities; Put in place a proper health management information system (MIS) with the help of information technology to
do morbidity/mortality surveillance, data processing, and to keep track of the inputs of health/medical services and their impact.
Undertake an anthropological study of the Naga cultural traits (attitudes, practices, beliefs, etc.) that hinder adoption of small family norm. Specific strategies will be worked out on the basis of the findings of the study.
Encourage much greater role of males in family planning and population stabilisation. Take policy decision to post the existing trained dais (those who have undergone 10 months training, numbering
about 300) now employed under the Departments of Health & Family Welfare and Rural Development to the villages which have no sub-centres.
Equip PHCs to function as contraceptive centres. Provision of referral services/facilities between the community and the PHCs and community health centres
(CHC). Adopt a State Population Policy through the State Population Council, so that population stabilisation may be
taken up as a mission. Give community incentives to villages doing well in compulsory registration of births, deaths, marriages,
pregnancies, universalising small family norm, increasing health personnel-assisted deliveries, and reducing infant mortality and maternal mortality. Incentives could be in the form of Governor’s Commendation Certificate, Governor’s gold medal, preference given for community development schemes, etc.
Bring about convergence of service delivery at village level by the various health related Government departments, including active involvement of the Village Councils, Village Health Committees, Mahila Swasthya Sangh, Church organisations and NGOs, etc.
Nagaland State Human Development Report196
National and International Connectivity
The dynamic transformation of the Indian economy in the next two decades would have tremendous spin-off effects on the economies of the North-Eastern states. In particular, the establishment of the North East as the gateway to the Chinese and the East Asian economies, would fuel a vibrant economy for the region where a rejuvenated Nagaland, with its strategic location in the East-West corridor, would emerge as one of the conduits in the India-China-South East Asia economic convergence. Connectivity within the State, with the rest of the country and with South-East Asia in consonance with the ‘Look East’ policy of the Government of India through quality roads, air, rail and water and though IT would have to be improved. This would open up tremendous opportunities for growth and development.
Transforming a Tribal Society
The pulsating atmosphere of economic development and the pace of technological changes and advancement would generate the pressures to restructure and reform. Such reforms would include legislation on land tenure, land reforms, tax structure and so on, which are necessary and vital to develop in the present day world and at pace with the rest of mankind. A rational taxation policy would also be introduced so that those who have benefited from the process of development contribute. All these measure will not only help in creating a stable revenue and resources base, it will also aid in promoting greater social and economic accountability. It will also act as a check and balance to rationalise income and wealth. It will also enhance better reporting systems leading to more accurate data, particularly of the Census and other growth-related statistics so vital for democracy as also for visualising and projecting future economic growth patterns.
People and Wealth: Issues of Per Capita Income
In his book India 2020: A Vision for the New Millennium, the Hon’ble President Dr APJ Abdul Kalam, has argued that for India to reach a developed country status by 2020 it must reach a per capita level of around $1540 at current prices. Assuming a real exchange rate of about Rs 40 to the dollar, this implies a per capita income of about Rs 62,000. (Box 8.5). However, this would require comprehensive measures of ensuring that the pre-requisites of development are achieved, the strengths built upon, and the weaknesses addressed to the advantage of the State.
A look at the percentage of the population involved in the agriculture sector and its share in the state domestic product, it is clear that, in the immediate future (next 4 to 5 years), agriculture can provide faster growth of the economy. This will also ensure equitable growth and rural
If Nagaland continues on the agenda of reform and development it has set for itself, it too would reach its goal of a developed State by 2020.

Nagaland 2020 – A Vision 197
transformation (Box 8.7). Once the primary sector gets galvanised, due to the agricultural and non-agricultural linkages, by 2010, the secondary and tertiary sectors will also grow at faster rates. The initial momentum of marketing and manufacturing initiated in the agro-based activities will soon spark off processing industries sector, including construction, which in fact is already the fastest growing sector. Such growth, along with the prevailing peace, and sustainable exploitation of mines and minerals, which are available in abundance, will have a multiplier effect on the growth of the economy. It is estimated that the growth rate in the secondary and tertiary sectors could even double in this decade itself if the approaches are focused and peace continues to prevail. The constraints in transport and other infrastructure,
2000–01 2020
70,000
60,000
50,000
40,000
30,000
20,000
10,000
0
At current rate of growth
With population stablisation measures
Faster rate of growth coupled with population stablisation measures
1999–001998–991997–98
87269118
Box 8.5
Per Capita Incomes: Middle or Fore Ranking State in 2020?
Based on data provided by the DES, the compound growth rates (in real terms, 1993–94 prices) of the various sectors are:
Agriculture 12.2 percent
Secondary 6 percent
Real estate etc. 4.1 percent
Public Admin. 2.1 percent
Transport, Communication etc. 17.2 percent
Other transport 17 percent
35,735
21,441
11,473
62,000
10287
As per the projections of State Directorate of Economics and Statistics (DES), by 2020, the per capita income of Nagaland, at the current rate of growth, is likely to be around Rs 21,441. This projection has been made on the assumption of a population of about 53 lakh in 2020 given the current decadal population growth rate of 64 percent. It is thus clear that, to reach anywhere near the levels of per capita income of the President’s Vision 2020 statement, it is imperative that either the economic growth engine in the State is greatly accelerated or the population growth rate be brought down from the current rate to around 1.80 percent per year, a rate that progressive states like Kerala, Tamil Nadu and Goa are expected to achieve. But, given the limitations of economic growth and sustainability at the rate of population growth projected above, the only alternative is to control population growth. Therefore, Nagaland will need to adopt a concrete population policy to stabilise the population level at around 30 to 35 lakh by 2020. Assuming that this is possible, by 2020, Nagaland will still be hovering around a per capita income of about Rs 35,735 as per the projections of the DES.
It is thus clear that for Nagaland to achieve a per capita income of around Rs 62,000 by 2020 (i.e. almost double the projected level of Rs. 35,735 through population stabilisation measures), it will still have to move on a trajectory that will ensure equitable growth and sustainable development, to double its current growth rate of NSDP of 6.4 percent (at constant 1993–94 prices). Thus, the various sectors of the economy will have to grow much faster than their current growth rates, even with population control measures.
Figure 8.1Nagaland's Growth Trajectory
Current Growth Rates in Various Sectors of the
EconomyTable 8.1

Nagaland State Human Development Report198
Box 8.6
Conservation of Biodiversity—A Responsibility & Potential Wealth
Nagaland’s biggest asset, and comparative advantage, lies in her natural and forest wealth. These include, apart from minerals, the State’s biodiversity as original sources of food, traditional knowledge systems, herbal medicinal plants, etc. The State is located within the Indo-Burma biodiversity hot spot. The richness of Nagaland is shown by the fact that, without any formal scientific study of its resources in general, two of the species found in the State figure in the Guinness Book of World Records (tallest rice plant and tallest rhodendeon). For the geographical size of a State like Nagaland, this is unique, especially in the backdrop of the fact that no formal studies of biodiversity have been made. Therefore, biotechnology, which also represents one of the sunshine sectors, presents Nagaland with a unique opportunity – the discovery of just one important medicine, for instance, could mean tremendous wealth for the State. To take advantage of these vast potentials, and larger benefit of mankind, the State must ensure immediate protection and conservation of its biodiversity, especially in this period of globalisation and large-scale bio-piracy. These must be followed with adequate investments on documentation and research. As a crucial part of the original home of the world’s flowering plants, Nagaland could also turn out to be the original home of many of the world’s food species. Therefore, focus on agriculture and select crop cultivation, must not be at the cost of destruction of our precious biodiversity.
Horticulture and floriculture have tremendous potential and will greatly expand the agricultural economy while animal husbandry will help retain scarce financial resources within the State.
such as power, would be contained by 2015 with adoption of appropriate policies and natural growth in infrastructure and production, fuelled by demand-driven activities. Funds for this would be mustered by internal resource augmentation and support from the Central Government and international funding organisations through the Central Government.
Sustainable Agriculture
A rational agriculture policy and land use policy for Nagaland, aimed towards sustainable development, would soon be in place in Nagaland. Through such policies, by 2020, the present permanent forest reserve areas in the State would increase from 12 percent to 30 percent while another 30 percent surface area would have been brought under forest and tree cover through measures such as commercial plantations (10 percent), agro-forestry and cash crops under trees in the form of high value aromatic and medicinal plants (10 percent), and the present bamboo-growing areas increased from 5 percent to 10 percent. Such activities would ensure sustaining permanent tree cover areas in the State.
In such a backdrop, the net cropped area in the State, which is at present only 2,48,354 ha, or about 15 percent of the State’s total area, would be increased to 30 percent or about 4,80,000 ha. This area would be under intensive agriculture with technology changes that will include inputs as well as value addition processes in the farming areas. The full potential irrigated areas of 1,65,000 ha would have been developed from the present irrigated area of about 49,000 ha.
With this, the food grain productivity in Nagaland, which is today assessed at only 11.54 kg per capita per month, as against 79.19 kg per capita per month in Punjab, will increase to at least 44 kg per capita, bringing the food grain production to a level of about 12 lakh MT.
Enhanced technology like the GIS, based on satellite and computer information systems, as well as soil and weather imaging, would enhance selective, scientific precision systems of cultivation through

Nagaland 2020 – A Vision 199
agro-climatic zoning. Understandably, for a State like Nagaland, organic production will have to be the focus area. Horticulture and floriculture have tremendous potential and will greatly expand the agricultural economy while animal husbandry will help retain scarce financial resources within the State. Organised market and market economy would replace the present subsistence economy. Contract farming, in various areas of selected crops, whether traditional agricultural crops or newly identified items, such as herbal medicines, would not only further boost production and earnings but also open up more opportunities for economic growth through research and development and secondary sector. While retaining the Naga knowledge systems and practices of traditional terraced agriculture, which were highly developed, there would also be space for inputs of modern technology systems, resulting in a fusion of the traditional and the modern.
One of the departments, within the wider framework of agriculture, which has achieved an enviable record in recent years, is the Veterinary and Animal Husbandry Department. This department has embarked on a road map to make Nagaland self-sufficient in meat and livestock products. The department’s efforts have resulted in Phek district producing sufficient meat for local needs and the banning of meat imports from outside, a first in the State and the region. Similarly, the Department’s KOMUL initiative is another success story. There is also a Mithun Mission. All these efforts are having tremendous impact in the State, and inspiring the youth to take up animal husbandry efforts. In turn, they will raise not only the commercial scale production line up in these products but also greatly address the problem of unemployment in the State. Nagaland can become the centre of processing the meat requirements in the country. By 2020, apart from being self-sufficient, the State would also export such products to the adjoining regions and the neighbouring countries. The impact of these activities would add to the wealth of the State.
Box 8.7
Agriculture: Engine for Growth and Rural Transformation
There is scope for tremendous growth in the agriculture sector. The strategy being envisaged for the agriculture sector in Nagaland is likely to make agriculture a catalyst for growth and economic prosperity in the State. Some of the policy initiatives are described below:a. Commercial scale production policy of the
Tenth Plan is bearing fruit and some of the projected crops are expected to increase production to over 10 times in the next three years. Passion fruit, cardamom, patchouli, kolar (Rajma), etc., are the prime examples.
b. The total irrigation potential in the State is 1,65,000 ha, of which only 49,000 ha has been developed. It is possible to develop the balance within the next ten years amounting to over 300 percent increase.
c. The total net cropped area in the State is only 2,48,000 a (about 15 percent of the State’s total area). It is intended to bring this up to at least 30 percent within the next 10 years with a focused agriculture and land use policy.
d. The food grain productivity in Nagaland is today assessed at only 11.54 kg per capita per month as against 79.19 kg in Punjab. With more focused attention on improving the agricultural practices, it will be possible to increase the State’s productivity to at least 45 kg per capita per month amounting to four times the present level.
e. Fusion of traditional agriculture knowledge systems and modern technology will result in fusion of the best of the traditional and the modern and enhance productivity in the sector. Such a fusion will also yield value additions.
f. The potential of greenhouse technology for oeliriculture and floriculture has not been explored in the State. Once initiated, with the high percentage of literate population, particularly the educated unemployed with progressive outlook, the production in this area can take off within the next 5 years. Organised floriculture for export by air is targeted within the next two years.
g. Organised agricultural marketing is being given focused attention at the moment with very encouraging results giving unexpected momentum to commercial scale production in the rural areas.
All such trends will go a long way in enhancing the productivity in the agriculture sector, which in turn will give a boost to the value addition processes and the manufacturing process. This will add to the secondary sector with the increased income of the farmers. The subsequent net effect on the tertiary and the services sectors will be quite substantial within ten years.
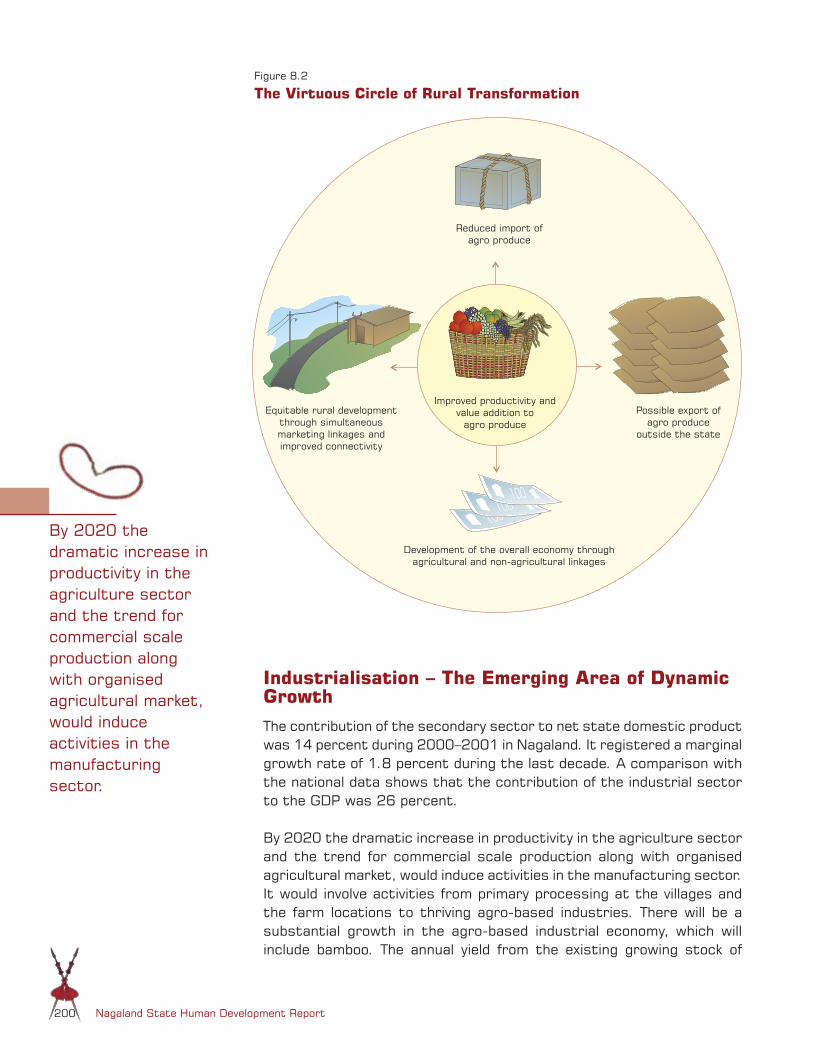
Nagaland State Human Development Report200
Industrialisation – The Emerging Area of Dynamic Growth
The contribution of the secondary sector to net state domestic product was 14 percent during 2000–2001 in Nagaland. It registered a marginal growth rate of 1.8 percent during the last decade. A comparison with the national data shows that the contribution of the industrial sector to the GDP was 26 percent.
By 2020 the dramatic increase in productivity in the agriculture sector and the trend for commercial scale production along with organised agricultural market, would induce activities in the manufacturing sector. It would involve activities from primary processing at the villages and the farm locations to thriving agro-based industries. There will be a substantial growth in the agro-based industrial economy, which will include bamboo. The annual yield from the existing growing stock of
The Virtuous Circle of Rural TransformationFigure 8.2
By 2020 the dramatic increase in productivity in the agriculture sector and the trend for commercial scale production along with organised agricultural market, would induce activities in the manufacturing sector.

Nagaland 2020 – A Vision 201
bamboo is assessed at 8,35,000 tons. This existing stock of naturally growing bamboo is worth over Rs 200 crore. (Given 120 culms of bamboo per ton it works out to over 10 crore culms, with an average of Rs 20 per culm). By 2020 through systematic regeneration and its exploitation it is possible that this would generate an annual economy of Rs 1000 crore.
The growing stock volume of wood in Nagaland is today assessed at 94,887 million cubic metres with an annual increment of over 1.9 million cubic metres. Rationalisation of the land use policy, adoption of appropriate forest management plans and the creation of a platform for sustainable environment through preservation of primary forest and tree cover would in turn rejuvenate a rationalised wood-based industry that will be able to use this huge natural resource of Nagaland. It would also be a participative industry where the prime players will not only be the large industries such as plywood and veneer. Creative use of wood in the small and tiny sectors, especially designed to utilise the wood from jhumlands and commercial plantations, would be the focus in various forms such as knock-down furniture, doorframes, toothpicks, skewers, etc., that would have continuous market. It would greatly enhance employment opportunities in the rural areas.
Peace and the subsequent growth-driven economy would facilitate a fast pace of industrialisation in the State by 2020. The development of infrastructure in the realm of roads, power and communication, accentuated by the envisaged growth of the country’s trade and commerce through the region to South-East Asia, will be a priority. This process will be facilitated and expedited by the availability of a large workforce of educated and progressive youth. The necessary reforms in land tenure to facilitate institutional investment would also dramatically change the availability of capital for entrepreneurship to grow. The growth in entrepreneurial skills coupled with facilitation of institutional investment would have the net effect of a speedy growth of industrial activity.
Through exploitation of its mineral reserves, Nagaland will be producing at least 1 million tons of oil from its present proven reserves of over 600 million tons. The mountains of high grade limestone assessed at over 6000 million tons could generate a massive cement industry geared to meet the building needs in the region, and perhaps even in Myanmar and other countries of South-East Asia. Coal mining and its production would reach economic viability while other minor minerals such as decorative stones, clay and glass sands would become thriving industries.
One of the major spin-offs of the opening up of the Indian commerce and trade through North-East India would be the growth of industries and tourism in the region. The major producing and manufacturing houses of India would either set up shop or locate assembly units in the

Nagaland State Human Development Report202
North-Eastern states to obtain a wider market and generate a competitive edge with their South-East Asian competitors. Nagaland with a peaceful atmosphere, reforming environment and the dynamic and progressive human resource would become an ideal location for such investments by the major industrial houses of India. This would induce a rapid pace of industrialisation in the State. It will create massive employment opportunities, which will further enlarge the tertiary sector.
Services
The net effect of growth in the agriculture sector and the industrial sector would trigger substantial activities in the tertiary sector, particularly under services, by 2020. Public administration, which presently contributes to the major portion of the services sector, would have been right-sized but in its place services related to the growing agriculture and the industrial sector would have sprung up. Tourism will be another area where the services sector will greatly expand. Peace and the progressive atmosphere, coupled with an eco-friendly State which already has a rich cultural heritage, would induce a very large eco-, adventure- and culture-tourism industry in Nagaland. An annual intake of even 10,000 tourists would have a multiplier effect on the entire industry in the State adding to the generation of wealth and employment. With the continuation of the recent initiatives of the State Government towards community-based eco-tourism and culture tourism, including adoption of Khonoma village in Nagaland as the first ‘Green Village’ in the country, sponsored by the Ministry of Tourism and Culture, Government of India, the effect of this sector is expected to rise even further. Moreover, the very real possibility of North-East India becoming the ‘corridor’ to South-East Asia offers unimagined possibilities for tourism in the future.
IT and the broad-band with a separate gateway for the State would have generated considerable activities. In the IT-related services, apart from many call centres and the medical transcription centres that have come up, Nagaland would be catering to the neighbouring countries in the region as it will become the springboard of the merchandise of the Indian computer technology to South-East Asia—both hardware and software. This would also provide opportunities to the progressive, educated manpower of Nagaland.
Infrastructure Reference Points: Technology, Connectivity, Communication and Power
A technology-driven economy is already in motion in the country at a mind-boggling speed. Within such a framework there would be a quantum change in the quality of infrastructure particularly in the realm of telecommunications and road communications in Nagaland, covering
Box 8.8
Strategy for Dividends from Industrialisation
Processing and value addition to agro produce, horticulture, livestock and dairy products.
E n c o u r a g e m e n t t o Naga hand loom and handicrafts.
Setting up forest-based units.
Support mineral-based industry
Focus on biotechnology. Aggressive promotion of
tourism as an industry.
Rationalisation of the land use policy, adoption of appropriate forest management plans and the creation of a platform for sustainable environment through preservation of primary forest and tree cover would in turn rejuvenate a rationalised wood-based industry that will be able to use this huge natural resource of Nagaland.

Nagaland 2020 – A Vision 203
all village approach roads and agricultural link roads in interior areas. A proper road development policy will be developed which will aim at substantially improving the quality of roads and connectivity, not only of transportation but also of agriculture and industrial products. An ‘X – Road’ has been visualised to connect places of economic importance and export routes. The construction of the vital ‘X – Road’, and other economic roads such as ‘Kholar Roads’, ‘Rubber Roads, and ‘Bamboo Roads’ would generate economic dynamics of their own.
Other areas of the communications and quality of their connectivity will be greatly enhanced through use of GIS and other improved technologies. Apart from the television and radio networks, presently being revolutionised through the DTH and the satellite radio, the IT network is expected to cover every nook and corner of Nagaland. Meanwhile, through the use of satellite and optical fibre cable, the broadband will give easy access to cyberspace from any point in the State. Technology would then begin to transform the Naga society in ways unimagined thus far.
Power systems, especially in the areas of quality, availability, management and distribution, have begun to see improvement through the recent policy of Communitisation adopted by the State. With the involvement of the Community in the power distribution system, the transmission and distribution losses would be contained to the minimum level, which would have downstream effect in the quality of power provided to the people. These improvements will, in turn, fuel consumption of power among the people, especially when profits are ploughed back into the system’s improvement, leading to improvement of livelihood and effective functioning.
New hydro and thermal projects would greatly enhance quantitative availability of power in Nagaland. The 24 MW Likimro Project and the 75 MW Doyang Power station have been commissioned while work on a 24 MW thermal project at Dimapur has already started. Simultaneously, the Communitisation process of power envisions village communities to generate their own power requirements through adoption of pico, micro, mini and small power generation systems based on hydropower and biomass. This could revolutionise rural Nagaland and the agricultural economy, besides addressing to a great extent, the problem of educated unemployed.
Social Sector
Universal Quality Education
The central issue in ‘development’ is how social opportunities can be extended to all people. Despite the trends of liberalisation, public
Box 8.9
The ‘X Road’
A conceptual proposal for covering Nagaland with two major economic highways in the shape of an ‘X’, traversing the areas of high economic potential in the State has been visualised.
1. Road traversing the rich agricultural belt commencing from the railhead in Assam and joining Khelma, Jalukie, Niuland, Wokha, Akuluto, Longleng, Mon, Longsa and into Myanmar. This will connect the ‘rice bowl’ of the State with the major consumption centres and the international trade centres. This road will also connect with Manipur.
2. Road commencing from the oil-rich areas of Champang, Mekukla, Mangmetong, Alichen, Zunheboto, Satakha, Phek, Meluri, Wazeho, Pokhungri, Avangkhu and into Myanmar. This will connect the oil-bearing areas with the mineral-bea r i ng a reas and another international trade centre.
The mobility made possible by the proposed highways alone has the potential to transform the State. The development of agriculture and exploitation of minerals, which will be made possible by the highway, can spearhead economic development in the State.

Nagaland State Human Development Report204
provisions for education, health care, nutritional support and social security continue as an integral process of development for any Government, particularly in the underdeveloped regions of the world.
Nagaland showed an increasing level of literacy compared to the all India figures during the last four decades. There has also been a quantum jump in the number of educational institutions in the State, from 597 in 1961–62 to 2327 in 2000–2001. Nagaland today has nearly 1500 primary schools, 320 high schools and 16 higher secondary schools. By 2020 the education scenario in the state would approach a situation described by Shri Lalhuma, through the interplay of certain crucial factors.
The first and foremost is the process of Communitisation, which has created the space for people’s participation in education. The process not only incorporates dimensions of decentralisation but also of joint mobilisation of resources. Such involvement of the community is leading to better monitoring and management of schools as well as inculcating a sense of ownership. By 2020 the communities would be actively investing in upgrading, modernising and managing their schools. The Government’s role, after having provided all the physical requirements or 100 percent coverage of all villages and hamlets by primary schools, may become focused on key areas like policy, syllabi, quality education, training, innovations and linkages with new technology. It would also allow the Government to give extra attention to the more backward areas and to bring them up quickly to the level of the more developed areas of the State. In such a scenario, the coverage and extension of primary schools through Government programmes and community partnership would ensure 100 percent coverage by 2020. The policy would then be to provide universal quality education.
“Well scrubbed children bubbling with health, merrily and excitedly making their way to schools…school buildings that look like centres of learning. Motivated and educated teachers enthusiastically imparting meaningful education to the children of the future.”
Shri Lalhuma, IAS, and the present
Development Commissioner in his article “The Nagaland of my dreams” for a rural development department
magazine in 1989.
Box 8.10
Global Strategies for Universalisation of Elementary Education
Priority 1: Ensuring strong Government commitment including increased resources for primary education
Priority 2: Making primary education free Priority 3: Ensuring commitment to gender equality Priority 4: Ensuring access and inclusion of all children Understanding and strengthening the demand for primary education,
reflected in children’s enrolment and retention rates in schools. Improving quality Building partnerships with civil society in support of UPE Strengthening capacities of institutions for planning, management,
monitoring and accountability Developing cross-sectoral linkages (poverty reduction, health and nutrition
policies, good economic policies conducive to private investment, to innovation and to job creation, etc).
Responding to conflict and preparing for reconstruction
Source: DFID, 2000

Nagaland 2020 – A Vision 205
The second important factor would be the improvement in the quality of teaching. The State Education Department is in the serious process of adopting ‘Joyful learning’ and the 17-point programme to ensure qualitative education. It is also addressing itself to the task of meeting the momentous task and challenge of training the 12,000 teachers of the State through programmes like the UNICEF-supported EQUIP programme within the next five years. By 2020, Nagaland would have 100 percent trained teachers, greatly adding to the quality of education imparted to young children. The Communitisation process may lead to devolution of more authority to the VEC, including that of appointment of teachers.
Finally, apart from community involvement in communitised schools, there is the matter of the growing involvement of the private sector in school education. Even today in Nagaland, over 73 percent of high school students study in private schools. Appropriate policies will seek to promote private sector at all levels so as to supplement Government efforts.
With all the above measures, by 2020 it is envisaged that the literacy in Nagaland would be nearly universal. Enrolment at the elementary stage would be universal, while the dropout rates reduced to below 10 percent. The pass percentages of Government/Communitised schools
Figure 8.3Educational Quality Improvement Programme – 'EQUIP'

Nagaland State Human Development Report206
would have come to a level of at least 75 percent. By 2020, the facilities in school education would also have shifted focus towards IT education and enabling technology awareness where vocational education would be a prominent feature. Such a directional change would further bring about quantum change in the outlook for future development. The fast growing agricultural and industrial sectors would need equally equipped manpower. The educational systems would be gearing up to meet such requirements of teaching and training the youth with the right mental attitudes and perspectives. Education in Nagaland would have become a process for the growth and development of society.
Higher Education
The establishment of Nagaland University has strengthened higher education. It is taking on new directions as a nodal centre for the functioning of higher educational institutions and putting in place a qualitative benchmark. There is skewed distribution of colleges among the various districts today. This pattern would be reversed by appropriate Government and private sector interventions prompted by the needs of the emerging trends. Not only would the existing infrastructural
The educational systems would be gearing up to meet such requirements of teaching and training the youth with the right mental attitudes and perspectives.
Box 8.11
Hon’ble President Sets Agenda for Excellence in Higher Education
“I would recommend certain initiatives, which can make the educational sector vibrant and meet the challenges of providing vital human resource for national development.
1. University needs to become the knowledge partner in programmes such as India’s Vision 2020, interlinking of rivers, desalination of water through nuclear and solar energy, etc.
2. A transparent system of university performance evaluation scheme is required to be evolved. Evaluation criteria may include areas such as quality and quantity of research, contribution to societal transformation, utilisation and performance of the students, quality and standing of the teaching staff, promotion of e-governance, transparent examination system and student-centric responsive administration.
3. Performance evaluation results could be used to plan merger of some universities for promoting synergy and excellence and reducing managerial overheads.
4. A simple, easy to implement ‘educational loan scheme’ should be evolved in collaboration with banks for enabling meritorious students to pursue higher education without disruption.
5. Create a dynamic curriculum review mechanism relating to current socio-technical needs of the country.
6. There are a number of young prodigies in different areas. A system for recognising these prodigies and promoting their growth consistent with their abilities different from the conventional system needs to be designed and implemented.
7. Create simplified uniform inter-university mobility norms for students.8. Build a common digital library for all universities and provide them seamless access to the
literary resources. 9. Build educational grid, which connects universities for resource sharing, content, content
generation on their core competence, e-learning, tele-education, and universal certification.10. Enlist great teachers of the nation from various sectors who love teaching.11. Lead to the approval of empowered university with private initiatives – national/
international.”
Extract from the Address of Hon’ble President of India at the Golden Jubilee Celebrations of University Grants Commission, on December 28, 2003

Nagaland 2020 – A Vision 207
development in the schools and colleges need to be upgraded but a number of technical colleges in the fields of medicine, engineering, management, IT and so on would also be created. Speciality and super speciality in various fields should also emerge in the form of research institutes and technical training centres. The products from such institutions would be geared to meet the emergent needs of the growing economy.
Some of the colleges of repute in the State would start collaboration with renowned institutions, both domestic and international, and would become centres of excellence catering to high degree of research. The Agriculture College at Medziphema would become an Agricultural University with specialisation in hill and mountain terrain agriculture. The polytechnics would become busy institutes trying to meet the burgeoning demands of the ever-growing industries. Management institutes in the private sector would be established in collaboration with leading industrial houses. With its tremendous wealth of biodiversity, Nagaland would command world interest. Biological research centres would emerge, laying the foundation of bio-technology and other cutting edge scientific technologies. Higher education in Nagaland by 2020 would be technology driven, and focus on the growing scientific temperament among the youth of Nagaland.
Health
The Nagaland Health Care Policy would have been in place by 2005–06 giving appropriate and rational direction to the future growth and development of health care in the State. The National Health Care Delivery System (3-tier health care system) would be on a firm footing in the State with appropriate manpower deployment policy. Efforts at mainstreaming the indigenous system of medicine & homoeopathy (ISM & H) and traditional systems in the State would have also developed substantially, adding to the health care delivery systems in the State. The present policy of Communitisation of health institutions and services and the emergence of high quality private sector in the delivery of health care services would add to the health care infrastructure in Nagaland by 2020. For the urban areas, by 2020 all the district civil hospitals would have been upgraded and made autonomous on the lines of the decision taken recently for the Naga Hospital, Kohima. Some of the civil hospitals would even branch off to become speciality centres with tie-ups and collaboration with other speciality hospitals around the country. Side by side there will be increasing investment in private hospitals, clinics and nursing homes, which will not only increase the health care coverage but also add to the quality of health services.
With the population under control, the economy growing at accelerated pace and infrastructure such as transport, communication and power
Box 8.12
Global Strategies for Achieving Better Health for all People
Response 1: Addressing the pr ior ity health problems; strengthening access to care, services and products.
Response 2: Investment in strong, efficient and effective health systems (publ ic, private and informal)
Response 3: A more effective global response to HIV/AIDS
Response 4: Supporting the necessary social, political and physical env i ronments that e n a b l e p e o p l e t o maximise access to better health
Source: “Strategies for achieving the international development targets” , DFID, 2000

Nagaland State Human Development Report208
improved to modern levels, qualitative health care will be provided to the people. Some sections of the society would require greater attention and support. The youth and the elderly would be provided with social security though better nutrition, health care, education and support services. People with disabilities and people affected by armed conflict will form a special category for attention and care in Nagaland’s context. Rehabilitative services will be required for the many young men and women who are currently participating in detoxification and de-addiction programmes. Harm reduction strategies are in place today by NACS and this would be further strengthened.
With infrastructure in place, in the form of properly equipped PHCs and sub-centres, trained manpower, including professional dais in every village, referral network/transport and facilities between sub-centres, PHCs, CHCs and district hospitals, the following would be the picture by 2020. Maternal health and ‘health-assisted delivery’ would have increased from the present level of 32 percent to 42 percent by 2010 and to over 70 percent by 2020. The child population with no immunisation would be reduced from the present level of 32 percent to 14 percent by 2010 and below 10 percent by 2020, while morbidity related to communicable diseases reduced to the barest minimum levels. The battle against AIDS would have reached a turning point with the prevalence of the disease coming down to below 1 percent. Availability of drugs and medicines to battle the disease would also have brought hope to those fighting this disease.
By 2020, it is possible to see a healthy Nagaland with people having a life expectancy of 80 years and beyond but with a population growth rate contained to below 2 percent, while ensuring that children under age 15 years, and around 15 to 20 years get the best possible options in life. It would indeed be a Nagaland moving into the future full of hope and expectations, and reaching the aspired position among the fore-ranking states in the country, in terms of prosperity, development and happiness.
Action-oriented Missions for Developed Nagaland
Nagaland today is ranked 11th among the states as per the human development index (1991). The State can legitimately aspire to emerge as a frontrunner among the states by 2020, if its natural wealth —land, water, forests, environments, oil, minerals—are sustainably exploited and marketed; the social capital invested into resuscitating and energising the public utility systems such as schools, health institutions, power utilities, tourism assets, water supply system, rural roads, ICDS network; if connectivity within the State, with the rest of the country and with the outside world in term of road, rail, waterways, air, telecommunication is improved; and if the State’s human capital is
“Youth with knowledge, skill and passion are required for undertaking and completing these tasks in time.”
–Dr APJ Abdul Kalam,
Hon’ble President of India, December 2003
Nagaland 2020 – A Vision 209
enriched in terms of technical skills. The resources required for these endeavours are envisioned to be mustered through internal resource mobilisation, contributions from those within the State who have benefited from the development process, through transfer from national resources and assistance from the international community through the Central Government. Particular strategies (mentioned below) would be followed to realise the vision. Such strategies coupled with continued governance reforms, encouragement, revival and reconstruction of traditional institutions, suitable health, HIV/AIDS and education policies, would further raise the HDI of the State, the per capita income of its people and lead to further improvements in what may be called a ‘Human Happiness Index’ (HHI).
Formulation and implementation of a comprehensive agriculture and forest policy.
Development through operations of the Bamboo Mission, encouragement of organic farming, establishment of storage, processing and marketing of agro-produce.
Promotion of industries based on agro-forestry, oil and mineral resources and indigenous skills in weaving and craftsmanship.
Sustainable exploitation of oil, gas and mineral reserves. Strengthening of the Village Development Boards. Continuation of the process of Communitisation of public institutions
to cover a wider area and more sectors in the State for delivery of quality services to the people.
Heavy investments in infrastructure development and connectivity through State Road Policy.
Improvement in power generation and distribution network. Investments in technology to witness sustained progress in the
spheres of economic activity and basic services. Setting up and nurturing centres of learning and active research,
including think tanks, for strengthening knowledge-based economy. Revival and reconstruction of traditional institutions. Development of tourism as an industry. Explore possibilities of social security net to ensure equitable access
to quality education and health care services. Development programmes to ensure 100 percent access to basic
amenities throughout the State. Population control. Continued endeavours and visions for development and learning from
successful initiatives and failures, both within the State and other parts of the country and the world.
Continued focus on Government reforms.

Nagaland State Human Development Report210
A Vision .... being realised
The Nagaland of my dreams
I often visualise an idyllic rural scenario in Nagaland. I dream of villages to which urban folks literally scramble to on holidays in order to relax in the well maintained rest houses managed by the villagers; swim in the crystal clear rivers; take long walks in the unspoiled forests and return to the towns/cities with renewed vigour. I dream of a rural Nagaland where funds have percolated down to the VDBs and the fruits of development are clearly there for all to see – living standards of the people substantially increased; smiles of contentment and prosperity writ large on their faces; all-weather roads criss-crossing the villages; mini buses transporting the rural folk; trucks loaded with surplus products winding their way to the markets in the towns; cold storages and godowns stocked with the agricultural and horticultural produce dotting the landscape, awaiting the next consignments to be loaded; village granaries full to the brim; forests rejuvenated; streams and brooks flowing unabated and feeding the thirsty fields; each village jealously maintaining and guarding its own reserve forests and water catchment areas; water sources and water supply systems managed by the people; no more work-charged workers sponging government funds without meaningful work; well scrubbed children bubbling with health and vitality and merrily and excitedly making their way to the schools to imbibe practical and useful knowledge in clean and healthy environments conducive to learning; motivated and educated teachers (educated youths of the village) enthusiastically imparting meaningful education to the children and nurturing and moulding them into respectable and useful citizens; school buildings that look like centres of learning; schools that are carefully maintained by the villagers and supported by their own funds, donated materials and voluntary labour; and effective and functional Village Education Committees managing the schools. On the animal and veterinary front, I visualise healthy cows ‘loaded’ with milk contentedly mooing in the meadows munching away the rich fodder blanketing the slopes; sties stocked with pigs and sows; chicken in their hundreds clucking away in their pens; the ponds full of fish; wholesellers and retailers making a beeline for villages and haggling over prices…at last ! it’s the producers turn to dictate – flourishing village cooperatives handling all the marketing, feed productions and animal health care; small-scale cottage industries humming with productive activities, generating rural employment and resources, their products finding their way to markets all over the country; ‘Made in Nagaland’ being looked upon with respect and admiration; educated youths, driven by zeal and concern for their kith and kin, returning to their villages to help their parents or to take up meaningful self-employment with generous doses of government assistance and institutional finance under various programmes. Micro-hydel projects generating enough power to meet rural requirements of lighting, sustaining village industrial units and the dam sites storing precious water to irrigate command areas of agricultural land; conventional sources of energy and cooking slowly replaced by improved chullahs, biogas plants, solar and wind-energised street lights; village dispensaries manned by trained people, well stocked with medicines; the concept of dedicated bare-foot doctors on the Chinese pattern revived; savings and thrift being the order of the day; rural banks flooded with community funds resulting in gradual self-dependence and self-reliance; government investments yielding the desired results, reaching the target groups and stern accountability fixed if they do not; literate adults able to comprehend instructions and directives, new programmes, aware of their rights, and facilities being provided.
Is it too much to dream of a return to time-honoured traditional and moral values, i.e. respect for authority, for elders? For dignity of labour? Raw honesty? Hard work? And sincerity? Pride in one’s culture and heritage? A return to religion with depth and true conviction and not as a garb for social acceptance and respectability? To politics with principles and genuine concern for the well being and welfare of the people, and not for personal gain or self-aggrandisement? Combining leadership with responsibility? Well, it is for the citizens of Nagaland to provide the answer!
Lalhuma, IASNB: This article was written for a rural development magazine in the year 1989. Since then many of the aspired scenarios have been achieved or are
closer to being fully realised. Community owned tourism initiatives are successful. There are serious efforts to extend them to more districts. State
owned tourism amenities have been handed over to the village communities. Many VDBs have successfully created income generating resources for
their villages resulting in greater prosperity and better connectivity to the villages. Communitisation of health and education has transformed the
delivery of these vital services in the rural areas and brought back people's faith in these State-owned institutions. KOMUL initiative has ensured
sustained results from animal husbandry for the people. APMCs have been set up. The more proactive ones among them are providing better returns
for the farm produce. Experimentation to set up micro hydel projects to provide electricity to remote inhabitations is making the dream to make
power available for economic activity a reality. Indeed, efforts synergising all round development in the State—giving hope of a vision of developed and
prosperous Nagaland—have already taken off. All stakeholders have to ensure, through affirmative action, that it becomes a vision realised.

District Profiles 211
District Profile
Annexure 1
District Profiles

Nagaland State Human Development Report212
I Dimapur District 213
II Kohima District 215
III Mokokchung District 217
IV Mon District 219
V Phek District 221
VI Tuensang District 223
VII Wokha District 225
VIII Zunheboto District 227

District Profiles 213
Dimapur
Dhansiripar
Chumukedima
Medziphema
Nihokhu
Niuland
Dimapur District*
DISTRICT INFORMATION 2001
Area 927
Share in Total Area (%) 5.59
Administrative Circles 7
No. of Blocks 4
Total Inhabited Villages 216
No. of Census Towns 2
Number of Gaonburas 486
Number of Village Council Members 1948
DEMOGRAPHY 1991* 2001
Total Population 308382
Share in State Population 15.51
Decadal Growth in Population 73.3
Urban Population (%) 35.11
Density of Population 333
Scheduled Tribe Population (%) N.A^
Sex Ratio - Total 830 854
Rural Sex Ratio 830 920
Urban Sex Ratio 765 746
Juvenile Sex Ratio (0-6 years) 973 981
Rural Juvenile Sex Ratio 986 1004
Urban Juvenile Sex Ratio 950 940
INCOME 2003
Per Capita DDP (Rs.) 16837
HUMAN DEVELOPMENT INDICES 2003
Human Development Index (HDI) 0.733
Rank in Nagaland - HDI 1
Gender Related Development Index (GDI) 0.472
Rank in Nagaland - GDI 2
Human Poverty Index (HPI) 29.25
Rank in Nagaland- HPI 4
HEALTH 1991* 2001
Infant Mortality Rate (per 1000 live births) 37.5
IMR Male (per 1000 live births) 28.0
IMR Female (per 1000 live births) 48.6
Life Expectancy at One Year (years) N.A^
Number of District Hospitals 1
CHCs 1
PHCs 4
Dispensaries 39
EMPLOYMENT 1991 2001
Total Workers (%) Rural 38.47 32.67
Urban 31.98 33.89
All 36.06 33.16
Share of Main Workers (%) 34.49 28.14
Share of Marginal Workers (%) 1.57 5.02
Total Employment – Agriculture Sector (%) N.A* 32.93
Of which, Agricultural Labour (%) N.A* 4.58
Total Employment – Non Agriculture Sector (%) N.A* 67.07
Worker Participation Rates
Total WPR 36.06 33.16
Rural WPR 38.47 32.67
Urban WPR 31.98 33.89
Rural WPR - Male 46.69 41.72
Rural WPR - Female 29.03 22.83
Urban WPR - Male 49.85 530
Urban WPR - Female 8.64 8.08
EDUCATION 1991* 2001
Literacy (percent) : Total 78.15
Male Literacy (%) 82.16
Female Literacy (%) 73.34
Rural Male Literacy (%) 79.74
Rural Female Literacy (%) 71.15
Urban Male Literacy (%) 85.34
Urban Female Literacy (%) 76.86
Enrolment Rates
Total Enrolment (%) 80
Boys Enrolment (%) 81.3
Girls Enrolment (%) 78.5
Pupil Teacher Ratio 1:23

Nagaland State Human Development Report214
LAND USE 2001
Forest Cover (%) 1999 Figures N.A
Dense Forest Cover (%) N.A
Total Area under Agriculture (in Ha) 41368
Of which, Total Area under Jhum (in Ha) 18307
Area under Current Jhum (in Ha) 4340
Area under TRC/WRC (in Ha) 30937
Area under Horticulture/Cash Crops (in Ha) 6091
INFRASTRUCTURE / FACILITIES 2001
Rural Population Serviced Per PHC 46122.5
Electrified Villages (%) 98.68
Road Length Per 100 sq.km. N.A
Villages with Drinking Water Facility (%)
Not Covered 11.89
Partially Covered 72.69
Fully Covered 15.42
HOUSEHOLD STATUS (based on Sample Survey)
2003
Households in Pucca Houses (%) 21.67
Households in Semi-Pucca Houses (%) 39.16
Households in Kutcha Houses (%) 37.26
Households with Access to Toilet Facilities (%)
79.09Note :- *Dimapur was a subdivision of Kohima district in 1991 ^Census figures for 2001 not yet available

District Profiles 215
Tseminyu
Chiephobozou
KezochaJakhama
Sechu Kohima
Ngwalwa
Jalukie
Athibung
TeningNsong
Peren
Kohima District *
DISTRICT INFORMATION 2001
Area 4041
Share in Total Area (%) 18.79
Administrative Circles 12
No. of Blocks 5
Total Inhabited Villages 3114
No. of Census Towns 1
Number of Gaonburas 695
Number of Village Council Members 1681
INCOME 2003
Per Capita DDP (Rs.) 11906
DEMOGRAPHY 1991* 2001
Total Population 3,87,561 3,14,366
Share in State Population 32.04 15.81
Decadal Growth in Population 44.19 49.96
Urban Population (%) 56.38 22.27
Density of Population 50 101
Scheduled Tribe Population (%) 74.47 N.A^
Sex Ratio - Total 859 944
Rural Sex Ratio 909 970
Urban Sex Ratio 745 870
Juvenile Sex Ratio (0-6 years) 1013 979
Rural Juvenile Sex Ratio 1031 990
Urban Juvenile Sex Ratio 957 941
HUMAN DEVELOPMENT INDICES 2003
Human Development Index (HDI) 0.674
Rank in Nagaland - HDI 4
Gender Related Development Index (GDI) 0.49
Rank in Nagaland - GDI 1
Human Poverty Index (HPI) 33.08
Rank in Nagaland- HPI 5
HEALTH 1991 2001
Infant Mortality Rate (per 1000 live births) 37.9
IMR Male (per 1000 live births) 28.0
IMR Female (per 1000 live births) 48.6
Life Expectancy at One Year (years) 73.2 N.A^
Number of District Hospitals 3
CHCs 2
PHCs 14
Dispensaries --
EDUCATION 1991 2001
Literacy (percent) : Total 69.16 74.28
Male Literacy (%) 75.58 81.44
Female Literacy (%) 61.41 66.64
Rural Male Literacy (%) 69.99 77.96
Rural Female Literacy (%) 54.43 62.02
Urban Male Literacy (%) 87.01 91.18
Urban Female Literacy (%) 79.33 81.19
Enrolment Rates
Total Enrolment (%) 85.2
Boys Enrolment (%) 91.9
Girls Enrolment (%) 78.7
Pupil Teacher Ratio 1:17
EMPLOYMENT 1991 2001
Total Workers (%) Rural 44.20 46.21
Urban 35.11 32.75
All 41.97 42.85
Share of Main Workers (%) 41.14 36.48
Share of Marginal Workers (%) 0.83 6.37
Total Employment – Agriculture Sector (%) 59.90 58.99
Of which, Agricultural Labour (%) 4.19 4.67
Total Employment – Non Agriculture Sector (%) 40.1 41.02
Worker Participation Rates
Total WPR 41.97 42.85
Rural WPR 35.11 46.21
Urban WPR 44.2 32.75
Rural WPR - Male 45.55 47.94
Rural WPR - Female 42.76 44.43
Urban WPR - Male 49.99 45.09
Urban WPR - Female 14.47 18.56
* Information on Kohima includes information on Peren district

Nagaland State Human Development Report216
LAND USE 2001
Forest Cover (%) 1999 Figures 88.39
Dense Forest Cover (%) 43.92
Total Area under Agriculture (in Ha) 26075
Of which, Total Area under Jhum (in Ha) 126036
Area under Current Jhum (in Ha) 11529
Area under TRC/WRC (in Ha) 13004
Area under Horticulture/Cash Crops (in Ha) 1542
INFRASTRUCTURE / FACILITIES 2001
Rural Population Serviced Per PHC 16842
Electrified Villages (%) 99.34
Road Length Per 100 sq.km. 58.6
Villages with Drinking Water Facility (%)
Not Covered 3
Partially Covered 80
Fully Covered 18
HOUSEHOLD STATUS (based on Sample Survey) 2003
Households in Pucca Houses (%) 6.02
Households in Semi-Pucca Houses (%) 42.12
Households in Kutcha Houses (%) 50.14
Households with Access to Toilet Facilities (%) 87.68
Note :- * Information on Kohima includes information on Dimapur for 1991 statistics/data ^Census figures for 2001 not yet available

District Profiles 217
EMPLOYMENT 1991 2001
Total Workers (%) Rural 40.14 49.91
Urban 30.59 35.09
All 38.64 47.87
Share of Main Workers (%) 38.64 47.87
Share of Marginal Workers (%) -- 11.66
Total Employment – Agriculture Sector (%) 71.64 66.43
Of which, Agricultural Labour (%) 0.62 6.34
Total Employment – Non Agriculture Sector (%) 28.32 33.57
Worker Participation Rates
Total WPR 38.64 47.87
Rural WPR 40.14 49.91
Urban WPR 30.59 35.09
Rural WPR - Male 42.85 51.81
Rural WPR - Female 37.23 47.87
Urban WPR - Male 44.38 47.48
Urban WPR - Female 13.29 20.01
HUMAN DEVELOPMENT INDICES 2003
Human Development Index (HDI) 0.705
Rank in Nagaland - HDI 2
Gender Related Development Index (GDI) 0.46
Rank in Nagaland - GDI 3
Human Poverty Index (HPI) 19.9
Rank in Nagaland- HPI 1
DEMOGRAPHY 1991 2001
Total Population 158374 227230
Share in State Population 13.09 11.43
Decadal Growth in Population 50.58 43.48
Urban Population (%) 11.91 8.84
Density of Population 98 141
Scheduled Tribe Population (%) 92.64 N.A
Sex Ratio - Total 912 919
Rural Sex Ratio 935 935
Urban Sex Ratio 798 821
Juvenile Sex Ratio (0-6 years) 1010 1004
Rural Juvenile Sex Ratio 1028 1019
Urban Juvenile Sex Ratio 929 916
HEALTH 1991 2001
Infant Mortality Rate (per 1000 live births) 35.05
IMR Male (per 1000 live births) 40.8
IMR Female (per 1000 live births) 28.0
Life Expectancy at One Year (years) 72.3 N.A^
Number of District Hospitals 1
CHCs 2
PHCs 11
Dispensaries 1
EDUCATION 1991 2001
Literacy (percent) : Total 77.85 84.27
Male Literacy (%) 80.52 86.14
Female Literacy (%) 74.88 82.2
Rural Male Literacy (%) 79 84.93
Rural Female Literacy (%) 72.89 80.48
Urban Male Literacy (%) 88.26 93.32
Urban Female Literacy (%) 86.86 93.88
Enrolment Rates
Total Enrolment (%) 62.7
Boys Enrolment (%) 65.1
Girls Enrolment (%) 60.3
Pupil Teacher Ratio 1:10
Mokokchung District
Tuli
Changtongya
Chuchuyimlang
Mokokchung
KupolongMangkolemba
Longchem
Alongkima
DISTRICT INFORMATION 2001
Area 1615
Share in Total Area (%) 9.74
Administrative Circles 8
No. of Blocks 6
Total Inhabited Villages 105
No. of Census Towns 1
Number of Gaonburas 496
Number of Village Council Members 1984
INCOME 2003
Per Capita DDP (Rs.) 12305

Nagaland State Human Development Report218
LAND USE 2001
Forest Cover (%) 1999 figures 82.79
Dense Forest Cover (%) 12.2
Total Area under Agriculture (in Ha) 16837
Of which, Total Area under Jhum (in Ha) 123063
Area under Current Jhum (in Ha) 11923
Area under TRC/WRC (in Ha) 2986
Area under Horticulture/Cash Crops (in Ha) 1928
HOUSEHOLD STATUS (based on Sample Survey)
2003
Households in Pucca Houses (%) 18.62
Households in Semi-Pucca Houses (%) 58.33
Households in Kutcha Houses (%) 23.04
Households with Access to Toilet Facilities (%) 100
INFRASTRUCTURE / FACILITIES 2001
Rural Population Serviced Per PHC 17820
Electrified Villages (%) 100
Road Length Per 100 sq.km. 137.83
Villages with Drinking Water Facility (%)
Not Covered 2.59
Partially Covered 71.55
Fully Covered 25.86
Note :- ^Census figures for 2001 not yet available
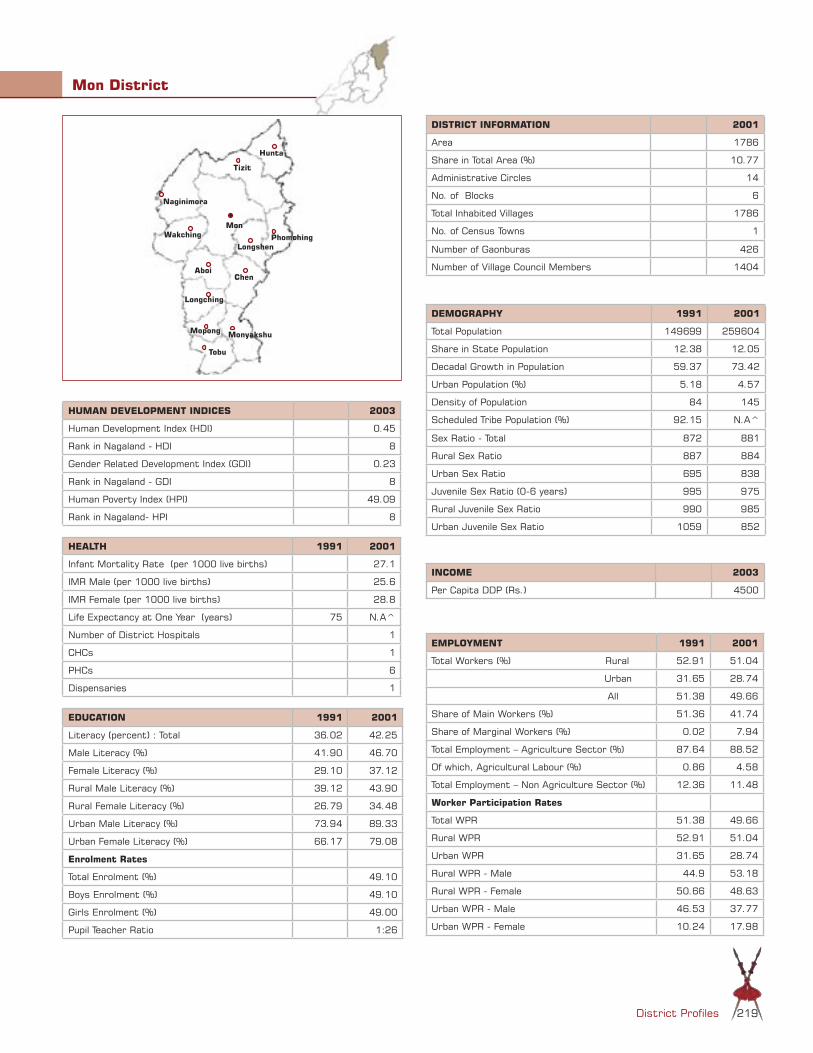
District Profiles 219
Hunta
Tizit
PhomchingLongshen
Naginimora
Wakching
Aboi
Longching
Mopong
Tobu
Monyakshu
Chen
Mon
Mon District
DISTRICT INFORMATION 2001
Area 1786
Share in Total Area (%) 10.77
Administrative Circles 14
No. of Blocks 6
Total Inhabited Villages 1786
No. of Census Towns 1
Number of Gaonburas 426
Number of Village Council Members 1404
DEMOGRAPHY 1991 2001
Total Population 149699 259604
Share in State Population 12.38 12.05
Decadal Growth in Population 59.37 73.42
Urban Population (%) 5.18 4.57
Density of Population 84 145
Scheduled Tribe Population (%) 92.15 N.A^
Sex Ratio - Total 872 881
Rural Sex Ratio 887 884
Urban Sex Ratio 695 838
Juvenile Sex Ratio (0-6 years) 995 975
Rural Juvenile Sex Ratio 990 985
Urban Juvenile Sex Ratio 1059 852
INCOME 2003
Per Capita DDP (Rs.) 4500
EDUCATION 1991 2001
Literacy (percent) : Total 36.02 42.25
Male Literacy (%) 41.90 46.70
Female Literacy (%) 29.10 37.12
Rural Male Literacy (%) 39.12 43.90
Rural Female Literacy (%) 26.79 34.48
Urban Male Literacy (%) 73.94 89.33
Urban Female Literacy (%) 66.17 79.08
Enrolment Rates
Total Enrolment (%) 49.10
Boys Enrolment (%) 49.10
Girls Enrolment (%) 49.00
Pupil Teacher Ratio 1:26
EMPLOYMENT 1991 2001
Total Workers (%) Rural 52.91 51.04
Urban 31.65 28.74
All 51.38 49.66
Share of Main Workers (%) 51.36 41.74
Share of Marginal Workers (%) 0.02 7.94
Total Employment – Agriculture Sector (%) 87.64 88.52
Of which, Agricultural Labour (%) 0.86 4.58
Total Employment – Non Agriculture Sector (%) 12.36 11.48
Worker Participation Rates
Total WPR 51.38 49.66
Rural WPR 52.91 51.04
Urban WPR 31.65 28.74
Rural WPR - Male 44.9 53.18
Rural WPR - Female 50.66 48.63
Urban WPR - Male 46.53 37.77
Urban WPR - Female 10.24 17.98
HUMAN DEVELOPMENT INDICES 2003
Human Development Index (HDI) 0.45
Rank in Nagaland - HDI 8
Gender Related Development Index (GDI) 0.23
Rank in Nagaland - GDI 8
Human Poverty Index (HPI) 49.09
Rank in Nagaland- HPI 8
HEALTH 1991 2001
Infant Mortality Rate (per 1000 live births) 27.1
IMR Male (per 1000 live births) 25.6
IMR Female (per 1000 live births) 28.8
Life Expectancy at One Year (years) 75 N.A^
Number of District Hospitals 1
CHCs 1
PHCs 6
Dispensaries 1

Nagaland State Human Development Report220
Note :- *Dimapur was a subdivision of Kohima district in 1991 ^Census figures for 2001 not yet available
LAND USE 2001
Forest Cover (%) 1999 figures 84.43
Dense Forest Cover (%) 47.98
Total Area under Agriculture (in Ha) 15624
Of which, Total Area under Jhum (in Ha) 75515
Area under current Jhum (in Ha) 13534
Area under TRC/WRC (in Ha) 1251
Area under Horticulture/Cash Crops (in Ha) 839
HOUSEHOLD STATUS (based on Sample Survey) 2003
Households in Pucca Houses (%) 0.50
Households in Semi-Pucca Houses (%) 19.00
Households in Kutcha Houses (%) 78.00
Households with Access to Toilet Facilities (%) 29.00
INFRASTRUCTURE / FACILITIES 2001
Rural Population serviced per PHC 40581.00
Electrified Villages (%) 100.00
Road Length per 100 sq.km. 79.62
Villages with Drinking Water Facility (%)
Not covered 0.85
Partially Covered 91.53
Fully Covered 7.63

District Profiles 221
Sekruzu
Chetheba
Pfutsero
Khezhakeno
Chizami
Sakraba
Phek
Meluri
Phokhungri
Phek District
DISTRICT INFORMATION 2001
Area 2026
Share in Total Area (%) 12.22
Administrative Circles 10
No. of Blocks 5
Total Inhabited Villages 104
No. of Census Towns 1
Number of Gaonburas 424
Number of Village Council Members 849
INCOME 2003
Per Capita DDP (Rs.) 9880
DEMOGRAPHY 1991* 2001
Total Population 102156 148246
Share in State Population 8.45 74.55
Decadal Growth in Population 44.19 45.12
Urban Population (%) 4.02 3.65
Density of Population 50 73
Scheduled Tribe Population (%) 94.08 N.A^
Sex Ratio - Total 880 923
Rural Sex Ratio 902 940
Urban Sex Ratio 663 760
Juvenile Sex Ratio (0-6 years) 969 934
Rural Juvenile Sex Ratio 972 936
Urban Juvenile Sex Ratio 939 919
EMPLOYMENT 1991 2001
Total Workers (%) Rural 46.32 48.19
Urban 40.55 49.57
All 45.85 48.31
Share of Main Workers (%) 45.69 38.85
Share of Marginal Workers (%) 0.16 9.46
Total Employment – Agriculture Sector (%) 76.14 74.64
Of which, Agricultural Labour (%) 0.42 1.90
Total Employment – Non Agriculture Sector (%) 23.86 25.36
Worker Participation Rates
Total WPR 45.85 48.31
Rural WPR 46.32 48.19
Urban WPR 40.55 49.57
Rural WPR - Male 45.37 47.64
Rural WPR - Female 47.38 48.78
Urban WPR - Male 56.74 56.63
Urban WPR - Female 16.13 40.28
HUMAN DEVELOPMENT INDICES 2003
Human Development Index (HDI) 0.652
Rank in Nagaland - HDI 5
Gender Related Development Index (GDI) 0.46
Rank in Nagaland - GDI 4
Human Poverty Index (HPI) 40.88
Rank in Nagaland - HPI 6
HEALTH 1991 2001
Infant Mortality Rate (per 1000 live births) 29.22
IMR Male (per 1000 live births) 29.6
IMR Female (per 1000 live births) 28.8
Life Expectancy at One Year (years) 74.2 N.A^
Number of District Hospitals 1
CHCs 2
PHCs 10
Dispensaries 3
EDUCATION 1991 2001
Literacy (percent) : Total 62.59 71.35
Male Literacy (%) 72.28 78.97
Female Literacy (%) 51.34 63.08
Rural Male Literacy (%) 70.57 77.32
Rural Female Literacy (%) 50.08 61.48
Urban Male Literacy (%) 89.07 94.52
Urban Female Literacy (%) 69.33 83.35
Enrolment Rates
Total Enrolment (%) 73.1
Boys Enrolment (%) 80.4
Girls Enrolment (%) 76.1
Pupil Teacher Ratio 1:27
Chozuba

Nagaland State Human Development Report222
INFRASTRUCTURE / FACILITIES 2001
Rural Population Serviced Per PHC 13538
Electrified Villages (%) 100
Road Length Per 100 sq.km. 80.9
Villages with Drinking Water Facility (%)
Not Covered 5.04
Partially Covered 56.3
Fully Covered 36.66
LAND USE 2001
Forest Cover (%) 1999 Figures 83.7
Dense Forest Cover (%) 26.75
Total Area under Agriculture (in Ha) 38148
Of which, Total Area under Jhum (in Ha) 52660
Area under Current Jhum (in Ha) 21054
Area under TRC/WRC (in Ha) 15561
Area under Horticulture/Cash Crops (in Ha) 1533
HOUSEHOLD STATUS (based on Sample Survey)
2003
Households in Pucca Houses (%) 11.64
Households in Semi-Pucca Houses (%) 32.19
Households in Kutcha Houses (%) 54.79
Households with Access to Toilet Facilities (%) 60.27Note :- *Dimapur was a subdivision of Kohima district in 1991 ^Census figures for 2001 not yet available

District Profiles 223
Tamlu
Yongya
Longleng
Noksen
Chare Longkhim
Tuensang
Noklak
Panso
Thonoknyu
Kiusam
Pungro
Chessore
AmahatorSeyochung
SitimiLongmatra
Kiphire
Shamator
Tuensang District *
DISTRICT INFORMATION 2001
Area 4228
Share in Total Area (%) 25.5
Administrative Circles 20
No. of Blocks 13
Total Inhabited Villages 251
No. of Census Towns 1
Number of Gaonburas 1681
Number of Village Council Members 3141
DEMOGRAPHY 1991 2001
Total Population 232906 414801
Share in State Population 19.26 20.86
Decadal Growth in Population 69.26 78.1
Urban Population (%) 10.09 8.4
Density of Population 55 98
Scheduled Tribe Population (%) 95.10 N.A^
Sex Ratio - Total 889 913
Rural Sex Ratio 910 923
Urban Sex Ratio 702 784
Juvenile Sex Ratio (0-6 years) 975 978
Rural Juvenile Sex Ratio 982 979
Urban Juvenile Sex Ratio 921 970
INCOME 2003
Per Capita DDP (Rs.) 8149
EDUCATION 1991 2001
Literacy (percent) : Total 48.39 51.3
Male Literacy (%) 53.98 55.97
Female Literacy (%) 41.98 46.12
Rural Male Literacy (%) 51.28 53.56
Rural Female Literacy (%) 39.56 43.84
Urban Male Literacy (%) 78.93 84.61
Urban Female Literacy (%) 72.74 78.81
Enrolment Rates
Total Enrolment (%) 39.6
Boys Enrolment (%) 35.5
Girls Enrolment (%) 42.2
Pupil Teacher Ratio 1:17
EMPLOYMENT 1991 2001
Total Workers (%) Rural 46.31 46.00
Urban 34.45 27.08
All 45.23 38.03
Share of Main Workers (%) 45.23 38.03
Share of Marginal Workers (%) 0.01 6.62
Total Employment – Agriculture Sector (%) 85.12 85.66
Of which, Agricultural Labour (%) 0.33 3.42
Total Employment – Non Agriculture Sector (%) 14.88 14.34
Worker Participation Rates
Total WPR 45.24 44.65
Rural WPR 46.31 46
Urban WPR 34.45 27.08
Rural WPR - Male 46.94 46.67
Rural WPR - Female 45.62 45.28
Urban WPR - Male 48.38 39.74
Urban WPR - Female 14.6 10.93
HUMAN DEVELOPMENT INDICES 2003
Human Development Index (HDI) 0.512
Rank in Nagaland - HDI 7
Gender Related Development Index (GDI) 0.3
Rank in Nagaland - GDI 7
Human Poverty Index (HPI) 48.98
Rank in Nagaland- HPI 7
HEALTH 1991 2001
Infant Mortality Rate (per 1000 live births) 41.3
IMR Male (per 1000 live births) 25.6
IMR Female (per 1000 live births) 58.5
Life Expectancy at One Year (years) 70.8 N.A^
Number of District Hospitals 2
CHCs 3
PHCs 11
Dispensaries 2
*Includes information of newly created Longleng and Kiphire districts
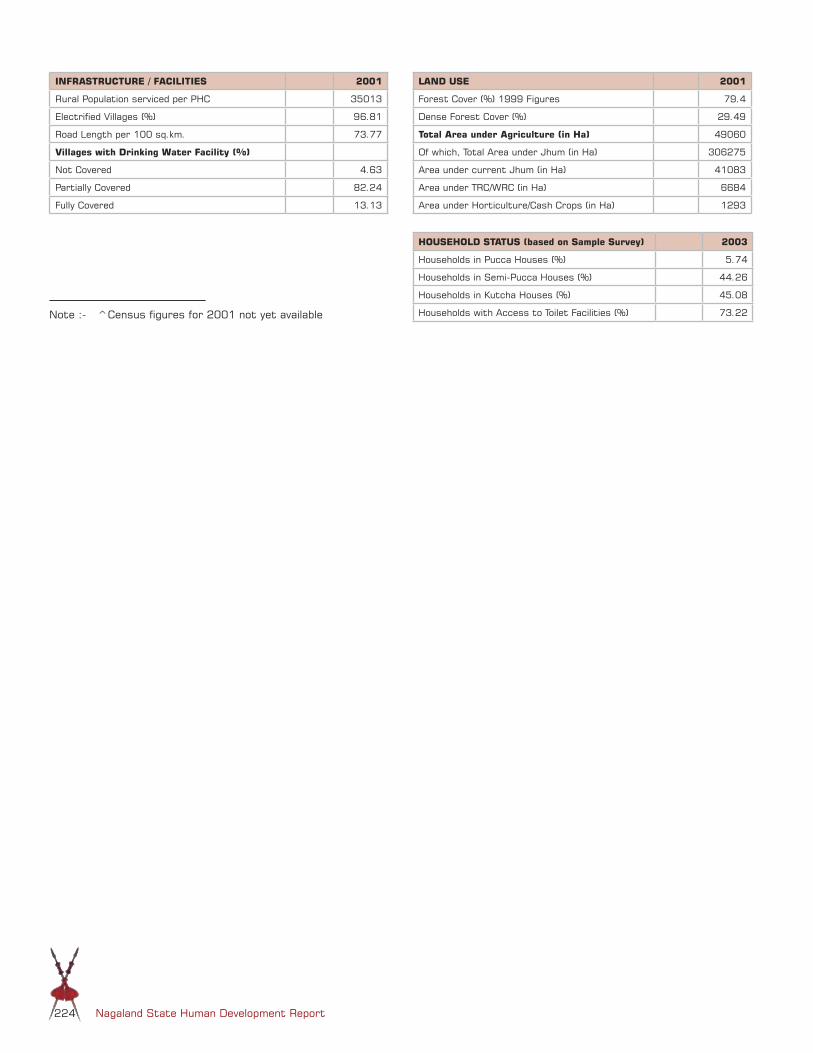
Nagaland State Human Development Report224
LAND USE 2001
Forest Cover (%) 1999 Figures 79.4
Dense Forest Cover (%) 29.49
Total Area under Agriculture (in Ha) 49060
Of which, Total Area under Jhum (in Ha) 306275
Area under current Jhum (in Ha) 41083
Area under TRC/WRC (in Ha) 6684
Area under Horticulture/Cash Crops (in Ha) 1293
HOUSEHOLD STATUS (based on Sample Survey) 2003
Households in Pucca Houses (%) 5.74
Households in Semi-Pucca Houses (%) 44.26
Households in Kutcha Houses (%) 45.08
Households with Access to Toilet Facilities (%) 73.22
INFRASTRUCTURE / FACILITIES 2001
Rural Population serviced per PHC 35013
Electrified Villages (%) 96.81
Road Length per 100 sq.km. 73.77
Villages with Drinking Water Facility (%)
Not Covered 4.63
Partially Covered 82.24
Fully Covered 13.13
Note :- ̂ Census figures for 2001 not yet available
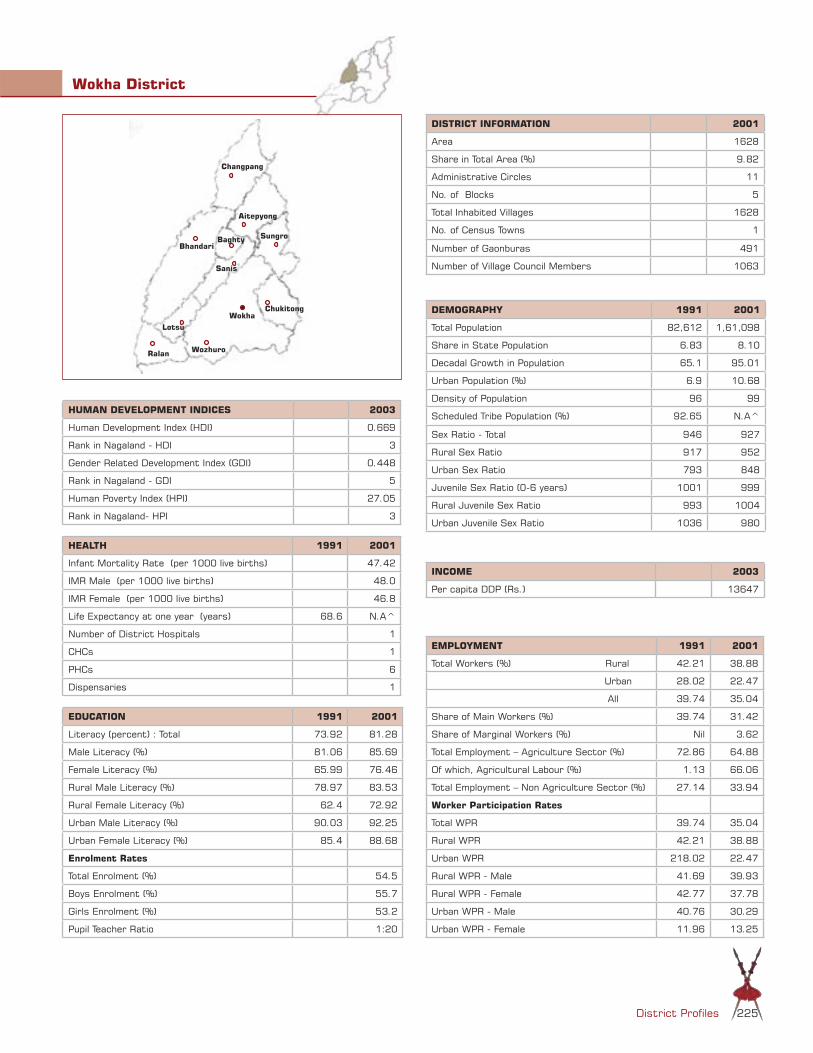
District Profiles 225
Changpang
Bhandari
Ralan
Lotsu
Sanis
WokhaChukitong
SungroBaghty
Aitepyong
Wokha District
DISTRICT INFORMATION 2001
Area 1628
Share in Total Area (%) 9.82
Administrative Circles 11
No. of Blocks 5
Total Inhabited Villages 1628
No. of Census Towns 1
Number of Gaonburas 491
Number of Village Council Members 1063
DEMOGRAPHY 1991 2001
Total Population 82,612 1,61,098
Share in State Population 6.83 8.10
Decadal Growth in Population 65.1 95.01
Urban Population (%) 6.9 10.68
Density of Population 96 99
Scheduled Tribe Population (%) 92.65 N.A^
Sex Ratio - Total 946 927
Rural Sex Ratio 917 952
Urban Sex Ratio 793 848
Juvenile Sex Ratio (0-6 years) 1001 999
Rural Juvenile Sex Ratio 993 1004
Urban Juvenile Sex Ratio 1036 980
INCOME 2003
Per capita DDP (Rs.) 13647
EDUCATION 1991 2001
Literacy (percent) : Total 73.92 81.28
Male Literacy (%) 81.06 85.69
Female Literacy (%) 65.99 76.46
Rural Male Literacy (%) 78.97 83.53
Rural Female Literacy (%) 62.4 72.92
Urban Male Literacy (%) 90.03 92.25
Urban Female Literacy (%) 85.4 88.68
Enrolment Rates
Total Enrolment (%) 54.5
Boys Enrolment (%) 55.7
Girls Enrolment (%) 53.2
Pupil Teacher Ratio 1:20
EMPLOYMENT 1991 2001
Total Workers (%) Rural 42.21 38.88
Urban 28.02 22.47
All 39.74 35.04
Share of Main Workers (%) 39.74 31.42
Share of Marginal Workers (%) Nil 3.62
Total Employment – Agriculture Sector (%) 72.86 64.88
Of which, Agricultural Labour (%) 1.13 66.06
Total Employment – Non Agriculture Sector (%) 27.14 33.94
Worker Participation Rates
Total WPR 39.74 35.04
Rural WPR 42.21 38.88
Urban WPR 218.02 22.47
Rural WPR - Male 41.69 39.93
Rural WPR - Female 42.77 37.78
Urban WPR - Male 40.76 30.29
Urban WPR - Female 11.96 13.25
HUMAN DEVELOPMENT INDICES 2003
Human Development Index (HDI) 0.669
Rank in Nagaland - HDI 3
Gender Related Development Index (GDI) 0.448
Rank in Nagaland - GDI 5
Human Poverty Index (HPI) 27.05
Rank in Nagaland- HPI 3
HEALTH 1991 2001
Infant Mortality Rate (per 1000 live births) 47.42
IMR Male (per 1000 live births) 48.0
IMR Female (per 1000 live births) 46.8
Life Expectancy at one year (years) 68.6 N.A^
Number of District Hospitals 1
CHCs 1
PHCs 6
Dispensaries 1
Wozhuro

Nagaland State Human Development Report226
LAND USE 2001
Forest Cover (%) 1999 figures 96.99
Dense Forest Cover (%) 23.95
Total Area under Agriculture (in Ha) 18737
Of which, Total Area under Jhum (in Ha) 109185
Area under current Jhum (in Ha) 15580
Area under TRC/WRC (in Ha) 1991
Area under Horticulture/Cash Crops (in Ha) 1166
HOUSEHOLD STATUS (based on Sample Survey) 2003
Households in Pucca Houses (%) 18.9
Households in Semi-Pucca Houses (%) 59.06
Households in Kutcha Houses (%) 22.05
Households with Access to Toilet Facilities (%) 13.39
INFRASTRUCTURE / FACILITIES 2001
Rural Population serviced per PHC 20567
Electrified Villages (%) 98.15
Road Length per 100 sq.km. 77.15
Villages with Drinking Water Facility (%)
Not covered 7.38
Partially Covered 85.25
Fully Covered 7.38
Note :- ^Census figures for 2001 not yet available

District Profiles 227
V.K. Akuloto Suruhoto
Asuto
Aghunato
Atoizu
Zunheboto
Satakha
Satoi
GhathashiPughoboto
Zunheboto District
DISTRICT INFORMATION 2001
Area 1255
Share in Total Area (%) 7.57
Administratiove Circles 11
No. of Blocks 6
Total Inhabited Villages 187
No. of Census Towns 1
Number of Gaonburas 617
Number of Village Council Members 1667
DEMOGRAPHY 1991 2001
Total Population 96218 154909
Share in State Population
Decadal Growth in Population 35.04 61
Urban Population (%) 5.51 6.46
Density of Population 77 123
Scheduled Tribe Population (%) 97.07 N.A^
Sex Ratio - Total 964 945
Rural Sex Ratio 982 968
Urban Sex Ratio 844 823
Juvenile Sex Ratio (0-6 years) 1030 949
Rural Juvenile Sex Ratio 1039 958
Urban Juvenile Sex Ratio 976 889
INCOME 2003
Per capita DDP (Rs.) 8372
EDUCATION 1991 2001
Literacy (percent) : Total 64.36 69.73
Male Literacy (%) 70.76 73.43
Female Literacy (%) 57.63 65.8
Rural Male Literacy (%) 68.46 69.5
Rural Female Literacy (%) 55.19 61.86
Urban Male Literacy (%) 87.03 93.71
Urban Female Literacy (%) 78.29 90.06
Enrolment Rates
Total Enrolment (%) 73.1
Boys Enrolment (%) 71.5
Girls Enrolment (%) 74.9
Pupil Teacher Ratio 1:17
EMPLOYMENT 1991 2001
Total Workers (%) Rural 44.39 42.13
Urban 28.91 28.08
All 42.54 40.06
Share of Main Workers (%) 42.54 32.52
Share of Marginal Workers (%) 0.00 7.54
Total Employment – Agriculture Sector (%) 77.54 47.35
Of which, Agricultural Labour (%) 0.09 2.78
Total Employment – Non Agriculture Sector (%) 22.46 52.65
Worker Participation Rates
Total WPR 42.54 40.06
Rural WPR 45.39 42.13
Urban WPR 28.91 28.08
Rural WPR - Male 44.36 41.76
Rural WPR - Female 44.42 42.52
Urban WPR - Male 41.82 36.55
Urban WPR - Female 13.62 17.78
HUMAN DEVELOPMENT INDICES 2003
Human Development Index (HDI) 0.611
Rank in Nagaland - HDI 6
Gender Related Development Index (GDI) 0.41
Rank in Nagaland - GDI 6
Human Poverty Index (HPI) 24.72
Rank in Nagaland- HPI 2
HEALTH 1991 2001
Infant Mortality Rate (per 1000 live births) 31.53
IMR Male (per 1000 live births) 25.6
IMR Female (per 1000 live births) 37.8
Life Expectancy at one year (years) 73.6 N.A^
Number of District Hospitals 1
CHCs 2
PHCs 40
Dispensaries 1

Nagaland State Human Development Report228
LAND USE 2001
Forest Cover (%) 1999 figures 88.84
Dense Forest Cover (%) 26.69
Total Area under Agriculture (in Ha) 16938
Of which, Total Area under Jhum (in Ha) 106046
Area under current Jhum (in Ha) 12306
Area under TRC/WRC (in Ha) 3574
Area under Horticulture/Cash Crops (in Ha) 1058
HOUSEHOLD STATUS (based on Sample Survey) 2003
Households in Pucca Houses (%) 10.36
Households in Semi-Pucca Houses (%) 45.95
Households in Kutcha Houses (%) 42.79
Households with Access to Toilet Facilities (%) 89.64
INFRASTRUCTURE / FACILITIES 2001
Rural Population serviced per PHC 3303
Electrified Villages (%) 100
Road Length per 100 sq.km. 106.77
Villages with Drinking Water Facility (%)
Not covered 3.6
Partially Covered 64.86
Fully Covered 31.53
Note :- ̂ Census figures for 2001 not yet available

District Profiles 229
Annexure 2
Statistical Tables
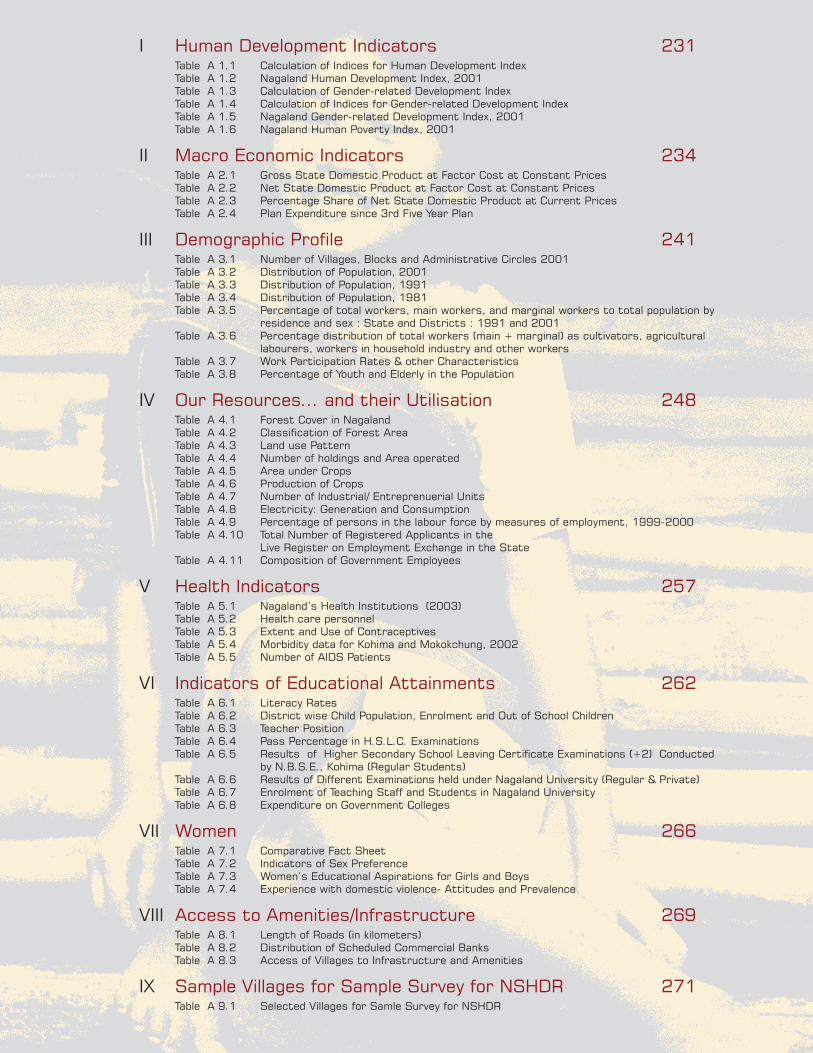
Nagaland State Human Development Report230
I Human Development Indicators 231 Table A 1.1 Calculation of Indices for Human Development Index Table A 1.2 Nagaland Human Development Index, 2001 Table A 1.3 Calculation of Gender-related Development Index Table A 1.4 Calculation of Indices for Gender-related Development Index Table A 1.5 Nagaland Gender-related Development Index, 2001 Table A 1.6 Nagaland Human Poverty Index, 2001
II Macro Economic Indicators 234 Table A 2.1 Gross State Domestic Product at Factor Cost at Constant Prices Table A 2.2 Net State Domestic Product at Factor Cost at Constant Prices Table A 2.3 Percentage Share of Net State Domestic Product at Current Prices Table A 2.4 Plan Expenditure since 3rd Five Year Plan
III Demographic Profile 241 Table A 3.1 Number of Villages, Blocks and Administrative Circles 2001 Table A 3.2 Distribution of Population, 2001 Table A 3.3 Distribution of Population, 1991 Table A 3.4 Distribution of Population, 1981 Table A 3.5 Percentage of total workers, main workers, and marginal workers to total population by
residence and sex : State and Districts : 1991 and 2001 Table A 3.6 Percentage distribution of total workers (main + marginal) as cultivators, agricultural
labourers, workers in household industry and other workers Table A 3.7 Work Participation Rates & other Characteristics Table A 3.8 Percentage of Youth and Elderly in the Population
IV Our Resources... and their Utilisation 248 Table A 4.1 Forest Cover in Nagaland Table A 4.2 Classification of Forest Area Table A 4.3 Land use Pattern Table A 4.4 Number of holdings and Area operated Table A 4.5 Area under Crops Table A 4.6 Production of Crops Table A 4.7 Number of Industrial/ Entreprenuerial Units Table A 4.8 Electricity: Generation and Consumption Table A 4.9 Percentage of persons in the labour force by measures of employment, 1999-2000 Table A 4.10 Total Number of Registered Applicants in the
Live Register on Employment Exchange in the State Table A 4.11 Composition of Government Employees
V Health Indicators 257 Table A 5.1 Nagaland’s Health Institutions (2003) Table A 5.2 Health care personnel Table A 5.3 Extent and Use of Contraceptives Table A 5.4 Morbidity data for Kohima and Mokokchung, 2002 Table A 5.5 Number of AIDS Patients
VI Indicators of Educational Attainments 262 Table A 6.1 Literacy Rates Table A 6.2 District wise Child Population, Enrolment and Out of School Children Table A 6.3 Teacher Position Table A 6.4 Pass Percentage in H.S.L.C. Examinations Table A 6.5 Results of Higher Secondary School Leaving Certificate Examinations (+2) Conducted
by N.B.S.E., Kohima (Regular Students) Table A 6.6 Results of Different Examinations held under Nagaland University (Regular & Private) Table A 6.7 Enrolment of Teaching Staff and Students in Nagaland University Table A 6.8 Expenditure on Government Colleges
VII Women 266 Table A 7.1 Comparative Fact Sheet Table A 7.2 Indicators of Sex Preference Table A 7.3 Women’s Educational Aspirations for Girls and Boys Table A 7.4 Experience with domestic violence- Attitudes and Prevalence
VIII Access to Amenities/Infrastructure 269 Table A 8.1 Length of Roads (in kilometers) Table A 8.2 Distribution of Scheduled Commercial Banks Table A 8.3 Access of Villages to Infrastructure and Amenities
IX Sample Villages for Sample Survey for NSHDR 271 Table A 9.1 Selected Villages for Samle Survey for NSHDR

Statistical Tables 231
District Per Capita DDP
IMR (per 1000)
Index of IMR
Life Expectancy
Index of Life Expectancy
Literacy Rate
Index of Literacy
Enrolment Ratios
Index of Enrolment
1. Dimapur 16837 37.50 0.781 73.4 0.780 78.15 0.780 0.800 0.800
2. Mokokchung 12305 35.05 0.821 72.3 0.743 84.27 0.840 0.627 0.880
3. Wokha 13647 47.42 0.657 68.6 0.619 80.56 0.800 0.545 0.870
4. Kohima 11906 37.90 0.776 73.2 0.772 74.28 0.740 0.852 0.800
5. Phek 9880 29.22 0.885 74.2 0.807 71.35 0.710 0.783 0.750
6. Zunheboto 8372 31.53 0.856 73.6 0.786 69.73 0.700 0.731 0.720
7. Tuensang 8149 41.30 0.734 70.8 0.693 51.30 0.510 0.396 0.540
8. Mon 4500 27.10 0.911 75.0 0.833 42.25 0.420 0.491 0.480
Nagaland 11119 40.00 0.750 73.4 0.779 67.11 0.700 0.636 0.640
Note: Districts arranged according to rank of Human Development Index
District Index for Percapita DDP Combined Index For Educational Attainments
Combined Index for Health Attainments
Human Development Index
X1 X2 X3 HDI
1. Dimapur 0.624 0.793 0.781 0.733
2. Mokokchung 0.483 0.866 0.767 0.705
3. Wokha 0.530 0.846 0.632 0.669
4. Kohima 0.468 0.779 0.773 0.673
5. Phek 0.384 0.736 0.834 0.651
6. Zunheboto 0.310 0.713 0.811 0.611
7. Tuensang 0.298 0.530 0.708 0.512
8. Mon 0.031 0.459 0.861 0.450
Nagaland 0.438 0.661 0.769 0.623
Note: Districts arranged according to rank of Human Development Index
Table A 1.1
I. Human Development Indicators
Calculation of Indices for Human Development Index
Table A 1.2Nagaland Human Development Index, 2001

Nagaland State Human Development Report232
Adjustment for Income Index for GDI
District Ratio of Female workers to Male
workers
Ratio of Female wages to Male
wages
Share of Females in total earned income
Share of Males in total earned
income
Correction factor for
adjusted income
Adjusted DDP
Wf/Wm If Im Iy
1. Dimapur 0.23 0.89 0.17 0.83 0.30 5038.83
2. Mokokchung 0.70 0.95 0.40 0.60 0.48 5957.76
3. Wokha 0.74 0.89 0.40 0.60 0.48 6596.53
4. Kohima 0.69 0.82 0.36 0.64 0.47 5555.59
5. Phek 0.86 0.80 0.41 0.59 0.49 4801.92
6. Zunheboto 0.84 0.90 0.43 0.57 0.49 4115.95
7. Tuensang 0.82 0.82 0.40 0.60 0.49 3954.42
8. Mon 0.71 0.79 0.36 0.64 0.47 2114.72
Nagaland 0.67 0.86 0.37 0.63 0.47 5203.00
Note: Districts arranged according to rank of Human Development Index
District Index of Life Expectancy
- Males
Index of Life Expectancy - Females
Index of Enrolment Ratios
- Males
Index of Enrolment Ratios
- Females
Index of Literacy- Males
Index of Literacy- Females
1. Dimapur 0.875 0.733 0.813 0.785 0.822 0.733
2. Mokokchung 0.788 0.792 0.651 0.603 0.861 0.822
3. Wokha 0.750 0.703 0.557 0.532 0.857 0.765
4. Kohima 0.875 0.733 0.919 0.787 0.814 0.666
5. Phek 0.850 0.792 0.804 0.761 0.790 0.631
6. Zunheboto 0.875 0.743 0.715 0.749 0.734 0.658
7. Tuensang 0.875 0.645 0.355 0.442 0.560 0.461
8. Mon 0.875 0.792 0.491 0.490 0.467 0.371
Nagaland 0.863 0.738 0.641 0.630 0.718 0.619
Note: Districts arranged according to rank of Human Development Index.
I. Human Development Indicators
Table A 1.3 Calculation of Gender-related Development Index
Table A 1.4 Calculation of Indices for Gender-related Development Index

Statistical Tables 233
District ed1 ed2 P2 P31 P32 P33 P34 P3 HPI Rank
1. Dimapur 0.220 0.200 20.700 0.029 0.645 0.373 0.335 34.536 29.252 4
2. Mokokchung 0.160 0.120 13.400 0.067 0.617 0.230 0.034 23.721 19.897 1
3. Wokha 0.200 0.130 15.450 0.064 0.634 0.220 0.402 32.990 27.052 3
4. Kohima 0.260 0.200 22.100 0.101 0.499 0.501 0.479 39.500 33.084 5
5. Phek 0.290 0.250 26.400 0.066 0.729 0.548 0.620 49.081 40.880 6
6. Zunheboto 0.300 0.280 28.700 0.092 0.095 0.428 0.133 18.725 24.718 2
7. Tuensang 0.490 0.460 47.050 0.077 0.954 0.451 0.549 50.766 48.979 7
8. Mon 0.580 0.520 54.100 0.071 0.040 0.780 0.820 42.778 49.092 8
Nagaland 0.300 0.360 33.900 0.071 0.547 0.437 0.430 37.119 35.583
Note: P1 : Health Deprivation Index(data not available)P2: Combined Educational Deprivation Indexed1: Illiteracy rateed2: Proportion in 2001 not enrolled in schoolsP31: Proportion of people below poverty line. Source:DESP32: Proportion of children denied basic medical facilities at birth. Proxied by immunisation measured as DPT(1st shot)P33: Proportion of people with kutcha houses. Source:DES Survey, 2003P34: Proportion of population without own toilet. Source: DES Survey, 2003
Districts arranged according to rank of Human Development Index
District Adjusted Xi Combined Literacy Index
Combined Enrolment
Index
Combined Education Index
Combined Life Expectancy
Combined Health Index
GDI Rank
X1 Li Ei Ie=X2 Iexp. Ih=X3
1. Dimapur 0.091 0.778 0.800 0.792 0.803 0.520 0.472 2
2. Mokokchung 0.175 0.842 0.627 0.702 0.790 0.510 0.460 3
3. Wokha 0.226 0.810 0.545 0.637 0.727 0.470 0.448 5
4. Kohima 0.140 0.737 0.852 0.811 0.802 0.800 0.580 1
5. Phek 0.067 0.705 0.783 0.755 0.821 0.530 0.450 4
6. Zunheboto -0.010 0.695 0.731 0.718 0.806 0.520 0.414 6
7. Tuensang -0.030 0.508 0.392 0.432 0.748 0.490 0.299 7
8. Mon -0.343 0.417 0.491 0.465 0.834 0.540 0.220 8
Nagaland 0.107 0.664 0.633 0.644 0.796 0.520 0.420
Note: Districts arranged according to rank of Human Development Index
I. Human Development Indicators
Table A 1.5Nagaland Gender-related Development Index, 2001
Table A 1.6Nagaland Human Poverty Index, 2001

Nagaland State Human Development Report234
(Rs in lakh )
Sector At 1980-81 Prices At 1993-94 Prices
1980-81 1985-86 1990-91 1993-94 1995-96 2000-01
1. Primary Sector, of which, 3511 5174 7100 33507 34604 76069
1.1 Agriculture 3056 3501 4455 26903 27400 67919
1.2 Forestry & Logging 449 1592 2472 6114 6475 6678
1.3 Fishing 6 81 173 490 729 1367
1.4 Mining & Quarrying 0 0 0 0 0 105
2. Secondary Sector, of which 1933 3054 7146 19157 27457 37033
2.1 Manufacturing 321 436 1222 4517 9018 2425
2.2 Construction 1688 2634 5461 11152 16653 33894
2.3 Electricity, Watersupply, Gas -76 -16 463 3488 1786 714
3. Tertiary Sector, of which, 6453 8563 12712 84796 93277 126379
3.1 Transport, Storage & Communication 250 429 1913 22471 23543 41183
3.2 Trade, Hotel and Restaurant 764 1069 1313 7813 8310 11470
3.3 Banking & Insurance 144 370 825 1761 1743 2936
3.4 Real Estate, ownership of dwelling & Business services
1769 1928 2049 16077 18605 22374
3.5 Public Administration 2210 2552 3143 26038 26938 31097
3.6 Other services 1316 2215 3469 10636 14138 17319
G.S.D.P. 11897 16791 26958 137460 155338 239481
Per Capita Income (Rs) 1535 1805 2324 9129 10566 12319
II. Macro Economic Indicators
Source: Directorate of Economic and Statistics, Nagaland
Table A 2.1 Gross State Domestic Product at Factor Cost at Constant Prices
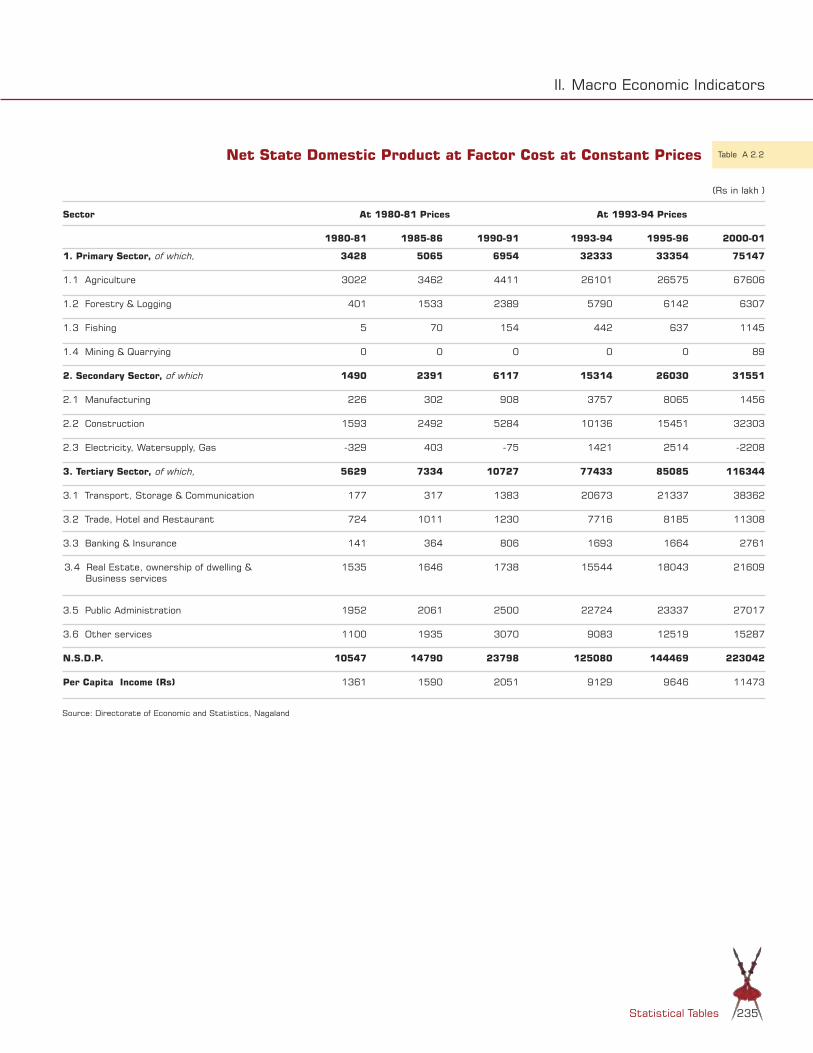
Statistical Tables 235
(Rs in lakh )
Sector At 1980-81 Prices At 1993-94 Prices
1980-81 1985-86 1990-91 1993-94 1995-96 2000-01
1. Primary Sector, of which, 3428 5065 6954 32333 33354 75147
1.1 Agriculture 3022 3462 4411 26101 26575 67606
1.2 Forestry & Logging 401 1533 2389 5790 6142 6307
1.3 Fishing 5 70 154 442 637 1145
1.4 Mining & Quarrying 0 0 0 0 0 89
2. Secondary Sector, of which 1490 2391 6117 15314 26030 31551
2.1 Manufacturing 226 302 908 3757 8065 1456
2.2 Construction 1593 2492 5284 10136 15451 32303
2.3 Electricity, Watersupply, Gas -329 403 -75 1421 2514 -2208
3. Tertiary Sector, of which, 5629 7334 10727 77433 85085 116344
3.1 Transport, Storage & Communication 177 317 1383 20673 21337 38362
3.2 Trade, Hotel and Restaurant 724 1011 1230 7716 8185 11308
3.3 Banking & Insurance 141 364 806 1693 1664 2761
3.4 Real Estate, ownership of dwelling & Business services
1535 1646 1738 15544 18043 21609
3.5 Public Administration 1952 2061 2500 22724 23337 27017
3.6 Other services 1100 1935 3070 9083 12519 15287
N.S.D.P. 10547 14790 23798 125080 144469 223042
Per Capita Income (Rs) 1361 1590 2051 9129 9646 11473
II. Macro Economic Indicators
Source: Directorate of Economic and Statistics, Nagaland
Table A 2.2Net State Domestic Product at Factor Cost at Constant Prices

Nagaland State Human Development Report236
Sector 1980-81 1985-86 1990-91 1995-96 2000-01
1. Primary Sector, of which, 32.5 34.89 31.55 23.82 31.01
1.1 Agriculture 28.65 27.52 26.25 19.12 27.49
1.2 Forestry & Logging 3.8 6.83 4.76 4.18 2.92
1.3 Fishing 0.05 0.54 0.54 0.52 0.58
1.4 Mining & Quarrying 0 0 0 0 0.03
2. Secondary Sector, of which 14.13 9.6 12.16 18.04 15.18
2.1 Manufacturing 2.14 1.48 2.21 5.53 0.74
2.2 Construction 15.11 11.12 11.52 11.06 15.43
2.3 Electricity, Watersupply, Gas -3.12 -3 -1.57 1.45 -0.99
3. Tertiary Sector, of which, 53.37 55.51 56.29 58.14 53.81
3.1 Transport, Storage & Communication 1.68 1.44 5.5 14.44 18.14
3.2 Trade, Hotel and Restaurant 6.86 8.81 7.56 5.85 5.36
3.3 Banking & Insurance 1.34 1.78 2.25 1.13 1.32
3.4 Real Estate, Ownership of Dwellings & Business Services 14.55 10.64 10.61 11.85 9.24
3.5 Public Administration 15.89 19.18 15.85 15.68 12.73
3.6 Other Services 10.43 13.66 14.52 9.19 7.02
NSDP 100 100 100 100 100
II. Macro Economic Indicators
Source: Directorate of Economic and Statistics, Nagaland
Table A 2.3 Percentage Share of Net State Domestic Product at Current Prices

Statistical Tables 237
(Rs. in lakhs)
Sl. Major Head of Development
Five Year/adhoc/rolling Plans Total
3rd Plan Adhoc 4th Plan 5th Plan Rolling 6th Plan 7th Plan Adhoc 8th Plan 9th Plan
1961-66 1966-69 1969-74 1974-79 1978-80 1980-85 1985-90 1990-92 1992-97 1997-02
1 2 3 4 5 6 7 8 9 10 11 12 13
I. AGRICULTURE & ALLIED ACTIVITIES
1 Agriculture 77.20 50.50 193.69 317.52 293.50 961.67 1996.20 1710.00 1299.03 2898.67 9797.98
2 Horticulture -- -- -- -- -- -- 195.51 150.61 830.49 1056.81 2233.42
3 Soil & Water Conservation
-- 3.24 51.06 205.07 199.74 542.80 964.79 274.49 1058.74 1869.31 5169.24
4 Vety. & A.H. 44.42 65.81 102.82 210.31 148.03 478.53 988.38 899.12 1321.20 1976.24 6234.86
5 Fisheries 12.01 58.86 23.43 27.16 19.94 108.94 352.45 310.29 571.41 701.86 2186.35
6 Forestry & Wild Life 46.12 12.08 87.72 439.02 271.69 587.90 1797.40 1045.55 1387.05 1599.54 7274.07
7 Wasteland Development
66.74 706.30 773.04
8 Cooperation 18.88 20.91 62.26 81.28 83.07 137.63 253.88 126.53 215.96 223.90 1224.30
Total - I 198.63 211.40 520.98 1280.36 1015.97 2817.47 6548.61 4516.59 6750.62 11032.63 34893.26
II. RURAL DEVELOPMENT
1 Rural development 115.17 133.73 111.25 129.92 175.54 1715.13 3412.98 7324.74 9290.02 18066.17 40474.65
2 Land Reforms -- -- 0.43 48.86 35.94 107.29 172.71 118.15 443.98 856.53 1783.89
3 Land Compensation for Central Projects
13.48 13.48
Total - II 115.17 133.73 111.68 178.78 211.48 1822.42 3585.69 7442.89 9734.00 18936.18 42272.02
III. IRRIGATION & FLOOD CONTROL
-- 24.47 58.41 171.81 258.99 1035.43 1433.85 677.00 1492.82 2741.16 7893.94
IV. SPECIAL AREA PROGRAMMES
Development of Backward Areas
-- -- -- -- -- 499.35 575.00 237.08 459.03 610.00 2380.46
Special Development Programme
-- -- -- -- -- 36.66 310.00 147.40 594.00 1837.06 2925.12
Border Area Development
-- -- -- -- -- -- -- -- -- 1432.00 1432.00
District Plan -- -- -- -- -- -- -- -- 11100.00 15000.00 26100.00
Total - IV -- -- -- -- -- 536.01 885.00 384.48 12153.03 18879.06 32837.58
V. ENERGY
1 Power 84.84 146.46 291.29 395.63 369.67 1859.86 3281.06 2153.82 9409.97 9785.20 27777.80
2 Non-conventional Source of Energy
-- -- -- -- -- -- 37.77 49.82 59.43 44.18 191.20
3 Integrated Rural Energy Prog.(IREP)
-- -- -- -- -- -- -- -- -- 165.00 165.00
TOTAL - V 84.84 146.46 291.29 395.63 369.67 1859.86 3318.83 2203.64 9469.40 9994.38 28134.00
II. Macro Economic Indicators
Table A 2.4Plan Expenditure since 3rd Five Year Plan
Contd.

Nagaland State Human Development Report238
VI. INDUSTRY & MINERALS
1 Village & Small Industries
12.64 28.46 55.13 115.26 110.42 527.74 926.80 417.00 1100.65 3065.35 6359.45
2 Sericulture -- -- -- -- -- -- -- 167.00 419.50 515.04 1101.54
3 Industries (other than V & SI)
-- 28.88 387.68 433.59 81.00 495.16 1185.30 668.00 1114.91 4280.12 8674.64
4 Mining -- 1.29 44.18 78.07 96.58 356.85 825.18 309.85 686.28 1250.80 3649.08
TOTAL - VI 12.64 58.63 486.99 626.92 288.00 1379.75 2937.28 1561.85 3321.34 9111.31 19784.71
VII. TRANSPORT
1 Civil Aviation 0.00 0
2 Roads and Bridges 343.01 487.84 1120.85 1904.41 1486.77 4588.93 7431.72 3643.63 7691.36 14189.31 42887.83
3 Road Transport 36.26 88.10 113.54 126.14 76.31 488.71 906.42 634.63 1092.51 1546.38 5109.00
4 Vehicular Pollution Control
87.46 102.23 189.69
TOTAL - VII 379.27 575.94 1234.39 2030.55 1563.08 5077.64 8338.14 4278.26 8871.33 15837.92 48186.52
VII. SCI. & TECH. & ENVIRONMENT
1 Scientific Research (incl. S & T)
-- -- -- -- -- 6.99 64.08 50.88 94.83 128.06 344.84
2 Ecology & Environment -- -- -- -- -- -- 5.00 6.00 14.00 10.00 35.00
TOTAL - VIII -- -- -- -- -- 6.99 69.08 56.88 108.83 138.06 379.84
IX. GENERAL ECONOMIC SERVICES
Planning Machinery -- 0.01 0.97 4.65 1.11 13.10 312.06 935.00 368.20 814.58 2449.68
Tourism -- 8.67 13.12 17.61 16.94 76.53 229.83 198.75 590.89 895.97 2048.31
Survey & Statistics 1.14 2.83 12.21 11.14 5.82 33.90 118.85 53.57 218.36 531.05 988.87
Civil Supplies -- -- -- -- -- 2.97 161.08 43.86 344.46 566.02 1118.39
Other General Economic Services
i) District Plan -- -- -- -- -- -- -- -- 11100.00 12000.00 23100.00
ii) Weights and Measures
1.35 8.28 13.91 10.44 35.22 60.00 35.94 91.02 127.87 384.03
iii) Evaluation -- 0.12 3.73 1.92 1.80 12.06 -- 35.87 142.85 245.23 443.58
iv) Judiciary -- -- -- -- -- -- -- -- -- 245.00 245.00
TOTAL - IX 1.14 12.98 38.31 49.23 36.11 173.78 881.82 1302.99 12855.78 3425.72 7677.86
X. SOCIAL SERVICES EDUCATION
1 School Education 128.99 193.86 356.36 508.92 372.88 1101.90 2388.01 1137.00 3937.18 6187.56 16312.66
2 Higher Education -- -- -- -- -- -- -- 298.00 822.59 1253.95 2374.54
3 SCERT -- -- -- -- -- -- -- 108.00 215.33 236.60 559.93
4 Technical Education -- 2.92 33.95 45.27 20.20 44.69 186.28 202.00 318.44 919.48 1773.23
5 Sports & Youth Services
-- -- -- -- -- -- 620.07 430.68 939.03 1170.48 3160.26
6 Art and Culture 1.41 8.68 14.74 17.54 28.74 142.11 406.50 196.67 416.53 662.31 1895.23
Sub-total :- Education 130.40 205.46 405.05 571.73 421.82 1288.70 3600.86 2372.35 6649.10 10430.38 26075.85
(Rs. in lakhs)
Sl. Major Head of Development
Five Year/adhoc/rolling Plans Total
3rd Plan Adhoc 4th Plan 5th Plan Rolling 6th Plan 7th Plan Adhoc 8th Plan 9th Plan
1961-66 1966-69 1969-74 1974-79 1978-80 1980-85 1985-90 1990-92 1992-97 1997-02
1 2 3 4 5 6 7 8 9 10 11 12 13
II. Macro Economic Indicators
Contd.
Plan Expenditure since...

Statistical Tables 239
7 Medical & Public Health 107.34 109.47 187.82 172.52 173.65 1347.15 2092.97 1074.00 6430.36 9760.24 21455.52
8 Water Supply & Sanitation
-- 93.43 301.17 537.31 347.77 1744.39 2945.60 1071.85 3731.21 10636.03 21408.76
9 Housing
a PWD Housing 40.47 34.97 77.36 792.24 408.05 1256.22 2005.76 268.36 3508.79 3816.02 12208.24
b G.A. Housing -- -- -- -- -- -- -- 308.00 -- 2557.91 2865.91
c Police Housing -- -- -- -- -- -- -- -- -- 4920.58 4920.58
d Social Housing -- -- -- -- -- -- -- 24.00 -- 40.00 64.00
e Excise Housing -- -- -- -- -- -- -- 13.87 -- 56.54 70.41
f Home Guard Housing -- -- -- -- -- -- -- 20.80 -- 75.00 95.80
g Law Housing -- -- -- -- -- -- -- 34.50 -- 165.50 200.00
h Jail Housing -- -- -- -- -- -- -- 104.00 -- 327.85 431.85
i Vigilance Housing -- -- -- -- -- -- -- -- -- 0.00 0.00
j Electricity Housing -- -- -- -- -- -- -- 184.47 -- 43.00 227.47
Total Housing 40.47 34.97 77.36 792.24 408.05 1256.22 2005.76 958.00 3508.79 12002.40 21084.26
10 Urban development -- 13.84 101.88 92.31 182.25 583.21 1826.52 688.96 3199.56 3064.64 9753.17
11 Information & Publicity 8.21 11.99 27.04 19.92 14.22 56.70 327.25 244.00 423.77 634.10 1767.20
12 Labour & Employment
a) Labour, Labour Welfare & Craftmen Training.
6.96 19.94 11.10 71.10 260.20 185.00 365.71 517.60 1437.61
b) Spl. Employment Prog.
97.80 173.40 71.89 182.00 40.00 565.09
13 Social Welfare -- 0.50 7.42 15.12 18.84 95.56 156.99 129.15 233.13 234.49 891.20
14 Nutrition -- -- -- 60.39 42.50 312.00 801.00 327.00 531.00 2190.00 4263.89
TOTAL - X 286.42 469.66 1114.70 2281.48 1620.20 6852.83 14190.55 7122.20 25254.63 49509.88 108702.55
XI. GENERAL SERVICES
1 Printing & Stationery -- -- -- -- 12.23 52.88 105.97 62.73 146.15 215.04 595.00
2 Public Works
a) Police -- -- -- -- -- -- -- -- -- 779.86 779.86
b) PWD -- -- -- -- -- 1078.55 2572.16 1041.65 3450.95 2447.71 10591.02
c) Excise
(Rs. in lakhs)
Sl. Major Head of Development
Five Year/adhoc/rolling Plans Total
3rd Plan Adhoc 4th Plan 5th Plan Rolling 6th Plan 7th Plan Adhoc 8th Plan 9th Plan
1961-66 1966-69 1969-74 1974-79 1978-80 1980-85 1985-90 1990-92 1992-97 1997-02
1 2 3 4 5 6 7 8 9 10 11 12 13
II. Macro Economic Indicators
Contd.
Plan Expenditure since...

Nagaland State Human Development Report240
3 Other Administrative Services
a) Training (ATI) -- -- -- -- 1.82 37.23 135.24 134.00 133.41 242.81 684.51
4 Others -- -- -- -- -- -- 15.00 -- -- -- 15.00
a) International Trade Centre
-- -- -- -- -- -- 10.00 -- -- -- 10.00
b) Parliamentary Affairs
-- -- -- -- -- -- 1404.63 -- -- -- 1404.63
c) Administration of Justice
-- -- -- -- -- -- -- -- -- -- 0.00
d) Up-gradation of Administration
-- -- -- -- -- -- -- -- -- -- 0.00
TOTAL- XI -- -- -- -- 14.05 1168.66 4243.00 1238.38 3730.51 3685.42 14080.02
XII. NON-DEVELOPMENT DEPARTMENTS
Other Non Developmental Departments.
1 Assembly Complex -- -- -- -- -- -- -- -- 2985.00 2985.00
2 (TFC - Upgradation of Standards)
a) Treasury & Accounts
-- -- -- -- -- -- -- -- 94.47 94.47
b) Fire Services -- -- -- -- -- -- -- -- 285.00 285.00
c) Civil Police Training & Telecom/Admn.
-- -- -- -- -- -- -- -- 238.00 423.19 661.19
d) Grant-in-Aid to Local Bodies
-- -- -- -- -- -- -- -- 522.00 522.00
e) Special Problem -- -- -- -- -- -- -- -- 1350.00 1350.00
f) Fiscal Administration
-- -- -- -- -- -- -- -- 70.00 70.00
g) Computer Education -- -- -- -- -- -- -- -- 258.00 258.00
Total : Non-Developmental Deptt.
-- -- -- -- -- -- -- -- 238.00 5987.66 6225.66
GRAND TOTAL : 1078.11 1633.27 3856.75 7014.76 5377.55 22730.84 46431.85 30785.16 93980.29 149324.38 351112.96
Source: Department of Planning & Coordination, Nagaland
(Rs. in lakhs)
Sl. Major Head of Development
Five Year/adhoc/rolling Plans Total
3rd Plan Adhoc 4th Plan 5th Plan Rolling 6th Plan 7th Plan Adhoc 8th Plan 9th Plan
1961-66 1966-69 1969-74 1974-79 1978-80 1980-85 1985-90 1990-92 1992-97 1997-02
1 2 3 4 5 6 7 8 9 10 11 12 13
II. Macro Economic Indicators
Plan Expenditure Since...

Statistical Tables 241
III. Demographic Profile
District Area (sq km.) Percentage Share Administrative Circles Blocks Villages(Inhabited)
1. Dimapur 927 5.59 7 4 216
2. Mokokchung 1615 9.74 8 6 105
3. Wokha 1628 9.82 11 5 128
4. Kohima 3114 18.79 12 7 180
5. Phek 2026 12.22 10 5 104
6. Zunheboto 1255 7.57 11 6 187
7. Tuensang 4228 25.5 20 13 251
8. Mon 1786 10.77 14 6 110
Nagaland 16579 100 93 52 1278
Note: Districts arranged according to rank of Human Development Index
(Provisional)
District Rural Population Urban Population Total Population Decadal
growth
rate
Density of
Population
Sex Ratio
Male Female Persons Male Female Persons Male Female Persons Overall 0 - 6
(1991- 01)
1. Dimapur 96088 88402 184490 70247 53645 123892 166335 142047 308382 73.30 333 854 981
2. Mokokchung 101288 94738 196026 17140 14064 31204 118428 108802 227230 43.48 141 919 1004
3. Wokha 63219 60183 123402 20401 17295 37696 83620 77478 161098 95.01 99 927 999
4. Kohima 119668 116114 235782 42033 36551 78584 161701 152665 314366 49.96 101 944 979
5. Phek 69773 65610 135383 7309 5554 12863 77082 71164 148246 45.12 73 923 934
6. Zunheboto 67117 64983 132100 12510 10299 22809 79627 75282 154909 61.00 123 945 949
7. Tuensang 200263 184884 385147 16625 13029 29654 216888 197913 414801 78.10 98 913 978
8. Mon 129235 114250 243485 8770 7349 16119 138005 121599 259604 73.42 145 881 975
Nagaland 846651 789164 1635815 195035 157786 352821 1041686 946950 1988636 64.41 120 909 975
Note: Districts arranged according to rank of Human Development Index
Source: Census of India, 2001
Table A 3.1Number of Villages, Blocks and Administrative Circles 2001
Table A 3.2Distribution of Population, 2001

Nagaland State Human Development Report242
District Rural Population Urban Population Total Population Decadal
growth
rate
Density of Sex Ratio
Male Female Persons Male Female Persons Male Female Persons Population Overall 0 - 6
(1981-91)
1. Dimapur -- -- -- -- -- -- -- -- -- -- -- -- --
2. Mokokchung 69026 64545 133571 13797 11006 24803 82823 75551 158374 50.58 98 912 1010
3. Wokha 35070 33165 68235 8020 6357 14377 43090 39522 82612 41.96 51 917 1000
4. Kohima 141527 128658 270185 67263 50133 117396 208790 178791 387581 65.10 96 856 994
5. Phek 49309 44481 93790 5030 3336 8366 54339 47817 102156 44.19 50 880 969
6. Zunheboto 42764 41981 84745 6222 5251 11473 48986 47232 96218 35.04 77 964 1030
7. Tuensang 110944 100944 211888 12349 8669 21018 123293 109613 232906 69.92 55 889 975
8. Mon 73595 65314 138909 6366 4424 10790 79961 69738 149699 59.37 84 872 995
Nagaland 522235 479088 1001323 119047 89176 208223 641282 568264 1209546 56.86 73 886 993
Note: 1. Districts arranged according to rank of Human Development Index
2. Dimapur district was part of Kohima during 1981 and 1991 census
Source: Census of India; Statistical Abstract of Nagaland 1999-2000
District Rural Population Urban Population Total Population Decadal
growth
rate
Density of
Population
Sex Ratio
Male Female Persons Male Female Persons Male Female Persons Overall
(1971-81)
1. Dimapur -- -- -- -- -- -- -- -- -- -- -- --
2. Mokokchung 44617 41516 86133 10031 8029 18060 54648 49545 104193 25.88 69 907
3. Wokha 25156 24247 49403 4860 3320 8180 30016 27567 57583 49.92 35 918
4. Kohima 99578 83309 182887 40116 27102 67218 139694 110411 250105 91.49 62 790
5. Phek 37699 32919 70618 -- -- -- 37699 32919 70618 58.36 35 873
6. Zunheboto 26662 26821 53483 4474 3204 7678 31136 30025 61161 29.87 49 964
7. Tuensang 73141 66991 140132 7357 4843 12200 80498 71834 152332 39.93 36 892
8. Mon 37846 34194 72040 4373 2525 6898 42219 36719 78938 23.07 44 870
Nagaland 344699 309997 654696 71211 49023 120234 415910 359020 774930 50.05 47 863
Note: 1. Districts arranged according to rank of Human Development Index 2. Dimapur district was part of Kohima during 1981 and 1991 census
Source: Census of India; Statistical Abstract of Nagaland 1999-2000
III. Demographic Profile
Table A 3.3 Distribution of Population, 1991
Table A 3.4 Distribution of Population, 1981
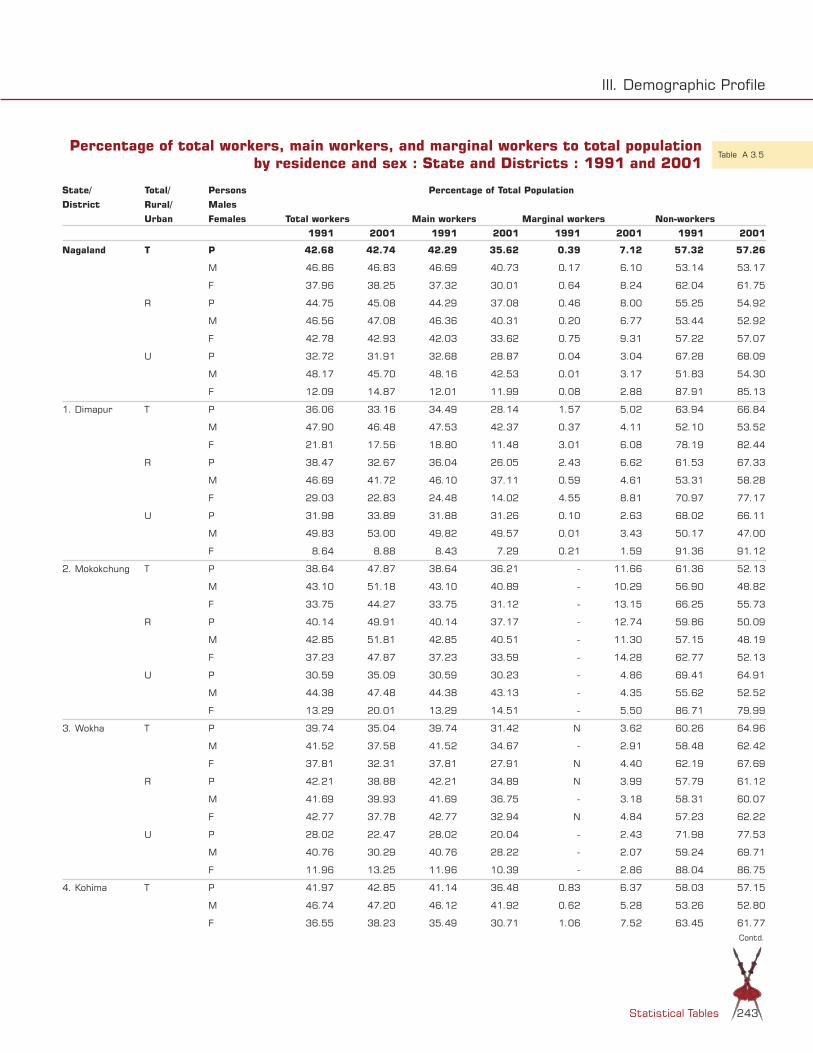
Statistical Tables 243
State/ Total/ Persons Percentage of Total Population
District Rural/ Males
Urban Females Total workers Main workers Marginal workers Non-workers
1991 2001 1991 2001 1991 2001 1991 2001
Nagaland T P 42.68 42.74 42.29 35.62 0.39 7.12 57.32 57.26
M 46.86 46.83 46.69 40.73 0.17 6.10 53.14 53.17
F 37.96 38.25 37.32 30.01 0.64 8.24 62.04 61.75
R P 44.75 45.08 44.29 37.08 0.46 8.00 55.25 54.92
M 46.56 47.08 46.36 40.31 0.20 6.77 53.44 52.92
F 42.78 42.93 42.03 33.62 0.75 9.31 57.22 57.07
U P 32.72 31.91 32.68 28.87 0.04 3.04 67.28 68.09
M 48.17 45.70 48.16 42.53 0.01 3.17 51.83 54.30
F 12.09 14.87 12.01 11.99 0.08 2.88 87.91 85.13
1. Dimapur T P 36.06 33.16 34.49 28.14 1.57 5.02 63.94 66.84
M 47.90 46.48 47.53 42.37 0.37 4.11 52.10 53.52
F 21.81 17.56 18.80 11.48 3.01 6.08 78.19 82.44
R P 38.47 32.67 36.04 26.05 2.43 6.62 61.53 67.33
M 46.69 41.72 46.10 37.11 0.59 4.61 53.31 58.28
F 29.03 22.83 24.48 14.02 4.55 8.81 70.97 77.17
U P 31.98 33.89 31.88 31.26 0.10 2.63 68.02 66.11
M 49.83 53.00 49.82 49.57 0.01 3.43 50.17 47.00
F 8.64 8.88 8.43 7.29 0.21 1.59 91.36 91.12
2. Mokokchung T P 38.64 47.87 38.64 36.21 - 11.66 61.36 52.13
M 43.10 51.18 43.10 40.89 - 10.29 56.90 48.82
F 33.75 44.27 33.75 31.12 - 13.15 66.25 55.73
R P 40.14 49.91 40.14 37.17 - 12.74 59.86 50.09
M 42.85 51.81 42.85 40.51 - 11.30 57.15 48.19
F 37.23 47.87 37.23 33.59 - 14.28 62.77 52.13
U P 30.59 35.09 30.59 30.23 - 4.86 69.41 64.91
M 44.38 47.48 44.38 43.13 - 4.35 55.62 52.52
F 13.29 20.01 13.29 14.51 - 5.50 86.71 79.99
3. Wokha T P 39.74 35.04 39.74 31.42 N 3.62 60.26 64.96
M 41.52 37.58 41.52 34.67 - 2.91 58.48 62.42
F 37.81 32.31 37.81 27.91 N 4.40 62.19 67.69
R P 42.21 38.88 42.21 34.89 N 3.99 57.79 61.12
M 41.69 39.93 41.69 36.75 - 3.18 58.31 60.07
F 42.77 37.78 42.77 32.94 N 4.84 57.23 62.22
U P 28.02 22.47 28.02 20.04 - 2.43 71.98 77.53
M 40.76 30.29 40.76 28.22 - 2.07 59.24 69.71
F 11.96 13.25 11.96 10.39 - 2.86 88.04 86.75
4. Kohima T P 41.97 42.85 41.14 36.48 0.83 6.37 58.03 57.15
M 46.74 47.20 46.12 41.92 0.62 5.28 53.26 52.80
F 36.55 38.23 35.49 30.71 1.06 7.52 63.45 61.77
III. Demographic Profile
Table A 3.5Percentage of total workers, main workers, and marginal workers to total population
by residence and sex : State and Districts : 1991 and 2001
Contd.

Nagaland State Human Development Report244
R P 44.20 46.21 43.11 38.44 1.09 7.77 55.80 53.79
M 45.55 47.94 44.71 41.57 0.84 6.37 54.45 52.06
F 42.76 44.43 41.40 35.21 1.36 9.22 57.24 55.57
U P 35.11 32.75 35.09 30.60 0.02 2.15 64.89 67.25
M 49.99 45.09 49.96 42.91 0.03 2.18 50.01 54.91
F 14.47 18.56 14.47 16.44 - 2.12 85.53 81.44
5. Phek T P 45.85 48.31 45.69 38.85 0.16 9.46 54.15 51.69
M 46.42 48.50 46.39 40.25 0.03 8.25 53.58 51.50
F 45.20 48.11 44.89 37.33 0.31 10.78 54.80 51.89
R P 46.32 48.19 46.14 38.92 0.18 9.27 53.68 51.81
M 45.37 47.64 45.33 39.48 0.04 8.16 54.63 52.36
F 47.38 48.78 47.05 38.34 0.33 10.44 52.62 51.22
U P 40.55 49.57 40.55 38.06 - 11.51 59.45 50.43
M 56.74 56.63 56.74 47.61 - 9.02 43.26 43.37
F 16.13 40.28 16.13 25.48 - 14.80 83.87 59.72
6. Zunheboto T P 42.54 40.06 42.54 32.52 - 7.54 57.46 59.94
M 44.04 40.94 44.04 34.48 - 6.46 55.96 59.06
F 40.99 39.13 40.99 30.45 - 8.68 59.01 60.87
R P 44.39 42.13 44.39 33.69 - 8.44 55.61 57.87
M 44.36 41.76 44.36 34.50 - 7.26 55.64 58.24
F 44.42 42.52 44.42 32.85 - 9.67 55.58 57.48
U P 28.91 28.08 28.91 25.77 - 2.31 71.09 71.92
M 41.82 36.55 41.82 34.38 - 2.17 58.18 63.45
F 13.62 17.78 13.62 15.30 - 2.48 86.38 82.22
7. Tuensang T P 45.24 44.65 45.23 38.03 0.01 6.62 54.76 55.35
M 47.08 46.14 47.08 40.02 - 6.12 52.92 53.86
F 43.17 43.01 43.15 35.85 0.02 7.16 56.83 56.99
R P 46.31 46.00 46.30 39.10 0.01 6.90 53.69 54.00
M 46.94 46.67 46.94 40.30 - 6.37 56.06 53.33
F 45.62 45.28 45.60 37.81 0.02 7.47 54.38 54.72
U P 34.45 27.08 34.45 24.11 N 2.97 65.55 72.92
M 48.38 39.74 48.38 36.69 - 3.05 51.62 60.26
F 14.60 10.93 14.59 8.06 0.01 2.87 85.40 89.07
8. Mon T P 51.38 49.66 51.36 41.74 0.02 7.92 48.62 50.34
M 54.23 52.20 54.22 45.84 0.01 6.36 45.77 47.80
F 48.10 46.77 48.07 37.09 0.03 9.68 51.90 53.23
R P 52.91 51.04 52.90 42.79 0.01 8.25 47.09 48.96
M 54.90 53.18 54.90 46.59 - 6.59 45.10 46.82
F 50.66 48.63 50.65 38.50 0.01 10.13 49.34 51.37
U P 31.65 28.74 31.48 25.86 0.17 2.88 68.35 71.26
M 46.53 37.77 46.43 34.77 0.10 3.00 53.47 62.23
F 10.24 17.98 9.95 15.23 0.29 2.75 89.76 82.02
N = NegligibleSource: Census of India, 2001
Note: Districts arranged according to rank of Human Development Index
State/ Total/ Persons Percentage of Total PopulationDistrict Rural/ Males
Urban Females Total workers Main workers Marginal workers Non-workers
1991 2001 1991 2001 1991 2001 1991 2001
III. Demographic Profile
Percentage of total workers, main workers...
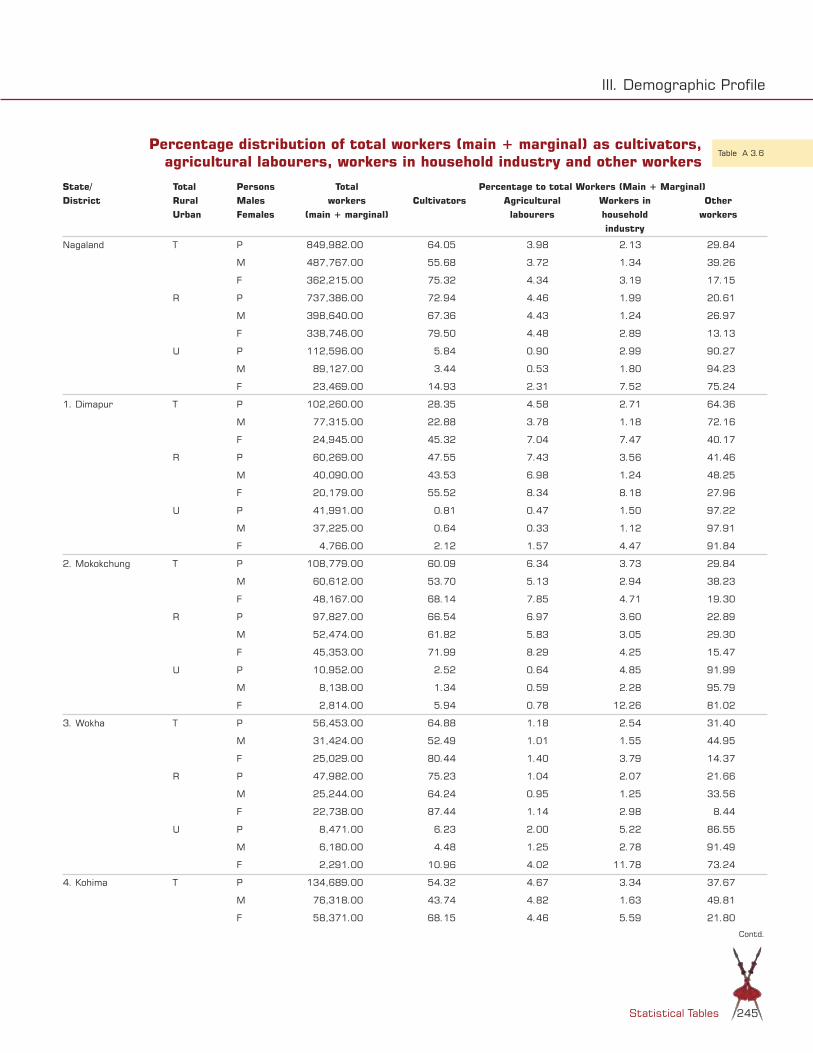
Statistical Tables 245
State/ Total Persons Total Percentage to total Workers (Main + Marginal)District Rural Males workers Cultivators Agricultural Workers in Other
Urban Females (main + marginal) labourers household workersindustry
Nagaland T P 849,982.00 64.05 3.98 2.13 29.84
M 487,767.00 55.68 3.72 1.34 39.26
F 362,215.00 75.32 4.34 3.19 17.15
R P 737,386.00 72.94 4.46 1.99 20.61
M 398,640.00 67.36 4.43 1.24 26.97
F 338,746.00 79.50 4.48 2.89 13.13
U P 112,596.00 5.84 0.90 2.99 90.27
M 89,127.00 3.44 0.53 1.80 94.23
F 23,469.00 14.93 2.31 7.52 75.24
1. Dimapur T P 102,260.00 28.35 4.58 2.71 64.36
M 77,315.00 22.88 3.78 1.18 72.16
F 24,945.00 45.32 7.04 7.47 40.17
R P 60,269.00 47.55 7.43 3.56 41.46
M 40,090.00 43.53 6.98 1.24 48.25
F 20,179.00 55.52 8.34 8.18 27.96
U P 41,991.00 0.81 0.47 1.50 97.22
M 37,225.00 0.64 0.33 1.12 97.91
F 4,766.00 2.12 1.57 4.47 91.84
2. Mokokchung T P 108,779.00 60.09 6.34 3.73 29.84
M 60,612.00 53.70 5.13 2.94 38.23
F 48,167.00 68.14 7.85 4.71 19.30
R P 97,827.00 66.54 6.97 3.60 22.89
M 52,474.00 61.82 5.83 3.05 29.30
F 45,353.00 71.99 8.29 4.25 15.47
U P 10,952.00 2.52 0.64 4.85 91.99
M 8,138.00 1.34 0.59 2.28 95.79
F 2,814.00 5.94 0.78 12.26 81.02
3. Wokha T P 56,453.00 64.88 1.18 2.54 31.40
M 31,424.00 52.49 1.01 1.55 44.95
F 25,029.00 80.44 1.40 3.79 14.37
R P 47,982.00 75.23 1.04 2.07 21.66
M 25,244.00 64.24 0.95 1.25 33.56
F 22,738.00 87.44 1.14 2.98 8.44
U P 8,471.00 6.23 2.00 5.22 86.55
M 6,180.00 4.48 1.25 2.78 91.49
F 2,291.00 10.96 4.02 11.78 73.24
4. Kohima T P 134,689.00 54.32 4.67 3.34 37.67
M 76,318.00 43.74 4.82 1.63 49.81
F 58,371.00 68.15 4.46 5.59 21.80
III. Demographic Profile
Table A 3.6Percentage distribution of total workers (main + marginal) as cultivators,
agricultural labourers, workers in household industry and other workers
Contd.

Nagaland State Human Development Report246
R P 108,951.00 66.89 5.66 3.48 23.97
M 57,365.00 58.01 6.32 1.69 33.98
F 51,586.00 76.77 4.91 5.47 12.85
U P 25,738.00 1.08 0.49 2.77 95.66
M 18,953.00 0.53 0.28 1.44 97.75
F 6,785.00 2.61 1.05 6.51 89.83
5. Phek T P 71,620.00 72.74 1.90 2.01 23.35
M 37,382.00 61.75 1.98 1.27 35.00
F 34,238.00 84.75 1.81 2.81 10.63
R P 65,244.00 76.11 1.96 1.96 19.97
M 33,243.00 66.43 2.13 1.31 30.13
F 32,001.00 86.17 1.78 2.64 9.41
U P 6,376.00 38.19 1.32 2.51 57.98
M 4,139.00 24.06 0.80 0.99 74.15
F 2,237.00 64.33 2.28 5.32 28.07
6. Zunheboto T P 62,507.00 44.57 2.78 1.25 51.40
M 32,598.00 45.95 1.88 0.80 51.37
F 29,459.00 43.04 3.77 1.75 51.44
R P 55,653.00 48.41 2.77 1.01 47.81
M 28,025.00 52.52 2.08 0.61 44.79
F 27,628.00 44.24 3.47 1.42 50.87
U P 6,404.00 11.18 2.84 3.33 82.65
M 4,573.00 5.71 0.63 1.97 91.69
F 1,831.00 24.85 8.35 6.72 60.08
7. Tuensang T P 185,209.00 82.25 3.42 0.84 13.49
M 100,080.00 76.26 3.30 0.63 19.81
F 85,129.00 89.27 3.56 1.10 6.07
R P 177,178.00 85.32 3.51 0.82 10.35
M 93,473.00 80.93 3.45 0.62 15.00
F 83,705.00 90.22 3.57 1.05 5.16
U P 8,031.00 14.46 1.42 1.26 82.86
M 6,607.00 10.35 1.08 0.74 87.83
F 1,424.00 33.50 3.02 3.65 59.83
8. Mon T P 128,915.00 83.94 4.58 1.18 10.30
M 72,038.00 79.28 4.80 1.02 14.90
F 56,877.00 89.84 4.31 1.38 4.47
R P 124,282.00 86.39 4.70 0.76 8.15
M 68,726.00 82.52 4.98 0.51 11.99
F 55,556.00 91.19 4.34 1.06 3.41
U P 4,633.00 18.13 1.45 12.54 67.88
M 3,312.00 12.17 0.97 11.50 75.36
F 1,321.00 33.08 2.65 15.14 49.13
Source: Census of India, 2001
Note: Districts arranged according to rank of Human Development Index
State/ Total Persons Total Percentage to total Workers (Main + Marginal)District Rural Males workers Cultivators Agricultural Workers in Other
Urban Females (main + marginal) labourers household workersindustry
III. Demographic Profile
Percentage distribution of total workers...

Statistical Tables 247
District Work participation rate Percentage of workers engaged in
2001 1991 non-agricultural activities
1. Dimapur 33.16 35.06 67.07
(8) (8) (1)
2. Mokokchung 47.87 38.64 33.57
(3) (7) (5)
3. Wokha 35.04 39.74 33.94
(7) (6) (4)
4. Kohima 42.85 41.97 41.02
(5) (5) (3)
5. Phek 48.31 45.85 25.36
(2) (2) (6)
6. Zunheboto 40.06 42.54 52.65
(6) (4) (2)
7. Tuensang 44.65 45.24 14.34
(4) (3) (7)
8. Mon 49.66 51.38 11.48
(1) (1) (8)
Note: 1. Districts arranged according to rank of Human Development Index
2. Figures in Parentheses is the relative ranking within the districts
Source: Census of India, 2001
District Percentage of youth to total population Percentage of Population aged 65 and above to total Population
1991 1991
1. Dimapur -- --
2. Mokokchung 23.99 8921
3. Wokha 26.93 4164
4. Kohima 25.84 13079
5. Phek 27.41 4002
6. Zunheboto 26.38 5119
7. Tuensang 26.44 12794
8. Mon 24.39 9034
Nagaland 25.78 57113
Note: 1. Districts arranged according to rank of Human Development Index 2. Dimapur district was part of Kohima during 1991 census
Source: Census of India, 1991
III. Demographic Profile
Table A 3.7Work Participation Rates & other Characteristics
Table A 3.8Percentage of Youth and Elderly in the Population

Nagaland State Human Development Report248
(in Sq. Km.)
Density Class 1997 Assessment 1999 Assessment Increase/Decrease in Forest Cover
(1993-95 Data) (1998 Data)
Sq.Km Percent
Dense Forest 3,487 5,137 1,650 32.11
Open Forest 10,734 9,027 -1707 18.9
Non-Forest 2,358 2,415 57 2.36
Total 16,579 16,579 - -
District-wise Forest Cover in Nagaland in 1999(in Sq. Km.)
District Geographical area Forest cover Total
Dense Forest Open Forest
Mokokchung 1615 197 1140 1337
Wokha 1628 390 1189 1579
Kohima 4041 1775 1797 3572
Phek 2026 542 1154 1696
Zunheboto 1255 335 780 1115
Tuensang 4228 1247 2110 3357
Mon 1786 651 857 1508
Nagaland 16579 5137 9027 14164
Sources: The State of Forest Reports 1997 and 1999, Ministry of Environment & Forests, Government of India
Note: Dimapur district was part of Kohima during 1991 census
IV. Our Resources... and their Utilisation
Table A 4.1 Forest Cover in Nagaland

Statistical Tables 249
(In Hectares)
Legal Status Forests Area (Ha) % of Total Forest Area
State Owned:
Reserved Forests 8583 1
Purchased Forests 19162 2.2
Protected Forests 50756 5.9
Wildlife Sanctuary 22237 2.6
Village Forests:
Virgin Forests 477827 55.4
Degraded Forests 284280 32.9
Total 862845 100
Ownership:
State Government 100823 11.70%
Private/Community 762107 88.30%
Source: State Department of Forests and Environment
(In Hectares)
District Total area under
Jhum
Area under Current
Jhum
Area under
TRC/WRC
Area under
Horticulture/ Cash
Crops
Total Area under
agricultural activity
1. Dimapur 18307 4340 30937 6091 41368
2. Mokokchung 123063 11923 2986 1928 16837
3. Wokha 109185 15580 1991 1166 18737
4. Kohima 126036 11529 13004 1542 26075
5. Phek 52660 21054 15561 1533 38148
6. Zunheboto 106046 12306 3574 1058 16938
7. Tuensang 306275 41083 6684 1293 49060
8. Mon 75515 13534 1251 839 15624
Nagaland 917087 131349 75988 15450 222787
Source: Nagaland Village Profile 2001State Department of Agriculture
Note: Districts arranged according to rank of Human Development Index
IV. Our Resources... and their Utilisation
Table A 4.2Classification of Forest Area
Table A 4.3Land use Pattern

Nagaland State Human Development Report250
Size/Class Number of holdings and Area operated
1970-71 1976-77 1980-81 1985-86 1990-91 1995-96
Marginal8798 9812 10187 8332 13288 9396
(5683) -6180 (4575) (3364) (8542) (4778)
Small16397 14482 20068 19312 21403 2794
(20144) (22448) (26223) (24478) (29962) (21183)
Semi-medium25923 20077 15547 19202 26203 4466
(69238) (60124) (41543) (48994) (76053) (104118)
Medium 29467 33676 33090 41956 47191 64095
(175467) (228301) (202553) (260288) (297908) (380976)
Large 12678 25278 37154 36404 33411 14420
(233231) (468595) (484559) (9596089) (555711) (205722)
Total 93263 103325 116046 125206 141506 149171
(503763) (785648) (859453) (933413) (968196) (719052)
Source: Report on the Agricultural Census 1995-96
Note: Figures in Parentheses refer to the Area Operated (in hectares)
IV. Our Resources... and their Utilisation
Table A 4.4 Number of holdings and Area operated

Statistical Tables 251
(In Hectares)
Year Paddy Maize WheatOther Cereals Pulses Oil Seeds Fibres Fruits Vegetables
1980 - 81 1,01,594 17,299 2,700 12,472 4,790 3000 210 - 4,650.00
1981 - 82 1,06,038 17,692 3,060 11,555 4,340 3,340 215 - 5,315.00
1982 - 83 1,10,930 18,080 3,300 8,360 4,430 3,640 220 - 6,325.00
1983 - 84 1,13,670 18,480 3,850 22,900 4,007 3,680 230 - 3,720.00
1984 - 85 1,20,870 17,870 4,610 6,660 9,980 5,350 230 - 4,540.00
1985 - 86 1,19,750 21,500 5,000 10,070 10,700 7,050 230 - 1,450.00
1986 - 87 1,16,140 22,000 320 10,130 10,800 8,000 240 - 1,450.00
1987 - 88 1,22,500 22,500 300 10,850 10,900 9,000 260 - 1,600.00
1988 - 89 1,21,040 22,700 400 11,300 12,900 9,930 300 - 1,400.00
1989 - 90 1,27,400 22,500 500 6,700 13,500 10,600 350 - 1,650.00
1990 - 91 1,27,420 23,100 510 16,000 13,500 12,900 350 - 1,750.00
1991 - 92 1,29,000 24,900 540 14,000 14,000 11,750 350 - 1,900.00
1992 - 93 1,35,000 24,000 400 15,300 10,472 12,049 320 4,198.70 5,239.50
1993 - 94 1,34,000 26,000 330 13,000 9,900 4,700 325 4,428.80 4,556.90
1994 - 95 1,36,000 27,000 330 13,000 9,400 10,700 325 14,513.70 5,490.80
1995 - 96 1,35,000 26,000 500 13,000 10,000 13,900 350 5,047.90 5,513.50
1996 - 97 1,40,000 32,000 2,000 14,000 4,100 18,500 550 - -
1997 - 98 1,45,200 30,000 1,750 14,500 1,440 17,500 500 - 10,799.00
1998 - 99 1,45,250 32,000 3,500 12,500 2,500 22,500 600 5,598.00 6,042.00
Source: Directorate of Economics & Statistics, Nagaland
IV. Our Resources... and their Utilisation
Table A 4.5Area under Crops

Nagaland State Human Development Report252
(In Tonnes)
Year Paddy Maize Wheat Other Cereals
Pulses Oil Seeds Fibres Fruits Vegetables Sugars
1980 - 81 91,412 11,763 4,000 6,860 2,278 1,318 915 - 25,242.00 -
1981 - 82 99,144 12,385 4,500 6,568 2,412 1,402 989 - 30,124.00 -
1982 - 83 1,03,430 13,020 5,000 6,080 2,470 1,577 605 - 42,840.00 -
1983 - 84 92,000 14,840 6,160 14,000 4,000 1,600 150 - 24,410.00 -
1984 - 85 1,02,350 14,200 6,950 3,500 8,010 5,000 160 - 2,155.00 -
1985 - 86 95,080 14,520 7,100 11,400 6,600 5,620 110 - 1,620.00 -
1986 - 87 83,900 7,200 500 11,400 7,500 10,410 110 - 7,620.00 -
1987 - 88 86,000 9,500 450 11,750 8,160 11,700 130 - 7,010.00 606,000
1988 - 89 67,000 19,290 1,000 11,800 10,300 6,000 160 - 6,500.00 119,000
1989 - 90 78,000 20,100 1,500 6,500 12,000 8,700 170 - 7,500.00 129,000
1990 - 91 1,56,300 22,250 1,550 18,650 12,000 9,550 160 - 2,750.00 130,000
1991 - 92 1,54,000 25,000 1,600 8,000 15,000 10,200 220 - 18,560.00 130,100
1992 - 93 1,76,000 26,000 900 9,200 1,050 7,195 2,610 107,715.50 54,178.80
1993 - 94 1,80,000 28,000 1,000 9,900 1,600 9,470 2,430 7,187.90 67,318.60 -
1994 - 95 1,84,000 28,000 1,000 9,000 1,200 7,760 2,430 71,338.40 68,591.90 -
1995 - 96 1,82,000 30,000 1,500 9,000 2,500 13,760 2,880 69,883.00 67,822.00 -
1996 - 97 1,53,000 33,000 5,000 9,700 - 13,380 4,600 - - 125,000
1997 - 98 1,87,250 30,000 3,000 8,850 - 13,300 710 - 108,935.90 50,000
1998 - 99 2,10,200 41,600 9,350 8,750 - 20,800 830 55,862.00 71,920.00 68,000
1999 - 00 2,20,700 48,000 12,500 1,200 - 24,500 830 57,235.00 76,934.00 30,000
Source: Directorate of Economics & Statistics, Nagaland
IV. Our Resources... and their Utilisation
Table A 4.6 Production of Crops

Statistical Tables 253
(Small Scale industries, Govt. Emporium, District Industries Centres and Farms)
District 1980-81 1985-86 1990-91 1997-98 1999-00
1. Dimapur .. .. .. .. 786
2. Mokokchung 14 14 21 74 99
3. Wokha 6 4 8 28 47
4. Kohima 29 24 51 654 71
5. Phek 5 4 11 35 37
6. Zunheboto 4 6 8 19 30
7. Tuensang 10 15 13 23 25
8. Mon 5 6 9 57 65
Nagaland 73 73 121 885 1160
Source: Directorate of Economics & Statistics, Nagaland
IV. Our Resources... and their Utilisation
Table A 4.7Number of Industrial/ Entreprenuerial Units

Nagaland State Human Development Report254
(In MKWH)
Year Power generated Power consumed
1980 - 81 2.26 23.62
1981 - 82 2.26 26.06
1982 - 83 1.65 26.55
1983 - 84 0.76 51.65
1984 - 85 0.53 85.59
1985 - 86 0.62 69.047
1986 - 87 1.1 62.291
1987 - 88 0.802 46.16
1988 - 89 0.617 72.86
1989 - 90 1.89 101.54
1990 - 91 2.3 74.11
1991 - 92 2.15 77.64
1992 - 93 3.65 79.11
1993 – 94 1.59 94.47
1994 – 95 2.33 102.28
1995 – 96 2.55 110.01
1996 – 97 2.22 127.36
1997 – 98 2.55 131.19
1998 – 99 2.42 129.29
1999 - 00 2.8 145.75
Total 37.049 1636.578
Source: Directorate of Economics & Statistics, Nagaland
IV. Our Resources... and their Utilisation
Table A 4.8 Electricity: Generation and Consumption

Statistical Tables 255
Measure of Employment Place of Nagaland All India
Residence Persons Male Female Persons Male Female
Usual Status Urban 31.5 43.2 17.6 34.2 53.9 12.6
Rural 39.8 52.3 25.5 38.7 53.3 23.5
Weekly Status Urban 33.5 43.3 21.7 34.7 53.9 13.8
Rural 49.2 53.3 44.5 40 53.1 26.3
Daily Status Urban 43.2 52.4 32.7 33.5 52.8 12.3
Rural 32.1 43.1 18.9 37 51.5 22
Source: Employment and Unemployment Situation in India, 1999-2000, NSS 55th Round, NSSO, Government of India
Year Persons registered as per educational qualifications Total Total Educated persons registered
% share of educated in total
unemployed
Below Matric
Matriculate Graduate & Above
1991 11535 9388 1146 22069 10534 47.73
1992 10768 10164 1464 22396 11628 51.92
1993 11549 11133 1767 24449 12900 52.76
1994 12212 11857 1780 25849 13637 52.76
1995 11570 11811 1610 24991 13421 53.7
1996 7315 10652 2688 20655 13340 64.58
1997 7237 11623 2783 21643 14406 66.56
1998 8242 16256 3254 27752 19510 70.3
1999 13889 18616 2958 35463 21574 60.84
2000 14971 18950 3169 37090 22119 59.64
Source: Kikhi, Kedilezo; ‘Educated Unemployed in Nagaland: Trend and Magnitude’;Dimensions of Development in Nagaland, Regency Publications, New Delhi
IV. Our Resources... and their Utilisation
Table A 4.9Percentage of persons in the labour force by measures of employment, 1999-2000
Table A 4.10Total Number of Registered Applicants in the
Live Register on Employment Exchange in the State

Nagaland State Human Development Report256
(As on 31.3.97)
Particulars Status Total
Class I Class II Class III Class IV
A. Distribution by Status 2591 916 33399 27611 64517
(4.02%) (1.42%) (51.77%) (42.80%) (100%)
B. Distribution by Sex
1. Male 2268 781 25468 25481 53998
(87.53%) (82.26%) (76.25%) (92.28%) (83.70%)
2. Female 323 135 7931 2130 10519
(12.47%) (14.74) (23.75%) (7.72%) (16.30%)
C. Distribution by Educational Qualifications
1. Post Graduate 680 114 418 0 1212
(26.24%) (12.45%) (1.25%) (()%) (1.88%)
2. Graduate 1065 453 4403 6 5927
(41.10%) (49.45%) (13.18%) (0.02%) (9.19%)
3. P.U./Intermediate 622 170 4393 81 5266
(24.01%) (18.56%) (13.15%) (0.29%) (8.16%)
4. Matriculate 215 116 9854 1281 11466
(8.30%) (12.66%) (29.51%) (4.64%) (17.77%)
5. Under-matric 9 63 14331 25311 39714
(0.35%) (6.88%) (42.91%) (91.67%) (61.56%)
6. Illiterate 0 0 0 932 932
(()%) (()%) (()%) (3.38%) (1.44%)
Total 2591 916 33399 27611 64517
(100%) (100%) (100%) (100%) (100%)
Source: Directorate of Economics & Statistics, Nagaland
IV. Our Resources... and their Utilisation
Table A 4.11 Composition of Government Employees

Statistical Tables 257
District CHC PHC SHC Big Dispensary SC Total
1. Dimapur 1 4 2 2 39 48
2. Mokokchung 2 11 1 5 49 68
3. Wokha 1 6 5 1 30 43
4. Kohima 2 14 8 .. 48 72
5. Phek 2 10 6 3 34 55
6. Zunheboto 2 6 3 1 40 52
7. Tuensang 3 11 5 2 61 82
8. Mon 1 6 5 1 49 62
Nagaland 14 68 35 15 350 482
Growth of Health Institutions
Health Centre/Institution Prior to 1992-93 Position in 2000 Current Position 2003
District Hospital 7 8 8
TB Hospital 2 2 2
Mental Hospital 1 1 1
Community Health Centre 3 12 14
Primary Health Centre 30 67 68
Sub Centre 209 335 350
Total 252 425 443
Source: Department of Health and Family Welfare, Government of Nagaland
V. Health Indicators
Table A 5.1Nagaland’s Health Institutions (2003)

Nagaland State Human Development Report258
Categories Number
MBBS 208
Specialists in different disciplines 98
General Nurse Midwife 390
Auxiliary Nurse Midwife (Female Health Worker) 665
Status of personnel disaggregated to different medical specialties
Discipline Trained Under Training
Orthopaedics 3 1
Anaesthesiology 4 3
Ophthalmology 6 1
Surgery 5 1
Pathology 3 2
Paediatrics 2 3
Obstetrics & Gynaecology 6 4
Radiology 2 -
Microbiology 1 -
Ear, Nose Throat (ENT) 5 1
Biochemistry 2 3
Medicine 3 4
Psychiatry 5 -
Public Health 4 -
MDS (Operation Dentistry 1 3
Total 52 26
Source: Department of Health and Family Welfare, Government of Nagaland
V. Health Indicators
Table A 5.2 Health care personnel

Statistical Tables 259
Age Percentage distribution of Currently married women by contraceptive method used
Not using any method
Using Any method
Pill IUD Condom Female sterilisation
Male sterilisation
Rhythm/safe period
Withdrawal Other method
15-19 100 0 0 0 0 0 0 0 0
20-24 88.1 2.4 7.2 0 0.8 0 1.5 0 0
25-29 76.4 1.8 7.8 5 6.2 0 1.1 1.7 0
30-34 57.1 5.1 9.9 1.4 15.3 0 8.4 2.9 0
35-39 53.7 2.2 8.6 2.2 23.7 0 9.7 0 0
40-44 59.2 2.7 12.3 0 17.6 0 3.6 3.5 1.1
45-49 69.9 1.4 1.5 0 21.7 0 4.1 1.3 0
Total 69.7 2.5 7.7 1.8 12.3 0 4.5 1.4 0.1
Source: National Family Health Survey 1998-1999.
V. Health Indicators
Table A 5.3Extent and Use of Contraceptives

Nagaland State Human Development Report260
Diseases Kohima Mokokchung
Inpatient Outpatient Total Inpatient Outpatient Total
1 Typhoid fever 708 2301 3009 211 1700 1911
2 Amoebiasis 387 3381 3768 81 2091 2172
3 Bacillary dysentery 1812 7611 9423 2003 3157 5160
4 Whooping cough 360 2900 3260 99 1041 1140
5 Malaria 800 3792 4592 400 3462 3862
6 Anaemia 1429 1597 3026 329 4674 5003
7 Acute Bronchitis 900 3179 4079 826 1493 2319
8 Influenza 2000 8836 9836 820 6290 7110
9 Ulcer stomach & duodenum 1295 2394 3689 194 1180 1374
10 Kidney infection 325 1890 2215 110 1362 1472
11 Diseases of skin and subcutaneous tissue 1000 2200 3200 1000 3150 4150
12 Open wounds & injury to blood vessel 2021 3835 5856 997 2175 3127
13 Tonsillitis 300 1695 1995 381 1259 1640
14 Hypertension 259 1700 1959 176 999 1175
15 Otitis media 45 1174 1219 10 1030 1040
Source: Department of Health and Family Welfare, Nagaland
V. Health Indicators
Table A 5.4 Morbidity data for Kohima and Mokokchung, 2002

Statistical Tables 261
Year Dimapur Mokokchung Wokha Kohima Phek Zunheboto Tuensang Mon Total
1994 .. .. .. 1 .. .. . .. 1
1995 .. 3 .. 3 .. .. .. .. 6
1996 .. .. .. .. .. .. .. .. 0
1997 .. .. .. 1 .. .. .. .. 1
1998 .. .. .. 10 .. .. 1 .. 11
1999 .. .. .. 3 .. .. 5 .. 8
2000 8 1 .. 31 .. .. 15 .. 55
2001 41 25 .. 24 .. .. 41 .. 131
2002 29 25 2 11 .. .. 35 5 107
2003 51 18 .. 18 .. .. 47 .. 134
Jan–04 .. 1 .. 2 3 .. 2 .. 8
Total 129 73 2 104 3 .. 146 5 462
Source: Nagaland State AIDS Control Society
V. Health Indicators
Table A 5.5Number of AIDS Patients

Nagaland State Human Development Report262
District Literacy Rate 2001 Literacy Rate 1991 Increase in Literacy RatePersons Males Females Persons Males Females Persons Males Females
1. Dimapur 78.15 82.16 73.34 68.65 73.44 64.42 13.84 11.57 13.86
2. Mokokchung 84.27 86.14 82.2 77.85 80.52 74.88 8.25 6.98 9.78
3. Wokha 81.28 85.69 76.46 73.92 81.05 65.99 11.28 5.71 16.05
4. Kohima 74.28 81.44 66.64 69.58 75.58 61.41 6.75 5.55 9.97
5. Phek 71.35 78.97 63.08 62.59 72.28 51.34 15.61 9.26 22.87
6. Zunheboto 69.73 73.43 65.8 64.36 70.76 57.63 8.34 3.77 14.18
7. Tuensang 51.3 55.97 46.12 48.39 53.98 41.98 6.01 3.69 9.86
8. Mon 42.25 46.7 37.12 36.02 41.9 29.1 17.3 11.46 27.56
Nagaland 67.11 71.77 61.92 61.65 67.62 54.75 8.86 6.14 13.1
All India 63.38 75.85 54.16 52.21 64.13 39.29 21.39 18.28 37.85
Source: Department of School Education, Nagaland
Note: Districts arranged according to rank of Human Development Index
District Total 6-11 years Total 11-14 years Total 6-14 years
Total child population
Total out of School
Total enrolled
Total child population
Total out of School
Total enrolled
Total child population
Total out of School
Total enrolled
1. Dimapur 20231 2943 17288 9004 877 8127 29235 3820 25415
2. Mokokchung 13301 871 12430 5686 349 5337 18987 1220 17767
3. Wokha 12801 1416 11385 4721 362 4359 17522 1778 15744
4. Kohima 22010 1838 20172 9368 778 8590 31378 2616 28762
5. Phek 21205 2916 18289 8315 1189 7126 29520 4105 25415
6. Zunheboto 17200 2567 14633 6792 975 5817 23992 3542 20450
7. Tuensang 34738 9484 25254 13107 2540 10567 47845 12024 35821
8. Mon 32929 13663 19266 11941 3499 8442 44870 17162 27708
Nagaland 174415 35698 138717 68934 10569 58365 243349 46267 197082
Source: Household Survey, State Education Department, 2002
Note: Districts arranged according to rank of Human Development Index
VI. Indicators of Educational Attainments
Table A 6.1 Literacy Rates
Table A 6.2 District wise Child Population, Enrolment and Out of School Children

Statistical Tables 263
District Total Trained Teachers Total Untrained Teachers Total Pupil-Teacher Ratio
1. Dimapur 326 788 1114 1 : 22.81.
2. Mokokchung 669 1041 1710 1 : 10.39.
3. Wokha 303 490 793 1 : 19.85.
4. Kohima 678 1030 1708 1 : 16.84.
5. Phek 197 739 936 1 : 27.15.
6. Zunheboto 374 806 1180 1 : 17.33.
7. Tuensang 349 1741 2090 1 : 17.14.
8. Mon 414 638 1052 1 : 26.34.
Nagaland 3310 7273 10583 1 : 18.62.
Source: Department of School Education, Nagaland
Note: Districts arranged according to rank of Human Development Index
Districts 1997 1998 1999
Govt. School Private School Govt. School Private School Govt. School Private School
1. Dimapur .. .. .. .. 45.95 72.66
2. Mokokchung 20.8 47.77 13.86 47.77 37.02 58.7
3. Wokha 10.64 43.78 8.87 34.48 29.92 60
4. Kohima 18.72 57.38 20.69 76.17 48.26 82.17
5. Phek 25.32 48.62 20.45 39.1 50.44 70.77
6. Zunheboto 1.86 29.55 6.2 31.78 21.43 50
7. Tuensang 8.32 53.76 9.74 71.16 24.65 69.28
8. Mon 6.12 42.35 4.19 51.4 19.92 69.35
Nagaland 13.84 52.62 13.03 62 35.02 70.21
Source: Report of Education Commission of Nagaland
Note: Districts arranged according to rank of Human Development Index
VI. Indicators of Educational Attainments
Table A 6.3Teacher Position
Table A 6.4Pass Percentage in H.S.L.C. Examinations
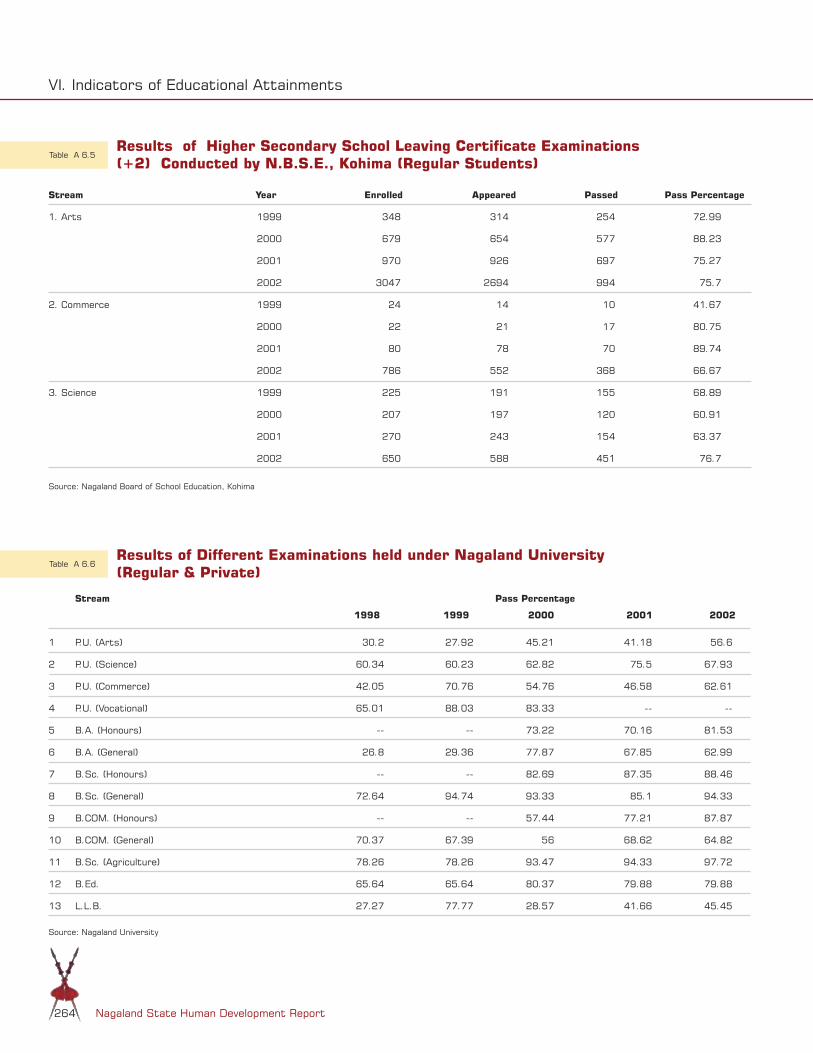
Nagaland State Human Development Report264
Stream Year Enrolled Appeared Passed Pass Percentage
1. Arts 1999 348 314 254 72.99
2000 679 654 577 88.23
2001 970 926 697 75.27
2002 3047 2694 994 75.7
2. Commerce 1999 24 14 10 41.67
2000 22 21 17 80.75
2001 80 78 70 89.74
2002 786 552 368 66.67
3. Science 1999 225 191 155 68.89
2000 207 197 120 60.91
2001 270 243 154 63.37
2002 650 588 451 76.7
Source: Nagaland Board of School Education, Kohima
Stream Pass Percentage
1998 1999 2000 2001 2002
1 P.U. (Arts) 30.2 27.92 45.21 41.18 56.6
2 P.U. (Science) 60.34 60.23 62.82 75.5 67.93
3 P.U. (Commerce) 42.05 70.76 54.76 46.58 62.61
4 P.U. (Vocational) 65.01 88.03 83.33 -- --
5 B.A. (Honours) -- -- 73.22 70.16 81.53
6 B.A. (General) 26.8 29.36 77.87 67.85 62.99
7 B.Sc. (Honours) -- -- 82.69 87.35 88.46
8 B.Sc. (General) 72.64 94.74 93.33 85.1 94.33
9 B.COM. (Honours) -- -- 57.44 77.21 87.87
10 B.COM. (General) 70.37 67.39 56 68.62 64.82
11 B.Sc. (Agriculture) 78.26 78.26 93.47 94.33 97.72
12 B.Ed. 65.64 65.64 80.37 79.88 79.88
13 L.L.B. 27.27 77.77 28.57 41.66 45.45
Source: Nagaland University
VI. Indicators of Educational Attainments
Table A 6.5Results of Higher Secondary School Leaving Certificate Examinations (+2) Conducted by N.B.S.E., Kohima (Regular Students)
Table A 6.6Results of Different Examinations held under Nagaland University (Regular & Private)

Statistical Tables 265
Particulars 1995 1996 1997 1998 1999 2000 2001 2002
1. Number of Teachers N.A. N.A. 79 109 112 152 139
2. Number of Post Graduate Students N.A. N.A. N.A. 413 516 420 246
3. Total Researches undertaken, of which, 2 7 15 19 7 7 6 58
a. By Teachers 2 7 5 11 4 1 0 13
b. By Research Scholars 0 0 10 8 3 6 6 45
Source: Nagaland University
(Rs. in lakh)
Name of the College 1998-99 1999-2000 2000-2001
1 Fazl Ali College, Mokokchung 123.02 173.08 180.45
2 Kohima Science College, Kohima 155.95 149.93 185
3 Dimapur College, Dimapur 73.28 75.77 126.05
4 Wangkhao College, Mon 25.83 36.74 59.59`
5 Sao Chang College, Tuensang 85.73 47.57 48.27
6 Zunheboto College, Zunheboto 42.85 46.63 47.24
7 Phek College, Phek 23.78 29.42 40.14
8 Mt. Tiyi College, Wokha 36.03 39.49 43.52
9 Nagaland College of Teacher Education, Kohima 37.73 46.66 56.04
10 Khelhoshe Polytechnic, Atoizu 94.81 91.23 89.01
11 Government Polytechnic, Kohima 19.2 25.8 56.35
Total 718.21 762.32 931.66
Source : Directorate of Higher & Technical Education, Nagaland
VI. Indicators of Educational
Table A 6.7Enrolment of Teaching Staff and Students in Nagaland University
Table A 6.8Expenditure on Government Colleges

Nagaland State Human Development Report266
District Female Literacy Rate Female Literacy Rate as a Percentage to the Male Literacy Rate
Female Work participation rate
Male Work participation rate
2001 2001 2001 1991 2001 1991
1. Dimapur 73.34 89.26 17.56 21.81 46.48 47.90
2. Mokokchung 82.2 95.43 44.28 33.75 51.18 43.10
3. Wokha 76.46 89.23 32.31 37.81 37.58 41.52
4. Kohima 66.64 81.83 38.23 36.55 47.20 46.74
5. Phek 63.08 79.88 48.11 45.20 48.50 46.42
6. Zunheboto 65.8 89.61 39.13 40.99 40.94 44.04
7. Tuensang 46.12 82.40 43.01 43.17 46.14 47.08
8. Mon 37.12 79.49 46.77 46.77 52.20 52.20
Source: Census of India, 2001
Note: Districts arranged according to rank of Human Development Index
Background characteristics Mean ideal number of Percentage of ever married women who want Number of women
Sons Daughters Either Sex More sons than daughters
More daughters than sons
Atleast one son
Atleast one daughter
Residence
Urban 1.7 1.4 0.3 27.2 5.6 91.6 91.2 166
Rural 2.1 1.7 0.3 34.2 6.5 91.6 88.0 642
Education
Illiterate 2.3 1.8 0.3 41.4 9.0 92.5 88.8 31.8
Literate, less than middle school complete 2.0 1.7 0.3 29.0 4.5 91.4 88.5 274
Middle School Complete 1.7 1.5 0.3 24.8 4.1 91.8 88.8 122
High School complete and above
1.5 1.3 0.3 24.8 5.5 88.5 88.8 94
Standard of living index
Low 2.1 1.7 0.2 37.7 9.5 94.0 89.7 209
Medium 2.1 1.7 0.3 31.2 5.0 91.1 88.1 472
High 1.7 1.4 0.5 31.5 3.9 87.5 87.6 100
Total 2.0 1.7 0.3 32.7 6.3 91.6 88.7 808
Source: National Family Health Survey 1998-1999
VII. Women
Table A 7.1 Comparative Fact Sheet
Table A 7.2 Indicators of Sex Preference
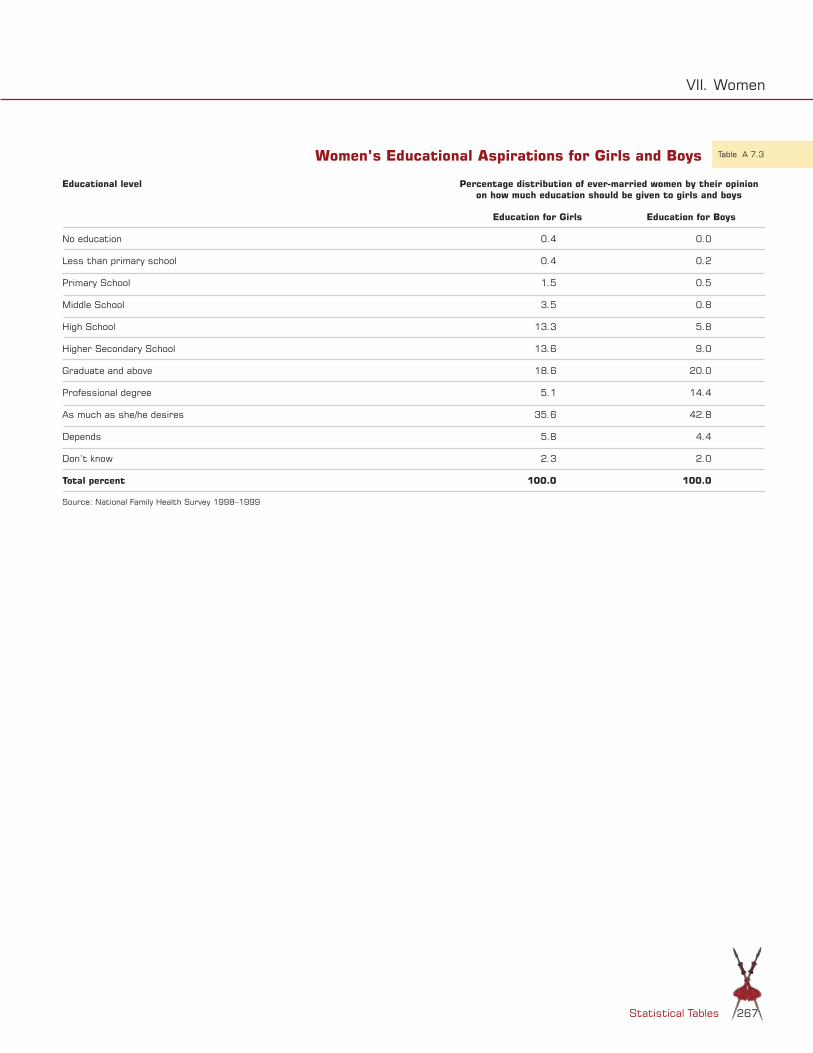
Statistical Tables 267
Educational level Percentage distribution of ever-married women by their opinion on how much education should be given to girls and boys
Education for Girls Education for Boys
No education 0.4 0.0
Less than primary school 0.4 0.2
Primary School 1.5 0.5
Middle School 3.5 0.8
High School 13.3 5.8
Higher Secondary School 13.6 9.0
Graduate and above 18.6 20.0
Professional degree 5.1 14.4
As much as she/he desires 35.6 42.8
Depends 5.8 4.4
Don’t know 2.3 2.0
Total percent 100.0 100.0
Source: National Family Health Survey 1998–1999
VII. Women
Table A 7.3Women’s Educational Aspirations for Girls and Boys

Nagaland State Human Development Report268
Background characteristics
Percentage of ever married women who have been beaten or physically mistreated
since age 15
Percentage of ever married women who agree with specific reasons for justifying a husband beating his wife
Number of
women
Total By husband By In-laws
Others Agree with atleast one
reason
Husband suspects wife is
unfaithful
Wife shows disrespect for in-laws
Natal family does
not give expected
money, etc.
Wife neglects house or children
Does not cook properly
Residence
Urban 9.5 5.8 0.6 3.0 99.4 98.7 83.2 13.8 89.2 33.3 166
Rural 21.4 14.5 0.8 9.0 96.2 91.2 78.7 17.4 83.4 32.8 652
Education
Illiterate 27.0 20.3 1.2 9.0 97.2 91.8 84.1 24.7 84.4 45.6 325
Literate, less than middle school complete
17.0 10.1 0.0 8.6 96.3 92.8 77.3 12.7 84.7 28.3 275
Middle School Complete
11.4 8.0 1.9 3.9 94.8 93.1 73.4 9.2 83.3 22.2 123
High School complete and above
6.4 1.0 0.0 5.4 100.0 95.0 79.0 10.8 88.8 15.6 94
Standard of living index
Low 36.9 26.9 1.2 11.6 96.9 91.5 82.6 24.8 84.3 45.6 212
Medium 14.1 8.6 0.7 6.8 96.5 92.2 79.8 14.7 85.0 30 480
High 7.9 5.1 0.0 4.8 98.8 97.5 75.0 6.6 88.3 18.7 100
Total 19.0 12.8 0.7 7.8 96.9 92.7 79.3 16.7 84.9 32.9 818
Source: National Family Health Survey 1998-1999
VII. Women
Table A 7.4 Experience with domestic violence- Attitudes and Prevalence
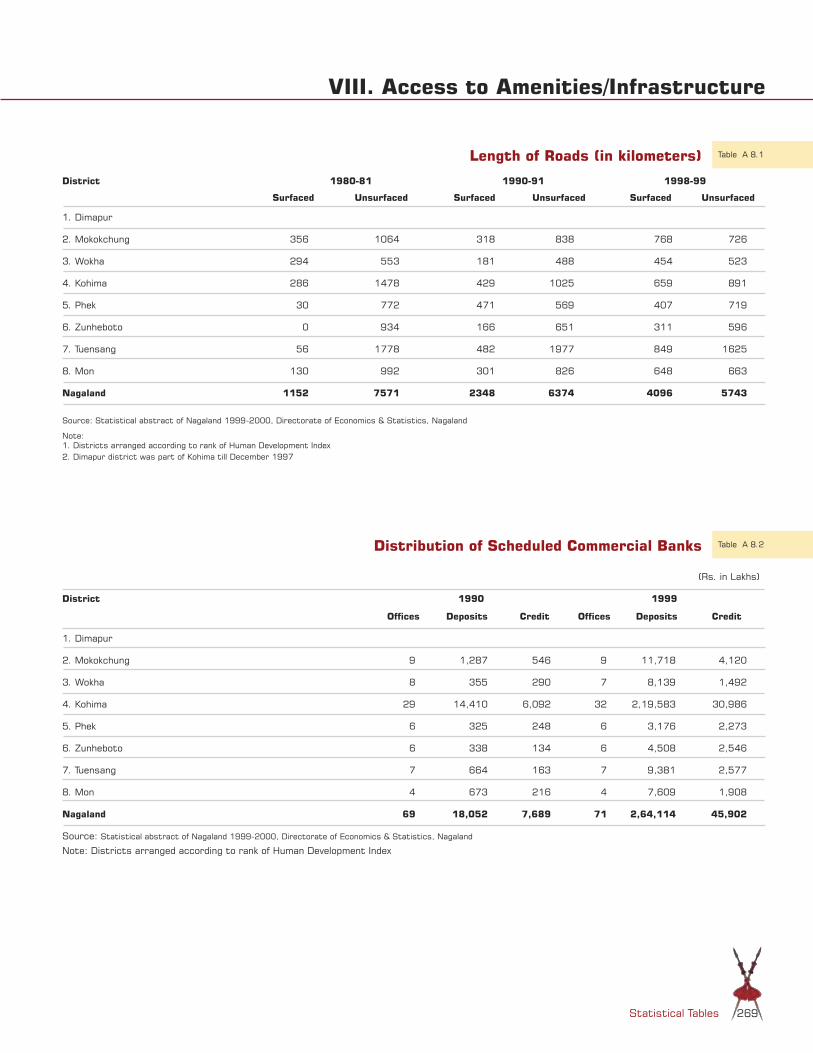
Statistical Tables 269
District 1980-81 1990-91 1998-99
Surfaced Unsurfaced Surfaced Unsurfaced Surfaced Unsurfaced
1. Dimapur
2. Mokokchung 356 1064 318 838 768 726
3. Wokha 294 553 181 488 454 523
4. Kohima 286 1478 429 1025 659 891
5. Phek 30 772 471 569 407 719
6. Zunheboto 0 934 166 651 311 596
7. Tuensang 56 1778 482 1977 849 1625
8. Mon 130 992 301 826 648 663
Nagaland 1152 7571 2348 6374 4096 5743
Source: Statistical abstract of Nagaland 1999-2000, Directorate of Economics & Statistics, Nagaland
Note:1. Districts arranged according to rank of Human Development Index2. Dimapur district was part of Kohima till December 1997
(Rs. in Lakhs)
District 1990 1999
Offices Deposits Credit Offices Deposits Credit
1. Dimapur
2. Mokokchung 9 1,287 546 9 11,718 4,120
3. Wokha 8 355 290 7 8,139 1,492
4. Kohima 29 14,410 6,092 32 2,19,583 30,986
5. Phek 6 325 248 6 3,176 2,273
6. Zunheboto 6 338 134 6 4,508 2,546
7. Tuensang 7 664 163 7 9,381 2,577
8. Mon 4 673 216 4 7,609 1,908
Nagaland 69 18,052 7,689 71 2,64,114 45,902
Source: Statistical abstract of Nagaland 1999-2000, Directorate of Economics & Statistics, Nagaland
Note: Districts arranged according to rank of Human Development Index
VIII. Access to Amenities/Infrastructure
Table A 8.1Length of Roads (in kilometers)
Table A 8.2Distribution of Scheduled Commercial Banks
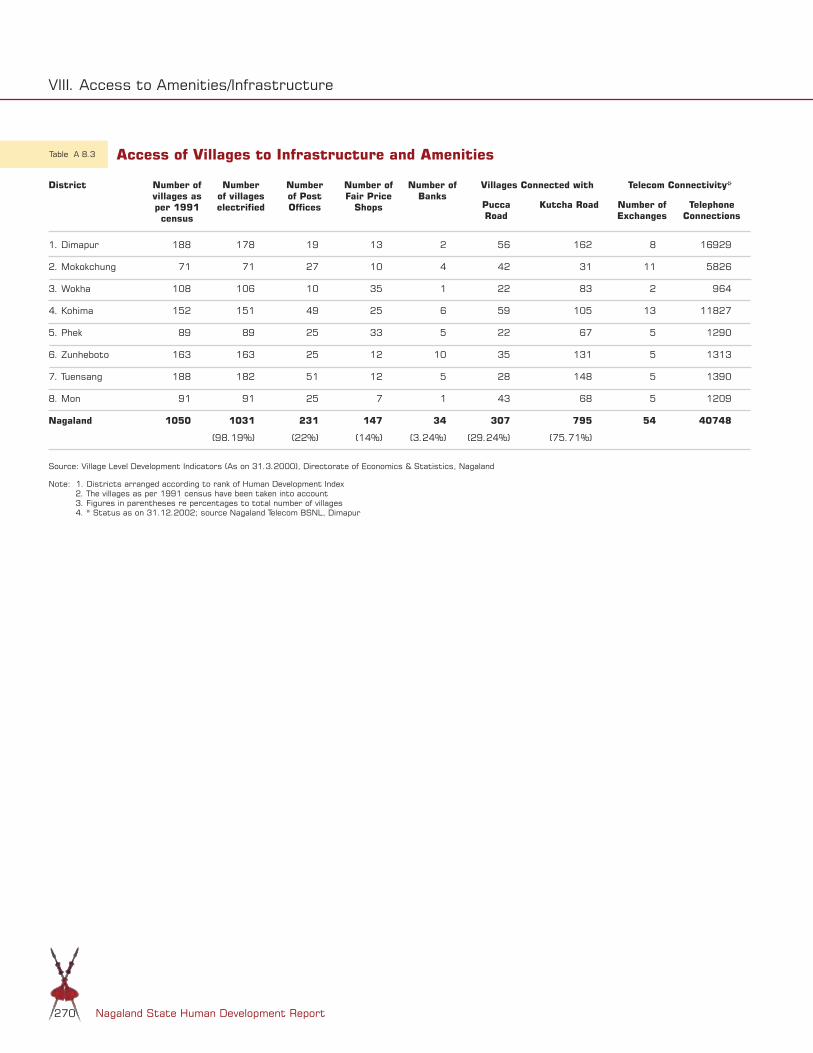
Nagaland State Human Development Report270
District Number of villages as per 1991 census
Number of villages electrified
Number of Post Offices
Number of Fair Price
Shops
Number of Banks
Villages Connected with Telecom Connectivity*
Pucca Road
Kutcha Road Number of Exchanges
Telephone Connections
1. Dimapur 188 178 19 13 2 56 162 8 16929
2. Mokokchung 71 71 27 10 4 42 31 11 5826
3. Wokha 108 106 10 35 1 22 83 2 964
4. Kohima 152 151 49 25 6 59 105 13 11827
5. Phek 89 89 25 33 5 22 67 5 1290
6. Zunheboto 163 163 25 12 10 35 131 5 1313
7. Tuensang 188 182 51 12 5 28 148 5 1390
8. Mon 91 91 25 7 1 43 68 5 1209
Nagaland 1050 1031
(98.19%)
231
(22%)
147
(14%)
34
(3.24%)
307
(29.24%)
795
(75.71%)
54 40748
Source: Village Level Development Indicators (As on 31.3.2000), Directorate of Economics & Statistics, Nagaland
Note: 1. Districts arranged according to rank of Human Development Index 2. The villages as per 1991 census have been taken into account 3. Figures in parentheses re percentages to total number of villages 4. * Status as on 31.12.2002; source Nagaland Telecom BSNL, Dimapur
VIII. Access to Amenities/Infrastructure
Table A 8.3 Access of Villages to Infrastructure and Amenities

Statistical Tables 271
KOHIMA DIMAPUR TUENSANG ZUNHEBOTO WOKHA PHEK MOKOKCHUNG MON
1. Athibung 1. Manglumukh 1. Sotokur 1. Hebolimi. 1. Mungya Village 1. Zapami 1. Kubza 1. Zakho
2. New Beisumpui 2. Aoyimkum 2. Konya. 2. Iphonumi. 2. Tsungki Village 2. Enhulumi 2. AoSetsu 2. Yangkham
3. Songlhu 3. Ura peace camp 3. Muksha. 3. Momi. 3. Chukitong STN 3. Swemi 3. Longnak 3. Wangla
4. Perenkipeujang Nkie. 4. Purana Bazaar 4. Noklak.Hq. 4. Lukhai. 4. Koio Village. 4. Chetheba Hq 4. Moayimti 4. Leangha
5. Lilem 5. Eralibil 5. Pangsha. 5. Shoixe. 5. Sanis Village 5. Phek Old village 5. Aonokpu 5. Totok Chingha
6. Jalukie B 6. Vidima 6. Wanshu. 6. Litsami. 6. Baghty 6. Ruzazhomi 6. Tsurmenyimsen 6. Toimei
7. Beisumpuikam 7. Medziphema Village 7. Nokhu. 7. Awotsakilimi. 7. Bhandari Village 7. Sukruzu Hq. (Phugwa)
7. Waromong 7. Chinglong
8. Ngwalwa 8. Sochunoma 8. Kiphire village. 8. Litta (New). 8. Changsu Village 8. Sowhemi 8. Merangkong 8. Ngangching
9. Peletkie 9. Kukidolong 9. Anatonger. 9. Sutimi. 9. Riphyim Village 9. Ketsapo 9. Changtongya Old 9. Wakching
10. K.Nyishunyu 11. P.Vihito 10. Chessore Hq. 10. A/Saghemi (S). 10. Humtso Village 10. Losami 10. Longkong 10. Chingphoi
11. Sendenyu. 11. Zezhito Village 11. Kyutsu Kir. 11. Satami. 11. Elumyo Village 11. E.B.11 of Phek Town
11. Impur Compound 11. Tiru Lower
12. Zunpha, Zunsunyu. 12. Zuheshe 12. Hokiur. 12. Achikuchu (A). 12. Wokha Town 12. Urban-Block-5
13. Ciesema 13. Kiyazu 13. Sekior. 13. Asukhomi.
14. Botsa 14. Hovishe 14. Shamator NAP Post. 14. Yemishe.
15. Nerhema 15. Niuland 15. Yakour. 15. Lizu, Avigato.
16. Kezo Town 16. Zekiye 16. Chare Town. 16. Tsutohe.
17. Sweba Viswema ( UR) 17. Zhexuche 17. Longkhitpe. 17. Lukhayimi.
18. Pfuchama 18. Zukihe 18. Chungliyimti. 18. Hoshepu.’B’
19. Khonoma 19. Aoyim 19. Lirise. 19. Tsukomi.
20. Chumukedima 20. Holongba,Vill. 20. Urban Block-11.
21. Dimapur 21. Old Mangangkkhi, Vill.II..
22. Ngangpong Village.
IX. Sample Villages for Sample Survey for NSHDR
Table A 9.1Selected Villages for Samle Survey for NSHDR

Nagaland State Human Development Report272
Aier, Anungla. Nagaland: Ethnography, History and Development, unpublished Ph.D. thesis, NEHU, Shillong, 1993.
Aiyar, Manishankar. “Nagaland’s Unlikely Gandhi”, Northeast Herald, May 29, 2003.
Angami Public Organization, The Angami Traditional Area, Souvenir.
Ao, Alemchiba, A Brief Historical Account of Nagaland, Kohima, 1970.
Asthana, P. Entrepreneurship Development Programmes (EDPs):Indian Experience.
Batliwala, Srilatha and Geeta Sen. Empowering Women for Reproductive Rights – Moving Beyond Cairo, Fifth NIAS Course on “An Integrated Approach to Knowledge and Information” for university and college teachers, 6th Oct-1 Nov. 1997, pp.1-17.
Bendangangshi. Glimpses of Naga History, Naga Patriots of Soyim, 1993.
Benger, Arthur Asa. Cultural Criticism: A Primer of Key Concepts, Sage Publications, New Delhi, 1995.
Bennet Benjamin, Director CRHSE, Tamil Nadu. Some Reflections on the National Policy for the Empowerment of Women: 2001.
Bora, Atul. Entrepreneurship Development in the North-East.
Borthakur, D.N, A. Singh, R.P. Awasthi, and R.N. Rai. “Shifting Cultivation in the North East Region”. In Proceedings of the National Seminar on Resources Development and Environment in the Himalayan Region, 1978.
Buchman, Frank. Remaking the World, Blandford Press, London.
Budda, C. Effects of Salt on Weed Control, B.Sc thesis, Maejo University, Thailand, 1996.
Central Statistical Organisation. Statistical Abstract of India, 2002.
Chadha, K.L. Use of Innovative Technology for the Development of Horticulture in India in New Millennium, Paper presented at National Horticultural Conference, Dec.4-5, 2000, New Delhi, organized by Ministry of Agriculture & Cooperation, New Delhi.
Chasie, Charles. The Naga Imbroglio: A Personal Perspective, Standard Printers & Publishers, Kohima, 1997. The Burungis, the Ahom Chronicles.
Chasie, Charles et al. Children Affected by Armed Conflict in Nagaland, 2002.
Chatterji, S.K., Kirata-Jana-Kti. J.R.A.S.B., Vol XVI, 1950.
Compendium of Policy Statements Made in the Parliament; Youth Affairs and Sports, New Delhi, 1991-95, Parliamentary News Views Services.
Conklin, H.C. Hanuoo Agriculture: A Report on an Integral System of Shifting Cultivation in the Philippines, Rome: FAO (Forestry Development Paper No.12), 1957.
Datta, Shyamal. Foundations of Naga Peoplehood: Road Maps (Seminar proceedings, 2003).
DFID, Having World Poverty by 2015, Economic Growth, Equity & Security, 2000.
——, Strategies for achieving the International development targets, 2000
Donne, John. Meditation No XVII, The Norton Anthology of English Literature, Vol. I, W.W. Norton & Company Pvt. Ltd., New York Inc., 1968.
Bibliography

Bibliography 273
Dube, S.C. Inaugural address, in: K.S. Singh (ed), Seminar Proceedings on Tribal Situation in India, Indian Institute of Advanced Studies, 1972.
Elwin, Verrier. Nagaland, Shillong, 1961.
Elwin, Verrier. Nagas in the Nineteenth Century, Oxford University Press, 1969.
EQUATIONS. Role of Panchayats and Tourism, unpublished, Bangalore, 2001
EQUATIONS. Biodiversity and Tourism, Sub-thematic paper for National Biodiversity Strategy and Action Plan of India, 2002.
Frayling, Nicholas, Pardon and Peace, Society for Promoting Christian Knowledge, Cromwell Press, London. 1996.
Furer-Haimendorf, C.V. Return to the Naked Naga, Vikas Publishing House Pvt. Ltd, New Delhi, 1979.
——, The Naked Naga, Methuen & Co, London, 1939.
Gadgil, Madhav. Forestry with a Social Purpose, cf. Walter Fernandes, “Post Independence Policies, Planned Development and Tribal Deprivation”, in Bhadari & Channa (eds), Tribes and Government Policies, Cosmo Publications, India, 1997.
Ganguly, J.B. (ed). Urbanization and Development in North East India, (Trends and Policy Publication), Deep & Deep Publication, New Delhi, 1995.
Ghosh, B.B. Gazetteers of Nagaland, Mokokchung District, Kohima, 1979.
——, History of Nagaland, S. Chand, Delhi, 1982.
——, Nagaland District Gazetteers, Wokha District, Government of Nagaland, Kohima, 1979.
Gilbert, John. Ecotourism Means Business, GP Publications, New Zealand, 1997.
Glass, E.H., and H.D. Thurston (1978). “Traditional and Modern Crop Protection in Perspective”, Bioscience 28 (2), 109-115.
Gopalan, Sarala. Women in Participatory Development through Mahila Samajams.
Government of India. National Agriculture Policy, Department of Agriculture & Cooperation, Ministry of Agriculture, New Delhi, 2000.
——, Programmes and Schemes for Horticulture Development at a Glance, Department of Agriculture and Cooperation, Ministry of Agriculture, Krishi Bhavan, New Delhi, 2000.
——, Annual Report, 1994-1995.
——, Constitution of India
——, Country Report, 1995.
——, Fifty Years of Indian Parliamentary Democracy 1947-1997, Lok Sabha Secretariat (1997).
——, Forest Survey of India, Ministry of Environment and Forests, New Delhi, State of Forest Report, 1999.
——, National Biodiversity Strategy and Action Plan India, Guidelines and Concept Papers. Ministry of Environment and Forests, New Delhi.
——, National Profile on Women, Health and Development
Government of Karnataka, Karnataka Human Development Report, 1999.
Government of Nagaland. Annual Administrative Report of Forests, Environment, Ecology and Wildlife Department, 2003-2004.
Nagaland State Human Development Report274
——, Annual Administrative Report 2001-2002, Department of Youth Resources and Sports, Kohima, 2002.
——, Annual Plan Documents.
——, Basic Facts of Nagaland 2002, Directorate of Information and Public Relations. Kohima, 2002.
——, Development Indicators of Nagaland, 2003.
——, Village Profile, Department of Agriculture, 2001
——, Nagaland Annual, Veterinary and Animal Husbandry Science, Directorate of Information and Public Relations, Kohima, 2000.
——, Nagaland (1993-2002): A Decade of Stability, Progress and Development, Directorate of Information and Public Relations. Kohima, 2002.
——, Nagaland Annual 2002, Directorate of Information and Public Relations. Kohima, 2002.
——, Nagaland State Plan of Action for Children
——, Road to Progress, Directorate of Information and Public Relations. December 2002.
——, Statistical Handbook of Nagaland, Directorate of Economics and Statistics, Kohima, 2000.
——, Status of Agriculture in Nagaland, Department of Agriculture,1999.
——, The Nagaland Communitisation of Public Institutions and Services Act, 2002.
——, The Nagaland Village and Area Council Act, 1978.
——, Village Development Boards Model Rules, 1980.
——, Village Level Development Indicators, Directorate of Economics and Statistics, Kohima, 2001.
——, Vision Nagaland: Towards Positive Changes, 2002.
——, Voices of Peace. Department of Information and Public Relations, 2002.
——, Women in Agriculture, Department of Agriculture, Kohima, Nagaland.
Government of Sikkim, Sikkim Human Development Report, 2001
Greenholgh, Susan Towards a Political Economy of Fertility: Anthropological Contribution, Population Development Review 16 (1):85-106.
Haimendorf, Christoph von Fuhrer. “Recent Developments in the Position of Indian Tribal Populations”. In Problems of Development in Tribal Areas, edited by S.G. Deogannkar, Leeladevi, Delhi, 1980.
Henry, Lewis C. Best Quotations for all Occasions, Fawcett Premier, New York.
Hoebel, E, Adamson and E.L. Frost. Social and Cultural Anthropology, McGraw-Hill Inc., 1976. (Source: Aier, Anungla. Culture Change Among the Nagas, 2002).
Horam, M. Naga Religion (A Case Study: Religion & Society of North-East India), Cosmo Publications, New Delhi, 1988.
Horam, M. Nagas’ Old Ways, New Trends, Cosmo Publications, New Delhi, 1988.
Hutton, J.H. The Sema Nagas, MacMillan & Co.Ltd, London, 1921.
——, The Angami Nagas, MacMillan & Co.Ltd, London, 1921.
Imcharenla, Deputy Commandant, 2nd N.A.P. Challenges for Women in Police, Paper presentation at the workshop on the deliberation and discussion of the Nagaland State Policy for Women’s Empowerment.

Bibliography 275
Imkonglemba. Implementation of Centrally Sponsored Schemes on Rural Development Programmes in Nagaland.
Imkonglemba. Realisation and Reorganization of Rural Development Programmes in Nagaland with special reference to the Village Development Boards.
Iralu, D., Kaka. Nagaland and India: The Blood and the Tears.
Iralu, Niketu. The Naga Struggle, Khonoma Ruffuno Anniversary, 1998, unpublished.
Jacoba, Juliana, The Nagas-Hill People of North East India, 1990
Jamir, N. Talitemjen. Ao-Naga Cultural Heritage.
Johnson, Harvey M. Sociology: A Systematic Introduction, Allied Publishers & Ltd, New Delhi, 1960.
Johnston, Alison. The International Dialogue on Tourism & Biodiversity, Briefing paper prepared on behalf of the International Support Centre for Sustainable Tourism. Opening Presentation for 1st International Meeting of Tourism NGOs on Biodiversity, in preparation for the Fifth Conference of the Parties to the UN Convention on Biological Diversity, Berlin, Germany, March 2000.
Johnston, Douglas and Cynthia Sampson (eds). Religion, The Missing Dimension of Statecraft, Centre for Strategic and International Studies, Oxford University Press, 1994.
Joshi, P.C. “The Value Problem and the Study of Social Change”. In Dimensions of Social Change in India edited by M.N. Srinivas, S..Seshaiah and V.S.Parthasarathy.
Kamei, Gangumei. Origin of the Nagas, Nagas at Work, Naga Students Union, Delhi, 1996.
Kashyap, S. “Youth Education and Empowerment”. In India’s Development after Independence, edited by B.M. Jauhari (ed), Gyan Publishing House, New Delhi, 2002.
Keer, V.K. Use of Salt (NaCl) as a Cheap Herbicide for Ageratum conzyzoides. In Upland Rice, unpublished report, 1994.
Keitzar, Supong, and N. Tiameren Ao. “Application of Plastics in Agriculture: Some Experiences in Nagaland”. In Application of Plastics in Agriculture in NE Region, under publication (ICAR), 2002.
Keitzar, Supong. 1999. “Smale-scale Tea Cultivation: An Option for Naga Farmers, In: Building upon Traditional Agriculture in Nagaland, India, NEPED and IIRR resource book, pp 142-146.
Keitzar, Supong. Annual Scientific Report. SARS, Mokokchung, Nagaland, 1993.
Keitzar, Supong. Characterization of Shifting Cultivation, unpublished report, 1997.
Keitzar, Supong. Farmers’ Knowledge of Shifting Cultivation, SARS, Mokokchung, Nagaland, 1999.
Kertzer, David I. and Tom Fricker. Anthropological Demography: Toward a New Synthesis, 1997.
Khanna, S.K. Encyclopedia of the North East, Indian Publishers & Distributors, Delhi.
Kikon, Myanbemo. Culture Change Among the Lotha Nagas, A Case Study of Wokha and Akuk Villages in Nagaland (unpublished thesis), North-Eastern Hill University, Shillong, 2002.
Longchari, Akum. World View and Transformation, Proceedings of seminar on Naga Society, Change and Continuity, 2003.
Longchar, Kari. NBCC Peace Work, Peace and Reconciliation, March 2003, (Seminar papers, unpublished).
Longchar, Narola. unpublished papers.

Nagaland State Human Development Report276
Lonchar, Wati. The Tribal Religious Traditions in North-East India: An Introduction, Assam Printing Press, Private (p) Ltd. Jorhat, 1991.
Mascie, Taylor C.G.N. and G.W. Lasker. Application of Biological Anthropology to Human Affairs, 1991
McKibben, Jennifer. Involvement of Young People at Work, University Press Ltd, London, 1990, Competitive Success Review Year Book, 2003.
McLaren, Deborah. Rethinking Tourism and Ecotravel, Kumarian Press, Connecticut, USA, 1998.
Menon, M.B. Higher Education: Its Context and Linkages, ES-301, IGNOU, New Delhi, 1999.
——, Higher Education: The Social Psychological Field, ES 303, IGNOU, New Delhi, 1999.
Mills, J.P. The Ao Nagas, MacMillan & Co., London, 1926.
——, The Lotha Nagas, MacMillan & Co.Ltd., London, 1922.
——, The Rengma Nagas, MacMillan & Co., London, 1937.
Mishra, A.K. Integrated Development of Mushroom in India, Ministry of Agriculture & Cooperation, New Delhi, 2000.
Mishra, B. “A Positive Approach to the Problem of Shifting Cultivation in Eastern India and a few Suggestions to the Policy Makers”. In Shifting Cultivation in North-East India edited by B. Pakem, J.B. Bhattarcharjee, B.B. Dutta and B. Duttary, 1976.
Misra, Udayon. “The Naga National Question”, Economic and Political Weekly, Bombay, 1978.
Moran, E.F. Developing the Amazon, Indiana University Press, Bloomington, 1981.
Murry, Benrithung. Demographic Dynamic and Anthropo-Genetic Study of the Lotha Naga of Nagaland, PhD thesis, NEHU Shillong.
Murry, Ezamo. Tribal Spirituality Reconsidered (A Psychological Study of Religion), Navatin Prakashan Kendra, Delhi, 1995.
Ngully, P. Mental Health Problem of the Nagas affected by Conflict, Seminar proceedings, 2003.
Ngully, P. Women in Difficult Circumstances, Proceedings of workshop on Naga women, 2003.
Nongbri, Tiplut. “Some Reflections on Culture, Development and Politics among the Tribes in India”, in: Bhandari & Channa (ed). Tribes and Government Policies, Cosmo Publications India, 1997.
North East Council, Basic Statistics of North East Region, Shillong, 2002.
Notes and Queries in Anthropology, The Royal Anthropological Survey, 1960.
NSSO, Employment and Unemployment Situation in India, 1999-2000, NSSO 55TH Round.
Nuh, V.K. Foundations of Naga Peoplehood (Proceeding of seminar).
Nye, P.H. and D.J. Greenland. Commonwealth Bureau of Soils, Technical Communication No 51, Commonwealth Agricultural Bureau, Farnham, England, 1960.
Pathak, H., D.R. Biswas and Ramandeep Singh. “Fertilizer Use and Environment Quality”, Fertilizer News, Vol 47 (11), November 2002.
Patnaik, S. Studies on Land Use and Village Ecosystem Function in the Khasi Hills of Meghalaya, Ph.D. thesis, North Eastern Hills University, Shillong, 1988.

Bibliography 277
Planning Commission, National Human Development Report, 2001.
Proceedings of Nagaland State Assembly.
Radcliffe-Brown, A.R. “Methods in Social Anthropology”, in: M.N.Srinivas (ed), Selected Essays by A.R. Radcliffe-Brown, Hindustan Publishing House, 1983.
Ramakrishnan, P.S. Shifting Agriculture and Sustainable Development, IHB, New Delhi. 1993.
Ramesh, M Veeraju and T.V. Rao. “Blood Group among the Yadavas of North Coastal Andhra Pradesh”, Indian Anthropologists Vol 28 No. 1, Delhi,1998.
Registrar General of India, Census of India 1981.
——, Census of India 1991.
——, Census of India 2001.
——, “India: Causes of Death Report, 1989”, Statistical Atlas of Nagaland, Directorate of Economics and Statistics, Kohima, 1991.
Roberts, Lesley and Derek Hall. Rural Tourism and Recreation: Principles to Practice, CABI Publishing, New York, USA, 2001
Ruffuno, Khonoma. Centennial Commemoration of the Battle of Khonoma, 1979.
Ruivah, Khashim. Culture Change Among the Nagas (Tangkhul), Cosmo Publication, New Delhi, 1993.
Sahu, S.D. Energy Requirement for Some Selected Cultural Practices in a Hilly Region of Meghalaya, M.Tech thesis, IIT Kharagpur,1978.
Sammuel Jose, C. Development of Bee Keeping for Improving Crop Productivity, Paper presented at National Horticulture Conference, December 4-5, 2000, New Delhi.
Sanyu, Visier. A History of Nagas and Nagaland, Commonwealth Publishers, New Delhi, 1996.
SARS/IDRC. Technical Report on “Development of Sustainable Land Use Options for Shifting Cultivators of Nagaland”, SARS, Mokokchung, 2001.
Sayers, L. Dorothy. Creed or Chaos, Methuen, 1947.
Sema, Hokishe. Emergence of Nagaland, Vikas Publications, New Delhi, 1986.
Sema, K.K. Policy Perspective for the 10th Plan, Department of Agriculture. Unpublished, 2002.
Sema, Piketo. British Policy and Administration in Nagaland (1881-1947), Scholar Publishing House, New Delhi, 1992.
Serto, Leban. Peace Education, NBCC Seminar on Peace and Reconciliation, March 2003, unpublished.
Sharma, B.D. Planning for Tribal Development, Prachi Prakashan, New Delhi, 1984.
Sharma, Prajal. Sociological Constraints to Industrial and Entrepreneurship Development in the North-East.
Sharma, R.N. Indian Anthropology: An Overview, Surjeet Publication, Delhi.
Singer, Milton (ed). Traditional India: Structure and Change, Philadelphia, 1959 (Source: Aier, Anungla).
Singh, Bhupinder. “Tribal Policies and Issues”. In Tribes and Government Policies edited by Bhandari & Channa, Cosmo Publications India, 1997.

Nagaland State Human Development Report278
Singh, H.P. Technology Mission for Integrated Development of Horticulture in North Eastern States including Sikkim, Paper presented at National Horticulture Conference, December 4-5, 2000, organized by Ministry of Agriculture, Department of Agriculture & Cooperation, New Delhi.
Singh, V.B. “Integrated Nutrient Management in Vegetables”, Nutrient Management in NE Region. Concept Publications, Daryaganj, New Delhi, 2002.
——, Front of NE Region, M.S.Waley Estern Ltd., Daryaganj, New Delhi, 1990.
——, Spices of India, New Age International Publications, Daryaganj, New Delhi, 1996.
Singh, V.B., N.P. Singh and A.K. Singh. Horticulture-Based Land Use System for Sustainability in Jhumland of NE Region, Paper presented at Seminar on Management Strategies for North Eastern Hill System at Unnam, Meghalaya, August 8-10, 1998.
Singh, Yogendra. Modernization of Indian Traditions, Thomson Press India, Faridabad, 1973.
Sinha, Poonam. Empowerment through Women’s Entrepreneurship Development in the North-East.
Swainson, Bill (ed). Encarta Book of Quotations, A Bloomsbury Reference Book, London, 2000.
Thara Bhai, L. Women’s Studies in India, A.P.H Publishing Corporation, New Delhi, 2000.
The State of India’s Environment 1984-85 (The Second Citizens’ Report), Centre for Science and Environment, New Delhi.
Tivy, J. 1987. “Nutrient Cycling in Agro-ecosystems”, Applied Geography 7:93-113.
Thomas, C. Joshua and Gurudas Das. Dimensions of Development in Nagaland, Regency Publications, New Delhi, 2002.
Tutu, Desmond. No Future without Forgiveness, Rider/Random House, U.K., 1999.
UNDP, Human Development Report,2002
UNDP, Human Development Report,2003
United Nations. Report of the World Summit on Sustainable Development, Johannesburg, South Africa, 26 August - 4 September 2002, United Nations, New York, 2002.
Venuh, N. Emergence of Naga Nationhood, (Proceedings of seminar on Foundations of Naga Peoplehood: Road Maps, April 2003, and notes by J.P. Mills).
Verghese, B.G. India’s North-East Resurgent, Ethnicity, Insurgency, Governance, Development, Konark Publishers Pvt Ltd., New Delhi, 1996.
Vidrarthi, I.P. Applied Anthropology in India (Principles, Problems and Case Studies), Kitab Mahal, New Delhi.
Weaver, David. B. (ed.) 2001. The Encyclopedia of Ecotourism, CABI Publishing, New York, USA.
World Tourism Organisation. Sustainable Tourism Plan for Nagaland. SPPD document, Project of the State of Nagaland, India, 2002.
World Tourism Organisation. Tourism Highlights 2002, Capitan Haya, Spain, 2003.
Yonuo, Asoso. The Rising Nagas: A Historical, Political Study, Vivek Publishing House, Delhi, 1974.