Sulawesi Tengah Dalam Angka 2014
564
http://sulteng.bps.go.id
Transcript of Sulawesi Tengah Dalam Angka 2014

http
://sul
teng
.bps
.go.
id

http
://sul
teng
.bps
.go.
id

SULAWESI TENGAH
DALAM ANGKA
Sulawesi Tengah in Figures
2 0 1 4 ht
tp://s
ulte
ng.b
ps.g
o.id

SULAWESI�TENGAH�DALAM��ANGKA�2014�Sulawesi�Tengah�in�Figures�2014��ISSN :0215.2282 No. Publikasi/Publication Number :72000.1412Katalog BPS/BPS Catalogue:1102001.72
Ukuran Buku/Book Size: 21 x 15 cm Jumlah Halaman/Number of Pages: Lvii + 500 halaman/pages
Naskah/Manuscript:BPS Provinsi Sulawesi Tengah BPS – Statistics Sulawesi Tengah Provincial Office
Penyunting/Editor :Bidang Integrasi Pengolahan dan Diseminasi Statistik Division of Integrated Processing and Statistical Dissemination
GambardanGrafik/Charts :Bidang Integrasi Pengolahan dan Diseminasi Statistik Division of Integrated Processing and Statistical Dissemination
Gambar Kulit/Cover Design :Bidang Integrasi Pengolahan dan Diseminasi Statistik Division of Integrated Processing and Statistical Dissemination
Diterbitkan oleh/Published by :BPS Provinsi Sulawesi Tengah BPS – Statistics Sulawesi Tengah Provincial Office
Boleh dikutip dengan menyebut sumbernya May be cited with reference to the source
http
://sul
teng
.bps
.go.
id
PETA WILAYAH PROVINSI SULAWESI TENGAH MAP OF SULAWESI TENGAH
Morowali
Morowali Utara
Poso
Sigi
Banggai
Banggai Kepulauan
Banggai Laut
Tojo Una-una
ParigiMoutong
Donggala
Palu
Buol Tolitoli
http
://sul
teng
.bps
.go.
id

http
://sul
teng
.bps
.go.
id

LAMBANG DAERAH REGIONAL SYMBOL
Lambang daerah Provinsi Sulawesi Tengah dijiwai oleh Pancasila yang jelas terlukis pada bintang segi lima daun kelapa lima helai, dan buah kelapa lima buah. Lebih jauh hal ini
memberikan pengertian bahwa dengan jiwa Pancasila, di atas relnya/jalannya Pancasila, kita hendak mencapai cita-cita negara kebangsaan yang adil dan makmur diridhoi oleh Tuhan
Yang Maha Esa Symbol of SulawesiTengahProvince is obsessed by Pancasila. It is clearly reflected on five
angles star and five pieces of coconut tree leaves. Furthermore, it explains that by soulful of Pancasila, on the track of Pancasila, we do hope to reach aspiration of being a just and
prosperous nationalistic nation which is loved by The God
http
://sul
teng
.bps
.go.
id

http
://sul
teng
.bps
.go.
id

�
Dr
���������
s.H. LO
���� ���Gov
NGKI D
���������vernor
DJANGG
��������
GOLA, M
���
M.Si
http
://sul
teng
.bps
.go.
id

� �
http
://sul
teng
.bps
.go.
id

������������
H. SU
�������������
UDARTO
� �����������������
O, SH, M
���������
M.Hum
�����
http
://sul
teng
.bps
.go.
id

http
://sul
teng
.bps
.go.
id
Ass
mapenset
201bes
bag
Wa
�
salamu'alaiku
Publikaasukan dalamnyusunan dataiap organisasi
Saya m14”, karena pserta hasil pen
Akhir kgi yang memb
assalamu’alai
um Warahmatu
asi data merupm pengambilaa yang akurati dalam melak
menyambut geada buku ini d
ngolahannya dkata, semoga bbutuhkan.
ikum Warahm
Gubernur Su
ullah Wabara
pakan sumbean keputusant menjadi hal ksanakan tugaembira penerbdata dihimpun
dan saya harapbuku ini dapa
atullah Waba
��
ulawesi Tenga
akatuh.
r informasi yn, perencanayang pentings dan fungsinybitan buku “Sn menjadi satupkan lebih semat menjadi sum
arakatuh.�
P
Drs. H. LO
ah
yang sangat baan dan eva
sebagai sumbya.Sulawesi Tengu kesatuan se
mpurna dari edmber informas
alu, Agustu
ONGKI DJAN
ermanfaat sebaluasi, karenaber informasi
gah Dalam Acara komprehdisi sebelumnysi yang berma
s 2014
NGGOLA, M
bagaia itu bagi
Angka hensif ya.
anfaat
M.Si
http
://sul
teng
.bps
.go.
id

Assala
planni
data fo
2014”
expect
Wassa
�
amu'alaikum W
A publicati
ing, and evalu
or organizatio
I am deligh
”, as it brings
tedly improves
Finally, thi
alamu'alaikum
Govern
Warahmatulla
ion of data ca
uation, hence p
ons in accomp
hted with the r
together vari
s previous edi
is publication
m Warahmatul
�nor of Sulawe
ah Wabarakatu
n be a useful
providing acc
plishing their t
release of the
ious data and
itions.
is hopefully u
llah Wabaraka
Drs. H
�
esi Tengah
uh.
source of info
curate data is
tasks and resp
publication “
d processing r
useful source o
atuh.
Palu, Ag
H. LONGKI D
ormation in de
crucial to the
ponsibilities.
“Sulawesi Ten
results compre
of information
gustus 2014
DJANGGOL
ecision making
e importance o
ngah In Figure
ehensively, an
n to data users
LA, M.Si
g,
of
es
nd
s.
http
://sul
teng
.bps
.go.
id

tersteruser
SulyanSul
PemdatProini
KE
Meningkasedianya datautama guna mrta evaluasi kr
Guna mlawesi Tengang ada di wlawesi Tengah
Data statmbangunan Dta. Oleh karenovinsi Sulawe.
Semoga p
EPALA BAP
atnya usaha-a statistik ya
menunjang terwritis terhadap h
emenuhi kebah berusaha mwilayah Provinh Dalam Angk
tistik yang diDaerah Provinna itu, kami esi Tengah da
publikasi ini b
PPEDA PROV
SAMBU
-usaha pembang lengkap,wujudnya perhasil-hasil pem
butuhan data mengumpulkannsi Sulawesi ka setiap tahun
icakup tidaknsi Sulawesi T
mengucapkanan semua piha
bermanfaat.
VINSI SULA
UTAN
bangunan dal akurat, mut
rencanaan yanmbangunan ya
tersebut, Bn dan menyu
Tengah dannnya.
hanya dibutuTengah, namun terima kasihak yang telah
Pa
Badan PeDaerah P
Prof. Dr, reNIP. 1
AWESI TENG
lam segalatakhir, dan b
ng tepat, pengang telah dicap
adan Pusatusun data darin menerbitkan
uhkan oleh Bn juga oleh bh kepada Badh membantu t
alu, Agustus 2
erencanaan PeProvinsi Sulaw
Kepala,
er. Pol. PATT19650905 199
GAH
bidang menberkesinambuawasan yang pai.
Statistik Proi berbagai insnnya dalam
adan Perencaberbagai konsudan Pusat Staterbitnya publ
2014
embangunan wesi Tengah
TA TOPE, SE0011001
�
untutungan baik,
ovinsi stansi buku
anaan umen atistiklikasi
E
http
://sul
teng
.bps
.go.
id

datsuires
colpub
Bowistho
H
The rapidta which comitable planninsults achieved
To fulfillllect and compblishes them i
Statisticaard of Sulawesh to express ose who involv
We hope
HEAD OF REBOA
d accelerationmplete, accurng, good cond.
l the needs ofmpiles data froin Sulawesi Te
al data covereesi Tengah Pr
our gratitudved in publish
that this publ
EGIONAL DEARD OF SUL
F O R E
n activities in rate, up-to-datrolling and
f such data Bom various Inengah in Figu
ed not only nerovince but alsde to BPS-Staing this public
ication will be
EVELOPMENLAWESI TEN
E W O R D
all fields neeate, and concritical evalu
BPS-Statisticsnstitutions in ures annually
eeded by the Rlso by variousatistics of Sulacation for thei
e useful.
Pal
Regional Deof Sula
Prof. Dr, reNIP. 1
NT PLANNINNGAH
eds the availatinuous, espe
uation toward
s of SulawesiSulawesi Ten
y.
Regional Deves data consumawesi Tengahir assistance.
lu, Agustus
evelopment Plawesi Tengah
Head,
er. Pol. PATT19650905 199
NG
ability of statisecially to supd the develop
Tengah Provngah Province
elopment Planmers. Thereforh Province an
2014
lanning BoardProvince
TA TOPE, SE0011001
stical pport
pment
vince e and
nning e, we nd to
d
E
http
://sul
teng
.bps
.go.
id

�KATA PENGANTAR
Dengan memanjatkan puji syukur kehadirat Tuhan Yang Maha Esa, BPS Provinsi Sulawesi Tengah telah dapat menyelesaikan publikasi SULAWESI TENGAH DALAM ANGKA 2014.
Sulawesi Tengah dalam Angka 2014 ini menyajikan data dari hasil sensus dan survei yang dilaksanakan oleh BPS Provinsi Sulawesi Tengah serta beberapa data sekunder yang berasal dari berbagai instansi Pemerintah maupun Swasta di Provinsi Sulawesi Tengah.
Meskipun telah diupayakan kelengkapan dan penyempurnaan data yang disajikan, namun barangkali masih belum sepenuhnya dapat memenuhi kebutuhan pemakai data secara menyeluruh. Oleh karena itu kami mengharapkan saran dan kritik yang konstruktif dari berbagai pihak, untuk perbaikan pada publikasi yang akan datang.
Kami menyampaikan penghargaan dan ucapan terima kasih kepada dinas/ instansi/lembaga terkait di lingkungan Pemerintah Daerah Sulawesi Tengah dan Swasta yang telah memberikan bantuan hingga terwujudnya publikasi ini. Diharapkan hubungan kerjasama ini dapat terus dilanjutkan dan ditingkatkan pada masa yang akan datang.
Harapan kami semoga buku ini bermanfaat bagi kita semua dalam menyusun perencanaan dan melaksanakan pembangunan serta berbagai kajian ilmiah.
Palu, Agustus 2014
BADAN PUSAT STATISTIK Provinsi Sulawesi Tengah
Kepala,
JOHANES DE BRITTO PRIYONO, M.Sc.NIP. 195909161985011001�
http
://sul
teng
.bps
.go.
id

PREFACE
With Praises and Honour to the God Almighty, BPS-Statistics Sulawesi Tengah has completed the publication SULAWESI TENGAH IN FIGURES 2014.
Sulawesi Tengah in Figures 2014 presents statistics resulted from censuses and surveys conducted by BPS-Statistics Sulawesi Tengah, as well as secondary data compiled from various government institutions and private organizations in Sulawesi Tengah.
Efforts toward completeness and comprehensiveness of this publication have been made, however it might not fully meet customer needs. Therefore, comments and suggestions for the improvement of this publication are always welcome.
We would like to express our appreciation and gratitude to pertinent agencies, institutions, and organizations in Regional Government of Sulawesi Tengah, and private organizations for their assistance and contribution in the completion of this publication. Hopefully, this collaboration will be maintained and improved in the future.
We hope this publication is useful for all readers to obtain information for planning and implementation of regional development as well as scientific studies.
Palu, Agustus 2014
BPS-STATISTICS SULAWESI TENGAH Head,
JOHANES DE BRITTO PRIYONO, M.Sc.NIP. 195909161985011001
http
://sul
teng
.bps
.go.
id

Contents
Sulawesi Tengah in Figures 2014 xv
DAFTAR ISICONTENTS
Halaman/Page Peta Wilayah Sulawesi Tengah/Map of Sulawesi Tengah iLambang Daerah/Regional Symbol iii FotoGubernurSulawesi Tengah/Photo of Governor vFotoWakilGubernur Sulawesi Tengah/Photo of Vice-Governor vii SambutanGubernurSulawesi Tengah/Foreword by Governor ix SambutanKetua BAPPEDA Sulawesi Tengah/Foreword byHead of BAPPEDA xi Kata Pengantar/Preface xiii Daftar Isi/ Contents xv DaftarTabel/List of Tables xvii DaftarGambar/List of Figures xLvii PenjelasanUmum/Explanatory Notes xLix StrukturOrganisasi BPS Provinsi Sulawesi Tengah/Organization Structure of BPS-Statistics Sulawesi Tengah Provincial Office LiStrukturOrganisasi BPS /Organization Structure of BPS-Statistics Indonesia Liii Sejarah Sulawesi Tengah/History of Sulawesi Tengah Lv 1 KEADAAN GEOGRAFI/ GEOGRAPHYCAL SITUATION 32 KEADAAN IKLIM/CLIMATE 13 3 PEMERINTAHAN/GOVERNMENT 27 4 PENDUDUK DAN KETENAGAKERJAAN/POPULATION AND
EMPLOYMENT 57 4.1. Penduduk/Population 57 4.2. Ketenagakerjaan/Employment 58
5 SOSIAL/SOCIAL 89 5.1. Pendidikan/Education 89 5.2. Kesehatan/Health 91 5.3. Peradilan/Justice 92 5.4. Agama/Religion 93 5.5. SosialLainnya/Other Social Affairs 94
http
://sul
teng
.bps
.go.
id

Daftar Isi
xvi Sulawesi Tengah Dalam Angka 2014
Halaman/Page
5.6. Perumahan/Housing 94 6 PERTANIAN/ AGRICULTURE 187
6.1. TanamanPangan/Food Crops 187 6.2. Perkebunan/Estate Crops 189 6.3. Kehutanan/Forestry 189 6.4 Peternakan/Livestock 190
6.5. Perikanan/Fishery 190 7 PERINDUSTRIAN, PERTAMBANGANENERGI DAN AIR
MINUM INDUSTRY,MINING,ENERGYAND WATER SUPPLY 267
7.1. Perindustrian/Industry 267 7.2. Pertambangan/Mining 267 7.3. Energi/Energy 267 7.4. Air Minum/ Water Supply 268 8 PERDAGANGAN/TRADING 287 9 TRANSPORTASI, POS, DAN TELEKOMUNIKASI
TRANSPORTATION, POST,AND TELECOMMUNICATION 307 9.1. PanjangJalan/Length of Roads 307 9.2. AngkutanDarat /Land Transportation 307 9.3. AngkutanLaut/Sea Transportation 308 9.4. AngkutanUdara/Air Transportation 309 9.5. Posdan Telekomunikasi/Post and Telecommunication 310 10 HOTEL DAN PARIWISATA
HOTEL AND TOURISM 333 10.1. Hotel/Hotel 333 10.2. Pariwisata/Tourism 334 11 KEUANGAN, PERBANKAN, DAN HARGA-HARGA
FINANCE, BANKING, AND PRICES 351 11.1. KeuanganPemerintah Daerah/Regional Government Finance 351 11.2. Perbankan/Banking 352 11.3. Asuransi/Insurance 353 11.4. Koperasi/Cooperative 353 11.5. Harga-HargadanInflasi/Prices and Inflation 354
http
://sul
teng
.bps
.go.
id

Contents
Sulawesi Tengah in Figures 2014 xvii
Halaman/ Page
12 KONSUMSI DAN PENGELUARAN RUMAH TANGGA CONSUMPTION AND EXPENDITURE HOUSEHOLD 427
13 PENDAPATAN REGIONAL/REGIONAL INCOME 455 14 PERBANDINGAN NASIONAL/NATIONAL COMPARISON 485
http
://sul
teng
.bps
.go.
id

Daftar Tabel
xviii Sulawesi Tengah Dalam Angka 2014
DAFTAR�TABEL/LIST�OF�TABLES�
�Halaman/�Page�
1.�KEADAAN�GEOGRAFI/�GEOGRAPHICAL�SITUATION� �� �
1.1� Luas�Daerah�dan�Pembagian�Daerah�Administrasi�menurut�Kabupaten/Kota,�2013�The�Total�Area�and�Number�of�Administrative�Units�by�Regency/City,�2013�
7�
1.2� Jarak� antara� Ibukota� Kabupaten/Kota� dengan� Ibukota� Kecamatan� menurut�Kabupaten/Kota�Distances�between�Regency/City�Capital�to�Subdistrict�Capital�by�Regency/City�
8�
1.3� Nama,�Panjang�Sungai,�dan�Luas�Daerah�Alirannya�menurut�Kabupaten�Name,�Length�of�Rivers�and�River’s�Basin�Area�by�Regency�
9�
1.4� Nama�Gunung�dan�Tingginya�menurut�Kabupaten�Name�and��Height�of�Mountains�by�Regency�
10�
�2.�KEADAAN�IKLIM/�CLIMATE� �
2.1� Rata�Rata� Suhu� Udara,� Kelembaban,� Tekanan� Udara,� Arah� Angin,� KecepatanAngin,�Curah�Hujan�dan�Penyinaran�Matahari,�2009�2013�Average� of� Temperature,� Relative� Humidity,� Atmospheric� Pressure,� Wind�Direction,�Wind�Velocity,�Rainfall,�and�Sunshine,��2009��2013�
19�
2.2� Suhu� Udara� Maksimun,� Minimum,� dan� Rata�rata� Menurut� Bulan� di� StasiunMeteorologi�Mutiara�Palu,�2013�Maximum,� Minimum,� and� Average� Temperature� in� Meteorological� Station� of�Mutiara�Palu�by�Month,�2013�
20�
2.3� Kelembaban�Udara�Rata�rata�Menurut�Bulan�di�Stasiun�Meteorologi�Mutiara�Palu,2013�Average� Relative� Humidityin�Meteorological� Station� of�Mutiara� Palu� by�Month,�2013�
21�
2.4� Jumlah� Curah� Hujan� dan� Banyaknya� Hari� Hujan� Menurut� Bulan� di� StasiunMeteorologi�Mutiara�Palu,�2013�Number� of� Rainfall� and� Frequency�of� Rain� in�Meteorological� Station�of�Mutiara�Palu�by�Month,�2013�
22�
2.5� Tekanan�Udara,�Arah�Angin,�Kecepatan�Angin�dan��Penyinaran�Matahari�MenurutBulan�di�Stasiun�Meteorologi�Mutiara�Palu,�2013�Atmospheric� Pressure,�Wind� Direction,�Wind� Velocity,� and� Sunshine� Average� at�Meteorological�Station�of�Mutiara�Palu�by�Month,�2013�
23�
� �
http
://sul
teng
.bps
.go.
id

List Of Tables
Sulawesi Tengah in Figures 2014 xix
Halaman/�Page�3.��PEMERINTAHAN/�GOVERNMENT� �
3.1� Jumlah� Pemilih� yang� Terdaftar� dan� Pemilih� yang� Melaksanakan� Hak� Pilihnya�pada�Pemilu�Legislatif�(DPR)�Dirinci�menurut�Kabupaten/Kota,�2009�Number� of� Registered� Electors� and� Electors� Who� Used� Their� Right� on� 2009,�Legislative�General�Election�(Assembly)�by�Regency/City,�2009�
35�
3.2� Jumlah�dan�Persentase�Perolehan�Suara�dan�Jumlah�Perolehan�Kursi�Hasil�Pemilu�Legislatif�(DPRD�I)�Organisasi�Peserta�Pemilu,�2009�Number� and� Percentage� of� Legislative� and� Number� of� Chairs� Achievement� on�2009�General�Election�(DPRD�I)�Resulted�by�Participants�
36�
3.3� Jumlah�dan�Peringkat�Suara�Sah�Calon�Anggota�Dewan�Perwakilan�Daerah�(DPD)�Terpilih�Pemilihan�Umum�Tahun�2009�Number�and�Valid�Votes�Ranking�of� The� Select� Regional�Representative�Council�Member�Candidates�on�General�Election,�2009�
38�
3.4� Jumlah�Pemilih�yang�Terdaftar�dan�Pemilih�yang�Menggunakan�Hak�Pilihnya�pada�Pilpres�2009�menurut�Kabupaten/Kota�Number�of�Registered�Electors�and�Electors�Who�Used�Their�Right�on�Presidential�Election�2009�by�Regency/City�
39�
3.5� Jumlah�Perolehan�Suara�pada�Pilpres�2009�menurut�Pasangan�Capres�Cawapres�dan�Kabupaten/Kota�Number� of� Votes� on� Presidential� Election� 2009� by� President� and�Vice� President�Couple�and�Regency/City�
40�
3.6� Jumlah� Perolehan� Suara� pada� Pemilihan� Gubernur� Sulawesi� Tengah� 2011�menurut�Pasangan�Cagub�Cawagub�dan�Kabupaten/Kota�Number� of� Votes� on� Governor� Election� 2011� � by� Governor� and� Vice� Governor�Couple�and�Regency/City�
41�
3.7� Jumlah�Keanggotaan�DPRD�2009�2014�menurut�Fraksi�dan�Jenis�Kelamin�Number�of�Local�Assembly�Memberships�of�2009�2014�by�Faction�and�Sex�
42�
3.8� Jumlah��Keanggotaan�DPRD�2009�–�2014�menurut�Partai�Politik�dan�Jenis�Kelamin�Number�of�Local�Assembly�Memberships�of�2009�–�2014�by�Political�Party�and�Sex�
43�
3.9� Jumlah�Keanggotaan�DPRD�2009–2014�menurut�Fraksi�dan�Pendidikan�Number� of� Local� Assembly� Membership� of� 2009� –� 2014� � � by� Faction� and�Education�
44�
3.10� Jumlah�Keanggotaan�DPRD�2009–2014�menurut�Fraksi�dan�Kelompok�Umur�Number�of�Local�Assembly�Membership�of�2009�–�2014�by�Faction�and�Age�Group�
45�
3.11� Jumlah�Keputusan�DPRD�Provinsi�Menurut�Jenisnya,�2009�2013�Numbers�of�Acts�of�Assembly�at�Province�Level�by��Type�of�Act,�2009�2013�
46�
3.12� Jumlah� Keputusan� DPRD� Kabupaten/Kota� Menurut� Jenisnya� dan� Kabupaten/�Kota,�2013�Numbers�of�Acts�of�Assembly�at�Regency/City�Type�of�Act,�2013�
47�
� � �����������
http
://sul
teng
.bps
.go.
id

Daftar Tabel
xx Sulawesi Tengah Dalam Angka 2014
Halaman/�Page3.13� Jumlah�Pegawai�Negeri�Sipil�di�Lingkungan�Pemerintah�Daerah�Provinsi�Sulawesi�
Tengah�menurut�Golongan/Ruang�dan�Jenis�Kelamin,�2013�Number� of� Civil� Servants� of� Local� Government� in� Sulawesi� Tengah� Province� by�Heirarchy�and�Sex,�2013�
49�
3.14� Jumlah�PNS�di�Lingkungan�Pemerintah�Daerah�Provinsi�Sulawesi�Tengah�Menurut�Tingkat�Pendidikan�dan�Jenis�Kelamin,�2009�2013�Number� of� Civil� Servants� of� Local� Government� in� Sulawesi� Tengah� Province� by�Educational�Level�and�Sex,�2009�2013�
50�
3.15� Jumlah�Pegawai�Negeri�Sipil�di�Lingkungan�Pemerintah�Daerah�Tingkat�II�Menurut�Golongan/Ruang�dan�Kabupaten/Kota,�2013�Number� of� Civil� Servants� of� Local� Government� at� 2nd� Level� � by� Hierarchy� and�Regency/City,�2013�
51�
3.16� Jumlah�Pegawai�Negeri�Sipil�di�Lingkungan�Pemerintah�Daerah�Tingkat�II�Menurut�Kabupaten/Kota�dan�Tingkat�Pendidikan,�2013�Number� of� Civil� Servants� of� Local�Government�at� 2nd� Level� by�Regency/City� and�Educational�Level,�2013�
52�
3.17� Jumlah� Personil� Satuan� Perlindungan� Masyarakat� Menurut� Kabupaten/Kota,�2009��2013�Number�of�LINMAS�by�Regency/City,�2009�2013�
53�
� � �� �
4.��PENDUDUK�DAN�KETENAGAKERJAAN/POPULATION�AND�EMPLOYMENT� �� � �4.1.�Penduduk/Population� �4.1.1� Jumlah�dan�Laju�Pertumbuhan�Penduduk,�1971,�1980,�1990,�2000,�2010�dan�2013�
Number�and�Population�Growth,�1971,�1980,�1990,�2000,�2010�and�2013�65�
4.1.2� Penduduk� menurut� Jenis� Kelamin� dan� Rasio� Jenis� Kelamin� menurut�Kabupaten/Kota,�2013�Population�by�Sex�and��Sex�Ratio�by�Regency/City,�2013�
66�
4.1.3� Penduduk�Menurut�Kelompok�Umur�dan�Jenis�Kelamin,�2013�Population�by�Age�Group�and�Sex,�2013�
67�
4.1.4� Luas� Wilayah,� Penduduk� dan� Kepadatan� Penduduk� Menurut� Kabupaten/Kota,�2013�Regional�Area,�Population�and�Population�Density�by�Regency/City,�2013�
68�
4.1.5� Penduduk,� Rumahtangga� dan� Rata�rata� Anggota� Rumahtangga� menurut�Kabupaten/Kota,�2013�Population,�Households�and�Average�Household�Members�by�Regency/�City,�2013�
69�
4.1.6� Jumlah� Penduduk,� Desa/Kelurahan,� dan� Kepadatan� Penduduk� per�Desa/Kelurahan�menurut�Kabupaten/Kota,�2013�Number�of�Population,�Villages,�and�Population�Density�per�Village�by�Regency/�City,�2013�
70�
�
http
://sul
teng
.bps
.go.
id
List Of Tables
Sulawesi Tengah in Figures 2014 xxi
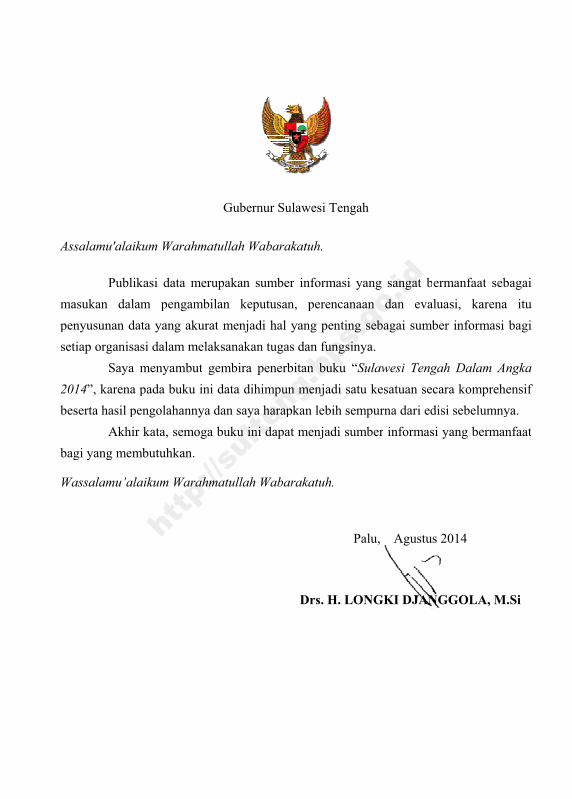
Halaman�/�Page�4.1.7� Jumlah�Penempatan�Penduduk�Transmigrasi�s.d.�Tahun�Anggaran�2013�menurut�
Kabupaten/Kota�dan�Jenis�Transmigrasi�Number� of� Transmigrant� Placements� up� to� Budget� Year� 2013� by� Regency/City�and�Kind�of�Transmigration�
71�
� � �4.2.Ketenagakerjaan/Employment� �
4.2.1� Penduduk� Berumur� 15� Tahun� Keatas� menurut� Jenis� Kegiatan� Utama� Selama�Seminggu�yang�Lalu,�2011�2013�Population� 15� Years� of� Age� and� Over� by� Type� of� Activity� During� the� Previous�Week,�2011�2013�
72�
4.2.2� Penduduk� Berumur� 15� Tahun� Keatas� Menurut� Kabupaten/Kota� dan� Jenis�Kegiatan,�2013�Population�15�Years�of�Age�and�Over�by�Regency/City�and�Kind�of�Activity,�2013�
73�
4.2.3� Penduduk� Berumur� 15� Tahun� Keatas� yang� Bekerja� Menurut� Pendidikan�Tertinggi�yang�Ditamatkan�dan�Jenis�Kelamin,�2013�Population�15�Years�of�Age�and�Over�Who�Worked�During�The�Previous�Week�by�Level�of�Educational�Attainment�and�Sex,�2013�
74�
4.2.4� Penduduk� Berumur� 15� Tahun� Keatas� yang� Bekerja� Selama� Seminggu� yang� Lalu�menurut�Lapangan�Usaha�dan�Jenis�Kelamin,�2013�Population� 15� Years� Age� and�Over�Who�Worked�During� The� Previous�Week� by�Industrial�Origin�and�Sex,�2013�
75�
4.2.5� Penduduk� Berumur� 15� Tahun� Keatas� yang� Bekerja� Selama� Seminggu� yang� Lalu�menurut�Status�Pekerjaan�Utama�dan�Jenis�Kelamin,�2013�Population�15�Years�of�Age�and�Over�Who�Worked�During�The�Previous�Week�by�Main�Employment�Status�and�Sex,�2013�
76�
4.2.6� Penduduk� Berumur� 15� Tahun� Keatas� yang� Bekerja� Selama� Seminggu� yang� Lalu�menurut�Jam�Kerja�dan�Jenis�Kelamin,�2013�Population�15�Years�of�Age�and�Over�Who�Worked�During�The�Previous�Week�by�Work�Hour�and�Sex,�2013�
77�
4.2.7� Pencari� Kerja� yang� Terdaftar� menurut� Tingkat� Pendidikan� dan� Jenis� Kelamin,�2009�2013�Registered�Job�Seeker�by�Educational�Level�and�Sex,�2009�2013�
78�
4.2.8� Penempatan�Pencari�Kerja�yang�Terdaftar�menurut�Bulan,�Pendidikan,�dan�Jenis�Kelamin,�2009�2013�Number� of� The� Registered� Job� Seekers� to� be� Occupied� by�Month,� Educational�Level�and�Sex,�2009�2013�
81�
4.2.9� Pencari� Kerja� yang� Dihapuskan� pada� Kantor� Depnaker� menurut� Bulan,�Pendidikan�dan�Jenis�Kelamin,�2009�2013�Number� of� Job� Seekers� to� be� Eliminated� at�Manpower� Department� by�Month,�Educational�Level�and�Sex,�2009�2013�
83�
� � �� ����������������
http
://sul
teng
.bps
.go.
id

Daftar Tabel
xxii Sulawesi Tengah Dalam Angka 2014
Halaman/�Page�4.2.10� Jumlah� Pencari� Kerja� yang� Sudah� dan� Belum� Ditempatkan� menurut� Jenis�
Kelamin,�2012�2013�Number�of�Job�Seekers�Occupied�and�Not�Yet�Occupied�by�Sex,�2011�2012�
85�
�5.���SOSIAL/SOCIAL�� �5.1.�Pendidikan/Education�
5.1.1� Jumlah�Sekolah,�Guru,�dan�Murid�Menurut�Jenis�Sekolah,�2012/2013�Number�of�Schools,�Teachers,�and�Pupils�by�Kind�of�School,�2012/2013�
103�
5.1.2� Jumlah�Sekolah,�Guru,�dan�Murid�Taman�Kanak�Kanak�Menurut�Status�Sekolah�dan�Kabupaten/Kota,�2008/2009�2012/2013�Number�of�Schools,�Teachers,�and�Pupils� �of�Kindergarten�by�Status�of�School�and�Regency/City,�2008/2009�2012/2013�
104�
5.1.3� Banyaknya�Sekolah,�Guru�dan�Murid�Sekolah�Dasar�menurut�Kabupaten/Kota�dan�Status�Sekolah,�2008/2009�2012/2013�Number�of�Schools,�Teachers�and�Pupils�of�Elementary�School�by�Regency/City�and�Status�of�School,�2008/2009�2012/2013�
105�
5.1.4� Banyaknya�Peserta�dan�Lulusan�Ujian�Sekolah�Dasar�menurut�Kabupaten/Kota�dan�Status�Sekolah,�2008/2009�2012/2013�Number�of�Participants�and�Passed�Students�of�Exam�of�Elementary�Schools�by�Regency/City�and�Status�of�School,�2008/2009�2012/2013�
106�
5.1.5� Banyaknya� Sekolah,� Guru� dan� Murid� Sekolah� Lanjutan� Tingkat� Pertama�menurut�Kabupaten/Kota�dan�Status�Sekolah,�2008/2009�2012/2013�Number�of�Schools,�Teachers�and�Pupils�of�Junior�High�School�by�Regency/City�and�Status�of�School,�2008/2009�2012/2013�
107�
5.1.6� Banyaknya�Sekolah,�Guru,�dan�Murid�Lanjutan�Tingkat�Pertama�(SLTP)�Terbuka�Menurut�Kabupaten/Kota,�2008/2009�2012/2013�Number�of�Schools,�Teachers,�and�Pupils�at�Vocational�Junior�High�Schools�by�Regency/City,�2008/2009�2012/2013�
108�
5.1.7� Banyaknya�Peserta�dan�Lulusan�Ujian�Sekolah�Lanjutan�Tingkat�Pertama�(SLTP)�Umum�menurut�Kabupaten/Kota�dan�Status�Sekolah,�2008/2009�2012/2013�Number�of�Participants�and�Passed�Students�of�Exam�of�Junior�High�School�by�Regency/City�and�Status�of�School,�2008/2009�2012/2013�
109��
5.1.8� Banyaknya�Peserta�dan�Lulusan�Ujian�Sekolah�Lanjutan�Tingkat�Pertama�(SLTP)�Terbuka�menurut�Kabupaten/Kota�dan�Status�Sekolah,�2008/2009�2012/2013�Number�of�Participants�and�Passed�Students�of�Exam�of�Vacational�Junior�High�School�by�Regency/City�and�Status�of�School,�2008/2009�2012/2013�
110�
� � �� � �� �
�
http
://sul
teng
.bps
.go.
id

List Of Tables
Sulawesi Tengah in Figures 2014 xxiii
��������Halaman/�Page�� �5.1.9� Banyaknya� Sekolah,� Guru� dan� Murid� Sekolah� Menengah� Umum� (SMU)� menurut�
Kabupaten/Kota�dan�Status�Sekolah,�2008/2009�2012/2013�Number�of�Schools,�Teachers�and�Pupils�of�Senior�High�School�by�Regency/City�and�Status�of�School,�2008/2009�2012/2013�
111�
5.1.10� Banyaknya�Sekolah,�Guru�dan�Murid�Sekolah�Menengah�Kejuruan�(SMK)�menurut�Kabupaten/Kota�Status�Sekolah,�2008/2009�2012/2013�Number� of� Schools,� Teachers� and� Pupils� of� Vocational� Senior� High� School� by�Regency/City�and�Status�of�School,�2008/2009�2012/2013�
112�
5.1.11� Banyaknya�Peserta�dan�Lulusan�Ujian�Sekolah�Menengah�Umum�(SMU)�menurut�Kabupaten/Kota�dan�Status�Sekolah,�2008/2009�2012/2013�Number� of� Participants� and� Passed� Students� of� Exam� of� Senior� High� School� by�Regency/City�and�Status�of�School,�2008/2009�2012/2013�
113�
5.1.12� Banyaknya�Peserta�dan�Lulusan�Ujian�Sekolah�Menengah�Kejuruan�(SMK)�menurut�Kabupaten/Kota�dan�Status�Sekolah,�2008/2009�2012/2013��Number� of� Participants� and� Passed� Students� of� Exam�of� Vocational� Senior� High�School�by�Regency/City�and�Status�of�School,�2008/2009�2012/2013�
114�
5.1.13� Banyaknya� Mahasiswa� Baru� dan� Alumni� pada� Perguruan� Tinggi� menurut�Kabupaten/kota,�2012/2013�Number� of� New� Students� and� Graduations� in� State� Colleges� by� Regency/City,�2012/2013�
115�
5.1.14� Banyaknya� Dosen� pada� Perguruan� Tinggi� � Negeri� menurut� Kabupaten/kota,�2012/2013�Number�of�Lectures�in�State�Colleges�by�Regency/city,�2012/2013�
116�
5.1.15� Banyaknya� Dosen� pada� Perguruan� Tinggi� � Swasta� menurut� Kabupaten/kota�,2012/2013�Number�of�Lectures�in�State�Colleges�by�Regency/city,�2012/2013�
117�
5.1.16� Banyaknya�Mahasiswa�pada�Perguruan�Tinggi�Negeri�menurut�Fakultas�dan�Jenis�Kelamin,�2012/2013�Number�of�Students�in�Colleges�by�Faculty�and�Sex,�2012/2013�
118�
5.1.17� Banyaknya� Mahasiswa� pada� Perguruan� Swasta� menurut� Fakultas� dan� Jenis�Kelamin,�2010/2011��Number�of�Students�in�Private�Colleges�by�Faculty�and�Sex,�2012/2013�
119�
5.1.18� Jumlah� dan� Persentase� Putus� Sekolah� pada� Sekolah� Dasar� Menurut�Kabupaten/Kota,��2012/2013�Number� and� Percentage� of� Drop� Outs� of� Primary� School� by� Regency/City,�2012/2013�
120�
5.1.19� Jumlah�dan�Persentase�Angka�Putus�Sekolah�Menengah�Pertama�pada�Penduduk�Usia�13�15�tahun�Menurut�Kabupaten/Kota,��2011/20132�Number�and�Percentage�of�Drop�outs�of�Junior�High�School�at�Population�Aged�13�15�Years�by�Regency/City,�2012/2013�
121�
http
://sul
teng
.bps
.go.
id

Daftar Tabel
xxiv Sulawesi Tengah Dalam Angka 2014
�Halaman/�Page�
5.1.20� Persentase� Penduduk� Berumur� 10� Tahun� Keatas� menurut� Kabupaten/Kota� dan�Pendidikan�Tertinggi�yang�Ditamatkan�Percentage� of� Population� 10� Years� of� Age� and� Over� by� Regency/City� and�Educational�Attainment�
122�
5.1.21� Persentase� Penduduk� Usia� 10� Tahun� Keatas� menurut� Kemampuan�Membaca/Menulis�dan�Kabupaten/Kota,�2013�Percentage�of�Population�Aged�10�Years�and�Over�by�Reading/Writing�Ability�and�Regency/City,�2013�
124�
5.1.22� Angka�Partisipasi�Kasar�Pendidikan�menurut�Kabupaten/Kota�dan�Kelompok�Umur,�2013�Rugged�Participation�Rate�of�Education�by�Regency/City�and�Age�Group,�2013�
125�
5.1.23� Persentase� Penduduk� 5� Tahun� Ke� Atas� yang� Masih� Sekolah� menurut�Kabupaten/Kota�dan�Kelompok�Umur,�2009�2013�Percentage� of� Population� 5� Years� of� Age� and� Over� Who� Attending� School� by�Regency/City�and�Age�Group,�2009�2013�
126�
�5.2.��Kesehatan�/�Health�5.2.1� Banyaknya�Peserta�Vaksinasi�menurut�Kabupaten/Kota,�2009�2013�
Number�of�Vaccinated�Participant�by�Regency/City,�2009�2013�127�
5.2.2� Banyaknya�Tenaga�Dokter�menurut�Kabupaten/Kota,�2009�2013�Number�of�Doctors�Personnel�by�Regency/City,�2009�2013�
129�
5.2.3� Banyaknya�Tenaga�Kesehatan�selain�Dokter�Kabupaten/Kota,�2009�2013�Number�of�Public�Health�Personnel�Except�Doctor�by�Regency/City,��2009�2013�
130�
5.2.4� Banyaknya�Penyalur�Obat�menurut�Kabupaten/Kota,2009�2013�Number�of�Medicine�Distributors�by�Regency/City,�2009�2013�
131�
5.2.5� Banyaknya� Rumah� Sakit� dan� Fasilitas� Tempat� Tidur� menurut� Kabupaten/Kota,�2009�2013�Number�of�Hospitals�and�Beds�Facility�by�Regency/City,�2009�2013�
132�
5.2.6� Banyaknya� Posyandu� dan� Puskesmas� menurut� Kabupaten/Kota� dan� Jenis,� 2009�2013�Number�of�Main�Service�Post�and�Local�Govt.�Clinics�by�Regency/City,�2009�2013�
134�
5.2.7� Sepuluh� Pola� Penyakit� � Terbesar� di� Sulawesi� Tengah� menurut� Kabupaten/Kota,�2013��The�Ten�Biggest�Diseases�Spread�Over�in�Sulawesi�Tengah�by�Regency/City,�2013�
135�
5.2.8� Sepuluh� Terbesar� Penyakit� Terbanyak� Penderita� Rawat� Jalan� di� Sulawesi� Tengah,�2013�The� Ten� Biggest� Most� diseases� patient� from� Sulawesi� Tengah� by� Regency/City,�2013�
137�
� �
http
://sul
teng
.bps
.go.
id

List Of Tables
Sulawesi Tengah in Figures 2014 xxv
Halaman/�Page�
�� � � � � � � � � ��� � � � � � � � � �� �
� �
5.2.9� Banyaknya� Pasangan� Usia� Subur/PUS,� Akseptor� Baru,� Klinik� KB,� Persentase�Peserta�KB�Baru�per�1000�Pasangan�Usia�Subur�dan�Rata�rata�Akseptor�Baru�per�Klinik�Keluarga�Berencana,�2009�2013�Number� of� Couples� of� Reproductive� Age� (CRA),� New�Acceptors,� Family� Planning�Clinics,� New� Acceptors� per� 1000� CRA� and� Average� New� Acceptors� per� Family�Planning�Clinic,�2009�2013�
138�
5.2.10� Pencapaian� Target� Akseptor� Baru� Peserta� Keluarga� Berencana� menurut�Kabupaten/Kota�dan�Jenis�Alat�Kontrasepsi,�2009�2013�Realization� of� New� Acceptors� by� Regency/City� and� Kind� of� Contraception,2009�2013�
139�
5.2.11� Jumlah� Pasangan� Usia� Subur� (PUS),� Peserta� Keluarga� Berencana� Aktif� menurut�Kabupaten/Kota�dan�Metode�Kontasepsi,�2009�2013�Number�Couples� of� Reproductive�Age� (CRA)� of�Active�Acceptors� by�Regency/City�and�Kind�of�Contraception,�2009�2013�
140�
5.2.12� Banyaknya�Sarana�Pelayanan�Kontrasepsi�menurut��Kabupaten/Kota,�2009�2013�Number�of�Contraception�Service�Facilities�by�Regency/City,�2009�2013�
141�
5.2.13� Jumlah� Keluarga� Sejahtera� menurut� Kabupaten/Kota� dan� Tahapan� Keluarga�Sejahtera,�2009�2013�Number� of� Prosperous� Families� by� Regency/City� and� Prosperous� Family� Stages,�2009�2013�
142�
5.2.14� Persentase�Balita�menurut�Kabupaten/Kota�dan�Penolong�Waktu�Lahir,�2009�2013�Percentage� of� Children� Under� Five� Year� by� Regency/City� and� Birth� Attendant,�2009�2013�
143�
� � �
5.3.�Peradilan�/�Justice� �5.3.1� Banyaknya� Perkara� Tindak� Pidana� Umum� yang� Masuk� dan� Diselesaikan� pada�
Kejaksaan�Tinggimenurut�Kabupaten/Kota,2009�2013�Number� of� General� Law� Case� that� Reported� and� Cleared� by� State� Court� by�Regency/City,�2009�2013�
144�
5.3.2� Banyaknya� Perkara� Tindak� Pidana� Korupsi� yang� Masuk� dan� Diselesaikan� pada�Kejaksaan� Tinggi� dan� Negeri� menurut� Kantor� Kejaksaan� di� Provinsi� Sulawesi�Tengah,�2013�Number� of� Corruption� Law� Cases� that� Reported� and� Cleared� on�High� Court� and�State�by�Court�Region�Office�in�Sulawesi�Tengah,�2013�
145�
5.3.3� Banyaknya� Kejahatan� Terhadap� Jiwa/Badan� dan� Harta� Benda� menurut� Jenisnya,�2009�2013�Number�of�Crimes�Against�Soul/Body�and�Property�by�Type�of�Crime,2009�2013�
146�
http
://sul
teng
.bps
.go.
id

Daftar Tabel
xxvi Sulawesi Tengah Dalam Angka 2014
Halaman/�Page�5.3.4� Banyaknya� Surat� Tanda� Nomor� Kendaraan� Bermotor� (STNKB)� yang� Dikeluarkan�
di�Daerah�Hukum�Polisi�Daerah,�2009�2013�Number�of�Motor�Vehicle�Licenses�Which�Issued�by�Regional�Police,�2009�2013�
147�
5.3.5� Perkembangan� Jumlah�Surat� Izin�Mengemudi� (SIM)�yang�dikeluarkan�di�Daerah�Hukum�Polisi�Daerah,�2009�2013�Trend�of�Driving�Licenses�Which�Issued�by�Regional�Police,�2009�2013�
148�
5.3.6� Perkembangan� Jumlah� Kecelakaan� Lalu� Lintas� dan� Korban� serta� Nilai� Kerugian�pada�DaerahPolisi�Daerah,�2009�2013�Trend�of�Total�Traffic�Accident�Victims�and�Materials�Lost,�2009�2013�
149�
� � �5.4.��Agama�/�Religion� �
5.4.1� Persentase�Pemeluk�Agama�menurut�Kabupaten/Kota,�2008�2012�Percentage�of�Population�by�Religion�and�Regency/City,�2008�2012�
150�
5.4.2� Banyaknya� Tempat� Peribadatan� menurut� Kabupaten/Kota� dan� Agama,�2008�2012�Number�of�Places�of��Worship�by�Regency/City�and�Religion,�2008�2012�
151�
5.4.3� Banyaknya�Rohaniawan�menurut�Agama�dan�Kabupaten/Kota,�2008�2012�Number�of�Spiritualists�by�Religion�and�Regency/City,�2008�2012�
152�
5.4.4� Jumlah�Nikah�menurut�Kabupaten/Kota,�2007�2011�Number�of�Marriages�by�Regency/City,�2007�2011�
154�
5.4.5� Jumlah� Perkara� Yurisdiksi� Pengadilan� Tinggi� Agama� Sulawesi� Tengah� menurut�Pengadilan�Agama�Tahun�2009�2013�Number� of� Jurisdiction� Cases� in� Religious� High� Court� of� Sulawesi� Tengah� by�Religious�Court�,�2009�2013�
156�
� � �5.5.��Sosial�Lainnya�/�Other�Social�Affairs� �
5.5.1� Banyaknya� Anak� Terlantar� yang� di� Bina� di� Panti� Penyantunan� Anak� menurut�Kabupaten/Kota�dan�Jenis�Ketrampilan,�2007�2011�Number�of�Neglected�Children�Building� in�Orphanage�by�Regency/City�and�Type�of�Skill,�2007�2011�
157�
5.5.2� Banyaknya�Penderita�Cacat�menurut�Kabupaten/Kota�dan�Jenisnya,�2007�2011�Number�of�Handicapped�by�Regency/City�and�Types,�2007�2011�
158�
5.5.3� Banyaknya� Komunitas� Adat� Terpencil� yang� Belum� Diberdayakan� menurut�Kabupaten�dan�Suku,�2005�2010�Number� of� Isolated� Communities� Which� have� not� Built� by� Regency� and� Tribe,�2005�2010�
159�
�� � � � � ��� � � � � � � � � �
�������
http
://sul
teng
.bps
.go.
id

List Of Tables
Sulawesi Tengah in Figures 2014 xxvii
�Halaman/�Page�5.5.4� Banyaknya� Panti� Asuhan� dan� Jumlah� Anak� yang� Disantuni� menurut�
Kabupaten/Kota,�2009�2013�Number�of�Orphanages�and�Total�Protégées.�by�Regency/City,�2009�2013�
161�
5.5.5� Banyaknya� Jiwa� yang� Mendapat� Pelayanan� Penyantunan� Melalui� Sistem� Panti�dan�Non�Panti�per�Kabupaten/Kota�2009�2013�Number� of� People�Who�Obtained� Sympathetic� Care� Service� by� Institution� and�Non�Institution�System�by�Regency/City,�2009�2013�
162�
5.5.6� Kejadian� Bencana� Alam� menurut� Jenis� Bencana� dan� Kabupaten/Kota,� 2009�2013�Event�of�Natural�Disaster�by�Kind�of�Disaster�and�Regency/City,�2009�2013�
163�
5.5.7� Banyaknya�Karang�Taruna�mendapat�Pelayanan�Kabupaten/Kota�dan�Klasifikasi,�2009�2013�Number�of�Youth�Associations�by�Regency/City�and�Classifications,�2009�2013�
164�
5.5.8� Jumlah�Pekerja�Sosial�Masyarakat�(PSM)�menurut�Kabupaten/Kota,�2009�2013�Number�of�Social�Workers�(PSM)�by�Regency/City,�2009�2013�
165�
5.5.9� Jumlah�Organisasi�Sosial�menurut/Kota�dan�Klasifikasi,�2009�2013�Number�of�Social�Organizations�by�Regency/City�and�Classifications,�2009�2013�
166�
5.5.10� Banyaknya�Permasalahan�Sosial�menurut�Kabupaten/Kota,�2009�2013�Number�of�Social�Problems�by�Regency/City,�2009�2013�
167�
5.5.11� Banyaknya�Keluarga�Fakir�Miskin�yang�mendapat�Bantuan�serta�Penderita�Cacat�Mental� dan� Anak� Nakal� yang� mendapat� Pembinaan� dan� Pelayanan� Sosial�menurut��Kabupaten/Kota,�2009�2013�Number� of� Poor� Families�Which�Obtained� Aids,�Mentally� Handicapped� People�and� Naughty� Children� Who� Got� Building� and� Social� Service� by� Regency/City,�2009�2013�
168�
5.5.12� Batas�Miskin,�Jumlah�dan�Persentase�Penduduk�Miskin�menurut�Status�Daerah,�2009�2013�Poverty� Line,� Number� and� Percentage� of� Population� Below� the� Poverty� Line,�2009�2013�
169�
5.5.13� Jumlah�Penduduk�Miskin�menurut�Kabupaten/Kota,�2010���2012�Number�of�Poor�People�by�Regency/City,�2010�–�2012�
170�
� �5.6.���Perumahan�/�Housing� �5.6.1� Penjualan� Rumah� melalui� Kredit� Pemilikan� Rumah� Bank� Negara� (KPR� BTN),�
2009�2013�Sale�of�House�By�House�Ownership�Credit�(KPR)�of�National�Savings�Bank�(BTN),�2009�2013�
171�
� �� � � � � � � �������
http
://sul
teng
.bps
.go.
id

Daftar Tabel
xxviii Sulawesi Tengah Dalam Angka 2014
Halaman�/�Page5.6.2� Persentase� Rumah� Tangga� menurut� Kabupaten/Kota� dan� Status� Kepemilikan�
Tempat�Tinggal,�2012�Percentage�of�Households�by�Regency/City�and�House�Ownership�Status,�2012�
172�
5.6.3� Persentase� Rumah� Tangga� menurut� Kabupaten/Kota� dan� Jenis� Atap� Terluas,�2012�Percentage�of�Households�by�Regency/City�and�Roof�Main�Material,�2012�
173�
5.6.4� Persentase� Rumah� Tangga� menurut� Kabupaten/Kota� dan� Jenis� Lantai� Terluas,�2012�Percentage�of�Households�by�Regency/City�and�Primary�Construction�Material�of�the�Floor,�2012�
174�
5.6.5� Persentase��Rumah�Tangga�menurut�Kabupaten/Kota�dan�Jenis�Dinding�Terluas,�2012�Percentage�of�Households�by�Regency/City�and�Outer�Main�Wall�Material,�2012�
175�
5.6.6� Persentase� � Rumah� Tangga� menurut� Kabupaten/Kota� dan� Luas� Lantai� Tempat�Tinggal�(m2),�2012�Percentage� of� Households� by� Regency/City� and� Floor� Area� � of� Living�Quarters�(m2),�2012�
176�
5.6.7� Persentase��Rumah�Tangga�menurut�Kabupaten/Kota�dan�Sumber�Penerangan,�2012�Percentage�of�Households�by�Regency/City�and�Source�of�Lighting,�2012�
177�
5.6.8� Persentase� Rumah� Tangga� menurut� Kabupaten/Kota� dan� Sumber� Air� Minum,�2012�Percentage�of�Households�by�Regency/City�and�Source�of�Drinking�Water,�2012�
178�
5.6.9� Persentase� Rumah� Tangga� menurut� Kabupaten/Kota� dan� Jenis� Tempat� Buang�Air�Besar,�2012�Percentage�of�Households�by�Regency/City�and�Type�of�Closet�Facility,�2012�
180�
5.6.10� Persentase� Rumah� Tangga� menurut� Kabupaten/Kota� dan� Pembuangan� Akhir�Tinja,�2012�Percentage�of�Households�by�Regency/City�and�Final�Disposal�of�Feces,�2012�
181�
5.6.11� Persentase�Rumah�Tangga�yang�Sumber�Air�Minumnya�dari�Pompa/Sumur/Mata�Air� menurut� Kabupaten/Kota� dan� Jarak� Pompa/Sumur/Mata� Air� ke�Penampungan�Akhir�Kotoran/Tinja�Terdekat�(m),�2012�Percentage�of�Households�Which�Used�Pump/Well/Spring�as�Source�of�Drinking�Water� by� Regency/City� and� the� Distance� to� the� Nearest� Septic� Tank� or� Other�Waste�Disposal�(m),�2012�
182�
5.6.12� Persentase� Rumah� Tangga� Menurut� Kabupaten/Kota� dan� Bahan� Bakar� yang�Digunakan,�2012�Percentage�of�Households�by�Regency/City�and�Fuel�Use,�2012�
183�
���������������������������������������������������������������������������������������������������������������������������������������������������������
�
http
://sul
teng
.bps
.go.
id

List Of Tables
Sulawesi Tengah in Figures 2014 xxix
Halaman�/�Page�6����PERTANIAN�/�AGRICULTURE� �� � �
6.1.��Tanaman�Pangan/�Foods�Crops� �6.1.1� Luas�Panen,�Hasil�per�Hektar�dan�Produksi�Padi�Sawah,�2009�2013�
Harvested�Area,�Yield�Rate�and�Production�of�Wet�Land�Paddy,�2009�2013�197�
6.1.2� Luas�Panen,�Hasil�per�Hektar�dan�Produksi�Padi�Ladang,�2009�2013�Harvested�Area,�Yield�Rate�and�Production�of�Dry�Land�Paddy,�2009�2013�
198�
6.1.3� Luas�Panen,�Hasil�per�Hektar�dan�Produksi�Padi�(Sawah�+�Ladang),�2009�2013�Harvested� Area,Yield� Rate� and� Production� of� Paddy� (Wet� and� Dry� Land),�2009�2013�
199�
6.1.4� Luas�Panen,�Hasil�per�Hektar�dan�Produksi�Jagung,�2009�2013�Harvested�Area,�Yield�Rate�and�Production�of�Maize,�2009�2013�
200�
6.1.5� Luas�Panen,�Hasil�per�Hektar�dan�Produksi�Ubi�Kayu,�2009�2013�Harvested�Area,�Yield�Rate�and�Production�of�Cassava,�2009�2013�
201�
6.1.6� Luas��Panen,�Hasil�per�Hektar�dan�Produksi�Ubi�Jalar,�2009�2013�Harvested�Area,�Yield�Rate�and�Production�of�Sweet�Potatoes,�2009�2013�
202�
6.1.7� Luas�Panen,�Hasil�per�Hektar�dan�Produksi�Kacang�Tanah,�2009�2013�Harvested�Area,�Yield�Rate�and�Production�of�Peanuts,�2009�2013�
203�
6.1.8� Luas�Panen,�Hasil�per�Hektar�dan�Produksi�Kacang�Kedelai,�2009�2013�Harvested�Area,�Yield�Rate�and�Production�of�Soybean�Peanuts,�2009�2013�
204�
6.1.9� Luas�Panen,�Hasil�per�Hektar�dan�Produksi�Kacang�Hijau,�2009�2013�Harvested�Area,�Yield�Rate�and�Production�of�Green�Peanuts,�2009�2013�
205�
6.1.10� Luas� Panen,� Produksi,� dan� Hasil� per� Hektar� Sayur�sayuran� menurut�Kabupaten/Kota�dan�Jenisnya,�2009�2013�Harvested�Area,�Production,�and�Yield�Rate�of�Vegetables�by�Regency/City�and�the�Kind,�2009�2013�
206�
6.1.11� Tanaman� Menghasilkan,� Hasil� per� Hektar� dan� Produksi� Buah�buahan� menurut�Jenis�Tanaman,�2013�Harvested�Area,�Yield�Rate�and�Production�of�Fruits,�2013�
215�
6.1.12� Luas�Sawah�menurut�Kabupaten/Kota�dan�jenis�Pengairan�(ha)�kewenangan�dan�tanggung�jawab�kabupaten,�2009�2013�Area�of�Wet�Land�by�Regency/City�and�Type�of�Irrigation�(hectare)�authority�and�reponsibility�regency,�2009�2013�
216�
6.1.13� Jumlah� Daerah� Irigasi,� Luas� Areal� Sawah� Potensial� dan� Fungsional� menurut�kabupaten/kota��(ha)�kewenangan�dan�tanggung�jawab�Provinsi,�2009�2013�Total� Irrigation� Local,� Potential� and� Functional�Wet� Land�Areas� Supervised� by�Regency/City�(hectare)�authority�and�reponsibility�Province,�2009�2013�
217�
6.1.14� Jumlah�Daerah�Irigasi,�Luas�Areal�Sawah�Potensial�dan�Fungsional�kewenangan�dan�tanggung�jawab�Pusat�(ha),�2013�Total� Irrigation� Local,� Potential� and� Functional� Wet� Land� Areas� Supervised� by�authority�and�reponsibility�Departemen(hectare),�2013�
218�
http
://sul
teng
.bps
.go.
id

Daftar Tabel
xxx Sulawesi Tengah Dalam Angka 2014
�Halaman/�Page�
� � �6.1.15� Luas�Lahan�Kering�menurut�Kabupaten/Kota�(ribu�ha),�2009�2013�
Area�of�Dry�Land�by�Regency/City�(thousands�hectare),�2009�2013�219�
6.1.16� Luas�Penggunaan�Tanah�menurut�Kabupaten/Kota,�2013�Area�of�Land�Utilization�by�Regency/City,�2013�
222�
� �6.2.�Perkebunan/Plantation� �
6.2.1� Luas� Areal� dan� Produksi� Tanaman� Perkebunan� Besar� menurut� Jenis� Komoditi�dan�Kabupaten/Kota,�2009�2013�Planted� Area� and� Production� of� Large� Estate� by� Kind� of� Commodity� and�Regency/City,�2009�2013�
225�
6.2.2� Luas� Areal�dan�Produksi� Tanaman� Perkebunan�Rakyat� menurut� Jenis� Komoditi�dan�Kabupaten/Kota,�2009�2013�Planted�Area�and�Production�of�Smallholders�Estate�by�Kind�of�Commodity�and�Regency/City,�2009�2013�
227�
� � �6.3.�Kehutanan�/�Forestry� �
6.3.1� Perkembangan� Luas� Penebangan� Hutan� dan� Hasilnya� oleh� Pemegang� Hak�Pengusahaan�Hutan�(HPH),�2009�2013�Progress� of� Felling� Area� and� the� Productions� of� Logging� Concession� (HPH),�2009�2013�
234�
6.3.2� Perkembangan�Produksi�Hasil�Hutan�menurut�Jenisnya,�2009�2013�Trend�of�Forest�Productions�by�the�Kind,�2009�2013�
235�
6.3.3� Luas�Hutan�(ha)�menurut�Kabupaten/Kota�dan�Fungsinya,�2009�2013�Forest�Area�by�Regency/City�and�the�Function�(hectare),�2009�2013�
236�
6.3.4� Perkembangan�Realisasi�Interinsuler�Hasil�Hutan�menurut�Jenisnya,�2009�2013�Interinsuler�of�Forest�Production�by�Kinds,�2009�2013�
237�
6.3.5� Kawasan�Konservasi�yang�Telah�Ditetapkan,�2013�Conservation�Area�Which�Has�Been�Defined,�2013�
237��
6.3.6� Luas�Lahan�Kritis�(ha)�menurut�Kabupaten/Kota,�2009�Critical�Land�Area�(ha)�by�Regency/City,�2009�
240�
6.3.7� Luas� Wilayah� Daerah� Aliran� Sungai� (DAS)� Prioritas� (ha)� menurut�Kabupaten/Kota,�2009�Alpha�Area�Priority�Watershe�(ha)�by�Regency/City,2009�
242�
�����
http
://sul
teng
.bps
.go.
id
List Of Tables
Sulawesi Tengah in Figures 2014 xxxi
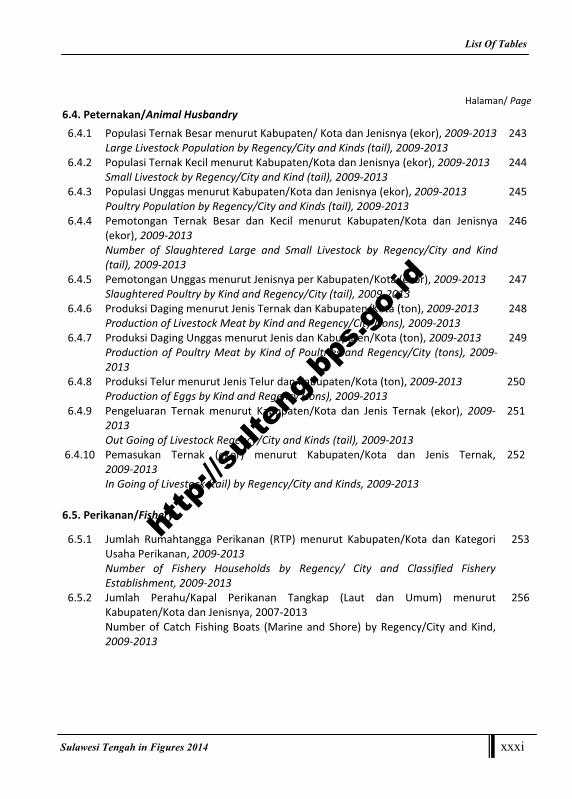
Halaman/�Page�6.4.�Peternakan/Animal�Husbandry�
6.4.1� Populasi�Ternak�Besar�menurut�Kabupaten/�Kota�dan�Jenisnya�(ekor),�2009�2013�Large�Livestock�Population�by�Regency/City�and�Kinds�(tail),�2009�2013�
243�
6.4.2� Populasi�Ternak�Kecil�menurut�Kabupaten/Kota�dan�Jenisnya�(ekor),�2009�2013�Small�Livestock�by�Regency/City�and�Kind�(tail),�2009�2013�
244�
6.4.3� Populasi�Unggas�menurut�Kabupaten/Kota�dan�Jenisnya�(ekor),�2009�2013�Poultry�Population�by�Regency/City�and�Kinds�(tail),�2009�2013�
245�
6.4.4� Pemotongan� Ternak� Besar� dan� Kecil� menurut� Kabupaten/Kota� dan� Jenisnya�(ekor),�2009�2013�Number� of� Slaughtered� Large� and� Small� Livestock� by� Regency/City� and� Kind�(tail),�2009�2013�
246�
6.4.5� Pemotongan�Unggas�menurut�Jenisnya�per�Kabupaten/Kota�(ekor),�2009�2013�Slaughtered�Poultry�by�Kind�and�Regency/City�(tail),�2009�2013�
247�
6.4.6� Produksi�Daging�menurut�Jenis�Ternak�dan�Kabupaten/Kota�(ton),�2009�2013�Production�of�Livestock�Meat�by�Kind�and�Regency/City�(tons),�2009�2013�
248�
6.4.7� Produksi�Daging�Unggas�menurut�Jenis�dan�Kabupaten/Kota�(ton),�2009�2013�Production�of�Poultry�Meat�by�Kind�of�Poultries�and�Regency/City� (tons),�2009�2013�
249�
6.4.8� Produksi�Telur�menurut�Jenis�Telur�dan�Kabupaten/Kota�(ton),�2009�2013�Production�of�Eggs�by�Kind�and�Regency�(tons),�2009�2013�
250�
6.4.9� Pengeluaran� Ternak� menurut� Kabupaten/Kota� dan� Jenis� Ternak� (ekor),� 2009�2013�Out�Going�of�Livestock�Regency/City�and�Kinds�(tail),�2009�2013�
251�
6.4.10� Pemasukan� Ternak� (ekor)� menurut� Kabupaten/Kota� dan� Jenis� Ternak,�2009�2013�In�Going�of�Livestock�(tail)�by�Regency/City�and�Kinds,�2009�2013�
252�
� � �6.5.�Perikanan/Fishery� �
6.5.1� Jumlah� Rumahtangga� Perikanan� (RTP)� menurut� Kabupaten/Kota� dan� Kategori�Usaha�Perikanan,�2009�2013�Number� of� Fishery� Households� by� Regency/� City� and� Classified� Fishery�Establishment,�2009�2013�
253�
6.5.2� Jumlah� Perahu/Kapal� Perikanan� Tangkap� (Laut� dan� Umum)� menurut�Kabupaten/Kota�dan�Jenisnya,�2007�2013�Number� of� Catch� Fishing�Boats� (Marine� and� Shore)� by� Regency/City� and� Kind,�2009�2013�
256�
�
http
://sul
teng
.bps
.go.
id

Daftar Tabel
xxxii Sulawesi Tengah Dalam Angka 2014
Halaman�/�Page6.5.3� Banyaknya�Alat�Penangkap�Ikan�menurut�Jenis�Tahun�2013�
Number�of�Fisher�Equipments�by�Type,�2013�257�
6.5.4� Produksi� Perikanan� Tangkap� menurut� Kabupaten/Kota� dan� Jenis� Perikanan�(ton),�2009�2013�Production� of� Catch� Fishing� by� Regency/City� and� Kind� of� Fishery� (tons),� 2009�2013�
258�
6.5.5� Nilai� Produksi� Perikanan� Tangkap� menurut� Kabupaten/Kota� Jenis� Perikanan�(juta�rupiah),�2009�2013�Production�Value�of�Catch�Fishing�by�Regency/City�and�Kind�of�Fishery� (million�rupiahs),�2009�2013�
259�
6.5.6� Produksi� Perikanan� Budidaya� menurut� Kabupaten/Kota� dan� Jenis� Perikanan�(ton),�2009�2013�Production�of�Culture�Fishery�by�Regency/City�and�Kinds�of�Fishery�(tons),�2009�2013�
260�
6.5.7� Nilai� Produksi� Perikanan� Budidaya� menurut� Kabupaten/Kota� dan� Jenis�Perikanan�(Juta�Rupiah),�2009�2013�Production�Value�of�Fishery�Culture�by�Regency/City�and�Kinds�of�Fishery�(million�rupiah),�2009�2013�
261�
6.5.8� Produksi�Ikan�Laut�Olahan�menurut�Kabupaten/Kota�(ton),�2009�2013�Production�of�Marine�Preservative�Fish�by�Regency/City�(tons),�2009�2013�
262�
6.5.9� Produksi�Ikan�Darat�Olahan�menurut�Kabupaten/Kota�(ton),�2009�2013�Production�of�Shore�Preservative�Fish�by�Regency/City�(tons),�2009�2013�
263��
� � �� � �
7�.��INDUSTRI,�PERTAMBANGAN,�DAN�ENERGI/MANUFACTURE,�MINING,�AND�ENERGY� �� � �
7.1.�Industri�/�Manufacture� �7.1.1� Banyaknya� Perusahaan� Industri� Besar/Sedang,� Tenaga� Kerja� dan� Pengeluaran�
untuk�Tenaga�Kerja�menurut�Golongan�Industri,�2008�2012�Number�of�Large�and�Medium�Scale�of�Manufacturing�Establishments,�Workers�Engaged,�Labor�Cost�by�Industrial�Code,�2008�2012�
275�
7.1.2� Nilai� Output� Industri� Besar/Sedang� menurut� Golongan� Industri� (ribu� rupiah),�2008�2012�Gross�Output�Value�of�Large�and�Medium�Scale�Manufacturing�Establishments�by�Industrial�Code�(thousand�rupiahs),�2008�2012�
276�
7.1.3� Nilai� Output,� Biaya� Input� dan� Nilai� Tambah� Industri� Besar/Sedang,� menurut�Golongan�Industri�(ribu�rupiah),�2008�2012�Gross� Output� Value� of� Input� Cost� and� Value� Added� Large� and�Medium� Scale�Manufacturing�Establishment�by�Industrial�Code�(thousands�rupiahs),�2008�2012�
277�
� � ��
http
://sul
teng
.bps
.go.
id

List Of Tables
Sulawesi Tengah in Figures 2014 xxxiii
Halaman�/�Page�7.2.�Pertambangan�/�Mining� �7.2.1� Banyaknya�Produksi�Nickel�dan�pasir�besi�menurut�Kabupaten/Kota�(metrik�ton),�
2009�2013�Number� of� Productions�Nickel�Ore�and� Iron� Salt� by�Regency/City� (Metric� Ton),�2009�2013�
278�
7.2.2� Banyaknya�Produksi�Minyak�Bumi�dan�Gas�menurut�Triwulan,�2013�Number�of�Productions�Nickel�Ore�by�Triwulan,�2013�
279�
�7.3.�Listrik/Electricity�
�
7.3.1� Banyaknya� Produksi,� Pemakaian� Bahan� Bakar� dan� Pelumas� pada� PLN� menurut�Kabupaten/Kota,�2009�2013�Number� of� Productions,� Fuel� Consumption� and� Lubricants� in� State� Electricity�Company�by�Regency/City,�2009�2013�
280�
7.3.2� Jumlah�Gardu�dan�Pelanggan�PLN�menurut�Kabupaten/Kota,�2009�2013�Number�of�Transmissions�and�Customers�by�Regency/City,�2009�2013�
281�
7.3.3� Banyaknya�Pelanggan�Listrik�PLN�menurut�Kabupaten/Kota,2009�2013�Number�of�Customers�of�PLN’s�Electrical�Power�by�Regency/City,�2009�2013�
282�
7.3.4� Produksi,� Daya� Terpasang� dan� Penggunaan� Listrik� PLN� menurut�Kabupaten/Kota,�2009�2013�Electricity� Production,� Installed� Capacity� and� Use� of� PLN’s� Electrical� Power� by�Regency/City,�2009�2013�
283�
� �
7.4.�Air�Minum�/�Clean�Water� �7.4.1� Banyaknya�Produksi�Air�Minum�menurut�Kabupaten/Kota,�2009�2013�
Number�of�Water�Supply�Productions�by�Regency/City,�2009�2013�285�
7.4.2� Banyaknya� Pelanggan� Perusahaan� Air� Minum� menurut� Kabupaten/Kota,� 2009�2013�Number�of�Consumers�of�Water�Supply�Enterprise�by�Regency/City,�2009�2013�
286�
� � �� �
8.�PERDAGANGAN/TRADE� �
8.1� Volume�dan�Nilai�Ekspor�Menurut�Jenis�Komoditi,�2013�Export�Volume�and�the�Value�by�Type�of�Commodity,�2013�
293�
8.2� Volume�dan�Nilai�Ekspor�menurut�Negara�Tujuan,�2012–2013�Export�Volume�and�Value�by�Destination�Country,�2012–2013�
295�
8.3� Volume�dan�Nilai�Ekspor�menurut�Pelabuhan�Muat,�2012–2013�Export�Volume�and�Value�by�Loading�Port,�2012–2013�
296�
8.4� Volume�dan�Nilai�Impor�menurut�Negara�Asal,�2012–2013�Import�Volume�and�Value�by�Country�Origin,�2012–2013�
297�
� � �
http
://sul
teng
.bps
.go.
id

Daftar Tabel
xxxiv Sulawesi Tengah Dalam Angka 2014
��
Halaman�/�Page�8.5� Volume�dan�Nilai�Impor�menurut�Pelabuhan�Bongkar,�2012–2013�
Import�Volume�and��Value�by�Unloading�Port,�2012–2013�298�
8.6� Perkembangan�Nilai�Ekspor�–�Impor�,�2009�2013�Trend�of�Export�and�Import�Value,�2009�2013�
299�
8.7� Penyaluran� Beras� Kepada� Golongan� Anggaran/Non� Anggaran� menurut� Bulan�dan�Kabupaten/Kota,�2009�2013�(Ton)�Rice� Distribution� of� Budgetary/non� Budgetary� Groups� by� Month� and�Regency/City,�2009�2013�(Ton)�
300�
8.8� Perkembangan� Harga� dan� Penyaluran� Beras� di� Provinsi� Sulawesi� Tengah,�2009�2013�Progress�of�Prices�and�Rice�Distribution�in�Sulawesi�Tengah�Province,�2009�2013�
301�
8.9� Penyaluran�Beras�Miskin�(Raskin)�Perum�BULOG�Divre�Sulawesi�Tengah,�2011�Distribution�of�Rice�for�Poor�People�(Raskin)�by�Public�Enterprise�Warehouse�for�Foodstuff�(BULOG)�Division�of�Regional�Sulawesi�Tengah,�2013�
302�
8.10� Jumlah� Stasiun� Pengisian� Bahan� Bakar� Umum� (SPBU)� di� Provinsi� Sulawesi�Tengah,�2009�2013�Number� of� Fuel� Filling� Stations� General� (gas� stations)� in� Sulawesi� Tengah�Province,2009�2013�
303�
� �9.����TRANSPORTASI,�POS,�DAN�TELEKOMUNIKASI/TRANSPORTATION,�POST,�AND�
TELECOMMUNICATION��
�
� �
9.1.�Panjang�Jalan�/Length�of�Roads� �9.1.1� Panjang�Jalan�menurut�Pemerintah�yang�Berwenang�dan�Jenis�Permukaan�(km),�
2009�2013�Length�of�Roads�by�Level�of�Government�Responsibility�and�Type�of�Surface�(km),�2009�2013�
315�
9.1.2� Panjang� Jalan� menurut� � Kondisi� Jalan� dan� Pemerintah� yang� Berwenang� (km),�2009�2013�Length�of� �Roads�by�Condition�of�Roads�and�Level�of�Government�Responsibility�(km),�2009�2013�
316�
9.1.3� Panjang�Jalan�menurut��Kelas�Jalan�dan�Pemerintah�yang�Berwenang�(km),�2009�2013�Length�of��Roads�by�Class�of�Roads�and�Level�of�Government�Responsibility�(km),�2009�2013�
317�
�����
http
://sul
teng
.bps
.go.
id

List Of Tables
Sulawesi Tengah in Figures 2014 xxxv
Halaman/�Page�
9.2.��Angkutan�Darat�/�Land�Transportation�
9.2.1� Banyaknya�Kendaraan�Bermotor�Wajib�Uji�menurut�Kabupaten/Kota�dan�Jenisnya,�2009�2013�Number� of� Obligatory� Tested� of� Motor� Vehicles� by� Regency/City� and� by� Type,�2009�2013�
318�
9.2.2� Banyaknya�Kendaraan�Bermotor�yang�Sudah�Diuji�menurut�Jenisnya,�2009�2013�Number�of�Vehicles�have�been�Tested�by�Type�of�Vehicles,�2009�2013�
319�
9.2.3� Banyaknya� Perusahaan� Angkutan� Bus� Umum,� Armada� dan� Daya� Angkut� Orang�yang�Beroperasi�di�Kabupaten/Kota,�2009�2013�Number� of� Public� Bus� Transportation� Companies,� Public� Bus,� and� Capacities� by�Regency/City,�2009�2013�
320�
9.2.4� Banyaknya� Perusahaan� Angkutan� Truk,� Armada� dan� Daya� Angkut� Orang� dan�Barang�di�Kabupaten/Kota,�2009�2013�Number�of�Truck�Transportation�Companies,�Trucks,�and�Capacities�of�People�and�Good�by�Regency/City,�2009�2013��
321�
9.3.�Angkutan�Laut�/Sea�Transportation� �9.3.1� Banyaknya� Penumpang� Kapal� Yang� Datang� dan� Berangkat� di� Provinsi� Sulawesi�
Tengah�menurut�Pelabuhan�dan�Jenis�PelayaranTahun�2013�Number�of�Ship�Passenger�(Arrival�and�Departure)�in�Sulawesi�Tengah�Province�by�Port�and�Kind�of�Voyage,�2013�
322�
9.3.2� Jumlah� Barang� yang� Dibongkar� dan� Dimuat� Menurut� Pelabuhan� dan� Jenis�Pelayaran�Provinsi�Sulawesi�Tengah,�2013�Total� Unloaded� and� Loaded� Cargo� by� Port� � and� Kind� of� Voyage� at� in� Sulawesi�Tengah�Province,�2013�
323�
� �9.4.�Angkutan�Udara/Air�Transportation� �9.4.1� Arus�Lalu�Lintas�Pesawat�Udara�dan�Penumpang�menurut�Pelabuhan�Udara,�2009�
2013�Air�Traffic��and�Passenger�by�Air�Port�,�2009�2013�
324�
9.4.2� Arus� Lalulintas� Barang,� Bagasi� dan� Pos� Paket� melalui� Bandara� Udara� (kg),�2009�2013�Number�of�Loaded�and�Unloaded��Cargo,�Baggage��and�Mails�(kg),�2009�2013�
325�
� � �9.5.�Pos�dan�Telekomunikasi�/�Post�and�Telecommunication� �9.5.1� Banyaknya�Surat,�Warkat/�Kartu�Pos,�Pos�Paket,�dan�Wesel�yang�Diterima�Dalam�
Negeri,�2009�2013�Number�of�Domestic�Receiving�of�Mails,�Papers/Post�Cards,�Parcels�and�Money�Orders,�2009�2013�
326��
http
://sul
teng
.bps
.go.
id

Daftar Tabel
xxxvi Sulawesi Tengah Dalam Angka 2014
Halaman/�Page��
9.5.2� Banyaknya� Surat,� Warkat/Kartu� Pos,� Pos� Paket,� dan� Wesel� yang� Dikirim� Dalam�Negeri,�2009�2013�Number� of� Domestic� Dispatch� of�Mails,� Papers/Post� Cards,�Matter,� Parcels� and�Money�Orders,�2009�2013�
327��
9.5.3� Banyaknya� Surat,� Warkat/Kartu� Pos,� Pos� Paket,� dan� Wesel� yang� Diterima� Luar�Negeri,�2009�2013�Number�of�International�Receiving�of�Mails,�Papers/Post�Cards,�Parcels�and�Money�Orders,�2009�2013�
328��
9.5.4� Banyaknya� Surat,� Warkat/Kartu� Pos,� Pos� Paket,� dan� Wesel� yang� Dikirim� Luar�Negeri,�2009�2013�Number�of�International�Dispatch�of�Mails,�Papers/Post�Cards,�Parcels�and�Money�Orders,�2009�2013�
329�
9.5.5� Jumlah� Pelanggan� dan� Sarana� Warung� Telekomunikasi� (Wartel)� menurut�Kabupaten/Kota,�2009�2013�Number�of�Subscribers�and�Phone�booths�by�Regency/City,�2009�2013�
330�
�10.��HOTEL�DAN�PARIWISATA/HOTEL�AND�TOURISM� �
� � �10.1.�Hotel/Hotel� �10.1.1� Jumlah� Hotel,� Kamar,� dan� Tempat� Tidur� menurut� Kabupaten/� Kota� dan� Jenis�
Hotel,�2009�2013�Number�of�Hotels,�Rooms,�and�Beds�by� � Regency/�City�and�Hotel� Classification,�2009�2013�
339�
10.1.2� Jumlah� Tenaga� Kerja� Perhotelan� menurut� Kabupaten/Kota� dan� Tingkat�Pendidikan,�2009�2013�Number�of�Hotel�Workers�by�Regency/City�and�Education�Level,�2009�2013�
340�
10.1.3� Persentase�Tingkat�Penghunian�Kamar�Hotel�dan�Akomodasi�Lainnya,�2009�2013�Room�Occupancy�Rate�of�Hotel�and�Other�Accommodations,�2009�2013�
341�
10.1.4� Banyaknya�Tamu�Asing�dan�Tamu�Dalam�Negeri�Datang�ke�Hotel�menurut� Jenis�Hotel,�2009�2013�Number�of�Foreign�Guests�and�Domestic�Guests�Who�Stayed�at�Hotels�by�Hotel�Classification,�2009�2013�
342�
10.1.5� Rata�rata�Lama�Menginap�Tamu�dirinci�menurut�Jenis�Hotel�(hari),�2009�2013�Average�Length�Stayed�of�Guest�by�Hotel�Classification�(days),�2009�2013�
343�
10.1.6� Rata�rata� Lama� Menginap� Tamu� Hotel� Menurut� Periode� dan� klasifikasi� Hotel�(hari),�2009�2013�Averages�Length�of�Stay�(by�Foreign�and�Domestic�Guest)�(days),�2009�2013�
344�
� � �
http
://sul
teng
.bps
.go.
id

List Of Tables
Sulawesi Tengah in Figures 2014 xxxvii
Halamam/Page��
10.1.7� Rata�rata�Lama�Menginap�Tamu�Hotel�Menurut�Bulan�dan�Klasifikasi�Hotel�(hari)�2009�2013�Average�Length�Stayed�of�Guest�(Foreign�and�Domestic)�at�Unclassified�Hotel�by�Rooms�Group�(days),�2009�2013�
345�
� �10.2.�Pariwisata/Tourism� �10.2.1� Jumlah�Kunjungan�Wisatawan�Menurut�Kabupaten/Kota,�2009�2013�
Number�of�Tourist�Visitors�by�Regency/City,��2009�2013�346�
10.2.2� Jumlah� Rumah� Makan/Restoran,� Meja� dan� Kursi� menurut� Kabupaten/Kota,�2009�2013�Number�of�Restaurants,�Chairs�and�Desks�by��Regency/City,�2009�2013�
347�
� �11.�KEUANGAN,�PERBANKAN�DAN�HARGA�HARGA/FINANCE,�BANKING�AND�PRICES�� �11.1.�Keuangan�Pemerintah�Daerah�/�Autonomy�Government�Finance� �11.1.1� Rencana� Penerimaan� Daerah� Otonom� Provinsi� Sulawesi� Tengah,� 2013�
(Juta�Rupiah)�Revenues� Program�of� � Autonomous�Regional� � Sulawesi� Tengah�Province,� 2013�(Million�Rupiahs)�
359�
11.1.2� Realisasi� Penerimaan� Daerah� Otonom� Propinsi� Sulawesi� Tengah,� 2012�(Juta�Rupiah)�Actual� Revenues� of� � Autonomous� Regional� � Sulawesi� Tengah� Province,� 2012�(Million�Rupiahs)�
363�
11.1.3� Realisasi� Pengeluaran� Daerah� Otonom� Provinsi� Sulawesi� Tengah,� 2012�(Juta�Rupiah)�Actual� Autonomous� Regional� Expenditures� of� Sulawesi� Tengah,� 2012� (Million�Rupiahs)�
368�
11.1.4� Realisasi�Penerimaan�Daerah�Otonom�Kabupaten/Kota,�2012(Juta�Rupiah)�Actual�Autonomous�Region�Receipts�by�Regency/City,�2012(Million�Rupiahs)�
370�
11.1.5��
11.1.6�
Realisasi�Pengeluaran�Daerah�Otonom�Kabupaten/Kota,�2012(Juta�Rupiah)�Actual�Autonomy�Expenditures�by�Regency/City,�2012�(Million�Rupiahs)�Luas�Tanah�yang�Dikenakan�Pungutan�PBB�menurut�Sektor�per�Kabupaten/Kota,�2009�2013�(ha)�Land�Areas�for�Tax�on�Land�and�Building�by�Sector�and�Regency/City,�2009�2013�(ha)�
371���
372�
� � �� � �
http
://sul
teng
.bps
.go.
id

Daftar Tabel
xxxviii Sulawesi Tengah Dalam Angka 2014
Halaman/�Page��
�����
11.1.7� Jumlah�Wajib�PBB�menurut�Sektor�dan�Kabupaten/Kota,�2009�2013�Number�of�Taxes�on�Land�and�Building�Object�by�Sector�and�Regency/�City,�2009�2013�
374�
11.1.8� Realisasi� Penerimaan� Pajak� Bumi� dan� Bangunan� menurut� Sektor� dan�Kabupaten/Kota2009�2013(000�Rupiah)�Actual� Tax� on� Land� and� Building� Receipts� by� Regency/City,� 2009�2013(000�Rupiahs)�
376�
11.1.9� Jumlah� Ketetapan,� Tunggakan,� Target� dan� Realisasi� PBB� Menurut�Kabupaten/Kota�(000�Rupiah),�2009�2013�Number� of� Decisions,� Arrears,� Target� and� Realization� of� Taxes� on� Land� and�Building�by�Regency/City�(000�Rupiahs),�2009�2013�
378�
11.1.10� Dana� Alokasi� Umum� (DAU)� dan� Dana� Alokasi� Khusus� Propinsi� Sulawesi� Tengah�dan�Kabupaten/Kota�Se�Sulawesi�Tengah,�Tahun�2012�2013�(Juta�Rupiah)�General�and�Special�Subsidies�in�Sulawesi�Tengah�Province�and�all�Regencies/City�of�Sulawesi�Tengah,�2012�2013�(million�rupiahs)�
379�
� �
11.2.�Perbankan/Banking� �11.2.1� Jumlah�Kantor�Bank�menurut�Kabupaten/Kota,�2013�
Number�of�Bank�Offices�by�Regency/City,�2013�380�
11.2.2� Posisi� Realisasi� Kredit� Perbankan� Bank� Pemerintah� menurut� Sektor� Ekonomi�(juta�rupiah),�2009�2013�Credit�Realization�of�State�Banks�Position�by�Economic�Sector� (million� rupiahs),�2009�2013�
381�
11.2.3� Posisi� Realisasi� Kredit� Perbankan� Bank� Swasta� menurut� Sektor� Ekonomi� (juta�rupiah),�2009�2013�Outstanding� Credit� Realization� � of� Private� National� Banks� by� Economic� Sector�(milion�rupiahs),�2009�2013�
382�
11.2.4� Posisi��Tabungan��Perbankan��menurut�Status�Bank�(juta�rupiah),�2009�2013�Outstanding�Saving�Deposits�by�Status�of�Banks�(million�rupiahs),�2009�2013�
383�
11.2.5� Posisi� Dana� Perbankan� Akhir� Tahun� di� Provinsi� Sulawesi� Tengah� (juta� rupiah),�2009�2013�Outstanding� Banks� Fund� in� Sulawesi� Tengah� Province� (million� rupiahs),� 2009�2013�
384�
http
://sul
teng
.bps
.go.
id

List Of Tables
Sulawesi Tengah in Figures 2014 xxxix
Halaman/�Page��
11.2.6� Perputaran� Kliring� Perbankan� di� Provinsi� Sulawesi� Tengah� (juta� rupiah),� 2009�2013�Clearing�Rotation�of�Bank� in�Sulawesi�Tengah�Province� (million� rupiahs),�2009�2013�
385�
11.2.7� Suku� Bunga� Deposito� Berjangka� 1� Bulan� menurut� Kelompok� Bank�(persen/tahun),�2009�2013�Time�Deposits� Interest� Rates� � for� 1�Month� by�Group� of� Banks� (percent/years),�2009�2013�
386�
11.2.8� Posisi� Deposito� Berjangka� Rupiah� dan� Valuta� Asing� Perbankan� (juta� rupiah),�2009�2013�Rupiah� and� Foreign� Exchange� Time� Deposits� Outstanding� of� Banks� (million�rupiahs),�2009�2013�
387�
11.2.9� Posisi� Kredit� Usaha� Kecil� (KUK)� menurut� Kelompok� Bank� (Juta� Rupiah),�2009�2013�Outstanding� Small� Scale� Business� Credits� by� Group� of� Bank� (million� rupiahs),�2009�2013�
388�
11.2.10� Posisi� Kredit� Usaha� Kecil� (KUK)� menurut� Kelompok� Bank� Sektor� Ekonomi� (Juta�Rupiah),�2007�2011�Outstanding� Small� Scale� Business� Credits� by� Group� of� Banks� and� Economics�Sectors�(million�rupiahs),�2007�2011�
390�
11.2.11� Rencana�dan�Realisasi�PMA�di�Sulawesi�Tengah�Tahun�2009�2013�Planning�and�Realization�of�Foreign�Investment�in�Sulawesi�Tengah,�2009�2013�
391�
11.2.12� Rencana�dan�Realisasi�PMA�di�Sulawesi�Tengah�Tahun�2009�2013�Planning�and�Realization�of�Foreign�Investment�in�Sulawesi�Tengah,�2009�2013�
392�
� � �11.3.�Asuransi�/�Insurance� �
11.3.1� Perkembangan�Perusahaan�Asuransi�Kerugian/Jasa,�2009�2013�Progress�of�Loss/Service�Insurance�Company,�2009�2013�
393�
11.3.2� Perkembangan�Jumlah�Peserta,�Pendapatan�Premi�dan�Pembayaran�Klaim�pada�PNS�dan�BUMN�di�Sulawesi�Tengah,�2009�2013�Progress�of�Total�Members,�Premium�Income,�Claim�Payment�of�Civil�Servant�nd�Stated�Owned�Corporation�in�Sulawesi�Tengah,�2007�2013�
394�
� �
11.4.�Koperasi�/�Cooperative� �11.4.1� Jumlah�Koperasi��menurut�Status�Koperasi�dan�Kabupaten/Kota,�2009�2013�
Number�of�Cooperatives�by�the�Status�and�Regency/City,�2009�2013�395�
11.4.2� Banyaknya� Koperasi� menurut� Status� Keaktifan� Koperasi� dan� Kabupaten/Kota,�2013�Number�of�Cooperatives�by�Being�Active�Status�and�Regency/City,�2013�
396�
http
://sul
teng
.bps
.go.
id

Daftar Tabel
xl Sulawesi Tengah Dalam Angka 2014
������Halaman/�Page��
11.4.3� Banyaknya�Koperasi�menurut�Jenis�Koperasi�dan�Kabupaten/Kota,�2009�2013�Number�of�Cooperatives�by�Kind�and�Regency/City,�2009�2013�
397�
11.4.4� Banyaknya�Anggota�Koperasi�menurut�Kabupaten/Kota,�2009�2013�Number�of�Cooperative�Members�by�Regency/City,�2009�2013�
402�
11.4.5� Volume�Usaha�Koperasi�menurut�Kabupaten/Kota,�2009�2013�(Juta�Rupiah)�Volume��of�Cooperative�Business�by�Regency/City,�2009�2013�(Million�Rupiah)�
403�
11.4.6� Jumlah� Sisa� Hasil� Usaha� Koperasi� menurut� Kabupaten/Kota,� 2009�2013� (Juta�Rupiah)�Number�of�Remaining�Cooperative�Business�Output�by�Regency/City,�2009�2013�(Million�Rupiah)�
404�
11.4.7� Jumlah� Modal� Usaha� Koperasi� menurut� Asal� Perolehan� dan� Kabupaten/Kota,�2013�(Juta�Rupiah)�Business� Capital� of� Cooperative� by� the� Capital� Acquisition� and� Regency/City,�2013�(Million�Rupiah)�
405�
11.4.8� Jumlah�Manajer,�Karyawan�dan�Rapat�Anggota�Tahunan�(RAT)�Koperasi�menurut�Kabupaten/Kota,�2013�Number� of� Managers,� Employees,� and� Annual� Membership� Meetings� of�Cooperative�by�Regency/City,�2013�
406�
� �
11.5.�Harga�Harga�/�Prices� �11.5.1� Rata�rata� Harga� Produsen� Tanaman� Palawija� menurut� Kabupaten/� Kota,�2009�
2013�(Rupiah/100�kg)�Average� Producer� Prices� of� Secondary� Food� Crop� by� Regency/City,� 2009�2013�(Rupiahs/100�kg)�
407�
11.5.2� Rata�rata� Harga� Produsen� Tanaman� Sayuran� menurut� Kabupaten/Kota,�2009�2013�(Rupiah/100�kg)�Average� Producer� Prices� of� Vegetable� Plant� By� Regency/City,� 2009�2013�(Rupiahs�/100�kg)�
408�
11.5.3� Rata�rata� Harga� Produsen� Tanaman� Buah�Buahan� menurut� Kabupaten/Kota,�2007�2011�Average�Producer�Prices�of�Fruits�Plant�By�Regency/City,�2009�2013�
410�
11.5.4� Rata�rata� Harga� Produsen� Tanaman� Perkebunan� Rakyat� menurut�Kabupaten/Kota,�2009�2013�Average�Producer�Prices�of�Smallholders�Estates�By�Regency/City,�2009�2013�
411�
11.5.5� Rata�Rata� Harga� Produsen� Peternakan� Besar� dan� Kecil� menurut� Ternak,�2009�2013��Average�Producer�Prices�of�Large�and�Small�Livestocks�by�Livestock,�2009�2013�
412�
� � �� � �� � �
http
://sul
teng
.bps
.go.
id

List Of Tables
Sulawesi Tengah in Figures 2014 xli
Halaman/�Page��
11.5.6� Rata�rata� Harga� Produsen� Hasil� Peternakan� dan� Perikanan� Laut� menurut�Komoditi,�2009�2013�Average�Producer�Prices�of�Livestock�Product�and�Marine�Fishery�by�Commodity,�2009�2013�
413�
11.5.7� Rata�Rata� Harga� Produsen� Obat�Obatan� dan� Pupuk� menurut� Jenisnya,�2009�2013��Average�Producer�Prices�of�Pesticide�and�Fertilizer�by�Types,�2009�2013�
414�
11.5.8� Indeks� Harga� yang� Diterima� dan� Dibayar� Petani� serta� Nilai� Tukar� Petani�Tanaman�Pangan�menurut�Bulan,�2013�Indices�of�Prices�Received�and�Paid�by�Farmers�and�Food�Crops�Farmers'� Term�Trade�by�Month,�2013�
415�
11.5.9� Indeks� Harga� yang� Diterima� dan� Dibayar� Petani� serta� Nilai� Tukar� Petani�Hortikultura�menurut�Bulan,�2013�Indices� of� Prices� Received� and� Paid� by� Farmers� and� � Farmers'� Term� Trade� by�Month,�2013�
416�
11.5.10� Indeks� Harga� yang� Diterima� dan� Dibayar� Petani� serta� Nilai� Tukar� Petani�Perkebunan�menurut�Bulan,�2013�Indices�of�Prices�Received�and�Paid�by�Farmers�and��Farmers'�Term�Trade�Planted�by�Month,�2013�
417�
11.5.11� Indeks� Harga� yang� Diterima� dan� Dibayar� Petani� serta� Nilai� Tukar� Petani�Peternakan�menurut�Bulan,�2013�Indices� of� Prices� Received� and� Paid� by� Farmers� and� � Farmers'� Term� Trade�Livestock�by�Month,�2013�
418�
11.5.12� Indeks� Harga� yang� Diterima� dan� Dibayar� Petani� serta� Nilai� Tukar� Petani�Perikanan��menurut�Bulan,�2013�Indices�of�Prices�Received�and�Paid�by�Farmers�and��Farmers'�Term�Trade�Fishery�by�Month,�2013�
419�
11.5.13� Indeks�Harga�yang�Diterima�dan�Dibayar�Petani�serta�Nilai�Tukar�Petani�menurut�Bulan,�2013�Indices� of� Prices� Received� and� Paid� by� Farmers� and� Farmers'� Term� Trade� by�Month,�2013�
420�
11.5.14� Rata�Rata� Indeks� Harga� Konsumen� (IHK)� Kota� Palu� menurut� Kelompok�Pengeluaran�Average�Consumer�Price�Indices�(CPI)�of�Palu�City�By�Consumption�Group��
421�
11.5.15� Inflasi�Kota�Palu�menurut�Tahun�Kelender,�2013�Inflation�of�Palu�City�by�Calendar�Year,�2013�
424�
11.5.16� Laju�Inflasi�Kota�Palu�menurut�Tahun�Kalender,�2009���2013�Inflation�Rate�of�Palu�City�by�Calendar�Year,�2009�–�2013�
426�
http
://sul
teng
.bps
.go.
id

Daftar Tabel
xlii Sulawesi Tengah Dalam Angka 2014
Halaman/�Page�12� KONSUMSI� DAN� PENGELUARAN� RUMAH� TANGGA/CONSUMPTION� AND�
EXPENDITURE�HOUSEHOLD��
� �12.1.�Pola�Konsumsi�Rumah�Tangga/Consumption�of�Households� �12.1.1� Rata�rata� Konsumsi� Kalori� per� Kapita� Sehari� menurut� Kelompok� Makanan,�
Tahun�2009���2013�(kalori)��Average�Daily�Consumption�of�Calorie�per�Capita�by�Food�Group,��2009���2013�(calorie)�
435�
12.1.2� Rata�rata�Konsumsi�Kalori�per�Kapita�Sehari�(dalam�kalori)�menurut�Kelompok�Makanan,�Tahun�2009���2013�Average�Daily�per�Capita�Consumption�of�Calorie�by�Food�Group,�2009���2013�(calorie)�
436�
12.1.3� Rata�rata�Konsumsi�Kalori�per�Kapita�Sehari�(dalam�kalori)�menurut�Kelompok�Barang,�Tahun�2009���2013�Average�Daily�per�Capita�Consumption�of�Calorie�by�Commodity�Group,�2009���2013�(calorie)�
437�
12.1.4� Rata�rata�Konsumsi�Protein�per�Kapita�Sehari�(dalam�gram)�menurut�Kelompok�Barang,�Tahun�2009���2013�Average�Daily�per�Capita�Consumption�of�Protein�by�Commodity�Group,�2009���2013�(�gram)�
438�
12.1.5� Rata�rata�Konsumsi�Protein�per�Kapita�Sehari�(dalam�gram)�menurut�Kelompok�Barang,�Tahun�2009���2013�Average�Daily�per�Capita�Consumption�of�Protein�by�Commodity�Group,�2009��2013(�gram)�
439�
12.1.6� Rata�rata�Konsumsi�Protein�per�Kapita�Sehari�(dalam�gram)�menurut�Kelompok�Barang,�Tahun�2009���2013�Average�Daily�per�Capita�Consumption�of�Protein�by�Commodity�Group,�2009���2013�(�gram)�
440�
� �12.2.�Pola�Pengeluaran�Rumah�Tangga�/�Expenditure�of�Households� �
12.2.1� Pengeluaran� Rata�rata� per� Kapita� Sebulan� untuk� Kelompok� Barang� Makanan�menurut�Status�Daerah�Kota�Tahun�2009���2013�Average� Monthly� per� Capita� Expenditure� by� Item� of� Food� Consumption� in�Urban�Areas,�2009���2013�
441�
12.2.2� Pengeluaran� Rata�rata� per� Kapita� Sebulan� untuk� Kelompok� Barang� Bukan�Makanan�menurut�Status�Daerah�Kota�Tahun�2009���2013�Average�Monthly� per� Capita� Expenditure� by� Non� Food� Commodity� Group� in�Urban�Areas,�2009���2013�
442�
http
://sul
teng
.bps
.go.
id

List Of Tables
Sulawesi Tengah in Figures 2014 xliii
Halaman/�Page�12.2.3� Pengeluaran� Rata�rata� per� Kapita� Sebulan� untuk� Kelompok� Barang� Makanan�
menurut�Status�Daerah�Perdesaan�Tahun�2009���2013�Average�Monthly�per�Capita�Expenditure�by�Item�of�Food�Consumption�in�Rural�Areas,�2009���2013�
443�
12.2.4� Pengeluaran� Rata�Rata� Perkapita� Sebulan� untuk� Kelompok� Barang� Bukan�Makanan�menurut�Status�Daerah�Perdesaan�Tahun�2009���2013�Average�Monthly�per�Capita�Expenditure�by�Item�of�Non�Food�Consumption�in�Rural�Areas,�2009���2013�
444�
12.2.5� Pengeluaran� Rata�rata� per� Kapita� Sebulan� untuk� Kelompok� Barang� Makanan�menurut�Status�Daerah�Kota�+�Perdesaan�Tahun�2009���2013�Average� Monthly� per� Capita� Expenditure� by� Item� of� Food� Consumption� in�Urban�+�Rural�Areas,�2009���2013�
445�
12.2.6� Pengeluaran� Rata�rata� per� Kapita� Sebulan� untuk� Kelompok� barang� Bukan�Makanan�menurut�Status�Daerah�Kota�+�Perdesaan�Tahun�2009�–2013�Average�Monthly�per�Capita�Expenditure�by�Item�of�Non�Food�Consumption�in�Urban�+�Rural�Areas,�2009���2013�
446�
12.2.7� Persentase� Penduduk� menurut� Kabupaten/Kota� dan� Pengeluaran� untuk�Makanan�per�Kapita�Sebulan,�2013�Percentage�of�Population�by�Regency/City�and�Monthly�per�Capita�Expenditure�of�Food�Consumption,�2013�
447�
12.2.8� Persentase� Penduduk� menurut� Kabupaten/Kota� dan� Pengeluaran� untuk� Non�Makanan�per�Kapita�Sebulan,�2013�Percentage�of�Population�by�Regency/City�and�Monthly�per�Capita�Expenditure�of�Non�Food�Consumption,�2013�
449�
12.2.9� Persentase�Penduduk�menurut�Kabupaten/Kota�Total�Pengeluaran�per�Kapita�Sebulan,�2013�Percentage� of� Population� by� Regency/City� and� Total� per� Capita� Monthly�Expenditure,�2013�
451�
�13.�PENDAPATAN�REGIONAL/REGIONAL�INCOME� �
13.1� Produk� Domestik� Regional� Bruto� Atas� Dasar� Harga� Berlaku� Menurut� Lapangan�Usaha,�2009���2013�(Juta�rupiah)�Gross�Regional�Domestic�Product�at�Current�Market�Prices�by� Industrial�Origin,�2009���2013�(Million�Rupiahs)�
465�
13.2� Produk� Domestik� Regional� Bruto� Atas� Dasar� Harga� Konstan� 2000� Menurut�Lapangan�Usaha,�2009���2013�(Juta�rupiah)�Gross�Regional�Domestic�Product�at�2000�Constant�Market�Prices� �by� Industrial�Origin,�2009���2013�(Million�Rupiahs)�
466�
�������
http
://sul
teng
.bps
.go.
id

Daftar Tabel
xliv Sulawesi Tengah Dalam Angka 2014
�Halaman/�Page
13.3� Laju� Pertumbuhan� Produk� Domestik� Regional� Bruto� Atas� Dasar� Harga� Berlaku�menurut�Lapangan�Usaha,�2009���2013�(Persen)�The�Growth�Rate�of�Gross�Regional�Domestic�Product�at�Current�Market�Prices�by�Industrial�Origin,�2009���2013�(Percent)�
467�
13.4� Laju�Pertumbuhan�Produk�Domestik�Regional�Bruto�Atas�Dasar�Harga�Konstan�2000�Menurut�Lapangan�Usaha�2009���2013�(Persen)�The�Growth�Rate�of�Gross�Regional�Domestic�Product�at�2000�Constant�Prices�by�Industrial�Origin,�2009���2013�(Percent)�
468�
13.5� Distribusi�Persentase�Produk�Domestik�Regional�Bruto�Atas�Dasar�Harga�Berlaku�Menurut�Lapangan�Usaha�2009���2013�(Persen)�Percentage�Distribution�of�Gross�Regional�Domestic� Product�at�Current�Market�Prices�by�Industrial�Origin�2009���2013,�(Percent)�
469�
13.6� Distribusi�Persentase�Produk�Domestik�Regional�Bruto�Atas�Dasar�Harga�Konstan�2000�Menurut�Lapangan�Usaha,�2009���2013�(Persen)�Percentage� Distribution� of� Gross� Regional� Domestic� Product� at� 2000� Constant�Prices�by�Industrial�Origin,�2009���2013,�(Percent)�
470�
13.7� Pendapatan� Agregat� dan� per� Kapita� Atas� Dasar� Harga� Berlaku� dan� Harga�Konstan�2000,�2009���2013�(Juta�rupiah)��Aggregate�and�per�Capita�Income�at�Current�and�2000�Constant�Market�Prices,�2009���2013�Million�Rupiahs)�
471�
13.8� Indeks� Harga� Implisit� Produk� Domestik� Regional� Bruto� Menurut� Lapangan�Usaha,�2009���2013�Implicit� Prices� Index� of� Gross� Regional� Domestic� Product� by� Industrial� Origin,�2009���2013�
472�
13.9� PDRB�Menurut�Penggunaan�Atas�Dasar�Harga�Berlaku,�2009���2013�(Juta�rupiah)�Expenditure�GRDP�at�Current�Market�Price,�2009���2013�(Million�Rupiahs)�
473�
13.10� PDRB�Menurut�Penggunaan�Atas�Dasar�Harga�Konstan�2000,�2009���2013� (Juta�rupiah)�Expenditure�GRDP�at�2000�Constant�Market�Price,�2009���2013�(Million�Rupiahs)�
474�
13.11� Distribusi�Persentase�PDRB�Penggunaan�atas�Dasar�Harga�Berlaku,�2009���2013�(Persen)��Percentage� Distribution� of� GRDP� at� Current� Market� Price� by� Expenditure�Components,�2009���2013�(Percent)�
475�
13.12� Distribusi� Persentase� PDRB� Penggunaan� atas� Dasar� Harga� Konstan� 2000,�2009���2013�(Persen)��Percentage�Distribution�of�GRDP�at�2000�Constant�Market�Price�by�Expenditure�Components,�2009���2013�(Percent)�
476�
������
http
://sul
teng
.bps
.go.
id

List Of Tables
Sulawesi Tengah in Figures 2014 xlv
Halaman/�Page13.13� Laju� Pertumbuhan� PDRB� Penggunaan� Atas� Dasar� Harga� Berlaku,� 2009� �� 2013�
(Persen)��The�Growth�Rate�of�GRDP�at�Current�Market�Price�by�Expenditure�Components,�2009���2013�(Percent)�
477�
13.14� Laju� Pertumbuhan� PDRB� Penggunaan� Atas� Dasar� Harga� Konstan� 2000,� 2009� ��2013�(Persen)��The� Growth� Rate� of� GRDP� at� 2000� Constant� Market� Prices� by� Expenditure�Components,�2009���2013�(Percent)�
478�
13.15� Produk� Domestik� Regional� Bruto� Atas� Dasar� Harga� Berlaku� menurut�Kabupaten/Kota,�2009���2013�(Juta�rupiah)�Gross� Regional� Domestic� Product� at� Current� Market� Prices� by� Regency/City,�2009���2013�(Million�Rupiahs)�
479�
13.16� Produk� Domestik� Regional� Bruto� Atas� Dasar� Harga� Konstan� 2000� Menurut�Kabupaten/Kota,�2009���2013�(Juta�rupiah)�Gross� Regional� Domestic� Product� at� 2000� Constant� � Prices� by� Regency/City,�2009���2013�(Million�Rupiahs)�
480�
13.17� Laju� Pertumbuhan� Produk� Domestik� Regional� Bruto� Atas� Dasar� Harga� Konstan�2000�Menurut�Kabupaten/Kota,�2009���2013�(Persen)�The�Growth�Rate�of�Gross�Regional�Domestic�Product�at�2000�Constant�Prices�by�Regency/City,�2009���2013�(Percent)�
481�
13.18� Distribusi� Persentase� Terhadap� Total� Produk� Domestik� Regional� Bruto� Seluruh�Kabupaten/Kota�Atas�Dasar�Harga�Berlaku,�2009���2013�(Persen)�Percentage� Distribution� of� Total� Gross� Regional� Domestic� Product� Throughout�Regency/City�at�Current�Market�Prices,�2009���2013�(Percent)�
482�
�14.�PERBANDINGAN�NASIONAL/�NATIONAL�COMPARISON�
14.1� Indeks�Harga�Konsumen�(IHK),�Inflasi/Deflasi,�Laju�Inflasi�dan�Peringkat�Inflasi�66�Kota�di�Indonesia,�Desember�2013�Consumer� Price� Index� (CPI),� Inflation/Deflation,� Inflation� Rate,� and� Rank� of�Inflation�Based�on�66�Cities�in�Indonesia,�December�2013�
487�
14.2� Jumlah� Penduduk� menurut� Provinsi� dan� Laju� Pertumbuhan� Penduduk� 1971,�1980,�1990,�2000�dan�2010�(000�Jiwa)�Population�by�Province�and�The�Population�Growth�Rate�1971,�1980,�1990,�2000�and�2010�(000�Persons)�
490�
14.3� Luas� Daratan� dan� Kepadatan� Penduduk� Menurut� Provinsi� di� Indonesia� Tahun�2010�Area�Land�And�Density�Population�in�Indonesia�,�2010�
491�
14.4� PDRB�Atas�Dasar�Harga�Berlaku�menurut�Provinsi�GDRP�by�Current�Price�by�Province�
493�
������
http
://sul
teng
.bps
.go.
id

Daftar Tabel
xlvi Sulawesi Tengah Dalam Angka 2014
�Halaman/�Page14.5� PDRB�Atas�Dasar�Harga�Konstan�2000�menurut�Provinsi�
GDRP�by�Constant�Price�2000�by�Province�495�
14.6� Jumlah� Penduduk� Miskin� dan� Persentasenya� menurut� Provinsi,� 2012�Number�and�Percentage�of�The�Poor�by�Province,�2013�
497�
14.7� Indeks�Pembangunan�Manusia�menurut�Provinsi,�2011�2012�Human�Development�Index�by�Province,�2011�2012�
500�
http
://sul
teng
.bps
.go.
id

List of Figures
Sulawesi Tengah in Figures 2014 xlvii
DAFTAR�GAMBAR�LIST�OF�FIGURES�
� Halaman/�Page�� �
� �� �
1.1.� PersentaseLuas�Wilayah�Sulawesi�Tengah�DirincimenurutKabupaten/Kota�Percentage�of�Sulawesi�Tengah�Province�Area�by�Regency/City�
5�
2.1.� Suhu�Udara�Minimum,�Maksimum,�dan�Rata�rata�Kota�Palu�Menurut�Bulan,�2013�Minimum,�Maximum,�and�Average�Temperature�in�Palu�City�by�Month,�2013�
15�
2.2.� Curah�Hujan�Kota�Palu�Menurut�Bulan,�2013�Rainfall�in�Palu�City�by�Month,�2013�
17�
3.1.� Persentase� Pemilih� Terdaftar� yang� Memilihdan� yang� Tidak� Memilihpada�PemiluLegislatif�(DPR)�2009�di�Sulawesi�Tengah�Percentage� of� Registered� Constituents� which� Used� and� Not� Use� Their� Right� on�Legislative�General�Election�(DPR)�2009�in�Sulawesi�Tengah�Province�
31�
4.1.� Piramida�Penduduk�Provinsi�Sulawesi�Tengah,�Tahun�2013�Population�Pyramid�of�Sulawesi�Tengah�Province,�2013�
61�
4.2.� PendudukBerusia�15�TahunKeatasmenurutJenisKegiatan,�Tahun�2013�Population�15�Years�of�Age��and�Over�by��Type�of�Activity,�2013�
63�
5.1.� Jumlah�Murid�Menurut�Jenis�Sekolah�2012/2013�Number�Pupils�by�Kind�of�School,�2012/2013�
97�
5.2.� BanyaknyaTenagaDoktermenurutJenisDokterdanKabupaten/Kota,�2013�Number�of�Doctors�by�Kind�of�Doctor�and�Regency/City,�2013�
99�
5.3.� PerkembanganKorban� KecelakaanLaluLintas� yang� TercatatpadaPolisi� Daerah�Sulawesi�Tengah,�2009�2013�Trend�of�The�Victims�Recorded�by�Regional�Police�of��Sulawesi�Tengah,�2009�2013�
101�
6.1.� Hasil�per�HektarPadi�(PadiSawah�+�PadiLadang),��2013�Yield�Field�of�Paddies�(Wet�and��Dry�land),�2013�
193�
6.2.� PopulasiTernakSapi�(�000�ekor)menurutKabupaten/Kota�2013�Population�Cows�(�000�tail)�by�Regency/City�2013�
195�
7.1.� JumlahPelangganListrikProvinsi�Sulawesi�Tengah,�2009�–�2013�Number�of�Electrical�Power�Customers�in�Sulawesi�Tengah�Province,�2009–2013�
273�
8.1.� PerkembanganNeracaPerdagangan,�2009�2013�(US$)�Trend�of�Trade�Balance,�2009�2013,�(US$)�
291�
http
://sul
teng
.bps
.go.
id

Daftar Gambar
xlviii Sulawesi Tengah Dalam Angka 2014
Halaman�/�Page�
9.1.� PanjangJalanmenurut�KondisiJalanPemerintah�yang�Berwenang,��2013�(km)�Lengthof� Roads� by� Condition� of� Roads� and� Level� of� Government� Responsibility,�2013�(km)�
313�
10.1.� Persentase�Tingkat�PenghunianKamar�Hotel�danAkomodasiLainnya,�2009�2013�Room�Occupancy�Rate�of�Hotel�and�OtherAccommodations,�2009�2013�
335�
10.2.� Jumlah�Hotel,�Kamar�dan�Tempat�Tidur�menurut�Kabupaten/Kota�dan�Jenis�Hotel,�2013�Number� of� Hotels,� Rooms,� dan� Beds� by� Regency/City� and� Hotel� Classsification,�2013�
337�
11.1.� PerkembanganLajuInflasiUmum,2004�–�2013�Trend�of�General�Inflation�Rate,�2004–2013�
357�
12.1� Persentase�Pengeluaran�Per�Kapita�menurut�Kelompok�Barang�Provinsi�Sulawesi�Tengah,�2009��2013�Percentage� Expenditure� Per� Capita� by� Commodity� Group� in� Sulawesi� Tengah�Province,�2009–2013�
431�
12.2.� Persentase� Penduduk� menurut� Kelompok� Pengeluaran� (Makanan� dan� Bukan�Makanan)�Per�Kapita�Sebulan,�2013�Population�Percentage�of�Sulawesi�Tengah�By�Expenditure�Group�(Food�and�Non�Food)�Per�Capita/Month,�2013�
433�
13.1.� Distribusi� Persentase� PDRB� Atas� Dasar� Harga� Berlaku� Provinsi� Sulawesi� Tengah,�2013�Percentage� Distribution� of� Sulawesi� Tengah� Province� GRDP� at� Current� Market�Prices,�2013�
463�
http
://sul
teng
.bps
.go.
id

Penjelasan Umum
Sulawesi Tengah in Figures 2014 xlix
PENJELASAN UMUM Tanda-tanda, satuan-satuan dan lain-lainnya yang digunakan dalam publikasi adalah sebagai berikut:
1. TANDA -TANDA Data tidak/belum tersedia.................. : ... Data dapat diabaikan : - Tanda Desimal................................. : , Angka Sementara............................ : *) Angka Sangat Sementara ............. : **) Angka Diperbaiki.............................. : r) Angka Perkiraan............................... : e)
2. SATUAN bal....................................... : 1250 m3 = 180 kg. barrel.................................... : 158,99 Liter = 1/6,2898 m3 bata (untuk garam)........................ : 500 gram. batang (untuk sabun).................... : 400 gram. botol..................................... : 700 cc kilometer (km)............................ : 1000 meter (m). kwintal (kw).............................. : 100 kg. liter (untuk beras)....................... : 0,80 kg. long ton.................................. : 1016,50 kg. lusin..................................... : 12 meter cubic feet(mcl)...................... : 1/35,3 m3 metric ton (m.ton)........................ : 0,98421 long ton = 1000 kg. once (oz).................................. : 28,31 gram. pound (lb)................................ : 0,454 kg. ton....................................... : 1000 kg. sak (untuk semen)......................... : 40 kg atau 50 kg. knots..................................... : 1,8 km/jam satuan lain : buah, bungkus, butir, helai/lembar, kaleng, batang, pulsa, ton kilometer(ton-km), jam, menit, persen (%).
3. LAIN - LAIN.
F.O.B. = (Free on board) = Harga ekspor sampai ke pelabuhan muat. C.I.F. = (Cost,insurance and freight) = Harga impor sampai ke pelabuhan masuk. M.T.O.W. = (Maximum Take Off Weights) = Kemampuan berat maksimum suatu pesawat
untuk dapat terbang. D.W.T. = (Dead Weights Ton) = BobotMati. B.R.T. = Bruto Registered Ton
http
://sul
teng
.bps
.go.
id

Explanatory Notes SULAWESI TENGAH IN FIGURES 2013
l Sulawesi Tengah In Figures 2014
EXPLANATORY NOTES
Symbols, units, and others which are used in this publication, are as follow:
1. SYMBOLS
Data not or not yet available..................... : ... Data negligible ........................................ : - Decimal point............................................ : , Preliminary figures.................................... : *) Very Preliminary figures........................... : **) Revised figures........................................... : r) Estimated figures........................................ : e)
2. U N I T S
bales..................................... : 1250 m3 = 180 kg barrel.................................... : 158,99 Liter = 1/6,2898 m3
briquette (for salt)...................... : 500 gram piece (a bar for soap).................... : 400 gram bottle.................................... : 700 cc kilometers (Km)........................... : 1000 meter (m) quintal.............................. : 100 kg liter (for rice )......................... : 0,80 kg long ton.................................. : 1016,50 kg dozen..................................... : 12 metercubic feet(mcl)...................... : 1/35,3 m3.
metric ton (m.ton)........................ : 0,98421 long ton = 1000 kg once(oz).................................. : 28,31 gram pound (lb)................................ : 0,454 kg ton ...................................... : 1000 kg sack (for cement).......................... : 40 kg or 50 kg knots..................................... : 1,8 km/ our other units : unit, pack, number, pieces, tin, pulls, ton-kilometers (ton-km), hour, minute,percent (%).
3. O T H E R S
F.O.B. = Free on board C.I.F. = Cost,insurance and freight M.T.O.W. = Maximum Take Off Weights D.W.T. = Dead Weights Ton G.R.T. = Gross Registered Ton
http
://sul
teng
.bps
.go.
id
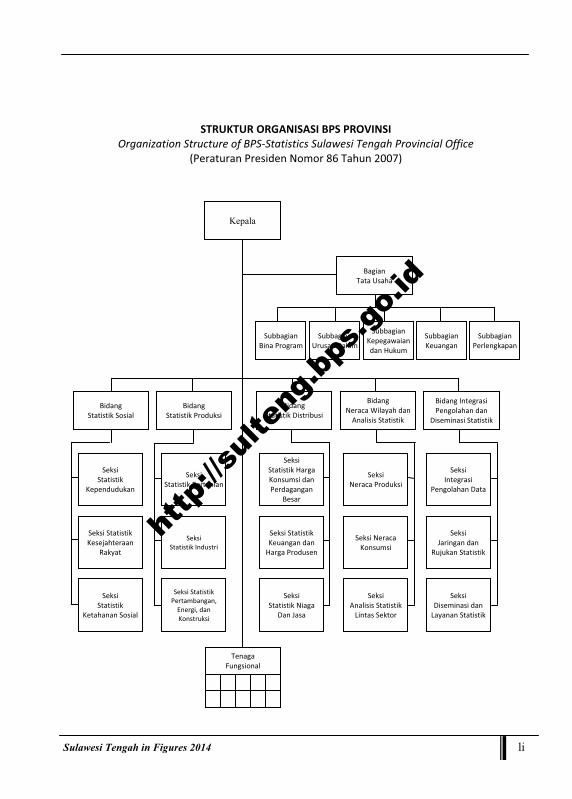
Sulawesi Tengah in Figures 2014 li
STRUKTUR�ORGANISASI�BPS�PROVINSI�Organization�Structure�of�BPS�Statistics�Sulawesi�Tengah�Provincial�Office�
(Peraturan�Presiden�Nomor�86�Tahun�2007)��
Subbagian�Bina�Program
Subbagian�Urusan�Dalam
Subbagian�Kepegawaiandan�Hukum�
Subbagian�Keuangan�
Subbagian�Perlengkapan�
Bagian�Tata�Usaha�
Kepala
Bidang�Statistik�Sosial�
Bidang�Statistik�Produksi�
Bidang�Statistik�Distribusi�
Bidang�Neraca�Wilayah�dan�
Analisis�Statistik�
Bidang�Integrasi�Pengolahan�dan�
Diseminasi�Statistik�
Seksi�Statistik�
Kependudukan�
Seksi�Statistik�Kesejahteraan�
Rakyat�
Seksi�Statistik�
Ketahanan�Sosial�
Seksi�Statistik�Pertanian
Seksi�Statistik�Industri�
Seksi�Statistik�Pertambangan,�
Energi,�dan�Konstruksi�
Seksi�Statistik�Harga�Konsumsi�dan�Perdagangan�
Besar�
Seksi�Statistik�Keuangan�dan�
Harga�Produsen�
Seksi�Statistik�Niaga�
Dan�Jasa�
Seksi�Neraca�Produksi�
Seksi�Neraca�Konsumsi�
Seksi�Analisis�Statistik�
Lintas�Sektor�
Seksi�Integrasi�
Pengolahan�Data�
Seksi�Jaringan�dan�
Rujukan�Statistik�
Seksi�Diseminasi�dan�
Layanan�Statistik�
Tenaga�Fungsional�
http
://sul
teng
.bps
.go.
id

lii Sulawesi Tengah Dalam Angka 2014
http
://sul
teng
.bps
.go.
id

Sulawesi Tengah in Figures 2014 liii
STRUKTUR�ORGANISASI�BPS�Organization�Structure�of�BPS�Statistics�Indonesia�
Peraturan�Presiden�Nomor�86�Tahun�2007
Biro�Bina�Program�
Biro�Kepegawaian
Biro�Keuangan�
Biro�Humas�dan�Hukum�
Biro�Umum�
Deputi�Bidang�Metodologi�dan�
Informasi�Statistik�
Pusat�Pendidikan�dan�Pelatihan�
Sekretariat�Utama�
Kepala�
Deputi�Bidang�Statistik�Sosial�
Deputi�Bidang�Statistik�Produksi
Deputi�Bidang�Statistik�
Distribusi�&�Jasa�
Deputi�Bidang�Neraca�dan�
Analisis�Statistik�
Inspektur�Utama�
Direktorat�Metodologi�&�
Informasi�Statistik�
Direktorat�Diseminasi�
Statistik�
Direktorat�Sistem�Informasi�
Statistik�
Direktorat�Statistik�Kependudukan�&�Ketenagakerjaan�
Direktorat�Statistik�
Kesejahteraan�Rakyat�
Direktorat�Statistik�
Ketahanan�Sosial�
Direktorat�Statistik�TP.�Hort
&�Perkebunan�
Direktorat�StatistikPeternakan�Perikanan�
&�Kehutanan�
Direktorat�Statistik�Industri�
Direktorat�Statistik�Distribusi
Direktorat�Statistik�Harga�
Direktorat�Statistik�Keuangan
TI�&�Pariwisata�
Direktorat�Neraca�Produksi�
Direktorat�Neraca�
Pengeluaran�
Direktorat�Analisis�&�Pengembangan
Statistik�
Inspektorat�Wilayah�I�
Inspektorat�Wilayah�II�
Inspektorat�Wilayah�III�
http
://sul
teng
.bps
.go.
id

liv Sulawesi Tengah Dalam Angka 2014
http
://sul
teng
.bps
.go.
id

History
Sulawesi Tengah in Figures 2014 lv
Sejarah�Singkat�Sulawesi�Tengah
�
�
Sulawesi� Tengah� merupakan� provinsi�
terbesar� di� pulau� Sulawesi,� dengan� luas�
wilayah� daratan� 61.841,29 km2� (Berdasarkan�
Peraturan�Menteri�Dalam��Negeri�No.�18�tahun�
2013)� yang� � mencakup� semenanjung� bagian�
timur�dan�sebagian�semenanjung�bagian�utara�
serta� kepulauan� Togean� di� Teluk� Tomini� dan�
Kepulauan� Banggai� di� TelukTolo,� dengan� luas�
wilayah�adalah�189.480�km2.�
�
�
Sulawesi� Tengah� � yang� terletak� di�
bagian� barat� kepulauan� Maluku� dan� bagian�
selatan� Philipina� membuat� pelabuhan� di�
daerah� ini� sebagai� persinggahan� kapal�kapal�
Portugis�dan�Spanyol�lebih�dari�500�tahun�yang�
lampau.� Dalam� perjalanannya� mengelilingi�
dunia� Francis� Drake,� dengan� kapalnya� "The�
Golden�Hind"�singgah�di�salah�satu�pulau�kecil�
di� pantai� timur� propinsi� ini� selamasebulan�
padabulan� Januari� 1580.� Meskipun� tidak�
adacatatan� sejarah,� kemungkinan� besar�
pelaut�pelaut�Portugal�dan�Spanyol�menginjak�
kakinya� di� negeri� ini� yang� terbukti� dengan�
Brief�History�of�Sulawesi�Tengah�
�
�
Sulawesi� Tengah� is� the� largest�
province�in�Sulawesi�Island,�covering�a�land�
area� of� � 61.841,29� square� kilometers�
(Based� on� Home� Affairs� Ministerial�
Regulation�No.18/2013)�which�includes�the�
eastern� peninsula� and� a� part� of� the� long�
northern� peninsula,� including� the� island�
group� of� Togean� in� the� Tomini� Bay� and�
Banggai�Island�in�Tolo�Bay�with�the�area�by�
189,480�square�kilometers.�
�
Sulawesi� Tengah� is� located� in� the�
west� of�Maluku� archipelago,� and� south� of�
the� Philippines,� apparently�made� the� local�
ports� as� a� transit� point� for� ships� of� the�
Portuguese�and�the�Spanish�more�than�500�
years�ago.�It�was�on�the�route�of�Sir�Francis�
Drake's� voyage� round� the� world� in� his�
galleon�"The�Golden�Hind"�when�in�January�
1580,�he�spent�a�month�on�one�of�the�small�
island� of� the� eastern� coast.� Though� there�
are� no� records,� there� is� a� possibility� of�
Spanish� or� Portuguese� encroachment� in�
this� part� of� the� island� as� vestiges� of�
http
://sul
teng
.bps
.go.
id

Sejarah
lvi Sulawesi Tengah Dalam Angka 2014
masih� ada� pengaruh� Eropa� terhadap bentuk
pakaian�masyarakat�hinggadewasa�ini.�
�
Setelah� dikuasai� oleh� Belanda� pada�
tahun� 1905� Sulawesi� Tengah� dibagi� menjadi�
beberapa� Kerajaan� kecil,� dibawah� kekuasaan�
Raja�yang�memiliki�wewenang�penuh.��
Belanda� membagi� Sulawesi� Tengah�
menjadi� tiga� daerah� yaitu� wilayah� barat� yang�
kini� dikenal� dengan� kabupaten� Donggala� dan�
Buol� Tolitoli� dibawah� kekuasaan� Gubernur�
yang� berkedudukan� di� Ujung� Pandang.� Di�
bagian� tengah� yang� membujur� di� Donggala�
kawasan� timur� dan� bagian� selatan� Poso�
berada� dibawah� pengawasan� Residen� di�
Menado,� bagian� timur� dikendalikan� dari�
Baubau.�
�
�
�
Pada�tahun�1919�Raja�raja�yang�masih�
berkuasa� dibawah� kekuasaan� Belanda�
menandatangani�suatuperjanjian�yang�disebut�
"KorteVerklaringRenewcame"� memperbaharui�
persekutuan� mereka� dan� seluruh� daerah�
Sulawesi� Tengah� dibawah� kekuasaan� residen�
di�Sulawesi�Utara.�
European� influence� on� the� population's�
mode�of�dress�remain�till�today.�
�
After� conquest� of� the� Dutch� in�
Sulawesi�Tengah,�1905,� it�was�divided� into�
small�kingdoms�ruled�by�kings�who�had�full�
authority.��
The�Dutch�divided�Sulawesi�Tengah�
into�three�parts.�The�western�part�of�what�
is�now�Donggala�Regency�and�Buol�Tolitoli�
came� under� the� rule� of� the� governor� of�
Sulawesi,�then�residing�in�Makassar�(Ujung�
Pandang).� The� Central� part� comprising� of�
eastern�Donggala�and�the�northern�part�of�
Poso�came�under�the�administration�of�the�
residence�of�North�Sulawesi�in�Menado.�the�
eastern�part,�Poso�and�Banggai,� fell� under�
control� of� East� Sulawesi,� then�
administration�from�Baubau.�
�
In� 1919,� the� kings� who� had�
continued� to� reign� under� Dutch� tutelage�
signed� an� agreement� “� KorteVerklaring� “�
renewing� their� allegiance� and� the� whole�
area� of� Central� Sulawesi� came� under� the�
administration� of� the� residence� of� North�
Sulawesi.�
http
://sul
teng
.bps
.go.
id

History
Sulawesi Tengah in Figures 2014 lvii
Setelah perang� dunia� kedua wilayah�
yang� merupakan� propinsi� Sulawesi� Tengah�
dewasa� ini� dibagi� menjadi� beberapa� bagian�
dan� sub� bagian� hingga� pada� tahun� 1964�
terbentuk� menjadi� propinsi� tersendiri� yang�
terpisah� dari� Sulawesi� Utara� yang� bergabung�
sejak�1960.��
�
Akhirnya� tanggal� 13� April� 1964�
diangkatlah�Gubernur�tersendiri�untuk�provinsi�
ini�yang�hingga�saat� ini� tanggal�tersebut�tetap�
diperingati� sebagai� hari� ulang� tahun� provinsi�
ini.� Wilayahnya� meliputi� :� Kabupaten� Poso,�
Kabupaten� Donggala,� Kabupaten� Banggai� dan�
Kabupaten�Buol�Tolitoli.�
After�World�War�II,� the�area�of�the�
present� province� of� Sulawesi� Tengah�
underwent� several� divisions� and� sub�
divisions�until�it�was�declared�a�province�in�
1964,� separating� from� North� Sulawesi� to�
which�it�had�been�bound�since�1960.�
�
�
�Finally,� established� in� April� 13,� 1964,�
Sulawesi� Tengah� had� its� own� governor.�
Today,� this� date� is� celebrated� as� the�
province’s� anniversary.� With� its� region�
covered:Poso�Regency,�Donggala�Regency,�
Banggai�Regency�and�Buol�Tolitoli�Regency��
http
://sul
teng
.bps
.go.
id

Sejarah
lviii Sulawesi Tengah Dalam Angka 2014
http
://sul
teng
.bps
.go.
id

Geographical Situation
Sulawesi Tengah in Figures 2014 1
KEADAAN GEOGRAFIGeographical Situationht
tp://s
ulte
ng.b
ps.g
o.id

Keadaan Geografi
2 Sulawesi Tengah Dalam Angka 2014
bo050876
http
://sul
teng
.bps
.go.
id

Geographical Situation
Sulawesi Tengah in Figures 2014 3
1. KEADAAN�GEOGRAFI��Sulawesi� Tengah� merupakan� dataran�
rendah� dengan� ketinggian� rata�rata� +� 84�meter�diatas�permukaan�laut,�terletak�pada�posisi�2o22'�Lintang�Utara�dan�3o48'�Lintang�Selatan,� serta� 119o22'� dan� 124o22'� � bujur�Timur.� Luas� wilayah� Sulawesi� Tengah,�adalah� � berupa� daratan� seluas� 61.841,29�km2.��
�Akhir� tahun�2013,�wilayah�administrasi�
Provinsi� Sulawesi� Tengah� terdiri� dari� 12�wilayah� kabupaten� dan� satu� kota,�berdasarkan� Peraturan� Menteri� Dalam�Negeri� no.� 18� tahun� 2013� luas� daratan�masing�masing� kabupaten/kota,� yaitu:�Banggai�Kepulauan�(2.448,79�km2),�Banggai�(9.672,70� km2),� Morowali� (3.037,04� km2),�Poso� (7.112,25� km2),� Donggala� (4.275,08�km2),�Tolitoli�(4.079,77�km2),�Buol�(4.043,57�km2),� Parigi� Moutong� (5.089.91� km2),� Tojo�Una� Una� (5.721,15� km2),� Sigi� (5.196,02�km2),�Banggai�Laut�(725,67�km2),�Morowali�Utara� (10.004,28� km2)� serta� Kota� Palu�(395,06�km2).�
��
Berdasarkan� elevasi� (ketinggian� dari�permukaan� laut),� dataran� di� Provinsi�Sulawesi�Tengah�terdiri�dari:�����������������������������0�m������100�m� =���20,2�%�01�m�����500�m� =��27,2�%��������������501�m��1000�m� =��26,7�%��������������
1. GEOGRAPHICAL��SITUATION��Sulawesi� Tengah� is� an� area� with�
average� high� around� 84� meters� of� sea�surface,� it� is� located� between� 2o22’�north� latitude� and3o48’� south�latitude,119o22’� and124o22’� east�longitude.� Sulawesi� Tengah� Province�area�is�shaped�in�landby�61,841.29�km2.�
��
In�2013,�Sulawesi�Tengah�is�divided�into� twelve� regencies� and� one� city,�based� on� home� affairs� regulatioan� no�18/2013� the� land� area� of� each�regency/city� is� Banggai� Kepulauan�(2,448.79�km2),�Banggai�(9,672.70�km2),�Morowali� (3,037.04� km2),� Poso�(7,112.25� km2),� Donggala� (4,275.08�km2),� Tolitoli� (4,079.77� km2),� Buol�(4,043.57� km2),� Parigi� Moutong�(5,089.91�km2),�Tojo�Una�Una�(5,721.51�km2),� Sigi� (5,196.02� km2),� Banggai� Laut�(725,67� km2),� Morowali� Utara�(10,004.28� km2)�and�395.06�km2of�Palu�City.�
��Based� on� elevation� (high� of� sea�
surface),� land� in� Sulawesi� Tengah�Province��consists�of:��������������� 0��m��100�m� =� 20.2�%������������������� 101��m�500�m� =� 27.2�%������������������� 501��m�1000�m� =� 26.7�%������������������
http
://sul
teng
.bps
.go.
id

Keadaan Geografi
4 Sulawesi Tengah Dalam Angka 2014
1.001�m�keatas� =��25,9�%���Jarak� antara� Ibukota� Provinsi� ke�
Daerah�Kabupaten/Kota:��1. Palu���Banggai�Kepulauan:� 607� km�+���
��������������������������������������������������46�mil.�2. Palu���Banggai� :� 607� km.�3. Palu���Morowali�� :� 518� km.�4. Palu���Poso��������� :� 221� km.�5. Palu���Donggala�� :� 34� km.�6. Palu���Parigi�Moutong��������:� 84� km.�7. Palu���Tolitoli� :� 434� km.�8. Palu���Buol�������� :� 383� km.�9. Palu���Tojo�Una�Una� :� 377� km.�10. Palu���Sigi� :�� 30� km�11. Palu���Banggai�Laut� :��607� km+�
��������������������������������������������������94�mil�12. Palu���Morowali�Utara� :��431� km�
�Wilayah� Provinsi� Sulawesi� Tengah�
bagian� utara� berbatasan� dengan� Laut�Sulawesi� dan� Provinsi� Gorontalo,� bagian�timur� berbatasan� dengan� Provinsi� Maluku,�bagian�selatan�berbatasan�dengan�Provinsi�Sulawesi�Barat�dan�Sulawesi�Tenggara,�dan�bagian� barat� berbatasan� dengan� Selat�Makasar.�
1,001��m��and�over� =� 25.9�%���
Distancebetween�ProvinceCapital�to�Regencies/City:��1. Palu���Banggai�Kepulauan:�607� km��
���������������������������������������������+��46�mile.�2. Palu���Banggai� :� 607� km.�3. Palu���Morowali�� :� 518� km.�4. Palu���Poso��������� :� 221� km.�5. Palu���Donggala�� :� 34� km.�6. Palu���Parigi�Moutong������:� 84� km.�7. Palu���Tolitoli� :� 434� km.�8. Palu���Buol�������� :� 383� km.�9. Palu���Tojo�Una�Una� :� 377� km.�10. Palu���Sigi� :�� 30� km.�11. Palu���Banggai�Laut� :�607���km.��
����������������������������������������������+�94�mile.�12. Palu���Morowali�Utara� :��431� km.��
Territorial� Boundaries� of�Sulawesi� Tengah� Province� in� nothern�area� bordered� by� Sulawesi� Sea� and�Gorontalo�Province,�eastern�area�border�on� Maluku� Province,� southern� area�border� on� Sulawesi� Barat� Province� and�Sulawesi� Tenggara,� and� western� area�bordered�by�Makassar�strait.�
http
://sul
teng
.bps
.go.
id

Sul
G
4
lawesi Tengah in
Gambar�
Figure� 1.1
4.
Tolitoli;�4.079,77 Km2
Buol;4.043,57 Km2
Parimo;�5.089,91 Km2
Toj5.7
n Figures 2014
�PersentasKabupatePercentag
Donggala.275,08 Km2
2
jo�Una�Una721,15 Km2
se� Luas� Wilaen/Kota�ge�of�Sulawes
20
Poso7.112,25 Km2
5.19
ayah� Sulawes
si�Tengah�Prov
013
Sigi96,02 Km2
G
si� Tengah� Di
vince�Area�by�
Morowali3.037,04 Km2
Banggai�Laut725,67 Km2
Mo10
Geographical Situ
irinci� menuru
Regency/City�
BanggaKepulau
2.488,79
Banggai9.672,70 Km
orowali�Utara0.004,28 Km2
Palu395,06 Km
uation
5
ut�
ai�uanKm2
m2
m2
http
://sul
teng
.bps
.go.
id

Keadaan Geografi
6 Sulawesi Tengah Dalam Angka 2014
http
://sul
teng
.bps
.go.
id

Geographical Situation
Sulawesi Tengah in Figures 2014 7
1. KEADAAN�GEOGRAFI�� GEOGRAPHICAL�SITUATION�� ��Tabel�
Table� � 1.1�Luas�Daerah�dan�Pembagian�Daerah�Administrasi�menurut�Kabupaten/Kota,�2013�The�Total�Area�and�Number�of�Administrative�Units��by�Regency/City,2013�
��
Sumber/Source�:Badan�Pemberdayaan�Masyarakat�dan�Pemerintah�Desa�Daerah�Provinsi�Sulawesi�Tengah��� � ���������Community�Empowerment�and�Village�Government�Services�Of�Sulawesi�Tengah�Province�Catatan/Note��:�1)�Berdasarkan�Peraturan�Menteri�Dalam��Negeri�No.�18�tahun�2013�� � ����������Based�on�Home�Affairs�Ministerial�Regulation�No.18/2013��
Kabupaten/Kota�Regency/City�
Luas��Area�
(km2)1)�
�Banyaknya�Kecamatan�Number�of�subdistricts�
�
BanyaknyaDesa�
Number�of�villages�
Banyaknya�Kelurahan�Number�of�urban�
Jumlah�Desa�dan�Kelurahan�
Total�villages�and�
urban��(1)� (2)� (3)� (4)� (5)� (6)�
� � �01.� Banggai�Kepulauan� 2�488,79 12� 141� 3� 144�
02.� Banggai� 9�672,70 23� 291� 46� 337�
03.� Morowali� 3�037,04 9� 122� 7� 129�
04.� Poso� 7�112,25 19� 134� 23� 157�
05.� Donggala� 4�275,08 16� 157� 9� 166�
06.� Tolitoli� 4�079,77 10� 98� 6� 104�
07.� Buol� 4�043,57 11� 108� 7� 115�
08.� Parigi�Moutong� 5�089,91 23� 252� 5� 257�
09.� Tojo�Una�Una� 5�721,15 9� 132� 12� 144�
10.� Sigi�� 5�196,02 15� 155� 0� 155�
11.��Banggai�Laut� �725,67 7� 63� 3� 66�
12.��Morowali�Utara� 10�004,28 9� 122� 3� 125�
13.� Palu� �395,06 8� 0� 45� 45�� �
Jumlah/Total� 61�841,29 171� 1�775� 169� 1�944�
http
://sul
teng
.bps
.go.
id

Keadaan Geografi
8 Sulawesi Tengah Dalam Angka 2014
�
Kabupaten/Kota�Regency/City�
�
Nama�Ibukota�Kabupaten/Kota�
Regency/City�Capital�
Jarak�ke�Ibukota�Provinsi*)�
Distance�to�Province�Capital�(Km)�
Keterangan�Explanation�
(1)� (2)� (3)� �
01.� Banggai�Kepulauan� Salakan�607�+��
46�mil/mile�Darat/Road�+�
Laut/Sea�
02.� Banggai� Luwuk� 607�� Darat/Road�
03.� Morowali� Bungku� 518�� Darat/Road�
04.� Poso� Poso�Kota� 221�� Darat/Road�
05.� Donggala� Banawa� 34�� Darat/Road�
06.� Tolitoli� Baolan� 434�� Darat/Road�
07.� Buol� Lipunoto� 383�� Darat/Road�
08.� Parigi�Moutong� Parigi� 84�� Darat/Road�
09.� Tojo�Una�Una� Ampana� 377�� Darat/Road�
10.� Sigi� Bora� 30�� Darat/Road�
11.���� Banggai�Laut� Banggai�607�+��
94�mil/mile�Darat/Road�+�
Laut/Sea�
12.� Morowali�Utara� Kolonodale� 431�� Darat/Road�
13.� Palu� Palu� 0� ��
Sumber/Source� :� Dinas�Perhubungan�Daerah�Provinsi�Sulawesi�Tengah��� � Transportation�Regional�Service�of��Sulawesi�Tengah�Province
Tabel�
Table� � 1.2�Jarak� antara� Ibukota� Kabupaten/Kota� dengan� Ibukota� Provinsi�menurut�Kabupaten/Kota�Distances� between� Regency/City� Capital� to� Province� Capital� by�Regency/City�
http
://sul
teng
.bps
.go.
id

Geographical Situation
Sulawesi Tengah in Figures 2014 9
Tabel�
Table� � 1.3�Nama� Sungai� Terpanjang� dan� Luas� Daerah� Alirannya� menurut�Kabupaten/Kota�Nameand�AreaRegion's�Longest�Riverflow�isaccording�tothe�Regency/City��
�
Kabupaten/Kota�Regency/City�
Nama�Sungai�Name�of�River�
Panjang�Length�(Km)�
Luas�Daerah�Alirannya�
River’s�Basin�Area�(ha)�
(1)� (2)� (3)� (4)�
01.� Banggai�Kepulauan� �� �� ��
02.� Banggai� Minahaki� 382,50� 67�875�
03.� Morowali� Tambalako� 717,25� 174�300�
04.� Poso� Poso� 487,75� 96�000�
05.� Donggala� Surumana� 162,50� 26�600�
06.� Tolitoli� M�a�r�a�j�a� 440,25� 136�350�
07.� Buol� Buol� 454,00� 166�250�
08.� Parigi�Moutong� P�a�l�a�s�a� 177,50� 46�550�
09.� Tojo�Una�Una� Bongka� 1�053,00� 327�500�
10.� Sigi� �� �� ��
11.� Banggai�Laut� �� �� ��
12.� Morowali�Utara� ...� ...� ...�
13.� Palu� Palu� 834,75� 312�500�
� � � �
Sumber/Source� :� Kanwil�Badan�Pertanahan�Nasional�ProvinsiSulawesi�Tengah�Regional�Office�ofNationalLand�BoardofSulawesi�Tengah�Province�
http
://sul
teng
.bps
.go.
id

Keadaan Geografi
10 Sulawesi Tengah Dalam Angka 2014
Tabel�Table� � 1.4�
Nama�Gunung�Tertinggi�menurut�Kabupaten/Kota�Highest�Mountaininthe�name�ofby�Regency/City�
�
Kabupaten/Kota�Regency/City�
Gunung�Mount�
Ketinggian�Height�(m)�
Lokasi�Kecamatan�Subdistrict�Location�
(1)� (2)� (3)� (4)�
01.� Banggai�Kepulauan� �� �� ��
02.� Banggai� Bulutumpu� 2401� Pagimana�
03.� Morowali� ...� ...� ...�
04.� Poso� M��a��o� 2552� Poso�Pesisir�
05.� Donggala� Ogoamas� 2535� Sojol�Utara�
06.� Tolitoli� Kalangkangan� 2432� Galang�
07.� Buol� Timbulon� 2�320� P�a�l�e�l�e�h�
08.� Parigi�Moutong� Malino� 2�443� Moutong�
09.� Tojo�Una�Una� Katopasa� 2�835� T�o�j�o�
10.� Sigi� Nokilalaki� 3�311� Kulawi�
11.� Banggai�Laut� �� �� ��
12.� Morowali�Utara� Kajoga� 2563� Mori�Atas�
11.� Palu� �� �� ��
� � � � �
Sumber/Source� :� Kanwil�Badan�Pertanahan�Nasional�Provinsi�Sulawesi�Tengah�Regional�Office�of�NationalLand�Boardof�SulawesiTengahProvince�
http
://sul
teng
.bps
.go.
id

Climate
Sulawesi Tengah in Figures 2014 11
KEADAAN IKLIMClimate
http
://sul
teng
.bps
.go.
id

Keadaan Iklim
12 Sulawesi Tengah Dalam Angka 2014
http
://sul
teng
.bps
.go.
id

Climate
Sulawesi Tengah in Figures 2014 13
2.� KEADAAN�IKLIM��
Kota� Palu� agak� berbeda� dengan�daerah� di� Indonesia� umumnya,� selama�tahun� 2013� hanya� terjadi� musim� hujan.�Namun�musim�hujan�ini�dapat�digolongkan�menjadi� 3� jenis� berdasarkan� frekuensi�curah� hujan,� yaitu� tinggi,� sedang,� dan�rendah.� Curah� hujan� tinggi� terjadi� pada�bulan�November�sekitar�152,0�mm,�sedang�pada� bulan� April� sekitar� 58,5� mm� dan�rendah� pada� bulan� Februari� sekitar� 28.0�mm.��
�Sepanjang� tahun� 2013,� suhu� udara�
rata�rata� terendah� yaitu� 26,60C� terjadi�pada�bulan�Juli�dan�September,�sedangkan�tertinggi�sebesar�28,50C�pada�bulan�Maret.�Arah� angin� terbanyak� selama� tahun� 2013�yaitu� dari� posisi� Barat� Laut,� dengan�kecepatan�rata�rata�3,6�knots.��
�Selama� tahun� 2013� kelembaban�
udara� di� Kota� Palu� tertinggi� terjadi� pada�bulan� Juli� sebesar� 80,8� persen,� dan�terendah� 73,1� persen� pada� bulan� Maret.�Sementara�penyinaran�matahari�terbanyak�pada� bulan� Maret� yaitu� 69,1� persen,� dan�terendah�Desember�sebesar�50,6�persen.�
��
2. CLIMATE�
Palu� City� is� slightly� different� of�Cities/Regencies� in� Indonesia�generally,�all� along�2013�was�only�occurred� rainy�season.� But� this� season� could� be�grouped� into� three� kinds� for� rainfall�frequency� that� is� high,� medium� and�small.� The� high� rainfall� occurred� in�November� by� 152.0� mm,� the� medium�rainfall� was� 58.5� mm� of� July,� and� the�small� rainfall� was� around� 28.0� mm� of�February�
.�All� along� 2013,� the� lowest�
temperature� is� occurred� on� July� and�September�by�26.60C�and�the�highest�by�28.50C� on� March.� The� most� wind�direction� in� 2013� is� from� North� West�position,�with�average� velocities�by�3.6�knots.�
�In� 2013,� the� highest� humidity� in�
Palu�City�is�on�July�by�80.8�percent�and�the� lowest� on� March� by� 73.1� percent.�While,� the� most� sunshine� is� on� March�by� 69.1� percent,� and� the� smallest� on�December�by�50.6�percent.�
���
http
://sul
teng
.bps
.go.
id

Keadaan Iklim
14 Sulawesi Tengah Dalam Angka 2014
http
://sul
teng
.bps
.go.
id

Sulawesi Tengah i
Gambar�
Figure� 2.1
32
27
24
20,0
25,0
30,0
35,0
J/J
Suhu
�/�Tem
perature�(o
C)
Maksim
in Figures 2014
1�Suhu�UdaMinimum,2013�
2,833,5
34,5
7,7 27,728,5
4,2 23,824,3
Jan/Jan
Peb/Feb
Mar/M
ar
mum/�Maximun
ara�Rata�rata�Ko,�Maximum,�an
533,8 33,8
5 28,2 28,0
3 24,5 24,1
Apr/Ap
r
Mei/M
ay
Rata
ota�Palu�Menund�Average�Tem
33,6
32,1 3
28,0
26,6 2
23,923,4 2
Jun/Jun
Jul/Jul
�rata�/�Average�
rut�Bulan,�2013mperature�in�Pa
32,5 32,1
33,
26,8 26,6
27,
23,0 23,4 23,
Agu/Au
g
Sep/Sep
Okt/O
ct
Minim
Clim
3�alu�City�by�Mont
,5 33,5 33,4
7,9 28,0 27,8
,7 23,323,9
Okt/O
ct
Nop
/Nov
Des/De
c
mum�/�Minimun
mate
15
th,�
http
://sul
teng
.bps
.go.
id

Keadaan Iklim
16 Sulawesi Tengah Dalam Angka 2014
http
://sul
teng
.bps
.go.
id

Climate
Sulawesi Tengah in Figures 2014 17
Gambar Figure 2.2
Curah Hujan Kota Palu Menurut Bulan, 2013 Rainfall in Palu City by Month, 2013
0,0
40,0
80,0
120,0
Jan/
Jan
Peb/
Feb
Mar
/Mar
Apr/
Apr
Mei
/May
Jun/
Jun
Jul/
Jul
Agu/
Aug
Sep/
Sep
Okt
/Oct
Nop
/Nov
Des/
Dec
51,0
28,0 35,0
58,5 49,8
97,0
130,0
79,8
98,4
57,2
152,0
69,0
Cura
h hu
jan
/ ra
infa
ll (m
m)
http
://sul
teng
.bps
.go.
id

Keadaan Iklim
18 Sulawesi Tengah Dalam Angka 2014
http
://sul
teng
.bps
.go.
id

Climate
Sulawesi Tengah in Figures 2014 19
2.�KEADAAN�IKLIM/CLIMATE�Tabel�
Table� �2.1�
Rata�Rata�Suhu�Udara,�Kelembaban,�Tekanan�Udara,�Arah�Angin,�Kecepatan�Angin,�Curah�Hujan�dan�Penyinaran�Matahari,�2009�2013�Average�of�Temperature,�Relative�Humidity,�Atmospheric�Pressure,Wind�Direction,�Wind�Velocity,�Rainfall,�and�Sunshine,2009��2013�
�
Uraian�Description�
Tahun/Year�
2009� 2010� 2011� 2012� 2013�
(1)� (2)� (3)� (4)� (5)� (6)�
Suhu�Temperature�(0C)� 27,6� 27,7� 27,6� 27,7� 27,7�
Kelembaban�Udara�Relative�Humidity�(%)� 74,9� 76,7� 76,1� 76,0� 76,4�
Tekanan�Udara�Atmospheric�Pressure�(mb)�
1�010,3� 1�010,4� 1�009,9� 1�010,3� 1�010,2�
Arah�Angin�Terbanyak�The�Most�Wind�Direction��
Utara�North�
Utara�North�
Utara�North�
Barat�Daya�North�West�
Barat�Daya�North�West�
Kecepatan�Angin�Wind�Velocity�(Knots)�
4,4� 3,7� 3,0� 3,8� 3,6�
Curah�Hujan�Rainfall�(mm)�
79,09� 46,9� 71,98� 63,38� 62,33�
Penyinaran�Matahari�Sun�shine�(%)�
64,9� 63,5� 54,5� 62,9� 57,7�
Sumber/Source:�� Stasiun�Meteorologi�Mutiara�Palu� ��Meteorological�Station�of�Mutiara�Palu�
http
://sul
teng
.bps
.go.
id

Keadaan Iklim
20 Sulawesi Tengah Dalam Angka 2014
�Tabel�
Table� �2.2�
Suhu� Udara� Minimum,� Maksimun� dan� Rata�rata� Menurut� Bulan� di� Stasiun�Meteorologi�Mutiara�Palu,�2013�Minimum,�Maximum,� �and�Average�Temperature� in�Meteorological� Station�of�Mutiara�Palu�by�Month,�2013�
�
Bulan�Month�
Suhu�Udara/Temperature(0C)�
Minimum�Minimum�
Maksimum�Maximum�
Rata�Rata��Average�
(1)� (2)� (3)� (4)�
Januari/January� 24,2� 32,8� 27,7�
Pebruari/February� 23,8� 33,5� 27,7�
Maret/March� 24,3� 34,5� 28,5�
April/April� 24,5� 33,8� 28,2�
Mei/May� 24,1� 33,8� 28,0�
Juni/June� 23,9� 33,6� 28,0�
Juli/July� 23,4� 32,1� 26,6�
Agustus/August� 23,0� 32,5� 26,8�
September/September� 23,4� 32,1� 26,6�
Oktober/October� 23,7� 33,5� 27,9�
Nopember/November� 23,3� 33,5� 28,0�
Desember/December� 23,9� 33,4� 27,8�
Sumber/Source� :� Stasiun�Meteorologi�Mutiara�Palu�� � � Meteorological�Station�of�Mutiara�Palu�
http
://sul
teng
.bps
.go.
id

Climate
Sulawesi Tengah in Figures 2014 21
Tabel�
Table� �2.3�
Kelembaban� Udara,� Penyinaran� Matahari� Menurut� Bulan� di� Stasiun�Meteorologi�Mutiara�Palu,�2013�Relative� Humidityin,� Sunshine� Meteorological� Station� of� Mutiara� Palu� by�Month,�2013�
�
Bulan�Month�
Kelembaban�Udara�Relative�humidity�
�(%)�
Penyinaran�Matahari�Sunshine�
(%)�
(1)� (2)� (3)�
Januari/January� 76,8� 56,1�
Pebruari/February� 75,7� 51,6�
Maret/March� 73,1� 69,1�
April/April� 76,6� 62,7�
Mei/May� 77,4� 55,2�
Juni/June� 74,3� 69,0�
Juli/July� 80,8� 46,2�
Agustus/August� 78,2� 55,2�
September/September� 76,7� 45,7�
Oktober/October� 74,5� 66,2�
Nopember/November� 77,2� 61,0�
Desember/December� 75,8� 50,6�
Sumber/Source� :� Stasiun�Meteorologi�Mutiara�Palu�� � � Meteorological�Station�of�Mutiara�Palu�
http
://sul
teng
.bps
.go.
id

Keadaan Iklim
22 Sulawesi Tengah Dalam Angka 2014
Tabel�
Table� �2.4�
Jumlah� Curah� Hujan� dan� Jumlah� Hari� Hujan� menurut� Bulan� di� Stasiun�Meteorologi�Mutiara�Palu,�2013�Number� of� Precipitation� and� Number� of� Rain� Days� in�Meteorological� Station� of�Mutiara�Palu�by�Month,�2013�
�
Bulan�Month�
Jumlah�Curah�Hujan�Number�of�Precipitation�(mm)
Jumlah�Hari�Hujan�Number�of�Rain�Days�
(1)� (2)� (3)�
Januari/January� 51,0� 17�
Pebruari/February� 28,0� 15�
Maret/March� 35,0� 11�
April/April� 58,5� 20�
Mei/May� 49,8� 21�
Juni/June� 97,0� 16�
Juli/July� 130,0� 24�
Agustus/August� 79,8� 22�
September/September� 98,4� 18�
Oktober/October� 57,2� 12�
Nopember/November� 152,0� 15�
Desember/December� 69,0� 16�
Sumber/Source� :� Stasiun�Meteorologi�Mutiara�Palu�� � � Meteorological�Station�of�Mutiara�Palu�
http
://sul
teng
.bps
.go.
id

Climate
Sulawesi Tengah in Figures 2014 23
Tabel�
Table� �2.5�
Tekanan�Udara,�Arah�Angin�Terbamyak�dan�Kecepatan�Angin�menurut�Bulan�di�Stasiun�Meteorologi�Mutiara�Palu,�2013�Atmospheric�Pressure,�Most�Wind�Direction,�and�Wind�Velocity�in�Meteorological�Station�of�Mutiara�Palu�by�Month,�2013�
�
Bulan�Month�
TekananUdara�Atmospheric�Pressure�
(mb)�
Arah�Angin�Terbanyak�Most�Wind�Direction�
Kecepatan�Angin�Wind�Velocity�
(Knots)�
(1)� (2)� (3)� (4)�
Januari/January� 1�010,4� Utara/�North� 4,0�
Pebruari/February� 1�009,7� Utara/�North� 4,0�
Maret/March� 1�010,8� Utara/�North� 4,0�
April/April� 1�010,0� Barat�Laut/�North�West� 4,0�
Mei/May� 1�010,3� Barat�Laut/�North�West� 3,0�
Juni/June� 1�009,4� Barat�Laut/�North�West� 3,0�
Juli/July� 1�010,2� Utara/�North� 3,0�
Agustus/August� 1�011,0� Barat�Laut/�North�West� 3,0�
September/September� 1�010,2� Barat�Laut/�North�West� 3,0�
Oktober/October� 1�011,0� Barat�Laut/�North�West� 4,0�
Nopember/November� 1�009,6� Barat�Laut/�North�West� 4,0�
Desember/December� 1�009,5� Barat�Laut/�North�West� 3,9�
Sumber/Source� :� Stasiun�Meteorologi�Mutiara�Palu�� � � Meteorological�Station�of�Mutiara�Palu
http
://sul
teng
.bps
.go.
id

Keadaan Iklim
24 Sulawesi Tengah Dalam Angka 2014
http
://sul
teng
.bps
.go.
id

Government
Sulawesi Tengah in Figures 2014 25
PEMERINTAHANGovernment
http
://sul
teng
.bps
.go.
id

Pemerintahan
26 Sulawesi Tengah Dalam Angka 2014
http
://sul
teng
.bps
.go.
id

Government
Sulawesi Tengah in Figures 2014 27
3.���PEMERINTAHAN���
Pada� tahun� 1964� melalui�Peraturan� Pemerintah� Pengganti�Undang�undang� (PERPU)� No.� 2� tahun�1964� tentang� pembentukan� Provinsi�Sulawesi� Tengah� dengan� ibukota� Palu,�terbentuklah� Daerah� Tingkat� I� Sulawesi�Tengah� yang� meliputi� empat� kabupaten�yaitu� Kabupaten� Donggala,� Kabupaten�Poso,�Kabupaten�Banggai�dan�Kabupaten�Buol�Toli�toli.�
�Selanjutnya,� Pemerintah� Pusat�
menetapkan� Provinsi� Sulawesi� Tengah�sebagai� provinsi� yang� otonom� berdiri�sendiri�yang�disahkan�dengan�UU�No.�13�yang� diundangkan� pada� tanggal� 23�September� 1964,� dan� berlaku� surat�tanggal�1� Januari�1964�(LN�No.�64�tahun�1964)�yang�wilayahnya�meliputi:�
1.�Kabupaten�Poso�=�24.122�Km2�2.�Kabupaten�Donggala�=�23.496�Km2�3.�Kabupaten�Banggai=�13.163�Km2�4.�Kabupaten�Buol�Tolitoli�=�7.261�Km2�
�Kemudian,� berdasarkan� Undang�
Undang� Nomor� 4� Tanggal� 12� Oktober�1994,� terbentuklah� Kotamadya� Palu.�Selanjutnya� dalam� era� Reformasi,�Pemerintah� Pusat� mengeluarkan�kebijakan� melalui� Undang�undang�Nomor� 11� tahun� 2000� tentang�perubahan� atas� Undang�undang� Nomor�51� Tahun� 1999� tentang� pembentukan�Kabupaten� Buol,� Morowali� dan� Banggai�Kepulauan.� Berdasarkan� Undang�undang�
3.��GOVERNMENT�By� the� Government� Regulation�
Replacement�Act� (PERPU)�No.� 2,� 1964� is�concern� with� the� establishment� of�Sulawesi� Tengah� that� its� capital� of� Palu,�so�formed�The�Level�1stRegional�Sulawesi�Tengah� in� 1964� included� the� four�regencies�were�Donggala,�Poso,�Banggai,�and�Buol�Toli�toli�Regency.�
��
��Furthermore,�the�central�government�determined� the� Sulawesi� Tengah�Province� as� autonomous� province� that�was�ratified�by�Act�No.�13�and�legislated�on� September� 23rd,� 1964,� and� put� in�placeon� January1st,� 1964� (LN� No.� 64� of�1964),with�its�region�covered:�1.�Poso�Regency�=�24.122�Km2��2.�Donggala�Regency�=�23.496�Km2��3.�Banggai�Regency�=�13.163�Km2��4.�Buol�Tolitoli�Regency�=�7.261�Km2����
Then,� based� on� Law� No.� 4� On�October� 12,� 1994,� formed� the� City� of�Palu.� Later� in� the� Reformation� era,� the�central� government� issued� a� policy�through� Act� No.� 11� of� 2000� concerning�amendment� of� Law� No.� 51� of� 1999�concerning� the� establishment� of� Buol,�Morowali�and�Banggai� Islands.�Based�on�Law� No.� 10� of� 2002� by� the� Central�
http
://sul
teng
.bps
.go.
id

Pemerintahan
28 Sulawesi Tengah Dalam Angka 2014
Nomor� 10� Tahun� 2002� oleh� Pemerintah�Pusat� terbentuk� lagi� Kabupaten� Parigi�Moutong.� Pada� tanggal� 21� Juli� 2008�terbentuk� Kabupaten� Sigi� berdasarkan�Undang�undang�No.�27�Tahun�2008�oleh�Pemerintah��Pusat.��
Pada� tahun� 2013� terbentuk� 2�Kabupaten�baru�yaitu�Kabupaten�Banggai�Laut� berdasarkan� Undang�undang� no.� 5�tahun� 2013� dan� Kabupaten� Morowali�Utara� berdasarkan� Undang�undang� no.�12�tahun�2013�
Dengan� demikian� hingga� saat� ini�berdasarkan� pemekaran� Wilayah� Ka�bupaten/kota� di� Provinsi� Sulawesi�Tengah,�menjadi�13�daerah�yakni�:��1. Kabupaten� Donggala� berkedudukan�
di�Donggala�2. Kabupaten� Poso� berkedudukan� di�
Poso�3. Kabupaten� Banggai� berkedudukan� di�
Luwuk�4. Kabupaten� Tolitoli� berkedudukan� di�
Tolitoli�5. Kota�Palu�berkedudukan�di�Palu�6. Kabupaten� Buol� berkedudukan� di�
Buol�7. Kabupaten� Morowali� berkedudukan�
di�Bungku�8. Kabupaten� Banggai� Kepulauan�
berkedudukan�di�Salakan�9. Kabupaten� Parigi� Moutong�
berkedudukan�di�Parigi�10. Kabupaten� Tojo� Una�Una�
berkedudukan�di�Ampana�11. Kabupaten� Sigi� berkedudukan� di�
Bora.�
Government� to� form� another� district�Moutong�Parigi.�On�July�21,�2008�formed�by� Sigi� Regency� Law.� 27� of� 2008� by� the�Central�Government.�
�Two� regencies� were� established��
in� 2013,� Banggai� Laut� regency�based�on�law� no.� 5� of� 2013� dan� Morowali� Utara�based�on�law�no.�12�of�2013.��
���Thus� until� recently� by� the�
expansion� area� Kabupaten/kota� in�Central�Sulawesi�Province,� into�13��Areas�are:�1. Donggala�Regency�based�in�Donggala�2. Poso�Regency�Based�in�Poso��3. Banggai�Regency�based�in�Luwuk�4. Toli�toli�Regency�based�in�Tolitoli�5. Palu�City�Based�in�Palu��6. Buol�Regency�Based�in�Buol�7. Morowali�Regency�based�in�Bungku�8. Banggai�Kepulauan�based�in�Salakan�9. Parigi� Moutong� Regency� based� in�
Parigi��10. Tojo� Una�Una� Regency� based� in�
Ampana�11. Sigi�Regency�is�based�in�Bora.�12. Banggai� Laut� Regency� is� based� in�
Banggai�13.Morowalu�Utara�Regency� is�based� in�
Kolonodale�
http
://sul
teng
.bps
.go.
id

Government
Sulawesi Tengah in Figures 2014 29
12. Kabupaten� Banggai� Laut�berkedudukan�di�Banggai.�
13. Kabupaten� Morowali� Utara�berkedudukan�di�Kolonodale�
Pada� Pemilu� 2009� baru�baru� ini,�baik� Pemilu� Legislatif� maupun� Presiden�(Pilpres),� penduduk� yang� terdaftar� pada�daftar� pemilih� tetap� (DPT)� tidak�semuanya�melaksanakan�hak�pilihnya.�
�Pada� Pemilu� Legislatif,� dari��
jumlah�penduduk�yang�terdaftar�sebesar�1.663.623� orang� di� Sulawesi� Tengah,�hanya� sekitar� 77,95� persen� yang�melaksanakan� hak� pilihnya� atau�1.296.819� orang.� Persentase� pemilih�yang� menggunakan� hak� pilihnya� pada�pemilu� 2009� ini� lebih� kecil� dibanding�persentase� pada� pemilu� sebelumnya,�tahun� 2004,� yang� mencapai� 88,93�persen.� Sementara� pada� Pilpres� yang�diselenggarakan� tanggal� 8� Juli� 2009,�pemilih�terdaftar�yang�menggunakan�hak�pilihnya� sebanyak� 1.388.325� orang� atau�sebesar�78,25�persen.�
�Bila� dilihat� perolehan� suara�
Pemilu� Legislatif� Tingkat� I� (DPRD� I)� dari�masing�masing� Partai� Politik� maka�jumlah� perolehan� suara� terbanyak�dicapai� oleh� partai� Golongan� Karya�(Golkar)� sebesar� 19,88� persen,� disusul�oleh� Partai� Demokrat� (PD),� Partai�Demokrasi� Indonesia� Perjuangan� (PDIP),�Partai� Amanat� Nasional� (PAN),� Partai�Damai�Sejahtera�(PDS),�Partai�Hati�Nurani�Rakyat� (Hanura)� dan� Partai� Keadilan�
��
�In�the�last�general�election,�2009�both�
of� Legislative� or� Presidential� Elections,�not� all� of� registered� electors� onThe�Electoral� Roll� (DPT)� used� their� right� on�the�occasion.�
�In� legislative� general� election,� from�
the� total� registered� population� in�Sulawesi� Tengah� Province� (1,663,623�persons)� which� used� their� right� is� only�77.95� percent� (1,296,819� persons).�Percentage�of�electors� in�2009�who�used�their� right� is� less� than� the� previous�general�election� (in�2004)�which�reached�88.93�percent.�Meanwhile�on�Presidential�Election�that�conducted�on�July�8th�2009,�total� registered� electors� who� used� their�right� reached� 1,388,325� persons� (78.25�percent).�
���According� to� the� result� of� legislative�
election� by� politic� parties,� Golongan�Karya� (Golkar)� Party� attained� the� first�position�with� the� biggest� votes� by� 19.88�percent.� The� next� � positions� were�Democratic�Party� (PD),� Party�of� Struggle�Indonesian� Democracy� (PDI�P),� National�Mandate�Party�(PAN),�Party�of�Peace�and�Welfare� (PDS),� People� Lustrous� Heart�Party� (Hanura),� and� Justice� and�Welfare�Party� (PKS),respectively� reached� 11.69�
http
://sul
teng
.bps
.go.
id

Pemerintahan
30 Sulawesi Tengah Dalam Angka 2014
Sejahtera (PKS), dengan perolehan suara masing-masing 11,69 persen, 6,27 persen, 5,49 persen, 4,95 persen, 4,88 persen, dan 4,84 persen.
Pemilu Legislatif tahun 2009,
menghasilkan komposisi keanggotaan DPRD Provinsi Sulawesi Tengah periode 2009-2014 yang terbagi dalam 4 fraksi dengan jumlah anggota terbanyak dari Fraksi Golkar yaitu sebanyak 9 orang atau 20,45 persen dari total anggota yang ada, disusul oleh fraksi Demokrat sebanyak 8 orang atau 18,18 persen, fraksi PAN sebanyak 7 orang atau sebesar 15,90 persen, fraksi Tadulako terdiri atas anggota dewan dari partai-partai yang lain berjumlah 8 orang atau 18,18 persen.
Sementara pada Pemilu Kepala
Daerah Provinsi Sulawesi Tengah (Pilgub) yang diselenggarakan tanggal 6 April 2011, pemilih terdaftar yang menggunakan hak pilihnya sebanyak 1.275.507 orang.
Pegawai Negeri Sipil (PNS) di
lingkungan Pemerintah Daerah Provinsi Sulawesi Tengah pada tahun 2013 mencapai 6.425 orang. Lebih dari separuh PNS tersebut berada pada jenjang golongan III (58,61%). Dilihat dari pendidikannya, mayoritas PNS Pemda Sulawesi Tengah berpendidikan SLTA atau sederajat, sebesar 38,86 persen.
percent,6.27 percent, 5.49 percent, 4.95 percent, 4.88 percent, and 4.84 percent.
Legislative General Election, 2009
resulted membership composition of Assembly at Regional Sulawesi Tengah Province during period 2009-2014 which divided into 4 factions with most members are Golkar Faction by 9 persons or 20.45 percent of total members, respectively followed by Demokrat faction by 8 persons or 18.18 percents, faction of PAN by 7 persons or 15.90 percents, and Tadulako faction which consists of other parties members as many 8 persons or 18.18 percent.
Meanwhile on Governor Election that
conducted on April 6th 2011, total registered electors who used their right reached 1,275,507 persons.
Total civil servants (PNS) inregional
government of Sulawesi Tengah in 2013 were 6,425 persons. Most of them were classified as level of III (58,61 %). Refer to their education attainment, most of them were graduated senior high school or on the parallel, about 38.86 percent.
http
://sul
teng
.bps
.go.
id

Government
Sulawesi Tengah in Figures 2014 31
�Jumlah� personil� satuan� Per�
lindungan� Masyarakat� (LINMAS)� di��Sulawesi� Tengah� tahun� 2013� berjumlah�35.354� orang� yang� tersebar� di� seluruh�kabupaten/kota�se�Sulawesi�Tengah.�
�Bila� ditinjau� menurut� kabupaten/�
kota,� jumlah� personil� LINMAS� terbanyak�berada� di� Kabupaten� Banggai� yaitu�sebanyak� 5.348� orang,� kemudian�Kabupaten� Parigi� Moutong� sebanyak�4.252� orang,� dan� Kabupaten� Morowali�sebanyak�4.114�orang.�
�����������������������
Total� Personnel� of� Society� Protection�Corp� (LINMAS)� Sulawesi� Tengah,� 2013�amounted� to�35,354�persons�and�spread�overof� all� regencies/city� in� Sulawesi�Tengah.�
�Among� all� regencies� and� city,� the�
largest�number�of�LINMAS�personnel�was�in� Banggai� Regency� by� 5,348� persons,�then� Parigi� Moutong� Regency� by� 4,252�persons,� and� Morowali� Regency�amounted�4,114�persons.�
http
://sul
teng
.bps
.go.
id

Pemerintahan
32 Sulawesi Tengah Dalam Angka 2014
�����������
http
://sul
teng
.bps
.go.
id

Sulawesi Tengah i
Gambar�
Figure� 3.1
0
10
20
30
40
50
60
70
80
90
100
Bang
gai�K
epul
auan
89,79
10,21
in Figures 2014
1�Persentaspada�PemPercentagRight� on�Province�
Bang
gai
Mor
owal
i
77,9475,79
1
22,0624,2
Memili
se�Pemilih�Terdmilu�Legislatif�(Dge�of�RegistereLegislative� Gen
Poso
Dong
gala
�
83,04
76,54
21
16,96
23,4
h�/�Vote
daftar�yang�MeDPR)�2009�di�Sud�Constituents�neral� Election� (
Tolit
oli
Buol
77,16
85,63
46 22,84
14
Tidak�Mem
emilih�dan�yanulawesi�Tengahwhich�Used�an(DPR)� 2009� in�
Parig
i�Mou
tong
Tojo
�Una
�Una
78,06
82,41
4,37
21,94
1
milih�/�Not�Vote
Governm
ng�Tidak�Memih�nd�Not�Use�TheSulawesi� Teng
Palu
Sula
wes
i�Ten
gah
67,22
77,95
7,59
32,78
2
e
ment
33
lih�
eir�ah�
g
22,05
http
://sul
teng
.bps
.go.
id

Pemerintahan
34 Sulawesi Tengah Dalam Angka 2014
http
://sul
teng
.bps
.go.
id

Government
Sulawesi Tengah in Figures 2014 35
3. PEMERINTAHAN/GOVERNMENT�
Tabel�
Table� �3.1�
Jumlah� Pemilih� yang� Terdaftar� dan� Pemilih� yang� Melaksanakan� Hak� Pilihnya�pada�Pemilu�Legislatif�(DPR)�Dirinci�menurut�Kabupaten/Kota,�2009�Number� of� Registered� Electors� and� Electors� Who� Used� Their� Right� on� 2009,�Legislative�General�Election�(Assembly)�by�Regency/City,�2009�
�
Kabupaten/Kota�Regency/City�
Pemilih�yang�
Terdaftar�Registered�Electors�
Jumlah�Pemilih�Melaksanakan�Hak�Pilihnya�
Number�of�Electors�Who�Used�Their�Right�
Persentase�yg�memilih�terhadap�Pemilih�
Percentage�of�VotedElectorsa
nd�Total�Electors��
Suara�Sah�Valid�Vote�
Suara�Tidak�Sah�
Invalid�Vote�
Jumlah�Suara�
Total�Vote�
(1) (2) (3) (4) (5) (6)�� � � �
01.� Banggai�Kepulauan������� 105�764� 87�189� 7�781� 94�970� 89,79�
02.� Banggai� 208�560� 152�143� 10�407� 162�550� 77,94�
03.� Morowali� 134�268� 98�077� 3�689� 101�766� 75,79�
04.���� Poso�� 131�120� 103�880� 5�003� 108�883� 83,04�
05.���� Donggala�� 317�823� 224�054� 19�210� 243�264� 76,54�
06.� Tolitoli������� 141�750� 98�122� 11�255� 109�377� 77,16�
07.� Buol� 79�130� 60�779� 6�978� 67�757� 85,63�
08.�� Parigi�Moutong� 265�102� 188�044� 18�904� 206�948� 78,06�
09.� Tojo�Una�Una� 85�737� 65�214� 5�440� 70�654� 82,41�
10.�� Palu� 194�369� 122�328� 8�322� 130�650� 67,22�
� � � � � � �
Sulawesi�Tengah�������������� 1�663�623� 1�199�830� 96�989� 1�296�819� 77,95�
Sumber/�Source�:� Komisi�Pemilihan�Umum�Provinsi�Sulawesi�Tengah�Social�Politic�Directorate�of�Sulawesi�Tengah�Province�
http
://sul
teng
.bps
.go.
id

Pemerintahan
36 Sulawesi Tengah Dalam Angka 2014
Tabel�
Table�3.2�
Jumlah�dan�Persentase�Perolehan�Suara�dan�Jumlah�Perolehan�Kursi�Hasil�Pemilu�Legislatif�(DPRD�I)�Organisasi�Peserta�Pemilu,�2009�Number�and�Percentage�of�Legislative�and�Number�of�Chairs�Achievement�on�2009�General�Election�(DPRD�I)�Resultedby�Participants�
�
Partai�Politik�Political�Party�
Jumlah�PerolehanAchievements
Persentase�Percentage�
Jumlah�Suara�Votes
Jumlah�Kursi�Chairs�
Perolehan�Suara�Votes
Perolehan�Kursi�Chairs�
(1)� (2)� (3)� (4)� (5)�� � � � � �1� Partai�Hati�Nurani�Rakyat� 59�425� 3� 4,88� 6,67�2� Partai�Karya�Peduli�Bangsa� 45�009� 2� 3,70� 4,44�3� Partai�Pengusaha��dan�Pekerja�Indonesia 11�627� �� 0,95� ��4� Partai�Peduli�Rakyat�Indonesia� 28�627� �� 2,35� ��5� Partai�Gerakan�Indonesia�Raya� 45�077� 2� 3,70� 4,44�6� Partai�Barisan�Nasional� 16�861� �� 1,38� ��7� Partai�Keadilan�dan�Persatuan�Indonesia 34�888� 2� 2,86� 4,44�8� Partai�Keadilan�Sejahtera� 58�947� 4� 4,84� 8,89�9� Partai�Amanat�Nasional� 66�810� 4� 5,49� 8,89�10� Partai�Perjuangan�Indonesia�Baru� 7�648� �� 0,63� ��11� Partai�Kedaulatan� 10�141� �� 0,83� ��12� Partai�Persatuan�Daerah� 7�609� �� 0,62� ��13� Partai�Kebangkitan�Bangsa� 39�797� 1� 3,27� 2,22�14� Partai�Pemuda�Indonesia� 8�916� �� 0,73� ��15� Partai�Nasional�Indonesia�Marhaenisme 8�556� �� 0,70� ��16� Partai�Demokrasi�Pembaruan� 23�854� 1� 1,96� 2,22�17� Partai�Karya�Perjuangan� 9�042� �� 0,74� ��18� Partai�Matahari�Bangsa� 8�014� �� 0,66� ��19� Partai�Penegak�Demokrasi�Indonesia 1�474� �� 0,12� ��20� Partai�Demokrasi�Kebangsaan�
10�397� �� 0,85� ��
http
://sul
teng
.bps
.go.
id

Government
Sulawesi Tengah in Figures 2014 37
Lanjutan�Tabel/Continued�Table��3.2���
�
Partai�Politik�Political�Party�
Jumlah�PerolehanAchievements�
Persentase�Percentage�
Jumlah�Suara�Votes�
Jumlah�Kursi�Chairs��
Perolehan�Suara�Votes�
Perolehan�Kursi�Chairs�
(1)� (2)� (3)� (4)� (5)�
� � � � � �21� Partai�Republika�Nusantara� 13�694� �� 1,12� ��22� Partai�Pelopor� 9�385� �� 0,77� ��23� Partai�Golongan�Karya� 242�130� 9� 19,88� 20,00�24� Partai�Persatuan�Pembangunan 43�634� 2� 3,58� 4,44�25� Partai�Damai�Sejahtera� 60�288� 3� 4,95� 6,67�26� Partai�Nasional�Benteng�Kerakyatan�
Indonesia� 4�234� �� 0,35� ��
27� Partai�Bulan�Bintang� 26�994� �� 2,22� ��28� Partai�Demokrasi�Indonesia�Perjuangan 76�351� 4� 6,27� 8,89�29� Partai�Bintang�Reformasi� 27�741� 1� 2,28� 2,22�30� Partai�Patriot� 36�896� 1� 3,03� 2,22�31� Partai�Demokrat� 142�403� 6� 11,69� 13,33�32� Partai�Kasih�Demokrasi�Indonesia 11�027� �� 0,91� ��33� Partai�Indonesia�Sejahtera� 5�233� �� 0,43� ��34� Partai�Kebangkitan�Nasional�Ulama 9�118� �� 0,75� ��41� Partai�Merdeka� 1�034� �� 0,08� ��42� Partai�Persatuan�Nahdlatul�Ummah�
Indonesia� 166� �� 0,01� ��
43� Partai�Serikat�Indonesia� 255� �� 0,02� ��44� Partai�Buruh� 4�465� �� 0,37� ��
� Jumlah/Total� 1�217�767� 45� 100,00� 100,00�
Sumber/�Source�:� Komisi�Pemilihan�Umum�Provinsi�Sulawesi�Tengah�Social�Politic�Directorate�of�Sulawesi�Tengah�Province��
http
://sul
teng
.bps
.go.
id

Pemerintahan
38 Sulawesi Tengah Dalam Angka 2014
Tabel�
Table�3.3�
Jumlah�dan�Peringkat�Suara�Sah�Anggota�Dewan�Perwakilan�Daerah�(DPD)�Terpilih�Pemilihan�Umum�Tahun�2009�Number� and� Valid� Votes� Ranking� of� The� Select� Regional� Representative�Council�Member�General�Election,�2009�
�
Nama�Calon�Name�of�Candidate�
Jumlah�Suara�Sah�Valid�Votes�
(1)� (2)�
� � �
1� Nurmawati�Dewi�Bantilan,�Hj.,�SE�� 104�022�
2� Ahmad�Syaifullah�Malonda,�SP�� 80�616�
3� Shaleh�Muhamad�Aldjufri,Lc.,�MA�� 78�303�
4� Pdt.�Silviana�Hendriete�Padegirot,�MTh�� 75�0831)�
� � �
Sumber/�Source�:� Komisi�Pemilihan�Umum�Provinsi�Sulawesi�Tengah�Social�Politic�Directorate�of�Sulawesi�Tengah�Province��Catatan/Note�� :� 1)�Pengganti�Sudarto,�SH��(setelah�menjadi�wakil�gubernur�Sulawesi�Tengah)�
http
://sul
teng
.bps
.go.
id

Government
Sulawesi Tengah in Figures 2014 39
Tabel�
Table�3.4�
Jumlah� Pemilih� yang� Terdaftar� dan� Pemilih� yang� � Menggunakan� Hak�Pilihnya�pada�Pemilihan�Presiden�2009�menurut�Kabupaten/Kota�Number� of� Registered� Electors� and� Electors� Who� Used� Their� Right� on�Presidential�Election�2009��by�Regency/City�
�
Kabupaten/Kota�Regency/City�
Pemilih/Electors� Suara�/�Votes�
DPT�/�Electoral�Roll�Daftar�
TambahanAdditional�
List�
Suara�Sah�Valid�Votes�
Suara�Tidak�Sah�Invalid�Votes�
Jumlah�Total�
Yang�Mengguna�
kan�Hak�PilihVoted�
Yang�Tidak�Mengguna�
kan�Hak�PilihNot�Voted�
(1)� (2)� (3)� (4)� (5)� (6)� (7)�� � � �
01� Banggai�Kepulauan�� 94�093� 16�077� 312� 91�125� 3�280� 94�405�
02� Banggai� 173�035� 51�124� 1�424� 167�503� 6�956� 174�459�
03� Morowali� 108�515� 27�422� 1�554� 104�842� 5�227� 110�069�
04� Poso�� 114�715� 24�546� 1�088� 111�934� 3�869� 115�803�
05� Donggala�� 260�397� 69�218� 1�652� 246�150� 15�899� 262�049�
06� Tolitoli������� 109�642� 37�165� 676� 106�158� 4�160� 110�318�
07� Buol� 66�466� 16�582� 268� 63�546� 3�188� 66�734�
08� Parigi�Moutong� 213�304� 62�029� 1�605� 203�357� 11�552� 214�909�
09� Tojo�Una�Una� 71�485� 18�419� 883� 68�841� 3�527� 72�368�
10� Palu� 163�106� 63�369� 4�105� 161�342� 5�869� 167�211�
� � � � � � �
Sulawesi�Tengah� 1�374�758� 385�951� 13�567� 1�324�798� 63�527� 1�388�325�
Sumber/�Source�:� Komisi�Pemilihan�Umum�Provinsi�Sulawesi�Tengah�Social�Politic�Directorate�of�Sulawesi�Tengah�Province
http
://sul
teng
.bps
.go.
id

Pemerintahan
40 Sulawesi Tengah Dalam Angka 2014
Tabel�
Table�3.5�
Jumlah�Perolehan�Suara�pada�Pemilihan�Presiden�2009�menurut�Pasangan�Capres�Cawapres�dan�Kabupaten/Kota�Number� of� Votes� on� Presidential� Election� 2009� � by� President� and� Vice�President�Couple�and�Regency/City�
�
Kabupaten/Kota�Regency/City�
Hj.Megawati�Soekarnoputri��H.�Prabowo�
Subianto�
Dr.�H.�Susilo�Bambang�
Yudhoyono���Prof.�Dr.�
Boediono�
H.M.�Jusuf�Kalla�� ����������
H.�Wiranto�
Jumlah�Total�
(1)� (2)� (3)� (4)� (5)�� � �
01� Banggai�Kepulauan�� 14�482� 38�689� 37�954� 91�125�
02� Banggai� 22�924� 86�023� 58�556� 167�503�
03� Morowali� 6�305� 56�627� 41�910� 104�842�
04� Poso�� 9�838� 74�522� 27�574� 111�934�
05� Donggala�� 17�141� 128�749� 100�260� 246�150�
06� Tolitoli������� 3�601� 50�146� 52�411� 106�158�
07� Buol� 3�480� 41�833� 18�233� 63�546�
08� Parigi�Moutong� 19�218� 86�242� 97�897� 203�357�
09� Tojo�Una�Una� 2�607� 24�881� 41�353� 68�841�
10� Palu� 11�031� 81�701� 68�610� 161�342�
� � � � � �
Sulawesi�Tengah� 110�627� 669�413� 544�758� 1�324�798�
Sumber/�Source�:� Komisi�Pemilihan�Umum�Provinsi�Sulawesi�Tengah�Social�Politic�Directorate�of�Sulawesi�Tengah�Province�
http
://sul
teng
.bps
.go.
id

Government
Sulawesi Tengah in Figures 2014 41
Tabel�
Table�3.6�
Jumlah� Perolehan� Suara� pada� Pemilihan� Gubernur� Sulawesi� Tengah� 2011�menurut�Pasangan�Cagub�Cawagub�dan�Kabupaten/Kota�Number� of� Votes� on�Governor� Election� 2011� � by�Governor� and�Vice�Governor�Couple�and�Regency/City�
Sumber/�Source�:� Komisi�Pemilihan�Umum�Provinsi�Sulawesi�Tengah��Social�Politic�Directorate�of�Sulawesi�Tengah�Province�
Kabupaten/Kota�Regency/City�
Prof.Drs.H.Aminudin�
Ponulele,Ms�–�DR.Hj�
Luciana�is�Baculu,SE,M
M�
H.�Sahabuddi
n�Mustapa�–�H.Faisal�Mahmud
Drs.H.Longki�Djanggola,Msi���
Drs.H.Sudarto,M,Hum�
Ir.H.Rendy�
M.Affandi�Aziz�
Lamadjido,MBA�–�H.Bandjela�Paliudju
H.Achmad�Yahya,SE,MM�–�Drs.H.Ma’ruf�Bantilan,MM�
Jumlah�Total�
(1)� (2)� (3)� (4)� (5)� (6)� (7)�
01� Banggai�Kepulauan�� 7�402� 3�529� 59�888� 14�148� 4�723� 89�690�
02� Banggai� 10�244� 6�485� 120�928� 21�337� 15�042� 174�036�
03� Morowali� 12�906� 12�653� 49�195� 7�105� 16�279� 98�138�
04� Poso�� 13�340� 13�988� 41�169� 27�576� 7�587� 103�660�
05� Donggala�� 48�344� 8�185� 47�194� 20�965� 6�967� 131�655�
06� Tolitoli������� 11�090� 6�485� 37�776� 8�500� 26�188� 90�039�
07� Buol� 33�423� 1�411� 24�006� 1�795� 4�612� 65�247�
08� Parigi�Moutong� 14�345� 36�270� 137�614� 8�399� 6�871� 203�499�
09� Tojo�Una�Una� 14�430� 6�625� 25�773� 15�747� 5�007� 67�582�
10� Palu� 11�921� 14�121� 90�686� 13�511� 10�588� 140�827�
11� Sigi� 28�908� 5�775� 60�070� 9�126� 7�255� 111�134�
Sulawesi�Tengah� 206�353� 115�527� 694�299� 148�209� 111�119� 1�275�507�
http
://sul
teng
.bps
.go.
id

Pemerintahan
42 Sulawesi Tengah Dalam Angka 2014
Tabel�
Table�3.7�
Jumlah�Keanggotaan�DPRD�2009�2014�menurut�Fraksi�dan�Jenis�Kelamin�Number�of�Local�Assembly�Memberships�of�2009�2014�by�Faction�and�Sex�
�
Nama�Fraksi�Faction�Name�
Anggota�Members�
Jumlah�Total�
Laki�laki�Male�
Perempuan�
Female�(1)� (2)� (3)� (4)�
� � � � �
01.�� Fraksi�Partai�Golkar�/�Golkar�Faction� 7� 2� 9�
02.�� Fraksi�Partai�Demokrat�/�Demokrat�Faction� 8� 1� 9�
03.� Fraksi�PDIP�/�PDIP�Faction� 5� 1� 6�
04.�� Fraksi��PKS/�PKS��Faction� 4� 2� 6�
05.� Fraksi�PAN�/�PAN�Faction� 7� �� 7�
06.� Fraksi�TADULAKO/�TADULAKO�Faction� 6� 2� 8�
Jumlah/Total� 37� 8� 45�
Sumber/�Source�:� Sekretariat�DPRD�Provinsi�Sulawesi�Tengah�House�of�Parliament�Secretariat�of�Sulawesi�Tengah�Province�
http
://sul
teng
.bps
.go.
id

Government
Sulawesi Tengah in Figures 2014 43
Tabel�
Table�3.8�
Jumlah� Keanggotaan� DPRD� 2009�2014� menurut� Partai� Politik� dan� Jenis�Kelamin�Number�of�Local�Assembly�Memberships�of�2009�2014�by�Political�Party�and�Sex�
�
Nama�Partai�Party�Name�
Anggota�Members� Jumlah�
Total�Laki�laki�Male�
Perempuan�Female�
(1)� (2)� (3)� (4)�� � � � �01.�� Partai�Golkar� 7� 2� 9�
02.�� Partai�Demokrat� 5� 1� 6�
03.� Partai�Demokrasi�Indonesia�Perjuangan� 3� 1� 4�
04.�� Partai�Amanat�Nasional� 4� �� 4�
05.� Partai�Keadilan�Sejahtera� 3� 1� 4�
06.� Partai�Damai�Sejahtera� 2� 1� 3�
07.� Partai�Hati�Nurani�Rakyat� 2� 1� 3�
08.� Partai�Persatuan�Pembangunan� 2� �� 2�
09.� Partai�Gerakan�Indonesia�Raya� 1� 1� 2�
10.� Partai�Karya�Peduli�Bangsa� 2� �� 2�11.� Partai�Keadilan�dan�Persatuan�
Indonesia� 2� �� 2�
12.� Partai�Kebangkitan�Bangsa� 1� �� 1�
13.� Partai�Demokrasi�Pembaharuan� 1� �� 1�
14.� Partai�Bintang�Reformasi� 1� �� 1�
15.� Partai�Patriot� 1� �� 1�
� � � � �
Jumlah/�Total� 37� 8� 45�
Sumber/�Source�:� Sekretariat�DPRD�Provinsi�Sulawesi�Tengah�House�of�Parliament�Secretariat�of�Sulawesi�Tengah�Province�
http
://sul
teng
.bps
.go.
id

Pemerintahan
44 Sulawesi Tengah Dalam Angka 2014
Tabel�
Table�3.9�
Jumlah�Keanggotaan�DPRD�2009�–�2014�menurut�Fraksi�dan�Pendidikan�Number� of� Local� Assembly� Memberships� of� 2009� –� 2014� by� Faction� and�Education�
�
Nama�Fraksi�Faction�Name�
Pendidikan�/�Education�
Jumlah�Total�
S2�ke�atas�
Master�and�over�
S1�Scholar�
Akademi�Diploma�
SLTA�Senior�High�School�
(1)� (2)� (3)� (4)� (5)� (6)�� � � � � � �
01.�� Fraksi�Partai�Golkar� 5� 4� �� �� 9�
02.�� Fraksi�Partai�Demokrat� �� 5� �� 4� 9�
03.� Fraksi�PDIP� 1� 4� �� 1� 6�
04.� Fraksi�PKS� 1� 4� �� 1� 6�
05.� Fraksi�PAN� 1� 5� �� 1� 7�
06.�� Fraksi�TADULAKO� 2� 5� �� 1� 8�
� � � � � � �
Jumlah/�Total� 10� 27� �� 8� 45�
Sumber/�Source�:� Sekretariat�DPRD�Provinsi�Sulawesi�Tengah�House�of�Parliament�Secretariat�of�Sulawesi�Tengah�Province�
http
://sul
teng
.bps
.go.
id

Government
Sulawesi Tengah in Figures 2014 45
Tabel�
Table�3.10�
Jumlah� Keanggotaan� DPRD� 2009� –� 2014� menurut� Fraksi� dan� Kelompok�Umur�Number�of�Local�Assembly�Membership�of�2009�–�2014��by�Faction�and�Age�Group�
�
Nama�Fraksi�Faction�Name�
Kelompok�Umur�/�Age�Group� Jumlah�Total�30�34 35�39 40�44 45�49 50�54 55�59 60�+�
(1)� (2)� (3)� (4)� (5)� (6)� (7)� (8)� (9)�� � � � � � � � � �
01.�� Fraksi�Partai�Golkar� �� 1� 1� 1� 2� 2� 2� 9�
02.�� Fraksi�Partai�Demokrat� �� �� 3� 1� 2� 2� 1� 9�
03.� Fraksi�PDIP� �� �� 2� ��1� 1� 1� 1� 6�
04.� Fraksi�PKS� 3� 1� �� 1� �� �� 1� 6�
05.� Fraksi�PAN� �� �� 1� 2� 1� 1� 2� 7�
04.�� Fraksi�TADULAKO� �� 1� �� �� 1� 1� 5� 8�
� � � � � � � � � �
Jumlah/�Total��������� 3� 3� 7� 6� 7� 7� 12� 45�
Sumber/�Source�:� Sekretariat�DPRD�Provinsi�Sulawesi�Tengah�House�of�Parliament�Secretariat�of�Sulawesi�Tengah�Province�
http
://sul
teng
.bps
.go.
id

Pemerintahan
46 Sulawesi Tengah Dalam Angka 2014
Tabel�Table� 3.11�
Jumlah�Keputusan�DPRD�Provinsi�Menurut�Jenisnya,�2009�2013�Numbers�of�Acts�of�Assembly�at�Province��Type�of�Act,�2009�2013�
��
Jenis�Keputusan�Type�of�Acts� 2009� 2010� 2011� 2012� 2013�
(1)� (2)� (3)� (4)� (5)� (6)�
� � � � � �
1. Peraturan�Daerah�Regional�Regulation� 13� 7� 8� �� 2�
2. Keputusan�DPRD�DPRD�Decisions� 41� 32� 45� 33� 26�
3. Nota�/�Note� �� �� �� �� ��
4. Pernyataan�/�Statement� �� �� �� �� ��
5. Pernyataan�Pendapat�/�Opinion� �� �� �� �� ��
6. Resolusi�/�Resolution� �� �� �� �� ��
7. Kesimpulan,�Pendapat�Conclusion� �� �� �� �� ��
8. Keputusan�Pimpinan��DPRD�Chief’s�Decision�� 31� 30� 33� 36� 39�
9. Keputusan�Panitia�Musyawarah�/�Conference�Committee�Decision� 1� 1� �� �� ��
10. Memorandum�/�Memorandum� 10� 3� 3� �� ��
11. Panitia��Anggaran�Budget�Committee� 1� 1� �� �� ��
12. Panitia�Khusus�Ad�hoc�committee� �� 13� 14� �� ��
13. Rekomendasi/Recommendation� 3� 7� 4� �� 5�
Jumlah/Total� 100� 94� 107� 69� 72�
Sumber/�Source�:� Sekretariat�DPRD�Provinsi�Sulawesi�Tengah�House�of�Parliament�Secretariat�of�Sulawesi�Tengah�Province�
http
://sul
teng
.bps
.go.
id

Government
Sulawesi Tengah in Figures 2014 47
Tabel�
Table�3.12�
Jumlah�Keputusan�DPRD�Kabupaten/Kota�Menurut�Jenisnya,�2013�Numbers�of�Acts�of�Assembly�at�Regency/City�Type�of�Act,�2013�
�
Jenis�Keputusan�Type�of�Acts�
Peraturan�Daerah�Regional�Regulation
Keputusan�DPRD/�DPRD�
Decisions�
NotaNote�
PernyataanStatement�
Pernyataan�PendapatOpinion�
Resolusi�Resolution�
Kesimpulan,�Pendapat�Conclusion�
(1)� (2)� (3)� (4)� (5)� (6)� (7)� (8)�
� � � � � � � �
1. Banggai�Kepulauan� 13� 18� 4 �� �� �� ��
2. Banggai� �� 16� � �� �� �� 40�
3. Morowali� 16� 12� 1 �� �� �� 1�
4. Poso� 13� 15� � �� �� �� ��
5. Donggala� 8� 26� � �� �� �� ��
6. Tolitoli� 11� 16� 5 �� �� �� ��
7. Buol� 7� 3� 7 �� �� �� ��
8. Parigi�Moutong� 11� 17� � �� �� �� ��
9. Tojo�Una�Una� 17� 24� � �� �� �� ��
10. Sigi� 15� 13� 4 �� �� �� ��
11. Banggai��Laut1)� …� …� … …� …� …� …�
12. Morowali�Utara1)� …� …� … …� …� …� …�
13. Palu� 14� 20� �� �� �� �� ��
Jumlah/Total� 125� 180� 21 �� �� �� 41�
�
�
�
http
://sul
teng
.bps
.go.
id

Pemerintahan
48 Sulawesi Tengah Dalam Angka 2014
Lanjutan�Tabel�/Continued�Table��3.12�
�
Sumber/�Source�:� Sekretariat�DPRD�Kabupaten/Kota�House�of�Parliament�Secretariat�of�Regency/City�
Catatan/Note�����:����1)�Tergabung�Dengan�Kabupaten�Induknya/�Include�in�main�regency�
Jenis�Keputusan�Type�of�Acts�
Keputusan�Pimpinan��
DPRD�Chief’s�Decision��
Keputusan�Panitia�
Musyawarah�/�Conference�Committee�Decision���
Memorandum��memorandum�
��Panitia��Anggaran�Budget�
Committee��
Panitia�Khusus�Adhoc�
committee�
Reko�mendasi�Recom�
mendation�
(1)� (9)� (10)� (11)� (12)� (13)� (14)�
� � � � � � �
1. Banggai�Kepulauan� 22� 7� �� �� 15� 1�
2. Banggai� 1� 8� �� �� 4� ��
3. Morowali� 11� 4� �� 3� 2� 1�
4. Poso� 27� �� �� �� �� ��
5. Donggala� 12� 12� �� 2� �� ��
6. Tolitoli� 11� 3� �� 3� 5� ��
7. Buol� 7� 10� 14� 16� �� ��
8. Parigi�Moutong� 16� �� �� �� �� ��
9. Tojo�Una�Una� �� 13� �� �� �� ��
10. Sigi� 13� �� �� �� �� ��
11. Banggai�Laut1)� …� …� …� …� …� …�
12. Morowali�Utara1)� …� …� …� …� …� …�
13. Palu� 8� 8� ��� ��� ��� ���
Jumlah/Total� 128� 65� 14� 24� 26� 2�
http
://sul
teng
.bps
.go.
id

Government
Sulawesi Tengah in Figures 2014 49
Tabel�
Table�3.13�
Jumlah� Pegawai� Negeri� Sipil� di� Lingkungan� Pemerintah� Daerah� Provinsi�Sulawesi�Tengah�menurut�Golongan/Ruang,�2013*)�Number�of�Civil� Servants�of� Local�Government� in�Sulawesi� Tengah�Province�by�Heirarchy,�2013*)�
Golongan/Ruang�Hierarchy�
Jumlah�Total�
(Jiwa/Person)�
Persentase�menurut�Golongan�Percentage�by�Hierarchy�
(1)� (2)� (3)�� � � � �
Golongan�I� � �I/a� 30� 0,00�I/b� 21� 0,33�I/c� 30� 0,47�I/d� 21� 0,33�
Sub�Jumlah/Sub�Total� 102� 1,59�� � � � �
Golongan�II� � �II/a� 383� 5,96�II/b� 846� 13,17�II/c� 451� 7,02�II/d� 304� 4,73�
Sub�Jumlah/Sub�Total� 1�984� 30,88�� � � � �
Golongan�III� � �III/a� 828� 12,89�III/b� 1�452� 22,60�III/c� 730� 11,36�III/d� 756� 11,77�
Sub�Jumlah/Sub�Total� 3�766� 58,61�� � � � �
Golongan�IV�� � �IV/a� 327� 5,09�IV/b� 184� 2,86�IV/c� 39� 0,61�IV/d� 23� 0,36�IV/e� 0� 0,00�
Sub�Jumlah/Sub�Total� 573� 8,92��
� � � �Jumlah/Total� 6�425� 100,00�
Sumber/�Source�:� Badan�Kepegawaian�Pendidikan�dan�Pelatihan�Daerah�Provinsi�Sulawesi�Tengah�Regional�Office�for�Civil�Servant�Management�Education�and�Training��of�Sulawesi�Tengah�Province�
Catatan/Note������:����*)�Kondisi�Maret�2014/Condition�March�2014�
http
://sul
teng
.bps
.go.
id

Pemerintahan
50 Sulawesi Tengah Dalam Angka 2014
Tabel�
Table�3.14�
Jumlah� PNS� di� Lingkungan� Pemerintah� Daerah� Provinsi� Sulawesi� Tengah�Menurut�Tingkat�Pendidikan,�2009���2013*)�Number�of�Civil�Servants�of�Local�Government�in�Sulawesi�Tengah�Province�by�Educational�Level,2009�–�2013*)�
�
Jenis�Pendidikan�Educational�Level�
Jumlah�Total�
(Jiwa/Person)�
Persentase�Menurut�Pendidikan�
Percentage�by��Educational�Level�
(1)� (2)� (3)�
1.�SD/Primary�School� 92� 1,43�
2.�SLTP/Junior�High�School� 86� 1,34�
3.�SLTA/Senior�High�School� 2�368� 36,86�
4.�Diploma�I,II/Diploma� 50� 0,78�
5.�Diploma�III/�Sarjana�Muda/Bachelor�Degree� 908� 14,13�
6.�Strata�I/�Scholar�Degree� 2�341� 36,44�
7.�Strata�II/Master�Degree� 560� 8,72�
8.�Strata�III/Doctoral�Degree� 20� 0,31�
� � � � �
Jumlah/�Total� � �
2013� 6�425� 100,00�
2012� 6�614� 100,00�
2011� 6�867� 100,00�
2010� 6�716� 100,00�
2009� 6�720� 100,00�
Sumber/�Source�:� Badan�Kepegawaian�Pendidikan�dan�Pelatihan�Daerah�Provinsi�Sulawesi�Tengah�Regional�Office�for�Civil�Servant�Management�Education�and�Training��of�Sulawesi�Tengah�Province�
Catatan/Note�����:�����*)�Kondisi�Maret�2014/Condition�March�2014�
http
://sul
teng
.bps
.go.
id

Government
Sulawesi Tengah in Figures 2014 51
Tabel�
Table�3.15�
Jumlah� Pegawai� Negeri� Sipil� di� Lingkungan� Pemerintah� Daerah�Kabupaten/Kota�Menurut�Golongan/Ruang,�2013*)�Number� of� Civil� Servants� of� Local� Government� at� by� Hierarchy� and�Regency/City,2013*)��
Kabupaten/Kota�Regency/City�
Golongan/Hierarchy� Jumlah�Total�Gol.�I� Gol.�II� Gol.�III� Gol.�IV�
(1)� (2)� (3)� (4)� (5)� (6)�� � � � � �
01.��� Banggai�Kepulauan� �91� 2�093� 2�223� �341� 4�748�
02.� Banggai� �120� 2�772� 3�876� 1�867� 8�635�
03.� Poso�� �108� 2�978� 3�415� 1�239� 7�740�
04.� Morowali�� �49� 2�492� 2�802� 1�016� 6�359�
05.� Donggala�� �50� 1�942� 2�840� 1�143� 5�975�
06.��� Toli�Toli�� �43� 1�858� 2�880� �784� 5�565�
07.� Buol� �39� 1�616� 2�370� �505� 4�530�
08.��� Parigi�Moutong� �91� 2�392� 2�879� �887� 6�249�
09.� Tojo�Una�Una� �41� 1�894� 1�781� �549� 4�265�
10.� Sigi� �53� 1�679� 2�898� �769� 5�399�
11.� Banggai�Laut1)� …� …� …� …� …�
12.� Morowali�Utara1)� …� …� …� …� …�
13.��� Palu�� �91� 1�914� 4�230� 1�964� 8�199�
� � � � � �
Sumber/�Source�:� Badan�Kepegawaian�Pendidikan�dan�Pelatihan�Daerah�Provinsi�Sulawesi�Tengah�Regional�Office�for�Civil�Servant�Management�Education�and�Training��of�Sulawesi�Tengah�Province�
Catatan/Note������:����*)�Kondisi�Maret�2014/Condition�March�2014�� ������1)�Tergabung�Dengan�Kabupaten�Induknya/�Include�in�main�regency�
http
://sul
teng
.bps
.go.
id

Pemerintahan
52 Sulawesi Tengah Dalam Angka 2014
Tabel�
Table�3.16�
Jumlah� Pegawai� Negeri� Sipil� di� Lingkungan� Pemerintah� Daerah�Kabupaten/Kota�menurut�Tingkat�Pendidikan,�2013*)�Number�of�Civil� Servants�of�Local�Government�Regency/City�by� �Educational�Level,�2013*)�
�
Kabupaten/Kota�Regency/City�
SD�Elementary�School�
SLTP�Junior�High�School�
SLTA�Umum�dan�KejuruanSenior�and�Vocational�High�School�
�Diploma��
I/II/III��
(1)� (2)� (3)� (4)� (5)�� � � � �
01.��� Banggai�Kepulauan�� �19� �79� 1�692� 1�252�
02.� Banggai�� �65� �146� 3�193� 1�873�
03.� Poso�� �75� �90� 2�805� 1�806�
04.��� Morowali� �38� �72� 2�714� 1�289�
05.� Donggala� �23� �53� 1�821� 1�446�
06.� Toli�Toli� �33� �73� 2�218� 1�351�
07.� Buol� �17� �49� 1�285� �987�
08.� Parigi�Moutong� �39� �52� 1�662� 1�902�
09.� Tojo�Una�Una� �31� �49� 1�150� 1�531�
10.� Sigi� �27� �57� 1�869� 1�319�
11.� Banggai�Laut1)� …� …� …� …�
12.� Morowali�Utara1)� …� …� …� …�
13.� Kota�Palu� 55� 100� 2�226� 1�942�
� � � � �
�
�
�
http
://sul
teng
.bps
.go.
id

Government
Sulawesi Tengah in Figures 2014 53
Lanjutan�Tabel�/�Continued�Table��3.16�
�
Kabupaten/Kota�Regency/City�
Strata�Degree�1�
Strata�Degree�2�
Strata�Degree�3�
Jumlah�Total�
(1)� (8)� (9)� (10)� (11)�� � � � �
01.��� Banggai�Kepulauan�� 1�630� �76� �0� 4�748�
02.� Banggai� 3�305� �53� �0� 8�635�
03.� Poso�� 2�784� �179� �1� 7�740�
04.��� Morowali� 2�195� �51� �0� 6�359�
05.� Donggala� 2�462� �168� �2� 5�975�
06.� Toli�Toli� 1�857� �33� �0� 5�565�
07.� Buol� 2�124� �67� �1� 4�530�
08.� Parigi�Moutong� 2�457� �135� �2� 6�249�
09.� Tojo�Una�Una� 1�454� �50� �0� 4�265�
10.� Sigi� 1�959� �167� �1� 5�399�
11.� Banggai�Laut1)� …� …� …� …�
12.� Morowali�Utara1)� …� …� …� …�
13.� Kota�Palu� 3�752� �122� �2� 8�199�
� � � � �
Sumber/�Source�:� Badan�Kepegawaian�Pendidikan�dan�Pelatihan�Daerah�Provinsi�Sulawesi�Tengah�Regional�Office�for�Civil�Servant�Management�Education�and�Training��of�Sulawesi�Tengah�Province�
Catatan/Note������:�����*)�Kondisi�Maret�2014/Condition�March�2014�� � �1)�Tergabung�Dengan�Kabupaten�Induknya/�Include�in�main�regency�
http
://sul
teng
.bps
.go.
id

Pemerintahan
54 Sulawesi Tengah Dalam Angka 2014
Tabel�
Table�3.17�
Jumlah� Personil� Satuan� Perlindungan� Masyarakat� Menurut�Kabupaten/Kota,�2009��2013�
Number�of�Civil�Defense�by�Regency/City,�2009�2013�
�
Kabupaten/�Kota�Regency/City�
Jumlah�LINMAS�Number�of�LINMAS�
(1)� (2)�
� �
01.��� Banggai�Kepulauan�� 3�622�
02.� Banggai� 5�348�
03.� Morowali� 4�114�
04.��� Poso�� 3�150�
05.��� Donggala�� 3�296�
06.� Tolitoli� 2�140�
07.��� Buol�� 2�126�
08.� Parigi�Moutong� 4�252�
09.� Tojo�Una�Una� 2�470�
10.� Sigi� 3�098�
11.� Banggai�Laut1)� …�
12� Morowali�Utara1)� …�
13.��� Palu� 1�738�
� �
Jumlah�/�Total� �
� 2013� 35�354�
� 2012� 35�354�
� 2011� 35�354�
� 2010� 28�899�
� 2009� 28�899�
Sumber/�Source�:� Satuan�Polisi�Pamong�Praja�Daerah�Provinsi�Sulawesi�Tengah.�Civil�Service�Police�Unit�Services�Sulawesi�Tengah��Province�
Catatan/Note�����:����1)��Tergabung�Dengan�Kabupaten�Induknya/�Include�in�main�regency�
http
://sul
teng
.bps
.go.
id

Population and Employment
Sulawesi Tengah in Figures 2014 55
PENDUDUK DAN TENAGA KERJA
Populationand Manpowerht
tp://s
ulte
ng.b
ps.g
o.id

Penduduk dan Tenaga Kerja
56 Sulawesi Tengah Dalam Angka 2014
http
://sul
teng
.bps
.go.
id

Population and Employment
Sulawesi Tengah in Figures 2014 57
4.��PENDUDUK�DAN�KETENAGAKERJAAN��4.1.�Penduduk�
�Sejak� Indonesia� merdeka,� BPS� telah�
melaksanakan�Sensus�Penduduk�sebanyak�lima� kali.Pertama� kali� tahun�1961,� namun�Provinsi�Sulawesi�Tengah�belum�terbentuk�pada� waktu� itu.� Kemudian� ke� dua� kalinya�pada� tahun� 1971� jumlah� penduduk�Sulawesi� Tengah� tercatat� 914� ribu� jiwa,�tahun�1980�jumlahnya�meningkat�menjadi�1,28� juta� jiwa,� kemudian� meningkat� lagi�menjadi� 1,71� juta� jiwa� pada� tahun� 1990,�dan� pada� tahun� 2000� penduduk� Sulawesi�Tengah� mencapai� 2,176� ribu� jiwa.� Rata�rata� laju� pertumbuhan� penduduk� per�tahun� selama� periode� 1971�1980� adalah�sebesar� 3,87� persen� kemudian� menurun�menjadi� 2,87� persen� pada� periode� 1980�1990� dan� turun� lagi� menjadi� 2,52� persen�pada� periode� 1990�2000.� Laju�pertumbuhan� penduduk� terus� mengalami�penurunan� hingga� tahun� 2010� dimana�periode� 2000�2010� mencapai� laju�pertumbuhan� mencapai� 1,95� persen�dengan� jumlah� penduduk� pada� tahun�2010� mencapai� 2,64� juta� jiwa.� Kemudian�tahun� 2013� penduduk� Sulawesi� Tengah�mencapai�2,78�juta�jiwa.�
Ditinjau� dari� jenis� kelamin,� jumlah�penduduk� Sulawesi� Tengah� pada� tahun�2013� yang� berjenis� kelamin� laki�laki� lebih�banyak� dari� pada� penduduk� perempuan,�yaitu� 1,42� juta� jiwa� berbanding� 1,36� juta�
4.POPULATION AND EMPLOYMENT���4.1.��Population��
BPS� conducted� Population� Census�five� times� since� Indonesia� freedom.� The�Population�Census�was�conducted�for�the�first� time� in� 1961,� but� Sulawesi� Tengah�Province� had� not� been� formed� in� then.�Later,�the�implementation�at�second�time�in�1971,�and�total�population�of�Sulawesi�Tengah� counted� 914� thousand� persons.�The�number�in�1980�became�1.28�million�persons,�next�more�increased�1.71�million�persons� in� 1990,� and� in� 2000� reached�2.176� thousand� persons.� Average�population� growth� rate� per� annum�during� 1971�1980�was� 3.86�percent,� but�during� period� 1980�1990� went� down� to�2.87�percent�and� still� decreasing� to�2,57�percent� during� 1990�2000.� Population�growth� rate� continues� to� decline� until�2010� when� the� period� 2000�2010� to�reach� the� growth� rate� reached� 1.95�percent� with� a� total� population� in� 2010�reached� 2.64� million.� Then� in� 2013� the�population� of� Sulawesi� Tengah� reached�2.78�million.�
��By�looking�of�sex,�the�population�of�
Sulawesi� Tengah� in� 2013� had� 1.42�thousand� males� and� 1.36� thousand�females,� or� had� sex� ratio� (of� males� to�females)�by�104.58.�
�
http
://sul
teng
.bps
.go.
id

Penduduk dan Tenaga Kerja
58 Sulawesi Tengah Dalam Angka 2014
jiwa� dengan� rasio� jenis� kelamin� sebesar�104,58.�
Provinsi� Sulawesi� Tengah� yang�memiliki� 1.944� desa/kelurahan� dan�652.951� rumahtangga� serta� luas� wilayah�61.841,29� �km2,�secara�umum�pada�tahun�2013� memiliki� kepadatan� penduduk� 45�jiwa�per�km2,�1.433� jiwa�per�desa,�serta�4�jiwa� dalam� setiap� rumah� tangga,� (Tabel�4.1.4�Tabel�4.1.6).�
�Data� penduduk� Sulawesi� Tengah�
yang�disajikan�pada�publikasi�ini�mencakup�12� kabupaten� dan� 1� kota.� Kabupaten�Parigi�Moutong�memiliki�jumlah�penduduk�terbanyak,�yakni� �441.020� jiwa�atau�15,83�persen� dari� total� penduduk� Sulawesi�Tengah.�
�Selama� ini� Pemerintah� Daerah�
Sulawesi� Tengah� terus� melakukan� upaya�untuk� menyusun� tata� ruang� perkotaan�yang�tepat�dan�bagaimana�memberi�ruang�hidup,� makanan,� air� bersih,� pelayanan�kesehatan,� obat�obatan,� pendidikan,�pekerjaan,� pe�rumahan� dan� prasarana�transportasi� serta� berbagai� kebutuhan�lainnya� kepada� penduduk� Provinsi�Sulawesi�Tengah.�����
�4.2.��Ketenagakerjaan�
�Berdasarkan� kegiatannya,�
penduduk� usia� 15� tahun� ke� atas� dapat�dibedakan� menjadi� angkatan� kerja� dan�yang� bukan� angkatan� kerja.� Pada� tahun�
�Sulawesi�Tengah�Province�has�1,944�
villages,�652,951�households�and�area�by�61,841,29�square�kilometer�in�2013,�even�has� density� 45� persons� per� square�kilometer,�1,433�persons�per�village,�and�4� persons� in� every� household,� as�presented�in�Table�4.1.4�Table�4.1.6).�
��The� population� of� Sulawesi�
Tengah�covered�12�regencies�and�1�City.�Parigi� Moutong� Regency� has� a� biggest�population� of� total� population� in�Sulawesi� Tengah� that� was� 441,020�persons�or�15.83�percent.�
��The� regional� government� of� Sulawesi�
Tengah� has� been� continuing� efforts� for�making� up� the� urban� planning� program��and� how� to� give� a� better� living� space,�food,� clean� water,� health� services,�medicines,� education,� job� opportunities,�housing,� transportation� and� other�facilities� to� societies� of� Sulawesi� Tengah�Province.�
��
4.2.�Employment��According� to� the� economic� activities,�
the� population� aged� 15� years� and� over�could� be� divided� into� two� group,� those�were� labor� force� and� not� labor� force.� In�2013,� the� number� of� labor� forces� of�
http
://sul
teng
.bps
.go.
id

Population and Employment
Sulawesi Tengah in Figures 2014 59
2013� jumlah� angkatan� kerja� Provinsi�Sulawesi� Tengah� sebesar� 1,23� juta� orang�dan�bukan�angkatan�kerja�0,63�juta�orang.�
�Selanjutnya� dari� angkatan� kerja�
tersebut� terdapat� penduduk� � bekerja�sebanyak� 1,18� juta� orang� dan�pengangguran� sebanyak� 52� ribu� orang�(Tabel� 4.2.2).Sebagian� besar� penduduk�Sulawesi� Tengah� bekerja� pada� � sektor�pertanian,� jasa�jasa,� perdagangan/hotel�dan� restoran,� � masing�masing� sebesar�49,25� persen,� 18,86� persen,� dan� 14,22�persen.��
�Jika� dilihat� berdasarkan� status�
pekerjaannya� ada� sebesar� 20,67� persen�yang� berusaha� dibantu� anggota� rumah�tangga�atau�buruh�tidak�tetap,�sementara�dengan� status� buruh/karyawan� sebesar�29,06�persen�dan�sebagai�pekerja�keluarga�(pekerja� tak� dibayar)� sebesar� 19,37�persen.�
�Jumlah� pencari� kerja� yang� terdaftar�
di� Dinas� Tenaga� Kerja� hampir� 21,11� ribu�orang.� Lebih� dari� separuh� pencari� kerja�tersebut� mendaftar� dengan� bekal� ijazah�lulusan� SLTA� sebesar� 54,39� persen,yang�disusul� oleh� lulusan� universitas� atau� yang�sederajat� sebesar� 24,44� persen,� (Tabel�4.2.7).�
�����
Sulawesi� Tengah� was� 1.23� million� and�not�labor�force�was�0.63�million�people.�
��From� those� numbers� of� labor� forces�
who�worked�1.28�million,�and�around�52�thousand� people� unemployments.� Most�of�population�in�Sulawesi�Tengah�worked�in� agricultural� sector,� services� and�trading/hotel� and� restaurant� sector�which� had� respective� contribution� by�49.25� percent,� 18.86� percent,� and� 14.22�percent.�
��By� the� employment� status,� around�
20.67�percent�of�all�workers�who�worked�by� family� member� assist� or� temporary�employee,� 29.06� percent� was� regular�employee� and� 19.37� percent� was� as�family�workers�(unpaid�workers).�
���The� number� of� registered� job� seekers�
in� Regional� Government� Services� of�manpower� of� Sulawesi� Tengah� Province�was� nearly� 21.11� thousand� persons.�More� than� half� of� those� persons� were�graduated� senior� high� school,� (24.39�percent),� and� 27.44� � percent� of�graduated� universities� (as� presented� in�Table�4.2.7).�
����
http
://sul
teng
.bps
.go.
id

Penduduk dan Tenaga Kerja
60 Sulawesi Tengah Dalam Angka 2014
�����������
�����������
http
://sul
teng
.bps
.go.
id

Su
1
1
2
2
3
3
4
4
5
5
6
lawesi Tengah i
200 000 1
0 - 4
5 - 9
0 - 14
5 - 19
0 - 24
5 - 29
0 - 34
5 - 39
0 - 44
5 - 49
0 - 54
5 - 59
0 - 64
65+
Gambar�Figure�
in Figures 2014
50 000 100 00
Laki�laki�/�
4.1�PiramPopul
00 50 000
Male
mida�Penduduk�lation�Pyramid�
0 50 00
Perem
Provinsi�Sulawof�Sulawesi�Ten
Populat
00 100 000
mpuan�/�Fem
wesi�Tengah,�Tangah�Province,�
tion and Employ
150 000 200 0
ale
ahun�2013�2013�
yment
61
000
http
://sul
teng
.bps
.go.
id

Penduduk dan Tenaga Kerja
62 Sulawesi Tengah Dalam Angka 2014
http
://sul
teng
.bps
.go.
id

Sulawesi Tengah i
Beke
Dala
m�R
ibua
n
GambarFigure
4.
in Figures 2014
erja/ Working PengUnem
779141
3
396789
Laki-laki
2PenduduKegiatanPopulation
gangguran/ mployment
SAtten
32146 520261
Jenis Kegiatan
/ Male
k Berusia , 2013 n 15 Years of
Sekolah/ nding School
MengT
Hou
96712
61546
n / Type of Activities
Pere
15 Tahun
f Age and Ove
Populat
gurus Rumah Tangga/ usekeeping
Lain
22988
398147
empuan / Female
Keatas men
er by Type of
tion and Employ
nnya/ Others
59200 33346
nurut Jen
f Activity, 2013
yment
63
is
3
http
://sul
teng
.bps
.go.
id

Penduduk dan Tenaga Kerja
64 Sulawesi Tengah Dalam Angka 2014
http
://sul
teng
.bps
.go.
id

Population and Employment
Sulawesi Tengah in Figures 2014 65
4. PENDUDUK DAN KETENAGAKERJAAN POPULATION AND EMPLOYMENT
�
4.1. Penduduk / Population
�(Diolah�dari�Hasil�Sensus�Penduduk,�1971,1980,�1990,�2000,2010�dan�Supas�2005)�(Based�on�1971,1980,1990,2000�,2010�Population�Census,�and�Intercensal�Population�Survey,�2005)�
Sensus Penduduk Population Census
Jenis Kelamin/SexJumlah Total
(Jiwa/Person)
Laju Pertumbuhan
Population Growth
(%)
Laki-laki Male
(Jiwa/Person)
PerempuanFemale
(Jiwa/Person)(1) (2) (3) (4) (5)
1 9 7 11 467 166 446 496 913 662 2,83 (1961-1971)
1 9 8 01 655 285 624 350 1289 635 3,87 (1971-1980)
1 9 9 01 877 039 834 288 1 711 327 2,87 (1980-1990)
2 0 0 01 1 113 212 1 062 781 2 175 993 2,52 (1990-2000)
2 0 1 01 1 350 844 1 284 165 2 635 009 1,95 (2000-2010)
2 0 1 32 1 423 938 1 361 550 2 785 488 1,95 (2010-2013)
Catatan/Note� :� 1Sensus�Penduduk,2Proyeksi�Penduduk�diolah�dari�Hasil�SP2010�1Population�Census,2Projection�figures�based�on�result�of�The�2010�SP
Tabel Table
4.1.1Jumlah dan Laju Pertumbuhan Penduduk,1971,1980, 1990, 2000, 2010 dan 2013 Number and Population Growth, 1971,1980, 1990, 2000, 2010, and 2013
http
://sul
teng
.bps
.go.
id

Penduduk dan Tenaga Kerja
66 Sulawesi Tengah Dalam Angka 2014
Tabel Table
4.1.2Penduduk menurut Jenis Kelamin dan Rasio Jenis Kelamin menurut Kabupaten/Kota, 2013 Population by Sex and Sex Ratio by Regency/City, 2013
�(Proyeksi�Penduduk�diolah�dari�hasil��SP�2010)�(Projection�figures�based�on�result�of�The�2010�SP)�
Kabupaten/Kota Regency/City
Jenis Kelamin/SexJumlah Total
(Jiwa/Person)
Rasio Jenis KelaminSexRatio
Laki-laki Male
(Jiwa/Person)
PerempuanFemale
(Jiwa/Person)(1) (2) (3) (4) (5)
01. Banggai Kepulauan 57 078 55 947 113 025 102,02
02. Banggai 174 614 168 084 342 698 103,88
03. Morowali 55 678 53 195 108 873 104,67
04. Poso 116 827 108 552 225 379 107,62
05. Donggala 147 288 140 633 287 921 104,73
06. Tolitoli 112 616 107 996 220 612 104,28
07. Buol 73 087 69 498 142 585 105,16
08. Parigi Moutong 226 321 214 699 441 020 105,41
09. Tojo Una-Una 73 630 70 158 143 788 104,95
10. Sigi 115 130 109 084 224 214 105,54
11. Banggai Laut 33 598 33 124 66 722 101,43
12. Morowali Utara 58 780 53 592 112 372 109,68
13. Palu 179 291 176 988 356 279 101,30
Sulawesi Tengah 1 423 938 1 361 550 2 785 488 104,58
� ��
http
://sul
teng
.bps
.go.
id

Population and Employment
Sulawesi Tengah in Figures 2014 67
Tabel Table 4.1.3
Penduduk Menurut Kelompok Umur dan Jenis Kelamin, 2013 Population by Age Group and Sex, 2013
��(Proyeksi�Penduduk�diolah�dari�hasil��SP�2010)�(Projection�figures�based�on�result�of�The�2010�SP)�
Kelompok Umur
Age Group
Jenis Kelamin/Sex Jumlah Total Laki-laki/ Male
(Jiwa/Person)Perempuan/ Female
(Jiwa/Person)(1) (2) (3) (4)
0 - 4 150 047 143 704 293 751
5 - 9 136 072 127 762 263 834
10 - 14 133 910 126 721 260 631
15 - 19 132 465 126 690 259 155
20 - 24 120 950 117 142 238 092
25 - 29 118 297 114 782 233 079
30 - 34 118 379 115 867 234 246
35 - 39 114 077 108 985 223 062
40 - 44 101 353 95 820 197 173
45 - 49 83 393 78 052 161 445
50 - 54 66 622 61 787 128 409
55 - 59 51 687 47 151 98 838
60 - 64 36 949 34 026 70 975
65 + 59 737 63 061 122 798
Jumlah/ Total 1 423 938 1 361 550 2 785 488
�
http
://sul
teng
.bps
.go.
id

Penduduk dan Tenaga Kerja
68 Sulawesi Tengah Dalam Angka 2014
Tabel Table
4.1.4Luas Wilayah, Penduduk dan Kepadatan Penduduk Menurut Kabupaten/Kota, 2013 Regional Area, Population and Population Density by Regency/City, 2013
�(Proyeksi�Penduduk�diolah�dari�hasil��SP�2010)�(Projection�figures�based�on�result�of�The�2010�SP)�
Kabupaten/Kota Regency/City
Luas/Area1
(Km2)
Penduduk Population
(Jiwa/Person)
Kepadatan Penduduk
Population Density (Jiwa/Km2)
(1) (2) (3) (4)
01. Banggai Kepulauan 2 488,79 113 025 45
02. Banggai 9 672,70 342 698 35
03. Morowali 3 037,04 108 873 36
04. Poso 7 112,25 225 379 32
05. Donggala 4 275,08 287 921 67
06. Tolitoli 4 079,77 220 612 54
07. Buol 4 043,57 142 585 35
08. Parigi Moutong 5 089,91 441 020 87
09. Tojo Una-Una 5 721,15 143 788 25
10. Sigi 5 196,02 224 214 43
11. Banggai Laut 725,67 66 722 92
12. Morowali Utara 10 004,28 112 372 11
13. Palu 395,06 356 279 902
Jumlah/Total 61 841,29 2 785 488 45
Catatan/Note : 1) Berdasarkan Peraturan Menteri Dalam Negeri No. 18 tahun 2013 Based on Home Affairs Ministerial Regulation No.18/2013
http
://sul
teng
.bps
.go.
id

Population and Employment
Sulawesi Tengah in Figures 2014 69
Tabel Table 4.1.5
Penduduk, Rumahtangga dan Rata-rata Anggota Rumahtangga menurut Kabupaten/Kota, 2013 Population, Households and Average Household Members by Regency/ City, 2013
(Proyeksi Penduduk diolah dari hasil SP 2010) (Projection figures based on result of The 2010 SP)
Kabupaten/Kota Regency/City
Penduduk Population
(jiwa/person)
Rumahtangga Households
(rt/hh)
Rata-rata Anggota Rumahtangga
Average Households
Member2 (1) (2) (3) (4)
01. Banggai Kepulauan 113 025 28 713 4
02. Banggai 342 698 84 562 4
03. Morowali 108 873 27 047 4
04. Poso 225 379 51 557 4
05. Donggala 287 921 65 419 4
06. Tolitoli 220 612 50 454 4
07. Buol 142 585 33 395 4
08. Parigi Moutong 441 020 100 908 4
09. Tojo Una-Una 143 788 33 117 4
10. Sigi 224 214 52 356 4
11. Banggai Laut 66 722 16 374 4
12. Morowali Utara 112 372 27 052 4
13. Palu 356 279 81 997 4
Jumlah/Total 2 785 488 652 951 4
http
://sul
teng
.bps
.go.
id

Penduduk dan Tenaga Kerja
70 Sulawesi Tengah Dalam Angka 2014
Tabel Table
4.1.6Jumlah Penduduk, Desa/Kelurahan, dan Kepadatan Penduduk per Desa/Kelurahan menurut Kabupaten/Kota, 2013 Number of Population, Villages, and Population Density per Village by Regency/ City, 2013
�(Proyeksi�Penduduk�diolah�dari�hasil��SP�2010)�(Projection�figures�based�on�result�of�The�2010�SP)�
Kabupaten/Kota Regency/City
PendudukPopulation
(jiwa/person)
Desa/Kelurahan Village
Rata-rata Penduduk per Desa
Population Density per Village
(1) (2) (3) (4)
01. Banggai Kepulauan 113 025 144 785
02. Banggai 342 698 337 1 017
03. Morowali 108 873 129 844
04. Poso 225 379 157 1 436
05. Donggala 287 921 166 1 734
06. Tolitoli 220 612 104 2 121
07. Buol 142 585 115 1 240
08. Parigi Moutong 441 020 257 1 716
09. Tojo Una-Una 143 788 144 999
10. Sigi 224 214 155 1 447
11. Banggai Laut 66 722 66 1 011
12. Morowali Utara 112 372 125 899
13. Palu 356 279 45 7 917
Jumlah/Total 2 785 488 1 944 1 433
��
http
://sul
teng
.bps
.go.
id

Population and Employment
Sulawesi Tengah in Figures 2014 71
Tabel Table
4.1.7Jumlah Penempatan Penduduk Transmigrasi Tahun Anggaran 2013 menurut Kabupaten/Kota dan Jenis TransmigrasiNumber of Transmigrant Placements Year 2013 by Regency/City and Kind of Transmigration
�
Kabupaten/Kota Regency/City
Transmigrasi Umum
General Transmigration
Tranmigrasi Swakarsa Own Will
Transmigration
Jumlah Total
KKHead of family
Jiwa Persons
KKHead of family
Jiwa Persons
KKHead of family
Jiwa Persons
(1) (2) (3) (4) (5) (6) (7)
01. Banggai Kepulauan - - - - - -
02. Banggai - - - - - -
03. Morowali 100 435 - - 100 435
04. Poso 110 439 - - 110 439
05. Donggala 100 370 - - 100 370
06. Tolitoli - - - - - -
07. Buol 95 351 - - 95 351
08. Parigi Moutong - - - - - -
09. Tojo Una-Una - - - - - -
10. Sigi 50 163 - - 50 163
11. Banggai Laut - - - - - -
12. Morowali Utara - - - - - -
13. Palu - - - - - -
Jumlah/Total 455� 1�758� �� �� 455� 1�758�
Sumber/Source� :� Dinas�Tenaga�Kerja�dan�Transmigrasi�Provinsi�Sulawesi�Tengah��� � Govt.�Services�of�Manpower�and�Transmigration,�Sulawesi�Tengah�Province�
http
://sul
teng
.bps
.go.
id

Penduduk dan Tenaga Kerja
72 Sulawesi Tengah Dalam Angka 2014
4.2. Ketenagakerjaan/Employment
Tabel Table
4.2.1Penduduk Berumur 15 Tahun Keatas menurut Jenis Kegiatan Utama Selama Seminggu yang Lalu, 2012-2013 Population 15 Years of Age and Over by Type of Activity During the Previous Week, 2012-2013
�(Diolah�dari�Survei�Angkatan�Kerja�Nasional�(Sakernas)�Agustus�2013)�(Based�on�August�2013�National�Labor�Force�Survey)�
Jenis Kegiatan (Type of Activite)
2012 2013 PriaMale
WanitaFemale
JumlahTotal
PriaMale
WanitaFemale
JumlahTotal
(1) (2) (3) (4) (5) (6) (7)
1. Penduduk Usia Kerja Working Age Population(15 +)
935 039 892 329 1 827 368 953 146 910 089 1 863 235
2. Angkatan Kerja Economically Active
799 074 413 989 1 213 063 811 287 417 050 1 228 337
3. Bekerja/ Working 773 423 392 019 1 165 442 779 141 396 789 1 175 930
4. Pengangguran/ Unemployment *
25 652 21 970 47 621 32 146 20 261 52 407
5. Bukan Angkatan Kerja/NotEconomically Active
135 965 478 340 614 305 141 859 493 039 634 898
6. Sekolah/ Attending School
23 928 25 605 49 533 59 671 61 546 121 217
7. Mengurus Rumah Tangga/ Housekeeping
29 985 406 350 436 335 22 988 398 147 421 135
8. Lainnya/ Others 82 052 46 385 128 437 59 200 33 346 92 546
9. T P A K/ LFPR (%) 85,46 46,39 66,38 85,12 45,83 65,92
10. Tingkat Pengangguran Terbuka/ Unemployment Rate (%)
3,21 5,31 3,93 3,96 4,86 4,27
Catatan��:*��Termasuk:� 1)�Mencari�pekerjaan,�2)�Sudah�punya�pekerjaan�tetapi�belum�mulai�bekerja,�� 3)�Mempersiapkan�suatu�usaha,��4)�Tidak�mencari�kerja�karena�merasa�sudah�tidak�
mungkin�mendapat�pekerjaan�/�Including:�1)�Looking�for�work,2)�Have�a�job�in��future�start,3)�Establishing�a�new�business/firm,��4)Hopeless�of�job.�
�
http
://sul
teng
.bps
.go.
id

Population and Employment
Sulawesi Tengah in Figures 2014 73
Tabel Table
4.2.2Penduduk Berumur 15 Tahun Keatas Menurut Kabupaten/Kota dan Jenis Kegiatan, 2013 Population 15 Years of Age and Over by Regency/City and Type of Activity, 2013
��
(Diolah�dari�Survei�Angkatan�Kerja�Nasional�(Sakernas)�Agustus�2013)�(Based�on�August�2013��National�Labor�Force�Survey)�
Kabupaten/Kota Regency/City
Jenis Kegiatan/Type of Activity
Jumlah TotalBekerja
WorkingPengangguranUnemployment
BukanAngkatan
KerjaNot
EconomicallyActive
(1) (2) (3) (4) (5)
01. Banggai Kepulauan 80 161 3 991 32 843 116 995
02. Banggai 139 012 7 226 89 144 235 382
03. Morowali 88 985 2 749 55 120 146 854
04. Poso 110 266 3 269 42 421 155 956
05. Donggala 104 230 6 668 74 324 185 222
06. Tolitoli 82 324 3 433 60 210 145 967
07. Buol 57 893 1 016 29 464 88 373
08. Parigi Moutong 188 142 5 822 95 041 289 005
09. Tojo Una-Una 69 795 1 584 22 205 93 584
10. Sigi 100 337 3 910 46 965 151 212
11. Banggai Laut1) … … … …
12. Morowali Utara1) … … … …
13. Palu*) … … … …
Jumlah/Total 1 175 930 52 407 634 898 1 863 235
Catatan/Note:*)�Secara�Metodologi,�Respon�Rate�Responden�<�70%,�sehingga�tidak�memenuhi�kecukupan�sampel�untuk�estimasi�angka�Kota�Palu/ In�Methodology,�Response�Rate�Respondents�<70%,�so�it�does�not�meet�the�adequacy�of�the�sample�for�estimation�of�Palu��
�������������������������1)��Tergabung�Dengan�Kabupaten�Induknya/�Include�in�main�regency
http
://sul
teng
.bps
.go.
id

Penduduk dan Tenaga Kerja
74 Sulawesi Tengah Dalam Angka 2014
Tabel Table
4.2.3Penduduk Berumur 15 Tahun Keatas yang Bekerja Menurut Pendidikan Tertinggi yang Ditamatkan dan Jenis Kelamin, 2013 Population 15 Years of Age and Over Who Worked During The Previous Week by Level of Educational Attainment and Sex, 2013
� �(Diolah�dari�Survei�Angkatan�Kerja�Nasional�(Sakernas)�Agustus�2013)�(Based�on�August�2013�National�Labor�Force�Survey)�
Pendidikan Tertinggi yang Ditamatkan Educational Attainment
Jenis Kelamin/Sex Jumlah Total Laki-laki
MalePerempuan
Female (1) (2) (3) (4)
A.Tidak/Belum Menamatkan/Uncompleted 1. Tidak/Belum Pernah Sekolah
No Schooling 22 653 31 258 53 911
2. Tidak/ Belum Tamat SD Did Not Complete/Not Yet Completed Primary School
119 148 118 084 237 232
B. Menamatkan/Completed 3. Sekolah Dasar/ Primary School 293 572 285 378 578 950 4. Paket A 1 137 1 448 2 585 5. SLTP Umum
General Junior High School 196 916 188 630 385 546
6. SLTP Kejuruan Vocantion Junior High School 6 383 6 108 12 491
7. Paket B 5 150 2 247 7 397 8. SMA/MA
General Senior High School 162 635 144 098 306 733
9. SMK/ Vocational Senior High School 63 938 46 612 110 550
10. Paket C 11 296 6 710 18 006 11. Diploma I/II 8 759 11 687 20 446 12. Akademi (DIII)
Akademy (DIII) 7 988 11 741 19 729
13. Universitas/University 53 571 56 088 109 659
Jumlah/Total 953 146 910 089 1 863 235
http
://sul
teng
.bps
.go.
id

Population and Employment
Sulawesi Tengah in Figures 2014 75
Tabel Table
4.2.4Penduduk Berumur 15 Tahun Keatas yang Bekerja Selama Seminggu yang Lalu menurut Lapangan Usaha dan Jenis Kelamin, 2013 Population 15 Years Age and Over Who Worked During The Previous Week by Main Industry and Sex, 2013
�(Diolah�dari�Survei�Angkatan�Kerja�Nasional�(Sakernas)�Agustus�2013)�(Based�on�August�2013�National�Labor�Force��Survey)�
Lapangan Usaha Main Industry
Jenis Kelamin/Sex
JumlahTotal Laki-laki
MalePerempuan
Female
(1) (2) (3) (4)
1. Pertanian / Agriculture 419 930 159 246 579 176
2. Pertambangan, Penggalian / Mining, Digging 19 570 885 20 455
3. Industri Pengolahan / Processing Industry 38 863 20 457 59 320
4. Listrik.Gas.Air Bersih Electricity, Gas and Water Supply 2 939 586 3 525
5. Bangunan / Construction 61 646 1 803 63 449
6. Perdagangan, Hotel dan Restoran Trade, Hotel and Restaurant 67 696 99 518 167 214
7. Transportasi, Pergudangan, dan Komunikasi Transportation, Storage and Communication 41 922 1 351 43 273
8. Keuangan. Perbankan & Jasa Perusahaan Finance, Banking & Services 12 046 5 749 17 795
9. Jasa-jasa / Services 114 529 107 194 221 723
Jumlah/Total 779 141 396 789 1 175 930
http
://sul
teng
.bps
.go.
id

Penduduk dan Tenaga Kerja
76 Sulawesi Tengah Dalam Angka 2014
Tabel Table
4.2.5Penduduk Berumur 15 Tahun Keatas yang Bekerja Selama Seminggu yang Lalu menurut Status Pekerjaan Utama dan JenisKelamin, 2013 Population 15 Years of Age and Over Who Worked During The Previous Week by Main Employment Status and Sex, 2013
�(Diolah�dari�Survei�Angkatan�Kerja�Nasional�(Sakernas)�Agustus�2013)�(Based�on�August�2013�National�Labor�Force��Survey)�
Status Pekerjaan UtamaMain Employment Status
Jenis Kelamin/Sex JumlahTotal Laki-laki
MalePerempuan
Female
(1) (2) (3) (4)
1. Berusaha Sendiri Tanpa Bantuan Orang Lain Self Employed 173 911 60 184 234 095
2. Berusaha dengan dibantu Anggota Rumah Tangga Buruh Tidak Tetap
Employer Assisted by Family Member/Temporary Worker
197 348 45 741 243 089
3. Berusaha dengan Buruh Tetap Employer Assisted by Permanent Worker 38 977 5 785 44 762
4. Buruh/Karyawan RegularEmployee 217 416 124 326 341 742
5. Pekerja Bebas Pertanian Casual Employee in Agriculture 35 368 9 513 44 881
6. Pekerja Bebas Non Pertanian Casual Employee not in Agriculture 35 831 3 782 39 613
7. Pekerja Tak Dibayar Unpaid Worker 80 290 147 458 227 748
Jumlah/Total 779 141 396 789 1 175 930
http
://sul
teng
.bps
.go.
id

Population and Employment
Sulawesi Tengah in Figures 2014 77
Tabel Table
4.2.6Penduduk Berumur 15 Tahun Keatas yang Bekerja Selama Seminggu yang Lalu menurut Jam Kerja dan Jenis Kelamin, 2013 Population 15 Years of Age and Over Who Worked During The Previous Week by Working our and Sex, 2013
�(Diolah�dari�Survei�Angkatan�Kerja�Nasional�(Sakernas)�Agustus�2013)�(Based�on�August�2013�National�Labor�Force�Survey)�
Jam Kerja Work Hours
Jenis Kelamin/SexJumlah TotalLaki-laki
MalePerempuan
Female(1) (2) (3) (4)
0* �66�547� �39�138� �105�685�
1 – 9 �31�106� �36�839� �67�945�
10 – 24 �172�344� �114�929� �287�273�
25 – 34 �124�244� �63�901� �188�145�
35 – 44 �186�758� �74�848� �261�606�
45 – 59 �143�738� �39�660� �183�398�
60 > �54�404� �27�474� �81�878�
Jumlah/Total �779�141� �396�789� 1�175�930�
Catatan/�Note���:�*�Sementara�tidak��bekerja��/�While�not�Working
http
://sul
teng
.bps
.go.
id

Penduduk dan Tenaga Kerja
78 Sulawesi Tengah Dalam Angka 2014
Tabel Table
4.2.7Pencari Kerja yang Terdaftar menurut Tingkat Pendidikan dan Jenis Kelamin, 2009-2013 Registered Job Seeker by Educational Level and Sex, 2008-2012
��
B u l a n M o n t h
S D Primary School
S M T P Junior High School
S M T A Senior High School
Laki-laki Male
PerempuanFemale
Laki-laki Male
PerempuanFemale
Laki-laki Male
Perempuan Female
(1) (2) (3) (4) (5) (6) (7) 01. Januari/January ��8� ��2� ��32� ��14� ��280� ��195�
02. Februari/February ���� ��209� ��4� ��73� ��198� ��281�
03. Maret/March ��33� ��12� ��16� ��5� ��241� ��38�
04. April/April ��47� ���� ��76� ��17� ��140� ��54�
05. Mei/M a y ��2� �� ��9� �� ��57� ��37�
06. Juni/June ��25� ��39� ��40� ��7� ��200� ��52�
07. Juli/July ��7� ��2� ��42� ��26� ��342� ��211�
08. Agustus/August ��3� ��44� ��22� ��32� ��477� ��711�
09. September/September ��7� ��44� ��77� ��74� �1�494� �1�653�
10. Oktober/October ��7� ��44� ��77� ��74� �1�494� �1�653�
11. Nopember/November ��2� �� ��57� ��64� ��363� ��476�
12. Desember/December ��2� ���� ��57� ��64� ��363� ��476�
� � � � � �
Jumlah/ Total � � � � � �
2 0 1 3 ��143� ��396� ��509� ��450� �5�649� �5�837�
2 0 1 2 59� 58� 158� 64� 1�406� 1�073�
2 0 1 1 33� 242� 165� 168� 1�441� 1�032�
2 0 1 0 31� 24� 49� 22� 2�205� 2�377�
2 0 0 9 8� 8� 114� 54� 4�850� 5�735�
http
://sul
teng
.bps
.go.
id

Population and Employment
Sulawesi Tengah in Figures 2014 79
Lanjutan�Tabel/Continued�Table�4.2.7���
B u l a n M o n t h
D I Diploma I
D II Diploma II
D III/S. MudaDiploma III /
Bachelor
Laki�laki�Male�
PerempuanFemale�
Laki�laki�Male�
PerempuanFemale�
Laki�laki�Male�
Perempuan�
Female�(1) (8) (9) (10) (11) (12) (13)
01.�� Januari/January� ���� ���� ��1� ��7� ��33� ��56�
02.�� Februari/February� ��5� ��9� ��8� ��21� ��72� ��115�
03.�� Maret/March� ��2� ���� ��1� ��1� ��10� ��6�
04.�� April/April� ��2� ��3� ��2� ��5� ��24� ��87�
05.�� Mei/M�a�y��� ��1� ��1� ���� ��7� ��11� ��9�
06.�� Juni/June� ��1� ���� ��1� ��13� ��8� ��18�
07.�� Juli/July� ��1� ��8� ��4� ��18� ��17� ��121�
08.�� Agustus/August� ���� ��37� ��29� ��85� ��60� ��153�
09.�� September/September� ��21� ��39� ��48� ��145� ��96� ��453�
10.�� Oktober/October� ��21� ��39� ��48� ��145� ��96� ��453�
11.�� Nopember/November� ���� ��4� ��13� ��39� ��16� ��76�
12.�� Desember/December� ���� ��4� ��13� ��39� ��16� ��76�
� � � � � � � �
Jumlah/�Total� � � � � � �
� 2�0�1�3� ��54� ��144� ��168� ��525� ��459� �1�623�
� 2�0�1�2� 17� 23� 20� 72� 124� 520�
� 2�0�1�1� 13� 53� 74� 188� 240� 779�
� 2�0�1�0� 49� 22� 2�205� 2�377� 529� 1�164�
� 2�0�0�9� 444� 1�363� 950� 1�980� 922� ��1�572�
�
http
://sul
teng
.bps
.go.
id

Penduduk dan Tenaga Kerja
80 Sulawesi Tengah Dalam Angka 2014
Lanujutan Tabel/Continued Table 4.2.7 ��
B u l a n M o n t h
Sarjana University
Pasca Sarjana Master
J u m l a hT o t a l
Laki�laki�Male�
PerempuanFemale�
Laki�laki�Male�
PerempuanFemale�
Laki�laki�Male�
Perempuan�Female�
(1) (14) (15) (16) (17) (18) (19)
01.�� Januari/January� ��103� ��86� �� �� ��457� ��360�
02.�� Februari/February� ��88� ��228� �� �� ��375� ��936�
03.�� Maret/March� ��33� ��29� �� �� ��336� ��91�
04.�� April/April� ��49� ��100� �� �� ��340� ��266�
05.�� Mei/M�a�y��� ��47� ��71� �� �� ��127� ��125�
06.�� Juni/June� ��42� ��42� �� �� ��317� ��171�
07.�� Juli/July� ��94� ��119� �� �� ��507� ��505�
08.�� Agustus/August� ��242� ��437� �� �� ��833� �1�499�
09.�� September/September� ��581� ��819� �� �� �2�324� �3�227�
10.�� Oktober/October� ��581� ��819� �� �� �2�324� �3�227�
11.�� Nopember/November� ��113� ��162� �� �� ��564� ��821�
12.�� Desember/December� ��113� ��162� �� �� ��564� ��821�
� � � � � � � �
Jumlah/�Total� � � � � � �� 2�0�1�3� �2�086� �3�074� �� �� �9�068� �12�049�� 2�0�1�2� 657� 868� 1� 2� 2�443� 2�680�� 2�0�1�1� 650� 760� 6� 43� 2�622� 3�116�� 2�0�1�0� 2�368� 3�180� 10� 8� 7�446� 9�174�� 2�0�0�9� �2�565� �3�873� 14� 9� 9�867� �14�594�
Sumber/Source� :� Dinas�Tenaga�Kerja�dan�Transmigrasi�Provinsi�Sulawesi�Tengah�/�Govt.�Services�of�Man�Power�and�Transmigration,�Sulawesi�Tengah�Province
http
://sul
teng
.bps
.go.
id

Population and Employment
Sulawesi Tengah in Figures 2014 81
Tabel Table
4.2.8Penempatan Pencari Kerja yang Terdaftar menurut Bulan, Pendidikan, dan Jenis Kelamin, 2009-2013 Number of The Registered Job Seekers to be Occupied by Month, Educational Level and Sex, 2009-2013
��
B u l a n M o n t h
S D Primary School
S M T P Junior High School
S M T A Senior High School
Laki�laki�Male�
PerempuanFemale�
Laki�laki�Male�
PerempuanFemale�
Laki�laki�Male�
Perempuan�Female�
(1) (2) (3) (4) (5) (6) (7)
01.�� Januari/January� �� 51� 1� 20� 2� 1�
02.�� Februari/February� 21� 132� 4� 52� �� 183�
03.�� Maret/March� 56� 5� 55� 3� 1�121� 9�
04.�� April/April� �� 2� �� �� �� ��05.�� Mei/M�a�y��� �� �� �� �� 25� ��
06.�� Juni�June� �� 16� �� �� 20� 69�
07.�� Juli/July� �� 2� 23� 7� 234� 8�
08.�� Agustus/August� �� 42� �� �� �� ��09.�� September/September� �� �� �� �� �� ��10.�� Oktober/October� �� �� �� �� �� ��11.�� Nopember/November� �� �� �� �� �� ��12.�� Desember/December� �� �� �� �� �� ��
� � � � � � � �
Jumlah/�Total� � � � � � �
� 2�0�1�3� 77 250 83 82 1�402� 270�
� 2�0�1�2� 53� 51� 181� 123� 394� 368�
� 2�0�1�1� 36� 188� 151� 157� 630� 338�
� 2�0�1�0� �� 6� �� �� 618� 459�
� 2�0�0�9� 8� 8� 114� 54� 4�850� 5�735�
http
://sul
teng
.bps
.go.
id

Penduduk dan Tenaga Kerja
82 Sulawesi Tengah Dalam Angka 2014
Lanjutan Tabel / Continued Table 4.2.8 ��
B u l a n M o n t h
Sarjana Muda Bachelor
Sarjana University
JumlahTotal
Laki�laki�Male�
PerempuanFemale�
Laki�laki�Male�
PerempuanFemale�
Laki�laki�Male�
Perempuan�Female�
(1) (8) (9) (10) (11) (12) (13) 01.�� Januari/�January� �� �� �� �� ��3� ��72�
02.�� Februari/�February� �� �� �� �� ��25� ��367�
03.�� Maret/�March� ��29� ��22� ��46� ��27� �1�307� ��66�
04.�� April/�April� �� �� �� �� �� ��2�
05.�� Mei/�M�a�y��� �� �� �� �� ��25� ��
06.�� Juni/�June� �� ��8� ���� ��10� ��20� ��103�
07.�� Juli/�July� �� ��7� ��10� ��2� ��267� ��26�
08.�� Agustus/�August� �� �� �� �� �� ��42�
09.�� September/�September� �� �� �� �� �� ��10.�� Oktober/�October� �� �� �� �� �� ��11.�� Nopember/�November� �� �� �� �� �� ��12.�� Desember/�December� �� �� �� �� �� ��
� �
� � � � � �
Jumlah�/�Total� � � � � � �
� 2�0�1�3� ��29 ��37 ��56 ��39 �1�647� ��678�� 2�0�1�2� 13� 5� 16� 22� 29� 27�
� 2�0�1�1� 349� 558� 1�673� 747� 2�839� 1�988�
� 2�0�1�0� 692� 494� 999� 575� 2�306� 1�534�� 2�0�0�9� 2�316� 4�915� 2�579� 3�882� 9�867� �14�594�
Sumber/Source� :� Dinas�Tenaga�Kerja�dan�Transmigrasi�Provinsi�Sulawesi�Tengah��� � Govt.�Services�of�Manpower�and�Transmigration,�Sulawesi�Tengah�Province
http
://sul
teng
.bps
.go.
id

Population and Employment
Sulawesi Tengah in Figures 2014 83
Tabel Table
4.2.9Pencari Kerja yang Dihapuskan pada Kantor Disnaker menurut Bulan, Pendidikan dan Jenis Kelamin, 2009-2013 Number of Job Seekers to be Eliminated at Manpower Department by Month, Educational Level and Sex, 2009-2013
�
B u l a n M o n t h
S D Primary School
S M T P Junior High School
S M T A Senior High
SchoolLaki�laki�Male�
PerempuanFemale�
Laki�laki�Male�
PerempuanFemale�
Laki�laki�Male�
PerempuanFemale�
(1) (2) (3) (4) (5) (6) (7) 01.�� Januari/�January� �� �� 1� �� 30� 19�
02.�� Februari/�February� �� 95� �� 9� �� 118�
03.�� Maret/�March� �� �� �� �� 7� 6�
04.�� April/�April� �� 34� �� 19� 69� 43�
05.�� Mei/�M�a�y��� 5� �� 1� �� 76� 63�
06.�� Juni/�June� �� 26� 1� 16� 2� 16�
07.�� Juli/�July� 2� �� 1� �� 71� 85�
08.�� Agustus/�August� �� �� �� �� 85� 66�
09.�� September/�September� �� �� 10� 4� 144� 149�
10.�� Oktober/�October� �� �� 10� 4� 144� 149�
11.�� Nopember/�November� �� �� 4� 1� 84� 97�
12.�� Desember/�December� �� �� 4� 1� 84� 97�
� � � � � � � �
Jumlah/�Total� � � � � � �
2�0�1�3� 7� 155� 32� 54� 796� 908�
2�0�1�2� 30� 29� 41� 12� 1�458� 1�566�
2�0�1�1� 8� 66� 198� 42� 5�031� 6�457�
2�0�1�0� 88� 3� 248� 13� 3�028� 2�556�
2�0�0�9� 23� 21� 129� 142� 2�116� 3�229�
http
://sul
teng
.bps
.go.
id

Penduduk dan Tenaga Kerja
84 Sulawesi Tengah Dalam Angka 2014
Lanjutan Tabel / Continued Table 4.2.9 �
B u l a n M o n t h
Sarjana Muda Bachelor
Sarjana University
JumlahTotal
Laki-lakiMale
PerempuanFemale
Laki-laki Male
PerempuanFemale
Laki-laki Male
Perempuan Female
(1) (8) (9) (10) (11) (12) (13)
01.�� Januari/�January� 3� 4� 3� 3� 37� 26�
02.�� Februari/�February� �� �� �� �� �� 222�
03.�� Maret/�March� 3� 1� �� 18� 10� 25�
04.�� April/�April� 8� 17� 12� 11� 89� 124�
05.�� Mei/�M�a�y��� 66� 123� �� �� 148� 186�
06.�� Juni/�June� 27� 6� �� 5� 30� 69�
07.�� Juli/�July� 9� 32� 14� 21� 97� 138�
08.�� Agustus/�August� 5� 15� 6� 13� 96� 94�
09.�� September/�September� 43� 103� 46� 52� 243� 308�
10.�� Oktober/�October� 43� 103� 46� 52� 243� 308�
11.�� Nopember/�November� 29� 88� 43� 62� 160� 248�
12.�� Desember/�December� 29� 88� 43� 62� 160� 248�
�
� � � �
� �
Jumlah/�Total� � � � � � �
2�0�1�3� 265� 580� 213� 299� 1�313� 1�996�
2�0�1�2� 424� 847� 692� 863� 1�116� 1�710�
2�0�1�1� 1�250� 2�399� 2�349� 2�319� 8�836� 11�173�
2�0�1�0� 1�068� 1�876� 1�816� 2�581� 6�248� 7�029�
2�0�0�9� 334� 635� 546� 660� 3�148� 4�687�
Sumber/Source� :� Dinas�Tenaga�Kerja�dan�Transmigrasi�Provinsi�Sulawesi�Tengah��� � Govt.�Services�of�Manpower�and�Transmigration,�Sulawesi�Tengah�Province
http
://sul
teng
.bps
.go.
id

Population and Employment
Sulawesi Tengah in Figures 2014 85
Tabel Table
4.2.10Jumlah Pencari Kerja yang Sudah dan Belum Ditempatkan menurut Jenis Kelamin, 2012-2013 Number of Job Seekers Occupied and Not Yet Occupied by Sex, 2012-2013
�
Sumber/Source� :Dinas�Tenaga�Kerja�dan�Transmigrasi�Provinsi�Sulawesi�Tengah�
U r a i a n Description
2012 2013
Laki�laki�Male�
PerempuanFemale�
Jumlah�Total�
Laki�laki�Male�
Perempuan�Female�
Jumlah�Total�
(1) (2) (3) (4) (5) (6) (7)
Pencari�Kerja/�Job�Seeker� � � � � � �� �
1. Sisa�Pencari�Kerja�Tahun�Lalu�Last�Year�Job�Seeker�Remainder��
25�183 32�328 57�511 24�327 31�122� 55�449�
2. Pencari�Kerja�Terdaftar�Registered�Job�Seeker��
2�444 2�680 5�124 9�068 12�049� 21�117�
� � �A.�Jumlah�/�Total�(1+2)�� 27�627 35�008 62�635 33�395 43�171� 76�566�
� � �
3. Ditempatkan/�Occupied� 660 569 1�229 1�647 �678� �2�325�
4. Dihapuskan/�Eliminated� 2�640 3�317 5�957 1�315 1�994� �3�309�
� � �
B.�Jumlah�/�Total�(3+4)� 3�300 3�886 7�186 2�962 2�672� �5�634�
� � �
5. Pencari�Kerja�Belum�Ditempatkan�Job�Seeker�Not�Yet�Occupied�(A�B)���
24�327 31�122 55�449 30�433 40�499� 70�932�
http
://sul
teng
.bps
.go.
id

Penduduk dan Tenaga Kerja
86 Sulawesi Tengah Dalam Angka 2014
� �Govt.�Services�of�Manpower�and�Transmigration,�Sulawesi�Tengah�Province��
http
://sul
teng
.bps
.go.
id

Sosial
Sulawesi Tengah in Figures 2014 87
SOSIALSocial
http
://sul
teng
.bps
.go.
id

Sosial
88 Sulawesi Tengah Dalam Angka 2014
pendidikan
http
://sul
teng
.bps
.go.
id

Sosial
Sulawesi Tengah in Figures 2014 89
5. SOSIAL
Data yang disajikan dalam bab ini mencakup berbagai informasi yang terangkum dalam pendidikan, kesehatan dan keluarga berencana, peradilan, agama, perumahan, dan kegiatan sosial lainnya. Dalam lingkup informasi pendidikan disajikan data antara lain; banyaknya sekolah, guru, dan murid dari pendidikan dasar hingga pendidikan tinggi baik negeri maupun swasta.
Pada bagian kesehatan meliputi data banyaknya fasilitas kesehatan, tenaga kesehatan, banyak dan jenis rumah sakit, dan tempat tidur. Data Keluarga Berencana (KB) meliputi partisipasi masyarakat terhadap program KB dan berbagai fasilitasnya. Bidang agama meliputi penduduk menurut agama yang dianut dan tempat peribadatan. Bidang sosial lainnya terdiri dari data tentang lembaga sosial kemasyarakatan, panti, jenis binaan masalah penyandang cacat, pelayanan dan bantuan terhadap orang terlantar serta permasalahan anak jalanan.
5.1. Pendidikan
Salah satu faktor keberhasilan pembangunan di suatu daerah adalah apabila didukung oleh sumber daya manusia yang berkualitas. Proses peningkatan kualitas sumber daya manusia yang pada gilirannya akan merupakan Modal Investasi Manusia bagi kepentingan pembangunan daerah bahkan sampai tingkat Nasional. Pembangunan pendidikan
5. SOCIAL
This part presents some information that covers education, health and family planning, judicature, religion, other social affairs, and housing. Some information that presented in education part was number of schools, teachers and students of kindergarten to senior/ vocational high school. Also, provided number of students and lecturers of public and private universities.
In part of health presented number ofhealth facilities, personals, type of hospital,and hospital’s beds. Meanwhile, familyplanning comprised public participation onfamily planning’s program and itsfacilities. The religion part coverspopulation number by religion and worshipplaces. As for, social organizations,orphanage, building kind for handicappedsufferer, services for neglected childrenand homeless included to other socialaffairs.
5.1. Education
One of elements to achieve successfully development in a region is the qualified human resource support. Process of improving quality of human resource will be capital of human investment to local development, in fact to the national level. Development of education was still on important position of this priority scale and it kept on to be
http
://sul
teng
.bps
.go.
id

Sosial
90 Sulawesi Tengah Dalam Angka 2014
yang masih menempati posisi penting dalam skala prioritas ini akan terus ditingkatkan, program wajib belajar 9 tahun bagi pendidikan dasar terus digalakkan sehingga diharapkan seluruh anak-anak usia sekolah dapat memasuki jenjang pendidikan dasar.
Peningkatan sumber daya manusia sekarang ini lebih diutamakan dengan memberi kesempatan kepada penduduk usia sekolah serta luasnya wilayah yang harus dijangkau merupakan faktor yang cukup berpengaruh disamping faktor-faktor lainnya dalam menjalankan program-program pendidikan. Terse-dianya data pendidikan yang baik akan sangat membantu perencanaan yang dibuat menjadi lebih terarah dan mencapai sasaran yang diinginkan.
Data pendidikan yang disajikan dalam publikasi ini adalah yang termasuk di dalam lingkungan Dinas Pendidikan (Disdik) Provinsi Sulawesi Tengah, dimana kurikulum yang digunakan merujuk pada kurikulum yang telah ditetapkan oleh Depdiknas, sedangkan data pendidikan diluar lingkungan Depdiknas disajikan dalam publikasi lain.
Secara keseluruhan data pendidikan menggambarkan: 1. Banyaknya sekolah, murid dan guru
untuk setiap tingkat dan status sekolah dapat dilihat mulai tabel 5.1.1 sampai 5.1.12.
2. Data Perguruan Tinggi yang dipisahkan antara Perguruan Tinggi Negeri (PTN)
improved. The compulsory elementary education program for 9 years will still be jutted, that all of school’s age children could get through elementary school stage.
Improvement of human resource is recently more prioritized to give opportunity for school’s age children. Besides that, the other factor of education programs needed to be thought, such as the accessibility of school location. Availability of the educational data will quite help to governmental planning for more guided and could attain the target.
The educational data in this publication is derived from the Teaching and Education of Government Service (Disdikjar) of Sulawesi Tengah Province, which its curriculum refers to the determinate curriculum by National Education Department (Depdiknas), while the outer educational data of Depdiknas was presented in other publication.
On the whole, educational data outline: 1. Number of schools, teachers and
pupils for every school status and level as shown in Tables 5.1.1 to 5.1.12.
2. Data of colleges separated into state college and private college, as
http
://sul
teng
.bps
.go.
id

Sosial
Sulawesi Tengah in Figures 2014 91
dan Perguruan Tinggi Swasta (PTS) disajikan dalam tabel 5.1.13 s/d 5.1.18.
3. Data siswa putus sekolah, penduduk 15 tahun ke atas menurut pendidikan tertinggi yang ditamatkan dan menurut kemampuan membaca dan menulis, angka partisipasi kasar tingkat SD, SLTP dan SLTA serta persentase penduduk 5 tahun ke atas yang masih sekolah disajikan pada tabel 5.1.19 s/d 5.1.24.
5.2. Kesehatan
Banyaknya rumah sakit di Provinsi Sulawesi Tengah tahun 2013, termasuk rumah sakit TNI dan Polri, berjumlah 21 buah dengan rincian rumah sakit umum sebanyak 21 buah. Dari jumlah rumah sakit tersebut sebanyak 4 buah dikelola oleh pihak swasta sedangkan rumah sakit pemerintah sebanyak 17 buah. Jumlah tempat tidur yang tersedia secara keseluruhan mencapai 2.665 tempat tidur.
Tenaga kesehatan yang terdiri dari dokter umum tercatat sebesar 442 orang, dokter spesialis 107 orang dan dokter gigi 96 orang. Tenaga kesehatan lainnya mencapai 9.934 orang yang terdiri atas apoteker, asisten apoteker, sarjana kesehatan masyarakat, bidan, perawat, dan sanitarian. Hampir separuh dari tenaga kesehatan non-dokter tersebut adalah perawat, yakni sebesar 48,67 persen.
presented in tables 5.1.13 to 5.1.18.
3. Number of drop-outs, the population aged 15 years old and over by educational attainment and read/write ability, rough participation rate of elementary school, junior high school and senior high school, and the population aged 5 years old and over who were still attending school, as presented in Tables 5.1.19 to 5.1.24.
5.2. Health
Number of hospitals in Sulawesi Tengah Province in 2011 included military and Police hospitals was 25 units. It’s consisted of 21 public hospitals. From hospitals number as mentioned, 4 units were managed by private party and 17 units by government. Total beds for patients reached 2,665 units.
The health workers were consisted of 442 general doctors, 107 doctor specialists, and 96 dentists. The other health workers, was 9.934 persons that consisted of pharmacist, pharmaceutical assistant, master of public health, midwife, nurse, and sanitary personnel, From total non-doctor health workers which worked as nurse is around 48.67 percent.
http
://sul
teng
.bps
.go.
id

Sosial
92 Sulawesi Tengah Dalam Angka 2014
Jumlah pasangan Program Keluarga Berencana sebagai peserta KB baru berjumlah 97.841 pasangan. Dari jumlah ini yang menggunakan jenis kontrasepsi tiga terbanyak adalah pemakaian suntik mencapai 43,23 persen, pil sebanyak 32,81 persen dan susuk sebanyak 9,61 persen, sisanya menggunakan alat kontrasepsi yang lain.
5.3. Peradilan
Hukum dan lembaga hukum/ peradilan adalah bagian dari perangkat hukum yang dapat menjadi tiang pokok dalam pelaksanaan kehidupan berbangsa dan negara, karena Indonesia adalah Negara Hukum yang bercita-cita menciptakan tertib hukum, dan pembangunan di bidang hukum yang berdasarkan Pancasila dan Undang-Undang Dasar 1945 sebagai sumber dari segala sumber hukum, yang mengarah kepada hukum nasional untuk kepentingan nasional pula.
Banyaknya perkara yang masuk dalam laporan kejaksaan tinggi di Sulawesi Tengah pada tahun 2013 mencapai 1.599 kasus. Total kasus pada tahun 2013, termasuk sisa kasus tahun sebelumnya, menjadi 1.821 kasus dan 87,86 persen di antaranya telah dinyatakan selesai. Sementara pada kasus tindak pidana korupsi, tidak sedikit kasus yang masih menjadi pekerjaan rumah bagi kejaksaan tinggi provinsi maupun kejaksaan negeri di kabupaten/kota. Dari 112 kasus tindak pidana korupsi, baru 50 kasus atau 44,64 persen bisa diselesaikan
Number of family planning program couples as new acceptors was 97,841 couples. From number as mentioned, 43.23 percent used pill, 32.81 used injection, condom by 9.61 percent, and the remainder used other contraceptives.
5.3. Justice
Law Institute/Judicature is part of law peripheral to be able to become main pole in carrying out life in state and nation, cause of Indonesia is a constitutional state who has been aspired to create obedient law, and development of law sector that pursuant to Pancasila and Constitution, 1945 as source from all law source, that pointed to national law and also to national importance.
Number of cases recorded in high judiciary report of Sulawesi Tengah in 2013 was 1,599 cases. Total cases in 2013, included remainders of a previous year cases was 1,821 cases and 87,86 percent from this number was clear. While at corruption case, not least of cases still became homework for high public judiciary of province and judiciary of regency/city. From 112 corruption cases, 50 cases (44.64 percent) of them had been finished.
http
://sul
teng
.bps
.go.
id

Sosial
Sulawesi Tengah in Figures 2014 93
5.4. Agama Agama sebagai salah satu unsur utama dalam kehidupan berbangsa dan bernegara karena pentingnya nilai-nilai agama dalam kehidupan ini, maka para pendiri republik tercinta ini memasukkan dasar agama dalam Pancasila yaitu sila pertama.
Pancasila merupakan jiwa dan pandangan hidup bangsa dan sebagai alat pemersatu bangsa. Di Sulawesi Tengah suasana kehidupan beragama dan kepercayaan terhadap Tuhan Yang Maha Esa senantiasa dibina, dikembangkan dan ditingkatkan sesuai dengan falsafah Negara Pancasila. Dalam menjalin kehidupan beragama Pemerintah Daerah Sulawesi Tengah melalui Kantor Wilayah Departemen Agama Provinsi Sulawesi Tengah berusaha membangun suasana hidup yang rukun dan saling menghargai diantara umat beragama yang diarahkan kepada peningkatan amal untuk kepentingan bersama dalam membangun masyarakat, sekaligus dapat mengatasi berbagai masalah sosial yang mungkin dapat menghambat kemajuan pembangunan itu sendiri.
Proporsi penduduk menurut agama yang dianut (dari Tabel 5.4.1) di Sulawesi Tengah pada tahun 2011 adalah Islam sebesar 74,45 persen, Kristen 17,69 persen, Katolik 1,60 persen, Hindu 5,19 persen, dan Budha 1,07 persen.
5.4. Religion
Religion is as one of the essential element in life of nation and state, because the religious values was quite important in this life, hence all founders of this beloved republic put into religion base in Pancasila as first principle.
Pancasila is soul and philosophy of life of this nation. It also functions as the unifier of nation. In Sulawesi Tengah, religious life and trust to The One God is always constructed, to be developed and improved as according to state philosophy of Pancasila. In braiding religious life, Regional Government of Sulawesi Tengah Province through Regional Office of Religious Department of Sulawesi Tengah Province tried to develop religious life peace to esteeming each other, that pointed to increase charities for importance together in developing public, and could overcome varied social problems that can obstruct progress of the development.
The proportional population by their religion in Sulawesi Tengah in 2011 (as shown on Table 5.4.1) that is: Moslem by 74.45 percent, Christian by 17.69 percent, Catholic by 1.60 percent, Hinduism by 5.19 percent, and Buddhism by 1.07 percent.
http
://sul
teng
.bps
.go.
id
Sosial
94 Sulawesi Tengah Dalam Angka 2014
5.5. Sosial Lainnya
Pemerintah bersama masyarakat telah berusaha mewujudkan tata kehidupan dan penghidupan sosial, baik secara materil maupun spirituil. Usaha tersebut bertujuan demi mencapai kehidupan sosial yang makin baik khususnya bagi masyarakat golongan ekonomi lemah/kurang mampu dan penyandang cacat.
Tercatat 70 anak terlantar yang dibina di panti penyantunan anak se-Sulawesi Tengah. Para anak terlantar ini dibina dengan pembekalan keterampilan seperti tata rias, menjahit, pertukangan, elektronik, dan otomotif.
5.6. Perumahan
Sebagai salah satu kebutuhan dasar dalam kehidupan manusia, rumah tidak hanya berfungsi sebagai tempat berlindung tetapi fungsinya sebagai tempat tinggal lebih menonjol. Karena itu aspek kesehatan dan kenyamanan dan bahkan estetika bagi sekelompok masyarakat tertentu sangat menentukan dalam pemilihan rumah tinggal.
Secara umum, kualitas rumah tinggal ditentukan oleh kualitas bahan bangunan yang digunakan. Di samping itu kelengkapan fasilitas yang digunakan juga sangat menentukan kenyamanan rumah tinggal. Rumah nyaman adalah rumah yang memiliki beberapa ruangan yang mempunyai fungsi masing-masing
5.5. Other Social Affairs
The government and societies tried together in bringing into reality good life, as well as material and spiritual. These efforts purposed to achieve a better social life, particularly for poor people, and disable people.
In order to improve the knowledge and skill of neglected children, the orphanage in Sulawesi Tengah have given courses/ practices of skill for 70 children such as sewing, carpentry, electronic, and automotive.
5.6. Housing
As one of basic needs in human life, a house not only has function for shelter, but its function as residence is more prominent. Therefore health and comfortable aspects, or even aesthetics of a house are very important in choosing home for many groups of people.
Generally, the quality of house depends on use of the quality of building material. Besides that, the complete facilities will quite influence the pleasure and comfort of staying at home. The comfortable home if it has many rooms as each its function and proportional total occupants, so it’s not crowded. The main
http
://sul
teng
.bps
.go.
id

Sosial
Sulawesi Tengah in Figures 2014 95
dan proporsional dengan jumlah penghuni yang tinggal, sehingga penghuni tidak berdesak-desakan. Fasilitas pokok yang penting agar suatu rumah menjadi nyaman dan sehat untuk ditinggal adalah tersedianya listrik, air bersih, jamban dengan tangki septik serta jarak ke tempat penampungan.
Data-data mengenai perumahan ini merupakan hasil pengolahan Survei Sosial Ekonomi Nasional (SUSENAS) yang dilaksanakan serentak di seluruh Indonesia dua kali setiap tahunnya. Selengkapnya mengenai kondisi perumahan penduduk Sulawesi Tengah dapat dilihat pada tabel 5.6.2. hingga 5.6.12.
important facilities of a house that health and comfort to living are the available electricity, clean water, cesspool with septic tank and adequate distance between water source and the septic tank.
The housing data are derived from processing of National Socio-Economic Survey (Susenas) that held simultaneously in all provinces in Indonesian for twice in a year. More complete about housing condition of population in Sulawesi Tengah as presented in Tables 5.6.2 to 5.6.12.
http
://sul
teng
.bps
.go.
id

Sosial
96 Sulawesi Tengah Dalam Angka 2014
http
://sul
teng
.bps
.go.
id

Sosial
Sulawesi Tengah in Figures 2014 97
Gambar
Figure 5.1 Jumlah Murid Menurut Jenis Sekolah 2012/2013 Number of Pupils by Kind of School, 2012/2013
0
100000
200000
300000
400000
T.K./Kindergarten
S.D./Elementary
School
SLTP/ JuniorHigh School
SMU/ SeniorHigh School
SMK/VocationalSenior High
School
36940
387.924
120.096
55.310 67.626
http
://sul
teng
.bps
.go.
id

Sosial
98 Sulawesi Tengah Dalam Angka 2014
http
://sul
teng
.bps
.go.
id

Suulawesi Tengah
Gambar
Figure� 5
0
50
100
150
200
250
300
350
400
450
500
2�0
375
Dokter�U
h in Figures 201
5.2�BanyaknTengah,NumberProvicia
0�0�9 2�
393
83 78
mum/�Doctor���
14
nya� Tenaga� D,�2009�2013�r� of� Doctors�al,�2009��2013�
0�1�0 2
3
48
88 91
Dokter�Spe
okter� menurut
by� Kind� of� D
2�0�1�1
87 4
86
119
esialis/�Specialist
t� Jenis� Dokter
Doctor� in� Sula
2�0�1�2
486
11499
��� Dokter�G
So
r� di� Sulawesi�
awesi� tengah�
2�0�1�3
442
107 96
igi/�Dentist���
osial
99
http
://sul
teng
.bps
.go.
id

Sosial
100 Sulawesi Tengah Dalam Angka 2014
http
://sul
teng
.bps
.go.
id

Su
Ga
Fi
ulawesi Tengah
mbar�
gure� 5.3�
0
200
400
600
800
1000
1200
1400
1600
Juml
Juml
h in Figures 201
PerkembangPolisi�DaerahTrend�of��The2009�2013�
2�0�0�9
ah�Kecelakaan�/�
ah�Luka�Berat�/�H
14
gan� Korban� Kech�Sulawesi�Tenge�Victims�Record
2�0�1�0Tah
Total�of�Accident
Heavy�injured
celakaan� Lalu�gah,�2009�2013ded�by�Regiona
2�0�1�1hun�/�year
t Jumla
Luka�R
Lintas� yang� Te3��al�Police�of��Sula
2�0�1�2
h�Mati�Death
Ringan�/�Light�inju
So
ercatat� � pada�
awesi�Tengah,�
2�0�1�3
ured
osial
101
http
://sul
teng
.bps
.go.
id

Sosial
102 Sulawesi Tengah Dalam Angka 2014
http
://sul
teng
.bps
.go.
id

Sosial
Sulawesi Tengah in Figures 2014 103
5. SOSIAL/SOCIAL 5.1. Pendidikan / Education
Tabel Table 5.1.1
Jumlah Sekolah, Guru, dan Murid Menurut Jenis Sekolah, 2012/2013 Number of Schools, Teachers, and Pupils by Kind of School, 2012/2013
Jenis Sekolah Kind of School
Sekolah School (Unit)
Guru Teacher
(Orang/Person)
Murid Pupils
(Orang/Person)
(1) (2) (3) (4)
1. TK/ Kindergarten
Negeri dan Swasta / State and Private 1 419 5 219 36 940
2. SD/ Elementary School
Negeri/State 2 705 25 139 363 410
Swasta/Private 400 3 928 24 514
3. SLTP/ Junior High School
Negeri/State 788 8 679 110 230
Swasta/Private 289 2 686 9 866
4. SMU/ Senior High School
Negeri/Public 158 3 616 50 333
Swasta/Private 152 1 252 4 977
5. SMK/ Vocational Senior High School
Negeri/State 85 1 872 45 350
Swasta/Private 70 836 22 276
Sumber/Source : Dinas Pendidikan Daerah Provinsi Sulawesi Tengah Education Goverment Service of Sulawesi Tengah Province
http
://sul
teng
.bps
.go.
id

Sosial
104 Sulawesi Tengah Dalam Angka 2014
Tabel Table
5.1.2Jumlah Sekolah, Guru, dan Murid Taman Kanak-Kanak Menurut Status Sekolah dan Kabupaten/Kota, 2008/2009-2012/2013 Number of Schools, Teachers, and Pupils of Kindergarten by Status of School and Regency/City,2008/2009-2012/2013
�
Kabupaten/Kota Regency/City
SekolahSchool (Unit)
MuridPupil
(Orang/Person)
GuruTeacher
(Orang/Person)(1) (2) (3) (4)
01. Banggai Kepulauan 104 2 702 293 02. Banggai 190 2 762 456 03. Morowali 126 4 319 496 04. Poso 154 4 140 642 05. Donggala 153 4 722 648 06. Tolitoli 51 1 758 142 07. Buol 73 2 414 421 08. Parigi Moutong 208 5 733 603 09. Tojo Una-Una 109 1 003 343 10. Sigi 156 3 847 499 11. Banggai Laut1) ... ... ...
12. Morowali Utara1) ... ... ...
13. Palu 95 3 540 676
Sulawesi Tengah 2012/2013 1 419 36 940 5 219 2011/2012 1 548 39 059 5 980 2010/2011 1 468 44 459 5 278 2009/2010 1 256 45 341 4 461 2008/2009 1 054 36 442 3 183
Sumber/Source� :� Dinas�Pendidikan�Daerah��Provinsi�Sulawesi�Tengah��� � Education�Goverment��Service�of��Sulawesi�Tengah�Province�Catatan/Note�������:��1)�Tergabung�Dengan�Kabupaten�Induknya/�Include�in�main�regency
http
://sul
teng
.bps
.go.
id

Sosial
Sulawesi Tengah in Figures 2014 105
Tabel
Table 5.1.3 Banyaknya Sekolah, Guru dan Murid Sekolah Dasar menurut Kabupaten/Kota dan Status Sekolah, 2008/2009-2012/2013 Number of Schools, Teachers and Pupils of Elementary School by Regency/City and Status of School, 2008/2009-2012/2013
Kabupaten/Kota Regency/City
Negeri State
Swasta Private
Jumlah Total
Sekolah School
Guru Teacher
Murid Pupil
Sekolah School
Guru Teacher
Murid Pupil
Sekolah Schools
Guru Teacher
Murid Pupils
(1) (2) (3) (4) (5) (6) (7) (8) (9) (10)
01. Banggai Kepulauan 233 2 148 25 406 12 96 821 245 2 244 26 227
02. Banggai 349 3 302 46 188 37 301 1 665 386 3 603 47 853
03. Morowali 250 2 467 40 099 37 232 1 557 287 2 699 41 656
04. Poso 209 2 286 22 859 39 449 3 528 248 2 735 26 387
05. Donggala 342 2 523 44 042 55 714 2 225 397 3 237 44 267
06. Tolitoli 220 1 789 31 663 26 179 845 246 1 968 32 508
07. Buol 166 1 671 18 103 14 117 169 180 1 788 18 272
08. Parigi Moutong 404 3 387 51 703 54 339 2 209 458 3 726 53 912
09. Tojo Una-Una 187 1 698 22 391 11 73 702 198 1 771 23 093
10. Sigi 203 1 804 27 248 64 946 4 688 267 2 750 31 936
11. Banggai Laut1) ... ... ... ... ... ... ... ... ...
12. Morowali Utara1) ... ... ... ... ... ... ... ... ...
13. Palu 142 2 064 33 708 51 482 6 105 193 2 546 39 813
Sulawesi Tengah 2012/2013 2 705 25 139 363 410 400 3 928 24 514 3 105 29 067 387 924 2011/2012 2 646 24 745 371 060 378 3 855 34 274 3 024 28 600 405 334 2010/2011 2 543 23 152 355 838 363 3 392 34 666 2 906 26 544 390 504 2009/2010 2 537 18 439 354 853 196 9 978 24 356 2 733 28 417 379 209 2008/2009 2 416 12 598 313 997 196 656 17 728 2 612 13 254 331 725
Sumber/Source : Dinas Pendidikan Daerah Provinsi Sulawesi Tengah Education Goverment Service of Sulawesi Tengah Province Catatan/Note : 1) Tergabung Dengan Kabupaten Induknya/ Include in main regency
http
://sul
teng
.bps
.go.
id

Sosial
106 Sulawesi Tengah Dalam Angka 2014
Tabel�
Table� �5.1.4�
Banyaknya� Peserta� dan� Lulusan� Ujian� Sekolah� Dasar� menurut��Kabupaten/Kota�dan�Status�Sekolah,�2008/2009�2012/2013�Number� of� Participants� and� Passed� Students� of� Exam� of� Elementary�Schools�by�Regency/City�and�Status�of�School,�2008/2009�2012/2013�
��
Kabupaten/Kota�Regency/City�
Negeri�State�
Swasta�Privates�
Jumlah�Total�
Peserta�Partici�pant�
Lulusan�Passed�
Student�of�Exam
Peserta�Partici�pant�
Lulusan�Passed�
Student�of�Exam
Peserta�Partici�pant�
Lulusan�Passed�
Student�of�Exam�
(1)� (2)� (3)� (6)� (7)� (8)� (9)�� � � � � � �
01. Banggai�Kepulauan� 4�092� 4�092� �152� �152� 4�244� 8�336�02. Banggai� 6�677� 6�677� �500� �500� 7�177� 13�854�03. Morowali� 4�181� 4�181� �391� �391� 4�572� 8�753�04. Poso� 3�667� 3�667� �634� �634� 4�301� 7�968�05. Donggala� 5�719� 5�719� �485� �485� 6�204� 11�923�06. Tolitoli� 4�586� 4�586� �253� �253� 4�839� 9�425�07. Buol� 3�458� 3�458� �118� �118� 3�576� 7�034�08. Parigi�Moutong� 8�237� 8�237� �596� �596� 8�833� 17�070�09. Tojo�Una�Una� 3�015� 3�015� �91� �91� 3�106� 6�121�10. Sigi� 3�814� 3�814� �781� �781� 4�595� 8�409�11. Banggai�Laut1)� ...� ...� ...� ...� ...� ...�12. Morowali�Utara1)� ...� ...� ...� ...� ...� ...�13. Palu� 5�217� 5�217� 1�232� 1�232� 6�449� 11�666�
� �� �� �� �� �� ��
Sulawesi�Tengah� � � � � � �2012/2013� 52�663� 52�663� 5�233� 5�233� 57�896� 57�896�2011/2012� 50�501� 50�502� 3�241� 3�241� 53�743� 53�743�2010/2011� 46�631� 46�631� 4�651� 4�651� 51�282� 51�282�2009/2010� 44�843� 44�843� 3�776� 3�776� 48�619� 48�619�2008/2009� 43�932� 43�932� 1�276� 1�257� 45�208� 45�189�
Sumber/Source� :� Dinas�Pendidikan�Daerah��Provinsi�Sulawesi�Tengah��� � Education�Goverment��Service�of��Sulawesi�Tengah�Province��Catatan/Note�������:��1)�Tergabung�Dengan�Kabupaten�Induknya/�Include�in�main�regency�
http
://sul
teng
.bps
.go.
id
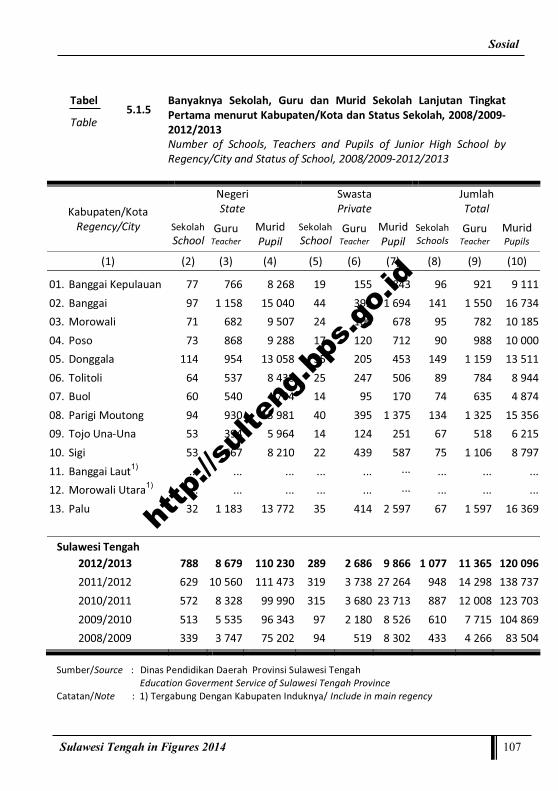
Sosial
Sulawesi Tengah in Figures 2014 107
Tabel
Table 5.1.5 Banyaknya Sekolah, Guru dan Murid Sekolah Lanjutan Tingkat Pertama menurut Kabupaten/Kota dan Status Sekolah, 2008/2009-2012/2013 Number of Schools, Teachers and Pupils of Junior High School by Regency/City and Status of School, 2008/2009-2012/2013
Kabupaten/Kota Regency/City
Negeri State
Swasta Private
Jumlah Total
Sekolah School
Guru Teacher
Murid Pupil
Sekolah School
Guru Teacher
Murid Pupil
Sekolah Schools
Guru Teacher
Murid Pupils
(1) (2) (3) (4) (5) (6) (7) (8) (9) (10)
01. Banggai Kepulauan 77 766 8 268 19 155 843 96 921 9 111 02. Banggai 97 1 158 15 040 44 392 1 694 141 1 550 16 734 03. Morowali 71 682 9 507 24 100 678 95 782 10 185 04. Poso 73 868 9 288 17 120 712 90 988 10 000 05. Donggala 114 954 13 058 35 205 453 149 1 159 13 511 06. Tolitoli 64 537 8 438 25 247 506 89 784 8 944 07. Buol 60 540 4 704 14 95 170 74 635 4 874 08. Parigi Moutong 94 930 13 981 40 395 1 375 134 1 325 15 356 09. Tojo Una-Una 53 394 5 964 14 124 251 67 518 6 215 10. Sigi 53 667 8 210 22 439 587 75 1 106 8 797 11. Banggai Laut1) ... ... ... ... ... ... ... ... ... 12. Morowali Utara1) ... ... ... ... ... ... ... ... ... 13. Palu 32 1 183 13 772 35 414 2 597 67 1 597 16 369
Sulawesi Tengah 2012/2013 788 8 679 110 230 289 2 686 9 866 1 077 11 365 120 096 2011/2012 629 10 560 111 473 319 3 738 27 264 948 14 298 138 737 2010/2011 572 8 328 99 990 315 3 680 23 713 887 12 008 123 703 2009/2010 513 5 535 96 343 97 2 180 8 526 610 7 715 104 869 2008/2009 339 3 747 75 202 94 519 8 302 433 4 266 83 504
Sumber/Source : Dinas Pendidikan Daerah Provinsi Sulawesi Tengah Education Goverment Service of Sulawesi Tengah Province Catatan/Note : 1) Tergabung Dengan Kabupaten Induknya/ Include in main regency
http
://sul
teng
.bps
.go.
id

Sosial
108 Sulawesi Tengah Dalam Angka 2014
Tabel�
Table� � 5.1.6�Banyaknya�Sekolah,�Guru,�dan�Murid� �Lanjutan�Tingkat�Pertama�(SLTP)�Terbuka�Menurut�Kabupaten/Kota,�2008/2009�2012/2013�Number� of� Schools,� Teachers,� and� Pupils� � at� Vocational� Junior� High�Schools�by��Regency/City,�2008/2009�2012/2013���
Kabupaten/Kota�Regency/City�
Sekolah�School�(Unit)�
Murid���Pupil�
(Orang/Person)�
Guru�Teacher�
(Orang/Person)�(1)� (2)� (3)� (4)�
� � � �
01. Banggai�Kepulauan� 3� 106� 16�
02. Banggai� 6� 260� 56�
03. Morowali� 1� 30� 83�
04. Poso� 1� 48� 12�
05. Donggala� 7� 251� 11�
06. Tolitoli� 4� 139� 78�
07. Buol� 5� 146� 68�
08. Parigi�Moutong� 6� 418� 114�
09. Tojo�Una�Una� 2� 24� 24�
10. Sigi� 6� 475� 63�
11. Banggai�Laut1)� ...� ...� ...�
12. Morowali�Utara1)� ...� ...� ...�
13. Palu� 3� 166� 19�
� �� �� ��
Sulawesi�Tengah� � � �
2012/2013� 44� 2�063� 544�
2011/2012� 48� 3�675� 544�
2010/2011� 59� 32�179� 1�344�
2009/2010� 41� 3�906� 715�
2008/2009� 39� 3�641� 300�
Sumber/Source� :� Dinas�Pendidikan�Daerah��Provinsi�Sulawesi�Tengah��� � Education�Goverment�Service�of�Sulawesi�Tengah�Province��Catatan/Note�������:��1)�Tergabung�Dengan�Kabupaten�Induknya/�Include�in�main�regency�
http
://sul
teng
.bps
.go.
id

Sosial
Sulawesi Tengah in Figures 2014 109
Sumber/Source� :� Dinas�Pendidikan�Daerah��Provinsi�Sulawesi�Tengah��� � Education�Goverment�Service�of�Sulawesi�Tengah�Province��Catatan/Note�������:��1)�Tergabung�Dengan�Kabupaten�Induknya/�Include�in�main�regency�
Kabupaten/Kota�Regency/City�
Negeri�State�
Swasta�Private�
Jumlah�Total�
��Peserta�Participant�
Lulusan�Passed�
Student�of�Exam
Peserta�Participant
Lulusan�Passed�
Student�of�Exam
Peserta�Participants�
Lulusan�Passed�Students�of�Exam�
(1)� (2)� (3)� (4)� (5)� (6)� (7)�� � � � � � �
01. Banggai�Kepulauan� 2�221� 2�221� �569� �569� 2�790� 2�790�02. Banggai� 4�114� 4�087� �987� �558� 5�101� 4�645�03. Morowali� 2�687� 2�634� �486� �478� 3�173� 3�112�04. Poso� 3�113� 3�013� �308� �289� 3�421� 3�302�05. Donggala� 2�671� 2�627� �559� �546� 3�230� 3�173�06. Tolitoli� 2�437� 2�312� �802� �797� 3�239� 3�109�07. Buol� 2�100� 2�033� �358� �345� 2�458� 2�378�08. Parigi�Moutong� 4�119� 4�166� 1�553� 1�543� 5�672� 5�709�09. Tojo�Una�Una� 1�693� 1�599� �379� �364� 2�072� 1�963�10. Sigi� 2�199� 2�040� �788� �788� 2�987� 2�828�11. Banggai�Laut1)� ...� ...� ...� ...� ...� ...�12. Morowali�Utara1)� ...� ...� ...� ...� ...� ...�13. Palu� 4�422� 4�403� 1�194� 1�178� 5�616� 5�581�
� � � � � � �
Sulawesi�Tengah� �� �� �� �� �� ��2012/2013� 31�776� 31�135� 7�983� 7�455� 39�759� 38�590�2011/2012� 31�683� 31�683� 7�339� 7�152� 39�022� 38�415�2010/2011� 33�621� 31�550� 7�250� 7�149� 40�871� 38�699�2009/2010� 31�951� 31�707� 7�444� 7�370� 39�395� 39�077�2008/2009� 26�103� 23�065� 2�511� 2�134� 28�614� 25�199�
Tabel�
Table� � 5.1.7�Banyaknya�Peserta�dan�Lulusan�Ujian�Sekolah�Lanjutan�Tingkat�Pertama�(SLTP)�Umum�menurut�Kabupaten/Kota�dan�Status�Sekolah�2008/2009�2012/2013���Number�of�Participants�and�Passed�Students�of�Exam�of�Junior�High�School�by�Regency/City�and�Status�of�School,�2008/2009�2012/2013�
http
://sul
teng
.bps
.go.
id

Sosial
110 Sulawesi Tengah Dalam Angka 2014
Sumber/Source� :� Dinas�Pendidikan�Daerah��Provinsi�Sulawesi�Tengah��� � Education�Goverment�Service�of�Sulawesi�Tengah�Province��Catatan/Note�������:��1)�Tergabung�Dengan�Kabupaten�Induknya/�Include�in�main�regency
Tabel�
Table� ��5.1.8�
Banyaknya� Peserta� dan� Lulusan� Ujian� Sekolah� Lanjutan� Tingkat� Pertama�(SLTP)�Terbuka�menurut�Kabupaten/Kota�dan�Status�Sekolah,�2008/2009�2012/2013�Number� of� Participants� and� Passed� Students� of� Exam� of� Vacational� Junior�High�School�by�Regency/City�and�Status�of�School,�2008/2009�2012/2013�
Kabupaten/Kota�Regency/City�
Negeri�State�
Swasta�Private�
Jumlah�Total�
��Peserta�Participant�
Lulusan�Passed�
Student�of�Exam
Peserta�Participant
Lulusan�Passed�
Student�of�Exam
Peserta�Participants�
Lulusan�Passed�Students�of�Exam�
(1)� (2)� (3)� (4)� (5)� (6)� (7)�� � � � � � �
01. Banggai�Kepulauan� 33� 33� - - 33� 33�02. Banggai� 67� 57� - - 67� 57�03. Morowali� 16� 7� - - 16� 7�04. Poso� 12� 12� - - 12� 12�05. Donggala� 173� 173� - - 173� 173�06. Tolitoli� 85� 79� - - 85� 79�07. Buol� 97� 90� - - 97� 90�08. Parigi�Moutong� 159� 155� - - 159� 155�09. Tojo�Una�Una� 11� 9� - - 11� 9�10. Sigi� 125� 93� - - 125� 93�11. Banggai�Laut1)� ...� ...� ... ... ...� ...�12. Morowali�Utara1)� ...� ...� ... ... ...� ...�13. Palu� 82� 81� - - 82� 81�
� � � � � � �
����Sulawesi�Tengah� �� �� �� �� �� ��2012/2013� 860� 789� - - 860� 789�2011/2012� 1�180� 895� 21� 17� 1�201� 912�2010/2011� 1�031� 934� �� �� 1�031� 934�2009/2010� 2�926� 1�739� �� �� 2�926� 1�739�2008/2009� 1�711� 1�108� �� �� 1�711� 1�108�
http
://sul
teng
.bps
.go.
id

Sosial
Sulawesi Tengah in Figures 2014 111
Tabel
Table 5.1.9 Banyaknya Sekolah, Guru dan Murid Sekolah Menengah Umum (SMU) menurut Kabupaten/ Kota dan Status Sekolah, 2008/2009-2012/2013 Number of Schools, Teachers and Pupils of Senior High School by Regency/City and Status of School, 2008/2009-2012/2013
Kabupaten/Kota Regency/City
Negeri State
Swasta Private
Jumlah Total
Sekolah School
Guru Teacher
Murid Pupil
Sekolah School
Guru Teacher
Murid Pupil
Sekolah Schools
Guru Teacher
Murid Pupils
(1) (2) (3) (4) (5) (6) (7) (8) (9) (10)
01. Banggai Kepulauan 15 318 3 488 8 34 ... 23 352 3 488 02. Banggai 20 517 8 194 11 114 531 31 631 8 725 03. Morowali 14 290 4 410 15 70 429 29 360 4 839 04. Poso 15 372 4 963 9 95 667 24 467 5 630 05. Donggala 22 241 4 323 20 120 149 42 361 4 472 06. Tolitoli 10 182 3 180 19 106 262 29 288 3 442 07. Buol 7 212 3 033 9 37 ... 16 249 3 033 08. Parigi Moutong 18 378 6 454 20 149 411 38 527 6 865 09. Tojo Una-Una 7 160 2 459 8 47 43 15 207 2 502 10. Sigi 12 268 3 374 20 216 527 32 484 3 901 11. Banggai Laut1) ... ... ... ... ... ... ... ... ...
12. Morowali Utara1) ... ... ... ... ... ... ... ... ...
13. Palu 18 678 6 455 13 264 1 958 31 942 8 413
Sulawesi Tengah 2012/2013 158 3 616 50 333 152 1 252 4 977 310 4 868 55 310 2011/2012 150 4 537 51 438 143 2 097 13 014 293 6 634 64 452 2010/2011 134 3 731 49 502 129 1 858 12 661 263 5 589 62 163 2009/2010 118 2 475 48 031 36 995 6 857 154 3 470 54 888 2008/2009 107 2 746 40 035 39 641 6 084 145 3 387 46 119
Sumber/Source : Dinas Pendidikan Daerah Provinsi Sulawesi Tengah Education Goverment Service of Sulawesi Tengah Province Catatan/Note : 1) Tergabung Dengan Kabupaten Induknya/ Include in main regency
http
://sul
teng
.bps
.go.
id

Sosial
112 Sulawesi Tengah Dalam Angka 2014
Tabel�
Table� � 5.1.10�Banyaknya�Sekolah,�Guru�dan�Murid�Sekolah�Menengah�Kejuruan�(SMK)�menurut�Kabupaten/Kota�Status�Sekolah,�2008/2009�2012/2013���Number�of�Schools,�Teachers�and�Pupils�of�Vocational�Senior�High�School�by�Regency/City�and�Status�of��School,�2008/2009�2012/2013�
�
Kabupaten/Kota�Regency/City�
Negeri�State�
Swasta�Private�
Jumlah�Total�
Sekolah�School�
Guru�Teacher
MuridPupil�
SekolahSchool
GuruTeacher
MuridPupil
SekolahSchool
Guru�Teacher�
Murid�Pupil�
(1)� (2)� (3)� (4)� (5)� (6)� (7)� (8)� (9)� (10)�� � � � � � � � � �
01.� Banggai�Kepulauan� �3� �103� 3�268 �10� �95� 1�188 �13� �198� 4�456�
02.� Banggai� �12� �155� 3�424 �9� �148� 2�076 �21� �303� 5�500�
03.� Morowali� �7� �118� 3�510 �3� �60� 1�348 �10� �178� 4�858�
04.� Poso� �7� �155� 3�176 �8� �145� 2�444 �15� �300� 5�620�
05.� Donggala� �16� �204� 5�264 �2� �11� �446 �18� �215� 5�710�
06.� Tolitoli� �7� �160� 4�250 �7� �56� �942 �14� �216� 5�192�
07.� Buol� �6� �160� 3�160 �2� �16� �472 �8� �176� 3�632�
08.� Parigi�Moutong� �12� �174� 4�050 �6� �59� 2�408 �18� �233� 6�458�
09.� Tojo�Una�Una� �6� �139� 2�660 �1� �18� 1�076 �7� �157� 3�736�
10.��Sigi� �2� �85� 1�856 �4� �46� 1�408 �6� �131� 3�264�
11.��Banggai�Laut1)� ... ... ... ... ... ... ... ... ...
12.��Morowali�Utara1)� ... ... ... ... ... ... ... ... ...
13.� Palu� �7� �419� 10�732 �18� �182� 8�468 �25� �601� 19�200�� �� �� � �� �� � �� �� ��
���Sulawesi�Tengah� � � � � � � �2012/2013� �85� 1�872� 45�350 �70� �836� 22�276 �155� 2�708� 67�626�2011/2012� 63� 2�195� 22�021 57� 1�066� 9�421 120� 3�261� 31�442�2010/2011� 60� 1�785� 18�264 54� 887� 8�669 114� 2�672� 26�933�2009/2010� 51� 1�208� 9�518 51� 881� 4�749 102� 2�089� 14�267�2008/2009� 42� 1�029� 10�871 35� 538� 5�194 75� 1�567� 16�065�
Sumber/Source� :���Dinas�Pendidikan�Daerah��Provinsi�Sulawesi�Tengah��� � Education�Goverment��Service�of��Sulawesi�Tengah�Province��Catatan/Note�������:��1)�Tergabung�Dengan�Kabupaten�Induknya/�Include�in�main�regency�
http
://sul
teng
.bps
.go.
id

Sosial
Sulawesi Tengah in Figures 2014 113
Tabel�
Table� � 5.1.11�Banyaknya��Peserta��dan�Lulusan�Ujian�Sekolah�Menengah�Umum�(SMU)�menurut�Kabupaten/Kota��dan�Status�Sekolah,�2008/2009�2012/2013���Number�of�Participants�and�Passed�Students�of�Exam�of�Senior�High�School�by�Regency/City�and�Status�of��School,�2008/2009�2012/2013�
�
Kabupaten/Kota�Regency/City�
Negeri�State�
Swasta�Private�
Jumlah�Total�
Peserta�Participant
Lulusan�Passed�
Student�of�Exam
Peserta�Participant
Lulusan�Passed�
Student�of�Exam
Peserta�Participant�
Lulusan�Passed�
Student�of�Exam�
(1)� (2)� (3)� (4)� (5)� (6)� (7)�� � � � � � �
01.� Banggai�Kepulauan� 1�149� 1�147� �112� �110� 1�261� 1�257�
02.� Banggai� 2�373� 2�358� �636� �630� 3�009� 2�988�
03.� Morowali� 1�281� 1�254� �372� �356� 1�653� 1�610�
04.� Poso� 1�598� 1�577� �297� �290� 1�895� 1�867�
05.� Donggala� 1�375� 1�344� �306� �265� 1�681� 1�609�
06.� Tolitoli� 1�114� 1�092� �438� �420� 1�552� 1�512�
07.� Buol� �872� �819� �132� �129� 1�004� �948�
08.� Parigi�Moutong� 2�187� 2�139� �723� �693� 2�910� 2�832�
09.� Tojo�Una�Una� �733� �708� �108� �108� �841� �816�
10.���Sigi� 1�011� �995� �541� �496� 1�552� 1�491�
11.���Banggai�Laut1)� ...� ...� ...� ...� ...� ...�
12.���Morowali�Utara1)� ...� ...� ...� ...� ...� ...�
13.� �Palu� 2�680� 2�677� �909� �841� 3�589� 3�518�
���Sulawesi�Tengah� �� � �� �� �� ��2012/2013� 16�373� 16�110� 4�574� 4�338� 20�947� 20�448�2011/2012� 15�376� 15�200� 4�226�� 3�986� 19�602� 19�186�2010/2011� 16�115� 15�863� 3�122� 2�905� 19�237� 18�768�2009/2010� 16�544� 16�248� 1�749� 1�632� 18�293� 17�880�2008/2009� 15�218� 11�292� 2�189� 1�327� 17�407� 12�619�
Sumber/Source� :���Dinas�Pendidikan�Daerah��Provinsi�Sulawesi�Tengah��� � Education�Goverment��Service�of��Sulawesi�Tengah�Province��Catatan/Note�������:��1)�Tergabung�Dengan�Kabupaten�Induknya/�Include�in�main�regency�
http
://sul
teng
.bps
.go.
id

Sosial
114 Sulawesi Tengah Dalam Angka 2014
Tabel�
Table� � 5.1.12�Banyaknya� Peserta� � dan� Lulusan� � Ujian� Sekolah� � Menengah� Kejuruan�(SMK)�menurut�Kabupaten/Kota�dan�Status�Sekolah,��2008/2009�2012/2013���Number�of�Participants�and�Passed�Students�of�Exam�of�Vocational�Senior�High�School�by�Regency/City�and�Status�of�School,�2008/2009�2012/2013�
�
Kabupaten/Kota�Regency/City�
Negeri�State�
Swasta�Private�
Jumlah�Total�
Peserta�Participant
Lulusan�Passed�
Student�of�Exam
Peserta�Participant
Lulusan�Passed�
Student�of�Exam
Peserta�Participant�
Lulusan�Passed�
Student�of�Exam�
(1)� (2)� (3)� (4)� (5)� (6)� (7)�� � � � � � �
01.� Banggai�Kepulauan� �474� �472� �144� �144� �618� �616�02.� Banggai� �763� �762� �162� �162� �925� �924�03.� Morowali� �352� �352� �197� �197� �549� �549�04.� Poso� �370� �370� �248� �247� �618� �617�05.� Donggala� �567� �564� �67� �67� �634� �631�06.� Tolitoli� �655� �655� �187� �187� �842� �842�07.� Buol� �662� �660� �84� �81� �746� �741�08.� Parigi�Moutong� �379� �379� �239� �239� �618� �618�09.� Tojo�Una�Una� �445� �441� �127� �126� �572� �567�10.� Sigi� �250� �250� �114� �114� �364� �364�11.���Banggai�Laut1)� ... ... ... ... ... ...12.���Morowali�Utara1)� ... ... ... ... ... ...13.� �Palu� 1�309� 1�302� 1�167� 1�166� 2�476� 2�468�
� �� �� �� �� �� ��
���Sulawesi�Tengah� � � � � � �2012/2013� 6�226� 6�207� 2�736� 2�730� 8�962� 8�937�2011/2012� 5�896� 5�757� 2�511� 2�435� 8�407� 8�192�2010/2011� 5�558� 5�376� 2�076� 1�889� 7�634� 7�264�2009/2010� 4�843� 4�707� 1�993� 1�862� 6�836� 6�569�2008/2009� 3�746� 3�310� 1�633� 1386� 5379� 4696�
Sumber/Source� :� Dinas�Pendidikan�Daerah�Provinsi�Sulawesi�Tengah��� � Education�Goverment��Service�of��Sulawesi�Tengah�Province��Catatan/Note�������:��1)�Tergabung�Dengan�Kabupaten�Induknya/�Include�in�main�regency�
http
://sul
teng
.bps
.go.
id

Sosial
Sulawesi Tengah in Figures 2014 115
Tabel�
Table� � 5.1.13�Banyaknya� Mahasiswa� Baru� � dan� Alumni� Perguruan� Tinggi� menurut�Kabupaten/Kota�dan�Status�Perguruan�Tinggi,�2008/2009�2012/2013��Number� of� New� Students� and� Graduations� in� State� Colleges� by�Regency/City�and�State�Colleges,�2008/2009�2012/2013�
�
Sumber/Source� :� �Registrasi�Universitas�/�Registration�of�Universities
Kabupaten/Kota�Regency/City�
Negeri�State�
Swasta�Private�
Jumlah�Total�
Mahasiswa�Baru��New�
Students�
Alumni�Graduation
Mahasiswa�Baru��New�
Students�
Alumni�Graduation
Mahasiswa�Baru��New�
Students�
Alumni�Graduation�
(1)� (2)� (3)� (4)� (5)� (6)� (7)�� � � � � � �
01.� Banggai�Kepulauan� �� �� �� �� �� ��02.� Banggai� �� �� 2�297� 4�021� 2�297� 4�021�03.� Morowali� �151� �� �� �� �151� ��04.� Poso� �� �� 1�113� �947� 1�113� �947�05.� Donggala� �� �� �� �� �� ��06.� Tolitoli� �� �� 1�991� 1�148� 1�991� 1�148�07.� Buol� �� �� �� �� �� ��08.� Parigi�Moutong� �� �� �� �� �� ��09.� Tojo�Una�Una� �� �� �� �� �� ��10.� Sigi� �� �� �� �� �� ��11.���Banggai�Laut� �� �� �� �� �� ��12.���Morowali�Utara� �� �� �� �� �� ��13.� �Palu� 7�532� 4�190� 5�397� 6�111� 12�929� 10�301�
� � � � � � ����Sulawesi�Tengah� � � � � � �
2012/2013� 7�683� 4�190� 10�798� 12�227� 18�481� 16�417�2011/2012� 9�383� 4�156� 9�816� 6�372� 19�199� 10�528�2010/2011� 7�942� 4�295� 10�007� 11�275� 17�949� 15�570�2009/2010� 5�939� 3�582� 9�466� 6�565� 15�405� 10�147�2008/2009� 5�777� 2�825� 8�110� 2�821� 13�887� 5�646�
http
://sul
teng
.bps
.go.
id

Sosial
116 Sulawesi Tengah Dalam Angka 2014
� � �
Kabupaten/Kota�Regency/City�
Pengajar�/�Lecturer�
Tetap�/�Definitive Tidak�Tetap�Temporary�
Jumlah�Total�Sarjana
(S1)�
Magister/DR/PHD(S2/S3)�
Sarjana�(S1)�
Magister/DR/PHD�(S2/S3)�
(1)� (2)� (3)� (4)� (5)� (6)�01.� Banggai�Kepulauan� �� �� �� �� ��02.� Banggai� �� �� �� �� ��03.� Morowali� �� �� �� 2� 2�04.� Poso� �� �� �� �� ��05.� Donggala� �� �� �� �� ��06.� Tolitoli� �� �� �� �� ��07.� Buol� �� �� �� �� ��08.� Parigi�Moutong� �� �� �� �� ��09.� Tojo�Una�Una� �� �� �� �� ��10.� Sigi� �� �� �� �� ��11.��Banggai�Laut� �� �� �� �� ��12.��Morowali�Utara� �� �� �� �� ��13.� �Palu� 92� 1�200� 23� 131� 1�446�� � � � � �
Sulawesi�Tengah� � � � � �2012/2013� 92� 1�200� 23� 133� 1�448�2011/2012� 249� 1�185� 80� 77� 1�591�2010/2011� 259� 1�160� 82� 49� 1�534�2009/2010� 395� 938� 99� 53� 1�485�2008/2009� 429� 885� 27� 36� 1�377�
Sumber/Source� :�Registrasi�Universitas�/�Registration�of�Universities
Tabel�
Table� � 5.1.14�Banyaknya� Dosen� pada� Perguruan� Tinggi� � Negeri� menurut�Kabupaten/Kota,�2008/2009���2012/2013�Number� of� Lecturer� in� � State� Collelges� by� Regency/City,2008/2009� ��2012/2013�
http
://sul
teng
.bps
.go.
id

Sosial
Sulawesi Tengah in Figures 2014 117
Tabel�
Table� � 5.1.15�Banyaknya� Dosen� pada� Perguruan� Tinggi� � Swasta� menurut�Kabupaten/Kota,�2008/2009�2012/2013�Number� of� Lecturer� in� Private� Colleges� by� Regency/City,� 2008/2009�2012/2013�
�
Perguruan�Tinggi�Swasta�Private�Colleges�
Pengajar�/�Lecturer�
Tetap�/�Definitive� Tidak�Tetap�Temporary�
Jumlah�Total�Sarjana
(S1)�
Magister/DR/PHD�(S2/S3)�
Sarjana(S1)�
Magister/DR/PHD�(S2/S3)�
(1)� (2)� (3)� (4)� (5)� (6)�� � � � � �
01.� Banggai�Kepulauan� �� �� �� �� ��02.� Banggai� �151� �122� �115� �69� �457�03.� Morowali� �� �� �� �� ��04.� Poso� �32� �143� �29� �69� �273�05.� Donggala� �� �� �� �� ��06.� Tolitoli� �118� �185� �101� �148� �552�07.� Buol� �� �� �� �� ��08.� Parigi�Moutong� �� �� �� �� ��09.� Tojo�Una�Una� �� �� �� �� ��10.� Sigi� �� �� �� �� ��11.��Banggai�Laut� �� �� �� �� ��12.��Morowali�Utara� �� �� �� �� ��13.� �Palu� �390� �480� �302� �695� 1�867�� �� �� �� �� ��
Sulawesi�Tengah� � � � � �2012/2013� �691� �930� �547� �981� 3�149�2011/2012� 741� 498� 519� 648� 2�406�2010/2011� 539� 353� 321� 792� 2�015�2009/2010� 535� 380� 410� 625� 1�931�2008/2009� 602� 231� 499� 573� 1�905�
Sumber/Source� :�Registrasi�Universitas�/�Registration�of�Universities�
http
://sul
teng
.bps
.go.
id

Sosial
118 Sulawesi Tengah Dalam Angka 2014
Tabel�
Table� � 5.1.16�Banyaknya� Mahasiswa� pada� Perguruan� Tinggi� Negeri� menurut�Kabupaten/Kota�dan�Jenis�Kelamin,�2007/2008�2011/2012�Number� of� Students� in� � State� Colleges� by� Regency/City� and� Sex,�2007/2008�2011/2012�
�
Perguruan�Tinggi�Negeri�State�Colleges�
Jumlah�Mahasiswa�/�Number�of�Students�Laki�laki�Male�
Perempuan�Female�
Jumlah�Total�
(1)� (2)� (3)� (4)�
� � � �
01.� Banggai�Kepulauan� �� �� ��
02.� Banggai� �� �� ��
03.� Morowali� �206� �190� �396�
04.� Poso� �� �� ��
05.� Donggala� �� �� ��
06.� Tolitoli� �� �� ��
07.� Buol� �� �� ��
08.� Parigi�Moutong� �� �� ��
09.� Tojo�Una�Una� �� �� ��
10.� Sigi� �� �� ��
11.��Banggai�Laut� �� �� ��
12.��Morowali�Utara� �� �� ��
13.� �Palu� 15�513� 15�471� 30�984�
� � � �
Sulawesi�Tengah� � � �
2012/2013� 15�719� 15�661� 31�380�
2011/2012� 12�153� 10�054� 22�172�
2010/2011� 14�419� 14�009� 28�428�
2009/2010� 13�250� 12�267� 25�517�
2008/2009� 14�180� 9�899� 24�079�
Sumber/Source� :��Registrasi�Universitas�/Registration�of��Universities
http
://sul
teng
.bps
.go.
id

Sosial
Sulawesi Tengah in Figures 2014 119
Tabel�
Table� � 5.1.17�Banyaknya� Mahasiswa� pada� Perguruan� Tinggi� Swasta� menurut�Kabupaten/Kota�dan�Jenis�Kelamin,�2008/2009�2012/2013�Number� of� Students� in� � Private� Colleges� by� Regency/City� and� Sex,�2008/2009�2012/2013�
�
Perguruan�Tinggi�Negeri�State�Colleges�
Jumlah�Mahasiswa�/�Number�of�Students�Laki�laki�Male�
Perempuan��Female�
Jumlah�Total�
(1)� (2)� (3)� (4)�
� � � �
01.� Banggai�Kepulauan� �� �� ��
02.� Banggai� 4�683� 4�925� 9�608�
03.� Morowali� �� �� ��
04.� Poso� 2�448� 2�586� 5�034�
05.� Donggala� �� �� ��
06.� Tolitoli� 3�299� 5�580� 8�879�
07.� Buol� �� �� ��
08.� Parigi�Moutong� �� �� ��
09.� Tojo�Una�Una� �� �� ��
10.� Sigi� �� �� ��
11.��Banggai�Laut� �� �� ��
12.��Morowali�Utara� �� �� ��
13.� �Palu� 11�613� 12�785� 24�398�
� � � �
Sulawesi�Tengah� � � �
2012/2013� 22�043� 25�876� 47�919�
2011/2012� 22�967� 18�749� 41�716�
2010/2011� 31�078� 19�554� 50�632�
2009/2010� 14�811� 15�152� 29�963�
2008/2009� 9�814� 13�484� 23�298�� � � �
Sumber/Source� :��Registrasi�Universitas�/Registration�of��Universities
http
://sul
teng
.bps
.go.
id

Sosial
120 Sulawesi Tengah Dalam Angka 2014
Tabel�
Table� � 5.1.18�Jumlah�dan�Persentase�Putus�Sekolah�pada�Sekolah�Dasar�Menurut�Kabupaten/Kota,��2012/2013��Number�and�Percentage�of�Drop�Outs�of�Primary�School�by�Regency/City,�2012/2013�
��(Diolah�dari�Survei�Sosial�Ekonomi�Nasional�(Susenas)�2013)�(Based�on�2013�National�Socio�Economic�Survey)�
Kabupaten/Kota�Regency/City�
Jumlah�Putus�Sekolah�pada�Sekolah�Dasar�
Number�of�Drop�Outs�of�Primary�School�
Persentase�Putus�Sekolah�pada�Sekolah�Dasar�
Percentage�of�Drop�Outs�of�Primary�School�
Laki�Laki�Male�
Perem�puan�
Female�
Jumlah�Total�
Laki�Laki�Male�
Perem�puan�
Female�
Jumlah�Total�
(1)� (2)� (3)� (4)� (5)� (6)� (7)�� � � � � � �
01.� Banggai�Kepulauan� 419� 517� 936� 3,23� 3,74� 3,49�
02.� Banggai� 266� 0� 266� 1,07� 0,00� 0,56�
03.� Morowali� 359� 84� 443� 1,99� 0,56� 1,35�
04.� Poso� 99� 70� 169� 0,63� 0,43� 0,53�
05.� Donggala� 112� 0� 112� 0,46� 0,00� 0,23�
06.� Tolitoli� 0� 70� 70� 0,00� 0,46� 0,21�
07.� Buol� 202� 33� 234� 1,51� 0,30� 0,97�
08.� Parigi�Moutong� 1490� 227� 1717� 4,54� 0,69� 2,61�
09.� Tojo�Una�Una� 283� 64� 347� 2,71� 0,50� 1,50�
10.��Sigi� 372� 118� 490� 1,85� 0,74� 1,36�
11.��Banggai�Laut1)� ... ... ... ... ... ...
12.��Morowali�Utara1)� ... ... ... ... ... ...
13.� �Palu� 0� 145� 145� 0,00� 0,78� 0,35�� � � � � � �
Sulawesi�Tengah� 3�602� 1�327� 4�929� 1,68� 0,67� 1,19�
Catatan/Note�������:��1)�Tergabung�Dengan�Kabupaten�Induknya/�Include�in�main�regency
http
://sul
teng
.bps
.go.
id

Sosial
Sulawesi Tengah in Figures 2014 121
Tabel�
Table� � 5.1.19�Jumlah�dan�Persentase�Angka�Putus�Sekolah�Menengah�Pertama�pada�Penduduk�Usia�13�15�tahun�Menurut�Kabupaten/Kota,�2012/2013��Number�and�Percentage�of�Drop�outs�of��Junior�High�School�at���Population�Aged�13�15�Years�by�Regency/City,�2012/2013�
��(Diolah�dari�Survei�Sosial�Ekonomi�Nasional�(Susenas)�2012)��(Based�on�2012�National�Socio�Economic�Survey)�
Kabupaten/Kota�Regency/City�
Jumlah�Putus�Sekolah�pada�SLTP�
Number�of�Drop�out�of�Junior�High�School�
Persentase�Putus�Sekolah�pada�SLTP�
Percentage�of�Drop�Out�of�Junior�High�School�
Laki�Laki�Male�
Perem�puan�
Female�
Jumlah�Total�
Laki�Laki�Male�
Perem�puan�
Female�
Jumlah�Total�
(1)� (2)� (3)� (4)� (8)� (9)� (10)�� � � � � � �
01.� Banggai�Kepulauan� 460� 645� 1�105� 7,15� 12,95� 9,68�
02.� Banggai� 809� 1�145� 1�954� 9,67� 10,65� 10,22�
03.� Morowali� 545� 573� 1�119� 8,58� 9,12� 8,85�
04.� Poso� 286� 662� 948� 4,63� 10,81� 7,71�
05.� Donggala� 1�474� 765� 2�239� 14,60� 8,78� 11,91�
06.� Tolitoli� 1�196� 592� 1�789� 20,31� 10,32� 15,38�
07.� Buol� 893� 500� 1�393� 19,30� 9,70� 14,24�
08.� Parigi�Moutong� 2�264� 2�096� 4�360� 17,74� 17,98� 17,85�
09.� Tojo�Una�Una� 1�232� 504� 1�736� 28,98� 14,18� 22,24�
10.��Sigi� 674� 749� 1�423� 9,80� 11,44� 10,60�
11.��Banggai�Laut1)� ... ... ... ... ... ...12.��Morowali�Utara1)� ... ... ... ... ... ...13.� �Palu� 657� 694� 1351� 7,40� 6,91� 7,14�� � � � � � �
Sulawesi�Tengah� 10�490� 8�926� 19�417� 13,00� 11,22� 12,12�
Catatan/Note�������:��1)�Tergabung�Dengan�Kabupaten�Induknya/�Include�in�main�regency
http
://sul
teng
.bps
.go.
id

Sosial
122 Sulawesi Tengah Dalam Angka 2014
Tabel�
Table� � 5.1.20�Persentase�Penduduk�Berumur�10�Tahun�Ke�Atas��menurut�Kabupaten/Kota�dan�Pendidikan�Tertinggi�yang�Ditamatkan��Percentage�of�Population�10�Years�of�Age�and�Over�by�Regency/City��and�Educational�Attainment�
��
(Diolah�dari�Survei�Sosial�Ekonomi�Nasional�(Susenas)�2013)�(Based�on�2013�National�Socio�Economic�Survey)�
Kabupaten/Kota�Regency/City�
Pendidikan�Tertinggi�Yang�Ditamatkan�Educational�Attainment�
Tidak/BelumTamat�SD�
Not�Completed�Elementary�School�
SD�ElementarySchool�
SMTP�Junior�HighSchool�
SMTA�Umum�
Senior�HighSchool�
SMTA�Kejuruan�Vocational�Senior�High�School�
(1)� (2)� (3)� (4)� (5)� (6)�� � � � � �
01.� Banggai�Kepulauan� 18,46� 45,60� 15,97� 12,09� 2,15�02.� Banggai� 21,29� 34,95� 20,67� 13,97� 3,35�03.� Morowali� 18,90� 34,29� 20,09� 19,66� 2,51�04.� Poso� 17,28� 31,72� 21,98� 17,52� 3,68�05.� Donggala� 25,88� 38,90� 18,01� 12,57� 2,25�06.� Tolitoli� 22,13� 34,96� 19,13� 14,12� 3,40�07.� Buol� 22,71� 34,27� 19,42� 14,48� 3,45�08.� Parigi�Moutong� 30,99� 33,18� 18,74� 12,21� 1,59�09.� Tojo�Una�Una� 28,88� 37,97� 14,83� 9,53� 3,89�10.��Sigi� 20,86� 39,36� 17,12� 15,97� 2,15�11.��Banggai�Laut1)� ... ... ... ... ...12.��Morowali�Utara1)� ... ... ... ... ...13.� �Palu� 10,96� 18,18� 19,89� 30,56� 6,17�� � � � � �
Sulawesi�Tengah� 21,60� 33,61� 19,00� 16,43� 3,18�
�Catatan/Note�������:��1)�Tergabung�Dengan�Kabupaten�Induknya/�Include�in�main�regency
http
://sul
teng
.bps
.go.
id

Sosial
Sulawesi Tengah in Figures 2014 123
Sambungan�Tabel�/�Continued�Table��5.1.20����
Kabupaten/Kota�Regency/City�
Pendidikan�Tertinggi�yang�Ditamatkan�Educational�Attainment�
D1/D2�Diploma�I/II
�
Akademi/�D3�
Academy/�Diploma�III�
�
Univer��sitas/D4�
University/�Diploma�IV�
�
Jumlah�Total�
(1)� (7)� (8)� (9)� (10)�
� � � � �
01.� Banggai�Kepulauan� 0,89� 0,59� 4,23� 100,00�
02.� Banggai� 0,94� 0,77� 4,05� 100,00�
03.� Morowali� 0,93� 1,24� 2,37� 100,00�
04.� Poso� 1,56� 1,00� 5,27� 100,00�
05.� Donggala� 0,72� 0,24� 1,42� 100,00�
06.� Tolitoli� 0,76� 0,46� 5,04� 100,00�
07.� Buol� 1,56� 0,57� 3,53� 100,00�
08.� Parigi�Moutong� 0,68� 0,40� 2,21� 100,00�
09.� Tojo�Una�Una� 1,68� 0,73� 2,50� 100,00�
10.���Sigi� 1,02� 0,83� 2,70� 100,00�
11.��Banggai�Laut1)� ... ... ... ...
12.��Morowali�Utara1)� ... ... ... ...
13.� �Palu� 1,47� 2,68� 10,07� 100,00�
� � � � �
Sulawesi�Tengah� 1,06� 0,94� 4,17� 100,00�
Catatan/Note�������:��1)�Tergabung�Dengan�Kabupaten�Induknya/�Include�in�main�regency
http
://sul
teng
.bps
.go.
id

Sosial
124 Sulawesi Tengah Dalam Angka 2014
Tabel�
Table� � 5.1.21�Persentase�Penduduk�Usia�10�Tahun�Keatas�menurut�Kemampuan�Membaca/Menulis�dan�Kabupaten/Kota,�2013��Percentage�of�Population�Aged�10�Years�and�Over�by�Reading/Writing�Ability�and�Regency/City,�2013�
� ��Diolah�dari�Survei�Sosial�Ekonomi�Nasional�(Susenas)�2013�Based�on�2013�National�Socio�Economic�Survey�
Kabupaten/�Kota�Regency/City�
Dapat�Membaca/Menulis�Reading�and�Writing�Ability� Tidak�dapat���
Membaca/�Menulis�Illiterate�
Huruf�Latin�Alphabet�
Huruf�Lainnya�Others�
Huruf�Latin�dan�Lainnya�
Alphabet��&�Others�
(1)� (2)� (3)� (4)� (5)�� � � � �
01.� Banggai�Kepulauan� 95,32� 19,11� 18,74� 4,32�02.� Banggai� 96,28� 30,60� 30,48� 3,59�03.� Morowali� 96,34� 5,55� 5,45� 3,57�04.� Poso� 97,17� 21,50� 21,18� 2,51�05.� Donggala� 93,69� 32,32� 30,61� 4,59�06.� Tolitoli� 95,85� 32,97� 32,84� 4,02�07.� Buol� 97,65� 32,73� 32,33� 1,95�08.� Parigi�Moutong� 93,35� 36,51� 34,57� 4,71�09.� Tojo�Una�Una� 95,88� 34,82� 34,46� 3,76�10.��Sigi� 94,23� 46,47� 44,95� 4,25�11.��Banggai�Laut1)� ... ... ... ...
12.��Morowali�Utara1)� ... ... ... ...
13.��Palu� 98,79� 52,64� 52,27� 0,85�� � � � �
Sulawesi�Tengah� 95,76� 32,94� 32,18� 3,47�
Catatan/Note�������:��1)�Tergabung�Dengan�Kabupaten�Induknya/�Include�in�main�regency
http
://sul
teng
.bps
.go.
id

Sosial
Sulawesi Tengah in Figures 2014 125
Tabel�
Table� � 5.1.22�Angka�Partisipasi�Kasar�Pendidikan�menurut�Kabupaten/Kota�dan�Kelompok�Umur,�2013��Gross�Enrollment�Ratio�of�Education�by�Regency/City�and�by�Age�Group,�2013�
��(Diolah�dari�Survei�Sosial�Ekonomi�Nasional�(Susenas)�2013)�(Based�on�2013�National�Socio�Economic�Survey)�
Kabupaten/Kota�Regency/City��
Kelompok�Umur�/�Age�Group�
7�12� 13�15� 16�18� 19�24�
(1)� (2)� (3)� (4)� (5)�� � � � �
01.� Banggai�Kepulauan� 107,49� 90,73� 69,08� 30,44�
02.� Banggai� 104,77� 88,03� 73,57� 18,55�
03.� Morowali� 104,81� 85,60� 85,98� 7,80�
04.� Poso� 100,75� 91,09� 89,09� 28,46�
05.� Donggala� 107,38� 83,31� 82,45� 27,36�
06.� Tolitoli� 107,48� 90,93� 70,46� 25,41�
07.� Buol� 100,95� 77,26� 88,57� 30,27�
08.� Parigi�Moutong� 102,14� 83,95� 67,88� 21,04�
09.� Tojo�Una�Una� 105,45� 64,69� 56,32� 12,64�
10.��Sigi� 103,82� 83,83� 72,52� 29,85�
11.��Banggai�Laut1)� ...� ...� ...� ...�
12.��Morowali�Utara1)� ...� ...� ...� ...�
13.��Palu� 99,65� 87,23� 84,75� 57,41�
� � � � �
Sulawesi�Tengah� 103,96� 85,06� 76,63� 29,62�
Catatan/Note�������:��1)�Tergabung�Dengan�Kabupaten�Induknya/�Include�in�main�regency
http
://sul
teng
.bps
.go.
id
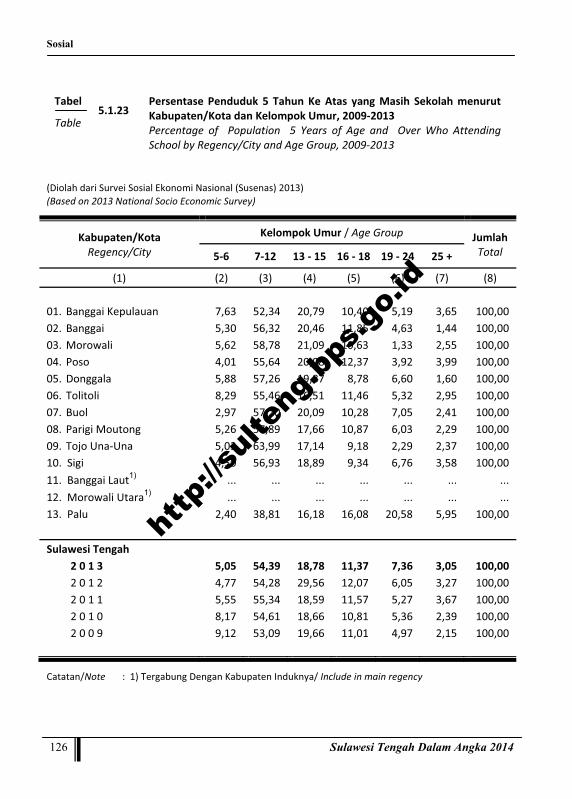
Sosial
126 Sulawesi Tengah Dalam Angka 2014
Tabel�
Table� � 5.1.23�Persentase�Penduduk� 5� Tahun�Ke�Atas� yang�Masih� Sekolah�menurut�Kabupaten/Kota�dan�Kelompok�Umur,�2009�2013��Percentage� of� � Population� � 5� Years� of� Age� and� � Over�Who� Attending���School�by�Regency/City�and�Age�Group,�2009�2013�
��(Diolah�dari�Survei�Sosial�Ekonomi�Nasional�(Susenas)�2013)��(Based�on�2013�National�Socio�Economic�Survey)�
Kabupaten/Kota�Regency/City�
Kelompok�Umur�/�Age�Group� Jumlah�Total�5�6� 7�12� 13���15 16���18 19���24 25�+�
(1)� (2)� (3)� (4)� (5)� (6)� (7)� (8)�� � � � � � � �
01.� Banggai�Kepulauan� 7,63� 52,34� 20,79� 10,40� 5,19� 3,65� 100,00�02.� Banggai� 5,30� 56,32� 20,46� 11,85� 4,63� 1,44� 100,00�03.� Morowali� 5,62� 58,78� 21,09� 10,63� 1,33� 2,55� 100,00�04.� Poso� 4,01� 55,64� 20,08� 12,37� 3,92� 3,99� 100,00�05.� Donggala� 5,88� 57,26� 19,87� 8,78� 6,60� 1,60� 100,00�06.� Tolitoli� 8,29� 55,46� 16,51� 11,46� 5,32� 2,95� 100,00�07.� Buol� 2,97� 57,20� 20,09� 10,28� 7,05� 2,41� 100,00�08.� Parigi�Moutong� 5,26� 57,89� 17,66� 10,87� 6,03� 2,29� 100,00�09.� Tojo�Una�Una� 5,03� 63,99� 17,14� 9,18� 2,29� 2,37� 100,00�10.��Sigi� 4,50� 56,93� 18,89� 9,34� 6,76� 3,58� 100,00�11.��Banggai�Laut1)� ...� ...� ...� ...� ...� ...� ...�12.��Morowali�Utara1)� ...� ...� ...� ...� ...� ...� ...�13.��Palu� 2,40� 38,81� 16,18� 16,08� 20,58� 5,95� 100,00�� � � � � � � �Sulawesi�Tengah� � � � � � � �
2�0�1�3� 5,05� 54,39� 18,78� 11,37� 7,36� 3,05� 100,00�2�0�1�2� 4,77� 54,28� 29,56� 12,07� 6,05� 3,27� 100,00�2�0�1�1� 5,55� 55,34� 18,59� 11,57� 5,27� 3,67� 100,00�2�0�1�0� 8,17� 54,61� 18,66� 10,81� 5,36� 2,39� 100,00�2�0�0�9� 9,12� 53,09� 19,66� 11,01� 4,97� 2,15� 100,00�� � � � � � � �
Catatan/Note�������:��1)�Tergabung�Dengan�Kabupaten�Induknya/�Include�in�main�regency
http
://sul
teng
.bps
.go.
id

Sosial
Sulawesi Tengah in Figures 2014 127
5.2.��Kesehatan�/�Health���
Tabel�Table� � 5.2.1�
Banyaknya�Peserta�Vaksinasi�menurut�Kabupaten/Kota,�2009�2013��Number�of�Vaccinated�Participant�by�Regency/City,�2009�2013�
��
Kabupaten/Kota�Regency/City� BCG� DPT3� Polio�III� Campak��
Measles�
(1)� (2)� (3)� (4)� (5)�� � � � �
01.� Banggai�Kepulauan� 3�352� 3�066� 3�299� 3�088�02.� Banggai� 5�777� 5�586� 5�830� 5�493�03.� Morowali� 4�572� 5�062� 4�992� 4�899�04.� Poso� 3�710� 3�823� 3�834� 3�704�05.� Donggala� 5�700� 5�468� 5�412� 5�285�06.� Tolitoli� 3�727� 3�376� 3�483� 3�074�07.� Buol� 2�676� 2�529� 2�729� 2�406�08.� Parigi�Moutong� 7�175� 6�714� 6�695� 6�449�09.� Tojo�Una�Una� 3�027� 3�083� 3�112� 3�032�10.��Sigi��� 3�749� 3�329� 3�368� 3�285�11.��Banggai�Laut1)� ... ... ... ...
12.��Morowali�Utara1)� ... ... ... ...
13.��Palu� 8�121� 8�275� 8�345� 7�912�� �� �� �� �����Sulawesi�Tengah� � � � �
2�0�1�3� 51�586� 50�311� 51�099� 48�627�2�0�1�2� 54�877� 52�807� 52�715� 52�095�2�0�1�1� 51�532� 50�045� 50�851� 48�811�2�0�1�0� 49�395� 45�910� 45�902� 45�037�2�0�0�9� 50�409� 48�047� 48�106� 47�910�
�� �
http
://sul
teng
.bps
.go.
id

Sosial
128 Sulawesi Tengah Dalam Angka 2014
Lanjutan�Tabel�/�Continued�Table��5.2.1���
Sumber/Source� :��Dinas�Kesehatan�Daerah�Provinsi�Sulawesi�Tengah�������������������������������� ���Health�Govt.�Service�of�Sulawesi�Tengah�Province��Catatan/Note�������:��1)�Tergabung�Dengan�Kabupaten�Induknya/�Include�in�main�regency
Kabupaten/Kota�Regency/City�
Bulan�Imunisasi�Anak�Sekolah�(BIAS)�School�Kids�Immunization�Month�
DT�Klas/Class�I�
Campak�Klas/�Class�1�
Tetanus��Klas/�Class�1�
Tetanus��Klas/�Class�2�
(1)� (6)� (7)� (8)� (9)�
� � � � �
01.� Banggai�Kepulauan� ...� ...� ...� ...�
02.� Banggai� ...� ...� ...� ...�
03.� Morowali� ...� ...� ...� ...�
04.� Poso� ...� ...� ...� ...�
05.� Donggala� ...� ...� ...� ...�
06.� Tolitoli� ...� ...� ...� ...�
07.� Buol� ...� ...� ...� ...�
08.� Parigi�Moutong� ...� ...� ...� ...�
09.� Tojo�Una�Una� ...� ...� ...� ...�
10.�Sigi�� ...� ...� ...� ...�
11.��Banggai�Laut1)� ...� ...� ...� ...�
12.��Morowali�Utara1)� ...� ...� ...� ...�
13.��Palu� ...� ...� ...� ...�� � � � �����Sulawesi�Tengah� � �
2�0�1�3� ...� ...� ...� ...�
2�0�1�2� 66�425� 66�450� �� 66�001�
2�0�1�1� 49�232� 44�226� 25�941� 45�960�
2�0�1�0� 49�979� 44�982� 24�312� 39�033�
2�0�0�9� 17�431� 17�334� 17�431� 14�928�
http
://sul
teng
.bps
.go.
id

Sosial
Sulawesi Tengah in Figures 2014 129
Tabel�Table� � 5.2.2.�
Banyaknya�Tenaga�Dokter�menurut�Kabupaten/Kota,�2009�2013�Number�of�Doctors�Personnel�by�Regency/City,�2009�2013�
�
Kabupaten/Kota�Regency/City�
Dokter�Umum�Doctor��������
Dokter�Spesialis�Specialist������
Dokter�Gigi�Dentist�������
Jumlah�Total�����������
(1)� (2)� (3)� (4)� (5)�� � � � �
01.� Banggai�Kepulauan� 30� 0� 4� 34�
02.� Banggai� 35� 14� 4� 53�
03.� Morowali� 53� 3� 9� 65�
04.� Poso� 34� 9� 9� 52�
05.� Donggala� 42� 2� 5� 49�
06.� Tolitoli� 23� 6� 4� 33�
07.� Buol� 18� 1� 5� 24�
08.� Parigi�Moutong� 26� 6� 10� 42�
09.� Tojo�Una�Una� 29� 4� 4� 37�
10.�Sigi� 27� 1� 9� 37�
11.��Banggai�Laut1)� ... ... ... ...
12.��Morowali�Utara1)� ... ... ... ...
13.��Palu� 125� 61� 33� 219�
� � � � �
Sulawesi�Tengah� �� �� �� ��
2�0�1�3� 442� 107� 96� 645�
2�0�1�2� 486� 114� 99� 699�
2�0�1�1� 487� 86� 119� 692�
2�0�1�0� 393� 88� 91� 572�
2�0�0�9� 375� 83� 78� 536�
Sumber/Source� :��Dinas�Kesehatan�Daerah�Provinsi�Sulawesi�Tengah�������������������������������� ���Health�Govt.�Service�of�Sulawesi�Tengah�Province��Catatan/Note�������:��1)�Tergabung�Dengan�Kabupaten�Induknya/�Include�in�main�regency
http
://sul
teng
.bps
.go.
id

Sosial
130 Sulawesi Tengah Dalam Angka 2014
Tabel�
Table� � 5.2.3�Banyaknya�Tenaga�Kesehatan�selain�Dokter�Kabupaten/Kota,�2009�2013�Number� of� Public�Health� Personnel� Except�Doctor� by� Regency/City,2009�2013�
�
Kabupaten/Kota�Regency/City�
Apote��ker�&�
Asisten�Pharmacist&�Assis��tance�
S�K�M�Master�
of�Public�Health�
Bidan�Mid��wife�
Pera��Wat�Nurse�
Sani���tarian�Sani���tariant�
Jumlah�Total�
(1)� (2)� (3)� (4)� (5)� (6)� (7)�01.�Banggai�Kepulauan� �42� �150� �221� �389� �20� �822�
02.�Banggai� �48� �115� �364� �497� �54� 1�078�
03.�Morowali� �33� �58� �155� �283� �27� �556�
04.�Poso� �81� �148� �311� �505� �54� 1�099�
05.�Donggala� �41� �72� �241� �226� �64� �644�
06.�Tolitoli� �40� �70� �173� �475� �27� �785�
07.�Buol� �37� �93� �142� �402� �35� �709�
08.�Parigi�Moutong� �63� �111� �370� �443� �73� 1�060�
09.�Tojo�Una�Una� �31� �51� �199� �309� �31� �621�
10.�Sigi� �35� �79� �282� �211� �35� �642�
11.��Banggai�Laut1)� ... ... ... ... ... ...
12.��Morowali�Utara1)� ... ... ... ... ... ...
13.��Palu� �159� �113� �449� 1�095� �102� 1�918��
� � � � � �
Sulawesi�Tengah� �� �� �� �� �� ��2�0�1�3� �610� 1�060� 2�907� 4�835� �522� 9�934�
2�0�1�2� 487� 1�071� 3�079� 5�010� 545� 10�192�
2�0�1�1� 397� 708� 2�080� 3�703� 421� 7�309�
2�0�1�0� 420� 761� 1�916� 3�707� 597� 7�401�
2�0�0�9� 391� 714� 1�822� 3�724� 572� 7�223�
Sumber/Source� :��Dinas�Kesehatan�Daerah�Provinsi�Sulawesi�Tengah�������������������������������� ���Health�Govt.�Service�of�Sulawesi�Tengah�Province��Catatan/Note�������:��1)�Tergabung�Dengan�Kabupaten�Induknya/�Include�in�main�regency
http
://sul
teng
.bps
.go.
id

Sosial
Sulawesi Tengah in Figures 2014 131
Tabel�Table� � 5.2.4�
Banyaknya�Penyalur�Obat�menurut�Kabupaten/Kota,�2009�2013�Number�of�Medicine�Distributors�by�Regency/City,�2009�2013�
��
Kabupaten/Kota�Regency/City�
Pedagang�Besar�Farmasi�
Wholesale�of�Pharmacy�
Apotik�Pharmacy�
Toko�Obat�Medicine�Store�
Jumlah�Total�
(1)� (2)� (3)� (4)� (5)�
� � � � �01. Banggai�Kepulauan� �� 4� 12� 16�
02. Banggai� � 31� 33� 64�
03. Morowali� � 15� 24� 39�
04. Poso� � 22� 57� 79�
05. Donggala� � 6� 6� 12�
06. Tolitoli� � 14� 6� 20�
07. Buol� � 10� 3� 13�
08. Parigi�Moutong� � 23� 10� 33�
09. Tojo�Una�Una� � 11� 8� 19�
10. Sigi� � 11� 5� 16�
11. Banggai�Laut1)� ... ... ... ...
12. Morowali�Utara1)� ... ... ... ...
13. Palu� 25� 152� 24� 201�
Sulawesi�Tengah� � � � �2�0�1�3� 25� 299� 188� 512�
2�0�1�2� 28� 280� 185� 493�
2�0�1�1� 27� 217� ���166� 410�
2�0�1�0� 26� 168� 188� 382�
2�0�0�9� 26� 132� 151� 309�
Sumber/Source� :��Dinas�Kesehatan�Daerah�Provinsi�Sulawesi�Tengah�������������������������������� ���Health�Govt.�Service�of�Sulawesi�Tengah�Province��Catatan/Note�������:��1)�Tergabung�Dengan�Kabupaten�Induknya/�Include�in�main�regency
http
://sul
teng
.bps
.go.
id

Sosial
132 Sulawesi Tengah Dalam Angka 2014
Tabel�
Table� � 5.2.5�Banyaknya� � Rumah� Sakit� � dan� Fasilitas� Tempat� � Tidur� menurut�Kabupaten/Kota,�2009�2013�Number�of�Hospitals�and�Beds�Facility�by�Regency/City,�2009�2013�
�
Kabupaten/Kota�Regency/City�
�
RSU�Pemerintah�Public�Hospital�
RSU�Swasta�Private�Hospital�
RSU�TNI/Polri�Army�Hospital�
Rumah�Sakit�
Hospital�
Tempat�Tidur�Bed�
Facility�
Rumah�Sakit�
Hospital�
Tempat�Tidur�Bed�
Facility�
Rumah�Sakit�
Hospital�
Tempat�Tidur�Bed�
Facility�(1)� (2)� (3)� (4)� (5)� (6)� (7)�
� � �01.�Banggai�Kepulauan� �� �� � � � �
02.�Banggai� �1� �242� � � � �
03.�Morowali� �1� �112� � � � �
04.�Poso� �1� �135� � � � �
05.�Donggala� �1� �102� � � � �
06.�Tolitoli� �1� �100� � � � �
07.�Buol� �1� �80� � � � �
08.�Parigi�Moutong� �2� �109� � � � �
09.�Tojo�Una�Una� �1� �152� � � � �
10.�Sigi� ��� �� � � � �
11.��Banggai�Laut� �1� �42� � � � �
12.��Morowali�Utara� �1� �75� � � � �
13.��Palu� �3� �856� �4� �267� �2� �183�
Sulawesi�Tengah� � � � � � �
2�0�1�3� �14� 2�005� �4� �267� �2� �183�
2�0�1�2� 12� 1�667� 5� 362� 2� 164�
2�0�1�1� 13� 2�549� 6� 361� 2� 148�
2�0�1�0� 13� 1�362� 6� 441� 2� 90�
2�0�0�9� 12� 1�276� 6� 495� 2� 102�
http
://sul
teng
.bps
.go.
id

Sosial
Sulawesi Tengah in Figures 2014 133
Lanjutan�Tabel�/�Continued�Table��5.2.5���
Kabupaten/Kota�Regency/City�
RS�Jiwa��Hospital�for�Mentally�
Sick�People�
Klinik�Bersalin�Maternal�Clinic�
Jumlah�Total�
Rumah�Sakit�
Hospital�
Tempat�Tidur�Bed�
Facility�
Rumah�Sakit�
Hospital�
Tempat�Tidur�Bed�
Facility�
Rumah�Sakit�
Hospital�
Tempat�Tidur�Bed�
Facility�
(1)� (8)� (9)� (10)� (11)� (12)� (13)�� � � � � � �
01.�Banggai�Kepulauan� � � � � �� ��
02.�Banggai� � � � � �1� �242�
03.�Morowali� � � � � �1� �112�
04.�Poso� � � � � �1� �135�
05.�Donggala� � � � � �1� �102�
06.�Tolitoli� � � � � �1� �100�
07.�Buol� � � � � �1� �80�
08.�Parigi�Moutong� � � � � �2� �109�
09.�Tojo�Una�Una� � � � � �1� �152�
10.�Sigi� � � � � �0� �0�
11.��Banggai�Laut1)� � � � � �1� �42�
12.��Morowali�Utara1)� � � � � �1� �75�
13.��Palu� �1� �200� ��� ��� �10� 1�506�
Sulawesi�Tengah�l� � � � � � �
2�0�1�3� �1� �200� �� �� �21� 2�655�
2�0�1�2� 1� 200� �� �� 20� 2�393�
2�0�1�1� �� �� 4� 88� 25� 2�945�
2�0�1�0� �� �� 4� 88� 26� 2�101�
2�0�0�9� �� �� 4� 85� 25� 2�198�
Sumber/Source� :��Dinas�Kesehatan�Daerah�Provinsi�Sulawesi�Tengah�������������������������������� ���Health�Govt.�Service�of�Sulawesi�Tengah�Province��Catatan/Note�������:��1)�Tergabung�Dengan�Kabupaten�Induknya/�Include�in�main�regency
http
://sul
teng
.bps
.go.
id

Sosial
134 Sulawesi Tengah Dalam Angka 2014
Tabel�
Table� � 5.2.6�Banyaknya� Posyandu� dan� Puskesmas� menurut� Kabupaten/Kota� dan�Jenis,�2009�2013�Number� of� Main� Service� Post� and� Local� Govt.� Clinics� by� Regency/City,�2009�2013�
�
Kabupaten/Kota�Regency/City�
Posyandu�Post�of�
Integrated�Service�
Pusat�Kesehatan�Masyarakat�/�Local�Govt.�Clinic�
Induk�Center�
Pembantu�Auxiliary�
Keliling�/�Roundtrip�
Mobil�Car�
Perahu�Boat�
Roda�dua�
Motor��cycle�
(1)� (2)� (3)� (4)� (5)� (6)� (7)�� � � � � � �
01.�Banggai�Kepulauan� �251� �15� �70� �12� �1� �63�02.�Banggai� �392� �24� �104� �4� �� �184�03.�Morowali� �314� �19� �72� �13� �2� �163�04.�Poso� �264� �21� �66� �22� �� �164�05.�Donggala� �447� �14� �72� �11� �1� �147�06.�Tolitoli� �246� �14� �74� �0� ��� �71�07.�Buol� �156� �11� �55� �9� �1� �71�08.�Parigi�Moutong� �440� �21� �80� �10� �� �84�09.�Tojo�Una�Una� �194� �13� �43� �8� �1� �101�10.��Sigi� �325� �19� �44� �16� ��� �96�11.��Banggai�Laut1)� ... ... ... ... ... ...
12.��Morowali�Utara1)� ... ... ... ... ... ...
13.��Palu� �220� �12� �29� �12� ��� �160�
Sulawesi�Tengah� �� �� �� �� �� ��2�0�1�3� 3�249� �183� �709� �117� �6� 1�304�2�0�1�2� 3�218� 176� 719� �� �� ��2�0�1�1� 3�223� 174� 693� 294� 29� 1�019�2�0�1�0� 3�149� 171� 724� 101� �� …�2�0�0�9� 2�623� ���162� �724� �101� �26� 776�
Sumber/Source� :��Dinas�Kesehatan�Daerah�Provinsi�Sulawesi�Tengah�������������������������������� ���Health�Govt.�Service�of�Sulawesi�Tengah�Province��Catatan/Note�������:��1)�Tergabung�Dengan�Kabupaten�Induknya/�Include�in�main�regency
http
://sul
teng
.bps
.go.
id
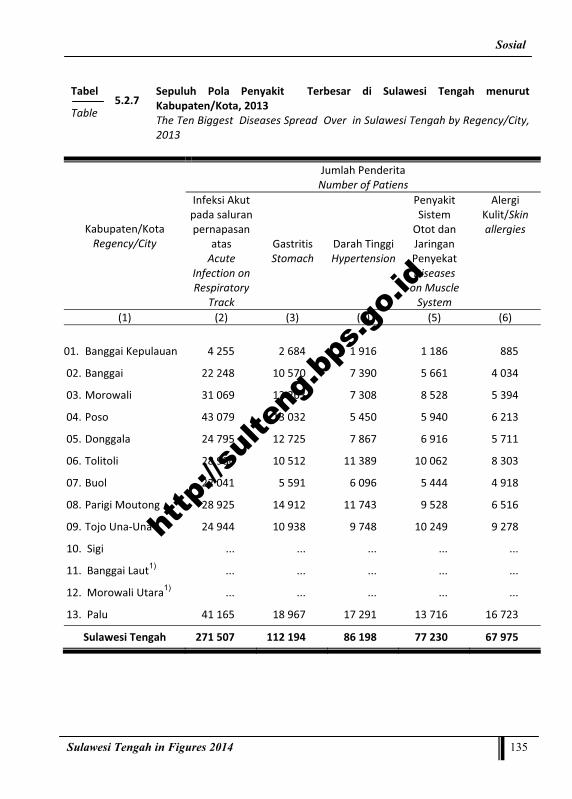
Sosial
Sulawesi Tengah in Figures 2014 135
Tabel�
Table� � 5.2.7�Sepuluh� Pola� Penyakit� � Terbesar� di� Sulawesi� Tengah� menurut�Kabupaten/Kota,�2013��The�Ten�Biggest��Diseases�Spread��Over��in�Sulawesi�Tengah�by�Regency/City,�2013�
�
Kabupaten/Kota�Regency/City�
Jumlah�Penderita��Number�of�Patiens�
Infeksi�Akut�pada�saluran�pernapasan�
atas�Acute�
Infection�on�Respiratory�
Track�
Gastritis�Stomach�
Darah�Tinggi�Hypertension
Penyakit�Sistem�
Otot�dan�Jaringan�Penyekat�Diseases�on�Muscle�System�
Alergi�Kulit/Skin�allergies�
(1)� (2)� (3)� (4)� (5)� (6)�� � � � � �
01.� Banggai�Kepulauan� 4�255� 2�684� 1�916� 1�186� �885�
02.�Banggai� 22�248� 10�570� 7�390� 5�661� 4�034�
03.�Morowali� 31�069� 12�263� 7�308� 8�528� 5�394�
04.�Poso� 43�079� 13�032� 5�450� 5�940� 6�213�
05.�Donggala� 24�795� 12�725� 7�867� 6�916� 5�711�
06.�Tolitoli� 28�986� 10�512� 11�389� 10�062� 8�303�
07.�Buol� 22�041� 5�591� 6�096� 5�444� 4�918�
08.�Parigi�Moutong� 28�925� 14�912� 11�743� 9�528� 6�516�
09.�Tojo�Una�Una� 24�944� 10�938� 9�748� 10�249� 9�278�
10.��Sigi� ...� ...� ...� ...� ...�
11.��Banggai�Laut1)� ...� ...� ...� ...� ...�
12.��Morowali�Utara1)� ...� ...� ...� ...� ...�
13.��Palu� 41�165� 18�967� 17�291� 13�716� 16�723�
Sulawesi�Tengah� 271�507� 112�194� 86�198� 77�230� 67�975�
��� �
http
://sul
teng
.bps
.go.
id

Sosial
136 Sulawesi Tengah Dalam Angka 2014
Lanjutan�Tabel�/�Continued�Table�5.2.7���
Kabupaten/Kota�Regency/City�
Jumlah�Penderita��Number�of�Patiens�
Diare�dan�Gastroentiritis�Oleh�Penyebab�infeksi/�Kolitis�
infection)/�Diarrhea�
Kecelakaan��dan�Ruda�
Paksa/��Accidents�and�Ruda�Forced�
Penyakit��Lain�pada�Saluran�
Pernafasan�bagian�
Atas/ Other�diseases�in�the�Upper�Respiratory�
Tract�
Penyakit�Tekanan�darah�rendah/�
Hypotension� Infeksi�Kulit/�Dermatitis�
(1)� (7)� (8)� (9)� (10)� (11)�� � � � � �
01.�Banggai�Kepulauan� 2�186� �� �� �� ��
02.�Banggai� 5�426� 3�134� �8� 1�204� 2�568�
03.�Morowali� 4�971� 3�630� �� 3�721� 5�035�
04.�Poso� 7�567� 1�755� 1�831� 1�953� 1�337�
05.�Donggala� 6�355� 4�393� �� 3�961� 3�298�
06.�Tolitoli� 5�069� 5�788� 4�552� 3�466� 2�461�
07.�Buol� 4�369� 7�028� �� 1�767� 3�189�
08.�Parigi�Moutong� 9�693� 4�393� �� 5�632� 3�298�
09.�Tojo�Una�Una� 3�879� 2�935� 2�940� 6�374� 3�423�
10.��Sigi� ...� ...� ...� ...� ...�
11.��Banggai�Laut1)� ...� ...� ...� ...� ...�
12.��Morowali�Utara1)� ...� ...� ...� ...� ...�
13.��Palu� 7�260� 4�035� 23�733� 2�541� 3�882�
Sulawesi�Tengah� 56�775� 37�091� 33�064� 30�619� 28�491�
Sumber/Source� :�� Dinas�Kesehatan�Daerah�Provinsi�Sulawesi�Tengah�Health�Govt.�Service�of�Sulawesi�Tengah�Province��
Catatan/Note�������:��1)�Tergabung�Dengan�Kabupaten�Induknya/�Include�in�main�regency�
http
://sul
teng
.bps
.go.
id

Sosial
Sulawesi Tengah in Figures 2014 137
�Tabel�
Table� � 5.2.8�Sepuluh� Besar� Penyakit� Terbanyak� � Penderita� Rawat� Jalan� di� Sulawesi�Tengah,�2013��The�Ten�Biggest�Most��Diseases�Outpatient�in�Sulawesi�Tengah,�2013�
Sumber/Source� :�� Dinas�Kesehatan�Daerah�Provinsi�Sulawesi�Tengah�Health�Govt.�Service�of�Sulawesi�Tengah�Province��
Catatan/Note�������:��1)�Tergabung�Dengan�Kabupaten�Induknya/�Include�in�main�regency
Nama�Penyakit�Name�of�Disease�
Penderita�Rawat�Jalan/�Outpatient�
�Jumlah�Kasus/�Case�Number��
�
Persentase/�Percentage�
(1)� (2)� (3)�� � �Infeksi�Akut�Lain�pada�Saluran�Pernafasan�Atas/�Acute�Infection�on�Respiratory�Track.� 271�507� 33,89�
�Gastritis/Stomach� 112�194� 14,00�
Penyakit�Tekanan�Darah�Tinggi/�Hypertension� 86�198� 10,76�
Penyakit�Sistem�Otot�dan�Jaringan�Penyekat�Diseases�on�Muscle�System� 77�230� 9,64�
Alergi�Kulit/Skin�allergies� 67�975� 8,48�
Diare�dan�Gastroentiritis�Oleh�Penyebab�infeksi/�Kolitis�infection)/�Diarrhea� 56�775� 7,09�
Kecelakaan��dan�Ruda�Paksa/��Accidents�and�Ruda�Forced� 37�091� 4,63�
Penyakit��Lain�pada�Saluran�Pernafasan�bagian�Atas/ Other�diseases�in�the�Upper�Respiratory�Tract�
33�064� 4,13�
Penyakit�Tekanan�darah�rendah/Hypotension� 30�619� 3,82�
Infeksi�Kulit/Dermatitis� 28�491� 3,56�
� Sulawesi�Tengah� 801�144� 100,00�
http
://sul
teng
.bps
.go.
id

Sosial
138 Sulawesi Tengah Dalam Angka 2014
Tabel�
Table� � 5.2.9�Banyaknya� � Pasangan� Usia� Subur/PUS,� Akseptor� � Baru,� Klinik� KB,�Persentase� Peserta� KB� Baru� per� 1000� Pasangan�Usia� Subur� dan� Rata�rata�Akseptor�Baru�per�Klinik�Keluarga�Berencana,�2009�2013��Number� of� Couples� of� Reproductive� Age� (CRA),� New� Acceptors,� Family�Planning� Clinics,� New�Acceptors� per� 1000� CRA� and�Average�New�Acceptors�per��Family�Planning�Clinic,�2009�2013�
�
Kabupaten/�Kota�Regency/�City�
�
Pasangan�Usia�
Subur��Couple�
Reproduc�tive�
Age(CRA)�
�Akseptor�
Baru�New�
Acceptors��
%�Peserta�KB�Baru�
Terhadap�PUS/�New�Acceptors�to�CRA�
�
Jumlah�KKB+PKBRS�Number�of�Family�Planning�Clinics�+�PKBRS�
Rata�rata�Akseptor�Baru�Per�
KKB+PKBRS�New�
Acceptors�per�FPC�+�PKBRS�
(1)� (2)� (3)� (4)� (5)� (6)�� � � � � �
01.� Banggai�Kepulauan� 31�849� 4�337� 13,62� 80� 54,21�02.� Banggai� 63�363� 8�442� 13,32� 132� 63,95�03.� Morowali� 41�102� 12�746� 31,01� 91� 140,07�04.� Poso� 41�447� 5�414� 13,06� 90� 60,16�05.� Donggala� 52�104� 8�553� 16,42� 75� 114,04�06.� Tolitoli� 38�356� 12�829� 33,45� 91� 140,98�07.� Buol� 24�711� 3�823� 15,47� 46� 83,11�08.� Parigi�Moutong� 85�177� 12�520� 14,70� 113� 110,80�09.� Tojo�Una�Una� 42�080� 3�578� 8,50� 64� 55,91�10.���Sigi� 43�992� 7�711� 17,53� 52� 148,29�11.��Banggai�Laut1)� ... ... ... ... ...12.��Morowali�Utara1)� ... ... ... ... ...13.��Palu� 59�078� 17�888� 30,28� 62� 288,52�Sulawesi�Tengah� � � � � �
2�0�1�3� 523�259� 97�841� 18,70� 896� 109,20�2�0�1�2� 531�930� 123�252� 23,17� 853� 94,19�2�0�1�1� 530�446� 119�350� 23,25� 823� 145,02�2�0�1�0� 510�650� 98�211� 19,23� 813� 120,80�2�0�0�9� 470�713� 77�518� 16,47� 774� 100,15�
Sumber/Source� :� Badan�Kependudukan�dan��Keluarga�Berencana�Nasional�Provinsi�Sulawesi�Tengah��National�Agency�Population�and�Family�Planning,�Sulawesi�Tengah�Province��
Catatan/Note����������:��1)�Tergabung�Dengan�Kabupaten�Induknya/�Include�in�main�regency
http
://sul
teng
.bps
.go.
id

Sosial
Sulawesi Tengah in Figures 2014 139
Tabel�
Table� � 5.2.10�Pencapaian� Target� Akseptor� Baru� Peserta� Keluarga� Berencana� menurut�Kabupaten/Kota�dan�Jenis�Alat�Kontrasepsi,�2009�2013�Realization� of� New� Acceptors� by� Regency/City� and� Kind� of� Contraception,�2009�2013�
�
Kabupaten/Kota�Regency/�
City�
Target�Target�
Jumlah�Peserta�KB�BaruTotal�New�Accep��tors�
Peserta�KB�Baru�menurut�Metode�Kontrasepsi�
The�New�Acceptors�by�Kind�of�Contraception�
I�U�D/�Spiral�
P�I�L�Pill�
Suntik�Injection
Susuk�KB�
Implant�
Kon��dom�
Condom�
M�O�Medical�Opera��tive�
(1)� (2)� (3)� (4)� (5)� (6)� (7)� (8)� (9)�� � � � � � � � �
01.�Banggai�Kepulauan� 4�228� 4�337 �98 1�878 1�950 �219 �190� ��02.�Banggai� 8�813� 8�442 �536 2�499 3�883 1�118 �377� ���03.�Morowali� 11�192� 12�746 �378 4�554 3�855 1�640 2�243� �37�04.�Poso� 4�246� 5�414 �893 1�171 1�915 1�006 �224� �30�05.�Donggala� 7�447� 8�553 �164 2�979 4�414 �791 �162� �14�06.�Tolitoli� 9�686� 12�829 �178 5�972 5�365 �949 �332� �2�07.�Buol� 3�216� 3�823 �74 1�118 2�089 �361 �119� �7�08.�Parigi�Moutong� 11�870� 12�520 �626 3�816 5�889 1�041 �925� �37�09.�Tojo�Una�Una� 3�961� 3�578 �410 �681 1�902 �391 �43� ��10.�Sigi��� 4�878� 7�711 �909 2�184 3�150 1�058 �317� �28�11.��Banggai�Laut1)� ... ... ... ... ... ... ... ...12.��Morowali�Utara1)� ... ... ... ... ... ... ... ...13.��Palu� 7�937� 17�888 2�232 5�246 7�880 �827 �977� �185�Sulawesi�Tengah�
2�0�1�3� 77�474� 97�841 6�498 32�098 42�292 9�401 5�909� �340�2�0�1�2� 98�290� 122�058 6�378 42�033 46�137 10�114 17�388� 1�202�2�0�1�1� 83�527� 119�350 5�013 43�734 47�208 9�666 12�642� 1�087�2�0�1�0� 83�479� 98�211 3�898 37�257 39�599 6�626 9�860� 973�2�0�0�9� ��65�729� 77�518 2�132 29�430 28�960 7�463 8�797� 736�
� � � �
Sumber/Source� :� Badan�Kependudukan�dan��Keluarga�Berencana�Nasional�Provinsi�Sulawesi�Tengah��National�Agency�Population�and�Family�Planning,�Sulawesi�Tengah�Province��
Catatan/Note����������:��1)�Tergabung�Dengan�Kabupaten�Induknya/�Include�in�main�regency
http
://sul
teng
.bps
.go.
id

Sosial
140 Sulawesi Tengah Dalam Angka 2014
Tabel�
Table� � 5.2.11�Jumlah� Pasangan� Usia� Subur� (PUS),� Peserta� � Keluarga� Berencana� � Aktif��menurut�Kabupaten/Kota�dan�Metoda�Kontrasepsi,�2009�2013�Number� Couples� of� Reproductive� Age� (CRA)� of� Active� Acceptors� by�Regency/City�and�Kind�of�Contraception,�2009�2013�
�
Kabupaten/K�o�t�a�Regency/City�
�P�U�S�CRA�
JumlahPeserta�KB�Aktif�Total�Active�
Acceptors
Peserta�KB�Aktif�menurut�Metode�Kontrasepsi�The�Active�Acceptorsby�Kind�of�Contraception�
I�U�D/�Spiral�
P�I�L�Pill�
Suntik�Injection�
Susuk�Implant�
Kondom�Condom�
MO�Medical�Operative�
(1)� (2)� (3) (4) (5) (6) (7) (8)� (9)�� � � �
01.�Banggai�Kepulauan� 31�849 25�991 �619 10�815 12�281 1�601 �639� �402.�Banggai� 63�363 49�553 3�602 19�202 20�086 5�082 �494� �21403.�Morowali� 41�102 29�997 4�991 2�326 3�763 2�772 16�122� �1404.�Poso� 41�447 33�790 4�179 12�031 12�230 3�979 �256� �10505.�Donggala� 52�104 42�342 1�623 17�128 18�124 4�109 �556� �35006.�Tolitoli� 38�356 29�500 1�258 11�745 10�579 4�146 �876� �407.�Buol� 24�711 20�494 �386 8�338 9�734 1�102 �527� �7308.�Parigi�Moutong� 85�177 69�218 5�109 24�875 27�740 7�559 1�871� �17909.�Tojo�Una�Una� 42�080 38�807 1�629 15�360 17�134 2�596 1�440� �5610.��Sigi� 43�992 34�634 2�998 12�002 14�178 3�957 �928� �8911.��Banggai�Laut1)� ... ... ... ... ... ... ... ...12.��Morowali�Utara1)� ... ... ... ... ... ... ... ...13.��Palu� 59�078 47�317 5�320 16�281 19�028 3�115 1�717� �38� �Sulawesi�Tengah� �
2�0�1�3� 523�259 421�643 31�714 150�103 164�877 40�018 25�426� 1�1262�0�1�2� 531�900 400�900 26�414 153�552 164�317 35�991 11�066� 9�9412�0�1�1� 539�446 397�790 22�675 156�677 162�451 36�029 10�488� 9�4702�0�1�0� 510�650 380�481 20�868 153�584 153�269 34�425 9�697� 8�6382�0�0�9� ���470�713 367�076 19�103 149�567 149�479 34�485 6�168� 8�274
� �
Sumber/Source� :� Badan�Kependudukan�dan��Keluarga�Berencana�Nasional�Provinsi�Sulawesi�Tengah��National�Agency�Population�and�Family�Planning,�Sulawesi�Tengah�Province�
Catatan/Note����������:��1)�Tergabung�Dengan�Kabupaten�Induknya/�Include�in�main�regency
http
://sul
teng
.bps
.go.
id

Sosial
Sulawesi Tengah in Figures 2014 141
Tabel�
Table� � 5.2.12�Banyaknya� Sarana� Pelayanan� Kontrasepsi� menurut� � Kabupaten/Kota,�2009�2013�Number�of�Contraception�Service�Facilities�by�Regency/City,�2009�2013�
�
Kabupaten/Kota�Regency/City�
PKBRS�Hospital�Family�
Planning�Service�
PPKBD�Village�
Family�Planning��Service�Center�
Sub�PPKBD�
Sub�Village�Family�Planning��Service�Center�
(1)� (2)� (3)� (4)�� � � �
01.�Banggai�Kepulauan� �� �207� �272�02.�Banggai� � �330� �518�03.�Morowali� � �252� �204�04.�Poso� � �156� �432�05.�Donggala� � �148� �653�06.�Tolitoli� � �104� �327�07.�Buol� � �106� �284�08.�Parigi�Moutong� � �285� �909�09.�Tojo�Una�Una� � �155� �310�10.�Sigi�� � �157� �433�11.��Banggai�Laut1)� ...� ...� ...�12.��Morowali�Utara1)� ...� ...� ...�13.��Palu� ��� �45� �359�� � � �Sulawesi�Tengah� � � �
2�0�1�3� �� 1�945� 4�701�2�0�1�2� �� 1�870� 4�559�2�0�1�1� �� 1�802� 3�623�2�0�1�0� 813� 2�132� 5�423�2�0�0�9� �����������774� ����������2�092� ��5�409�� � � �
Sumber/Source� :� Badan�Kependudukan�dan��Keluarga�Berencana�Nasional�Provinsi�Sulawesi�Tengah��National�Agency�Population�and�Family�Planning,�Sulawesi�Tengah�Province�
Catatan/Note����������:��1)�Tergabung�Dengan�Kabupaten�Induknya/�Include�in�main�regency
http
://sul
teng
.bps
.go.
id

Sosial
142 Sulawesi Tengah Dalam Angka 2014
Tabel�
Table� � 5.2.13�Jumlah� Keluarga� Sejahtera� menurut� Kabupaten/Kota� dan� Tahapan�Keluarga�Sejahtera,�2009�2013�Number�of�Prosperous� Families� by�Regency/City�and�Prosperous� Family�Stages,�2009�2013�
�
Kabupaten/Kota�Regency/City�
Tahapan�Keluarga�Sejahtera�Stage�of�Prosperous�Family�
Jumlah�Total�
Pra�KS�Pre�
Prospe�rous�Family�
KS�I�Prospe�rous�
Family�on�Stage�I�
�
KS�II�Prospe�rous�
Family�on�Stage�II�
KS�III�Prospe�rous�
Family�on�Stage�III�
KS�III�+�Prospe�rous�
Family�on�Stage�III�plus�
(1)� (2)� (3) (4) (5) (6) (7)�� � � � � � ��
01.�Banggai�Kepulauan� 17�905 12�360 11�842 5�173 �834 48�114�02.�Banggai� 26�404 23�017 26�732 12�088 6�366 94�607�03.�Morowali� 10�043 13�641 22�702 9�778 �355 56�519�04.�Poso� 10�797 15�468 18�002 11�046 1�015 56�328�05.�Donggala� 11�739 18�857 32�937 7�426 1�116 72�075�06.�Tolitoli� 10�860 11�803 18�132 9�543 �702 51�040�07.�Buol� 8�851 9�708 10�388 3�429 �601 32�977�08.�Parigi�Moutong� 25�832 31�472 31�274 20�734 3�849 113�161�09.�Tojo�Una�Una� 13�648 12�354 8�720 4�637 �481 39�840�10.�Sigi�� 17�896 16�942 16�798 8�559 �735 60�930�11.��Banggai�Laut1)� ... ... ... ... ... ...�12.��Morowali�Utara1)� ... ... ... ... ... ...�13.��Palu� 9�776 14�959 24�504 22�551 10�145 81�935�Sulawesi�Tengah� �2�0�1�3� 163�751 180�581 222�031 114�964 26�199 707�526�2�0�1�2� 162�317 179�174 219�846 110�045 22�595 693�977�2�0�1�1� 166�810 175�330 206�847 105�611 21�083 675�681�2�0�1�0� 169�592 171�070 196�654 99�543 18�838 655�697�2�0�0�9� 175�632 169�619 180�588 94�192 18�530 638�561�
Sumber/Source� :� Badan�Kependudukan�dan��Keluarga�Berencana�Nasional�Provinsi�Sulawesi�Tengah�/�National�Agency�Population�and�Family�Planning,�Sulawesi�Tengah�Province�
Catatan/Note����������:��1)�Tergabung�Dengan�Kabupaten�Induknya/�Include�in�main�regency
http
://sul
teng
.bps
.go.
id

Sosial
Sulawesi Tengah in Figures 2014 143
Tabel�
Table� � 5.2.14�Persentase� � Balita� � menurut� � Kabupaten/Kota� dan� Penolong� �Waktu��Lahir,�2009�2013�Percentage� of� Children� Under� Five� Year� by� Regency/City� and� � Birth�Attendant,�2009�2013�
�(Diolah�dari�Survei�Sosial�Ekonomi�Nasional�(Susenas)�2012)��(Based�on�2012�National�Socio�Economic�Survey)�
Kabupaten/Kota�Regency/City�
Penolong�Waktu�Kelahiran�Birth�Attendant�
Dokter�Doctor�
Bidan�Midwife�
Tenaga�Medis�Lain�Other�
Paramedic
Dukun�TraditionalHealer�
Famili�Family�
Lainnya�Others�
(1)� (2)� (3)� (4)� (5)� (6)� (7)�� �
01.�Banggai�Kepulauan� 4,70� 32,57� 5,82� 54,63� 2,28� ��02.�Banggai� 7,98� 63,04� 4,38� 19,39� 3,52� 1,69�03.�Morowali� 9,92� 51,66� �� 38,02� 0,39� ��04.�Poso� 8,24� 79,81� �� 10,13� 1,82� ��05.�Donggala� 5,48� 24,94� 0,87� 48,57� 18,52� 1,61�06.�Tolitoli� 9,43� 52,94� 0,67� 33,99� 2,97� ��07.�Buol� 6,68� 48,91� 0,49� 40,33� 3,58� ��08.�Parigi�Moutong� 4,48� 48,17� 1,07� 32,85� 13,42� ��09.�Tojo�Una�Una� 19,08� 20,27� 0,19� 55,52� 4,41� 0,53�10.�Sigi� 16,71� 47,22� �� 26,28� 8,77� 1,02�11.��Banggai�Laut1)� ...� ...� ...� ...� ...� ...�12.��Morowali�Utara1)� ...� ...� ...� ...� ...� ...�13.��Palu� 24,86� 66,63� �� 5,24� 3,27� ������ � � � � � �Sulawesi�Tengah� � � � � � �2�0�1�3� 10,40� 50,20� 1,24� 31,04� 6,67� 0,46�2�0�1�2� 13,68� 51,13� 1,71� 29,15� 4,21� 0,12�2�0�1�1� 13,34� 47,75� 2,10� 32,01� 4,46� 0,34�2�0�1�0� 11,91� 49,83� 1,9� 33,42� 2,82� 0,12�2�0�0�9� ��8,61� 50,25� ���3,65� ���33,60� ��3,74� ��0,16�
Catatan/Note����������:��1)�Tergabung�Dengan�Kabupaten�Induknya/�Include�in�main�regency
http
://sul
teng
.bps
.go.
id

Sosial
144 Sulawesi Tengah Dalam Angka 2014
5.3.��Peradilan�/�Justice��Tabel�
Table� � 5.3.1�Banyaknya� Perkara� Tindak� Pidana� Umum� yang� Masuk� dan� Diselesaikan�pada�Kejaksaan�Tinggi�menurut��Kabupaten/Kota,�2009�2013�Number� of� General� Law� Case� that� Reported� and� Cleared� by� State� Court� by�Regency/City,�2009�2013�
�
Kabupaten/Kota�Regency/City�
Sisa�Laporan�Tahun�Lalu�Last�Year�Remainder�
Masuk�Tahun�Laporan�Reported����
Diselesaikan�Cleared����
Sisa�Akhir�Tahun�����End�Year���Remainder����
(1)� (2)� (3)� (4)� (5)�� � � � �
01.�Banggai�Kepulauan� �9� �107� �104� �12�
02.�Banggai� �85� �268� �322� �31�
03.�Poso� �22� �86� �108� ��
04.�Donggala� ��� �244� �214� �30�
05.�Tolitoli� �11� �67� �72� �6�
06.�Buol�������� �2� �98� �91� �9�
07.�Parigi�Moutong� �21� �180� �161� �40�
08.�Tojo�Una�Una� �20� �106� �92� �34�
09.�Palu� �52� �443� �436� �59�
Sulawesi�Tengah� �� �� �� ��
2013� �222� 1�599� 1�600� �221�
2012� 221� 1�252� 1�251� 222�
2011� 205� 1�612� 1�596� 221�
2010� 256� 1�788� 1�839� 205�
2009� 188� ��������1�746� ��������1�678� 256�
Catatan/Note�� :� Morowali�masuk�wilayah�hukum�Kejaksaan�Negeri�Poso�Morowali�are�covered�by�Poso�State�Court�
Sumber/Source� :�� Kejaksaan�Tinggi�Sulawesi�Tengah�/�High�State�Court�of�Sulawesi�Tengah��
http
://sul
teng
.bps
.go.
id

Sosial
Sulawesi Tengah in Figures 2014 145
Tabel�
Table� � 5.3.2�Banyaknya��Perkara�Tindak�Pidana�Korupsi�yang�Masuk�dan�Diselesaikan�pada�Kejaksaan�Tinggi�dan�Negeri�menurut�Kantor�Kejaksaan�di�Provinsi�Sulawesi�Tengah,�2013��Number�of�Corruption�Cases�that�Reported�and�Cleared�on�High�Court�and�State�by��Court�Region�Office�in�Sulawesi�Tengah,�2013�
�
Kejaksaan�Negeri�dan�Tinggi�High�State�and�Court�
Sisa�tahun�lalu�
Last�year�remainder
Masuk�tahun�
laporan�Reported�
Jumlah�Total�
Penyele�saian�Cleared�
Sisa�tahun�laporan�
Current�year�Remainder�
(1)� (2)� (3)� (4)� (5)� (6)�� � � � � �
01. Kejari�Bangkep� 1� 2� 3� 1� 2�
02. Kejari�Luwuk� 2� 7� 9� 3� 6�
03. Kejari�Poso� 6� 4� 10� 3� 7�
04. Kejari�Donggala� 5� 4� 9� 6� 3�
05. Kejari�Tolitoli� 11� 8� 19� 11� 8�
06. Kejari�Buol� 5� 4� 9� 4� 5�
07. Kejari�Parigi� 10� 9� 19� 7� 12�
08. Kejari�Ampana� 2� 5� 7� 3� 4�
09. Kejari�Palu� � 9� 9� 4� 5�
10. Kejati�Sulteng� 8� 10� 18� 8� 10�
��� �� �� �� ��
Sulawesi�Tengah� 50� 62� 112� 50� 62�
� � � � � �
Sumber/Source� :�� Kejaksaan�Tinggi�Sulawesi�Tengah��� � High�State�Court�of�Sulawesi�Tengah
http
://sul
teng
.bps
.go.
id
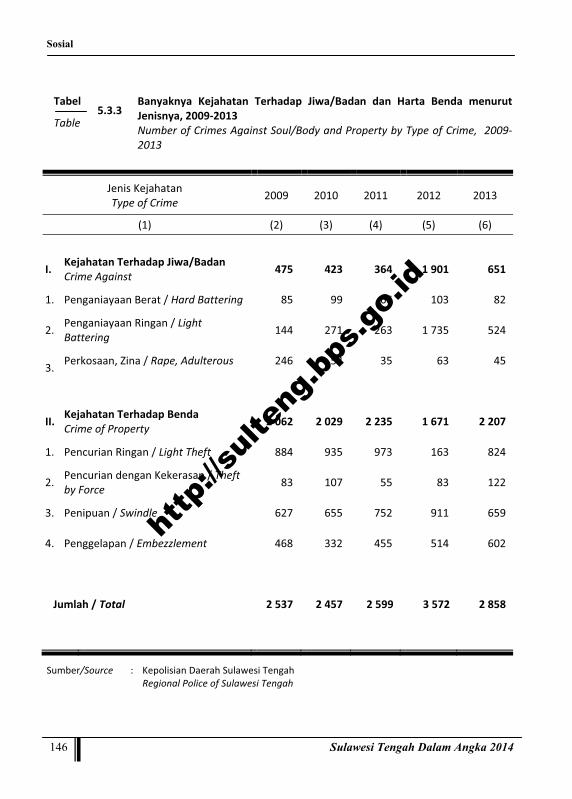
Sosial
146 Sulawesi Tengah Dalam Angka 2014
Tabel�
Table� � 5.3.3�Banyaknya� Kejahatan� Terhadap� Jiwa/Badan� dan� Harta� Benda� menurut�Jenisnya,�2009�2013��Number�of�Crimes�Against�Soul/Body�and�Property�by�Type�of�Crime,��2009�2013�
�
Jenis�Kejahatan�Type�of�Crime� 2009� 2010� 2011� 2012� 2013�
(1)� (2)� (3)� (4)� (5)� (6)�
� � � � � � �
I.��� Kejahatan�Terhadap�Jiwa/Badan�Crime�Against��� 475� 423� 364� 1�901� 651�
1.� Penganiayaan�Berat�/�Hard�Battering� 85� 99� 66� 103� 82�
2.� Penganiayaan�Ringan�/�Light�Battering� 144� 271� 263� 1�735� 524�
����3.�� Perkosaan,�Zina�/�Rape,�Adulterous ������ 246� 53� 35� 63� 45�
� � � � � � �
II.�� Kejahatan�Terhadap�Benda�Crime�of�Property� 2�062� 2�029� 2�235� 1�671� 2�207�
1.�� Pencurian�Ringan�/�Light�Theft�� 884� 935� 973��� 163� 824�
2.�� Pencurian�dengan�Kekerasan�/�Theft�by�Force� 83� 107� 55� 83� 122�
3.� Penipuan�/�Swindle������������ 627� 655� 752� 911� 659�
4.� Penggelapan�/�Embezzlement����������������� 468� 332� 455� 514� 602�
� � � � � � �
���Jumlah�/�Total� 2�537� 2�457� 2�599� 3�572� 2�858�
� � � � � ��
Sumber/Source� :�� Kepolisian�Daerah�Sulawesi�Tengah�Regional�Police�of�Sulawesi�Tengah�
�
http
://sul
teng
.bps
.go.
id

Sosial
Sulawesi Tengah in Figures 2014 147
Tabel�
Table� � 5.3.4�Banyaknya� Surat� Tanda� Nomor� Kendaraan� Bermotor� � (STNKB)� yang��Dikeluarkan��di�Daerah�Hukum�Polisi�Daerah,�2009�2013��Number�of�Motor�Vehicle�Licenses�Which�Issued�by�Regional�Police,��2009�2013�
�
T�a�h�u�n�Y�e�a�r�
Mobil�Penumpang�Passenger�
Cars�
�Mobil�Barang�
Truk�Truck�
�Kendaraan�
khusus��
Sepeda�Motor�Motor�Cycles�
�Jumlah�Total�
�
(1)� (2)� (3)� � (4)� (5)�
� � � � � �
2�0�0�9� 1�401� 462� 19� 28�112� 29�994�
2�0�1�0�� 4�612� 1�838� 38� 114�778� 121266�
2�0�1�1� 3�776� 2�914� 1� 89�847� 96�540�
2�0�1�2� 5�252� 2�594� 16�� 72�711� 80�573�
2�0�1�3� 12�067� 6�086� �26� 105�093� 123�272�
� � �
�
� �
Sumber/Source� :�� Kepolisian�Daerah�Sulawesi�Tengah�Regional�Police�of�Sulawesi�Tengah�
�
http
://sul
teng
.bps
.go.
id

Sosial
148 Sulawesi Tengah Dalam Angka 2014
Tabel�
Table� � 5.3.5�Perkembangan� Jumlah� Surat� Izin� Mengemudi� (SIM)� yang� dikeluarkan� di�Daerah�Hukum�Polisi�Daerah,�2009�2013�Trend�of�Driving�Licenses�Which�Issued�by�Regional�Police,�2009�2013�
�
T�a�h�u�n�Y�e�a�r�
J��e�n�i�s���S�I�M�Type�of�License���
Jumlah�Total�
A� B�I� B�II� C�A.�
Umum/General
B.I�Umum/General
B.II�Umum/General�
(1)� (2)� (3)� (4)� (5)� (6)� (7)� (8)� (9)�
� � � � � � � � �
2�0�0�9� 6�139� 715� 78� 21�800� 246� 1�190� 388� 30�556�
2�0�1�0�� 14�799� 1�338� 248� 72�430� 495� 2�258� 950� 92�518�
2�0�1�1� 18�451� 1�894� 333� 63�354� 451� 2�210� 1�061� 87�754�
2�0�1�2� 15�989� 1�406� 260� 42�042� 333� 892� 622� 61�544�
2�0�1�3� 19�665� 1�886� �275� 56�381� �369� 1�737� 1�049� 81�362�
� � � � � � � � �
Sumber/Source� :�� Kepolisian�Daerah�Sulawesi�Tengah�Regional�Police�of�Sulawesi�Tengah
http
://sul
teng
.bps
.go.
id

Sosial
Sulawesi Tengah in Figures 2014 149
Tabel�
Table� � 5.3.6�Perkembangan� Jumlah� Kecelakaan� Lalu� Lintas� dan� Korban� serta� � Nilai�Kerugian��pada�Daerah�Polisi�Daerah,�2009�2013�Trend�of�Total�Traffic�Accident�Victims�and�Materials�Lost,�2009�2013�
�
T�a�h�u�n�Y�e�a�r�
Banyaknya�Korban�Number�of�Victims�
Kerugian�Materi�Material�Lost�(000�
Rupiahs)��
Jumlah�Kecelakaan�
Total�Accidents�
�M�a�t�i�Death�
Luka�Berat�Heavy�Injured�
Luka�Ringan�Light�Injured�
(1)� (2)� (3)� (4)� (5)� (6)�
� � � � � �
2�0�0�9� 1�222� 370� 345� 1�115� 2�345�900�
2�0�1�0� 1�359� 411� 526� 1�077� 3�036�100�
2�0�1�1� 1�474� 402� 748� 1�016� 4�397�740�
2�0�1�2� 1�552� 386� 889�� 1�101� 5�554�390�
2�0�1�3� 1�574� �376� �986� 1�232� 5�446�760�
� � � � � �
Sumber/Source� :�� Kepolisian�Daerah�Sulawesi�Tengah�Regional�Police�of�Sulawesi�Tengah
http
://sul
teng
.bps
.go.
id

Sosial
150 Sulawesi Tengah Dalam Angka 2014
5.4.�Agama�/�Religion��
Tabel�Table� � 5.4.1�
Persentase�Pemeluk�Agama�menurut�Kabupaten/Kota,�2008�20121)��Percentage�of�Population�by�Religion�and�Regency/City,�2008�20121)�
�
Kabupaten/Kota�Regency/City�
Islam�Moslem�
Kristen�Christian�
Katolik�Catholic�
Hindu�Hinduism�
Budha�Buddhism�
Jumlah�Total�
(1)� (2)� (3)� (4)� (5)� (6)� (7)�
� � � � � � �
01.�Banggai�Kepulauan� 61,15� 32,99� 5,60� 0,01� 0,25� 100,00�
02.�Banggai� 77,66� 13,21� 1,85� 6,37� 0,91� 100,00�
03.�Morowali� 75,27� 22,14� 1,15� 0,41� 1,03� 100,00�
04.�Poso� 43,99� 47,42� 1,62� 6,74� 0,22� 100,00�
05.�Donggala� 71,85� 24,87� 0,51� 2,21� 0,55� 100,00�
06.�Tolitoli� 88,42� 7,56� 0,79� 1,33� 1,90� 100,00�
07.�Buol�������� 89,84� 7,01� 1,35� 0,39� 1,41� 100,00�
08.�Parigi�Moutong� 73,38� 7,42� 1,36� 17,21� 0,63� 100,00�
09.�Tojo�Una�Una� 90,42� 7,79� 0,97� 0,54� 0,28� 100,00�
10.�Palu� 80,23� 11,67� 2,52� 2,31� 3,27� 100,00�
� � � � � � �
Sulawesi�Tengah� � � � � � �2012� 74,45� 17,69� 1,60� 5,19� 1,07� 100,00�
2011� 74,45� 17,69� 1,60� 5,19� 1,07� 100,00�
2010� 75,31� 17,59� 1,54� 5,15� 0.40� 100,00�
2009� ���77,06� ������17,06� 1,42� 4,04� �0,42� 100,00�
2008� 77,08� 17,06� 1,41� 4,04� 0,40� 100,00�
� � � � � � �
Sumber/Source� �:� Kementerian�Agama�Provinsi�Sulawesi�Tengah�Ministry�of�Religion�Affair�of�Sulawesi�Tengah�Province�
Catatan/Note� �����:� 1�data�tahun�2013�tidak�tersedia/1 the�data�in�2013�are�not�available
http
://sul
teng
.bps
.go.
id

Sosial
Sulawesi Tengah in Figures 2014 151
�Tabel�
Table� � 5.4.2�Banyaknya� Tempat� Peribadatan� menurut� Kabupaten/Kota� dan� Agama,�2008�20121)��Number�of�Places�of��Worship�by�Regency/City�and�Religion,�2008�20121)�
�
Kabupaten/Kota�Regency/City�
I�s�l�a�m�M�o�s�l�e�m�
Kristen�Christian
Katolik�Catholic�
Hindu�Hinduism�
Budha�Buddhism�
Masjid�Mosque� �Mushola Gereja�
Church�Gereja�Church�
Pura�Temple�
Vihara�Monastery�
(1)� (2)� (3)� (4)� (5)� (6)� (7)�� � � � � � �
01.�Banggai�Kepulauan� 216� �� 244� 53� 0� 0�
02.�Banggai� 640� �� 254� 32� 4�888� 3�
03.�Morowali� 373� �� 134� 6� 680� 1�
04.�Poso� 194� �� 225� 6� 1�026� 0�
05.�Donggala� 680� �� 369� 15� 1�818� 1�
06.�Tolitoli� 423� �� 65� 5� 153� 3�
07.�Buol�������� 229� �� 22� 10� 147� 2�
08.�Parigi�Moutong� 469� �� 148� 15� 20�238� 1�
09.�Tojo�Una�Una� 231� �� 35� 4� 29� 0�
10.�Palu� 413� �� 65� 2� 352� 5�
� � � � � � �
Sulawesi�Tengah� � � � � � �
2012� 3�868� �� 1�561� 148� 29�331� 16�
2011� 3�360� 624� 1�561� 148� 223� 16�
2010� 3�207� 966� 1�860� 123� 322� 12�
2009� ��3�815� …� 1�322� 142� 222� 14�
2008� 2�849� 993� 1�568� 149� 222� 13�� � � � � � �
Sumber/Source� �:� Kementerian�Agama�Provinsi�Sulawesi�Tengah�Ministry�of�Religion�Affair�of�Sulawesi�Tengah�Province��
Catatan/Note�����������:� 1�data�tahun�2013�tidak�tersedia/1 the�data�in�2013�are�not�available
http
://sul
teng
.bps
.go.
id

Sosial
152 Sulawesi Tengah Dalam Angka 2014
Tabel�
Table� � 5.4.3�Banyaknya� Rohaniawan� menurut� Agama� dan� Kabupaten/Kota,�2008�20121)��Number�of�Spiritualists�by�Religion�and�Regency/City,�2008�20121)�
�
Kabupaten/Kota�Regency/City�
Islam�/�Moslem�Ulama�
Muslim�Scholar� Muballig� Khatib�Preacher�
Penyuluh�Instructor�
(1)� (2)� (3)� (4)� (5)�� � � � �
01.�Banggai�Kepulauan� ...� 151� 193� 2�
02.�Banggai� ... ...� ...� ...�
03.�Morowali� ... 195� 205� 2�
04.�Poso� ... 203� 195� 3�
05.�Donggala� ... 215� 300� 4�
06.�Tolitoli� ... 247� 293� 1�
07.�Buol�������� ... 205� 195� 2�
08.�Parigi�Moutong� ... 360� 247� 2�
09.�Tojo�Una�Una� ... 325� 250� 2�
10.�Palu� ... 295� 265� 10�
� � � � �
Sulawesi�Tengah� � � � �
2012� ...� 2�196� 2�143� 28�
2011� 15� �3�132� 3�655� 2�463�
2010� 15� 4�232� 4�635� 2�478�
2009� 4�705� 3�400� 2�810� 1�228�
2008� 4�705� 3�400� 2�810� 1�228�
�� � � �
http
://sul
teng
.bps
.go.
id

Sosial
Sulawesi Tengah in Figures 2014 153
Lanjutan�Tabel�/�Continued�Table��5.4.3����
Kabupaten/Kota�Regency/City�
Kristen�/�Christian� Katolik�/�Catholic�
Pendeta�Clergy�man�
Pendeta�Muda�Young�
Clergyman�
Pastor�Pastor�
Suster�Catholic�Nun�
Frater/Bruder�
(1)� (6)� (7)� (8)� (9)� (10)�� � � � � �
01.�Banggai�Kepulauan� 165� 75� 3� �� ��
02.�Banggai� 235� 139� 3� �� ��
03.�Morowali� 106� 66� 1� �� 1�
04.�Poso� 230� 105� 1� �� ��
05.�Donggala� 279� 75� 0� �� ��
06.�Tolitoli� 69� 29� 1� �� ��
07.�Buol�������� 46� 16� 1� �� ��
08.�Parigi�Moutong� 145� 45� 2� 3� ��
09.�Tojo�Una�Una� 79� 25� �� �� ��
10.�Palu� 196� 92� 4� 8� 5�
� � � � � �
Sulawesi�Tengah� � � � � �
2012� �1�550� 667� 16� 11� 6�
2011� 1�550� 667� 18� 12� 17�
2010� 1�865� 618� 18� 14� 16�
2009� 1�304� 418� 18� 12� 16�
2008� ��1�255� ���������376� 16� 10� 6�
� � � � � �
http
://sul
teng
.bps
.go.
id

Sosial
154 Sulawesi Tengah Dalam Angka 2014
Lanjutan�Tabel�/�Continued�Table���5.4.3��
Kabupaten/Kota�Regency/City�
Hindu�/�Hinduism� Budha�/�Buddhism�
Pemangku�Hindu�Priest� ‘Pedanda’� Upasaka�
Servant�‘Pandhita’�
Buddhist�Priest�(1)� (11)� (12)� (13)� (14)�
� � � � �
01.�Banggai�Kepulauan� �� �� 200� 40�
02.�Banggai� 95� 2� 1�700� 280�
03.�Morowali� 17� �� 590� 190�
04.�Poso� 48� 1� 230� 40�
05.�Donggala� 52� 1� 1�200� 270�
06.�Tolitoli� 11� �� 1�800� 350�
07.�Buol�������� 5� �� 977� 190�
08.�Parigi�Moutong� 158� 4� 1�200� 290�
09.�Tojo�Una�Una� 6� �� 98� 30�
10.�Palu� 3� �� 4�503� 1�050�
� � � � �
Sulawesi�Tengah� � � � �
2012� 395� 8� 12�498� 2�730�
2011� 392� 8� 300� 56�
2010� 400� 6� 300� 35�
2009� �������376� 7� 104� 31�
2008� 375� 7� 140� 17�
�� � � �
Sumber/Source� �:� Kementerian�Agama�Provinsi�Sulawesi�Tengah�Ministry�of�Religion�Affair�of�Sulawesi�Tengah�Province�
Catatan/Note� �:� 1�data�tahun�2013�tidak�tersedia/1 the�data�in�2013�are�not�available�
http
://sul
teng
.bps
.go.
id
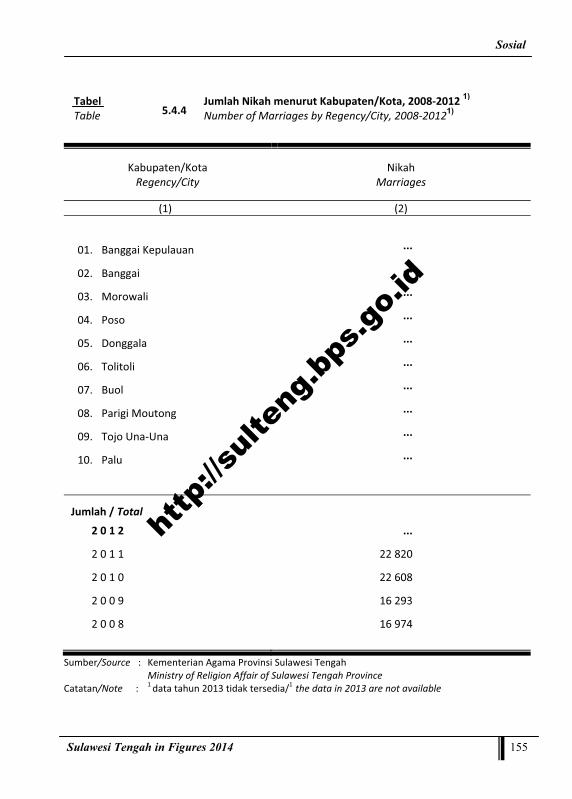
Sosial
Sulawesi Tengah in Figures 2014 155
Tabel�Table� � 5.4.4�
Jumlah�Nikah�menurut�Kabupaten/Kota,�2008�2012�1)�Number�of�Marriages�by�Regency/City,�2008�20121)�
�
Kabupaten/Kota�Regency/City�
Nikah�Marriages�
(1)� (2)�
� �
01. Banggai�Kepulauan� ...
02. Banggai� ...
03. Morowali� ...
04. Poso� ...
05. Donggala� ...
06. Tolitoli� ...
07. Buol�������� ...
08. Parigi�Moutong� ...
09. Tojo�Una�Una� ...
10. Palu� ...
� �
Jumlah�/�Total� �
2�0�1�2� ...�
2�0�1�1� 22�820�
2�0�1�0� 22�608�
2�0�0�9� 16�293�
2�0�0�8� 16�974�� �
Sumber/Source� �:� Kementerian�Agama�Provinsi�Sulawesi�Tengah�Ministry�of�Religion�Affair�of�Sulawesi�Tengah�Province��
Catatan/Note� :� 1�data�tahun�2013�tidak�tersedia/1 the�data�in�2013�are�not�available
http
://sul
teng
.bps
.go.
id

Sosial
156 Sulawesi Tengah Dalam Angka 2014
Tabel�
Table� � 5.4.5�Jumlah� Perkara� Yurisdiksi� Pengadilan� Tinggi� Agama� Sulawesi� Tengah�menurut�pengadilan�agama�tahun�2009�2013��Number� of� Jurisdiction� Cases� in� Religious� High� Court� by� Religious� Court� of�Sulawesi�Tengah,�2009�2013�
�
Kabupaten�/Kota�Regency�/City�
Perkara�Diterima�Received�Cases�
Perkara�Diputus�Decided�Cases�
Talak�Divorce�
Gugat�Accuse�
Perkara�Lain�
Others�
Talak�Divorce�
Gugat�Accuse�
Perkara�Lain�
Others�(1)� (2)� (3)� (4)� (5)� (6)� (7)�
� � � � � � �
PA.�Palu� �175� �466� �59� 130� 402� 67�
PA.�Luwuk� �136� �265� �37� 118� 243� 43�
PA.�Poso� �58� �144� �9� 44� 124� 15�
PA.�Tolitoli� �51� �162� �25� 45� 144� 47�
PA.�Donggala� �66� �202� �15� 63� 189� 26�
PA.�Buol� �32� �72� �20� 34� 66� 19�
PA.�Bungku� �41� �128� �4� 33� 109� 11�
PA.�Banggai� �46� �96� �5� 44� 75� 10�
PA.�Parigi� �59� �176� �14� 50� 154� 20�
� � � � � � �
Sulawesi�Tengah� � � � � � �
2�0�1�3� �664� 1�711� �188� �561� 1�506� �258�
2�0�1�2� 701� 1�661� 167� 606� 1�442� 262�
2�0�1�1� 636� 1457� 349� 570� 1�344� 437�
2�0�1�0� 632� 1�376� 222� 579� 1�242� 286�
2�0�0�9� 571� 1�243� 114� 442� �1�068� 165�
Sumber/Source� �:� Pengadilan�Tinggi�Agama�Palu�Sulawesi�Tengah�Religion�High�Court�of�Palu,�Sulawesi�Tengah�
http
://sul
teng
.bps
.go.
id

Sosial
Sulawesi Tengah in Figures 2014 157
5.5.�Sosial�Lainnya�/�Others�Social�Affairs������Tabel�
Table� � 5.5.1�Banyaknya� Anak� Terlantar� yang� di� Bina� di� Panti� Penyantunan� Anak�menurut�Kabupaten/�Kota�dan�Jenis�Ketrampilan,�2009�2013�Number�of�Neglected�Children�Building��in�Orphanage�by�Regency/City�and�Type�of�Skill,�2009�2013�
�
Kabupaten/�Kota�Regency/City�
Tata�Rias,�Menjahit�Make�Up,�Sewing�
Pertuka��ngan�
Carpentry�
Elektronik,�Auto��motif�
Electronic,�Automotive�
Jumlah�Total�
(1)� (2)� (3)� (4)� (5)�01.� Banggai�Kepulauan� 3� 1� 2� 6�02.� Banggai� 4� �� 2� 6�03.� Morowali� 3� 1� 2� 6�04.� Poso� 3� 1� 2� 6�05.� Donggala� 4� 2� 2� 8�06.� Tolitoli� 3� 1� 2� 6�07.� Buol� 2� 2� 2� 6�08.� Parigi�Moutong� 4� 1� 1� 6�09.� Tojo�Una�Una� 3� 2� 1� 6�10.� Sigi� 3� 3� 1� 7�11.��Banggai�Laut1)� ...� ...� ...� ...�12.��Morowali�Utara1)� ...� ...� ...� ...�13.��Palu� 4� 2� 1� 7�
Sulawesi�Tengah� �� �� �� ��2�0�1�3� 36� 16� 18� 70�2�0�1�2� 36� 16� 18� 70�2�0�1�1� 36� 16� 18� 70�2�0�1�0� 20� 10� 10� 40�2�0�0�9� 51� 28� 27� 106�
Sumber/Source� :� Dinas�Sosial�Daerah�Provinsi�Sulawesi�Tengah�Social�Goverment��Service�of��Sulawesi�Tengah�Province��
Catatan/Note����������:��1)�Tergabung�Dengan�Kabupaten�Induknya/�Include�in�main�regency
http
://sul
teng
.bps
.go.
id

Sosial
158 Sulawesi Tengah Dalam Angka 2014
Tabel�
Table� � 5.5.2�Banyaknya� � Penderita� Cacat� � menurut� Kabupaten/Kota� dan� Jenisnya,�2009�2013�Number�of�Handicapped�Persons�by�Regency/City�and�Types,�2009�2013�
�
Kabupaten/�Kota�Regency/City�
Tuna�Netra�Blind�
Tuna��Rungu/�
Tuna�wicara�
Deaf/Mute
Cacat�Tubuh�Physical�Handicap
Cacat�Mental�Mental�Handicap
Cacat�Ganda�Double�Handicap
Penderita�Penyakit�
Kronis�Chronic�Sick�
(1)� (2)� (3)� (4)� (5)� (6)� (7)�� � �
01.�Banggai�Kepulauan� �100� �45� �150� �25� �60� �25�02.�Banggai� �50� �40� �� �� �� ��03.�Morowali� �300� �150� �500� �55� �75� �40�04.�Poso� �150� �80� �600� �100� �60� �75�05.�Donggala� �50� �40� �250� �25� �40� �50�06.�Tolitoli� �134� �236� �391� �197� �37� �128�07.�Buol� �25� �25� �200� �30� �25� �25�08.�Parigi�Moutong� �40� �30� �350� �30� �30� �55�09.�Tojo�Una�Una� �20� �25� �250� �35� �25� �40�10.��Sigi� �30� �15� �300� �27� �40� �50�11.��Banggai�Laut1)� ...� ...� ...� ...� ...� ...�12.��Morowali�Utara1)� ...� ...� ...� ...� ...� ...�13.��Palu� �60� �65� �450� �211� �85� �125�
� �� �� �� �� �� ��Sulawesi�Tengah� � � � � � �2�0�1�3� �959� �751� 3�441� �735� �477� �613�2�0�1�2� �595� �751� 3�441� �738� �477� �613�2�0�1�1� 2�770� 4�665� 5�860� 3�064� 1�072� 2�103�2�0�1�0� 2�770� 4�665� 5�860� 3�064� 1�072� 2�103�2�0�0�9� 2�683� 4�605� 5�506� 3�056� 1�112� 2�173�
� � � � � � �
Sumber�/�Source� :� Dinas�Sosial�Daerah�Provinsi�Sulawesi�Tengah�Social�Goverment��Service�of��Sulawesi�Tengah�Province�
Catatan/Note���������������:��1)�Tergabung�Dengan�Kabupaten�Induknya/�Include�in�main�regency�
http
://sul
teng
.bps
.go.
id

Sosial
Sulawesi Tengah in Figures 2014 159
Tabel�
Table� � 5.5.3�Banyaknya��Komunitas�Adat�Terpencil�yang�Belum�Diberdayakan�menurut�Kabupaten�dan�Suku,�2009�2013�Number� of� Isolated� Communities�Which� Have� Not� Built� by� Regency� � and�Tribe,�2009�2013�
�
K�a�b�u�p�a�t�e�n�Regency�
Nama�Suku�Tribes�Name�
KK�Family�
Jiwa�Person�
(1)� (2)� (3)� (4)�� � � � � �01.� Banggai�Kepulauan� 1.�� Sea�sea� 441� 1�762�� � 2.�� Bajo� ...� ...�� � � � � �02.�� Banggai���������������� 1.�� Loinang�(saluam)� 1�157� 4�629�� � 2.�� wana� ...� ...�� � 3.� Balantak/masama� ...� ...�� � � � � �03.�� Morowali� 1.�� Wana(taa)� 875� 3�503�� � � � � �04.� Poso� 1.� wana� ...� ...�� � � � � �05.�� Donggala��������� 1.�� Tolare/Da'a� 428� ...�� � 2.�� Kori�Rai� 947� 3�788�� � 3.�� Unde� ...� ...�� � 4.�� Inde� ...� ...�� � 5.�� Tajio� ...� ...�� � 6.�� Pendau� ...� ...�� � 7.�� Ado� ...� ...�� � 8.�� Tado� 210� 844�� � 9.� Uma� 496� 1�984�� � 10.� Tara� ...� ...�� � 11.� Ledo� ...� ...�� � 12.�� Lauje� ...� ...�� � � � � �
http
://sul
teng
.bps
.go.
id

Sosial
160 Sulawesi Tengah Dalam Angka 2014
Lanjutan�Tabel�/�Continued�Table��5.5.3��
K�a�b�u�p�a�t�e�n�Regency�
Nama�Suku�Tribes�Name�
K�K�Family�
Jiwa�Person�
(1)� (2)� (3)� (4)�
06.� �Tolitoli�� 1.�� Lauje� 627� 2�508�
� � 2.�� Pandau� ...� ...�
� � 3.�� Dondo� 724� 2�896�
� � 4.� Lanje� ...� ...�
� � 5.� Hanje� ...� ...�
07.� Parigi�Moutong� 1.� Lauje� 1�649� 6�596�
� � 2.� Tara� ...� ...�
� � 3.� Pendau� ...� ...�
� � � � � �
08.� Tojo�Una�Una� 1.� Wana� 419� 4�676�
� � � � � �
09.� Sigi� 1.� Da'a� 1�606� �6�424�
Jumlah�/�Total� � � �� 2�0�1�3� � � 9�579� 39�610�� 2�0�1�2� � � ...� ...�
� 2�0�1�1� � � 13�195� 3�347�
� 2�0�1�0� � � 15�352� 57�991�
� 2�0�0�9� � � 15�352� 57�991�
� � � � � �
Sumber�/�Source� :� Dinas�Sosial�Daerah�Provinsi�Sulawesi�Tengah�Social�Goverment��Service�of��Sulawesi�Tengah�Province�
http
://sul
teng
.bps
.go.
id

Sosial
Sulawesi Tengah in Figures 2014 161
Tabel�
Table� � 5.5.4�Banyaknya� Panti� Asuhan� dan� Jumlah� Anak� yang� Disantuni� menurut�Kabupaten/Kota,�2009�2013�Number�of�Orphanages�and�Total�Protégées.�by�Regency/City,�2009�2013�
�
Kabupaten/Kota�Regency/City�
Panti�Asuhan�/�Orphanages�Anak�Asuh�Protégé.�Pemerintah�
Government�Non�Pemerintah�Non�Government�
(1)� (2)� (3)� (4)�
� � � �01.�Banggai�Kepulauan� �� �5� �69�
02.�Banggai� �� �19� �320�
03.�Morowali� �� �� ��
04.�Poso� �� �14� �210�
05.�Donggala� �� �4� �60�
06.�Tolitoli� �� �11� �195�
07.�Buol� �� �3� �45�
08.�Parigi�Moutong� �� �5� �75�
09.�Tojo�Una�Una� �� �� ��
10.��Sigi� �� �14� �210�
11.��Banggai�Laut1)� ...� ...� ...�
12.��Morowali�Utara1)� ...� ...� ...�
13.��Palu� �� �33� 1�054�
�� �� �� ��
Sulawesi�Tengah� � � �
2�0�1�3� �� �108� 2�238�
2�0�1�2� �� �114� 2�250�
2�0�1�1� 1� 117� 3�204�
2�0�1�0� 1� 116� 2�952�
2�0�0�9� 1� 116� 2�966�
Sumber�/�Source� :� Dinas�Sosial�Daerah�Provinsi�Sulawesi�Tengah�Social�Goverment�Service�of��Sulawesi�Tengah�Province�
Catatan/Note����������������:��1)�Tergabung�Dengan�Kabupaten�Induknya/�Include�in�main�regency�
http
://sul
teng
.bps
.go.
id

Sosial
162 Sulawesi Tengah Dalam Angka 2014
Tabel�
Table� � 5.5.5�Banyaknya� Jiwa� yang� Mendapat� Pelayanan� Penyantunan� Melalui�Sistem�Panti�dan�Non�Panti�per�Kabupaten/Kota�2009�2013�Number�of�People�Who�Obtained�Sympathetic�Care�Service�by�Institution�and�Non�Institution�System�by�Regency/City,�2009�2013�
�
Kabupaten/Kota�Regency/City�
Anak�Terlantar�Neglected�
Child�
PenderitaCacat�
Handicapped�Person�
Bekas�Hukuman�Ex�Prisoner�
Orang�JompoLanjut�Usia�Retired/Old�Person�
Tuna�Susila�Prostitute�
Panti�Insti�tution�
BukanPanti�Non�Institu�tion�
Panti�Insti�tution
BukanPanti�Non�Institution�
Panti�Insti�tution
BukanPanti�Non�Institution�
Panti�Insti�tution
BukanPanti�Non�Institution�
Panti�Insti�tution�
Bukan�Panti�Non�Institution�
(1)� (2)� (3)� (4)� (5)� (6)� (7)� (8)� (9)� (10)� (11)�01.� Banggai�Kepulauan� �69� � � � � � � � �� ��02.� Banggai� �320� � � � � � � � �� ��03.� Morowali� �� �20 � � � � � � �� �6�04.� Poso� �210� �20 � � � � � � �� ��05.� Donggala� �60� �20 � � � � � � �� ��06.� Tolitoli� �170� �20 �35 � � � � � �� �6�07.� Buol� �45� � � � � � � � �� ��08.� Parigi�Moutong� �75� �20 � � � � � � �� ��09.� Tojo�Una�Una� �� � � � � � � � �� ��10.��Sigi� �225� � � � � � � � �� ��11.��Banggai�Laut1)� ... ... ... ... ... ... ... ... ... ...12.��Morowali�Utara1)� ... ... ... ... ... ... ... ... ... ...13.��Palu� 1�014� �20 �35 �90 � � �120 �50 �30� ��
Sulawesi�Tengah� �� � � � � � � � �� ��2�0�1�3� 2�188� �120 �70 �90 � � �120 �50 �30� �12�2�0�1�2� 2�188� �120 �70 �90 � � �120 �50 �30� �12�2�0�1�1� 1�950� 120 117 201 � � 117 430 30� 8�2�0�1�0� 2�776� � 35 � � � 96 349 20� ��2�0�0�9� 2�812� 2�140 70 100 � 50 100 630 30� ��
Sumber�/�Source� :� Dinas�Sosial�Provinsi�Sulawesi�Tengah�Social�Goverment�Service�of��Sulawesi�Tengah�Province��
Catatan/Note����������������:��1)�Tergabung�Dengan�Kabupaten�Induknya/�Include�in�main�regency�
http
://sul
teng
.bps
.go.
id

Sosial
Sulawesi Tengah in Figures 2014 163
Tabel�
Table� � 5.5.6�Kejadian� Bencana� Alam� menurut� Jenis� Bencana� dan� Kabupaten/Kota,�2009�2013�Event�of��Natural�Disaster�by�Kind�of�Disaster�and�Regency/City,�2009�2013�
�
Kabupaten/Kota��Regency/City�
Banjir��Flood�
Kebakaran�Fire�
Angin�Topan�
Hurrican�ce�
Tanah�Longsor�Landslide�
Gempa�Bumi�Earth�Quake�
Gelombang�Pasang�
�
(1)� (2)� (3)� (4)� (5)� (6)� (7)�
� � � � � � �
01.� Banggai�Kepulauan� �� �� 1� 1� �� ��02.� Banggai� �� �� 1� �� �� 1�03.� Morowali� 2� �� 1� �� �� ��04.� Poso� 2� �� 1� �� �� ��05.� Donggala� 3� �� �� �� �� ��06.� Tolitoli� 2� �� �� �� �� ��07.� Buol� �� �� �� �� �� ��08.� Parigi�Moutong� 3� �� 1� �� �� ��09.� Tojo�Una�Una� 1� �� �� 1� �� ��10.� Sigi� 2� �� �� �� �� ��11.����Banggai�Laut1)� ... ... ... ... ... ...
12.����Morowali�Utara1)� ... ... ... ... ... ...
13.����Palu� 1� 3� �� �� �� ��
� �� �� �� �� �� ��
Sulawesi�Tengah� � � � � � �2�0�1�3� 16� 3� 5� 2� �� 1�2�0�1�2� 6� 1� 2� 1� �� ��2�0�1�1� 24� 4� �� �� �� 3�2�0�1�0� 6� 17� 3� 1� �� ��2�0�0�9� 24� 4� 7� 4� 5� 2�� � � � � � �
Sumber�/�Source� :� Dinas�Sosial�Daerah�Provinsi�Sulawesi�Tengah��Social�Goverment�Service�of��Sulawesi�Tengah�Province�
Catatan/Note����������������:��1)�Tergabung�Dengan�Kabupaten�Induknya/�Include�in�main�regency�
http
://sul
teng
.bps
.go.
id

Sosial
164 Sulawesi Tengah Dalam Angka 2014
Tabel�
Table� � 5.5.7�Banyaknya�Karang�Taruna�yang�Mendapat�Pelayanan�Kabupaten/Kota�dan�Klasifikasi,�2009�2013�Number� of� Youth� Associations� by� Regency/City� and� Classifications,��2009�2013�
�
Kabupaten/Kota�Regency/City�
Tumbuh�Growing�
Berkembang�Developing�
Maju�Advance�
Prestasi�Excellent�
(1)� (2)� (3)� (4)� (5)�
� � � � �01.� Banggai�Kepulauan� 110� 50� 2� 2�02.� Banggai� 90� 40� 6� 3�03.� Morowali� 75� 39� 8� 3�04.� Poso� 110� 60� 12� 3�05.� Donggala� 70� 35� 10� 5�06.� Tolitoli� 65� 12� � �07.� Buol� �� � � �08.� Parigi�Moutong� �� � � �09.� Tojo�Una�Una� 80� 20� 7� 1�10.����Sigi� 93� 20� 27� 3�11.����Banggai�Laut1)� ... ... ... ...
12.����Morowali�Utara1)� ... ... ... ...
13.����Palu� 24� 10� 5� 4�� �� �� �� ��
Sulawesi�Tengah� � � � �2�0�1�3� 717� 286� 77� 24�2�0�1�2� 717� 285� 74� 23�2�0�1�1� 907� 217� 43� 11�2�0�1�0� 747� 570� 146� 11�2�0�0�9� 696� 455� 248� 11�
� � � � �
Sumber�/�Source� :� Dinas�Sosial�Daerah�Provinsi�Sulawesi�Tengah�Social�Goverment��Service�of��Sulawesi�Tengah�Province��
Catatan/Note����������������:��1)�Tergabung�Dengan�Kabupaten�Induknya/�Include�in�main�regency�
�
http
://sul
teng
.bps
.go.
id

Sosial
Sulawesi Tengah in Figures 2014 165
Tabel�
Table� � 5.5.8�Jumlah� Pekerja� Sosial� Masyarakat� (PSM)� menurut� Kabupaten/Kota,�2009�2013�Number�of�Social�Workers�by�Regency/City,�2009�2013�
�
Kabupaten/Kota�Regency/City�
Jumlah�Desa/�Kelurahan2)�Number�of�
Villages/Urban�
Jumlah�Desa�yang�Ada�PSM�Number��of�
Villages�Which�Have�
Social�Workers�
Jumlah�PSM�Number��of�
Social�Workers�
PSM�yang�Mendapat�Pembinaan�
Social�Workers�Which�Got�Building�
(1)� (2)� (3)� (4)� (5)�
� � � � �01.�Banggai�Kepulauan� 144� �45� �136� �3�02.�Banggai� 337� �45� �171� �3�03.�Morowali� 129� �14� �15� �3�04.�Poso� 157� �25� �29� �3�05.�Donggala� 166� �40� �135� �6�06.�Tolitoli� 104� �55� �142� �3�07.�Buol� 115� �40� �139� �3�08.�Parigi�Moutong� 257� �18� �25� �3�09.�Tojo�Una�Una� 144� �15� �17� �2�10.��Sigi�� 155� �36� �48� �5�11.��Banggai�Laut� 66� ... 1) ... 1) ... 1)
12.��Morowali�Utara� 125� ... 1) ... 1) ... 1)
13.��Palu� 45� �41� �184� �6�� �� �� ��Sulawesi�Tengah� � � � �
2�0�1�3� 1�944� �374� 1�041� �40�2�0�1�2� …� �377� 1�033� �37�2�0�1�1� 1�815� 346� 993� 61�2�0�1�0� 1�778� 326� 946� 40�2�0�0�9� 1�458� 1�448� 4�408� 355�� � � � �
Sumber�/�Source�:�� Dinas�Sosial�Daerah�Provinsi�Sulawesi�Tengah�� Social�Goverment��Service�of��Sulawesi�Tengah�Province�� 2)�Badan�Pemberdayaan�Masyarakat�dan�Pemerintah�Desa�Daerah�Prov.�Sulawesi�Tengah��� Community�Empowerment�and�Village�Government�Services�Of�Sulawesi�Tengah�Province�Catatan/Note�������:��1)�Tergabung�Dengan�Kabupaten�Induknya/�Include�in�main�regency�
http
://sul
teng
.bps
.go.
id

Sosial
166 Sulawesi Tengah Dalam Angka 2014
Tabel�
Table� � 5.5.9�Jumlah�Organisasi�Sosial�menurut/Kota�dan�Klasifikasi,�2009�2013�Number�of�Social�Organizations�by�Regency/City�and�Classifications,��2009�2013�
�
Kabupaten/Kota�Regency/City�
Type�/�Classification1)� Jumlah�Total�A� B� C� D� E�
(1)� (2)� (3)� (4)� (5)� (6)� (7)�
� � � � � � �01.�Banggai�Kepulauan� ... ... ... ... ... 8�02.�Banggai� ... ... ... ... ... 13�03.�Morowali� ... ... ... ... ... 5�04.�Poso� ... ... ... ... ... 12�05.�Donggala� ... ... ... ... ... 4�06.�Tolitoli� ... ... ... ... ... 14�07.�Buol� ... ... ... ... ... 5�08.�Parigi�Moutong� ... ... ... ... ... 5�09.�Tojo�Una�Una� ... ... ... ... ... 4�10.�Sigi� ... ... ... ... ... 19�11.�Banggai�Laut1)� ... ... ... ... ... ...
12.�Morowali�Utara1)� ... ... ... ... ... ...
13.�Palu� ... ... ... ... ... 55�
� � � � � � ��
Sulawesi�Tengah� � � � � � �2�0�1�3� ... ... ... ... ... 144�2�0�1�2� ... ... ... ... ... 142�2�0�1�1� �� 7� 51� 79� �� 137�2�0�1�0� �� 8� 56� 52� �� 117�
2�0�0�9� �� 8� 86� 32� �� 126�
� � � � � � �
Sumber�/�Source� :� Dinas�Sosial�Daerah�Provinsi�Sulawesi�Tengah�Social�Goverment��Service�of��Sulawesi�Tengah�Province�
Keterangan��1):�Tipe�A�=�Mandiri;�� Tipe�C�=�Tumbuh;� Tipe�E�=�Ordes;�� Tipe�B�=�Berkembang;�� Tipe�D�=�Embrio;����Catatan/Note�������:��1)�Tergabung�Dengan�Kabupaten�Induknya/�Include�in�main�regency�
http
://sul
teng
.bps
.go.
id

Sosial
Sulawesi Tengah in Figures 2014 167
Tabel�Table� � 5.5.10�
Banyaknya�Permasalahan�Sosial�menurut�Kabupaten/Kota,�2009�2013�Number�of�Social�Problems�by�Regency/City,�2009�2013�
�
Kabupaten/Kota�Regency/City�
Wanita�Tuna�Susila�Prostitute�
Anak�Terlantar�Neglected��Child�
Jompo�Terlantar�Decrepit�Neglected�
(1)� (2)� (3)� (4)�
� � � �01.�Banggai�Kepulauan� �50� 2�339� �50�
02.�Banggai� �50� 2�222� �37�
03.�Morowali� �50� 3�213� �34�
04.�Poso� �50� 12�667� �50�
05.�Donggala� �300� 2�820� �80�
06.�Tolitoli� �300� 4�452� �75�
07.�Buol� �50� 2�625� �49�
08.�Parigi�Moutong� �75� 3�935� �70�
09.�Tojo�Una�Una� �10� 2�156� �51�
10.�Sigi� �� 2�515� �113�
11.��Banggai�Laut� �50� - -
12.��Morowali�Utara� �20� - -
13.��Palu� �500� 1�054� �107�
� �� �� ��
Sulawesi�Tengah� � � �
2�0�1�3� 1�505� 39�998� �716�
2�0�1�2� �955� 3�998� �590�
2�0�1�1� 843� 39�340� 37�709�
2�0�1�0� 1�350� 69�600� 48�657�
2�0�0�9� 1�350� 69�600� 48�657�
Sumber�/�Source� :� Dinas�Sosial�Daerah�Provinsi�Sulawesi�Tengah�Social�Goverment�Service�of��Sulawesi�Tengah�Province�
Catatan/Note���������������:��1)�Tergabung�Dengan�Kabupaten�Induknya/�Include�in�main�regency�
http
://sul
teng
.bps
.go.
id

Sosial
168 Sulawesi Tengah Dalam Angka 2014
Tabel�
Table� � 5.5.11�Banyaknya� Keluarga� Fakir� Miskin� yang� mendapat� Bantuan� serta�Penderita� Cacat� Mental� dan� Anak� Nakal� yang� mendapat� Pembinaan�dan�Pelayanan�Sosial�menurut��Kabupaten/Kota,�2009�2013�Number� of� Poor� Families�Which� Obtained� Aids,�Mentally� Handicapped�People� � and� Naughty� Children�Who� Got� Building� and� Social� Service� by�Regency/City,�2009�2013�
�
Kabupaten/Kota�Regency/City�
Fakir�Miskin�Poor�Family�
(KK)�
Penderita�Cacat�Mental�Mentally��
Handicapped�(Orang)�
Anak�Bermasalah�Sosial�
Naughty�Child�(Orang)�
(1)� (2)� (3)� (4)�
01.� Banggai�Kepulauan� 290� 3� ��02.� Banggai� 190� 1� ��03.� Morowali� �� 3� ��04.� Poso� 600� 4� ��05.� Donggala� 500� 5� ��06.� Tolitoli� 50� 2� ��07.� Buol� 230� � ��08.� Parigi�Moutong� 440� 4� ��09.� Tojo�Una�Una� 300� 2� ��10.� Sigi� 400� 5� ��11.��Banggai�Laut1)� … … …12.��Morowali�Utara1)� … … …13.��Palu� 75� 6� ��Sulawesi�Tengah� �� �� �
2�0�1�3� 3�075� 35� ��2�0�1�2� 2�300� 35� ��2�0�1�1� 1�000� 66� 13�936�2�0�1�0� 300� 67� ...�2�0�0�9� 400� 84� 13�963�� � � �
Sumber�/�Source� :� Dinas�Sosial�Daerah�Provinsi�Sulawesi�Tengah�Social�Goverment��Service�of��Sulawesi�Tengah�Province�
Catatan/Note����������������:��1)�Tergabung�Dengan�Kabupaten�Induknya/�Include�in�main�regency�
http
://sul
teng
.bps
.go.
id

Sosial
Sulawesi Tengah in Figures 2014 169
Tabel�
Table� � 5.5.12�Batas� �Miskin,� � Jumlah� dan� � Persentase� Penduduk� �Miskin�menurut�Status�Daerah,�2009�2013�Poverty�Line,��Number�and�Percentage�of�Population�Below�the�Poverty�Line,�2009�2013�
�(Diolah�dari�Survei�Sosial�Ekonomi�Nasional�(Susenas)�Bulan�Maret)�(Based�on�National�Socio�Economic�Survey�March�Month)�
Rincian/��Description�
KotaUrban�
PedesaanRural�
Kota+Pedesaan�Rural�+�Urban�
(1)� (2) (3) (4)�� �� 2009� �Batas�Miskin�(Rp/Kapita/bulan)�/�Poverty�Line�(Rp/Capita/Month)� 217�529� 182�241� 189�653�
Jumlah�Penduduk�Miskin/Number�of�Population�Below�the�Poverty�Line�(000)� 54,70� 435,20� 489�800�
Persentase/Percentage� 10,09 21,35 18,98�� 2010� �Batas�Miskin�(Rp/Kapita/bulan)�/�Poverty�Line�(Rp/Capita/Month)� 231�225� 195�795� 203�237�
Jumlah�Penduduk�Miskin/Number�of�Population�Below�the�Poverty�Line�(000)� 54,20� 420,80� 475�000�
Persentase/Percentage� 9,82 20,26 18,07�� 2011� �Batas�Miskin�(Rp/Kapita/bulan)�/�Poverty�Line�(Rp/Capita/Month)� 263�326� 226�509� 247�584�
Jumlah�Penduduk�Miskin/Number�of�Population�Below�the�Poverty�Line�(000)� 61,90� 361,74� 421�940�
Persentase/Percentage� 9,46 17,89 16,04�� 2012� �Batas�Miskin�(Rp/Kapita/bulan)�/�Poverty�Line�(Rp/Capita/Month)� 274�497� 237�340� 246�392�
Jumlah�Penduduk�Miskin/Number�of�Population�Below�the�Poverty�Line�(000)� 61,17� 357,�47� 418�640�
Persentase/Percentage� 9,24 17,39 15,40�� 2013� �Batas�Miskin�(Rp/Kapita/bulan)�/�Poverty�Line�(Rp/Capita/Month)� 298�646� 265�582� 273�624�
Jumlah�Penduduk�Miskin/Number�of�Population�Below�the�Poverty�Line�(000)� 59,79� 345,63� 405,42�
Persentase/Percentage� 8,90 16,53 ��14,67�
http
://sul
teng
.bps
.go.
id

Sosial
170 Sulawesi Tengah Dalam Angka 2014
Tabel�Table� � 5.5.13�
Jumlah�Penduduk�Miskin�menurut�Kabupaten/Kota,�2010���2012�Number�of�Poor�People�by�Regency/City,�2010�–�2012�
�(Diolah�dari�Survei�Sosial�Ekonomi�Nasional�(Susenas))��(Based�on�National�Socio�Economic�Survey)�
�� �
Kabupaten/Kota��Regency/City�
2010� 2011� 2012�
JumlahTotal�
(ribuan�/�thousands)
PersentasePercentage
JumlahTotal�
(ribuan�/�thousands)
PersentasePercentage
JumlahTotal�
(ribuan�/�thousands)�
Persentase�Percentage�
(1)� (2)� (3)� (4)� (5)� (6)� (7)�
� � � � � � �
01.� Banggai�Kepulauan� 33,5� 19,48� 31,8� 18,08� 30,2� 17,03�
02.� Banggai� 39,1� 12,07� 37,2� 11,25� 35,3� 10,48�
03.� Morowali� 41,9� 20,29� 39,8� 18,85� 37,7� 17,25�
04.� Poso� 45,3� 21,42� 43,0� 20,10� 40,8� 18,46�
05.� Donggala� 53,9� 19,43� 51,1� 18,03� 48,4� 17,02�
06.� Tolitoli� 34,2� 16,17� 32,4� 15,03� 30,7� 14,12�
07.� Buol� 24,8� 18,68� 23,5� 17,40� 22,3� 15,99�
08.� Parigi�Moutong� 83,4� 20,11� 79,1� 18,70� 75,0� 17,36�
09.� Tojo�Una�Una� 33,2� 24,07� 31,5� 22,37� 29,9� 20,97�
10.���Sigi� 32,4� 15,10� 30,8� 14,03� 29,2� 13,20�
11.� Palu� 33,5� 9,98� 31,8� 9,24� 30,1� 8,58�
� � � � � � �
Jumlah��/�Total� 455,1� 17,25� 432,1� 16,04� 409,6� 14,94�
http
://sul
teng
.bps
.go.
id

Sosial
Sulawesi Tengah in Figures 2014 171
5.6. Perumahan��/�Housing��Tabel�
Table� � 5.6.1�Penjualan� Rumah� melalui� Kredit� Pemilikan� Rumah� Bank� Negara� (KPR�BTN),�2008�2012�Sale�of�House�By�House�Ownership�Credit� (KPR)�of�National� Savings�Bank�(BTN),��2008�2012�
��
Akhir�Tahun�End�Of�Year�
Realisasi�/�Realization� Kumulatif�/�Cummulative�
Unit�Unit�
Nilai�/�Value�(Juta�/�Million�Rp)�
Unit�Unit�
Nilai�/�Value�(Juta�/�Million�Rp)�
(1)� (2)� (3)� (4)� (5)�
� � � � �
2�0�0�9� 1�094� 54�043,0� 15�821� 340�877,5�
2�0�1�0� 1�020� 51�533,0� 16�841� 392�410,0�
2�0�1�1� 898� 51�015,00� 17�739� 443�425,0�
2�0�1�2� 1�363�� 108�643,00� 19�102� 334�886,0�
2�0�1�3� 1�103� 110�187,00� 20�205� 445�073,0�
� � � � �
Sumber/Source� :�Bank�Indonesia��� ��National�Savings�Bank�
http
://sul
teng
.bps
.go.
id

Sosial
172 Sulawesi Tengah Dalam Angka 2014
Tabel
Table 5.6.2
Persentase Rumah Tangga menurut Kabupaten/Kota dan Status Kepemilikan Tempat Tinggal, 2013 Percentage of Households by Regency/City and House Ownership Status, 2013
(Diolah dari Survei Sosial Ekonomi Nasional (Susenas) 2013) (Based on 2013 National Socio Economic Survey)
Kabupaten/Kota Regency/City
Status penguasaan bangunan tempat tinggal Ownership status of house building
Milik sendiri
Own
Kontrak Contract
Sewa Rent
Bebas sewa
Free Rent
Dinas Govt.
Service
Milik orangtua/san
ak saudara Own Family
Jumlah Total
(1) (2) (3) (4) (5) (6) (7) (8)
01. Banggai Kepulauan 92,16 0,84 0,43 0,65 1,61 4,30 100,00
02. Banggai 83,65 1,29 3,03 1,98 3,51 6,54 100,00
03. Morowali 87,98 1,86 1,01 2,01 1,49 5,66 100,00
04. Poso 88,27 0,70 1,31 2,98 1,30 5,44 100,00
05. Donggala 85,88 0,65 0,00 0,58 3,42 9,47 100,00
06. Tolitoli 82,77 1,36 3,34 3,55 2,40 6,58 100,00
07. Buol 87,48 0,55 0,28 6,65 1,06 3,98 100,00
08. Parigi Moutong 86,72 1,70 0,17 2,45 0,72 8,24 100,00
09. Tojo Una-Una 87,50 0,61 1,11 1,87 0,92 7,98 100,00
10. Sigi 89,58 1,28 0,34 1,45 1,03 6,31 100,00
11. Banggai Laut1) … … … … … … …
12. Morowali Utara1) … … … … … … …
13. Palu 58,14 8,03 13,70 2,80 0,89 16,45 100,00
Sulawesi Tengah 83,23 2,04 2,72 2,30 1,73 7,97 100,00
Catatan/Note : 1) Tergabung Dengan Kabupaten Induknya/ Include in main regency
http
://sul
teng
.bps
.go.
id

Sosial
Sulawesi Tengah in Figures 2014 173
Tabel�
Table� � 5.6.3�Persentase� � Rumah� Tangga� menurut� Kabupaten/Kota� dan� Jenis� Atap�Terluas,�2013�Percentage�of�Households�by�Regency/City�and�Roof�Main�Material,�2013�
��(Diolah�dari�Survei�Sosial�Ekonomi�Nasional�(Susenas)�2013)�(Based�on�2013�National�Socio�Economic�Survey)�
Kabupaten/Kota�Regency/City�
Beton�Concre�
te�
Gen��teng��Tile�
Kayu�/Sirap�Wood�
Seng�Zinc�
Asbes�Asbes�tos�
Ijuk�Sugar�Palm�Fiber�
Lainnya�Others�
Jumlah�Total�
(1)� (2)� (3)� (4)� (5)� (6)� (7)� (8)� (9)�
� � � � � � � � �
01.�Banggai�Kepulauan� �� 0,67� �� 64,79� 0,40� 34,14� �� 100,00�
02.�Banggai� 1,28� 2,71� 0,83� 74,57� 1,11� 19,50� �� 100,00�
03.�Morowali� 0,73� 2,45� 0,25� 70,63� 3,40� 22,54� �� 100,00�
04.�Poso� 0,89� 1,85� 0,36� 83,44� 0,06� 12,34� 1,07� 100,00�
05.�Donggala� 0,32� 0,53� 0,16� 81,09� 0,57� 17,32� �� 100,00�
06.�Tolitoli� 1,73� 0,52� 0,37� 85,43� 1,14� 10,69� 0,14� 100,00�
07.�Buol� 0,23� 0,22� 0,21� 72,27� 3,79� 19,82� 3,46� 100,00�
08.�Parigi�Moutong� 0,49� 4,64� 0,63� 77,89� �� 15,86� 0,49� 100,00�
09.�Tojo�Una�Una� 0,99� �� 0,20� 61,56� 0,51� 36,74� �� 100,00�
10.�Sigi� 0,72� 0,58� 0,47� 81,73� 0,46� 15,37� 0,67� 100,00�
11.��Banggai�Laut1)� … … … … … … … …
12.��Morowali�Utara1)� … … … … … … … …
13.��Palu� 3,45� 2,32� 0,56� 92,65� �� 0,73� 0,29� 100,00�
� � � � � � � � �
Sulawesi�Tengah� 1,09� 1,92� 0,43� 78,36� 0,85� 16,93� 0,43� 100,00�
Catatan/Note����������:��1)�Tergabung�Dengan�Kabupaten�Induknya/�Include�in�main�regency
http
://sul
teng
.bps
.go.
id

Sosial
174 Sulawesi Tengah Dalam Angka 2014
Tabel�
Table� � 5.6.4�Persentase��Rumah�Tangga�menurut�Kabupaten/Kota�dan�Jenis�Lantai��Terluas,��2013�Percentage�of�Households�by�Regency/City�and�Primary�Construction�Material�of�the�Floor,�2013�
��(Diolah�dari�Survei�Sosial�Ekonomi�Nasional�(Susenas)�2013)�(Based�on�2013�National�Socio�Economic�Survey)�
Catatan/Note����������:��1)�Tergabung�Dengan�Kabupaten�Induknya/�Include�in�main�regency
Kabupaten/�Kota�Regency/City�
Marmer/�Keramik/�
Granit�Marmer�/�Ceramic�/�Granit��
Tegel�/�Teraso�Tegel�
Semen�Cement�
Kayu�Woods�
Tanah�Earth�
Lainnya�Other�
Jumlah�Total�
(1)� (2)� (3)� (4)� (4)� (5)� (6)� (7)�� � � � � � � �
01.�Banggai�Kepulauan� 8,46� 5,65� 53,95� 20,45� 7,65� 3,85� 100,00�
02.�Banggai� 9,24� 11,47� 63,69� 3,88� 11,35� 0,37� 100,00�
03.�Morowali� 10,71� 4,24� 58,40� 21,98� 4,30� 0,37� 100,00�
04.�Poso� 9,34� 6,63� 60,67� 13,96� 9,24� 0,16� 100,00�
05.�Donggala� 9,68� 6,04� 61,54� 17,19� 2,44� 3,11� 100,00�
06.�Tolitoli� 18,33� 5,12� 32,83� 42,80� 0,70� 0,22� 100,00�
07.�Buol� 12,77� 3,55� 52,33� 29,42� 1,92� �� 100,00�
08.�Parigi�Moutong� 9,86� 2,82� 70,19� 7,45� 7,75� 1,93� 100,00�
09.�Tojo�Una�Una� 7,11� 4,67� 56,20� 24,86� 6,32� 0,84� 100,00�
10.�Sigi� 8,36� 3,09� 69,23� 10,44� 5,60� 3,29� 100,00�
11.��Banggai�Laut1)� … … … … … … …
12.��Morowali�Utara1)� … … … … … … …
13.��Palu� 45,56� 6,91� 44,70� 2,62� 0,21� �� 100,00�
Sulawesi�Tengah� 14,72� 5,74� 57,88� 14,86� 5,50� 1,30� 100,00�
http
://sul
teng
.bps
.go.
id

Sosial
Sulawesi Tengah in Figures 2014 175
Tabel�
Table� � 5.6.5�Persentase��Rumah�Tangga�menurut�Kabupaten/Kota�dan�Jenis�Dinding�Terluas,�2013�Percentage�of�Households�by�Regency/City�and�Outer�Main�Wall�Material,��2013�
��(Diolah�dari�Survei�Sosial�Ekonomi�Nasional�(Susenas)�2013)�(Based�on�2013�National�Socio�Economic�Survey)�
Kabupaten/�Kota�Regency/City�
Tembok�Concrete�
Kayu�Wood�
Bambu�Bamboo�
Lainnya�Others�
Jumlah�Total�
(1)� (2)� (3)� (4)� (5)� (6)�� � � � � �
01.�Banggai�Kepulauan� 32,82� 62,34� 4,84� �� 100,00�
02.�Banggai� 42,50� 57,14� 0,24� 0,12� 100,00�
03.�Morowali� 31,95� 66,06� 0,46� 1,53� 100,00�
04.�Poso� 43,31� 54,80� 1,89� �� 100,00�
05.�Donggala� 45,52� 51,64� 2,27� 0,58� 100,00�
06.�Tolitoli� 41,07� 57,37� 0,03� 1,52� 100,00�
07.�Buol� 45,16� 53,96� 0,19� 0,69� 100,00�
08.�Parigi�Moutong� 45,84� 50,92� 2,74� 0,50� 100,00�
09.�Tojo�Una�Una� 46,40� 51,83� 1,37� 0,40� 100,00�
10.��Sigi� 47,89� 42,72� 7,96� 1,43� 100,00�
11.��Banggai�Laut1)� … … … … …
12.��Morowali�Utara1)� … … … … …
13.��Palu� 77,79� 22,13� �� 0,08� 100,00�
� � � � � �
Sulawesi�Tengah� 46,91� 50,60� 1,92� 0,57� 100,00�� � � � � �
Catatan/Note����������:��1)�Tergabung�Dengan�Kabupaten�Induknya/�Include�in�main�regency
http
://sul
teng
.bps
.go.
id

Sosial
176 Sulawesi Tengah Dalam Angka 2014
Tabel�
Table� � 5.6.6�Persentase� � Rumah� Tangga� menurut� Kabupaten/Kota� dan� Luas� Lantai�Tempat�Tinggal�(m2),�2013�Percentage� of� Households� by� Regency/City� and� Floor� Area� � of� Living�Quarters�(m2),�2013�
�(Diolah�dari�Survei�Sosial�Ekonomi�Nasional�(Susenas)�2013)�(Based�on�2013�National�Socio�Economic�Survey)�
Kabupaten/�Kota�Regency/City�
Luas�Lantai�Tempat�Tinggal�Floor�Area�of�Living�Quarters� Jumlah�
Total�<�20� 20�–�49� 50����99� 100�–�149� 150+�
(1)� (2)� (3)� (4)� (5)� (6)� (7)�� � � � � � �
01.�Banggai�Kepulauan� 3,69� 52,02� 36,92� 4,89� 2,48� 100,00�
02.�Banggai� 3,64� 38,95� 44,92� 9,03� 3,46� 100,00�
03.�Morowali� 3,95� 28,02� 51,77� 12,32� 3,95� 100,00�
04.�Poso� 4,88� 43,82� 37,72� 10,23� 3,35� 100,00�
05.�Donggala� 9,97� 46,82� 31,22� 8,34� 3,65� 100,00�
06.�Tolitoli� 5,18� 35,17� 40,51� 11,45� 7,69� 100,00�
07.�Buol� 2,42� 44,60� 39,94� 9,06� 3,99� 100,00�
08.�Parigi�Moutong� 6,74� 36,26� 44,09� 10,63� 2,28� 100,00�
09.�Tojo�Una�Una� 5,60� 36,16� 41,81� 12,59� 3,85� 100,00�
10.�Sigi� 7,22� 45,78� 35,06� 8,91� 3,02� 100,00�
11.��Banggai�Laut1)� … … … … … …
12.��Morowali�Utara1)� … … … … … …
13.��Palu� 5,48� 31,44� 39,18� 14,67� 9,23� 100,00�
�� � � � � �
Sulawesi�Tengah� 5,56� 39,17� 40,60� 10,35� 4,32� 100,00�� � � � � � �
Catatan/Note����������:��1)�Tergabung�Dengan�Kabupaten�Induknya/�Include�in�main�regency
http
://sul
teng
.bps
.go.
id

Sosial
Sulawesi Tengah in Figures 2014 177
Tabel�
Table� � 5.6.7�Persentase� � Rumah� Tangga� menurut� Kabupaten/Kota� dan� Sumber�Penerangan,�2013�Percentage�of�Households�by�Regency/City�and�Source�of�Lighting,�2013�
��(Diolah�dari�Survei�Sosial�Ekonomi�Nasional�(Susenas)�2013)�(Based�on�2013�National�Socio�Economic�Survey)�
Kabupaten/�Kota�Regency/City�
Listrik�PLN�State�
Electricity�
ListrikNon�PLN�Privately�GeneratedElectricity�
Petromak/Aladin�Pumped�Lamp�
Pelita/�Sentir�
Oil�Lamp/�Spotlight�
Lainnya�Others�
Jumlah�Total�
(1)� (2)� (3)� (4)� (5)� (6)� (7)�� � � � � � �
01.�Banggai�Kepulauan� 56,10� 19,18� 0,14� 24,58� �� 100,00�
02.�Banggai� 88,72� 5,80� 0,65� 4,66� 0,17� 100,00�
03.�Morowali� 69,53� 17,75� 0,25� 11,72� 0,75� 100,00�
04.�Poso� 88,87� 3,93� 0,42� 6,47� 0,30� 100,00�
05.�Donggala� 66,01� 13,97� 0,17� 19,65� 0,20� 100,00�
06.�Tolitoli� 86,83� 2,82� �� 10,35� �� 100,00�
07.�Buol� 65,25� 16,64� 1,72� 16,39� �� 100,00�
08.�Parigi�Moutong� 80,14� 4,62� 0,67� 14,42� 0,15� 100,00�
09.�Tojo�Una�Una� 65,43� 17,39� 0,35� 16,83� �� 100,00�
10.�Sigi�� 76,73� 5,61� 0,25� 16,98� 0,43� 100,00�
11.��Banggai�Laut1)� … … … … … …
12.��Morowali�Utara1)� … … … … … …
13.��Palu� 99,27� 0,73� �� �� �� 100,00�
� � � � � � �
Sulawesi�Tengah� 79,17� 8,44� 0,39� 11,82� 0,19� 100,00�� � � � � � �
Catatan/Note����������:��1)�Tergabung�Dengan�Kabupaten�Induknya/�Include�in�main�regency
http
://sul
teng
.bps
.go.
id

Sosial
178 Sulawesi Tengah Dalam Angka 2014
Tabel�
Table� � 5.6.8�Persentase��Rumah�Tangga�menurut�Kabupaten/Kota�dan�Sumber�Air�Minum,�2013�Percentage�of�Households�by�Regency/City�and�Source�of�Drinking�Water,��2013�
��
(Diolah�dari�Survei�Sosial�Ekonomi�Nasional�(Susenas)�2013)�(Based�on�2013�National�Socio�Economic�Survey)�
Kabupaten/Kota�Regency/City�
Air�dalam�
kemasan�Packaged�Water��
Leding�Pipe�
Sumur�bor/pompa�Artesian�well�
Sumur�terlind
ung�Protected�well�
Sumur�tak�terlindung�Unprotecte
d�well�
Mata�air�terlindung�Protected�spring�
(1)� (2)� (3)� (4)� (5)� (6)� (7)�� � � � � � �
01.�Banggai�Kepulauan� 7,08� 13,16� 0,49� 12,37� 3,92� 54,19�
02.�Banggai� 20,27� 12,49� 8,29� 30,59� 7,49� 17,72�
03.�Morowali� 19,38� 6,68� 0,23� 26,01� 11,77� 21,49�
04.�Poso� 13,74� 15,49� 5,41� 11,30� 3,41� 35,93�
05.�Donggala� 3,55� 9,00� 22,60� 14,00� 1,67� 25,12�
06.�Tolitoli� 15,31� 21,37� 4,36� 16,71� 3,10� 28,27�
07.�Buol� 14,08� 12,81� 1,84� 24,02� 15,68� 28,36�
08.�Parigi�Moutong� 15,98� 2,15� 19,83� 25,05� 10,00� 10,17�
09.�Tojo�Una�Una� 14,88� 16,95� 3,13� 6,38� 1,94� 34,56�
10.��Sigi� 4,15� 1,10� 27,41� 5,62� 4,91� 30,17�
11.��Banggai�Laut1)� … … … … … …
12.��Morowali�Utara1)� … … … … … …
13.��Palu� 63,34� 5,28� 26,21� 0,98� �� 2,81�
� � � � � � �
Sulawesi�Tengah� 19,59� 9,45� 12,98� 16,58� 5,70� 22,88�� � � � � � �
Catatan/Note����������:��1)�Tergabung�Dengan�Kabupaten�Induknya/�Include�in�main�regency
http
://sul
teng
.bps
.go.
id

Sosial
Sulawesi Tengah in Figures 2014 179
Lanjutan�Tabel�/�Continued�Table��5.6.8.�������
Kabupaten/Kota�Regency/City�
Mata�air�tak�terlindung�Unprotected�
spring�
Air�sungai�River�water�
Air�hujan�Rain�water�
Lainnya�Others�
Total�Total�
(1)� (8)� (9)� (10)� (11)� (12)�
� � � � � �01.�Banggai�Kepulauan� 4,45� �� 4,35� �� 100,00�
02.�Banggai� 2,59� 0,56� �� �� 100,00�
03.�Morowali� 5,77� 4,59� 3,98� 0,10� 100,00�
04.�Poso� 5,70� 7,52� 0,47� 1,03� 100,00�
05.�Donggala� 6,41� 17,46� �� 0,19� 100,00�
06.�Tolitoli� 3,63� 7,25� �� �� 100,00�
07.�Buol� 1,78� 0,86� 0,57� �� 100,00�
08.�Parigi�Moutong� 3,00� 13,23� 0,59� �� 100,00�
09.�Tojo�Una�Una� 10,08� 12,08� �� �� 100,00�
10.��Sigi� 11,31� 15,33� �� �� 100,00�
11.��Banggai�Laut1)� … … … … …
12.��Morowali�Utara1)� … … … … …
13.��Palu� 0,70� 0,69� �� �� 100,00�
� � � � � �
Sulawesi�Tengah� 4,54� 7,37� 0,79� 0,11� 100,00�� � � � � �
Catatan/Note����������:��1)�Tergabung�Dengan�Kabupaten�Induknya/�Include�in�main�regency
http
://sul
teng
.bps
.go.
id

Sosial
180 Sulawesi Tengah Dalam Angka 2014
Tabel�
Table� � 5.6.9�Persentase� � Rumah� Tangga� menurut� Kabupaten/Kota� dan� Jenis�Tempat��Buang�Air�Besar,�2013�Percentage�of�Households�by�Regency/City�and�Type�of�Closet�Facility,�2013�
��
(Diolah�dari�Survei�Sosial�Ekonomi�Nasional�(Susenas)�2013)�(Based�on�2013�National�Socio�Economic�Survey)�
Kabupaten/Kota�Regency/City�
Leher�Angsa��
Swan�Trine�
Pleng��sengan�
Cemplung/�Cubluk��Pit�Privy�
Lainnya�Others�
Jumlah�Total�
(1)� (2)� (3)� (4)� (5)� (6)�
� � � � � �01.�Banggai�Kepulauan� 90,04� 2,83� 4,99� 2,15� 100,00�
02.�Banggai� 83,74� 2,50� 13,44� 0,31� 100,00�
03.�Morowali� 83,90� 8,32� 5,25� 2,53� 100,00�
04.�Poso� 85,35� 5,99� 8,40� 0,26� 100,00�
05.�Donggala� 85,82� 2,28� 9,87� 2,03� 100,00�
06.�Tolitoli� 91,09� 1,13� 6,54� 1,24� 100,00�
07.�Buol� 89,95� 2,94� 6,72� 0,39� 100,00�
08.�Parigi�Moutong� 84,74� 2,14� 12,92� 0,20� 100,00�
09.�Tojo�Una�Una� 85,93� 2,24� 11,59� 0,24� 100,00�
10.�S�i�gi� 94,73� 3,25� 1,35� 0,67� 100,00�
11.��Banggai�Laut1)� … … … … …
12.��Morowali�Utara1)� … … … … …
13.��Palu� 95,26� 2,50� 2,24� �� 100,00�
� � � � � �
Sulawesi�Tengah� 88,25� 3,33� 7,61� 0,81� 100,00�
Catatan/Note����������:��1)�Tergabung�Dengan�Kabupaten�Induknya/�Include�in�main�regency
http
://sul
teng
.bps
.go.
id

Sosial
Sulawesi Tengah in Figures 2014 181
Tabel�
Table� � 5.6.10�Persentase� Rumah� Tangga� menurut� Kabupaten/Kota� dan� Pembuangan�Akhir�Tinja,2013��Percentage�of�Households�by�Regency/City�and�Final�Disposal�of�Feces,2013�
��
(Diolah�dari�Survei�Sosial�Ekonomi�Nasional�(Susenas)�2013)�(Based�on�2013�National�Socio�Economic�Survey)�
Kabupaten/Kota�Regency/City�
Tempat�pembuangan�akhir�tinja/�Final�Cesspool�
Jumlah�Total�
Tangki/�SPAL�Septic�Tank�
Kolam/�Sawah�Pond/�Rice�Field�
Sungai/danau/�
laut�River/�Lake/�Ocean�
Lobang�Tanah�Land�Hole�
Pantai/�kebun�Beach/��Garden�
Lain�nya�Others�
(1)� (2)� (3)� (4)� (5)� (6)� (7)� (8)�
� � � � � � � �
01.�Banggai�Kepulauan� 56,74� �� 23,10� 10,78� 8,82� 0,55� 100,00�
02.�Banggai� 61,16� 0,79� 9,77� 15,04� 11,29� 1,95� 100,00�
03.�Morowali� 59,09� 0,21� 11,36� 19,14� 6,35� 3,85� 100,00�
04.�Poso� 74,39� 0,56� 8,37� 12,46� 2,82� 1,39� 100,00�
05.�Donggala� 44,49� �� 28,67� 7,22� 17,88� 1,74� 100,00�
06.�Tolitoli� 60,34� 0,55� 21,30� 5,28� 11,15� 1,37� 100,00�
07.�Buol� 54,77� 0,46� 7,28� 6,70� 29,33� 1,46� 100,00�
08.�Parigi�Moutong� 47,92� 0,10� 29,84� 6,61� 14,21� 1,32� 100,00�
09.�Tojo�Una�Una� 42,96� �� 33,90� 10,21� 12,78� 0,16� 100,00�
10.�Sigi� 48,99� 1,70� 26,20� 8,20� 8,71� 6,20� 100,00�
11.��Banggai�Laut1)� … … … … … … …
12.��Morowali�Utara1)� … … … … … … …
13.��Palu� 91,30� 0,52� 1,87� 3,51� 0,31� 2,49� 100,00�
� � � � � � � �
Sulawesi�Tengah� 59,55� 0,44� 18,04� 9,39� 10,50� 2,08� 100,00�
Catatan/Note����������:��1)�Tergabung�Dengan�Kabupaten�Induknya/�Include�in�main�regency
http
://sul
teng
.bps
.go.
id

Sosial
182 Sulawesi Tengah Dalam Angka 2014
Tabel�
Table� � 5.6.11�Persentase� � Rumah� Tangga� � yang� � Sumber� � Air�Minumnya�dari� Pompa/�Sumur/Mata� Air� menurut� Kabupaten/Kota� dan� Jarak� Pompa/Sumur/�Mata�Air�ke�Penampungan�Akhir�Kotoran/Tinja�Terdekat�(m),�2013��Percentage� of� Households� Which� Used� Pump/Well/Spring� as� Source� of�Drinking� Water� by� Regency/City� and� the� Distance� to� the� Nearest� Septic�Tank��or�Other�Waste�Disposal�(m),�2013�
��
(Diolah�dari�Survei�Sosial�Ekonomi�Nasional�(Susenas)�2013)�(Based�on�2013�National�Socio�Economic�Survey)�
Kabupaten/Kota�Regency/City�
<�10� >=�10� Tidak�Tahu�Unknown�
Jumlah�Total�
(1)� (2)� (3)� (4)� (5)�
� � � � �01.�Banggai�Kepulauan� 4,86� 85,18� 9,95� 100,00�
02.�Banggai� 11,81� 62,27� 25,92� 100,00�
03.�Morowali� 29,92� 38,22� 31,86� 100,00�
04.�Poso� 19,35� 33,65� 47,00� 100,00�
05.�Donggala� 19,61� 37,81� 42,58� 100,00�
06.�Tolitoli� 6,39� 68,22� 25,39� 100,00�
07.�Buol� 12,23� 50,63� 37,14� 100,00�
08.�Parigi�Moutong� 22,19� 50,77� 27,04� 100,00�
09.�Tojo�Una�Una� 17,10� 64,07� 18,82� 100,00�
10.��Sigi� 11,78� 70,15� 18,07� 100,00�
11.��Banggai�Laut1)� … … … …
12.��Morowali�Utara1)� … … … …
13.��Palu� 40,32� 36,50� 23,18� 100,00�
� � � � �
Sulawesi�Tengah� 17,66� 54,21� 28,13� 100,00�
Catatan/Note����������:��1)�Tergabung�Dengan�Kabupaten�Induknya/�Include�in�main�regency
http
://sul
teng
.bps
.go.
id

Sosial
Sulawesi Tengah in Figures 2014 183
Tabel�
Table� � 5.6.12�Persentase� Rumah� Tangga� Menurut� Kabupaten/Kota� dan� Bahan�Bakar��yang�Digunakan,�2013��Percentage�of�Households�by�Regency/City�and�Fuel�Use,�2013�
��(Diolah�dari�Survei�Sosial�Ekonomi�Nasional�(Susenas)�2013)�(Based�on�2013�National�Socio�Economic�Survey)�
Kabupaten/Kota�Regency/City�
Bahan�bakar/energi�utama�untuk�memasakMain�Fuel�Use�for�Cooking�
Jumlah�Total�Listrik�
Electric�Gas/elpiji
Gas�
Minyak�tanah�
Kerosene�
Arang/�briket�
Charcoal�
Kayu�bakarFirewood
Lainnya�Others�
(1)� (2)� (3)� (4)� (5)� (6)� (7)� (8)�� � � � � � � �
01.�Banggai�Kepulauan� �� 0,01� 20,81� 1,02� 77,80� 0,37� 100,00�
02.�Banggai� 0,05� 1,96� 30,10� 1,17� 66,72� �� 100,00�
03.�Morowali� �� 3,73� 29,82� 1,55� 64,90� �� 100,00�
04.�Poso� �� 3,49� 21,08� �� 75,42� �� 100,00�
05.�Donggala� �� 0,46� 13,72� 27,52� 58,31� �� 100,00�
06.�Tolitoli� �� 3,88� 20,49� 22,55� 52,74� 0,34� 100,00�
07.�Buol� 0,18� 1,26� 12,56� 4,30� 81,70� �� 100,00�
08.�Parigi�Moutong� �� 1,50� 16,98� 1,56� 79,77� 0,19� 100,00�
09.�Tojo�Una�Una� �� 1,24� 22,29� 4,69� 71,78� �� 100,00�
10.�Sigi� 0,12� 2,56� 16,05� 0,93� 80,34� �� 100,00�
11.��Banggai�Laut1)� … … … … … … …
12.��Morowali�Utara1)� … … … … … … …
13.��Palu� 0,39� 16,50� 74,11� 0,52� 7,86� 0,61� 100,00�
� � � � � � � �
Sulawesi�Tengah� 0,07� 3,81� 27,39� 5,72� 62,85� 0,16� 100,00�
Catatan/Note����������:��1)�Tergabung�Dengan�Kabupaten�Induknya/�Include�in�main�regency
http
://sul
teng
.bps
.go.
id

SOSIAL SULAWESI TENGAH DALAM ANGKA 2012
184 BPS Provinsi Sulawesi Tengah
http
://sul
teng
.bps
.go.
id

Agriculture
Sulawesi Tengah in Figures 2014 185
PERTANIANAgriculture
http
://sul
teng
.bps
.go.
id

Pertanian
186 Sulawesi Tengah Dalam Angka 2014
P
http
://sul
teng
.bps
.go.
id

Agriculture
Sulawesi Tengah in Figures 2014 187
6.��PERTANIAN���
Pembangunan� Bidang� Ekonomi�yang� dilakukan� Pemerintah,� diarahkan�pada� peningkatan� sektor� industri� dengan�didukung� oleh� sektor� pertanian� yang�tangguh.� Pembangunan� di� sektor�pertanian� menjadi� lebih� penting� lagi�disebabkan� jumlah� penduduk� yang�berusaha� di� bidang� pertanian� masih�sangat� besar.� Gambaran� mengenai�keadaan� pertanian� di� Sulawesi� Tengah�yang� menyangkut� luas� lahan� yang�digunakan� serta� produksinya� disajikan�pada�bab�ini.�
�Sektor� pertanian� terdiri� dari�
beberapa�sub�sektor,�yaitu�:��
6.1.� Subsektor� Pertanian� Tanaman�Pangan�
6.2.�����Subsektor�Perkebunan��6.3.�����Subsektor�Kehutanan�6.4.�����Subsektor�Peternakan�6.5.�����Subsektor�Perikanan�����6.1.��Pertanian�Tanaman�Pangan��� Angka� produksi� padi� Sulawesi�Tengah� tahun� 2013� sebanyak� 1.031.364�ton.� Bila� dibandingkan� terhadap� tahun�2012�dengan�produksi�padi�1.024.315�ton�berarti� mengalami� kenaikan� sekitar� 0,69�persen.� Peningkatan� ini� terjadi� karena�kenaikan�produktivitas.���
6.�AGRICULTURE�
Economy� sector� development� by�government� is� aimed� to� improvement� of�industrial�sector�with�supportingof�strong�agriculture� sector.� Development� in�agriculture� sector� becomes� more�important,� because� the� peoplewhohad�been� working� in� agricultural� sector� still�much.� Descriptions� about� agriculture�condition� in� Sulawesi� Tengah� related� to�using� land� area� and� its� production� are�presented�in�this�chapter.��
��Agriculture� sector� consists� of� some�
sub�sectors,�that�is:��
6.1.�Food�Crops�Sub�sector��6.2.�Plantation�Sub�sector�6.3.�Forestry�Sub�sector�6.4.�Livestock�Sub�sector�6.5.�Fishery�Sub�sector���6.1.�Food�Crops��Paddy�production�rate�of�Sulawesi�Tengah�2013� was� 1,031,364� tons.� When�compared� to� the� year� 2012� with�1,024,315� � tons�of� rice�production�meant�a�rise�of�about�1.68�percent.�This�increase�occurred� because� the� decrease� in�productivity.���
http
://sul
teng
.bps
.go.
id

Pertanian
188 Sulawesi Tengah Dalam Angka 2014
Tanaman� palawija� terdiri� atas�tanaman� jagung,� ubi� kayu,� ubi� jalar,�kacang� tanah,�kacang�kedelai�dan�kacang�hijau.�Produksi�palawija�pada�tahun�2013�mengalami� penurunan,� kecuali� komoditi�ubi�kayu�dan�kedelai.�Penurunan�produksi�tersebut� disebabkan� semakin� ber�kurangnya� luas� panen� masing�masing�komoditas� tersebut� walaupun� semuanya�mengalami�peningkatan�produktivitas.�
�Tanaman� sayur�sayuran� di�
Sulawesi� Tengah� yang� tercatat�perkembangannya� meliputi� tujuh� belas�jenis� tanaman� sayur�sayuran� mulai� dari�Bawang� daun,� Kentang,� Kubis,� sampai�dengan� Kangkung.� Di� tahun�2013� dari� 17�jenis� tanaman� sayur�sayuran� yang�mempunyai� produksi� terbesar� adalah�sayuran�jenis�cabe�yang�mencapai�10.731�ton,�dengan�luas�areal�panen�yang�terluas�yang� tercatat� sebesar� 3.432� ha.�Sedangkan� ditinjau� dari� produktivitasnya�dari� 17� jenis� tanaman� tersebut� yang�tertinggi� adalah� tanaman� worteldengan�108,03� kw/ha.� Untuk� melihat� lebih� rinci�mengenai� � luas� panen,� produktivitas� dan�produksi� tanaman� sayur�sayuran� dapat�dilihat�pada�tabel�6.1.10.�
��������
Secondary� food�crops�comprised�of�maize,� cassava,� sweet�potatoes,�peanuts,�soybeans� peanuts,� and� green� peanut.� In�2013,�production�of�secondary�food�crops�slightly� decreasing,� except� cassava� and�soybeans� peanuts.� The� decreasing� was�due� to� lowering� of� production� area� for�each�commodity,�though�all�those�kinds�of�secondary� food�crops�had� increased� their�productivities.��
From� all� kinds� of� vegetables� in�Sulawesi� Tengah� only� recorded� 17� kinds�which� had� continuous� productions,� that�begun� with� white� onion,� potatoes,�cabbage,�up�to�watercress.� In�2013,� from�all� 17� kinds� of� vegetables,� the� largest�production� was� chili� commodity� which�had�reached�10,731��tons,�with�the�largets�harvested� area� 3,432� hectares.� In�accordance� with� the� productivity,� carrot�had� the� highest� productivity� was� 108.03�quintal/ha� among� all� 17� kinds� of�vegetables.� More� complete� about�harvested� area,� productivity� (yield� per�hectare),�and�production�are�presented�in�Table�6.1.10.�����������
http
://sul
teng
.bps
.go.
id

Agriculture
Sulawesi Tengah in Figures 2014 189
6.2.�Perkebunan�� �Komoditi� tanaman� perkebunan� yang�merupakan� komoditi� perdagangan�mempunyai� peranan� strategis,� karena�disamping� merupakan� sumber�penghasilan� devisa� negara,� juga� yang�lebih� penting� lagi� adalah� mencakup�rangkaian� kegiatan� produksinya,�termasuk� peluang� terbukanya� lapangan�kerja� yang� cukup.� Dari� ruang� lingkup�usahanya,�maka�perkebunan�dibagi�dalam�dua� golongan� yakni:� Perkebunan� Besar�dan�Perkebunan�Rakyat.��6.3.��Kehutanan��
Luas� kawasan� hutan� Sulawesi�Tengah�tahun�2013,�tercatat�4.391.932�ha�yang� terdiri� dari� hutan� lindung� seluas�1.434.565�ha,�hutan�produksi�biasa� tetap�seluas� 498.868� ha,� hutan� produksi�terbatas�seluas��1.537.910��ha,�hutan�yang�dapat� dikonversi� seluas� 274.205� ha,� dan�hutan� Suaka� Alam� dan� Hutan� Wisata�seluas��649.384�ha.�
�Usaha� yang� dilakukan� pemerintah�
melalui� Kementerian� Kehutanan� dalam�mengadakan� penghijauan� dan� reboisasi�dari�tahun�ke�tahun�semakin�ditingkatkan,�sejalan� dengan� makin� bertambahnya�lahan�lahan� kritis� yang� ada.� Hal� ini�ditunjang� dengan� makin� besarnya� ke�sadaran� akan� pentingnya� hutan� dalam�kelangsungan�kehidupan�umat�manusia.�
�
6.2.�Estate�Crops�Commodity� of� estate� crops� is� the�
trading� commodity,� has� strategic�contribution.� Besidesit� as� a� source� of�national� incomes,� even�gave� contribution�in�employment�on�phase�of�the�production�process.�Base� onthescale� establishment,� it� can� be�divided� into� two� main� groups� is� large�estate�and�small�estate.�����6.3.�Forestry��
Forest� area� in� Sulawesi� Tengah�Province� in� 2012�was� 4,391,932� hectares�consisted� of� protection� forest� (1,434,565�hectares),� definitive� production� forest�(498,868� hectares),� limited� production�forest� (1,537,910� � hectares),� conversion�forest� (274,205� hectares),� and� Forest�Preserve� and� National� Park� (649,384�hectares).��
The� government� through� Forestry�Ministery� in� carrying� out� programs� of�reforestation� from�year� to�year�still�more�increased� simultaneously� with� increasing�of� critical� forest� area.� These� efforts� are�supported� by� higher� awareness� of�usefulness�of�forest�for�human�being�life.����
http
://sul
teng
.bps
.go.
id

Pertanian
190 Sulawesi Tengah Dalam Angka 2014
Eksploitasi� hasil� hutan� bagi�pemegang� Hak� Pengusaha� Hutan� (HPH)�pada� tahun� 2012� menunjukkan�peningkatan� dengan� luas� penebangan�mencapai� 412,38� ha� jika� dibandingkan�dengan� luas� penebangan� tahun� 2011�sebesar�373,60�ha�berarti�terjadi�kenaikan�sebesar� 10,38� persen,� sedang� � produksi�(eksploitasi)� tahun� 2012� sebanyak�12.741,04� m3.� Jika� dibandingkan� dengan�produksi� (eks�ploitasi)� tahun� 2011�sebanyak�12.131,68�m3.�
�6.4.�Peternakan�
�Jenis�jenis� ternak�yang�diusahakan�
di� Sulawesi� Tengah� antara� lain:� sapi,�kerbau,�kuda,�kambing,�domba,�dan�babi,�sedangkan� unggas� ialah� ayam� ras,� ayam�kampung�dan�itik.�Jenis�jenis�ternak�diatas�diklasifikasikan�sebagai�berikut:�
�a. Ternak�besar,�meliputi�sapi,�kerbau�
serta�kuda�b. Ternak�kecil,�meliputi�kambing,�
domba�serta�babi,�dan�c. Ternak�unggas,�meliputi�ayam�ras,�
ayam�kampung�dan�itik.���6.5.�Perikanan��
Berbagai� usaha� telah� dilakukan�oleh� Pemerintah� baik� dalam� men�ingkatkan� bahan� makanan� pokok,�konsumsi� protein,� dan� juga� pendapatan�masyarakat� dibidang� perikanan.� Data�statistik� perikanan� yang� disajikan� sangat�
Forest� product� exploitation� for�holders� of� logging� concession� (HPH)� in�2012� relatively� decreased,� with� logging�area� reached� 412.38� hectares,� higher�than�a�previous�year�was�373.60�hectares,�or� underwent� increasing� 10.38� percent.�Whereas,� production� (exploitation)� in�2012� was� 12,741.04� m3.Compared� with�exploitation� of� year� 2011� by� 12,131.68�m3.�
��
�6.4.�Animal�Husbandry��
Livestock� exertion� in� Sulawesi�Tengah� included� cow,� buffalo,� horse,�goat,� sheep,� and� pig.� While� kinds� of�poultry� comprised� improved� chicken,�village� chicken,� and� duck.� Furthermore,�kinds�of�livestock�are�grouped�as�below:�
�a. Large�livestock,�included�cow,�buffalo,�
and�horse�b. Small� livestock,� included�goat,�sheep,�
and�pig�c. Poultries,� included� improved� hen,�
village�hen,�and�duck.��6.5.�Fishery��
The� government� has� been�conducted�varied�efforts�to� improve�basic�foodstuff,� protein� consumption,� and� also�people� income� in� fishery� sector.� Statistics�of� fishery� that� presented� in� this�publication� quite� useful� to� evaluate�
http
://sul
teng
.bps
.go.
id

Agriculture
Sulawesi Tengah in Figures 2014 191
berguna� dalam� penilaian� keadaan� serta�perkembangan� dibidang� perikanan,�sehingga� memudahkan� rencana�pembangunan�secara�lebih�meluas.��
�Tabel� 6.5.1.� s.d.� 6.5.3.� menyajikan�
jumlah� rumah� tangga� perikanan� serta�banyaknya� sarana� dan� prasarana� yang�dimiliki.�Kemudian�Tabel�6.5.4.�dan�Tabel.�6.5.5� menyajikan� produksi� dan� nilai�produksi� � perikanan� menurut� jenis� per�ikanan,� serta� Tabel� 6.5.6.� menyajikan�produksi�serta�nilai�produksi�ikan�laut�dan�ikan�darat�awetan.���
progress� of� fishery� sector,� so� that� the�government� can� easily� plan� development�programs�related�to�fishery.���
Table� 6.5.1�up� to�6.5.3� present� the�number� of� fishery� households� and� the�number� of� their� tools.� Then� Table� 6.5.4�and�Table�6.5.5�present�production�and�its�value�by�fishery�classification.�Last�but�not�least� Table� 6.5.6� present� production� and�production� value� of� marine� fish� and�preserved�freshwater�fish.��
http
://sul
teng
.bps
.go.
id

Pertanian
192 Sulawesi Tengah Dalam Angka 2014
http
://sul
teng
.bps
.go.
id

Agriculture
Sulawesi Tengah in Figures 2014 193
Gambar
Figure 6.1 Hasil per Hekar Padi (Sawah dan Ladang), 2013 Yield Field of Paddies (Wet and Dry land), 2013
0
10
20
30
40
50
60
Bang
gai K
epul
auan
Bang
gai
Mor
owal
i
Poso
Dong
gala
Tolit
oli
Buol
Parig
i Mou
tong
Tojo
Una
-Una
Sigi
Bang
gai L
aut*
)
Mor
owal
i uta
ra*)
Palu
37,27
44,20 41,11
44,56 44,89 43,93
54,98
50,68
34,63
46,99 49,99
Hasil per Hektar/Yield Rate (kw/hektar)
Catatan/Note : *) Tergabung Dengan Kabupaten Induknya/ Include in main regency
http
://sul
teng
.bps
.go.
id

Pertanian
194 Sulawesi Tengah Dalam Angka 2014
http
://sul
teng
.bps
.go.
id

Agriculture
Sulawesi Tengah in Figures 2014 195
0
10
20
30
40
50
60
Bang
gai K
epul
auan
Bang
gai
Mor
owal
i
Poso
Dong
gala
Tolit
oli
Buol
Parig
i Mou
tong
Tojo
Una
-Una
Sigi
Bang
gai L
aut*
)
Mor
owal
i uta
ra*)
Palu
15,98
54,64
21,02
14,11
35,08
13,32 13,96
26,18
20,97
26,54
8,19
000 ekor/tail
Gambar
Figure 6.2 Populasi Ternak Sapi ( 000 ekor) menurut Kabupaten/Kota 2013 Population Cows ( 000 tail) by Regency/City 2013
Catatan/Note : *) Tergabung Dengan Kabupaten Induknya/ Include in main regency
http
://sul
teng
.bps
.go.
id

Pertanian
196 Sulawesi Tengah Dalam Angka 2014
http
://sul
teng
.bps
.go.
id

Agriculture
Sulawesi Tengah in Figures 2014 197
6 PERTANIAN / AGRICULTURE
6.1. Tanaman Pangan / Food Crops
Tabel Table
6.1.1Luas Panen, Hasil per Hektar dan Produksi Padi Sawah, 2009-2013Harvested Area, Yield Rate and Production of Wet Land Paddy, 2009-2013
�(Diolah�dari�SP�Padi�dan�Survei�Ubinan)�(Based�on�SP�Paddy�and�Crop�Cutting�Survey)�
Kabupaten/Kota Regency/City
Luas Panen Harvested Area
(Ha)
Produksi Production
(Ton)
Hasil per Hektar Yield Rate(Kw/Ha)
(1) (2) (3) (4)
01. Banggai�Kepulauan� 1�001� �3�731� 37,27�02. Banggai� 38�110� �170�542� 44,75�03. Morowali� 17�515� �72�696� 41,51�04. Poso� 23�259� �104�410� 44,89�05. Donggala� 24�844� �112�516� 45,29�06. Tolitoli� 21�376� �93�910� 43,93�07. Buol� 4�770� �26�440� 55,43�08. Parigi�Moutong� 49�540� �251�543� 50,78�09. Tojo�Una�Una� 1�639� �7�961� 48,57�10. Sigi� 34�837� �164�668� 47,27�11. Banggai�Laut1)� �…� …� …��12. Morowali�Utara1)� �…� …� …��13. Palu� �537� �2�684� 49,99�
�� �� �Sulawesi Tengah �� �� �
2�0�1�3� 217�428� 1�011�101� ������������46,50��2�0�1�2� �221�909� 1�005�886� 45,33�2�0�1�1� 208�628� 957�107� 45,88�2�0�1�0� �������200�938� �������935�536� ����������46,56��2�0�0�9� 201�877� 929�791� 46,06�
Catatan/Note ���������:��1)�Tergabung�Dengan�Kabupaten�Induknya/�Include�in�main�regency
http
://sul
teng
.bps
.go.
id

Pertanian
198 Sulawesi Tengah Dalam Angka 2014
Tabel Table
6.1.2Luas Panen, Hasil per Hektar dan Produksi Padi Ladang, 2009-2013Harvested Area, Yield Rate and Production of Dry Land Paddy, 2009-2013
�(Diolah�dari�SP�Padi�dan�Survei�Ubinan)�(Based�on�SP�Paddy�and�Crop�Cutting�Survey)�
Kabupaten/Kota�Regency/City�
Luas�Panen��Harvested�Area�
(Ha)�
Produksi�Production�
(Ton)�
Hasil�per�Hektar��Yield�Rate�(Kw/Ha)�
(1)� (2)� (3)� (4)�
� � � �01. Banggai�Kepulauan� �� �� ��������������������������02. Banggai� �1�774� �5�734� 32,32�
03. Morowali� �1�094� �3�807� 34,80�
04. Poso� ��520� �1�557� 29,94�
05. Donggala� ��503� �1�257� 25,00�
06. Tolitoli� �� �� ��������������������������07. Buol� ��204� ��910� 44,59�
08. Parigi�Moutong� ��227� ��673� 29,64�
09. Tojo�Una�Una� �2�043� �4�788� 23,44�
10. Sigi� ��533� �1�538� 28,86�
11. Banggai�laut1)� �…� …� …��
12. Morowali�Utara1)� �…� …� …��
13. Palu� �� �� ��������������������������� �� �� ��
Sulawesi�Tengah� �� �� ��2�0�1�3� �6�898� �20�263� ���������������29,38��
2�0�1�2� 7�171� 18�429� 25,70�
2�0�1�1� 6�518� 18�540� 28,44�
2�0�1�0� 7�690� 21�571� 28,05�
2�0�0�9� 9�355� 23�605� 25,23�
Catatan/Note����������:��1)�Tergabung�Dengan�Kabupaten�Induknya/�Include�in�main�regency�
http
://sul
teng
.bps
.go.
id

Agriculture
Sulawesi Tengah in Figures 2014 199
Tabel�
Table� 6.1.3�Luas�Panen,�Hasil�per�Hektar�dan�Produksi�Padi� (Sawah�dan�Ladang),�2009�2013�Harvested�Area,Yield�Rate�and�Production�of�Paddy�(Wet�and�Dry�Land),�2009�2013�
�(Diolah�dari�SP�Padi�dan�Survei�Ubinan)�(Based�on�SP�Paddy�and�Crop�Cutting�Survey)�
Kabupaten/Kota�Regency/City�
Luas�Panen��Harvested�Area�
(Ha)�
Produksi�Production�
(Ton)�
Hasil�per�Hektar��Yield�Rate�(Kw/Ha)�
(1)� (2)� (3)� (4)�� � � �01. Banggai�Kepulauan� �1�001� �3�731� 37,27�02. Banggai� �39�884� �176�275� 44,20�03. Morowali� �18�609� �76�503� 41,11�04. Poso� �23�779� �105�967� 44,56�05. Donggala� �25�347� �113�773� 44,89�06. Tolitoli� �21�376� �93�910� 43,93�07. Buol� �4�974� �27�349� 54,98�08. Parigi�Moutong� �49�767� �252�216� 50,68�09. Tojo�Una�Una� �3�682� �12�749� 34,63�10. Sigi� �35�370� �166�206� 46,99�11. Banggai�laut1)� �…� …� …��12. Morowali�Utara1)� �…� …� …��13. Palu� ��537� �2�684� 49,99�
� �� �� �Sulawesi�Tengah� �� �� �
2�0�1�3� �224�326� 1�031�364� ������������45,98��2�0�1�2� 229�080� 1�024�315� 44,71�2�0�1�1� 221�846� 1�041�789� 46,96�2�0�1�0� �����208�628� �����957�107� ���������45,88��2�0�0�9� 211�232� 953�396� 45,14�
� Catatan/Note ���������:��1)�Tergabung�Dengan�Kabupaten�Induknya/�Include�in�main�regency�
http
://sul
teng
.bps
.go.
id

Pertanian
200 Sulawesi Tengah Dalam Angka 2014
Tabel�
Table� 6.1.4�Luas�Panen,�Hasil�per�Hektar�dan�Produksi�Jagung,�2009�2013�Harvested�Area,�Yield�Rate�and�Production�of�Maize,�2009�2013�
�(Diolah�dari�SP�Padi�dan�Survei�Ubinan)�(Based�on�SP�Paddy�and�Crop�Cutting�Survey)�
Kabupaten/Kota�Regency/City�
Luas�Panen��Harvested�Area�
(Ha)�
Produksi�Production�
(Ton)�
Hasil�per�Hektar��Yield�Rate�(Kw/Ha)�
(1)� (2)� (3)� (4)�
� � � �01. Banggai�Kepulauan� ��377� �1�404� 37,25�02. Banggai� �2�885� �12�135� 42,06�03. Morowali� ��981� �4�624� 47,14�04. Poso� �2�279� �8�706� 38,20�05. Donggala� �3�158� �14�578� 46,16�06. Tolitoli� ��347� �1�143� 32,93�07. Buol� ��525� �2�093� 39,86�08. Parigi�Moutong� �5�476� �20�823� 38,03�09. Tojo�Una�Una� �11�341� �44�139� 38,92�10. Sigi� �6�401� �27�918� 43,62�11. Banggai�laut1)� �…� …� …��12. Morowali�Utara1)� �…� …� …��13. Palu� ��404� �1�703� 42,15�
� �� � �Sulawesi�Tengah� �� � �
2�0�1�3� �34�174� �139�265� �������������40,75��2�0�1�2� 37�418� 141�649� 37,86�2�0�1�1� 41�218� 161�810� 39,26�2�0�1�0� ��������42�747�� �������162�306� 35,32�2�0�0�9� 46�245� 164�282� 35,83�
�Catatan/Note����������:��1)�Tergabung�Dengan�Kabupaten�Induknya/�Include�in�main�regency�
http
://sul
teng
.bps
.go.
id

Agriculture
Sulawesi Tengah in Figures 2014 201
Tabel�
Table� 6.1.5�Luas�Panen,�Hasil�per�Hektar�dan�Produksi�Ubi�Kayu,�2009�2013�Harvested�Area,�Yield�Rate�and�Production�of�Cassava,�2009�2013�
�(Diolah�dari�SP�Padi�dan�Survei�Ubinan)�(Based�on�SP�Paddy�and�Crop�Cutting�Survey)�
Kabupaten/Kota�Regency/City�
Luas�Panen��Harvested�Area�
(Ha)�
Produksi�Production�
(Ton)�
Hasil�per�Hektar��Yield�Rate�(Kw/Ha)�
(1)� (2)� (3)� (4)�
� � � �01. Banggai�Kepulauan� ��211� �4�516� 214,03�
02. Banggai� ��155� �4�031� 260,04�03. Morowali� ��558� �10�043� 179,99�
04. Poso� �2�360� �49�377� 209,22�
05. Donggala� ��361� �7�404� 205,09�06. Tolitoli� ��167� �3�185� 190,71�
07. Buol� ��47� ��953� 202,82�
08. Parigi�Moutong� ��337� �7�264� 215,54�09. Tojo�Una�Una� ��120� �2�181� 181,76�
10. Sigi� ��435� �9�943� 228,58�
11. Banggai�laut1)� �…� …� …��12. Morowali�Utara1)� �…� …� …��
13. Palu� ��93� �2�053� 220,75�
� �� � �
Sulawesi�Tengah� �� � �2�0�1�3� �4�844� �100�950� ��������������208,40��
2�0�1�2� 4�702� 93�642� 199,16�
2�0�1�1� �����������4�198�� 83�139� 198,04�2�0�1�0� 3�872� 74�129� 191,45�
2�0�0�9� 4�422� 82�294� 186,10�
Catatan/Note ���������:��1)�Tergabung�Dengan�Kabupaten�Induknya/�Include�in�main�regency�
http
://sul
teng
.bps
.go.
id

Pertanian
202 Sulawesi Tengah Dalam Angka 2014
Tabel�
Table� 6.1.6�Luas��Panen,�Hasil�per�Hektar�dan�Produksi�Ubi�Jalar,2009���2013�Harvested�Area,�Yield�Rate�and�Production�of�Sweet�Potatoes,�2009�2013�
��
(Diolah�dari�SP�Padi�dan�Survei�Ubinan)�(Based�on�SP�Paddy�and�Crop�Cutting�Survey)�
Kabupaten/Kota�Regency/City�
Luas�Panen��Harvested�Area�
(Ha)�
Produksi�Production�
(Ton)�
Hasil�per�Hektar��Yield�Rate�(Kw/Ha)�
(1)� (2)� (3)� (4)�
� � � �01. Banggai�Kepulauan� ��154� �1�338� 86,89�02. Banggai� ��171� �1�924� 112,52�03. Morowali� ��184� �1�868� 101,53�04. Poso� ��197� �2�048� 103,95�05. Donggala� ��141� �1�414� 100,28�06. Tolitoli� ��173� �1�809� 104,58�07. Buol� ��31� ��303� 97,78�08. Parigi�Moutong� ��417� �5�308� 127,30�09. Tojo�Una�Una� ��106� �1�087� 102,54�10. Sigi� ��370� �3�871� 104,61�11. Banggai�laut1)� �…� …� …��12. Morowali�Utara1)� �…� …� …��13. Palu� ��57� ��579� 101,52�
� �� � �Sulawesi�Tengah� �� � �
2�0�1�3� �2�001� �21�549� �����������107,69��2�0�1�2� 2�516� 26�932� 107,04�2�0�1�1� �����������2�306�� 25�110� 108,89�2�0�1�0� �����2�462� ����26�333� �������106,96��2�0�0�9� 2�815� 29�821� 105,94�
Catatan/Note����������:��1)�Tergabung�Dengan�Kabupaten�Induknya/�Include�in�main�regency
http
://sul
teng
.bps
.go.
id

Agriculture
Sulawesi Tengah in Figures 2014 203
Tabel�
Table� 6.1.7�Luas�Panen,�Hasil�per�Hektar�dan�Produksi�Kacang�Tanah,�2009�2013�Harvested�Area,�Yield�Rate�and�Production�of�Peanuts,�2009�2013�
��
(Diolah�dari�SP�Padi�dan�Survei�Ubinan)�(Based�on�SP�Paddy�and�Crop�Cutting�Survey)�
Kabupaten/Kota�Regency/City�
Luas�Panen��Harvested�Area�
(Ha)�
Produksi�Production�
(Ton)�
Hasil�per�Hektar��Yield�Rate�(Kw/Ha)�
(1)� (2)� (3)� (4)�
� � � �01. Banggai�Kepulauan� ��764� �1�516� 19,84�02. Banggai� ��292� ��524� 17,94�03. Morowali� ��200� ��379� 18,96�04. Poso� ��296� ��456� 15,40�05. Donggala� ��459� ��884� 19,26�06. Tolitoli� ��200� ��297� 14,86�07. Buol� ��60� ��116� 19,35�08. Parigi�Moutong� ��311� ��737� 23,70�09. Tojo�Una�Una� ��281� ��399� 14,20�10. Sigi� ��877� �1�528� 17,42�11. Banggai�laut1)� �…� …� …��12. Morowali�Utara1)� �…� …� …��13. Palu� ��231� ��467� 20,23�
� �� � �Sulawesi�Tengah� �� � �
2�0�1�3� �3�971� �7�303� ��������������18,39��2�0�1�2� 6�136� 9�473� 15,44�2�0�1�1� 6�362� 10�513� 16,52�2�0�1�0� �����5�071� �����8�424� ���������16,61��2�0�0�9� 6�207� 10�225� 16,47�
Catatan/Note ���������:��1)�Tergabung�Dengan�Kabupaten�Induknya/�Include�in�main�regency�
http
://sul
teng
.bps
.go.
id

Pertanian
204 Sulawesi Tengah Dalam Angka 2014
Tabel�
Table� 6.1.8�Luas�Panen,�Hasil�per�Hektar�dan�Produksi�Kacang�Kedelai,�2009�2013�Harvested� Area,� Yield� Rate� and� Production� of� Soybean� Peanuts,� 2009�2013�
�(Diolah�dari�SP�Padi�dan�Survei�Ubinan)�(Based�on�SP�Paddy�and�Crop�Cutting�Survey)�
Kabupaten/Kota�Regency/City�
Luas�Panen��Harvested�Area�
(Ha)�
Produksi�Production�
(Ton)�
Hasil�per�Hektar��Yield�Rate�(Kw/Ha)�
(1)� (2)� (3)� (4)�
� � � �01. Banggai�Kepulauan� ��2� ��2� 9,97�
02. Banggai� �1�751� �2�865� 16,36�
03. Morowali� ��142� ��147� 10,37�
04. Poso� ��182� ��214� 11,76�
05. Donggala� ��511� ��633� 12,38�
06. Tolitoli� ��14� ��16� 11,36�
07. Buol� ��34� ��45� 13,24�
08. Parigi�Moutong� ��951� �1�523� 16,01�
09. Tojo�Una�Una� �4�051� �7�205� 17,79�
10. Sigi� ��4� ��5� 11,43�
11. Banggai�laut1)� �…� …� …��
12. Morowali�Utara1)� �…� …� …��
13. Palu� �� �� ���������������������������
� �� �� ��
Sulawesi�Tengah� �� �� ��
2�0�1�3� �7�642� �12�654� ���������������16,56��
2�0�1�2� 5�621� 8�203� 14,59�
2�0�1�1� 4�632� 6�900� 14,90�
2�0�1�0� �����2�786� �����3�555� ���������12,76��
2�0�0�9� 3�618� 4�722� 13,05�
Catatan/Note����������:��1)�Tergabung�Dengan�Kabupaten�Induknya/�Include�in�main�regency
http
://sul
teng
.bps
.go.
id

Agriculture
Sulawesi Tengah in Figures 2014 205
Tabel�
Table� 6.1.9�Luas�Panen,�Hasil�per�Hektar�dan�Produksi�Kacang�Hijau,�2009�2013�Harvested�Area,�Yield�Rate�and�Production�of�Green�Peanuts,�2009�2013�
�(Diolah�dari�SP�Padi�dan�Survei�Ubinan)�(Based�on�SP�Paddy�and�Crop�Cutting�Survey)�
Kabupaten/Kota�Regency/City�
Luas�Panen��Harvested�Area�
(Ha)�
Produksi�Production�
(Ton)�
Hasil�per�Hektar��Yield�Rate�(Kw/Ha)�
(1)� (2)� (3)� (4)�
� � � �01. Banggai�Kepulauan� ��1� ��1� 7,13�02. Banggai� ��157� ��132� 8,42�03. Morowali� ��93� ��76� 8,21�04. Poso� ��66� ��57� 8,57�05. Donggala� ��136� ��113� 8,28�06. Tolitoli� ��84� ��68� 8,05�07. Buol� ��15� ��12� 8,02�08. Parigi�Moutong� ��112� ��102� 9,07�09. Tojo�Una�Una� ��117� ��93� 7,94�10. Sigi� ��228� ��186� 8,16�11. Banggai�Laut1)� �…� …� …��12. Morowali�Utara1)� �…� …� …��13. Palu� �� �� ���������������������������
� �� �� ��Sulawesi�Tengah� �� �� ��
2�0�1�3� �1�009� ��839� �����������������8,31��2�0�1�2� 1�639� 1�373� 8,38�2�0�1�1� �����������1�577�� 1�312� 8,31�2�0�1�0� �����1�254� �����1�031� �����������8,22��2�0�0�9� 1�250� 1�014� 8,11�
�Catatan/Note ���������:��1)�Tergabung�Dengan�Kabupaten�Induknya/�Include�in�main�regency�
http
://sul
teng
.bps
.go.
id

Pertanian
206 Sulawesi Tengah Dalam Angka 2014
Tabel�
Table� 6.1.10�Luas� Panen,� Produksi,� dan� Hasil� per� Hektar� Sayur�sayuran� menurut�Kabupaten/Kota�dan�Jenisnya,�2009�2013�Harvested�Area,�Production,�and�Yield�Rate�of�Vegetables�by�Regency/City�and�the�Kind,�2009�2013�
�(Diolah�dari�hasil�SPH�SBS�/Based�on�SPH�SBS)�
Kabupaten/Kota�Regency/City�
Bawang�Daun/Onion�Spring� Kentang/Potatoes�
Luas�Panen�
Harvested�Area�(Ha)�
Produksi�Produc��Tion�(Ton)�
Hasil�per�Hektar�
Yield�Rate(Kw/Ha)�
Luas�Panen�
HarvestedArea�(Ha)�
Produksi�Produc��Tion�(Ton)�
Hasil�per�Hektar�
Yield�Rate�(Kw/Ha)�
(1)� (2)� (3)� (4)� (5)� (6)� (7)�� � � � � � �01.Banggai�Kepulauan� �� �� �� �� �� ��02.Banggai� 11� 7� 6,27� �� �� ��03.Morowali� 41� 59� 14,32� �� �� ��04.Poso� 82� 517� 63,02� 18� 96� 53,11�05.Donggala� 12� 96� 79,83� 12� 140� 116,67�06.Tolitoli� 2� 1� 3,00� �� �� ��07.Buol� 1� 4� 42,00� �� �� ��08.Parigi�Moutong� 14� 4� 3,00� �� �� ��09.Tojo�Una�Una� 38� 72� 19,00� �� �� ��10.�Sigi� 6� 11� 18,33� �� �� ��11.�Banggai�Laut1)� …� …� …� …� …� …�12.�Morowali�Utara1)� …� …� …� …� …� …�13.�Palu� 14� 66� 47,36� �� �� ��� �� � � �� � �Sulawesi�Tengah� �� � � �� �� �
2�0�1�3� 221� 837� 37,86� 30� 236� 78,53�2�0�1�2� 278� 952� 34,24� 18� 192�� 150,81�2�0�1�1� 307� 1�230� 40,06� 78� 1�144� 146,67�2�0�1�0� 229� 1�004� 43,86� 75� 1�094� 150,81�2�0�0�9� 169� 606� 35,89� 66� 582� 88,13�
� Catatan/Note����������:��1)�Tergabung�Dengan�Kabupaten�Induknya/�Include�in�main�regency�
http
://sul
teng
.bps
.go.
id

Agriculture
Sulawesi Tengah in Figures 2014 207
Lanjutan�Tabel/Continued�Table�6.1.10�����
Kabupaten/Kota�Regency/City�
Kubis/�Cabbage� Petsai/Sawi/Mustard�Green�
Luas�Panen�
HarvestedArea�(Ha)
Produksi�Produc��tion�
(Ton)�
Hasil�per�Hektar�
Yield�Rate�(Kw/Ha)�
Luas�Panen�
HarvestedArea�(Ha)�
Produksi�Produc��tion�
(Ton)�
Hasil�per�Hektar�
Yield�Rate�(Kw/Ha)�
(1)� (8)� (9)� (10)� (11)� (12)� (13)�
� � � � � � �01.Banggai�Kepulauan� �� �� �� 8� 61� 76,75�02.Banggai� 14� 35� 24,71� 73� 80� 10,96�03.Morowali� 3� 3� 10,00� 96� 263� 27,39�04.Poso� 90� 368� 40,91� 177� 463� 26,16�05.Donggala� 12� 306� 254,83� 21� 137� 65,00�06.Tolitoli� �� �� �� 78� 161� 20,68�07.Buol� �� �� �� 1� 1� 7,00�08.Parigi�Moutong� 3� 1� 3,00� 74� 8� 1,03�09.Tojo�Una�Una� �� �� �� 28� 100� 35,54�10.�Sigi� 36� 159� 44,14� 76� 262� 34,49�11.�Banggai�Laut1)� …� …� …� …� …� …�12.�Morowali�Utara1)� …� …� …� …� …� …�13.�Palu� �� �� �� 114� 555� 48,66�� �� � � �� � �Sulawesi�Tengah� �� �� � �� �� �
2�0�1�3� 158� 871� 55,15� 738� 2�028� 27,49�2�0�1�2� 169�� 1�139� 219,69� 744�� 2�928�� 52,10�2�0�1�1� 238� 3�977� 167,09� 894� 5�492� 61,43�2�0�1�0� 173� 3�752� 219,69� 804� 4�033� 52,10�2�0�0�9� 154� 2�019� 131,10� 644� 1�394� 21,65�
� Catatan/Note����������:��1)�Tergabung�Dengan�Kabupaten�Induknya/�Include�in�main�regency�
http
://sul
teng
.bps
.go.
id

Pertanian
208 Sulawesi Tengah Dalam Angka 2014
Lanjutan�Tabel�/�Continued�Table�6.1.10�����
Kabupaten/Kota�Regency/City�
Tomat/�Tomato� Buncis/Green�Bean�
Luas�Panen�
Harvested�Area�(Ha)�
Produksi�Produc��tion�
(Ton)�
Hasil�per�Hektar�
Yield�Rate(Kw/Ha)�
Luas�Panen�
HarvestedArea�(Ha)�
ProduksiProduc��tion�
(Ton)�
Hasil�per�Hektar�
Yield�Rate�(Kw/Ha)�
(1)� (14)� (15)� (16)� (17)� (18)� (19)�
� � � � � � �01.Banggai�Kepulauan� 130� 866� 66,64� �� �� ��02.Banggai� 174� 306� 17,60� 21� 58� 27,71�03.Morowali� 140� 757� 54,04� 22� 205� 92,95�04.Poso� 230� 1706� 74,17� 71� 361� 50,83�05.Donggala� 359� 960� 26,74� 111� 20� 1,82�06.Tolitoli� 79� 1042� 131,91� 5� 1� 1,80�07.Buol� 60� 836� 139,37� 12� 118� 98,67�08.Parigi�Moutong� 296� 45� 1,53� 3� 1� 1,67�09.Tojo�Una�Una� 158� 626� 39,64� 10� 8� 7,50�10.�Sigi� 228� 1319� 57,83� 33� 105� 31,73�11.�Banggai�Laut1)� …� …� …� …� …� …�12.�Morowali�Utara1)� …� …� …� …� …� …�13.�Palu� 145� 1616� 111,46� �� �� ��� �� � � �� � �Sulawesi�Tengah� �� �� � �� �� �
2�0�1�3� 1�869� 9�214� 49,30� 288� 876� 30,41�2�0�1�2� 1�826� 12�162� 66,61� 207� 932� 45,01�2�0�1�1� 5�745� 65�120� 113,35� 310� 1�929� 62,22�2�0�1�0� 1�830� 10�976� 59,97� 313� 1�684� 53,83�2�0�0�9� 1�524� 5�645� 37,04� 230� 976� 42,45�
Catatan/Note����������:��1)�Tergabung�Dengan�Kabupaten�Induknya/�Include�in�main�regency
http
://sul
teng
.bps
.go.
id

Agriculture
Sulawesi Tengah in Figures 2014 209
Lanjutan�Tabel�/�Continued�Table�6.1.10�����
Kabupaten/Kota�Regency/City�
Bawang�Putih/White�Onion� Wortel/�Carrot�
Luas�Panen�
HarvestedArea�(Ha)�
ProduksiProduc�tion�
(Ton)�
Hasil�per�Hektar�
Yield�Rate�(Kw/Ha)�
Luas�Panen�
HarvestedArea�(Ha)�
Produksi�Produc��tion�
(Ton)�
Hasil�per�Hektar�
Yield�Rate�(Kw/Ha)�
(1)� (20)� (21)� (22)� (23)� (24)� (25)�
� � � � � � �01.Banggai�Kepulauan� � � �� �� �� ��02.Banggai� � � �� 5� 3� 5,60�03.Morowali� � � �� 2� 2� 10,00�04.Poso� � � �� 8� 120� 149,63�05.Donggala� � � �� 12� 243� 202,83�06.Tolitoli� � � �� �� �� ��07.Buol� � � �� �� �� ��08.Parigi�Moutong� � � �� 4� 0� 1,00�09.Tojo�Una�Una� � � �� �� �� ��10.�Sigi� � � �� 4� 10� 24,50�11.�Banggai�Laut1)� …� …� …� …� …� …�12.�Morowali�Utara1)� …� …� ...� …� …� …�13.�Palu� � � �� �� �� ��� � � � �� � �Sulawesi�Tengah� � � � �� �� �
2�0�1�3� �� �� �� 35� 378� 108,03�2�0�1�2� �� �� �� 58� 525� 175,18�2�0�1�1� �� �� �� 94� 1�708� 181,71�2�0�1�0� �� �� �� 90� 1�544� 175,18�2�0�0�9� �� �� �� 82� 664� 81,00�
Catatan/Note����������:��1)�Tergabung�Dengan�Kabupaten�Induknya/�Include�in�main�regency�
http
://sul
teng
.bps
.go.
id

Pertanian
210 Sulawesi Tengah Dalam Angka 2014
Lanjutan�Tabel�/�Continued�Table�6.1.10�����
Kabupaten/Kota�Regency/City�
�
Bawang�Merah/Shallot� Ketimun/Cucumber�
Luas�Panen�
Harvested�Area�(Ha)�
Produksi�Produc��tion�
(Ton)�
Hasil�per�Hektar�
Yield�Rate�(Kw/Ha)�
Luas�Panen�
Harvested�Area�(Ha)�
Produksi�Produc��tion�
(Ton)�
Hasil�per�Hektar�
Yield�Rate�(Kw/Ha)�
(1)� (26)� (27)� (28)� (29)� (30)� (31)�
� � � � � � �01.Banggai�Kepulauan� �� �� �� �65� �389� 59,91�02.Banggai� �48� �37� 7,73� �92� �255� 27,68�03.Morowali� �2� �6� 28,50� �62� �203� 32,74�04.Poso� �70� �256� 36,59� �74� �254� 34,26�05.Donggala� �57� �227� 39,82� �284� �563� 19,82�06.Tolitoli� �� �� �� �36� �269� 74,75�07.Buol� �7� �24� 34,71� �24� �296� 123,33�08.Parigi�Moutong� �251� �50� 2,01� �92� �15� 1,66�09.Tojo�Una�Una� �51� �169� 33,04� �66� �303� 45,88�10.�Sigi� �547� 2�097� 38,33� �68� �455� 66,84�11.�Banggai�Laut1)� …� …� …� …� …� …�12.�Morowali�Utara1)� …� …� …� …� …� …�13.�Palu� �274� 1�534� 56,00� �63� �544� 86,40�� �� �� � �� �� �Sulawesi�Tengah� �� �� � �� �� �
2�0�1�3� 1�307� 4�400� 33,67� �926� 3�546� 38,29�2�0�1�2� 1�765� 7�272� 41,20� 650� 3�680� 56,62�2�0�1�1� 1�297� 11�511� 88,75� 4�390� 46�161� 105,15�2�0�1�0� 1�280� 10�301� 80,48� 931� 5�620� 60,36�2�0�0�9� 1�051� 6�490� 61,75� 834� 3�744� 40,46�
� Catatan/Note����������:��1)�Tergabung�Dengan�Kabupaten�Induknya/�Include�in�main�regency
http
://sul
teng
.bps
.go.
id

Agriculture
Sulawesi Tengah in Figures 2014 211
Lanjutan�Tabel�/�Continued�Table�6.1.10����
Kabupaten/Kota�Regency/�City�
Kacang�Kacangan�/�Nuts� Cabe/�Chili�
Luas�Panen�
HarvestedArea�(Ha)
ProduksiProduc��tion�
(Ton)�
Hasil�per�Hektar�
Yield�Rate(Kw/Ha)�
Luas�Panen�
Harvested�Area�(Ha)�
Produksi�Produc��tion�
(Ton)�
Hasil�per�Hektar�
Yield�Rate�(Kw/Ha)�
(1)� (32)� (33)� (34)� (35)� (36)� (37)�
� � � � � �01.Banggai�Kepulauan� �128� �807� 63,03� �112� �878� 78,39�02.Banggai� �173� �272� 15,72� �311� �452� 14,52�03.Morowali� �215� 1�006� 46,79� �217� �915� 42,18�04.Poso� �278� �456� 16,40� �186� �720� 38,70�05.Donggala� 1�021� 2�871� 28,12� �699� 1�519� 21,73�06.Tolitoli� �118� �711� 60,27� �198� 1�370� 69,18�07.Buol� �74� �398� 53,72� �114� 1�053� 92,33�08.Parigi�Moutong� �250� �69� 2,78� �764� �303� 3,96�09.Tojo�Una�Una� �135� �379� 28,07� �329� 1�119� 34,02�10.�Sigi� �477� 1�461� 30,63� �303� 1�239� 40,89�11.�Banggai�Laut1)� …� …� …� …� …� …�12.�Morowali�Utara1)� …� …� …� …� …� …�13.�Palu� �73� �256� 35,12� �199� 1�165� 58,52�� �� �� � �� �� �Sulawesi�Tengah� �� �� � �� �� �
2�0�1�3� 2�942� 8�686� 29,52� 3�432� 10�731� 31,27�2�0�1�2� 1�913� 7�411� 38,74� 2�685� 13�168� 94,37�2�0�1�1� 7�525� 50�079� 66,55� 20�001� 160�387� 80,19�2�0�1�0� 2�225� 8�534� 38,35� 2�993� 13�908� 46,46�2�0�0�9� 1�877� 5�374� 28,63� 2�565� 7�476� 29,15�
�Catatan/Note����������:��1)�Tergabung�Dengan�Kabupaten�Induknya/�Include�in�main�regency�
http
://sul
teng
.bps
.go.
id

Pertanian
212 Sulawesi Tengah Dalam Angka 2014
Lanjutan�Tabel�/�Continued�Table�6.1.10����
Kabupaten/Kota�Regency/�City�
Terung/Eggplant� Bayam/�Spinach�
Luas�Panen�
Harvested�Area�(Ha)�
Produksi�Produc��tion�
(Ton)�
Hasil�per�Hektar�
Yield�Rate�(Kw/Ha)�
Luas�Panen�
Harvested�Area�(Ha)�
Produksi�Produc��tion�
(Ton)�
Hasil�per�Hektar�
Yield�Rate�(Kw/Ha)�
(1)� (38)� (39)� (40)� (41)� (42)� (43)�
� � � � � � �01.Banggai�Kepulauan� �108� �731� 67,69� �100� �434� 43,36�02.�Banggai� �151� �346� 22,89� �108� �99� 9,20�03.�Morowali� �134� �702� 52,35� �115� �132� 11,48�04.�Poso� �118� �399� 33,81� �114� �153� 13,44�05.�Donggala� �298� 1�031� 34,58� �52� �142� 27,31�06.�Tolitoli� �74� �460� 62,19� �68� �183� 26,87�07.�Buol� �56� �363� 64,82� �50� �218� 43,50�08.�Parigi�Moutong� �207� �34� 1,65� �135� �17� 1,29�09.�Tojo�Una�Una� �96� �210� 21,85� �76� �199� 26,13�10.�Sigi� �103� �422� 40,96� �50� �130� 26,08�11.�Banggai�Laut1)� …� …� …� …� …� …�12.�Morowali�Utara1)� …� …� …� …� …� …�13.�Palu� �50� �463� 92,58� �177� �535� 30,23�� �� �� � �� �� �Sulawesi�Tengah� �� �� � �� �� �
2�0�1�3� 1�395� 5�160� 36,99� 1�045� 2�242� 21,45�2�0�1�2� 1�036� 5�797� 55,95� 908� 2�061� 22,70�2�0�1�1� 5�179� 37�364� 72,14� 1�221� 3�804� 31,16�2�0�1�0� 1�425� 8�365� 58,62� 1�264� 2�741� 21,69�2�0�0�9� 1�181� 4�623� 39,16� 1�016� 1�545� 15,20�
Catatan/Note����������:��1)�Tergabung�Dengan�Kabupaten�Induknya/�Include�in�main�regency�
http
://sul
teng
.bps
.go.
id

Agriculture
Sulawesi Tengah in Figures 2014 213
Lanjutan�Tabel�/Continued�Table�6.1.10����
Kabupaten/Kota�Regency/City� Labu�Siam/Squash� Kangkung/Water�Cress�
Regency/�City��
Luas�Panen�
HarvestedArea�(Ha)�
Produksi�Produc��tion�
(Ton)�
Hasil�per�Hektar�
Yield�Rate�(Kw/Ha)�
Luas�Panen�
Harvested�Area�(Ha)�
Produksi�Produc��tion�
(Ton)�
Hasil�per�Hektar�
Yield�Rate(Kw/Ha)�
(1)� (44)� (45)� (46)� (47)� (48)� (49)�
� � � � � � �01.�Banggai�Kepulauan� �27� �168� 62,33� �67� �407� 60,78�02.�Banggai� �33� �67� 20,42� �92� �234� 25,39�03.�Morowali� �1� �61� 605,00� �117� �287� 24,50�04.�Poso� �52� �889� 170,90� �145� �672� 46,37�05.�Donggala� �31� �472� 152,16� �58� �388� 66,90�06.�Tolitoli� �11� �34� 31,18� �110� �669� 60,82�07.�Buol� �3� �24� 78,33� �48� �731� 152,23�08.�Parigi�Moutong� �22� �4� 2,00� �160� �38� 2,36�09.�Tojo�Una�Una� �20� �175� 87,55� �72� �459� 63,75�10.�Sigi� �284� 1�401� 49,32� �74� �271� 36,58�11.�Banggai�Laut1)� …� …� …� …� …� …�12.�Morowali�Utara1)� …� …� …� …� …� …�13.�Palu� �� �� …� �211� �868� 41,11�� � � � � � �Sulawesi�Tengah� � � � � � �
2�0�1�3� �484� 3�295� 68,07� 1�154� 5�022� 43,52�2�0�1�2� 317� 3�182� 110,95� 1�047� 6�935� 66,24�2�0�1�1� 304� 5�053� 166,20� 1�370� 8�813� 64,33�2�0�1�0� 387� 5�172� 110,95� 1�359� 5�956� 43,83�2�0�0�9� 304� 2�697� 88,73� 1�020� 3�008� 29,49�
�Catatan/Note����������:��1)�Tergabung�Dengan�Kabupaten�Induknya/�Include�in�main�regency
http
://sul
teng
.bps
.go.
id
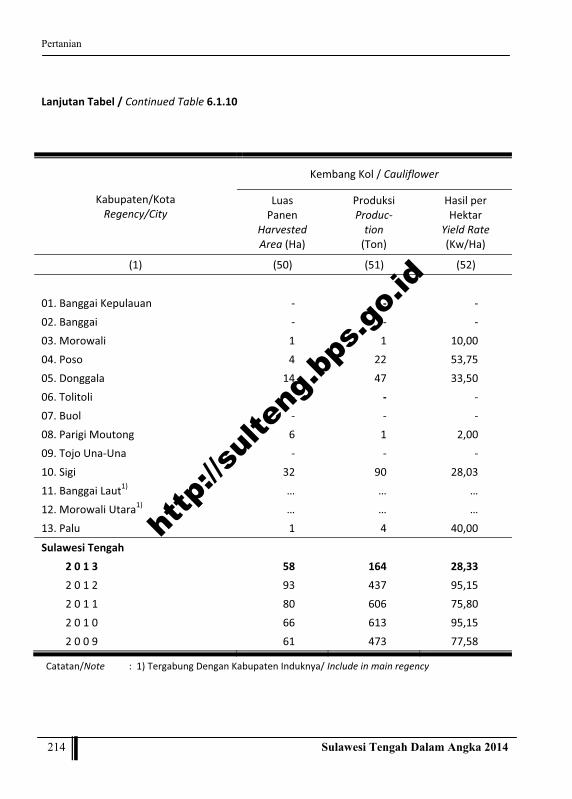
Pertanian
214 Sulawesi Tengah Dalam Angka 2014
Lanjutan�Tabel�/�Continued�Table�6.1.10����
Kabupaten/Kota�Regency/City�
Kembang�Kol�/�Cauliflower�
Luas�Panen�
Harvested�Area�(Ha)�
Produksi�Produc��tion�
(Ton)�
Hasil�per�Hektar�
Yield�Rate�(Kw/Ha)�
(1)� (50)� (51)� (52)�
� � � �01.�Banggai�Kepulauan� �� �� ��02.�Banggai� �� �� ��03.�Morowali� �1� �1� 10,00�04.�Poso� �4� �22� 53,75�05.�Donggala� �14� �47� 33,50�06.�Tolitoli� �� �� ��07.�Buol� �� �� ��08.�Parigi�Moutong� �6� �1� 2,00�09.�Tojo�Una�Una� �� �� ��10.�Sigi� �32� �90� 28,03�11.�Banggai�Laut1)� …� …� …�12.�Morowali�Utara1)� …� …� …�13.�Palu� �1� �4� 40,00�
Sulawesi�Tengah� �� �� �2�0�1�3� �58� �164� 28,33�2�0�1�2� 93� 437� 95,15�2�0�1�1� 80� �����������606�� ��������75,80��2�0�1�0� 66� 613� 95,15�2�0�0�9� 61� 473� 77,58�
Catatan/Note����������:��1)�Tergabung�Dengan�Kabupaten�Induknya/�Include�in�main�regency
http
://sul
teng
.bps
.go.
id

Agriculture
Sulawesi Tengah in Figures 2014 215
Tabel�
Table� 6.1.11�Tanaman� Menghasilkan,� Hasil� per� Hektar� dan� Produksi� Buah�buahan�menurut�Jenis�Tanaman,�2013�Harvested�Area,�Yield�Rate�and�Production�of�Fruits,2013�
�(Diolah�dari�hasil��SPIII�A�Survei�Pertanian�/Based�on�Agriculture�Survey)�
Jenis�Tanaman��Plant�
Tanaman�Menghasilkan�Plant�Yield�
(Pohon)�
Produksi�Production�
(Kw)�
Hasil�per�Pohon�
Yield�Rate�(Kw/Pohon)�
(1)� (2)� (3)� (4)�� � � � �
1. Alpukat/Avocado������������������������ 29�501� 44�566� 1,51�2. Belimbing/Carambola���������������������� 3�808� 4�802� 1,26�3. Duku/langsat/kokosan/Duku���������� 63�558� 81�601� 1,28�4. Durian/Durian������������������������� 77�003� 152�391� 1,98�5. Jambu�biji/Guava��������������������� 19�831� 12�062� 0,61�6. Jambu�air/Rose�apple��������������������� 20�183� 19�530� 0,97�7. Jeruk�siam/keprok/Siam�orange�������������� 303�079� 111�651� 0,37�8. Jeruk�besar/Grapefruit�������������������� 6�040� 9�998� 1,66�9. Mangga/Mango������������������������� 113�290� 174�726� 1,54�10. Manggis/Mangosteen������������������������ 10�240� 10�135� 0,99�11. Nangka/cempedak/Jackfruit/cempedak �� 58�052� 102�142� 1,76�12. Nenas/Pineapple�������������������������� 179�034� 11�023� 0,06�13. Pepaya/Papaya������������������������� 58�396� 48�706� 0,83�14. Pisang/Banana������������������������� 578�245� 517�105� 0,89�15. Rambutan/Rambutan���������������������� 91�405� 160�811� 1,76�16. Salak/Bark�������������������������� 63�322� 11�197� 0,18�17. Sawo/Sapodilla��������������������������� 1�272� 3�120� 2,45�18. Markisa/konyal/Passion�Fruit����������������� �20� �7� 0,35�19. Sirsak/Soursop������������������������� 5�778� 3�510� 0,61�20. Sukun/Toothless�gum�������������������������� 5�708� 8�706� 1,53�21. Apel/Apple�������������������������� �� �� ��22. Anggur/Wine������������������������� �613� �525� 0,86�23. Melinjo/Melinjo������������������������ �889� �669� 0,75�24. Petai/Petai������������������������� 1�508� 1�238� 0,82�25. Jengkol/Jengkol������������������������ �415� �361� 0,87�� � � � �
http
://sul
teng
.bps
.go.
id

Pertanian
216 Sulawesi Tengah Dalam Angka 2014
Tabel�
Table� 6.1.12�Luas� Sawah� (Ha)� menurut� Kabupaten/Kota� dan� Jenis� Pengairan�Kewenangan�dan�Tanggung�Jawab�Kabupaten,�2009�2013�Area�of�Wet�Land� (Ha)�by�Regency/City�and�Type�of� Irrigation�Authority�and�Responsibility�Regency,�2009�2013�
�
Kabupaten/Kota�Regency/City�
Teknis�Technical�
Semi�Teknis�
Semi�Technical�
Sederhana�Simple�
Jumlah�Total�
(1)� (2)� (3)� (4)� (5)�
� � � � �01.Banggai�Kepulauan� �� �� 1�191,00� 1�191,00�
02.Banggai� 6�173,00� 1�198,00� 3�147,00� 10�518,00�
03.Morowali� 1�967,00� 2�764,00� �175,00� 4�906,00�
04.Poso� 4�596,00� 15�591,50� �781,00� 20�968,50�
05.Donggala� 4�059,00� 4�771,00� �140,00� 8�970,00�
06.Tolitoli� 2�677,00� 5�024,10� 1�046,00� 8�747,10�
07.Buol� �950,00� 2�582,00� �155,00� 3�687,00�
08.Parigi�Moutong� 8�412,72� �959,00� �215,00� 9�586,72�
09.Tojo�Una�Una� �921,00� �400,00� 1�056,00� 2�377,00�
10.�Sigi� 2�569,00� 2�755,00� 1�226,50� 6�550,50�
11.�Banggai�Laut�� �� �200,00� �� �200,00�
12.�Morowali�Utara� �� �989,00� �� �989,00�
13.�Palu� �� 1�001,00� �� 1�001,00�
Sulawesi�Tengah� � � � �
2�0�1�3� 32�324,72� 38�234,60� 9�132,50� 79�691,82�
2�0�1�2� 6�173,00� 8�322,00� 4�480,00� 93�975,00�
2�0�1�1� 6�173,00� 8�322,00� 4�480,00� 93�975,00�
2�0�1�0� 35�546,00� 19�436,00� 7�040,00� 62�022,00�
2�0�0�9� 35�546,00� 19�436,00� 6�175,00� 61�157,00�
Sumber/Source� :� Dinas�Pekerjaan�Umum�Daerah�Provinsi�Sulawesi�Tengah�(Bidang�Sumber�Daya�Air)�Public�Work�Service�of�Sulawesi�Tengah�Province�(Water�Resource�Developing�Bidang)
http
://sul
teng
.bps
.go.
id

Agriculture
Sulawesi Tengah in Figures 2014 217
Tabel�
Table� 6.1.13�Jumlah� �Daerah� � Irigasi,� � Luas� � Areal� � Sawah�Potensial� dan� Fungsional�menurut� Kabupaten/Kota� Kewenangan� dan� tanggung� Jawab� Provinsi�Sulawesi�Tengah�(ha),�2009�2013�Total�Irrigation�Local,�Potential�and�Functional�Wet�Land�Areas�Supervised�by� � Regency/City� � Authority� and� Responsibility� of� Sulawesi� Tengah�Province�(hectare),�2009�2013�
�
Kabupaten/Kota�Regency/City�
Jumlah�Daerah�Irigasi�
Total�Irrigation�Local�
Luas��Potensial�
Potential�Areas�(ha)�
Luas��Fungsional�
Functional�Areas�(ha)�
(1)� (2)� (3)� (4)�� � � �
01. Banggai�Kepulauan� �� �� ��02. Banggai� �8,00� 13�316,00� 8�181,00�03. Morowali� �3,00� 5�103,00� 4�091,86�04. Poso� �4,00� 5�628,00� 2�864,50�05. Donggala� �1,00� 1�625,00� �568,00�06. Tolitoli� �3,00� 4�348,00� 3�060,00�07. Buol� �1,00� 1�028,00� �518,00�08. Parigi�Moutong� �8,00� 14�923,00� 9�166,34�09. Tojo�Una�Una� �� �� ��10. Sigi� �2,00� 1�669,00� 1�073,00�11. Banggai�Laut�� �� �� ��12. Morowali�Utara1)� �…� …� …��13. Palu�� ��� ��� ��
Sulawesi�Tengah�� � � �2�0�1�3� �30,00� 47�640,00� 29�522,70�2�0�1�2� 30,00�� 47�640,00� 28�275,00�2�0�1�1� 30,00� 47�640,00� 27�968,00�2�0�1�0� 30,00� 48�777,00� 34�691,00�2�0�0�9� 30,00� 48�777,00� 27�498,00�
Sumber/Source� :� Dinas�Pekerjaan�Umum�Daerah�Provinsi�Sulawesi�Tengah�(Bidang�Sumber�Daya�Air)�Public�Work�Service�of�Sulawesi�Tengah�Province�(Water�Resource�Developing�Bidang)�
Catatan/Note������:��1)�Tergabung�Dengan�Kabupaten�Induknya/�Include�in�main�regency�
http
://sul
teng
.bps
.go.
id

Pertanian
218 Sulawesi Tengah Dalam Angka 2014
Tabel�
Table� 6.1.14�Jumlah� �Daerah� � Irigasi,� � Luas� � Areal� � Sawah�Potensial� dan� Fungsional�Kewenangan�dan�Tanggung�Jawab�Pusat�(ha),�2013�
Total�Irrigation�Local,�Potential�and�Functional�Wet�Land�Areas�Authority�and�Responsibility��Departemen(hectare),�2013�
�
Kabupaten/Kota�Regency/City�
Jumlah�Daerah�Irigasi�
Total�Irrigation�Local�
Luas��Potensial�
Potential�Aeas�(ha)�
Luas�Fungsional�Functional�Areas�
(ha)�
(1)� (2)� (3)� (4)�
� � � �
01.��Banggai�Kepulauan� �� �� ��
02.��Banggai� �3,00� 9�962,00� 7�472,00�
03.��Morowali� �� �� ��
04.��Poso� �� �� ��
05.��Donggala� �� �� ��
06.��Tolitoli� �� �� ��
07.��Buol� �� �� ��
08.��Parigi�Moutong� �2,00� 13�418,00� 10�064,00�
09.��Tojo�Una�Una� �� �� ��
10.�Sigi� �1,00� 7�922,00� 5�942,00�
12.�Banggai�Laut�� �� �� ��
13.�Morowali�Utara� �� �� ��
14.�Palu� �� �� ��
Sulawesi�Tengah� �6,00� 31�302,00� 23�478,00�
Sumber/Source� :� Dinas�Pekerjaan�Umum�Daerah�Provinsi�Sulawesi�Tengah�(Bidang�Sumber�Daya�Air)�Public�Work�Service�of�Sulawesi�Tengah�Province�(Water�Resource�Developing�Bidang)��
Ket�:�sesuai�usulan�Perubahan�Kepmen�390/KPTS/M/2007��
http
://sul
teng
.bps
.go.
id

Agriculture
Sulawesi Tengah in Figures 2014 219
Tabel�
Table� 6.1.15�Luas�Lahan�Kering�menurut�Kabupaten/Kota�(ribu�ha),�2009�2013�Area�of�Dry�Land�by�Regency/City�(thousands�hectare),�2009�2013�
�(Diolah�dari�hasil�SP.�Lahan)�(Based�on�SP.�Land)�
Kabupaten/Kota�Regency/City�
Lahan�Bukan�Sawah/�Non�Wet�Land�
Tegal/Kebun�Dry�Land�
Ladang/�Huma��Non�irrigated�Field�
Perkebunan�Plantation�
(1)� (2)� (3)� (4)�� � � �01.�Banggai�Kepulauan� �23,72� �9,31� �37,45�02.�Banggai� �42,07� �23,56� �105,67�03.�Morowali� �15,53� �5,11� �41,26�04.�Poso� �26,37� �16,75� �54,40�05.�Donggala� �36,25� �16,72� �100,08�06.�Tolitoli� �29,12� �12,70� �97,20�07.�Buol� �7,84� �5,62� �29,93�08.�Parigi�Moutong� �86,38� �12,47� �86,64�09.�Tojo�Una�Una� �21,48� �10,88� �42,96�10.�Sigi� �37,45� �31,97� �55,45�11.�Banggai�Laut� �7,20� �4,62� �15,61�12.�Morowali�Utara� �21,53� �2,50� �80,08�13.�Palu� �1,51� �1,11� �1,33�Sulawesi�Tengah� � � �
2�0�1�3� �356,46� �153,29� �748,05�2�0�1�2� 347,13� 155,49� 755,56�2�0�1�1� 480,01� 188,48� 685,05�2�0�1�0� 577,49� 241,22� 768,56�2�0�0�9� 555�26� 213�,11� 688,14�
� �
http
://sul
teng
.bps
.go.
id

Pertanian
220 Sulawesi Tengah Dalam Angka 2014
Lanjutan�Tabel�/Continued�Table�6.1.15���
Kabupaten/Kota�Regency/City�
Lahan�Bukan�Sawah/�Non�Wet�Land�
Ditanami�Pohon/���Hutan�Rakyat�
Smallholder�Forest�
Padang�Penggem��balaan/�Rumput�Green�Field�
Sementara�Tidak�Diusahakan�Not�Being�
Active�
(1)� (5)� (6)� (7)�
� � � �01.�Banggai�Kepulauan� �38,43� �0,71� �48,64�
02.�Banggai� �15,19� �7,49� �106,26�
03.�Morowali� �1,20� �1,94� �25,85�
04.�Poso� �6,71� �35,52� �6,74�
05.�Donggala� �33,85� �16,23� �38,56�
06.�Tolitoli� �25,42� �7,32� �18,44�
07.�Buol� �12,92� �1,42� �27,77�
08,�Parigi�Moutong� �32,19� �1,56� �19,59�
09.�Tojo�Una�Una� �0,00� �0,00� �0,00�
10.�Sigi� �16,48� �9,32� �17,09�
11.�Banggai�Laut� �26,31� �0,02� �11,23�
12.�Morowali�Utara� �6,77� �14,60� �26,55�
13.�Palu� �8,19� �1,28� �1,88�
Sulawesi�Tengah� � � �2�0�1�3� �223,66� �97,39� �348,61�2�0�1�2� 218,83� 118,12� 411,07�2�0�1�1� 361,68� 101,84� 407,15�2�0�1�0� 434,07� 92,03� 481,60�2�0�0�9� 644,74� 83,69� 600,32�
�� �
http
://sul
teng
.bps
.go.
id

Agriculture
Sulawesi Tengah in Figures 2014 221
Lanjutan�Tabel��/�Continued�Table��6.1.15���
Kabupaten/Kota�Regency/City�
Lainnya1)/��Other�
Jumlah��Total�
(1)� (8)� (9)�
� � �
01.�Banggai�Kepulauan� 83,69� 241,93�02.�Banggai� 643,63� 943,87�03.�Morowali� 449,58� 540,47�04.�Poso� 702,88� 849,37�05.�Donggala� 271,25� 512,94�06.�Tolitoli� 200,91� 391,11�07.�Buol� 313,61� 399,12�08.�Parigi�Moutong� 351,12� 589,94�09.�Tojo�Una�Una� 494,92� 570,24�10.�Sigi� 329,49� 497,25�11.�Banggai�Laut� 13,62� 78,62�12.�Morowali�Utara� 838,39� 990,42�13.�Palu� 23,37� 38,65�Sulawesi�Tengah� � �
2�0�1�3� 4�716,45� 6�643,91�2�0�1�2� 4�438,16� 6�444,36�2�0�1�1� 4�438,16� 6�662,37�2�0�1�0� 4�010,41� 6�605,38�2�0�0�9� 3�821,08� 5�837,97�
Catatan/Note������:��1)Jumlah�Bukan�pertanian�dan�Lahan�bukan�sawah�lainnya/��������������������������������������Total�Non�Farm�Land�and��other�Non�Wet�Land��
http
://sul
teng
.bps
.go.
id

Pertanian
222 Sulawesi Tengah Dalam Angka 2014
Tabel�Table� 6.1.16�
Luas�Penggunaan�Tanah�menurut�Kabupaten/Kota�(ha),2013�Area�of�Land�Utilization�by�Regency/City�(hectare),�2013�
��
Kabupaten/Kota�Regency/City�
Pemukiman/�Settlement�
Sawah/�Paddy�Field�
Tegalan/�Dry�Land�
Perkebunan/�Plantation�
(1)� (2)� (3)� (4)� (5)�
01.Banggai�Kepulauan� �1�181� �� �29�248� �3�645�
02.�Banggai� �5�114� �17�583� �59�736� �38�956�
03.�Morowali� ��902� �7�771� �64�863� �7�327�
04.�Poso� �2�888� �7�307� �66�121� �2�076�
05.�Donggala� �4�596� �14�545� �57�567� �2�365�
06.�Tolitoli� �3�541� �13�186� �52�045� �9�336�
07.�Buol� �1�318� �3�815� �31�160� �27�377�
08.�Parigi�Moutong� �6�496� �15�596� �55�792� �14�766�
09.�Tojo�Una�Una� �2�789� ��907� �66�906� �1�721�
10.Sigi� ��472� �17�915� �22�208� ��
11.Banggai�Laut� ��656� �� �1�953� ��
12.�Morowali�Utara� �1�497� �1�299� �19�028� �16�067�
13.�Palu� �4�148� ��819� �4�675� ��
Sulawesi�Tengah� �35�596� �100�743� �531�303� �123�635�
�� �
http
://sul
teng
.bps
.go.
id

Agriculture
Sulawesi Tengah in Figures 2014 223
Lanjutan�Tabel��/�Continued�Table�6.1.16��
�� �
Kabupaten/Kota�Regency/City�
Kebun�Campuran/�mix�estate�
Pertambangan�Mining�
Hutan�Forest�
Semak/Alang�alang�Shrubs�
(1)� (6)� (7)� (8)� (9)�
� � � � �
01.Banggai�Kepulauan� �53�096� �� �140�986� �12�762�
02.�Banggai� �115�201� �� �529�865� �63�109�
03.�Morowali� �94�709� �� �628�812� �59�777�
04.�Poso� �51�944� �� �548�403� �16�229�
05.�Donggala� �60�379� �� �321�652� �32�571�
06.�Tolitoli� �44�883� �� �194�556� �38�351�
07.�Buol� �28�006� �� �271�496� �28�673�
08.�Parigi�Moutong� �76�084� �� �307�615� �90�578�
09.�Tojo�Una�Una� �84�389� �� �332�423� �48�325�
10.Sigi� �52�523� �� �380�999� �41�053�
11.Banggai�Laut� �24�264� �� �47�686� �1�068�
12.�Morowali�Utara� �37�406� �� �321�867� �18�152�
13.�Palu� �1�273� �� �15�002� �11�964�
Sulawesi�Tengah� �724�157� �� 4�041�361� �462�612�
http
://sul
teng
.bps
.go.
id

Pertanian
224 Sulawesi Tengah Dalam Angka 2014
Lanjutan�Tabel��/�Continued�Table�6.1.16��
Sumber/Source� :� Kantor�Wilayah�Badan�Pertanahan�Nasional��Provinsi�Sulawesi�Tengah�� � Regional�Office�of�National�Land�Board�of�Sulawesi�Tengah�Province�Catatan/Note������:��������Perhitungan�luas�dari�Peta�Digital�Sistim�Informasi�Geografis�(GIS)/ Extensive�
calculations�of�Digital�Map�Geographic�Information�Systems�(GIS)�����������������������������������������Peta�Penggunaan�Lahan�RTRW�Provinsi�Sulawesi�Tengah�2013/Basic�Land�Use�Map�
RTRW�of�Sulawesi�Tengah�Province�
Kabupaten/Kota�Regency/City�
Tambak/�Embankment
Perairan�Territorial/�
Water�Tanah�Tebuka Lain�lain�
Other�Jumlah�Total�
(1)� (10)� (11)� (12)� (13)� (14)�� � � � � �
01.Banggai�Kepulauan� �� ��151� ��95� �� �241�163�
02.�Banggai� ��192� �2�329� �6�458� ��42� �838�585�
03.�Morowali� �� �4�020� ��2� �� �868�184�
04.�Poso� ��481� �42�044� �16�183� �� �753�675�
05.�Donggala� �1�306� �5�450� ��215� �� �500�646�
06.�Tolitoli� �1�824� ��867� �� �� �358�588�
07.�Buol� ��105� ��815� �� �� �392�765�
08.�Parigi�Moutong� �18�618� �1�523� ��427� �� �587�495�
09.�Tojo�Una�Una� �� �2�376� �4�663� �� �544�499�
10.Sigi� �� �4�534� ��28� �� �519�732�
11.�Banggai�Laut�� �� ��3� ��95� �� �75�725�
12.�Morowali�Utara� �� ��314� ��145� �� �415�776�
13.�Palu� ��28� ��183� �� ��106� �38�197�
Sulawesi�Tengah� �22�554� �64�611� �28�310� ��148� 6�135�030�
http
://sul
teng
.bps
.go.
id

Agriculture
Sulawesi Tengah in Figures 2014 225
6.2.Perkebunan�/�Plantation�
�Tabel�
Table� 6.2.1�Luas� Areal� dan� Produksi� Tanaman� Perkebunan� Besar� menurut� � Jenis�Komoditi�dan�Kabupaten/Kota,�2009�2013�Planted�Area�and�Production�of� Large�Estate�by�Kind�of�Commodity�and�Regency/City,�2009�2013�
�
Kabupaten/Kota�Regency/City�
Kelapa�Coconut�
Kakao�Cocoa�
Luas�Areal�Planted�Area�
(Ha)�
Produksi�Production�
(Ton)�
Luas�Areal�Planted�Area�
(Ha)�
Produksi�Production�
(Ton)�
(1)� (2)� (3)� (4)� (5)�
� � � � �01.Banggai�Kepulauan� �� �� �� ��02.Banggai� �� �� �� ��03.Morowali� �� �� �� ��04.Poso� �� �� �� ��05.Donggala� �� �� �� ��06.Tolitoli� �� �� �� ��07.Buol� �� �� �� ��08.Parigi�Moutong� �� �� �� ��09.Tojo�Una�Una� �� �� �� ��10.�Sigi� �� �� �� ��11.�Banggai�Laut1)� ... ... ... ...12.�Morowali�Utara1)� ... ... ... ...13.�Palu� �� �� �� ��� � � � �Sulawesi�Tengah������� � � � �
2�0�1�3� �� �� �� ��2�0�1�2� �� �� �� ��2�0�1�1� �� �� �� ��2�0�1�0� 478� 245� �� ��2�0�0�9� 478� 245� �� ��
Catatan/Note����������:��1)�Tergabung�Dengan�Kabupaten�Induknya/�Include�in�main�regency����� �
http
://sul
teng
.bps
.go.
id

Pertanian
226 Sulawesi Tengah Dalam Angka 2014
Lanjutan�Tabel��/�Continued�Table�6.2.1�
�
�
�
Kabupaten/Kota�Regency/City�
Karet�Rubber�
Kelapa�Sawit�Palm�Oil�
Luas�Areal�Planted�Area�
(Ha)�
Produksi�Production�
(Ton)�
Luas�Areal�Planted�Area�
(Ha)�
Produksi�Production�
(Ton)�
(1)� (2)� (3)� (4)� (5)�
� � � � �01.�Banggai�Kepulauan� � � ��� ���02.�Banggai� � � 10�245� 60�836�03.�Morowali� ... ... 31�542� 214�673�04.�Poso� � � ��� ���05.�Donggala� � � 6�891� 136�000�06.�Tolitoli� � � ��� ���07.�Buol� � � 16�485� 197�333�08.�Parigi�Moutong� � � ��� ���09.�Tojo�Una�Una� � � ��� ���10.�Sigi� � � ��� ���11.�Banggai�Laut1)� ... ... ... ...
12.�Morowali�Utara1)� ... ... ... ...
13.�Palu� � � - - � �� �� � �
Sulawesi�Tengah������� � � � �2�0�1�3� ... .... 65�163� 608�842�2�0�1�2� ... ... 52�496� 634�001�2�0�1�1� 1�083� 3�525� 46�027� 500�565�2�0�1�0� �2�159� 3�005� 53�703� 457�804�2�0�0�8� 1�621� 3�981� 41�272� 134�128�
Sumber/Source� :� Dinas�Perkebunan�Daerah�Provinsi�Sulawesi�Tengah��� � Plantation�Goverment��Service�of�Sulawesi�Tengah�Province�Catatan/Note����������:��1)�Tergabung�Dengan�Kabupaten�Induknya/�Include�in�main�regency�
http
://sul
teng
.bps
.go.
id

Agriculture
Sulawesi Tengah in Figures 2014 227
Tabel�
Table� 6.2.2�Luas� Areal� dan� Produksi� Tanaman� Perkebunan� Rakyat�menurut� � Jenis�Komoditi�dan�Kabupaten/Kota,�2009�2013�Planted�Area�and�Production�of�Smallholders�Estate�by�Kind�of�Commodity�and�Regency/City,�2009�2013�
��
Kabupaten/Kota�Regency/City�
Kelapa�Coconut�
Kopi�Coffee��
Luas�Areal�Planted�Area�
(Ha)�
Produksi�Production�
(Ton)�
Luas�Areal�Planted�Area�
(Ha)�
Produksi�Production�
(Ton)�
(1)� (2)� (3)� (4)� (5)�
� � � � �01.��Banggai�Kepulauan� 32�366� 17�100� �80� �8�02.��Banggai� 54�267� 46�733� �815� �301�03.��Morowali� 3�409� 2�255� �614� �162�04.��Poso� 4�589� 4�124� 1�496� 1�301�05.��Donggala� 28�338� 28�721� �667� �360�06.��Tolitoli� 20�380� 10�106� �750� �153�07.��Buol� 12�757� 11�858� �628� �201�08.��Parigi�Moutong� 28�914� 39�121� �445� �96�09.��Tojo�Una�Una� 23�565� 27�024� �504� �268�10.��Sigi� 5�828� 2�276� 1�763� �314�11.�Banggai�Laut�1)� ... ... ... ...12.�Morowali�Utara1)� ... ... ... ...13.�Palu� �284� �253� ��� ���� � � � �
Sulawesi�Tengah������� � � � �2�0�1�3� 214�697� 189�572� 7�762� 3�164�2�0�1�2� 210�205� 218�411� 7�573� 4�626�2�0�1�1� 158�614� 192�469� 5�899� 7�104�2�0�1�0� 141�480� 200�676� �������7�990�� ���������8�186�2�0�0�9� 140�734� 199�906� �������7�948�� ���������7�675��
Catatan/Note����������:��1)�Tergabung�Dengan�Kabupaten�Induknya/�Include�in�main�regency�� �
http
://sul
teng
.bps
.go.
id

Pertanian
228 Sulawesi Tengah Dalam Angka 2014
Lanjutan�Tabel��/�Continued�Table�6.2.2�
�
Kabupaten/Kota�Regency/City�
Cengkeh�Clove�
Kapuk�Kapok�
Luas�Areal�Planted�Area�
(Ha)�
Produksi�Production�
(Ton)�
Luas�Areal�Planted�Area�
(Ha)�
Produksi�Production�
(Ton)�
(1)� (6)� (7)� (8)� (9)�
� � � � �01.��Banggai�Kepulauan� 5�736� 1�200� �22� �6�
02.��Banggai� 2�920� �460� �36� �11�
03.��Morowali� 1�157� �128� ��� ��
04.��Poso� 1�545� �198� �� ���
05.��Donggala� 4�083� 1�424� �410� �44�
06.��Tolitoli� 27�893� 7�630� �26� ���
07.��Buol� 1�873� �358� �34� �7�
08.��Parigi�Moutong� 4�559� 1�263� �377� �150�
09.��Tojo�Una�Una� 2�711� 1�100� �23� �8�
10.��Sigi� �160� �27� ��� ���
11.�Banggai�Laut�1)� ... ... ... ...
12.�Morowali�Utara1)� ... ... ... ...
13.�Palu� �� ��� ��� ���
� � � � �
Sulawesi�Tengah������� � � � �
2�0�1�3� 52�637� 13�788� �928� �227�
2�0�1�2� 43�883� 9�304� �909� �239�
2�0�1�1� 31�769� 7�996� 759� 242�
2�0�1�0� 33�451� 10�368� 769� 276�
2�0�0�9� 33�139� 3�223� 772� 274�
Catatan/Note����������:��1)�Tergabung�Dengan�Kabupaten�Induknya/�Include�in�main�regency��
http
://sul
teng
.bps
.go.
id

Agriculture
Sulawesi Tengah in Figures 2014 229
��Lanjutan�Tabel��/�Continued�Table�6.2.2�
�
Kabupaten/Kota�Regency/City�
Lada�Pepper�
Pala��Nutmeg�
Luas�Areal�Planted�Area�
(Ha)�
Produksi�Production�
(Ton)�
Luas�Areal�Planted�Area�
(Ha)�
Produksi�Production�
(Ton)�
(1)� (10)� (11)� (12)� (13)�
� � � � �01.��Banggai�Kepulauan� �24� �1� �808� �80�02.��Banggai� �26� �3� �176� �12�03.��Morowali� �53� �71� �512� �19�04.��Poso� �30� �19� �373� ���05.��Donggala� �786� �57� �325� �5�06.��Tolitoli� �60� �13� 1�516� �55�07.��Buol� �52� �10� �436� �10�08.��Parigi�Moutong� �30� �10� �418� �27�09.��Tojo�Una�Una� ��� ��� �404� �2�10.��Sigi� ��� ��� �85� ��11.�Banggai�Laut�1)� ... ... ... ...
12.�Morowali�Utara1)� ... ... ... ...
13.�Palu� ��� ��� ��� ��
� �� �� �� ��
Sulawesi�Tengah������� �� �� �� ��2�0�1�3� 1�061� �183� 5�052� �209�2�0�1�2� 2�028� �252� 2�440� �88�2�0�1�1� 468� 238� 355� 89�2�0�1�0� 435� 254� 352� 81�2�0�0�9� 435� 258� �������363� �������94�
Catatan/Note����������:��1)�Tergabung�Dengan�Kabupaten�Induknya/�Include�in�main�regency��
http
://sul
teng
.bps
.go.
id

Pertanian
230 Sulawesi Tengah Dalam Angka 2014
�Lanjutan�Tabel��/�Continued�Table�6.2.2�
�
Kabupaten/Kota�Regency/City�
Jambu�Mete���Cashew�
Kakao�Cacao�
Luas�Areal�Planted�Area�
(Ha)�
Produksi�Production�
(Ton)�
Luas�Areal�Planted�Area�
(Ha)�
Produksi�Production�
(Ton)�
(1)� (14)� (15)� (16)� (17)�
� � � � �01.��Banggai�Kepulauan� 8�279� �800� 8�207� 4�200�02.��Banggai� 3�554� 1�300� 46�417� 19�302�03.��Morowali� 1�362� �435� 14�233� 10�241�04.��Poso� ��� ��� 40�529� 32�469�05.��Donggala� 1�260� �161� 30�286� 20�754�06.��Tolitoli� �8� ��� 21�213� 7�335�07.��Buol� �142� �4� 11�537� 7�064�08.��Parigi�Moutong� �929� �213� 69�656� 69�822�09.��Tojo�Una�Una� �793� �76� 13�856� 7�562�10.��Sigi� �4� �2� 27�595� 17�013�11.�Banggai�Laut�1)� ... ... ... ...
12.�Morowali�Utara1)� ... ... ... ...
13.�Palu� �27� �2� �596� �83�� �� �� �� ��Sulawesi�Tengah������� �� �� �� ��
2�0�1�3� 16�358� 2�992� 284�125� 195�846�2�0�1�2� 18�393� 4�816� 295�874� 181�523�2�0�1�1� 10�322� 3�455� 195�725� 168�859�2�0�1�0� 10�378� 3�973� 166�732� 138�306�2�0�0�9� 10�391� ������4�088� 166�691� 137�851�
Catatan/Note����������:��1)�Tergabung�Dengan�Kabupaten�Induknya/�Include�in�main�regency�
http
://sul
teng
.bps
.go.
id

Agriculture
Sulawesi Tengah in Figures 2014 231
Lanjutan�Tabel��/�Continued�Table�6.2.2�
�
Kabupaten/�Kota�Regency/City�
�
Vanili�Vanilla�
Kelapa�sawit�Palm�Oil�
Luas�Areal�Planted�Area�
(Ha)�
Produksi�Production�
(Ton)�
Luas�Areal�Planted�Area�
(Ha)�
Produksi�Production�
(Ton)*)�
(1)� (18)� (19)� (20)� (21)�
� � � � �01.��Banggai�Kepulauan� �159� �7� ��� ���02.��Banggai� �336� �16� 9�473� 26�303�03.��Morowali� �141� �21� 42�804� 80�826�04.��Poso� �209� �61� �522� �522�05.��Donggala� �77� �9� 10�734� 10�957�06.��Tolitoli� �19� ��� ��� ���07.��Buol� �49� �10� 4�060� 2�439�08.��Parigi�Moutong� �18� �1� �92� �29�09.��Tojo�Una�Una� �96� �7� ��� ���10.��Sigi� �138� ��� ��� ���11.�Banggai�Laut�1)� ... ... ... ...�12.�Morowali�Utara1)� ... ... ... ...�13.�Palu� ��� ��� ��� ��
� �� �� �� �
Sulawesi�Tengah������� �� �� �� �2�0�1�3� 1�242� �132� 67�685� 121�077�2�0�1�2� 1�571� �151� 62�852� 144�861�2�0�1�1� 627� 143� 36�007� 571�846�2�0�1�0� 695� 153� 53�703� 570�796�2�0�0�9� 682� 188� 47�768� 555�562�
Catatan/Note����������:��1)�Tergabung�Dengan�Kabupaten�Induknya/�Include�in�main�regency������������������������������������������
http
://sul
teng
.bps
.go.
id

Pertanian
232 Sulawesi Tengah Dalam Angka 2014
Lanjutan�Tabel��/�Continued�Table�6.2.2��
�
��
Kabupaten/�Kota�Regency/City�
Sagu�Sago�
Kemiri�Candlenut�
Luas�Areal�Planted�Area�
(Ha)�
Produksi�Production�
(Ton)�
Luas�Areal�Planted�Area�
(Ha)�
Produksi�Production�
(Ton)�
(1)� (22)� (23)� (24)� (25)�
� � � � �01.��Banggai�Kepulauan� ��� �� 1�281� �170�02.��Banggai� �589� �172� �742� �312�03.��Morowali� �17� �57� �75� �18�04.��Poso� ��� ��� �140� �51�05.��Donggala� �6� �2� �596� �36�06.��Tolitoli� ��� ��� ��� ���07.��Buol� 4�266� �468� ��� ���08.��Parigi�Moutong� �281� ��� �312� �331�09.��Tojo�Una�Una� ��� ��� �655� �239�10.��Sigi� ��� ��� �138� �6�11.�Banggai�Laut�1)� ... ... ... ...
12.�Morowali�Utara1)� ... ... ... ...
13.�Palu� ��� ��� ��� ���� � � � �
Sulawesi�Tengah������� � � � �2�0�1�3� 5�159� �699� 3�939� 1�163�2�0�1�2� 4�939� �680� 3�992� 1�818�2�0�1�1� 792� 694� 1�748� 1�403�2�0�1�0� �� �� 1�955� 1�180�2�0�0�9� �� �� 1�939� 1�278�
http
://sul
teng
.bps
.go.
id

Agriculture
Sulawesi Tengah in Figures 2014 233
Lanjutan�Tabel��/�Continued�Table�6.2.2�
�
�
Kabupaten/Kota�Regency/City�
Karet�Rubber�
Nilam�Patchouli�
Luas�Areal�Planted�Area�
(Ha)�
Produksi�Production�
(Ton)*)�
Luas�Areal�Planted�Area�
(Ha)�
Produksi�Production�
(Ton)�
(1)� (2)� (3)� (4)� (5)�
� � � � �01.�Banggai�Kepulauan� ��� �� �67� �17�02.�Banggai� ��� �� ��� ���03.�Morowali� 5�273� 5�673� ��� ���04.�Poso� �332� �� ��� ���05.�Donggala� ��� �� ��� ���06.�Tolitoli� ��� �� ��� ���07.�Buol� ��� �� 4�377� �641�08.�Parigi�Moutong� ��� �� �8� ���09.�Tojo�Una�Una� ��� �� �90� �18�10.�Sigi� ��� �� ��� ���11.�Banggai�Laut�1)� ... ... ... ...
12.�Morowali�Utara1)� ... ... ... ...
13.�Palu� ��� �� ��� ��� � � � ��
Sulawesi�Tengah������� � � � �2�0�1�3� 5�605� 5�673� 4�542� 676�2�0�1�2� 5�398� 5�673� 6�638� 4�836�2�0�1�1� 4�662� 9�725� 3�065� 8�649�2�0�1�0� 3�520� 7�880� …� …�2�0�0�9� 3�520� 5�900� …� …�
Sumber/Source� :� Dinas�Perkebunan�Daerah�Provinsi�Sulawesi�Tengah��� � Plantation�Goverment��Service�of�Sulawesi�Tengah�Province�Catatan/Note�������:������1)�Tergabung�Dengan�Kabupaten�Induknya/�Include�in�main�regency���������������������������������������
http
://sul
teng
.bps
.go.
id

Pertanian
234 Sulawesi Tengah Dalam Angka 2014
6.3.�Kehutanan/Forestry�
�Tabel�
Table� 6.3.1�Perkembangan�Luas�Penebangan�Hutan�dan�Hasilnya�oleh�Pemegang�Hak�PengusahaanHutan�(HPH),�2009�2013�Progress�of�Felling��Area�and�the�Productions�of�Logging�Concession�(HPH)��by�Year,�2009�2013�
�
T�a�h�u�n�Y�e�a�r�
L�u�a�s�Penebangan�
Felling�A�r�e�a�
(ha)�
Jenis��Hasil��Hutan�Kind��of�Forest��Production� Jumlah�Produksi�
Productions�(m3)�
Kayu�Rimba�Forest�Wood�
Kayu�Hitam�Ebony�
Kayu�Bakau�
Mangrove�Wood�
(1)� (2)� (3)� (4)� (5)� (6)�
� � � � � �
2�0�1�3� �� - - - -
2�0�1�2� 412,38� 12�741,04� �� �� 12�741,04�
2�0�1�1� 373,60� 12�131,68� �� �� 12�131,68�
2�0�1�0� �638,09� 21�224,45� �� �� 21�224,45�
2�0�0�9� 1�662,42� 41�376,34� �� �� 41�376,34�
� � � � � �
Sumber/Source� :� Dinas�Kehutanan��Daerah�Provinsi�Sulawesi�Tengah�Regional�Forest�Service�of�Sulawesi�Tengah�Province�
http
://sul
teng
.bps
.go.
id

Agriculture
Sulawesi Tengah in Figures 2014 235
�Tabel�Table� � 6.3.2�
Perkembangan�Produksi�Hasil�Hutan�menurut�Jenisnya,�2009�2013�Trend�of�Forest�Productions�by�the�Kind,�2009�2013�
Sumber/Source� :� Dinas�Kehutanan��Daerah�Provinsi�Sulawesi�Tengah�Forest�Goverment�Service�of��Sulawesi��Tengah�Province�
Jenis�Hasil�Hutan�Kind�of�Forest�Production�
Satuan�Unit� 2009� 2010� 2011� 2012� 2013�
(1)� (2)� (3)� (4)� (5)� (6)� (7)�
� � � � � � � �
1.� Kayu�Bulat/Logs� m3� 41�376,34 18�529,77 51�018,03 48�445,87� 51�054,25�
2.� Kayu�Gergajian/Sawn�Wood� m3� 17�851,12 25�159,19 27�409,59 27�217,48� 17�007,79�
3.� Kayu�Hitam/Ebony� m3� � � � �� ��
4.� Rotan/Rattan� ton� 11�121,22 4�581,43 5�723,54 81�939,00� 11�218,04�
5.� Damar/Resin� ton� 2�009,50 377,00 742,40 16�751� 1�816,50�
6.� Kayu�Bakar/Fire�Wood� ton� � � � �� ��
7.� Kemiri/Candlenut� ton� � � � �� ��
8.� Kayu�Manis/Cinnamon� m3� � � � �� ��
9.� Kayu�Rimba�Campuran/�Forest�Wood� m3� � 11�140,79 33�201,45 40�330,30� 44�899,88�
10.� Kayu�Hitam�Gergajian/�Sawn�Ebony� m3� � � � �� ��
11.� Kayu�Galapari� ton� � � � �� ��
12.� Limbah�Pakanagi� ton� 180 � � �� ��
� � � � �
http
://sul
teng
.bps
.go.
id

Pertanian
236 Sulawesi Tengah Dalam Angka 2014
�Tabel�
Table� 6.3.3�Luas��Hutan�(ha)menurut�Kabupaten/Kota�dan�Fungsinya,�2009�2013�Forest�Area(hectare)�by�Regency/City�and�the�Function,�2009�2013�
Sumber/Source� :� Dinas�Kehutanan�Daerah�Provinsi�Sulawesi�Tengah�Forestry�Goverment�Service�of�Sulawesi�Tengah�Province
Kabupaten/�Kota�Regency/�City�
Hutan�Lindung�Protection�Forest�
Hutan�Produksi�
Biasa�Tetap�
Definitive�Production�Forest�
Hutan�Produksi�Terbatas�Limited�
Production�Forest�
Hutan�yang�Da��pat�Di��
Konversi�Conversion�Forest�
HutanSuaka�
Alam�&�Hutan�Wisata�Natural�Park�&�Reserve�Forest�
Luas�Kawasan�
Hutan�Forest�Area�
(1)� (2)� (3)� (4)� (5)� (6)� (7)�
� � � � � � �01.�Banggai�Kepulauan� �29�735� �35�018� �44�470� �16�585� ���� �125�808�02.�Banggai� �182�066� �56�053� �326�270� �63�167� �18�890� �646�447�03.�Morowali� �137�430� �36�582� �96�998� �41�583� ���� �312�592�04.�Poso� �167�499� �35�113� �211�692� �12�752� �133�466� �560�522�05.�Donggala� �100�680� �12�871� �182�776� �26�329� �23�215� �345�872�06.�Tolitoli� �44�518� �40�249� �86�308� �1�185� �51�447� �223�707�07.�Buol� �51�224� �57�918� �113�434� �38�009� �5�123� �265�708�08.�Parigi�Moutong� �161�754� �28�741� �132�052� �16�554� �55�049� �391�149�09.�Tojo�Una�Una� �158�387� �65�422� �124�931� �12�165� �7�680� �368�585�10.�Sigi� �142�791� �3�117� �134�636� �9�851� �121�390� �411�785�11.�Banggai�Laut�� �9�470� ���� �8�148� �2�161� ���� �19�779�12.�Morowali�Utara� �240�568� �127�784� �71�140� �33�864� �227�275� �700�631�13.�Palu� �8�443� ��� �5�055� ���� �5�849� �19�347�
� � �Sulawesi�Tengah������� � �
2�0�1�3� 1�434�565� �498�868� 1�537�910� �274�205� �649�384� 4�391�932�2�0�1�2� 1�438�587� 500�587� 1�476�318� 251�856� 676�248� 4�394�932�2�0�1�1� 1�438�587� 500�587� 1�476�318� 251�856� 676�248� 4�394�932�2�0�1�0� 1�438�587� 500�587� 1�476�318� 251�856� 676�248� 4�394�932�2�0�0�9� 1�438�587� 500�587� 1�476�318� 251�856� 676�248� 4�394�932�
http
://sul
teng
.bps
.go.
id

Agriculture
Sulawesi Tengah in Figures 2014 237
Tabel�
Table� 6.3.4�Perkembangan� Realisasi� Interinsuler� Hasil� Hutan� menurut� Jenisnya,�2009�2013�Interinsuler�of�Forest�Production�by�Kinds,�2009�2013�
�
Jenis�Hasil�Hutan�Kinds�of�Forest�Production�
SatuanUnit�
2009� 2010� 2011� 2012� 2013�
(1)� (2)� (3)� (4)� (5)� (6)� (7)�
� �Kayu�Hitam�Logs/Ebony�Logs� m3� �� �� �� �� ��
Kayu�Hitam�Gergajiaan�/�Ebony�Sawn�Timbers� m3� �� �� �� �� ��
Kayu�Rimba�Logs�/�Forest�Wood�Logs�� m3� 41�376� 18�529,77� 27�300,83� 42�769,83� 75�358,79�
Kayu�Rimba�Gergajiaan/�Sawn�Wood� m3� 17�851� 25�159,19� 10�320,98� 1�248,02� 5�407,07�
Rotan/�Rattan�� Ton� 11�121� 4�581,43� 11�160,31� 16�498,88� 176�009,72�
Kemiri/�Candlenut���� Ton� �� �� �� �� ��
Kayu�Kuning� Ton� �� �� �� �� ��
Damar�/�Resins�������� Ton� 2�010� 2�010� 996� 11,05� �316,42�
Kayu��Manis������� Ton� �� �� �� �� ��
Kayu�Rimba�Campuran/Forest�Wood� m3� �� 11�140,79� �� �� 3�415,63�
Kemendangan� ton� �� �� �� �� ��
Gaharu� ton� �� �� �� �� ��
Galapari� ton� �� �� �� �� ��
Akar/Limbah� ton� �� �� �� �� ��
Pinus�� ton� 180� �� 352,48� �� ��
Sumber/Source� :� Dinas�Kehutanan��Daerah�Provinsi�Sulawesi�Tengah�Forestry�Goverment��Service�of�Sulawesi�Tengah�Province
http
://sul
teng
.bps
.go.
id

Pertanian
238 Sulawesi Tengah Dalam Angka 2014
Tabel�
Table� 6.3.5�Kawasan��Konservasi��yang�Telah��Ditetapkan,�2013�Conservation�Area�Which��Has�Been�Defined,�2013�
�
No�Nama�Kawasan�
Name�of�Conservation�Area�
Luas�Area�(ha)�
Lokasi�Location�
Pengelola�Under�Authority�
(1)� (2)� (3)� (4)� (5)�
� � � � �1.� CA�G.�Tinombala� 37�106,12� Kab.�Tolitoli/�Parimo� BKSDA�Sulteng�
2.� CA�Morowali� 209�400,00� Kab.�Morowali� BKSDA�Sulteng�
3.� CA�Tanjung�Api� 4�246,00� Kab.�Tojo�Una�una� BKSDA�Sulteng�
4.� Tahura�Poboya� 7128,00� Kota�Palu,�Kab.�Sigi� Dishut�Prov�Sulteng�
5.� SM�Lumbuyan� 3�069,00� Kab.�Banggai� BKSDA�Sulteng�
6.� SM�Pati�Pati� 3�103,79� Kab.�Banggai� BKSDA�Sulteng�
7.� CA�Gunung�Sojol� 64�448,71� Kab.�Tolitoli,�Donggala,Parimo�
BKSDA�Sulteng�
8.� CA�Gunung�Dako� 19�590,20� Kab.�Tolitoli� BKSDA�Sulteng�
9.� SM�Tg.�Santigi� 1�502,00� Kab.�Parimo� BKSDA�Sulteng�
10.� TN�Kep.�Togean� 362�605,00� Kab.�Tojo�Una�Una� BTN�Kepulauan�Togean�
11.� TN�Lore�Lindu� 217�991,18� Kab.�Poso/�Sigi� BBTN�Lore�Lindu�
12.� TWA�Bancea� 5�000,00� Kab.�Poso� BKSDA�Sulteng�
13.� SM�Tg.�Matop� 1�612,50� Kab.�Tolitoli� BKSDA�Sulteng�
14.� TWA�Wera� 250,00� Kab.�Sigi� BKSDA�Sulteng�
� �
http
://sul
teng
.bps
.go.
id

Agriculture
Sulawesi Tengah in Figures 2014 239
Lanjutan�Tabel�/�Continued�Table�6.3.5�� � �
No�Nama�Kawasan�
Name�of�Conservation�Area�
Luas�Area�(ha)�
Lokasi�Location�
Pengelola�Under�Authority�
(1)� (2)� (3)� (4)� (5)�
� � � � �15.� SM�Bakiriang� 12�500,00 Kab.�Banggai� BKSDA�Sulteng�
16.� TB�Landusa�Tomata� 5�000,00 Kab.�Morowali/Poso� BKSDA�Sulteng�
17.� SM�Pulau�Dolangon� 462,50 Kab.�Tolitoli� BKSDA�Sulteng�
18.� CA�Pangi�Binangga� 6�000,00 Kab.Parimo� BKSDA�Sulteng�
19.� CA�Pamona� 35�000,00 Kab.�Poso� BKSDA�Sulteng�
20.� TWA�(L)�Pulau�Tokobae� 1�000,00 Kab.Poso� BKSDA�Sulteng�
21.� TWA�(L)�Teluk�Tomori� 7�200,00 Kab.�Morowali� ...�
22.� SM�Pulau�Pasoso� 5�000,00 Kab.�Donggala� BKSDA�Sulteng�
23.� SM�(L)��Pulau�Tiga� 42�000,00 Kab.�Morowali� ...�
24.� TWA�(L)�Tosale� 5�000,00 Kab.�Donggala� ...�
25.� TWA�(L)�Pulau�Peleng� 17�462,00 Kab.�Banggai�Kepulauan� ...�
26.� TWA�(L)�Kep.�Sago� 153�850,00 Kab.�Banggai�Kepulauan� ...�� � �
� Catatan�/�Notes�:�� � � �� TB:�Taman�Buru/Hunting�Park�
TN:�Taman�Nasional�/�National�Park� � � �� TWA:�Taman�Wisata�Alam�/�Natural�Tourism�Park�� (L)�:�Laut�/�Sea� �� SM:�Suaka�Margasatwa�/�Game�Preserve�� CA:�Cagar�Alam�/�Conservation�Area� � �� Dishutprop:�Dinas�Kehutanan�Provinsi�/�Province�Forestry�Service� � �� BTN:�Balai�Taman�Nasional�/�Central�Park�� BBTN:�Balai�Besar�Taman�Nasional� �/�Big�Central�Park� � �� BKSDA:�Balai�Konservasi�Sumber�Daya�Alam�/�Central�Natural�Resources�Conservation�
Sumber/Source� :� Balai�Konservasi�Sumber�Daya�Alam�Provinsi�Sulawesi�Tengah�Natural�Resources�Conservation�Foundation�of�Sulawesi�Tengah�Province�
� �
http
://sul
teng
.bps
.go.
id

Pertanian
240 Sulawesi Tengah Dalam Angka 2014
Catatan/Note����������:��1)�Tergabung�Dengan�Kabupaten�Induknya/�Include�in�main�regency�
Catatan/Note����������:��1)�Tergabung�Dengan�Kabupaten�Induknya/�Include�in�main�regency�� �
Tabel�
Table� 6.3.6�Luas��Lahan�Kritis�(ha)menurut�Kabupaten/Kota,�2013Critical�Land�Area�(ha)�by�Regency/City,�2013�
Kabupaten/�Kota�Regency/�City�
Dalam�Kawasan�Hutan/�In�the�Forest�
Sangat�Kritis/�Highly�Critical�
Kritis/�Critical�
Agak�Kritis/�
Somewhat�Critical�
Potensial�Kritis/�
Potential�Critical�
�
Tidak�Kritis/�Not�Critical�
�
Jumlah/�Number�
(1)� (2)� (3)� (4)� (5)� (6)� (7)�
� � � � � � �
01.��Banggai�Kepulauan� ��� �3�452� �52�083� �36�571� �40�731� �132�837�
02.��Banggai� �4�220� �17�024� �52�867� �444�216� �70�675� �589�002�
03.��Morowali� �3�601� �33�535� �66�045� �607�876� �218�314� �929�371�
04.��Poso� �3�808� �14�528� �25�188� �431�541� �17�924� �492�989�
05.��Donggala� ��44� �15�385� �23�112� �252�636� �18�357� �309�534�
06.��Tolitoli� ��411� �6�221� �6�997� �169�399� �18�423� �201�451�
07.��Buol� ���� �1�293� �5�213� �209�396� �28�773� �244�675�
08.��Parigi�Moutong� ��113� �40�452� �21�686� �292�423� �15�232� �369�906�
09.��Tojo�Una�Una� �3�849� �16�742� �28�078� �241�034� �52�223� �341�926�
10.��Sigi� �2�021� �29�398� �13�031� �334�562� �16�999� �396�011�
11.�Banggai�Laut�1)� ...� ...� ...� ...� ...� ...�
12.�Morowali�Utara1)� ...� ...� ...� ...� ...� ...�
13.�Palu� �1�680� �4�011� �2�866� �9�426� ��27� �18�010�
� � � � � � �
� � � � � � �
Sulawesi�Tengah������� �19�747� �182�041� �297�166� 3�029�080� �497�678� 4�025�712�
� � � � � � �
http
://sul
teng
.bps
.go.
id

Agriculture
Sulawesi Tengah in Figures 2014 241
Lanjutan�Tabel�/�Continued�Table�6.3.6�
�
Sumber/Source����:� Balai�Pengelolaan�Daerah�Aliran�Sungai�(DAS)�Palu�Poso��Watershed�Management�Institute�Palu�Poso��
Catatan/Note�������:��1)�Tergabung�Dengan�Kabupaten�Induknya/�Include�in�main�regency�
Kabupaten/�Kota�Regency/�City�
Luar�Kawasan�Hutan/�Out��the�Forest�
Sangat�Kritis/�Highly�Critical�
Kritis/�Critical�
Agak�Kritis/�
Somewhat�Critical�
Potensial�Kritis/�
Potential�Critical�
�
Tidak�Kritis/�Not�Critical�
�
Jumlah/�Number�
(1)� (2)� (3)� (4)� (5)� (6)� (7)�
� � � � � � �
01.��Banggai�Kepulauan� ��887� ��59� �37�057� �73�786� �67�004� �178�793�
02.��Banggai� ��193� �5�953� �47�536� �159�853� �81�007� �294�542�
03.��Morowali� ��11� �8�210� �54�325� �200�835� �42�079� �305�460�
04.��Poso� ��228� �1�637� �50�098� �98�398� �83�676� �234�037�
05.��Donggala� ��61� �10�205� �39�153� �93�362� �34�070� �176�851�
06.��Tolitoli� ��44� �8�447� �31�560� �64�905� �53�231� �158�187�
07.��Buol� ��3� �5�375� �23�131� �102�386� �4�395� �135�290�
08.��Parigi�Moutong� ��784� �19�682� �49�253� �147�609� �5�105� �222�433�
09.��Tojo�Una�Una� ��102� �2�070� �33�933� �66�726� �45�060� �147�891�
10.��Sigi� �1�867� �18�932� �40�724� �51�966� �18�742� �132�231�
11.�Banggai�Laut1)�� ...� ...� ...� ...� ...� ...�
12.�Morowali�Utara1)� ...� ...� ...� ...� ...� ...�
13.�Palu� ��212� �2�194� �6�955� �11�298� ��106� �20�765�
� � � � � � �
� � � � � � �
Sulawesi�Tengah������� �4�392� �82�764� �413�725� 1�071�124� �434�475� 2�006�480�
� � � � � � �
http
://sul
teng
.bps
.go.
id

Pertanian
242 Sulawesi Tengah Dalam Angka 2014
Tabel�
Table� 6.3.7�Luas� � Wilayah� Daerah� Aliran� Sungai� (DAS)� Prioritas� (ha)� menurut�Kabupaten/Kota,�2013�
Area�Priority�Watershe�(ha)�by�Regency/City,2013�
�
�
Sumber/Source� :� Balai�Pengelolaan�Daerah�Aliran�Sungai�(DAS)�Palu�Poso��Watershed�Management�Institute�Palu�Poso��
Catatan/Note������:��1)�Tergabung�Dengan�Kabupaten�Induknya/�Include�in�main�regency�
Kabupaten/�Kota�Regency/�City�
Luas�DAS�Prioritas/�Priority�Area�DAS�
Prioritas�I/��Priority�I�
Prioritas�II�/��Priority�II�
Prioritas�III�/��Priority�III� Jumlah/�Number�
(1)� (2)� (3)� (4)� (5)�
� � � � �
01.��Banggai�Kepulauan� �� �120�997� �190�635� �311�631�
02.��Banggai� �248�931� �448�843� �185�768� �883�543�
03.��Morowali� �764�337� �306�927� �163�568� 1�234�831�
04.��Poso� �317�360� �251�255� �158�410� �727�025�
05.��Donggala� �2�488� �384�423� �99�475� �486�386�
06.��Tolitoli� �134�411� �102�041� �123�184� �359�637�
07.��Buol� �314�922� �45�475� �19�566� �379�963�
08.��Parigi�Moutong� �260�444� �243�689� �88�205� �592�338�
09.��Tojo�Una�Una� �162�761� �27�049� �300�008� �489�817�
10.��Sigi� �285�272� �239�980� �2�990� �528�241�
11.�Banggai�Laut�1)� ...� ...� ...� ...�
12.�Morowali�Utara1)� ...� ...� ...� ...�
13.�Palu� �16�530� �22�246� �� �38�776�
� � � � �
� � � � �
Sulawesi�Tengah������� 2�507�454� 2�192�924� 1�331�809� 6�032�187�
� � � � �
http
://sul
teng
.bps
.go.
id

Agriculture
Sulawesi Tengah in Figures 2014 243
6.4.�Peternakan�/�Animal�Husbandry�
�Tabel�
Table� 6.4.1�Populasi� Ternak� Besar� (ekor)menurut� Kabupaten/� Kota� dan� Jenisnya,�2009�2013�Large�Livestock�Population�(tail)�by�Regency/City�and�Kinds,�2009�2013�
�
Kabupaten/�Kota�Regency/�City�
Kerbau�Buffalo�
S�a�p�i�C�o�w�
Kuda�Horse�
(1)� (2)� (3)� (4)�
� � � �01.��Banggai�Kepulauan� ��4� �15�979� ��573�02.��Banggai� ��4� �54�642� ��224�03.��Morowali� ��575� �21�023� ��04.��Poso� �1�986� �14�109� ��340�05.��Donggala� ��27� �35�083� ��82�06.��Tolitoli� ��108� �13�320� ��180�07.��Buol� ���� �13�957� ����08.��Parigi�Moutong� ��40� �26�183� ��330�09.��Tojo�Una�Una� ���� �20�969� ��424�10.��Sigi� ��662� �26�540� ��252�11.��Banggai�Laut�1)� …� …� …�12.��Morowali�Utara� …1)� …1)� ��2�13.��Palu� ��3� �8�185� ��911�
� �� �� ��Sulawesi�Tengah������� � � �
2�0�1�3� �3�409� �249�990� �3�318�2�0�1�2� ���3�403� 250�921� 3�904�2�0�1�1� 3�341� 242�564� 3�976�2�0�1�0� 4�202� 211�769� 4�294�2�0�0�9� 4�241� 210�536� 4�233�� � � �
Sumber/Source� :� Dinas�Peternakan�Daerah�Provinsi�Sulawesi�Tengah�Livestock�Goverment�Services�of�Sulawesi�Tengah�Province�
Catatan/Note������:��1)�Tergabung�Dengan�Kabupaten�Induknya/�Include�in�main�regency�
http
://sul
teng
.bps
.go.
id

Pertanian
244 Sulawesi Tengah Dalam Angka 2014
Tabel�
Table� 6.4.2�Populasi� Ternak� Kecil� (ekor)menurut� Kabupaten/Kota� dan� Jenisnya,�2009�2013�Small�Livestock�(tail)�by�Regency/City�and�Kind,�2009�2013�
�
Kabupaten/Kota�Regency/City�
Kambing�Goat�
Domba�Sheep�
B�a�b�i�Pig�
(1)� (2)� (3)� (4)�
� � � �01.��Banggai�Kepulauan� �117�863� �� �28�180�02.��Banggai� �71�907� �� �67�036�03.��Morowali� �10�613� �� �3�161�04.��Poso� �4�053� �� �58�224�05.��Donggala� �28�928� ��223� �8�071�06.��Tolitoli� �25�281� ��215� �2�737�07.��Buol� �17�778� �� �1�116�08.��Parigi�Moutong� �33�640� �� �26�787�09.��Tojo�Una�Una� �22�563� �� �2�339�10.��S�i�gi� �25�583� �2�578� �9�097�11.��Banggai�Laut�1)� …� …� …�12.��Morowali�Utara� �3�275� �� �12�244�13.��Palu� �203�569� �4�720� ��
� �� �� ��Sulawesi�Tengah������� � � �
2�0�1�3� �565�053� �7�736� �218�992�2�0�1�2� 530�627� 7�354� 215�446�2�0�1�1� 477�445� 8�656� 198�636�2�0�1�0� 416�231� 9�036� 207�255�2�0�0�9� 359�915� 24�647� 203�652�� � � �
Sumber/Source� :� Dinas�Peternakan�Daerah�Provinsi�Sulawesi�Tengah�Livestock�Goverment�Services�of�Sulawesi�Tengah�Province�
Catatan/Note������:��1)�Tergabung�Dengan�Kabupaten�Induknya/�Include�in�main�regency�
http
://sul
teng
.bps
.go.
id

Agriculture
Sulawesi Tengah in Figures 2014 245
Tabel�
Table� 6.4.3�Populasi�Unggas�(ekor)menurut�Kabupaten/Kota�dan�Jenisnya,��2009�2013�Poultry�Population�(tail)�by�Regency/City�and�Kinds,�2009�2013�
�
�Kabupaten/Kota�Regency/City�
Ayam�Ras�Improved�Hen�
Ayam�Kampung�Native�Chicken�
I�t�i�k�Duck�Petelur�
Layer�Pedaging�Broiler�
(1)� (2)� (3)� (4)� (5)�
� � � � �01.�Banggai�Kepulauan� �8�086� �12�927� �753�743� �22�671�02.�Banggai� �44�691� �799�000� �997�087� �368�528�03.�Morowali� �18�600� �32�183� �80�076� �8�314�04.�Poso� �26�464� �76�900� �328�863� �20�112�05.�Donggala� �229�318� �449�500� �221�183� �9�052�06.�Tolitoli� �59�230� �60�000� �117�402� �32�482�07.�Buol� �14�000� �16�000� �68�697� �12�644�08.�Parigi�Moutong� �14�395� �540�335� �422�405� �39�483�09.�Tojo�Una�Una� �16�113� �321�378� �201�548� �8�080�10.�Sigi� �258�501� �37�562� �70�823� �9�644�11.�Banggai�Laut�1)� …� …� …� …�12.�Morowali�Utara� �13�200� �51�750� �98�170� �7�517�13.�Palu� �185�807� 6�500�000� 1�584�654� �3�942�
� �� �� �� ��
Sulawesi�Tengah������� � � � �2�0�1�3� �888�405� 8�897�535� 4�944�651� �542�469�2�0�1�2� 613�677� 6�915�137� 4�615�310� 527�789�2�0�1�1� 470�416� 5�136�202� 3�883�331� 331�880�2�0�1�0� 394�741� ���5�172�902� 3�748�952� 246�512�2�0�0�9� 609�855� ���5�784�821� ��3�183�432� 270�122�� � � � �
Sumber/Source� :� Dinas�Peternakan�Daerah�Provinsi�Sulawesi�Tengah�Livestock�Goverment�Services�of�Sulawesi�Tengah�Province�
Catatan/Note������:��1)�Tergabung�Dengan�Kabupaten�Induknya/�Include�in�main�regency�
http
://sul
teng
.bps
.go.
id
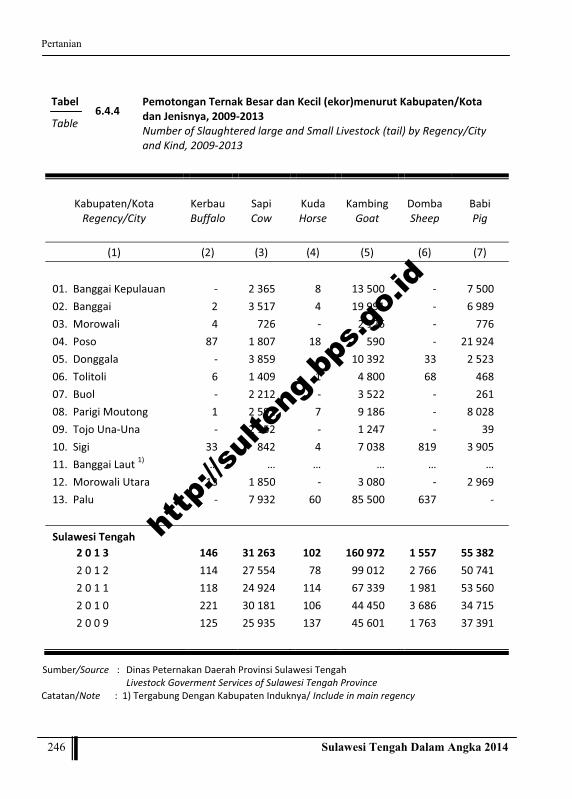
Pertanian
246 Sulawesi Tengah Dalam Angka 2014
Tabel�
Table� 6.4.4�Pemotongan�Ternak�Besar�dan�Kecil�(ekor)menurut�Kabupaten/Kota�dan�Jenisnya,�2009�2013�Number�of�Slaughtered�large�and�Small�Livestock�(tail)�by�Regency/City�and�Kind,�2009�2013�
�
Kabupaten/Kota�Regency/City�
Kerbau�Buffalo�
Sapi�Cow�
Kuda�Horse�
Kambing�Goat�
Domba�Sheep�
Babi�Pig�
(1)� (2)� (3)� (4)� (5)� (6)� (7)�
� � � � � � �01.��Banggai�Kepulauan� ���� �2�365� ��8� �13�500� ���� �7�500�02.��Banggai� ��2� �3�517� ��4� �19�991� ���� �6�989�03.��Morowali� ��4� ��726� ���� �2�126� ���� ��776�04.��Poso� ��87� �1�807� ��18� ��590� ���� �21�924�05.��Donggala� ���� �3�859� ���� �10�392� ��33� �2�523�06.��Tolitoli� ��6� �1�409� ��1� �4�800� ��68� ��468�07.��Buol� ���� �2�212� ���� �3�522� ���� ��261�08.��Parigi�Moutong� ��1� �2�592� ��7� �9�186� ���� �8�028�09.��Tojo�Una�Una� ���� �2�152� ���� �1�247� ���� ��39�10.��Sigi� ��33� ��842� ��4� �7�038� ��819� �3�905�11.��Banggai�Laut�1)� …� …� …� …� …� …�12.��Morowali�Utara� ��13� �1�850� ���� �3�080� ���� �2�969�13.��Palu� ���� �7�932� ��60� �85�500� ��637� ����
� � � � � � �
Sulawesi�Tengah������� � � � � � �2�0�1�3� ��146� �31�263� ��102� �160�972� �1�557� �55�382�2�0�1�2� 114� 27�554� 78� 99�012� 2�766� 50�741�2�0�1�1� 118� 24�924� 114� 67�339� 1�981� 53�560�2�0�1�0� 221� 30�181� 106� 44�450� 3�686� 34�715�2�0�0�9� 125� 25�935� 137� 45�601� 1�763� 37�391�� � � � � � �
Sumber/Source� :� Dinas�Peternakan�Daerah�Provinsi�Sulawesi�Tengah� �Livestock�Goverment�Services�of�Sulawesi�Tengah�Province�
Catatan/Note������:��1)�Tergabung�Dengan�Kabupaten�Induknya/�Include�in�main�regency�
http
://sul
teng
.bps
.go.
id

Agriculture
Sulawesi Tengah in Figures 2014 247
Tabel�
Table� 6.4.5�Pemotongan�Unggas�(ekor)menurut�Jenisnya�per�Kabupaten/Kota,�2008�20121)�
Slaughtered��Poultry�(tail)�by�Kind�and�Regency/City,�2008�20121)�
�
Kabupaten/Kota�Regency/City�
Ayam�Ras�Improved�Hen�
Ayam�Kampung�Native�Chicken�
I�t�i�k�Duck�Petelur�
Layer�Pedaging�Broiler�
(1)� (2)� (3)� (4)� (5)�
� � � � �01.��Banggai�Kepulauan� 4�680� 11��233� 918��595� 13�223�
02.��Banggai� �� 558��821� 239��234� 1�495�
03.��Morowali� �� 90�362� 241�628� 14�224�
04.��Poso� 7�413� 4�928� 282�412� 4�170�
05.��Donggala� �� 140�527� 268�750� 5�030�
06.��Tolitoli� 2�500� 43�650� 127�000� 8�250�
07.��Buol� �� 6�096� 88�763� 2�544�
08.��Parigi�Moutong� 5�569� 620�238� 514�790� 19�691�
09.��Tojo�Una�Una� 1�675� 77�493� 56�171� �263�
10.��Sigi� 84�592� 25�024� 85�053� 5�854�
11.�Palu� 25�499� 5�296�720� 1�314�348� 1�260�
� � � � �
Sulawesi�Tengah������� � � � �
2�0�1�2� 131�928� 6�845�092� 4�136�743� 76�004�
2�0�1�1� 129�327� 5�130�995� 4�066�789� 70�691�
2�0�1�0� 179�298� 5�762�641� 5�313�467� 112�572�
2�0�0�9� 182�838� 5�607�583� 4�509�632� 111�191�
2�0�0�8� 177�563� 4�210�407� 3�098�511� 105�215�
� � � � �
Sumber/Source� :� Dinas�Peternakan�Daerah�Provinsi�Sulawesi�Tengah�Livestock�Goverment�Services�of��Sulawesi�Tengah�Province�
Catatan/Note������:��1)�Data�2013�tidak�tersedia�/�Data�in�2013�not�avalibel�
http
://sul
teng
.bps
.go.
id

Pertanian
248 Sulawesi Tengah Dalam Angka 2014
Tabel
Table 6.4.6 Produksi Daging (ton) menurut Jenis Ternak dan Kabupaten/Kota, 2009-2013 Production of Livestock Meat (tons) by Kind and Regency/City, 2009-2013
Kabupaten/Kota Regency/City
Kerbau Buffalo
Sapi Cow
Kuda Horse
Kambing Goat
Domba Sheep
Babi Pig
(1) (2) (3) (4) (5) (6) (7)
01. Banggai Kepulauan - 348,22 1,26 206,28 - 340,63 02. Banggai 0,43 517,80 0,63 305,46 - 317,40 03. Morowali 0,87 106,90 - 32,48 - 35,22 04. Poso 17,14 266,11 2,73 9,01 - 995,74 05. Donggala - 568,17 - 158,79 0,49 114,59 06. Tolitoli 1,08 207,48 0,21 73,34 1,01 21,26 07. Buol - 325,71 - 53,82 - 11,85 08. Parigi Moutong 0,22 381,59 1,05 140,36 - 364,61 09. Tojo Una-Una - 316,80 - 19,05 - 1,77 10. Sigi 6,51 123,90 0,63 107,54 12,26 177,33 11. Banggai Laut 1) … … … … … … 12. Morowali Utara 2,56 272,42 47,06 - - 13. Palu 0,00 1 167,92 9,03 1 306,46 9,54 -
Sulawesi Tengah 2 0 1 3 28,82 4 603,02 15,54 2 459,65 23,29 2 380,40 2 0 1 2 22,57 3 380,89 11,76 1 515, 87 41,52 2 299,05 2 0 1 1 23,12 3 058,16 17,22 1 030,92 29,72 2 426,69 2 0 1 0 43,61 3 671,54 15,96 680,52 55,32 1 572,91 2 0 0 9 24,74 3 154,74 20,58 693,52 26,46 1 694,10
Sumber/Source : Dinas Peternakan Daerah Provinsi Sulawesi Tengah Livestock Regional Services of Sulawesi Tengah Province
Catatan/Note : 1) Tergabung Dengan Kabupaten Induknya/ Include in main regency
http
://sul
teng
.bps
.go.
id

Agriculture
Sulawesi Tengah in Figures 2014 249
Tabel�
Table� 6.4.7�Produksi�Daging�Unggas�(ton)�menurut�Jenis�dan�Kabupaten/Kota,�2009�2013�Production�of�Poultry�Meat�(tons)�by�Kind�of�Poultries�and�Regency/City,�2009�2013�
�
Kabupaten/Kota�Regency/City�
Ayam�Ras�Improved�Hen�
Ayam�Kampung�Native�Chicken�
I�t�i�k�D�u�c�k�Petelur�
Layer�Pedaging�Broiler�
(1)� (2)� (3)� (4)� (5)�
� � � � �01.��Banggai�Kepulauan� �6,03� �11,72� 1�299,74� �14,21�02.��Banggai� �33,33� �724,65� 1�719,36� �231,07�03.��Morowali� �13,87� �29,19� �138,08� �5,21�04.��Poso� �19,74� �69,74� �567,08� �12,61�05.��Donggala� �171,03� �407,67� �381,40� �5,68�06.��Tolitoli� �44,17� �54,42� �202,45� �20,37�07.��Buol� �10,44� �14,51� �118,46� �7,93�08.��Parigi�Moutong� �10,74� �490,06� �728,39� �24,76�09.��Tojo�Una�Una� �12,02� �291,47� �347,55� �5,07�10.��Sigi� �192,79� �34,07� �122,13� �6,05�11.�Banggai�Laut�1)� …� …� …� …�12.�Morowali�Utara� �9,84� �46,93� �169,28� �4,71�13.�Palu� �138,57� 5�895,18� 2�732,55� �2,47�� �� �� �� ��Sulawesi�Tengah������� � � � �
2�0�1�3� �662,57� 8�069,62� 8�526,46� �340,13�2�0�1�2� 163,59� 7�940,31� 5�088,19� 86�65�2�0�1�1� 160,37� 5�951,95� 5�002,15� 80,59�2�0�1�0� 222,33� 6�684,66� 6�535,56� 128,33�2�0�0�9� 226,72� 6�504,80� 5�546,85� 126,76�� � � � �
Sumber/Source����� :� Dinas�Peternakan�Daerah�Provinsi�Sulawesi�Tengah�����Livestock��Goverment�Services�of��Sulawesi�Tengah�Province�
Catatan/Note����������:��1)�Tergabung�Dengan�Kabupaten�Induknya/�Include�in�main�regency�
http
://sul
teng
.bps
.go.
id

Pertanian
250 Sulawesi Tengah Dalam Angka 2014
Tabel�
Table� 6.4.8�Produksi�Telur�(ton)menurut�Jenisnya�dan�Kabupaten/Kota,2009�2013�Production�of�Eggs��(tons)�by�Kind�and�Regency/City,�2009�2013�
�
Kabupaten/Kota�Regency/City�
Telur�Ayam�Ras�Improved�Hen�
Egg�
Telur�Ayam�Kampung�
Native�Chicken�Egg�
Telur�I�t�i�k�Duck�Egg�
(1)� (2)� (3)� (4)�
� � � �01.�Banggai�Kepulauan� �60,89� �488,05� �145,41�02.�Banggai� �336,52� �645,61� 2�363,74�03.�Morowali� �140,06� �51,85� �53,33�04.�Poso� �199,27� �212,94� �129,00�05.�Donggala� 1�726,76� �143,22� �58,06�06.�Tolitoli� �446,00� �76,02� �208,34�07.�Buol� �105,42� �44,48� �81,10�08.�Parigi�Moutong� �108,39� �273,51� �253,24�09.�Tojo�Una�Una� �121,33� �130,50� �51,83�10.��Sigi� 1�946,51� �45,86� �61,86�11.�Banggai�Laut�1)� …� …� …�12.�Morowali�Utara� �99,40� �63,57� �48,21�13.�Palu� 1�399,13� 1�026,06� �25,28�� � � �Sulawesi�Tengah������� � � �
2�0�1�3� 6�689,69� 3�201,66� 3�479,40�2�0�1�2� 6�910,49� 2�769,19� 3�800,08�2�0�1�1� 5�297,26� 2�330,00� 2�389,53�2�0�1�0� 4�445,10� 2�249,37� �1�774,89�2�0�0�9� 4�705,12� 1�911,46� 1�574,19�� � � �
Sumber/Source� ���:� Dinas�Peternakan�Daerah�Provinsi�Sulawesi�Tengah������Livestock��Goverment�Services�of��Sulawesi�Tengah�Province�
Catatan/Note����������:����1)�Tergabung�Dengan�Kabupaten�Induknya/�Include�in�main�regency�
http
://sul
teng
.bps
.go.
id

Agriculture
Sulawesi Tengah in Figures 2014 251
Tabel�
Table� 6.4.9�Pengeluaran� Ternak� � (ekor)� menurut� Kabupaten/Kota� dan� Jenis� Ternak,�2009�2013�Out�Going�of�Livestock�(tail)�by�Regency/City�and�Kinds,2009�2013�
�
Kabupaten/Kota�Regency/City�
Kerbau�
Buffalo�Sapi�Cow�
Kuda�Horse�
Kam��bing�Goat�
Domba�Sheep�
Babi�Pig�
(1)� (2)� (3)� (4)� (5)� (6)� (7)�� � � � � � �
01.�Banggai�Kepulauan� ... ... ... ... ... ...
02.�Banggai� ... ... ... ... ... ...
03.�Morowali� ... ... ... ... ... ...
04.�Poso� ... ... ... ... ... ...
05.�Donggala� ... ... ... ... ... ...
06.�Tolitoli� ... ... ... ... ... ...
07.�Buol� ... ... ... ... ... ...
08.�Parigi�Moutong� ... ... ... ... ... ...
09.�Tojo�Una�Una� ... ... ... ... ... ...
10.�Sigi� ... ... ... ... ... ...
11.�Banggai�Laut�� ... ... ... ... ... ...
12.�Morowali�Utara� ... ... ... ... ... ...
13.�Palu� ... ... ... ... ... ...
� � � � � � �
Sulawesi�Tengah������� � � � � � �
2�0�1�3� ��180� �10�260� ��740� �12�000� ��107� �15�514�
2�0�1�2� 269� 12�701� 222� 13�576� 133� 12�100�
2�0�1�1� 189� 9�421� 201� 13�269� 131� 28�854�
2�0�1�0� 170� 10�665� 276� 26�814� 918� 25�104�
2�0�0�9� 148� 11�228� 87� 11�825� 29� 15�752�
Sumber/Source� :� Dinas�Peternakan�Daerah�Provinsi�Sulawesi�Tengah�Livestock��Goverment�Services�of��Sulawesi�Tengah�Province
http
://sul
teng
.bps
.go.
id

Pertanian
252 Sulawesi Tengah Dalam Angka 2014
Tabel�
Table� 6.4.10�Pemasukan� Ternak� � (ekor)menurut� � Kabupaten/Kota� dan� Jenis� Ternak,�2009�2013�In�Going�of�Livestock�(tail)�by�Regency/City�and�Kinds,�2009�2013�
�
Kabupaten/Kota�Regency/City�
Kerbau�Buffalo�
Sapi�Cow�
Kuda�Horse�
Kam��bing�Goat�
Domba�Sheep�
Babi�Pig�
(1)� (2)� (3)� (4)� (5)� (6)� (7)�� � � � � � �
01.�Banggai�Kepulauan� ... ... ... ... ... ...
02.�Banggai� ... ... ... ... ... ...
03.�Morowali� ... ... ... ... ... ...
04.�Poso� ... ... ... ... ... ...
05.�Donggala� ... ... ... ... ... ...
06.�Tolitoli� ... ... ... ... ... ...
07.�Buol� ... ... ... ... ... ...
08.�Parigi�Moutong� ... ... ... ... ... ...
09.�Tojo�Una�Una� ... ... ... ... ... ...
10.�Sigi� ... ... ... ... ... ...
11.�Banggai�Laut�� ... ... ... ... ... ...
12.�Morowali�Utara� ... ... ... ... ... ...
13.�Palu� ... ... ... ... ... ...
� � � � � � �
Sulawesi�Tengah������� � � � � � �2�0�1�3� ��54� �11�113� ��47� �8�170� ��41� �12�701�2�0�1�2� 215� 11�191� 95� 8�161� 66�� 13�190�2�0�1�1� 156� 12�998� 72� 5�751� 370� 10�073�2�0�1�0� 23� 9�194� 446� 8�424� 500� 2�802�2�0�0�9� 5� 11�308� 816� 65�499� 15�580� 6�916�� � � � � � �
Sumber/Source� :� Dinas�Peternakan�Daerah�Provinsi�Sulawesi�Tengah�Livestock��Goverment�Services�of��Sulawesi�Tengah�Province
http
://sul
teng
.bps
.go.
id

Agriculture
Sulawesi Tengah in Figures 2014 253
6.5.�Perikanan/�Fishery��Tabel�
Table� 6.5.1�Jumlah� Rumahtangga� Perikanan� (RTP)� menurut� Kabupaten/Kota� dan�Kategori�Usaha�Perikanan,�2009�2013�Number� of� Fishery� Households� by� Regency/City� and� Classified� Fishery�Establishment,�2009�2013�
�
Kabupaten/K�o�t�a�Regency/City�
Perikanan�Tangkap�Laut/MarineFishery�Catching�
Tanpa�Perahu�N�o�n�Vessels�
Perahu�Tak�Ber��Motor/�Non�
Powered�Boat�
Perahu�Motor�Tempel�Motor�Boat�
Kapal�Motor�Ship�Jukung�
Dug�Out�Boat�
Perahu�Papan�Boat�
(1)� (2)� (3)� (4)� (5)� (6)�� � �
01.�Banggai�Kepulauan� ��645� �2�189� �3�259� �3�035� ��195�02.�Banggai� �4�275� �1�737� �2�824� �4�209� �1�025�03.�Morowali� ���� ��91� ��369� �5�095� �2�991�04.�Poso� ��78� ��95� ��314� ��518� ��11�05.�Donggala� �1�179� �1�382� �3�882� �1�541� �1�445�06.�Tolitoli� ��288� ��693� ��871� �1�235� ��348�07.�Buol� ��309� ��167� ��465� �2�193� ��80�08.�Parigi�Moutong� ���� ��392� �1�987� �1�963� ��38�09.�Tojo�Una�Una� ��204� ���� ��747� �2�227� ��25�10.�Sigi� � ���� ���� ���� ���� ����11.�Banggai�Laut�1)� ... ... ... ... ...12.�Morowali�Utara1)� ... ... ... ... ...13.�Palu� ��62� ��271� ��252� ��141� ��2�
� �� �� �� �� ��Sulawesi�Tengah� � � � � �2�0�1�3�*)� �7�040� �7�017� �14�970� �22�157� �6�160�2�0�1�2� 6�678� 7�749� 11�821� 21�768� 4�448�2�0�1�1� 6�080� 7�761� 11�416� 19�580� 4�321�2�0�10� 6�672� 5�858� 12�112� 9�902� 3�237�2�0�0�9� 3�100� 6�896� 13�290� 12�555� 2�279�
Catatan/Note����������:��1)�Tergabung�Dengan�Kabupaten�Induknya/�Include�in�main�regency���������������������������������������*)�Angka�sementara
http
://sul
teng
.bps
.go.
id

Pertanian
254 Sulawesi Tengah Dalam Angka 2014
Lanjutan�Tabel�/Continued�Table�6.5.1�
�
Kabupaten/K�o�t�a�Regency/City�
Perikanan�Tangkap�Umum�Inland�Fishery�Catching�
Danau�Lake�
Rawa�Swamp�
Sungai�River�
(1)� (7)� (8)� (9)�
� �01.�Banggai�Kepulauan� ���� ���� ����
02.�Banggai� ���� ���� ����
03.�Morowali� ��265� ���� ��7�
04.�Poso� ��218� ���� ����
05.�Donggala� ��59� ���� ����
06.�Tolitoli� ���� ���� ����
07.�Buol� ���� ���� ����
08.�Parigi�Moutong� ��42� ���� ����
09.�Tojo�Una�Una� ���� ���� ����
10.�Sigi� ��305� ���� ����
11.�Banggai�Laut�1)� ... ... ...
12.�Morowali�Utara1)� ... ... ...
13.�Palu� �� ���� ����
� �� �� ��
Sulawesi�Tengah� � � �
2�0�1�3*)� ��889� ���� ��7�
2�0�1�2� 884� �� 7�
2�0�1�1� 603� �� 133�
2�0�1�0�� 354� 87� 162�
2�0�0�9� 296� 68� 144�
Catatan/Note����������:��1)�Tergabung�Dengan�Kabupaten�Induknya/�Include�in�main�regency���������������������������������������*)�Angka�sementara�� �
http
://sul
teng
.bps
.go.
id

Agriculture
Sulawesi Tengah in Figures 2014 255
Lanjutan�Tabel�/�Continued�Table�6.5.1�
�
Kabupaten/K�o�t�a�Regency/City�
Perikanan�Budidaya/�Fishery�Culture�
Jumlah�Total�
Kolam�Fresh�water�pond�
Tambak�Brackish�water�pond�
KarambaCage�
Sawah�Paddy�field�
Budidaya�Laut�
Marine�culture�
Jaring�Apung�Floating�cage�net�
(1)� (10)� (11)� (12)� (13)� (14)� (15)� (16)�� � �
01.�Banggai�Kepulauan� ���� ���� ���� ���� �6�848� ���� �16�171�
02.�Banggai� ��215� ��340� ���� ���� ��525� ���� �15�150�
03.�Morowali� ��158� ��258� ���� ���� �2�860� ���� �12�094�
04.�Poso� �1�675� ��119� ��343� ���� ��145� ���� �3�516�
05.�Donggala� ��46� ��951� ���� ���� ��216� ���� �10�701�
06.�Tolitoli� ��201� ��338� ���� ��10� ��895� ���� �4�879�
07.�Buol� ��154� ��145� ���� ���� ��50� ���� �3�563�
08.�Parigi�Moutong� ��103� �1�971� ���� ���� �1�591� ���� �8�087�
09.�Tojo�Una�Una� ��342� ��73� ���� ���� ��828� ���� �4�446�
10.Sigi� �1�944� ���� ���� ��12� ���� ���� �2�261�
11.�Banggai�Laut�1)� …� …� …� …� …� …� …�
12.�Morowali�Utara1)� …� …� …� …� …� …� …�
13.�Palu� ��112� ���� ���� ���� ��31� ���� ��871��� �� �� �� �� �� ��
Sulawesi�Tengah� � � � � � � �2�0�1�3*)� �4�950� �4�195� ��343� ��22� 13�989� ���� �81�739�2�0�1�2� 4�974� 4�152� �� 21� 13�340� �� 22�487�2�0�1�1� 4�946� 4�414� 277� 19� 13�719� �� 23�375�2�0�1�0� 4�931� 5�163� 254� 17� 13�058� �� 23�423�2�0�0�9� 4�302� 4�753� 152� 26� 12�279� 55� 21�567�
� � � � � � � �
Sumber/Source� ����:� Dinas�Kelautan�dan�Perikanan�Daerah�Provinsi�Sulawesi�Tengah�Marine�and�Fisheries�Goverment�Services�of�Sulawesi�Tengah�Province�
Catatan/Note����������:��1)�Tergabung�Dengan�Kabupaten�Induknya/�Include�in�main�regency���������������������������������������*)�Angka�sementara�
http
://sul
teng
.bps
.go.
id

Pertanian
256 Sulawesi Tengah Dalam Angka 2014
�Tabel�
Table� 6.5.2�Jumlah� Perahu/Kapal� Perikanan� Tangkap� (Laut� dan� Umum)� menurut�Kabupaten/Kota�dan�Jenisnya,�2009�2013�Number�of�Catch�Fishing�Boats�(Marine�and�Shore)�by�Regency/City�and�Kind,�2009�2013�
�
Kabupaten/Kota�Regency/City�
Perahu�Tak�Bermotor�Non�Powered��Boat�
Perahu�Motor�Tempel�Out�Boat�Motor�
Kapal�Motor�In�Boat�Motor�
Jumlah�Total�Jukung�
Dug�Out�Boat�
Perahu�Papan�
Plank�Boat�(1)� (2)� (3)� (4)� (5)� (6)�
� � � � � �01.�Banggai�Kepulauan� �2�568� �3�292� �4�348� ��195� �10�403�02.�Banggai� �1�737� �2�824� �4�209� �1�025� �9�795�03.�Morowali� ��92� ��369� �4�993� ��431� �5�885�04.�Poso� ��95� ��314� ��518� ��11� ��938�05.�Donggala� �1�382� �3�882� �1�541� �1�445� �8�250�06.�Tolitoli� ��693� ��871� �1�235� ��347� �3�146�07.�Buol� ��194� ��502� �2�386� ��88� �3�170�08.�Parigi�Moutong� ��399� �2�045� �2�031� ��41� �4�516�09.�Tojo�Una�Una� ���� ��747� �2�227� ��25� �2�999�10.�S��i�g��i� ���� ���� ���� ���� ����11.�Banggai�Laut�1)� …� …� …� …� …�12.�Morowali�Utara1)� …� …� …� …� …�13.�Palu� ��271� ��252� ��141� ��2� ��666�
�� �� �� �� ��Sulawesi�Tengah� � � � � �
2�0�1�3*)� �7�431� �15�098� �23�629� �3�610� �49�768�
2�0�1�2� 7�988� 12�152� 22�517� 3�551� 46�208�
2�0�1�1� 7�559� 12�490� 22�401� 3�218� 46�195�
2�0�1�0� 6�187� 13�058� �� 10�578� 29�823�
2�0�0�9� 6�892� 13�856� 13�060� 2�328� 36�136�
Sumber/Source� ��:�Dinas�Kelautan�dan�Perikanan�Daerah�Provinsi�Sulawesi�Tengah�Marine�and�Fisheries�Goverment�Services�of�Sulawesi�Tengah�Province�
Catatan/Note����������:��1)�Tergabung�Dengan�Kabupaten�Induknya/�Include�in�main�regency���������������������������������������*)�Angka�sementara�
http
://sul
teng
.bps
.go.
id

Agriculture
Sulawesi Tengah in Figures 2014 257
Tabel�Table� 6.5.3�
Banyaknya�Alat�Penangkap�Ikan�menurut�Jenisnya�Tahun�2013*)�Number�of�Fisher�Equipments�by�Type,�2013*)�
Sumber/Source� :� Dinas�Kelautan�dan�Perikanan�Daerah�Provinsi�Sulawesi�Tengah�Marine�and�Fisheries�Goverment�Services�of�Sulawesi�Tengah�Province�
�
Jenis�Alat�Tangkap�Kind�of�Fisher�Equipment�
Laut/�Marine�
Perairan�Umum/�Inland�Waters�
Jumlah�Total�
(1)� (2)� (3)� (4)�1. Pukat�Tarik�Ikan�/�Fish�Pull�Trawl� ��478� �� ��478�2. Pukat�Tarik�Udang�Tunggal� ��30� �� ��30�3. Payang�/Payang� ��300� �� ��300�4. Pukat�Pantai�/�Beach�Seine� �1�409� �� �1�409�5. Pukat�Cincin�/�Ring�Trawl� �1�930� �� �1�930�6. Dogol� ��161� �� ��161�7. Jaring�Insang�Hanyut�/��Float�Gill�Net� �1�787� �� �1�787�8. Jaring�Lingkar�/�Cycled�Net� ��461� �� ��461�9. Jaring��Insang�Tetap�/�Fixed�Gill�Net� �2�607� �� �2�607�10. Jaring�Angkat�Lain�/�Other�Lift�Net� ��183� �� ��183�11. Bagan�Perahu/Rakit�/�Boat/raft� ��473� �� ��473�12. Bagan�Tancap�/�Embed�Bagan� ��122� �� ��122�13. Serok�/�Scoop� ��318� �� ��318�14. Anco�/�Anco� �� �� ��15. Rawai�Tuna�/�Tuna�Fishing�Line� ��603� �� ��603�16. Rawai�Hanyut�/�Float�Fishing�Line� ��45� �� ��45�17. Rawai�Tetap�/�Fixed�Fishing�Line� ��823� �� ��823�18. Rawai�Tetap�Dasar�/�Base�Fixed�Fishing�Line� �2�165� �� �2�165�19. Huhate�/�Huhate� ��451� �� ��451�20. Pancing�Tonda�/�Tonda�Rod� �16�204� �� �16�204�21. Pancing�Ulur�/�Overextend�Rod� �35�160� �� �35�160�22. Pancing�Tegak�/�Portrait�Rod� �3�737� �� �3�737�23. Pancing�Cumi�/�Squid�Rod� �1�473� �� �1�473�24. Pancing�yang�Lain�/�Other�Rods� �7�262� �� �7�262�25. Sero�/�Sero� ��266� �� ��266�26. Bubu�/�Bubu� �3�715� �� �3�715�27. Perangkap�Lain�/�Other�Traps� ��302� �� ��302�28. Alat�Pengumpul�Rumput�Laut� ��140� �� ��140�29. Alat�Pengumpul�Kerang�/�Shell�Collector� � �� ��0�30. Alat�Penangkap�Teripang�/�Sea�Slug�Catcher� ��721� �� ��721�31. Alat�Penangkap�kepiting�/�Crab�Trapper� ��689� �� ��689�32. Muoroami/�Muoroami� ��452� �� ��452�33. Jala�Tebar�/�Spread�Net� ��248� �� ��248�34. Garpu/Tombak/Lain�lain�/�Fork/Spear/Others� ��587� �� ��587�
http
://sul
teng
.bps
.go.
id

Pertanian
258 Sulawesi Tengah Dalam Angka 2014
Tabel�
Table� 6.5.4�Produksi�Perikanan�Tangkap�menurut�Kabupaten/Kota�dan�Jenis�Perikanan�(ton),�2009�2013�Production�of�Catch�Fishing�by�Regency/City�and�Kind�of�Fishery�(tons),�2009�2013�
�
Kabupaten/�Kota�Regency/�City�
Perikanan�Laut�
Marine�Fishery�
Perikanan�Umum/�Inland�Fishery�Jumlah�Total�Danau�
Lake�Rawa�Creek�
Sungai�River�
Jumlah�Total�
(1)� (2)� (3)� (4)� (5)� (6)� (7)�01.�Banggai�Kepulauan� 43�447,20� �� �� �� �� 43�447,20�02.�Banggai� 18�224,80� �� �� �� �� 18�224,80�03.�Morowali� 45�038,10� �� �� �� �� 45�038,10�04.�Poso� 8�491,40� �� �� �� �� 8�491,40�05.�Donggala� 21�323,20� �� �� �� �� 21�323,20�06.�Tolitoli� 61�879,00� �� �� �� �� 61�879,00�07.�Buol� 22�853,00� �� �� �� �� 22�853,00�08.�Parigi�Moutong� 24�005,30� �� �� �� �� 24�005,30�09.�Tojo�Una�Una� 12�059,20� �� �� �� �� 12�059,20�10.�Sigi� �� �� �� �� �� ��11.�Banggai�Laut�1)� … … … … … …
12.�Morowali�Utara1)� … … … … … …
13.�Palu� 2�665,10� �� �� �� �� 2�665,10�� �� �� �� �� �� ��
Sulawesi�Tengah� � � � � � �2013*)� 259�986,30� �� �� �� �� 259�986,30�
2012� 196�107,00� 1�088,4� �� 4,81� 1�093,2� 197�200,21�
2011� 145�784,06� 46,74� �� 48,12� 94,86� 14�878,92�
2010� 140�465,71� 519,15� 28,21� 59,41� 606,77� 141�072,48�
2009� 148�804,08� 181,17� 248,00� 38,00� 278,60� 149�083,40�
Sumber/Source� ���:� Dinas�Kelautan�dan�Perikanan�Daerah�Provinsi�Sulawesi�Tengah���������Marine�and�Fisheries�Goverment�Services�of�Sulawesi�Tengah�Province�
Catatan/Note����������:��1)�Tergabung�Dengan�Kabupaten�Induknya/�Include�in�main�regency���������������������������������������*)�Angka�sementara�
http
://sul
teng
.bps
.go.
id

Agriculture
Sulawesi Tengah in Figures 2014 259
Tabel�
Table� 6.5.5�Nilai��Produksi�Perikanan�Tangkap�(Rp�1000)�menurut�Kabupaten/Kota�dan�Jenis�Perikanan,�2009�2013�Production�Value�of�Catch�Fishing�(sei�rupiahs)�by�Regency/City�and�Kind�of�Fishery,�2009�2013�
�
Kabupaten/Kota�Regency/City�
Perikanan�Laut�
Marine�Fishery�
Perikanan�Umum/�Inland�Fishery�
Jumlah*)�Total�Danau�
Lake�Rawa�Creek�
Sungai�River�
Jumlah�Total�
(1)� (2)� (3)� (4)� (5)� (6)� (7)�01.�Banggai�Kepulauan� �599�758�097 �� �� �� �� �599�758�097
02.�Banggai� �169�072�873 �� �� �� �� �169�072�873
03.�Morowali� 1�050�594�599 �� �� �� �� 1�050�594�599
04.�Poso� �139�487�700 �� �� �� �� �139�487�700
05.�Donggala� �141�731�315 �� �� �� �� �141�731�315
06.�Tolitoli� �611�231�380 �� �� �� �� �611�231�380
07.�Buol� �264�008�195 �� �� �� �� �264�008�195
08.�Parigi�Moutong� �362�346�759 �� �� �� �� �362�346�759
09.�Tojo�Una�Una� �156�112�438 �� �� �� �� �156�112�438
10.Sigi� �� �� �� �� �� ��11.�Banggai�Laut�1)� … … … … … …12.�Morowali�Utara1)� … … … … … …13.�Palu� �46�963�350 �� �� �� �� �46�963�350
� � �
Sulawesi�Tengah�2�0�1�3*)� 3�541�306�706 �� �� �� �� 3�541�306�706
2�0�1�2� 2�523�746�454 23�546�651 � 72�135 23�618�786 2�547�356�240
2�0�1�1� 1�625�168�362 456�708 � 626�236 1�082�944 1�626�251�306
2�0�1�0� 1�148�106�909 2�346�960 346�145 695�899 3�389�004 1�151�495�913
2�0�0�9� 1�101�857�589 3�678�413 270�434 886�420 3�799�877 1�109�457�343
Sumber/Source� ���:� Dinas�Kelautan�dan�Perikanan�Daerah�Provinsi�Sulawesi�Tengah���������Marine�and�Fisheries�Goverment�Services�of�Sulawesi�Tengah�Province�
Catatan/Note����������:��1)�Tergabung�Dengan�Kabupaten�Induknya/�Include�in�main�regency���������������������������������������*)�Angka�sementara�
http
://sul
teng
.bps
.go.
id

Pertanian
260 Sulawesi Tengah Dalam Angka 2014
Tabel�
Table� 6.5.6�Produksi� Perikanan� Budidaya� (ton)� menurut� Kabupaten/Kota� dan� Jenis�Perikanan,�2008��2012�Production� of� Culture� Fishery� (tons)� by� Regency/City� and� Kinds� of� Fishery,�2009�2013�
�
Kabupaten/Kota�Regency/City�
Tambak�Brackish�
Water�Pond�
Budidaya�Laut�(Rumput�
laut)�Marine��Culture�
(Seaweed)�
Kolam�Fresh�water�pond�
Karamba�Cage�
Jaring�Apung�dan�
Sawah�Floating�Cage�Net�and�Paddy�
Field�
Jumlah�Total�
(1)� (2)� (3)� (4)� (5)� (6)� (7)�� � � � � �
01.�Banggai�Kepulauan� � 503�121,9 � �� �853,2� 503�975,1�02.�Banggai� �532,0 47�900,0 �808,4 �202,6 �54,7� 49�497,7�03.�Morowali� 48�514,9 397�616,5 �150,6 � �35,5� 446�317,4�04.�Poso� �537,7 �468,0 �925,6 �436,5 �7,4� 2�375,2�05.�Donggala� 3�728,0 1�570,0 �9,7 � �0,0� 5�307,7�06.�Tolitoli� �423,0 2�080,0 �13,0 � �2,2� 2�518,2�07.�Buol� 1�029,0 �257,0 1�242,0 � �� 2�528,0�08.�Parigi�Moutong� 4�307,0 153�615,5 1�434,6 � ��� 159�357,1�09.�Tojo�Una�Una� �32,8 53�300,0 �26,1 � �78,6� 53�437,4�10.�Sigi� � �0,0 2�106,6 � �16,0� 2�122,6�11.�Banggai�Laut�1)� … … … … … …12.�Morowali�Utara1)� … … … … … …13.�Palu� � � �44,8 �� ��� �44,8�
� � � � � �� ��Sulawesi�Tengah� � �
2013*)� 59�104,3 1159�928,9 6�761,4 �639,1 1�047,5� 1227�481,3�2012� 72�837,2 927�721,1 5�816,5 345,5 20,0� 1�006�740,3�2011� 42�057,3 791�268,1 4�394,5 273,0 19,3� 838�012,2�2010� 23�213,7 795�166,7 4�212,3 266,3 9,6� 822�868,6�2009� 13�590,7 758�141,9 3�536,5 42,0 1,5� 775�311,6�
Sumber/Source� :� Dinas�Kelautan�dan�Perikanan�Daerah�Provinsi�Sulawesi�Tengah���������Marine�and�Fisheries�Goverment�Services�of�Sulawesi�Tengah�Province�
Catatan/Note������:�������1)�Tergabung�Dengan�Kabupaten�Induknya/�Include�in�main�regency���������������������������������������*)�Angka�sementara�
http
://sul
teng
.bps
.go.
id

Agriculture
Sulawesi Tengah in Figures 2014 261
Tabel�
Table� 6.5.7�Nilai�Produksi�Perikanan�Budidaya�(Rp�Seribu)menurut�Kabupaten/Kota�dan�Jenis�Perikanan,�2009�2013�Production�Value�of�Fishery�Culture��by�Regency/City�and�Kinds�of�Fishery,2008��2012�
�
Kabupaten/Kota�Regency/City�
Tambak�Brackish�
water�pond
Budidaya�Laut�(Rumput�laut)�Marine�culture(Seaweed)�
Kolam�Fresh�water�
pond�
Karamba�Cage�
Jaring�Apung�dan�
Sawah�Floating�cage�net�and�Paddy�
field�
Jumlah�Total�
(1)� (2)� (3)� (4)� (5)� (6)� (7)�� � � � � � �
01.�Banggai�Kepulauan� ���� �868�994�945 ���� ���� ���� �868�994�945
02.�Banggai� �40�633�736 �32�961�200 �18�975�250 ���� �7�800�000 �100�370�186
03.�Morowali� �317�323�000 1�194�948�000 �3�933�900 ���� ���� 1�516�204�900
04.�Poso� �5�801�440 ��927�275 �29�071�750 ��851�000 �12�867�650 �49�519�115
05.�Donggala� �72�470�127 �3�362�500 �17�377�650 ���� ���� �93�210�277
06.�Tolitoli� �12�631�990 �1�995�300 ��472�327 ���� ��30�375 �15�129�992
07.�Buol� �34�115�000 �1�285�000 �29�825�000 ���� ���� �65�225�000
08.�Parigi�Moutong� �235�320�418 �384�038�700 �25�847�185 ���� ���� �645�206�303
09.�Tojo�Una�Una� �1�242�120 �40�505�029 ��872�300 ���� ���� �42�619�449
10.�Sigi� ���� ���� �63�805�000 ���� ��530�000 �64�335�000
11.�Banggai�Laut�1)� … … … … … …12.�Morowali�Utara1)� … … … … … …13.�Palu� ���� ���� �2�064�620 ���� ���� �2�064�620
�
Sulawesi�Tengah��2013*)� �719�537�831 2�529�017�949 �192�244�982 ��851�000 �21�228�025 3�462�879�7862012� 547�778�243 2�448�930�835 138�102�000 7�508�260 560�000 3�142�879�3382011� 852�915�132 1�964�875�300 90�369�334 6�779�420 628�990 2�915�568�1762010� 396�870�053 2�072�444�809 326�181�885 6�685�970 117�052 2�802�299�7692009� 362�432�050 2�001�547�054 59�911�545 789�550 � 2�424�703�779
Sumber/Source� ���:� Dinas�Kelautan�dan�Perikanan�Daerah�Provinsi�Sulawesi�Tengah���������Marine�and�Fisheries�Goverment�Services�of�Sulawesi�Tengah�Province�
Catatan/Note����������:��1)�Tergabung�Dengan�Kabupaten�Induknya/�Include�in�main�regency���������������������������������������*)�Angka�sementara�
http
://sul
teng
.bps
.go.
id

Pertanian
262 Sulawesi Tengah Dalam Angka 2014
Tabel�
Table� 6.5.8�Produksi�Ikan�Laut�Olahan�(ton)�menurut�Kabupaten/Kota,�2009�2013�Production�of�Marine�Preservative�Fish�(tons)�by�Regency/City,�2009�2013�
�
Kabupaten/Kota�Regency/City�
Penggaraman�Salt�
Pengasapan�Fumigation�
Pembekuan�Freezing�
Lainnya�Others�
Jumlah�Total�
(1)� (2)� (3)� (4)� (5)� (6)�
� � � � � �01.�Banggai�Kepulauan� 2�235,40� �210,20� 15�767,20� ��� 18�212,80�
02.�Banggai� 1�893,50� �164,90� �319,90� �31,30� 2�409,60�
03.�Morowali� 3�741,10� 5�828,40� �� �� 9�569,50�
04.�Poso� 1�207,00� �784,90� �� �� 1�991,90�
05.�Donggala� 3�346,80� �836,90� �� 1�044,50� 5�228,20�
06.�Tolitoli� �825,90� �� �� ��� �825,90�
07.�Buol� �831,50� �214,40� �� �110,60� 1�156,50�
08.�Parigi�Moutong� �295,00� �162,40� �� ��� �457,40�
09.�Tojo�Una�Una� 4�593,60� �0,90� �� �2,40� 4�596,90�
10.�Sigi� �� �� �� �� ��
11.�Banggai�Laut�1)� … … … … …
12.�Morowali�Utara1)� … … … … …
13.�Palu� �� �� �� �� ��
�� �� �� �� ��
Sulawesi�Tengah� � � � � �
2013*)� 18�969,80� 8�203,00� 16�087,10� 1�188,80� 44�448,70�
2012� 17�023,98� 6�630,77� 8�624,76� 217,48� 32�496,99�
2011� 19�606,10� 6�215,94� 5�544,30� 2�569,65� 33�935,99�2010� 25�463,80� 8�778,56� 3�378,05� 1�504,01� 39�124,42�2009� 14�741,89� 4�084,83� 54,96� 3�004,99� 21�886,67�
Sumber/Source� ���:� Dinas�Kelautan�dan�Perikanan�Daerah�Provinsi�Sulawesi�Tengah���������Marine�and�Fisheries�Goverment�Services�of�Sulawesi�Tengah�Province�
Catatan/Note����������:��1)�Tergabung�Dengan�Kabupaten�Induknya/�Include�in�main�regency���������������������������������������*)�Angka�sementara�
http
://sul
teng
.bps
.go.
id

Agriculture
Sulawesi Tengah in Figures 2014 263
Tabel�
Table� 6.5.9�Produksi�Ikan�Darat�Olahan�(ton)�menurut�Kabupaten/Kota,�2009�2013�Production�of�Shore�Preservative�Fish�(tons)�by�Regency/City�,2009�2013�
�
Jenis�Olahan�Kind�of�Preserved�Fish� 2009� 2010� 2011� 2012� 2013*)�
(1)� (2)� (3)� (4)� (5)� (6)�� � � � � �Pembekuan�Freezing�
�� � � � ��
Penggaraman�Salt�
�� 81,26 13,09 � ��
Pengasapan�Fumigation�
�� � � � ��
Pindang�Preserved�
�� � � � ��
Lainnya�Others�
�� 45,62 7,31 � ��
� �
Sulawesi�Tengah� �� 126,88� 20,40� �� ��
Sumber/Source� ���:� Dinas�Kelautan�dan�Perikanan�Daerah�Provinsi�Sulawesi�Tengah���������Marine�and�Fisheries�Goverment�Services�of�Sulawesi�Tengah�Province�
Catatan/Note����������:��1)�Tergabung�Dengan�Kabupaten�Induknya/�Include�in�main�regency���������������������������������������*)�Angka�sementara�� �
http
://sul
teng
.bps
.go.
id

Pertanian
264 Sulawesi Tengah Dalam Angka 2014
�
http
://sul
teng
.bps
.go.
id

Manufacturing
Sulawesi Tengah in Figures 2014 265
INDUSTRI, LISTRIK, DANAIR MINUM
Manufacture, Electricity, and Water Supply
http
://sul
teng
.bps
.go.
id

Perindustrian
266 Sulawesi Tengah Dalam Angka 2014
http
://sul
teng
.bps
.go.
id

Manufacturing
Sulawesi Tengah in Figures 2014 267
7.� PERINDUSTRIAN,�PERTAMBANGAN,ENERGI,�DAN�AIR�MINUM�
�7.�1.��Perindustrian����
Hasil� Survei� Industri� Besar� dan�Sedang� Tahun� 2012� menunjukkan� bahwa�jumlah� perusahaan� industri� besar� dan�sedang�sebesar�70�perusahaan�yang�aktif.�Penyerapan�tenaga�kerja�mencapai�8.909�orang� (tabel� 7.1.1).� Jenis� industri�terbanyak� adalah� industri� makanan,�minuman� dan� tembakau,� yakni� sebanyak�29�perusahaan.�
�Nilai� output� mencapai� 4,68� triliun�
rupiah� dengan� biaya� input� sebesar� 3,02�triliun� rupiah.� Nilai� output� terbesar�terdapat� pada� kelompok� industri�makanan,�minuman,�dan�tembakau�(Tabel�7.1.2�dan�Tabel�7.1.3).�
�7.2.�Pertambangan�
�Ketersediaan� sumber� daya� alam�
berupa� barang� tambang� baik� minyak�bumi� maupun� bukan� minyak� bumi�disajikan�pada�tabel�7.2.1�7.2.2.�
�7.3.��Energi�
�Sebagian� besar� kebutuhan� listrik� di�
Provinsi� Sulawesi� Tengah� dipenuhi� oleh�PT.� Perusahaan� Listrik� Negara,� dan�sebagian� lagi� masih� disuplai� oleh� para�pengusaha� listrik� non� PLN.� � Sampai�
7. INDUSTRY,� MINING,� ENERGI� AND�WATER�SUPPLY�
�7.�1.��Industry������ Based� on� BPS� Survey� of� Large� and�Medium� Industry� 2012,� there� were� 70�active� large� and� medium� manufacturing�industries.� Those� gave� contribution� to�employment� opportunities� were�accounted� 8,909� persons� (Table� 7.1.1).�The�most� industrial�enterprises�was� food,�beverages� and� tobacco� product� industry�by�25�enterprises.��� Output� value� reached� 4.68� trillion�rupiahs� with� input� cost� 3.02� trillion�rupiahs.� The� biggest� output� value�happened� to� food,� beverages,� and�tobacco�groups�(Table�7.1.2�and�7.1.3).���7.2.�Mining��
Availability�of�natural�resources�in�the�form�of�either�mineral�oil�or�petroleum� is�not�presented�in�tables�7.2.1�7.2.2���7.3.��Energy��
Most�of�electricity�use�in�Sulawesi�Tengah� Province� was� supplied� by� State�Electricity� Company� (PLN),� while� the� rest�produced� by� private� companies� (Non�PLN).�Since�2013,�PLN�could�not�serve�the�
http
://sul
teng
.bps
.go.
id

Perindustrian
268 Sulawesi Tengah Dalam Angka 2014
dengan� tahun� 2013,� belum� semua�wilayah� di� Sulawesi� Tengah� telah�tersambung� jaringan� PLN,� terutama�daerah�daerah� pelosok,� sehingga�sebagian� masyarakat� mengusahakannya�secara� swasembada� yaitu� melalui�perusahaan� non� PLN� yang� dikelola� oleh�Pemda�dan�swasta�lainnya.�
�Dilihat� dari� kelompok� pelanggan�
yang� ada� maka� kelompok� pelanggan�rumah� tangga� merupakan� pelanggan�dengan� jumlah�yang�paling�besar,�disusul�pelanggan� lainnya� (di� luar� rumah� tangga,�industri� dan� instansi),� sementara� untuk�instansi� dan� industri� menduduki� urutan�ketiga�dan�keempat.�
�7.�4.�Air�Minum��
Ketersediaan� air� bersih� yang� sehat�sangat� dibutuhkan� masyarakat.� Produksi�air� minum� di� Propinsi� Sulawesi� Tengah�selama� tahun� 2013� berjumlah� 24.424.993�m3� dengan� total� nilai� penjualan� sebesar�39.557.649�ribu�rupiah.�
�.�
�Dari� Tabel� 7.3.2� terlihat� bahwa�
jumlah� pelanggan� air� minum� di� Provinsi�Sulawesi� Tengah� tahun� 2013� telah�mencapai� 83.193� pelanggan.� Angka�tersebut� menunjukkan� peningkatan�jumlah� pelanggan� sebesar� 15,51� persen�dari� tahun� sebelumnya� yang� jumlahnya�sebesar�72.021�pelanggan.�
entire� regions� in� Sulawesi� Tengah�Province,� particularly� for� the� remote�spots.� In� relation� of� that,� Non�PLN�companies�emerged�to�produce�electricity�by� their� own� capacity,� for� example� those�managed�by� local�government,�and�other�private�parties.�
Based� on� the� existing� customer�groups,� the�most� customers�derived� from�household� group,� and� it� followed� by�groups� of� other� customers� (or� excluding�government� institution,� household� and�industry),� government� institution,� and�industry,�respectively.�����7.4.�Water�Supply��
Availability�of�healthful�clean�water�is�very�important�for�every�people.��Water�supply� production� in� Sulawesi� Tengah�Province� in� 2013� was� 24,424,993�m3�with�total� value� of� sale� reached� 39,557,649�thousands�rupiahs.�
.����In� 2013,� the� number� of� customers�
of� water� supply� in� Sulawesi� Tengah�Province� was� 86,890� customers,� as�presented� in� Table� 7.3.2.� � This� number� is�higher� than� a� previous� year� (72,021�customers),� or� underwent� sharply�increasing�15.51�percent.�
��
http
://sul
teng
.bps
.go.
id

Manufacturing
Sulawesi Tengah in Figures 2014 269
Jika� dilihat� berdasarkan� kelompok�pelanggan,� maka� banyaknya� pelanggan�terbesar� masih� didominasi� oleh� rumah�tangga� dengan� kontribusinya� sebesar�91,36� persen,� disusul� oleh� niaga� sebesar�4,92� persen,� dan� instansi� pemerintah�yaitu�1,98�persen.��
According� to� customer� group,� the�most� customers� was� households� with� its�contribution�by�91.36�percent,�followed�by�trade� group� with� its� contribution� 4.92�percent,�and�Goverment�Institution�group�by�1.98�percent.�
��
http
://sul
teng
.bps
.go.
id

Perindustrian
262 Sulawesi Tengah Dalam Angka 2014
http
://sul
teng
.bps
.go.
id

Manufacturing
Sulawesi Tengah in Figures 2014 271
PENJELASAN�KLASIFIKASI�INDUSTRI��
Classification�of�Manufacturing�Industry��
�
10,11�� INDUSTRI�MAKANAN,�MINUMAN,�DAN�TEMBAKAU��
� Manufacture�of�food,�beverages�and�tobacco��
12�� INDUSTRI�TEMBAKAU��
� Manufacture�of�tobacco��
13�� INDUSTRI�TEKSTIL� �
� Manufacture�of�tekstil�
16�� INDUSTRI�KAYU�DAN�BARANG�DARI�KAYU�(TIDAK�TERMASUK��
� PERABOT�RUMAH�TANGGA��DAN�BARANG�ANYAMAN�
� Manufacture�of�wood�and�wood�products�(not�including�furniture�and�souvenir)��
18,31,32��INDUSTRI�PENERBITAN,�PERCETAKAN�DAN�REPRODUKSI�MEDIA��
� REKAMAN�
� Manufacture�of�Publishing,�Offset,�and�Recording�Media�Reproduction��
22�� INDUSTRI�KARET,�BARANG�DARI�KARET�DAN�PLASTIK�
� Manufacture�of�Karet��
23�� INDUSTRI�GALIAN�BUKAN�LOGAM�
� Manufacture�of�Non�Metal�Quarrying��
http
://sul
teng
.bps
.go.
id

Perindustrian
272 Sulawesi Tengah Dalam Angka 2014
http
://sul
teng
.bps
.go.
id

Sulaw
Gam
Figu
JN
wesi Tengah in F
mbar�
ure� 7.1�
250�000
300�000
350�000
400�000
450�000
umlah�PelanggNumber�of�Cust
Figures 2014
Jumlah�PelangNumber�of�Ele2009���2013�
271�696
2009
anomers
ggan�Listrik�Provectrical�Power�C
286�702
2010
vinsi�Sulawesi�Customers� in�Su
333�861
2011
Tengah,�2009�–ulawesi�Tengah
353�976
2012
Manufactu
–�2013�h�Province,�
429�791
2013
uring
273
http
://sul
teng
.bps
.go.
id

Perindustrian
274 Sulawesi Tengah Dalam Angka 2014
http
://sul
teng
.bps
.go.
id

Manufacturing
Sulawesi Tengah in Figures 2014 275
7�.���INDUSTRI,�LISTRIK,�DAN�AIR�MINUM��INDUSTRY,�ELECTRICITY,�AND�WATER�SUPPLY��
7.1. �Industri�/�Industry�
�
Tabel�
Table� � 7.1.1�Banyaknya� Perusahaan� Industri� Besar/Sedang,� Tenaga� Kerja� dan�Pengeluaran�untuk�Tenaga�Kerja�menurut�Golongan�Industri,�2008�2012��Number� of� Large� and� Medium� Scale� of� Manufacturing� Establishments,�Workers�Engaged,�Labor�Cost�by�Industrial�Code,�2008�2012�
�(Diolah�dari�Survei�Industri�Besar/Sedang�Tahunan)�(Based�on�The�Annually�Large�and�Medium�Manufacturing�Establishment�Survey)�
Kode�Industri�Industrial�Code�
Banyaknya�PerusahaanNumber�of�
Establishment
Tenaga�Kerja���Workers�Engaged�(orang/�person)�
Pengeluaran�Total�untuk�Tenaga�Kerja�(ribuan)��
Total�Labor�Cost�(thousand)�
(1)� (2)� (3)� (4)�� � � � �
10,11� ���29� ��6�409� �139�353�136�12� ���2� ���40� �1�438�000�13� ���3� ���72� ��781�840�16� ���17� ��1�246� �15�675�033�
18,31,32� ���7� ���598� �9�287�198�22� ���0� ���0� ���0�23� ���12� ���544� �13�814�139�
� �� �� �� ��
Jumlah/Total� � � � �2�0�1�2*)� ���70� ��8�909� �180�349�346�2�0�1�1 70� �4�704� 67�082�009�2�0�1�0� 67� 4�472� 362�571�881�2�0�0�9� 52� 3�167� 96�201�284�2�0�0�8� 52� 3�759� 47�825�072�
http
://sul
teng
.bps
.go.
id

Perindustrian
276 Sulawesi Tengah Dalam Angka 2014
Tabel�
Table� 7.1.2�Nilai� Output� Industri� Besar/Sedang� menurut� Golongan� Industri� (ribu�rupiah),�2008�2012�Gross� Output� Value� of� Large� and� Medium� Scale� Manufacturing�Establishments�by�Industrial�Code�(thousand�rupiahs),�2008�2012�
��
(Diolah�dari�Survei�Industri�Besar/Sedang�Tahunan)�(Based�on�The�Annually�Large�and�Medium�Manufacturing�Establishment�Survey)�
Kode�Industri�Industrial�Code�
Barang�yang�Dihasilkan�Goods�Pro��Duced�
Jasa�Industri�yg�Dijual�
Sale�of�IndustryService�
Selisih�Nilai�Stok�Brg�½�
Jadi/��A�Different�Value�of�
Goods�Stock�of�Half�done
Penerimaandari�Jasa�Industri�Lainnya��Receipts�
from�Other�Industry�
Jumlah�Total�
(1)� (2)� (3)� (4)� (5)� (6)�
� � � � � �
10,11� 4�471�127�650� �195�856�977 ���177�375 �28�103�893 4�694�911�145�
12� �1�656�000� ���0 ��1�359�000 ���0 ��297�000�
13� �3�603�070� ���431 ��114�954 ���862 �3�719�317�
16� �97�089�739� ��970�942 �1�864�517 ��715�929 �100�641�127�
18,31,32� �23�358�305� �20�300�000 ���103�346 ��100�000 �43�654�959�
22� ���0� ���0 ���0 ���0 ���0�
23� �81�029�020� �2�360�001 �4�866�219 �338�903 �88�255�240�� �� � � ��
���Jumlah/Total� � �
2�0�1�2*)�� 4�677�863�784� �219�488�351 �5�205�969 �28�920�684 4�931�478�788�
2�0�1�1�� �1�877�283�377� 1�992�759 4�090�091 186�265�366 1�877�283�377�2�0�1�0�� 1�865�563�965� 17�322�569 8�988,89 569�892�254 2�461�784�083�
2�0�0�9� 2�178�262�818� 4�450�799 3�515�871 9�380�130 2�195�609�618�
2�0�0�8� 1�209�295�584� 5�408�200 2�663�524 1�176�584 1�218�543�892�
http
://sul
teng
.bps
.go.
id

Manufacturing
Sulawesi Tengah in Figures 2014 277
Tabel�
Table� 7.1.3�Nilai� Output,� Biaya� Input� dan� Nilai� Tambah� Menurut� Kode� Industri�Besar/Sedang,�menurut�Golongan�Industri�(ribu�rupiah),�2008�2012��Gross�Output�Value�of�Input�Cost�and�Value�Added�Large�and�Medium�Scale�Manufacturing� Establishment� by� Industrial� Code� (thousands� rupiahs),���2008�2012�
��
(Diolah�dari�Survei�Industri�Besar/Sedang�Tahunan)�(Based�on�The�Annually�Large�and�Medium�Manufacturing�Establishment�Survey)�
Kode�Industri�Industrial�Code�
Nilai�Output�Gross�Output�
Biaya�Input�Input�Costs�
Nilai�Tambah�Harga�Pasar�Value�Added�Market�Prices�
Pajak�Tak�Langsung�Indirect�Taxes�
Nilai�Tambah�Biaya�Antara�Value�Added�Factor�Costs�
(1)� (2)� (3)� (4)� (5)� (6)�� � � � � �
10,11� 4�698�004�598 2�907�491�964 1�790�512�634 �28�916�847� 1�761�595�787�12� �1�656�000 ��752�069 ��903�931 ��1�648� ��902�283�13� �3�719�317 �2�486�659 �1�232�658 ���0� �1�232�658�16� �99�125�643 �57�384�003 �41�741�640 ��303�581� �41�438�059�
18,31,32� �43�755�305 �9�110�131 �34�645�174 ��108�383� �34�536�791�22� ���0 ���0 ���0 ���0� ���0�23� �85�217�925 �45�403�908 �39�814�017 �2�874�952� �36�939�065�
� � � � �� ��
Jumlah�/�Total� � �
2�0�1�2*)�� 4�931�478�788 3�022�628�734 1�908�850�054 �32�205�411� 1�876�644�643�
2�0�1�1�� 1�877�283�377 �951�707�860 �925�576�516 �3�185�368� �922�391�148�
2�0�1�0� 2�461�784�083 825�747�063 1�636�037�020 4�892�330� 1�631�144�688�
2�0�0�9� 1�218�543�892 876�024�705 342�519�187 4�380�727� 338�138�460�
2�0�0�8� 2�195�609�618 1�820�185�378 375�424�242 4�974�173� 370�450�069�
�
� �
http
://sul
teng
.bps
.go.
id

Perindustrian
278 Sulawesi Tengah Dalam Angka 2014
7.2. Pertambangan/Mining�
�
Sumber�/Source� :�Dinas�Energi�dan�Sumber�Daya�Mineral�Daerah�Provinsi�Sulawesi�Tengah����Energy�and�Mineral�Resources�Goverment�Service�of�Sulawesi�Tengah�Province�
�
Tabel�
Table� 7.2.1�Banyaknya� Produksi� Nickel� dan� Pasir� Besi� menurut� Kabupaten/Kota�(Metrik�Ton),2009�2013�
Number�of�Productions�Nickel�and�Iron�Sand��by�Regency/City�(Metric�Tons),�2009�2013�
Kabupaten/Kota�Regency/City�
Nikel�Nickel�
Pasir�Besi��Iron�Sand�
(1)� (2)� (3)�� � �� � �
01.� Banggai�Kepulauan� �� ��02.� Banggai� ��680�226� ��03.� Morowali� �5�619�270� ��04.� Poso� �� ��05.� Donggala� �� ��06.� Tolitoli� �� ��07.� Buol� �� ��08.� Parigi�Moutong� �� ��09.� Tojo�Una�Una� �� 50�000�10.���Sigi� �� ��11.���Banggai�Laut� �� ��12����Morowali�Utara� �1�921�993� ��13.� Palu� �� ��� �� �Sulawesi�Tengah� � �
2�0�1�3� �8�221�489� 50�000�2�0�1�2� �10�648�543� ��2�0�1�1� �4�594�706� 100�000�2�0�1�0� �1�255�968� ��2�0�0�9� ����� ��
� � �
http
://sul
teng
.bps
.go.
id

Manufacturing
Sulawesi Tengah in Figures 2014 279
Sumber�/Source� :� Dinas�Energi�dan�Sumber�Daya�Mineral�Daerah�Provinsi�Sulawesi�Tengah��Energy�and�Mineral�Resources�Goverment�Service�of�Sulawesi�Tengah�Province�
� �
Tabel�
Table� 7.2.2�Banyaknya�Produksi�Minyak�Bumi�menurut�Triwulan,�2013�Number�of�Productions�Oil�by�Quarter,�2013�
Triwulan/Tahun�Quarter/Year�
Jenis�Tambang�Type�of�Mine�
Satuan�Unit�
Produksi�Production�
(1)� (2)� (3)� (4)�
Triwulan�I/2013� Minyak�Bumi�� Barrel� ��57�565�
Triwulan�II/2013� Minyak�Bumi�� Barrel� ��75�933�
Triwulan�III/2013� Minyak�Bumi�� Barrel� ��75�897�
Triwulan�IV/2013� Minyak�Bumi�� Barrel� ��133�498�
� � � �
http
://sul
teng
.bps
.go.
id

Perindustrian
280 Sulawesi Tengah Dalam Angka 2014
7.3. Energi/Energy��
�
Sumber�/Source� :� PLN�Cabang�Palu,�Luwuk,�Toli�Toli,��State�Electricity�Company,�Branch�Office�of�Palu,�Luwuk,�Toli�Toli,��
Catatan/Note��������:��1)�Tergabung�Dengan�Kabupaten�Induknya/�Include�in�main�regency
Tabel�
Table� 7.3.1�Banyaknya� Produksi,� Pemakaian� Bahan� Bakar� dan� Pelumas� pada� PLN�menurut�Kabupaten/Kota,�2009�2013�Number�of�Productions,�Fuel�Consumption�and�Lubricants�in�State�Electricity�Company�by�Regency/City,�2009�2013�
Kabupaten/Kota�Regency/City�
Produksi�Production�
(kwh)�
Pemakaian�BahanBakar�
Fuel�Consumption�(liter)�
Pelumas�Lubricants�
�(liter)�
(1)� (2)� (3)� (4)�� � � �
01.� Banggai�Kepulauan� 9�334�879� 2�891�850� �17�390�02.� Banggai� 110�074�906� 20�973�535� �38�722�03.� Morowali� 34�960�207� 1�359�988� �29�351�04.� Poso� 65�770�113� 3�227�932� �8�513�05.� Donggala� 14�082�133� 4�048�232� �7�507�06.� Tolitoli� 50�429�015� 13�337�626� �58�975�07.� Buol� 25�663�085� 7�590�740� �26�262�08.� Parigi�Moutong**)� �74�794� �29�962� ��469�09.� Tojo�Una�Una� 26�146�913� 7�000�321� �8�302�10.���Sigi*)� ...� ...� ...�11.���Banggai�Laut� 10�450�844� 3�254�792� �21�503�12.���Morowali�Laut� ...� ...� ...�13.� Palu� 490�641�256� 81�003�466� �106�073�
� � �Sulawesi�Tengah� � � �
2�0�1�3� 837�628�145� 144�718�444� �323�067�2�0�1�2� 690�323�993� 125�466�880� 244�352�2�0�1�1� 521�982�042� 112�525�063� 301�790�2�0�1�0� 348�366�234� 80�551�805� 430�165�2�0�0�9� 421�034�825� 30�379�381� ��������243�323�
� � � �
http
://sul
teng
.bps
.go.
id

Manufacturing
Sulawesi Tengah in Figures 2014 281
Tabel�
Table� 7.3.2�Jumlah�Gardu�dan�Pelanggan�PLN��menurut�Kabupaten/Kota,�2009�2013�Number�of��Transmissions�and�Customers�by�Regency/City,�2009�2013�
��
Kabupaten/Kota�Regency/City�
Jumlah�Gardu�Listrik�Number�of�Transmissions�
Jumlah�Pelanggan�Number�of�Customers�
(1)� (2)� (3)�� � �
01.� Banggai�Kepulauan� ��158� �10�283�02.� Banggai� ��433� �51�478�03.� Morowali� ��213� �24�047�04.� Poso� ��418� �47�401�05.� Donggala� ��438� �47�780�06.� Tolitoli� ��317� �36�787�07.� Buol� ��142� �17�298�08.� Parigi�Moutong� ��360� �38�206�09.� Tojo�Una�Una� ��156� �21�845�10.���Sigi� ...� ...�11.���Banggai�Laut� ...� �10�878�12.���Morowali�Utara1)� ...� ...�13.� Palu� ��960� �123�788�� � �
Sulawesi�Tengah� � �
2�0�1�3� �3�595� �429�791�2�0�1�2� 2�933� 353�976�2�0�1�1� 2�434� 333�861�2�0�1�0� 2�518� 286�702�2�0�0�9� ��������������2�293� 271�696�
Sumber�/Source� :� PLN�Cabang�Palu,�Luwuk,�Toli�Toli,�State�Electricity�Company,�Branch�Office�of�Palu,�Luwuk,�Toli�Toli,�
�Catatan/Note����������:��1)�Tergabung�Dengan�Kabupaten�Induknya/�Include�in�main�regency
http
://sul
teng
.bps
.go.
id

Perindustrian
282 Sulawesi Tengah Dalam Angka 2014
Tabel�
Table� � 7.3.3�Banyaknya� Pelanggan� Listrik� PLN� menurut� Kabupaten/Kota,���2009�2013�Number� of� Customers� of� PLN’s� Electrical� Power� by� Regency/City,���2009�2013�
��
Kabupaten/Kota�Regency/City�
Rumah�Tangga�
Household�
Industri�Industry�
Instansi�Institution�
Lainnya�Others�
Jumlah�Total�
(1)� (2)� (3)� (4)� (5)� (6)�� � � � � �
01.� Banggai�Kepulauan� ...� ...� ...� ...� �10�283�02.� Banggai� �44�660� ��11� ��431� �6�376� �51�478�03.� Morowali� �22�949� �� ��169� ��929� �24�047�04.� Poso� �44�698� ��8� ��543� �2�152� �47�401�05.� Donggala� �45�439� ��8� ��276� �2�057� �47�780�06.� Tolitoli� �34�402� ��16� ��213� �2�156� �36�787�07.� Buol� �16�459� �� ��145� ��694� �17�298�08.� Parigi�Moutong� �35�988� ��6� ��224� �1�988� �38�206�09.� Tojo�Una�Una� �20�493� ��5� ��191� �1�156� �21�845�10.���Sigi� ...� ...� ...� ...� ...�11.���Banggai�Laut� ...� ...� ...� ...� �10�878�12.���Morowali�Utara1)� ...� ...� ...� ...� ...�13.� Palu� �113�593� ��144� ��813� �9�238� �123�788�� � � � � �
Sulawesi�Tengah� � � � � �2�0�1�3� �378�681� ��198� �3�005� �26�746� �429�791�2�0�1�2� 329�772r) 185� 2�580� 21�439� 353�976�2�0�1�1� 310�760� 187� 2�583� 20�339� 333�861�2�0�1�0� 265�712� 190� 2�244� 18�556� 286�702�2�0�0�9� 196�697� 1�370� 1�783� 12�343� 271�696�
Sumber�/Source� :� PLN�CabangPalu,�Luwuk,�Toli�Toli�State�Electricity�Company,�Branch�Office�of�Palu,�Luwuk,�Toli�Toli,�
Catatan/Note����������:��1)�Tergabung�Dengan�Kabupaten�Induknya/�Include�in�main�regency
http
://sul
teng
.bps
.go.
id

Manufacturing
Sulawesi Tengah in Figures 2014 283
Tabel�
Table� 7.3.4�Produksi,� DayaTerpasang� dan� Penggunaan� Listrik� PLN� menurut�Kabupaten/Kota,�2008�2012�Electricity� Production,� Installed� Capacity� and� Use� of� PLN’s� Electrical�Power�by�Regency/City,�2008�2012�
�
Kabupaten/Kota�Regency/City�
Produksi�Electricity�Production�
(kWh)�
Daya�Terpasang�Installed�Capacity�(MVA)�
Terjual�Electricity�
Sold�(kWh)�
Nilai�Terjual�
Sold�Value�(Ribu�Rp.)�
(1)� (2)� (3)� (4)� (5)�� � � � �
01.� Banggai�Kepulauan� �9�334�879� ...� ...� ...�02.� Banggai� �110�074�906� ��32�023� �79�847�903� ��58�116�03.� Morowali� �34�960�207� ��23�926� �33�887�861� �24�087�983�04.� Poso� �65�770�113� ��40�717� �53�992�986� �38�506�039�05.� Donggala� �14�082�133� ��30�882� �41�920�951� �25�700�238�06.� Tolitoli� �50�429�015� ��21�616� �46�554�025� �31�502�000�07.� Buol� �25�663�085� ��9�040� �21�133�288� �13�753�000�08.� Parigi�Moutong� ��74�794� ��28�443� �49�162�810� �31�995�129�09.� Tojo�Una�Una� �26�146�913� ...� ...� ...�10.���Sigi� ...� ...� ...� ...�11.���Banggai�Laut� �10�450�844� ...� ...� ...�12.���Morowali�Utara1)� ...� ...� ...� ...�13.� Palu� �490�641�256� ��180�346� �347�550�192� �283�421�574�� � � � �
Sulawesi�Tengah� � � � �
2�0�1�3� �837�628�145� ��366�993� �674�050�016� �449�024�079�2�0�1�2� 690�324�043� 241�331� 611�979�828� ���340�093�669�2�0�1�1� 521�982�042� 290�402� 506�213�842� 343�661�807�2�0�1�0� 348�366�234� 252�364� 474�191�477� 255�613�026�2�0�0�9� 421�034�825� 214�787� 401�706�597� 268�267�069�
Catatan/Note����������:��1)�Tergabung�Dengan�Kabupaten�Induknya/�Include�in�main�regency
http
://sul
teng
.bps
.go.
id

Perindustrian
284 Sulawesi Tengah Dalam Angka 2014
LanjutanTabel�/�Continued�Table�7.3.4�
�
Kabupaten/Kota�Regency/City�
Dikonsumsi�Sendiri�Self�
Consumed�(kWh)�
S�u�s�u�t�Transmisi�
Transmission�Decrease�
(kWh)�
S�i�s�a�Produksi�Rest�of�
Production�(kWh)�
(1)� (6)� (7)� (8)�
� � � �
01.� Banggai�Kepulauan� ...� ...� ...�
02.� Banggai� ...� ...� ...�
03.� Morowali� ��487�322� ��807�581� ���246�483�
04.� Poso� ��643�616� �1�519�290� �9�573�504�
05.� Donggala� ��73�612� ��325�297� ��28�268�609�
06.� Tolitoli� �1�116�636� ��29�587� �2�707�151�
07.� Buol� ...� ...� ...�
08.� Parigi�Moutong� ��1�870� ��1�728� ��49�120�057�
09.� Tojo�Una�Una� ...� ...� ...�
10.���Sigi� ...� ...� ...�
11.���Banggai�Laut� ...� ...� ...�
12.���Morowali�Utara1)� ...� ...� ...�
13.� Palu� �3�072�331� �11�333�813� �128�504�574�� � � �
Sulawesi�Tengah� � � �2�0�1�3� �5�395�387� �14�017�296� �63�150�080�
2�0�1�2� 4�877�136� 10�712�146� 90�006�099�
2�0�1�1� 2�525�091� 8�020�299� 90�006�099�
2�0�1�0� 2�067�144� ...� 377�115�712�
2�0�0�9� 47�196�270� 4�773�091� …�
Sumber�/Source� :� PLN�Cabang�Palu,�Luwuk,�Tolitoli,��State�Electricity�Company,�Branch�Office�of��Palu,�Luwuk,�Tolitoli�
Catatan/Note����������:��1)�Tergabung�Dengan�Kabupaten�Induknya/�Include�in�main�regency
http
://sul
teng
.bps
.go.
id

Manufacturing
Sulawesi Tengah in Figures 2014 285
7.4. Air�Minum/Water�Supply�
Tabel�Table� � 7.4.1�
Banyaknya�Produksi�Air�Minum�menurut�Kabupaten/Kota,�2009�2013�Number�of�Water�Supply�Productions�by�Regency/City,�2009�2013�
��(DiolahdariSurveiTahunan�Perusahaan�Daerah�Air�Minum)�(Based�on�The�Annually�Regional�Water�Supply�Enterprise�Survey)�
Kabupaten/Kota�Regency/City�
Produksi�Production�
(m3)�
Yang�dijual�S�o�l�d�(m3)�
Nilai�yang�Terjual�
Sold�Value�(�000�Rp�)�
(1)� (2)� (3)� (4)�� � � �
01.� Banggai�Kepulauan� 1�722�688� 1�263�868� 2�223�995�02.� Banggai� 6�402�530� 6�402�530� 5�748�351�03.� Morowali� 1�090�983� �487�412� �524�094�04.� Poso� 1�947�345� �185�658� �569�664�05.� Donggala� �288�732� �288�732� �462�359�06.� Tolitoli� 2�820�600� 2�686�284� 8�693�233�07.� Buol� �526�008� �526�008� �821�664�08.� Parigi�Moutong� 1�067�504� �699�446� �976�153�09.� Tojo�Una�Una� ...� ...� 2�856�700�10.��Sigi1)� ...� ...� ...�11.��Banggai�Laut1)� ...� ...� ...�12.��Morowali�Utara1)� ...� ...� ...�13.� Palu� 8�558�603� 5�535�188� 16�681�435�� � � �
Sulawesi�Tengah� � � �2�0�1�3� 24�424�993� 18�075�126� 39�557�649�2�0�1�2� ...� ...� ...�2�0�1�1� 27�195�278� 12�744�393� 21�147�455�2�0�10� 24�768�850� 16�816�583� 31�146�080�2�0�0�9� 26�671�541� 16�534�700� 30�153�497�
Catatan/Note����������:��1)�Tergabung�Dengan�Kabupaten�Induknya/�Include�in�main�regency
http
://sul
teng
.bps
.go.
id

Perindustrian
286 Sulawesi Tengah Dalam Angka 2014
Tabel�
Table� 7.4.2�Banyaknya� Pelanggan� Perusahaan� Air� Minum� menurut�Kabupaten/Kota,�2009�2013�Number� of� Consumers� of�Water� Supply� Enterprise� by�Regency/City,�2009�2013�
�(Diolah�dari�Survei�Tahunan�Perusahaan�Daerah�Air�Minum)�(Based�on�The�Annually�Regional�Water�Supply�Ent�erprise�Survey)�
Kabupaten/Kota�Regency/City�
Rumah�Tangga�House��hold�
Sosial�Social�
InstansiPemerin�
tah�Govern�ment�
Institution
Niaga�Trade�
Industri�Industry�
Khusus�Special�
Jumlah�Pelang��
gan�Number�of�Consumers�
(1)� (2)� (3)� (4)� (5)� (6)� (7)� (8)�� � � � � � � �
01.� Banggai�Kepulauan� �6�598� ��144� ��140� ��359� ��12� ��2� �7�255�02.� Banggai� �12�704� ��254� ��289� �1�202� ��32� ��5� �14�486�03.� Morowali� �2�194� ��56� ��75� ��86� �� ��1� �2�412�04.� Poso� �7�610� ��161� ��382� ��346� ��23� �� �8�522�05.� Donggala� �1�115� ��21� ��57� ��42� �� �� �1�235�06.� Tolitoli� �11�329� ��177� ��161� ��840� �� ��3� �12�510�07.� Buol� �1�962� ��26� ��84� ��199� �� �� �2�271�08.� Parigi�Moutong� �1�986� ��46� ��59� ��32� �� �� �2�123�09.� Tojo�Una�Una� �7�693� ��25� ��199� ��157� ��2� ��86� �8�162�10.��Sigi1)� � � � � � � �11.��Banggai�Laut1)� � � � � � � �12.��Morowali�Utara1)� � � � � � � �13.� Palu� �22�811� ��328� ��199� ��829� ��45� ��5� �24�217�� � � � � � � �Sulawesi�Tengah� � � � � � � �
2�0�1�3� �76�002� �1�238� �1�645� �4�092� ��114� ��102� �83�193�2�0�1�2� 70�830� 1�821� 2�884� 3�813� ...� 20� 72�021�2�0�1�1� 65�544� 1�203� 1�668� 3�488� 84� 33� 62�618�2�0�1�0�� 64�928� 4�242� 3�125� 10�663� 76� 48� 83�082�2�0�0�9� 60�306� 1�233� 1�376� 2�721� 351� 71� 66�065�
Catatan/Note����������:��1)�Tergabung�Dengan�Kabupaten�Induknya/�Include�in�main�regency
http
://sul
teng
.bps
.go.
id

Trading
Sulawesi Tengah in Figures 2014 287
PERDAGANGANTrade
http
://sul
teng
.bps
.go.
id

Perdagangan
288 Sulawesi Tengah Dalam Angka 2014
http
://sul
teng
.bps
.go.
id

Trading
Sulawesi Tengah in Figures 2014 289
8.��PERDAGANGAN��
Nilai� ekspor� Sulawesi� Tengah� turun�dari� US$� 362,38� juta� pada� tahun� 2012�menjadi� US$� 297,14� juta� pada� tahun�2013�atau� turun�sekitar�18,00�persen.�Di�sisi�lain�nilai�impor�Sulawesi�Tengah�pada�tahun�2013,�naik�dari�US$�3,44�juta�tahun�2012� menjadi� US$� 186,00� juta� tahun�2013.��
�Komoditi� ekspor� utama� pada� tahun�
2013� adalah� biji� kerak� dan� abu� logam�dengan� volume� perdagangan� sebesar�12,87� juta� ton� lebih� yang� nilainya�mencapai�US$�220,92�juta.��
�Negara�negara� tujuan� ekspor� yang�
mendominasi� komposisi� ekspor� Sulawesi�Tengah� adalah� Malaysia,� Korea� Selatan�dan� Cina.� Nilai� ekspor� ke� ketiga� negara�tersebut� mencapai� 94,59� persen� dari�total�ekspor�pada�tahun�2013.�
�Beras� yang� disalurkan� oleh� Dolog�
pada� tahun� 2013� dibandingkan� dengan�tahun� anggaran� yang� lalu� turun� sebesar�54,29� persen,� yakni� dari� 39,15� ribu� ton�menjadi�60,40�ribu�ton.�
��������
8.�TRADE��Export� of� Sulawesi� Tengah� decreased�
around� 18.00� percent� from� US$� 362.38�million� in� 2012� to� US$� 297.14�million� in�2013.� Mean� while,� import� of� Sulawesi�Tengah� in� 2013� increased� US$� 3.44�millions� of� year� 2012� to� US$� 186.00�million�in�2013.�
��
Ore,� Crust,� and� Abu�Metal� was� primary�commodity� of� export� in� 2013,� with�volume� by� � 12.87� million� tons� and� the�value�reached�US$�220.92�million�
��The� destination� countries� who�
dominated� the� export� composition� of�Sulawesi�Tengah�were�Malaysia,�Republic�of�Korea�and�China.�Export�value�of�those�three� countries� reached�94.59�percent�of�total�exports�in�2013.�
�In� 2013,� rice� distribution� by� Dolog�
(ware� house� for� food� stuff)� increased�54.29�percent�of�a�previous�year,�or�from�39.15� thousand� tons� to� 60.40� thousand�tons.���
�
http
://sul
teng
.bps
.go.
id

Perdagangan
290 Sulawesi Tengah Dalam Angka 2014
http
://sul
teng
.bps
.go.
id

Su
JuJu
lawesi Tengah in
Gambar
Figure�
320
0
50
100
150
200
250
300
350
400
450
20
utaan�/�Millions
276
0
50
100
150
200
250
300
350
400
450
20
utaan�/�Millions
n Figures 2014
r�8.1� Per
Tren
0,88
2
008 2
s
6,10
4
009 2
s
rkembangan�Nend�of�the�Trade
276,10
2009
23,26
2010
eraca�Perdagane�Banlance,�200
423,26
2010
373,18
2011
ngan�,�2009�20109�2013,�(US$)
373,18
2011
358,94
2012
Tra
13(US$)�
358,94
2012
111,15
2013
ading
291
http
://sul
teng
.bps
.go.
id

Perdagangan
292 Sulawesi Tengah Dalam Angka 2014
http
://sul
teng
.bps
.go.
id

Trading
Sulawesi Tengah in Figures 2014 293
8. PERDAGANGAN�/�TRADE��
�
Tabel�Table� 8.1�
Volume�dan�Nilai�Ekspor�Menurut�Jenis�Komoditi,�2013�Export�Volume�and��the�Value�by�Type�of�Commodity,�2013�
��(Diolah�dari�Dokumen�Pemberitahuan�Ekspor�Barang�(PEB)�KPPBC)��
JenisKomoditi�Type�of�Commodity�
Volume�Volume��(�000�
Ton)�
Nilai/Value�FOB�
(�000�000�US�$)�(1)� (2)� (3)�
� �
�01� Ikan�dan�Udang/Fish�and�Shrimp� 0,51 2,36
02� Produk�hewani/Animal�Products� - -
03� Hasil�penggilingan/Results�Milling� 0,04 0,05
04� Biji�bijian�berminyak/Grains�Oily� - -
05� Lak,Getah,�dan�Damar/Lac,Gum�and�Damar� 1,40 1,11
06� Bahan�bahan�nabati/Vegetable�Ingredients� - -
07� Lemak�&�minyak�hewan/nabati/Fats�and�oils�of�Animal/Vegetable�
- -
08� Biji�Kakao/Cocoa�Beans� 20,75 46,20
09� Bijih,�Kerak,�dan�Abu�logam/Ore,�Crust,�and�Abu�Metal� 12 874,21 220,92
http
://sul
teng
.bps
.go.
id

Perdagangan
294 Sulawesi Tengah Dalam Angka 2014
LanjutanTabel�/�Continued�Table�:�8.1����
JenisKomoditi�Type�of�Commodity�
Volume�/�Volume(000�Ton)�
Nilai/Value�FOB�(�000�000�
US$)�(1)� (2)� (3)�
� �10� Bahan�bakar�mineral/Mineral�Fuels� 29,42 21,61
11� Minyak�atsiri,�Kosmetik�wangi�wangian/Essensial�Oils,�Perfumes�Cosmetics�
- -
12� Kayu,�Barang�dari�Kayu/Wood�and�Articles�of�Wood� 0,03 0,40
13� Perabot,�penerangan�rumah/Furniture,�Home�Lighting�
3,27 4,36
14� Olahan�dari�tepung/Preparitions�of�flour� 0,11 0,01
�
Jumlah�/�Total� 12�929,83� 297,14�
����
http
://sul
teng
.bps
.go.
id

Trading
Sulawesi Tengah in Figures 2014 295
���
Tabel�Table� � 8.2�
Volume�dan�Nilai�Ekspor�menurut�Negara�Tujuan,�2012–�2013�Export�Volume�and��Value�by�Destination�Country,�2012�–�2013�
��
(Diolah�dari�Dokumen�Pemberitahuan�Ekspor�Barang�(PEB)�KPPBC)�
Negara�Tujuan�Country�of�Destination�
Volume�/�Volume��(000�Ton)�
Nilai��/�Value��FOB��(�000�000�US$)�
2012� 2013� 2012� 2013�(1)� (2)� (3)� (4)� (5)�
� � � � �
Malaysia� 32,23� 17,32 63,96� 38,84�
Singapore� 202,31� 3,56 35,91� 7,58�
Cina� 8�287,92� 12 675,59 216,25� 219,22�
United�States� 0,21� 0,34 1,37� 1,62�
France� 0,76� 0,52 1,44� 0,90�
Japan� 0,97� 0,82 1,64� 1,54�
Vietnam� 0,01� 0,05 0,02� 0,05�
Republic�of�Korea� 0,98� 30,64 1,34� 23,03�
Belgium� 0,10� 0,06 0,23� 0,14�
Hong�Kong� 132,02� 145,14 3,55� 1,98�
Taiwan� 0,19� 0,07 0,24� 0,06�
Lainnya/Others� 33,02� 55,72 36,42� 2,20�
Jumlah/Total� 8�9690,73� 12 929,83 362,38� 297,14�
� � � �
http
://sul
teng
.bps
.go.
id

Perdagangan
296 Sulawesi Tengah Dalam Angka 2014
�(Diolah�dari�Dokumen�Pemberitahuan�Ekspor�Barang�(PEB)�KPPBC)�
PelabuhanMuat�Loading�Port��
Volume�/�Volume��(�000�Ton)�
Nilai��/�Value��FOB��(�000�000�US$)�
2012� 2013� 2012� 2013�(1)� (2)� (3)� (4)� (5)�
1. Pantoloan� 48,70� 18,06� 93,41� 38,77�
2. L�o�l�i� 0,08� 6,09� 0,13� 12,30�
3. Luwuk� 1�202,95� 1�340,97� 25,04� 20,52�
4. Poso� 510,14� �� 55,14� �
5. Kolonodale� 6�926,91� 11�562,66� 184,73� 222,02�
6. Banggai� 0,02� 0,02� 0,05� 0,04�
7. Lainnya� 1,93� 2,03� 3,90� 3,50�
Jumlah/Total� 8�690,73� 12�929,83 362,38� 297,14�
Tabel�Table� 8.3�
Volume�dan�Nilai�Ekspor�menurut�Pelabuhan�Muat,�2012–�2013�Export�Volume�and��Value�by�Loading�Port,�2012�–�2013�
http
://sul
teng
.bps
.go.
id

Trading
Sulawesi Tengah in Figures 2014 297
Tabel�Table� � 8.4�
Volume�dan�Nilai�Impor�menurut�Negara�Asal,�2012–�2013�Import�Volume�and��Value�by�Country�Origin,�2012�–�2013�
�(Diolah�dari�Dokumen�Pemberitahuan�Ekspor�Barang�(PEB)�KPPBC)�
Negara�Asal�Country�Origin�
Volume�/�Volume��(�000�Ton)�
Nilai�/�Value��CIF��(�000�000�US$)�
2012� 2013� 2012� 2013�
(1)� (2)� (3)� (4)� (5)�� �
1.� Vietnam� �� �� �� ��
2.� China� �� 2,14� �� 6,62�
3.� Malaysia� 1,03� 3,46� 0,64� 4,65�
4.� United�States� �� �� 0,74� ��
5.� Singapore� 1,00� 1,32� 0,77� 4,16�
6.� Korea�Selatan� 2,00� 7,38� 1,28� 16,35�
7.� India� �� �� �� ��
8. Taiwan� 0,01� �� 0,01� ��
9. Lainnya� ...� 1,42� ...� 154,22�
Jumlah/Total� 4,04� 15,73� 3,44� 186,00�
�
http
://sul
teng
.bps
.go.
id

Perdagangan
298 Sulawesi Tengah Dalam Angka 2014
Tabel�Table� � 8.5�
Volume�dan�Nilai�Impor�menurut�Pelabuhan�Bongkar,�2012–2013�Import�Volume�and��Value�by�Unloading�Port,�2012�–�2013�
�(Diolah�dari�Dokumen�Pemberitahuan�Ekspor�Barang�(PEB)�KPPBC)�
Pelabuhan�Bongkar�Unloading�Port�
Volume�/�Volume��(�000�Ton)�
Nilai��/�Value��CIF��(�000�000�US$)�
2012� 2013� 2012� 2013�(1)� (2)� (3)� (4)� (5)�
� � � � �
1. Luwuk� �� 2,28� �� 170,53�
2. Toli�Toli� �� �� �� ��
3. Mutiara�(�Palu)� �� �� 0,74� ��
4. Poso� �� �� �� ��
5. Pantoloan� 4,04� 13,45� 2,70� 15,47�
� � � � �
Jumlah/Total� 4,04� 15,73� 3,44� 186,00�
�
http
://sul
teng
.bps
.go.
id

Trading
Sulawesi Tengah in Figures 2014 299
Tabel�Table� � 8.6�
Perkembangan�Nilai�Ekspor�–�Impor�,�2009�–�2013�Trend�of�Export�and�Import�Value,�2009�–�2013�
�(�000�000�US�$)�
�(Diolah�dari�Dokumen�Pemberitahuan�Ekspor�Barang�(PEB)�KPPBC)�
Tahun�Year�
Nilai�Ekspor�Export�Value�
NilaiImpor�Import�Value�
(1)� (2)� (3)�� � �
2009� 289,05� 12,95�
2010� 441,92� 18,66�
2011� 386,33� 13,15�
2012� 362,38� 3,44�
2013� 297,14� 186,00�
� � �
http
://sul
teng
.bps
.go.
id

Perdagangan
300 Sulawesi Tengah Dalam Angka 2014
Tabel�
Table� 8.7�Penyaluran� Beras� Kepada� Golongan� Anggaran/Non� Anggaran�menurut�Bulan�dan�Kabupaten/Kota,�2008–�2013�(Ton)�
Rice� Distribution� of� Budgetary/non� Budgetary� Groups� by�Month� and�Regency/City,�2008–�2013�(Ton)��
��
Bulan�Month� Banggai� Poso� Tolitoli� Palu� Sulteng�
���(1)� (2)� (3)� (4)� (5)� (6)�� � � � � �
Januari/January� ��6,29� ��2,30� ��757,44� ��239,36� �1�005,38�
Februari/February� ��822,51� ��546,63� ��76,50� �2�042,55� �3�488,18�
Maret/March� ��399,97� ��757,36� ��604,86� �1�331,04� �3�093,22�
April/April� �1�062,51� �1�224,86� �1�074,59� �2�109,19� �5�471,14�
Mei/May� �1�134,60� �1�587,66� ��2,78� �2�783,80� �5�508,83�
Juni/June� �1�146,37� �1�058,36� �1�714,33� �1�703,24� �5�622,29�
Juli/July� �1�131,33� �1�908,92� ��299,07� �3�584,65� �6�923,97�
Agustus/August� ��2,36� ��13,44� ��26,92� ��667,22� ��709,95�
September/September� �1�708,67� �2�266,21� ��798,80� �2�684,37� �7�458,05�
Oktober/October� ��1,52� ��799,19� ��816,18� �1�940,99� �3�557,87�
November/November� �1�137,98� ��133,62� ��7,27� �2�112,49� �3�391,36�
Desember/December� ��3,27� ��10,98� ��9,51� ��47,50� ��71,26�
Januari�–�Desember�January���December� �8�557,37� �10�309,50� �6�188,22� �21�246,40� �46�301,48�
2012� �6�891,41� �8�844,32� �5�655,54� �18�290,85� �39�682,12�
2011� 7�957,41� 7�681,16� 5�184,63� 27�031,10� 47�854,30�
2010� 5�260,00� 4�457,70� 3�062,70� 4�121,90� 12�168,30�
2009� 6�494,92� 7�207,96� 4�941,87� 18�138,46� 36�783,31�
2008� 6�110,39� 9�804,52� 5�736,96� 17�091,62� 38�743,48�
Sumber/Source:�Perum�Bulog�Devisi�Regional�Provinsi�Sulawesi�Tengah�Public�Company�of�Warehouse�for�Foodstuff�Division�of�Ragional�Sulawesi�Tengah�Province�
�
http
://sul
teng
.bps
.go.
id

Trading
Sulawesi Tengah in Figures 2014 301
Tabel�
Table� 8.8�Perkembangan�Penyaluran� Beras� di� Provinsi� Sulawesi� Tengah,� 2008�2013�Progress� of� Prices� and� Rice� Distribution� in� Sulawesi� Tengah� Province,�2008�2013�
�
Bulan�Month�
Stok�Awal�Original�Stock��(Ton)�
Pengadaan�Lokal�Local�
Supplying��(Ton)�
Pengadaan�dari�Divre�
Lain��Other�Division�Supplying�
(Ton)�
Impor�Import�(Ton)�
Penyaluran�Distribu�tion�
(Ton)�
Stok�Akhir�Final�Stock�
(Ton)�
(1)� (2)� (3)� �(4)� (5)� (6)� (7)�Januari/January� 28�061 �35 �� �� 1�505� 26�591�
Februari/February� 26�591 �120 �937 �� 4�488� 23�159�
Maret/March� 23�159 �� �563 �� 3�593� 20�130�
April/April� 20�130 2�971 �800 �� 7�271� 16�630�
Mei/May� 16�630 10�291 1�252 �� 5�509� 22�664�
Juni/June� 22�664 9�077 1�292 �� 8�122� 24�909�
Juli/July� 24�909 3�686 �956 �� 6�924� 22�628�
Agustus/August� 22�628 1�675 �500 �� �710� 24�093�
September/September� 24�093 3�070 2�003 �� 12�458� 16�707�
Oktober/October� 16�707 7�599 1�114 �� 4�558� 20�863�
November/November� 20�863 5�311 1�854 �� 5�191� 22�837�
Desember/December� 22�837 3�319 �828 �� �71� 26�913�Januari�–�Desember�January���December� 269�272 47�154 12�100 �� 60�401� 268�124�
2012� 178�178 30�875 20�842 �� 39�151� 190�785�
2011� 153�871 14�667 22�721 22�662 49�180� 164�742�
2010� �����95�176 ��5�855 � 9�400 35�924� 89�040�
2009� ���191�240 �������10�592 5�100 �� 36�783� 10�691�
2008� 201�175 �38�871� �19�356� �� 47�816� 24�939��
� �
Sumber/Source:�Perum�Bulog�Devisi�Regional��Provinsi�Sulawesi�Tengah�Public�Company�of�Warehouse�for�Food�stuff�Division�of�Regional�Sulawesi�Tengah�Province�
��
http
://sul
teng
.bps
.go.
id

Perdagangan
302 Sulawesi Tengah Dalam Angka 2014
Tabel�
Table� � 8.9�Penyaluran� Beras� Miskin� (Raskin)� oleh� Perum� BULOG� Divre���Sulawesi�Tengah,�2013�Distribution� of� Rice� for� Poor� People� (Raskin)� by� Public� Enterprise�Warehouse� for� Foodstuff� (BULOG)� Division� of� Regional� Sulawesi�Tengah,�2013�
�
Kabupaten/Kota�Regency/City�
Rumah�Tangga�Miskin�Poor�Household�
Pagu/kg�Limit�of�use/kg�
(1)� (2)� (3)�� � �
01.�Banggai�Kepulauan� �12�329� �184�935�02.�Banggai� �25�441� �381�615�03.�Morowali� �14�895� �223�425�04.�Poso� �17�980� �269�700�05.�Donggala� �23�339� �350�085�06.�Tolitoli� �16�524� �247�860�07.�Buol� �9�837� �147�555�08.�Parigi�Moutong� �12�390� �185�850�09.�Tojo�Una�Una� �36�537� �548�055�10.�Sigi� �18�276� �274�140�11.�Banggai�Laut1)�
…� …�12.Morowali�Utara1)� …� …�13.�Palu� �13�673� �205�095�
� � �
Jumlah� �201�221� 3�018�315�
Sumber/Source:�Perum�Bulog�Devisi�Regional��Provinsi�Sulawesi�Tengah/�Public�Company�of�Warehouse�for�Foodstuff�Division�of�Ragional�Sulawesi�Tengah�Province�
���Catatan/Note���:��1)�Tergabung�Dengan�Kabupaten�Induknya/�Include�in�main�regency�
�
http
://sul
teng
.bps
.go.
id

Trading
Sulawesi Tengah in Figures 2014 303
Tabel�
Table� � 8.10�Jumlah� Stasiun� Pengisian� Bahan� Bakar� Umum� (SPBU)� di� Provinsi��Sulawesi�Tengah,�2009�2013�Number�of�Fuel�Filling�Stations�General� (gas� stations)� in�Sulawesi�Tengah�Province,�2009�2013�
�
Kabupaten/Kota�Regency/City�
Jumlah�Number�
(1)� (2)�� �
01.�Banggai�Kepulauan� 1�02.�Banggai� 7�03.�Morowali� 4�04.�Poso� 6�05.�Donggala� 4�06.�Tolitoli� 3�07.�Buol� 2�08.�Parigi�Moutong� 10�09.�Tojo�Una�Una� 1�10.�Sigi� 1�11.�Banggai�Laut1)� …�
12.�Morowali�Utara1)� …�
13.�Palu� 15� �
Sulawesi�Tengah� �2013� 54�2012� 53�2011� 53�2010� 48�2009� 46�
� �
Sumber/Source� :� Dinas�Koperasi,�UMKM,�Perindustrian,�dan�Perdagangan�Daerah�Provinsi�Sulawesi�Tengah�� � Govt.of�Cooperative,�UMKM�(Micro,�Small�and�Medium�Scale�Establishments),�
Manufacturing,�and�Trading�in�Sulawesi�Tengah�Province�Catatan/Note�����:����1)�Tergabung�Dengan�Kabupaten�Induknya/�Include�in�main�regency�
http
://sul
teng
.bps
.go.
id

Perdagangan
304 Sulawesi Tengah Dalam Angka 2014
��
http
://sul
teng
.bps
.go.
id

Transportation, Post, and Telecommunication
Sulawesi Tengah in Figures 2014 305
TRANSPORTASI, POS DAN TELEKOMUNIKASI
Transportation, Post , and Telecommunication
http
://sul
teng
.bps
.go.
id

Transportasi, Pos, dan Telekomunikasi
306 Sulawesi Tengah Dalam Angka 2014
http
://sul
teng
.bps
.go.
id
Transportation, Post, and Telecommunication
Sulawesi Tengah in Figures 2014 307
9.���TRANSPORTASI,�POS�DAN��TELEKOMUNIKASI�
�9.�1.�Panjang�Jalan�
�Untuk� mendukung� kelancaran� arus�
perekonomian� daerah,� perlu� tersedia�sarana� transportasi� yang� memadai�sehingga� arus� lalu� lintas� baik� kendaraan��bermotor� maupun� kendaraan� tidak�bermotor�yang�digunakan�untuk�kegiatan�ekonomi�dapat�beroperasi�dengan�baik.�
�Provinsi� Sulawesi� Tengah� dengan�
wilayah� yang� cukup� luas� membutuhkan�sarana� jalan� dalam� upaya� menembus�daerah�daerah� yang� masih� terisolir.�Dengan�demikian�potensi�perekonomian,�khususnya�hasil�hasil�pertanian�yang�ada�di�Sulawesi�Tengah�dapat�dengan�segera�dipasarkan.�Usaha�ke�arah�tersebut�dapat�dilihat� dengan� makin� bertambahnya�panjang� jalan� yang� ada� di� Sulawesi�Tengah� dari� tahun� ke� tahun.�Perkembangan� sektor� perhubungan�tersebut,� khususnya� mengenai� kondisi�dan� panjang� jalan� yang� ada� di� Sulawesi�Tengah� dapat� dilihat� pada� Tabel� 9.1.1.�s.d.�9.1.2.�
�9.�2.�Angkutan�Darat�
�Armada� angkutan� darat� yang�
beroperasi� disajikan� pada� tabel� 9.2.1�yang� memperlihatkan� jumlah� kendaraan�bermotor� wajib� uji� di� Sulawesi� Tengah.�
9.��TRANSPORTATION,�POST�AND�TELECOMMUNICATION�
�9.1.�Length�of�Roads��
In� order� to� support� regional�economic� development� needs� supplying�good� transportation� infrastructures� so�that� the� traffic� flow� for� either� motor� or�non�motor� vehicles� will� not� find� any�obstacles,� thus,� the� economic� activities�can�run�well.�
�Sulawesi�Tengah�Province�which�has�
large� area� needs� road� infrastructures� to�reaching� isolated� regions.� Therefore� the�potencies� of� economic,� especially�agriculture� products� from� Sulawesi�Tengah� Province,� can� be� soon� spread�over� the� markets� as� well� as� inside� and�outside�Sulawesi�Tengah.�Many�efforts�to�this� aim� have� been� done� by� regional�government,� it� seen� from� more� added�length�of� roads� in�Sulawesi�Tengah� from�year� to� year.� Transportation� sector�development,� in� particular� about�condition� and� length� of� roads� are�presented�in�Tables�9.1.1�to�9.1.2.�
��
�9.2.��Land�Transportation��
Table� 9.2.1� presents� data� of� land�transportations�which�still�have�operated.�This� table� shows� the� number� of�obligatory� test� of� motor� vehicles� in�
http
://sul
teng
.bps
.go.
id

Transportasi, Pos, dan Telekomunikasi
308 Sulawesi Tengah Dalam Angka 2014
Jumlah� kendaraan� bermotor� tahun� 2013 �tercatat� sejumlah� 18.264� buah� yang�terdiri� atas� mobil� penumpang� sebanyak�1.278� buah,� bis� sebanyak� 3.272� buah,�mobil� barang� 10.691� buah,� kereta�gandengan� sebanyak� 116� buah,� pick� up�sebanyak� 771� buah� dan� traktor� tercatat�hanya�113�buah.��
��Jika� dilihat� perbandingan� jumlah�
kendaraan�wajib�uji�dan�kendaraan�yang�sudah� diuji� seperti� yang� disajikan� pada�tabel�9.2.2.�
�Selanjutnya� tercatat� sebanyak� 59�
perusahaan�angkutan�yang�beroperasi�di�Sulawesi�Tengah.�Jumlah�bus�umum�yang�beroperasi� sebanyak� 660� unit� dengan�kapasitas�penumpang�13.946�orang.�
�9.3.��Angkutan�Laut������
�Kondisi� alam� Provinsi� Sulawesi�
Tengah� yang� sebagian� besar� wilayahnya�terletak�di�daerah�pantai�memungkinkan�armada�laut�untuk�beroperasi�dari�dan�ke�pelabuhan�yang�ada�di�setiap�Kabupaten,�guna� menunjang� kelancaran� kegiatan�perekonomian� ataupun� sebagai�penunjang� transportasi� penumpang�angkutan�laut.�
�Sebanyak� 18� pelabuhan� yang�
mengirimkan� laporan� aktivitas� penum�pang/barang�yang�masuk�maupun�keluar�pelabuhan� yang� tersebar� di� sepuluh�kabupaten/kota,� yaitu� :� 2� buah�
Sulawesi� Tengah.� Number� of� motor�vehicles� in� 2013� was� 18,254� units,�consisted�of�passenger�cars�(1,278�units),�buses�(3,272�units),�trucks�(10,691�units),�linked� trucks� (116� units),� pick� up� cars�(771�units),�and�tractors�(113�units).��
���
By� looking� in�Table�9.2.2,� �number�of� the� obligatory� test� of� motor� vehicles�and�the�motor�vehicles�have�been�tested.�
��
In� 2013,number� of� transportation�companies� in� Sulawesi� Tengah� was� 59�units.�Meanwhile� number� of� busses�was�660� units,� with� the� passenger� capacity�reached�13.946�persons.�
�9.3.�Sea�Transportation�
�Most� of� area� in� Sulawesi� Tengah�
Province� are� located� along� beach� lines,�has� made� significantly� possible� for� sea�transportation� to� be� operated� from� and�to� all� ports� in� every� regency/city.� Then,�these� activities� will� surely� support� their�economic�system�and�mobile�people.�
��There� are� 18� ports� who� sent� the�
reports�of�passenger�and�good�that�come�and� out� of� ports� which� located� in� ten�regencies/city,� those� are� 2� ports� in� the�Donggala�Regency�(Donggala�Port,�Wani�Port),� 2� ports� in� the� Parigi� Moutong�
http
://sul
teng
.bps
.go.
id

Transportation, Post, and Telecommunication
Sulawesi Tengah in Figures 2014 309
pelabuhan� di� Kabupaten� Donggala� yakni�Pelabuhan� Donggala,� Wani;� 2� buah�pelabuhan� di� Kabupaten� Parigi� Moutong�yaitu� Pelabuhan� Parigi� dan� Moutong,;� 1�buah�pelabuhan�di�Kabupaten�Poso�yaitu�Pelabuhan� Poso,� 2� buah� di� Kabupaten�Tojo� Una�una� yaitu� Pelabuhan� Wakai,�Ampana;� dan� 3� buah� pelabuhan� di�Kabupaten� Morowali� yaitu� Pelabuhan�Bungku,� Kolonodale� dan� Wosu;� 3� buah�pelabuhan� di� Kabupaten� Banggai� yakni�pelabuhan� Luwuk,� Bunta,� Pagimana� dan�2�buah�pelabuhan�di�Kabupaten�Banggai�Kepulauan� yaitu� Pelabuhan� Banggai,�Salakan,� serta� 1� buah� pelabuhan� di�Kabupaten� Buol� dan� � Tolitoli� yakni�pelabuhan� Tolitoli� dan� Leok,� dan� 1�pelabuhan�di�kota�Palu,�yaitu�Pantoloan.��Aktivitas�pelabuhan�tersebut�tahun�2012,�yakni� mengenai� banyaknya� kapal� motor�yang�datang/berangkat,�arus�penumpang�datang/berangkat� serta� barang� yang�dibongkar/muat�dapat�dilihat�pada�Tabel�9.4.1.�dan�9.4.2.�
�9.�4.�Angkutan�Udara�
�Gambaran��mengenai�arus��lalu�lintas�
pesawat� udara� serta� jumlah� penumpang�yang� datang� dan� berangkat� pada� setiap�bandara� di� Sulawesi� Tengah� disajikan�pada� Tabel� 9.3.1.� Pada� tahun� 2013�jumlah� pesawat� dan� penumpang� yang�datang� dan� berangkat� ke� dan� dari�Sulawesi� Tengah� terbesar� melalui�Bandara� Mutiara� Palu� dan� Bubung�Luwuk.�
Regency�(Moutong�Port�and�Parigi�Port),�1� ports� in� Poso� Regency� (Poso� Port),� 2�port�in�the�Tojo�Una�una�Regency�(Wakai�Port,� Ampana� Port),� 3� ports� the� in�Morowali� Regency� (Bungku� Port,�Kolonodale�Port,�and�Wosu�Port),�3�ports�in� Banggai� Regency� (Luwuk� Port,� Bunta�Port,� Pagimana� port),� 2� ports� in� the�Bangkep� Regency� (Banggai� Port� and�Salakan� Port).� 1� Regencies� of� Buol� and�Tolitoli�(Leok�Port�and�Tolitoli�Port)�and�1�port� in� Palu� City� (Pantoloan� Port).� The�activities� in� ports� during� 2012� are� sea�traffic� of� ships,� passengers� who� arrived�and�departed,�and�load/unload�of�goods,�as�can�be�seen�in�Tables�9.4.1�and�9.4.2.�
���������
9.4.�Air�Transportation��
Description� of� air� traffics� and� the�passengers,� which� arrived� to� and�departed� from� airports� in� Sulawesi�Tengah,� is� presented� on� Table� 9.3.1.� In�2013,� most� number� of� aircrafts� and�passengers� arrived� and� departed� to� and�from� Sulawesi� Tengah,� recorded� in�Airports� of� Mutiara� Palu� and� Bubung�Luwuk.�
�
http
://sul
teng
.bps
.go.
id

Transportasi, Pos, dan Telekomunikasi
310 Sulawesi Tengah Dalam Angka 2014
�Pada� tahun� 2013� terlihat� adanya�
peningkatan� terhadap� jumlah� pesawat�yang� datang� dan� berangkat� dibanding�tahun� 2011.� Pesawat� yang� berangkat�melalui� pelabuhan� udara� se�Sulawesi�Tengah� mengalami� kenaikan� sebesar�2,77� persen� dibanding� tahun�sebelumnya.� Hal� yang� sama� terjadi�kenaikan� pada� jumlah� penumpang� yang�berangkat� melalui� bandara� di� Sulawesi�Tengah�meningkat�sebesar�7,03�persen.�
�9.5.�Pos�dan�Telekomunikasi��
�Kebutuhan� akan� pelayanan� jasa�
pos� dan� giro� dari� tahun� ke� tahun�dirasakan� semakin� menurun� kondisi� ini�diakibatkan� semakian� banyak� pelayanan�jasa� yang� dikelola� pihak� swasta.� Hal� ini�dapat� dilihat� dari� volume� dan� ragam�bentuk� pelayanan� yang� dilakukan� terjadi�fluktuasi.� Perkembangan� kegiatan�pelayanan� jasa� pos� dan� giro� tentunya�seiring� dengan� pemanfaatannya� oleh�masyarakat.� Data� Pos� yang� disajikan�disini� berupa� kegiatan� pelayanan� yang�diberikan� terhadap� penerimaan� dan�pengiriman� surat�surat� pos,� warkat� pos,�kartu� pos,� pos� paket� dan� wesel,� pada�masing�masing�kabupaten.�
�Terlihat�pada�periode�tahun�2009�
2013� terjadi� fluktuasi� yang� tajam� dalam�penerimaan�maupun�pengiriman�melalui�kantor�pos.�Secara�umum�keadaan�tahun�2013,� penerimaan� dan� pengiriman�
In� 2013,� there� was� an� increase� of�the�number�of�aircrafts�who�arrived�and�departed� from� 2011.� Aircrafts� departed�through� all� airports� in� Sulawesi� Tengah�increase�2.77�percent�of�a�previous�year.�The� same� thing� happened� increased� on�the� number� of� departing� passengers�through� all� airports� in� Sulawesi� Tengah�increased�7.03�percent.�
���
9.5.�Post�and�Telecommunication��Need� of� post� and� postal� clearing�
services� from� year� to� year� is� seemed�more� descending,� caused� by� increasing�number� of� the� private� services.� This�phenomenon� can� be� seen� by� fluctuation�of� volume� and� varied� services� by� post�offices.� Post� and� postal� clearing� services�grows� along� with� utilization� of� the�services� by� people.� Data� post� presented�in�this�publication�are�services�to�send�or�receive� the� letters,� papers,� post� cards,�parcels,� and� money� orders� in� every�regency/City.�
����During� 2009�2013,� occurred�
fluctuation� of� dispatch� and� receiving� by�post� office.� Generally,� condition� of� post�items� that� received� and� sent� in� 2013�experienced� increasing� compared� to� the�
http
://sul
teng
.bps
.go.
id

Transportation, Post, and Telecommunication
Sulawesi Tengah in Figures 2014 311
benda�benda� pos� mengalami�peningkatan� jika� dibandingkan� dengan�tahun� sebelumnya.� Untuk� jelasnya� lihat�tabel�9.5.1.�s.d.�tabel�9.5.2.�
�Di� sektor� telekomunikasi� kebutuhan�
akan� informasi� yang� cepat� menuntut�tersedianya� sarana� dan� prasarana� yang�memadai� dan� mudah� dijangkau.�Gambaran� mengenai� telekomunikasi� di�Sulawesi�Tengah�dapat�dilihat�pada�tabel�9.5.3.�s.d.��9.5.4.�
previous� year,� as� can� be� seen� in� Table�9.5.1�and�Table�9.5.2.�
���Meanwhile,� need� of� high� speed�
information� demands� availability� of� the�accessible� infrastructures� of� tele�communication.�Illustration�of�concerning�telecommunication�in�Sulawesi�Tengah�is�presented�in�Tables�9.5.3�to�9.5.4.�
http
://sul
teng
.bps
.go.
id

Transportasi, Pos, dan Telekomunikasi
312 Sulawesi Tengah Dalam Angka 2014
http
://sul
teng
.bps
.go.
id

Sulaw
Gam
Fig
1111
wesi Tengah in
mbar�
gure� 9.1�
0200400600800
1000120014001600
Ba
1
n Figures 2014
Panjang� JalBerwenang�(Length� of� RoResponsibility
aik� S
416,13
272,0
Ne
an� menurut�km),�2013�oads� by� Condiy�(km),�2013�
Sedang
611,5809
50
egara
Transp
Kondisi� Jala
ition� of� Roads
Rusak
76,76
00,31
1
Provin
portation, Post, a
n� dan� Peme
s� and� Level� of
Rusak�Berat�dan�Belum�
Tembus
77,48
148,05
nsi
and Telecommunic
3
erintah� yang�
f� Government�
698,81
cation
313
http
://sul
teng
.bps
.go.
id

Transportasi, Pos, dan Telekomunikasi
314 Sulawesi Tengah Dalam Angka 2014
http
://sul
teng
.bps
.go.
id

Transportation, Post, and Telecommunication
Sulawesi Tengah in Figures 2014 315
9.1.�Panjang�Jalan�/Length�of�Roads��Tabel�
Table� � 9.1.1�Panjang� Jalan� menurut� Pemerintah� yang� Berwenang� dan� Jenis�Permukaan�(km),�2009�2013�Length�of�Roads�by�Level�of�Government�Responsibility�and�Type�of�Surface�(km),�2009�2013�
��
Jenis�Permukaan�Type�of�Surface�
Negara�State�
Propinsi�Province�
Jumlah�Total�
(1)� (2)� (3)� (4)�� � � � �
01.� Diaspal/�Asphalted� 2�151,25� 1�238,36� 3�389,61�
02.� Kerikil�/�Gravel� �30,70� �106,60� �137,30�
03.� T�a�n�a�h/�Earth� �� �274,30� �274,30�
04.� Tidak�dirinciUnspecified� �� �� ��
� � � � �
�Jumlah/�Total� � � �
� 2�0�1�3� 2�181,95� 1�619,26� 3�801,21�
� 2�0�1�2� 2�181,95� 1�619,26� 3�801,21�
� 2�0�1�1� 2�181,95� 1�619,26� 3�801,21�
� 2�0�1�0� 2�181,95� 1�648,75� 3�830,70�
� 2�0�0�9� 1�806,46� 2�037,06� 3�843,52��
Sumber/Source� :� Dinas�Pekerjaan�Umum�(jasa�marga)�Provinsi�Sulawesi�Tengah��� � Public�Work��Department�(jasa�marga)��of�Sulawesi�Tengah�Province
http
://sul
teng
.bps
.go.
id

Transportasi, Pos, dan Telekomunikasi
316 Sulawesi Tengah Dalam Angka 2014
Tabel�
Table� 9.1.2�Panjang� Jalan� menurut� � Kondisi� Jalan� dan� Pemerintah� yang� Berwenang�(km),�2009�2013�Length� of� Roads� by� Condition� of� Roads� and� Level� of� Government�Responsibility�(km),�2009�2013�
��
Kondisi�Jalan�Condition�of�Road�
Negara�State�
Propinsi�Province�
Jumlah�Total�
(1)� (2)� (3)� (4)�� � � � �
01.� B�a�i�k/�G�o�o�d� 1�416,13� �272,09� 1�688,22�
02.� S�e�d�a�n�g/�Moderate� �611,58� �500,31� 1�111,89�
03.� R�u�s�a�k/�Damage� �76,76� �148,05� �224,81�
04.� Rusak�Berat�dan�Belum�Tembus�/��Heavy�Damage�and�Not�Penetrated� �77,48� �698,81� �776,29�
�
�Jumlah/�Total� � � �
� 2�0�1�3� 2�181,95� 1�619,26� 3�801,21�
� 2�0�1�2� 2�181,95� 1�619,26� 3�801,21�
� 2�0�1�1� 2�181,95� 1�619,26� 3�801,21�
� 2�0�1�0� 2�181,95� 1�648,75� 3�830,70�
� 2�0�0�9� 1�806,46�� 2�037,06� 3�843,52�
Sumber/Source� :� Dinas�Pekerjaan�Umum�(jasa�marga)�Provinsi�Sulawesi�Tengah��� � Public�Work��Department��(jasa�marga)�of�Sulawesi�Tengah�Province
http
://sul
teng
.bps
.go.
id

Transportation, Post, and Telecommunication
Sulawesi Tengah in Figures 2014 317
Tabel�
Table� 9.1.3�Panjang�Jalan�menurut��Kelas�Jalan�dan�Pemerintah�yang�Berwenang�(km),�2009�2013�Length�of� �Roads�by�Class�of�Roads�and�Level�of�Government�Responsibility�(km),�2009�2013�
��
Kelas�Jalan�Class�of�Road�
Negara�State�
Propinsi�Province�
Jumlah�Total�
(1)� (2)� (3)� (4)�� � � � �
01.� Arteri� �� �� ��
02.� Kelas�I� �� �� ��
03.� Kelas�II� �� �� ��
04.� Kelas�III� �� �� ��
05.� Kelas�III�A� �675,65� �� �675,65�
06.� Kelas�III�B� 1�506,30� 1�619,26� 3�125,56�
07.� Kelas�III�C� �� �� ���
�Jumlah/�Total� � � �
� 2�0�1�3� 2�181,95� 1�619,26� 3�801,21�
� 2�0�1�2� 2�181,95� 1�619,26� 3�801,21�
� 2�0�1�1� 2�181,95� 1�619,26� 3�801,21�
� 2�0�1�0� 2�181,95� 1�648,75� 3�830,70�
� 2�0�0�9� 1�806,46� 2�037,06� 3�843,52�
Sumber/Source� :� Dinas�Pekerjaan�Umum�(jasa�marga)�Provinsi�Sulawesi�Tengah��� � Public�Work��Department��(jasa�marga)�of��Sulawesi�Tengah�Province
http
://sul
teng
.bps
.go.
id

Transportasi, Pos, dan Telekomunikasi
318 Sulawesi Tengah Dalam Angka 2014
9.2.�Angkutan�Darat�/Land�Transportation���
Tabel�
Table� 9.2.1�Banyaknya�Kendaraan�Bermotor�Wajib�Uji�menurut�Kabupaten/Kota�dan�Jenisnya,�2009�2013�Number� of� Obligatory� Tested� of� Motor� Vehicles� by� Regency/City� and� by�Type,�2009�2013�
�
Kabupaten/Kota�Regency/City�
Mobil�Penum��
pang�Passenger�
Cars�
Bus�Busses�
Mobil�BarangTrucks�
KeretaGande�
ngan�LinkedTrucks�
Traktor�Track��tors�
Pick�Up�
Lain��nya�
Others�
Jumlah�Kenda��
raan�Total�of�Vehicles�
(1)� (2)� (3)� (4)� (5)� (6)� (7)� (8)� (9)�� � � � � � � � �
�01.�Banggai�Kepulauan� �15� �60� �75� �� �� �206� �� �356�02.�Banggai� �680� 1�230� 4�710� �45� �38� � � 6�703�03.�Morowali� ...� ...� ...� ...� ...� ...� ...� ...�04.�Poso� �11� �4� �181� � ����� �1� �� �� �197�05.�Donggala� ...� ...� ...� ...� ...� ...� ...� ...�06.�Tolitoli� �221� �112� �387� �13� �7� �334� �11� 1�085�07.�Buol� �21� �98� �541� �� �5� �� �� �665�08.�Parigi�Moutong� �122� �855� 2�174� �� �42� �� �� 3�193�09.�Tojo�Una�una� �152� �4� �663� �� �10� �� 2�001� 2�830�10.�Sigi� � �1� �41� �� �� �167� �� �209�11.�Banggai�Laut� �1� �31� �2� �� �� �64� �� �98�12.�Morowali�Utara� ...� ...� ...� ...� ...� ...� ...� ...�13.�Palu� �66� �877� 1�917� �58� �10� �� �� 2�928�� � � � � � � � �Sulawesi�Tengah������� � � � � � � � �
2�0�1�3� 1�289� 3�272� 10�691� �116� �113� �771� 2�012� 18�264�
2�0�1�2� 473� 2�194� 9�867� 135� 9� 792� �� 12�470�
2�0�1�1� 1�834� 5�036� 9�787� 105� 82� 9�459� 198� 26�501�
2�0�1�0� 1�130� 4�829� 8�947� 175� 9� 3�268� �� 18�412�
2�0�0�9� 1�139� 4�925� 7�871� 125� 8� 2�972� 46� 15�224�
Sumber/Source� :� Dinas�Perhubungan�Daerah�Provinsi�Sulawesi�Tengah��� � Transportation�Regional�Service�of��Sulawesi�Tengah�Province
http
://sul
teng
.bps
.go.
id

Transportation, Post, and Telecommunication
Sulawesi Tengah in Figures 2014 319
Tabel�
Table� 9.2.2�Banyaknya�Kendaraan�Bermotor�yang�Sudah�Diuji�menurut�Jenisnya,�2009�2013�Number�of�Vehicles�have�been�Tested�by�Type�of�Vehicles,�2009�2013�
���
Kabupaten/Kota�Regency/City�
Mobil�Penum��
pang�Passenger
Cars�
Bus�Busses�
Mobil�Barang�Truck�
KeretaGande�
ngan�Link�Trucks
Traktor�Track��tors�
Pick�Up�
Lain��nya�
Others�
Jumlah�Kenda��
raan�Total�of�Vehicles�
(1)� (2)� (3)� (4)� (5)� (6)� (7)� (8)� (9)�� � � � � � � � �1. Banggai�Kepulauan� �10� �20� �50� �� �� �150� ������� �230�2. Banggai� �650� 1�205� 4�145� �50� �55� �� �� 6�105�3. Morowali� ...� ...� ...� ...� ...� ...� ...� ...�4. Poso� �128� �180� 2�135� � ����� �37� �� �� 2�480�5. Donggala� ...� ...� ...� ...� ...� ...� ...� ...�6. Tolitoli� �436� �218� �760� �23� �9� �661� �20� 2�127�7. Buol� �7� �74� �484� � ����� �5� �� �� �570�8. Parigi�Moutong� �103� �236� 1�460� �� �12� �� �� 1�811�9. Tojo�Una�una� �152� �4� �663� � ����� �10� �� 2�001� 2�830�10. Sigi� ������� �1� �41� �� �� �167� �� �209�11. Banggai�Laut� ������� �2� �2� �� �� �26� �� �30�12. Morowali�Utara� ...� ...� ...� ...� ...� ...� ...� ...�13. Palu� �66� �877� 1�917� �58� �10� �� �� 2�928�� � � � � � � � �Sulawesi�Tengah������� � � � � � � � �
2�0�1�3� 1�552� 2�817� 11�657� �131� �138� 1�004� 2�021� 19�320�2�0�1�2� 610� 3�126� 7�320� 219�� 9� 737� 92� 12�113�
2�0�1�1� 1�425� 5�373� 13�366� 135� 56� 7�421� 95� 27�871�
2�0�1�0� 1�142� 3�740� 9�591� 167� 19� 4�679� 2� 21�789�
2�0�0�9� 940� 4�696� 9�780� 69� 21� 4�054� 44� 12�970�
Sumber/Source� :� Dinas�Perhubungan�Daerah�Provinsi�Sulawesi�Tengah��� � Transportation�Regional�Service�of��Sulawesi�Tengah�Province
http
://sul
teng
.bps
.go.
id

Transportasi, Pos, dan Telekomunikasi
320 Sulawesi Tengah Dalam Angka 2014
Tabel�
Table� 9.2.3�Banyaknya� Perusahaan� Angkutan� Bus� Umum,� Armada� dan� Kapasitas�Orang,yang�Beroperasi�di�Kabupaten/Kota,�2009�2013�Number� of� Public� Bus� Transportation� Companies,� Public� Bus,� and��Capacities�by�Regency/City,�2009�2013�
�
Kabupaten/Kota�Regency/City�
Perusahaan�Angkutan�Bus�
Umum�Public�Bus�
Transportation�Company�
Bus�Umum�Public�bus�
Kapasitas�Orang�People�Capacity��
(1)� (2)� (3)� (4)�� � � �
1. Banggai�Kepulauan� - - - 2. Banggai� - - - 3. Morowali� - - - 4. Poso� - - - 5. Donggala� - - - 6. Tolitoli� - - - 7. Buol� �� �129� 1�202�8. Parigi�Moutong� - - - 9. Tojo�Una�Una� - - - 10. Sigi� - - - 11. Banggai�Laut� - - - 12. Morowali�Utara� - - - 13. Palu� �59� �531� 12�744�� � � �
Sulawesi�Tengah������� � �2�0�1�3� �59� �660� 13�946�2�0�1�2� 44� 5�263� 2�655�250�2�0�1�1� 76� 5�027� ��2�0�1�0� 125� 530� 1�112�812�2�0�0�9� 1�056� 1�279� 16�394�
Sumber/Source� :� Dinas�Perhubungan�Daerah�Provinsi�Sulawesi�Tengah��� � Transportation�Regional�Service�of��Sulawesi�Tengah�Province
http
://sul
teng
.bps
.go.
id

Transportation, Post, and Telecommunication
Sulawesi Tengah in Figures 2014 321
Tabel�
Table� 9.2.4�Banyaknya� Perusahaan� Angkutan� Truk,� Armada� dan� Kapasitas�Orangdan�Barang�di�Kabupaten/Kota,�2008�2012�Number� of� Truck� Transportation� Companies,� Trucks,� and� Capacities� of�People�and�Good�by�Regency/City,�2008–�2012�
�
Kabupaten/Kota�Regency/City�
Perusahaan�Angkutan�Truk�
Truck�Transportation�
Company�
Truk�Truck�
Kapasitas�/�Capacity�
Orang�Persons�
Barang�Goods�(Kg)�
(1)� (2)� (3)� (4)� (5)�� � � � �
01.Banggai�Kepulauan� � � �� ��
02.Banggai� � � �� ��
03.Morowali� � � �� ��
04.Poso� � � �� ��
05.Donggala� 0� 2�400� 3�800� 4�800�000�
06.Tolitoli� 7� 86� 180� 4�500�
07.Buol� � � �� ��
08.Parigi�Moutong� � � �� ��
09.Tojo�Una�Una� � � �� ��
10.Sigi� � � �� ��
11.Palu� � � �� ��
� � � � �
Sulawesi�Tengah������� � � � �2�0�1�2� 7� 2�486� 3�980� 4�804�500�2�0�1�1� 349� 2�412� 1�634� 10�104�2�0�1�0� 312� 969� 2�511� 2�630�508�2�0�0�9� 1�121� 1�347� 543� 3�876�634�2�0�0�8� 1�121� 1�347� 543� 3�876�634�� � � � �
Sumber/Source� :� Dinas�Perhubungan�Daerah�Provinsi�Sulawesi�Tengah��� � Transportation�Regional�Service�of��Sulawesi�Tengah�Province�Data�tidak�tesedia
http
://sul
teng
.bps
.go.
id

Transportasi, Pos, dan Telekomunikasi
322 Sulawesi Tengah Dalam Angka 2014
9.3.�Angkutan�Laut�/Sea�Transportation���
Tabel�
Table� 9.3.1�Banyaknya� Penumpang� Kapal� Yang� Datang� dan� Berangkat� di� Provinsi�Sulawesi�Tengah�menurut�Pelabuhan�dan�Jenis�PelayaranTahun�2013�Number� of� Ship� Passenger� (Arrival� and� Departure)� in� Sulawesi� Tengah�Province��by�Port�and�Kind�of�Voyage,�2013�
�
Sumber/Source� :� Dinas�Perhubungan�Daerah�Provinsi�Sulawesi�Tengah��� � Transportation�Regional�Service�of��Sulawesi�Tengah�Province
Pelabuhan�Port�
Dalam�Negeri/�Domestic�
Luar�Negeri�International�
Jumlah�Total�
Datang�Arrival�
BerangkatDeparture
Datang�Arrival�
BerangkatDeparture
Datang�Arrival�
Berangkat�Departure�
(1)� (2)� (3)� (4)� (5)� (6)� (7)�� � �
Pelabuhan�Utama��01��Pantoloan� 31�495� 46�661� �� �� 31�495� 46�661�02��Donggala� �� �� �� �� �� ���03��Tolitoli� 3�478� 2�856� �� �� 3�478� 2�856�Pelabuhan�Tidak�Diusahakan/� � � � � � �01��Banggai� 18�486� 13�837� �� �� 18�486� 13�837�02��Salakan� �� �� �� �� �� ��03��Bunta� �� �� �� �� �� ��04��Pagimana� 1�098� �939� �� �� 1�098� �939�05��Luwuk� 109�574� 98�877� �� �� 109�574� 98�877�06��Kolonedale� 8�413� 8�889� �� �� 8�413� 8�889�07��Poso� �287� �353� �� �� �287� �353�08��Ogoamas� �� �� �� �� �� ��09��Wani� �� �� �� �� �� ��10��Leok� �74� �70� �� �� �74� �70�11��Parigi� �� �� �� �� �� ��12��Moutong� �� �� �� �� �� ��13��Ampana� 10�984� 20�838� �� �� 10�984� 20�838�14��Wakai� �� �� �� �� �� ��15��Dolong�Popoli� �� �� �� �� �� ��
� � � � � � �
http
://sul
teng
.bps
.go.
id

Transportation, Post, and Telecommunication
Sulawesi Tengah in Figures 2014 323
Tabel�
Table� 9.3.2�Jumlah�Barang�yang�Dibongkar�dan�Dimuat�Menurut�Pelabuhan�dan�Jenis�Pelayaran�Provinsi�Sulawesi�Tengah,�2013�(Ton)�Total� Unloaded� and� Loaded� Cargo� by� Port� � and� Kind� of� Voyage� at� � in�Sulawesi�Tengah�Province,�2013(Ton)�
�
�Pelabuhan�Port�
Dalam�Negeri/�Domestic�
Luar�Negeri�International�
Jumlah�Total�
Bongkar�Unloaded
Muat�Loaded�
Bongkar�Unloaded
Muat�Loaded�
Bongkar�Unloaded�
Muat�Loaded�
(1)� (2)� (3)� (4)� (5)� (6)� (7)�� �
Pelabuhan�Utama�/Main�Port�
01��Pantoloan� 403�359� 10�860� �� �� 403�359� 1�086�
02��Donggala� 19�139� 5�529� �� �� 19�139� 5�529�
03��Tolitoli� 20�459� 29�754� �� �� 20�459� 29�754�Pelabuhan�Tidak�Diusahakan/� � � � � � �01��Banggai� 33�655� 8�829� �� �� 33�655� 8�829�02��Salakan� �� �� �� �� �� ��03��Bunta� �� �� �� �� �� ��04��Pagimana� �429� �150� �� �� �429� �150�05��Luwuk� 361�438� 296�002� �� �� 361�438� 296�002�06��Kolonedale� 9�291� 1571�684� �� �� 9�291� 1�571�684�07��Poso� 64�063� �� �� �� 64�063� ��08��Ogoamas� �� �� �� �� �� ��09��Wani� 101�838� 437�691� �� �� 101�838� 437�691�10��Leok� 51�133� 63�323� �� �� 51�133� 63�323�11��Parigi� 42�807� 63�012� �� �� 42�807� 63�012�12��Moutong� �� �� �� �� �� ��13��Ampana� 1�779� 14�298� �� �� 1�779� 14�298�14��Wakai� �� �� �� �� �� ��15��Dolong�Popoli� �� �� �� �� �� ��
� � � � � � �
Sumber/Source� :� Dinas�Perhubungan�Daerah�Provinsi�Sulawesi�Tengah��� � Transportation�Regional�Service�of��Sulawesi�Tengah�Province
http
://sul
teng
.bps
.go.
id

Transportasi, Pos, dan Telekomunikasi
324 Sulawesi Tengah Dalam Angka 2014
9.4.�Angkutan�Udara�/Air�Transportation����
Tabel�
Table� 9.4.1�Arus� Lalu� Lintas� Pesawat� Udara� dan� Penumpang� menurut� Pelabuhan�Udara,�2009�2013�Air�Traffic��and�Passenger�by�Air�Port�,�2009�2013�
��
Pelabuhan�Udara�Air�Port�
P�e�s�a�w�a�t�Air�Craft�
P�e�n�u�m�p�a�n�g�Passenger�
Datang�Arrival�
Berangkat�Departure�
Datang�Arrival�
Berangkat�Departure�
Transit�Transit�
(1)� (2)� (3)� (4)� (5)� (6)�� � � � � � �
01.�� Bubung�Luwuk� �933� �932� 64�018� 65�082� ��
02.�� Kasiguncu�Poso� �223� �223� 11�506� 12�068� ��
03.�� Lalos�Tolitoli� �265� �264� 6�278� 6�530� ��
04.�� Pogogul�Buol� �79� �79� 1�582� 1�547� ��
05.�� Mutiara�Palu� 3�886� 3�886� 450�223� 450�677� ��
� � � � � � �
�Jumlah/�Total� � � � � �
� 2�0�1�3� 5�386� 5�384� 533�607� 535�904� ��
� 2�0�1�2� 5�241� 5�240� 831�015� 500�719� 24�121�
� 2�0�1�1� 5�317� 5�319� 395�785� 460�010� 31�188�
� 2�0�1�0� 4�396� 4�394� 375�085� 377�361� 32�819�
� 2�0�0�9� 3�689� 3�693� 288�505� 288�637� 39�828�
Sumber/Source� :� Dinas�Perhubungan�Daerah�Provinsi�Sulawesi�Tengah��� � Transportation�Regional�Service�of��Sulawesi�Tengah�Province
http
://sul
teng
.bps
.go.
id

Transportation, Post, and Telecommunication
Sulawesi Tengah in Figures 2014 325
Tabel�
Table� 9.4.2�Arus� Lalulintas� Barang,� Bagasi� dan� Pos� Paket� melalui� Bandara� Udara�(kg),�2009�2013�Number� of� Loaded� and� Unloaded� � Cargo,� Baggage� � and� Mails� (kg),���2009�2013�
��
Pelabuhan�Udara�AirPort�
B�a�r�a�n�g�C�a�r�g�o�
B�a�g�a�s�i�Baggage�
Pos�Paket�M�a�i�l�
Muat�Loaded�
Bongkar�Unloaded�
Muat�Loaded�
Bongkar�Unloaded�
Muat�Loaded�
Bongkar�Unloaded�
(1)� (2)� (3)� (4)� (5)� (6)� (7)�� � � � � � � �
01.�� Bubung�Luwuk� �391�650� �305�838� �636�248� �539�761� �� ��
02.�� Kasiguncu�Poso� �� �� �108�253� �101�022� �� ��
03.�� Lalos�Tolitoli� �� �� �43�598� �60�947� �� ��
04.�� Pogogul�Buol� �� �� �9�696� �9�589� �� ��
05.�� Mutiara�Palu� 1�909�052� 1�887�360� 4�589�114� 4�591�185� �66�489� �68�968�
� � � � � � � �
�Jumlah/�Total��������������� � � �
� 2�0�1�3� 2�300�702� 2�193�198� 5�386�909� 5�302�504� �66�489� �68�968�� 2�0�1�2� 3�455�017� 3�508�751� 4�465�403� 4�990�205� 59�083� 62�144�� 2�0�1�1� 4�338�260� 4�419�128� 4�450�825� 4�495�002� 61�355� 56�071�� 2�0�1�0� 3�290�186� 3�299�281� 3�593�235� 3�611�555� 51�806� 65�342�� 2�0�0�9� 2�353�013� 2�320�320� 2�576�135� 2�601�728� 25�898� 30�648�
Sumber/Source� :� Dinas�Perhubungan�Daerah�Provinsi�Sulawesi�Tengah��� � Transportation�Regional�Service�of��Sulawesi�Tengah�Province
http
://sul
teng
.bps
.go.
id
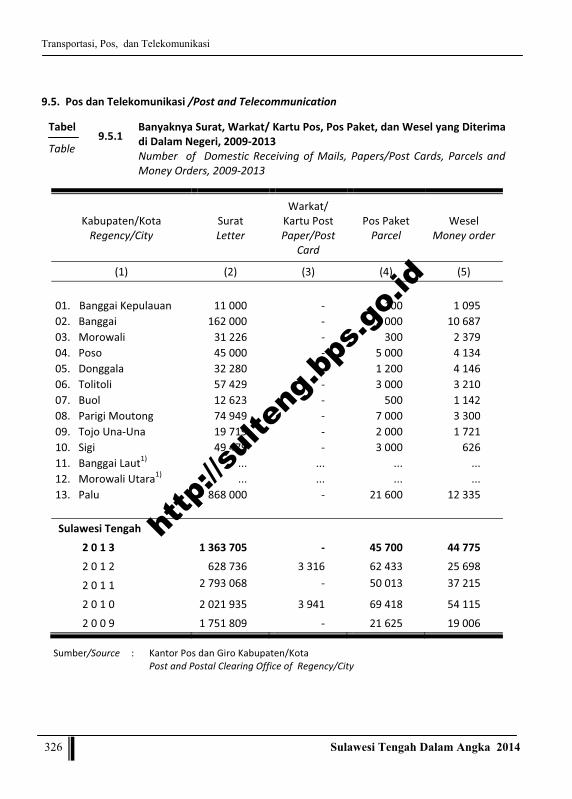
Transportasi, Pos, dan Telekomunikasi
326 Sulawesi Tengah Dalam Angka 2014
9.5.��Pos�dan�Telekomunikasi�/Post�and�Telecommunication���
Tabel�
Table� 9.5.1�Banyaknya�Surat,�Warkat/�Kartu�Pos,�Pos�Paket,�dan�Wesel�yang�Diterima�di�Dalam�Negeri,�2009�2013�Number� � of� �Domestic�Receiving�of�Mails,� Papers/Post�Cards,� Parcels�and�Money�Orders,�2009�2013�
�
Kabupaten/Kota�Regency/City�
Surat�Letter�
Warkat/�Kartu�Post�Paper/Post�
Card�
Pos�Paket�Parcel�
Wesel�Money�order�
(1)� (2)� (3)� (4)� (5)�� � � � �
01. Banggai�Kepulauan� �11�000� �� ��100� �1�095�02.���Banggai� �162�000� �� �2�000� �10�687�03.���Morowali� �31�226� �� ��300� �2�379�04.���Poso� �45�000� �� �5�000� �4�134�05.���Donggala� �32�280� �� �1�200� �4�146�06.���Tolitoli� �57�429� �� �3�000� �3�210�07.���Buol� �12�623� �� ��500� �1�142�08.���Parigi�Moutong� �74�949� �� �7�000� �3�300�09.���Tojo�Una�Una� �19�719� �� �2�000� �1�721�10.���Sigi� �49�479� �� �3�000� ��626�11.���Banggai�Laut1)� ...� ...� ...� ...�12.���Morowali�Utara1)�� ...� ...� ...� ...�13.���Palu� �868�000� �� �21�600� �12�335�� � � � �Sulawesi�Tengah������� � � � �
2�0�1�3� 1�363�705� �� �45�700� �44�775�
2�0�1�2� 628�736� 3�316� 62�433� 25�698�
2�0�1�1� 2�793�068� �� 50�013� 37�215�
2�0�1�0� 2�021�935� 3�941� 69�418� 54�115�
2�0�0�9� ��1�751�809� �� ����21�625� ���19�006�
Sumber/Source� :� Kantor�Pos�dan�Giro�Kabupaten/Kota�Post�and�Postal�Clearing�Office�of��Regency/City
http
://sul
teng
.bps
.go.
id

Transportation, Post, and Telecommunication
Sulawesi Tengah in Figures 2014 327
Tabel�
Table� 9.5.2�Banyaknya� Surat,� Warkat/Kartu� Pos,� Pos� Paket,� dan� Wesel� yang�Dikirim�dari�Dalam��Negeri,�2009�2013�Number� of� Domestic� Dispatch� of� �Mails,� Papers/Post� Cards,�Matter,�Parcels�and�Money�Orders,�2009�2013�
��
Kabupaten/Kota�Regency/City�
Surat�Letter�
Warkat/�Kartu�Post�Paper/Post�
Card�
Pos�Paket�Parcel�
Wesel�Money�order�
(1)� (2)� (3)� (4)� (5)�
� � � � �01. Banggai�Kepulauan� �1�800� �� ��840� �1�443�02. Banggai� �28�000� �� �1�200� �13�380�03. Morowali� �4�500� �� ��300� �6�516�04. Poso� �10�000� �� ��300� �3�497�05. Donggala� �4�500� �� ��336� �1�163�06. Tolitoli� �6�600� �� ��360� �2�752�07. Buol� �2�195� �� ��240� �1�100�08. Parigi�Moutong� �5�600� �� ��480� �3�919�09. Tojo�Una�Una� �6�100� �� ��180� �2�095�10. Sigi� ��600� �� ��360� ��543�11. Banggai�Laut1)� ...� ...� ...� ...�12. Morowali�Utara1)� ...� ...� ...� ...�13. Palu� �144�000� �� �3�600� �24�073��
Sulawesi�Tengah�������
2�0�1�3� �213�895� �� �8�196� �60�481�
2�0�1�2� 257�549� 2�431� 27�750� 36�045�
2�0�1�1� 1�120�073� �� 56�109� 48�457�
2�0�1�0� 2�752�312� 3�494� 26�011� 85�766�
2�0�0�9� 756�746� �� 18�918� 190�944�
Sumber/Source� :� Kantor�Pos�dan�Giro�Kabupaten/Kota�Post�and�Postal�Clearing�Office�of��Regency/City�
Catatan/Note�������:�����1)�Tergabung�Dengan�Kabupaten�Induknya/�Include�in�main�regency
http
://sul
teng
.bps
.go.
id

Transportasi, Pos, dan Telekomunikasi
328 Sulawesi Tengah Dalam Angka 2014
Tabel�
Table� 9.5.3�Banyaknya�Surat,�Warkat/Kartu�Pos,�Pos�Paket,�dan�Wesel�yang�Diterimadari�Luar�Negeri,�2009�2013�Number�of�International�Receiving�of�Mails,�Papers/Post�Cards,�Parcels�and�Money�Orders,�2009��2013�
��
Kabupaten/Kota�Regency/City�
Surat�Letter�
Warkat/�Kartu�Post�Paper/Post�
Card�
Pos�Paket�Parcel�
Wesel�Money�order�
(1)� (2)� (3)� (4)� (5)�
� � � � �01. Banggai�Kepulauan� ��12� �� ��12� ��5�02.���Banggai� ��360� �� ��120� ��161�02. Morowali� ��180� �� ��60� ��154�03. Poso� ��240� �� ��60� ��491�04. Donggala� ��360� �� ��240� ��519�05. Tolitoli� ��180� �� ��50� ��180�06. Buol� ��36� �� ��12� ��140�07. Parigi�Moutong� ��96� �� ��180� �1�101�08. Tojo�Una�Una� ��84� �� ��36� ��147�10�.��Sigi� ��48� �� ��10� ��128�11.��Banggai�Laut1)� ...� ...� ...� ...�12.��Morowali�Utara1)� ...� ...� ...� ...�13.���Palu� �1�080� �� ��360� �4�124��Sulawesi�Tengah�������
2�0�1�3� �2�676� �� �1�140� �7�150�
2�0�1�2� 334� 215� 236� 434�
2�0�1�1� 1�960� �� 1�452� 1�750�
2�0�1�0� 4�766� 146� 529� 1�077�
2�0�0�9� 5�092� 392� 788� 1�878�
Sumber/Source� :Kantor�Pos�dan�Giro�Kabupaten/Kota��Post�and�Postal�Clearing�Office�of��Regency/City�
Catatan/Note�������:��1)�Tergabung�Dengan�Kabupaten�Induknya/�Include�in�main�regency
http
://sul
teng
.bps
.go.
id

Transportation, Post, and Telecommunication
Sulawesi Tengah in Figures 2014 329
Tabel�
Table� 9.5.4�Banyaknya�Surat,�Warkat/Kartu�Pos,�Pos�Paket,�dan�Wesel�yang�Dikirim�ke�Luar��Negeri,�2009�2013�Number�of�International�Dispatch�of�Mails,�Papers/Post�Cards,�Parcels�and�Money�Orders,�2009�2013�
�
Kabupaten/Kota�Regency/City�
Surat�Letter�
Warkat/�Kartu�Post�Paper/Post�
Card�
Pos�Paket�Parcel�
Wesel�Money�order�
(1)� (2)� (3)� (4)� (5)�
� � � � �01. Banggai�Kepulauan� ��36� �� �� ��02. Banggai� ��300� �� ��12� ��33�03. Morowali� ��36� �� �� ��04. Poso� ��120� �� ��6� ��05. Donggala� ��60� �� �� ��06. Tolitoli� ��48� �� ��6� ��07. Buol� ��36� �� �� ��08. Parigi�Moutong� ��120� �� ��5� ��09. Tojo�Una�Una� ��360� �� �� ��2�10. Sigi� ��36� �� �� ��120�11. Banggai�Laut1)� ... ... ... ...
12. Morowali�Utara1)� ... ... ... ...
13. Palu� ��960� �� ��60� ��� Sulawesi�Tengah�
2�0�1�2� �2�112� �� ��89� ��155�2�0�1�2� 459� 319� 55� 46�2�0�1�1� 4�006� �� 200� 447�2�0�1�0� 106�992� 120� 161� 280�2�0�0�9� 6�051� 335� 576� 120�
Sumber/Source� :� Kantor�Pos�dan�Giro�Kabupaten/Kota�Post�and�Postal�Clearing�Office�of��Regency/City�
Catatan/Note�������:�����1)�Tergabung�Dengan�Kabupaten�Induknya/�Include�in�main�regency
http
://sul
teng
.bps
.go.
id

TRANSPORTASI, POS, DAN TELEKOMUNIKASI SULAWESI TENGAH DALAM ANGKA 2013
330 BPS Provinsi Sulawesi Tengah
Tabel�
Table� 9.5.5�Jumlah�Pelanggan�dan�Sarana�Warung�Telekomunikasi�(Wartel)�menurutKabupaten/Kota,�2008�20121)�
Number�of�Subscribers�and�Phone�booths�by�Regency/City,�2008�20121)���
Lokasi�Location�
Jumlah�Pelanggan�Number�of�Subscribers�
Jumlah�Wartel��Number�of�Phone�booths�
(1)� (2)� (3)�� � �
01. Banggai�Kepulauan� ...� ...
02. Banggai� ...� ...
03. Morowali� 683� ...
04. Poso� 3�190� ...
05. Donggala� 815� ...
06. Tolitoli� 2�654� ...
07. Buol� 213� ...
08. Parigi�Moutong� ...� ...
09. Tojo�Una�Una� 1�170� ...
10. Sigi� 516� ...
11. Palu� ...� ...
� �� �
Sulawesi�Tengah�� � �
2�0�1�2� 9�241� ...�
2�0�1�1� 7�657� ��
2�0�1�0� 42�812� 83�
2�0�0�9� 43�896� 54�
2�0�0�8� 47�244�� �277��
Sumber/Source� :� Kantor�Daerah�Telekomunikasi�Kabupaten/Kota�Regional�Office�of�Telecommunication�in�Each�Regency/City�
Catatan/Note������:�������Data�tidak�tersedia/data�not��available�2013�
http
://sul
teng
.bps
.go.
id

Hotel and Tourism
Sulawesi Tengah in Figures 2014 331
HOTEL DAN PARIWISATA
Hotel and Tourism
http
://sul
teng
.bps
.go.
id

Hotel dan Pariwisata
332 Sulawesi Tengah Dalam Angka 2014
http
://sul
teng
.bps
.go.
id

Hotel and Tourism
Sulawesi Tengah in Figures 2014 333
10.����HOTEL��DAN��PARIWISATA�10.1.��Hotel��
Dalam� memberikan� pelayanan�terhadap� wisatawan� asing� maupun�domestik� yang� datang� ke� Sulawesi�Tengah,� diperlukan� tersedianya�akomodasi� yang� memadai.� Akomodasi�yang� dimaksud� ialah� hotel,� baik� yang�berbintang� maupun� yang� non�bintang.�Jumlah� hotel� di� Sulawesi� Tengah� tahun�2013� tercatat� sebanyak� 422�buah� seperti�terlihat� pada� Tabel� 10.1.1.� enam� di�antaranya� adalah� hotel� berbintang� yang�hanya� dapat� ditemukan� di� Kota� Palu� (5�hotel)�dan�Kabupaten�Banggai�(�1�hotel).�
�Persediaan� jumlah� kamar� hotel�
pada� tahun� 2013� mencapai� 492� kamar�dengan� 706� tempat� tidur� pada� hotel�berbintang� dan� 5.160� kamar� dengan�8.193� tempat� tidur� pada� hotel� non�bintang.��
�Tenaga�kerja�perhotelan�di�Provinsi�
Sulawesi� Tengah� mengalami� peningkatan�sebesar� 14,18� persen� yaitu� dari� 2.087�orang� pada� tahun� 2012� menjadi� 2.383�orang� pada� tahun� 2013.� Hal� ini�menunjukkan� bahwa� perhotelan� di�Sulawesi� Tengah� cepat� menyerap� tenaga�kerja.�Tenaga�kerja�yang�terserap�di�dunia�perhotelan� ini� sejak� dulu� selalu�didominasi� oleh� lulusan� SMU� sebanyak�64,04� persen.� Kelompok� tenaga� kerja�yang� juga� mendominasi� adalah� lulusan�
10.HOTEL��AND��TOURISM�10.1.��Hotel�
�In�order�to�serve�foreign�and�domestic�
tourists� who� come� to� Sulawesi� Tengah�neededthe� availability� of� enough�accommodation.� The� accommodation� or�hotel� is� grouped� into� 2� types:� classified�hotelsand� non�classified� hotels.� The�number� of� hotels� in� Sulawesi� Tengah� in�2013� was� around� 422� units� as� shown�inTable�10.1.1.�Among�of�those�hotels�are�four� classified� hotels� and� found� in� Palu�City(5� hotels)� dan� Banggai� Regency(1�hotels).�
��The� hotel’s� room� in� Sulawesi� Tengah�
reached� 492� rooms� and� 706� beds� at�classified� hotels,with� that� at� non�classified� hotels� were� 5,160� rooms� and�8,193�beds,�in�2013.�
��Hotel� workers� in� Sulawesi� Tengah�
increased� 14.18� percent� from� 2,087�persons�in�2012�to�2,383�persons�in�2013.�This� means� that� hotel� sector� has�extremely� big� contribution� in�employment,� particularlyin� Sulawesi�Tengah� Province.� Since� years� ago,� labor�force� who� dominated� hotel� sector� was�senior� high� school� graduation� by� 64.04�percent.� Other� labor� forces� group� which�also� dominated� hotel� sector� was�graduated� junior� high� school� or� lower�
http
://sul
teng
.bps
.go.
id

Hotel dan Pariwisata
334 Sulawesi Tengah Dalam Angka 2014
SLTP� ke� bawah.� Persentasenya� mencapai�21,95�persen.�
Tingkat� penghunian� kamar� (TPK)�hotel� berbintang� tahun� 2013� naik� dari�63,55� persen� menjadi� 69,73� persen� atau�turun� 6,18� persen� poin.� Sementara� TPK�hotel�non�bintang�turun�dari�29,81�persen�menjadi� 25,47� persen� atau� turun� 4,34�persen�poin.��
�10.2.�Pariwisata�
�Jumlah� kunjungan� wisatawan� pada�
tahun� 2013� Lebih� dari� 95� persen� di�antaranya� adalah� wisatawan� domestik.�Kunjungan� wisatawan� domestik� ini�tercatat� di� Kota� Palu,� sebesar� 103.053�orang.�
�Wisatawan�mancanegara�di�Sulawesi�
Tengah,� melakukan� kunjungan� ke� semua�wilayah� di� Provinsi� Sulawesi� Tengah,�dengan�kunjungan�tertinggi�di�Kabupaten�Tojo�Una�una�sebesar�4.369�orang.�
level�education by�21.95 percent.��Room� occupancy� rate� (RCR)� of�
classified� hotel� in� 2013� increased� from�63.55� percent� to� 69.73� percent,� or� went�down� 6.18� percent� point.� While� RCR� of�non�classified�hotel�decreased�from�29.81�percent� to� 25.47� percent� or� went� down�4.34�percent�point.��10.2.�Tourism�
�Number�of�tourist�visits� in�2013.�More�
than� 95� percent� of� it� was� domestic�tourists.� The� biggest� domestic� tourist�visitors� wererecorded� in� Palu� City� by�103,053�persons.�
��In� concerning� foreign� tourists,� the�
highest� foreign� tourist� visitsin� Sulawesi�Tengah�was� in� Tojo�Una�una�Regency� by�4,369�persons.�
http
://sul
teng
.bps
.go.
id

Sulawwesi Tengah in
Gambar
Figure�
0
20
40
60
80
2�0�0�
2
Hotel�BerbHotel�Non�
n Figures 2014
10.1�PersentLainnyaRoom�2009�2
92�0�1�0
22,9126,92
5
intang�/�ClassifBerbintang�/�N
tase� Tingkat� Pa,�2009�2013�Occupancy� Ra013�
2�0�1�12�0�
231,04
54,42 66,47
fied�Hotelon�Classified�H
Penghunian� Ka
ate� of� Hotel� a
1�22�0�1�3
29,81
2
765,14
otel
amar� Hotel� da
and� OtherAcco
3
25,47
63,55 6
Hotel and To
n� Akomodasi�
ommodations,�
9,73
ourism
335
http
://sul
teng
.bps
.go.
id

Hotel dan Pariwisata
336 Sulawesi Tengah Dalam Angka 2014
http
://sul
teng
.bps
.go.
id

Hotel and Tourism
Sulawesi Tengah in Figures 2014 337
Gambar
Figure 10.2 Jumlah Hotel, Kamar, dan Tempat Tidur menurut Kabupaten/ Kota dan Jenis Hotel 2013 Number of Hotels, Rooms, and Beds by Regency/City and Hotel Classification 2013
0
500
1000
1500
2000
2500
3000
Hotel / Hotel Kamar / Room Tempat Tidur / Bed
http
://sul
teng
.bps
.go.
id

Hotel dan Pariwisata
338 Sulawesi Tengah Dalam Angka 2014
http
://sul
teng
.bps
.go.
id

Hotel and Tourism
Sulawesi Tengah in Figures 2014 339
10.��HOTEL�DAN�PARIWISATA�/�HOTEL�AND�TOURISM���10.1.�Hotel/Hotel��Tabel�
Table� 10.1.1�Jumlah�Hotel,�Kamar,�dan�Tempat�Tidur�menurut�Kabupaten/�Kota�dan�Jenis�Hotel,�2009�2013�Number� of� Hotels,� Rooms,� and� Beds� by� Regency/City� and� Hotel�Classification,�2009�2013�
�Diolah�dari�hasil�Survei�Tingkat�Penghunian�Kamar�Based�on�Room�Occupancy�Rate�Survey�
Kabupaten/Kota�Regency/City�
Hotel�Berbintang�Classified�Hotel�
Hotel�Melati��Non�Classified�Hotel� Jumlah�/�Total�
Hotel�Hotel�
KamarRoom�
TempatTidur�Bed�
Hotel�Hotel�
Kamar�Room�
TempatTidur�Bed�
Hotel�Hotel�
Kamar�Room�
Tempat�Tidur�Bed�
(1)� (2)� (3)� (4)� (5)� (6)� (7)� (8)� (9)� (10)�� � � � � � � � � �
01.� Banggai�Kepulauan� �� �� �� �8� �122� �158� �8� �122� �158�02.� Banggai� �1� �39� �61� �64� �750� 1�139� �65� �789� 1�200�03.� Morowali� �� �� �� �41� �380� �602� �41� �380� �602�04.� Poso� �� �� �� �51� �612� �974� �51� �612� �974�05.� Donggala� �� �� �� �21� �198� �297� �21� �198� �297�06.� Tolitoli� �� �� �� �34� �327� �527� �34� �327� �527�07.� Buol� �� �� �� �15� �190� �322� �15� �190� �322�08.� Parigi�Moutong� �� �� �� �56� �541� �926� �56� �541� �926�09.� Tojo�Una�Una� �� �� �� �33� �450� �812� �33� �450� �812�10.� Sigi� �� �� �� �4� �27� �33� �4� �27� �33�11.��Banggai�Laut� � � � �4� �59� �85� �4� �59� �85�12.��Morowali�Utara� � � � �16� �173� �292� �16� �173� �292�13.� Palu� �5� �453� �645� �69� 1�331� 2�026� �74� 1�784� 2�671�
� � � � � � � � � �Sulawesi�Tengah� � � � � � � � � �
2013� �6� �492� �706� �416� 5�160� 8�193� �422� 5�652� 8�899�2012� 4� 341� 493� 367� 4�573� 7�417� 371� 4�774� 7�910�2011� 3� 201� 319� 350� 4�206� 6�977� 353� 4�407� 7�296�2010� 3� 167� 279� 311� 3�636� 5�945� 314� 3803� 6�224�2009� 2� 218� 304� 291� 3�381� 5�703� 293� 3�599� 6�007�
http
://sul
teng
.bps
.go.
id

Hotel dan Pariwisata
340 Sulawesi Tengah Dalam Angka 2014
Tabel�
Table� 10.1.2�Jumlah�Tenaga�Kerja�Perhotelan�menurut�Kabupaten/�Kota�dan�Tingkat�Pendidikan,�2009�2013�Number�of�Hotel�Workers�by�Regency/City�and�Education�Level,�2009�2013�
�Diolah�dari�hasil�Survei�Tingkat�Penghunian�Kamar�Based�on�Room�Occupancy�Rate�Survey�
Kabupaten/Kota�Regency/City�
Pendidikan�/�Education�
Jumlah��Total�
SD/SLTP�Primary�and�Junior�High�School�
SMU�Senior�High�School�
Diploma�Diploma�
Sarjana/Pasca�Sarjana�Scholar/�
(1)� (2)� (3)� (4)� (5)� (6)�� � � � � �
01.� Banggai�Kepulauan� �4� �16� �2� �5� �27�02.� Banggai� �83� �226� �15� �27� �351�03.� Morowali� �29� �58� �4� �12� �103�04.� Poso� �48� �110� �2� �16� �176�05.� Donggala� �53� �45� �1� �4� �103�06.� Tolitoli� �31� �73� �5� �12� �121�07.� Buol� �19� �29� � �5� �53�08.� Parigi�Moutong� �73� �97� �2� �9� �181�09.� Tojo�Una�Una� �105� �58� �1� �9� �173�10.� Sigi� �1� �16� �4� �2� �23�11.��Banggai�Laut� �4� �9� � �2� �15�12.��Morowali�Utara� �18� �23� �1� � �42�13.� Palu� �55� �766� �77� �117� 1�015�� � � � � �
Sulawesi�Tengah� � � � � �2�0�1�3� �523� 1�526� �114� �220� 2�383�2�0�1�2� 476� 1�330� 109� 172� 2�087�2�0�1�1� 474� 1�193� 94� 148� 1�909�2�0�1�0� 443� 1�090� 101� 136� 1�770�2�0�0�9� 418� 1�074� 157� 114� 1�763�
http
://sul
teng
.bps
.go.
id

Hotel and Tourism
Sulawesi Tengah in Figures 2014 341
Tabel�
Table� 10.1.3�Persentase� Tingkat� Penghunian� Kamar� Hotel� dan� Akomodasi� Lainnya,�2009�2013�Room�Occupancy�Rate�of�Hotel�and�Other�Accommodations,�2009�2013�
�Diolah�dari�hasil�Survei�Tingkat�Penghunian�Kamar�Based�on�Room�Occupancy�Rate�Survey�
Tahun�Y�e�a�r�
Hotel�Berbintang�Classified�Hotels�
Hotel�Non�Bintang/�Akomodasi�Lainnya�Non�Classified�Hotel/�
Others�Accommodation�
(1)� (2)� (3)�� � �
2�0�0�9� 54,42� 22,91�
2�0�1�0� 66,47� 26,92�
2�0�1�1� 65,14� 31,04�
2�0�1�2� 63,55� 29,81�
2�0�1�3� 69,73� 25,47�
� � �
http
://sul
teng
.bps
.go.
id

Hotel dan Pariwisata
342 Sulawesi Tengah Dalam Angka 2014
Tabel�
Table� 10.1.4�Banyaknya�Tamu�Asing�dan�Tamu�Dalam�Negeri�Datang�ke�Hotel�menurut�Jenis�Hotel,�2009�2013�Number�of�Foreign�Guests�and�Domestic�Guests�Who�Stayed�at�Hotels�by�Hotel�Classification,�2009�2013�
�Diolah�dari�hasil�Survei�Tingkat�Penghunian�Kamar�Based�on�Room�Occupancy�Rate�Survey�
Bulan�Month�
�
Berbintang/�Classified� Non�Bintang/�Non�Classified�Asing�Foreign�
Dalam�Negeri�Domestic�
Asing�Foreign�
Dalam�Negeri�Domestic�
(1)� (2)� (3)� (4)� (5)�
� � � � � �01.� Januari/�January� �163� 7�430� �438� 26�950�02.� Pebruari/�February� �145� 7�584� �498� 28�218�03.� Maret/�March� �205� 11�250� �639� 30�527�04.� April/�April� �101� 8�371� �544� 31�092�05.� Mei/�May� �115� 9�627� �353� 32�156�06.� Juni/�June� �107� 10�391� �477� 32�874�07.� Juli/�July� �115� 7�261� �865� 25�818�08.� Agustus/�August� �210� 7�205� �710� 24�842�09.� September/�September� �212� 9�670� �516� 30�487�10.� Oktober/�October� �178� 12�606� �381� 33�922�11.� November/�November� �159� 10�808� �328� 33�988�12.� Desember/�December� �113� 11�748� �191� 38�874�
� � � � � �
��Jumlah�/�Total� � � � �� 2�0�1�3� 1�823� 113�951� 5�940� 369�748�� 2�0�1�2� 1�134� 78�033� 6�405� 311�874�
� 2�0�1�1� 756� 48�157� 5�772� 783�764�
� 2�0�1�0� 838� 49�018� 5�574� 300�829�
� 2�0�0�9� 541� 30�224� 4�731� 289�987�
http
://sul
teng
.bps
.go.
id

Hotel and Tourism
Sulawesi Tengah in Figures 2014 343
Tabel�
Table� � 10.1.5�Rata�rata�Lama�Menginap�Tamu�dirinci�menurut�Jenis�Hotel�(hari),�2009�2013�Average�Length��Stayed�of�Guest�by�Hotel�Classification�(days),�2009�2013�
�Diolah�dari�hasil�Survei�Tingkat�Penghunian�Kamar�Based�on�Room�Occupancy�Rate�Survey�
Bulan�Month�
Hotel�Hotel� Seluruh�Hotel�
All�Hotels�Berbintang�Classified�
Non�Bintang�Non�Classified�
(1)� (2)� (3)� (4)�
� � � �01.� Januari/�January� 1,43� 1,54� 1,54�02.� Pebruari/�February� 1,65� 1,46� 1,47�03.� Maret/�March� 1,65� 1,50� 1,51�04.� April/�April� 1,80� 1,51� 1,52�05.� Mei/�May� 1,91� 1,39� 1,41�06.� Juni/�June� 1,84� 1,31� 1,33�07.� Juli/�July� 2,18� 1,45� 1,48�08.� Agustus/�August� 1,77� 1,44� 1,46�09.� September/�September� 1,76� 1,64� 1,65�10.� Oktober/�October� 1,41� 1,53� 1,52�11.� November/�November� 1,51� 1,38� 1,39�12.� Desember/�December� 1,44� 1,39� 1,39�� � � � �
Rata�Rata�/�Average� � � �� 2�0�1�3� 1,70� 1,46� 1,47�� 2�0�1�2� 1,79� 1,24� 1,26�� 2�0�1�1� 1,60� 1,51� 1,38�� 2�0�1�0� 1,37� 1,51� 1,10�� 2�0�0�9� 1,59� 1,68� 1,94�� � � � �
http
://sul
teng
.bps
.go.
id

Hotel dan Pariwisata
344 Sulawesi Tengah Dalam Angka 2014
Tabel�
Table� 10.1.6�Rata�rata� Lama�Menginap� Tamu� Hotel� menurut� Periode� dan� Klasifikasi�Hotel�(hari),�2009�2013�Averages�Length�of�Stay�of�HotelGuestby�Period�and�Classification(days),��2009�2013�
�Diolah�dari�hasil�Survei�Tingkat�Penghunian�Kamar�Based�on�Room�Occupancy�Rate�Survey�
Tahun��Y�e�a�r�
Hotel�Berbintang�Classified�Hotels�
Hotel�Non�Bintang/�Akomodasi�Lainnya�Non�Classified�Hotel/�
Others�Accommodation�
(1)� (2)� (3)�� � �
2�0�0�9� 1,68� 1,52�
2�0�1�0� 1,49� 1,45�
2�0�1�1� 1,51� 1,57�
2�0�1�2� 1,58� 1,52�
2�0�1�3� 1,70� 1,46�
� � �
http
://sul
teng
.bps
.go.
id

Hotel and Tourism
Sulawesi Tengah in Figures 2014 345
Tabel�
Table� 10.1.7�Rata�rata� Lama� Menginap� Tamu� Hotelmenurut� Bulan� dan� Klasifikasi�Hotel�(hari),�2009�2013�Average� Lengthof� Stay� of� Guest� byMonth� and� Classification(days),� 2009�2013�
�Diolah�dari�hasil�Survei�Tingkat�Penghunian�Kamar�Based�on�Room�Occupancy�Rate�Survey�
B�u�l�a�n�Month�
Hotel/�Hotels�
Bintang/�Classified� Melati/�NonClassified�Asing/�Foreign�
Dalam�Negeri/�Domestic�
Asing/�Foreign�
Dalam�Negeri/�Domestic�
(1)� (2)� (3)� (4)� (5)�� � � � �01.� Januari/�January� 1,58� 1,42� 1,41� 1,55�02.� Pebruari/�February� 2,46� 1,64� 1,28� 1,46�03.� Maret/�March� 1,88� 1,65� 1,16� 1,50�04.� April/�April� 1,50� 1,80� 1,20� 1,51�05.� Mei/�May� 2,00� 1,91� 1,06� 1,39�06.� Juni/�June� 1,58� 1,84� 1,07� 1,32�07.� Juli/�July� 2,49� 2,17� 1,06� 1,46�08.� Agustus/�August� 1,90� 1,77� 1,22� 1,44�09.� September/�September� 3,12� 1,74� 1,06� 1,64�10.� Oktober/�October� 2,05� 1,40� 1,18� 1,54�11.� November/�November� 1,82� 1,50� 1,49� 1,38�12.� Desember/�December� 2,15� 1,43� 1,03� 1,39�� � � � � �Rata�rata�/�Average� � � � �� 2�0�1�3� 2,04� 1,69� 1,19� 1,47�� 2�0�1�2� 1,79� 1,58� 1,24� 1,52�� 2�0�1�1� 1,60� 1,51� 1,38� 1,57�� 2�0�1�0� 1,37� 1,51� 1,10� 1,44�� 2�0�0�9� 1,59� 1,68� 1,94� 1,52�
� � � � � �
http
://sul
teng
.bps
.go.
id

Hotel dan Pariwisata
346 Sulawesi Tengah Dalam Angka 2014
10.2.�Pariwisata/Tourism��Tabel�Table� 10.2.1�
Jumlah�Kunjungan�Wisatawan�menurut�Kabupaten/Kota,2009���2013�Number�of�Tourist�Visitors�by�Regency/City,2009–2013�
(Kunjungan�/�Visits)��
Kabupaten/Kota�Regency/City�
Wisatawan�Asing/�Foreign�
Wisatawan�Dalam�Negeri/�Domestic�
(1)� (2)� (3)�
� � �
1.����Banggai�Kepulauan� �28� 12�231�2.����Banggai�� �51� 6�046�3.����Morowali� ...� ...�4.����Poso� �195� �572�5.����Donggala� 315� 65�275�6.����Tolitoli� �48� 1�975�7.����Buol� ...� ...�8.����Parigi�Moutong� ...� ...�9.����Tojo�Una�Una� 4�369� 4�261�10.��Sigi� 3� 23�11.��Banggai�Laut1)� ...� ...�12.��Morowali�Utara1)� ...� ...�13.��Palu� 1�206� 103�053�
� � �Sulawesi�Tengah� � �
2�0�1�3� 6�215� 193�436�2�0�1�2� 7�529� 2�015�052�2�0�1�1� 7�163� 1�672935�2�0�1�0� 6�325� 1�412�230�2�0�0�9� 5�272� 320�211�
� � � �
Sumber/Source� :� Dinas�Kebudayaan�dan�Pariwisata�Provinsi�Sulawesi�Tengah�Govt.�Service�of�Culture�and�Tourism�of�Sulawesi�Tengah�Province�
Catatan/Note�������:����1)�Tergabung�Dengan�Kabupaten�Induknya/�Include�in�main�regency�
�
http
://sul
teng
.bps
.go.
id

Hotel and Tourism
Sulawesi Tengah in Figures 2014 347
Tabel�
Table� 10.2.2�Jumlah� Rumah� Makan/Restoran,� Meja� dan� Kursi� menurut��Kabupaten/Kota,�2009�2013�Number�of�Restaurants,�Chairs�and�Desks�by��Regency/City,�2009�2013�
�
Kabupaten/Kota�Regency/City�
Rumah�Makan�Restaurant�
Meja�Desk�
Kursi�Chair�
(1)� (2)� (3)� (4)�� � � �
1.����Banggai�Kepulauan� �16� �19� �100�2.����Banggai�� �41� �294� 1�176�3.����Morowali� �46� �138� �550�4.����Poso� �17� �83� �330�5.����Donggala� �28� �60� �150�6.����Tolitoli� �25� �230� �919�7.����Buol� �41� �139� �556�8.����Parigi�Moutong� �41� �250� 1�024�9.����Tojo�Una�Una� �51� �484� 1�934�10.��Sigi� �10� �55� �380�11.��Banggai�Laut1)� ... ... ...
12.��Morowali�Utara1)� ... ... ...
13.��Palu� �218� 2�109� 8�436�� � � �
Sulawesi�Tengah�� � �
2013� �534� 3�861� 15�555�2012� 378� 1�645� 9�373�2011� 334� 2�088� 9�417�2010� 259� 1�536� 6�910�
2009� 215� 1�510� 5�510�
Sumber/Source� :� Dinas�Kebudayaan�dan�Pariwisata�Daerah�Provinsi�Sulawesi�Tengah�Regional�Govt.�Service�of�Culture�and�Tourism�of�Sulawesi�Tengah�Province�
Catatan/Note��������:����1)�Tergabung�Dengan�Kabupaten�Induknya/�Include�in�main�regency��
http
://sul
teng
.bps
.go.
id

Hotel dan Pariwisata
348 Sulawesi Tengah Dalam Angka 2014
������������ �
http
://sul
teng
.bps
.go.
id

Finance, Banking, and Prices
Sulawesi Tengah in Figures 2014 349
KEUANGAN,PERBANKAN,DAN HARGA
Finance, Banking and Price
http
://sul
teng
.bps
.go.
id

Keuangan, Perbankan, dan Harga-Harga
350 Sulawesi Tengah Dalam Angka 2014
http
://sul
teng
.bps
.go.
id

Finance, Banking, and Prices
Sulawesi Tengah in Figures 2014 351
11.��KEUANGAN,�PERBANKAN�DAN���������HARGA�HARGA��11.1.�Keuangan�Pemerintah�Daerah�
�Dalam� mengelola� anggaran� dan�
belanja� daerah� dianut� suatu� sistim�anggaran� yang� berimbang� dan� dinamis.�Sistim� berimbang� berarti� terdapat�keseimbangan� antara� penerimaan� dan�pengeluaran,� sedangkan� sistim� dinamis�berarti� terjadi� peningkatan� tabungan�pemerintah.�
�Realisasi� anggaran� penerimaan�
daerah� pada� tahun� anggaran� 2012�tercatat� 2.139,53� milyar� rupiah,� dengan�rincian� Pendapatan� asli� daerah� sebesar�611,93�milyar�rupiah,��Dana�perimbangan�1.158,37� milyar� rupiah,� Pendapatan�lainnya� yang� sah� 369,24� milyar� rupiah.�Sedang� realisasi� pengeluaran� belanja�daerah� pada� tahun� anggaran� 2012�tercatat� 2.013,02� milyar� rupiah,� yang�terbagi� dalam� belanja� tidak� langsung�961,12� milyar� rupiah� dan� belanja�langsung�1.051,91�milyar�rupiah.�
��
11.2.�Perbankan���Peranan� Perbankan� di� Sulawesi�
Tengah� sangat� besar� artinya� dalam� era�pembangunan� yang� berlangsung� saat� ini,�terutama� dalam� memperlancar� arus�peredaran� uang.� Kegiatan� tersebut�
11.��FINANCE,�BANKING,��AND��������PRICES��11.1.�Regional�Government�Finance��
The� budgetary� program� and�regional� expenditure� management� was�kept� to� take� the� dynamic� and� balanced,�budget� system.� The� balanced� system�means� a� balance� between� receipts� and�expenditures,� while� the� dynamic� system�means� there� was� an� additional�government�savings.��
Budgetary� realization� of� the�regional� revenue� in� the� budgetary� year�2012� recorded� � � 2,139.53� billion� rupiahs,�which� consisted� of� 611.93� billion� rupiahs�of� local� government� origin� receipts,�1.158.37�billion�rupiahs�of�balanced�fund,�and� 369.24� billion� rupiahs� of� other� legal�receipts.�While� expenditure� realization� in�budgetary� year� 2012� by� 2.013,02� billion�rupiahs� divided� into� two� kinds� of�expenditure:� indirect� (961.12� billion�rupiahs)�and�direct�expenditure� (1,051.91�billion�rupiahs).�
�11.2.�Banking��
Contribution� of� banking� sector� in�Sulawesi� Tengah� Province� is� very�important� to� the� current� development,�particularly� to� expedite� the� cash� flow�system.� In� 2013,� Sulawesi� Tengah�Province� has� bank� by� 220� units,� it�
http
://sul
teng
.bps
.go.
id

Keuangan, Perbankan, dan Harga-Harga
352 Sulawesi Tengah Dalam Angka 2014
dilaksanakan� oleh� lembaga� keuanganyang� berbentuk� kantor� Bank.� Propinsi�Sulawesi� Tengah� pada� tahun� 2013�memiliki� 220� buah� Kantor� Bank,� meliputi�kantor� pusat,� kantor� cabang,� dan� kantor�lainnya� (Cabang� Pembantu,� Kas,� dan�Unit).��
�Bank� Indonesia� cabang� Palu� turut�
serta� dalam� menyumbangkan� data� yang�dimuat� dalam� publikasi� ini.� Data� terakhir�yang� disajikan� adalah� data� akhir� tahun�anggaran�2013�seperti�terlihat�pada�tabel�11.2.1�s/d�11.2.10.��
�Gambaran� kegiatan� perbankan�
melalui� posisi� tabungan� perbankan�terlihat�semakin�meningkat�dari� tahun�ke�tahun.� Sementara� posisi� dana� perbankan�yang�tersedia�dari��10.306,59�miliar�rupiah�pada� keadaan� tahun� 2012� naik� � menjadi�11.330,36� miliar� rupiah� tahun� 2013� atau�naik�sebesar�9,93�persen,�yang�terdiri�dari�1.737,35� miliar� berupa� giro,� 1.919,92�miliar� rupiah� berupa� deposito� dan�7.673,10� miliar� rupiah� berupa� tabungan�(Tabel�11.2.5.).�
�Perputaran� kliring� di� wilayah��
Sulawesi� Tengah� dalam� tahun� 2013�sebanyak�146.345� lembar� warkat� dengan�nilai� nominalnya� sebesar� 5.328.564� juta�rupiah.�
�����
consisted�of�central�bank,�branch,�or�other�types�of�bank�(auxiliary,�treasury,�and�unit�offices).��
���Bank� Indonesia� of� Palu� has� taken�
place� in� contributing� data� in� this�publication.� Data� presented� in� this� book�are� data� at� the� end� of� budgetary� year�2013�as�shown�in�Table�11.2.1�to�11.2.10.���
Pattern� of� the� saving� position� of�banking�activities�tended�more�increasing�from�year�to�year.�Available�banking�fund�was� 10,306.59� � billion� rupiahs� in� 2012�then� increased� 9,93� percent� in� 2013� by�11,330.36�billion� rupiahs.� Its� composition�was�comprised�of�gyro�by�1,737.35�billion�rupiahs,� deposit� by� 1,919.92� billion�rupiahs,� and� saving� by� 7,673.10� billion�rupiahs,�(as�presented�in�Table�11.2.5).���
Clearing� cycle� in� region� of�Sulawesi� Tengah� for� 2013� was� recorded�146,345� sheets� of� paper� with� the� value�was�5,328,564�million�rupiahs.���
����
��
http
://sul
teng
.bps
.go.
id

Finance, Banking, and Prices
Sulawesi Tengah in Figures 2014 353
�11.3.�Asuransi�
�Kegiatan�perasuransian�di�Sulawesi�
Tengah� memperlihatkan� perkembangan�yang� menggembirakan,� baik� dari� jumlah�maupun� jenis� asuransi� yang� ditawarkan.��Dari� dua� tabel� yang� disajikan� (tabel�11.3.1.� dan� 11.3.2.)� dapat� diketahui�adanya� peningkatan� pada� pendapatan�premi�dan�jumlah�nasabah.��
���
11.4.�� Koperasi��
Koperasi� merupakan� soko� guru�perekonomian� di� Indonesia.� Peranan�koperasi� dalam� pembangunan� per�ekonomian� ialah� menghimpun� skala� �skala�usaha�kecil�dan�menjadikannya�lebih�besar� dengan� segala� aspeknya.� Juga�koperasi� digunakan� sebagai� alat� untuk�mem�berantas� para� rentenir/lintah� darat�yang� banyak� terdapat� di� daerah�pedesaan.�
�Kenyataan� menunjukkan� bahwa�
masyarakat,� khususnya� masyarakat� di�pedesaan� belum� memiliki� kekuatan�ekonomi�yang�cukup�untuk�mengembang�kan� usahanya� sendiri,� karenanya� mereka�memerlukan�bantuan�dan�bimbingan�dari�pemerintah�melalui�koperasi�yang�dikenal�sebagai� Koperasi� Unit� Desa� (KUD)� dan�koperasi� lainnya� yang� dapat� memberikan�pelayanan� kepada� setiap� anggotanya�
11.3.�Insurance��
Insurance� activities� in� Sulawesi�Tengah�shows�pleasant�progress,�either�in�number�of� insurance�or� type�of� insurance�service� offered� to� the� market.� From� two�tables� presented� (11.3.1� and� 11.3.2),� it�can� be� concluded� an� increasing� of�premium�income�and�customers.��
��
�� �11.4.�Cooperative��
Cooperative� is� foundation� for�economy� system� in� Indonesia.� Its� role� in�economic� development� is� compiling� the�small� scale� of� economic� business� and�making�them�to�the�bigger�business�in�all�aspects.� Cooperative� even�used�as�a�way�to�wipe�out�usurers� that�still�have�spread�over�particularly�in�rural�area.����
The� condition� of� rural� society�reflects� that� it� has� not� had� sufficiently�economic� power� yet� to� develop� their�business�by�themselves,�cause�them�need�aid� and� guidance� from� government�through�cooperatives�such�as�Village�Unit�Cooperative� (KUD),� and� other�cooperatives�which�could�give�services�for�every� member� especially� in� providing�foods,�oils,�and�other�daily�needs.�
http
://sul
teng
.bps
.go.
id

Keuangan, Perbankan, dan Harga-Harga
354 Sulawesi Tengah Dalam Angka 2014
terutama� dalam� menyediakan� pangan,minyak� dan� lain�lain� kebutuhan� sehari�hari.��
�Pada� tahun� 2013� jumlah� koperasi�
di� Sulawesi� Tengah� tercatat� sejumlah�2.155� � buah,� jumlah� ini� 5� persen� lebih�banyak� jika� dibandingkan� tahun� 2012�yang��mencapai�2.048�buah.�
�11.5.�Harga�Harga�dan�Inflasi��
Dalam� �usaha� �mengetahui� tingkat�pendapatan� � penduduk� dan� mengukur�tingkat� konsumsi� masyarakat� dibutuhkan�data�data� di� sektor� ekonomi� antara� lain�adalah� data� tenaga� kerja� dan�perkembangan� tingkat� harga.� Fluktuasi�harga� di� pasar� merupakan� salah� satu�indikator� utama� dalam� menggambarkan�stabilitas� perekonomian� suatu� negara�atau� daerah.� Berdasarkan� data� tersebut�dapat� dilihat� keseimbangan� antara�penawaran� (supply)� dengan� � permintaan�(demand)�akan�barang�dan�jasa�pada�saat�tertentu.��
�Dalam� publikasi� ini� disajikan�
beberapa� jenis� data� tentang� rata�rata�harga� produsen,� nilai� tukar� petani� serta�indeks�harga�konsumen�(IHK).�Sajian�data�rata�rata� harga� produsen� mencakup�harga� produsen� tanaman� palawija�(tabel.11.5.1),� harga� produsen� tanaman�sayuran� � tabel.11.5.2,� harga� produsen�tanaman�buah�buahan�tabel�11.5.3,�harga�produsen� tanaman� perkebunan� rakyat�
���
In�2013,�number�of� cooperatives� in�Sulawesi� Tengah� recorded� 2,155� units.�This�number�is�higher�than�a�previous�year�number,� which� reached� 2,048� units� or�increased�5�percent.��11.5.�Prices�and�Inflation��
As� measurement� of� income� rate�and� consumption� by� people� needed� data�of� economic� sector,� such� as� data� labor�force�and� trend�of�prices� rate.� The�prices�fluctuation� in�market� is� one� of� the�main�indicators� to� illustrate� a� nation� or� region�economy� stabilization.� From� the� data,�even� be� able� to� see� balance� between�supply�and�demand�of�goods�and�services�on�fixed�times.������
This� publication� presents� some�varied� data,� those� are� average� producer�prices,� farmer’s� term� of� trade� (FTT),� and�consumer� price� indices� (CPI).� Data� of�average�producer�prices�in�this�publication�include� producer� price� of� secondary� food�crops� (as� presented� in� Table� 11.5.1),�vegetables� (Table� 11.5.2),� fruits� (Table�11.5.3),� smallholders� estate� (Table�11.5.4),� and� smallholders� estate� product�
http
://sul
teng
.bps
.go.
id

Finance, Banking, and Prices
Sulawesi Tengah in Figures 2014 355
tabel� 11.5.4,� sementara� tabel� 11.5.5,harga� produsen� peternakan� besar� dan�kecil� ,� unggas� dan� hasil� peternakan�masing�masing� tabel� 11.5.6� sampai� tabel�11.5.7.�
�Indeks�Harga�Konsumen�(IHK)�yang�
merupakan� indikator� inflasi� suatu� daerah�yang� mencakup� tujuh� kelompok� barang�dan� jasa� yang� dikonsumsi� masyarakat,�mulai�dari�bahan�makanan,�makanan�jadi,�minuman,� rokok� dan� tembakau� sampai�dengan�transpor�dan�komunikasi�disajikan�dalam�tabel�11.5.15.�
�Laju� Inflasi� yang� terjadi� � di� Kota�
Palu� tahun�2013� (Januari� s.d.�Desember),�secara�umum�adalah�sebesar�7,57�persen.�Dilihat� dari� kelompok� pengeluaran�konsumsi�masyarakat,�laju�inflasi�tertinggi�pada� tahun� 2013� (Januari� s/d� Desember)�terjadi� pada� kelompok� transpor� dan�komunikasi� sebesar� 12,14� persen,��kelompok�makanan�jadi,�minuman,�rokok�dan� tembakau� sebesar� � 11,01� persen,�kemudian�kelompok�bahan�makanan�7,58�persen,� kelompok� pendidikan� rekreasi�dan� olahraga� 6,10� persen,� kelompok�perumahan� sebesar� 3,94� persen,�kelompok�kesehatan�sebesar�1,48�persen,��serta�sandang�1,48�persen.�
�����
(Table� 11.5.5).� Whereas,� producer� prices�of� large� and� smallest� livestock,� poultry,�and� livestock� product� presented� in� Table�11.5.6�up�to�Table�11.5.7.��
�Consumer� Price� Indices� (CPI)� is�
inflation� indicator� in� a� region� covered�seven� consumption� groups� of� goods� and�services� that� began� with� group� of�foodstuff,� group� of� prepared� food,�beverage,� cigarette� and� tobacco,� up� to�transportation�and�communication�group,�as�presented�in�Table�11.5.15.�
�Inflation� rate� in� Palu� City� in� 2013�
(January� to� December)� reached� 7.57�percent.� Pattern� of� people� consumption�by� expenditure� groups,� followed� by�comunication�and� transportation� � groups�12.14� percent,� prepared� food� beverage�and� tobacco� group� was� 11.01� percent,�foodstuff� group� 7.58� percent,� education,�recreation� &� sport� groups� 6.10� percent,�housing�group�3.94�percent,��health�group�was� 1.48� percent,� Then,� clothing� group�1.48�percent.�
��������
��
http
://sul
teng
.bps
.go.
id

Keuangan, Perbankan, dan Harga-Harga
356 Sulawesi Tengah Dalam Angka 2014
�
http
://sul
teng
.bps
.go.
id

Su
1
1
lawesi Tengah in
Gambar
Figure� 1
8,69
0
2
4
6
8
10
12
2006
n Figures 2014
11.1� PerkemTrend�o
98,13
2007
mbangan�Laju�Inof�General�Infla
10,4
2008 2009
nflasi�Umum,�2tion�Rate,�2006
5,73
6,4
9 2010
Finance
2006�–�2013�6�–�2013�
4,47
2011
e, Banking, and P
5,87
2012 2013
Prices
357
7,57
3ht
tp://s
ulte
ng.b
ps.g
o.id

Keuangan, Perbankan, dan Harga-Harga
358 Sulawesi Tengah Dalam Angka 2014
http
://sul
teng
.bps
.go.
id

Finance, Banking, and Prices
Sulawesi Tengah in Figures 2014 359
11.���KEUANGAN,�PERBANKAN,�DAN�HARGA�HARGA/�FINANCE,�BANKING,�AND�PRICES�11.1. Keuangan�Pemerintah�Daerah�/Autonomy�Government�Finance�
�
���
Tabel�
Table� � 11.1.1�Rencana� Penerimaan� Daerah� Otonom� Provinsi� Sulawesi� Tengah,� 2013�(Juta�Rupiah)��Revenues� Program� of� � Autonomous� Regional� � Sulawesi� Tengah� Province,�2013�(Million�Rupiahs)�
Jenis�Penerimaan�Kind�of�Revenues�
APBD�Penerimaan��Regional�Budgetary�
Revenue�(1)� (2)�
� � �
� Pendapatan�Daerah/�Local�Revenue�(1+2+3)� �1�962�393�1� Pendapatan�Asli�Daerah/�Domestic�Revenue� ��605�821�1.1� Pajak�Daerah�/�Local�Taxes� ��494�753�1.1.1� Pajak�Kendaraan�Bermotor�/�Motor�Vehicles�Taxes� ��1.1.2� Pajak�Kendaraan�Di�Air�/�Vehicle�On�Waters�Taxes� ��1.1.3� Bea�Balik�Nama�Kendaraan�Bermotor/�Transfer�The�Title�Of�
Ownership�Cost�Of�The�Motor�Vehicles� ��240�956�
1.1.4� Bea�Balik�Nama�Kendaraan�Di�Air/�Transfer�The�Title�Of�Ownership�Cost�Of�The�Vehicles�On�Water� ��
1.1.5� Pajak�Bahan�Bakar�Kendaraan�Bermotor/�Fuel�Oil�Of�The�Motor�Vehicles� ��119�351�
1.1.6� Pajak�Air�Permukaan/�Use�Of�Surface�Waters�Taxes� ��1.1.7� Lainnya/�Others� ��� �
�1.2� Retribusi�Daerah/�Local�Retribution� ��3�124�1.2.1� Rertibusi�Jasa�Umun/�General�Services�Retribution� ���550�1.2.1.1� Retribusi�Pelayanan�Kesehatan/�
Health�Services�Retribution� ���435�1.2.1.2� Retribusi�Pengujian�Kendaraan�Bermotor/�
Retribution�Of�The�Motor�Vehicles�Testing� ��
1.2.1.3� Retribusi�Penggantian�Biaya�Cetak�Peta/�Retribution�Of�Print�Out�Of�Maps�Cost� ���8�
1.2.1.4� Retribusi�Pelayanan�Tera/Tera�Ulang�Retribution�Of�The�Fishery�Ships�Testing� ���107�
1.2.1.5� Retribusi�Pelayanan�Pendidikan/�Retribution�of�Education�Services�
����
1.2.2� Retribusi�Jasa�Usaha/�Buisness�Services�Retribution� 2�530�
http
://sul
teng
.bps
.go.
id

Keuangan, Perbankan, dan Harga-Harga
360 Sulawesi Tengah Dalam Angka 2014
Lanjutan�Tabel�/�Continued�Table��11.1.1��
Jenis�Penerimaan/�Kind�of�Revenues�
APBD�Penerimaan/�Regional�Budgetary�
Revenue�(1)� (2)�
1.2.2.1� Retribusi�Pemakaian�Kekayaan�DaerahRetribution�Use�Of�The�Domestic�Resources 953�
1.2.2.2� Retribusi�Tempat�Pelelangan/�Retribution�Of�Auction ��1.2.2.3� Retribusi�Tempat�Penginapan/Pesanggarahan/Villa/�
Retribution�Of�Lodges/Villas� ���689�1.2.2.4� Retribusi�Pelayanan�Kepelabuhan/Retribution�Of�Port�Service ���107�1.2.2.5� Retribusi�Tempat�Rekreasi�Dan�Olah�Raga/�Retribution�Of�
The�Sport�And�Recreation�Places ���14�1.2.26� Retribusi�Penyeberangan�di�Air/�Retribution�Of�Water�
Crossing� ���51�1.2.2.7� Retribusi�Pengolahan�Limbah�Cair/�Retribution�Of�The�Liquid�
Waste�Processing� ��
1.2.2.8� Retribusi�Penjualan�Produksi�Usaha�Daerah/�Sale�Retribution�Of�The�Local�Enterprises�Product ���715�
1.2.2.9� Lainnya/�Others� ��1.2.3� Retribusi�Perizinan�Tertentu�/�Retribution�Of�Licenses ���44�1.2.3.1� Retribusi�Izin�Taryek/�Retribution�of�The Route�Licenses ���14�1.2.3.2� Retribusi�Izin�Usaha�Perikanan/�Retribution�of�Fishery�
Licenses� ���30�1.3� Hasil�Pengelolaan�Kekayaan�Daerah�yang�Dipisahkan/
Separated�Local�Resources�Management ��5�475�1.3.1� Bagian�Laba�Perusahaan�Milik�Daerah/BUMD/�Profit�Share�
of��Local�Government�Enterprises ��5�141�1.3.2� Bagian�Laba�Perusahaan�Milik�Pemerintah/BUMN/�Profit�
Share�of�Central�Government�Enterprises ��
1.3.3� Bagian�Laba�Perusahaan�Milik�Swasta/�Profit�Share�of�Private�Enterprises� ���334�
1.3.4� Lainnya/�Others� ��1.4� Lain�Lain�Pendapatan�Asli�Daerah�yang�Sah
The�Legally�Domestic�Revenues� ��102�470�1.4.1� Hasil�Penjualan�Aset�Daerah�Yang�Tidak�Dipisahkan/�Sale�Of�
The�Domestic’s�Asset�Unities� ���430�1.4.2� Jasa�Giro/�Clearing�Services�Incomes ��17�785�1.4.3� Pendapatan�Bunga/�Deposit�Interest�Incomes ����
http
://sul
teng
.bps
.go.
id

Finance, Banking, and Prices
Sulawesi Tengah in Figures 2014 361
Lanjutan�Tabel�/�Continued�Table�11.1.1�� �
Jenis�Penerimaan�Kind�of�Revenues�
APBD�Penerimaan�Regional�Budgetary�
Revenue�(1)� (2)�
1.4.4� Tuntutan�Ganti�Rugi/�Compensation�Incomes� ��1.4.5� Komisi,�Potongan�dan�Keuntungan�Selisih�Nilai�Tukar�Rupiah/�
Comissions�and�Margins�of�Exchanges�Rate���
1.4.6� Pendapatan�Denda�Keterlambatan�Pelaksanaan�Pekerjaan/�Fine�of�Carrying�Late�Jobs�Incomes�
���397�
1.4.7� Pendapatan�Denda�Pajak/�Fine�of�Taxes�Incomes� ��3�990�1.4.8� Pendapatan�Denda�Retribusi/�Fine�of�Retribution�Incomes� ��1.4.9� Pendapatan�Hasil�Eksekusi�Jaminan/�Execution�of�Collateral�
Incomes���
1.4.10� Pendapatan�dari�Pengembalian/�Return�Incomes� ��12�843�1.4.11� Fasilitas�Sosial�dan�Fasilitas�Umum/�Social�and�Public�Facilities�
Incomes���
1.4.12� Pendapatan�dari�Penyelenggaraan�Pendidikan�Pelatihan/�Education�and�Training�Organization�Incomes�
��2�750�
1.4.13� Pendapatan�dari�Angsuran/Cicilan�Penjualan/�Selling�Installments�Incomes�
��
1.4.14� Pendapatan�dari�Penyelenggaraan�Pelayanan/�Services�Organization�Incomes�
��64�276�
� �2� Dana�Perimbangan�/�Balanced�Funds� �1�042�927�2.1.� Dana�Bagi�Hasil�Pajak�dan�Bukan�Pajak/�Tax�and�Non�Tax�
Sharing�Incomes���97�602�
2.1.1� Bagi�Hasil�Pajak�/�Tax�Sharing� ��83�176�2.1.1.1� Pajak�Bumi�Dan�Bangunan/�Land�And�Building�Taxes� ��49�152�2.1.1.2� Bea�Perolehan�Hak�Atas�Tanah�Dan�Bangunan/��
The�Obtainable�Cost�Of�Right�On�Tax�And�Building���
2.1.1.3� Pajak�Penghasilan�Orang�Pribadi(Termasuk�PPh�Pasal�21)/�Personal�Income�Taxes�(article�of�21)�
��33�047�
2.1.1.4� Lainnya/�Others� ���977�
��� �
http
://sul
teng
.bps
.go.
id

Keuangan, Perbankan, dan Harga-Harga
362 Sulawesi Tengah Dalam Angka 2014
Lanjutan�Tabel�/�Continued�Table��11.1.1�� �
Jenis�Penerimaan�Kind�of�Revenues�
APBD�Penerimaan�Regional�Budgetary�
Revenue�(1)� (2)�
2.1.2� Bagi�Hasil�Bukan�Pajak/Sumber�Daya�Alam/�Non�Tax/Resources�Sharing�
��14�426�
2.1.2.1� Iuran�Hak�Pengusahaan�Hutan�(IHPH)/�Dues�Of�Forest�Exertion�Right�
��
2.1.2.2� Provisi�Sumber�Daya�Hutan�(PSDH)/�Profit�Of�Forest�Resource� ���606�
2.1.2.3� Dana�Reboisasi/�Reboisation�Funds� ��
2.1.2.4� Iuran�Tetap/Landrent/�Definite�Dues� ��1�530�
2.1.2.5� Iuran�Eksplorasi�dan�Eksploitasi/�Dues�Of�Exploration�and�Expoitation�
��11�027�
2.1.2.6� Pungutan�Pengusahaan�Perikanan/�Levies�Of�Fishery�Exertion�Incomes�
��
2.1.2.7� Pungutan�Hasil�Perikanan�/�Levies�Of�Fishery�Product�Incomes�
��
2.1.2.8� Pertambangan�Minyak�Bumi/�Petroleum�Quarrying�Incomes� ��1�263�2.1.2.9� Pertambangan�Gas�Bumi/�Natural�Gas�Quarrying�Incomes� ��2.1.2.10� Pertambangan�Panas�Bumi/�Geothermal�Quarrying�Incomes� ��2.1.2.11� Lainnya/�Others� ��2.2� Dana�Alokasi�Umum(DAU)/�General�Allocation�Funds� ��902�088�2.3� Dana�Alokasi�Khusus(DAK)/�Specific�Allocation�Funds� ��43�237�3� Lain�Lain�Pendapatan�yang�Sah/�Other�Validity�Of��The�
Domestic�Revenues���313�645�
3.1� Pendapatan�Hibah� ��5�140�3.2� Dana�Darurat/�Emergency�Funds� ��3.3� Dana�Bagi�Hasil�Pajak�dari�Provinsi�dan�Pemda�Lain/�Tax�
Share�from�Other�Regions�Funds���
3.4� Dana�Penyesuaian�dan�Otonomi�Khusus/�Adjustment�and�Specific�Autonomous�Funds�
��308�505�
3.5� Bantuan�Keuangan�dari�Provinsi�atau�Pemerintah�Daerah�Lainnya/�Funds�Aid�from�Other�Regions�Government� ��
Sumber/Source� :� Sekretariat��Daerah�Provinsi�Sulawesi�Tengah�Regional�Secretariat�of�Sulawesi�Tengah�Province�
�
http
://sul
teng
.bps
.go.
id
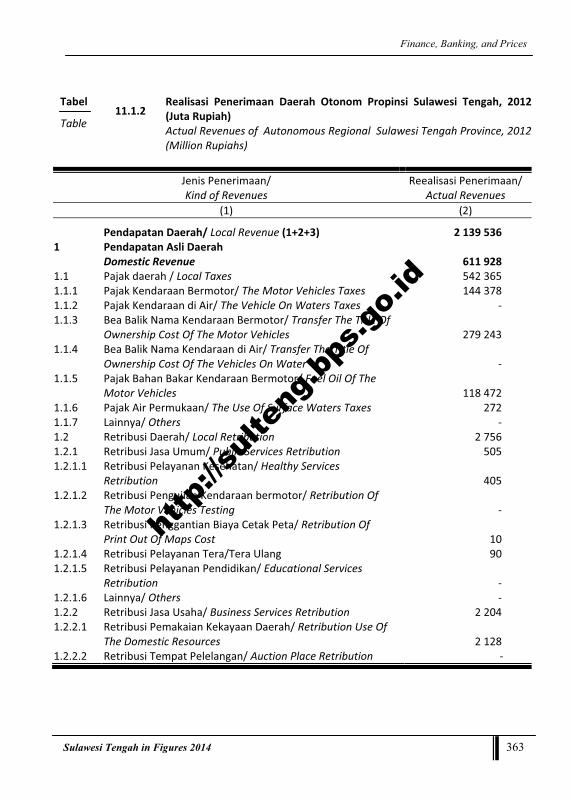
Finance, Banking, and Prices
Sulawesi Tengah in Figures 2014 363
Tabel�
Table� 11.1.2�Realisasi� Penerimaan� Daerah� Otonom� Propinsi� Sulawesi� Tengah,� 2012�(Juta�Rupiah)��Actual�Revenues�of��Autonomous�Regional��Sulawesi�Tengah�Province,�2012�(Million�Rupiahs)�
�
Jenis�Penerimaan/�Kind�of�Revenues�
Reealisasi�Penerimaan/�Actual�Revenues��
(1)� (2)�� � �
� Pendapatan�Daerah/�Local�Revenue�(1+2+3)� �2�139�536�1� Pendapatan�Asli�Daerah�
Domestic�Revenue� ��611�928�1.1� Pajak�daerah�/�Local�Taxes� ��542�365�1.1.1� Pajak�Kendaraan�Bermotor/�The�Motor�Vehicles�Taxes� ��144�378�1.1.2� Pajak�Kendaraan�di�Air/�The�Vehicle�On�Waters�Taxes� ��1.1.3� Bea�Balik�Nama�Kendaraan�Bermotor/�Transfer�The�Title�Of�
Ownership�Cost�Of�The�Motor�Vehicles� ��279�243�1.1.4� Bea�Balik�Nama�Kendaraan�di�Air/�Transfer�The�Title�Of�
Ownership�Cost�Of�The�Vehicles�On�Water� ��1.1.5� Pajak�Bahan�Bakar�Kendaraan�Bermotor/�Fuel�Oil�Of�The�
Motor�Vehicles� ��118�472�1.1.6� Pajak�Air�Permukaan/�The�Use�Of�Surface�Waters�Taxes� ���272�1.1.7� Lainnya/�Others� ��1.2� Retribusi�Daerah/�Local�Retribution� ��2�756�1.2.1� Retribusi�Jasa�Umum/�Public�Services�Retribution� ���505�1.2.1.1� Retribusi�Pelayanan�Kesehatan/�Healthy�Services�
Retribution� ���405�1.2.1.2� Retribusi�Pengujian�Kendaraan�bermotor/�Retribution�Of�
The�Motor�Vehicles�Testing� ��1.2.1.3� Retribusi�Penggantian�Biaya�Cetak�Peta/�Retribution�Of�
Print�Out�Of�Maps�Cost� ���10�1.2.1.4� Retribusi�Pelayanan�Tera/Tera�Ulang� ���90�1.2.1.5� Retribusi�Pelayanan�Pendidikan/�Educational�Services�
Retribution� ��1.2.1.6� Lainnya/�Others� ��1.2.2� Retribusi�Jasa�Usaha/�Business�Services�Retribution� ��2�204�1.2.2.1� Retribusi�Pemakaian�Kekayaan�Daerah/�Retribution�Use�Of�
The�Domestic�Resources� ��2�128�1.2.2.2� Retribusi�Tempat�Pelelangan/�Auction�Place�Retribution� ��
�� �
http
://sul
teng
.bps
.go.
id

Keuangan, Perbankan, dan Harga-Harga
364 Sulawesi Tengah Dalam Angka 2014
Lanjutan�Tabel�11.1.2�� � �
Jenis�Penerimaan�Kind�of�Revenues�
Reealisasi�Penerimaan�Actual�Revenues�
(1)� (2)�1.2.2.3� Retribusi�Tempat�Penginapan/Pesanggrahan/Villa/�
Retribution�Of�Lodges/Villas���
1.2.2.4� Retribusi�Pelayanan�Kepelabuhan/�Port�Services�Retribution�
��
1.2.2.5� Retribusi�Tempat�Rekreasi�dan�Olahraga/�Retribution�Of�The�Sport�And�Recreation�Places�
���76�
1.2.2.6� Retribusi�Penyeberangan�di�Air/�Retribution�Of�The�Crossings�On�Water�
��
1.2.2.7� Retribusi�Pengolahan�Limbah�Cair/�Retribution�Of�The�Liquid�Waste�Processing�
��
1.2.2.8� Retribusi�Penjualan�Produksi�Usaha�Daerah/�Sale�Retribution�Of�The�Local�Enterprises�Product�
��
1.2.2.9� Retribusi�Pasar�Grosir/Pertokoan/�The�Wholesales�And�Shopping�Complex�Retribution�
��
1.2.2.10� Retribusi�Jembatan�Timbang/�truck�weighing�station� ��1.2.2.11� Retribusi�Tempat�Pendaratan�Kapal/�Retribution�Of�The�
Ship�Docking���
1.2.2.12� Retribusi�Pengujian�kapal�Perikanan/�Retribution�Of�The�Fishery�Ships�Testing�
��
1.2.2.13� Retribusi�Pelayanan�Tera/Tera�Ulang� ��1.2.2.14� Retribusi�Pelayanan�Pelabuhan�Laut/�Port�Services�
Retribution���
1.2.3� Retribusi�Perizinan�Tertentu/�specific�licenses�retribution� ��1.2.3.1� Retribusi�Izin�Trayek/�The�Route�Licenses�retribution� ���48�1.2.3.2� Lainnya/�Others� ���18�1.3� Hasil�Pengelolaan�Kekayaan�Daerah�yang�Dipisahkan/�
Product�Domestic’s�Enterprises�And�The�Separately�Local�Resources�Management�
���29�
1.3.1� Bagian�laba�Atas�Penyertaan�modal�pada�perusahaan�Milik�Daerah/BUMD/�The�Profit�Of�Enclosing�Capital�to�Domestic’s�Enterprises�
��19�932�
1.3.2� Bagian�Laba�Atas�penyertaan�Modal�pada�Perusahaan�Milik�Pemerintah/BUMN/�The�Profit�Of�Enclosing�Capital�to�National’s�Enterprises�
��
�� �
http
://sul
teng
.bps
.go.
id

Finance, Banking, and Prices
Sulawesi Tengah in Figures 2014 365
Lanjutan�Tabel��/�Continued�Table��11.1.2�� �
Jenis�Penerimaan�Kind�of�Revenues�
Reealisasi�Penerimaan�Actual�Revenues�
(1)� (2)�1.3.3� Bagian�laba�atas�penyertaan�modal�pada�perusahaan�Milik�
Swasta�/�The�Profit�Of�Enclosing�Capital�to�Private’s�Enterprises�
���118�
1.3.4� Bagian�laba�lembaga�keuangan/�Finance�institution�profit� ��1.4� Lain�lain�pendapatan�asli�daerah�yang�sah/�The�Legally�
Domestic�Revenues���46�875�
1.4.1� Hasil�penjualan�aset�daerah�yang�tidak�dipisahkan/�Sale�Of�The�Domestic’s�Asset�Unities�
���201�
1.4.2� Jasa�giro�/�Clearing�Services� ��3�903�1.4.3� Pendapatan�bunga�/�Interest�Incomes� ��1.4.4� Tuntutan�ganti�rugi�(Tgr)�/�Compensation�Demand� ���282�1.4.5� Komisi,�potongan�dan�keuntungan�selisih�nilai�tukar�rupiah�
Tip,�devaluation�and�profit�of�differences�of�money�changer����
1.4.6� Pendapatan�Denda�Atas�Keterlambatan�Pelaksanaan�Pekerjaan/�Fine�Incomes�Of�Carrying�Lately�Out�Of�Job�
���115�
1.4.7� Pendapatan�Denda�Pajak�/�Taxes�Fine�Incomes� ��1�500�1.4.8� Pendapatan�Denda�Retribusi�/�Retribution�Fine�Incomes� ��1.4.9� Pendapatan�Hasil�Eksekusi�Atas�Jaminan�
Incomes�Of�Execution�Product�Of�Guarantee����
1.4.10� Pendapatan�dan�Pengembalian�/�Reversions�And�Incomes� ��1�100�1.4.11� Fasilitas�Sosial�Dan�Fasilitas�Umum�
Social�And�Public�Facilities���
1.4.12� Pendapatan�Dan�Penyelenggaraan�Pendidikan�Dan�Pelatihan�Incomes�And�Implementations�Of�Education�And�Training�
��
1.4.13� Pendapatan�Dari�Angsuran/Cicilan�Penjualan�Incomes�Of�Sales�Installment�
��
1.4.14� Lainnya/�Others� 39�774�� �
���� � �
http
://sul
teng
.bps
.go.
id

Keuangan, Perbankan, dan Harga-Harga
366 Sulawesi Tengah Dalam Angka 2014
Lanjutan�Tabel�/�Continued�Table��11.1.2��
Jenis�Penerimaan�Kind�of�Revenues�
Reealisasi�Penerimaan�Actual�Revenues�
(1)� (2)�2� Dana�Perimbangan�/�Balanced�Funds� �1�158�371�2.1� Dana�Bagi�Hasil�Pajak/Bagi�Hasil�Bukan�Pajak�
Funds�of�taxes�and�non�taxes�sharing�� ��97�763�2.1.1� Bagi�Hasil�Pajak/�taxes�sharing� ��84�506�2.1.1.1� Pajak�Bumi�dan�Bangunan/�land�and�building�taxes� ��57�382�2.1.1.2� Bea�perolehan�Hak�atas�Tanah�dan�Bangunan/�The�
Obtainable�Cost�Of�Right�On�Tax�And�Building� ��2.1.1.3� Pajak�Penghasilan�(PPh)�Pasal�25�dan�Pasal�29�Wajib�Pajak�
Orang�Pribadi�dalam�Negeri�dan�PPh�Pasal�21/�Personal�Income�Taxes,�articles�of�21,�25,�and�29.� ��27�124�
2.1.2� Bagi�Hasil�Bukan�Pajak/Sumber�Daya�Alam/�Non�Taxes�sharing/resources� ��13�257�
2.1.2.1� Iuran�Hak�Pengusahaan�Hutan�(IHPH)/�Dues�Of�Forest�Exertion�Right� ��
2.1.2.2� Provisi�Sumber�Daya�Hutan�(PSDH)/�Profit�Of�Forest�Resource� ���737�
2.1.2.3� Dana�Reboisasi/�reforestation�funds� ��2.1.2.4� Iuran�Tetap�(Land�Rent)/�Definite�Dues� ��4�640�2.1.2.5� Iuran�Eksplorasi�dan�Iuran�Eksploitasi�(Royalti)/�Dues�Of�
Exploration�and�Exploitation� ��6�880�2.1.2.6� Pungutan�Perusahaan�Perikanan/�/�Levies�Of�Fishery�
Exertion� ��2.1.2.7� Pungutan�Hasil�Perikanan/�Levies�Of�Fishery�Product� ��2.1.2.8� Pertambangan�Minyak�Bumi/�Petroleum�Quarrying� ��1�000�2.1.2.9� Pertambangan�Gas�Bumi/�Natural�Gas�Quarrying� ��2.1.2.10� Pertambangan�Panas�Bumi/�Geothermal�Quarrying� ��2.2� Dana�Alokasi�Umum�(DAU)�)/�General�Allocation�Funds� ��994�659�2.3� Dana�Alokasi�Khusus�(DAK)�)/�Specific�Allocation�Funds� ��65�949�2.3.1� Dana�Alokasi�Khusus�Reboisasi/�Reforestation�� ��43�722�2.3.2� Dana�Alokasi�Khusus�Non�Reboisasi/�Non�Reforestation�
��22�227�
�� �
http
://sul
teng
.bps
.go.
id

Finance, Banking, and Prices
Sulawesi Tengah in Figures 2014 367
Lanjutan�Tabel�/�Continued�Table��11.1.2��
Jenis�Penerimaan�Kind�of�Revenues�
Reealisasi�Penerimaan�Actual�Revenues�
(1)� (2)�� �
3� Lain�Lain�Pendapatan�Daerah�yang�Sah/�Other�Validity�Of�The�Domestic�Revenues�
��369�237�
3.1� Pendapatan�Hibah�/�Bequest�Incomes� ��7�427�
3.1.1� Pendapatan�Hibah�Dari�Pemerintah�/�Incomes�Of�The�Governmental�Bequest�
��6�124�
3.1.2� Pendapatan�Hibah�Dari�Pemerintah�Daerah�Lainnya�Incomes�Of�The�Other�Region�Government�Bequest�
��
3.1.3� Pendapatan�Hibah�Dari�Badan/Lembaga/Organisasi�Swasta�Dalam�Negeri�/�Incomes�Of�The�Privately�Domestic�Institution/Organization�Bequest�
��1�303�
3.1.4� Pendapatan�Hibah�Dari�Kelompok�Masyarakat/Perorangan�Incomes�Of�An�Individual/Communities�Group�Bequest�
��
3.1.5� Lainnya�/�other� ��
3.2� Dana�Darurat/�Emergency�Funds� ��
3.3� Dana�Bagi�Hasil�Pajak�dari�Propinsi�dan�Pemerintah�Daerah�Lainnya/�Taxes�Sharing�Funds�Of�Province�And�Other�Region�Government�
��
3.4� Dana�Penyesuaian�Dan�Otonomi�Khusus/�Funds�Of�Adjustment�And�Specific�Autonomy��
��361�810�
3.5� Bantuan�Keuangan�dari�Provinsi�Atau�Pemerintah�Daerah�Lainnya�/�Finance�Aids�Of�Province�Or�Other�Region�Government�
��
3.6� Pendapatan�Lainnya�/�other�Incomes� ��
Sumber/Source� :� Sekretariat��Daerah�Provinsi�Sulawesi�Tengah�Regional�Secretariat�of��Sulawesi�Tengah�Province�
�
http
://sul
teng
.bps
.go.
id

Keuangan, Perbankan, dan Harga-Harga
368 Sulawesi Tengah Dalam Angka 2014
Tabel�
Table� 11.1.3�Realisasi�Pengeluaran�Daerah�Otonom�Provinsi�Sulawesi�Tengah,��2012�(Juta�Rupiah)��Actual�Autonomous�Regional��Expenditures�of��Sulawesi�Tengah,�2012�(Million�Rupiahs)�
�
Jenis�Pengeluaran�Kind�of�Expenditures�
Realisasi�Pengeluaran�Actual�Expenditures�
(1)� (2)�� �
� Belanja�Daerah/�Regional�Expenditures� 2�013�022�1� Belanja�Tidak�Langsung/�Indirect�Expenditures� 961�116�1.1� Belanja�Pegawai/�Workers�Expenditure� 339�580�1.1.1� Gaji�dan�Tunjangan/�Subsidies�and�salaries� 302�529�1.1.2� Tambahan�penghasilan�PNS/�additional�incomes�of�the�
official�servants� 13�574�
1.1.3� Belanja�Penerimaan�Lainnya�Pimpinan�dan�Anggota�DPRD�serta�KDH/WKDH�Other�incomes�Expenditures�of�Assembly�at�regional�head�and�members,�including�regional�head/assistant�
6�382�
1.1.4� Biaya�Pemungutan�Pajak�Daerah/�regional�taxes�Levies�cost� 17�095�1.2� Belanja�Bunga/�interest�expenditures� �169�1..3� Belanja�Subsidi/�subsidy�expenditures� ��1.4� Belanja�Hibah/�bequest�expenditures� 350�880�1.5� Belanja�Bantuan�Sosial/�social�aid�expenditures� 6�705�1.5.1� Belanja�Bantuan�Sosial�Organisasi�Kemasyarakatan/�social�
aid�expenditures�of�the�social�organization���6�705�
1.5.2� Belanja�Bantuan�Partai�Politik�/�Political�Party�Aid�Expenditure�
��
1.6� Belanja�Bagi�Hasil�kepada�Provinsi/Kabupaten/Kota�dan�Pemerintah�Desa�
221�450�
1.6.1� Belanja�Bagi�Hasil�Pajak�Daerah�kepada�Provinsi� ��1.6.2� Belanja�Bagi�Hasil�Pajak�Daerah�kepada�Kabupaten/Kota� 221�349�1.6.3� Belanja�Bagi�Hasil�Retribusi�Daerah�kepada�
Kabupaten/Kota��101�
1.7� Belanja�Bantuan�Keuangan�kepada�Provinsi/Kabupaten/Kota�dan�Pemerintah�Desa�
41�099�
1.8� Belanja�Tidak�Terduga� 1�233�
�� �
http
://sul
teng
.bps
.go.
id

Finance, Banking, and Prices
Sulawesi Tengah in Figures 2014 369
Lanjutan�Tabel�/�Continued�Table��11.1.3���� �
Jenis�Pengeluaran�Kind�of�Expenditure�
Realisasi�Pengeluaran�Actual�Expenditures�
(1)� (2)�� �
2� Belanja�Langsung�Direct�Expenditure�
1�051�906�
2.1� Belanja�Pegawai�Employee�Expenditure�
114�425�
2.1.1� Honorarium�PNS�State�Employee�Honorary�Fee�
50�902�
2.1.2� Honorarium�Non�PNS�Non�State�Employee�Honorary�Fee�
37�332�
2.1.3� Uang�lembur�Overtime�Fee�
3�139�
2.1.4� Belanja�beasiswa�pendidikan�PNS�State�Employee�Scholarship�Expenditure�
��
2.1.5� Belanja�kursus,�pelatihan,�sosialisasi,�dan�bimbingan�teknis�PNS�Course,�Training,�Socialization,�and�Technical�Guidance�for�State�Employee�
�478�
2.2� Belanja�barang�dan�jasa�Goods�and�Services�Expenditure�
22�574�
2.3� Belanja�modal�Capital�Expenditure�
612�619�
� � �
Sumber/Source� :� Sekretariat��Daerah�Provinsi�Sulawesi�Tengah�Regional�Secretariat�of��Sulawesi�Tengah�Province�
http
://sul
teng
.bps
.go.
id

Keuangan, Perbankan, dan Harga-Harga
370 Sulawesi Tengah Dalam Angka 2014
Tabel�
Table� 11.1.4�Realisasi�Penerimaan�Daerah�Otonom�Kabupaten/Kota,�2012�(Juta�Rupiah)��Actual�Autonomous�Region�Receipts�by�Regency/City,�2012�(Million�Rupiahs)�
�
Kabupaten/Kota�Regency/City�
Pendapatan�Asli�Daerah�Domestic�Revenue�
Dana�Perimbangan�Balancing�Fund
Lain�lain�Pendapatan�Daerah�yang�
Sah�Other�Validity�
of�The�Domestic�Revenues�
Jumlah�Total�
(1)� (2)� (3)� (4)� (5)�� � � � �
01.�Banggai�Kepulauan� 13�500� 458�445� 67�664� 539�609�
02.�Banggai� 51�508� 685�239� 125�698� 862�445�
03.�Morowali� 30�528� 679�659� 59�550� 769�737�
04.�Poso� 26�224� 603�141� 92�496� 721�861�
05.�Donggala� 36�201� 563�775� 67�272� 667�248�
06.�Tolitoli� 19�316� 499�242� 48�797� 567�355�
07.�Buol� 16�352� 425�041� 37�318� 478�711�
08.�Parigi�Moutong� 28�919� 620�803� 76�388� 726�110�
09.�Tojo�Una�Una� 26�766� 455�246� 51�325� 533�337�
10.�Sigi� 11�582� 513�922� 55�764� 581�268�
11.�Banggai�Laut1)� …� …� …� …�
12.�Morowali�Utara1)� …� …� …� …�
13.�Palu� 108�409� 585�378� 158�033� 851�820�
� � � � �
Sumber/Source� :� Sekretariat��Daerah�Provinsi�Sulawesi�Tengah,�Kabupaten/Kota�Regional�Secretariat�of��Sulawesi�Tengah�Province,�Regency/City�
Catatan/Note�������:����1)�Tergabung�Dengan�Kabupaten�Induknya/�Include�in�main�regency�
http
://sul
teng
.bps
.go.
id

Finance, Banking, and Prices
Sulawesi Tengah in Figures 2014 371
�Tabel�
Table� 11.1.5�Realisasi� Pengeluaran� Daerah� Otonom� Kabupaten/Kota,� 2012���(Juta�Rupiah)��Actual�Autonomy�Expenditures�by�Regency/City,�2012�(Million�Rupiahs)�
�
Kabupaten/Kota�Regency/City�
Belanja�Langsung�Direct�Expenditure�
Belanja�Tidak�Langsung�
Indirect�Expenditure�
Jumlah�Total�
(1)� (2)� (3)� (4)�� � � �
01.�Banggai�Kepulauan� 260�713� 257�245� 517�958�
02.�Banggai� 304�110� 549�226� 853�336�
03.�Morowali� 322�736� 421�851� 744�587�
04.�Poso� 297�746� 438�933� 736�679�
05.�Donggala� 312�050� 361�317� 673�367�
06.�Tolitoli� 219�329� 322�824� 542�153�
07.�Buol� 202�837� 266�395� 469�232�
08.�Parigi�Moutong� 324�109� 397�610� 721�719�
09.�Tojo�Una�Una� 298�352� 244�679� 543�031�
10.�Sigi� 291�658� 314�207� 605�865�
11.�Banggai�Laut1)� …� …� …�
12.�Morowali�Utara1)� …� …� …�
13.�Palu� 304�128� 521�340� 825�468�
� � � �
Sumber/Source� :� Sekretariat��Daerah�Provinsi�Sulawesi�Tengah,�Kabupaten/Kota�Regional�Secretariat�of��Sulawesi�Tengah�Province,�Regenvy/city�
Catatan/Note�������:����1)�Tergabung�Dengan�Kabupaten�Induknya/�Include�in�main�regency�
http
://sul
teng
.bps
.go.
id
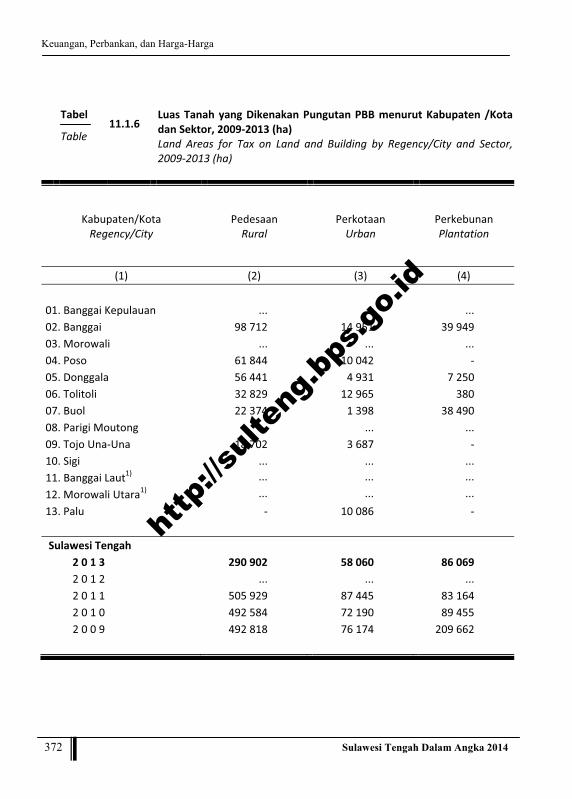
Keuangan, Perbankan, dan Harga-Harga
372 Sulawesi Tengah Dalam Angka 2014
�Tabel�
Table� 11.1.6�Luas�Tanah�yang�Dikenakan�Pungutan�PBB�menurut�Kabupaten�/Kota�dan�Sektor,�2009�2013�(ha)�Land� Areas� for� Tax� on� Land� and� Building� by� Regency/City� and� Sector,�2009�2013�(ha)���
Kabupaten/Kota�Regency/City�
Pedesaan�Rural�
Perkotaan�Urban�
Perkebunan�Plantation�
(1)� (2)� (3)� (4)�� � � �
01.�Banggai�Kepulauan� ...� ...� ...�02.�Banggai� �98�712� �14�951� �39�949�03.�Morowali� ...� ...� ...�04.�Poso� �61�844� �10�042� ��05.�Donggala� �56�441� �4�931� �7�250�06.�Tolitoli� �32�829� �12�965� ��380�07.�Buol� �22�374� �1�398� �38�490�08.�Parigi�Moutong� ...� ...� ...�09.�Tojo�Una�Una� �18�702� �3�687� ��10.�Sigi� ...� ...� ...�11.�Banggai�Laut1)� ... ... ...12.�Morowali�Utara1)� ... ... ...13.�Palu� �� �10�086� ��� � � �Sulawesi�Tengah������� � � �
2�0�1�3� �290�902� �58�060� �86�069�2�0�1�2� ...� ...� ...�2�0�1�1� 505�929� 87�445� 83�164�2�0�1�0� 492�584� 72�190� 89�455�2�0�0�9� 492�818� 76�174� 209�662�� � � �
�
http
://sul
teng
.bps
.go.
id

Finance, Banking, and Prices
Sulawesi Tengah in Figures 2014 373
Lanjutan�Tabel�/�Continued�Table���11.1.6���
Kabupaten/Kota�Regency/City�
Kehutanan�Forestry�
Pertambangan�Mining�
Jumlah�Total�
(1)� (5)� (6)� (7)�
� � � �01.�Banggai�Kepulauan� ...� ...� ...�
02.�Banggai� `�� �35�959� �189�571�
03.�Morowali� ...� ...� ...�
04.�Poso� �� �� �71�886�
05.�Donggala� �� �� �68�622�
06.�Tolitoli� �� �19�789� �65�963�
07.�Buol� �� �10�818� �73�080�
08.�Parigi�Moutong� ...� ...� ...�
09.�Tojo�Una�Una� �� �� �22�389�
10.�Sigi� ...� ...� ...�
11.�Banggai�Laut1)� ... ... ...
12.�Morowali�Utara1)� ... ... ...
13.�Palu� �� �� �10�086�
� � � �
Sulawesi�Tengah� � � �
2�0�1�3� ��...� �66�566� �501�597�
2�0�1�2� ��... ��... ��...
2�0�1�1� 588�505� 366�325� 1�631�368�
2�0�1�0� 305�584� 113�221� 1�073�034�
2�0�0�9� 236�660� 151�442� 1�166�756�
� � � �
Sumber/Source� :� Kantor�Inspeksi�Pelayanan�Pajak�Bumi�dan�Bangunan�Kabupaten/Kota�Inspectorate�of�Tax�on�Land�and�Building�of�Regency/City�
Catatan/Note�������:����1)�Tergabung�Dengan�Kabupaten�Induknya/�Include�in�main�regency�
http
://sul
teng
.bps
.go.
id

Keuangan, Perbankan, dan Harga-Harga
374 Sulawesi Tengah Dalam Angka 2014
Tabel�
Table� 11.1.7�Jumlah�Wajib�PBB�menurut�Sektor�dan�Kabupaten/Kota,�2009�2013��Number�of�Taxes�on�Land�and�Building�Object�by�Sector�and�Regency/�City,�2009�2013�
�
Kabupaten/Kota�Regency/City�
Pedesaan�Rural�
Perkotaan�Urban�
Perkebunan�Plantation�
(1)� (2)� (3)� (4)�
� � � �01.�Banggai�Kepulauan� ...� ...� ...�02.�Banggai� �136�978� �43�123� ��7�03.�Morowali� �32�437� �3�304� ...�04.�Poso� �94�717� �27�362� ��05.�Donggala� �96�655� �14�665� ��8�06.�Tolitoli� �63�132� �25�252� ��3�07.�Buol� �46�897� �7�622� ��2�08.�Parigi�Moutong� ...� ...� ...�09.�Tojo�Una�Una� �34�382� �11�572� ��10.�Sigi� �100�573� �� ��11.�Banggai�Laut1)� ...� ...� ...�12.�Morowali�Utara1)� ...� ...� ...�13.�Palu� �� �58�086� ��� � � �Sulawesi�Tengah������� � � �
2�0�1�3� �605�771� �190�986� ��20�2�0�1�2� ...� ...� ...�2�0�1�1� 868�500� 271�406� 56�2�0�1�0� 831�766� 265�978� 41�2�0�0�9� 874�725� 351�910� 36�� � � �
�
http
://sul
teng
.bps
.go.
id

Finance, Banking, and Prices
Sulawesi Tengah in Figures 2014 375
Lanjutan�Tabel�/�Continued�Table���11.1.7���
Kabupaten/Kota�Regency/City�
Kehutanan�Forestry�
Pertambangan�Mining�
Jumlah�Total�
(1)� (5)� (6)� (7)�
� � � �01.�Banggai�Kepulauan� ...� ...� ...�
02.�Banggai� �� ��6� �180�114�
03.�Morowali� ...� ...� �35�741�
04.�Poso� �� �� �122�079�
05.�Donggala� �� �� �111�328�
06.�Tolitoli� �� ��5� �88�392�
07.�Buol� �� ��1� �54�522�
08.�Parigi�Moutong� ...� ...� ...�
09.�Tojo�Una�Una� �� ...� �45�954�
10.�Sigi� �� �� �100�573�
11.�Banggai�Laut1)� ...� ...� ...�
12.�Morowali�Utara1)� ...� ...� ...�
13.�Palu� �� �� �58�086�
� � � �Sulawesi�Tengah� � � �
2�0�1�3� ...� ��12� �796�789�
2�0�1�2� ...� ...� ...�
2�0�1�1� 10� 58� 1�140�030�
2�0�1�0� 5� 40� 1�097�830�
2�0�0�9� 5� 44� 1�226�720�
� � � �
Sumber/Source� :� Kantor�Inspeksi�Pelayanan�Pajak�Bumi�dan�Bangunan�Kabupaten/Kota��Inspectorate�of�Tax�on�Land�and�Building�of�Regency/City�
Catatan/Note�������:����1)�Tergabung�Dengan�Kabupaten�Induknya/�Include�in�main�regency�
http
://sul
teng
.bps
.go.
id

Keuangan, Perbankan, dan Harga-Harga
376 Sulawesi Tengah Dalam Angka 2014
Tabel�
Table� 11.1.8�Realisasi� Penerimaan� Pajak� Bumi� dan� Bangunan� menurut� Sektor� dan�Kabupaten/Kota,�2009�2013�(000�Rupiah)�Actual�Tax�on�Land�and��Building�Receipts�by�Regency/City,�2009�2013�(000�Rupiahs)��
�
Kabupaten/Kota�Regency/City�
Pedesaan�Rural�
Perkotaan�Urban�
Perkebunan�Plantation�
(1)� (2)� (3)� (4)�� � � �
01.�Banggai�Kepulauan� ...� ...� ...�02.�Banggai� ...� ....� ...�03.�Morowali� ...� ....� ...�04.�Poso� 1�728�475� �443�886� ��05.�Donggala� ...� ....� ...�06.�Tolitoli� ...� ....� ...�07.�Buol� ...� ....� ...�08.�Parigi�Moutong� ...� ...� ...�09.�Tojo�Una�Una� ...� ...� ...�10.�Sigi� ...� ....� ...�11.�Banggai�Laut1)� ...� ....� ...�12.�Morowali�Utara1)� ...� ....� ...�13.�Palu� �� 6�234�944� ��� � � �Sulawesi�Tengah������� � � �
2�0�1�3� 1�728�475� 6�678�830� ...�2�0�1�2� ...� ...� ...�2�0�1�1� 4�923�296� 6�501�498� 16�069�2�0�1�0� 2�396�062� 554�566� 1�514�092�2�0�0�9� 8�625�569� 8�146�375� 3�707�248�
�����
http
://sul
teng
.bps
.go.
id

Finance, Banking, and Prices
Sulawesi Tengah in Figures 2014 377
Lanjutan�Tabel�/�Continued�Table���11.1.8���
Kabupaten/Kota�Regency/City�
Kehutanan�Forestry�
Pertambangan�Mining�
Non�migas�Non�Oil�and�gas
Jumlah�Total�
(1)� (5)� (6)� (7)� (8)�
� � � � �01.�Banggai�Kepulauan� ...� ...� ...� ...�
02.�Banggai� ...� ...� ...� 7�343�813�
03.�Morowali� ...� ...� ...� 1�407�860�
04.�Poso� �� �� �� 2�172�361�
05.�Donggala� ...� ...� ...� 2�023�692�
06.�Tolitoli� ...� ...� ...� 2�879�576�
07.�Buol� ...� ...� ...� 1�051�204�
08.�Parigi�Moutong� ...� ...� ...� ...�
09.�Tojo�Una�Una� ...� ...� ...� �605�643�
10.�Sigi� ...� ...� ...� �730�832�
11.�Banggai�Laut1)� ...� ...� ...� ...�
12.�Morowali�Utara1)� ...� ...� ...� ...�
13.�Palu� �� �� �� 6�234�944�
� � � � �
Sulawesi�Tengah� � � � �2�0�1�3� ...� ...� ...� 24�449�925�
2�0�1�2� ...� ...� ...� ...�
2�0�1�1� �� 8�689�442� 22�897� 98�358�195�
2�0�1�0� �� 83�701�758� 1�503�845� 89�670�323�
2�0�0�9� 217�695�207� �� �� 238�174�399�
� � � � �
Sumber/Source� :� Kantor�Inspeksi�Pelayanan�Pajak�Bumi�dan�Bangunan�Kabupaten/Kota��Inspectorate�of�Tax�on�Land�and�Building�of�Regency/City�
Catatan/Note�������:����1)�Tergabung�Dengan�Kabupaten�Induknya/�Include�in�main�regency���
http
://sul
teng
.bps
.go.
id

Keuangan, Perbankan, dan Harga-Harga
378 Sulawesi Tengah Dalam Angka 2014
�Tabel�
Table� 11.1.9�Jumlah� Ketetapan,� Tunggakan,� Target� dan� Realisasi� PBB� Menurut�Kabupaten/Kota�(000�Rupiah),�2009�2013�Number�of�Decisions,�Arrears,�Target�and�Realization�of�Taxes�on�Land�and�Building�by�Regency/City�(000�Rupiahs),�2009�2013�
�
Kabupaten/Kota�Regency/City�
Ketetapan�PBB�Tahun�
lalu�Decision�of�
Taxes�on�Land�and�Building�Previous�Year�
Tunggakan�Tahun�lalu��Arrear�of�A�Previous�
Year�
Target�Tahun�ini��
Target�of�This�Year�
Realisasi�Tahun�ini��
Realization�of�This�Year�
(1)� (2)� (3)� (4)� (5)�� � � � �
01.�Banggai�Kepulauan� ...� ...� ...� ...�02.�Banggai� 7�965�340� 6�514�256� 7�343�813� 1�430�080�03.�Morowali� 1�419�542� ...� 2�500�000� ...�04.�Poso� 2�217�915� 1�605�831� 2�951�539� 2�172�362�05.�Donggala� 2�792�444� ...� 4�552�566� 2�023�692�06.�Tolitoli� ...�
...�...�...�
...�
...�...�...�07.�Buol�
08.�Parigi�Moutong� ...� ...� ...� ...�09.�Tojo�Una�Una� �912�052� �296�196� �912�052� �624�977�10.�Sigi� 1�538�565� �124�279� 1�414�286� �730�832�11.�Banggai�Laut1)� ...� ...� ...� ...�12.�Morowali�Utara1)� ...� ...� ...� ...�13.�Palu� 9�000�000� 4�503�252� 9�000�000� 6�234�944�� � � � �Sulawesi�Tengah������� � � � �
2�0�1�3� 25�845�858� 13�043�814� 28�674�256� 13�216�887�2�0�1�2� ...� ...� ...� ...�2�0�1�1� 174�147�491� 2�561�182� 332�819�924� 446�639�357�2�0�1�0� 84�161�524� 1�453�878� 235�342�723� 291�252�739�
2�0�0�9� 104�587�370� 10�436�754� 143�539�652� 185�972�782�
Sumber/Source� :� Kantor�Inspeksi�Pelayanan�Pajak�Bumi�dan�Bangunan�Kabupaten/Kota��Inspectorate�of�Tax�on�Land�and�Building�of�Regency/City�
Catatan/Note�������:����1)�Tergabung�Dengan�Kabupaten�Induknya/�Include�in�main�regency�� �
http
://sul
teng
.bps
.go.
id

Finance, Banking, and Prices
Sulawesi Tengah in Figures 2014 379
Tabel�
Table� 11.1.10�Dana� Alokasi� Umum� (DAU)� dan� Dana� Alokasi� Khusus� Provinsi� Sulawesi�Tengah�dan�Kabupaten/Kota�Se�Sulawesi�Tengah,�Tahun�2012�–�2013�(Juta�Rupiah)��General� and� Special� Subsidies� in� Sulawesi� Tengah� Province� and� all�Regencies/City�of�Sulawesi�Tengah,�2012�2013�(million�rupiahs)�
�
Provinsi/Kabupaten/Kota�Province/Regency/City�
2012� 2013�
D�A�U�General�Subsidies�
DAK�Special�Subsidies�
D�A�U�General�Subsidies�
DAK�Special�Subsidies�
(1)� (2)� (3)� (4)� (5)�� � �01.� Sulawesi�Tengah� �902�088� �43�237� 994�659� 65�949�
02.� Banggai�Kepulauan� �371�918� �57�895� 446�341� 63�806�
03.� Banggai� �580�225� �61�530� 711�134� 57�984�
04.� Morowali� �548�248� �55�359� 615�423� 61�407�
05.� Poso� �509�605� �58�878� 583�807� 65�228�
06.� Donggala� �464�885� �69�147� 523�661� 69�925�
07.� Tolitoli� �436�210� �39�289� 487�396� 58�269�
08.� Buol� �359�942� �40�480� 405�310� 42�639�
09.� Parigi�Moutong� �520�678� �67�428� 588�503� 73�153�
10.� Tojo�Una�Una� �373�700� �51�799� 426�316� 62�167�
11.��Sigi� �442�900� �51�219� 503�991� 48�316�
11.��Banggai�Laut1)� …� …� …� …�
12.��Morowali�Utara1)� …� …� …� …�
13.��Palu� �512�824� �42�362� 575�235� 45�042�
� � � � �
� Jumlah� 6�023�223� �638�623� 6�861�776� 713�885�
Sumber�/�Source� :� Sekretariat�Daerah�Provinsi�Sulawesi�Tengah�Regional�Secretariat�of��Sulawesi�Tengah�Province�
Catatan/Note�������:����1)�Tergabung�Dengan�Kabupaten�Induknya/�Include�in�main�regency�
http
://sul
teng
.bps
.go.
id

Keuangan, Perbankan, dan Harga-Harga
380 Sulawesi Tengah Dalam Angka 2014
11.2. Perbankan�/�Banking�
��
Kabupaten/Kota�Regency/City�
Kantor�Pusat�Central�
Kantor�Cabang�Branch�
Kantor�*����Lainnya�Other�
Jumlah�kantor�bank�
Number�of�Banks�
(1)� (2)� (3)� (4)� (5)�� � � � �
01.� Banggai�Kepulauan� �� �� 5� 5�
02.� Banggai� 1� 8� 16� 25�
03.� Morowali� �� 2� 7� 9�
04.� Poso� 1� 4� 19� 24�
05.� Donggala� �� �� 13� 13�
06.� Tolitoli� �� 5� 16� 21�
07.� Buol� �� 2� 7� 9�
08.� Parigi�Moutong� 3� 5� 26� 34�
09.� Tojo�Una�Una� �� 1� 10� 11�
10.���Sigi� �� �� 5� 5�
11.���Banggai�Laut�� �� 3� 1� 4�
12. Morowali�Utara� �� �� 2� 2�
10.� Palu� 5� 24� 29� 58�
� � � � �
Jumlah�/�Total� 10� 49� 156� 220�
Sumber/Source� :� Otoritas�Jasa�Keuangan�Provinsi�Sulawesi�Tengah��� � OJK�of�Sulawesi�Tengah��
Cat�*:�Kantor�lainnya�terdiri�dari�kantor�cabang�pembantu,BRI�Unit,kantor�kas,�UPTD�
Tabel�Table� 11.2.1� Jumlah�Kantor�Bank�menurut�Kabupaten/Kota,�Tahun�2013�
Number�of�Bank�Offices�by�Regency/City,�2013�
http
://sul
teng
.bps
.go.
id

Finance, Banking, and Prices
Sulawesi Tengah in Figures 2014 381
�Tabel�
Table� 11.2.2�Posisi� Realisasi� Kredit� Perbankan� Bank� Pemerintah� menurut� Sektor�Ekonomi�(juta�rupiah),�2009�2013��Credit� Realization� of� State� Banks� Position� by� Economic� Sector� (million�rupiahs),�2009�2013�
�
Sektor�Ekonomi�Economic�Sector� 2009� 2010� 2011� 2012� 2013�
(1)� (2)� (3)� (4)� (5)� (6)�
� � � � � � �1.�� Pertanian/Agriculture�� 178�064 135�788 329�205 520�205� �710�577�
2.�� Pertambangan/Mining��������� 52�915 31�999 39�005 37�188� �54�335�
3.�� Perindustrian/Industry� 144�671 175�544 171�231 194�455� �206�884�
4.�� Listrik,Gas�&�Air�������������Electricity,�Gas�and�Water��
4�570 18�138 43�062 688� �2�915�
5.�� Konstruksi�Construction���������������
220�360 168�745 188�941 280�703� �407�129�
6.�� Perdagangan�Trade������������������
2�743�478 2�039�493 2�411�833 3�008�964� 3�811�566�
7.�� Pengangkutan�Construction���������������������
104�840 82�528 94�255 105�109� �118�137�
8.�� Jasa�Dunia�Usaha�Business�Services���������
93�004 23�402 35�384 60�856� �107�104�
9.�� Jasa�Sosial�Masyarakat���������Social�Services������������������������
22�331 41�522 80�494 97�096� �156�223�
10�� Lain�Lain�Others��
3�690�685 4�678�712 5�343�209 6�435�925� 7�655�254�
� � � �
Jumlah�/�Total������������������������ 7�254�918 7�395�871 8�736�619 10�741�190� 13�230�124�
Sumber/Source� :� Kantor�Perwakilan�Bank�Indonesia�Provinsi�Sulawesi�Tengah�Bank��Indonesia�Representative�Office�of�Sulawesi�Tengah
http
://sul
teng
.bps
.go.
id

Keuangan, Perbankan, dan Harga-Harga
382 Sulawesi Tengah Dalam Angka 2014
Tabel�
Table� 11.2.3�Posisi� Realisasi� Kredit� Perbankan� Bank� Swasta� menurut� Sektor�Ekonomi�(juta�rupiah),�2009�2013��Outstanding�Credit�Realization� �of�Private�National�Banks�by�Economic�Sector�(milion�rupiahs),�2009�2013�
�
Sektor�Ekonomi�Economic�Sector� 2009� 2010� 2011� 2012� 2013�
(1)� (2)� (3)� (4)� (5)� (6)�
� � � � � � �1.�� Pertanian/Agriculture�� 13�025� 20�906� 31�668� 58�674� �78�648�
2.�� Pertambangan/Mining������������ 1�551� 4�850� 12�672� 24�871� �14�047�
3.�� Perindustrian/Industry� 18�358� 23�440� 31�805� 39�061� �42�968�
4.�� Listrik,Gas�&�Air�������������Electricity,�Gas�and�Water��
924� 3�876� 3�460� 4�317� �4�636�
5.�� Konstruksi�Construction���������������
34�695� 35�473� 76�600� 73�736� �59�345�
6.�� Perdagangan�Trade������������������
472�156� 715�625� 1�011�734� 1�164�247� 1�313�375�
7.�� Pengangkutan�Construction���������������������
6�779� 10�638� 17�242� 19�245� �20�815�
8.�� Jasa�Dunia�Usaha�Business�Services���������
55�118� 141�562� 253�386� 411�066� �517�550�
9.�� Jasa�Sosial�Masyarakat������������Social�Services���������������������������
6�140� 58�057� 76�321� 81�674� �91�781�
10�� Lain�Lain�Others��
404�353� 669�251� 969�668� 1�112�052� 1�319�747�
� � � � � � �
Jumlah�/�Total������������������������ 1�013�099� 1�683�678� 2�484�556� 2�988�943� 3�462�912�
Sumber/Source� :� Kantor�Perwakilan�Bank�Indonesia�Provinsi�Sulawesi�Tengah�Bank��Indonesia�Representative�Office�of�Sulawesi�Tengah
http
://sul
teng
.bps
.go.
id

Finance, Banking, and Prices
Sulawesi Tengah in Figures 2014 383
Tabel�
Table� 11.2.4�Posisi� �Tabungan� �Perbankan�Akhir�Tahun�menurut�Status�Bank�(juta�rupiah),�2009�2013��Outstanding� Saving� Deposits� by� Status� of� Banks� (million� rupiahs),���2009�2013�
�
Akhir�Tahun�End�of�Year�
Bank�Pemerintah�Public�Bank�
Bank�Swasta�Private�Bank�
Jumlah�Total�
Penabung�Number�of�Accounts�
Posisi�Position�
Penabung�Number�of�Accounts�
Posisi�Position�
Penabung�Number�of�Accounts�
Posisi�Position�
(1)� (2)� (3)� (4)� (5)� (6)� (7)�
� � � � � � �
2�0�0�9� 507�962� 3�236�767� 79�281� 509�910� 587�243� 3�746�677�
2�0�1�0� 676�615� 5�993�233� 120�930� 1�467�129� 773�232� 4�745�653�
2�0�1�1� 729�445� 7�059�532� 148�743� 1�804�981� 878�188� 8�864�512�
2�0�1�2� 761�129� 7�913�506� 180�026� 2�108�896� 941�155� 10�022�402�
2�0�1�3� 1�174�644� 8�897�663� �217�317� 2�432�700� 1�391�961� 11�330�363�
� �� �� �� �� �� ��
Tw./Quart��I� 1�002�028� 8�362�992� �188�841� 2�078�939� 1�190�869� 10�441�931�
Tw./Quart��II� �944�084� 8�808�966� �179�315� 2�114�723� 1�123�399� 10�923�688�
Tw./Quart��III� 1�021�601� 9�136�469� �209�216� 2�227�664� 1�230�817� 11�364�133�
Tw./Quart��IV�� 1�174�644� 8�897�663� �217�317� 2�432�700� 1�391�961� 11�330�363�
Sumber/Source� :� Kantor�Perwakilan�Bank�Indonesia�Provinsi�Sulawesi�Tengah�Bank��Indonesia�Representative�Office�of�Sulawesi�Tengah�
http
://sul
teng
.bps
.go.
id

Keuangan, Perbankan, dan Harga-Harga
384 Sulawesi Tengah Dalam Angka 2014
Tabel�
Table� 11.2.5�Posisi�Dana�Perbankan�Akhir�Tahun�di�Provinsi�Sulawesi�Tengah�(miliar�rupiah),�2009�2013�Outstanding� Banks� Fund� in� Sulawesi� Tengah� Province� (billion� rupiahs),�2009�2013�
�
Akhir�Tahun�End�of�Year�
G�i�r�o�Demand�Deposits�
Deposito�Time�
Deposits�
Tabungan�Saving�Deposits�
Jumlah�Total�
(1)� (2)� (3)� (4)� (5)�� � � � �
2�0�0�9� 1�129,08� 1�233,97� 3�937,48� 6�300,53�
2�0�1�0� ����1�200,73� 1�591,31� ���4�797,67� ���7�589,71�
2�0�1�1� 1�513,41� 1�900,29� 5�728,23� 9�141,94�
2�0�1�2� 1�723,76� 1�958,99� 6�623,81� 10�306,56�
2�0�1�3� �1�737,35� �1�919,92� �7�673,10� �11�330,36�
� �� �� �� ��
Triwulan����I�/�Quarter�I� �2�851,05� �1�730,56� �5�860,32� �10�441,93�
Triwulan����II�/�Quarter�I� �2�917,25� �1�808,85� �6�197,58� �10�923,69�
Triwulan����III�/�Quarter�I� �2�905,92� �1�840,39� �6�617,83� �11�364,13�
Triwulan����IV�/�Quarter�I� �1�737,35� �1�919,92� �7�673,10� �11�330,36�
Sumber/Source� :� Kantor�Perwakilan�Bank�Indonesia�Provinsi�Sulawesi�Tengah�Bank��Indonesia�Representative�Office�of�Sulawesi�Tengah
http
://sul
teng
.bps
.go.
id
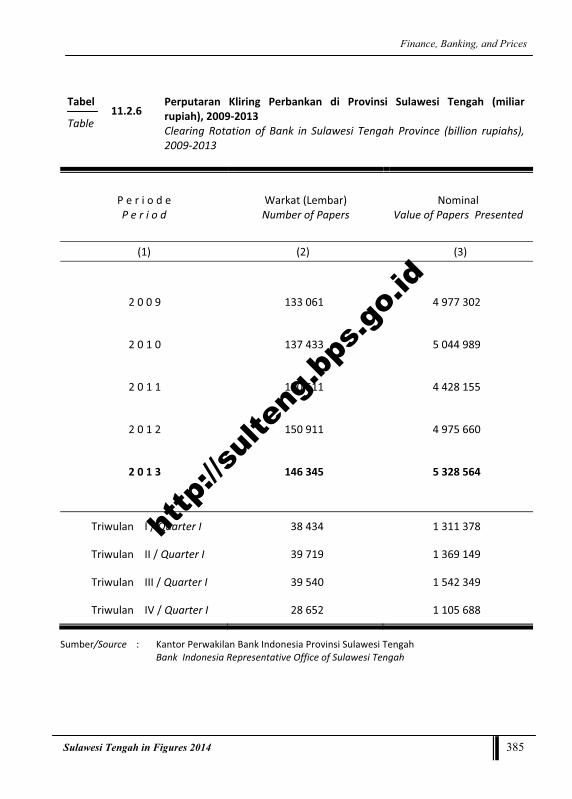
Finance, Banking, and Prices
Sulawesi Tengah in Figures 2014 385
Tabel�
Table� 11.2.6�Perputaran� Kliring� Perbankan� di� Provinsi� Sulawesi� Tengah� (miliar�rupiah),�2009�2013��Clearing� Rotation� of� Bank� in� Sulawesi� Tengah� Province� (billion� rupiahs),�2009�2013�
�
P�e�r�i�o�d�e�P�e�r�i�o�d�
Warkat�(Lembar)�Number�of�Papers�
Nominal�Value�of�Papers��Presented�
(1)� (2)� (3)�
� � �
2�0�0�9� 133�061� 4�977�302�
2�0�1�0� 137�433� 5�044�989�
2�0�1�1� 150�511� 4�428�155�
2�0�1�2� 150�911� 4�975�660�
2�0�1�3� �146�345� 5�328�564�
� �� ��
Triwulan����I�/�Quarter�I� �38�434� 1�311�378�
Triwulan����II�/�Quarter�I� �39�719� 1�369�149�
Triwulan����III�/�Quarter�I� �39�540� 1�542�349�
Triwulan����IV�/�Quarter�I� �28�652� 1�105�688�
Sumber/Source� :� Kantor�Perwakilan�Bank�Indonesia�Provinsi�Sulawesi�Tengah�Bank��Indonesia�Representative�Office�of�Sulawesi�Tengah
http
://sul
teng
.bps
.go.
id

Keuangan, Perbankan, dan Harga-Harga
386 Sulawesi Tengah Dalam Angka 2014
Tabel�
Table� 11.2.7�Suku� Bunga� Deposito� Berjangka� 1� Bulan� menurut� Kelompok� Bank�(persen/tahun),�2009�2013��Time� Deposits� Interest� Rates� for� 1� Month� by� Group� of� Banks�(percent/years),�2009�2013�
�
Akhir�Tahun�End�of�Year�
Bank�Umum�/�General�Banks�
Bank�Pemerintah�State�Banks�
Bank�Swasta�Private�Banks� ‘B�P�R’�
TT� TR� TT� TR� TT� TR�
(1)� (2)� (3)� (4)� (5)� (6)� (7)�
� � � � � � �
2�0�0�9� 12� 5,75� 12� 5,25� 14� 7�
2�0�1�0� 7� 5,25� 8� 5,25� 10,25� 6,00�
2�0�1�1� ...� 5,65� ...� 6,12� ...� ...�
2�0�1�2� ...� 4,59� ...� 5,30� ...� ...�
2�0�1�3� ...� 6,75� ...� 7,01� ...� ...�
� �� �� �� �� �� ��
Triwulan�I/�Quarter�I� ...� 4,63� ...� 5,17� ...� ...�
Triwulan�II/�Quarter�II� ...� 4,63� ...� 5,38� ...� ...�
Triwulan�III/�Quarter�III� ...� 4,88� ...� 6,16� ...� ...�
Triwulan�IV/�Quarter�IV� ...� 6,75� ...� 7,01� ...� ...�
Catatan/Note� � :� TT�=�Tertinggi�pada�akhir�periode�/�The�highest�at�the�end�of�period�TR�=�Terendah�pada�akhir�periode�/�The�lowest�at�the�end�of�period�
Sumber/Source� :� Kantor�Perwakilan�Bank�Indonesia�Provinsi�Sulawesi�Tengah�Bank��Indonesia�Representative�Office�of�Sulawesi�Tengah
http
://sul
teng
.bps
.go.
id

Finance, Banking, and Prices
Sulawesi Tengah in Figures 2014 387
Tabel�
Table� 11.2.8�Posisi� Deposito� Berjangka� Rupiah� dan� Valuta� Asing� Perbankan���(juta�rupiah),�2009�2013��Rupiah�and�Foreign�Exchange�Time�Deposits�Outstanding�of�Banks�(million�rupiahs),�2009�2013�
�
Akhir�Tahun�End�of�Year�
1�Bulan�1�Months�
3�Bulan�3�Months�
6�Bulan�6�Months�
12�Bulan�12�Months�
>12�Bulan�>12�Months�
Jumlah�Total�
(1)� (2)� (3)� (4)� (5)� (6)� (7)�
� � � � � � �
2�0�0�9� 728�402� 293�039� 91�920� 67�185� 53�421� 1�233�967�
2�0�1�0� 919�872� �285�360� 127�619� 87�531� 92�915� 1�513�297�
2�0�1�1� 828�564� 363�928� 146�504� 91�440� 34�545� 1�464�981�
2�0�1�2� 925�586� 419�404� 193�546� 131�614� 49�735� 1�719�884�
2�0�1�3� �939�036� �447�284� �160�496� �108�430� 31�382� 1�686�628�
� �� �� �� �� � ��
Tw./Quart��I� �598�459� �282�695� �131�171� �103�691� 51�650� 1�167�666�
Tw./Quart��II� �819�916� �398�845� �152�192� �130�498� 12�912� 1�514�363�
Tw./Quart��III� �872�922� �404�152� �171�728� �112�383� 12�508� 1�573�692�
Tw./Quart��IV�� �939�035� �447�284� �160�496� �108�430� 31�382� 1�686�628�
Sumber/Source� :� Kantor�Perwakilan�Bank�Indonesia�Provinsi�Sulawesi�Tengah�Bank��Indonesia�Representative�Office�of�Sulawesi�Tengah
http
://sul
teng
.bps
.go.
id

Keuangan, Perbankan, dan Harga-Harga
388 Sulawesi Tengah Dalam Angka 2014
Tabel�
Table� 11.2.9�Posisi� Kredit� Usaha� Mikro,� Kecil� dan� Menengah� (UMKM)� menurut�Kelompok�Bank�(Juta�Rupiah),�2010�2013��Outstanding� Micro,� Small� dan� Medium� Business� Credits� by� Group� of�Bank�(million�rupiahs),�2010�2013�
�
Akhir�Tahun�End�of�Year�
Bank�Umum��General�Bank�
Investasi�Investment�
Modal�Kerja�Capital�
Lain��Lain�
Others�
Sub�Jumlah�Sub�Total�
(1)� (2)� (3)� (4)� (5)�
� � � � �� � � � �
2�0�1�0� �514�270� 3�338�129� �9�673� 3�862�072�
2�0�1�1� �699�262� 4�307�681� �7�907� 5�014�850�
2�0�1�2� �790�151� 4�328�182� �12�704� 5�131�038�
2�0�1�3� 1�185�913� 4�950�478� �33�535� 6�169�927�
� �� �� �� ��
Tw./Quart��I� �811�744� 4�450�474� �23�052� 5�285�271�
Tw./Quart��II� 1�105�338� 4�738�724� �26�156� 5�870�218�
Tw./Quart��III� 1�124�965� 4�801�047� �30�489� 5�956�501�
Tw./Quart��IV�� 1�185�913� 4�950�478� �33�535� 6�169�927�
� �
�� �
http
://sul
teng
.bps
.go.
id
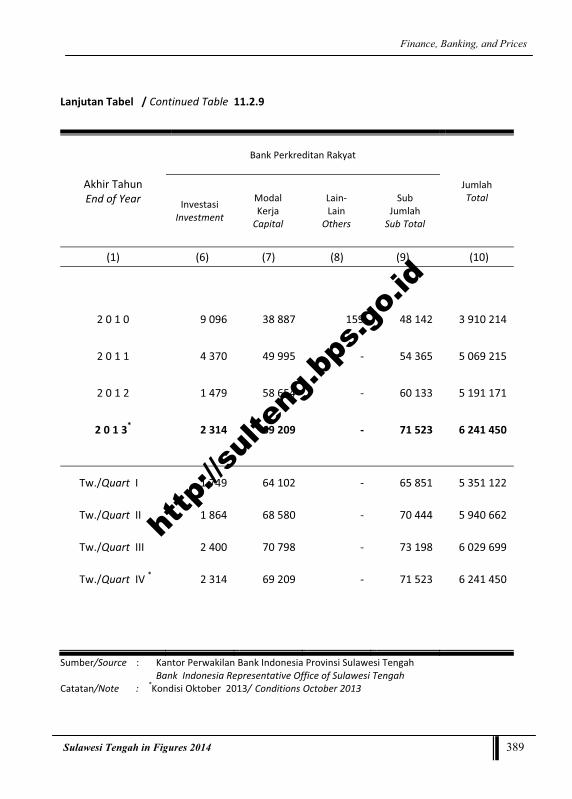
Finance, Banking, and Prices
Sulawesi Tengah in Figures 2014 389
Lanjutan�Tabel���/�Continued�Table��11.2.9�
�
Akhir�Tahun�End�of�Year�
Bank�Perkreditan�Rakyat��
Jumlah�Total�Investasi�
Investment�
Modal�Kerja�Capital�
Lain��Lain�
Others�
Sub�Jumlah�Sub�Total�
(1)� (6)� (7)� (8)� (9)� (10)�
� � � � � �� � � � � �
2�0�1�0� �9�096� �38�887� ��159� �48�142� 3�910�214�
2�0�1�1� �4�370� �49�995� �� �54�365� 5�069�215�
2�0�1�2� �1�479� �58�654� �� �60�133� 5�191�171�
2�0�1�3*� �2�314� �69�209� �� �71�523� 6�241�450�
� �� �� � �� ��
Tw./Quart��I� �1�749� �64�102� �� �65�851� 5�351�122�
Tw./Quart��II� �1�864� �68�580� �� �70�444� 5�940�662�
Tw./Quart��III� �2�400� �70�798� �� �73�198� 6�029�699�
Tw./Quart��IV�*� �2�314� �69�209� �� �71�523� 6�241�450�
� �
Sumber/Source� :� Kantor�Perwakilan�Bank�Indonesia�Provinsi�Sulawesi�Tengah�Bank��Indonesia�Representative�Office�of�Sulawesi�Tengah�
Catatan/Note�������:����*Kondisi�Oktober��2013/ Conditions�October�2013
http
://sul
teng
.bps
.go.
id

Keuangan, Perbankan, dan Harga-Harga
390 Sulawesi Tengah Dalam Angka 2014
Tabel�
Table� 11.2.10�Posisi�Kredit�Usaha�Mikro,�Kecil�dan�Menengah�(UMKM)�menurut�Kelompok�Bank�Sektor�Ekonomi�(Juta�Rupiah),�2010�2013�Outstanding�Micro,�Small�dan�Medium�Business�Credits�by�Group�of�Banks�and�Economics�Sectors�(million�rupiahs),�2010�2013�
�
�Sektor�Ekonomi�Economic�Sectors�
Bank�PemerintahState�Banks
Bank�Swasta�Private�Banks�
Bank�Per��kreditan�Rakyat�
Jumlah�Total�
(1)� (2)� (3)� (4)� (5)�� � � � � �1.� Pertanian/Agriculture�� �499�789� �72�544� �27�148� �599�481�2.� Pertambangan/Mining����������������������� �41�930� �3�922� ��170� �46�022�3.� Perindustrian/Industry� �154�611� �39�925� �1�050� �195�586�4.� Listrik,Gas�&�Air/�Electricity,�Gas�
and�Water�� �2�915� �4�636� ��168� �7�719�
5.� Konstruksi�Construction��������������� �293�763� �33�387� �2�073� �329�223�
6.� Perdagangan�Trade������������������ 3�380�850� 1�051�877� �31�988� 4�464�715�
7.� Pengangkutan�Construction��������������������� �78�354� �17�540� �1�912� �97�806�
8.� Jasa�Dunia�Usaha�Business�Services��������� �106�582� �130�412� ��208� �237�202�
9.� Jasa�Sosial�Masyarakat������������������Social�Services��������������������������������������� �149�683� �73�423� �5�256� �228�362�
10.� Lain�Lain�Others�� ��247� �33�535� �1�548� �35�330�
� � �� �� �� ��Jumlah�/�Total� � � � �� 2�0�1�3*� 4�708�724� 1�461�202� �71�521� 6�241�446�� 2�0�1�2� 3�788�233� 1�342�805� �60�133� 5�191�171�� 2�0�1�1� 3�589�245� 1�425�605� �54�365� 5�069�215�� 2�0�1�0� 2�706�924� 1�155�148� �48�142� 3�910�214�� � � � � �
Sumber/Source� :� Kantor�Perwakilan�Bank�Indonesia�Provinsi�Sulawesi�Tengah�Bank��Indonesia�Representative�Office�of�Sulawesi�Tengah�
Catatan/Note�������:����*Kondisi�Oktober��2013/ Conditions�October�2013
http
://sul
teng
.bps
.go.
id

Finance, Banking, and Prices
Sulawesi Tengah in Figures 2014 391
Tabel�
Table� 11.2.11�Rencana�dan�Realisasi�PMA�di�Sulawesi�Tengah�Tahun�2009�2013�Planning� and� Realization� of� Foreign� Investment� in� Sulawesi� Tengah,�2009�2013�(ribuan)�
�
Sektor�Sector�
Jumlah�Proyek�Number�
of�Projects�
Investasi�/�Investment��(US�$)�
Tenaga�Kerja�Manpower�
Rencana�Plan�
RealisasiReali��zation�
��
IndonesiaDomestic�
Asing�Foreign�
RencanaPlan�
RealisasiRealization
Rencana�Plan�
Realisasi�Realization�
(1)� (2)� (3)� (4)� (5)� (6)� (7)� (8)�2009� 1� 3�958� 3�542� 25� 25� �� ���
Perikanan/Fishery� �� �� �� �� �� �� ��
Pertambangan�/Mining� �� �� �� �� �� �� ��
Industri/Manufacturing� 1� 3�958� 3�542� 25� 25� �� ��
2010� 4� 9�200� � 291� �� �� ��PerikananFishery� �� �� �� �� �� �� ��
Pertambangan/�Mining� 3� 7�700� �� 241� �� �� ��
Industri/Manufacturing� 1� 1�500� �� 50� �� �� ��
2011� 10� 6�066�353� 7�136� 126� 335� �� 2�PerikananFishery� �� �� �� �� �� �� ��
Pertambangan/�Mining� 5� 5�943�453� 7�136� 126� 209� �� 2�
Industri/Manufacturing� 5� 122�900� �� �� 126� �� ��
2012� 18� 267�233�054� �� �� �� �� ��
PerikananFishery� �� �� �� �� �� �� ��
Pertambangan/�Mining� 13� 267�000�854� �� �� �� �� ��
Industri/Manufacturing� 5� 232�200� �� �� �� �� ��
2013� 14� 449�833� �� �� �� �� ��PerikananFishery� �� �� �� �� �� �� ��
Pertambangan/�Mining� 11� 135�233� �� �� �� �� ��
Industri/Manufacturing� 3� 314�600� �� �� �� �� ��
Sumber/Source� :� Badan�Koordinasi�Penanaman�Modal�Sulawesi�Tengah�Investment�Coordinating�Board�of��Sulawesi�Tengah
http
://sul
teng
.bps
.go.
id

Keuangan, Perbankan, dan Harga-Harga
392 Sulawesi Tengah Dalam Angka 2014
Tabel�
Table� 11.2.12�Rencana�dan�Realisasi�PMDN�di�Sulawesi�Tengah�Tahun�2009�2013��Planning� and� Realization� of� Foreign� Investment� in� Sulawesi� Tengah,�2009�2013�
�
Sektor�Subsektor�Sector�
Subsector�
Jumlah�Proyek�Number�
of�Projects�
InvestasiInvestment�
(�Jutaan�rupiah)�
Tenaga�Kerja�Manpower�
RencanaPlan�
RealisasiReali�zation�
IndonesiaDomestic�
Asing�Foreign�
Rencana�Plan�
RealisasiReali�zation�
Rencana�Plan�
Realisasi�Reali�zation�
(1)� (2)� (3)� (4)� (5)� (6)� (7)� (8)�2009� 1� 219�875 �� 257� �� �� ��
Perikanan/Fishery� �� � �� �� �� �� ��Pertambangan/Mining� �� � �� �� �� �� ��Industri/Manufacturing� 1� 219�875 �� 257� �� �� ��
2010� �� � �� �� �� �� ��Perikanan/Fishery� �� � �� �� �� �� ��Pertambangan/Mining� �� � �� �� �� �� ��Industri/Manufacturing� �� � �� �� �� �� ��
2011� 7� ��151�442 66�550� �� 466� �� 6�Perikanan/Fishery� 3� 57�200 55�200� �� 263� �� 6�Pertambangan/Mining� �� � �� �� �� �� ��Industri/Manufacturing� 4� 94�242 11�350� �� 203� �� ��
2012� 1� 16�900 �� �� �� �� ��Perikanan/Fishery� �� � �� �� �� �� ��Pertambangan/Mining� �� � �� �� �� �� ��Industri/Manufacturing� 1� 16�900 �� �� �� �� ��
2013� �� � �� �� �� �� ��Perikanan/Fishery� �� � �� �� �� �� ��Pertambangan/Mining� �� � �� �� �� �� ��Industri/Manufacturing� �� � �� �� �� �� ��
Sumber/Source� :� Badan�Koordinasi�Penanaman�Modal�Sulawesi�Tengah�Investment�Coordinating�Board�of�Sulawesi�Tengah
http
://sul
teng
.bps
.go.
id

Finance, Banking, and Prices
Sulawesi Tengah in Figures 2014 393
11.3.Asuransi�/�Insurance��Tabel�
�Table�
11.3.1�Perkembangan�Perusahaan�Asuransi�Kerugian/Jasa,�2009�2013��Progress�of�Loss/Service�Insurance�Company,�2009�2013�
��
Uraian�Description� 2009� 2010� 2011� 2012� 2013�
(1)� (2)� (3)� (4)� (5)� (6)�
� � �
Jumlah�nasabah�Number�of�customers�
61�357� 59�961� 243�004� 5�231� 211�581�
Pendapatan�premi�Premium�income�(Juta�Rupiah)�
74�118,72� 104�026,46� 118�647,57� 48�587,91� 224�199,46�
Pembayaran�klaim�Claim�payment�(Juta�Rupiah)�
47�516,57� 56�469,97� 613�898,21� 21�903,92� 193�075,79�
� � �
Sumber/Source� :� Perusahaan�Asuransi�Kerugian�Sulawesi�Tengah�Insurance�Company�in�Sulawesi�Tengah
http
://sul
teng
.bps
.go.
id
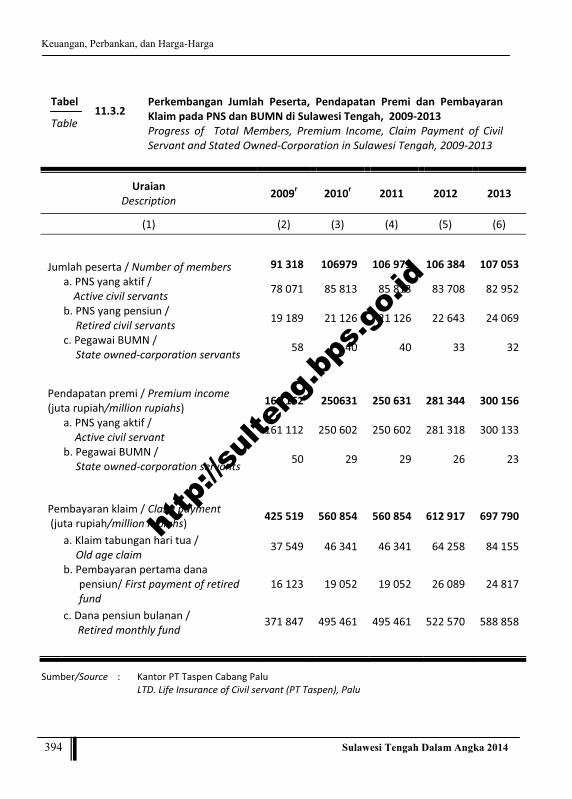
Keuangan, Perbankan, dan Harga-Harga
394 Sulawesi Tengah Dalam Angka 2014
Tabel�
Table� 11.3.2�Perkembangan� Jumlah� Peserta,� Pendapatan� Premi� dan� Pembayaran�Klaim�pada�PNS�dan�BUMN�di�Sulawesi�Tengah,��2009�2013��Progress� of� � Total�Members,� Premium� Income,� Claim� Payment� of� Civil�Servant�and�Stated�Owned�Corporation�in�Sulawesi�Tengah,�2009�2013�
�
Uraian�Description� 2009r� 2010r� 2011� 2012� 2013�
(1)� (2)� (3)� (4)� (5)� (6)�
� � � � � �
Jumlah�peserta�/�Number�of�members� 91�318� 106979� 106�979� 106�384� �107�053�
�a.�PNS�yang�aktif�/��� Active�civil�servants� 78�071� 85�813� 85�813� 83�708� �82�952�
�b.�PNS�yang�pensiun�/��� Retired�civil�servants� 19�189� 21�126� 21�126� 22�643� �24�069�
�c.�Pegawai�BUMN�/��� State�owned�corporation�servants� 58� 40� 40� 33� ��32�
� � � � � � �
Pendapatan�premi�/�Premium�income��(juta�rupiah/million�rupiahs)� 161�162� 250631� 250�631� 281�344� �300�156�
�a.�PNS�yang�aktif�/��� Active�civil�servant� 161�112� 250�602� 250�602� 281�318� �300�133�
�b.�Pegawai�BUMN�/��� State�owned�corporation�servants� 50� 29� 29� 26� ��23�
� � � � � � �
Pembayaran�klaim�/�Claim�payment���(juta�rupiah/million�rupiahs)� 425�519� 560�854� 560�854� 612�917� �697�790�
�a.�Klaim�tabungan�hari�tua�/�� Old�age�claim�
37�549� 46�341� 46�341� 64�258� �84�155�
�
b.�Pembayaran�pertama�dana�pensiun/�First�payment�of�retired�fund�
16�123� 19�052� 19�052� 26�089� �24�817�
�c.�Dana�pensiun�bulanan�/�� Retired�monthly�fund�
371�847� 495�461� 495�461� 522�570� �588�858�
� � � � � � �
Sumber/Source� :� Kantor�PT�Taspen�Cabang�Palu�LTD.�Life�Insurance�of�Civil�servant�(PT�Taspen),�Palu
http
://sul
teng
.bps
.go.
id

Finance, Banking, and Prices
Sulawesi Tengah in Figures 2014 395
11.4. �Koperasi�/�Cooperative��Tabel�
Table� 11.4.1�Jumlah�Koperasi��menurut�Status�Koperasi�dan�Kabupaten/Kota,�2009�2013��Number�of�Cooperatives�by�the�Status�and�Regency/City,�2009�2013�
�
Kabupaten/Kota�Regency/City�
Primer�Primary�
Sekunder�Secondary�
Jumlah�Total�
(1)� (2)� (3)� (4)�� � � �
01.�Banggai�Kepulauan� 105� �� 105�02.�Banggai� 238� �� 238�03.�Morowali� 259� �� 259�04.�Poso� 285� �� 285�05.�Donggala� 144� �� 144�06.�Tolitoli� 121� �� 121�07.�Buol� 239� �� 239�08.�Parigi�Moutong� 248� �� 248�09.�Tojo�Una�Una� 80� �� 80�10.�Sigi� 70� �� 70�11.�Banggai�Laut1)� …� …� …�12.�Morowali�Utara1)� …� …� …�13.�Palu� 355� 11� 366�� � � �Sulawesi�Tengah������� � � �
2�0�1�3� 2�144� �11� 2�155�2�0�1�2� 2�036� 12� 2�048�2�0�1�1� 2�017� 12� 2�029�2�0�1�0� 1�857� 12� 1�869�2�0�0�9� 1�821� 12� 1�833�
Sumber/Source� :� Dinas�Koperasi,�UMKM,�Perindustrian,�dan�Perdagangan�Daerah�Propinsi�Sulawesi�Tengah�� � Regional�Govt.of�Cooperative,�UMKM�(Micro,�Small�and�Medium�Scale�Establishments),�
Manufacturing,�and�Trading�in�Sulawesi�Tengah�Province�Catatan/Note�������:����1)�Tergabung�Dengan�Kabupaten�Induknya/�Include�in�main�regency�
http
://sul
teng
.bps
.go.
id

Keuangan, Perbankan, dan Harga-Harga
396 Sulawesi Tengah Dalam Angka 2014
Tabel�
Table� 11.4.2�Banyaknya� Koperasi� menurut� Status� Keaktifan� Koperasi� dan�Kabupaten/Kota,�2013��Number�of�Cooperatives�by�Being�Active�Status�and�Regency/City,�2013�
�
Kabupaten/Kota�Regency/City�
Aktif�Active�
�
Tidak�Aktif�Inactive�
�
Total�Total�
(1)� (2)� (3)� (4)�� � � �
01.�Banggai�Kepulauan� 102� 3� 105�
02.�Banggai� 156� 82� 238�
03.�Morowali� 159� 100� 259�
04.�Poso� 255� 30� 285�
05.�Donggala� 76� 68� 144�
06.�Tolitoli� 88� 33� 121�
07.�Buol� 95� 144� 239�
08.�Parigi�Moutong� 156� 92� 248�
09.�Tojo�Una�Una� 41� 39� 80�
10.�Sigi� 41� 29� 70�
11.�Banggai�Laut1)� …� …� …�
12.�Morowali�Utara1)� …� …� …�
13.�Palu� 186� 180� 366�
� � � �
Sulawesi�Tengah������� 1�355� �800� 2�155�
Sumber/Source� :� Dinas�Koperasi,�UMKM,�Perindustrian,�dan�Perdagangan�Daerah�Propinsi�Sulawesi�Tengah�� � Regional�Govt.of�Cooperative,�UMKM�(Micro,�Small�and�Medium�Scale�Establishments),�
Manufacturing,�and�Trading�in�Sulawesi�Tengah�Province�Catatan/Note�������:����1)�Tergabung�Dengan�Kabupaten�Induknya/�Include�in�main�regency�
http
://sul
teng
.bps
.go.
id

Finance, Banking, and Prices
Sulawesi Tengah in Figures 2014 397
Tabel�
Table� 11.4.3�Banyaknya� Koperasi� menurut� Jenis� Koperasi� dan� Kabupaten/Kota,�2009�2013��Number�of�Cooperatives�by�Kind�and�Regency/City,�2009�2013�
�
Kabupaten/Kota�Regency/City�
Koperasi�Unit�Desa�(KUD)�Village�Unit�Cooperative�
Koperasi�Pontren�Pontren�
Cooperative�
Koperasi�Pinkra�Pinkra�
Cooperative�
Koperasi�Pegawai�Negeri�
(KPN)/Civil�Servant�
Cooperative�
(1)� (2)� (3)� (4)� (5)�
� � � � �01.�Banggai�Kepulauan� 16� 2� 1� 5�02.�Banggai� 42� 9� 3� 42�03.�Morowali� 38� 5� 4� 16�04.�Poso� 18� 2� 2� 32�05.�Donggala� 24� 1� 2� 29�06.�Tolitoli� 18� 6� 3� 23�07.�Buol� 12� 4� 3� 8�08.�Parigi�Moutong� 30� 10� 2� 20�09.�Tojo�Una�Una� 11� 2� 1� 15�10.�Sigi� 13� 3� �� 18�11.�Banggai�Laut1)� …� …� …� …�12.�Morowali�Utara1)� …� …� …� …�13.�Palu� 1� 5� 9� 80�� � � � �Sulawesi�Tengah������� � � � �
2�0�1�3� 223� 49� 30� 288�2�0�1�2� 219� 48� 29� 290�2�0�1�1� 223� 48� 29� 290�2�0�1�0� 228� 46� 27� 306�2�0�0�9� ���220� 39� ����28� ���310�
� �
http
://sul
teng
.bps
.go.
id

Keuangan, Perbankan, dan Harga-Harga
398 Sulawesi Tengah Dalam Angka 2014
Lanjutan�tabel�/�Continued�Table��11.4.3���
Kabupaten/Kota�Regency/City�
Koperasi�Buruh/Karyawan
Workers�Cooperatives�
Koperasi�ABRI�
Indonesian�Armed�Force�Cooperatives�
Koperasi�Serba�Usaha�Multipurpose�Cooperatives�
Koperasi�Simpan�Pinjam�Saving�and�Credit�
Cooperatives�
(1)� (6)� (7)� (8)� (9)�
� � � � �01.�Banggai�Kepulauan� 2� 1� 44� 5�
02.�Banggai� 17� 2� 48� 11�
03.�Morowali� 6� 1� 102� 8�
04.�Poso� 3� 3� 68� 12�
05.�Donggala� 7� 1� 23� 5�
06.�Tolitoli� 7� 1� 17� 12�
07.�Buol� 4� 1� 91� 4�
08.�Parigi�Moutong� 5� �� 62� 34�
09.�Tojo�Una�Una� 5� �� 17� 3�
10.�Sigi� 1� �� 11� 2�
11.�Banggai�Laut1)� …� …� …� …�
12.�Morowali�Utara1)� …� …� …� …�
13.�Palu� 43� 12� 134� 20�
� � � � �
Sulawesi�Tengah������� � � � �2�0�1�3� 100� 22� 617� 116�
2�0�1�2� 97� 20� 576� 89�
2�0�1�1� 97� 14� 570� 84�
2�0�1�0� 94� 19� 479� 74�
2�0�0�9� 91� 16� 435� 64�
�
http
://sul
teng
.bps
.go.
id
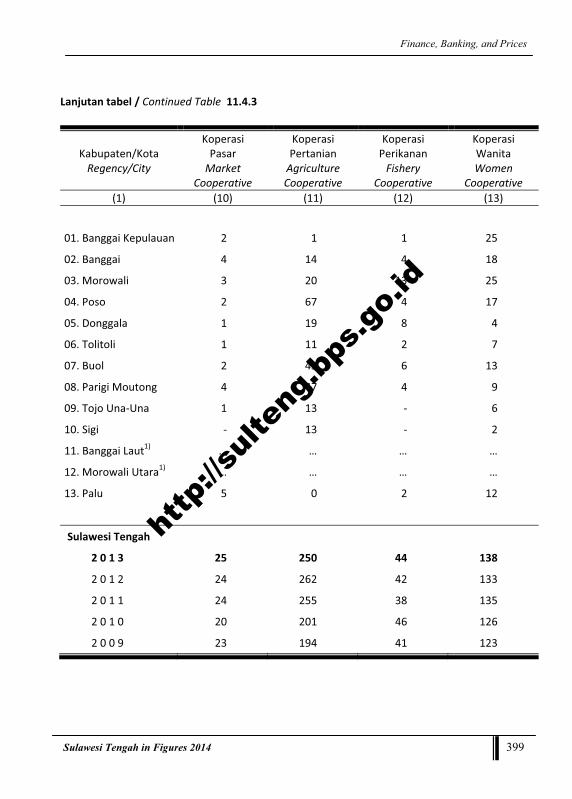
Finance, Banking, and Prices
Sulawesi Tengah in Figures 2014 399
Lanjutan�tabel�/�Continued�Table��11.4.3��
�
Kabupaten/Kota�Regency/City�
Koperasi�Pasar�Market�
Cooperative�
Koperasi�Pertanian�Agriculture�Cooperative�
Koperasi�Perikanan�Fishery�
Cooperative�
Koperasi�Wanita�Women�
Cooperative�(1)� (10)� (11)� (12)� (13)�
� � � � �01.�Banggai�Kepulauan� 2� 1� 1� 25�
02.�Banggai� 4� 14� 4� 18�
03.�Morowali� 3� 20� 13� 25�
04.�Poso� 2� 67� 4� 17�
05.�Donggala� 1� 19� 8� 4�
06.�Tolitoli� 1� 11� 2� 7�
07.�Buol� 2� 45� 6� 13�
08.�Parigi�Moutong� 4� 47� 4� 9�
09.�Tojo�Una�Una� 1� 13� �� 6�
10.�Sigi� �� 13� �� 2�
11.�Banggai�Laut1)� …� …� …� …�
12.�Morowali�Utara1)� …� …� …� …�
13.�Palu� 5� 0� 2� 12�
� � � � �
Sulawesi�Tengah������� � � � �
2�0�1�3� 25� 250� 44� 138�
2�0�1�2� 24� 262� 42� 133�
2�0�1�1� 24� 255� 38� 135�
2�0�1�0� 20� 201� 46� 126�
2�0�0�9� 23� 194� 41� 123�
http
://sul
teng
.bps
.go.
id

Keuangan, Perbankan, dan Harga-Harga
400 Sulawesi Tengah Dalam Angka 2014
Lanjutan�tabel�/�Continued�Table��11.4.3��
Kabupaten/Kota�Regency/City�
Koperasi�Peran�Serta�Masyarakat�
Community�Participation�Cooperative
Koperasi�Perkebunan�
Estate�Cooperative�
Koperasi�Pemuda�Youth�
Cooperative�
(1)� (14)� (15)� (16)�
� � � �01.�Banggai�Kepulauan� �� �� ��
02.�Banggai� 6� 5� 2�
03.�Morowali� 9� 2� 2�
04.�Poso� 3� 1� ��
05.�Donggala� �� �� ��
06.�Tolitoli� �� �� ��
07.�Buol� �� 29� ��
08.�Parigi�Moutong� 18� �� 1�
09.�Tojo�Una�Una� 2� �� ��
10.�Sigi� 4� �� ��
11.�Banggai�Laut1)� …� …� …�
12.�Morowali�Utara1)� …� …� …�
13.�Palu� 3� 2� 6�
� � � �
Sulawesi�Tengah������� � � �
2�0�1�3� 45� 39� 11�
2�0�1�2� 47� 21� 11�
2�0�1�1� 47� 25� 10�
2�0�1�0� 49� 31� 11�
2�0�0�9� 42� 26� 10�
http
://sul
teng
.bps
.go.
id

Finance, Banking, and Prices
Sulawesi Tengah in Figures 2014 401
Lanjutan�tabel�/�Continued�Table��11.4.3��
�
Sumber/Source� :� Dinas�Koperasi,�UMKM,�Perindustrian,�dan�Perdagangan�Daerah�Propinsi�Sulawesi�Tengah�� � Regional�Govt.of�Cooperative,�UMKM�(Micro,�Small�and�Medium�Scale�Establishments),�
Manufacturing,�and�Trading�in�Sulawesi�Tengah�Province�Catatan/Note�������:����1)�Tergabung�Dengan�Kabupaten�Induknya/�Include�in�main�regency�
Kabupaten/Kota�Regency/City�
Koperasi�Mahasiswa�Student�
Cooperative�
Koperasi�Lainnya�Other�
Cooperatives�
Jumlah�Total�
Cooperatives�
(1)� (17)� (18)� (19)�
� � � �01.�Banggai�Kepulauan� �� �� 105�
02.�Banggai� 1� 10� 238�
03.�Morowali� �� 5� 259�
04.�Poso� 1� 50� 285�
05.�Donggala� �� 20� 144�
06.�Tolitoli� 2� 11� 121�
07.�Buol� 1� 16� 239�
08.�Parigi�Moutong� �� 2� 248�
09.�Tojo�Una�Una� 1� 3� 80�
10.�Sigi� �� 3� 70�
11.�Banggai�Laut1)� …� …� …�
12.�Morowali�Utara1)� …� …� …�
13.�Palu� 3� 29� 366�
� � � �
Sulawesi�Tengah������� � � �
2�0�1�3� 9� 149� 2�155�
2�0�1�2� 7� 130� 2�048�
2�0�1�1� 7� 84� 2�029�
2�0�1�0� 8� 70� 1�835�
2�0�0�9� 8� 134� 1�804�
http
://sul
teng
.bps
.go.
id

Keuangan, Perbankan, dan Harga-Harga
402 Sulawesi Tengah Dalam Angka 2014
Tabel�Table� 11.4.4�
Banyaknya�Anggota�Koperasi�menurut�Kabupaten/Kota,�2009�2013��Number�of�Cooperative�Members�by�Regency/City,�2009�2013�
�
Kabupaten/Kota�Regency/City� 2009� 2010� 2011� 2012� 2013�
(1)� (2)� (3)� (4)� (5)� (6)�� � � � � �
01.�Banggai�Kepulauan� 10�408� 11�495� 11�611� 11�5258� 11�534�
02.�Banggai� 36�896� 37�906� 40�002� 40�168� 39�075�
03.�Morowali� 20�299� 16�525� 20�665� 20�913� 21�272�
04.�Poso� 24�810� 24�250� 26�981� 28�482� 16�326�
05.�Donggala� 28�170� 26�744� 25�858� 27�843� 21�912�
06.�Tolitoli� 30�804� 30�736� 29�301� 29�307� 29�683�
07.�Buol� 18�507� 17�340� 17�774� 18�184� 18�244�
08.�Parigi�Moutong� 27�048� 27�210� 28�183� 28�231� 29�648�
09.�Tojo�Una�Una� 12�459� 12�291� 12�295� 13�183� 13�413�
10.�Sigi� 12�909� 29�044� 14�076� 13�871� 12�375�
11.�Banggai�Laut1)� …� …� …� …� …�
12.�Morowali�Utara1)� …� …� …� …� …�
13.�Palu� 23�955� 13�679� 29�434� 28�203� 28�203�
� � � � � �
Sulawesi�Tengah������� 246�733� 236�026� 256�180� 259�913� 241�685�
� � � � � �
Sumber/Source� :� Dinas�Koperasi,�UMKM,�Perindustrian,�dan�Perdagangan�Daerah�Propinsi�Sulawesi�Tengah�� � Regional�Govt.of�Cooperative,�UMKM�(Micro,�Small�and�Medium�Scale�Establishments),�
Manufacturing,�and�Trading�in�Sulawesi�Tengah�Province�Catatan/Note�������:����1)�Tergabung�Dengan�Kabupaten�Induknya/�Include�in�main�regency�
http
://sul
teng
.bps
.go.
id
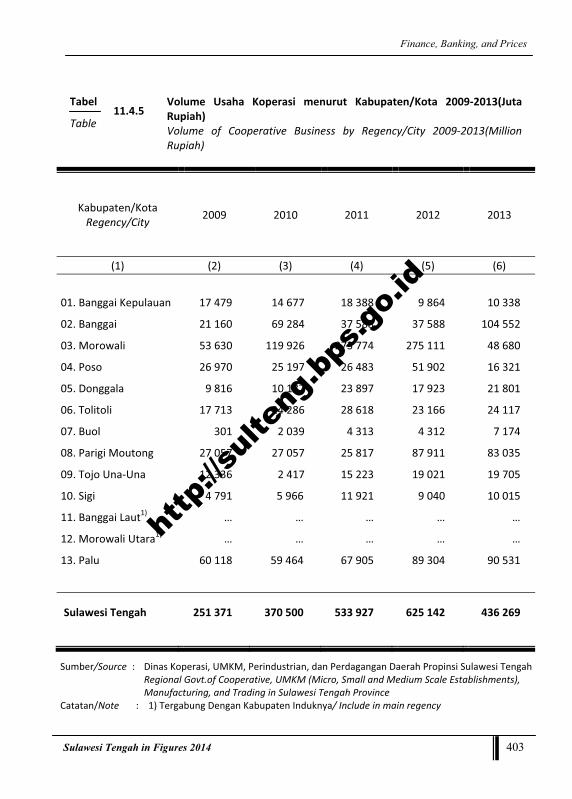
Finance, Banking, and Prices
Sulawesi Tengah in Figures 2014 403
Tabel�
Table� 11.4.5�Volume� Usaha� Koperasi� menurut� Kabupaten/Kota� 2009�2013(Juta�Rupiah)��Volume� of� Cooperative� Business� by� Regency/City� 2009�2013(Million�Rupiah)�
�
Kabupaten/Kota�Regency/City� 2009� 2010� 2011� 2012� 2013�
(1)� (2)� (3)� (4)� (5)� (6)�� � � � � �
01.�Banggai�Kepulauan� 17�479� 14�677� 18�388� 9�864� 10�338�
02.�Banggai� 21�160� 69�284� 37�588� 37�588� 104�552�
03.�Morowali� 53�630� 119�926� 273�774� 275�111� 48�680�
04.�Poso� 26�970� 25�197� 26�483� 51�902� 16�321�
05.�Donggala� 9�816� 10�187� 23�897� 17�923� 21�801�
06.�Tolitoli� 17�713� 24�286� 28�618� 23�166� 24�117�
07.�Buol� 301� 2�039� 4�313� 4�312� 7�174�
08.�Parigi�Moutong� 27�057� 27�057� 25�817� 87�911� 83�035�
09.�Tojo�Una�Una� 12�336� 2�417� 15�223� 19�021� 19�705�
10.�Sigi� 4�791� 5�966� 11�921� 9�040� 10�015�
11.�Banggai�Laut1)� …� …� …� …� …�
12.�Morowali�Utara1)� …� …� …� …� …�
13.�Palu� 60�118� 59�464� 67�905� 89�304� 90�531�
� � � � � �
Sulawesi�Tengah������� 251�371� 370�500� 533�927� 625�142� 436�269�
� � � � � �
Sumber/Source� :� Dinas�Koperasi,�UMKM,�Perindustrian,�dan�Perdagangan�Daerah�Propinsi�Sulawesi�Tengah�� � Regional�Govt.of�Cooperative,�UMKM�(Micro,�Small�and�Medium�Scale�Establishments),�
Manufacturing,�and�Trading�in�Sulawesi�Tengah�Province�Catatan/Note�������:����1)�Tergabung�Dengan�Kabupaten�Induknya/�Include�in�main�regency��
http
://sul
teng
.bps
.go.
id

Keuangan, Perbankan, dan Harga-Harga
404 Sulawesi Tengah Dalam Angka 2014
Tabel�
Table� 11.4.6�Jumlah�Sisa�Hasil�Usaha�Koperasi�menurut�Kabupaten/Kota�2009�2013�(Juta�Rupiah)��Number� of� Remaining� Cooperative� Business� Output� by� Regency/City�2009�2013�(Million�Rupiah)�
�
Kabupaten/Kota�Regency/City� 2009� 2010� 2011� 2012� 2013�
(1)� (2)� (3)� (4)� (5)� (6)�� � � � � �
01.�Banggai�Kepulauan� 564� 527� 577� 1�254� �1�226�
02.�Banggai� 993� 2�482� 2�606� 2�605� �3�904�
03.�Morowali� 9�948� 1�923� 10�630� 10�384� �4�251�
04.�Poso� 2�333� 2�763� 4�280� 8�121� �1�208�
05.�Donggala� 241� �506� 1�451� 1�464� �1�762�
06.�Tolitoli� 603� �657� 1�163� 774� �1�061�
07.�Buol� 722� �629� 766� 766� �3�479�
08.�Parigi�Moutong� 1�180� 1�124� 1�903� 2�791� �3�110�
09.�Tojo�Una�Una� 787� 394� 928� 1�107� �1�272�
10.�Sigi� 309� 623� 968� 439� �2�503�
11.�Banggai�Laut1)� …� …� …� …� …�
12.�Morowali�Utara1)� …� …� …� …� …�
13.�Palu� 3�931� 4��873� 3�841� 5�569� 4�903�
� � � � � �
Sulawesi�Tengah������� 21�611� 16�501� 29�113� 35�274� 28�679�� � � � � �
Sumber/Source� :� Dinas�Koperasi,�UMKM,�Perindustrian,�dan�Perdagangan�Daerah�Propinsi�Sulawesi�Tengah�� � Regional�Govt.of�Cooperative,�UMKM�(Micro,�Small�and�Medium�Scale�Establishments),�
Manufacturing,�and�Trading�in�Sulawesi�Tengah�Province�Catatan/Note�������:����1)�Tergabung�Dengan�Kabupaten�Induknya/�Include�in�main�regency�
http
://sul
teng
.bps
.go.
id

Finance, Banking, and Prices
Sulawesi Tengah in Figures 2014 405
Tabel�
Table� 11.4.7�Jumlah� Modal� Usaha� Koperasi� menurut� Asal� Perolehan� dan�Kabupaten/Kota,�2013�(Juta�Rupiah)��Business� Capital� of� Cooperative� by� the� Capital� Acquisition� and�Regency/City,�2013�(Million�Rupiah)�
�
Kabupaten/Kota�Regency/City�
Modal�Sendiri�Own�Capital�
Modal�Luar�External�Capital�
Jumlah�Total�
(1)� (2)� (3)� (4)�� � � �
01.�Banggai�Kepulauan� 12�001� 7�715� 19�715�
02.�Banggai� 40�759� 34�936� 75�695�
03.�Morowali� 27�226� 5�893� 33�119�
04.�Poso� 41�446� 21�173� 62�619�
05.�Donggala� 13�494� 109�711� 123�204�
06.�Tolitoli� 54�533� 16�868� 71�401�
07.�Buol� �873� 6�302� 7�174�
08.�Parigi�Moutong� 25�037� 35�848� 60�885�
09.�Tojo�Una�Una� 11�890� 6�768� 18�658�
10.�Sigi� 13�494� 18�659� 32�152�
11.�Banggai�Laut1)� …� …� …�
12.�Morowali�Utara1)� …� …� …�
13.�Palu� 19�400� 5�561� 24�961�
� � � �
Sulawesi�Tengah�� 260�152� 269�433� 529�585�� � � �
Sumber/Source� :� Dinas�Koperasi,�UMKM,�Perindustrian,�dan�Perdagangan�Daerah�Propinsi�Sulawesi�Tengah�� � Regional�Govt.of�Cooperative,�UMKM�(Micro,�Small�and�Medium�Scale�Establishments),�
Manufacturing,�and�Trading�in�Sulawesi�Tengah�Province�Catatan/Note�������:����1)�Tergabung�Dengan�Kabupaten�Induknya/�Include�in�main�regency�
http
://sul
teng
.bps
.go.
id

Keuangan, Perbankan, dan Harga-Harga
406 Sulawesi Tengah Dalam Angka 2014
Tabel�
Table� 11.4.8�Jumlah�Manajer�Karyawan�dan�Rapat�Anggota�Tahunan�(RAT)�Koperasi�menurut�Kabupaten/Kota,�2013�Number� of�Managers� Employees� and� Annual�Membership�Meetings� of��Cooperative�by�Regency/City,2013�
�
Kabupaten/Kota�Regency/City�
Manajer�Manager�
Karyawan�Employee�
Rapat�Anggota�Tahunan�(RAT)�
Annual�Membership�Meeting�
(1)� (2)� (3)� (4)�� � � �
01.�Banggai�Kepulauan� 81� 109� 17�
02.�Banggai� 26� 376� 55�
03.�Morowali� 16� 208� 26�
04.�Poso� 11� 62� 81�
05.�Donggala� 6� 69� 15�
06.�Tolitoli� 19� 227� 33�
07.�Buol� 130� 584� 17�
08.�Parigi�Moutong� 32� 405� 38�
09.�Tojo�Una�Una� 7� 82� 13�
10.�Sigi� 16� 76� 28�
11.�Banggai�Laut1)� …� …� …�
12.�Morowali�Utara1)� …� …� …�
13.�Palu� 76� 684� 81�
� � � �
Sulawesi�Tengah��� 420� 2882� 404�� � � �
Sumber/Source� :� Dinas�Koperasi,�UMKM,�Perindustrian,�dan�Perdagangan�Daerah�Propinsi�Sulawesi�Tengah�Regional�Govt.of�Cooperative,�UMKM�(Micro,�Small�and�Medium�Scale�Establishments),�Manufacturing,�and�Trading�in�Sulawesi�Tengah�Province�
Catatan/Note�������:����1)�Tergabung�Dengan�Kabupaten�Induknya/�Include�in�main�regency�
http
://sul
teng
.bps
.go.
id

Finance, Banking, and Prices
Sulawesi Tengah in Figures 2014 407
11.5. Harga�Harga�/�Prices��Tabel�
Table� 11.5.1�Rata�rata�Harga�Produsen�Tanaman�Palawija�menurut�Komoditi,�2009�2013�(Rupiah�/100�kg)��Average� Producer� Prices� of� Secondary� Food� Crop� by� Comodity,� 2009�2013�(Rupiahs�/100�kg)�
�(Diolah�dari�Hasil�Survei�Harga�Produsen�/�Based�on�Producer�Price�Survey)�
Komoditi�Comodity�
2009� 2010� 2011� 2012� 2013�
(1)� (2)� (3)� (4)� (5)� (6)�� � �
01. Jagung�Pipilan/Maize� 261�531� 248�500� 328�819� 287�813� �328�690�
02. Ketela�Pohon/�Yams�Cassavas� 247�381� 286�354� 295�833� 287�583� �277�521�
03. Ketela�Rambat/Sweet�Potatoes� 328�472� 368�256� 333�368� 287�583� �345�913�
04. Kacang�Tanah/Peanut� 1�080�903� 1�101�905� 1�458�345� 923�952� 1�310�327�
05. Kacang�Kedele/Soybeans� 558�333� 562�153� 655�694� 692�000� �712�937�
06. Kacang�Hijau/Green�Peanut� 875�833� 872�000� 981�656� 1�049�667� 1�188�504�
� � �
�
http
://sul
teng
.bps
.go.
id

Keuangan, Perbankan, dan Harga-Harga
408 Sulawesi Tengah Dalam Angka 2014
Tabel�
Table� 11.5.2�Rata�rata�Harga�Produsen�Tanaman�Sayuran�menurut�Komoditi,�2009�2013�(Rupiah�/100�kg)��Average�Producer�Prices�of�Vegetable�Plant�By�Regency/City���2009�2013�(Rupiahs�/100�kg)�
�(Diolah�dari�Hasil�Survei�Harga�Produsen�/�Based�on�Producer�Price�Survey)�
Komoditi�Commodity�
2009� 2010� 2011� 2012� 2013�
(1)� (2)� (3)� (4)� (5)� (6)�� �
01. Kentang/Potatoe� 411�667� 793�044� 493�833� 658�333� �707�571�
02. Ketimun/Cucumber� 286�845� 314�352� 358�157� 343�239� �292�992�
03. Kacang�Panjang/Long�Bean�
379�404� 416�667� 425�504� 464�042� �462�908�
04. Kubis/Cabbage� 304�167� 618�825� �� �� ���
05. Cabe�Rawit/Chili� 1�779�037� 1�959�875� 2�729�861� 2�366�417� 2�518�363�
06. Cabe�Merah/Ordinary�Chili� 1�755�556� 1�652�500� 2�641�667� 1�791�204� 1�607�923�
07. Tomat�Sayur/Tomato� 565�417� 605�250� 560�391� 623�657� �629�593�
� � � �
�
�� �
http
://sul
teng
.bps
.go.
id

Finance, Banking, and Prices
Sulawesi Tengah in Figures 2014 409
Lanjutan�tabel�/�Continued�Table�11.5.2���
Komoditi�Commodity�
2009� 2010� 2011� 2012� 2013�
(7)� (8)� (9)� (10)� (11)� (12)�� � �
08. Buncis�Green/Bean� 787�500� 651�389� 427�778� 564�722� �486�566�
09. Labu�Siam/Squash� 141�806� 191�250� 174�861� 225�625� �214�318�
10. Kacang�Panjang/Long�Bean� 325�863� 355�700� 330�968� 464�042� �462�908�
11. Kangkung/Leafy�vegetable� 217�662 248�417� 276�295� 305�783� �306�589�
12. Bayam/Spinach� 380�235 424�907� 454�319� 470�958� �514�268�
13. Pepaya��Sayur/Unripe�papaya� 214�583� 332�188� 369�646� 220�035� ���
14. Sawi�Hijau/Mustard�Green� 355�000� 363�750� 423�288� 408�556� �453�796�
15. Bawang�Putih/Garlic� 922�084� 1�695�833� 1�416�667� 1�008�333� 1�200�000�
16. Bawang�Merah/Shallot� 1�530�682� 1�410�417� 1�662�500� 1�162�500� 4�100�000�
� � � �� �
http
://sul
teng
.bps
.go.
id

Keuangan, Perbankan, dan Harga-Harga
410 Sulawesi Tengah Dalam Angka 2014
Tabel�
Table� 11.5.3�Rata�rata�Harga�Produsen�Tanaman�Buah�Buahan�menurut�Komoditi,�2009�2013�Average�Producer�Prices�of��Fruits�Plant��By�Commodity,�2009�2013�
�((Diolah�dari�Hasil�Survei�Harga�Produsen�/�Based�on�Producer�Price�Survey)�
Komoditi�Commodity�
Satuan�Unit� 2009� 2010� 2011� 2012� 2013�
(1)� (2)� (3)� (4)� (5)� (6)� (7)�� � �
01. Pisang�Ambon/�Banana� (Rp/Sisir)� 3�196� 3�390� 4�212� 4�435� 4832
02. Pisang�Raja/�Banana� (Rp/Sisir)� 2�751� 3�488� 3�579� 3�530� 3518
03. Pisang�Sepatu/�Banana� (Rp/Sisir)� 3�808� 4�505� 4�329� 3�991� 3966
04. Pepaya�Besar/Papaya� (Rp/Kg)� 3�146� 2�892� 2�673� �� 2983
05. Nangka/Jack�Fruit�� (Rupiah/Kg)� 2�969� 3�102� 5�301� �� ��
06. Nenas/Pineapple��
(Rupiah/10�Buah)�
36�600� 41�988� 55�069� 48�313� 52853
07. Durian/Durian�� (Rupiah/10�Buah)� 122�672� 50�333� 118�861� 124�750� 122491
� � �
�� �
http
://sul
teng
.bps
.go.
id

Finance, Banking, and Prices
Sulawesi Tengah in Figures 2014 411
�Tabel�
Table� 11.5.4�Rata�rata�Harga�Produsen�Tanaman�Perkebunan�Rakyat�menurut�Komoditi,�2009�2013��Average�Producer�Prices�of�Smallholders�Estates�By�Commodity,��2009�2013�
�(Diolah�dari�Hasil�Survei�Harga�Produsen�/�Based�on�Producer�Price�Survey)�
Komoditi�Commodity�
Satuan��Unit� 2009� 2010� 2011� 2012� 2013�
(1)� (2)� (3)� (4)� (5)� (6)� (7)�� � �
01. Kelapa/Coconuts� (Rp/100�btr/100�grain)�
109�283 95�024 145�708 116�826 132�973
02. Kopi/Coffees� (Rp/100�Kg)� 1�458�333 1�839�583 1�792�708 1�981�250 1�843�056
03. Kakao/Cocoas� (Rp/100�Kg)� 2�079�333 1�864�048 1�942�667 1�669�226 1�791�070
04. Lada/Peppers� (Rp/100�Kg)� 4�650�000 4�576�700 5�823�600 8�441�700 8�474�800
05. Jambu�Mente/Cashews�
�(Rp/100�Kg)�
641�667 656�250 829�167 � �
06. Jahe/Gingers� (Rp/100�Kg)� 549�740 687�708 638�583 � �
07. Cengkeh/Clove� (Rp�/Kg)� 47�050 48�896 110�417 92�333 145�977
08. Pala/Nutmeg� (Rp�/Kg)� 24�200 27�639 40�833 42�667 43�403
09. Gula�Merah/Brown�Sugars� (Rp/Kg)� 11�709 12�667 12�870 13�458 13�062
10. Kopra/Copra� (Rp/100�Kg)� 292�598 399�655 650�000 429�893 388�520
� � �
�
http
://sul
teng
.bps
.go.
id

Keuangan, Perbankan, dan Harga-Harga
412 Sulawesi Tengah Dalam Angka 2014
Tabel�
Table� 11.5.5�Rata�Rata�Harga�Produsen�Peternakan�Besar�dan�Kecil�menurut�Ternak,�2009�2013��Average�Producer�Prices�of�Large�and�Small�Livestocks�by�Livestock,�2009�2013�
��(Diolah�dari�Hasil�Survei�Harga�Produsen�/�Based�on�Producer�Price�Survey)�
Jenis�Ternak�Types�of�Livestock�
Satuan�Unit� 2009� 2010� 2011� 2012� 2013�
(1)� (2)� (3)� (4)� (5)� (6)� (7)�
��
�
A. Ternak�Besar/�Large�Livestock� � � � �
01. Sapi�Potong/Beef�Cattle�
(1�ekor/head=�250�Kg)�
5�811�023 5�920�833 9�875�000 11�373�611 10�054�924
02. Kuda/Horse� (1�ekor/head=�150�Kg)�
... ... ... ... ...
� �
B. Ternak�Kecil�/�Small�Livestock� � � � �
01. Kambing/Goat� (1�ekor�/�head�=15�Kg)
556�875 649�271 734�028 843�056 �876�616
02. Babi�Lokal�/Pig� (1�ekor/head=70�Kg)�
829�166 831�944 857�917 975�000 1�347�828
� �
C. Ternak�Unggas�/�Poultry�Livestock�� � � � �
01. Ayam�Kampung/�Native�Chicken�
(Rp/Ekor)�/(Rp/Tail)�
47�458 50�635 52�854 65�133 44�100
02. Ayam�Ras/�Improved�hen�
(Rp/Ekor)�/(Rp/Tail)�
30�625 32�260 33�479 41�063 27�305
03. Itik/Bebek/Duck� (Rp/Ekor)�/(Rp/Tail)�
40�000 45�313 ... ... ...
� � �
http
://sul
teng
.bps
.go.
id

Finance, Banking, and Prices
Sulawesi Tengah in Figures 2014 413
Tabel�
Table� 11.5.6�� Rata�rata� Harga� Produsen� Hasil� Peternakan� dan� Perikanan� Laut�
menurut�Komoditi,�2009�2013��Average�Producer�Prices�of� �Livestock�Product�and�Marine�Fishery�by�Commodity,2009�2013��
�(Diolah�dari�Hasil�Survei�Harga�Produsen�/�Based�on�Producer�Price�Survey)�
Rincian�Items�
Satuan�Unit� 2009� 2010� 2011� 2012� 2013�
(1)� (2)� (3)� (4)� (5)� (6)� (7)�
��
��
Hasil�Peternakan/Product�Livestock�� � �
Telur�Ayam�Kampung/Native�Chicken�Eggs�
(Rp�/10�Butir)/�(rupiah�/10�Grains)�
15�313� 16�850� 18�750 22�052 �24�389
Telur�Itik/Duck�Eggs�
(Rp�/10�Butir)/�
(rupiah�/10�Grains)�
11�563� 14�450� 15�500 15�667 �16�154
Hasil�Perikanan�Laut/Marine�Fishery�Product� � �
Ikan�Segar�Kembung/Fresh�Fish� (Rp�/Kg)/�(rupiah�/Kg)�
12�477� 12�347� 14�806 12�458 �11�519
Ikan�Segar�Layang/Fresh�Fish� (Rp�/Kg)/�(rupiah�/Kg)�
11�635� 12�298� 13�448 12�817 �14�872
Ikan�Segar�Cakalang/Fresh�Fish� (Rp�/Kg)/�(rupiah�/Kg)�
16�802� 14�969� 15�673 16�675 �19�904
Ikan�Segar�Tongkol/Fresh�Fish� (Rp�/Kg)/�(rupiah�/Kg)�
16�712� 17�482� 19�938 ... ...
Ikan�Segar�Lainnya/Fresh�Fish�Other�
(Rp�/Kg)/�(rupiah�/Kg)�
13�365� 16�386� … ... ...
Cumi�cumi/Squid� (Rp�/Kg)/�(rupiah�/Kg)�
37�528� 39�979� 41�470 37�183 �38�122
Lainnya/Others� (Rp�/Kg)/�(rupiah�/Kg)�
18�766� 21�627� ... ... ...
� � � � � �
http
://sul
teng
.bps
.go.
id

Keuangan, Perbankan, dan Harga-Harga
414 Sulawesi Tengah Dalam Angka 2014
Tabel�
Table� 11.5.7�Rata�Rata�Harga�Produsen�Obat�Obatan�dan�Pupuk�menurut�Jenisnya,�2009�2013��Average�Producer�Prices�of�Pesticide�and��Fertilizer�by�Types,�2009�2013�
��(Diolah�dari�Hasil�Survei�Harga�Produsen�/�Based�on�Producer�Price�Survey)�
���
Rincian�Items�
Satuan�Unit� 2009� 2010� 2011� 2012� 2013�
(1)� (2)� (3)� (4)� (5)� (6)� (7)�� � �Pestisida�dan�Pupuk�/Pesticide�and�Fertilizer�� � �
01. Urea� (Rp/kg)/�(rupiahs/kg)�
2�013 1�780 2�158 1�957 �2�005
02. TSP� (Rp/kg)/�(rupiahs/kg)� 2�688 2�728 2�513 2�527 �2�360
03. ZA� (Rp/kg)/�(rupiahs/kg)� 1�377 1�473 1�651 1�504 �1�559
04. SP�36� (Rp/kg)/�(rupiahs/kg)� 2�170 2�275 2�321 2�565 �2�523
05. KCL� (Rp/kg)/�(rupiahs/kg)� 3�100 3�141 3�215 3�205 �3�844
06. Herbisida�� (Rp/Liter)/�(Rupiah/litre)�
� � 2005 2005 �60�047
07. Insektisida��� (Rp/Liter)/�(Rupiah/litre)�
� �27�542 �25�233 �38�036
08. Lainnya�� (Rp/Liter)/�(Rupiah/litre)�
� 60�491 … ... ...
� � � � �
http
://sul
teng
.bps
.go.
id

Finance, Banking, and Prices
Sulawesi Tengah in Figures 2014 415
Tabel�
Table� 11.5.8�Indeks�Harga�yang�Diterima�dan�Dibayar�Petani�serta�Nilai�Tukar�Petani�Tanaman�Pangan�menurut�Bulan,�2013�Indices�of�Prices�Received�and�Paid�by�Farmers�and�Food�Crops�Farmers'�Term�Trade�by�Month,�2013�
�
Bulan�Month�
Indeks�yang�
Diterima�Indices�of�Prices�
Received�(It)�
Peru��bahan�Change�
(%)�
Indeks�yang�
Dibayar�Indices�of�Prices�
Received�(Ib)�
Peru��bahan�Change�
(%)�
Nilai�Tukar�Petani�Farmers'�Term�Trade��(NTP)�
Peru��bahan�Change�
(%)�
(1)� (2)� (3)� (4)� (5)� (6)� (7)�
01.�Januari/�January�� 121,71� 0,60� 147,15� 0,57� 82,71� 0,02�
02.�Februari/�February�� 121,80� 0,07� 147,76� 0,41� 82,43� �0,34�
03.�Maret/�March�� 121,26� �0,44� 148,58� 0,55� 81,61� �0,99�
04.�April/�April�� 121,06� �0,16� 148,25� �0,22� 81,66� 0,06�
05.�Mei/�May�� 120,39� �0,55� 148,54� 0,20� 81,05� �0,75�
06.�Juni/�June�� 121,56� 0,97� 148,37� �0,11� 81,93� 1,09�
07.�Juli/�July�� 121,28� �0,23� 153,06� 3,16� 79,24� �3,28�
08.�Agustus/�August�� 121,81� 0,44� 155,97� 1,90� 78,10� �1,44�
09.�September/�September�� 121,65� �0,13� 156,05� 0,05� 77,95� �0,19�
10.�Oktober/�October�� 122,63� 0,81� 155,57� �0,31� 78,83� 1,13�
11.�November/�November�� 121,76� �0,71� 155,78� 0,13� 78,16� �0,85�
12.�Desember/�December�� 121,54� �0,18� 151,80� �2,56� 80,11� 2,50�
� � � � � � �
http
://sul
teng
.bps
.go.
id

Keuangan, Perbankan, dan Harga-Harga
416 Sulawesi Tengah Dalam Angka 2014
Tabel�
Table� 11.5.9�Indeks� Harga� yang� Diterima� dan� Dibayar� Petani� serta� Nilai� Tukar�Petani�Hortikultura�menurut�Bulan,�2013�Indices� of� Prices� Received� and� Paid� by� Farmers� and� � Farmers'� Term�Trade�by�Month,�2013�
�
Bulan�Month�
Indeks�yang�
Diterima��Indices�of�Prices�
Received�(It)�
Peru��bahan�Change�
(%)�
Indeks�yang�
Dibayar�Indices�of�Prices�
Received�(Ib)�
Peru��bahan�Change�
(%)�
Nilai�Tukar�Petani�Farmers'�Term�Trade��(NTP)�
Peru��bahan�Change�
(%)�
(1)� (2)� (3)� (4)� (5)� (6)� (7)�
01.�Januari/�January�� 148,48� 0,57� 144,14� 0,74� 103,01� �0,16�
02.�Februari/�February�� 146,35� �1,43� 144,44� 0,21� 101,32� �1,64�
03.�Maret/�March�� 148,32� 1,35� 145,11� 0,46� 102,22� 0,89�
04.�April/�April�� 150,32� 1,35� 145,03� �0,06� 103,65� 1,40�
05.�Mei/�May�� 150,58� 0,17� 145,12� 0,06� 103,76� 0,11�
06.�Juni/�June�� 148,42� �1,43� 145,34� 0,15� 102,12� �1,58�
07.�Juli/�July�� 152,30� 2,61� 149,76� 3,04� 101,70� �0,41�
08.�Agustus/�August�� 155,04� 1,80� 152,46� 1,80� 101,69� �0,01�
09.�September/�September�� 154,86� �0,12� 152,58� 0,08� 101,50� �0,19�
10.�Oktober/�October�� 154,52� �0,22� 151,78� �0,52� 101,81� 0,31�
11.�November/�November�� 154,23� �0,19� 151,84� 0,04� 101,58� �0,23�
12.�Desember/�December�� 151,64� �1,68� 148,57� �2,15� 102,16� 0,57�
� � � � � � �
http
://sul
teng
.bps
.go.
id

Finance, Banking, and Prices
Sulawesi Tengah in Figures 2014 417
Tabel�
Table� 11.5.10�Indeks� Harga� yang� Diterima� dan� Dibayar� Petani� serta� Nilai� Tukar�Petani�Perkebunan�menurut�Bulan,�2013�Indices�of�Prices�Received�and�Paid�by�Farmers�and��Farmers'�Term�Trade�Planted�by�Month,�2013�
�
Bulan�Month�
Indeks�yang�
Diterima�Indices�of�Prices�
Received�(It)�
Peru��bahan�Change�
(%)�
Indeks�yang�
Dibayar�Indices�of�Prices�
Received�(Ib)�
Peru��bahan�Change�
(%)�
Nilai�Tukar�Petani�Farmers'�Term�Trade��(NTP)�
Peru��bahan�Change�
(%)�
(1)� (2)� (3)� (4)� (5)� (6)� (7)�
01.�Januari/�January�� 144,39� 1,02� 144,09� 0,59� 100,21� 0,43�
02.�Februari/�February�� 145,58� 0,82� 144,54� 0,31� 100,72� 0,51�
03.�Maret/�March�� 147,44� 1,28� 145,12� 0,40� 101,60� 0,87�
04.�April/�April�� 146,69� �0,51� 144,71� �0,28� 101,37� �0,23�
05.�Mei/�May�� 148,84� 1,47� 145,05� 0,23� 102,61� 1,22�
06.�Juni/�June�� 148,03� �0,54� 145,01� �0,03� 102,09� �0,51�
07.�Juli/�July�� 151,52� 2,36� 149,43� 3,05� 101,40� �0,68�
08.�Agustus/�August�� 153,80� 1,50� 152,21� 1,86� 101,04� �0,36�
09.�September/�September�� 152,26� �1,00� 152,57� 0,24� 99,80� �1,23�
10.�Oktober/�October�� 151,47� �0,52� 152,18� �0,26� 99,53� �0,27�
11.�November/�November�� 153,99� 1,66� 152,39� 0,14� 101,05� 1,53�
12.�Desember/�December�� 149,99� �2,60� 148,36� �2,64� 101,11� 0,06�
� � � � � � �
http
://sul
teng
.bps
.go.
id

Keuangan, Perbankan, dan Harga-Harga
418 Sulawesi Tengah Dalam Angka 2014
Tabel�
Table� 11.5.11�Indeks� Harga� yang� Diterima� dan� Dibayar� Petani� serta� Nilai� Tukar�Petani�Peternakan�menurut�Bulan,�2013�Indices� of�Prices� Received� and� Paid� by� Farmers� and� � Farmers'� Term�Trade�Livestock�by�Month,�2013�
�
Bulan�Month�
Indeks�yang�
Diterima�Indices�of�Prices�
Received�(It)�
Peru��bahan�Change�
(%)�
Indeks�yang�
Dibayar�Indices�of�Prices�
Received�(Ib)�
Peru��bahan�Change�
(%)�
Nilai�Tukar�Petani�Farmers'�Term�Trade��(NTP)�
Peru��bahan�Change�
(%)�
(1)� (2)� (3)� (4)� (5)� (6)� (7)�
01.�Januari/�January�� 132,23� �0,51� 138,04� 0,57� 95,79� �1,07�
02.�Februari/�February�� 132,06� �0,13� 138,44� 0,29� 95,39� �0,42�
03.�Maret/�March�� 132,11� 0,04� 139,10� 0,48� 94,97� �0,44�
04.�April/�April�� 133,03� 0,70� 138,80� �0,22� 95,84� 0,92�
05.�Mei/�May�� 133,28� 0,19� 138,96� 0,12� 95,91� 0,07�
06.�Juni/�June�� 134,03� 0,56� 138,83� �0,09� 96,55� 0,67�
07.�Juli/�July�� 137,28� 2,42� 142,45� 2,61� 96,38� �0,18�
08.�Agustus/�August�� 138,58� 0,95� 144,90� 1,72� 95,64� �0,77�
09.�September/�September�� 139,93� 0,97� 144,98� 0,06� 96,52� 0,92�
10.�Oktober/�October�� 141,40� 1,05� 144,60� �0,26� 97,79� 1,32�
11.�November/�November�� 140,82� �0,41� 144,81� 0,15� 97,24� �0,56�
12.�Desember/�December�� 136,29� �3,22� 141,59� �2,22� 96,25� �1,02�
� � � � � � �
http
://sul
teng
.bps
.go.
id

Finance, Banking, and Prices
Sulawesi Tengah in Figures 2014 419
Tabel�
Table� 11.5.12�Indeks�Harga�yang�Diterima�dan�Dibayar�Petani�serta�Nilai�Tukar�Petani�Perikanan�menurut�Bulan,�2013�Indices�of�Prices�Received�and�Paid�by�Farmers�and��Farmers'�Term�Trade�Fishery�by�Month,�2013�
�
Bulan�Month�
Indeks�yang�
Diterima�Indices�of�Prices�
Received�(It)�
Peru��bahan�Change�
(%)�
Indeks�yang�
Dibayar�Indices�of�Prices�
Received�(Ib)�
Peru��bahan�Change�
(%)�
Nilai�Tukar�Petani�Farmers'�Term�Trade��(NTP)�
Peru��bahan�Change�
(%)�
(1)� (2)� (3)� (4)� (5)� (6)� (7)�
01.�Januari/�January�� 148,78� 0,49� 135,31� 0,36� 109,96� 0,14�
02.�Februari/�February�� 150,20� 0,95� 135,59� 0,21� 110,78� 0,75�
03.�Maret/�March�� 151,05� 0,57� 135,96� 0,27� 111,10� 0,29�
04.�April/�April�� 150,92� �0,09� 135,78� �0,13� 111,15� 0,05�
05.�Mei/�May�� 151,93� 0,67� 135,99� 0,15� 111,72� 0,51�
06.�Juni/�June�� 153,22� 0,85� 136,12� 0,10� 112,57� 0,76�
07.�Juli/�July�� 157,15� 2,56� 140,56� 3,26� 111,80� �0,68�
08.�Agustus/�August�� 159,82� 1,70� 142,71� 1,53� 111,99� 0,17�
09.�September/�September�� 158,92� �0,56� 142,99� 0,20� 111,13� �0,77�
10.�Oktober/�October�� 158,28� �0,40� 142,73� �0,18� 110,90� �0,21�
11.�November/�November�� 158,77� 0,31� 142,98� 0,18� 111,04� 0,13�
12.�Desember/�December�� 154,72� �2,55� 139,20� �2,64� 111,15� 0,10�
� � � � � � �
http
://sul
teng
.bps
.go.
id

Keuangan, Perbankan, dan Harga-Harga
420 Sulawesi Tengah Dalam Angka 2014
Tabel�
Table� 11.5.13�Indeks�Harga�yang�Diterima�dan�Dibayar�Petani�serta�Nilai�Tukar�Petani�Gabungan�menurut�Bulan,�2013�Indices�of�Prices�Received�and�Paid�by�Farmers�and�Farmers'�Term�Trade�by�Month,�2013�
�
Bulan�Month�
Indeks�yang�
Diterima�Indices�of�Prices�
Received�(It)�
Peru��bahan�Change�
(%)�
Indeks�yang�
Dibayar��Indices�of�Prices�
Received�(Ib)�
Peru��bahan�Change�
(%)�
Nilai�Tukar�Petani�Farmers'�Term�Trade��(NTP)�
Peru��bahan�Change�
(%)�
(1)� (2)� (3)� (4)� (5)� (6)� (7)�
01.�Januari/�January�� 138,66� 0,62� 142,63� 0,56� 97,22� 0,06�
02.�Februari/�February�� 139,09� 0,31� 143,06� 0,30� 97,22� 0,00�
03.�Maret/�March�� 139,97� 0,63� 143,68� 0,43� 97,42� 0,21�
04.�April/�April�� 139,96� �0,01� 143,39� �0,20� 97,61� 0,20�
05.�Mei/�May�� 140,74� 0,56� 143,64� 0,17� 97,98� 0,38�
06.�Juni/�June�� 140,85� 0,08� 143,62� �0,01� 98,07� 0,09�
07.�Juli/�July�� 143,45� 1,85� 148,05� 3,08� 96,90� �1,19�
08.�Agustus/�August�� 145,32� 1,30� 150,70� 1,79� 96,43� �0,49�
09.�September/�September�� 144,68� �0,44� 150,92� 0,15� 95,87� �0,58�
10.�Oktober/�October�� 144,64� �0,03� 150,48� �0,29� 96,12� 0,26�
11.�November/�November�� 145,25� 0,42� 150,68� 0,13� 96,39� 0,28�
12.�Desember/�December�� 142,40� �1,97� 146,84� �2,55� 96,99� 0,62�
� � � � � � �
http
://sul
teng
.bps
.go.
id

Finance, Banking, and Prices
Sulawesi Tengah in Figures 2014 421
Tabel�
Table� 11.5.14�Rata�Rata�Indeks�Harga�Konsumen�(IHK)�Kota�Palu��menurut�Kelompok��Pengeluaran�Average�Consumer�Price�Indices�(CPI)�of�Palu�City�By�Consumption�Group��
(2008�=�100)��Diolah�dari�Hasil�Survei�Harga�Konsumen�/�Based�on�Consumer�Price�Survey�
��
Kelompok/Sub�Kelompok�Group/Sub�Group� 2009� 2010� 2011� 2012� 2013�
(1)� (2)� (3)� (4)� (5)� (6)�� � �
� Indeks�Umum/�General�Indices� 120,96� 128,70� 134,45� 142,34� 153,12�I� �Bahan�Makanan/�Foodstuff� 141,68� 156,67� 157,80� 171,22� 178,04�
�1�� Padi�padian�Ubi�Ubian�&�Hasilnya�/�
Cereals�Roots�&�Their�Products�123,24� 149,34� 160,88� 171,22� 171,72�
�
�2�� Daging�&�Hasil�Hasilnya/Meat�&�it's�
Products�137,09� 145,51� 151,04� 154,59� 169,52�
�� 3�� Ikan�Segar/�Fresh�Fish� 162,07� 164,23� 163,85� 152,20� 169,94�� 4�� Ikan�Diawetkan/�Preserved�Fish� 133,99� 120,96� 135,37� 141,41� 116,66�
�5�� Telur�Susu�&�Hasil�Hasilnya/Eggs�
Milk�and�Their�Products�125,75� 133,88� 137,16� 145,26� 152,06�
�� 6�� Sayur�Sayuran/�Vegetables� 172,68� 144,50� 166,36� 175,13� 175,31�� 7�� Kacang�Kacangan/�Beans�and�Nuts� 189,05� 191,33� 187,10� 191,18� 249,17�� 8�� Buah�Buahan/�Fruits� 125,86� 116,99� 152,75� 149,05� 161,07�� 9�� Bumbu�bumbuan/�Spices� 152,46� 245,76� 143,23� 206,80� 246,93�� 10�� Lemak�dan�Minyak/�Fats�and�Oils� 137,15� 154,21� 167,06� 172,36� 185,03�
�11�� Bahan�Makanan�Lainnya/Other�
Food�Items���106,05� 112,81� 116,54� 117,51� 123,35�
�II�� Makanan�Jadi�Minuman�Rokok�&�
Tembakau�/�Prepared�Food�Beverage�and�Tobacco�Products�
129,57� 139,05� 151,97� 169,54� 188,20��
�� 1�� Makanan�Jadi/�Prepared�Food� 124,07� 137,30� 151,48� 174,04� 193,94�
�
2�� Minuman�yang�Tidak�Beralkohol/Non�Alcoholic�Beverages�
138,93� 146,86� 151,72� 161,72� 173,38��
�
3�� Tembakau�dan�Minuman�Beralkohol/Tobacco�Products�and�Alcoholic�Beverages�
137,96� 137,97� 153,55� 162,82� 183,37��
� � � �
http
://sul
teng
.bps
.go.
id

Keuangan, Perbankan, dan Harga-Harga
422 Sulawesi Tengah Dalam Angka 2014
Lanjutan�Tabel/Continued�Table��11.5.14��
Kelompok/Sub�Kelompok�Group/Sub�Group� 2009� 2010� 2011� 2012� 2013�
(1)� (2)� (3)� (4)� (5)� (6)�� � � � � �
III��Perumahan�Air�Listrik�Gas�&�Bahan�Bakar�/�Housing�Fuel�Electricity�and�Water�
116,13� 123,28� 131,15� 137,98� 143,42��
1�� Biaya�Tempat�Tinggal�Cost�of�Housing�
124,74� 126,82� 138,70� 144,09� 148,55��
2�� Bahan�Bakar�Penerangan�dan�AirFuel�Electricity�and�Water�
100,46� 121,80� 123,06� 135,95� 145,54��
3�� Perlengkapan�RT�Household�Equipment�
109,27� 110,77� 111,29� 113,12� 116,06��
4�� Penyelenggaraan�RT�Household�Operation�
113,29� 119,55� 128,49� 133,52� 136,67��
� � � � � �IV��Sandang/�Clothing�� 116,64� 119,71� 126,77� 130,20� 132,13�
1�� Sandang�Laki�laki�Men’s�Clothing�
105,62� 104,98� 106,44� 108,99� 115,88��
2�� Sandang�Wanita�Women’s�Clothing��
115,91� 117,61� 119,25� 118,87� 120,44��
3�� Sandang�Anak�anak�Children’s�Clothing�
109,76� 111,79� 118,57� 123,95� 125,41��
4�� Barang�Pribadi�&�Sandang�lainnya/�Personnel�Effects�
150,20� 165,17� 195,61� 206,23� 199,56��
� � � � � �V�� Kesehatan/�Health�� 114,96� 116,06� 119,32� 128,08� 129,97�
1�� Jasa�Kesehatan/Health�Services� 111,76� 112,17� 112,36� 127,42� 127,42�2� Obat�obatan/�Medicines� 117,56� 119,42� 126,16� 128,58� 128,70�3� Jasa�Perawatan�Jasmani�
Personal�Care�Services�115,04� 116,32� 116,32� 145,49� 145,49�
�4�� Perawatan�Jasmani�dan�Kosmetik�
Personnel�Care�and�Cosmetics�115,79� 116,93� 120,95� 126,11� 130,18�
�
� � � � � �
�� �
http
://sul
teng
.bps
.go.
id

Finance, Banking, and Prices
Sulawesi Tengah in Figures 2014 423
Lanjutan�Tabel/Continued�Table��11.5.14���
Kelompok/Sub�Kelompok�Group/�Sub�Group� 2009� 2010� 2011� 2012� 2013�
(1)� (2)� (3)� (4)� (5)� (6)�� � � � �
VI�� Pendidikan�Rekreasi�&�Olahraga�Education�Recreation�and�Sports�
119,68� 129,51� 133,86� 138,09� 146,51��
1�� Jasa�Pendidikan/�Education� 129,29� 144,84� 153,26� 159,78� 172,88��
2� Kursus�Kursus/Pelatihan�Courses�and�training�
118,14� 119,95� 125,78� 144,29� 144,29�
3�� Perlengkapan/Peralatan�PendidikanEducational�Equipment�
105,56� 116,69� 116,01� 116,87� 122,09��
4�� Rekreasi/�Recreation���� 109,96� 107,96� 107,02� 107,47� 109,45��
5� Olahraga/�Sports���� 104,90� 108,86� 109,67� 108,93� 111,04��
� � � � �VII�� Transpor�Komunikasi�&�Js�Keu�
TransportationCommunication�&�Services�Financial�
100,10� 101,74� 104,42� 107,51� 120,56��
1�� Transpor/�Transportation�� 104,57� 106,12� 110,92� 116,19� 137,04��
2�� Komunikasi�dan�PengirimanCommunication�and�Delivery�Services�
81,78� 78,54� 75,37� 72,58� 68,60��
3�� Sarana�dan�Penunjang�Transpor�Transport�Equipment�and�Support�
114,03� 131,10� 134,01� 136,67� 138,11�
4� Jasa�Keuangan/�Financial�Services�� 112,39� 112,40� 112,40� 114,14� 115,17��
�� � � � �
http
://sul
teng
.bps
.go.
id

Keuangan, Perbankan, dan Harga-Harga
424 Sulawesi Tengah Dalam Angka 2014
Tabel�Table� 11.5.15�
Inflasi�Kota�Palu�menurut�Tahun�Kelender�2013�Inflation�of�Palu�City�by�Calendar�Year��2013�
�(2008�=�100)��
Diolah�dari�hasil�Survei�Harga�Konsumen�/�Based�on�Consumer�PriceSurvey�
Kelompok�Group�
JanuariJanuary
FebruariFebru�ary�
Maret�March�
April�April�
Mei�May�
Juni�June�
(1)� (2)� (3)� (4)� (5)� (6)� (7)�
� � � � � ��
�
U�m�u�m/�General� 0,18� 0,58� �0,10� �0,95� �0,19� 0,88�
01�� Bahan�Makanan/�Food�Stuff� 2,05� 0,66� �1,11� �3,72� �3,84� 1,24�
02�� Makanan�Jadi�Minuman�Rokok�dan�Tembakau�Prepared�Food�Beverages�and�Tobacco�Products�
0,09� 0,06� 0,02� �0,01� 0,49� 0,01�
03�� Perumahan/�Housing���� 0,11� 2,14� 0,06� �0,02� 0,41� �0,01�
04�� Sandang/�Clothing� �0,45� �0,51� �0,43� �0,04� 0,57� 0,36�
05�� Kesehatan/�Health� 0,00� 0,00� 0,47� 0,00� 0,00� �0,37�
06�� Pendidikan�Rekreasi�&�Olahraga��Education�Recreation�and�Sports�
0,00� 0,07� 0,00� �0,08� 0,00� 0,54�
07�� Transpor�dan�Komunikasi/�Transportation�and�Communication�
�2,26� �0,30� 1,12� 0,16� 0,00� 3,40�
� � � � � � � �
http
://sul
teng
.bps
.go.
id

Finance, Banking, and Prices
Sulawesi Tengah in Figures 2014 425
Lanjutan�Tabel/Continued�Table��11.5.15�
�
Kelompok�Group�
Juli�July�
AgustusAugust�
Septem�ber�
Septem�ber�
OktoberOctober
Novem�ber�
Novem��ber�
Desem�ber�
Decem��ber�
(1)� (8)� (9)� (10)� (11)� (12)� (13)�� � � � � � �
�
U�m�u�m/�General� 4,59� 2,10� �0,75� �0,69� 0,67� 1,14�
01�� Bahan�Makanan/�Food�Stuff� 9,70� 6,39� �4,64� �4,27� 0,48� 3,23�
02�� Makanan�Jadi�Minuman�Rokok��dan�Tembakau�Prepared�Food�Beverage�and�Tobacco�Products�
3,01� 1,63� 1,75� 1,77� 1,62� 0,11�
03�� Perumahan/�Housing���� 1,31� �0,83� 0,16� 0,01� 0,46� 0,11�
04�� Sandang/�Clothing� 0,33� 0,00� 1,62� 0,11� 0,20� �0,28�
05�� Kesehatan/�Medical�Care� 0,40� 0,00� 0,84� 0,00� �0,13� 0,27�
06�� Pendidikan�Rekreasi�&�Olahraga�Education�Recreation�and�Sports�
5,07� �0,08� 0,32� 0,43� �0,08� �0,15�
07�� Transpor�dan�Komunikasi�Transportation�and�Communication�
5,78� 1,67� �0,25� 0,03� 0,57� 1,81�
� � � � � � � �
��
http
://sul
teng
.bps
.go.
id

Keuangan, Perbankan, dan Harga-Harga
426 BPS Provinsi Sulawesi Tengah
Tabel�Table� 11.5.16�
Laju�Inflasi�Kota�Palu�menurut�Tahun�Kelender�2009�2013�Inflation�Rate�of�Palu�City�by�Calendar�Year�2009�–�2013�
�(2008�=�100)��
Diolah�dari�hasil�Survei�Harga�Konsumen�/�Based�on�Consumer�PriceSurvey�
Kelompok�Group� 2009� 2010� 2011� 2012� 2013�
(1)� (2)� (3)� (4)� (5)� (6)�
� � � � � �
�
U�m�u�m/�General� 5,73� 6,40� 4,47� 5,87� 7,57�
01�� Bahan�Makanan/�FoodStuff� 9,42� 10,59� 0,72� 4,87� 7,58�
02�� Makanan�Jadi�Minuman�Rokok��dan�Tembakau/�Prepared�Food��Beverage�and�Tobacco�
13,65� 7,32� 9,29� 11,56� 11,01�
03�� Perumahan/�Housing���� 3,29� 6,16� 6,38� 5,21� 3,94�
04�� Sandang/�Clothing� 7,32� 2,63� � 5,90� 2,71� 1,48�
05�� Kesehatan/�Medical�Care� 2,25� 0,95� 2,81� 7,35� 1,48�
06�� Pendidikan�Rekreasi�&�Olahraga�Education�Recreation�and�Sports�
2,69� 8,22� 3,35� 3,16� 6,10�
07�� Transpor�dan�Komunikasi�Transportation�and�Communication�
�2,64� 1,65� 2,62� 2,96� 12,14�
� � � � � � �
http
://sul
teng
.bps
.go.
id

Consumption and Expenditure
Sulawesi Tengah In Figures 2014 427
KONSUMSIDAN PENGELUARAN
Consumption and Expenditureht
tp://s
ulte
ng.b
ps.g
o.id

Konsumsi dan Pengeluaran
428 Sulawesi Tengah Dalam Angka 2014
http
://sul
teng
.bps
.go.
id

Consumption and Expenditure
Sulawesi Tengah In Figures 2014 429
12.� KONSUMSI� DAN� PENGELUARAN�RUMAH�TANGGA�
�Tingkat� ketersediaan� pangan� suatu�
daerah�dapat�ditinjau�dari�kecukupan�gizi,�angka� kecukupan� gizi� yang� dianjurkan�pada� Widyakarya� Pangan� dan� Gizi� V�(1993)� sekitar� 2.150� kalori/kapita/hari,�untuk� protein� sekitar� 46,20�gram/kapita/hari,� dan� � untuk� lemak�minimum� setara� 10� persen� dan�maksimum�25�persen�dari�energi.��
�Pada�tahun�2013�jumlah�kalori�yang�
dikonsumsi� oleh� tiap� penduduk� Sulawesi�Tengah� tercatat� rata�rata� 1.856,01�kalori/kapita/hari,� dan� untuk� protein�sebanyak� 51,14� gram/kapita/hari.�Sehingga� jika� dibandingkan� dengan�standar� kecukupan� pangan� seperti�tersebut� di� atas� maka� angka� kecukupan�pangan� di� Sulawesi� Tengah� pada� tahun�2013� tersebut� � kurang� mencukupi� dari�yang�disyaratkan.�
�Pengeluaran� per� kapita� digolongkan�
menjadi� pengeluaran� makanan� dan�pengeluaran�bukan�makanan.�Pada� tahun�2013� pengeluaran� per� kapita� untuk�konsumsi� makanan� rata�rata� sebesar� Rp�329.598.� Sedangkan� pengeluaran�kelompok� non� makanan� mencapai� Rp�331.608.�
12.� CONSUMPTION� AND� EXPENDITURE�HOUSEHOLD�
�A�regional� food�availability� level�can�
be� reflected� by� nutrient� sufficiency.� The�nutrient� sufficiency� that� recommended�by�Fifth� Food� and�Nutrient�Workshop� (1993)�is� around� 2,150� calories/capita/day,�protein� is� around�46,20� gram/capita/day,��fat� is� around� minimum� 10� percent� and�maximum�25�percent�of�energy.��
�In�2013,�total�calories�that�consumed�
every� people� of� Sulawesi� Tengah� is�recorded� about� 1,856.01� calories�/capita/day,� and� is� about� 51.14� gram/�capita/day� for� protein.� If� it� compared� to�the� food� sufficiency� standard,� that� these�number� are� not� sufficient� of� the�recommendation.��
����Per� capita� expenditure� is� classified�
into� food� and� non� food� consumption.� In�2013,� the� average� consumption� of� food�per� capita� is� 329,598� rupiahs,� whereas�non� food� group� consumption� per� capita�reached�331,608�rupiahs.��
�
http
://sul
teng
.bps
.go.
id

Konsumsi dan Pengeluaran
430 Sulawesi Tengah Dalam Angka 2014
http
://sul
teng
.bps
.go.
id

Su
G
F
lawesi Tengah In
Gambar�
Figure� 12.1�
0%
10%
20%
30%
40%
50%
60%
70%
80%
90%
100%
Peng
elua
ran�
/�Exp
endi
ture
�(%)
Makanan�/
n Figures 2014
PersentaseSulawesi�TePercaentagTengah�Pro
%
%
%
%
%
2009
52,77
47,23
/�Food Bukan
�Pengeluaran�Pengah,�2009���2ge� Expenditureovince,�2009���20
2010
7 52,08
47,92
n�Makanan�/�Non
Per�Kapita�men2013�Per� Capita� by013�
20112
53,29
46,71
n�Food
Consump
nurut�Kelompo
y� Commodity� G
012201
53,694
46,315
ption and Expen
ok�Barang�Prov
Group� in� Sulaw
13
9,85
50,15
nditure
431
vinsi�
wesi�
http
://sul
teng
.bps
.go.
id

Konsumsi dan Pengeluaran
432 Sulawesi Tengah Dalam Angka 2014
http
://sul
teng
.bps
.go.
id

Su
Ga
Fi
lawesi Tengah In
mbar�
gure� 12.2�
Rp�500.000�� 749.20,79%
Rp�750.000�� 999.99,9%
n Figures 2014
Persentase�P(Makanan�daPopulation� Pand�Non�Foo�
999;�
999;�
Rp�1.000.000�13,89%
Penduduk�Sulawan�Bukan�MakaPercentage� of� Sd)�Per�Capita/M
<�Rp�100.000,03%+;�
wesi�Tengah�manan)�Per�KapitSulawesi� TengaMonth,�2013�
00;�
Consump
menurut�Kelomta�Sebulan,�201ah� By� Expendit
Rp�100.
Rp�150.0001,9
Rp�300.000��38,38
ption and Expen
pok�Pengeluar13�ture� Group� (Fo
000�� 149.999;�0,29%
0�� 199.999;�1%
Rp�200.000�� 2914,82%
499.999;�8%
nditure
433
ran�
ood�
99.999;�
http
://sul
teng
.bps
.go.
id

Konsumsi dan Pengeluaran
434 Sulawesi Tengah Dalam Angka 2014
http
://sul
teng
.bps
.go.
id

Consumption and Expenditure
Sulawesi Tengah In Figures 2014 435
12.�KONSUMSI�DAN�PENGELUARAN��/�CONSUMPTION�AND�EXPENDITURE��12.1. Pola�Konsumsi�Rumah�Tangga�/�Consumption�of�Households��Tabel�
Table� 12.1.1�Rata�rata� Konsumsi� Kalori� per� Kapita� Sehari� menurut� Kelompok�Makanan,�2009���2013�(kalori)�Average� Daily� Consumption� of� Calorie� per� Capita� by� Food� Group,���2009���2013�(calorie)�
�(Diolah�dari�hasil�Survei�Sosial�Ekonomi�Nasional�)�(Based�on�National�Socio�Economic�Survey)� Perkotaan�/�Urban�
Kelompok�Makanan�Food�Group� 2009� 2010� 2011� 2012� 2013�
(1)� (2)� (3)� (4)� (5)� (6)�� �
1.� Padi�padian/�Cereals�������������� 896,41� 871,14� 940,07� 958,42� 872,25�2.� Umbi�umbian/�Tubers� 35,73� 25,82� 28,83� 29,39� 31,70�3.� Ikan/�Fish� 75,29� 74,04� 72,09� 73,50� 75,83�4.� Daging/�Meat� 26,89� 30,97� 28,51� 29,07� 30,71�5.� Telur�dan�susu/�Eggs�and�milk 63,15� 70,96� 74,69� 88,05� 64,71�6.� Sayur�sayuran/�Vegetables� 31,28� 26,42� 31,52� 49,50� 29,92�7.� Kacang�kacangan/�Legumes� 43,02� 44,77� 49,76� 80,12� 39,14�8.� Buah�buahan/�Fruits� 53,10� 69,15� 53,29� 54,33� 48,91�9.� Minyak�dan�lemak�/�Oil�and�
fats� 229,31� 207,85� 236,41� 241,02� 228,91�
10.� Bahan�minuman�/�Beverages�stuffs� 109,65� 105,35� 107,89� 118,13� 93,33�
11.� Bumbu�bumbuan�/�Spices� 15,26� 10,84� 13,17� 27,34� 12,99�12.� Konsumsi�lainnya/�
Miscellaneous�food�items� 63,94� 54,94� 52,69� 63,44� 51,57�
13.� Makanan�dan�minuman�jadi�prepared�food�and�beverages� 282,67� 235,72� 322,26� 328,55� 264,85�
Jumlah�/�Total� 1�925,69� 1�827,97� 2�011,18� 2�140,87� 1�844,84�
http
://sul
teng
.bps
.go.
id

Konsumsi dan Pengeluaran
436 Sulawesi Tengah Dalam Angka 2014
Tabel�
Table� 12.1.2.�Rata�rata� Konsumsi� Kalori� per� Kapita� Sehari� (dalam� kalori)� menurut�Kelompok�Makanan,�2009��2013�Average� Daily� per� Capita� Consumption� of� Calorie� by� Commodity� Group,�2009��2013�(calorie)�
��(Diolah�dari�hasil�Survei�Sosial�Ekonomi�Nasional�)�(Based�on�National�Socio�Economic�Survey)�� Perdesaan�/�Rural�
Kelompok�Makanan�Food�Group� 2009� 2010� 2011� 2012� 2013�
(1)� (2)� (3)� (4)� (5)� (6)�� � �
1.� Padi�padian/�Cereals�������������� 997,96� 985,96 1,028,48� 1046,65� 1�020,47�2.� Umbi�umbian/�Tubers� 136,09� 136,09 111,81� 145,05� 95,71�3.� Ikan/�Fish� 65,70� 65,70 63,39� 64,96� 66,12�4.� Daging/�Meat� 14,46� 14,46 19,16� 20,23� 12,42�5.� Telur�dan�susu/�Eggs�and�milk� 28,46� 28,46 31,55� 31,46� 27,66�6.� Sayur�sayuran/�Vegetables� 40,22� 40,22 35,33� 40,66� 33,58�7.� Kacang�kacangan/�Legumes� 26,45� 26,45 28,11� 29,90� 24,83�8.� Buah�buahan�/�Fruits� 72,33� 72,33 61,48� 68,71� 52,54�
9.� Minyak�dan�lemak�/�Oil�and�fats�
259,94� 259,94 273,44� 283,34� 234,59�
10.�Bahan�minuman��Beverages�stuffs�
118,95� 118,95 126,44� 127,56� 105,90�
11.�Bumbu�bumbuan�/�Spices� 11,41� 11,41 12,11� 12,22� 9,89�12.�Konsumsi�lainnya/�
Miscellaneous�food�items�40,71� 40,71 43,97� 46,78� 36,67�
13.�Makanan�dan�minuman�jadi�prepared�food�and�beverages�
144,60� 144,60 180,21� 186,38� 139,28�
� � � � � � �
Jumlah�/�Total� 1�950,63� 1�957,26 2�015,49� 2�103,90� 1�859,64�
http
://sul
teng
.bps
.go.
id

Consumption and Expenditure
Sulawesi Tengah In Figures 2014 437
Tabel�
Table� 12.1.3�Rata�rata� Konsumsi� Kalori� per� Kapita� Sehari� (dalam� kalori)� menurut�Kelompok�Makanan,�2009��2013�Average� Daily� per� Capita� Consumption� of� Calorie� by� Commodity� Group,�2009��2013�(calorie)�
��(Diolah�dari�hasil�Survei�Sosial�Ekonomi�Nasional�)�(Based�on�National�Socio�Economic�Survey)� Perkotaan�+�Perdesaan��/��Urban�+�Rural�
Kelompok�Makanan�Food�Group� 2009� 2010� 2011� 2012� 2013�
(1)� (2)� (3)� (4)� (5)� (6)�� � � � � �
1.� Padi�padian�/�Cereals�������������� 976,63� 961,31� 1�006,86� 1033,13� 984,07�
2.� Umbi�umbian�/�Tubers� 115,01� 66,40� 91,52� 145,05� 79,99�
3.� Ikan/�Fish� 67,71� 64,69� 65,52� 64,96� 68,50�
4.� Daging/�Meat� 17,07� 23,43� 21,44� 15,53� 16,91�
5.� Telur�dan�susu/�Eggs�and�milk 35,74� 42,80� 42,10� 32,07� 36,76�
6.� Sayur�sayuran/�Vegetables� 38,34� 33,41� 34,40� 40,66� 32,68�
7.� Kacang�kacangan/�Legumes� 29,93� 33,11� 33,41� 29,90� 28,34�
8.� Buah�buahan/�Fruits� 68,29� 79,48� 59,47� 68,71� 51,65�
9.� Minyak�dan�lemak�Oil�and�fats�
253,51� 257,53� 264,39� 279,84� 233,20�
10.�Bahan�minuman�/�Beverages�stuffs�
116,99� 116,42� 121,90� 127,56� 102,81�
11.�Bumbu�bumbuan�/�Spices� 12,22� 11,80� 12,37� 12,52� 10,65�
12.�Konsumsi�lainnya/�Miscellaneous�food�items�
45,59� 43,40� 46,10� 43,52� 40,33�
13.�Makanan�dan�minuman�jadi�prepared�food�and�beverages�
173,60� 162,46� 214,95� 180,77� 170,11�
� � � � � � �
Jumlah�/�Total� 1�950,63� 1�896,25� 2�014,43� 2�074,22� 1�856,01�
http
://sul
teng
.bps
.go.
id

Konsumsi dan Pengeluaran
438 Sulawesi Tengah Dalam Angka 2014
Tabel�
Table� 12.1.4�Rata�rata� Konsumsi� Protein� per� Kapita� Sehari� (dalam� gram)� menurut�Kelompok�Makanan,�2009��2013�Average� Daily� per� Capita� Consumption� of� Protein� by� Commodity� Group,�2009��2013��(gram)�
��(Diolah�dari�hasil�Survei�Sosial�Ekonomi�Nasional�)�(Based�on�National�Socio�Economic�Survey)� Perkotaan�/�Urban�
Kelompok�Makanan�Food�Group� 2009� 2010� 2011� 2012� 2013�
(1)� (2)� (3)� (4)� (5)� (6)�� � � �
1.� Padi�padian�/�Cereals�������������� 21,03� 20,45� ������22,02�� 21,81� 20,47�2.� Umbi�umbian�/�Tubers� 0,25� 0,19� ��������0,21�� 0,44� 0,22�3.� Ikan�/�Fish� 12,36� 12,19� ������12,23�� 12,50� 12,80�4.� Daging�/�Meat� 1,74� 1,91� ���������1,77�� 6,60� 1,89�5.� Telur�dan�susu�/�Eggs�and�
milk�3,45� 3,63� ��������4,03�� 2,94� 3,60�
6.� Sayur�sayuran�/�Vegetables� 2,02� 1,60� ���������1,97�� 0,61� 1,88�7.� Kacang�kacangan�/�Legumes� 3,81� 3,75� ���������4,86�� 4,19� 3,96�8.� Buah�buahan�/�Fruits� 0,74� 1,00� ���������0,67�� 0,30� 0,67�9.� Minyak�dan�lemak��
Oil�and�fats�0,45� 0,45� ���������0,43�� 0,25� 0,39�
10.�Bahan�minuman�Beverages�stuffs�
0,75� 1,09� ���������0,86� 0,93� 0,73�
11.�Bumbu�bumbuan�/�Spices� 0,50� 0,38� ���������0,46�� 0,55� 0,45�
12.�Konsumsi�lainnya�Miscellaneous�food�items�
1,37� 1,11� ���������1,08� 1,37� 1,08�
13.�Makanan�dan�minuman�jadi�Prepared�food�and�beverages�
9,82� 8,23� ������11,53�� 10,00� 8,95�
� � � � �� ����
Jumlah�/�Total� 58,28� 55,97� ���62,13� 62,48� 57,09�
http
://sul
teng
.bps
.go.
id

Consumption and Expenditure
Sulawesi Tengah In Figures 2014 439
Tabel�
Table� 12.1.5�Rata�rata� Konsumsi� Protein� per� Kapita� Sehari� (dalam� gram)� menurut�Kelompok�Makanan,�2009��2013�Average� Daily� per� Capita� Consumption� of� Protein� by� Commodity� Group,��2009��2013�(�gram)�
��(Diolah�dari�hasil�Survei�Sosial�Ekonomi�Nasional�)�(Based�on�National�Socio�Economic�Survey)� Perdesaan�/�Rural�
Kelompok�Makanan�Food�Group� 2009� 2010� 2011� 2012� 2013�
(1)� (2)� (3)� (4)� (5)� (6)�� �
1.� Padi�padian�/�Cereals�������������� 23,43� 23,12� 24,15� 24,10� 23,93�
2.� Umbi�umbian�/�Tubers� 0,89� 0,52� 0,78� 0,80� 0,62�
3.� Ikan�/�Fish� 10,87� 10,33� 10,66� 8,16� 10,79�
4.� Daging�/�Meat� 0,78� 1,10� 0,98� 6,02� 0,65�
5.� Telur�dan�susu�/�Eggs�and�milk� 1,53� 2,06� 1,83� 1,75� 1,60�
6.� Sayur�sayuran�/�Vegetables� 2,82� 2,37� 2,39� 0,36� 2,29�
7.� Kacang�kacangan�/�Legumes� 1,96� 2,36� 2,26� 2,31� 2,21�
8.� Buah�buahan�/�Fruits� 0,88� 1,11� 0,74� 1,35� 0,66�9.� Minyak�dan�lemak�/�Oil�and�fats 0,97� 0,94� 0,85� 0,41� 0,68�10.� Bahan�minuman�
Beverages�stuffs�0,82� 0,95� 1,04� 1,43� 0,74�
11.� Bumbu�bumbuan�/��Spices�
0,34� 0,37� 0,39� 0,79� 0,33�
12.� Konsumsi�lainnya/�Miscellaneous�food�items�
0,88� 0,85� 0,93� 1,03� 0,78�
13.� Makanan�dan�minuman�jadi�prepared�food�and�beverages�
3,80� 3,75� 4,80� 4,18� 3,93�
Jumlah�/�Total� 49,97� 49,83� 51,81� 52,69� 49,20�
http
://sul
teng
.bps
.go.
id

Konsumsi dan Pengeluaran
440 Sulawesi Tengah Dalam Angka 2014
Tabel�
Table� 12.1.6�Rata�rata� Konsumsi� Protein� per� Kapita� Sehari� (dalam� gram)� menurut�Kelompok�Makanan,�2009��2013�Average� Daily� per� Capita� Consumption� of� Protein� by� Commodity� Group,�2009��2013�(�gram)�
��(Diolah�dari�hasil�Survei�Sosial�Ekonomi�Nasional�)�(Based�on�National�Socio�Economic�Survey)� Perkotaan�+�Perdesaan�/��Urban�+�Rural�
Kelompok�Makanan�Food�Group� 2009� 2010� 2011� 2012� 2013�
(1)� (2)� (3)� (4)� (5)� (6)�� � �
1.� Padi�padian�/�Cereals�������������� 22,92� 22,56� 23,63� 22,38� 23,08�2.� Umbi�umbian�/�Tubers� 0,76� 0,45� 0,64� 0,74� 0,52�3.� Ikan�/�Fish� 11,19� 10,72� 11,05� 11,72� 11,29�4.� Daging�/�Meat� 0,98� 1,27� 1,17� 6,44� 0,96�5.� Telur�dan�susu�/�Eggs�and�milk 1,93� 2,39� 2,37� 2,47� 2,09�6.� Sayur�sayuran�/�Vegetables� 2,65� 2,21� 2,29� 0,31� 2,19�7.� Kacang�kacangan�/�Legumes� 2,35� 2,65� 2,89� 3,41� 2,64�8.� Buah�buahan�/�Fruits� 0,85� 1,09� 0,73� 0,84� 0,66�9.� Minyak�dan�lemak�/�Oil�and�
fats�0,86� 0,84� 0,75� 0,38� 0,61�
10.� Bahan�minuman�Beverages�stuffs�
0,81� 0,98� 1,00� 1,02� 0,74�
11.� Bumbu�bumbuan�/�Spices� 0,38� 0,37� 0,41� 0,74� 0,36�
12.� Konsumsi�lainnya�Miscellaneous�food�items�
0,98� 0,91� 0,96� 1,99� 0,85�
13.� Makanan�dan�minuman�jadi�prepared�food�and�beverages�
5,07� 4,69� 6,45� 7,34� 5,16�
Jumlah�/�Total� 51,71� 51,12� ����54,33� 59,79� 51,14�
�� �
http
://sul
teng
.bps
.go.
id

Consumption and Expenditure
Sulawesi Tengah In Figures 2014 441
12.2. Pola�Pengeluaran�Rumah�Tangga�/Expenditure�of�Households��Tabel�
Table� 12.2.1�Pengeluaran� Rata�rata� per� Kapita� Sebulan� untuk� Kelompok� Barang�Makanan�menurut�Status�Daerah�Kota,��2009��2013�Average� Monthly� per� Capita� Expenditure� by� Commodity� Group� of� Food�Consumption�in�Urban�Areas,�2009��2013�
�(Diolah�dari�hasil�Survei�Sosial�Ekonomi�Nasional�)�(Based�on�National�Socio�Economic�Survey)�
Kelompok�Barang�Commodity�Group� 2009� 2010� 2011� 2012� 2013�
(1)� (2)� (3)� (4)� (5)� (6)�� � � � � � �
1.� Padi�padian�/�Cereals� 37�233� 40�038� 47�155� 64�562� 56�991�2.�� Umbi�umbian�/�Tubers� 1�181� 2�313� 2�682� 2�949� 2�645�3.�� Ikan�/�Fish� 31�928� 35�434� 42�627� 46�845� 49�715�4.�� Daging�/�Meat� 6�127� 8�318� 7�606� 12�362� 11�040�5.� Telur�dan�Susu�/�Eggs�and�Milk� 18�117� 23�859� 22�247� 31�208� 26�922�6.� Sayur�sayuran�/�Vegetables� 16�495� 16�714� 25�086� 22�370� 30�204�7.� Kacang�kacangan�/�Nuts� 5�164� 6�311� 7�197� 5�605� 7�579�8.� Buah�buahan�/�Fruits� 12�782� 21�387� 15�658� 20�533� 20�083�9.� Minyak�dan�Lemak�/�Oil�and�Fat� 8�809� 8�009� 11�618� 13�551� 12�497�10.� Bahan�Minuman�
Beverage�Stuffs�8�563� 11�553� 11�759� 11�360� 13�979�
11.� Bumbu�bumbuan�/�Spices� 5�707� 5�037� 7�048� 6�098� 7�781�12.� Konsumsi�Lainnya�
�Miscellaneous�food�items�6�588� 5�998� 6�301� 8�129� 8�509�
13.� Makanan�dan�Minuman�Jadi*)�Prepared�food�and�beverages*)�
60�027� 73�019� 101�583� 125�240� 117�730�
14.� Tembakau�dan�Sirih��Tobacco�and�Betel�
24�058� 23�262� 36�289� 54�418� 49�692�
� � � � � �
�
Jumlah�/�Total� 243�461� 281�251� 344�858� 425�230� 415�369�
Catatan/Note� :� *)�Sudah�termasuk�minuman�yang�mengandung�alkohol�/�including�alcoholic�beverage�
http
://sul
teng
.bps
.go.
id

Konsumsi dan Pengeluaran
442 Sulawesi Tengah Dalam Angka 2014
Tabel�
Table� 12.2.2�Pengeluaran�Rata�rata�per�Kapita�Sebulan�untuk�Kelompok�Barang�Bukan�Makanan�menurut�Status�Daerah�Kota,�2009��2013�Average�Monthly�per�Capita�Expenditure�by�Commodity�Group�Non�Food�Commodity�Group�in�Urban�Areas,�2009��2013�
��(Diolah�dari�hasil�Survei�Sosial�Ekonomi�Nasional�)�(Based�on�National�Socio�Economic�Survey)�
Kelompok�Barang�Commodity�Group�
�2009� 2010� 2011� 2012� 2013�
(1)� (2)� (3)� (4)� (5)� (6)�� � � � � � �1.�� Perumahan,�Bahan�
Bakar,�Penerangan�&�Air�Housing,�Fuel,�Light,�and�Water�
102�247� 142�873� 143�287� 217�367� 233�247�
2.� Aneka�Barang�dan�Jasa�Goods�and�Services�
103�684� 129�593� 143�421� 153�800� 202�706�
3.� Pakaian,�Alas�Kaki�&�Tutup�Kepala�Clothing,�Footwear,�and�Headwear�
16�597� 23�790� 14�475� 18�025� 37�775�
4.� Barang�yang�Tahan�Lama�Durables�Goods�
68�492� 67�097� 61�501� 40�215� 98�004�
5.� Pajak�Pemakaian�&�Premi�Asuransi��Taxes�and�Insurance�
6�541� 9�811� 13�368� 12�998� 17�031�
6.�� Keperluan�Pesta�dan�Upacara�Parties�and�Ceremonies�
9�562� 16�888� 23�046� 6�523� 17�763�
� � �������
� Jumlah�/�Total� 307�123� 390�051� ����399�098�� 448�928� 606�526�
http
://sul
teng
.bps
.go.
id

Consumption and Expenditure
Sulawesi Tengah In Figures 2014 443
Tabel�
Table� 12.2.3�Pengeluaran� Rata�rata� per� Kapita� Sebulan� � untuk� Kelompok� Barang�Makanan�menurut�Status�Daerah�Perdesaan,�2009��2013�Average� Monthly� per� Capita� Expenditure� by� Commodity� Group� of� Food�Consumption�in�Rural�Areas,�2009��2013�
��(Diolah�dari�hasil�Survei�Sosial�Ekonomi�Nasional�)�(Based�on�National�Socio�Economic�Survey)�
Kelompok�Barang�Commodity�Group� 2009� 2010� 2011� 2012� 2013�
(1)� (2)� (3)� (4)� (5)� (6)�� � � � � � �1.� Padi�padian/�Cereals� 45�482� 48�359� 51�624� 66�620� 66�863�2.�� Umbi�umbian/�Tubers� 4�924� 3�854� 5�215� 5�417� 6�037�3.�� Ikan/�Fish� 23�006� 27�116� 35�192� 33�135� 37�102�4.�� Daging/�Meat� 3�124� 5�471� 5�618� 3�973� 4�629�5.� Telur�dan�Susu/�Eggs�and�Milk� 7�343� 8�692� 12�552� 10�046� 10�472�6.� Sayur�sayuran/�Vegetables� 15�029� 16�117� 24�520� 20�657� 26�665�7.� Kacang�kacangan/�Nuts� 2�493� 3�702� 4�531� 3�465� 4�768�8.� Buah�buahan/�Fruits� 11�814� 19�176� 12�556� 13�425� 13�216�9.� Minyak�dan�Lemak/�Oil�and�Fat� 7�753� 8�313� 11�930� 11�504� 11�211�10.� Bahan�Minuman/�Beverage�
Stuffs�9�202� 12�611� 13�514� 14�326� 15�125�
11.� Bumbu�bumbuan/�Spices� 4�198� 5�195� 6�718� 6�311� 6�665�12.� Konsumsi�Lainnya�
�Miscellaneous�food�items�4�314� 4�748� 5�848� 5�503� 6�298�
13.� Makanan�dan�Minuman�Jadi*)�Prepared�food�and�beverages*)�
26�051� 33�477� 64�525� 44�329� 48�666�
14.� Tembakau�dan�Sirih/��Tobacco�and�Betel�
20�138� 25�817� 32�918� 39�109� 43�964�
� � � � ��
�
Jumlah�/�Total� 184�873� 222�649� 287�260� 277�820� 301�681�
Catatan/Note� :� *)�Sudah�termasuk�minuman�yang�mengandung�alkohol�/�including�alcoholic�beverages�
http
://sul
teng
.bps
.go.
id

Konsumsi dan Pengeluaran
444 Sulawesi Tengah Dalam Angka 2014
Tabel�
Table� 12.2.4�Pengeluaran�Rata�Rata�Perkapita�Sebulan�untuk�Kelompok�Barang�Bukan�Makanan�menurut�Status�Daerah�Perdesaan,�2009��2013�Average�Monthly�per�Capita�Expenditure�by�Commodity�Group�of�Non�Food�Consumption�in�Rural�Areas,�2009–2013�
��(Diolah�dari�hasil�Survei�Sosial�Ekonomi�Nasional�)�(Based�on�National�Socio�Economic�Survey)�
Kelompok�Barang�Commodity�Group�
�2009� 2010� 2011� 2012� 2013�
(1)� (2)� (3)� (4)� (5)� (6)�� � � � � � �1.�� Perumahan,�Bahan�
Bakar,�Penerangan�&�Air�Housing,�Fuel,�Light,�and�Water�
53�034� 66�078� 79�769� 87�679� 101�823�
2.� Aneka�Barang�dan�Jasa�Goods�and�Services�
41�627� 50�138� 60�775� 78�936� 79�651�
3.� Pakaian,�Alas�Kaki�&�Tutup�Kepala�Clothing,�Footwear,�and�Headwear�
12�342� 15�625� 17�154� 11�728� 18�560�
4.� Barang�yang�Tahan�Lama�Durables�Goods�
28�231� 25�274�� 25�101� 25�471� 27�338�
5.� Pajak�Pemakaian�&�Premi�Asuransi�Taxes�and�Insurance�
2�951� 3�793� 3�855� 4�267� 4�960�
6.�� Keperluan�Pesta�dan�Upacara�Parties�and�Ceremonies�
2�563� 9�089� 5�114� 5�102� 9�795�
� � � � � � �
� Jumlah�/�Total� 141�749� 169�997� 191�768� 213�183� 242�126�
�
http
://sul
teng
.bps
.go.
id

Consumption and Expenditure
Sulawesi Tengah In Figures 2014 445
Tabel�
Table� 12.2.5�Pengeluaran� Rata�rata� per� Kapita� Sebulan� untuk� Kelompok� Barang��Makanan�menurut�Status�Daerah�Kota�+�Perdesaan,�2009��2013�Average� Monthly� per� Capita� Expenditure� by� Commodity� Group� of� Food�Consumption�in�Urban�+�Rural�Areas,�2009��2013�
��
(Diolah�dari�hasil�Survei�Sosial�Ekonomi�Nasional�)�(Based�on�National�Socio�Economic�Survey)�
Kelompok�Barang�Commodity�Group� 2009� 2010� 2011� 2012� 2013�
(1)� (2)� (3)� (4)� (5)� (6)�� � � � � � �
1.� Padi�padian/�Cereals� 43�749� 46�612� 51�624� 66�119� 64�439�
2.�� Umbi�umbian/�Tubers� 4�281� 3�530� 5�215� 4�816� 5�204�
3.�� Ikan/�Fish� 24�880� 28�863� 35�192� 36�474� 40�199�
4.�� Daging/�Meat� 3�754� 6�069� 5�618� 6�017� 6�204�
5.� Telur�dan�Susu/�Eggs�and�Milk� 9�606� 11�877� 12�552� 15�201� 14�512�
6.� Sayur�sayuran/�Vegetables� 15�337� 16�242� 24�520� 21�074� 27�534�
7.� Kacang�kacangan/�Nuts� 3�054� 4�250� 4�531� 3�986� 5�459�
8.� Buah�buahan/�Fruits� 12�018� 19�640� 12�556� 15�156� 14�902�
9.� Minyak�dan�Lemak/�Oil�and�Fat� 7�975� 8�249� 11�930� 12�003� 11�527�
10.� Bahan�Minuman/�Beverage�Stuffs�
9�068� 12�389� 13�514� 13�603� 14�843�
11.� Bumbu�bumbuan/�Spices� 4�515� 5�162� 6�718� 6�259� 6�939�
12.� Konsumsi�Lainnya��Miscellaneous�food�items�
4�792� 5�011� 5�848� 6�143� 6�841�
13.� Makanan�dan�Minuman�Jadi*)�Prepared�food�and�beverages*)�
33�188� 41�782� 64�525� 64�040� 65�625�
14.� Tembakau�dan�Sirih/��Tobacco�and�Betel�
20�961� 25�280� 32�918� 42�839� 45�370�
Jumlah�/�Total� 197�179� 234�957� 287�261� 313�730� 329�598�
Catatan/Note� :� *)�Sudah�termasuk�minuman�yang�mengandung�alkohol�/�including�alcoholic�beverages�
http
://sul
teng
.bps
.go.
id

Konsumsi dan Pengeluaran
446 Sulawesi Tengah Dalam Angka 2014
Tabel�
Table� 12.2.6�Pengeluaran�Rata�rata�per�Kapita�Sebulan�untuk�Kelompok�Barang�Bukan�Makanan�menurut�Status�Daerah�Kota�+�Perdesaan,�2009�2013�Average�Monthly�per�Capita�Expenditure�by�Commodity�Group�of�Non�Food�Consumption�in�Urban�+�Rural�Areas,�2009���2013�
��
(Diolah�dari�hasil�Survei�Sosial�Ekonomi�Nasional�)�(Based�on�National�Socio�Economic�Survey)�
Kelompok�Barang�Commodity�Group�
�2009� 2010� 2011� 2012� 2013�
(1)� (2)� (3)� (4)� (5)� (6)�� � � � � � �1.�� Perumahan,�Bahan�Bakar,�
Penerangan�&�Air�Housing,�Fuel,�Light,�and�Water�
63�371� 82�208� 93�015� 119�271� 134�095�
2.� Aneka�Barang�dan�Jasa�Goods�and�Services�
54�661� 66�827� 79�261� 97�174� 109�868�
3.� Pakaian,�Alas�Kaki�&�Tutup�Kepala�Clothing,�Footwear,�and�Headwear�
13�236� 17�340� 13�886� 13�262� 23�278�
4.� Barang�yang�Tahan�Lama�Durables�Goods�
36�688� 34�059� 51�223� 29�062� 44�690�
5.� Pajak�Pemakaian�&�Premi�Asuransi��Taxes�and�Insurance�
3�705� 5�057� 5�746� 6�394� 7�924�
6.�� Keperluan�Pesta�dan�Upacara�Parties�and�Ceremonies�
4�823� 10�727� 8�684� 5�449� 11�752�
� � � � � � �
� Jumlah�/�Total� 176�483� 216�217� 251�815� 270�612� 331�608�
http
://sul
teng
.bps
.go.
id

Consumption and Expenditure
Sulawesi Tengah In Figures 2014 447
Tabel�
Table� 12.2.7�Persentase�Penduduk�menurut�Kabupaten/Kota�dan�Pengeluaran�untuk�Makanan�per�Kapita�Sebulan,�2013�Percentage�of�Population�by�Regency/City�and�Monthly�per�Capita�Expenditure�of�Food�Consumption,�2013�
��(Diolah�dari�hasil�Survei�Sosial�Ekonomi�Nasional�)�(Based�on�National�Socio�Economic�Survey)�
Kabupaten/Kota�Regency/City�
Golongan�Pengeluaran�Makanan�Perkapita��Sebulan�Monthly�Food�Expenditure��Group�
<100.000� 100.000���149.999�
150.000���199.999�
200.000���299.999�
(1)� (2)� (3)� (4)� (5)�� � � � �
01.�Banggai�Kepulauan� 0,92� 6,89� 14,25� 46,51�
02.�Banggai� 0,26� 5,80� 11,81� 44,72�
03.�Morowali� �� 2,73� 7,46� 33,15�
04.�Poso� 0,31� 3,85� 8,57� 37,61�
05.�Donggala� 1,15� 12,33� 20,96� 46,82�
06.�Tolitoli� 0,35� 6,41� 18,26� 46,71�
07.�Buol� �� 6,60� 12,32� 49,72�
08.�Parigi�Moutong� �� 2,36� 9,69� 38,69�
09.�Tojo�Una�una� �� 3,85� 12,81� 39,72�
10.��Sigi� 0,29� 8,95� 15,24� 44,14�
11.��Banggai�Laut1)� … … … …
12.��Morowali�Utara1)� … … … …
13.��Kota�Palu� �� 1,94� 4,86� 22,70�� � � � �
Sulawesi�Tengah� 0,29� 5,35� 11,94� 39,88�
Catatan/Note���:��1)�Tergabung�Dengan�Kabupaten�Induknya/�Include�in�main�regency�� �
http
://sul
teng
.bps
.go.
id

Konsumsi dan Pengeluaran
448 Sulawesi Tengah Dalam Angka 2014
Lanjutan�Tabel�/�Continued�Table��12.2.7���
Kabupaten/Kota�Regency/City�
Golongan�Pengeluaran�Makanan�Perkapita��Sebulan�Monthly�Food��Expenditure��Group�
Jumlah�Total�300.000���
499.999�500.000���749.999�
750.000���999.999� 1.000.000�+�
(1)� (6)� (7)� (8)� (9)� (10)�� � � � � �
01.�Banggai�Kepulauan� 25,21� 4,10� 1,92� 0,20� 100,00�
02.�Banggai� 28,59� 6,94� 1,26� 0,62� 100,00�
03.�Morowali� 31,32� 14,94� 6,85� 3,54� 100,00�
04.�Poso� 39,73� 7,68� 1,69� 0,57� 100,00�
05.�Donggala� 16,14� 2,37� 0,23� �� 100,00�
06.�Tolitoli� 21,29� 5,38� 0,64� 0,96� 100,00�
07.�Buol� 25,73� 4,26� 1,17� 0,20� 100,00�
08.�Parigi�Moutong� 36,30� 10,87� 1,99� 0,10� 100,00�
09.�Tojo�Una�una� 31,90� 9,32� 1,65� 0,75� 100,00�
10.�Sigi� 24,31� 4,91� 1,45� 0,72� 100,00�
11.��Banggai�Laut1)� …� …� …� …� …�
12.��Morowali�Utara1)� …� …� …� …� …�
13.��Kota�Palu� 37,70� 19,62� 8,18� 5,00� 100,00�
� � � � � �
Sulawesi�Tengah� 29,69� 8,93� 2,66� 1,26� 100,00�
Catatan/Note���:��1)�Tergabung�Dengan�Kabupaten�Induknya/�Include�in�main�regency��
http
://sul
teng
.bps
.go.
id

Consumption and Expenditure
Sulawesi Tengah In Figures 2014 449
Tabel�
Table� 12.2.8�Persentase� Penduduk� menurut� Kabupaten/Kota� dan� Pengeluaran� untuk�Non�Makanan�per�Kapita�Sebulan,�2013�Percentage� of� Population� by� Regency/City� and� Monthly� per� Capita�Expenditure�of�Non�Food�Consumption,�2013�
�(Diolah�dari�hasil�Survei�Sosial�Ekonomi�Nasional�)�(Based�on�National�Socio�Economic�Survey)�
Kabupaten/Kota�Regency/City�
Golongan�Pengeluaran�Non�Makanan�Perkapita��Sebulan�Monthly�Non�Food��Expenditure��Group�
<100.000� 100.000���149.999�
150.000���199.999�
200.000���299.999�
(1)� (2)� (3)� (4)� (5)�� � � � �
01.�Banggai�Kepulauan� 35,74� 18,52� 14,37� 13,08�
02.�Banggai� 24,22� 14,60� 13,38� 16,66�
03.�Morowali� 12,32� 14,86� 13,92� 20,07�
04.�Poso� 16,95� 15,70� 17,12� 20,03�
05.�Donggala� 39,24� 20,32� 14,45� 15,72�
06.�Tolitoli� 30,86� 25,66� 12,74� 12,85�
07.�Buol� 37,07� 18,84� 11,43� 15,70�
08.�Parigi�Moutong� 24,92� 13,96� 13,48� 23,23�
09.�Tojo�Una�una� 35,95� 15,86� 14,38� 12,36�
10.�Sigi� 37,60� 19,93� 12,21� 12,41�
11.��Banggai�Laut1)� …� …� …� …�
12.��Morowali�Utara1)� …� …� …� …�
13.��Kota�Palu� 1,08� 12,26� 9,99� 11,13�
� � � � �
Sulawesi�Tengah� 24,97� 16,74� 13,29� 16,30�
Catatan/Note���:��1)�Tergabung�Dengan�Kabupaten�Induknya/�Include�in�main�regency�
http
://sul
teng
.bps
.go.
id

Konsumsi dan Pengeluaran
450 Sulawesi Tengah Dalam Angka 2014
Lanjutan�Tabel�/�Continued�Table��12.2.8����
Kabupaten/Kota�Regency/City�
Golongan�Pengeluaran�Non�Makanan�Perkapita�Sebulan�Monthly�Non�Food��Expenditure��Group� Jumlah�
Total�300.000���499.999�
500.000���749.999�
750.000���999.999� 1.000.000�+�
(1)� (6)� (7)� (8)� (9)� (10)�� � � � � �
01.�Banggai�Kepulauan� 10,83� 3,83� 2,06� 1,57� 100,00�
02.�Banggai� 17,57� 7,09� 2,70� 3,78� 100,00�
03.�Morowali� 19,84� 8,11� 3,59� 7,28� 100,00�
04.�Poso� 18,22� 7,36� 1,50� 3,12� 100,00�
05.�Donggala� 7,66� 1,30� 0,70� 0,60� 100,00�
06.�Tolitoli� 9,77� 4,05� 1,22� 2,85� 100,00�
07.�Buol� 9,59� 3,18� 1,50� 2,69� 100,00�
08.�Parigi�Moutong� 16,81� 2,78� 1,90� 2,90� 100,00�
09.�Tojo�Una�una� 10,02� 5,78� 3,29� 2,35� 100,00�
10.�Sigi� 10,64� 3,28� 1,67� 2,26� 100,00�
11.��Banggai�Laut1)� …� …� …� …� …�
12.��Morowali�Utara1)� …� …� …� …� …�
13.��Kota�Palu� 18,55� 15,67� 10,75� 20,57� 100,00�
� � � � � �
Sulawesi�Tengah� 14,38� 5,99� 3,10� 5,23� 100,00�
Catatan/Note���:��1)�Tergabung�Dengan�Kabupaten�Induknya/�Include�in�main�regency�
http
://sul
teng
.bps
.go.
id

Consumption and Expenditure
Sulawesi Tengah In Figures 2014 451
Tabel�
Table� � 12.2.9�Persentase�Penduduk�menurut�Kabupaten/Kota�Total�Pengeluaran�per�Kapita�Sebulan,�2013�Percentage�of�Population�by�Regency/City�and�Total�per�Capita�Monthly�Expenditure,�2013�
�(Diolah�dari�hasil�Survei�Sosial�Ekonomi�Nasional�)�(Based�on�National�Socio�Economic�Survey)�
Kabupaten/Kota�Regency/City�
Total�Golongan�Pengeluaran�Perkapita��Sebulan�Total�Monthly�Expenditure��Group�
<100.000� 100.000���149.999�
150.000���199.999�
200.000���299.999�
(1)� (2)� (3)� (4)� (5)�� � � � �
01.�Banggai�Kepulauan� �� �� 2,39� 20,74�
02.�Banggai� �� �� 0,81� 15,76�
03.�Morowali� �� �� 0,29� 9,87�
04.�Poso� �� �� 1,08� 10,80�
05.�Donggala� 0,27� 1,62� 6,79� 23,82�
06.�Tolitoli� �� 0,90� 2,15� 20,33�
07.�Buol� �� �� 0,96� 20,35�
08.�Parigi�Moutong� �� �� 1,05� 10,70�
09.�Tojo�Una�una� �� 0,91� 2,95� 18,90�
10.�Sigi� �� �� 3,83� 21,05�
11.��Banggai�Laut1)� …� …� …� …�
12.��Morowali�Utara1)� …� …� …� …�
13.��Kota�Palu� �� �� �� 3,23�� � � � �
Sulawesi�Tengah� 0,03� 0,29� 1,91� 14,82�
Catatan/Note���:��1)�Tergabung�Dengan�Kabupaten�Induknya/�Include�in�main�regency�� �
http
://sul
teng
.bps
.go.
id

Konsumsi dan Pengeluaran
452 Sulawesi Tengah Dalam Angka 2014
�Lanjutan�Tabel�/�Continued�Table��12.2.9����
Kabupaten/Kota�Regency/City�
Total�Golongan�Pengeluaran�Perkapita��Sebulan�Total�Monthly�Expenditure��Group� Jumlah�/��
Total�300.000���499.999�
500.000���749.999�
750.000���999.999� 1.000.000�+�
(1)� (6)� (7)� (8)� (9)� (10)�� � � � � �
01.�Banggai�Kepulauan� 44,14� 18,56� 7,11� 7,06� 100,00�
02.�Banggai� 38,86� 21,00� 11,95� 11,61� 100,00�
03.�Morowali� 32,22� 22,21� 14,31� 21,09� 100,00�
04.�Poso� 38,34� 26,36� 11,59� 11,83� 100,00�
05.�Donggala� 45,97� 15,11� 3,90� 2,52� 100,00�
06.�Tolitoli� 48,52� 13,56� 7,07� 7,48� 100,00�
07.�Buol� 47,81� 18,63� 5,63� 6,63� 100,00�
08.�Parigi�Moutong� 39,61� 26,77� 12,13� 9,73� 100,00�
09.�Tojo�Una�una� 36,74� 21,82� 7,98� 10,69� 100,00�
10.�Sigi�� 42,62� 18,76� 6,36� 7,38� 100,00�
11.��Banggai�Laut1)� …� …� …� …� …�
12.��Morowali�Utara1)� …� …� …� …� …�
13.��Kota�Palu� 19,31� 20,68� 14,03� 42,75� 100,00�
� � � � � �
Sulawesi�Tengah� 38,38� 20,79� 9,90� 13,89� 100,00�
Catatan/Note���:��1)�Tergabung�Dengan�Kabupaten�Induknya/�Include�in�main�regency
http
://sul
teng
.bps
.go.
id

Regional Income
Sulawesi Tengah in Figures 2014 453
PENDAPATANREGIONAL
Regional Income
http
://sul
teng
.bps
.go.
id

Pendapatan Regional
454 Sulawesi Tengah Dalam Angka 2014
http
://sul
teng
.bps
.go.
id

Regional Income
Sulawesi Tengah in Figures 2014 455
13.����PENDAPATAN�REGIONAL��
Pendapatan� Regional� merupakan�salah� satu� indikator� penting� dalam�mengukur� keberhasilan� pembangunan.�Hal� ini� dapat� dilihat� dari� besaran� Produk�Domestik� Regional� Bruto� (PDRB),�perkembangan� PDRB� Sulawesi� Tengah,�struktur� perekonomian,� pendapatan�perkapita� maupun� pertumbuhan� ekonomi�dari�tahun�ke�tahun.��
�
Pertumbuhan� ekonomi� secara�nasional� maupun� regional� mengalami�perubahan� akibat� berbagai� perubahan�skala� ekonomi,teknologi,� dan� SDM� dalam�memproduksi� barang� dan� jasa.� PDRB�(Produk�Domestik�Regional�Bruto)�Provinsi�Sulawesi� Tengah� 2013� dengan� didasari�dengan�Tahun�Dasar�2000.�
�Perekonomian� Sulawesi� Tengah�
berdasarkan�Tahun�Dasar�2000��cenderung�mengalami� peningkatan,� dimana�pertumbuhan� ekonomi� tahun� 2013�mencapai� 9,38� persen� lebih� tinggi�dibandingkan� tahun� 2012� yang� hanya�mencapai� sebesar� 9,24� persen.�Perekonomian� Sulawesi� Tengah� didukung�oleh� kemampuan� ekspor� dan� konsumsi,�kondisi� ini� ikut� mendongkrak�perekonomian�nasional�yang� lebih�banyak�dipengaruhi� faktor� global.� Kondisi� ini�menunjukan� Perekonomian� Sulawesi�Tengah� telah� berada� pada� fase�development.�
13.��REGIONAL��INCOME��
Regional� income� is� one� of�important� indicators� in� measuring�development� progress� in� Sulawesi�Tengah.� This� is� shown� by� the� value� of�Gross�Regional�Domestic�Product� (GRDP)�of� Sulawesi� Tengah,structural� economy,�per� capita� income,� and� the� annum� of�economic�growth.�
�Economic�growth�as�well�as�nation�
and� regional� experienced� change� is� due�to� the� varied� change� of� economic� scale,�technology,� and� human� resource� in�producing� goods� and� service.� GRDP�(Gross� Regional� Domestic� Product)� of�Sulawesi�Tengah�Province�2013,�based�on�the��basic�year�of�2000.�
�Sulawesi� Tengah� economy� based�
on� constant� market� prices,� 2000� tended�to�increase,�the�economic�growth�in�2013�reached� 9.38� percent� is� bit� upperyear�2011achievement� by� 9.24� percent.�Sulawesi�Tengah's�economy� is� supported�by� export� and� consumption,� this�condition�took�up�pushing�in�the�national�economy� with� more� of� it� influenced�global� factors.� This� case� reflected� the�Sulawesi� Tengah� economyhas� been�placed�on�the�development�phase.�
���
http
://sul
teng
.bps
.go.
id

Pendapatan Regional
456 Sulawesi Tengah Dalam Angka 2014
Perkembangan� berbagai� sektor�ekonomi�selama�tahun�2013�menunjukkan�peningkatan�yang�berarti,�sektor�pertanian�yang� merupakan� sektor� terbesar�peranannya� terhadap� perekonomian�Sulawesi�Tengah�pada�tahun�2013�tumbuh�5,57�persen,�di�mana�sebelumnya�tumbuh�5,79�persen.��
�Berbagai� faktor� lain� yang� ikut�
mendukung� pertumbuhan� sektor�pertanian,� adalah� makin� kondusifnya�keamanan�secara�keseluruhan�di�Sulawesi�Tengah,� stabilnya� harga,� makin� efektifnya�pelaksanaan� pembangunan� pasca� krisis,�dan�penerapan�otonomi�daerah.�
�Sektor� pertambangan� dan�
penggalian� tumbuh� 35,23� persen� pada�tahun� 2013� yang� dipicu� oleh� besarnya�produksi� sub� sektor� migas.� Dilihat� dari�peranannya� dalam� perekonomian� secara�keseluruhan�masih�relatif�rendah,�padahal�komoditi� sektor� ini,� seperti� pasir� kuarsa,�nikel,� sirtu� merupakan� salah� satu��komoditi� andalan� baik� diekspor� antar�pulau� maupun� digunakan� untuk�kebutuhan�pembangunan�daerah.�Dengan�masuknya� migas� sebagai� salah� satu�komoditas� andalan,� sektor� ini� akan�menjadi� salah� satu� lokomotif�pertumbuhan�ekonomi�Sulawesi�Tengah.�
�Sektor� industri� pengolahan�
mengalami� peningkatan� nilai� tambah�sebesar� 4,96� persen.� Pertumbuhan� ini�didukung� oleh� adanya� peningkatan�
During�2013 ,developmentof�several�economic� sectors� underwent� the�significant� increase.� The� agricultural�sector�which� has� biggest� contribution� to�the� Sulawesi� Tengah� economy� growth�5.57� percent� and� before� was� 5.79�percent.��
��Other� varied� factors� that� support�
growth� in� the�agricultural� sector� is�more�conducive� safetyin� Sulawesi�Tengahgenerally,� the� price� stability,� the�more� effective� development� after� the�post�crisis� and� implementation� of� region�autonomy.��
The�mining� and� quarrying� sectors�grew� 35.23� percent� in� 2013� was� due� to�the�large�production�of�oil�gas�sub�sector.�By� looking� at� it� contribution� to�economysimultaneously� is� still� relative�small� in� spite� of� the� commodities� in� this�sector� such� as� sand� stone,� nickel,� and�quartz� sand� are� one� of� top� commodities�either� for� interisland� export� or� the�regional�development�needs.�In�including�oil�gas� asone� of� top� commodities� is�expected� this� sector� will� become� one� of�the� economic� growth� locomotive� of�Sulawesi�Tengah.�
��The�manufacturing�industry�sector�
experienced� increase� of� the� value� added�by�4.96�percent.�The�growth�is�supported�by� increasing� of� activity� and� production�
http
://sul
teng
.bps
.go.
id

Regional Income
Sulawesi Tengah in Figures 2014 457
aktivitas� dan� produksi� semua�subsektornya.� Angka� pertumbuhan� ini�dirasakan� � melambat� dan� relatif� sama�setiap� tahunnya� padahal� tumpuan�transformasi� ekonomi� diharapkan� pada�sektor� ini.� Dilihat� dari� peranan� sektor�industri� pengolahan� dalam� perekonomian�hanya� 6,35� persen� pada� tahun� 2013�menempatkan� Sulawesi� Tengah� berada�pada� daerah� non� industrialisasi� dengan�pangsa�NTB�lebih�kecil�dari�10�persen.�
�Sektor� bangunan� tumbuh� 13,48�
persen,� sektor� keuangan,� persewaan� &�jasa� perusahaan� 13,17� persen,� sektor�listrik� dan� air� bersih� sebesar� 9,68� persen,��sektor� perdagangan,� hotel� dan� restoran�sebesar�9,38�persen,� sektor�angkutan�dan�komunikasi�8,32�persen,�serta�sektor�jasa�jasa�tumbuh�8,11�persen.�
�Dari� gambaran� tersebut� terlihat�
bahwa� sektorindustri� pengolahan� tumbuh�di� bawah� 6� persen.� Terdapat� duasektor��dominan� dengan� andilnya� di� atas� 10�persen,� yaitu� sektor� pertambangan� dan�penggalian,�sertasektor�bangunan.��
�Kemampuan� perekonomian� tahun�
2013� di� Sulawesi� Tengah� ditinjau� dari�PDRB� atas� dasar� harga� berlaku� mencapai�58.641.176� juta� rupiah,� meningkat�dibandingkan� tahun� sebelumnya�51.106.074� juta� rupiah� dapat� dilihat� pada�Tabel�13.1.�
�
of� all� its� sub� sectors.� The� growth�rateseemed� slowly� and� relatively� same�with� every� yearalthough� dependence� of�economic� transformation� is� expected� on�this� sector.� Refer� to� contribution�ofmanufacturingindustry� sector� in�economy�was� only� 6.35� percent� in� 2013�so�that�Sulawesi�Tengah�was�included�as�non� industrial� region� with� gross� value�added�(NTB)�less�than�10�percent.�
��Construction� sector� grow� 13.48�
percent,� 9.58� percent� of� trading,�financial,�leasing�and�business�service�are�13.17� percent,� electricity� and� cleaning�water�sectors�by�9.68��percent,�hotel�and�restaurant� sectors,� transport� and�communication�sectors�8.32�percent,�and�services�sector�also�growth�8.11�percent.�
�From� the� description� can� be� seen�
that� the� manufacturing� industry� sectors�grew� below� 6� percent.Two� dominant�sectorswith� each� contributionmore� than�10� percentage,� mining� and� quarrying,�alsoconstruction�sectors.��
�According� to� GRDP� 2013� at�
current� market� prices,� Sulawesi� Tengah�economy�was�58,641,176�million�rupiahs,�went� up� to� compare� one� year� before� by�51,106,074�million� rupiahs,� as� presented�in�Table�13.1.�
��
http
://sul
teng
.bps
.go.
id

Pendapatan Regional
458 Sulawesi Tengah Dalam Angka 2014
Kontribusi� masing�masing� sektor�dalam� kaitannya� dengan� peranan� sektor�tersebut� terhadap� PDRB� Sulawesi� Tengah�atas� dasar� harga� berlaku� dalam� periode�2009�2013� mengalami� perubahan.�Tercatat� empat� sektor� kegiatan� yang�mendominasi� kehidupan� perekonomian�daerah� Sulawesi� Tengah� masing�masing:�sektor� pertanian,� sektor� jasa�jasa,� sektor�perdagangan,� hotel� dan� restoran,� dan�sektor�pertambangan/penggalian.�
�Sektor�pertanian�masih�merupakan�
tumpuan� kehidupan� perekonomian�daerah� ini.� � Peranannya� tetap� dominan,�hanya� sedikit� mengalami� penurunan� yang�tidak� signifikan� dari� 35,96� persen� pada�tahun� 2012� menjadi� 34,54� persen� pada�tahun� 2011.� Sektor� Jasa�jasa� yang� berada�pada� �urutan�kedua�memberikan�peranan�sebesar�17,64�persen,�menurun�dibanding�tahun�sebelumnya�17,73�persen.��
�Sektor� Perdagangan,� Hotel� dan�
Restoran� menempati� urutan� ketiga�dengan� andil� sebesar� 11,88� persen,�sedangkan� urutan� ke�� empat� ditempati�sektor� pertambangan� dan� penggalian�dengan� andil� sebesar� 8,47� persen� dan�urutan� kelima� adalah� sektor� bangunan�mencapai� 8,31� persen� ,� kemudian� sektor�Pengankutan�dan�Komunikasi� 6,95�persen�yang� hanya� beda� tipis� dengan� sektor�industry� pengolahan� 6,35� persen.� Adapun�sektor�sektor� lainnya� sumbangannya�masih� kurang� dari� lima� persen� (Tabel�13.5).�
Contribution in� each� sectorto�GRDP� at� current� market� prices� Sulawesi�Tengah� during� 2009�2013� underwent�change.� Four� sectorsdominated� Sulawesi�Tengah� economywere� agriculture,� trade,�hotel� and� restaurant,� services,� and�mining/Quarrying�sector.�
�����Agriculture� sector� still� becomes�
the�backbone�of�this�region�economy.� Its�contribution� was� still� dominant,� just�insignificantly� decreased� from� 34,54� in�2012� to� 35.96� in� 2013.� Services� sector�was� at� second� position� with� the�contribution� 17.64� percentage� down� to�compare� the� previous� year� by� 17.73�percent.��
��Sectors� of� trade,� hotel,� and�
restaurant�placed� the� third�position�with�11.88� percent� of� the� contribution.�Meanwhile,� at� the� fourth� position� was�mining/quarrying� sector� with�contribution� by� 8.47� percent.� Next,� the�fifth� position� was� construction� by� 8,31�percent,then� transportation� and�communication�by�6.95�pencent�it�almost�same�with�manufacturing�industry�sector�with�6.35�percent.�Whereas�other�sectors�had�only�bit�contribution�or�less�than�five�percent.�(as�shown�inTable�13.5.)�
�
http
://sul
teng
.bps
.go.
id

Regional Income
Sulawesi Tengah in Figures 2014 459
Berdasarkan� harga� konstan� 2000enam� sektor� di� atas� (pertanian,� jasa�jasa,�perdagangan,� hotel� dan� restoran,�pertambangan/penggalian,� bangunan,�serta� pengangkutan� dan� komunikasi)�masih� merupakan� sektor�sektor� yang�paling�dominan.�
�Sektor�Pertanian�yang�memberikan�
andil� 37,98� persen� tahun� 2012,� turun�menjadi� 36,66� persen� tahun� 2013� (Tabel�13.6),� dan� tetap� merupakan� sektor�terbesar� dalam� memberikan� andilnya�terhadap� PDRB� Sulawesi� Tengah.� Sektor�jasa�jasa� memberikan� andil� sebesar� 15,90�persen,� sedangkan� Sektor� Perdagangan,�Hotel� dan� Restoran� dengan� andil� sebesar�12,66� persen,� sektor� pertambangan/�pengalian,� sektor� bangunan� dan� sektor�angkutan� dan� komunikasi,� masing�masing��memberikan� andil� sebesar� � 8,18� persen,�8,01�persen,��dan�7,37�persen.�Selanjutnya�sektor�sektor� yang� lain� memiliki� andil�dibawah� enam� persen� dengan�kecenderungan� yang� semakin� meningkat�dari�tahun�ke�tahun.���
�PDRB� perkapita� atas� dasar� harga�
berlaku� menunjukkan� peningkatan� yaitu�dari� Rp.� 18.725.476� pada� tahun� 2012�menjadi� Rp.� 21.052.389� tahun� 2013.�Sedangkan� berdasarkan� harga� konstan��2000,PDRB�perkapita�secara�riil�mengalami�peningkatan� dari� Rp� 7.697.408� meningkat�menjadi� Rp� 8.249.686� pada� tahun� 2013�atau�naik�sekitar�7,17�persen.�� �
At� the� 2000� constant� market�prices,� six� sectors� as� mentioned� above�(agriculture,� services,� trade,� hotel� and�restaurant,� mining/quarrying,�transportation� and� communication,� and�construction)� still� became� the� most�dominantsectors.�
�Contribution� of� agriculturalsector�
decreased� from� 2012� to� 2013� or� 37.98�percent� compared� to� 36.66� percent�(Table�13.6).� This� condition� reflected� the�agriculture�was�still�sector�which�had�the�largest� contribution� to� Sulawesi� Tengah�GRDP.� Services� sector� gave� contribution�by� 15.90� percent,� meanwhile� sector� of�trade,� hotel,� and� restaurant� by� 12.66�percent.� Mining/quarrying� sector,�building� sector,� and� Transportation� and�communication� sectors� had� respectively�contributions� by� 8.18� percent,� 8.01�percent,� and� 7.37� percent.� Then,� other�sectors�which�had� contribution� less� than�six�percent�increasing�tendency�from�year�to�year.�
��Number� of� per� capita� GRDP� at�
current�market�prices�showed�an�increase�from� 18,725,476� rupiahs� in� 2012� to�21,052,389� rupiahs� in� 2013.�Meanwhile,�based� on� 2000� constant� market� prices,�per� capita�GRDP� in� 2011� increased� from�7,697,408�rupiahs�to�8,249,686�rupiahs�in�2013�or�around�7.17�percent.�
��
http
://sul
teng
.bps
.go.
id

Pendapatan Regional
460 Sulawesi Tengah Dalam Angka 2014
Dilihat� dari� sisi� penggunaan� PDRB�atas� dasar� harga� berlaku,� sebagian� besar�PDRB� digunakan� untuk� memenuhi�konsumsi�rumah�tangga.�Pada�tahun�2013�pengeluaran� konsumsi� rumah� tangga�mencapai� 33.933.868� juta� rupiah� atau�menyerap� sekitar� 57,79� persen� dari� total�PDRB�Sulawesi�Tengah.��
�Selain� itu,�kegiatan�pembentukan�
modal� tetap� bruto� (PMTB)� juga�mempunyai� kontribusi� cukup� besar� yaitu�senilai�12.706.443�juta�rupiah�atau�sekitar�21,64� persen� dan� untuk� pengeluaran�konsumsi� pemerintah� sebesar� 10.102.834�juta�rupiah,�ekspor�barang�dan�jasa�senilai�10.623.158� juta� rupiah� atau� sekitar� 18,09�persen�dari�total�PDRB.��
�Penggunaan� PDRB� untuk�
pengeluaran� konsumsi� lembaga� swasta�nirlaba� mempunyai� persentase� yaitu�hanya�1,49�persen.��
Berdasarkan� harga� konstan� 2000,�laju�pertumbuhan�PDRB�penggunaan�pada�tahun� 2013� digerakkan� oleh� semua�komponen� akhir.� Laju� pertumbuhan�komponen� penggunaan� mencapai� 9,38�persen,� tertinggi� berupa� pembentukan�modal�tetap�domestik�bruto�sebesar�18,75�persen.� Selanjutnya� diikuti� oleh�pengeluaran� pengeluaran� ekspor� barang�dan� jasa�sebesar� �8,73�persen.�Sementara�konsumsi� pemerintah� merupakan�komponen� yang� laju� pertumbuhannya�relatif�rendah,�yaitu�6,51�persen.�
According toGRDP�by�expenditure�at�current�market�prices,�most�of�GRDP�was�allocated� to� fulfill� household�consumption.� In� 2013,� household�consumption� expenditure� reached�33,933,868� million� rupiahs� or� about�57,79� percent� from� total� GRDP� of�Sulawesi�Tengah.��
Besides� that,� gross� fixed� capital�formation� also� had� enough� large�contribution� by� 12,706,443� million�rupiahs� or� about� 21.64� percent� and�Government�Consumption�Expenditure�by�10,102,834� million� rupiah,� export� by�10,623,158� million� rupiahs� or� about�18.09�percent�from�totalGRDP.��
��GRDP� expenditure� for� nonprofit�
private� organization� consumption� had�smallest�percentageby�1.49�percent.�
��Based� on� 2000� constant� market�
prices,� growth� of� GRDP� in� 2013� by�expenditure� was� pushed� the� all� end�components.� Growth� rate� of� the� highest�expenditure�component�9,38�percent,�the�Gross� Domestic� FixedCapital� Formation�by�16,66�persen�and�export�of�goods�and�services� by� 13,57� percent.Then� followed�by� Meanwhile,� Government� Consumption�Expenditureare� a� component� that� has�relatively� small� growth� rate,� or� 6,51�percent.�
�
http
://sul
teng
.bps
.go.
id

Regional Income
Sulawesi Tengah in Figures 2014 461
Dari� 13 Kabupaten/Kota� di� Sulawesi�Tengah,� Kota� Palu� merupakan� kota� yang�mempunyai� PDRB� terbesar.� Nilai� PDRB�Kota� Palu� atas� dasar� harga� berlaku� pada�tahun�2013�sebesar�9.728.261�juta�rupiah.�Kabupaten� berikutnya� adalah� Kabupaten�Parigi� Moutong� dan� Kabupaten� Banggai,�dengan� nilai� PDRB� masing�masing�9.561.013� juta� rupiah� dan� 8.080.946� juta�rupiah.� Kabupaten/Kota� yang� memiliki�PDRB� terkecil� adalah� Kabupaten� Banggai�Laut�dengan�nilai�PDRB�833.176�juta.�
Among� all� 13 regencies/city� in�Sulawesi� Tengah,� Palu� City� had� the�largest� GRDP.� Palu’s� GRDP� at� current�market� prices� reached� 9,728,261� million�rupiahs� in� 2013.� Parigi� Moutong�Regencyand� Banggai� Regency� had� also�big� GRDP� are� respective� 9.561.013�million� rupiahs� and� 8.080.946� million�rupiahs.� The� smallest� GRDP� is� Banggai�Laut� Regency� with� its� GRDP� 833.176�million�rupiahs.��
http
://sul
teng
.bps
.go.
id

Pendapatan Regional
462 Sulawesi Tengah Dalam Angka 2014
http
://sul
teng
.bps
.go.
id

Sul
G
F
P
TraC
lawesi Tengah
Gambar�
Figure� 13.1�
Perdagangan,�Hdan�Restoran
Trade,Hotel�aRestaurant
11,88%
Pengangkutan�&�Komunikasi�
ansportation�andCommunication
6,95%
KeuangPersewaan�dPerusahaan/
al�OwnersDwlling�
Business�Se5,21%
in Figures 201
Distribusi�PTengah,�20PercentageMarket�Pric
Bangunan/Cotion
8,31%
Hotel�n/�nd�
�
gan,�dan�Jasa�/Financi
ship�of�and�ervices%
Ja
14
Persentase�PDR13�� Distribution� oces,�2013�
onstruc
%
asa�Jasa/Services17,64%
RB�Atas�Dasar�
of� Sulawesi� Te
Listrik,�Gas�dBersih�/
Electricity,GaWater�Sup
0,66%
Harga�Berlaku
ngah� Province
Pertanian/Are
34,54
PeM
an�Air�/�as�and�pply
Regional In
�Provinsi�Sulaw
� GRDP� at� Cur
Agricultu
4%
Pertambanganggalian�
Mining/Quarr8,47%
Industri�engolahan�(�Tanp
Migas)/Manufactuing�Industry�
(excluding�oil)6,35%
come
463
wesi�
rrent�
n/Pen
rying
pa�urht
tp://s
ulte
ng.b
ps.g
o.id

Pendapatan Regional
464 Sulawesi Tengah Dalam Angka 2014
http
://sul
teng
.bps
.go.
id

Regional Income
Sulawesi Tengah in Figures 2014 465
13.�PENDAPATAN�REGIONAL/REGIONAL�INCOME��Tabel�
Table� � 13.1�Produk� Domestik� Regional� Bruto� Atas� Dasar� Harga� Berlaku� Menurut�Lapangan�Usaha,�2009�2013�(Juta�rupiah)�Gross� Regional� Domestic� Product� at� Current� Market� Prices� by� Industrial�Origin,�2009–�2013(Million�Rupiahs)�
��
Lapangan�Usaha�Industrial�Origin� 2009� 2010� 2011� 2012*)� 2013**)�
(1)� (2) (3) (4) (5) (6)�� � � �
1.� Pertanian�/�Agriculture� 13�231�345 14�507�237 16�493�715 18�376�221� 20�255�635�
2.� Pertambangan/Penggalian�Mining/Quarrying� 1�374�321 1�939�569 2�767�874 3�695�529� 4�964�504�
3.�Industri�Pengolahan�(�Tanpa�Migas)/Manufacturing�Industry�(excluding�oil�gas)�
2�547�427 2�812�821 3�084�443 3�363�839� 3�721�431�
4.�Listrik,�Gas�dan�Air�Bersih�Electricity,�Gas�and�WaterSupply�
�214�655 �240�940 �285�567 �335�488� �386�870�
5.� Bangunan/Construction� 2�120�616 2�478�308 3�205�542 4�052�197� 4�874�408�
6.�Perdagangan,�Hotel�dan��Restoran/�Trade,�Hotel�and�Restaurant�
3�841�235 4�437�424 5�301�431 6�194�460� 6�964�715�
7.�Pengangkutan�&�Komunikasi�Transportation�and�Communication�
2�318�900 2�642�818 3�146�576 3�606�293� 4�077�817�
8.�
Keuangan,�Persewaan�dan�Jasa�Perusahaan/Financial�Ownership�of�Leasing��and�Business�Services�
1�510�878 1�773�462 2�143�731 2�419�468� 3�052�902�
9.� Jasa�Jasa/Services� 5�301�954 6�481�787 7�883�343 9�062�578� 10�342�894�
PDRB/GRDP� 32�461�332 37�314�367 44�312�222 51�106�074� 58�641�176�
PDRB�TANPA�MIGAS�GRDP�WITHOUT�OIL�GAS� 31�816�970 36�548�211 43�366�062 50�076�484� 57�733�860�
Catatan/Note�� :�*)� �Angka�Sementara/Preliminary�Figures�
� **)��Angka�Sangat�Sementara/Very�Preliminary�Figures�
http
://sul
teng
.bps
.go.
id

Pendapatan Regional
466 Sulawesi Tengah Dalam Angka 2014
Tabel�
Table� � 13.2�Produk� Domestik� Regional� Bruto� Atas� Dasar� Harga� Konstan� 2000�Menurut��Lapangan���Usaha,��2009���2013�(Juta�rupiah)�Gross� Regional� Domestic� Product� at� 2000� Constant� Market� Prices� by�Industrial�Origin,�2009–�2013(Million�Rupiahs)�
�
Lapangan�Usaha�Industrial�Origin� 2009� 2010� 2011� 2012*)� 2013**)�
(1) (2) (3) (4) (5) (6)�� � �
1.� Pertanian/Agriculture� 6�652�547� 7�051�387� 7�542�543� 7�979�414� 8�423�688�
2.� Pertambangan/Penggalian�Mining/Quarrying� �596�315� �796�178� 1�075�821� 1�390�203� 1�879�989�
3.� Industri�Pengolahan�(�Tanpa�Migas)/Manufacturing�Industry�(excluding�oil�gas)�
1�043�659� 1�108�489� 1�160�960� 1�222�380� 1�283�002�
4.� Listrik,�Gas�dan�Air�Bersih�Electricity,�Gas�and�Water�Supply�
�119�330� �125�511� �134�985� �146�219� �160�371�
5.� Bangunan/Construction� 1�087�770� 1�188�816� 1�372�733� 1�622�572� 1�841�225�
6.� Perdagangan,�Hotel�dan��Restoran/�Trade,�Hotel�and�Restaurant�
2�079�597� 2�286�567� 2�464�863� 2�701�106� 2�908�607�
7.� Pengangkutan�&�Komunikasi�Transportation�and�Communication�
1�225�043� 1�332�953� 1�440�361� 1�563�733� 1�693�904�
8.� Keuangan,�Persewaan�dan�Jasa�Perusahaan/Financial�Ownership�of�Leasing�and�Business�Services�
�766�519� �848�133� �927�019� 1�001�872� 1�133�838�
9.� Jasa�Jasa/Services� 2�636�816� 2�886�140� 3�111�634� 3�380�473� 3�654�777�
PDRB/GRDP� 16�207�596� 17�624�174� 19�230�919� 21�007�973� 22�979�401�
PDRB�TANPA�MIGAS�GRDP�WITHOUT�OIL�GAS� 15�943�320� 17�334�357� 18�923�363� 20�706�526� 22�718�873�
Catatan/Note�� :�*)� �Angka�Sementara/Preliminary�Figures�
� **)��Angka�Sangat�Sementara/Very�Preliminary�Figures�
��
http
://sul
teng
.bps
.go.
id

Regional Income
Sulawesi Tengah in Figures 2014 467
Tabel�
Table� � 13.3�Laju�Pertumbuhan�Produk�Domestik�Regional�Bruto�Atas�Dasar�Harga�Berlaku�menurut�Lapangan�Usaha,�2009���2013�(Persen)�The�Growth�Rate�of�Gross�Regional�Domestic�Product�at�Current�Market�Prices�by�Industrial�Origin,2009–�2013�(Percent)�
�
Lapangan�Usaha�Industrial�Origin� 2009� 2010� 2011� 2012*)� 2013**)�
(1)� (2) (3) (4) (5) (6)�� � � �
1.� Pertanian/Agriculture� 9,64 13,69 11,41 10,23 9,64
2.� Pertambangan/Penggalian�Mining/Quarrying� 41,13 42,71 33,52 34,34 41,13
3.� Industri�Pengolahan�(�Tanpa�Migas)/Manufacturing�Industry�(excluding�oil�gas)�
10,42 9,66 9,06 10,63 10,42
4.� Listrik,�Gas�dan�Air�Bersih�Electricity,�Gas�and�Water�Supply�
20,48 12,25 18,52 17,48 15,32
5.� Bangunan/Construction� 17,52 16,87 29,34 26,41 20,29
6.� Perdagangan,�Hotel�dan��Restoran/�Trade,�Hotel�and�Restaurant�
12,43 15,52 19,47 16,85 12,43
7.� Pengangkutan�&�Komunikasi�Transportation�and�Communication�
16,61 13,97 19,06 14,61 13,08
8.� Keuangan,�Persewaan�dan�Jasa�Perusahaan/Financial�Ownership�of�Leasing�and�Business�Services�
15,39 17,38 20,88 12,86 26,18
9.� Jasa�Jasa/Services� 16,49 22,25 21,62 14,96 14,13
PDRB/GRDP� 13,00 14,95 18,75 15,33 14,74
PDRB�TANPA�MIGAS�GRDP�WITHOUT�OIL�GAS� 13,42 14,87 18,65 15,47 15,29
Catatan/Note�� :�*)� �Angka�Sementara/Preliminary�Figures�
� **)��Angka�Sangat�Sementara/Very�Preliminary�Figures�
�
http
://sul
teng
.bps
.go.
id

Pendapatan Regional
468 Sulawesi Tengah Dalam Angka 2014
Tabel�
Table� � 13.4�Laju� Pertumbuhan� Produk� Domestik� Regional� Bruto� Atas� DasarHarga�Konstan�2000�Menurut�Lapangan�Usaha�2009–�2013(Persen)�The� Growth� Rate� of� Gross� Regional� Domestic� Product� at� 2000� Constant�Prices�by�Industrial�Origin,�2009��2013�(Percent)�
��
Lapangan�Usaha�Industrial�Origin� 2009� 2010� 2011� 2012*)� 2013**)�
(1) (2) (3) (4) (5) (6)�� � � �
1.� Pertanian/Agriculture� 6,39� 6,00� 6,97� 5,79� 5,57�
2.� Pertambangan/Penggalian�Mining/Quarrying� 8,65� 33,52� 35,12� 29,22� 35,23�
3.� Industri�Pengolahan�(�Tanpa�Migas)/Manufacturing�Industry�(excluding�oil�gas)�
8,44� 6,21� 4,73� 5,29� 4,96�
4.� Listrik,�Gas�dan�Air�Bersih�Electricity,�Gas�and�Water�Supply�
11,10� 5,18� 7,55� 8,32� 9,68�
5.� Bangunan/Construction� 8,42� 9,29� 15,47� 18,20� 13,48�
6.� Perdagangan,�Hotel�dan��Restoran/�Trade,�Hotel�and�Restaurant�
8,12� 9,95� 7,80� 9,58� 7,68�
7.� Pengangkutan�&�Komunikasi�Transportation�and�Communication�
10,12� 8,81� 8,06� 8,57� 8,32�
8.� Keuangan,�Persewaan�dan�Jasa�Perusahaan/Financial�Ownership�of�Leasing�and�Business�Services�
8,69� 10,65� 9,30� 8,07� 13,17�
9.� Jasa�Jasa/Services� 8,44� 9,46� 7,81� 8,64� 8,11�
PDRB/GRDP� 7,71� 8,74� 9,12� 9,24� 9,38�
PDRB�TANPA�MIGAS�GRDP�WITHOUT�OIL�GAS� 8,00� 8,72� 9,17� 9,42� 9,72�
Catatan/Note�� :�*)� �Angka�Sementara/Preliminary�Figures�
� **)��Angka�Sangat�Sementara/Very�Preliminary�Figures�
http
://sul
teng
.bps
.go.
id

Regional Income
Sulawesi Tengah in Figures 2014 469
Tabel�
Table� � 13.5�Distribusi�Persentase�Produk�Domestik�Regional�Bruto�AtasDasar� �Harga�Berlaku�Menurut�Lapangan�Usaha�2009–�2013(Persen)�Percentage� Distribution� of� Gross� Regional� Domestic� Product� at� Current�Market�Prices��by�Industrial�Origin�2009��2013,�(Percent)�
��
Lapangan�Usaha�Industrial�Origin� 2009� 2010� 2011� 2012*)� 2013**)�
(1)� (2) (3) (4) (5) (6)�� � � �
1.� Pertanian/Agriculture� 40,76� 38,88� 37,22� 35,96� 34,54�
2.� Pertambangan/Penggalian�Mining/Quarrying� 4,23� 5,20� 6,25� 7,23� 8,47�
3.� Industri�Pengolahan�(�Tanpa�Migas)/Manufacturing�Industry�(excluding�oil�gas)�
7,85� 7,54� 6,96� 6,58� 6,35�
4.� Listrik,�Gas�dan�Air�Bersih�Electricity,�Gas�and�Water�Supply�
0,66� 0,65� 0,64� 0,66� 0,66�
5.� Bangunan/Construction� 6,53� 6,64� 7,23� 7,93� 8,31�
6.� Perdagangan,�Hotel�dan��Restoran/�Trade,�Hotel�and�Restaurant�
11,83� 11,89� 11,96� 12,12� 11,88�
7.� Pengangkutan�&�Komunikasi�Transportation�and�Communication�
7,14� 7,08� 7,10� 7,06� 6,95�
8.� Keuangan,�Persewaan�dan�Jasa�Perusahaan/Financial�Ownership�of�Leasing�and�Business�Services�
4,65� 4,75� 4,84� 4,73� 5,21�
9.� Jasa�Jasa/Services� 16,33� 17,37� 17,79� 17,73� 17,64�
PDRB/GRDP� 100,00� 100,00� 100,00� 100,00� 100,00�
PDRB�TANPA�MIGAS�GRDP�WITHOUT�OIL�GAS� 98,01� 97,92� 97,92� 97,92� 97,92�
Catatan/Note�� :�*)� �Angka�Sementara/Preliminary�Figures�
� **)��Angka�Sangat�Sementara/Very�Preliminary�Figures��
http
://sul
teng
.bps
.go.
id

Pendapatan Regional
470 Sulawesi Tengah Dalam Angka 2014
Tabel�
Table� � 13.6�Distribusi�Persentase�Produk�Domestik�Regional�Bruto�Atas�Dasar��Harga�Konstan�2000�Menurut�Lapangan�Usaha,�2009–�2013�(Persen)�Percentage� Distribution� of� Gross� Regional� Domestic� Product� at� 2000�Constant�Prices�by�Industrial�Origin,�2009–�2013,�(Percent)�
�
Lapangan�Usaha�Industrial�Origin� 2009� 2010� 2011� 2012*)� 2013**)�
(1) (2) (3) (4) (5) (6)�� � � �
1.� Pertanian/Agriculture� 41,05� 40,01� 39,22� 37,98� 36,66�
2.� Pertambangan/Penggalian�Mining/Quarrying� 3,68� 4,52� 5,59� 6,62� 8,18�
3.� Industri�Pengolahan�(�Tanpa�Migas)/Manufacturing�Industry�(excluding�oil�gas)�
6,44� 6,29� 6,04� 5,82� 5,58�
4.� Listrik,�Gas�dan�Air�Bersih�Electricity,�Gas�and�Water�Supply�
0,74� 0,71� 0,70� 0,70� 0,70�
5.� Bangunan/Construction� 6,71� 6,75� 7,14� 7,72� 8,01�
6.� Perdagangan,�Hotel�dan��Restoran/�Trade,�Hotel�and�Restaurant�
12,83� 12,97� 12,82� 12,86� 12,66�
7.� Pengangkutan�&�Komunikasi�Transportation�and�Communication�
7,56� 7,56� 7,49� 7,44� 7,37�
8.� Keuangan,�Persewaan�dan�Jasa�Perusahaan/Financial�Ownership�of�Leasing�and�Business�Services�
4,73� 4,81� 4,82� 4,77� 4,93�
9.� Jasa�Jasa/Services� 16,27� 16,38� 16,18� 16,09� 15,90�
PDRB/GRDP� 100,00� 100,00� 100,00� 100,00� 100,00�
PDRB�TANPA�MIGAS�GRDP�WITHOUT�OIL�GAS� 98,37� 98,36� 98,40� 98,57� 98,87�
Catatan/Note�� :�*)� �Angka�Sementara/Preliminary�Figures�
� **)��Angka�Sangat�Sementara/Very�Preliminary�Figures�
http
://sul
teng
.bps
.go.
id

Regional Income
Sulawesi Tengah in Figures 2014 471
Tabel�
Table� � 13.7�Pendapatan� Agregat� dan� per� Kapita� Atas� Dasar� Harga� Berlaku� dan�Harga�Konstan�2000,�2009���2013�(Juta�rupiah)�Aggregate�and�per�Capita�Income�at�Current�and�2000�Constant�Market�Prices,�2009–�2013(Million�Rupiahs)�
�
Uraian�Description� 2009� 2010� 2011� 2012*)� 2013**)�
(1)� (2) (3) (4) (5) (6)�� � � � � �
Atas�Dasar�Harga�Berlaku�/�At�Current�Market�Prices�1.� PDRB�(Juta�Rp.)�
GRDP�(Million�Rp.)� 32�461�332 37�314�367 44�312�222 51�106�074� 58�641�176�
2.� PDRB�Tanpa�Migas��(Juta�Rp.)�GRDP�Without�Oil�and�Gas�(Million�Rp.)�
31�816�970 36�548�211 43�366�062 50�076�484� 57�733�860�
3�� PDRB�per�Kapita�(Rp�)�Per�Capita�GRDP�(Rp)� 12�532�888 14�098�626 16�511�480 18�725�476� 21�052�389�
4�� PDRB�per�Kapita�Tanpa�Migas�(Rp)�Per�Capita�GRDP�Without�Oil�and�Gas�(Rp�)�
12�284�108 13�809�146 16�158�925 18�348�230� 20�726�659�
Atas�Dasar�Harga�Konstan�2000�/At�Constant�2000�Market�Prices�1�� PDRB�(Juta�Rp)�
GRDP�(Million�Rp)� 16�207�596 17�624�174 19�230�919 21�007�973� 22�979�401�
2�� PDRB�Tanpa�Migas��(Juta�Rp)�GRDP�Without�Oil�and�Gas�(Million�Rp�)�
15�943�320 17�334�357 18�923�363 20�706�526� 22�718�873�
3�� PDRB�per�Kapita�(Rp�)�Per�Capita�GRDP�(Rp)� 6�257�537 6�659�007 7�165�764 7�697�408� 8�249�686�
4�� PDRB�per�Kapita�Tanpa�Migas�(Rp)�Per�Capita�GRDP�Without�Oil�and�Gas�(Rp�)�
6�155�503 6�549�504 7�051�164 7�586�956� 8�156�155�
Jumlah�Penduduk�Pertengahan�Tahun�(Jiwa)�������Mid�Year�Population,�(person)�
2�590�092 2�646�667 2�683�722 2�729�227� 2�785�488�
Catatan/Note�� :�*)� �Angka�Sementara/Preliminary�Figures�
� **)��Angka�Sangat�Sementara/Very�Preliminary�Figures�
http
://sul
teng
.bps
.go.
id

Pendapatan Regional
472 Sulawesi Tengah Dalam Angka 2014
Tabel�
Table� � 13.8�Indeks� Harga� Implisit� Produk� Domestik� Regional� Bruto� Menurut�Lapangan�Usaha,�2009���2013�Implicit�Prices� Index� �of�Gross�Regional�Domestic�Product�by� Industrial�Origin,�2009���2013�
�
Lapangan�Usaha�Industrial�Origin� 2009� 2010� 2011� 2012*)� 2013**)�
� (1)� (2) (3) (4) (5) (6)�� � �
1� Pertanian/Agriculture� 198,89� 205,74� 218,68� 230,30� 240,46�
2� Pertambangan/Penggalian�Mining/Quarrying� 230,47� 243,61� 257,28� 265,83� 264,07�
3�Industri�Pengolahan�(�Tanpa�Migas)/Manufacturing�Industry�(excluding�oil�gas)�
244,09� 253,75� 265,68� 275,19� 290,06�
4� Listrik,�Gas�dan�Air�Bersih�Electricity,�Gas�and�Clean�water� 179,88� 191,97� 211,56� 229,44� 241,23�
5� Bangunan/Construction� 194,95� 208,47� 233,52� 249,74� 264,74�
6� Perdagangan,�Hotel�dan�Restoran/�Trade,�Hotel�and�Restaurant� 184,71� 194,06� 215,08� 229,33� 239,45�
7� Pengangkutan�&�Komunikasi�Transportation�and�Communication� 189,29� 198,27� 218,46� 230,62� 240,73�
8�Keuangan,�Persewaan�dan�Jasa�Perusahaan/Financial�Ownership�of�Leasing�and�Business�Services�
197,11� 209,10� 231,25� 241,49� 269,25�
9� Jasa�Jasa/Services� 201,07� 224,58� 253,35� 268,09� 283,00�
PDRB/GRDP� 200,28� 211,72� 230,42� 243,27� 255,19�
Catatan/Note�� :�*)� �Angka�Sementara/Preliminary�Figures�
� **)��Angka�Sangat�Sementara/Very�Preliminary�Figures�
�� �
http
://sul
teng
.bps
.go.
id

Regional Income
Sulawesi Tengah in Figures 2014 473
Tabel�
Table� � 13.9�PDRB�Menurut�Penggunaan�Atas�Dasar�Harga�Berlaku,�2009–�2013�(Juta�rupiah)�Expenditure�GRDP�at�Current�Market�Price,�2009�–�2013�(Million�Rupiahs)�
�
Penggunaan�Expenditure� 2009� 2010� 2011� 2012*)� 2013**)�
(1)� (2) (3) (4) (5) (6)�1��Pengeluaran�Konsumsi�
Rumah�Tangga�/��Private�Consumption�Expenditure� 19�918�486 22�691�032 26�549�347 29�254�343� 33�933�868�
2. Pengeluaran�Konsumsi���Lembaga�Swasta�Nirbala��Private�Non�Profit�Institution���
����Consumption��Expenditure��
�461�952 �524�519 �719�674 �793�749� �876�665�
3. Pengeluaran�Konsumsi�Pemerintah�Government�Consumption�Expenditure��
5�616�062 6�354�509 7�409�432 8�991�204� 10�102�834�
4���Pembentukan�Modal�Tetap�������Domestik�Bruto������Gross�Domestic�Fixed���������Capital�Formation���
5�564�376 6�351�815 7�541�159 9�981�876� 12�706�443�
5���Perubahan�Stok������Change�in�Stock� �457�454 �490�353 �591�487 �732�052� �744�946�
6���Ekspor�Barang�dan�Jasa�����������������Export�of�Goods�And��������Services��
5�356�502 6�410�286 7�732�904 9�330�646� 10�623�158�
7. Dikurangi�Impor�Barang������dan�Jasa����Less�Import�of�Goods�and�Services�
4�913�500 5�508�147 6�231�781 7�977�796� 10�264�338�
PDRB�/�GDRP� 32�461�332 37�314�367 44�312�222 51�106�074� 58�723�576�
PDRB�TANPA�MIGAS�
GRDP�WITHOUT�OIL�GAS�31�816�970 36�548�211 43�366�062 50�076�484� 57�816�260�
Catatan/Note�� :�*)� �Angka�Sementara/Preliminary�Figures�
� **)��Angka�Sangat�Sementara/Very�Preliminary�Figures�
http
://sul
teng
.bps
.go.
id

Pendapatan Regional
474 Sulawesi Tengah Dalam Angka 2014
Tabel�
Table� � 13.10�PDRB�Menurut�Penggunaan�Atas�Dasar�Harga�Konstan� 2000,� 2009–�2013(Juta�rupiah)�Expenditure�GRDP��at�2000�Constant��Market�Price,�2009–�2013(Million�Rupiahs)�
��
Penggunaan�Expenditure� 2009� 2010� 2011� 2012*)� 2013**)�
(1)� (2)� (3) (4) (5) (6)�1. Pengeluaran�Konsumsi�����
Rumah�Tangga/�Private�����������Consumption�Expenditure�
9�214�556 9�887�382 10�711�791 11�466�731 12�321�159�
2��Pengeluaran�Konsumsi������Lembaga�Swasta�Nirbala�Private�Non�Profit�Institution�Consumption�Expenditure�
�202�910 �213�678 �267�604 �267�360 �291�017�
3��Pengeluaran�Konsumsi�������Pemerintah/��Government�Consumption�Expenditure� 3�072�963 3�287�500 3�446�986 3�660�954 3�899�179�
4��Pembentukan�Modal������Tetap�Domestik�Bruto/�
Gross�Domestic�Fixed�Capital�Formation��
3�222�343 3�462�096 3�786�300 4�418�394 5�247�006�
5���Perubahan�Stok�����Change�in�Stock� �230�529 �240�844 �241�557 �267�058 �260�226�
6���Ekspor�Barang�dan�Jasa�����������Export�of�Goods�And���Services�
2�549�507 2�847�347 3�101�117 3�518�442 3�825�524�
8. Dikurangi�Impor�Barang�����dan�Jasa�
���Less�Import�of�Goods�and�Services�
2�285�212 2�314�674 2�324�434 2�590�966 2�864�960�
PDRB�/�GRDP� 16�207�596 17�624�174 19�230�919 21�007�973 22�979�151�
PDRB�TANPA�MIGAS�GRDP�WITHOUT�OIL�GAS� 15�943�320 17�334�357 18�923�363 20�706�526 22�718�623�
Catatan/Note�� :�*)� �Angka�Sementara/Preliminary�Figures�
� **)��Angka�Sangat�Sementara/Very�Preliminary�Figures�
http
://sul
teng
.bps
.go.
id

Regional Income
Sulawesi Tengah in Figures 2014 475
Tabel�
Table� � 13.11�Distribusi�Persentase�PDRB�Penggunaan�atas�Dasar�Harga�Berlaku,2009–�2013(Persen)�Percentage� Distribution� of� GRDP� at� Current�Market� Price� by� Expenditure�Components,�2009–�2013�(Percent)�
��
Penggunaan�Expenditure� 2009� 2010� 2011� 2012*)� 2013**)�
(1)� (2)� (3)� (4)� (5)� (6)�� �
1���Pengeluaran�Konsumsi�Rumah�Tangga������Private�Consumption�Expenditure� 61,36� 60,81� 59,91� 57,24� 57,79�
2. Pengeluaran�Konsumsi�Lembaga��Swasta�������Nirbala/�Private�Non�Profit�Institution��
Consumption���Expenditure�1,42� 1,41� 1,62� 1,55� 1,49�
3���Pengeluaran�Konsumsi�Pemerintah������Government�Consumption�Expenditure� 17,30� 17,03� 16,72� 17,59� 17,20�
4���Pembentukan�Modal�Tetap�Domestik�Bruto�����Gross�Domestic�Fixed�Capital�Formation�� 17,14� 17,02� 17,02� 19,53� 21,64�
5���Perubahan�Stok������Change�in�Stock� 1,41� 1,31� 1,33� 1,43� 1,27�
6���Ekspor�Barang�dan�Jasa������Export�of�Goods�And�Services� 16,50� 17,18� 17,45� 18,26� 18,09�
7���Dikurangi�Impor�Barang�dan�Jasa������Less�Import�of�Goods�and�Services� 15,14� 14,76� 14,06� 15,61� 17,48�
� � � � �
Produk��Domestik�Regional�Bruto�Gross�Domestic�Regional�Product�
100,00� 100,00� 100,00� 100,00� 100,00�
Catatan/Note�� :�*)� �Angka�Sementara/Preliminary�Figures�
� **)��Angka�Sangat�Sementara/Very�Preliminary�Figures�
http
://sul
teng
.bps
.go.
id

Pendapatan Regional
476 Sulawesi Tengah Dalam Angka 2014
�
�
Catatan/Note�� :�*)� �Angka�Sementara/Preliminary�Figures�
� **)��Angka�Sangat�Sementara/Very�Preliminary�Figures�
�
Penggunaan�Expenditure� 2009� 2010� 2011� 2012*)� 2013**)�
(1)� (2)� (3)� (4)� (5)� (6)�� �
1�����Pengeluaran�Konsumsi�Rumah�Tangga��������Private�Consumption�Expenditure� 56,85� 56,10� 55,70� 54,58� 53,62�
2�����Pengeluaran�Konsumsi�Lembaga�Swasta�Nirbala������������Private�Non�Profit��Institution�Consumption�����������Expenditure�
1,25� 1,21� 1,39� 1,27� 1,27�
3�����Pengeluaran�Konsumsi�Pemerintah��������Government�Consumption�Expenditure� 18,96� 18,65� 17,92� 17,43� 16,97�
4�����Pembentukan�Modal�Tetap�Domestik�Bruto�Gross�Domestic�Fixed�Capital�Formation�� 19,88� 19,64� 19,69� 21,03� 22,83�
5����Perubahan�Stok�������Change�in�Stock� 1,42� 1,37� 1,26� 1,27� 1,13�
6����Ekspor�Barang�dan�Jasa�������Export�of�Goods�And�Services� 15,73� 16,16� 16,13� 16,75� 16,65�
7����Dikurangi�Impor�Barang�dan�Jasa�������Less�Import�of�Goods�and�Services� 14,10� 13,13� 12,09� 12,33� 12,47�
� � � � � �
Produk��Domestik�Regional�Bruto��������Gross�Domestic�Regional�Product� 100,00� 100,00� 100,00� 100,00� 100,00�
Tabel�
Table� � 13.12�Distribusi�Persentase�PDRB�Penggunaan�atas�Dasar�Harga�Konstan�2000,�2009�–�2013�(Persen)�Percentage�Distribution�of�GRDP�at�2000�Constant��Market�Price�by�Expenditure�Components,�2009–�2013�(Percent)�
http
://sul
teng
.bps
.go.
id

Regional Income
Sulawesi Tengah in Figures 2014 477
�
�
Catatan/Note�� :�*)� �Angka�Sementara/Preliminary�Figures�
� **)��Angka�Sangat�Sementara/Very�Preliminary�Figures�
�
Tabel�
Table� � 13.13�Laju�Pertumbuhan�PDRB�Penggunaan�Atas�Dasar�Harga�Berlaku,�2009���2013�(Persen)�The�Growth�Rate�of�GRDP�at�Current�Market�Price�by�Expenditure�Components,�2009–�2013(Percent)�
Penggunaan/Expenditure� 2009� 2010� 2011� 2012*)� 2013**)�
(1)� (2)� (3)� (4)� (5)� (6)�
1����Pengeluaran�Konsumsi�Rumah�Tangga�������Private�Consumption�Expenditure� 14,32� 13,92� 17,00� 10,19� 16,00�
2����Pengeluaran�Konsumsi�Lembaga�Swasta�Nirbala/Private�Non�Profit�InstitutionConsumption��Expenditure�
13,73� 13,54� 37,21� 10,29� 10,45�
3�����Pengeluaran�Konsumsi�Pemerintah��������Government�Consumption�Expenditure� 15,88� 13,15� 16,60� 21,35� 12,36�
4�����Pembentukan�Modal�Tetap�Domestik�����������Bruto�/�Gross�Domestic�Fixed�Capital��������������Formation��
13,50� 14,15� 18,72� 32,37� 27,30�
5�����Perubahan�Stok��������Change�in�Stock� 12,09� 7,19� 20,62� 23,76� 1,76�
6�����Ekspor�Barang�dan�Jasa��������Export�of�Goods�And�Services� 15,51� 19,67� 20,63� 20,66� 13,85�
7�����Dikurangi�Impor�Barang�dan�Jasa��������Less�Import�of�Goods�and�Services�
26,10� 12,10� 13,14� 28,02� 28,66�
�������Produk��Domestik�Regional�Bruto��������Gross�Domestic�Regional�Product�
13,00� 14,95� 18,75� 15,33� 14,91�
�������Produk��Domestik�Regional�Bruto�Tanpa�������Migas/Gross�Domestic�Regional�Product������Without�Oil�Gas�
13,42� 14,87� 18,65� 15,47� 15,46�
http
://sul
teng
.bps
.go.
id

Pendapatan Regional
478 Sulawesi Tengah Dalam Angka 2014
Tabel�
Table� � 13.14�Laju� Pertumbuhan� PDRB� Penggunaan� Atas� Dasar� Harga� Konstan�2000,�2009–�2013(Persen)�The� Growth� Rate� of� GRDP� � at� 2000� Constant� � Market� Prices� by�Expenditure�Components,�2009–�2013�(Percent)�
��
Penggunaan/Expenditure� 2009� 2010� 2011� 2012*)� 2013**)�
(1)� (2)� (3)� (4)� (5)� (6)�
1����Pengeluaran�Konsumsi�Rumah�Tangga�������Private�Consumption�Expenditure� 7,36� 7,30� 8,34� 7,05� 7,45�
2. ��Pengeluaran�Konsumsi�Lembaga�Swasta���������Nirbala��
Private�Non�Profit�Institution�Consumption����������Expenditure�
6,69� 5,31� 25,24� �0,09� 8,85�
3����Pengeluaran�Konsumsi�Pemerintah�������Government�Consumption�Expenditure� 7,53� 6,98� 4,85� 6,21� 6,51�
4����Pembentukan�Modal�Tetap�Domestik�Bruto�Gross�Domestic�Fixed�Capital�Formation�� 8,15� 7,44� 9,36� 16,69� 18,75�
5����Perubahan�Stok�Change�in�Stock� 7,07� 4,47� 0,30� 10,56� �2,56�
6����Ekspor�Barang�dan�Jasa������������������������������������������Export�of�Goods�And�Services� 5,14� 11,68� 8,91� 13,46� 8,73�
7����Dikurangi�Impor�Barang�dan�Jasa�������Less�Import�of�Goods�and�Services� 3,73� 1,29� 0,42� 11,47� 10,57�
������Produk��Domestik�Regional�Bruto�������Gross�Domestic�Regional�Product� 7,71� 8,74� 9,12� 9,24� 9,38�
�������Produk��Domestik�Regional�Bruto��������Migas/�Gross�Domestic�Regional�Product�������Without�Oil�Gas�
8,00� 8,72� 9,17� 9,42� 9,72�
Catatan/Note�� :�*)� �Angka�Sementara/Preliminary�Figures�
� **)��Angka�Sangat�Sementara/Very�Preliminary�Figures�
http
://sul
teng
.bps
.go.
id

Regional Income
Sulawesi Tengah in Figures 2014 479
Tabel�
Table� � 13.15�Produk� Domestik� Regional� Bruto� Atas� Dasar� Harga� Berlaku� � menurut�Kabupaten/Kota,�2009–�2013(Juta�rupiah)�Gross� Regional� Domestic� Product� at� Current� Market� Prices� by��Regency/City,�2009–�2013(Million�Rupiahs)�
��
Kabupaten/Kota�Regency/City� 2009� 2010� 2011� 2012*)� 2013**)�
(1)� (2)� (3)� (4)� (5)� (6)�� � � �
1� Banggai�Kepulauan� �810�215� �929�211� 1�069�420� 1�219�021� 1�378�832�
2� Banggai� 3�414�639� 4�165�996� 5�136�921� 6�408�927� 8�080�946�
3� Morowali� 1�050�714� 1�374�004� 1�872�326� 2�383�190� 3�061�475�
4� Poso� 1�861�806� 2�141�600� 2�473�430� 2�858�682� 3�305�166�
5� Donggala� 3�224�968� 3�750�271� 4�323�966� 5�033�999� 5�882�456�
6� Tolitoli� 2�341�191� 2�698�243� 3�080�263� 3�540�108� 4�091�982�
7� Buol� 1�139�673� 1�310�312� 1�515�816� 1�760�884� 2�044�676�
8� Parigi�Moutong� 5�514�609� 6�323�281� 7�257�758� 8�319�907� 9�561�013�
9� Tojo�Una�Una� 1�052�828� 1�204�017� 1�385�552� 1�594�645� 1�833�905�
10� Sigi�� 2�763�450� 3�149�313� 3�620�724� 4�177�582� 4�786�689�
11� Banggai�Laut� �492�369� �566�775� �647�746� �736�646� �833�176�
12� Morowali�Utara� 1�931�124� 2�350�004� 2�991�126� 3�609�047� 4�216�086�
13� Palu� 5�332�677� 6�145�475� 7�131�148� 8�283�620� 9�728�261�
Catatan/Note�� :�*)� �Angka�Sementara/Preliminary�Figures�
� **)��Angka�Sangat�Sementara/Very�Preliminary�Figures�� �
http
://sul
teng
.bps
.go.
id

Pendapatan Regional
480 Sulawesi Tengah Dalam Angka 2014
Tabel�
Table� � 13.16�Produk� Domestik� Regional� Bruto� Atas� Dasar� Harga� Konstan� 2000�Menurut��Kabupaten/Kota,��2009–�2013(Juta�rupiah)�Gross� Regional� Domestic� Product� at� 2000� Constant� � Prices� � by�Regency/City,2009–�2013(Million�Rupiahs)��
�
Kabupaten/Kota�Regency/�City� 2009� 2010� 2011� 2012*)� 2013**)�
(1)� (2)� (3)� (4)� (5)� (6)�� � �
1� Banggai�Kepulauan� �420�394� �454�794� �493�165� �534�680� �581�340�
2� Banggai� 1�816�718� 2�048�135� 2�338�635� 2�699�477� 3�155�670�
3� Morowali� �611�528� �692�945� �794�946� �915�840� 1�056�477�
4� Poso� 1�028�969� 1�110�919� 1�201�653� 1�301�575� 1�411�369�
5� Donggala� 1�581�870� 1�701�128� 1�851�076� 2�016�656� 2�198�967�
6� Tolitoli� 1�204�221� 1�301�937� 1�851�076� 2�016�656� 2�198�967�
7� Buol� 609�518� 657�607� �688�544� �745�574� �807�625�
8� Parigi�Moutong� 2�796�098� 3�013�631� 3�248�647� 3�500�942� 3�775�191�
9� Tojo�Una�Una� 461�312� 497�916� �538�173� �581�844� �629�217�
10� Sigi�� 1�485�655� 1�600�642� 1�726�529� 1�861�521� 2�009�651�
11� Banggai�Laut� �255�037� �275�771� �298�673� �323�781� �351�300�
12� Morowali�Utara� 1�045�666� 1�172�288� 1�342�694� 1�538�626� 1�763�372�
13� Palu� 2�546�303� 2�755�931� 3�016�139� 3�305�959� 3�635�395�
Catatan/Note�� :�*)� �Angka�Sementara/Preliminary�Figures�
� **)��Angka�Sangat�Sementara/Very�Preliminary�Figures�
�
http
://sul
teng
.bps
.go.
id
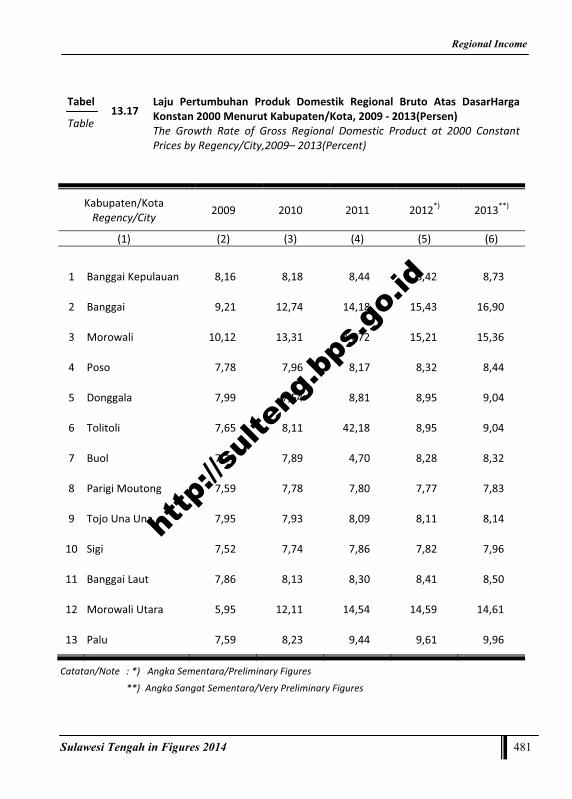
Regional Income
Sulawesi Tengah in Figures 2014 481
Tabel�
Table� � 13.17�Laju� Pertumbuhan� Produk� Domestik� Regional� Bruto� Atas� DasarHarga�Konstan�2000�Menurut�Kabupaten/Kota,�2009���2013(Persen)�The� Growth� Rate� of� Gross� Regional� Domestic� Product� at� 2000� Constant�Prices�by�Regency/City,2009–�2013(Percent)��
�
Catatan/Note�� :�*)� �Angka�Sementara/Preliminary�Figures�
� **)��Angka�Sangat�Sementara/Very�Preliminary�Figures�� �
Kabupaten/Kota�Regency/City� 2009� 2010� 2011� 2012*)� 2013**)�
(1)� (2)� (3)� (4)� (5)� (6)�� � � �
1� Banggai�Kepulauan� 8,16� 8,18� 8,44� 8,42� 8,73�
2� Banggai� 9,21� 12,74� 14,18� 15,43� 16,90�
3� Morowali� 10,12� 13,31� 14,72� 15,21� 15,36�
4� Poso� 7,78� 7,96� 8,17� 8,32� 8,44�
5� Donggala� 7,99� 7,54� 8,81� 8,95� 9,04�
6� Tolitoli� 7,65� 8,11� 42,18� 8,95� 9,04�
7� Buol� 7,31� 7,89� 4,70� 8,28� 8,32�
8� Parigi�Moutong� 7,59� 7,78� 7,80� 7,77� 7,83�
9� Tojo�Una�Una� 7,95� 7,93� 8,09� 8,11� 8,14�
10� Sigi� 7,52� 7,74� 7,86� 7,82� 7,96�
11� Banggai�Laut� 7,86� 8,13� 8,30� 8,41� 8,50�
12� Morowali�Utara� 5,95� 12,11� 14,54� 14,59� 14,61�
13� Palu� 7,59� 8,23� 9,44� 9,61� 9,96�
http
://sul
teng
.bps
.go.
id

Pendapatan Regional
482 Sulawesi Tengah Dalam Angka 2014
Kabupaten/Kota�Regency/City� 2009� 2010� 2011� 2012*)� 2013**)�
(1)� (2)� (3) (4) (5) (6)�
1�� Banggai�Kepulauan� 2,62� 2,57� 2,52� 2,44� 2,34�
2�� Banggai� 11,04� 11,54� 12,09� 12,84� 13,74�
3�� Morowali� 3,40� 3,81� 4,40� 4,77� 5,21�
4�� Poso� 6,02� 5,93� 5,82� 5,73� 5,62�
5�� Donggala� 10,43� 10,39� 10,17� 10,08� 10,00�
6�� Tolitoli� 7,57� 7,47� 7,25� 7,09� 6,96�
7�� Buol� 3,68� 3,63� 3,57� 3,53� 3,48�
8�� Parigi�Moutong� 17,83� 17,51� 17,07� 16,66� 16,26�
9�� Tojo�Una�Una� 3,40� 3,33� 3,26� 3,19� 3,12�
10�� Sigi� 8,93� 8,72� 8,52� 8,37� 8,14�
11� Banggai�Laut� 1,59� 1,57� 1,52� 1,48� 1,42�
12� Morowali�Utara� 6,24� 6,51� 7,04� 7,23� 7,17�
13� Palu� 17,24� 17,02� 16,78� 16,59� 16,54�
� Jumlah�/�Total� 100,00� 100,00� 100,00� 100,00� 100,00�
Catatan/Note�� :�*)� �Angka�Sementara/Preliminary�Figures�
� **)��Angka�Sangat�Sementara/Very�Preliminary�Figures�
�
Tabel�
Table� � 13.18�Distribusi� Persentase� Terhadap� Total� Produk� Domestik� Regional� Bruto�Seluruh�Kabupaten/Kota�Atas�Dasar��Harga�Berlaku,�2009�–�2013(Persen)�Percentage� Distribution� of� Total� Gross� Regional� Domestic� Product�Throughout�Regency/City�at�Current�Market�Prices,�2009�–�2013(Percent)�
http
://sul
teng
.bps
.go.
id

National Comparison
Sulawesi Tengah in Figures 2014 483
PERBANDINGAN NASIONAL
National Comparison
http
://sul
teng
.bps
.go.
id

Perbandingan Nasional
484 Sulawesi Tengah Dalam Angka 2014
http
://sul
teng
.bps
.go.
id

National Comparison
Sulawesi Tengah in Figures 2014 485
14. PERBANDINGAN NASIONAL
Statistik komparatif disajikan untuk memberikan gambaran tentang perbandingan data penting antar-provinsi, seperti inflasi, Indeks Harga Konsumen, jumlah penduduk, Produk Domestik Regional Bruto (PDRB) menurut harga berlaku dan harga konstan, serta jumlah penduduk miskin. Data statistik komparatif bersumber dari Publikasi Statistik Indonesia, Statistik Keuangan Indonesia (BI), serta publikasi-publikasi lainnya.
Inflasi terbesar pada akhir tahun
2013 (kondisi bulan Desember) terjadi di Manado yaitu sebesar 2,69. Sedangkan inflasi terendah terjadi di Padang Sidempuan yang mengalami deflasi sebesar 0,44. Sementara inflasi Kota Palu pada periode yang sama tahun 2013 sebesar 1,14 yang menjadikannya peringkat inflasi ke-11 di antara 66 kota di Indonesia.
Penduduk Sulawesi Tengah hasil
Sensus Penduduk pada tahun 2010 sebesar 2.635.009 jiwa. Dengan jumlah tersebut berarti Provinsi Sulawesi Tengah merupakan urutan kedua puluh tiga di Indonesia dengan laju pertumbuhan penduduk yang cukup besar: 1,95. Data selengkapnya tentang jumlah penduduk di masing-masing propinsi disajikan pada Tabel 14.2.
14. NATIONAL COMPARISON
Comparative statistics are served to describe about comparison some important data of inter-province, such as inflation, consumer price indices, population, Gross Regional Domestic Product (GRDB) at current or constant market prices, and number of poor people. Comparative statistics derived from other publications: Statistical Yearbook of Indonesia, Indonesian Finance Statistic (Indonesian Bank), etc.
The highest inflation at the end of
2013 (condition of December) was took place Manado, which reached 2.69. Meanwhile, the lowest one was in Padang Sidempuan with only 0.44 for deflation. Inflation of Palu City the same period in 2013 was about to 1.14, and it had made this city ranked at number 11 among 66 cities in Indonesia.
Population of Sulawesi Tengah
Province based on Population Census 2010 reached 2,635,009 persons. By this number, Sulawesi Tengah Province ranked at twenty-second position among all provinces in Indonesia, with the significant population growth rate by 1.95. More complete total population for all provinces presented in Table 14.2.
http
://sul
teng
.bps
.go.
id

Perbandingan Nasional
486 Sulawesi Tengah Dalam Angka 2014
http
://sul
teng
.bps
.go.
id

National Comparison
Sulawesi Tengah in Figures 2014 487
14. PERBANDINGAN NASIONAL / NATIONAL COMPARISON
Tabel
Table 14.1 Indeks Harga Konsumen (IHK), Inflasi/Deflasi, Laju Inflasi, dan Peringkat Inflasi 66 Kota di Indonesia, Desember 2013 Consumer Price Indices (CPI), Inflation/Deflation, Inflation Rate, and Rank of Inflation Based on 66 Cities in Indonesia, December 2013
Kota City
IHK CPI
Inflasi/Deflasi Inflation/ Deflation
Laju Inflasi Inflation Rate
(1) (2) (3) (4)
1. MANADO 144,59 2,69 8,12
2. KUPANG 158,28 1,59 8,84
3. GORONTALO 147,46 1,54 5,84
4. AMBON 153,14 1,51 8,81
5. JAYAPURA 143,68 1,48 8,27
6. PALANGKARAYA 154,28 1,47 6,45
7. BALIKPAPAN 156,54 1,31 8,56
8. PANGKAL PINANG 161,83 1,25 8,71
9. PONTIANAK 160,18 1,23 9,48
10. BANJARMASIN 153,49 1,23 6,98
11. PALU 153,12 1,14 7,57
12. SORONG 165,68 1,06 7,93
13. SAMPIT 147,44 1,03 7,25
14. JEMBER 145,66 0,92 7,21
15. PROBOLINGGO 151,77 0,90 7,98
16. MAKASSAR 143,33 0,84 6,24
17. TERNATE 150,25 0,84 9,78
18. JAKARTA 144,27 0,78 8,00
19. MATARAM 160,63 0,77 9,27
20. PARE-PARE 143,26 0,77 6,31
21. SIBOLGA 154,82 0,75 10,08
http
://sul
teng
.bps
.go.
id

Perbandingan Nasional
488 Sulawesi Tengah Dalam Angka 2014
LanjutanTabel / Continued Table14.1
Kota City
IHK CPI
Inflasi/Deflasi Inflation/ Deflation
Laju Inflasi Inflation Rate
(1) (2) (3) (4)
22. BANDA ACEH 135,32 0,71 6,39
23. PADANG 155,39 0,70 10,87
24. BATAM 137,80 0,66 7,81
25. MADIUN 148,57 0,66 7,52
26. TARAKAN 176,52 0,63 10,35
27. TANJUNG PINANG 148,56 0,62 10,09
28. PEMATANG SIANTAR 155,85 0,61 12,02
29. DEPOK 148,18 0,60 10,97
30. SURABAYA 145,19 0,60 7,52
31. SINGKAWANG 149,05 0,59 6,15
32. MALANG 146,64 0,53 7,92
33. PALOPO 149,68 0,52 5,25
34. DENPASAR 146,64 0,49 7,35
35. SUKABUMI 146,07 0,46 8,03
36. JAMBI 151,28 0,40 8,74
37. PEKANBARU 145,49 0,38 8,83
38. KEDIRI 145,44 0,36 8,05
39. BENGKULU 156,50 0,35 9,94
40. SURAKARTA 134,81 0,35 8,32
41. CILEGON 144,59 0,34 7,98
42. BANDUNG 138,82 0,33 7,97
43. BOGOR 146,71 0,32 8,55
44. SUMENEP 142,26 0,31 6,62
45. BEKASI 145,20 0,30 9,46
http
://sul
teng
.bps
.go.
id

National Comparison
Sulawesi Tengah in Figures 2014 489
LanjutanTabel / Continued Table14.1
Kota City
IHK CPI
Inflasi/Deflasi Inflation/ Deflation
Laju Inflasi Inflation Rate
(1) (2) (3) (4)
46. MANOKWARI 157,05 0,30 4,63
47. PURWOKERTO 145,46 0,29 8,50
48. TEGAL 142,05 0,28 5,80
49. SERANG 152,11 0,28 9,16
50. BANDAR LAMPUNG 158,44 0,27 7,56
51. MAMUJU 146,41 0,26 5,91
52. SAMARINDA 159,89 0,24 10,37
53. SEMARANG 145,29 0,21 8,19
54. DUMAI 150,17 0,19 8,60
55. CIREBON 149,78 0,17 7,86
56. YOGYAKARTA 145,65 0,17 7,32
57. MAUMERE 164,85 0,15 6,24
58. TASIKMALAYA 146,33 0,11 6,89
59. WATAMPONE 159,04 0,11 6,86
60. PALEMBANG 142,84 0,04 7,04
61. TANGERANG 149,92 0,04 10,02
62. KENDARI 149,50 -0,05 5,92
63. BIMA 161,42 -0,06 10,42
64. MEDAN 148,79 -0,07 10,09
65. LHOKSEUMAWE 144,56 -0,12 8,27
66. PADANG SIDEMPUAN 147,74 -0,44 7,82
Sumber/Source : Badan Pusat Statistik BPS-Statistics Indonesia
http
://sul
teng
.bps
.go.
id

Perbandingan Nasional
490 Sulawesi Tengah Dalam Angka 2014
Tabel Table 14.2
Jumlah Penduduk menurut Provinsi dan Laju Pertumbuhan Penduduk Population by Province and The Population Growth Rate
1971, 1980, 1990, 2000, 2010 (000 Jiwa/ Persons) [Diolah dari Sensus Penduduk Tahun 1971, 1980, 1990, 2000 and 2010/Population Census 1971, 1980, 1990, 2000 and 2010]
Provinsi/ Province 1971 1980 1990 2000 2010 Laju Pertumbuhan Penduduk/
Population Growth Rate 71-80 80-90 90-00 00-10
(1) (2) (3) (4) (5) (6) (7) (8) (9) (10) 1. DI Aceh 2 009 2 611 3 416 3 931 4 494 2,93 2,72 1,46 1,35 2.Sumatera Utara 6 622 8 361 10 256 11 650 12 982 2,60 2,06 1,32 1,11 3.Sumatera Barat 2 793 3 407 4 000 4 249 4 847 2,21 1,62 0,63 1,34 4.Riau 1 642 2 168 3 304 4 958 5 538 3,11 4,31 4,35 3,59 5.Jambi 1 006 1 446 2 021 2 414 3 092 4,07 3,38 1,84 2,55 6.Sumatera Selatan 3 441 4 630 6 313 6 900 7 450 3,32 3,09 1,28 1,85 7.Bengkulu 519 768 1 179 1 567 1 716 4,39 4,38 2,19 1,66 8.Lampung 2 777 4 625 6 018 6 741 7 608 5,77 2,65 1,17 1,23 9.Kepulauan Riau ... ... ... 900 1 223 ... ... 6,54 4,99 10. Bangka Belitung ... ... ... … 1 679 … … 0,97 3,14 11.DKI Jakarta 4 579 6 503 8 259 8 389 9 608 3,93 2,41 0,17 1,39 12.Jawa Barat 21 624 27 454 35 384 35 730 43 054 2,66 2,57 2,03 1,89 13.Jawa Tengah 21 877 25 373 28 521 31229 32 383 1,64 1,18 0,94 0,37 14.DI Yogyakarta 2 489 2 751 2 913 3 122 3 457 1,10 0,57 0,72 1,02 15.JawaTimur 25 517 29 189 32 504 34 784 37 477 1,49 1,08 0,70 0,76 16.Banten ... ... ... 8 099 10 632 ... ... 3,21 2,79 17.Bali 2 120 2 470 2 778 3 151 3 891 1,69 1,18 1,31 2,15 18.Nusa Tenggara Barat 2 203 2 725 3 370 4 009 4 500 2,36 2,15 1,82 1,17 19.Nusa TenggaraTimur 2 295 2 737 3 269 3 952 4 684 1,95 1,79 1,63 2,06 20.Kalimantan Barat 2 020 2 486 3 229 4 034 4 396 2,31 2,68 2,29 0,91 21.Kalimantan Tengah 702 954 1 396 1 857 2 212 3,43 3,88 2,99 1,74 22.Kalimantan Selatan 1 699 2 065 2 598 2 985 3 627 2,16 2,32 1,45 1,98 23.Kalimantan Timur 734 1 218 1 877 2 455 3 553 5,73 4,42 2,81 3,80 24.Sulawesi Utara 1 718 2 115 2 478 2 012 2 271 2,31 1,60 1,33 1,26 25.Sulawesi Tengah 914 1 285 1 711 2 218 2 635 3,86 2,87 2,57 1,95 26.Sulawesi Selatan 5 184 6 062 6 982 8 060 8 035 1,74 1,42 1,35 1,17 27.Sulawesi Tenggara 714 942 1 350 1 821 2 233 3,09 3,66 3,15 2,07 28.Gorontalo ... ... ... 835 1 040 ... ... 1,59 2,24 29. Sulawesi Barat ... ... ... … 1 159 ... ... 2,70 2,67 30.Maluku 1 090 1 411 1 858 1 206 1 534 2,88 2,78 0,11 2,78 31.Maluku Utara ... ... ... 785 1 038 ... ... 1,60 2,44 32.Papua 923 1 174 1 649 … 760 2,67 3,41 3,44 5,46 33. Papua Barat ... ... ... 2 221 2 833 ... ... 2,55 3,72
Indonesia 119 208 146 935 178 631 206 265 237 641 2,32 1,97 1,45 1,49
http
://sul
teng
.bps
.go.
id

National Comparison
Sulawesi Tengah in Figures 2014 491
Tabel Table 14.3
Luas Daratan dan Kepadatan Penduduk menurut Provinsi di Indonesia, 2010 Area Land and a Density Population in Indonesia, 2010
[Diolah dari Sensus Penduduk 2010 / PopulationCensus, 2010]
Provinsi Province
LuasDaratan Area Land
(Km2)
KepadatanPenduduk Population Density
(Jiwa/Km2) (1) (2) (3)
1. Aceh 57 956,00 77,42 2. Sumatera Utara 72 981,23 177,92 3. Sumatera Barat 42 012,89 115,35 4. Riau 87 023,66 63,70 5. Kepulauan Riau 8201,72 205,44 6. Jambi 50 058,16 61,71 7. Sumatera Selatan 91 592,43 81,29 8. Kepulauan Bangka Belitung 16 424,06 74,46 9. Bengkulu 19 919,33 86,00 10. Lampung 34 623,80 219,39 Sumatera 480 793,28 105,27 11. DKI Jakarta 664,01 14 439,54 12. Jawa Barat 35 377,76 1 216,07 13. Banten 9 662,92 1 101,53 14. Jawa Tengah 32 800,69 987,20 15. DI Yogyakarta 3 133,15 1 101,77 16. JawaTimur 47 799,75 784,02 Jawa 129 438,28 1 055,04 17. Bali 5 780,06 673,18 18. Nusa Tenggara Barat 18 572,32 242,13 19. Nusa Tenggara Timur 4 8718,1 96,04 Bali, Nusa Tenggara 73 070,48 178,83
http
://sul
teng
.bps
.go.
id

Perbandingan Nasional
492 Sulawesi Tengah Dalam Angka 2014
LanjutanTabel / Continued Table 14.3
Provinsi Province
LuasDaratan Area Land
(Km2)
KepadatanPenduduk Population Density
(Jiwa/Km2)
(1) (2) (3)
20. Kalimantan Barat 147 307,00 29,82
21. Kalimantan Tengah 153 564,50 14,35
22. Kalimantan Selatan 38 744,23 93,59
23. Kalimantan Timur 204 534,34 17,36
Kalimantan 544 150,07 25,31
24. Sulawesi Utara 13 851,64 163,59
25. Gorontalo 11 257,07 92,30
26. Sulawesi Tengah 61 841,29 42,58
27. Sulawesi Selatan 46 717,48 171,95
28. Sulawesi Barat 16 787,18 68,98
29. Sulawesi Tenggara 38 067,70 58,61
Sulawesi 188 522,36 92,08
30. Maluku 46 914,03 32,63
31. Maluku Utara 31 982,50 32,39
32. Papua 319 036,05 8,94
33. Papua Barat 97 024,27 7,84
Maluku & Papua 494 956,85 12,49 Indonesia 1910 931,32 124.31
http
://sul
teng
.bps
.go.
id

National Comparison
Sulawesi Tengah in Figures 2014 493
Tabel Table 14.4
PDRB Atas Dasar Harga Berlaku menurut Provinsi GDRP At Current Market Prices by Province
2011 - 2013 (Miliar Rupiah/ Billion Rupiahs)
Provinsi Province 2011 2012*) 2013**)
(1) (2) (3) (4)
1. Nanggroe Aceh Darussalam 87 530 95 074 103 046 2. Sumatra Utara 314 372 351 090 403 933 3. Sumatra Barat 98 967 110 180 127 100 4. Riau 413 706 469 073 522 241 5. Kepulauan Riau 80 238 90 568 100 310 6. Jambi 63 410 72 634 85 558 7. Sumatra Selatan 182 390 206 298 231 683 8. Kep. Bangka Belitung 30 484 34 459 38 935 9 Bengkulu 21 242 24 119 27 388 10. Lampung 127 908 144 639 164 393 Sumatera 1 420 248 1 598 135 1 804 588 1. DKI Jakarta 982 534 1 103 693 1 255 926 2. Jawa Barat 862 235 949 761 1 070 177 3. Banten 192 381 213 198 244 548 4. Jawa Tengah 498 764 556 484 623 750 5. DI Yogyakarta 51 785 57 032 63 690 6. Jawa Timur 884 503 1 001 201 1 136 327 Jawa 3 472 201 3 881 368 4 394 418 1. Bali 74 030 83 943 94 556 2. Nusa Tenggara Barat 49 063 49 680 56 278 3. Nusa Tenggara Timur 31 219 35 248 40 465 Bali dan Nusa Tenggara 154 312 168 872 191 299
http
://sul
teng
.bps
.go.
id

Perbandingan Nasional
494 Sulawesi Tengah Dalam Angka 2014
LanjutanTabel / Continued Table 14.4
Provinsi Province 2011 2012*) 2013**)
(1) (2) (3) (4) 1. Kalimantan Barat 66 916 74 970 84 956 2. Kalimantan Tengah 49 048 55 886 63 515 3. Kalimantan Selatan 68 187 75 894 83 362 4. Kalimantan Timur 391 761 419 507 425 429 Kalimantan 575 911 626 256 657 263 1. Sulawesi Utara 41 831 47 198 53 401 2. Gorontalo 9 154 10 369 11 752 3. Sulawesi Tengah 44 337 51 052 58 641 4. Sulawesi Selatan 137 520 159 860 184 783 5. Sulawesi Barat 12 884 14 408 16 184 6. Sulawesi Tenggara 32 113 36 601 40 773 Sulawesi 277 839 319 487 365 535 1. Maluku 9 599 11 469 13 245 2. Maluku Utara 6 039 6 918 7 725 3. Papua 76 501 77 396 93 137 4. Papua Barat 36 176 43 205 50 909 Maluku dan Papua 128 315 138 988 165 016
Jumlah 33 Provinsi 6 028 827 6 733 106 7 578 119
PDB Indonesia 7 419 187 8 229 439 9 083 972
Catatan/ Note : Perbedaan antara jumlah PDRB 33 provinsi,dan PDB Indonesia antara lain disebabkan oleh perbedaan cakupan dan Diskrepansi Statistik/ Different number of GDRP in 33Provinces and GDP of Indonesia among reasonably due is a different coverage and statistical discrepancy
Sumber / Source : Badan Pusat Statistik, Jakarta 2014 / BPS, Statistics Indonesia, 2014
http
://sul
teng
.bps
.go.
id

National Comparison
Sulawesi Tengah in Figures 2014 495
Tabel Table 14.5
PDRB Atas Dasar Harga Konstan 2000 menurut Provinsi GDRP by Constant Market Prices 2000 by Province
2011 - 2013 (Juta Rupiah/ Million Rupiahs)
Propinsi Province 2011 2012*) 2013**)
(1) (2) (3) (4)
1. Aceh 34 705 36 488 38 013 2. Sumatra Utara 126 588 134 462 142 537 3. Sumatra Barat 41 293 43 926 46 640 4. Riau 102 666 106 299 109 073 5. Kepulauan Riau 43 810 46 797 49 667 6. Jambi 18 964 20 374 21 979 7. Sumatra Selatan 68 008 72 096 76 410 8. Kep. Bangka Belitung 11 593 12 257 12 905 9. Bengkulu 8 879 9 465 10 052 10. Lampung 40 859 43 527 46 123 Sumatera 497 365 525 689 553 400 1. DKI Jakarta 422 242 449 805 477 285 2. Jawa Barat 343 194 364 752 386 839 3. Banten 94 198 99 992 105 856 4. Jawa Tengah 198 270 210 848 223 100 5. DI Yogyakarta 22 132 23 309 24 567 6. Jawa Timur 366 983 393 663 419 428 Jawa 1 447 019 1 542 370 1 637 076 1. Bali 30 758 32 804 34 788 2. Nusa Tenggara Barat 19 533 19 319 20 417 3. Nusa Tenggara Timur 13 252 13 970 14 746 Bali dan Nusa Tenggara 63 543 66 093 69 951
http
://sul
teng
.bps
.go.
id

Perbandingan Nasional
496 Sulawesi Tengah Dalam Angka 2014
LanjutanTabel / Continued Table 14.5
Propinsi Province 2011 2012*) 2013**)
(1) (2) (3) (4)
1. Kalimantan Barat 32 141 34 008 36 075 2. Kalimantan Tengah 20 078 21 420 23 000 3. Kalimantan Selatan 32 553 34 413 36 196 4. Kalimantan Timur 115 490 120 086 121 990 Kalimantan 200 262 209 927 217 261 1. Sulawesi Utara 19 735 21 287 22 872 2. Gorontalo 3 141 3 384 3 647 3. Sulawesi Tengah 19 231 21 008 22 979 4. Sulawesi Selatan 55 094 59 718 64 284 5. Sulawesi Barat 5 233 5 704 6 113 6. Sulawesi Tenggara 12 698 14 020 15 041 Sulawesi 115 133 125 122 134 936 1. Maluku 4 509 4 861 5 111 2. Maluku Utara 3 230 3 446 3 656 3. Papua 21 208 21 436 24 617 4. Papua Barat 11 890 13 780 15 062 Maluku dan Papua 40 837 43 523 48 446 Jumlah 33 Provinsi 2 364 159 2 512 723 2 661 071 PDB Indonesia 2 464 566 2 618 938 2 770 345
Catatan/ Note : Perbedaan antara jumlah PDRB 33 provinsi ,dan PDB Indonesia antara lain disebabkan oleh perbedaan cakupan dan Diskrepansi Statistik/ Different number of GDRP in 33 Provinces and GDP of Indonesia among reasonably due is a different coverage and statistical discrepancy
Sumber / Source : Badan Pusat Statistik, Indonesia 2014/ BPS-Statistics Indonesia, 2014
http
://sul
teng
.bps
.go.
id

National Comparison
Sulawesi Tengah in Figures 2014 497
Tabel Table 14.6
Jumlah Penduduk Miskin dan Persentasenya menurut Provinsi, 2013 Number and Percentage of The Poor People by Province, 2013 (000 jiwa)
Provinsi Province
Jumlah Penduduk Miskin Number of Poor People
Persentase Percentage
(1) (2) (3)
1. Nanggroe Aceh Darussalam 855,71 17,72
2. Sumatera Utara 1390,80 10,39
3. Sumatera Barat 380,63 7,56
4. Riau 522,53 8,42
5. Kepulauan Riau 125,02 6,35
6. Jambi 281,57 8,42
7. Sumatera Selatan 1108,21 14,06
8. Kepulauan Bangka Belitung 70,90 5,25
9. Bengkulu 320,41 17,75
10. Lampung 1134,28 14,39
11. DKI Jakarta 375,70 3,72
12. Jawa Barat 4382,65 9,61
13. Banten 682,71 5,89
14. Jawa Tengah 4704,87 14,44
15. DI Yogyakarta 535,18 15,03
16. Jawa Timur 4865,82 12,73
17. Bali 186,53 4,49
18. Nusa Tenggara Barat 802,45 17,25
19. Nusa Tenggara Timur 1009,15 20,24
http
://sul
teng
.bps
.go.
id

Perbandingan Nasional
498 Sulawesi Tengah Dalam Angka 2014
LanjutanTabel / Continued Table 14.6
Provinsi Province
Jumlah Penduduk Miskin Number of Poor People
Persentase Percentage
(1) (2) (3)
20. Kalimantan Barat 394,17 8,74
21. Kalimantan Tengah 145,36 6,23
22. Kalimantan Selatan 183,27 4,76
23. Kalimantan Timur 255,91 6,38
24. Sulawesi Utara 200,16 8,50
25. Gorontalo 200,97 18,01
26. Sulawesi Tengah 400,09 14,32
27. Sulawesi Selatan 857,45 10,32
28. Sulawesi Barat 154,20 12,23
29. Sulawesi Tenggara 326,71 13,73
30. Maluku 322,51 19,27
31. Maluku Utara 85,82 7,64
32. Papua 1057,98 31,53
33. Papua Barat 234,23 27,14
Indonesia 28 553,93 11,47
Sumber / Source : Badan Pusat Statistik, Indonesia 2014 BPS-Statistics Indonesia, 2014
http
://sul
teng
.bps
.go.
id

National Comparison
Sulawesi Tengah in Figures 2014 499
Tabel Table 14.7
Indeks Pembangunan Manusia menurut Provinsi, 2011-2012 Human Development Index by Province, 2011-2012
Provinsi Province
2011 2012
IPM Rangking IPM Rangking (1) (2) (3) (4) (5)
1. Nanggroe Aceh Darussalam 72,16 18 72,51 19
2. Sumatera Utara 74,65 8 75,13 8
3. Sumatera Barat 74,28 9 74,70 9
4. Riau 76,53 3 76,90 3
5. Jambi 73,30 13 73,78 12
6. Sumatera Selatan 73,42 10 73,99 10
7. Bengkulu 73,40 11 73,93 11
8. Lampung 71,94 20 72,45 20
9. Bangka Belitung 73,37 12 73,78 13
10. Kepulauan Riau 75,78 6 76,20 6
11. DKI Jakarta 77,97 1 78,33 1
12. Jawa Barat 72,73 16 73,11 16
13. Jawa Tengah 72,94 14 73,36 15
14. Yogyakarta 76,32 4 76,75 4
15. Jawa Timur 72,18 17 72,83 17
16. Banten 70,95 23 71,49 23
17. Bali 72,84 15 73,49 14
18. Nusa Tenggara Barat 66,23 32 66,89 32
19. Nusa Tenggara Timur 67,75 31 68,28 31
http
://sul
teng
.bps
.go.
id

Perbandingan Nasional
500 Sulawesi Tengah Dalam Angka 2014
LanjutanTabel / Continued Table 14.7
Provinsi Province
2011 2012
IPM Rangking IPM Rangking (1) (2) (3) (4) (5)
20. Kalimantan Barat 69,66 28 70,31 28
21. Kalimantan Tengah 75,06 7 75,46 7
22. Kalimantan Selatan 70,44 26 71,08 25
23. Kalimantan Timur 76,22 5 76,71 5
24. Sulawesi Utara 76,54 2 76,95 2
25. Sulawesi Tengah 71,62 22 72,14 22
26. Sulawesi Selatan 72,14 19 72,70 18
27. Sulawesi Tenggara 70,55 25 71,05 26
28. Gorontalo 70,82 24 71,31 24
29. Sulawesi Barat 70,11 27 70,73 27
30. Maluku 71,87 21 72,42 21
31. Maluku Utara 69,47 30 69,98 30
32. Papua Barat 69,65 29 70,22 29
33. Papua 65,36 33 65,86 33
Indonesia 72,77 - 73,29 -
Sumber / Source : Badan Pusat Statistik, Indonesia 2014 BPS-Statistics Indonesia, 2014
http
://sul
teng
.bps
.go.
id

http
://sul
teng
.bps
.go.
id

http
://sul
teng
.bps
.go.
id