TLR signaling and effector functions are intact in XLA neutrophils

Subunit Architecture of Intact Protein Complexesfrom Mass Spectrometry and Homology
Modeling†
THOMAS TAVERNER,§ HELENA HERNÁNDEZ,§
MICHAL SHARON,§ BRANDON T. RUOTOLO,§
DIJANA MATAK-VINKOVIC, DAMIEN DEVOS,‡
ROBERT B. RUSSELL,‡ AND CAROL V. ROBINSON*,§§Department of Chemistry, Lensfield Road, University of Cambridge,
Cambridge CB2 1EW, U.K., ‡EMBL, Meyerhofstrasse 1, 69177 Heidelberg, Germany
RECEIVED ON OCTOBER 1, 2007
C O N S P E C T U S
Proteomic studies have yielded detailed lists of protein components. Relatively little is known, however, of interactionsbetween proteins or of their spatial arrangement. To bridge this gap, we are developing a mass spectrometry approach
based on intact protein complexes. By studying intact complexes, we show that we are able to not only determine the stoi-chiometry of all subunits present but also deduce interaction maps and topological arrangements of subunits.
To construct an interaction network, we use tandem mass spectrometry to define peripheral subunits and partial denatur-ation in solution to generate series of subcomplexes. These subcomplexes are subsequently assigned using tandem mass spec-trometry. To facilitate this assignment process, we have developed an iterative search algorithm (SUMMIT) to both assign proteinsubcomplexes and generate protein interaction networks. This software package not only allows us to construct the subunit archi-tecture of protein assemblies but also allows us to explore the limitations and potential of our approach. Using series of hypo-thetical complexes, generated at random from protein assemblies containing between six and fourteen subunits, we highlight thesignificance of tandem mass spectrometry for defining subunits present. We also demonstrate the importance of pairwise inter-actions and the optimal numbers of subcomplexes required to assign networks with up to fourteen subunits.
To illustrate application of our approach, we describe the overall architecture of two endogenous protein assemblies iso-lated from yeast at natural expression levels, the 19S proteasome lid and the RNA exosome. In constructing our models,we did not consider previous electron microscopy images but rather deduced the subunit architecture from series of sub-complexes and our network algorithm. The results show that the proteasome lid complex consists of a bicluster with twotetrameric lobes. The exosome lid, by contrast, is a six-membered ring with three additional bridging subunits that conferstability to the ring and with a large subunit located at the base. Significantly, by combining data from MS and homologymodeling, we were able to construct an atomic model of the yeast exosome.
In summary, the architectural and atomic models of both protein complexes described here have been produced inadvance of high-resolution structural data and as such provide an initial model for testing hypotheses and planning futureexperiments. In the case of the yeast exosome, the atomic model is validated by comparison with the atomic structure fromX-ray diffraction of crystals of the reconstituted human exosome, which is homologous to that of the yeast. Overall there-fore this mass spectrometry and homology modeling approach has given significant insight into the structure of two pre-viously intractable protein complexes and as such has broad application in structural biology.
Vol. 41, No. 5 May 2008 617-627 ACCOUNTS OF CHEMICAL RESEARCH 617Published on the Web 03/04/2008 www.pubs.acs.org/acr10.1021/ar700218q CCC: $40.75 © 2008 American Chemical Society
IntroductionMany cellular processes are performed by stable protein com-
plexes, and recent predictions have estimated that up to 80%
of the yeast proteome exists in complexes with an average of
5.26 proteins.1 Using tandem-affinity purification (TAP) and
mass spectrometry (MS) to identify all proteins associated with
a particular TAP fusion protein, researchers have now puri-
fied several hundred putative complexes from yeast. Com-
mon to all these investigations is the use of standard
proteomics in which individual proteins are separated, typi-
cally on a 1D gel, and mass spectra of tryptic peptides are
used to identify proteins in databases.2 Subsequently com-
plexes are assigned according to the proteins that repeatedly
copurify with a particular TAP fusion protein. Direct contacts
between components however are not established beyond the
level of copurification, and subunit stoichiometry remains
unknown. Consequently an interaction map cannot be gener-
ated, and these data sets are not readily amenable to molec-
ular modeling.
To complement these standard proteomics methods, we
are developing a MS approach in which complexes are iso-
lated from cells and maintained intact throughout analysis. In
this way, complexes retain their overall architecture, enabling
us to establish not only mass spectra of intact complexes with
masses up to one megadalton but also their subunit stoichio-
metry and interaction map. To define the subunit interactions
within a complex, we use chemical cross-linking or perturba-
tion in solution, as well as dissociation in the gas phase to
generate multiple overlapping subcomplexes. Using a soft-
ware package developed in house, we assign the subunit
composition of these subcomplexes and determine the short-
est path network that connects all subunits. To validate this
approach and demonstrate the use of our software during var-
ious stages, we have used two complexes isolated from yeast,
the 19S proteasome lid and the RNA exosome. Without
recourse to known structural features and based on the inter-
action maps generated here, we extend our analysis by con-
sidering the location of homologous subunits. This enables us
to refine previous models3,4 and to generate the first atomic
model for the yeast RNA exosome.
A 3D Proteomics ApproachA brief outline of the approach taken in our analysis is shown
(Figure 1). The complex of interest is isolated via an affinity
purification of a tagged protein, typically either a His-tagged
or TAP-tagged subunit (step 1).5 The complex-containing solu-
tion is divided into three aliquots; two aliquots are used for
identifying subunits and determining the masses of the intact
subunits (∼4 pmol in total) and one for definition of the mass
of the intact complex and generation of subcomplexes (∼20
pmol total). The subunit identity is determined using standard
proteomics methods, typically polyacrylamide gel electro-
phoresis and sequencing of tryptic peptides from excised
bands (step 2).6 The masses of the intact subunits are then
determined (step 3) by recording a mass spectrum either at
low pH or in the presence of organic solvents, conditions that
denature the individual subunits. This is important since many
proteins are extensively post-translationally modified.7,8 The
third aliquot is exchanged into a buffer compatible with elec-
trospray in which the native state of the complex is main-
tained in solution (step 4).9 Careful control of the conditions
within the spectrometer is required to record a mass spec-
trum of the intact complex. This establishes the overall mass
of the complex as well as the existence of substoichiometric
interactors.
The next stage is to actively generate multiple overlapping
subcomplexes (step 5) either (i) by denaturing after chemical
cross-linking, (ii) by adding subdenaturing concentrations of
mild denaturants, (iii) by changing the ionic strength of com-
plex-containing solutions, or (iv) by dissociation of activated
complexes in the gas phase. Cross-linked complexes are sep-
arated on a denaturing gel, and cross-linked subunits are iden-
tified using standard proteomics methods.10 The addition of
subdenaturing concentrations of organic solvents disrupts
hydrophobic interfaces and consequently generates additional
subcomplexes in solution. Similarly, changes in ionic strength
can induce subcomplexes. Dissociation in the gas phase is
used to assign subcomplexes generated in solution.
The gas-phase dissociation process involves unfolding of a
peripheral subunit, released from the complex as a highly
charged individual protein subunit.11 Concomitantly, “stripped”
complexes are formed with lower charge than the original
complex. Practically therefore this dissociation process enables
identification of at least one protein subunit. The activation of
complexes in the gas phase also aids removal of associated
water or buffer molecules and consequently increases the
accuracy of the mass measurement over those of inactivated
complexes.12 As a final check on consistency, both masses
and charges of the monomeric subunits expelled and the
stripped complexes formed sum to the mass and charge of the
original ion isolated for tandem MS. We also use this gas-
phase dissociation process to determine the relative position
of subunits, reasoning that peripheral subunits dissociate pref-
erentially to those that make up the core.11,13 Our assump-
tions are that accessibility plays a key role in determining the
leaving subunit. We reason that unfolding of a core subunit is
Subunit Architecture of Intact Protein Complexes Taverner et al.
618 ACCOUNTS OF CHEMICAL RESEARCH 617-627 May 2008 Vol. 41, No. 5

FIGURE 1. Flowchart describing the steps taken and approximate quantities of protein complex consumed and illustrated with data fromthe two examples described here. The complex of interest is isolated via an affinity tag and column chromatography (step 1). The subunitcomposition of the complex is determined using gel electrophoresis followed by tryptic digestion and MALDI TOF/TOF analysis and isillustrated for the 19S proteasome lid with peptides derived from the subunit Rpn3 (circled, step 2). A C4 ZipTip was used to exchange thecomplex into a low pH solution, and a spectrum of the denatured proteasome lid was used to determine the masses of intact subunits (step3). After buffer exchange into ammonium acetate (10–1000 mM), a spectrum of the intact complex is recorded (step 4). Series A and B areassigned to the intact 10-component complex (in this case, the 400 kDa yeast exosome) and to substoichiometric binding of components,respectively. Denaturants were used to disrupt the hydrophobic core of the exosome generating a heterotrimer confirmed by tandem MS(step 5). To assign subcomplexes, masses of subunits together with their stoichiometry are submitted to SUMMIT, and the search engine isused to define possible compositions within a defined error (step 6). This list of subcomplexes is then submitted to SUMMIT fordetermination of an interaction network (step 7) in which the area of each subunit is scaled according to its mass and the connections areweighted according to the number of times they occur within the various networks. Red lines denote a weighted average of 1 implying thatthey are present in all network solutions. From this network, a 3D model for the subunit architecture may be generated (step 8), and giventhe availability of homologous protein structures in databases, an atomic model may be derived (step 9).
Subunit Architecture of Intact Protein Complexes Taverner et al.
Vol. 41, No. 5 May 2008 617-627 ACCOUNTS OF CHEMICAL RESEARCH 619

highly unlikely since it will be stabilized by many noncova-
lent interactions. Our second assumption is that the activated
complex retains it solution-phase subunit connectivity. Both of
these assumptions are supported by a wealth of experimen-
tal data.14
The subunit composition of the subcomplexes generated,
either in solution or in gas phases, is assigned using our soft-
ware package SUMMIT (summing masses for interaction topol-
ogy, step 6). The algorithm used to perform this task involves
an exhaustive search for masses that sum to the target mass
over all allowed stoichiometries within a given error range
(Figure 2A). The output of this routine is a list of subcomplexes
that can be used to build an interaction network using man-
ual methods. However it is difficult to rule out the existence
of all possible networks compatible with the subcomplexes
observed. We have developed a network inference algorithm
FIGURE 2. Flow diagram depicting the various stages in SUMMIT and investigation of the mass accuracy and number of subcomplexesrequired for our method. A list of known subunits and observed masses, together with any limiting information about their stoichiometryand tolerance in mass measurement, is submitted (panel A). A recursive algorithm defines their composition and lists all acceptable proteincomplexes, which are then submitted to the network algorithm. Subcomplexes are then deconstructed to generate common building blocks.Interactions between the building blocks are generated and examined for consistency with experimental data. Potential interaction networksare stored and refined by randomly switching and deleting interactions within and between networks. The output is an interaction networkwith connections displayed as weighted averages. To explore the mass accuracy required for our method, unique complexes, dimers (0),trimers (4) and tetramers (O), were selected at random from 100 complexes containing 6–14 subunits of unknown composition, submittedto SUMMIT, and plotted as a function of mass error (%) (panel B). Similarly tetramers with unique masses (%) selected from the 100complexes when the overall subunit composition of the 10-mer is established (gray circles), together with one subunit identified fromtandem MS (b), are plotted (panel B). To examine the number of complexes required to define interactions within a ring, a plot ofconnections identified (%) as a function of the number of subcomplexes submitted to SUMMIT is shown (panel C). Error bars represent thevariance among five trials. A full description of the program is given in the Supporting Information.
Subunit Architecture of Intact Protein Complexes Taverner et al.
620 ACCOUNTS OF CHEMICAL RESEARCH 617-627 May 2008 Vol. 41, No. 5

capable of considering all possible solutions (also contained
within SUMMIT, step 7). Taking a simplified approach, ignor-
ing the 3D aspect of protein complexes and deconstructing
complexes into their smallest possible protein building blocks,
we then generate all viable interactions between these build-
ing blocks. Subsequently, we order according to the number
of connections in each network. Our rationale is simply par-
simony, that the simplest description of the contact network
between proteins is most likely the correct one.
Defining the Limits of Our Approach
(i) Assigning Subcomplexes from Their Masses. One ques-
tion that arises is how accurate do masses have to be to
define the composition of a particular subcomplex? We use
SUMMIT to investigate how mass accuracy and knowledge of
the subunit composition affect our ability to define an over-
all topology map.
We created 100 hypothetical protein complexes, composed
of between six and fourteen subunits, with a uniform distri-
bution of masses from 10 to 50 kDa and generated sets of
100 protein dimers, trimers, or tetramers from these com-
plexes. These were submitted to SUMMIT, and the number of
unique masses within a given error limit for the different oli-
gomers was recorded (Figure 2B). Errors of ∼1% are typical for
hetero-oligomeric complexes of up to 1 MDa from mass mea-
surement alone.12 The results show that within these error
limits no tetramers and <16% and >70% of trimers and
dimers, respectively, have unique masses. We can conclude
therefore that it is not possible, in general, to assign subcom-
plexes with more than three subunits from intact mass alone.
To mimic the situation encountered in our method, we
then considered 100 randomly generated tetramers exam-
ined in a tandem MS experiment. From this experiment, it is
possible to achieve mass measurement errors that are much
lower than those from mass spectra alone (typically 0.1%).
Within this limit and given the masses and stoichiometry of all
the subunits within the parent complex (e.g., from spectra of
the denatured and intact protein complexes, respectively), we
find that this restriction enables us to define ∼55% of tetram-
ers within an error limit of 0.1%. Knowledge of the overall
subunit composition and identification of one component
within the tetramer, from a tandem MS experiment, increases
our definition further such that it is possible to assign >83%
of tetramers. These examples highlight the necessity for tan-
dem MS for assigning one component and reducing errors in
mass measurement.
(ii) Numbers of Subcomplexes. To examine the mini-
mum numbers of subcomplexes required to define interac-
tions, we performed a series of experiments on networks of
proteins. Two 10-mer complexes were considered: (i) a ring
similar to the arrangement of the yeast exosome4 but with
seven subunits in the ring rather than six and three periph-
eral subunits connected to the outside of the ring and (ii) a
bicluster, similar to the arrangement of the yeast 19S protea-
some lid,3 with two clusters of four or five subunits. We tested
the ability of the algorithm to determine subunit contacts by
randomly generating six to fourteen dimers, trimers, or tet-
ramers from each decamer and inputting these subcomplexes
into our network inference algorithm. Interactions with
weighted averages greater than 0.5 present in the original
complex were recorded (see Supporting Information). Similar
results were obtained for the bicluster (data not shown) and
the ring complex (Figure 2C). Interestingly tetrameric subcom-
plexes allow only ∼75% accuracy at most, and increasing the
number of tetramers above 12 does not improve the num-
ber of correct interactions determined. By contrast 13 dimers
enable complete prediction of all interactions of the ten pro-
teins in the ring complex. Together, these results demonstrate
that dimers are most readily assigned via tandem MS and
mass measurement and also the most informative for defin-
ing network connections.
To explore the use of the assignment and network algo-
rithms during the various stages of analyses, we apply our
approach to two endogenous yeast complexes isolated at nat-
ural expression levels. Although there is evidence for topo-
logical features within the two complexes selected, the 19S
proteasome lid and the exosome consist of a bicluster15 and
a ring,16 respectively, we did not include this knowledge in
our analyses.
An Interaction Network for the 19SProteasome LidAfter isolation of the 19S proteasome lid complex via a His-
tagged Rpn11 subunit, the composition of the complex was
validated using standard proteomics methods, and the sub-
unit masses were established from a denatured spectrum.3 A
further aliquot was equilibrated in volatile buffer prior to anal-
ysis of the intact complex. The mass determined for the intact
complex is consistent with a single copy of each of the nine
subunits as well as the existence of substoichiometric bind-
ing of Rpn6 and a subcomplex consisting of four proteins (Fig-
ure 3A). Tandem MS showed that Rpn6, -9, and -12 dissociate
readily from the complex. From the overall mass of the tet-
rameric subcomplex, there are two possible tetramers contain-
ing either Rpn5, -6, -8, and -9 or Rpn3, -7, -9, and -12 within
an acceptable mass error (0.18%). To distinguish these pos-
Subunit Architecture of Intact Protein Complexes Taverner et al.
Vol. 41, No. 5 May 2008 617-627 ACCOUNTS OF CHEMICAL RESEARCH 621

sibilities, we carried out tandem MS. Results showed that
Rpn5, -6, or -9 could be dissociated readily from the com-
plex, confirming that the complex has the composition Rpn5,
-6, -9, and -8 and that Rpn5, -6, and -9 are peripheral. The
interaction network produced from this data set using SUM-
MIT shows that we cannot define the location of Rpn3, -7, or
-11 or Sem1 but that Rpn6, -5, and -9 occupy peripheral loca-
tions with Rpn8 at the center of the subcomplex (Figure 3A).
To supplement this information, we used a chemical cross-
linking strategy.10 After incubation with chemical cross-linker
bis(sulphosuccinimidyl)suberate (BS3) and separation of cross-
linked subunits on a 1D gel, tryptic peptides enabled us to
define six different subcomplexes. In this approach, neighbor-
ing subunits are identified through comigration of cross-linked
proteins and not from cross-linked peptides. Consequently
binding sites within subunits are not defined, but additional
subcomplexes can be characterized. The interaction network
deduced from cross-linking demonstrates high-confidence
interactions between Rpn3, -5, and -7 and Sem1 (all with
weighted averages g0.5). Combining both data sets gives a
total of 14 subcomplexes (6 from cross-linking and 8 from MS
alone). Submitting these to SUMMIT yields a network in which
7 of the 9 proteins are located with high confidence (Figure
3B). The only exceptions are subunit Rpn11, which can inter-
act with either Rpn3, -5, or -8, and subunit Rpn12, which is
readily lost from the complex.
Previously, to define the locations of Rpn11 and -12, we
supplemented our model3 with data from yeast two-hybrid
FIGURE 3. MS of the intact 19S proteasome lid, together with interaction networks generated during the analyses and the final modelproposed from duplication of a tetrameric cluster. The mass spectrum of the intact lid (right-hand side) shows a major charge state series(43+ to 48+) and a second series assigned to an intact complex in which Rpn6 is absent (labeled /) (panel A). A subcomplex, charge stateseries (32+ to 35+), is assigned to a tetramer containing Rpn5, -6, -8, and -9. Tandem MS of the 47+ charge state gives rise to individualsubunits at low m/z (not shown) and stripped complexes between 10 000 and 18 000 m/z (left-hand side, panel A). These are assigned tocomplexes in which a single subunit has been expelled, either Rpn6, -9, or -12. From this tandem MS and that of the tetrameric subcomplex,we can generate a network that defines the peripheral subunits Rpn 5, -6, -9, and -12 and locates interactions between Rpn5 and -8 withinthe tetrameric subcomplex. Red lines indicate a weighted average >0.8. Four of the subunits are clustered together within the network (Rpn3, -7, and -11 and Sem1) and cross-linking defined their interactions. Combining both data sets leads to the overall interaction network(panel B) in which interactions of 7 of the 9 subunits are placed with high confidence. Considering homologous subunits suggests that thiscomplex may have evolved via duplication of two homologous structural lobes (panel C). Rotation to form a face-to-face conformation andinteractions with Sem1, defined by cross-linking, and Rpn10, taken from yeast two-hybrid analyses,17 complete our 3D model.
Subunit Architecture of Intact Protein Complexes Taverner et al.
622 ACCOUNTS OF CHEMICAL RESEARCH 617-627 May 2008 Vol. 41, No. 5

analyses.17 An alternative approach is to consider the com-
plex in terms of homologous subunits. Initially, we predicted
the fold types by sequence comparison methods. Eight of the
nine subunits share considerable homology. Rpn8 and -11
contain metalloproteinase domains, while Rpn3, -5, -6, -7, -9,
and -12 contain R-solenoid and W-helix motifs, often involved
in protein–protein interactions. Sem1, the smallest subunit,
shows no homology to proteins of known structure. Based on
this consideration, the subcomplex Rpn5, -6, -8, and -9 iden-
tified in the MS experiments would form one structural lobe
of the complex with Rpn8 occupying the central position. The
other structural lobe would comprise Rpn3, -7, -11, and -12,
in which Rpn11, the active subunit of the lid, occupies a cen-
tral position analogous to that occupied Rpn8. We construct
a homology-based model by rotating by 180° the subcom-
plex containing Rpn8, thus enabling interactions between
Rpn3 and Rpn5, identified by cross-linking. To complete our
model, we place the small nonhomologous subunit Sem1 in
contact with Rpn3 and -7 as defined by cross-linking (Figure
3C). To orient the lid on the base of the regulatory particle, we
place Rpn9 and -12 adjacent to Rpn10 from yeast two-hy-
brid analyses17 (Rpn10 was not present in our preparation).
This model satisfies all of the interactions found in our
topological map and the majority of the features proposed in
our previous model. The major difference is in the location of
Rpn11. In the symmetrical model, proposed here, Rpn11 con-
nects Rpn3, -7, and -12. These interactions are not supported
by yeast two-hybrid analyses or found in our MS analyses.
However, given the prevalence of duplication inside protein
complexes, such a model is satisfying from an evolutionary
standpoint. Recent studies have demonstrated that about 30%
of complexes determined by large-scale proteomics studies or
structural biology approaches contain subunit duplications,18,19
suggesting a prominent role for such events in complex evo-
lution.20 Interestingly in this model, proteins of a similar mass
occupy analogous positions further supporting their origin via
duplication. Overall, this example illustrates how an incom-
plete interaction map can be supplemented by knowledge of
homologous subunits enabling the definition of the 3D sub-
unit architecture, even though the molecular details of the
interactions cannot be predicted by homology.
The Subunit Architecture of the YeastExosomeIsolation of the cytoplasmic form of the yeast exosome com-
plex was carried out using three different TAP-fusion proteins
(Dis3, Csl4, and Rrp41). Standard proteomics confirmed the
presence of all 10 subunits, and the mass of the intact com-
plex was consistent with each of the subunits being present as
a single copy within the complex. Initially, we used tandem
MS of the intact complex to reveal at least six different sub-
complexes, many related by losses of the same subunit (Fig-
ure 4a-f, shaded gray). The interaction network generated
from this data set suggests that five of the ten subunits are
labile in the gas phase. The remaining subunits are not
released, implying that they are located in the core.
To define the remaining interactions, we used subdenatur-
ing concentrations of organic solvents. Under these conditions,
three pairwise dimers (i-iii) were formed, as well as subcom-
plexes in which core subunits had been displaced in solution
(viii–xiii). In total, 13 subcomplexes were submitted to SUM-
MIT (Figure 3 blue-shaded). From the interaction network gen-
erated from this data set, we find that interactions with Csl4
and Rrp4, both lost readily in the gas phase, are not well
defined but that pairwise dimers enable definition of four
interactions with high confidence.
If we combine the two data sets, using in total all 21 sub-
complexes shown in Figure 4, we obtain the overall interac-
tion map (panel C). This network differs from that published4
since previously we used only those confirmed by tandem MS
and constrained our solution to the ring topology defined by
EM. Here we wanted to explore the use of the network in
determining unknown topological features and found that we
are able to define eight high-confidence interactions (weighted
averages g0.5). From this network, we can place the three
peripheral proteins (Csl4, Rrp4, and Rrp40), which make com-
mon interactions with Rrp43, Rrp42/41, and Rrp45/46,
respectively, such that they bridge the interactions between
the heterodimers. Dis3, the largest subunit, interacts with
Rrp45/41 and is placed on the opposite face to the bridging
subunits, from spatial constraints, allowing us to construct our
final model.
Homology Modeling of the Yeast Exosomeand Proteasome LidWe aligned the yeast exosome and 19S lid proteins to those
of known structure using the HHSearch suite with default
parameters.21 It was not possible to build a model of the 19S
lid due to the absence of homologous proteins of known
atomic structure. For the exosome, homology models for each
protein subunit were obtained separately using Modeller with
default parameters.22 With these settings, models are opti-
mized with the variable target function method with conju-
gate gradients. We did not attempt to increase the quality of
individual subunit models by modeling them together, mini-
mization, or molecular dynamics because the majority of prior
Subunit Architecture of Intact Protein Complexes Taverner et al.
Vol. 41, No. 5 May 2008 617-627 ACCOUNTS OF CHEMICAL RESEARCH 623

research and assessment suggests that this has little effect on
the quality of the model and can make models worse.23 We
found suitable templates for the three KH/S1RNA binding sub-
units of the exosome (Csl4, 80–292, 73% of the sequence;
RRP4, 52–273, 62%; RRP40, 1–237, 99%) and the six RNase
PH domain subunits (MTR3, 11–249, 96%; RRP41, 23–245,
91%; RRP46, 2–219, 98%; RRP45, 6–304, 98%; RRP43,
17–393, 96%; RRP42, 2–264, 99%). Note that models nor-
FIGURE 4. MS and subcomplexes of the yeast exosome, isolated using different tagged subunits. Spectra of the exosome subcomplexes aregenerated by gas-phase dissociation or disruption in solution (left- and right-hand panels, respectively). Subcomplexes generated in solution(blue) and gas phases (gray) are grouped if common subunit losses occur. The interaction network generated from the complexes formed inthe gas phase defines the labile, peripheral proteins (panel A). High-confidence interactions for the pairwise dimers and the peripheralprotein Rrp40 are seen in the network generated from the solution-phase data set (panel B). Incorporating both data sets leads to high-confidence interactions for the pairwise dimers, the peripheral protein Rrp40, and the ring connections, the only exception being theconnection between Rrp43 and Mtr3, which is below 0.5. The peripheral proteins Csl4 and Rrp4 make fewer common interactions, butsymmetry and stability of interactions around the ring imply that these subunits bridge interactions between the remaining heterodimers.Due to space constraints, we place Dis3 (gray) on the opposite face of the ring to produce our final 3D model.
Subunit Architecture of Intact Protein Complexes Taverner et al.
624 ACCOUNTS OF CHEMICAL RESEARCH 617-627 May 2008 Vol. 41, No. 5
mally constitute a fraction of the protein. Models of the pro-
teins were superimposed on the structure of the archaeal
exosome (PDB code 2ba0), using the Stamp package.24
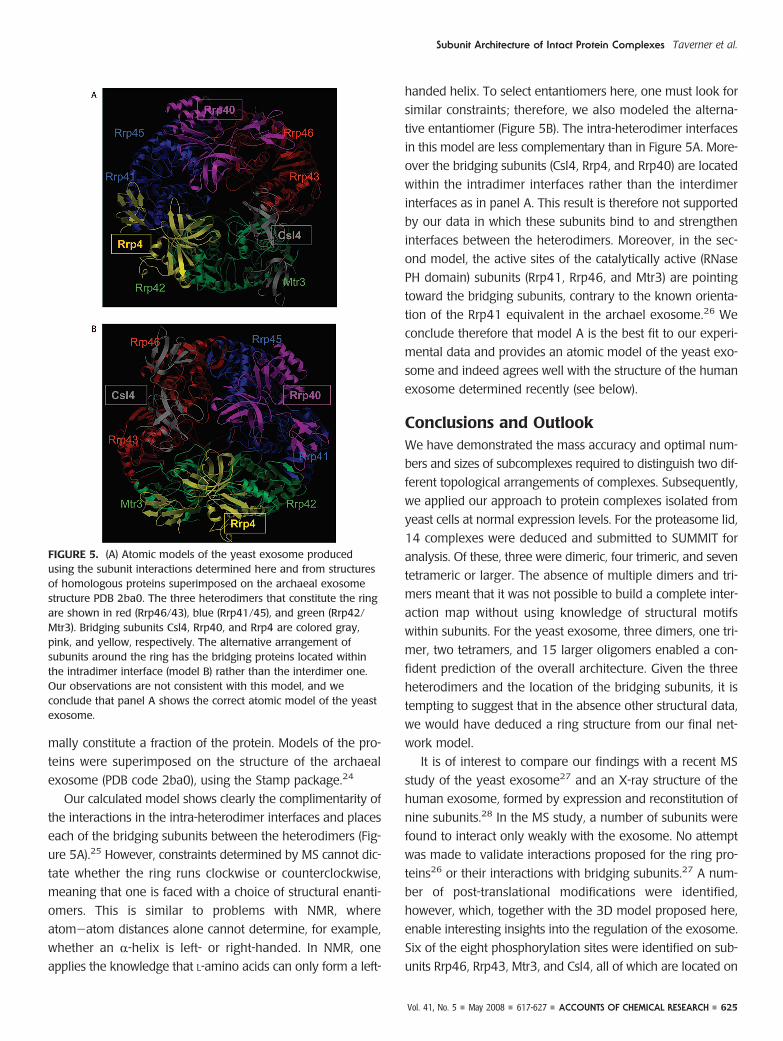
Our calculated model shows clearly the complimentarity of
the interactions in the intra-heterodimer interfaces and places
each of the bridging subunits between the heterodimers (Fig-
ure 5A).25 However, constraints determined by MS cannot dic-
tate whether the ring runs clockwise or counterclockwise,
meaning that one is faced with a choice of structural enanti-
omers. This is similar to problems with NMR, where
atom-atom distances alone cannot determine, for example,
whether an R-helix is left- or right-handed. In NMR, one
applies the knowledge that L-amino acids can only form a left-
handed helix. To select entantiomers here, one must look for
similar constraints; therefore, we also modeled the alterna-
tive entantiomer (Figure 5B). The intra-heterodimer interfaces
in this model are less complementary than in Figure 5A. More-
over the bridging subunits (Csl4, Rrp4, and Rrp40) are located
within the intradimer interfaces rather than the interdimer
interfaces as in panel A. This result is therefore not supported
by our data in which these subunits bind to and strengthen
interfaces between the heterodimers. Moreover, in the sec-
ond model, the active sites of the catalytically active (RNase
PH domain) subunits (Rrp41, Rrp46, and Mtr3) are pointing
toward the bridging subunits, contrary to the known orienta-
tion of the Rrp41 equivalent in the archael exosome.26 We
conclude therefore that model A is the best fit to our experi-
mental data and provides an atomic model of the yeast exo-
some and indeed agrees well with the structure of the human
exosome determined recently (see below).
Conclusions and OutlookWe have demonstrated the mass accuracy and optimal num-
bers and sizes of subcomplexes required to distinguish two dif-
ferent topological arrangements of complexes. Subsequently,
we applied our approach to protein complexes isolated from
yeast cells at normal expression levels. For the proteasome lid,
14 complexes were deduced and submitted to SUMMIT for
analysis. Of these, three were dimeric, four trimeric, and seven
tetrameric or larger. The absence of multiple dimers and tri-
mers meant that it was not possible to build a complete inter-
action map without using knowledge of structural motifs
within subunits. For the yeast exosome, three dimers, one tri-
mer, two tetramers, and 15 larger oligomers enabled a con-
fident prediction of the overall architecture. Given the three
heterodimers and the location of the bridging subunits, it is
tempting to suggest that in the absence other structural data,
we would have deduced a ring structure from our final net-
work model.
It is of interest to compare our findings with a recent MS
study of the yeast exosome27 and an X-ray structure of the
human exosome, formed by expression and reconstitution of
nine subunits.28 In the MS study, a number of subunits were
found to interact only weakly with the exosome. No attempt
was made to validate interactions proposed for the ring pro-
teins26 or their interactions with bridging subunits.27 A num-
ber of post-translational modifications were identified,
however, which, together with the 3D model proposed here,
enable interesting insights into the regulation of the exosome.
Six of the eight phosphorylation sites were identified on sub-
units Rrp46, Rrp43, Mtr3, and Csl4, all of which are located on
FIGURE 5. (A) Atomic models of the yeast exosome producedusing the subunit interactions determined here and from structuresof homologous proteins superimposed on the archaeal exosomestructure PDB 2ba0. The three heterodimers that constitute the ringare shown in red (Rrp46/43), blue (Rrp41/45), and green (Rrp42/Mtr3). Bridging subunits Csl4, Rrp40, and Rrp4 are colored gray,pink, and yellow, respectively. The alternative arrangement ofsubunits around the ring has the bridging proteins located withinthe intradimer interface (model B) rather than the interdimer one.Our observations are not consistent with this model, and weconclude that panel A shows the correct atomic model of the yeastexosome.
Subunit Architecture of Intact Protein Complexes Taverner et al.
Vol. 41, No. 5 May 2008 617-627 ACCOUNTS OF CHEMICAL RESEARCH 625

the labile side of the ring. This implies a possible role for phos-
phorylation in regulating interactions between these subunits.
It is also of interest to compare the X-ray structure of the
reconstituted human exosome with our model for the in vivocytoplasmic form of the yeast exosome. The location of each
homologous subunit is identical in our atomic model, and the
structure is determined crystallographically (see Supporting
Information). Minor differences are observed in some of the
loops that are less structured in the model than in the X-ray
structure. Similarly the C-terminal helices are shorter in the
model than in the structure, because the model constitutes
only a percentage of the protein sequence. Overall, however,
interfaces within the ring and overall structural features are
extremely well-conserved between the model and the X-ray
structure.
Our model allows us to rationalize our experimental obser-
vations. The action of mild denaturants on the exosome can
be explained since the surface areas of interaction are appre-
ciably larger between the dimeric interfaces that are retained
compared with those that are disrupted. Moreover the rela-
tively low surface area of interaction calculated for Csl4 (682
Å2) compared with those of the other bridging proteins Rrp40
(1292 Å2) and Rrp4 (1106 Å2) explains the absence of Csl4 in
a large number of solution and gas-phase complexes of the
yeast exosome.
In summary, this MS approach, together with the software
designed to support it, holds promise for a variety of pro-
teomic investigations. It can be used either as a stand-alone
tool or in conjunction with bioinformatics and modeling to
generate 3D architectures or even atomic models of protein
complexes. This approach therefore advances current descrip-
tions of complexes bringing to these lists of interactors the
overall stoichiometry and presence of substoichiometric inter-
actors, as well as interaction networks and subunit architec-
ture. Importantly the close similarity between the X-ray
structure of the human exosome and the atomic model of the
yeast exosome demonstrates the potential for determining
atomic models of in vivo complexes in advance of high-reso-
lution structural data.
We acknowledge financial support from the EU 3D repertoire,
BBSRC, Waters Kundert Trust, and the Royal Society. We thank
Andrzej Dziembowski and Bertrand Séraphin for the exosome
and Xavier I. Ambroggio and Raymond J. Deshaies for the 19S
proteasome lid.
Supporting Information Available. A full description of the
SUMMIT program and additional figures showing the compar-
ison of the human exosome structure and the model of the
yeast exosome. This material is available free of charge via
the Internet at http://pubs.acs.org.
BIOGRAPHICAL INFORMATION
Tom Taverner graduated from Melbourne, Australia, andobtained his Ph.D. from Cambridge, U.K. He is currently a post-doctoral researcher at Stanford University, California.
Helena Hernández obtained her B.Sc. and Ph.D. from the Uni-versity of Wales. She is currently a research associate at the Uni-versity of Cambridge.
Michal Sharon received her first degree from the Hebrew Uni-versity of Jerusalem and her Ph.D. at the Weizmann Institute ofScience. After a postdoctoral research fellowship at Cambridge,she joined the Weizmnan Institute of Science as a senior lecturer.
Brandon T. Ruotolo obtained his B.Sc. in Chemistry from SaintLouis University in 1999 and his Ph.D from Texas A&M Univer-sity in 2004. He is currently a research associate at the Univer-sity of Cambridge.
Dijana-Matak Vinkovic received her Ph.D. in Protein Crystallog-raphy from University of Zagreb. She is currently a Research Asso-ciate at Cambridge University.
Damien Devos obtained his Ph.D. from Madrid, Spain. After post-doctoral research at the Rockefeller, NY, and UC San Francisco,CA, he is now staff at EMBL, Heidelberg, Germany.
Robert Russell obtained his Ph.D. from Oxford, U.K. After a stayat SmithKline Beecham, he is now group leader at EMBL, Heidel-berg, Germany.
Carol Robinson obtained her Ph.D. from the University of Cam-bridge and is currently Professor of Chemical Biology in theDepartment of Chemistry at Cambridge.
FOOTNOTES†This paper is dedicated to the late Dr. David Taverner (October 12, 1951 - February 11,2008), the father of Thomas Taverner. As head of General Medicine at the Royal Ade-laide Hospital his dedication to his work, patients, teaching and research, as well as hisgenerous, gentle and modest spirit, inspired T.T. to pursue science.
REFERENCES1 Gavin, A. C.; Aloy, P.; Grandi, P.; Krause, R.; Boesche, M.; Marzioch, M.; Rau, C.;
Jensen, L. J.; Bastuck, S.; Dumpelfeld, B.; Edelmann, A.; Heurtier, M. A.; Hoffman,V.; Hoefert, C.; Klein, K.; Hudak, M.; Michon, A. M.; Schelder, M.; Schirle, M.;Remor, M.; Rudi, T.; Hooper, S.; Bauer, A.; Bouwmeester, T.; Casari, G.; Drewes,G.; Neubauer, G.; Rick, J. M.; Kuster, B.; Bork, P.; Russell, R. B.; Superti-Furga, G.Proteome survey reveals modularity of the yeast cell machinery. Nature 2006, 440,631–636.
2 Aebersold, R.; Mann, M. Mass spectrometry-based proteomics. Nature 2003, 422(6928), 198–207.
3 Sharon, M.; Taverner, T.; Ambroggio, X. I.; Deshaies, R. J.; Robinson, C. V.Structural organization of the 19S proteasome lid - insights from MS of intactcomplexes. PLoS Biol. 2006, 4, 1314–1323.
4 Hernandez, H.; Dziembowski, A.; Taverner, T.; Seraphin, B.; Robinson, C. V. Subunitarchitecture of multimeric complexes isolated directly from cells. EMBO Rep. 2006,7 (6), 605–610.
5 Rigaut, G.; Shevchenko, A.; Rutz, B.; Wilm, M.; Mann, M.; Seraphin, B. A genericprotein purification method for protein complex characterization and proteomeexploration. Nat. Biotechnol. 1999, 17 (10), 1030–1032.
6 Yates, J. R. r.; Gilchrist, A.; Howell, K. E.; Bergeron, J. J. Proteomics of organellesand large cellular structures. Nat. Rev. Mol. Cell. Biol. 2005, 6, 702–714.
7 Kelleher, N. L. Top-down proteomics. Anal. Chem. 2004, 76, 197A–203A.
Subunit Architecture of Intact Protein Complexes Taverner et al.
626 ACCOUNTS OF CHEMICAL RESEARCH 617-627 May 2008 Vol. 41, No. 5

8 Damoc, E.; Fraser, C. S.; Zhou, M.; Videler, H.; Mayeur, G. L.; Hershey, J. W.;Doudna, J. A.; Robinson, C. V.; Leary, J. A. Structural characterization of the humaneukaryotic initiation factor 3 protein complex by mass spectrometry. Mol. Cell.Proteomics 2007, 6, 1135–1146.
9 Hernández, H.; Robinson, C. V. Determining the stoichiometry and interactions ofmacromolecular assemblies from mass spectrometry. Nat. Protoc. 2007, 2, 715–726.
10 Rappsilber, J.; Siniossoglou, S.; Hurt, E. C.; Mann, M. A generic strategy to analyzethe spatial organization of multi-protein complexes by cross-linking and massspectrometry. Anal. Chem. 2000, 72 (2), 267–275.
11 Benesch, J. L.; Aquilina, J. A.; Ruotolo, B. T.; Sobott, F.; Robinson, C. V. Tandemmass spectrometry reveals the quaternary organization of macromolecularassemblies. Chem. Biol. 2006, 13 (6), 597–605.
12 McKay, A. R.; Ruotolo, B. T.; Ilag, L. L.; Robinson, C. V. Mass Measurements ofIncreased Accuracy Resolve Heterogeneous Populations of Intact Ribosomes. J. Am.Chem. Soc. 2006, 128, 11433–11442.
13 Benesch, J. L.; Ruotolo, B. T.; Simmons, D. A.; Robinson, C. V. Protein complexes inthe gas phase: Technology for structural genomics and proteomics. Chem. Rev.2007, 107 (8), 3544–3567.
14 Sharon, M.; Robinson, C. V. The Role of Mass Spectrometry in Structure Elucidationof Dynamic Protein Complexes. Annu. Rev. Biochem. 2007, 76, 167–193.
15 Fu, H.; Reis, N.; Lee, Y.; Glickman, M. H.; Vierstra, R. D. Subunit interaction mapsfor the regulatory particle of the 26S proteasome and the COP9 signalosome. EMBOJ. 2001, 20 (24), 7096–7107.
16 Aloy, P.; Bottcher, B.; Ceulemans, H.; Leutwein, C.; Mellwig, C.; Fischer, S.; Gavin,A. C.; Bork, P.; Superti-Furga, G.; Serrano, L.; Russell, R. B. Structure-basedassembly of protein complexes in yeast. Science 2004, 303 (5666), 2026–2029.
17 Uetz, P.; Giot, L.; Cagney, G.; Mansfield, T. A.; Judson, R. S.; Knight, J. R.;Lockshon, D.; Narayan, V.; Srinivasan, M.; Pochart, P.; Qureshi-Emili, A.; Li, Y.;Godwin, B.; Conover, D.; Kalbfleisch, T.; Vijayadamodar, G.; Yang, M.; Johnston, M.;Fields, S.; Rothberg, J. M. A comprehensive analysis of protein-protein interactionsin Saccharomyces cerevisiae. Nature 2000, 403 (6770), 623–627.
18 Ispolatov, I.; Yuryev, A.; Mazo, I.; Maslov, S. Binding properties and evolution ofhomodimers in protein-protein interaction networks. Nucleic Acids Res. 2005, 33,3629–3635.
19 Pereira-Leal, J. B.; Levy, E. D.; Kamp, C.; Teichmann, S. A. Evolution of proteincomplexes by duplication of homomeric interactions. Genome Biol. 2007, 8,R51.
20 Devos, D.; Dokudovskaya, S.; Williams, R.; Alber, F.; Eswar, N.; Chait, B. T.; Rout,M. P.; Sali, A. Simple fold composition and modular architecture of the nuclear porecomplex. Proc. Natl. Acad. Sci. U.S.A. 2006, 103, 2172–2177.
21 Soding, J.; Biegert, A.; Lupas, A. N. The HHpred interactive server for proteinhomology detection and structure prediction. Nucleic Acids Res. 2005, 33 (WebServer issue), W244–W248.
22 Sali, A.; Blundell, T. L. Comparative protein modelling by satisfaction of spatialrestraints. J. Mol. Biol. 1993, 234, 779–815.
23 Martin, A. C.; MacArthur, M. W.; Thornton, J. M. Assessment of comparativemodeling in CASP2. Proteins 1997, (Suppl 1), 14–28.
24 Russell, R. B.; Barton, G. J. Multiple protein sequence alignment from tertiarystructure comparison: assignment of global and residue confidence levels. Proteins1992, 14, 309–323.
25 Robinson, C. V.; Sali, A.; Baumeister, W. The molecular sociology of the cell. Nature2007, 450, 973–982.
26 Lorentzen, E.; Walter, P.; Fribourg, S.; Evguenieva-Hackenberg, E.; Klug, G.; Conti,E. The archaeal exosome core is a hexameric ring structure with three catalyticsubunits. Nat. Struct. Mol. Biol. 2005, 12 (7), 575–581.
27 Synowsky, S. A.; van den Heuvel, R. H.; Mohammed, S.; Pijnappel, P. W.; Heck,A. J. Probing genuine strong interactions and post-translational modifications in theheterogeneous yeast exosome protein complex. Mol. Cell. Proteomics. 2006, 5 (9),1581–1592.
28 Liu, Q.; Greimann, J. C.; Lima, C. D. Reconstitution, activities, and structure of theeukaryotic RNA exosome. Cell 2006, 127, 1223–1237.
Subunit Architecture of Intact Protein Complexes Taverner et al.
Vol. 41, No. 5 May 2008 617-627 ACCOUNTS OF CHEMICAL RESEARCH 627
Copyright © 2022 FDOKUMEN