Subm itted to Colorado PUC E-Filings System - The Mendota ...
91
Submitted to Colorado PUC E-Filings System
-
Upload
khangminh22 -
Category
Documents
-
view
3 -
download
0
Transcript of Subm itted to Colorado PUC E-Filings System - The Mendota ...
Subm
itted
to C
olor
ado
PUC
E-Fi
lings
Sys
tem
��
������������������
Exhibit No. DLS-4 Page 1 of 88
�
2
���
� ��� ����� ����!�(%+$�44444444444444444444444444444444444444444444444444444444444444444444444444444444444444444444444444444444444444444444444444444444444444444444444444444444444444444444444444444444 B� �((%-�$��*����%&�� 44444444444444444444444444444444444444444444444444444444444444444444444444444444444444444444444444444444444444444444444444444444444444444444444444444444444444 C��/���)��(����+�)*�%$)44444444444444444444444444444444444444444444444444444444444444444444444444444444444444444444444444444444444444444444444444444444444444444444444444444444 D�����$�*�%$) 44444444444444444444444444444444444444444444444444444444444444444444444444444444444444444444444444444444444444444444444444444444444444444444444444444444444444444444444444444444<;������������� �$�"+�$��)4444444444444444444444444444444444444444444444444444444444444444444444444444444444444444444444444444444444444444444444444444444444444444444444444444444444444444444444444444444444<?���"�+"�*�%$)�%���(%))���,�$�) 4444444444444444444444444444444444444444444444444444444444444444444444444444444444444444444444444444444444444444444444444444444444444444444<A� �*���,�$�)���"�+"�*�%$)44444444444444444444444444444444444444444444444444444444444444444444444444444444444444444444444444444444444444444444444444444444444444444444444444444<B�#&%(*�$����$��������+"*/ 44444444444444444444444444444444444444444444444444444444444444444444444444444444444444444444444444444444444444444444444444444444444444444444444444<C��+((�$*��(�$�) 44444444444444444444444444444444444444444444444444444444444444444444444444444444444444444444444444444444444444444444444444444444444444444444444444444444444444444444444=<����#�����,�$�) 444444444444444444444444444444444444444444444444444444444444444444444444444444444444444444444444444444444444444444444444444444444444444444444444444444444444444444444>;��(%))�,)4� �*��%�") 4444444444444444444444444444444444444444444444444444444444444444444444444444444444444444444444444444444444444444444444444444444444444444444444444444444444444444><���1���$�� ��44444444444444444444444444444444444444444444444444444444444444444444444444444444444444444444444444444444444444444444444444444444444444444444444444444444444444444444444>>������������ �����$�$��*�����(!�*��(�$)�%(#�*�%$�����$�*�%$4444444444444444444444444444444444444444444444444444444444444444444444444444444444444444444444444444444>@��)*�#�*�$���%*�$*��" 4444444444444444444444444444444444444444444444444444444444444444444444444444444444444444444444444444444444444444444444444444444444444444444444444444444444444@<��+�$*��/�$����)+"*)444444444444444444444444444444444444444444444444444444444444444444444444444444444444444444444444444444444444444444444444444444444444444444444444444444444444444@=�$�%(&%(�*�$���$*%��(%�(�#)44444444444444444444444444444444444444444444444444444444444444444444444444444444444444444444444444444444444444444444444444444444444444444444@B��� � �*5*%5�(%))�))+�)444444444444444444444444444444444444444444444444444444444444444444444444444444444444444444444444444444444444444444444444444444444444444444444444444444444444444AC��� ��$)-�(����+�)*�%$) 444444444444444444444444444444444444444444444444444444444444444444444444444444444444444444444444444444444444444444444444444444444444444444444444444444444444B;� ��&&�$��.��3���"�,�$*���"�$���$������)�%$) 4444444444444444444444444444444444444444444444444444444444444444444444444444444444444444444444444444444444444444B=��&&�$��.��3��*��(���(!�*�����$�*�%$)�%����(!�*��(�$)�%(#�*�%$4444444444444444444444444444444444444444444444444444444444444444444B?��&&�$��.��3��(%�(�#����%(/�8��%�����%��")444444444444444444444444444444444444444444444444444444444444444444444444444444444444444444444444444444444444B@��&&�$��.��3���"��%($����(%�(�#���(�%(#�$���$����*%(��%(!)���* 44444444444444444444444444444444444444444444444444444444444444BB��&&�$��.��3��"%))�(/ 44444444444444444444444444444444444444444444444444444444444444444444444444444444444444444444444444444444444444444444444444444444444444444444444444444444444BC��&&�$��.��3�$*�($�*�%$�"���(�%(#�$������)+(�#�$*��$����(�����*�%$��(%*%�%"�9����:��&*�%$)��%(��,�"+�*�$���$�(�/8��#�$����,�$�)4444444444444444444444444444444444444444444444444444444444444444444444444444444444444444444444444444444444444444444444C<��&&�$��.��3�����(�$��) 444444444444444444444444444444444444444444444444444444444444444444444444444444444444444444444444444444444444444444444444444444444444444444444444444444C>�
Exhibit No. DLS-4 Page 2 of 88
�
3
��This study was conducted in response to Public Service Company of Colorado’s (“Public Service”) commitment as part of its 2009-2010 Electric and Gas Biennial Plan to review techniques for quantifying the impacts of and potential for DSM market transformation strategies and analyze issues related to net-to-gross ratios and the variety of factors that could affect these ratios. Public Service also requested that the study provide recommendations quantification of market transformation and treatment of net-to-gross issues. With respect to net-to-gross issues, the study recommends that Public Service:
1) Not specifically propose to adopt a “net” or “gross” goals approach but rather ensure that whichever approach is selected, that goals and achievements are apples-to-apples comparisons. In this sense, if it is determined that goals are more closely aligned with gross achievements, then achievements should also be measured on a gross basis. Calculations of net-to-gross (the primary differentiator between gross and net achievements) remain important although it is not clear that the benefits of calculating such ratios for purposes of determining goals and achievements outweigh the potentially significant costs of accurately determining these values. If such a “gross” goals approach is pursued, it would make sense to propose its implementation over a number of years and perhaps tie adoption of the approach to Public Service’s success in implementing the coordination strategy discussed below (because one of the primary reasons for adopting a gross approach is to encourage coordination and cooperation among players in the energy efficiency space).
2) Develop a technical reference manual and database to explain the process of calculating savings for different types of projects and to record deemed savings values for projects. Such technical reference manuals are increasingly common among utilities and serve to increase transparency involving energy savings calculations and help clearly document the approach taken to estimate savings.
3) Immediately implement mechanisms that would allow the Company to more readily calculate free ridership during the course of a program to ensure that unusual trends are not emerging. Mechanisms such as sampling of customers during program implementation can serve this purpose and feed into any after-the-fact evaluations conducted on the program. To be sure, program development and design should clearly include how the program plans to handle assessments of net-to-gross.
4) Implement a requirement that all programs have clear program designs along with program theories and logic models (PT/LM). Logic models help communicate program theory (the how’s and why’s) and the reasons for outcomes. Although not a new concept, PT/LMs can play important roles in maximizing program performance, establishing continuous improvement and creating a structure to more clearly identify program impacts. This, too, should be incorporated into program design and development.
5) Maximize its coordination with other “players” in the energy efficiency space who could influence customer EE decisions and establish leadership position in the interface with customers in this regard (i.e. assert primary customer contacts). Although all of the recommendations in this list entail active participation and, in certain cases approval by the Colorado Public Utilities Commission this suggestion will not succeed without the
Exhibit No. DLS-4 Page 3 of 88
�
4
CPUC’s involvement and encouragement. There are multiple players in the Colorado energy efficiency space and coordination among these players will produce the best outcomes; however, it is important that one program administrator lead the coordinated effort. This entity should be Public Service Company of Colorado because Public Service possesses the consistency of funding, is regulated by the CPUC to protect consumer interests, and has the depth of knowledge and experience to play this role. The CPUC in its role as utility regulator and electric and gas policy leader can facilitate this effort. Formally request CPUC approval for its current approach to Evaluation, Measurement & Evaluation. This approach was previously approved as part of a settlement and, therefore, has not been approved on its own merits. The Company’s EM&V approach should be modified to include the recommendations embodied in this paper.
6) Readily incorporate into program designs and revisions for future program years results from any impact evaluations.
With respect to market transformation programs and strategies the study recommends that Public Service:
1) Give more thought to its design of such programs to include clear methods for evaluating the impacts and success of such programs well before the program launches.
2) Adopt protocols and approaches for estimating savings from market transformation programs based on the California Evaluation Framework for estimating results.
3) Implement a Codes and Standards program in partnership with local governments and possibly the Governor’s Energy Office.
4) Consider pursuing development of an Energy Resource Center program and establish an Energy Resource Center. An Energy Resource Center can help provide a focal point with Public Service’s service territory for energy efficiency (and possibly renewable energy) efforts. Such centers can be quite expensive and of uncertain value. However, if developed with focus on clearly identifying how benefits will be annually measured, creating productive partnerships, and potentially reclaiming an existing facility to lower first cost, such a Center could serve an important role in the Company’s market transformation strategy. Implement a Targeted Education and Information program that incorporates experimental design.
5) Establish larger budgets for a research function either within the Company or for outside contractors for EM&V and development of innovative program activities.
6) Set a limit on the amount it will spend on market transformation programs to guide allocation of resources between the various types of programs Public Service will operate.
Exhibit No. DLS-4 Page 4 of 88
5
����Net-to-gross issues and market transformation strategies are not topics that are normally grouped together. However, both concepts relate to motivating consumers to pursue energy efficiency with one attempting to determine what motivated consumers and the other providing a method of motivating customers to reduce their energy use. And, it happens that an increase in the number of factors that result in transformation of markets for energy-using devices (one definition of market transformation) potentially complicates efforts to determine what influenced consumers to reduce their energy use. All this is to say that the many issues at play in discussing net-to-gross ratios and market transformation make for an interesting discussion and lend themselves to recommendations that are, at least, pertinent to current activities and, at best, vital to current and future energy efficiency program development. The following analysis covers a lot of ground in framing the issues of net-to-gross (NTG) and market transformation while providing the national “state of play” for NTG, examining ways of estimating potential and results from market transformation (MT) strategies and recommending possible MT programs and strategies. Net-to-gross ratios remain a key part of both program evaluation and program design, yet recent trends acknowledge and attempt to quantify the broader effects energy efficiency programs are having on consumer decision making. This is occurring despite the proliferation and intensity of factors influencing consumer energy-use decisions. In fact, the number of factors influencing consumer decisions is causing some to question whether it makes sense to use gross figures in setting both program administrator goals and calculating program results. Market transformation programs and strategies are experiencing resurgence both as spending on energy efficiency programs increases and interest in “non-traditional” approaches to energy efficiency programs is growing. In the era of formal energy efficiency programs, the more traditional method of providing customers incentives or rebates to buy-down the first cost of more expensive energy efficiency measures continues to dominate but regulators and others are enamored with the promise of market transformation approaches because MT envisions fundamentally altering markets for energy efficient goods and services, the strategy can appear less costly and it can be (possibly more effectively) administered by entities other than utilities. These aspirations can be elusive, however, particularly if the same issues that create interest in MT strategies remain, namely lack of adequate planning, program design, administration, and measurement. Market transformation programs and strategies can play important roles in a program administrator’s energy efficiency portfolio but it is crucially important that MT approaches as well as more traditional approaches to energy efficiency program design incorporate adequate planning, program design, administration, and measurement. MT approaches, including those recommended in this paper, probably need more not less planning than traditional programs because their results are often harder to measure and the program logic can be more difficult to clearly articulate than rebate-based methods. Public Service has made good strides in its efforts to launch market transformation programs and has good approaches to calculating net-to-gross.
Exhibit No. DLS-4 Page 5 of 88
�
6
Both areas, however, would benefit from additional input and more detailed planning. Our hope is that this paper helps provides this assistance. This remainder of this document is organized as follows. Chapter two provides: background information that led to the analysis, a set of questions the analysis seeks to answer, definitions and examples, and introductions to concepts used throughout the analysis. The third chapter looks at the increasing number of influences on customer decision-making with respect to energy efficiency and conservation, attribution (net-to-gross) and current national trends. The fourth chapter explores the concept of market transformation and market transformation programs. The chapter further examines ways to quantify program results, market potential and how to incorporate such concepts into programs. The fifth chapter provides recommendations for Public Service Company of Colorado for use and quantification of market transformation programs and net-to-gross ratios. The sixth chapter provides concluding thoughts.
Exhibit No. DLS-4 Page 6 of 88
7
�����
�The Mendota Group, LLC submits the following report in response to Public Service Company of Colorado’s commitment as part of its 2009-2010 Electric and Natural Demand-Side Management Biennial Plan (page 373) to, “Assess techniques and practices for quantifying Market Transformation and assessing the effects and national policies related to Net-to-Gross from increased market transformation, education, and energy codes & standards.” The basis for this study traces back to Public Service’s Application for Rehearing, Reargument and Reconsideration (ARRR) in Docket 07A-420E. In its ARRR filing, Public Service expressed concerns about the accuracy of net-to-gross calculations and highlighted the fact that “it has always been difficult to identify the responsible parties who influenced a customer's decision.” The filing went to say that, “rapidly increasing number of messages regarding global warming and energy efficiency, coming from many sources, renders this identification virtually impossible.” 1 The Colorado Public Utilities Commission in paragraph 43 of Decision No. C08-0769 (Order on Applications for Rehearing, Reargument and Reconsideration, Docket No. 07A-420E) responded that its Decision did “not preclude Public Service from including a proposed approach to net-to-gross in its biennial plan filing, as part of the overall cost-effectiveness detail that it will provide pursuant to Paragraph 171.” Paragraph 43 continued, “Paragraph 87 directs Public Service to engage in supplemental market studies, including a study to ‘assess techniques for quantifying market transformation potential and for quantifying the impact of DSM market transformation strategies.’” As the Commission further explained, “This language conveys that we acknowledge that other market forces are impacting DSM potential and need to be appropriately factored into DSM planning. A reevaluation of this issue is not precluded by the Decision, and could be incorporated into a subsequent docket. Public Service is encouraged to address this issue in its biennial plan.” Public Service responded by proposing to study the issue as part of its 2009-10 Biennial Plan. Public Services witness Suzanne Doyle testified that the Company plans to:
Assess techniques for quantifying market transformation potential and for quantifying the impact of DSM market transformation strategies. A study is planned for 2009 to review techniques for quantifying market transformation potential and techniques for quantifying the impacts of DSM market transformation strategies. In addition, this study will investigate national and local
1 Public Service Company of Colorado, “Application of Public Service Company of Colorado for Rehearing, Reargument and Reconsideration of Commission Decision No. C08-056,” In the Matter of the Application of Public Service Company of Colorado for Authority to Implement an Enhanced Demand Side Management Program and to Revise its Demand Side Management Cost Adjustment Mechanism to Include Cost Recovery and Incentives (Docket No. 07A-420E), June 25, 2008, p. 9.
Exhibit No. DLS-4 Page 7 of 88
�
8
practices and policies related to market transformation, education, and standards and code changes and their effects on attribution analysis for establishing net-to-gross ratios applied to gross utility savings.2
This study responds to this line of inquiry and Public Service’s commitment as part of its 2009-2010 Biennial Plan.
���This is a complex and potentially expansive set of topics. The complexity derives from the fact that the issues are fundamental to determining energy efficiency program impacts and because the landscape is ever changing; practitioners are involved in a constant process of improving methods of estimating impacts and developing new approaches to maximizing program effectiveness. Narrowing the topic may help provide a more coherent and useful response. One way to narrow the topic is to understand that the issue precipitating this study is the expansion of influences affecting consumers’ energy use decision making. In this context, the utility (“program administrator”3) is but one source of influence that, together with the variety of other influences (to include among other things, federal, state and local government programs, corporate marketing, social and other media), is attempting to drive customer behavior.4 In the case of the non-utility influences, certainly some might be considered “point” and some “non-point” insofar as the point influences are readily identifiable and may even include specific, quantifiable objectives for changing customer behavior (e.g. federal American Recovery and Reinvestment Act of 2009 – “ARRA” or “Stimulus Bill”5) while the non-point influences are diffuse and certainly much more difficult to pin down in terms of quantifiable effects (e.g. editorials in newspapers and newsletters advocating greater amounts of energy efficiency).6 Needless to say, increased concerns about global warming, election of a President who has made improving the environment (and in particular energy efficiency) a primary goal of his
2 Suzanne R. Doyle, “Direct Testimony of Suzanne R. Doyle,”In the Matter of the Application of Public Service Company of Colorado for Approval of its Electric and Natural Gas Demand-Side Management (DSM) for Calendar Years 2009 and 2010 and to Change its Electric and Gas DSM Cost Adjustment Rates Effective January 1, 2009, and for Related Authorizations and Waivers (Docket No. 08A-366EG), November 20, 2008, pp. 23-24. 3 This study uses “program administrator” and “utility” interchangeably as the terms relate to the entity administering the energy efficiency program. Program administrator is a more generic term that incorporates the possibility that the utility is not the entity running the energy efficiency program. However, as this study is provided to a utility, Public Service Company of Colorado, it will often assume that program administrator and utility are synonymous. 4 Other key factors include: broad-based educational efforts, codes & standards, and energy efficiency advocacy by non-utility entities. 5 Public Law 111-5, February 17, 2009. 6 The use of the terms “point” and “non-point” borrows from terminology to describe types of water pollution. According to the U.S. Environmental Protection Agency, nonpoint source pollution comes from many diffuse sources. (http://www.epa.gov/owow/nps/qa html) In contrast, point source pollution “is a single identifiable localized source of air, water, thermal, noise or light pollution.” (http://en.wikipedia.org/wiki/Point source pollution) Despite the mangled comparison, the terms provide a good general description of the concept applicable to energy efficiency influences.
Exhibit No. DLS-4 Page 8 of 88
�
9
Administration, and general heightened awareness about energy issues have increased the number of non-point influences entering the collective customer consciousness. At the same time, though, utilities and other organizations have also substantially increased their investments in energy efficiency activities.7 For example, “several states have established state policies that mandate that energy efficiency is ‘first’ in the ‘loading order’ of utility resources, and/or that requires utilities to capture all cost-effective energy efficiency.”8 Given these trends, utilities and their regulators want to be certain that utility efforts to promote energy efficiency to their customers are efficient and effective and, indeed, sufficiently comprehensive that the utility is maximizing its acquisition of a resource often considered the least expensive/most environmentally desirable. So, at its essence, this analysis should explore concepts and trends related to determining who influenced customer energy efficiency actions while looking into one of the methods heretofore employed in limited form by utility administrators, so-called market transformation (MT) programs, to better understand their potential and possible complimentary role in relation to other influences. Following is a set of key research questions that the analysis will attempt to answer.
���This study proposes to address the following research questions: 1. What are the various key influences affecting customer energy efficiency decision
making? 2. How can these influences be best quantified?
a) Specifically, how do national and local practices and policies related to education, and standards and code changes affect attribution analysis?
3. What are national trends on this topic and possible future directions? 4. What are the implications of such influences on calculations of utility-claimed energy
savings and regulatory goal setting (specifically for Public Service)? 5. What is market transformation and what are market transformation programs and
activities? 6. How can Public Service incorporate MT concepts into its portfolio? 7. What is “best practice” for estimating results from market transformation programs? 8. How can one measure “market potential” for market transformation programs? Chapter 5 includes a “key” to identify areas of the document where these questions are answered.
7 The Consortium for Energy Efficiency’s (CEE) 2008 Annual Industry Report indicates that ratepayer funded energy efficiency program spending increased 21 percent in 2008 from 2007 (http://www.cee1.org/ee-pe/2008/us_combo.php). The reaction is not confined to the U.S. The United Kingdom’s primary energy regulator, Ofgem (Office of the Gas and Electricity Markets), recently published a study that strongly encourages increased energy efficiency in the face of rising energy costs. See http://www.energyefficiencynews.com/i/2478/ 8 Martin Kushler, Patti Witte, Dan York, “Can We Get There From Here? Identifying Key Factors in Meeting Aggressive New State Energy Efficiency Savings Goals?” (paper presented at Counting on Energy Programs: It’s Why Evaluation Matters, Portland, Oregon: International Energy Program Evaluation Conference, August 2009), p. 861.
Exhibit No. DLS-4 Page 9 of 88
�
10
�This analysis contains a lot of terminology that may be new to many readers. However, even if the terms are not new, all would benefit from a common understanding of the terms and concepts as they apply to this analysis. Two key terms used in this analysis start us down the definitional path. Market transformation, as the term is used in an energy efficiency context, can mean different things to different people. Similarly, the concept of net-to-gross, although as a term probably easier to clearly define than market transformation is nonetheless amorphous due to differing views on what constitutes “gross” and “net”. The definitions in the next section, without larger context, raise a number of questions that are not addressed in this chapter. The context for these terms is provided in subsequent chapters. Net-to-gross issues and the larger topic of assessing customer decision making are discussed in Chapter 2. Market Transformation is further discussed in Chapter 3.
��For purposes of this analysis, we adopt the following definition for market transformation programs and activities: Programs and activities whose primary purpose is to induce long-lasting sustainable changes in the structure or functioning of a market achieved by reducing barriers to the adoption of energy efficiency measures to the point where such measures become standard in that specific market. 9 It should be noted that this definition contrasts somewhat with the definition of market transformation in the Code of Colorado Regulations. 4 CCR 723-4 (gas rules) defines market transformation as: a strategy for influencing the adoption of new techniques or technologies by consumers. The objective is to overcome barriers within a market through coordinating tactics such as education, training, product demonstration and marketing, often conducted in concert with rebates or other financial incentives.10 This analysis does not adopt the definition in Colorado rules because the rules definition and associated definitions effectively categorize market transformation programs and activities as “indirect” or “non-resource” type programs.11 Indirect/non-resource programs are programs and activities for which energy savings are not readily quantifiable. This approach generally does
9 This is a variation on the California PUC’s definition: Market transformation is long-lasting, sustainable changes in the structure or functioning of a market achieved by reducing barriers to the adoption of energy efficiency measures to the point where continuation of the same publicly-funded intervention is no longer appropriate in that specific market. Market transformation includes promoting one set of efficient technologies, processes or building design approaches until they are adopted into codes and standards (or otherwise substantially adopted by the market), while also moving forward to bring the next generation of even more efficient technologies, processes or design solutions to the market. California Public Utilities Commission, Decision 09-09-047, August 25, 2009, p. 73. It should be noted that the CPUC in its 2009 decision modified a definition that basically remained intact since 1998. The 2009 Decision modified the definition by adding the underlined portion. 10 Section 4751 (n), 4 Code of Colorado Regulations 723-4. 11 Section 4753(h)(IV) 4 Code of Colorado Regulatiions 723-4.
Exhibit No. DLS-4 Page 10 of 88
�
11
not appear consistent with the approach used in other jurisdictions and since this study is looking at national trends, we adopt the different definition for purposes of the analysis. In addition, the Colorado definition (and, to a certain extent, our definition) fails to provide a “bright line” distinction between market transformation strategies and other energy efficiency program strategies. The interest in a bright line definition comes from the desire to clearly identify a program as employing market transformation strategies or correctly label the program “market transformation”. This is a theme that will be repeated throughout this analysis; the sense that market transformation is an amorphous concept that means different things to different people. It will be helpful to know what we mean when we say market transformation.
���The California Evaluation Framework defines net-to-gross ratio as follows: A factor representing net program load impacts divided by gross program load impacts that is applied to gross program load impacts to convert them into net program load impacts. This factor is also sometimes used to convert gross measure costs to net measure costs.12 Of course, this requires additional definitions for gross and net load impacts. Gross load impacts are defined as: The change in energy consumption and/or demand that results directly from program-related actions taken by participants in the DSM program, regardless of why they participated.13 Further, net load impacts are defined as: The total change in load that is attributable to the utility DSM program. This change in load may include, implicitly or explicitly, the effects of free drivers, free riders, state or federal energy efficiency standards, changes in the level of energy service, and natural change effects.14 And, the required definitions continue: Free Driver - A non-participant who adopted a particular efficiency measure or practice as a result of a utility program. See SPILLOVER EFFECTS for aggregate impacts.15 Free Rider - A program participant who would have implemented the program measure or practice in the absence of the program.16
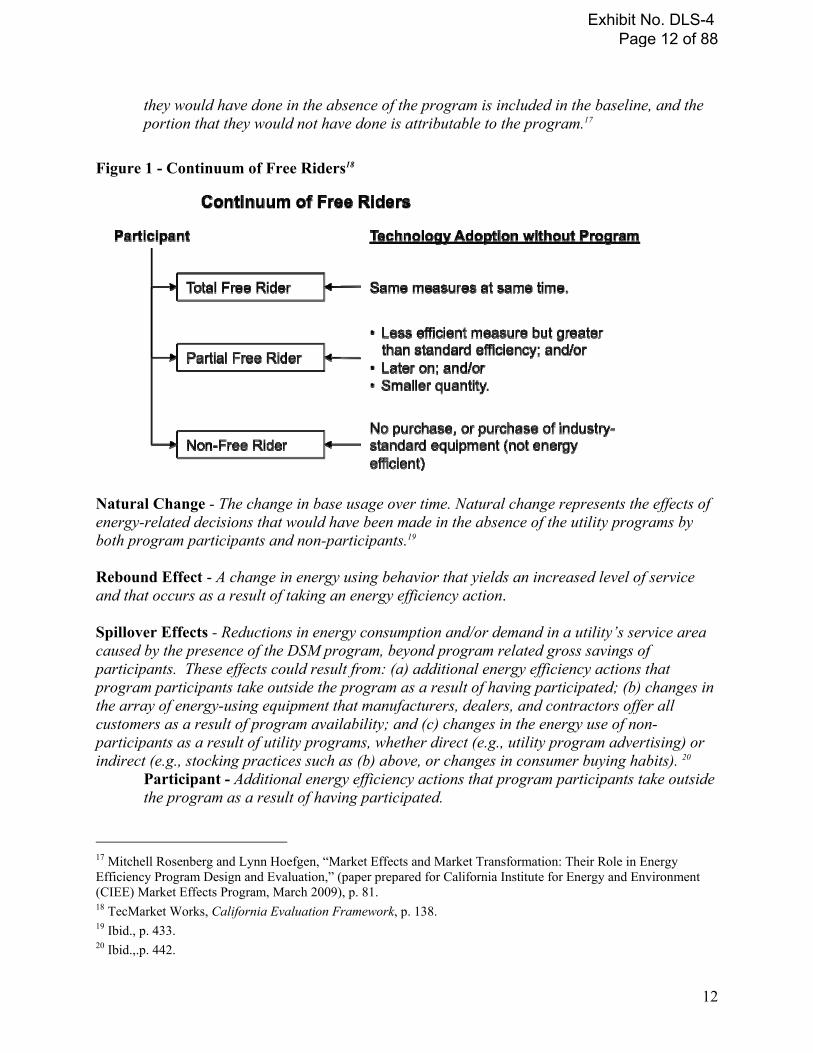
� Partial free rider - Those customers who would have installed some program-supported measures on their own, but not as many, as highly efficient, or as soon; the portion that
12 TecMarket Works, California Evaluation Framework, Prepared for the California Public Utilities Commission and the Project Advisory Group, revised January 24, 2006, p. 433. 13 Ibid., p. 423. DSM refers to demand-side management. This term is defined in the glossary. 14 Ibid., p. 433. 15 Ibid., p. 422. 16 Ibid., p. 422.
Exhibit No. DLS-4 Page 11 of 88
�
12
they would have done in the absence of the program is included in the baseline, and the portion that they would not have done is attributable to the program.17
Figure 1 - Continuum of Free Riders18
Natural Change - The change in base usage over time. Natural change represents the effects of energy-related decisions that would have been made in the absence of the utility programs by both program participants and non-participants.19 Rebound Effect - A change in energy using behavior that yields an increased level of service and that occurs as a result of taking an energy efficiency action. Spillover Effects - Reductions in energy consumption and/or demand in a utility’s service area caused by the presence of the DSM program, beyond program related gross savings of participants. These effects could result from: (a) additional energy efficiency actions that program participants take outside the program as a result of having participated; (b) changes in the array of energy-using equipment that manufacturers, dealers, and contractors offer all customers as a result of program availability; and (c) changes in the energy use of non-participants as a result of utility programs, whether direct (e.g., utility program advertising) or indirect (e.g., stocking practices such as (b) above, or changes in consumer buying habits). 20
Participant - Additional energy efficiency actions that program participants take outside the program as a result of having participated.
17 Mitchell Rosenberg and Lynn Hoefgen, “Market Effects and Market Transformation: Their Role in Energy Efficiency Program Design and Evaluation,” (paper prepared for California Institute for Energy and Environment (CIEE) Market Effects Program, March 2009), p. 81. 18 TecMarket Works, California Evaluation Framework, p. 138. 19 Ibid., p. 433. 20 Ibid.,.p. 442.
Exhibit No. DLS-4 Page 12 of 88
�
13
Non-participant - Changes in the energy use of non-participants as a result of utility programs, whether direct (e.g., utility program advertising) or indirect (e.g., stocking practices such as (b) above, or changes in consumer buying habits).
Market Effect - A change in the structure or functioning of a market or the behavior of participants in a market that result from one or more program efforts. Typically these efforts are designed to increase the adoption of energy-efficient products, services or practices and are causally related to market interventions.21
Causality/Attribution - Causality should be examined to estimate net market effects. The goal of the activity is to estimate the proportion of market changes that can be attributed to program interventions using PGC and procurement funds, as versus those naturally occurring in the market or from interventions using non-PGC (Public Goods Charge – see footnote) and non-procurement funds to arrive at market effects. There are two primary approaches for estimating causal attribution, one uses a preponderance of evidence approach and the other uses a modeling approach. The ultimate goal for assessment of causal attribution is to avoid retrospective analysis in which contacts are asked to judge what efforts had effects on the market. Retrospective approaches have great potential for bias because contacts are themselves influenced and cannot maintain objective perspectives.22
Although perhaps more straightforward, net-to-gross ratios certainly have a lot of facets that have to be considered to truly assess the trends and ways in which different jurisdictions are considering them. �
�������Traditional Energy Efficiency Programs – This analysis uses the phrase “traditional energy efficiency programs” to refer to programs that attempt to encourage customers to adopt energy efficiency practices through financial rebates and incentives. This type of program is contrasted with “market transformation programs and activities”, although as discussed the lines between the two are not always bright and clear.
21 Ibid., p. 430. 22 The TecMarket Works Team, California Energy Efficiency Evaluation Protocols: Technical, Methodological, and Reporting Requirements for Evaluation Professionals (a.k.a Evaluators’ Protocols), (Prepared under direction of the Energy Division, with the guidance by Joint Staff, for the California Public Utilities Commission, April 2006), p. 155. PGC refers to the Public Goods Charge that utilities charge customers to fund energy efficiency programs.
Exhibit No. DLS-4 Page 13 of 88
14
������������� There are a myriad of factors that influence customer decision making with respect to purchase, installation and use of energy-using measures. The process of customer (individual or business) decision making has been studied in tremendous detail and plays a very important role in the fields of psychology, economics, and sociology among other disciplines. Each of these fields of study seeks to understand what motivates decisions, how to predict decisions and, in some cases, how to influence decisions.23 In the “field” of energy efficiency, we are interested in all three areas as well. Energy efficiency program administrators are concerned with what motivated decisions, how to predict decisions and how to influence decisions. In particular, evaluation, measurement and verification (EM&V) concerns itself with what motivates decisions regarding purchase, installation and use of energy-using measures. The EM&V field borrows from (and expands upon) concepts studied in the fields of psychology and economics to conduct its analyses. This is a job that has become increasingly difficult in recent years, especially as the number of factors that may motivate (or influence) energy efficient decisions has increased.24 Stated differently, “With the increasing “push” for energy efficiency by utilities and government at the local, state, and national level and by private groups and large companies, it can be quite difficult to separate out how one particular program among all this activity influences the decision of whether, when, and to what degree to adopt efficiency actions.”25 That is, it becomes increasingly difficult to determine net savings.
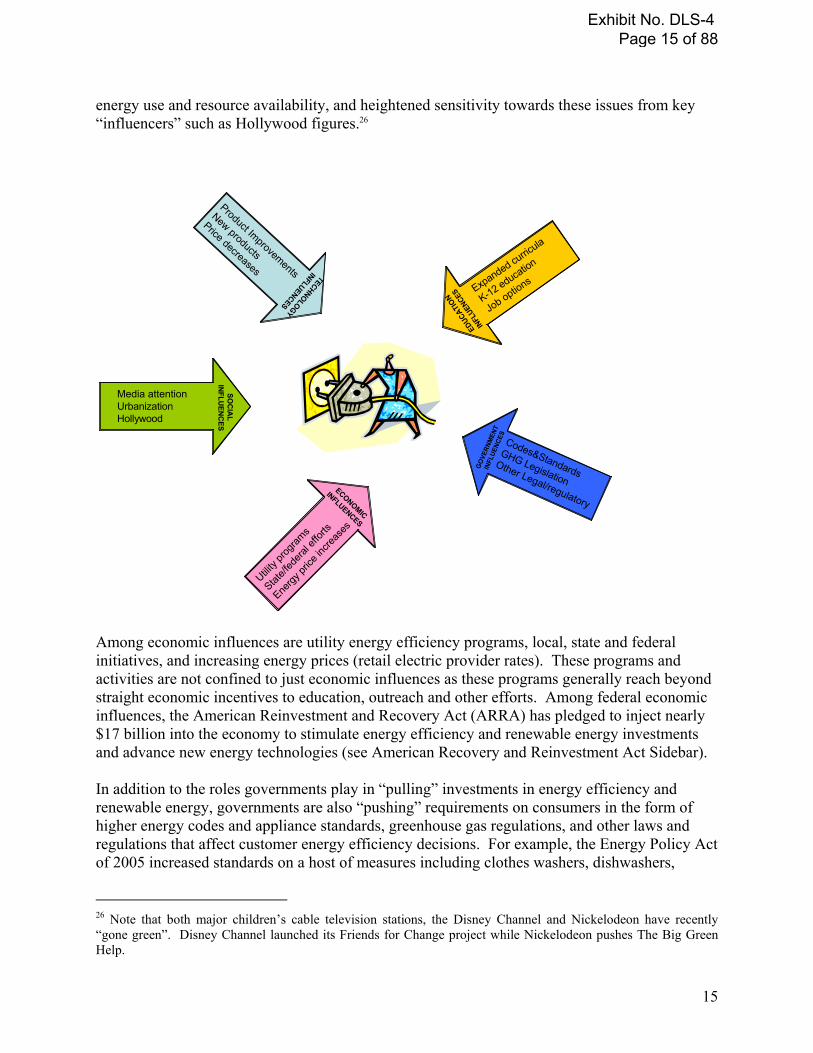
�Among the key influential factors are social influences, economic influences, technology influences, government, and educational influences. With respect to social influences, there is a greater level of awareness related to all things energy, including energy efficiency. This is occurring as a result of media interest, the effects increasing urbanization has on pollution,
23 For example, the rising field of “behavioral economics” has also become involved with energy efficiency and how to influence customer decisions. See Michael Gruenwald, “How Obama is Using the Science of Change,” Time Magazine, April 2, 2009. The Precourt Energy Efficiency Center at Stanford University includes a Behavior & Energy Cluster that centralizes key behavioral science resources relevant to accelerating the adoption and sustained use of energy-efficient technologies and climate-positive actions by individuals, groups, and organizations. (http://peec.stanford.edu/behavior/). Precourt also co-sponsors the annual Behavior, Energy & Climate Change Conference (http://aceee.org/conf/09becc/09beccindex htm) 24 Lucas Hamilton, “Stars Align for Energy Efficiency,” CertainTeed Blog, August 28, 2009 (http://blog.certainteed.com/2009/08/stars-align-for-energy-efficiency/). 25 National Action Plan for Energy Efficiency, Model Energy Efficiency Program Impact Evaluation Guide. (Prepared by Steven R. Schiller, Schiller Consulting, Inc. 2007), www.epa.gov/eeactionplan, p. 5-1.
Exhibit No. DLS-4 Page 14 of 88
�
15
energy use and resource availability, and heightened sensitivity towards these issues from key “influencers” such as Hollywood figures.26
Media attentionUrbanizationHollywood
SOC
IAL
IN
FLUEN
CES
Utility
progra
ms
State/f
edera
l effo
rts
Energy
price
incre
ases
ECONOMIC
INFLUENCES
Product Improvements
New products
Price decreases TECHNOLOGY
INFLUENCES
Expanded curric
ula
K-12 education
Job options
EDUCATI
ON
INFL
UENCE
S
Codes&Standards
GHG LegislationOther Legal/regulatory
GO
VERN
MEN
TIN
FLUE
NCES
Among economic influences are utility energy efficiency programs, local, state and federal initiatives, and increasing energy prices (retail electric provider rates). These programs and activities are not confined to just economic influences as these programs generally reach beyond straight economic incentives to education, outreach and other efforts. Among federal economic influences, the American Reinvestment and Recovery Act (ARRA) has pledged to inject nearly $17 billion into the economy to stimulate energy efficiency and renewable energy investments and advance new energy technologies (see American Recovery and Reinvestment Act Sidebar). In addition to the roles governments play in “pulling” investments in energy efficiency and renewable energy, governments are also “pushing” requirements on consumers in the form of higher energy codes and appliance standards, greenhouse gas regulations, and other laws and regulations that affect customer energy efficiency decisions. For example, the Energy Policy Act of 2005 increased standards on a host of measures including clothes washers, dishwashers,
26 Note that both major children’s cable television stations, the Disney Channel and Nickelodeon have recently “gone green”. Disney Channel launched its Friends for Change project while Nickelodeon pushes The Big Green Help.
Exhibit No. DLS-4 Page 15 of 88
�
16
refrigerators/freezers, dehumidifiers, lighting, furnaces, air conditioners, and motors, among other technologies.27 In addition, states such as California have building codes that update on a regular schedule, establishing standards for energy use in residential and non-residential buildings. Education is also playing a larger role in energy efficiency awareness through changes to K-12 curricula, increasing number of college and vocational courses and degrees focused on energy efficiency, and employment opportunities in fields that relate to energy efficiency. All these factors can influence customer decision making with respect to energy efficiency. Lastly, technological changes are also occurring at a rapid pace and influencing customer energy efficiency decision making. These changes include product improvements (e.g. “super lamp” CFLs28), the introduction of new products (e.g. lower cost LED lighting, tankless water heaters) and lower prices for energy efficient
products (as a result of economies of scale, improvements in technology). Other “new technologies” include the proliferation of “behavior based” programs that, although not technologically new, result from the increasing availability of customer-use data and interest and willingness on the part of administrators to pursue such approaches.29
����Before estimating net savings associated with programs one must first estimate gross savings. Recall that we adopt the following definition for gross load impacts, “The change in energy
27 The Energy Policy Act of 2005 is Public Law 109-58 and was approved on August 8, 2005. 28 Super lamp CFLs do not yet exist; however, the California utilities and the Sacramento Municipal Utility District issued an RFP at the end of 2009 for manufacturers to develop superior efficiency and quality CFLs for use in 2010-2012 programs. See http://www.etcc-ca.com/index.php?option=com_content&task=view&id=2830 29 See footnote 27 reference to Precourt Institute and the University of California Energy Institute’s California Institute for Energy and Environment working papers on behavior (http://uc-ciee.org/energyeff/energyeff html).
����������$�+)�%$�%���$�(�/��������$�/��+$�)��(%#�*����#�(���$����%,�(/��$�����$,�)*#�$*���*�9����:���)��%#&"���*����#&"�#�$*�*�%$��$��#��)+(�#�$*�%��+*�"�*/5��#�$�)*�(����$�(�/��������$�/�&(%�(�#)4����*��(�)&��*�*%��#&"�#�$*�*�%$2��"*�%+���������+���"�$�)�)*�*��*��*�)+����+$�)�)�%+"��$%*����+)���*%�)+&&"�$*�%(�(�&"�����.�)*�$���+$��$�2�*����#�(��$���%(��.&�$)�%$�%��$%$5+*�"�*/���#�$�)*�(���&(%�(�#)�&%)�)�&%*�$*��"��))+�)�-��(��)+����+���"�$�)��(����*��(�$%*���*�,�"/��$�%(����%(�-��(���$*�(&(�*�*�%$)������(4���)���"�$���(�%)�2��*4��"�&%�$*��$���(���$*����(*��"�2�6��#+��������(����(���%���%%(��$�*�%$�-�""����(�'+�(����#%$���$�(�/��������$�/�&(%�(�#���#�$�)*(�*%()��$������)*�*��9�4�4�+*�"�*��)2�)*�*���$�(�/�%�����2�"%��"��%,�($#�$*):��$�%(��(�*%��$)+(���%$)�)*�$�/��$�&(%�(�#�%���(�$�)2�%�*��$�)+&&%(*��(%#�*(�����""��)2��$��#�$�#�0���%$�+)�%$��#%$���+)*%#�()��$��&(%�(�#���"�,�(/��%$*(��*%()47�96��������*�$����$�)��&��%����*�&�/�(5�+$�����$�(�/��������$�/��$�*����4�472��2���*%��(�=;;D2�&4�=D:���#�"�("/2�*%�*����.*�$*��+)*%#�()�(����,��������+$��$���$�����*�%$�*%�+*�"�*/�(���*�)��%(��$�(�/��������$�/�#��)+(�)2��*�#�/����������+"*�*%���*�(#�$��-������$*�*/�)�%+"��(����,���(���*��%(�*���(�)+"*�$���$�(�/�)�,�$�)4����)��)��$��))+������+)��*��������(�'+�(�)��+$��$��(���&��$*)�*%�*(��!�)�,�$�)��)�-�""��)���%$%#����#&��*)4���%#��)*�*�)���,���"(���/�#������*�(#�$�*�%$)��$�*��)�(���(�4���%(��.�#&"�2���$$)/",�$��2���)���*�(#�$���*��*�+*�"�*��)�)�%+"��(����,���+""��(���*��%(�&(% ��*)�*��*�#�/���� %�$*"/��+$�����/�������%""�()4����"��%($�����)�(�'+�)*���*��*�+*�"�*��)��""%��*���%)*)��$��)�,�$�)�6��(��+""/74��9��"��%($����+�"����*�"�*��)��%##�))�%$2��4;D5;D5;?B2�&4�>>D:�
Exhibit No. DLS-4 Page 16 of 88
�
17
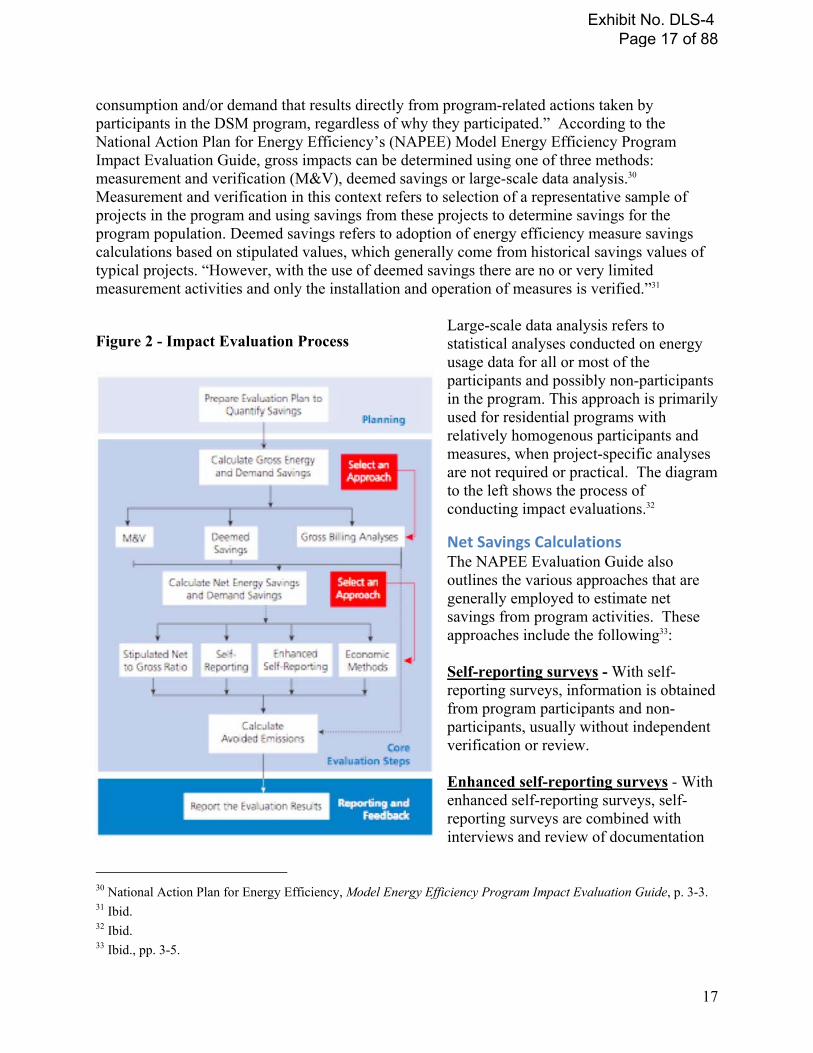
consumption and/or demand that results directly from program-related actions taken by participants in the DSM program, regardless of why they participated.” According to the National Action Plan for Energy Efficiency’s (NAPEE) Model Energy Efficiency Program Impact Evaluation Guide, gross impacts can be determined using one of three methods: measurement and verification (M&V), deemed savings or large-scale data analysis.30 Measurement and verification in this context refers to selection of a representative sample of projects in the program and using savings from these projects to determine savings for the program population. Deemed savings refers to adoption of energy efficiency measure savings calculations based on stipulated values, which generally come from historical savings values of typical projects. “However, with the use of deemed savings there are no or very limited measurement activities and only the installation and operation of measures is verified.”31
Large-scale data analysis refers to statistical analyses conducted on energy usage data for all or most of the participants and possibly non-participants in the program. This approach is primarily used for residential programs with relatively homogenous participants and measures, when project-specific analyses are not required or practical. The diagram to the left shows the process of conducting impact evaluations.32
���The NAPEE Evaluation Guide also outlines the various approaches that are generally employed to estimate net savings from program activities. These approaches include the following33: Self-reporting surveys - With self-reporting surveys, information is obtained from program participants and non-participants, usually without independent verification or review.
Enhanced self-reporting surveys - With enhanced self-reporting surveys, self-reporting surveys are combined with interviews and review of documentation
30 National Action Plan for Energy Efficiency, Model Energy Efficiency Program Impact Evaluation Guide, p. 3-3. 31 Ibid. 32 Ibid. 33 Ibid., pp. 3-5.
Figure 2 - Impact Evaluation Process
Exhibit No. DLS-4 Page 17 of 88
�
18
and possibly analysis of market-based sales data in attempts to derive more accurate results. Econometric methods – With econometric methods34, evaluators use statistical tools and models to compare participant and non-participant energy and demand patterns. The models include survey inputs and other non-program-related factors such as weather and energy costs. Deemed net-to-gross ratios – With deemed net-to-gross ratios, an evaluator uses information available from similar evaluations or similar programs to estimate net savings. Market share methods – Gay Cook of Summit Blue Consulting adds the market share method to the NAPEE list. Market share methods, which are often used in market effects studies (see definition of market effects on pages 10-11), compare aggregated sales volumes of a particular technology in a specific location with an estimate of the baseline sales volume that would have been sold in the program’s absence (market sales approach) or use observations at two points in time of the share of existing equipment stock that is high efficiency (saturation data analysis).35
���Determinations of gross and net savings levels tend to take on increasing importance in jurisdictions that provide utilities (or other administrators) financial incentives for superior performance relative to goals.36 And, as the financial incentives increase in size, the scrutiny applied to factors that influence such incentives also increases. These factors include net-to-gross ratios and other elements associated with the estimation of program impacts. This is particularly evident in California, which in January 2009 indefinitely suspended its “risk-reward incentive mechanism”. This action was related to the feeling that the incentive mechanism had become too “complicated, controversial, and ineffectual …”. As Tim Drew, a staffer for the California Public Utility Commission’s Energy Division wrote, “the implementation of this mechanism, however, has revealed fundamental flaws which lead Energy Division to propose that the EM&V process, at least as it is currently designed and administered, cannot serve as a tool to simultaneously determine incentive awards or penalties and produce accurate estimates of energy savings without protracted disputes concerning the magnitude of specific values or the fairness of allowing those values to be updated and applied retroactively.” 37
34 Econometrics is the branch of Economics that is concerned with the tasks of developing and applying quantitative or statistical methods to the study and explain economic principles. http://en.wikipedia.org/wiki/Econometric 35 Gay Cook, “Attribution Methodology Wars: Self-Report Methods Versus Statistical Number CrunchingWhich Should Win?,” (paper presented at the 2008 ACEEE Summer Study on Energy Efficiency in Buildings, August 18-22, 2008). 36 Mike Rufo, “Evaluation and Performance Incentives: Seeking Paths to (Relatively) Peaceful Coexistence," (paper presented at Counting on Energy Programs: It’s Why Evaluation Matters, Portland, Oregon: International Energy Program Evaluation Conference, August 2009), pp. 1030-1041. 37 Tim Drew, “An Assessment of California’s Energy Efficiency Incentive Mechanism,” (paper presented at Counting on Energy Programs: It’s Why Evaluation Matters, Portland, Oregon: International Energy Program Evaluation Conference, August 2009).
Exhibit No. DLS-4 Page 18 of 88
�
19
However, these factors are also becoming increasingly important as jurisdictions leverage energy efficiency in efforts to reduce greenhouse gases38 (with the added issue of attaching value to energy efficiency credits as part of efforts to establish carbon markets), allow energy efficiency and demand response programs to participate in capacity markets39, and delay or eliminate need to construct supply-side infrastructure in an increasing rate environment. And yet, it is readily acknowledged by many evaluators that estimations of net-to-gross are very difficult and often controversial.40 For example, as Carl Blumstein suggests, “current practice is to determine who is a free rider by asking program participants a series of questions to determine if it was their intention to act even in the absence of the program. But this is not reliable. As Peters and McRae (2008) point out,
‘The self-report method for measuring free-ridership assumes intentions are [perfect predictors of] behavior. If someone reports, ‘I would have done it anyway,’ they are assigned a free-ridership value of 100%. Yet any student of behavior knows that, while better than attitudes and beliefs, intentions are only a weak predictor of behavior.’”41
Further to this point, the New York State Energy and Development Authority (NYSERDA) reports that, “The largest issue for reliable net-to-gross estimates is in ascertaining whether the underlying construct of ‘what would have occurred in the absence of the program’ is being best measured. NTG analysis is measuring a hypothetical, and it can be difficult to know that the measurement is accurate.”42 The California Evaluators’ Protocols recommend use of one of three methods for determining net impacts. These methods follow:
38 National Action Plan for Energy Efficiency, Energy Efficiency as a Low-Cost Resource for Achieving Carbon Emissions Reductions. (Prepared by William Prindle, ICF International, Inc. September 2009), www.epa.gov/eeactionplan 39 This refers to the New England Independent System Operator’s (NE-ISO) and PJM’s decisions to allow energy efficiency and demand response resources to participate in these organizations capacity markets bidding programs. 40 See recent publications: Rufo (2009), Phillipp Degens, et. al., “Influence and Intention as Determinants of Free Ridership,” (paper presented at Counting on Energy Programs: It’s Why Evaluation Matters, Portland, Oregon: International Energy Program Evaluation Conference, August 2009), “Program Evaluation and Incentives for Administrators of Energy-Efficiency Programs: Can Evaluation Solve the Principal/Agent Problem?,” (paper prepared by Carl Blumstein for University of California Energy Institute Center for the Study of Energy Markets (CSEM), March 2009), p. 4, National Action Plan for Energy Efficiency, Model Energy Efficiency Program Impact Evaluation Guide, p. 5-1. The California Evaluation Framework also highlights the issue on page 135. 41 Blumstein, “Program Evaluation and Incentives for Administrators of Energy-Efficiency Programs: Can Evaluation Solve the Principal/Agent Problem?” 42 New York State Energy Research Development Authority, New York State Energy Research and Development Authority Transition Plan for Enhancing Program Evaluation, Proceeding on Motion of the Commission Regarding an Energy Efficiency Portfolio Standard (Case 07-M-0548), August 22, 2008.
Exhibit No. DLS-4 Page 19 of 88
�
20
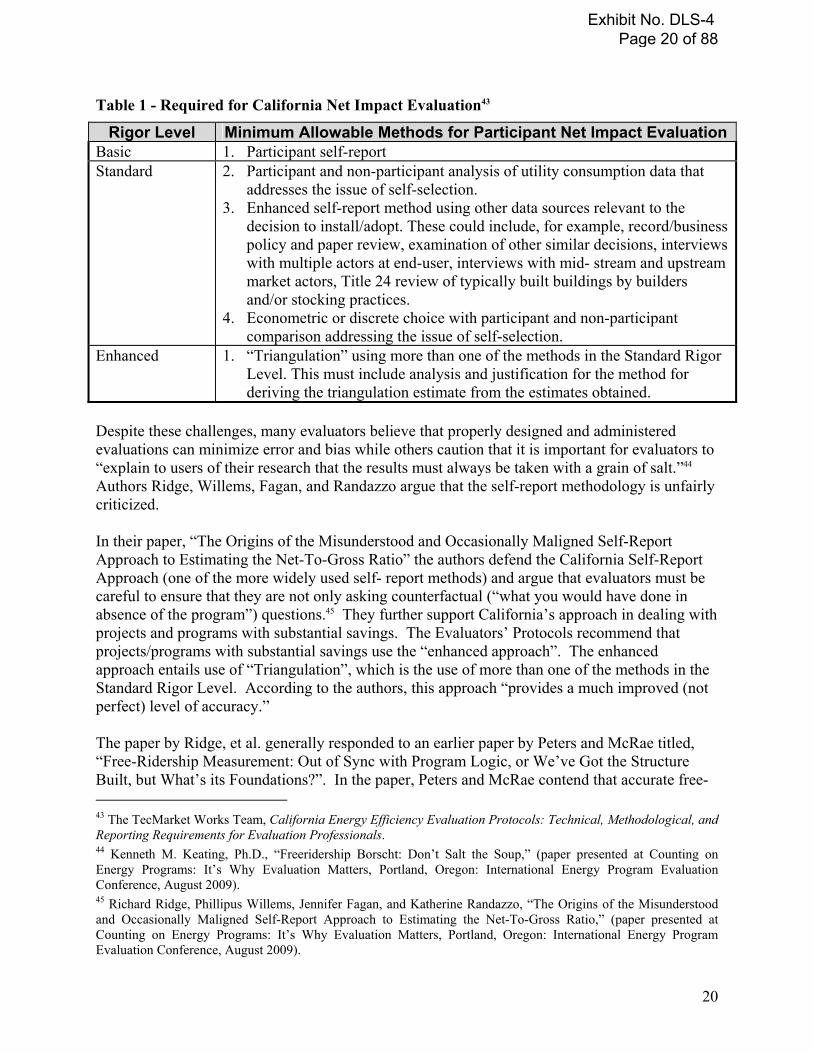
Table 1 - Required for California Net Impact Evaluation43
Rigor Level Minimum Allowable Methods for Participant Net Impact Evaluation Basic 1. Participant self-report Standard 2. Participant and non-participant analysis of utility consumption data that
addresses the issue of self-selection. 3. Enhanced self-report method using other data sources relevant to the
decision to install/adopt. These could include, for example, record/business policy and paper review, examination of other similar decisions, interviews with multiple actors at end-user, interviews with mid- stream and upstream market actors, Title 24 review of typically built buildings by builders and/or stocking practices.
4. Econometric or discrete choice with participant and non-participant comparison addressing the issue of self-selection.
Enhanced 1. “Triangulation” using more than one of the methods in the Standard Rigor Level. This must include analysis and justification for the method for deriving the triangulation estimate from the estimates obtained.
Despite these challenges, many evaluators believe that properly designed and administered evaluations can minimize error and bias while others caution that it is important for evaluators to “explain to users of their research that the results must always be taken with a grain of salt.”44 Authors Ridge, Willems, Fagan, and Randazzo argue that the self-report methodology is unfairly criticized. In their paper, “The Origins of the Misunderstood and Occasionally Maligned Self-Report Approach to Estimating the Net-To-Gross Ratio” the authors defend the California Self-Report Approach (one of the more widely used self- report methods) and argue that evaluators must be careful to ensure that they are not only asking counterfactual (“what you would have done in absence of the program”) questions.45 They further support California’s approach in dealing with projects and programs with substantial savings. The Evaluators’ Protocols recommend that projects/programs with substantial savings use the “enhanced approach”. The enhanced approach entails use of “Triangulation”, which is the use of more than one of the methods in the Standard Rigor Level. According to the authors, this approach “provides a much improved (not perfect) level of accuracy.” The paper by Ridge, et al. generally responded to an earlier paper by Peters and McRae titled, “Free-Ridership Measurement: Out of Sync with Program Logic, or We’ve Got the Structure Built, but What’s its Foundations?”. In the paper, Peters and McRae contend that accurate free- 43 The TecMarket Works Team, California Energy Efficiency Evaluation Protocols: Technical, Methodological, and Reporting Requirements for Evaluation Professionals. 44 Kenneth M. Keating, Ph.D., “Freeridership Borscht: Don’t Salt the Soup,” (paper presented at Counting on Energy Programs: It’s Why Evaluation Matters, Portland, Oregon: International Energy Program Evaluation Conference, August 2009). 45 Richard Ridge, Phillipus Willems, Jennifer Fagan, and Katherine Randazzo, “The Origins of the Misunderstood and Occasionally Maligned Self-Report Approach to Estimating the Net-To-Gross Ratio,” (paper presented at Counting on Energy Programs: It’s Why Evaluation Matters, Portland, Oregon: International Energy Program Evaluation Conference, August 2009).
Exhibit No. DLS-4 Page 20 of 88
�
21
ridership estimation is elusive and serves to distract from more important questions about energy behavior.46 Peters and McRae instead recommend that evaluations for net impacts focus on the market as opposed to the end-user. As will be discussed later in this paper, this is one of the approaches California is taking in evaluating market effects from some of its programs. But, as introduced earlier in this analysis, yet another issue with respect to measuring net savings is the proliferation of influences on customer decision making. For example, local and statewide initiatives to educate customers about reducing their energy use and implement new codes and standards likely complicate efforts to measure the utility program’s influence on the customer. For example, with a traditional rebate-based energy efficiency program, the participating customer may be asked if the incentive she received from the utility was the determining factor in her purchase of the energy efficient measure. Due to the profusion of (non-utility) messages she has received encouraging the purchase, she may be uncertain of why she made the specific purchase and be deemed a free rider. In a perfect world, an evaluator may be able to tease out all the various factors that contributed to the person’s decision and ultimately attribute “credit” to the relevant entity. The reality is that the attribution conundrum remains and becomes more complicated with the increased number (and effectiveness) of such influences. Ultimately, creating a construct that facilitates coordination among the various influencers may prove the most effective (although perhaps also the most difficult). In sum, measuring net-to-gross ratios can tend to more of an art than a science. “Essentially, one is attempting to separate out the influence of a particular energy efficiency program (or portfolio) from all the other influences that determine participant and non-participant behavior and decisions.”47 Despite its imperfections, net-to-gross measurement and use of such measurement remain an important element of most U.S. energy efficiency programs. This is the case because the reason such calculations exist remains as vital as ever, perhaps increasingly so because of the many influences on customer decision making. Program administrators need to ensure that their efforts are linked, preferably causally linked, to energy efficient outcomes or such efforts will be a waste of resources and even worse, possibly destructive to energy efficiency efforts.48 However, the complexion of NTG approaches is evolving as energy efficiency programs advance. So, what are the current trends in the area of net-to-gross?
��Due to the difficulties in measuring NTG, it would seem that many jurisdictions might be reconsidering their use of net-to-gross ratios to assess the influence of utility programs on customer energy savings activities. However, this does not seem to be the case. Rather,
46 Jane Peters and Marjorie McRae, Free-Ridership Measurement If Out of Sync with Program Logic . . . or, We’ve Got the Structure Built, but What’s Its Foundations? (paper presented at the 2008 ACEEE Summer Study on Energy Efficiency in Buildings, American Council for an Energy Efficiency Economy). 47 National Action Plan for Energy Efficiency, Model Energy Efficiency Program Impact Evaluation Guide, p. 5-1. 48 For example, if a poorly run program creates negative public perceptions towards energy efficiency this situation may or may not be revealed through NTG analyses and instead may speak to the importance of general impact and process evaluations, areas of study beyond the scope of this analysis.
Exhibit No. DLS-4 Page 21 of 88
�
22
jurisdictions seem to be refining the ways in which they estimate net-to-gross ratios, experimenting with new approaches to energy efficiency programs and, in some fairly prominent cases, very consciously modifying the manner in which they calculate and use net-to-gross ratios. NYSERDA, in its Transition Plan for Enhancing Program Evaluation recognizes the challenge of conducting net-to-gross evaluation in an environment with multiple program administrators, and has committed to work with other administrators to identify spillover and put into place mechanisms to ascertain which administrators are responsible for the spillover that is occurring. 49 NYSERDA’s report continues, “Standard industry approaches for evaluating net savings, in order of generally-accepted reliability, include deemed net-to-gross (NTG) ratios, self-report surveys, enhanced self-report surveys, econometric methods, and triangulation based upon the use of multiple methods.”50 In response to evolving circumstances, NYSERDA concludes that its methods of evaluation must also evolve to maintain their accuracy. NYSERDA has produced a series of technical manuals that provide the “Standard Approach for Estimating Energy Savings” for Single Family Residential, Commercial and Industrial, and Multifamily energy efficiency programs. These manuals establish default NTGRs of 0.90 and state that, “as program evaluations are completed this factor will be adjusted up or down as appropriate by program, for each measure included in this manual.”51 California has long-standing policies requiring use of net-to-gross ratios for calculating energy efficiency program achievements. In addition, the state requires extensive evaluation, measurement and verification of programs. Two policy documents serve to guide development and evaluation of California’s energy efficiency programs. The documents include: The California Energy Efficiency Evaluation Protocols: Technical, Methodological, and Reporting Requirements for Evaluation Professionals [“Evaluators’ Protocols”] (April 2006) and the Energy Efficiency Policy Manual, Version 4.0 (March 2008). Due to their comprehensiveness, these documents also serve as essential guides for program development and evaluation outside of California. The Evaluators’ Protocols notably require that program evaluations estimate free ridership and participant spillover in evaluation reports but do not include market effects or non-participant
49 New York State Energy Research Development Authority, New York State Energy Research and Development Authority Transition Plan for Enhancing Program Evaluation, p. 11. 50 Ibid., p. 10. 51 New York Evaluation Advisory Contract Team, New York Standard Approach for Estimating Energy Savings from Energy Efficiency Programs: Single Family Residential Measures (prepared for New York Department of Public Service, December 16, 2009); New York Evaluation Advisory Contract Team, New York Standard Approach for Estimating Energy Savings from Energy Efficiency Measures in Commercial and Industrial Programs (prepared for New York Department of Public Service, September 1, 2009); New York Evaluation Advisory Contract Team, New York Standard Approach for Estimating Energy Savings from Energy Efficiency Measures in Multifamily Programs (prepared for New York Department of Public Service, July 9, 2009).
Exhibit No. DLS-4 Page 22 of 88
�
23
spillover in savings estimates for goal attainment.52 The California Public Utilities Commission recently suspended this decision and directed its staff to “assess our existing EM&V protocols, the availability of data, the credibility of estimating savings, the gain from doing so relative to any incremental evaluation costs, to determine if there are participant spillover market effects that should be attributed to ratepayer-supported programs beginning with the next program cycle (2009-2011).”53 The CPUC also directed its staff to propose possible revisions to market effects protocols, utility savings goals, and/or performance incentive mechanisms for subsequent action by the CPUC. The CPUC is currently examining market effects in three areas: CFLs, residential new construction, and high-bay lighting. Taking this concept a step further, the CPUC in D.08-07-047 adopted “gross goals” for utility performance in program years 2010-2012, because the Commission determined that long-term goals established in 2004 were now out of date and more applicable to gross as opposed to net estimates of achievement (in other words, the goals were set too high) and that a number of factors had changed since goals were first established. The Commission explained, “For example, the net-to-gross and expected useful life assumptions in the 2009-2011 goals are about ten years old. Further, the model for current goals assumed there would be no further improvements in Title 24 or state and federal appliance standards.”54 However, the CPUC stopped short of adopting its Staff’s (and Itron, Inc.’s) recommendations that the Commission implement “expansive net” goals. Expansive net goals would include Current Net Program savings + Utility program-induced market effects. This redefinition was intended to “widen the scope of utility programs and align policy mechanisms with this objective.” Staff believed that, to reach the next level of energy efficiency achievements, the CPUC would have to direct utilities to obtain savings through a wider variety of methods and program designs in addition than traditional incentive programs.55 This theme was echoed in Energy Division staffer Tim Drew’s recent paper on California’s risk-reward incentive mechanism. In the paper, Drew explains Staff’s belief that the incentive mechanism encourages pursuit of measures that produce the most net benefits (energy efficiency program avoided supply-side costs [benefits] minus costs to run the programs and measure costs [costs]) and discourages pursuit of maximum amounts of energy efficiency. 56 But, there is still more to the story. In D.08-07-047, the Commission stated, “The change from net to gross goals only affects the calculation of the minimum performance standard of the 52 The TecMarket Works Team, California Energy Efficiency Evaluation Protocols: Technical, Methodological, and Reporting Requirements for Evaluation Professionals, p. 3. As a reminder, participant spillover is additional energy efficiency actions that program participants take outside the program as a result of having participated in the program (e.g. buy and install a second CFL even though they only received a rebate for the first one). 53 California Public Utilities Commission, D. 07-10-032, Interim Opinion on Issues Relating to Future Savings Goals and Program Planning for 2009-2011 Energy Efficiency and Beyond, California Public Utilities Commission, October 18, 2007, p. 111. 54 California Public Utilities Commission, D. 08-07-047, Decision Adopting Interim Energy Efficiency Savings Goals for 2012 through 2020, and Defining Energy Efficiency Savings Goals for 2009 through 2011, July 31, 2008, p. 25. Title 24 contains California’s energy efficiency standards for residential and non-residential buildings. 55 California Public Utilities Commission, “Energy Division Staff Paper: 2012-2020 Energy Efficiency Goal Setting: Technical and Policy Issues,” May 12, 2008, pp. 14-15. 56 Drew, “An Assessment of California’s Energy Efficiency Incentive Mechanism,” p. 1043.
Exhibit No. DLS-4 Page 23 of 88
�
24
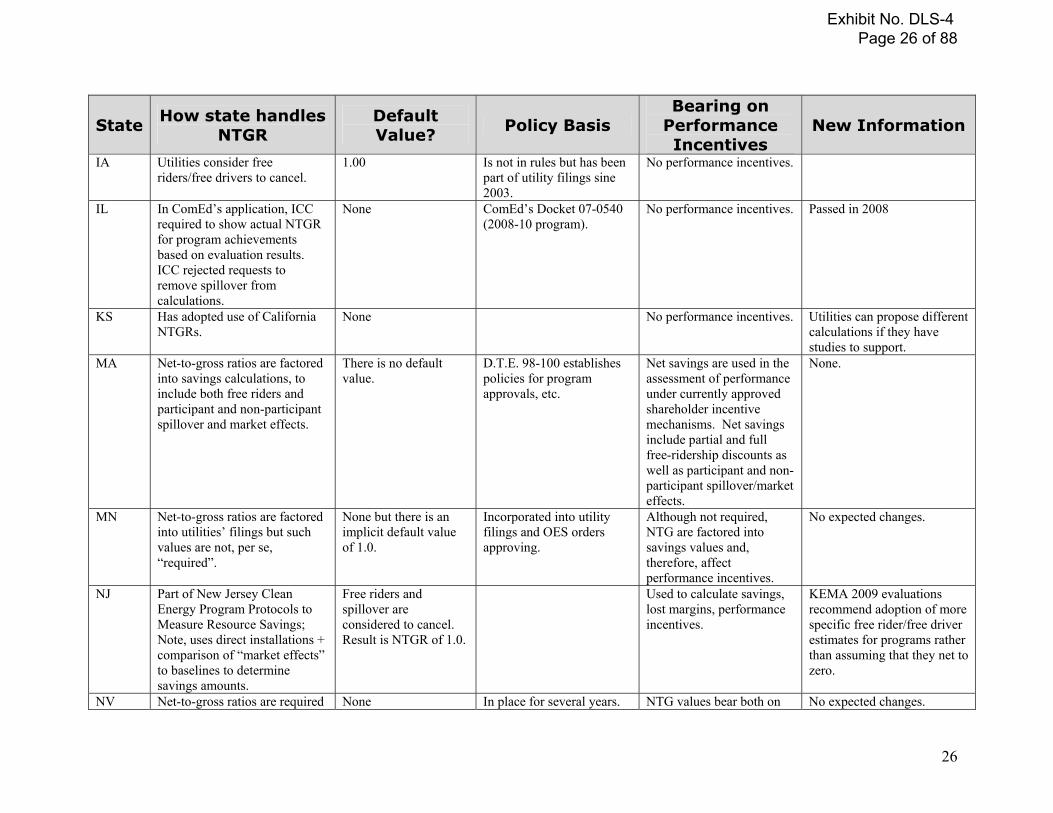
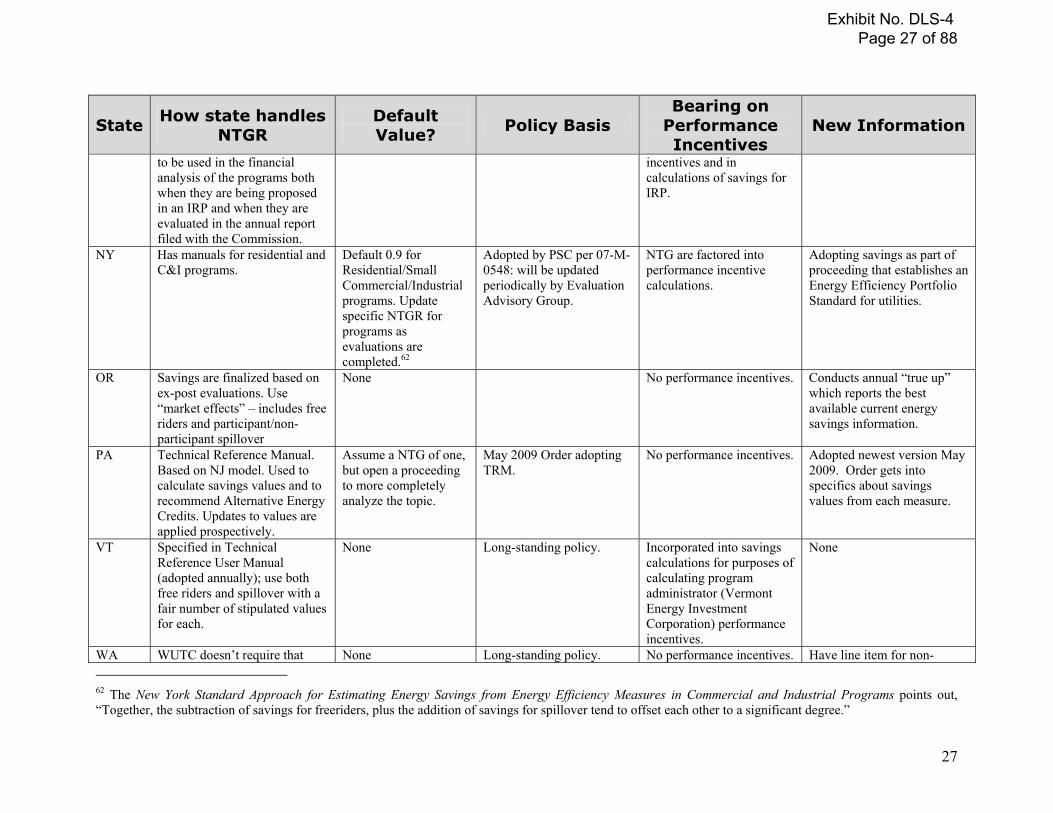
Risk/Reward Incentive Mechanism adopted in D.07-09-043 and does not impact the calculation of the performance earnings basis also adopted in that decision. The performance earnings basis remains calculated using net benefits.”57 So, with respect to calculating incentives, the Commission determined that gross achievements would apply to the determination of whether a utility had met the minimum performance standard (savings threshold at which utilities begin to earn shareholder incentives) but not to the calculation of net benefits (utility achievements relative to goals determine the percentage of net benefits they are awarded for shareholder incentives). Subsequent decisions have reaffirmed this position regarding shareholder incentives; however, the decisions have deferred “final” determinations regarding treatment of gross versus net savings in shareholder incentives calculations to a rulemaking docket the CPUC opened to discuss revisions to the shareholder incentive mechanism (R.09-01-019).58 It is anticipated that R. 09-01-019 will produce a decision on this topic in early 2010. Perhaps more important is the CPUC’s decision to change its requirement that utilities use “ex-ante” estimates of measure savings for goal setting but “ex-post” estimates for determining achievements.59 The PUC had previously required that utilities “true-up” their reported savings based on ex-post measurement and verification studies. Now, the utilities’ savings estimates will use ex-ante values for estimating measure, program and portfolio savings. However, the PUC again deferred the decision regarding whether this ex-ante treatment of savings calculations would apply to determination of shareholder savings.60 Nonetheless, the Decision approving utilities’ 2010-2012 programs “freezes” for purposes of “measuring portfolio performance against goals over the program cycle”, savings calculations based on ex-ante values.61 This discussion of California’s trials and tribulations with respect to handling of net-to-gross issues, particularly as they relate to determining shareholder incentives is illustrative of the complexity and potential controversy associated with these issues. Interestingly, though, California stands among a handful of states that do not allow use of spillover estimates in calculations of energy savings. The table below provides a quick survey of a number of states in terms of the way they handle net-to-gross issues. As is evident, most use net-to-gross ratios that incorporate spillover. 57 California Public Utilities Commission, D. 08-07-047, p. 25. 58 California Public Utilities Commission, Proposed Decision of ALJ Gamson, Interim Decision Determining Policy and Counting Issues for 2009 to 2011 Energy Efficiency Programs, April 21, 2009; California Public Utilities Commission, D. 09-09-047, Decision Approving 2010-2012 Energy Efficiency Portfolios and Budgets, September 24, 2009. 59 According to the Evaluators’ Protocols (p. 226), ex-ante savings estimates refer to “administrator-forecasted savings used for program and portfolio planning purposes as filed with the CPUC, from the Latin for ‘beforehand’” while ex-post evaluation estimated savings refers to “savings estimates reported by the independent evaluator after the energy impact evaluation and the associated M&V efforts have been completed. If only the term ‘ex-post savings’ is used, it will be assumed that it is referring to the ex-post evaluation estimate, the most common usage, from the Latin for ‘from something done afterward.’” 60 California Public Utilities Commission, Assigned Commission and Administrative Law Judge Ruling Regarding Policy Issues, February 25, 2009, p. 3. 61 California Public Utilities Commission, D.09-09-047, p. 44.
Exhibit No. DLS-4 Page 24 of 88
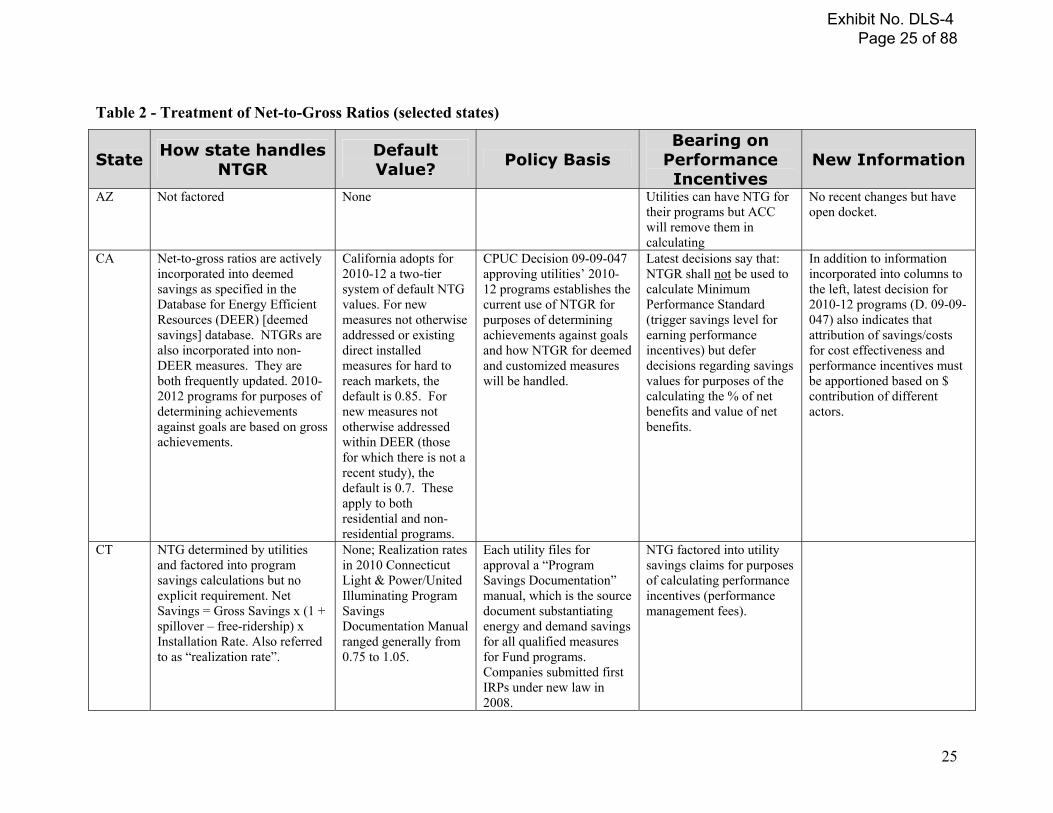
25
Table 2 - Treatment of Net-to-Gross Ratios (selected states)
State How state handles NTGR
Default Value? Policy Basis
Bearing on Performance Incentives
New Information
AZ Not factored None Utilities can have NTG for their programs but ACC will remove them in calculating
No recent changes but have open docket.
CA Net-to-gross ratios are actively incorporated into deemed savings as specified in the Database for Energy Efficient Resources (DEER) [deemed savings] database. NTGRs are also incorporated into non-DEER measures. They are both frequently updated. 2010-2012 programs for purposes of determining achievements against goals are based on gross achievements.
California adopts for 2010-12 a two-tier system of default NTG values. For new measures not otherwise addressed or existing direct installed measures for hard to reach markets, the default is 0.85. For new measures not otherwise addressed within DEER (those for which there is not a recent study), the default is 0.7. These apply to both residential and non-residential programs.
CPUC Decision 09-09-047 approving utilities’ 2010-12 programs establishes the current use of NTGR for purposes of determining achievements against goals and how NTGR for deemed and customized measures will be handled.
Latest decisions say that: NTGR shall not be used to calculate Minimum Performance Standard (trigger savings level for earning performance incentives) but defer decisions regarding savings values for purposes of the calculating the % of net benefits and value of net benefits.
In addition to information incorporated into columns to the left, latest decision for 2010-12 programs (D. 09-09-047) also indicates that attribution of savings/costs for cost effectiveness and performance incentives must be apportioned based on $ contribution of different actors.
CT NTG determined by utilities and factored into program savings calculations but no explicit requirement. Net Savings = Gross Savings x (1 + spillover – free-ridership) x Installation Rate. Also referred to as “realization rate”.
None; Realization rates in 2010 Connecticut Light & Power/United Illuminating Program Savings Documentation Manual ranged generally from 0.75 to 1.05.
Each utility files for approval a “Program Savings Documentation” manual, which is the source document substantiating energy and demand savings for all qualified measures for Fund programs. Companies submitted first IRPs under new law in 2008.
NTG factored into utility savings claims for purposes of calculating performance incentives (performance management fees).
Exhibit No. DLS-4 Page 25 of 88
�
26
State How state handles NTGR
Default Value? Policy Basis
Bearing on Performance Incentives
New Information
IA Utilities consider free riders/free drivers to cancel.
1.00 Is not in rules but has been part of utility filings sine 2003.
No performance incentives.
IL In ComEd’s application, ICC required to show actual NTGR for program achievements based on evaluation results. ICC rejected requests to remove spillover from calculations.
None ComEd’s Docket 07-0540 (2008-10 program).
No performance incentives. Passed in 2008
KS Has adopted use of California NTGRs.
None No performance incentives. Utilities can propose different calculations if they have studies to support.
MA Net-to-gross ratios are factored into savings calculations, to include both free riders and participant and non-participant spillover and market effects.
There is no default value.
D.T.E. 98-100 establishes policies for program approvals, etc.
Net savings are used in the assessment of performance under currently approved shareholder incentive mechanisms. Net savings include partial and full free-ridership discounts as well as participant and non-participant spillover/market effects.
None.
MN Net-to-gross ratios are factored into utilities’ filings but such values are not, per se, “required”.
None but there is an implicit default value of 1.0.
Incorporated into utility filings and OES orders approving.
Although not required, NTG are factored into savings values and, therefore, affect performance incentives.
No expected changes.
NJ Part of New Jersey Clean Energy Program Protocols to Measure Resource Savings; Note, uses direct installations + comparison of “market effects” to baselines to determine savings amounts.
Free riders and spillover are considered to cancel. Result is NTGR of 1.0.
Used to calculate savings, lost margins, performance incentives.
KEMA 2009 evaluations recommend adoption of more specific free rider/free driver estimates for programs rather than assuming that they net to zero.
NV Net-to-gross ratios are required None In place for several years. NTG values bear both on No expected changes.
Exhibit No. DLS-4 Page 26 of 88
�
27
State How state handles NTGR
Default Value? Policy Basis
Bearing on Performance Incentives
New Information
to be used in the financial analysis of the programs both when they are being proposed in an IRP and when they are evaluated in the annual report filed with the Commission.
incentives and in calculations of savings for IRP.
NY Has manuals for residential and C&I programs.
Default 0.9 for Residential/Small Commercial/Industrial programs. Update specific NTGR for programs as evaluations are completed.62
Adopted by PSC per 07-M-0548: will be updated periodically by Evaluation Advisory Group.
NTG are factored into performance incentive calculations.
Adopting savings as part of proceeding that establishes an Energy Efficiency Portfolio Standard for utilities.
OR Savings are finalized based on ex-post evaluations. Use “market effects” – includes free riders and participant/non-participant spillover
None No performance incentives. Conducts annual “true up” which reports the best available current energy savings information.
PA Technical Reference Manual. Based on NJ model. Used to calculate savings values and to recommend Alternative Energy Credits. Updates to values are applied prospectively.
Assume a NTG of one, but open a proceeding to more completely analyze the topic.
May 2009 Order adopting TRM.
No performance incentives. Adopted newest version May 2009. Order gets into specifics about savings values from each measure.
VT Specified in Technical Reference User Manual (adopted annually); use both free riders and spillover with a fair number of stipulated values for each.
None Long-standing policy. Incorporated into savings calculations for purposes of calculating program administrator (Vermont Energy Investment Corporation) performance incentives.
None
WA WUTC doesn’t require that None Long-standing policy. No performance incentives. Have line item for non- 62 The New York Standard Approach for Estimating Energy Savings from Energy Efficiency Measures in Commercial and Industrial Programs points out, “Together, the subtraction of savings for freeriders, plus the addition of savings for spillover tend to offset each other to a significant degree.”
Exhibit No. DLS-4 Page 27 of 88
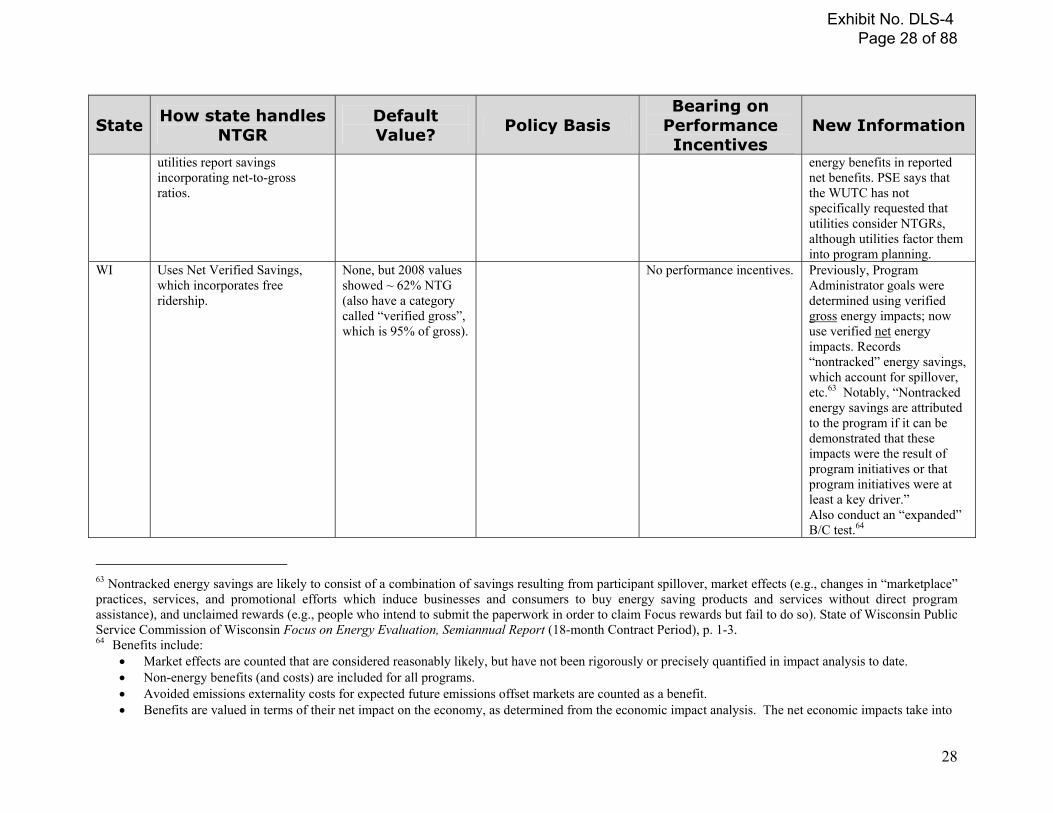
�
28
State How state handles NTGR
Default Value? Policy Basis
Bearing on Performance Incentives
New Information
utilities report savings incorporating net-to-gross ratios.
energy benefits in reported net benefits. PSE says that the WUTC has not specifically requested that utilities consider NTGRs, although utilities factor them into program planning.
WI Uses Net Verified Savings, which incorporates free ridership.
None, but 2008 values showed ~ 62% NTG (also have a category called “verified gross”, which is 95% of gross).
No performance incentives. Previously, Program Administrator goals were determined using verified gross energy impacts; now use verified net energy impacts. Records “nontracked” energy savings, which account for spillover, etc.63 Notably, “Nontracked energy savings are attributed to the program if it can be demonstrated that these impacts were the result of program initiatives or that program initiatives were at least a key driver.” Also conduct an “expanded” B/C test.64
63 Nontracked energy savings are likely to consist of a combination of savings resulting from participant spillover, market effects (e.g., changes in “marketplace” practices, services, and promotional efforts which induce businesses and consumers to buy energy saving products and services without direct program assistance), and unclaimed rewards (e.g., people who intend to submit the paperwork in order to claim Focus rewards but fail to do so). State of Wisconsin Public Service Commission of Wisconsin Focus on Energy Evaluation, Semiannual Report (18-month Contract Period), p. 1-3. 64 Benefits include:
� Market effects are counted that are considered reasonably likely, but have not been rigorously or precisely quantified in impact analysis to date. � Non-energy benefits (and costs) are included for all programs. � Avoided emissions externality costs for expected future emissions offset markets are counted as a benefit. � Benefits are valued in terms of their net impact on the economy, as determined from the economic impact analysis. The net economic impacts take into
Exhibit No. DLS-4 Page 28 of 88

�
account the economic ripple effects on the Wisconsin economy of energy savings and associated non-energy and emissions ef
Exhibit No. DLS-4 Page 29 of 88
30
For the Northeastern states, the Northeast Energy Efficiency Partnership is planning to develop in 2010 Net Savings Research/Guidelines as part of its EM&V Forum. These guidelines aim to “to develop greater consistency in how states in the region address and assess net savings, focusing on free-ridership, spillover, and net-to-gross ratios.”65 This study should provide additional interesting and useful information when complete. The table demonstrates that, for the selection of jurisdictions analyzed, most use net-to-gross ratios to calculate savings levels. In addition, most jurisdictions that use NTG and have performance incentives use net values for purposes of calculating savings for performance incentives. Although the analysis did not include consideration of whether a jurisdiction used ex-ante or ex-post calculations of savings in determining performance incentives, California would appear to stand as one of the few states that subjected program administrators to possible diminution of performance incentives based on ex-post evaluations (as previously discussed, California has not carried this approach into its 2010-12 program cycle). Many jurisdictions also use deemed net savings values for those programs that have not been recently evaluated (California, New York, Minnesota are notable examples), likely for efficiency and based on studies performed. And, for some jurisdictions that do not use deemed savings values (and some that do), free riders and free drivers are either considered to cancel (Iowa, New Jersey, Pennsylvania, Minnesota) or program evaluations actively incorporate estimations of participant spillover, non-participant spillover and market effects such that net-to-gross ratios are in the .80 – 1.0 range (Massachusetts, New York, Vermont).
��Use of deemed savings (savings based on stipulated values based on historical savings values of typical projects) is fairly common and makes a great deal of sense from an administrative efficiency standpoint. Such values, if updated regularly, can also prove more than adequate for goal setting and measuring program achievements. Regulators and program administrators must, however, determine how to handle projects and programs that may not as readily lend themselves to standardization (like large industrial projects, whole house or building type projects, process improvement projects – that may vary significantly between project and be difficult to project for goal purposes). Still, even these large projects can be deemed (or at least the method used to estimate savings from these projects can be standardized) if this makes sense. In using a deemed savings approach, particularly as it relates to net-to-gross issues (the other issues are generally outside the scope of this analysis), it is important for regulators to “hold harmless” program administrators during the course of a program cycle for revelations that may reduce savings claims. For example, if a program that assumes a deemed NTGR of 0.80 determines through the course of the program that a larger number of free riders appear to be participating in the program and that this trend is sustainable (say .60), then the program administrator should be held harmless during the program cycle (meaning, retain the .80 for calculating savings) but be placed on alert that: 1) the administrator should immediately make program changes that seek to increase the NTGR level, 2) the administrator will be required in the next cycle to change its NTGR to reflect the most accurate findings, and 3) such analyses should continue to determine if this trend changes. 65 Northeast Energy Efficiency Partnership, “2010 Business Plan,” December 2, 2009, p. 41.
Exhibit No. DLS-4 Page 30 of 88
�
31
The example above assumes that the program administrator has some indication during the program cycle that free ridership levels are changing. One such way would be to establish free rider indicators that help gauge during the course of a program’s implementation whether free ridership is, indeed, an issue. This can be handled by conducting a limited sample of self-report NTGR assessments during throughout the program period. This approach would serve multiple purposes: 1) it would provide a leading indicator of trends within the program, 2) it would enable program managers and evaluators to have more timely information regarding net program effects, 3) it would enable program managers to adjust program features to potentially reduce free ridership/increase spillover, and 4) it would help overcome one of the problems associated with conducting NTGR analyses [the delay between customer implementation and survey administration]. It is important that regulators encourage such an approach by agreeing not to penalize the program administrator in those instances where the resulting surveys show higher than anticipated (deemed) levels of free ridership.
����As previously mentioned, California has adopted “gross goals” for purposes of measuring its utilities’ achievements. In other words, utility achievements for purposes of determining individual program and portfolio results do not include net-to-gross ratios. It did so, though, because it was determined that the goals set for the utilities were, indeed, gross and it would be unfair to hold the utilities to gross goals while requiring net results. So, the CPUC made the move to ensure an “apples-to-apples” comparison. Should Public Service request approval for a gross goals (and results) approach? The Company should request such a change if the goals set for purposes of determining its achievements are, in fact, at the gross level. If they are net goals, then it probably continues to make sense to use net results. But this also implies a significant policy choice on the part of utilities and regulators. Because goal setting is an essential part of the process of adopting new energy efficiency plans in Colorado (and many other jurisdictions – see Minnesota), regulators and the Company could pursue a gross goals approach and then determine the appropriate levels for these gross goals. This approach suggests that goals would be higher than they otherwise would be (because the goals do not discount for free riders) but they also suggest that the expected program achievements would also be higher (because they are not discounted by free riders). The benefits of such an approach would be to possibly reduce the degree of influence EM&V (and associated costs) has on the energy efficiency program administration process, encourage (or at least not discourage) active collaboration with other market influencers without risk of this diminishing the utility’s claimed savings (because these other market influencers could be viewed as the primary reason for the customer decision to pursue the energy efficient outcome even though the customer participated in a Public Service program – free rider), and possibly reduce the expenditure of resources (human and financial) on the EM&V process. The costs (negatives) are that this approach could reduce the role of EM&V when EM&V is considered to play a key role in the process and that such a move would discourage the utility from designing and operating their programs to minimize free ridership (and to maximize spillover). Collaborating with other market influencers does not necessarily have to result in an
Exhibit No. DLS-4 Page 31 of 88
�
32
increase in free ridership, particularly if the regulator explicitly deems such collaborations valuable and instructs the utility not to count these actions free ridership (for example, the sidebar on page 15 regarding ARRA funding points out that Pennsylvania has decided that utilities should receive full credit for projects that may be jointly funded with stimulus $ - rather than having credit either allocated proportionally or consider the participant a free rider). If the jurisdiction dedicates itself to a generalized market transformation approach to energy efficiency, shifting to gross goals might seem to make sense because the jurisdiction is attempting to maximize collaboration between all market influencers and seeking to overtly convert to the most efficient option markets for energy using activities and devices. However, even in the case where market transformation is the rule, EM&V guidelines indicate that it’s important to determine causality/attribution if for no other reason than to ensure that funds (be they ratepayer, taxpayer or other source) are being spent appropriately. So, where does this leave us? Determinations of net and gross tend to matter most in jurisdictions that have performance incentives for administrators based on savings goals and achievements (and often the larger the incentives, the more these issues matter). Further, in regions that actively incorporate electric energy savings goals into resource planning, there exists a structured way in which goals can be set and actively factored into meeting customer needs. In such cases, like Colorado’s, it makes sense to keep goals as “net” to directly relate the utility’s expenditures to its achievements. In other words, in estimating the portion of customer electric needs (kWh, kW) that will be met through energy efficiency, it is important to know the net savings levels at different expenditure levels. Although natural gas may not have resource plans, it makes sense to align the approach applied to electric and gas programs. Whatever path is pursued, it is important to ensure that goals and achievements are set on an “apples-to-apples” basis, meaning that if goals are set at the gross level, so too should achievements be measured at the gross level. If goals are determined to be at a level equivalent to gross savings, then by extension achievements should also be measured at gross. In any case, if the decision is made to pursue gross goals and achievements, this should be implemented over a period of years (say during a program cycle to prepare for the next cycle) so that all the relevant details (examples include: Should all programs be set at a gross level? Should measurements be conducted at the market level vs. on a program-by-program basis? Should program administrators implement market indicators that gauge program successes toward transformation of individual markets? Should the program administrator’s success in achieving collaboration among relevant energy efficiency players be a determinant in adopting gross goals?) As demonstrated by states like California and New York, incorporating deemed savings (and deemed net-to-gross ratios) for measures probably makes a great deal of sense as it can improve the efficiency with which programs are administered, can be developed in such a way as to incorporate the latest available evaluation information and enables the program administrator to focus on elements that are within its control (such as increasing program participation).
Exhibit No. DLS-4 Page 32 of 88
�
33
To help ensure that any deemed savings and protocols for managing both deemed and “custom” savings (those measures, activities and programs that may not lend themselves to a deemed savings approach because of the variability of savings resulting from each application), the utility should develop a reference manual and database (such as the northeastern states’ technical reference manuals or California’s Database for Energy Efficient Resources [DEER]) that explains how savings will be calculated and is updated with latest information regarding deemed savings rates. As was mentioned earlier, the northeastern utilities through the Northeast Energy Efficiency Partnership are planning to develop in 2010 Net Savings Research/Guidelines to ensure consistency among program administrators and increase transparency around M&V protocols.
���It makes sense to have clearly defined approaches to both evaluation and estimations of net savings. As California has demonstrated, though, that even well-defined approaches to evaluation and estimations of net savings can run into problems. Developing a coherent framework for evaluating programs and estimating net savings is likely easier in smaller jurisdictions than larger jurisdictions like California or New York in part because the sheer level of stakeholder involvement and multitude of competing interests increase the process’s complexity. Given the complexity of these issues and the lack of clear unanimity on how to handle net-to-gross issues, is there a clear path out the woods? The short answer is “no”. The longer answer suggests that utilities should, indeed, continue to measure net-to-gross ratios for purposes of improving program management and likely to use such methods to estimate program performance. However, significant amounts of ratepayer resources are expended to develop such estimates and, in turn, to improve their accuracy. And, as California has demonstrated, when performance incentives are involved, the EM&V process can become very contentious and consume significant amounts of human resources. Ideally, there would exist estimation methods that produced incontrovertible results and did not require many human or financial resources. However, the very essence of a system that seeks to determine how to influence customer decisions/actions and, in turn, seeks to divine the degree to which a program administrator’s actions resulted in the customer’s decisions/actions is fraught with uncertainty. Does this mean that such a system shouldn’t exist? Does this imply that all resources currently directed at EM&V should be redirected towards programmatic efforts because “EM&V is going to be rife with issues no matter what you do”? The answers to both these questions are an emphatic “no”. The system of program administrators (utility or otherwise) influencing customers to pursue energy efficient outcomes does work as evidenced by many decades of activity and successful outcomes. And, EM&V has continued to improve its ability to estimate both gross and net savings resulting from these influences. However, reasonableness should be the watchword in determining the role EM&V should play and how NTG factors into the equation. Certainly, a reasonable amount of spending on evaluation, measurement and verification is both appropriate and necessary. Particularly as shareholder incentives become larger and programs more complex, there remains a need to “check” utility performance to ensure that programs are
Exhibit No. DLS-4 Page 33 of 88
�
34
producing anticipated savings. As an extreme example, without such checks, it is conceivable that a program resulting in a substantial portion of the utility’s claimed savings could have a “real-time” net-gross-ratio close to zero, negating the value of the savings to the utility’s portfolio of resources, undermining its credibility in claiming shareholder incentives, and failing to indicate to the utility that such a program should either be cancelled or substantially revised. This is an extreme example but its description points out that lack of any E,M&V requirements could lead to unintended results. Rather, it is preferable to establish a balance between spending and reliance on E,M&V for program planning/goal setting and its use in determining overall program performance. It is argued by some that free ridership is an element over which administrators have little control (and, therefore, they should not be penalized for its emergence in a program cycle). However, the degree of control over free ridership can vary across program types, measure types, incentive strategies and more.66 Therefore, it makes sense that “a balanced assessment of the relative importance of performance, controllability, and measurability … leads to different choices regarding whether free ridership is deemed or measured ex post for different types of programs.” 67 The California PUC in its recent decision approving utilities’ 2010-2012 portfolios, determined that it needed to take a “fresh look” at “several aspects of (its) EM&V activity in California for the upcoming program cycle, to reduce unnecessary burden on staff and other resources, and streamline (the) EM&V processes.”68 In D. 05-04-051 (approved programs for 2006-8 cycle), the PUC adopted a “funding guideline” of 8% of the portfolio budget for all 2006-2008 E,M&V projects. For the 2010-2012 cycle, the PUC set the E,M&V budget at a “conservative” level of 4 percent of the overall portfolio budgets to “encourage cost efficiencies and support … efforts to streamline the scope and reporting of EM&V projects by prioritizing EM&V projects, minimizing redundant efforts, and enhancing collaborative working wherever possible.”69 The lessons from California’s experience are that E, M&V spending need not be extravagant and that E, M&V results (certainly those that fail to consider spillover) should not be considered infallible for purposes of determining program and portfolio results and shareholder incentives. In addition, program administrators and regulators should make a concerted effort to establish a clear framework for evaluating programs and measuring program impacts. This will help ensure that all factors (and relevant entities) that may influence customer decision making are involved in the process of developing effective programs and accurately estimated results. The next Chapter switches gears somewhat to discuss market transformation programs and activities. Market transformation are part of the net-to-gross, customer decision making milieu in that these programs and activities seek to achieve energy efficient results in ways that make their results difficult to quantify.
66 Drew, “Evaluation and Performance Incentives: Seeking Paths to (Relatively) Peaceful Coexistence,” p. 1034. 67 Ibid., p. 1035. 68 California Public Utilities Commission, D.09-09-047, p. 294. 69 Ibid., p. 297.
Exhibit No. DLS-4 Page 34 of 88
35
������������ This chapter provides a more in-depth discussion of market transformation, and discusses how potential for such programs can be estimated, how results from such programs and activities can be quantified, and how such activities can be incorporated into programs.
�����To repeat, this analysis adopts the following definition for market transformation programs and activities: Programs and activities whose primary purpose is to induce long-lasting sustainable changes in the structure or functioning of a market achieved by reducing barriers to the adoption of energy efficiency measures to the point where such measures become standard in that specific market. Key in this definition is the reference to “primary purpose” because it implies that the program/activity was designed, developed and implemented with the specific purpose of transforming a market.70 This is a relevant distinction as will be discussed later in this document. The focus on programs and activities also raises other questions. What is market transformation? Is it a type of energy efficiency program or activity that seeks through its design and implementation to change a market for energy efficient goods/services to the point where the program is no longer needed? Or, is it the end state when that describes the condition of a market that is dominated by energy efficient goods/services? Or, can it be both? Although this may seem confusing, the distinctions between market transformation as an end state and market transformation as a type of program or activity that seeks to achieve market transformation are much easier to discern (and, frankly, are not contradictory) than the different uses of the market transformation label to describe utility programs and activities. We’ll first talk about market transformation as an end state. Using our adopted definition, market transformation is the point at which energy efficiency measures become standard in the specific market. As the California definition in footnote 12 points out, this can happen as a result of adoption into codes or standards or otherwise substantially adopted by the market. Adoption into codes or standards is easier to define, though, than “otherwise substantially adopted” or “standard” in the specific market. Is substantially adopted or standard defined by 40% of the market, 50% of the market, 100%?71 The California 70 Stated somewhat differently, Ken Keating, et al. note that the term market transformation has been used in at least two ways: “(1) to identify a policy goal, and (2) to describe a strategic approach to intervening in the market, which is only one among many ways of getting to the policy goal.” Keating, K.M., Goldstein, D.B., Eckman, T., and Miller, P., “Wheat, Chaff and Conflicting Definitions in Market Transformation, ” (paper prepared for the 1998 American Council for an Energy-Efficient Economy Summer Study on Energy Efficiency in Buildings, 1998), p. 157-170.. 71 Dan York points out that market transformation is certainly a lofty goal. He cites Blumstein, et al., who state, “Private new product market transformation initiatives are subjected to a direct and immediate market test. Indeed,
Exhibit No. DLS-4 Page 35 of 88
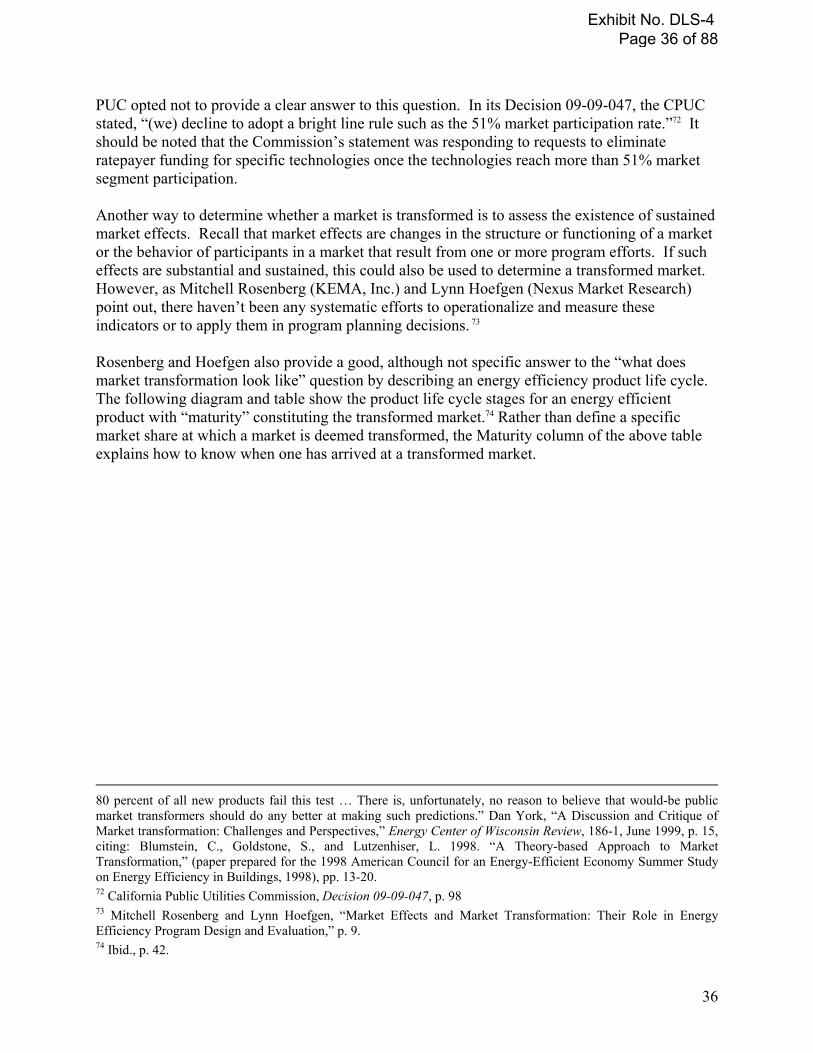
�
36
PUC opted not to provide a clear answer to this question. In its Decision 09-09-047, the CPUC stated, “(we) decline to adopt a bright line rule such as the 51% market participation rate.”72 It should be noted that the Commission’s statement was responding to requests to eliminate ratepayer funding for specific technologies once the technologies reach more than 51% market segment participation. Another way to determine whether a market is transformed is to assess the existence of sustained market effects. Recall that market effects are changes in the structure or functioning of a market or the behavior of participants in a market that result from one or more program efforts. If such effects are substantial and sustained, this could also be used to determine a transformed market. However, as Mitchell Rosenberg (KEMA, Inc.) and Lynn Hoefgen (Nexus Market Research) point out, there haven’t been any systematic efforts to operationalize and measure these indicators or to apply them in program planning decisions. 73 Rosenberg and Hoefgen also provide a good, although not specific answer to the “what does market transformation look like” question by describing an energy efficiency product life cycle. The following diagram and table show the product life cycle stages for an energy efficient product with “maturity” constituting the transformed market.74 Rather than define a specific market share at which a market is deemed transformed, the Maturity column of the above table explains how to know when one has arrived at a transformed market.
80 percent of all new products fail this test … There is, unfortunately, no reason to believe that would-be public market transformers should do any better at making such predictions.” Dan York, “A Discussion and Critique of Market transformation: Challenges and Perspectives,” Energy Center of Wisconsin Review, 186-1, June 1999, p. 15, citing: Blumstein, C., Goldstone, S., and Lutzenhiser, L. 1998. “A Theory-based Approach to Market Transformation,” (paper prepared for the 1998 American Council for an Energy-Efficient Economy Summer Study on Energy Efficiency in Buildings, 1998), pp. 13-20. 72 California Public Utilities Commission, Decision 09-09-047, p. 98 73 Mitchell Rosenberg and Lynn Hoefgen, “Market Effects and Market Transformation: Their Role in Energy Efficiency Program Design and Evaluation,” p. 9. 74 Ibid., p. 42.
Exhibit No. DLS-4 Page 36 of 88
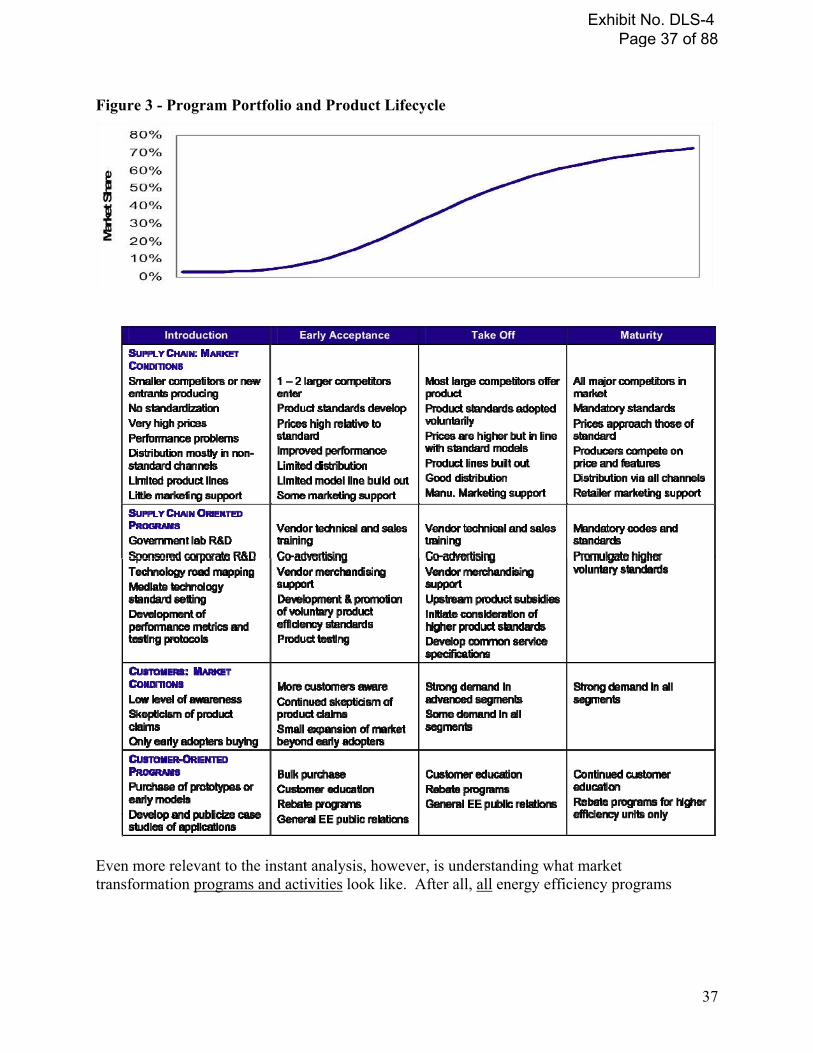
�
37
Figure 3 - Program Portfolio and Product Lifecycle
Even more relevant to the instant analysis, however, is understanding what market transformation programs and activities look like. After all, all energy efficiency programs
Exhibit No. DLS-4 Page 37 of 88
�
38
(certainly those that are actively monitored for success), unless they are serving a discrete short-term purpose, should strive ultimately to achieve market transformation.75 Despite the vagueness associated with determining whether a market is transformed, market transformation as an end state is in some ways is easier to pin down than the category of programs and activities termed market transformation programs.76 As has already been discussed in contrasting the definitions of market transformation in the Colorado gas rules with the definition adopted for this paper, market transformation programs and activities can mean different things to different people. This occurs because over the years a variety of programs have been labeled, sometimes incorrectly, market transformation programs. In some common misperceptions, any program that simply seeks to educate consumers about energy efficiency or otherwise lacks specific quantifiable energy savings goals might be termed market transformation. However, seasoned practitioners of market transformation strategies would probably react harshly to the characterization of educational program as market transformation because these practitioners view market transformation as a more comprehensive approach to achieving energy efficient outcomes, one that requires considerable forethought, sustained action and continuous revision. For example, the following lists give an indication of one perspective on what is involved in running a “true” market transformation program. ACEEE’s Dan York (then with the Energy Center of Wisconsin) explains that market transformation programs typically include the following steps (not necessarily in this sequence):
1. Establish infrastructure to lead and manage the market transformation initiative. This could take the form of an organization such as NEEA (Northwest Energy Efficiency Alliance) or NEEP (Northeast Energy Efficiency Partnership), or it could be an existing organization that takes on this responsibility (a state or national energy department or other public organization).
2. Establish funding to cover costs of the intervention(s) (program costs). 3. Identify market participants (manufacturers, retailers, consumers) and stakeholders
(such as public energy offices, advocacy groups, trade organizations). 4. Form collaborative among key market participants and stakeholders. 5. Define roles of participants in the collaborative. 6. Define markets in which to intervene. 7. Choose target products or services within the chosen market. 8. Measure market baselines against which intervention(s) will be evaluated. 9. Define program (intervention) goals. 10. Design strategies and measures for the intervention.
75 Programs with discrete short-term objectives might include pilot programs, programs that are intended simply to delay purchase of a supply-side alternative, or education programs with the sole purpose of raising awareness about energy efficiency. 76 Evidenced by Colorado Governor Ritter’s use of the term “market transformation”, its use is not confined to energy efficiency markets. See “Testimony before the House Select Committee on Energy Independence and Global Warming,” Bill Ritter, Jr., Governor of Colorado, September 20, 2007. In this speech, Governor Ritter refers to the incipient electrified transportation industry and the fact that the industry will require assistance to become transformed.
Exhibit No. DLS-4 Page 38 of 88
�
39
11. Implement measures. 12. Evaluate results of the program. 13. Develop and implement a transition (exit) strategy. 14. Continue to monitor and evaluate market developments. 15. Continue intervention as indicated by monitoring and evaluation results.
In addition, York explains that, “Implementation of market transformation programs requires adoption of numerous, coordinated measures targeted to various market participants.” These typically may include:
� marketing � rebates or other consumer incentives to increase consumer acceptance � labeling � manufacturer and retailer incentives � consumer education � professional training (e.g., sales associates, skilled tradespeople, contractors,
manufacturers) � support for research and development � codes and standards � technology procurement (specifying required performance of technologies and
aggregating customers to create sufficient demand for suppliers to respond to performance requirements)
� other types of bulk purchasing or buyer aggregation to create market pull � design competitions based on desired performance77
From this perspective, market transformation programs and strategies “require collaboration among a diverse set of market actors, including utilities, manufacturers, retailers, and efficiency advocates.”78 Such requirements have led to development of regional market transformation organizations such as the Northwest Energy Efficiency Alliance (NEEA), the Midwest Energy Efficiency Alliance (MEEA) and the Northeast Energy Efficiency Partnerships, Inc. (NEEP), statewide organizations such as the Energy Trust of Oregon, Efficiency Vermont, Efficiency Maine, Connecticut Clean Energy Fund, New York State Energy Research and Development Authority (NYSERDA), and Wisconsin Focus on Energy, and national organizations such as the Consortium for Energy Efficiency (CEE).79 The U.S. Environmental Protection Agency’s ENERGY STAR® program can also be considered a “true” market transformation program. From this perspective, market transformation programs are typically “bigger” than other types of programs in that they are seeking as part of their program theory, program logic and design to accomplish more fundamental changes in the way markets operate.80 True market transformation 77 York, “A Discussion and Critique of Market transformation: Challenges and Perspectives,” pp. 10-11. 78 Ibid., p. 9. 79 This is not an exhaustive list of organizations that have market transformation among their primary objectives. 80 As ACEEE’s Dan York points out in a presentation on Administrative Models for EE, “Markets know no boundaries”. Most states are “small” relative to markets for the products and services targeted by energy efficiency programs. Utility and statewide public benefits programs have long recognized the need for regional and national
Exhibit No. DLS-4 Page 39 of 88
�
40
programs have the capacity and scope to change markets for particular products such that the energy efficient option becomes the standard in that market. Two key terms are important here, namely, “market” and “standard”. Is it possible for an energy efficiency program administrator in Colorado Springs to transform the market for residential lighting such that sale and installation of compact fluorescent bulbs (CFLs) constitute 60 percent of the market for sale and installation of light bulbs in Colorado Springs yet nearby Pueblo, Colorado is only selling and installing 10 percent CFLs? Is Colorado Springs’ residential lighting market transformed even though Colorado’s residential market clearly is not? The answers to these questions depend heavily on how one defines the “market” for purposes of determining whether the market has been transformed. Similarly, much depends on what one defines as “standard”. It’s fair to say that, although the ultimate objective for market transformation program may be to transform a market for an energy efficiency product to the point where that measure is standard in that market, much depends on the goals the program sets for itself. In this sense, if the program meets various other qualifications to be defined as market transformation, the market and ultimate goals may not matter as much as the path the program takes to get there. In reality, the relevance of the ultimate goal or defining what constitutes the program’s “market” is more applicable to decisions about when to reduce or remove program activities (because the market is transformed). Still, it makes sense to regularly measure the program’s progress in transforming the market, both to adjust program design and implementation and to estimate the program’s impacts. The following table shows two technologies that have been transformed as a result of a variety of activities.
approaches. Dan York, “Making it Work: Administrative models for MT (and EE) Programs,” (presentation to the 2009 National Symposium on Market Transformation, March 2009), p. 27.
Exhibit No. DLS-4 Page 40 of 88
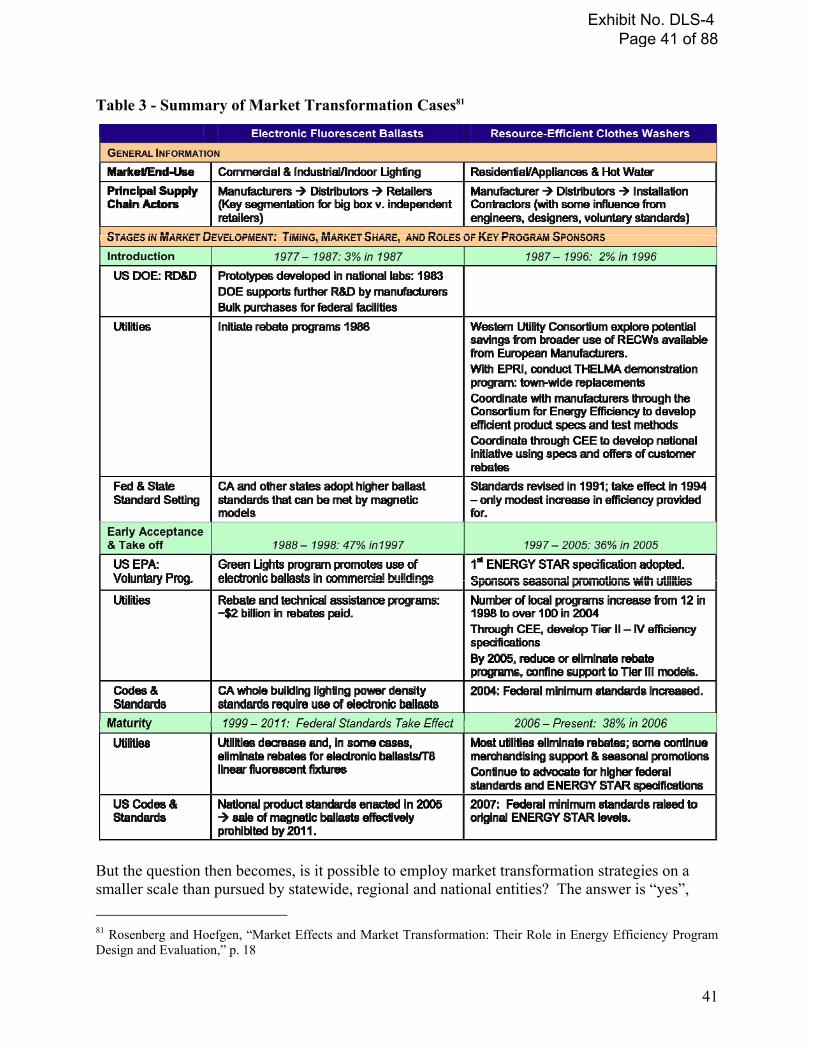
�
41
Table 3 - Summary of Market Transformation Cases81
But the question then becomes, is it possible to employ market transformation strategies on a smaller scale than pursued by statewide, regional and national entities? The answer is “yes”, 81 Rosenberg and Hoefgen, “Market Effects and Market Transformation: Their Role in Energy Efficiency Program Design and Evaluation,” p. 18
Exhibit No. DLS-4 Page 41 of 88
�
42
although it also the case that such strategies (to repeat) require a more comprehensive approach to achieving energy efficient outcomes, considerable forethought, sustained actions, and continuous revision. It is possible for a program administrator to define “market” to apply to the market over which the administrator has influence. In the case of an investor owned utility like Public Service Company of Colorado, the Company might define the market as its Colorado service territory. This narrowing of the definition of market also facilitates broadening the scope of the definition of market transformation beyond the “true” market transformation programs discussed above. It also enables a broadening of the types of programs and activities that could be considered market transformation. It’s useful to distinguish programs that employ market transformation strategies from other types of energy efficiency programs. Dan York refers to more traditional energy efficiency rebate programs as Demand-Side Management (DSM). As he explains,
The goals of most past DSM programs have been relatively narrow, to reduce energy and power demand to avoid investments in new power plants or transmission and distribution systems. DSM was used within the context of integrated resource planning to yield the lowest system cost by avoiding more costly construction and operation of supply-side power plants. DSM was considered a resource comparable and substitutable for supply-side resources. DSM typically has been implemented by individual utilities for their own customers, as ordered by utility commissions. Utilities recover the cost of the programs in their rates, so all utility customers share the costs.82
Although we may differ with the use of the term DSM to describe these programs, this is a fairly good description of traditional resource acquisition energy efficiency programs. The National Action Plan for Energy Efficiency (NAPEE) in its Model Energy Efficiency Program Impact Evaluation Guide takes this description a step further by characterizing the various different types of programs by their primary objectives:
� Resource acquisition —primary objective is to directly achieve energy and/or demand savings, and possibly avoid emissions, through specific actions.
� Market transformation—primary objective is to change the way in which energy efficiency markets operate (how manufacturers, distributors, retailers, consumers, and others sell and buy energy-related products and services), which tends to result in energy and demand savings in a more indirect manner. To a large extent, all programs can be considered market transformation in that they involve changing how energy efficiency activities take place in the marketplace. (emphasis added)
� Codes and standards —primary objective is to define and enforce mandated levels of efficiency in buildings and products.
82 York, “A Discussion and Critique of Market transformation: Challenges and Perspectives,” p. 7. Note that York speaks about DSM programs in the past tense, owing at least in part to his state’s (Wisconsin) elimination of utility integrated resource planning and shift away from utility-administered DSM. To be sure, in many states, Integrated Resource Planning and DSM remain alive and well.
Exhibit No. DLS-4 Page 42 of 88
�
43
� Education and training—primary objective is to inform consumers and providers about energy efficiency and encourage them to act on that information.
� Multiple objective—objectives can include some or all of the above listed objectives.83 It is interesting to note that the NAPEE Guide states under Market transformation that, “To a large extent, all programs can be considered market transformation in that they involve changing how energy efficiency activities take place in the marketplace.” This is quite true and underscores the fact that application of the term “market transformation” to a certain type of program can be misleading because it implies that other energy efficiency programs that fall outside this umbrella term are not attempting, ultimately, to transform markets.84 That said it is probably also fair to say that many market transformation programs can also be used for resource acquisition. The lines separating the program types are not clean and it may be most useful to identify commonly held views of what market transformation programs look like and explain why these programs are appropriately labeled market transformation.
���As was previously mentioned, Colorado’s gas rules categorize market transformation as indirect impact (also known as non-resource) programs. Colorado Public Utilities Commission Decision C08-0560, Order Point 141 again categorizes market transformation programs as indirect impact programs but sets the presumptive Total Resource Cost test result for market transformation programs at 1.0, implying the program is marginally cost effective. However, the Order Point also indicates that the costs for the market transformation program need to be factored into calculation of the overall portfolio TRC. Further, the Order Point requires that Public Service “include in each biennial DSM plan filing a proposed amount of the budget dedicated to market transformation activities, along with an explanation of the proposed activities and anticipated results.” 85 Although the approach Colorado takes is one possible way to implement market transformation programs, the approach poses some issues. First, characterizing market transformation programs as direct impact and requiring that they adhere to the same measurement standards as other direct impact programs is very important. Second, although providing market transformation programs a presumptive 1.0 TRC is a good way to at least hold the utility harmless in calculations of net benefits for purposes of a performance incentive, it does not necessarily encourage the utility to pursue these programs since other programs will produce greater net benefits (if the programs are cost effective). Finally, since the Commission in Order Point 141 also states that, “we find that market transformation efforts can be a significant part of a long-range DSM strategy”, it is 83 National Action Plan for Energy Efficiency, Model Energy Efficiency Program Impact Evaluation Guide, p. 2-2. 84 As Rosenberg and Hoefgren state, “Ratepayer-supported energy efficiency programs, including those operated by the California investor-owned utilities (IOUs), have contributed significantly to market transformation in key energy end-uses, and continue to do so.” Rosenberg and Hoefgren, p. 4. This result is not without strategic purpose as the California PUC has stated, “… an ‘end game’ for each technology or practice that transforms building, purchasing, and use decisions to become either “standard practice” (sometimes referred to as “MT”), or incorporated into minimum codes and standards.” (D. 07-10-032, p. 150). 85 “Order Granting Application in Part (Decision C08-0560),” In the Matter of the Application of Public Service Company of Colorado for Authority to Implement an Enhanced Demand Side Management Program and to Revise its Demand-Side Management Cost Adjustment to Include Current Cost Recovery and Incentives (Docket No. 07A-420E), May 23, 2008, p. 44.
Exhibit No. DLS-4 Page 43 of 88
�
44
important to set policy that is sustainable and will encourage the utility over the long-term to implement such programs. As was discussed earlier in this paper, Tim Drew from the California Public Utilities Commission’s Energy Division said that the current incentive mechanism in California is broken and fails to encourage utilities to pursue market transformation strategies. Drew suggests that the California Commission set total customer energy consumption targets and track progress against these targets as an alternative to net benefits-based performance incentives. However, he suggests this approach because reviewing utility performance claims and managing the California EM&V process has become unworkable. Fortunately, Colorado is not in this position but may also benefit from use of different approaches to estimating savings from market transformation programs (this is discussed further under Quantifying Results). In the next section, we will clarify the definitional issue by identifying commonly held views of what Market Transformation programs look like, explain why these programs are appropriately labeled Market Transformation, and provide examples of these programs and their applications to individual utilities.
����This section provides examples of true market transformation programs and programs that identify themselves as either market transformation programs or programs in the Southwest that are using market transformation strategies.
����
ENERGY STAR (www.energystar.gov) – U.S. Environmental Protection Agency, U.S. Department of Energy The U.S. EPA launched its Energy Star program in 1992 as a voluntary labeling program designed to identify and promote energy-efficient products to reduce greenhouse gas emissions. Initiated as a voluntary labeling program designed to identify and promote energy efficient products, Energy Star began with labels for computer products. In 1995 the program was significantly expanded, introducing labels for residential heating and cooling systems and new homes. As of 2006, more than 40,000 Energy Star products were available in a wide range of items including major appliances, office equipment, lighting, home electronics, and more. In addition, the label can also be found on new homes and commercial and industrial buildings. In 2006, about 12 percent of new housing in the United States was labeled Energy Star. The program targets consumer and commercial products. The Program seeks to transform markets for energy efficient products through testing, labeling, benchmarking, education, and consumer and business awareness raising. Topten (www.topten.info) – Various European Countries, World Wildlife Fund Topten is a consumer-oriented online search tool, which presents the best appliances in various categories of products. The key criteria are energy efficiency, impact on the environment, health and quality. As a communication tool it helps to show how our energy consumption causes climate change and what we can do personally to reduce our impact. It is also a powerful instrument to influence manufacturers.
Exhibit No. DLS-4 Page 44 of 88
�
45
Topten was launched in 2000 in Switzerland. Since then, twelve other national Topten sites have been established. Each Topten website provides a selection of best appliances from the energy point of view. Topten information targets consumers (pictures, functions, price, no complex calculation, for products available locally in their country) and large buyers. The program is rigorous and transparent (the selection methodology is explained online), independent from producers and commercial distributors. Topten relies on neutral tests and analysis of independent institutions, labels and on standardized declarations of manufacturers (e.g. EU-directives for household appliances). www.topten.info serves as a portal to reach all sites of participating countries. The site now consolidates its political impact by establishing “Best of Europe”. This concept identifies the most energy efficient products in Europe, identifying the countries where they are marketed. It makes explicit and transparent the status quo of efficient technologies on the European market and can thus serve as the European reference on energy efficiency to further negotiate with government and manufacturers. It seeks to transform markets for energy efficient products through labeling, education, benchmarking, standards setting, and consumer and business awareness raising. Consortium for Energy Efficiency – Premium Motors Initiative (www.cee1.org) Founded in 1991, the Consortium for Energy Efficiency (CEE) is a nonprofit that works with its members to promote the use of energy-efficient products, technologies and services. CEE brings energy-efficiency organizations together, providing a forum to discuss, network and exchange information with their peers. CEE also develops national initiatives that can be used as templates for individual energy-efficiency programs. Among its initiatives are the Premium-Efficiency Motors Initiative (1996) and the High-Efficiency Motor Systems Initiative (1999). CEE teamed with a mix of organizations to encourage the availability and sales of motors exceeding federal minimum standards and in 2001 joined with the National Electrical Manufacturers Association (NEMA) to co- promote a new set of specifications for premium-efficiency motors (NEMA Premium). The High-Efficiency Motor Systems initiative is designed to complement the Premium-Efficiency Motors Initiative by addressing the entire motor system, rather than just the motor itself. In 2001, CEE rolled out the Motor Decisions MatterSM campaign. Motor Decisions Matter promotes system efficiency by encouraging industrial and commercial customers to develop a motor management plan before motors fail. The initiatives seek to transform markets for energy efficient products through education, active stakeholder management, standards setting, and consumer and business awareness raising.
����
A quick review of utility programs in the Southwest offered in 2009 indicates a number of programs that identify themselves as market transformation programs.
Exhibit No. DLS-4 Page 45 of 88
�
46
Xcel Energy (CO) Market Transformation: Customer Behavioral Change Program The goal of the program is to “improve public knowledge concerning the benefits of energy efficiency and conservation.” This program overtly aims to accomplish market transformation by removing barriers to adoption of energy efficiency measures so as to cause a permanent shift in the market. The program’s design appears to have carefully considered how it will accomplish its market transformation objectives and appropriately defines its target market at a regional level with plans to leverage partnerships with regional players. In addition, the program has set clear measures of progress, using tracking participation and interaction goals. Initially, the Program will focus on:
� Community-based events, � Partnerships with local, regional and state government agencies, � Utilizing mass market advertising such as radio, print and television to create awareness
in energy efficiency, � Online messaging through targeted websites, � Direct mail marketing to address seasonal usage challenges, � Sponsorship of local Earth Day events, � Conservation messaging through the Company’s newsletters and bill inserts to residential
customers, and � Publication of reference education materials in English and Spanish.86
This program appears to be one of the better examples of a market transformation program in the region with the possible shortcoming that is defined expressly as indirect impact and does not seek to track market effects. This shortcoming may, though, have less to do with the program than is does with Colorado’s rules (at least the gas rules) and recent Colorado Public Utilities Commission decisions (see discussion above). Xcel Energy (CO) Home Performance with Energy Star Program In partnering with Energy Star, Xcel Energy is leveraging the market transformation opportunities presented by the Energy Star brand and benefits. The program provides energy-auditing services, contractor resources for implementing energy efficiency measures recommended in the audit, and independent verification of results after implementation. Xcel Energy (CO) Energy Star Retailer Incentive Pilot Program The Energy Star Retailer Incentive Pilot Program seeks to increase the sale of energy efficient technologies by working directly with retailers that sell Energy Star measures. The Company will pay retailers directly for every qualifying unit sold to the Company’s customers. Due to the newness of the concept, the program will be introduced as a pilot and in phases. The first phase will include some of the largest and most energy-intensive measures (refrigerators, clothes washers, dishwashers, room air conditioners, televisions, ceiling fans). The program appropriately recognizes the importance of incorporating market transformation strategies in the program’s design. Among these include: coordinating with other statewide, regional and national partners; identifying specific market barriers/gaps to facilitate targeted efforts to reduce
86 Public Service Company of Colorado, 2009/2010 Demand-Side Management Biennial Plan Electric and Natural Gas Public Service Company of Colorado, (Docket No. 08A-366EG), February 2009, pp. 359-60.
Exhibit No. DLS-4 Page 46 of 88

�
47
these barriers and close the gaps; recognizing that “true” market transformation takes time, and establishing up-front evaluation, measurement and verification features to enable mid-course corrections or enhancements. 87 Arizona Public Service Energy Star Residential Lighting Program APS launched its Energy Star Residential Lighting Program in 2005. The program utilizes a manufacturer buy-down coupled with aggressive promotion and consumer outreach. The program is comprised of two core elements: 1) promoting the value of the Energy Star brand and the benefits of Energy Star qualified lighting, and 2) offering customers discounted pricing through an upstream manufacturer buy-down on CFLs.88 Public Service Company of New Mexico’s Market Transformation Program PNM’s Market Transformation Program, launched in 2009, has as its goal to “increase consumer awareness of energy efficiency through education, which will result in increased adoption of energy efficiency technologies and remove or minimize market barriers to adopting energy efficient technologies and participating in PNM’s programs.”89 As proposed, the program is not subject to cost effectiveness tests, which is allowed under New Mexico law unless the program makes the overall portfolio not cost effective. Rocky Mountain Power’s Energy Star New Homes Program Rocky Mountain Power’s Energy Star New Homes Program provides incentives to Energy Star-certified builders who construct new homes and multi-family dwellings with improved efficiency. Participating contractors also have the opportunity to be featured in Rocky Mountain Power-sponsored advertising and marketing, and can have access to additional cooperative marketing funds to promote their company as a program participant. More information and applicable application forms are available on the program website.90 Nevada Power Company’s Energy Star Lighting Program Nevada Power’s Lighting program is a “market-based residential DSM program that provides direct incentives to consumers for the retail purchase of energy efficient lighting products.” The program is also offered by Nevada Power’s sister company NV Energy in other parts of Nevada. A third-party contractor runs both programs. Specifically, the program seeks to transform the residential lighting market by:
� Moving more ENERGY STAR products into the retail marketplace, � Making energy efficient lighting products more affordable for customers, and � Providing customers valuable energy efficiency education and guidance through various
outreach events.91 87 Public Service Company of Colorado, 2009/2010 Demand-Side Management Biennial Plan Electric and Natural Gas Public Service Company of Colorado, (Docket No. 08A-366EG), September 29, 2008, p. 210. 88 American Council for Energy Efficiency, “Compendium of Champions – Residential Lighting Programs,” February 2008, p. 12-2. 89 Public Service Company of New Mexico, Application for Approval of 2008 Electric Energy Efficiency and Load Management Program Plan and Program Cost Tariff Riders, (Docket No. 08-00204), September 15, 2008, p. 18. 90 Rocky Mountain Power, Rocky Mountain Power - ENERGY STAR New Homes Program for Builders, Database of State Incentives for Renewables & Efficiency (DSIRE), http://www.dsireusa.org 91 Nevada Power Company, Nevada Power Company 2010 Interim Demand Side Plan, August 14, 2009, p. 96.
Exhibit No. DLS-4 Page 47 of 88
�
48
The program has been offered since 2006 but previously also included appliances. The program shifted to a lighting-only focus in 2008. Nevada Power Company’s Energy Plus Homes Program Launched in 2008, Nevada Power’s Energy Plus New Homes program is designed to significantly increase energy efficiency in new home construction in southern Nevada. The overall goal of the program is to encourage a transformation in the housing market by incorporating more energy efficient materials and techniques in the production home construction process to build more energy efficient homes.92
�����There is a growing tendency to identify market transformation programs and activities as further along the energy efficiency program evolutionary scale. In other words, as an energy efficiency program evolves, some perceive that traditional energy efficiency programs should give way to market transformation programs. Although originally conceived as an alternative approach to more traditional resource acquisition energy efficiency programs, market transformation approaches appear to have taken on a somewhat different mantle. For example, the most recent American Council for an Energy Efficient Economy’s 2009 Market Transformation Symposium dedicated a panel to discussion of “Efficiency Programs – Moving Away from the Rebate Model”. Panelists from PG&E and Wisconsin Focus on Energy spoke about their experiences with programs that were in the process of transitioning to models that utilized reduced incentives. These approaches had, in fact, evolved out of more traditional rebate-based approaches to energy efficiency but were also made possible by high levels of trade ally or customer awareness about energy efficiency coming from rebate-based programs. In this sense, these programs were evolving into market transformation-type programs. California’s Energy Efficiency Strategic Plan employs “market transformation as its unifying objective.”93 It selected this as its unifying theme because the CPUC in D.07-10- 032 directed that “a key element of the Strategic Plan would be that it articulates how energy efficiency programs are or will be designed with the goal of transitioning to either the marketplace without ratepayer subsidies, or codes and standards.”94 From this perspective, and further articulated within the Strategic Plan, more traditional (California) utility rebate programs have “naturally tended towards measures which produce readily-quantified, low-cost, near-term savings [and] which offer the opportunity to ‘buy’ load 92 Nevada Power Company, Nevada Power Company 2010 Interim Demand Side Plan, p. 184. 93 California Public Utilities Commission, California Long Term Energy Efficiency Strategic Plan, September 2008, p. 4. It is interesting to note that the PUC’s focus on market transformation is not new. In two decisions as part of electric restructuring, the PUC committed to shift from resource acquisition to market transformation and ended its exclusive reliance on utilities to administer programs. This approach was revisited after electric restructuring foundered. (see Ralph Prahl, Jeff Schlegel, Charles Goldman, “Organizing for Market Transformation: Institutional Issues in the Creation of a New Energy Efficiency Framework in California,” (paper presented at the 1998 ACEEE Summer Study on Energy Efficiency in Buildings, August 1998), p. 6.166. 94 California Public Utilities Commission, D.07-10-032, Interim Opinion on Issues Relating to Future Savings Goals and Program Planning for 2009-2011 Energy Efficiency and Beyond, (Rulemaking 06-04-010), October 19, 2007, p.33
Exhibit No. DLS-4 Page 48 of 88
�
49
reduction in easy, well- packaged measures with limited market impacts.” The Plan emphasizes that, “There has been little incentive for utilities to engage in measures with a longer-term orientation – those very measures which produce meaningful market transformation.” With this in mind, the “Plan seeks to move utilities, the CPUC, and other stakeholders beyond a focus on short-term energy efficiency activities into a more sustained long-term, market transformation strategic focus.”95 Although perhaps not an evolution but rather a different focus, the Strategic Plan clearly emphasizes a desire to move beyond incentives and implies that incentive-based programs are prone to short-term thinking. Lest one wonder if this means that California is abandoning rebate programs, the Plan balances its earlier statements by saying,
By re-emphasizing the market transformation goal, we do not discount the benefits of short-term measures for energy savings. Utility portfolios must contain an appropriate mix of short and longer term energy savings. However, short-term programs such as the replacement of incandescent light bulbs with compact fluorescent light bulbs must be accompanied by solutions which focus on multi-year and holistic lighting system strategies, improved conservation actions, and other means of market transformation.96
A similar theme is incorporated into recent publication from the Colorado Public Utilities Commission.97 The publication indicates that Colorado can benefit from California’s experience accelerating the “the evolution of DSM” and emphasizes the importance for “Colorado to respond to the market changes identified in this report by bringing MT strategies more centrally into DSM portfolios.”98 To a large extent, it is understandable why market transformation approaches would be viewed as the next step in the process towards transforming markets. The notion of eliminating incentives and rebates is an appealing one, implying that program administrators will be able spend less and get more. But, this is an overly simplistic approach to a complex topic. It seems apparent that energy efficiency portfolios will include increasing numbers of market transformation strategies and programs. What is not clear is whether such market transformation programs will continue to be viewed as the evolutionary successor to rebate-based programs and, in turn, lead to calls to eliminate “antiquated” rebate-based programs. As presented in the California Energy Efficiency Strategic Plan, it is likely preferable to highlight with all programs the importance of long-term, sustainable energy savings and ensure that programs include a strategic intent to transform the markets in which they operate. As further discussed in the Quantifying Results section of this Chapter, this objective can be satisfied in part through efforts to quantify results from market transformation programs.
95 California Long Term Energy Efficiency Strategic Plan, p. 4. 96 California Long Term Energy Efficiency Strategic Plan, p. 4. 97 Colorado Public Utilities Commission, Energy Efficiency and Colorado Utilities: How Far We’ve Come; How Far We Need to Go, October 20, 2009. 98 Energy Efficiency and Colorado Utilities: How Far We’ve Come; How Far We Need to Go, p. 20.
Exhibit No. DLS-4 Page 49 of 88
�
50
Ruth Horton with NYSERDA offers an interesting take on what she suggests should be part of the evolution of resource acquisition and market transformation programs. In her paper, “Resource Acquisition and Market Transformation: Leveraging the Positive and Dealing with Conflicts,” Horton suggests the need to foster market transformation within resource acquisition programs. This insightful approach suggests that it may be useful to blur the distinction between resource acquisition and market transformation programs and instead combine elements of both strategies. From her perspective, resource acquisition programs can benefit by incorporating the following MT elements:
� Inviting a wide variety of actors to participate in the program; � Incorporating technical assistance elements into the program – for example, offering
technical design assistance in conjunction with rebates for measures; � Keeping options open – for example, supporting a wide range of equipment and custom
measures encourages market exposure to variety of energy efficiency options, and � Coordinating with separate market transformation programs – for example, aligning
educational and marketing programs targeting upstream and midstream market actors with incentive and marketing programs targeting end use customers.99
Notably, many of the approaches Horton suggests are already apparently incorporated into many Public Service programs. For example, Public Service’s Energy Design Assistance program offers design assistance to building owners and also offers incentives for installation of energy efficient measures. In addition, the Energy Analysis program interfaces with the Company’s business rebate programs to provide a more well-rounded offering that seeks to provide technical assistance including on-site energy assessments and engineering assistance studies. Public Service’s Custom Efficiency Program provides “customized” rebates to conform to the needs of the marketplace and, in this sense, keeps the Company’s and its customers’ options open. Lastly, the Indirect Segment aims to provide “valuable information and support for the direct impact programs and offer innovative approaches to effecting changes in the demand-side management marketplace.”100 Horton’s analysis indicates that it may not be as important to clearly distinguish between resource acquisition and market transformation programs but rather to take the best features of all types of programs and ensure that measurement of the results is done correctly. As will be discussed in the measurement section, there are distinct approaches for evaluating market transformation programs. That said, a combination of evaluation approaches may be in order for programs that combine a variety of program methodologies. In any case, it is crucial that regulators and program administrators not use the term market transformation to describe a program or activity that is the evolutionary progeny of rebate-based programs or somehow superior to rebate-based programs, in part because the distinctions between the two are not necessarily clear cut and in part because this implies that an amorphous
99 Ruth Horton, Resource Acquisition and Market Transformation: Leveraging the Positive and Dealing with Conflicts, The 2006 National Symposium on Market Transformation: The Next 10 Years, March 20, 2006. 100 Public Service Company of Colorado, 2009/2010 Demand-Side Management Biennial Plan Electric and Natural Gas Public Service Company of Colorado, pp. 349.
Exhibit No. DLS-4 Page 50 of 88
�
51
and ill-defined concept is somehow superior to the traditional way of doing things. As has been demonstrated, market transformation programs can include rebates and incentives and programs that should likely not be termed market transformation (but do) can expressly exclude rebates and incentives. Market transformation is a laudable objective for all energy efficiency programs and, as is discussed in the quantifying results section below, may be a more appropriate way to measure the success of any program.
��Estimating market potential for market transformation programs poses more issues than estimating market potential for resource programs. The typical process of estimating market potential focuses mainly on specific energy-using end-use technologies and their customer markets. In other words, a market potential study starts at a high-level by identifying total energy use and its anticipated “natural” change over some period. The study then disaggregates this total energy use into separate customer markets (residential, commercial, industrial) and the energy-using technologies that customers purchase, install and use. By estimating current market shares for energy efficient technologies among these markets and technology groupings, and forecasting the natural change that will occur to change the market share for energy efficient technologies, the study estimates how much an energy efficiency program administrator can potentially change the market share for energy efficient technologies and for what cost this can be achieved. Traditionally, these market potential studies have used equipment saturation algorithms and cost effectiveness tools to estimate the market potential for various technologies in various market segments. Cost effectiveness tools are used because they help determine what amount of administrator investment will be cost effective and what the likely effects will be of these investments on energy and demand savings. These cost effectiveness tools are, almost by definition, focused on resource acquisition. The tools are focused on resource acquisition because their purpose is to frame the administrator’s decision regarding investments in demand-side (energy efficiency and demand response) activities and alternate investments in supply-side (power plants and their infrastructure) resources. Although one can use these tools to estimate opportunities for market transformation-type activities, it is not the preferred method mainly because market transformation programs often do not use customer rebates and incentives to accomplish their objectives and traditional cost effectiveness tools rely heavily on customer incentives to form their estimates.101 Similarly, the objective for each market transformation program is, ultimately, to transform the market such that the standard for the particular energy-using device or end-use is the energy efficient option. So, by definition, the market potential for an individual market transformation program is the total potential that exists for that particular technology to the point where that
101 It should be noted that many practitioners and, most recently, the California Public Utilities Commission have acknowledged this concern. The California PUC in D.09-09-047 requested that its staff analyze cost effectiveness tests for application to market transformation programs and recommend alternative cost effectiveness tests for market transformation programs.
Exhibit No. DLS-4 Page 51 of 88
�
52
technology is the “standard”. Estimating potential for market transformation programs will likely require a different type of model or changes to existing models.
��Measuring results is one of the major difficulties associated with market transformation programs and strategies. This happens because rebate-based programs can typically link provision of a rebate with customer implementation of the energy efficiency measure while market transformation programs (that tend not to have rebates) must rely more heavily on surveys to determine their influence. This is not to say, though, that such programs are not quantifiable but, rather, that measurement may cost more and require more planning and follow-up. Even with these additional efforts, the results may not be as accurate as with rebate-based programs. The California Evaluation Framework dedicates an entire chapter (Chapter 10) to conducting evaluations of market transformation programs. Although it is unclear whether this approach constitutes “best practice”, largely because a limited number of market transformation evaluations programs have been conducted, it certainly constitutes a thoughtful and potentially quite useful approach to conducting such evaluations. This is particularly the case when the information is supplemented by market effects evaluation information from the Evaluators’ Protocols. The Framework distinguishes between Impact Evaluations (Chapter 2) and Market Transformation Program Evaluations because the MT Evaluation chapter “focuses on the evaluation of program-induced market effects when the program being evaluated has a goal of making longer-term lasting changes in the way a market operates.” And further, “These evaluations are challenging, as markets are constantly in a state of change as new and competing technologies are offered or as other non-program market transformation efforts compete with the program’s efforts.”102 Impact Evaluations “focus on estimating the gross and net effects from the implementation of one or more energy efficiency programs … These estimates are used for program planning and contracting purposes and for prioritizing program funding choices.”103 The Framework highlights four important principles that are central to the recommended approach for conducting evaluations of market transformation programs. These are:
1. Market transformation program evaluations need to be conducted at the market, sub-market or niche market level rather than at the program level. This can mean conducting a market evaluation on a group of programs operating in the same market or conducting multiple market studies for a program operating in a number of markets.
2. There are a number of important conditions and activities needed to be able to evaluate market transformation programs, including an assessment of the program theory/logic model (PT/LM), a characterization of the market(s) in which the program(s) operate, the availability of baseline studies that provide a “starting point” for assessing market effects, market progress studies, and a causality assessment that examines the linkages between the program and the observed market changes (where the program-induced changes are
102 TecMarket Works, California Evaluation Framework, p. 5. 103 TecMarket Works, California Evaluation Framework, p. 3.
Exhibit No. DLS-4 Page 52 of 88
�
53
defined as the market effects).104 3. If a MT program evaluation is conducted to document program-created market change as
part of an effort to estimate the energy impacts from a MT program, an energy impacts evaluation may still, in some cases, need to be conducted to verify the impacts achieved through the MT program.
4. A MT evaluation critically evaluates causality and sustainability. It is recommended that long-term market effects only be claimed under three conditions:
a. If the program theory specifically identifies the market effect(s) to be measured in the evaluation and provides theories supporting the causal relationship between the program’s efforts and the expected market effect(s),
b. If these efforts are supported in the program theory as being sustainable (i.e. last beyond the program period), or
c. If sufficient evidence is provided through a MT evaluation indicating that the market effect(s) have a high probability of being the result of the program’s efforts. 105
Interestingly, the Evaluators’ Protocols make scant reference to market transformation programs. Yet, the Evaluators’ Protocols are “the primary guidance documents evaluation contractors will use to design and conduct evaluations for programs implemented after December 31, 2005.” The Protocols build on the Evaluation Framework and reference the Evaluation Framework (and other documents) for applicable methods. But the Protocols still serve as the “the primary evaluation guidance documents for all types of evaluations presented in these Protocols.” This is relevant because the Evaluators’ Protocols clearly outline the options for evaluating programs that either obtain savings “directly” or “indirectly”. Resource-acquisition programs provide savings directly because the link between the program activity and the savings is “clear, straightforward and relatively fast.”106 As the Protocols describe it, “for each participant who receives an incentive, there is the clear expectation that there will be savings based upon the program’s direct results in obtaining equipment installations.”107 Information and education programs are examples of programs that provide savings indirectly. In this case, “there is a more tenuous link between the program activities and any eventual savings.”108 In other words, these programs may not result in immediately quantifiable savings (or no savings at all) but rather may induce behavior changes or realize savings over a longer period of time. Still, even in the case of programs that produce savings indirectly, there is a “need to link program-induced behavioral changes to eventual energy and demand impacts.”109 The Protocols include a section describing the Market Effects Protocol. As outlined in the
104 The concept of program theory/logic models is further detailed in Appendix C. 105 TecMarket Works, California Evaluation Framework, p. 246. 106 The TecMarket Works Team, Evaluators’ Protocols, p. 10. 107 Ibid, p. 10. 108 Ibid, p. 10. 109 Ibid, p. 10.
Exhibit No. DLS-4 Page 53 of 88
�
54
definitions at the beginning of this paper, market effects are changes in the structure or functioning of a market or the behavior of participants in a market that result from one or more program efforts. The Market Effects Protocol is designed to measure net market effects at a market level when one or more energy efficiency programs target a market. Net market effects are those effects that are induced by energy efficiency programs and are net of market activities induced by non-energy efficiency programs including normal market changes.110 A recent paper by authors Mitchell Rosenberg and Lynn Hoefgen examines in detail the experiences of program sponsors in the design, delivery, and evaluation of programs aimed at achieving market transformation.111 In the paper, they highlight the key role the estimation of market effects must play in evaluation of programs that aim to achieve market transformation (see point 4 in the above highlighted portion of the California Evaluation Framework description of market transformation evaluations). As they point out, “the performance of market transformation programs is less well documented. Moreover, the methods for assessing market effects have undergone less standardization than those for estimating physical energy savings…”112 Also relevant to point 4, the Market Effects Evaluation Protocol provides the steps that should be taken to estimate market effects: 1. Conduct a scoping study to determine optimum data collection and analysis approach for the
evaluation – used to determine what indicators should be used to assess market effects; 2. Select a contractor and develop a detailed evaluation plan; 3. Collect baseline and longitudinal indicators; 4. Analyze market effects - the market effects study should estimate what changes would have
occurred in the market without program efforts. The indicators are used to draw conclusions about these changes, and
5. Produce the Market Effects Report.113 Rosenberg and Hoefgen delve more deeply into elements of the Market Effects Evaluation Protocol in offering ways to characterize the market and estimate baselines. As they describe it,
Baseline estimation refers to the quantitative estimation of various indicators of the level of market acceptance of the products and services promoted by the program under evaluation. These indicators include market share (the percent of total product or service sales accounted for by energy-efficient versions), saturation (the percent of the installed base of the technology accounted for by the efficient technology), indicators of availability such as the number of efficient models found on retailer sales floors, and indicators of awareness, such as the percentage of potential customers or suppliers who report various levels of knowledge of the product. These indicators are generally estimated through
110 Ibid, p. 143. 111 Rosenberg and Hoefgen, “Market Effects and Market Transformation: Their Role in Energy Efficiency Program Design and Evaluation,” p. 9. 112 Ibid, p. 37. 113 The TecMarket Works Team, Evaluators’ Protocols, p. 149.
Exhibit No. DLS-4 Page 54 of 88
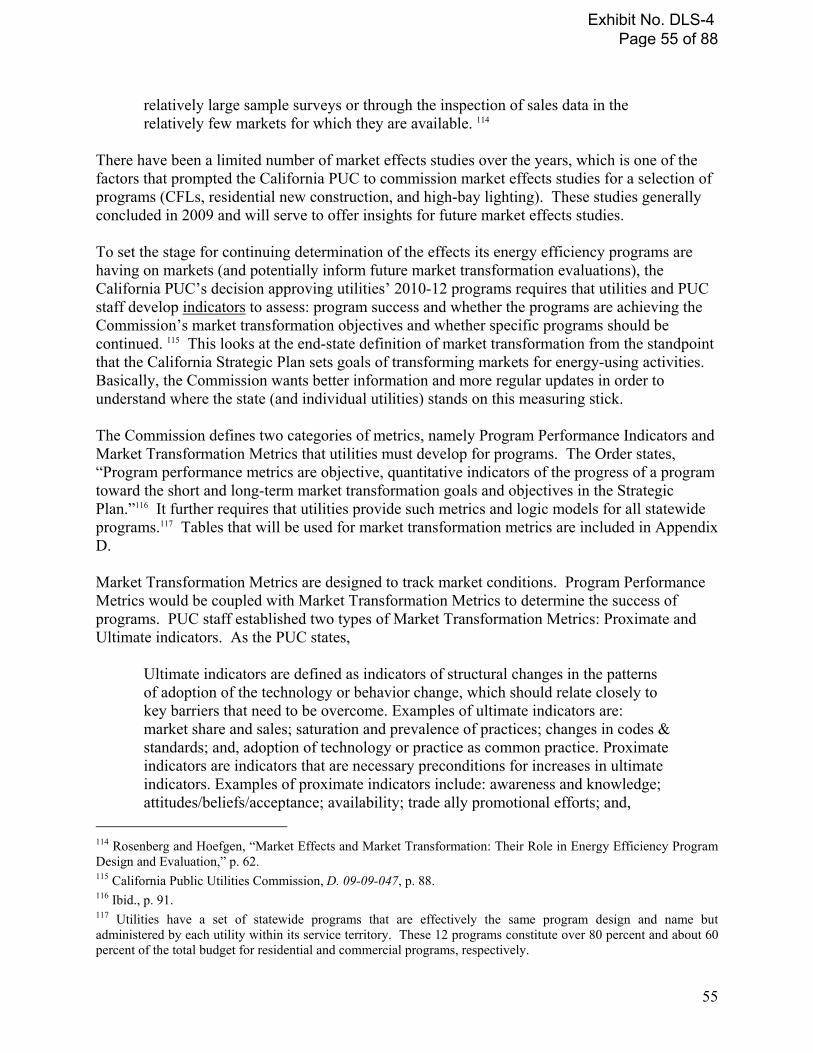
�
55
relatively large sample surveys or through the inspection of sales data in the relatively few markets for which they are available. 114
There have been a limited number of market effects studies over the years, which is one of the factors that prompted the California PUC to commission market effects studies for a selection of programs (CFLs, residential new construction, and high-bay lighting). These studies generally concluded in 2009 and will serve to offer insights for future market effects studies. To set the stage for continuing determination of the effects its energy efficiency programs are having on markets (and potentially inform future market transformation evaluations), the California PUC’s decision approving utilities’ 2010-12 programs requires that utilities and PUC staff develop indicators to assess: program success and whether the programs are achieving the Commission’s market transformation objectives and whether specific programs should be continued. 115 This looks at the end-state definition of market transformation from the standpoint that the California Strategic Plan sets goals of transforming markets for energy-using activities. Basically, the Commission wants better information and more regular updates in order to understand where the state (and individual utilities) stands on this measuring stick. The Commission defines two categories of metrics, namely Program Performance Indicators and Market Transformation Metrics that utilities must develop for programs. The Order states, “Program performance metrics are objective, quantitative indicators of the progress of a program toward the short and long-term market transformation goals and objectives in the Strategic Plan.”116 It further requires that utilities provide such metrics and logic models for all statewide programs.117 Tables that will be used for market transformation metrics are included in Appendix D. Market Transformation Metrics are designed to track market conditions. Program Performance Metrics would be coupled with Market Transformation Metrics to determine the success of programs. PUC staff established two types of Market Transformation Metrics: Proximate and Ultimate indicators. As the PUC states,
Ultimate indicators are defined as indicators of structural changes in the patterns of adoption of the technology or behavior change, which should relate closely to key barriers that need to be overcome. Examples of ultimate indicators are: market share and sales; saturation and prevalence of practices; changes in codes & standards; and, adoption of technology or practice as common practice. Proximate indicators are indicators that are necessary preconditions for increases in ultimate indicators. Examples of proximate indicators include: awareness and knowledge; attitudes/beliefs/acceptance; availability; trade ally promotional efforts; and,
114 Rosenberg and Hoefgen, “Market Effects and Market Transformation: Their Role in Energy Efficiency Program Design and Evaluation,” p. 62. 115 California Public Utilities Commission, D. 09-09-047, p. 88. 116 Ibid., p. 91. 117 Utilities have a set of statewide programs that are effectively the same program design and name but administered by each utility within its service territory. These 12 programs constitute over 80 percent and about 60 percent of the total budget for residential and commercial programs, respectively.
Exhibit No. DLS-4 Page 55 of 88
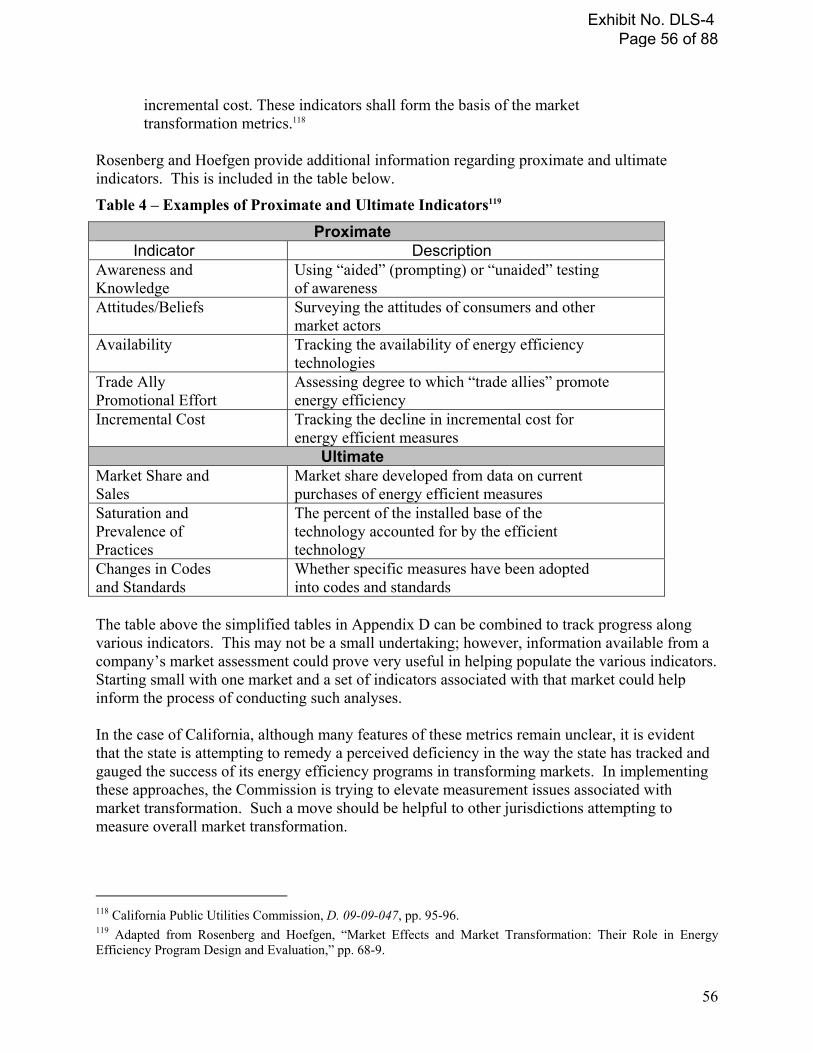
�
56
incremental cost. These indicators shall form the basis of the market transformation metrics.118
Rosenberg and Hoefgen provide additional information regarding proximate and ultimate indicators. This is included in the table below.
Table 4 – Examples of Proximate and Ultimate Indicators119
Proximate Indicator Description
Awareness and Knowledge
Using “aided” (prompting) or “unaided” testing of awareness
Attitudes/Beliefs Surveying the attitudes of consumers and other market actors
Availability Tracking the availability of energy efficiency technologies
Trade Ally Promotional Effort
Assessing degree to which “trade allies” promote energy efficiency
Incremental Cost Tracking the decline in incremental cost for energy efficient measures
Ultimate Market Share and Sales
Market share developed from data on current purchases of energy efficient measures
Saturation and Prevalence of Practices
The percent of the installed base of the technology accounted for by the efficient technology
Changes in Codes and Standards
Whether specific measures have been adopted into codes and standards
The table above the simplified tables in Appendix D can be combined to track progress along various indicators. This may not be a small undertaking; however, information available from a company’s market assessment could prove very useful in helping populate the various indicators. Starting small with one market and a set of indicators associated with that market could help inform the process of conducting such analyses. In the case of California, although many features of these metrics remain unclear, it is evident that the state is attempting to remedy a perceived deficiency in the way the state has tracked and gauged the success of its energy efficiency programs in transforming markets. In implementing these approaches, the Commission is trying to elevate measurement issues associated with market transformation. Such a move should be helpful to other jurisdictions attempting to measure overall market transformation.
118 California Public Utilities Commission, D. 09-09-047, pp. 95-96. 119 Adapted from Rosenberg and Hoefgen, “Market Effects and Market Transformation: Their Role in Energy Efficiency Program Design and Evaluation,” pp. 68-9.
Exhibit No. DLS-4 Page 56 of 88
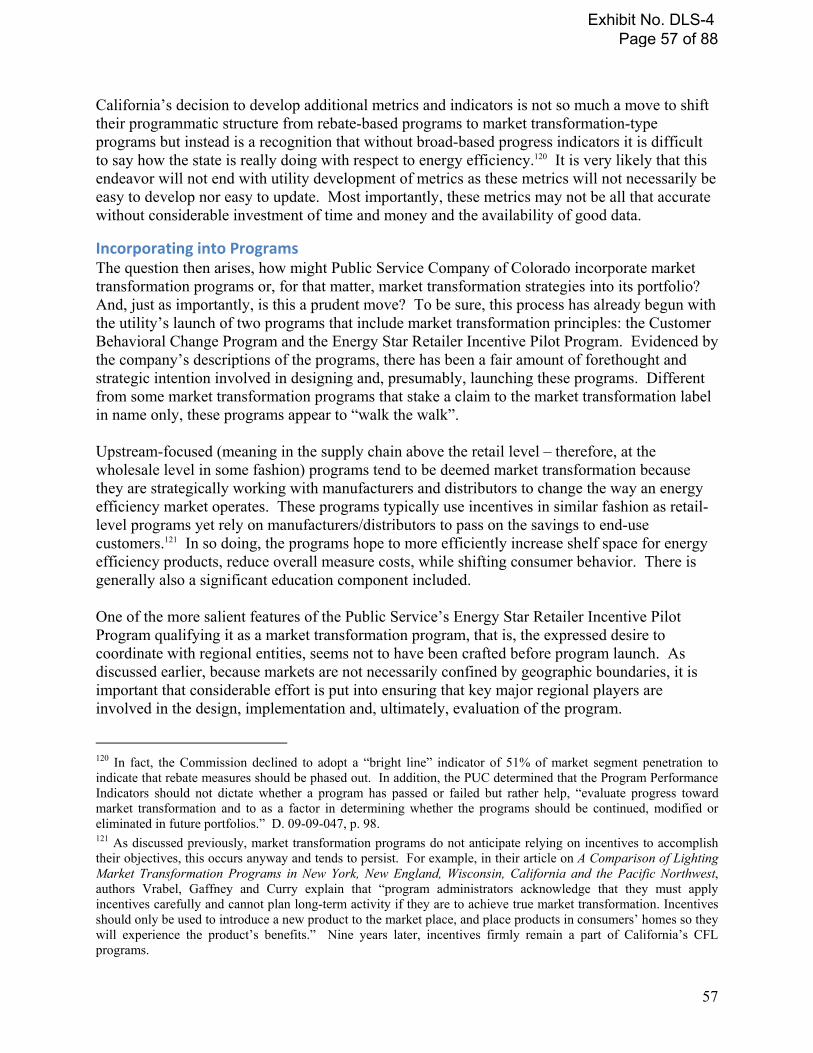
�
57
California’s decision to develop additional metrics and indicators is not so much a move to shift their programmatic structure from rebate-based programs to market transformation-type programs but instead is a recognition that without broad-based progress indicators it is difficult to say how the state is really doing with respect to energy efficiency.120 It is very likely that this endeavor will not end with utility development of metrics as these metrics will not necessarily be easy to develop nor easy to update. Most importantly, these metrics may not be all that accurate without considerable investment of time and money and the availability of good data.
���The question then arises, how might Public Service Company of Colorado incorporate market transformation programs or, for that matter, market transformation strategies into its portfolio? And, just as importantly, is this a prudent move? To be sure, this process has already begun with the utility’s launch of two programs that include market transformation principles: the Customer Behavioral Change Program and the Energy Star Retailer Incentive Pilot Program. Evidenced by the company’s descriptions of the programs, there has been a fair amount of forethought and strategic intention involved in designing and, presumably, launching these programs. Different from some market transformation programs that stake a claim to the market transformation label in name only, these programs appear to “walk the walk”. Upstream-focused (meaning in the supply chain above the retail level – therefore, at the wholesale level in some fashion) programs tend to be deemed market transformation because they are strategically working with manufacturers and distributors to change the way an energy efficiency market operates. These programs typically use incentives in similar fashion as retail-level programs yet rely on manufacturers/distributors to pass on the savings to end-use customers.121 In so doing, the programs hope to more efficiently increase shelf space for energy efficiency products, reduce overall measure costs, while shifting consumer behavior. There is generally also a significant education component included. One of the more salient features of the Public Service’s Energy Star Retailer Incentive Pilot Program qualifying it as a market transformation program, that is, the expressed desire to coordinate with regional entities, seems not to have been crafted before program launch. As discussed earlier, because markets are not necessarily confined by geographic boundaries, it is important that considerable effort is put into ensuring that key major regional players are involved in the design, implementation and, ultimately, evaluation of the program.
120 In fact, the Commission declined to adopt a “bright line” indicator of 51% of market segment penetration to indicate that rebate measures should be phased out. In addition, the PUC determined that the Program Performance Indicators should not dictate whether a program has passed or failed but rather help, “evaluate progress toward market transformation and to as a factor in determining whether the programs should be continued, modified or eliminated in future portfolios.” D. 09-09-047, p. 98. 121 As discussed previously, market transformation programs do not anticipate relying on incentives to accomplish their objectives, this occurs anyway and tends to persist. For example, in their article on A Comparison of Lighting Market Transformation Programs in New York, New England, Wisconsin, California and the Pacific Northwest, authors Vrabel, Gaffney and Curry explain that “program administrators acknowledge that they must apply incentives carefully and cannot plan long-term activity if they are to achieve true market transformation. Incentives should only be used to introduce a new product to the market place, and place products in consumers’ homes so they will experience the product’s benefits.” Nine years later, incentives firmly remain a part of California’s CFL programs.
Exhibit No. DLS-4 Page 57 of 88
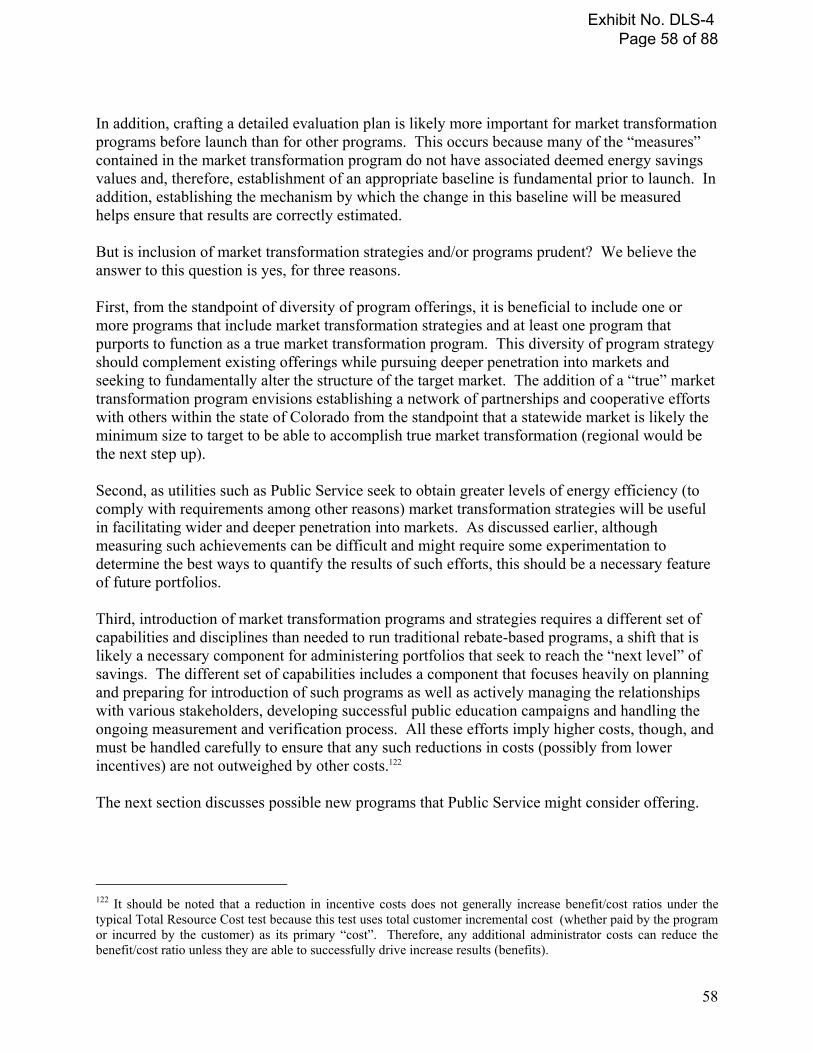
�
58
In addition, crafting a detailed evaluation plan is likely more important for market transformation programs before launch than for other programs. This occurs because many of the “measures” contained in the market transformation program do not have associated deemed energy savings values and, therefore, establishment of an appropriate baseline is fundamental prior to launch. In addition, establishing the mechanism by which the change in this baseline will be measured helps ensure that results are correctly estimated. But is inclusion of market transformation strategies and/or programs prudent? We believe the answer to this question is yes, for three reasons. First, from the standpoint of diversity of program offerings, it is beneficial to include one or more programs that include market transformation strategies and at least one program that purports to function as a true market transformation program. This diversity of program strategy should complement existing offerings while pursuing deeper penetration into markets and seeking to fundamentally alter the structure of the target market. The addition of a “true” market transformation program envisions establishing a network of partnerships and cooperative efforts with others within the state of Colorado from the standpoint that a statewide market is likely the minimum size to target to be able to accomplish true market transformation (regional would be the next step up). Second, as utilities such as Public Service seek to obtain greater levels of energy efficiency (to comply with requirements among other reasons) market transformation strategies will be useful in facilitating wider and deeper penetration into markets. As discussed earlier, although measuring such achievements can be difficult and might require some experimentation to determine the best ways to quantify the results of such efforts, this should be a necessary feature of future portfolios. Third, introduction of market transformation programs and strategies requires a different set of capabilities and disciplines than needed to run traditional rebate-based programs, a shift that is likely a necessary component for administering portfolios that seek to reach the “next level” of savings. The different set of capabilities includes a component that focuses heavily on planning and preparing for introduction of such programs as well as actively managing the relationships with various stakeholders, developing successful public education campaigns and handling the ongoing measurement and verification process. All these efforts imply higher costs, though, and must be handled carefully to ensure that any such reductions in costs (possibly from lower incentives) are not outweighed by other costs.122 The next section discusses possible new programs that Public Service might consider offering.
122 It should be noted that a reduction in incentive costs does not generally increase benefit/cost ratios under the typical Total Resource Cost test because this test uses total customer incremental cost (whether paid by the program or incurred by the customer) as its primary “cost”. Therefore, any additional administrator costs can reduce the benefit/cost ratio unless they are able to successfully drive increase results (benefits).
Exhibit No. DLS-4 Page 58 of 88

�
59
���
Public Service Company has done a very good job of reviewing the issues involved with developing and launching market transformation programs (see Market Transformation Plan). However, the decision to pursue market transformation programs or to incorporate market transformation activities into existing programs requires a serious and sustained commitment. This occurs because market transformation programs can suffer disproportionately from unclear goals and objectives, incomplete consideration of key factors, and deficient E,M&V. These programs can suffer disproportionately to resource programs because they lack the more “tried and true” methods associated with targeted rebate programs. Does this mean it might not be worth attempting such a programmatic effort? Yes, it certainly could. Public Service has launched its market transformation in an appropriate manner by constituting its program a pilot. However, the nature of a pilot can mean that the program will not be prioritized, particularly if it does not produce identifiable energy savings vis-à-vis savings goals. In this sense, it may make more sense to launch an actual program with quantifiable goals. A few possible programs with these objectives in mind follow: Codes Enhancement Program – Federal, state or local adoption of more stringent building codes or appliance efficiency standards is probably one of the most effective ways to transform energy efficiency markets. However, adopting revised codes and standards is not necessarily an easy endeavor. As the National Action Plan for Energy Efficiency points out, there are a number of barriers to achieving effective building codes123 (see the graphic below):
123 National Action Plan for Energy Efficiency, Energy Efficiency Program Administrators and Building Energy Codes, p. 10, www.epa.gov/eeactionplan
Exhibit No. DLS-4 Page 59 of 88
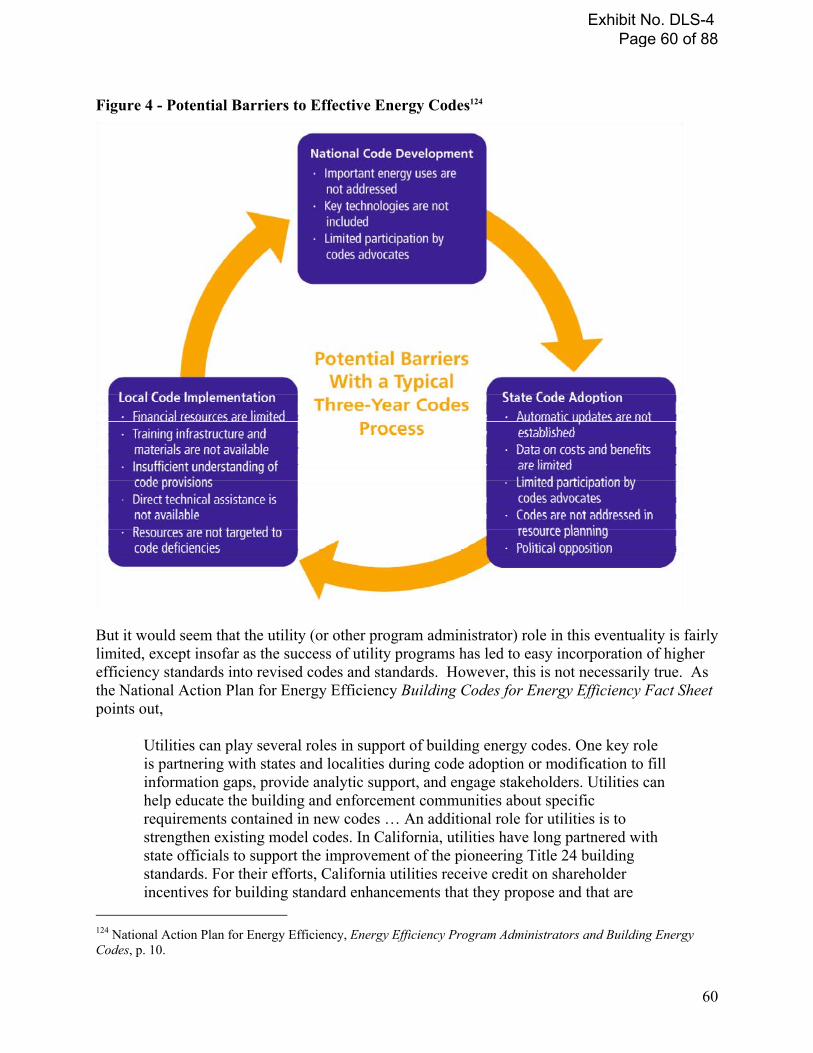
�
60
Figure 4 - Potential Barriers to Effective Energy Codes124
But it would seem that the utility (or other program administrator) role in this eventuality is fairly limited, except insofar as the success of utility programs has led to easy incorporation of higher efficiency standards into revised codes and standards. However, this is not necessarily true. As the National Action Plan for Energy Efficiency Building Codes for Energy Efficiency Fact Sheet points out,
Utilities can play several roles in support of building energy codes. One key role is partnering with states and localities during code adoption or modification to fill information gaps, provide analytic support, and engage stakeholders. Utilities can help educate the building and enforcement communities about specific requirements contained in new codes … An additional role for utilities is to strengthen existing model codes. In California, utilities have long partnered with state officials to support the improvement of the pioneering Title 24 building standards. For their efforts, California utilities receive credit on shareholder incentives for building standard enhancements that they propose and that are
124 National Action Plan for Energy Efficiency, Energy Efficiency Program Administrators and Building Energy Codes, p. 10.
Exhibit No. DLS-4 Page 60 of 88
�
61
adopted by the CEC. The resulting savings count toward their energy efficiency targets and are incorporated into overall forecasts of energy and demand savings.125
In additional support of this observation, a new publication by NAPEE states plainly, “It is important to explore the opportunity for utilities and other program administrators to play an expanded role as part of achieving all cost-effective energy efficiency.” 126 A number of states, in particular California and New York, have had considerable success with program administrator-supported codes and standards (C&S) programs. California Codes and Standards Program California has had a long history of implementing building codes. California established its first statewide energy requirements in 1975. The California Building Standards Commission is responsible for Title 24 California Code of Regulations, which governs residential and commercial buildings. The codes are updated on a triennial cycle. In 2008, the California Energy Commission (CEC) completed the rulemaking process for updates to Part 6 of Title 24, Energy Efficiency Standards for Residential and Non-Residential Buildings (for implementation in 2010).127 California established its first Appliance Energy Efficiency regulations in 1976. The California Energy Commission administers these regulations (Title 20, Section 1601-1608 California Code of Regulations128) and updates them periodically. The codes include standards for both federally and non-federally regulated appliances. The newest regulations went into effect in August 2009. California utilities started the statewide Codes and Standards Program in 2000 and have been actively engaged ever since. The program transitioned from an information-only program to a resource-acquisition oriented program during the utilities’ 2006-8 program cycle. The program engages in all phases of codes and standards development and implementation by:
- Developing codes and standards enhancement (CASE) studies for energy efficiency improvements for promising design practices and technologies and presenting to standards and code-setting bodies, and
- Following the adoption of new codes or standards the program by supporting their implementation through activities designed too ensure compliance.
The California Public Utilities Commission approved a statewide 2010-12 C&S program that contains the following specific elements:
1. a Building Codes Sub-Program, with Advocacy, Extension of Advocacy and Codes And Standards Advocacy (CASE) Studies program elements (all of which are continuations of 2006-2008 programs);
125 National Action Plan for Energy Efficiency, Building Codes for Energy Efficiency Fact Sheet, October 2007, pp. 4-5. 126 National Action Plan for Energy Efficiency, Energy Efficiency Program Administrators and Building Energy Codes, p. 1. 127 See http://www.energy.ca.gov/title24/2008standards/ 128 See http://www.energy.ca.gov/appliances/
Exhibit No. DLS-4 Page 61 of 88
�
62
2. an Appliance Standards Subprogram, with Advocacy, Extension of Advocacy and CASE Studies program elements (all of which are continuations of 2006-2008 programs);
3. a Compliance Enhancement Sub-Program (CEP), which includes Measure-Based and Holistic program elements (both of which are new programs); and
4. a Reach Codes Subprogram, with Local Government Ordinances and Green Building Standards program elements (both of which are new programs).129
Importantly, the CPUC allows utilities to claim credit for energy savings associated with these programs. During 2010-12, the budgets and goals for this program are approximately 1 percent of the total electric budget ($34.4M/$2,844M) and 8 percent of electric goals (546 GWh/6,965 GWh).130 To quantify the savings associated with the C&S programs, the California Evaluators’ Protocols include a chapter that establishes a “Codes and Standards and Compliance Enhancement Evaluation Protocol”.131 Northwest Energy Efficiency Alliance (NWEA) Codes and Standards Support Project Since 1997, NEEA has supported energy code activities in the Northwest through its Codes and Standards Support Project. Its main method of intervention has been funding staff positions and organizations responsible for code adoption and education. Its recent objectives include:
- #1 Encourage the adoption of uniform and easily interpreted energy codes in the Northwest;
- #2 Develop an energy “reach” code for the region that can serve as a guideline for regional and state code adoptions for the next five to seven years;
- #3 Increase compliance with energy codes where compliance is below 85%, and maintain it at current levels where it is at or above 85%; compliance rates will be measured by periodic regional new construction baseline surveys;
- #4 Increase the stringency of Northwest and national energy codes with a target of a 15% overall increase in efficiency by 2010, and
- #5 Successfully adopt cost-effective, performance-based code change proposals. The Market Progress Evaluation Report conducted in April 2008 concluded that NEEA had a great number of successes and room for improvement as well. 132 Among the suggested improvements was the suggestion that “NEEA actively explore avenues to work with utilities to build their involvement and support for energy code-related activities.”133 As an organization
129 California Public Utilities Commission, D. 09-09-047, p. 201. The Compliance Enhancement Subprogram is designed to enhance compliance with existing code and will initially target the following measures/practices: SEER 13 air conditioners, Storage water heaters, Nonresidential window U-factor and solar heat gain coefficient, Mandatory requirements for duct sealing, Quality insulation installation, and HVAC quality installation. 130 California Public Utilities Commission, D. 09-09-047. This is approximate because the $2,844M in budget also includes some gas spending. In addition the projected goals do not include savings associated with the Compliance Enhancement Program (CEP) and Reach Codes subprogram because utilities did not submit such estimates in their filings. 131 The TecMarket Works Team, Evaluators’ Protocols, pp. 81-104. 132 Northwest Energy Efficiency Alliance, NEEA Codes and Standards Support Project: MPER # 2, Prepared for the Northwest Energy Efficiency Alliance by Quantec, LLC, April 11, 2008. 133 Northwest Energy Efficiency Alliance, NEEA Codes and Standards Support Project: MPER # 2, p. 42.
Exhibit No. DLS-4 Page 62 of 88
�
63
primarily funded by the Bonneville Power Administration (BPA), NEEA engages with utilities but surveys found that eighty-five percent of region energy codes contractors interviewed said that utilities could play a role supporting energy code activities through, among other things various types of financial and in-kind support, such as training facilities, funding third-party special plans inspectors, and encouraging beyond code and early adopters. New York State Energy Research and Development Authority’s Strategy for an Enhanced Codes and Appliance Standards Program in New York The Codes Division of the New York Department of State updated the State’s Energy Conservation and Construction Code in April 2008. All building-related codes in New York are currently reviewed and updated on a three-year cycle, with the next cycle beginning in 2009. NYSERDA is proposing an enhanced codes and standards program as part of New York’s adoption of an energy efficiency portfolio standard. NYSERDA’s proposal aims to address the need “to increase compliance with existing energy codes, channel resources to advance code standards and ensure the timely enactment of appliance and equipment standards.”134 The five components of its strategy are:
- Strategy 1 - Determine Current Levels of Energy Code Compliance Through Regular Baseline Compliance Assessments;
- Strategy 2 - Development and Delivery of Advanced Training, Tools, Strategies, and Resources;
- Strategy 3 - Provide Technical Support for Enhanced Energy Code and Appliance Standards;
- Strategy 4 - Expand Implementation Assistance to Communities and Product Supply Chain, and
- Strategy 5 - Continue Benchmarking Building Performance and Progress Toward Goals.135
In developing its plan, NYSERDA worked actively with the Building Codes Assistance Project (BCAP), an initiative that provides custom-tailored assistance on building energy code adoption and implementation.136 The New York Department of Public Service issued in late 2008 a Notice of Proposed Rulemaking that includes NYSERDA’s proposal. Colorado Program As a “home rule” state, Colorado allows municipalities to set their own codes.137 However, the cities of Denver (note that Denver is not home rule) and Boulder, have sought regular changes in
134 The New York Energy Research and Development Authority, A Strategy for Enhanced Energy Codes and Appliance Standards in New York, Submitted in Case 07-M-0548: Proceeding on Motion of the Commission Regarding an Energy Efficiency Portfolio Standard, October 15, 2008, p. 2. 135 The New York Energy Research and Development Authority, A Strategy for Enhanced Energy Codes and Appliance Standards in New York, pp. 6-9. 136 http://bcap-energy.org/ 137 Colorado has 59 cities and 30 towns that are Home Rule Municipalities: Colorado Home Rule Municipalities are self-governing under Article XX of the Constitution of the State of Colorado; Title 31, Article 1, Section 202 of the Colorado Revised Statutes; and the Home Rule Charter of each municipality. The Home Rule Charter determines
Exhibit No. DLS-4 Page 63 of 88

�
64
their codes and BCAP reports that energy codes are gaining momentum in the state.138 Adoption of one of the variations on an energy codes program, particularly as it relates to those municipalities that are actively pursuing code updates would make a great deal of sense. Energy Technologies Center One of the primary program efforts of California’s Statewide Energy Efficiency Education and Training Program is the establishment and management of nine Energy Centers around the state. These energy centers are sponsored and managed by utilities. The Centers are generally set-up for a particular target customer segment (e.g. Pacific Gas & Electric’s Food Service Training Center, Southern California Edison’s Agricultural Technology Application Center) but some serve all customer segments (e.g. Southern California Gas’s Energy Resource Center). The activity varies greatly by Center, to include educational courses, consultations, tool lending libraries, outreach, demonstrations, and other activities. A recent evaluation of the Energy Centers attempted to quantify energy savings associated with the Centers. Unfortunately, this was one of the first and few efforts of this type. The evaluation found that:
there is a substantial positive impact of these centers in energy savings that is not being captured by the impact evaluations of the incentive programs. Forty-five percent of the commercial end-user attendees and 27% of the residential end-user attendees took energy saving actions in locations within the four IOU territories that was not already being counted in another impact evaluation. In addition, 77% of market actors changed or enhanced services based on course information, and over half had made changes that resulted in measurable energy savings. The courses also had the expected indirect benefits of increasing attendees’ awareness of energy saving opportunities and utility programs.139
In reality, California’s Energy Centers are not structured as direct impact market transformation programs but rather exist to provide education and training with little effort to quantify savings. Yet, these centers have had a clear and quantifiable effect on customer energy-use behaviors and have produced beneficial outcomes. Establishing a center that includes as part of its program design a very clear set of energy saving objectives to include ongoing evaluation and measurement could be a very valuable addition to a utility’s market transformation portfolio. Emerging Technologies Program An emerging technologies program relies on research, development, demonstration and/or deployment to move energy-efficient products and developments from the laboratory into the commercial marketplace. Emerging technologies fit the definition of market transformation
the form of government. A Colorado Home Rule Municipality may declare itself to be either a city or a town. See http://en.wikipedia.org/wiki/Colorado municipalities. 138 Building Codes Assistance Project, Energy Codes in the Home Rule West How home rule affects building energy code adoption and implementation in Arizona and Colorado, March 2009, p. 6. 139 Tami Buhr, et al., “Education and Training Programs: An Evaluation of the Energy Benefits”, (paper presented at Counting on Energy Programs: It’s Why Evaluation Matters, Portland, Oregon: International Energy Program Evaluation Conference, August 2009), p. 907.
Exhibit No. DLS-4 Page 64 of 88
�
65
strategies because the programs are attempting to help establish the conditions to enable non-market-ready energy efficiency technologies to enter the market and change market paradigms. An emerging technologies program is not especially risky; however, it is not a program that a single utility can easily pursue on its own. Rather, if such an effort is pursued, it is best accomplished through collaboration with other entities that have prominent Emerging Technologies efforts already underway, such as the California utilities or the Consortium for Energy Efficiency. In addition, the results from the program are difficult to quantify. It is possible for a utility’s program to count savings from these emerging technologies if the technologies are introduced as part of the utility’s custom program. But many of these technologies may be more applicable to mass markets, for which custom programs do not typically exist. Still, active involvement in such efforts can enable the program administrator to have a closer connection to emerging technologies and facilitate more rapid integration into the administrator’s portfolio when market ready. Targeted Education and Information Program Public Service has proposed with its Customer Behavioral Change program a targeted education and information program. Targeted education and information campaigns are considered market transformation because they seek to shift customer behaviors without using rebates/incentives and, in so doing, modify market structures for energy efficiency goods and services. The difficulty with such campaigns comes in attempting to quantify the energy savings effects of the effort, having a sufficiently large impact, and extending any changes in consumer behavior to changes in market structures. With the increased interest in behaviorally based programs, targeted education and information campaigns are re-emerging with a variety of twists. The new twists to these programs are emerging out of interest in the behavioral school of thought about consumer decisions and the increasing availability of information on customer usage. As described by Michael Sullivan, energy use (and energy efficiency) is viewed as byproducts of human actions that include: mobility, sustenance, security, and household maintenance. From this perspective, the decision to purchase energy using equipment is just one of many behaviors that affect a person’s energy consumption. In addition, according to this view, the traditional energy efficiency program primary focus on encouraging customers to adopt better technologies, based on the theory that consumers are wholly rational and will respond to efforts to improve awareness and lower first costs is insufficient and will not allow acquisition of all available energy efficiency. 140,141 Figure 5 - BDP Paradigm142
140 Michael Sullivan, Behavioral Assumptions Underlying Energy Efficiency Programs and Policies: Presentation of the Key Findings and Conclusions in the Behavioral Assumptions White Paper, February 6, 2009, p. 8. 141 Also see Energy Efficiency Economics and Policy, Kenneth Gillingham, Richard G. Newell, and Karen Palmer, Resources for the Future Discussion Paper, April 2009, p. 18. 142 Michael Sullivan, Impacts of Behavioral Assumptions on Energy Efficiency Program Design and Development – badly needed program innovations and how to get there, (presentation to the 2009 National Symposium on Market Transformation, March 2009), p. 8.
Exhibit No. DLS-4 Page 65 of 88
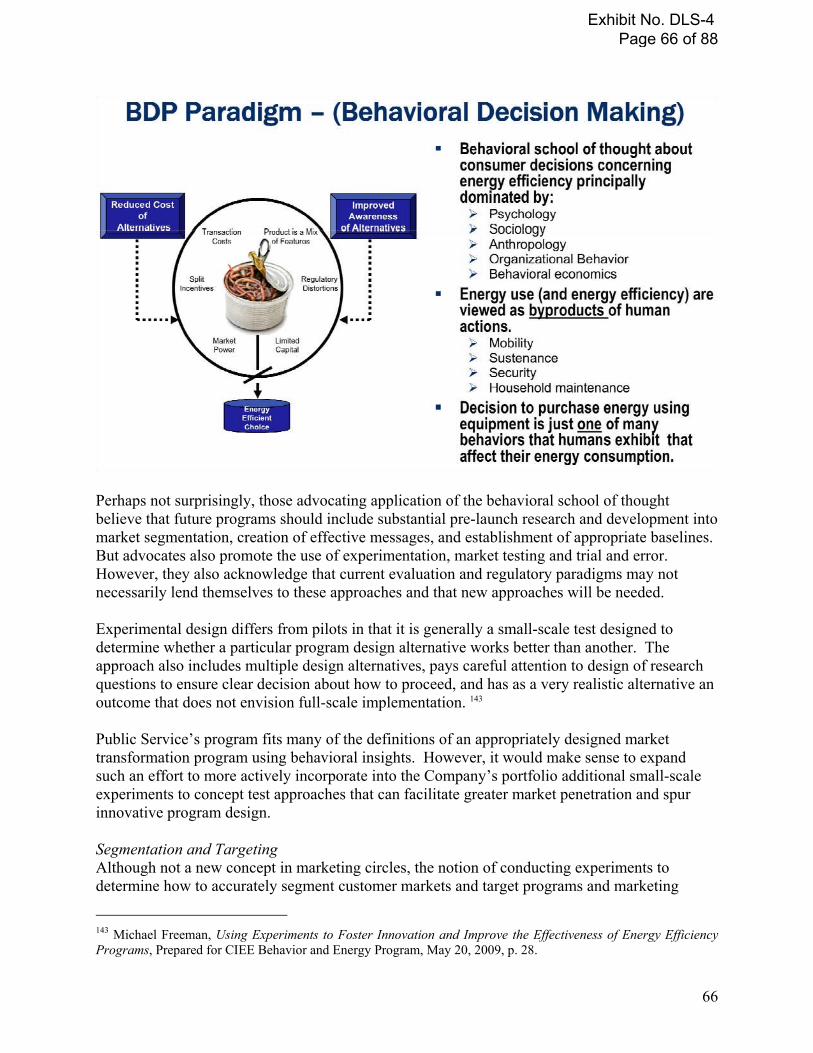
�
66
Perhaps not surprisingly, those advocating application of the behavioral school of thought believe that future programs should include substantial pre-launch research and development into market segmentation, creation of effective messages, and establishment of appropriate baselines. But advocates also promote the use of experimentation, market testing and trial and error. However, they also acknowledge that current evaluation and regulatory paradigms may not necessarily lend themselves to these approaches and that new approaches will be needed. Experimental design differs from pilots in that it is generally a small-scale test designed to determine whether a particular program design alternative works better than another. The approach also includes multiple design alternatives, pays careful attention to design of research questions to ensure clear decision about how to proceed, and has as a very realistic alternative an outcome that does not envision full-scale implementation. 143 Public Service’s program fits many of the definitions of an appropriately designed market transformation program using behavioral insights. However, it would make sense to expand such an effort to more actively incorporate into the Company’s portfolio additional small-scale experiments to concept test approaches that can facilitate greater market penetration and spur innovative program design. Segmentation and Targeting Although not a new concept in marketing circles, the notion of conducting experiments to determine how to accurately segment customer markets and target programs and marketing
143 Michael Freeman, Using Experiments to Foster Innovation and Improve the Effectiveness of Energy Efficiency Programs, Prepared for CIEE Behavior and Energy Program, May 20, 2009, p. 28.
Exhibit No. DLS-4 Page 66 of 88

�
67
efforts to these segments is new to the energy efficiency industry. Consumer product marketing has long used market research to better determine how to efficiently market to customers and such approaches are beginning to gain greater favor for energy efficiency programs. Experimenting with such approaches would entail selecting a segment and a randomly selected group to which marketing messages can be provided (or alternatively comparing the targeted group for a period before and after the messages) and using these comparisons to gauge the success of both the selected segment and the targeting to increase energy efficiency actions. Public Information Campaign with Varying Messages Similarly, the program administrator might experiment with different messages. For example, such messages might be varied between emphasis on preserving the future, climate change, being a responsible citizen, cleaning the air, supporting the community, etc. In any case, selecting reasonably sized samples with which to try such messages and gauge their success can be done cost effectively and generate substantial benefits. Community Level Interventions Partnering at the community-level can provide another channel through which to market programs but could be established in such a way as to experiment with different approaches. Stopping short of having each of these community-level entities (cities, counties, etc.) serve as “guinea pigs”, it would be practical to propose different (equally acceptable) approaches to program design to different communities to help understand which concepts work the best. Although implementation of the different approaches in the different communities may be highly dependent on the skill and experience of the local partner and the receptiveness of the customers in those communities, it is possible to neutralize these factors in conducting the analysis of the different approaches.
Exhibit No. DLS-4 Page 67 of 88
68
���Public Service Company of Colorado appears to be on the right path with respect its method of handling net-to-gross ratios and its recent efforts to pursue market transformation strategies and programs. However, the Company still has some room for improvement in both areas.
����1) Not specifically propose to adopt a “net” or “gross” goals approach but rather ensure that
whichever approach is selected, that goals and achievements are apples-to-apples comparisons. In this sense, if it is determined that goals are more closely aligned with gross achievements, then achievements should also be measured on a gross basis. Calculations of net-to-gross (the primary differentiator between gross and net achievements) remain important although it is not clear that the benefits of calculating such ratios for purposes of determining goals and achievements outweigh the potentially significant costs of accurately determining these values. If such a “gross” goals approach is pursued, it would make sense to propose its implementation over a number of years and perhaps tie adoption of the approach to Public Service’s success in implementing the coordination strategy discussed below (because one of the primary reasons for adopting a gross approach is to encourage coordination and cooperation among players in the energy efficiency space).
2) Develop a technical reference manual and database to explain the process of calculating savings for different types of projects and to record deemed savings values for projects. Such technical reference manuals are increasingly common among utilities and serve to increase transparency involving energy savings calculations and help clearly document the approach taken to estimate savings.
3) Immediately implement mechanisms that would allow the Company to more readily calculate free ridership during the course of a program to ensure that unusual trends are not emerging. Mechanisms such as sampling of customers during program implementation can serve this purpose and feed into any after-the-fact evaluations conducted on the program. To be sure, program development and design should clearly include how the program plans to handle assessments of net-to-gross.
4) Implement a requirement that all programs have clear program designs along with program theories and logic models (PT/LM). Logic models help communicate program theory (the how’s and why’s) and the reasons for outcomes. Although not a new concept, PT/LMs can play important roles in maximizing program performance, establishing continuous improvement and creating a structure to more clearly identify program impacts. This, too, should be incorporated into program design and development.
5) Maximize its coordination with other “players” in the energy efficiency space who could influence customer EE decisions and establish leadership position in the interface with customers in this regard (i.e. assert primary customer contacts). Although all of the recommendations in this list entail active participation and, in certain cases approval by the Colorado Public Utilities Commission this suggestion will not succeed without the CPUC’s involvement and encouragement. There are multiple players in the Colorado energy efficiency space and coordination among these players will produce the best outcomes; however, it is important that one program administrator lead the coordinated
Exhibit No. DLS-4 Page 68 of 88

�
69
effort. This entity should be Public Service Company of Colorado because Public Service possesses the consistency of funding, is regulated by the CPUC to protect consumer interests, and has the depth of knowledge and experience to play this role. The CPUC in its role as utility regulator and electric and gas policy leader can facilitate this effort. Formally request CPUC approval for its current approach to Evaluation, Measurement & Evaluation. This approach was previously approved as part of a settlement and, therefore, has not been approved on its own merits. The Company’s EM&V approach should be modified to include the recommendations embodied in this paper.
6) Readily incorporate into program designs and revisions for future program years results from any impact evaluations.
With respect to market transformation programs and strategies the study recommends that Public Service:
1) Give more thought to its design of such programs to include clear methods for evaluating the impacts and success of such programs well before the program launches.
2) Adopt protocols and approaches for estimating savings from market transformation programs based on the California Evaluation Framework for estimating results.
3) Implement a Codes and Standards program in partnership with local governments and possibly the Governor’s Energy Office.
4) Consider pursuing development of an Energy Resource Center program and establish an Energy Resource Center. An Energy Resource Center can help provide a focal point with Public Service’s service territory for energy efficiency (and possibly renewable energy) efforts. Such centers can be quite expensive and of uncertain value. However, if developed with focus on clearly identifying how benefits will be annually measured, creating productive partnerships, and potentially reclaiming an existing facility to lower first cost, such a Center could serve an important role in the Company’s market transformation strategy. Implement a Targeted Education and Information program that incorporates experimental design.
5) Establish larger budgets for a research function either within the Company or for outside contractors for EM&V and development of innovative program activities.
6) Set a limit on the amount it will spend on market transformation programs to guide allocation of resources between the various types of programs Public Service will operate.
Market transformation strategies and programs present potential significant opportunities (particularly related to behaviorally-based programs) but such programs generally require considerably more forethought, research and development. This might entail establishing larger budgets for a research function either within the Company or for outside contractors; but in either case, such an effort will have to be actively managed by Company personnel.
Exhibit No. DLS-4 Page 69 of 88
70
���
��This final chapter reviews the research questions raised at the beginning of this paper. As presented, they are: 1. What are the various key influences affecting customer energy efficiency decision
making?
This question was answered in Chapter 3, pages 14-16. 2. How can these influences be best quantified?
This question was answered in Chapter 3, pages 17-18 and page 21.
(a) Specifically, how do national and local practices and policies related to education, and standards and code changes affect attribution analysis?
3. What are national trends on this topic and possible future directions?
This question was answered in Chapter 3, pages 21-28. 4. What are the implications of such influences on calculations of utility-claimed energy
savings and regulatory goal setting (specifically for Public Service)?
This question was answered in Chapter 3, pages 30-32. 5. What is market transformation and what are market transformation programs?
This question was answered in Chapter 4, pages 34-35. 6. How could Public Service incorporate these concepts into its programs?
This question was answered in Chapter 4, pages 56-60. 7. What is “best practice” for estimating results from market transformation programs?
This question was answered in Chapter 4, pages 51-56. 8. Is it possible to estimate “market potential” for market transformation programs?
This question was answered in Chapter 4, page 50.
Exhibit No. DLS-4 Page 70 of 88
71
��This is a complicated set of topics with a great many points of view and emerging developments. As program administrators pursue higher levels of energy efficiency, attempt to penetrate more deeply into customer markets and look for new and innovative ways to reduce customer energy use, the topics discussed in this document will continue to evolve. It is clear that, at the very least, a utility like Public Service of Colorado needs to be vigilant in its efforts to innovate and pursue new approaches and methods for accomplishing its energy savings objectives. These new approaches may include partnerships with organizations and entities that were previously either not considered or, for whatever reason, not pursued. To be sure, Public Service appears to be doing a lot of things right and must continue to pursue new and novel approaches in order to reach higher levels of energy efficiency within its territory. Ultimately, to accomplish its goals and improve the environment in which the Company operates, no less than a wholesale commitment to this innovation will be required.
�
Exhibit No. DLS-4 Page 71 of 88
�
72
�
������Paragraphs 43 and 45 (pages 13-14) of Decision C08-0769, Docket No. 07A-420E, Order on Applications for Rehearing, Reargument, Reconsideration, Adopted Date: July 16, 2008 43. The Decision does not preclude Public Service from including a proposed approach to net-to-
gross in its biennial plan filing, as part of the overall cost-effectiveness detail that it will provide pursuant to Paragraph 171. Further, Paragraph 87 directs Public Service to engage in supplemental market studies, including a study to “assess techniques for quantifying market transformation potential and for quantifying the impact of DSM market transformation strategies.” This language conveys that we acknowledge that other market forces are impacting DSM potential and need to be appropriately factored into DSM planning. A reevaluation of this issue is not precluded by the Decision, and could be incorporated into a subsequent docket. Public Service is encouraged to address this issue in its biennial plan.
45. We find that, in response to the directive in Paragraph 87 of the Decision regarding market
research, Public Service could offer suggestions as to how market transformation strategies, including energy codes, appliance standards, and other indirect efforts, could be appropriately incorporated into its Colorado DSM programs. This could include an assessment of how such activities are treated in the DSM policies and programs of other states, including Minnesota. Thus, aside from utility infrastructure improvements, which were not discussed in the 07A-420E docket, we find that the concern expressed by Public Service regarding various factors impacting energy savings potential is already addressed in the Decision.
Paragraph 87 (page 28) of Decision C08-0560, Docket No. 07A-420E, Order Granting Application in Part, Adopted Date: May 23, 2008 87. We also direct Public Service to engage one or more market research consultants to conduct
targeted assessment or updates, as listed below, for use in developing the second and subsequent biennial DSM plan: � Residential appliance saturation; customer awareness and energy efficiency behaviors;144 � Update of portions of the current KEMA study simultaneous with offering DSM
programs into specific markets; in other words, seek out opportunities to reduce the cost of implementing an assessment by “piggybacking” upon DSM programs as a means of accessing customers for survey purposes;
� Update the residential market potential assessment to assess “plug load” savings, the potential for approaching existing housing “as a system” as advocated by EEBC and quantifying the potential within the new housing market; and
144 See Coito Rebuttal Testimony, p. 14
Exhibit No. DLS-4 Page 72 of 88

�
73
� Assess techniques for quantifying market transformation potential and for quantifying the impact of DSM market transformation strategies.
Exhibit No. DLS-4 Page 73 of 88
74
��������Market Transformation is the strategic process of intervening in a market to create lasting change in market behavior by removing identified barriers or exploiting opportunities to accelerate the adoption of all cost-effective energy efficiency as a matter of standard practice. Northwest Energy Efficiency Alliance, NEEA’s Definition of Market Transformation, at www.nwalliance.org/participate/docs/NEEAMTDefinition2008.pdf Market Transformation (MT) is a strategy that promotes the manufacture and purchase of energy-efficient products and services. The goal of this strategy is to induce lasting structural and behavioral changes in the marketplace, resulting in increased adoption of energy-efficient technologies. Consortium for Energy Efficiency (CEE), Market Transformation Primer, http://www.cee1.org/cee/mt-primer.php3 A reduction in market barriers resulting from a market intervention, as evidenced by a set of market effects, that lasts after the intervention has been withdrawn, reduced, or changed. Eto, J., Prahl, R., and Schlegel, J. 1996. A Scoping Study on Energy-Efficiency Market Transformation by California Utility DSM Programs. LBNL-39058. UC-1322. Berkeley, Calif.: Earnest Orlando Lawrence Berkeley National Laboratory.
Exhibit No. DLS-4 Page 74 of 88
75
������� Program logic models are graphic representations of the causal links between program activities, short-term responses to those activities among market actors, and longer-term market effects. Program sponsors routinely use logic models to array information and insights gained from market characterization and trace their implications for the design of various program components and the timing of their deployment. Program sponsors report using logic models in the following ways to support program planning:
� Ensure that all key groups of market actors are addressed by one or more program component.
� Ensure that key motivators and barriers for each group are addressed in the program design.
� Formulate indicators of market change that can be used to characterize the baseline and formulate program goals and objectives in a quantitative manner.
� Identify gaps in the market data that need to be filled through program-related contacts with market actors or independent data gathering activities as the program progresses.
� Provide a framework for negotiation among sponsors and evaluators regarding the establishment of quantitative goals for participation and observed market changes.
� Identify areas of overlap and potential synergy among different programs that operate in the same market sectors.145
The following page includes a logic model filed by Pacific Gas and Electric Company in support of the 2010-12 Codes and Standards Program. 146
145 Market Effects and Market Transformation: Their Role in Energy Efficiency Program Design and Evaluation, p. 49. 146 Pacific Gas and Electric Company, 2009-11 Energy Efficiency Portfolio Program Implementation Plan Statewide Program Codes and Standards, Docket No. 08-07-031, February 2009.
Exhibit No. DLS-4 Page 75 of 88
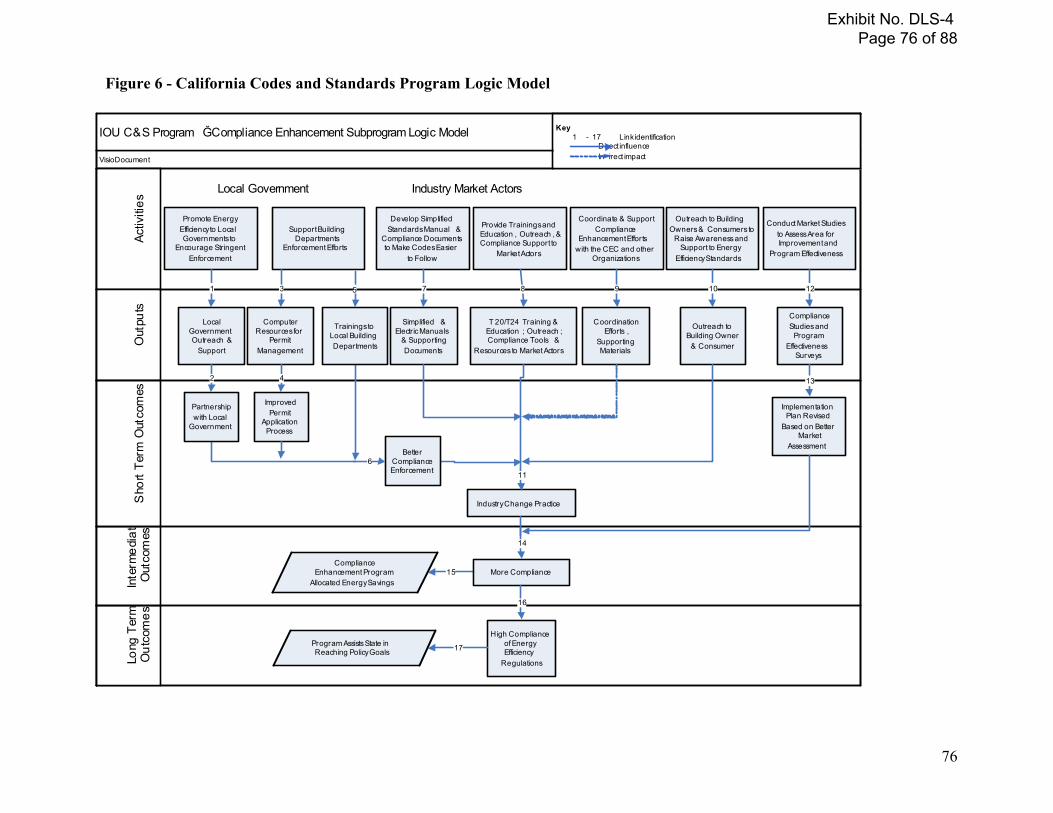
76
VisioDocument
IOU C&S Program � Compliance Enhancement Subprogram Logic ModelAc
tiviti
esLo
ng T
erm
O
utco
mes
Inte
rmed
iat
O
utco
mes
Out
puts
Sho
rt Te
rm O
utco
mes
Promote Energy Efficiency to Local Governments to
Encourage Stringent Enforcement
Program Assists State in Reaching Policy Goals
Key 1 - 17 Link identification Di ect influence In irect impact
1
15
Support Building Departments
Enforcement Efforts
Develop Simplified Standards Manual &
Compliance Documents to Make Codes Easier
to Follow
Provide Trainings and Education , Outreach , & Compliance Support to
Market Actors
Outreach to Building Owners & Consumers to
Raise Awareness and Support to Energy
Efficiency Standards
Coordinate & Support Compliance
Enhancement Efforts with the CEC and other
Organizations
Conduct Market Studies to Assess Area for Improvement and
Program Effectiveness
Simplified & Electric Manuals
& Supporting Documents
Trainings to Local Building Departments
Computer Resources for
Permit Management
T 20/T24 Training & Education ; Outreach ; Compliance Tools &
Resources to Market Actors
Outreach to Building Owner
& Consumer
Coordination Efforts ,
Supporting Materials
Compliance Studies and
Program Effectiveness
Surveys
Local Government Outreach &
Support
3 5 7 8 109 12
Partnership with Local
Government
Implementation Plan Revised
Based on Better Market
Assessment
Improved Permit
Application Process
Industry Change Practice
2 4
11
Better Compliance Enforcement
More ComplianceCompliance
Enhancement Program Allocated Energy Savings
High Compliance of Energy Efficiency
Regulations
17
16
13
14
6
Local Government Industry Market Actors
Figure 6 - California Codes and Standards Program Logic Model
Exhibit No. DLS-4 Page 76 of 88

77
�������Source: D. 09-09-047, California Public Utilities Commission, Market Transformation Metrics The following tables were used by California utilities in filings associated with their 2010-12 programs. The two tables were intended for each program to provide ways of measuring baseline while the other would indicate progress against that metric. It is anticipated that the Energy Division (staff) of the California Public Utilities Commission will more fully develop these metrics in 2010.
Baseline Metrics Baseline Metrics
Metric A Metric B Metric C Overall Program
Market Transformation Metrics Internal Market Transformation Planning Estimates
Market Sector and Segment 2010 2011 2012 Metric A Metric B Metric C
Exhibit No. DLS-4 Page 77 of 88
78
��� Cost Effectiveness - An indicator of the relative performance or economic attractiveness of any energy efficiency investment or practice when compared to the costs of energy produced and delivered in the absence of such an investment147 Deemed Savings - Savings based on stipulated values, which come from historical savings values of typical projects. With deemed savings there are no or very limited measurement activities and only the installation and operation of measures is verified.148 Demand-Side Management (DSM) - Programs that reduce the use of energy by the use of energy efficiency products, services, and practices, or that change the timing of energy use. (Policy Manual) Free Driver - A non-participant who adopted a particular efficiency measure or practice as a result of a utility program. See SPILLOVER EFFECTS for aggregate impacts. Free Rider - A program participant who would have implemented the program measure or practice in the absence of the program. Gross Load Impacts - The change in energy consumption and/or demand that results directly from program-related actions taken by participants in the DSM program, regardless of why they participated. Incentives - Financial support (e.g., rebates, low-interest loans) to install energy efficiency measures. The incentives are solicited by the customer and based on the customer’s billing history and/or customer-specific information.149 Large-Scale Data Analysis - Statistical analyses are conducted on the energy usage data (typically collected from the meter data reported on utility bills) for all or most of the participants and possibly non-participants in the program. This approach is primarily used for residential programs with relatively homogenous participants and measures, when project-specific analyses are not required or practical.150 Market Effects - A change in the structure or functioning of a market or the behavior of participants in a market that result from one or more program efforts. Typically these efforts are designed to increase in the adoption of energy-efficient products, services or practices and are causally related to market interventions.
Causality/Attribution - Causality should be examined to estimate net market effects. The goal of the activity is to estimate the proportion of market changes that can be attributed to program interventions using PGC and procurement funds, as versus those naturally occurring in the market or from interventions using non-PGC and non-procurement funds to arrive at market effects.
There are two primary approaches for estimating causal attribution, one uses a preponderance of evidence approach and the other uses a modeling approach. The ultimate goal for assessment of causal attribution is to avoid retrospective analysis in which contacts are asked to judge what efforts had effects on the market. Retrospective
147 California Energy Efficiency Policy Manual, Version 3.1, p. A5. 148 Model Energy Efficiency Evaluation Guide, A Resource of the National Action Plan for Energy Efficiency, p. 3-3. 149 California Evaluators’ Protocols, p. 228. 150 Model Energy Efficiency Evaluation Guide, A Resource of the National Action Plan for Energy Efficiency, p. 3-5.
Exhibit No. DLS-4 Page 78 of 88
�
79
approaches have great potential for bias because contacts are themselves influenced and cannot maintain objective perspectives.
Market Transformation - Programs and activities whose primary purpose is to induce long-lasting sustainable changes in the structure or functioning of a market achieved by reducing barriers to the adoption of energy efficiency measures to the point where such measures become standard in that specific market. Measurement and Verification (M&V) – In the context of measuring gross energy and demand savings, the term entails selecting a representative sample of projects in the program, determining savings those selected projects and applying these results to the entire population of projects, i.e. the program. The individual project savings are determined using one or more of the four M&V options defined in the IPMVP (the four IPMVP options are provided in Appendix E).151 M&V also refers more generally to all activities and expenditures associated with measuring and verifying energy and demand savings. Measures - A product whose installation and operation at a customer’s premises results in a reduction in the customer’s on-site energy use, compared to what would have happened otherwise. 152 Natural Change Effects - The change in base usage over time. Natural change represents the effects of energy-related decisions that would have been made in the absence of the utility programs by both program participants and non-participants. Net Load Impacts - The total change in load that is attributable to the utility DSM program. This change in load may include, implicitly or explicitly, the effects of free drivers, free riders, state or federal energy efficiency standards, changes in the level of energy service, and natural change effects. Net-to-Gross Ratio - A factor representing net program load impacts divided by gross program load impacts that is applied to gross program load impacts to convert them into net program load impacts. This factor is also sometimes used to convert gross measure costs to net measure costs. Non-Energy Benefits (NEBs) - Participant NEBs can include non-market goods, such as comfort and safety, as well as water savings and reduced operation and maintenance costs. Other possible positive NEBs include reduced eyestrain due to improved lighting quality and higher resale value associated with energy-efficient building upgrades. However, non-energy benefits can also be negative. Examples of negative NEBs are aesthetic issues associated with compact fluorescent bulbs and increased maintenance costs due to unfamiliarity with new energy-efficient equipment.153 Partial free rider - Those customers who would have installed some program-supported measures on their own, but not as many, as highly efficient, or as soon; the portion that they would have done in the absence of the program is included in the baseline, and the portion that they would not have done is attributable to the program. Performance Incentives – Monetary incentives paid to program administrators, usually for energy efficiency program performance that exceeds established goals.
151 Model Energy Efficiency Evaluation Guide, A Resource of the National Action Plan for Energy Efficiency, p. 3-3. 152 California Evaluators’ Protocols, p. 232. 153 Model Energy Efficiency Evaluation Guide, A Resource of the National Action Plan for Energy Efficiency, p. 3-8.
Exhibit No. DLS-4 Page 79 of 88
�
80
Rebates - A type of incentive provided to encourage the adoption of energy-efficient practices, typically paid after the measure has been installed. There are typically two types of rebates: a Prescriptive Rebate, which is a prescribed financial incentive/unit for a prescribed list of products, and a Customized Rebate, in which the financial incentive is determined using an analysis of the customer’s equipment and an agreement on the specific products to be installed. Upstream rebates are financial incentives provided for manufacturing, sales, stocking or other per unit energy-efficient product movement activities designed to increase use of particular type of products. 154 Snapback (also termed Rebound Effect, Take Back Effect) – A change in energy using behavior that yields an increased level of service and that occurs as a result of taking an energy efficiency action. Spillover Effects - Reductions in energy consumption and/or demand in a utility’s service area caused by the presence of the DSM program, beyond program related gross savings of participants. These effects could result from: (a) additional energy efficiency actions that program participants take outside the program as a result of having participated; (b) changes in the array of energy-using equipment that manufacturers, dealers, and contractors offer all customers as a result of program availability; and (c) changes in the energy use of non-participants as a result of utility programs, whether direct (e.g., utility program advertising) or indirect (e.g., stocking practices such as (b) above, or changes in consumer buying habits).
Participant - Additional energy efficiency actions that program participants take outside the program as a result of having participated. Non-participant - Changes in the energy use of non-participants as a result of utility programs, whether direct (e.g., utility program advertising) or indirect (e.g., stocking practices such as (b) above, or changes in consumer buying habits). (also referred to as “free driver”)
(Modified) Total Resource Cost Test - Modified TRC means an economic cost- effectiveness test used to compare the net present value of the benefits of a DSM program or measure over its useful life, to the net present value of costs of a DSM measure or program for the participant and the utility, consistent with § 40-1-102(5), C.R.S. In performing the modified TRC test, the benefits shall include, but are not limited to, as applicable: the utility’s avoided production, distribution and energy costs; the participant’s avoided operating and maintenance costs; the valuation of avoided emissions; and non-energy benefits as set forth in rule 4753. Costs shall include utility and participant costs. The utility costs shall include the net present value of costs incurred in accordance with the budget set forth in rule 4753.155
154 California Evaluators’ Protocols, p. 237. 155 Section 4750 (o), 4-CCR 723-4.
Exhibit No. DLS-4 Page 80 of 88
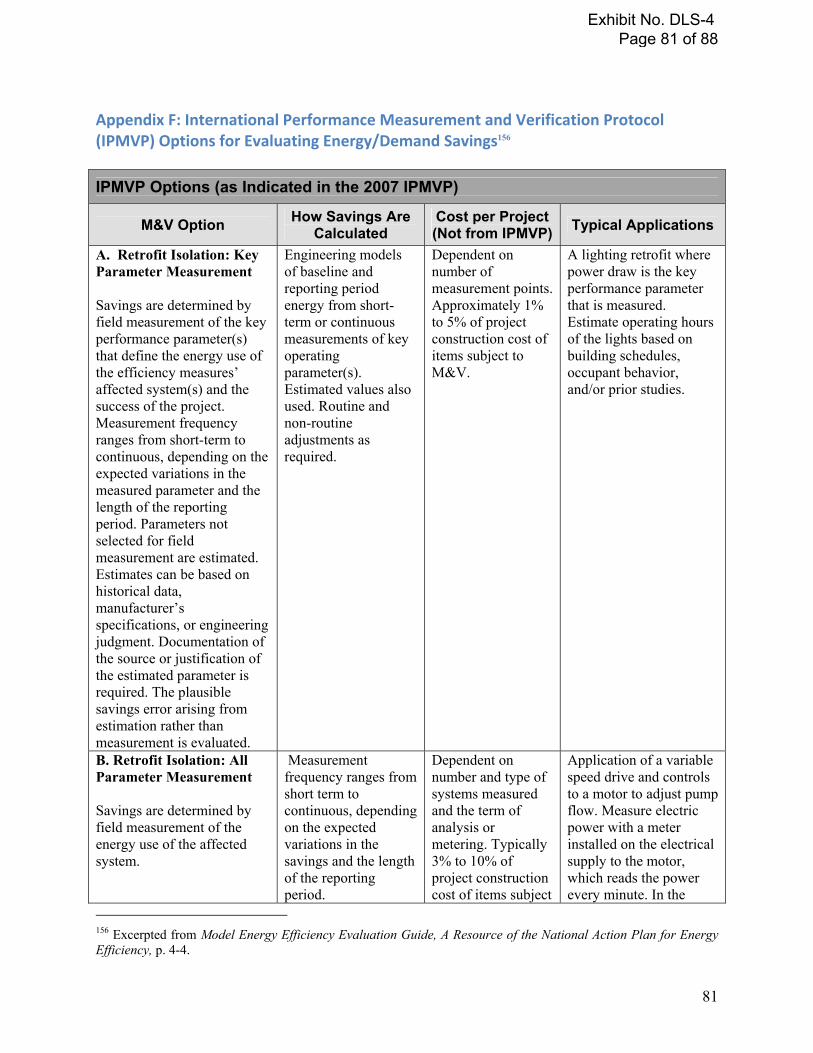
81
�������������156�
IPMVP Options (as Indicated in the 2007 IPMVP)
M&V Option How Savings Are Calculated
Cost per Project (Not from IPMVP) Typical Applications
A. Retrofit Isolation: Key Parameter Measurement
Savings are determined by field measurement of the key performance parameter(s) that define the energy use of the efficiency measures’ affected system(s) and the success of the project. Measurement frequency ranges from short-term to continuous, depending on the expected variations in the measured parameter and the length of the reporting period. Parameters not selected for field measurement are estimated. Estimates can be based on historical data, manufacturer’s specifications, or engineering judgment. Documentation of the source or justification of the estimated parameter is required. The plausible savings error arising from estimation rather than measurement is evaluated.
Engineering models of baseline and reporting period energy from short-term or continuous measurements of key operating parameter(s). Estimated values also used. Routine and non-routine adjustments as required.
Dependent on number of measurement points. Approximately 1% to 5% of project construction cost of items subject to M&V.
A lighting retrofit where power draw is the key performance parameter that is measured. Estimate operating hours of the lights based on building schedules, occupant behavior, and/or prior studies.
B. Retrofit Isolation: All Parameter Measurement Savings are determined by field measurement of the energy use of the affected system.
Measurement frequency ranges from short term to continuous, depending on the expected variations in the savings and the length of the reporting period.
Dependent on number and type of systems measured and the term of analysis or metering. Typically 3% to 10% of project construction cost of items subject
Application of a variable speed drive and controls to a motor to adjust pump flow. Measure electric power with a meter installed on the electrical supply to the motor, which reads the power every minute. In the
156 Excerpted from Model Energy Efficiency Evaluation Guide, A Resource of the National Action Plan for Energy Efficiency, p. 4-4.
Exhibit No. DLS-4 Page 81 of 88
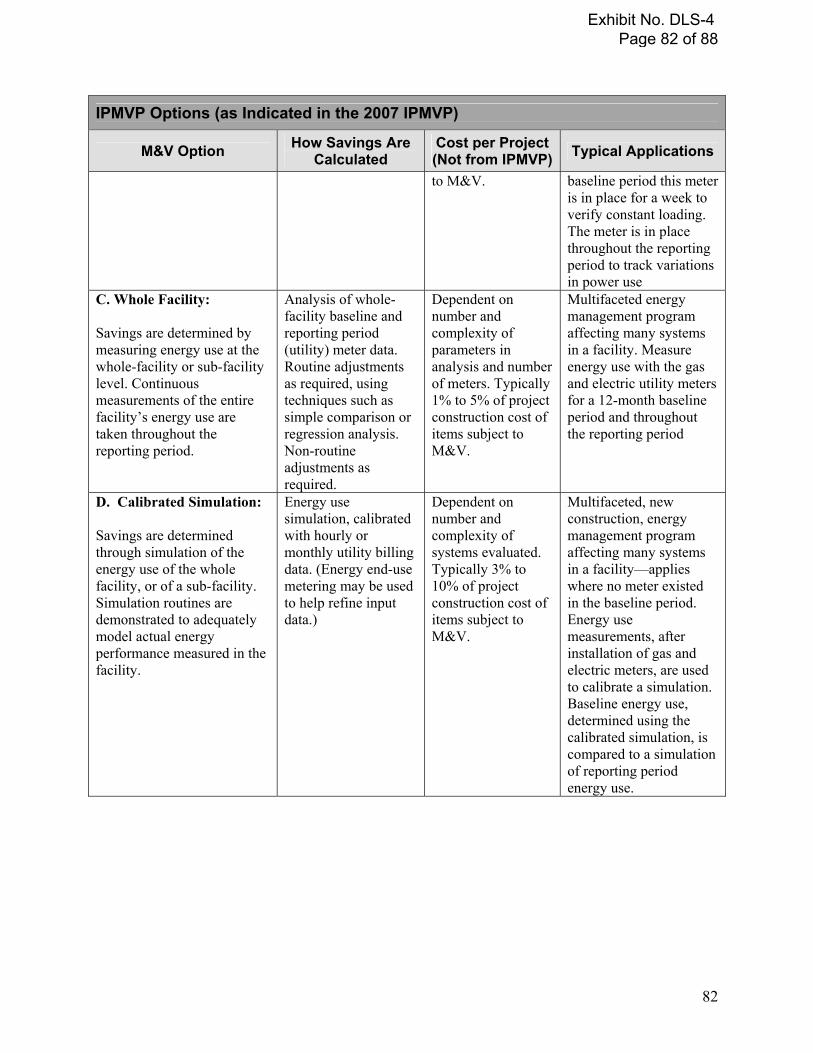
�
82
IPMVP Options (as Indicated in the 2007 IPMVP)
M&V Option How Savings Are Calculated
Cost per Project (Not from IPMVP) Typical Applications
to M&V. baseline period this meter is in place for a week to verify constant loading. The meter is in place throughout the reporting period to track variations in power use
C. Whole Facility: Savings are determined by measuring energy use at the whole-facility or sub-facility level. Continuous measurements of the entire facility’s energy use are taken throughout the reporting period.
Analysis of whole-facility baseline and reporting period (utility) meter data. Routine adjustments as required, using techniques such as simple comparison or regression analysis. Non-routine adjustments as required.
Dependent on number and complexity of parameters in analysis and number of meters. Typically 1% to 5% of project construction cost of items subject to M&V.
Multifaceted energy management program affecting many systems in a facility. Measure energy use with the gas and electric utility meters for a 12-month baseline period and throughout the reporting period
D. Calibrated Simulation: Savings are determined through simulation of the energy use of the whole facility, or of a sub-facility. Simulation routines are demonstrated to adequately model actual energy performance measured in the facility.
Energy use simulation, calibrated with hourly or monthly utility billing data. (Energy end-use metering may be used to help refine input data.)
Dependent on number and complexity of systems evaluated. Typically 3% to 10% of project construction cost of items subject to M&V.
Multifaceted, new construction, energy management program affecting many systems in a facility—applies where no meter existed in the baseline period. Energy use measurements, after installation of gas and electric meters, are used to calibrate a simulation. Baseline energy use, determined using the calibrated simulation, is compared to a simulation of reporting period energy use.
Exhibit No. DLS-4 Page 82 of 88
83
���� “2009 Energy Survey of Small Business.” National Small Business Association. April 2009.
“2009/2010 Demand-Side Management Biennial Plan: Electric and Natural Gas (Docket No. 08A-366EG).” Public Service Company of Colorado. Feb. 2009.
“2010 Business Plan.” Northeast Energy Efficiency Partnership. 2 Dec. 2009.
“A Strategy for Enhanced Energy Codes and Appliance Standards in New York.” Prepared by The New York Energy Research and Development Authority and submitted in Proceeding on Motion of the Commission Regarding an Energy Efficiency Portfolio Standard (Case 07-M-0548). 15 Oct. 2008.
“Application for Approval of 2008 Electric Energy Efficiency and Load Management Program Plan and Program Cost Tariff Riders (Docket No. 08-00204).” Public Service Company of New Mexico. 15 Sep. 2008.
“Application of Public Service Company of Colorado for Rehearing, Reargument and Reconsideration of Commission Decision No. C08-056.” In the Matter of the Application of Public Service Company of Colorado for Authority to Implement an Enhanced Demand Side Management Program and to Revise its Demand Side Management Cost Adjustment Mechanism to Include Cost Recovery and Incentives (Docket No. 07A-420E). 25 June 2008.
“Assigned Commission and Administrative Law Judge Ruling Regarding Policy Issues.” Application of Southern California Edison Company (U338E) for Approval of its 2009-2011 Energy Efficiency Program Plans and Associated Public Goods Charge (PGC) and Procurement Funding Requests (A.08-07-021). California Public Utilities Commission. 25 Feb. 2009.
“Behavior & Energy Cluster.” The Precourt Energy Efficiency Center at Stanford University. <http://peec.stanford.edu/behavior/>.
“Building Codes for Energy Efficiency Fact Sheet.” National Action Plan for Energy Efficiency. Oct. 2007. “California Long Term Energy Efficiency Strategic Plan: Achieving Maximum Energy Savings in California for 2009 and Beyond.” California Public Utilities Commission. Sep. 2008. <www.californiaenergyefficiency.com>
“Colorado Municipalities.” Wikipedia: The Free Encyclopedia. 24 Dec. 2009. <http://en.wikipedia.org/wiki/Colorado municipalities>.
“Compendium of Champions – Residential Lighting Programs.” American Council for an Energy-Efficient Economy (ACEEE). Feb. 2008.
“Decision Adopting Interim Energy Efficiency Savings Goals for 2012 through 2020, and Defining Energy Efficiency Savings Goals for 2009 through 2011 (Decision 08-07-047).” Order Instituting Rulemaking to Examine the Commission’s Post-2005 Energy Efficiency Policies, Programs, Evaluation, Measurement, and Verification, and Related Issues (Rulemaking 06-04-010). 31 July 2008.
“Decision Approving 2010 to 2012 Energy Efficiency Portfolios and Budgets (Decision 09-09-047).” Application of Southern California Edison Company (U338E) for Approval of its 2009-
Exhibit No. DLS-4 Page 83 of 88
�
84
2011 Energy Efficiency Program Plans and Associated Public Goods Charge (PGC) and Procurement Funding Requests (A.08-07-021). California Public Utilities Commission. 24 Sep. 2009.
“Econometrics.” Wikipedia: The Free Encyclopedia. 1 Jan. 2010. http://en.wikipedia.org/wiki/Econometric
“Energy Codes in the Home Rule West How home rule affects building energy code adoption and implementation in Arizona and Colorado.” Building Codes Assistance Project. March 2009.
“Energy Division Staff Paper: 2012-2020 Energy Efficiency Goal Setting: Technical and Policy Issues.” California Public Utilities Commission. 12 May 2008.
“Energy Efficiency and Colorado Utilities: How Far We’ve Come; How Far We Need to Go.” Colorado Public Utilities Commission. 20 Oct. 2009.
“Energy Efficiency Policy Manual, Version 4.0.” California Public Utilities Commission. March 2008.
“Financing Guidebook for Energy Efficiency Program Sponsors.” ENERGYSTAR, U.S. Environmental Protection Agency. Dec. 2007.
“Interim Decision Determining Policy and Counting Issues for 2009 to 2011 Energy Efficiency Programs (Decision 09-05-037).” Application of Southern California Edison Company (U338E) for Approval of its 2009-2011 Energy Efficiency Program Plans and Associated Public Goods Charge (PGC) and Procurement Funding Requests (A.08-07-021). California Public Utilities Commission. 21 May 2009. “Interim Opinion on Issues Relating to Future Savings Goals and Program Planning for 2009-2011 Energy Efficiency and Beyond (Decision 07-10-032).” Order Instituting Rulemaking to Examine the Commission’s Post-2005 Energy Efficiency Policies, Programs, Evaluation, Measurement, and Verification, and Related Issues. (Rulemaking 06-04-010). California Public Utilities Commission. 18 Oct. 2007.
“Khazzoom–Brookes Postulate.” Wikipedia: The Free Encyclopedia. 26 Dec. 2009. <http://en.wikipedia.org/wiki/Khazzoom-Brookes_Postulate>.
“Market Transformation: A Strategy to Increase Energy Savings.” A Report by the Market Transformation (G7) Team. Undated.
“NEEA Codes and Standards Support Project: MPER # 2.” Prepared for the Northwest Energy Efficiency Alliance by Quantec Energy. 11 April 2008.
“Nevada Power Company 2010 Interim Demand Side Plan.” Nevada Power Company. 14 Aug. 2009
“New York Standard Approach for Estimating Energy Savings from Energy Efficiency Measures in Commercial and Industrial Programs.” Prepared by the New York Evaluation Advisory Contractor Team for the New York Department of Public Service. 1 Sep. 2009.
“New York Standard Approach for Estimating Energy Savings from Energy Efficiency Programs: Single Family Measures.” Prepared by the New York Evaluation Advisory Contractor Team for the New York Department of Public Service. 16 Dec. 2009.
Exhibit No. DLS-4 Page 84 of 88
�
85
“New York Standard Approach for Estimating Energy Savings from Energy Efficiency Measures in Multifamily Programs.” Prepared by the New York Evaluation Advisory Contractor Team for the New York Department of Public Service. 9 July 2009. “New York State Energy Research and Development Authority Transition Plan for Enhancing Program Evaluation.” Proceeding on Motion of the Commission Regarding an Energy Efficiency Portfolio Standard (Case 07-M-0548). Prepared by the New York State Energy Research and Development Authority (NYSERDA) for the New York State Public Service Commission. 22 Aug. 2008.
“Ofgem Report Indicates Urgent Need for Improved Efficiency.” Energy Efficiency News. 12 Oct. 2009. <http://www.energyefficiencynews.com/i/2478/>.
“Order Granting Application in Part (Decision C08-0560).” In the Matter of the Application of Public Service Company of Colorado for Authority to Implement an Enhanced Demand Side Management Program and to Revise its Demand-Side Management Cost Adjustment to Include Current Cost Recovery and Incentives (Docket No. 07A-420E). Colorado Public Utilities Commission. 23 May 2008.
“Overview of DEER NTFR Update Process for 2006- 2007 Programs.” California Public Utilities Commission. 14 Oct. 2008.
“Point Source Pollution.” Wikipedia. 4 Nov. 2009 <http://en.wikipedia.org/wiki/Point source pollution>.
“Rocky Mountain Power - ENERGY STAR New Homes Program for Builders.” Database of State Incentives for Renewables & Efficiency (DSIRE). <http://www.dsireusa.org>.
“Technical Reference User Manual (TRM): Measure Savings Algorithms and Cost Assumptions.” Efficiency Vermont. 30 Dec. 2008.
“Technical Reference User Manual: Measure Savings Algorithms and Cost Assumptions.” Efficiency Vermont. 30 Dec. 2008.
“U.S. Combined Budgets.” 2008 Annual Industry Report. Consortium for Energy Efficiency (CEE). <http://www.cee1.org/ee-pe/2008/us_combo.php>.
“Verification of EVT 2008 Claimed Annual MWh Savings, Coincident Summer and Winter Peak Savings And Total Resource Benefit (TRB): Final Report to the Energy Efficiency Utility Contract Administrator.” Department of Public Service. 12 June 2009.
“Working Group VI – On-Bill Financing (OBF) Interim Report Presentation.” Submitted in Proceeding on Motion of the Commission Regarding an Energy Efficiency Portfolio Standard (Case 07-M-0548). Nov. 2008.
Blumstein, C., S. Goldstone, S. and L. Lutzenhiser. “A Theory-based Approach to Market Transformation.” Proceedings from the 1998 American Council for an Energy-Efficient Economy Summer Study on Energy Efficiency in Buildings, 1998.
Blumstein, Carl. “Program Evaluation and Incentives for Administrators of Energy-Efficiency Programs: Can Evaluation Solve the Principal/Agent Problem?” University of California Energy Institute Center for the Study of Energy Markets (CSEM). March 2009.
Exhibit No. DLS-4 Page 85 of 88
�
86
Buhr, Tami, Wendy Todd, Pamela Wellner, and Robert Wirtshafter. “Education and Training Programs: An Evaluation of the Energy Benefits.” Counting on Energy Programs: It’s Why Evaluation Matters, Portland, Oregon: International Energy Program Evaluation Conference, August 2009.
Building Codes Assistance Project (BCAP) web site. <http://bcap-energy.org/>.
Coito, Fred. “Rebuttal Testimony of Fred Coito.” In the Matter of the Application of Public Service Company of Colorado for Authority to Implement an Enhanced Demand Side Management Program and to Revise its Demand Side Management Cost Adjustment Mechanism to Include Cost Recovery and Incentives (Docket No. 07A-420E). 8 April 2008.
Cook, Gay. “Attribution Methodology Wars: Self-Report Methods Versus Statistical Number Crunching, Which Should Win?” Presented at the ACEEE Summer Study of Energy Efficiency in Buildings, 18 Aug. 2009.
Deggans, Philipp. “Influence and Intention as Determinants of Free Ridership.” Counting on Energy Programs: It’s Why Evaluation Matters, Portland, Oregon: International Energy Program Evaluation Conference, August 2009.
Doyle, Suzanne R. “Direct Testimony of Suzanne R. Doyle,” In the Matter of the Application of Public Service Company of Colorado for Approval of its Electric and Natural Gas Demand-Side Management (DSM) Plan for Calendar Years 2009 and 2010 and to Change its Electric and Gas Cost Adjustment Rates Effective January 1, 2009, and for Related Waivers and Authorizations, (Docket No. 08A-366EG). 20 Nov. 2008.
Drew, Tim. “An Assessment of California’s Energy Efficiency Incentive Mechanism.” Counting on Energy Programs: It’s Why Evaluation Matters, Portland, Oregon: International Energy Program Evaluation Conference, August 2009.
Eto, Joseph, Ralph Prahl and Jeff Schlegel. “A Scoping Study on Energy-Efficiency Market Transformation by California Utility DSM Programs.” Prepared for the California Demand-Side Measurement Advisory Committee. July 1996.
Eto, Joseph. “Guidelines for Assessing the Value and Cost-effectiveness of Regional Market Transformation Initiatives.” Prepared for the Northeast Energy Efficiency Partnerships, Inc. 3 Dec. 1998.
Freeman, Michael. “Using Experiments to Foster Innovation and Improve the Effectiveness of Energy Efficiency Programs.” Prepared for CIEE Behavior and Energy Program. 20 May 2009.
Fuller, Merrian. “Enabling Investments in Energy Efficiency: A study of programs that eliminate first cost barriers for the residential sector.” Efficiency Vermont. Aug. 2008.
Geller, Howard and Steven Nadel. “Market Transformation Strategies to Promote Energy Efficiency.” Annual Review of Energy and the Environment. 1994.
Gillingham, Kenneth, Richard G. Newell and Karen Palmer. “Energy Efficiency Economics and Policy.” Resources for the Future Discussion Paper. April 2009.
Grunwald, Michael. “How Obama is Using the Science of Change.” Time Magazine. 2 April 2009.
Exhibit No. DLS-4 Page 86 of 88

�
87
Hamilton, Lucas. “Stars Align for Energy Efficiency.” CertainTeed Blog. 28 Aug. 2009. <http://blog.certainteed.com/2009/08/stars-align-for-energy-efficiency/>.
Horton, Ruth. “Resource Acquisition and Market Transformation: Leveraging the Positive and Dealing with Conflicts.” The 2006 National Symposium on Market Transformation: The Next 10 Years. March 20, 2006.
Keating, K.M., D.B. Goldstein, D.B., T. Eckman, and P. Miller, P. “Wheat, Chaff and Conflicting Definitions in Market Transformation.” Proceedings from the 1998 American Council for an Energy-Efficient Economy Summer Study on Energy Efficiency in Buildings. 1998.
Keating, Kenneth. “Freeridership Borscht: Don’t Salt the Soup.” Counting on Energy Programs: It’s Why Evaluation Matters, Portland, Oregon: International Energy Program Evaluation Conference, August 2009.
Kushler, Martin, Patti Witte and Dan York. “Can We Get There From Here? Identifying Key Factors in Meeting Aggressive New State Energy Efficiency Savings Goals?” Counting on Energy Programs: It’s Why Evaluation Matters, Portland, Oregon: International Energy Program Evaluation Conference, August 2009.
Lee, Allen and Charlie Stevens. “Energy Efficiency Program Administrators and Building Energy Codes.” National Action Plan for Energy Efficiency Leadership Group. September 2009.
PA Consulting Group. “Focus on Energy Evaluation, Semiannual Report (18-month Contract Period).” State of Wisconsin Public Service Commission of Wisconsin. 19 Oct. 2009.
Peters, Jane and Marjorie McRae. “Free-Ridership Measurement If Out of Sync with Program Logic . . . or, We’ve Got the Structure Built, but What’s Its Foundations?” In the Proceedings of the 2008 ACEEE Summer Study on Energy Efficiency in Buildings, American Council for an Energy Efficiency Economy (ACEEE). 2008.
Prahl, Ralph, Jeff Schlegel and Charles Goldman. “Organizing for Market Transformation: Institutional Issues in the Creation of a New Energy Efficiency Framework in California.” In the Proceedings of the 1998 ACEEE's Summer Study on Energy Efficiency in Buildings. August 1998.
Prindle, William. Energy Efficiency as a Low-Cost Resource for Reducing Carbon Emissions: A Resource of the National Action Plan for Energy Efficiency. Prepared for the National Action Plan for Energy Efficiency Leadership Group. U.S. Environmental Protection Agency. Sep. 2009.
Ridge, Richard, Phillipus Willems, Jennifer Fagan, and Katherine Randazzo. “The Origins of the Misunderstood and Occasionally Maligned Self-Report Approach to Estimating the Net-To-Gross Ratio.” Counting on Energy Programs: It’s Why Evaluation Matters, Portland, Oregon: International Energy Program Evaluation Conference. August 2009.
Ritter, Jr., Governor Bill. “Testimony before the U.S. House Select Committee on Energy Independence and Global Warming.” 20 Sep. 2007.
Exhibit No. DLS-4 Page 87 of 88
�
88
Rosenberg, Mitchell, and Lynn Hoefgen. “Market Effects and Market Transformation: Their Role in Energy Efficiency Program Design and Evaluation.” Prepared for CIEE Market Effects Program. Mar. 2009.
Rosenberg, Mitchell. “Market Transformation Programs: What They Are. How to Evaluate Them.” Prepared for Kansas Corporation Commission. 26 March 2008.
Rufo, Mike. “Evaluation and Performance Incentives: Seeking Paths to (Relatively) Peaceful Coexistence.” Counting on Energy Programs: It’s Why Evaluation Matters, Portland, Oregon: International Energy Program Evaluation Conference, August 2009.
Schiller, Steven R. Model Energy Efficiency Program Impact Evaluation Guide: A Resource of the National Action Plan for Energy Efficiency. Prepared for the National Action Plan for Energy Efficiency Leadership Group. U.S. Environmental Protection Agency. Nov. 2007.
Sullivan, Michael. “Behavioral Assumptions Underlying Energy Efficiency Programs and Policies: Presentation of the Key Findings and Conclusions in the Behavioral Assumptions White Paper.” Prepared for CIEE Behavior and Energy Program. 6 Feb. 2009.
Sullivan, Michael. “Impacts of Behavioral Assumptions on Energy Efficiency Program Design and Development – badly needed program innovations and how to get there.” Presentation to 2009 National Symposium on Market Transformation. March 2009.
The American Recovery and Reinvestment Act. Public Law 111-5, 17 Feb. 2009.
The Energy Policy Act of 2005. Public Law 109-58. 8 Aug. 2005.
The TecMarket Works Team. California Energy Efficiency Evaluation Protocols: Technical, Methodological, and Reporting Requirements for Evaluation Professionals. Prepared for the California Public Utilities Commission. April 2006.
The TecMarket Works Team. The California Evaluation Framework. Prepared for the California Public Utilities Commission. 24 Jan. 2006.
Violette, Dan. “Select Issues in Attribution and Net-to-Gross – Practical Examples for Discussion.” Presented at CALMAC Meetings. 18 July 2007.
Vrabel, Paul, Kathryn Gaffney and Heidi Curry. “A Comparison of Lighting Market Transformation Programs in New York, New England, Wisconsin, California and the Pacific Northwest.” ACEEE 2000 Summer Study on Energy Efficiency in Buildings. Summer 2000.
York, Dan. “A Discussion and Critique of Market transformation: Challenges and Perspectives.” Energy Center of Wisconsin Review. June 1999.
York, Dan. “Making it Work: Administrative models for MT (and EE) Programs.” Presentation to the 2009 National Symposium on Market Transformation. March 2009.
Exhibit No. DLS-4 Page 88 of 88