Study on the drivers of investments in equity by insurers and ...
271
mmmll mmmll Study on the drivers of investments in equity by insurers and pension funds Final Study December 2019
-
Upload
khangminh22 -
Category
Documents
-
view
0 -
download
0
Transcript of Study on the drivers of investments in equity by insurers and ...

mmmll
mmmll
Study on the drivers of
investments in equity by insurers and pension funds
Final Study
December 2019

European Commission - Study on the drivers of investments in equity by insurers and pension funds
December 2019 I 2
DISCLAIMER
The information and views set out in this study are those of the author(s) and do not necessarily reflect the official opinion of the European Commission. The European Commission does not guarantee the accuracy of the data included in this study. Neither the European Commission nor any person acting on the European Commission’s behalf may be held responsible for the use, which may be made of the information contained therein.
A study prepared by Deloitte Belgium and CEPS for the European Commission, Directorate-General for Financial Stability, Financial Services and Capital Markets Union. © European Union, 2019.
Reproduction is authorised provided the source is acknowledged.

European Commission - Study on the drivers of investments in equity by insurers and pension funds
December 2019 I 3
Table of Contents List of tables ................................................................................................... 6
List of figures ................................................................................................. 7
List of acronyms ............................................................................................. 9
Abstract ........................................................................................................ 14
Executive summary ...................................................................................... 15
Purpose ........................................................................................................15
Methodology .................................................................................................15
Limitations ....................................................................................................16
Findings ........................................................................................................16
Résumé......................................................................................................... 22
Objectifs .......................................................................................................22
Méthodologie .................................................................................................22
Limitations ....................................................................................................23
Constatations ................................................................................................24
1 Introduction ............................................................................................ 30
1.1 Study background and objectives ...........................................................30
1.2 Reading guide......................................................................................32
2 Overview of potential drivers of equity investments ............................... 33
2.1 Types of equity investments ..................................................................33
2.2 Potential drivers of investments in equity ................................................36
2.2.1 Market conditions ............................................................................37
2.2.2 Asset and liability management ........................................................42
2.2.3 Prudential framework ......................................................................44
2.2.4 Undertaking characteristics ..............................................................48
2.2.5 Accounting framework .....................................................................51
2.2.6 Tax framework ...............................................................................53
3 Methodology ........................................................................................... 54
3.1 Literature review ..................................................................................54
3.2 Data collection .....................................................................................55
3.3 Equity lists ..........................................................................................57
3.4 Country factsheets ...............................................................................59
3.5 Interviews ...........................................................................................60
3.6 Other stakeholder consultations .............................................................63
3.7 Econometric model ...............................................................................64
3.7.1 Dependent variables ........................................................................64
3.7.2 Base model and driver categories ......................................................65
3.7.3 Econometric model selection and specification ....................................66
3.8 Theoretical model.................................................................................67
3.9 Triangulation .......................................................................................69
3.10 Limitations ..........................................................................................71
4 Drivers of equity investments for insurers .............................................. 73
4.1 State of play ........................................................................................73
4.1.1 Total investments ...........................................................................73
4.1.2 Equity investments ..........................................................................75
4.1.3 Non-unit-linked insurance ................................................................76
European Commission - Study on the drivers of investments in equity by insurers and pension funds
December 2019 I 4
4.1.4 Unit-linked insurance .......................................................................82
4.2 Trends ................................................................................................85
4.2.1 Total investments ...........................................................................85
4.2.2 Equity investments ..........................................................................86
4.2.3 Unit-linked insurance .......................................................................92
4.2.4 Conclusions ....................................................................................95
4.3 Drivers ...............................................................................................97
4.3.1 Market conditions ............................................................................97
4.3.2 Asset and liability management ...................................................... 112
4.3.3 Prudential framework .................................................................... 118
4.3.4 Undertaking characteristics ............................................................ 143
4.3.5 Accounting framework ................................................................... 149
4.3.6 Tax framework ............................................................................. 160
5 Drivers of equity investments for pension funds ................................... 165
5.1 State of play ...................................................................................... 165
5.1.1 Total investments ......................................................................... 166
5.1.2 Equity investments ........................................................................ 168
5.2 Trends .............................................................................................. 173
5.2.1 Total investments ......................................................................... 173
5.2.2 Defined benefit funds .................................................................... 174
5.2.3 Defined contribution funds ............................................................. 175
5.2.4 Conclusions .................................................................................. 176
5.3 Drivers ............................................................................................. 177
5.3.1 Market conditions .......................................................................... 177
5.3.2 Asset and liability management ...................................................... 178
5.3.3 Prudential framework .................................................................... 179
5.3.4 Undertaking characteristics ............................................................ 183
5.3.5 Accounting framework ................................................................... 184
5.3.6 Tax framework ............................................................................. 185
5.3.7 Conclusions .................................................................................. 186
6 Conclusions ........................................................................................... 187
6.1 Insurance sector ................................................................................ 188
6.1.1 Market conditions .......................................................................... 189
6.1.2 Asset Liability Management ............................................................ 190
6.1.3 Prudential framework .................................................................... 191
6.1.4 Undertaking characteristics ............................................................ 192
6.1.5 Accounting framework ................................................................... 193
6.1.6 Tax framework ............................................................................. 194
6.1.7 Ranking of the drivers ................................................................... 195
6.2 Pension fund sector ............................................................................ 196
6.3 Limitations ........................................................................................ 198
References .................................................................................................. 200
Annex 1 Econometric model – insurance companies ................................... 208
Annex 2 Econometric model – pension funds .............................................. 232
Annex 3 Analysis of driver scores provided by interviewees....................... 250
Annex 4 Theoretical model of a life insurance company ............................. 256
Annex 5 Accounting framework .................................................................. 259
Annex 6 Tax framework .............................................................................. 260

European Commission - Study on the drivers of investments in equity by insurers and pension funds
December 2019 I 5
Glossary ..................................................................................................... 261
Insurance ................................................................................................ 261
Pension Funds .......................................................................................... 271

European Commission - Study on the drivers of investments in equity by insurers and pension funds
December 2019 I 6
List of tables Table 1 – List of potential drivers of equity investments derived from the literature
review .............................................................................................................36
Table 2 – Profile of interviewed insurance companies and pension funds ..................61
Table 3 - Solvency II balance sheet (S.02.01) group and individual comparison ..... 150
Table 4 – Data series used in the analyses, data description and sources ............... 209
Table 5 – Regression results, amount invested in listed equity ............................. 211
Table 6 – Regression results, adjusted amount invested in listed equity ................ 214
Table 7 – Regression results, ratio of listed equity to total investments ................. 217
Table 8 – Regression results, amount invested in unlisted equity .......................... 220
Table 9 – Regression results, ratio of unlisted equity to total investments .............. 223
Table 10 – Regression results, amount invested in total equity ............................. 226
Table 11 – Regression results, ratio of total equity to total investments ................. 229
Table 12 - Data series used in the macro panel data analyses, data description and
sources ......................................................................................................... 233
Table 13 – Regression results, amount invested in listed equity ............................ 235
Table 14 – Regression results, adjusted amount invested in listed equity ............... 237
Table 15 – Regression results, ratio of listed equity to total investments................ 239
Table 16 – Regression results, amount invested in unlisted equity ........................ 241
Table 17 – Regression results, ratio of unlisted equity to total investments ............ 243
Table 18 – Regression results, amount invested in total equity ............................. 245
Table 19 – Regression results, ratio of total equity to total investments ................. 247
Table 20 – Regression results, pension fund specific data for funding ratio analysis 249
Table 21 - Applicable GAAP at consolidated and statutory level for all EU member states
.................................................................................................................... 259
Table 22 – Tax treatment of capital gains, losses and dividends across EU Member States
.................................................................................................................... 260
European Commission - Study on the drivers of investments in equity by insurers and pension funds
December 2019 I 7
List of figures Figure 1 – Overview of types of equity investments ..............................................33
Figure 2 – Identification process of the most relevant drivers .................................69 Figure 3 – Total investments of insurance companies across EU Member States as share of GDP at year-end 2017 (incl. unit-linked investments) ........................................74 Figure 4 – Total investments of insurance companies across EU Member States at year-end 2017 (incl. unit-linked investments) ..............................................................74 Figure 5 – Direct and indirect equity exposure at year-end 2017 (incl. unit-linked
investments) ....................................................................................................75 Figure 6 – Total investments of the insurance market per undertaking type (in % of GDP) for all EU Member States at year-end 2017 (excl. unit-linked investments) ......76 Figure 7 – Total investments of life, non-life, and composite (re)insurers in the EU at year-end 2017 (excl. unit-linked investments) .....................................................77 Figure 8 – Direct and indirect equity exposure at year-end 2017 (excl. unit-linked investments) ....................................................................................................78 Figure 9 – Listed equity, unlisted equity, and holdings in related undertakings, incl. participations at year-end 2017 (excl. unit-linked investments) ..............................79 Figure 10 – Equity exposure by location at year-end 2017 (excl. unit-linked investments) ......................................................................................................................80 Figure 11 – Equity exposure for life, non-life and composite insurance undertakings for all EU Member States at year-end 2017(excl. unit-linked investments) ....................81 Figure 12 – Unit-linked investments in the EU at year-end 2017 .............................82 Figure 13 – Importance of unit-linked investments of EU Member States at year-end 2017 ...............................................................................................................83 Figure 14 – Asset allocation unit-linked investments in the EU at year-end 2017 ......83 Figure 15 – Direct and indirect equity exposure (unit-linked investments) ...............84 Figure 16 – Total investments of the EU insurance market (incl. unit-linked investments) ......................................................................................................................85 Figure 17 – Direct equity investments of the EU insurance market (incl. unit-linked investments) ....................................................................................................87 Figure 18 – Listed equity investments of the EU insurance market (incl. unit-linked investments) ....................................................................................................87 Figure 19 – Unlisted equity investments of the EU insurance market (incl. unit-linked investments) ....................................................................................................89 Figure 20 - Non-money market funds investments of the EU insurance market (incl.
unit-linked investments) ....................................................................................91 Figure 21 – Trends of unit-linked investments across the EU for the period 2005-2017 ......................................................................................................................92 Figure 22 – Evolution of EU government bond yield index ......................................98 Figure 23 – ECB assets and asset purchase programs ...........................................99 Figure 24 – Evolution of STOXX50E and drops in markets .................................... 100 Figure 25 – Evolution of VIX............................................................................. 100 Figure 26 – Macaulay duration for life insurance companies across EU Member States .................................................................................................................... 113 Figure 27 – Evolution of the Solvency ratio under Solvency I and Solvency II during 2005-2017..................................................................................................... 120 Figure 28 – Solvency ratio under Solvency I, Solvency II and equity exposure (excl. unit-linked investments) .................................................................................. 121 Figure 29 – Solvency II ratio and total equity exposure (excl. unit-linked investments) at year-end 2017 ............................................................................................ 122 Figure 30 – Composition of Solvency Capital Requirement for standard formula users at year-end 2017 ............................................................................................... 126 Figure 31 – BSCR composition by module for standard formula users at year-end 2017 .................................................................................................................... 127

European Commission - Study on the drivers of investments in equity by insurers and pension funds
December 2019 I 8
Figure 32 – Market risk module for standard formula users at year-end 2017 ......... 128 Figure 33 – Impact of different equity exposures on Solvency II ratio and IRR based on (simplified) theoretical model of a life insurance company ................................... 131 Figure 34 – Impact of different equity exposures on IRR based on (simplified) theoretical model of a life insurance company – using weighted equity index ......................... 132 Figure 35 – Composition of shock on assets sensitive to equity risk (incl. unit-linked investments) for standard formula users at year-end 2017 .................................. 135 Figure 36 – Gross SCR equity risk to net SCR equity risk for standard formula users (incl. all activities) .......................................................................................... 138 Figure 37 – Impact LAC TP and equity exposure (excl. unit-linked investments) ..... 140 Figure 38 – Concentration ratio for life and non-life insurers at year-end 2017 ....... 144 Figure 39 – Impact of FVPL accounting on equity return based upon weighted equity index ............................................................................................................ 155 Figure 40 – Equity exposures by taxation category of capital gains/losses and dividends on equity investments ..................................................................................... 160 Figure 41 – Impact of tax exemption on fair value changes of equity investments .. 162 Figure 42 – Total investments of EU pension fund market at year-end 2017........... 166 Figure 43 – Composition of the pension fund market across EU Member States at year-end 2017 ....................................................................................................... 167 Figure 44 – Investments for defined benefit pension fund countries at year-end 2017 .................................................................................................................... 168 Figure 45 – Concentration of listed equity investments (in % of total listed equity investments) .................................................................................................. 169 Figure 46 – Listed equity investments by size (% of total listed equity investments) .................................................................................................................... 170 Figure 47 – Listed equity investments by sector (% of total listed equity investments) .................................................................................................................... 170 Figure 48 – Listed equity investments by stakes (% of total listed equity investments) .................................................................................................................... 171 Figure 49 – Listed equity investments by region for Dutch pension funds (% of total listed equity investments) ................................................................................ 171 Figure 50 – Listed equity investments by region for British pension funds (% of total listed equity investments) ................................................................................ 172 Figure 51 – Total investments pension funds across EU Member States (incl. defined contribution schemes) ..................................................................................... 173 Figure 52 – Equity exposure pension funds across EU Member States ................... 174 Figure 53 – Graphical illustration of the relation between funding ratio and equity investments for pension funds with strong corporate support ............................... 181 Figure 54 – Graphical illustration of the relation between funding ratio and equity investments for pension funds with weaker corporate support .............................. 182 Figure 55 – Potential drivers of equity investments ............................................. 187 Figure 56 - Average normalised scores per driver for the EU insurers .................... 251 Figure 57 - Average normalised scores by type of EU insurance undertaking .......... 252 Figure 58 - Average normalised scores by EU standard formula and (partial) internal model users ................................................................................................... 253 Figure 59 - Average normalised scores by EU and Non-EU insurers ....................... 254 Figure 60 - Average normalised scores by EU insurers and EU pension funds ......... 255 Figure 61 – Weighted equity index .................................................................... 258

European Commission - Study on the drivers of investments in equity by insurers and pension funds
December 2019 I 9
List of acronyms ABP Algemeen Burgerlijk Pensioenfonds
ABS Asset Backed Securities
ABSPP Asset Backed Securities Purchase Programme
AEX Amsterdam Exchange Index
AFS Available for Sale
AIF Alternative Investment Fund
ALM Asset Liability Management
Avg Average
BIS Bank for International Settlements
bpfBOUW Stichting Bedrijfstakpensieoenfonds voor Bouwnijverheid
BSCR Basic Solvency Capital Requirement
CAC 40 Cotation Assistée en Continu 40
CBPP Covered Bond Purchase programme
CDO Collateralised Debt Obligations
CDOp Credit Default Options
CDS Credit Default Swaps
CEIOPS Committee of European Insurance and Occupational Pensions Supervisors.
CEPS Centre for European Policy Studies
CHF Swiss Franc (Confoederatio Helvetica Franc)
CIU Collective Investment Undertakings
CLO Collateralised Loan Obligations
CMBS Commercial Mortgage Backed Securities
CMO Collateralised Mortgage Obligations
CMS Constant Maturity Swaps
CMU Capital Markets Union
CoC Cost of Capital
CPI Consumer Price Index
CR Concentration Ratio
CSM Contractual Service Margin
CSPP Corporate Sector Purchase Programme
DC Defined Contribution
DID Difference in differences
DNB De Nederlandsche Bank
EAR Earnings at Risk
EC European Commission

European Commission - Study on the drivers of investments in equity by insurers and pension funds
December 2019 I 10
ECB European Central Bank
EEA European Economic Area
EFRAG European Financial Reporting Advisory Group
EIOPA European Insurance and Occupational Pension Authority
ESA European System of National and Regional Accounts
ESG Environmental, social and governance
ESMA European Securities Market Authority
EU European Union
EUR Euro
EURIBOR Euro Interbank Offered Rate
EUROSTAT European Statistical Office
FE Fixed Effects
FED Federal Reserve System
FESE Federation of European Securities Exchanges
FFA Fédération Française de l’Assurance
FRED Federal Reserve Economic Data
FRS Financial Reporting Standard
FTSE Financial Time Stock Exchange
FVOCI Fair Value through Other Comprehensive Income
FVPL Fair Value through Profit or Loss
GAAP General Accepted Accounting Principles
GDAX Germany Deutscher Aktien Index
GDP Gross Domestic Product
GDV Gesamtverband der Deutschen Versicherungswirtschaft
GMM Generalised Method of Moments
HICP Harmonised Index of Consumer Price
HY Hybrid Schemes
IAS International Accounting Standards
IASB International Accounting Standards Board
IBEX 35 Indice Bursatil Espanol, Spanish Exchange Index
ICA Insurance Contracts Act
ICAS Individual Capital Adequacy Standards
ICB Insurance Corporations Assets and Liablities
ICPF Insurance Companies and Pension Funds
IFRS International Financial Reporting Standards
IMF International Monetary Fund
IORP Institutions for Occupational Retirement Provision

European Commission - Study on the drivers of investments in equity by insurers and pension funds
December 2019 I 11
IRR Internal Rate of Return
IRM Institute of Risk Management
ISM Institute for Supply Management Index
JPY Japanese Yen
LAC DT Loss Absorbing Capacity of Deferred tax
LAC TP Loss Absorbing Capacity of Technical Provision
LTG Long-term guarantees
LTROs Long-term refinancing operations
M&A Mergers and Acquisitions
Max Maximum
MBS Mortgage Backed securities
MCEV Market Consistent Embedded Value
MCR Minimum Capital Requirement
MIFID Markets in Financial Instruments Directive
Min Minimum
MSCI Morgan Stanley Capital International
MTM Marked to Market
NACE Nomenclature statistique des Activités économiques dans la Communauté Européenne
NAV Net Asset Value
NFA National Financial Accounts
NSAs National Supervisory Authorities
OECD Organisation for Economic cooperation and development
OEE Overall Equipment Effectiveness
OLS Ordinary Least Squares
OMX Aktiebolaget Optionsmäklarna
P&C Property and casualty
P&L Profit and Loss
PEPP Pan-European Personal Pension program
PMI Purchase Manager Index
PSPP Public Sector Purchase Programme
QE Quantitative Easing
QIS Quantitative Impact Study of Solvency II
QSA Quarterly Sectoral Accounts
RE Random Effects
RFR Risk-free rate
ROA Return on Assets

European Commission - Study on the drivers of investments in equity by insurers and pension funds
December 2019 I 12
ROE Return on Equity
S&P Standards and Poors
SAA Strategic Asset Allocation
SCR Solvency Capital Requirement
SDW Statistical Data Warehouse
SFCRs Solvency and Financial Conditions Reports
SMEs Small and Medium Enterprise
SMI Swiss Market Index
SMP Securities Markets Programme
SPW Stichting Pensioenfonds voor de Woningcorporaties
SST Swiss Solvency Test
StD Standard Deviation
TLTROs Targeted longer- term refinancing operations
UCITS Undertakings for Collective Investments in Transferable Securities
USD US Dollar
VaR Value at Risk
VAR Vector Autoregression
VIX Chicago Board Options Exchange Volatility Index
ISO 3166 Codes for countries
AT Austria
BE Belgium
BG Bulgaria
CY Cyprus
CZ Czech Republic
DE Germany
DK Denmark
EE Estonia
ES Spain
FI Finland
FR France
GB United Kingdom
GR Greece
HR Croatia
HU Hungary
IE Ireland
IT Italy

European Commission - Study on the drivers of investments in equity by insurers and pension funds
December 2019 I 13
LT Lithuania
LU Luxembourg
LV Latvia
MT Malta
NL Netherlands
PL Poland
PT Portugal
RO Romania
SE Sweden
SI Slovenia
SK Slovakia
CH Switzerland
JP Japan
US United States

European Commission - Study on the drivers of investments in equity by insurers and pension funds
December 2019 I 14
Abstract
European insurance companies and pension funds (ICPFs) are significant institutional investors within the EU and globally, whose investment decisions affect their own performance, as well as rest of the economy. This study focuses on the potential drivers of equity investments by ICPFs from the EU Member States over the last two decades. The analyses in this study use a combination of different research methods, such as a literature review to identify a preliminary list of drivers of equity investments. The results of the literature review are then tested through econometric analyses, interviews with ICPFs, and a theoretical model. Finally, a triangulation method is applied, (1) to adequately account for several events from the last two decades that potentially impacted the investments in equity in the EU, and (2) because a dataset for equity investments, that would disentangle these drivers, is not readily available. Market conditions along with the prudential and accounting framework are identified as the major driving forces for investments in equity. The analysis also shows that insurance
product characteristics play a central role, especially when the market risk related to equity investments is shared between insurers and customers, who are both looking for an optimal risk/return.

European Commission - Study on the drivers of investments in equity by insurers and pension funds
December 2019 I 15
Disclaimer
The information and views set out in this study are those of the author(s) and do not necessarily reflect the official opinion of the European Commission. The European Commission does not guarantee the accuracy of the data included in this study. Neither the European Commission nor any person acting on the European Commission’s behalf may be held responsible for the use which may be made of the information contained therein.
Executive summary
Purpose
As a follow-up on the Mid-term Review of the CMU Action Plan, the European Commission has committed to assess the drivers of equity investments by insurance companies and pension funds (ICPFs).
This study aims to inform and support the European Commission’s policy initiatives to promote higher equity investments by insurance companies across the EU by (1) identifying the trends in equity investments by ICPFs and (2) analysing and discussing the drivers determining these equity investments. Based on this assessment it will draw conclusions about the most relevant factors, which encourage or discourage investments in equity by EU insurance companies and defined benefit pension funds, including an indication of the degree of relevance of the identified drivers.
Methodology
As a starting point for the study, a thorough literature review is conducted in order to
gain an understanding of the potential drivers of equity investments made by insurers and pension funds. The review covers academic papers, policy studies and technical reports by international organisations and supervisory authorities.
Data on equity investments for ICPFs is obtained from the European Insurance and Occupational Pension Authority (EIOPA), the European Central Bank (ECB), National Supervisory Authorities (NSAs), insurance companies’ Solvency and Financial Conditions Reports (SFCRs), and annual financial reports. These sources contribute to obtaining a comprehensive view on the trends of equity investments at EU and Member State level. When relevant, additional data was requested from regulators and supervisors to get a more complete picture of the EU insurance and occupational pension funds markets. Some of the data received through this channel is not publicly available.
Specific country factsheets are produced to enable comparative analysis of the insurance and pension fund markets. For the insurance market, factsheets are made for the 28 EU Member States and 3 third-countries (Japan, Switzerland and the United States). For the pension fund market, country factsheets are produced for five EU Member States, namely Belgium, Germany, Ireland, the Netherlands and the United Kingdom. These factsheets contain a deep-dive on the balance sheet, investments, products, accounting framework, and tax framework of the countries.
The information from the factsheets, including the historical data gathered, is used to support a market-wide trend analysis of the equity investments, to show how the investments of the ICPFs evolved over time and when important changes occurred. Potential drivers of equity investments are then analysed in a panel data regression

European Commission - Study on the drivers of investments in equity by insurers and pension funds
December 2019 I 16
framework. These regressions use the different equity types as dependent variables, in order to be able to analyse the relationship between potential drivers and changes in equity investments based on the equity type. Finally, where possible, the drivers’ analyses are illustrated by a simplified theoretical model of a life insurance company.
To complete the assessment of the drivers, interviews were conducted with a targeted sample of insurance companies and pension funds, consisting of 32 insurance companies and 5 pension funds, across 17 countries including the following third-countries: Japan, Switzerland and the US. The objective of the interviews is to rank the list of drivers of equity investments identified through the literature review, but also to reveal other possible drivers, which are potentially not captured by the market-wide data analysis and literature study. Finally, the interviews intend to obtain more granular information on the equity investments and other investments by the ICPFs. Specific additional stakeholders consultations were also conducted with national and supranational authorities, as well as actuarial and industry bodies, to confirm or further nuance the trends and drivers observed and their importance.
Limitations
The various analyses performed as part of this study were confronted with a number of
challenges. The most important one was the limited availability of historical data with the required level of granularity that would allow to gain full insight into the trends and drivers of equity investments by ICPFs. Data from before the advent of Solvency II does not have the same level of disclosure, reporting frequency and granularity. For the regressions in this study the data used runs until 2018 Q1, which means only 2 years of data with the Solvency II level of granularity was used. The insights into the trends and drivers may therefore only be tested for their full impact in the coming years, using the more recently available granular data of insurance markets and the recent initiatives by EIOPA to enhance data on investments of the EU pension fund sector.
In addition, we must point out that the quantitative part of the interviews was ultimately of limited use to the analysis, as only a very limited number of insurance companies and pension funds were able to provide information on equity investments that was sufficiently granular and had a time-series of a sufficient duration.
Furthermore, market development and policy changes, during the period under
consideration, are embedded in the analysis of other drivers, and we were not able to fully distinguish the specific effect of the former (market developments and policy changes) from the ones of the latter (other factors). In addition, in the last two decades, there have been two financial crises, a major change in accounting standards and a prudential framework change for insurers. These overlapping market developments and policy changes have long-term potential effects and might affect each other.
By triangulating the inputs and conclusions from all different available sources
(literature, data, interviews) and by applying appropriate statistical methods, the study methodology aims to mitigate these limitations to the furthest extent possible.
Findings
ICPFs play an important role as institutional investors in Europe, and more specifically as investors in equity. In terms of size, the sector collectively accounts for 12,8% of the overall euro area financial sector. At the end of 2017, the total investments reported by more than 2.000 individual insurance undertakings which apply Solvency II in the EU

European Commission - Study on the drivers of investments in equity by insurers and pension funds
December 2019 I 17
stood at 10.305 billion EUR (incl. unit-linked investments), while the total investments of the EU pension market stood at 3.409 billion EUR.
Over the last two decades, two financial crises, namely the dot-com crisis and the global
financial crisis, affected the markets. Coinciding with this, insurers’ investments in (direct) listed equity have dropped significantly over the last 20 years, from 11,5% of total investments (excl. UK) in 1999 to 3,3% after the financial crisis. Since 2011, listed equity investments have remained stable at around 3%, but never fully recovered to their pre-crisis levels. In contrast, EU insurers’ investments in unlisted equity remained relatively stable between 1999 and 2018 at around 7% of total investments.
We note that participations – defined as the ownership, direct or by way of control, of
20% or more of the voting rights or capital of an undertaking – currently have an important contribution to the balance sheet for most of the European Member States, coinciding with the importance of insurance groups in Europe. Based on EIOPA data at year-end 2017, ‘Holdings in related undertakings, incl. participations’ amount to 800 billion EUR, or 10,5% of total non-unit-linked investments in the EU. Nevertheless, limited granular data exists on the evolution of participations over the last 20 years.
The decreasing trend in (listed) equity investments has occurred in parallel with an
increasing trend towards indirect equity investments through funds. The trend analyses show an increase in non-money market funds from 14% in 1999 to 26% in 2018, especially after the financial crisis of 2008. Based on year-end 2017 data, approximately one third of the investments through funds relate to equity funds. The lack of historical data does not allow to discuss the evolution of these funds. Hence, one could say that in broad terms, when funds are also taken into account, a 2018 theoretical ‘average’ insurer might invest in total – through both direct and indirect investments – up to 10 to 20% in equity.
Unit-linked investments in the EU have remained stable at around 27% of total investments over the last two decades and equity investments related to unit-linked contracts are higher than those of traditional insurance products. Life insurance undertakings recently seem to be shifting more risk towards policyholders by increasing their unit-linked business. The current low interest rate environment and the corresponding decrease in guaranteed interest rates offered in (life) insurance contracts, may be causing policyholders to search for higher yield, through unit-linked products.
Finally, and specific to the pension fund sector, the EU share of equity in total investments was considerably higher (at 50%) before the global financial crisis than it is today. In recent years, the EU share of equity in total investments is stable at around 30%. The decreasing trend can be attributed to general derisking after the financial
crisis (away from equity), and a decreasing trend in the UK, where they increasingly allocate investments towards debt securities instead.
Listed equity of large defined benefit pension funds in the Netherlands and UK was mainly invested in large-caps. Nearly a quarter was invested in companies active in financial and insurance services, and the geographical destination can differ substantially between pension funds. In addition, analyses indicate an increasing popularity towards offering defined contribution (DC) occupational pension plans.
The drivers of insurers’ equity investments interact with one another in such a way that it may be difficult to disentangle them. Trends in equity investments cannot be attributed to a single factor, but rather to a combination of several driver categories. As

European Commission - Study on the drivers of investments in equity by insurers and pension funds
December 2019 I 18
a result of the triangulation exercise for insurers – i.e. combining the quantitative analyses results, the literature review, the interviews, as well as the insights from our theoretical model – we come to the following conclusions.
The regression results, the literature review, and the interviews concur that equity market returns and favourable market conditions in general, are of utmost importance to insurers in conducting their investment decisions. An attractive risk-return profile is an important incentive to invest in equity, given that equity is still considered to deliver a higher return over the long run, while taking into account the potential risks and volatility related to this kind of investment. Interviewees find the asset class also attractive from a diversification and a hedging perspective to protect against inflation rate risk. Overall, insurers search for the optimal investment portfolio to maximise their returns, given the different constraints defined by their risk appetite.
Whereas economic fundamentals and low interest rate levels are positively
associated with equity investments, market events negatively impact these, as part of derisking behaviour. According to the interviews and the literature review, average dividend yield and market volatility also play a respectively positive and negative role in the equity investments behaviour of insurers, however, we were not able to run a regression analysis on the average dividend yield due to a lack of historical data.
Finally, the absence of a national bond market with sufficiently long maturities may be a trigger to invest in equity. In Sweden, the bond market traditionally does not issue bonds with maturities over 10 years, leading to a duration mismatch, which can lead to equity investments. Insurers in Sweden have a significantly higher (direct) equity exposure than the EU average. However, the absence of supporting evidence and the lack of sufficient data to test this with regressions, may bias the conclusion.
Asset Liability Management (ALM) influences the insurers’ equity investments behaviour, since, when implemented effectively in line with the liability profile, it helps mitigate a number of (market) risks. However, due to a lack of publicly available historical data on the related factors, no regressions could be performed for ALM.
Literature and interviews suggest that cash flows related to equity investments can play
a role in managing a duration mismatch. Life insurers seem only willing to allow for a small duration gap, whereas non-life insurers, based on their generally short-term contracts, are less concerned with the duration gap. They also indicate that the longer the duration of their liabilities, the higher their proportion of equities. However, we also find that a number of countries, despite a long liability duration, are not investing in equity as much as could be expected based on the duration of the liabilities. The outflow profile is an essential component of ALM, as it is most of the time the point of
departure for the ALM framework and literature suggests that uncertainty about financial market conditions may incentivise long-term investors to hold liquid assets. Literature also suggests that in terms of financial consequences, lapse risk is one of the biggest risks to consider for life insurers. However, in the current low interest rate environment policyholders might not see alternative attractive investments, which together with contractual lapse penalties, makes policyholders less likely to lapse.
Finally, owing to its purpose, ALM interplays strongly with market conditions and the prudential framework, insofar that the cost of capital for insurers will drive their strategic asset allocation, searching for an optimal return within their risk tolerance.

European Commission - Study on the drivers of investments in equity by insurers and pension funds
December 2019 I 19
The prudential framework affects the asset allocation, within the limits of the insurer’s risk appetite. When testing with Solvency I and Solvency II data combined, the regressions suggest that the size of a regulatory capital requirement (i.e. minimum solvency margin or Solvency Capital Requirements (SCR)) has an influence on insurers’ equity investments behaviour, including before the introduction of the Solvency II risk sensitive framework. The analyses show that a strong solvency ratio is correlated with more equity investments, mainly in listed equity, over a period from 1999 to 2017, and is even more pronounced whenever the LTG measures are applied. However, with two years of Solvency II data (period 2016 Q3 – 2018 Q1) as part of the series used, it is difficult to conclude on the specific impact of introducing the Solvency II framework.
During the interviews it was suggested that the move towards market valuation brought forward the effects of short-term market fluctuations in the balance sheet of insurers. The Solvency II framework, per the interviewees, does not reflect the longer investment horizon of their insurance activities and is therefore not conducive to more
equity investments. However, according to interviews and literature, the transitional measures embedded within the Solvency II framework, alleviate this to some extent.
The duration-based approach, where the holding period of the equity investments is introduced in the calibration, does not currently seem to provide a solution as insurers often do not meet the conditions to qualify for its application. The adopted new rules in 2019 on long-term equity with a 22% shock aim to provide a better answer for insurers with a long-term investment horizon.
The interviews suggest that depending on a company’s risk appetite and Solvency ratio, Solvency II will as of a certain level put constraints on increasing equity investments if these would result in breaching the company’s risk appetite. As shown by EIOPA’s data at year-end 2017 and our theoretical model, diversification benefits
significantly decrease the capital charges for equity. Besides this, the diversification within and across various asset classes, equity in particular, is also considered a good risk management practice.
Recent research on the Solvency II framework demonstrates that good interest rate risk management, hedging the interest rate risk and focusing on maximising the ratio of expected excess return to marginal risk, can deliver an optimal asset allocation, which
involves a significant increase in the equity exposure. Our theoretical model also shows a positive relationship between higher equity investments and an increase of the internal rate of return on own funds (given the higher expected returns from equities). However, this observation is highly dependent on the observation period.
Capital charges on equity investments are significantly reduced for specific insurance
products, specifically products for which the policyholder is willing to accept equity risk in exchange for a higher possible return, such as unit-linked products. This allows the insurer to partly transfer the equity risk to the policyholder, and grow their insurance portfolios, while continuing to invest in equity within their risk appetite limits.
In terms of undertaking characteristics, the impact of an undertaking’s size is unclear. Where interviews and some articles suggest it plays a minor role, several other
articles see it as positively related to the holding of common equity. Besides the undertaking’s size, the regressions suggest that the concentration in the market and the business share in terms of types of activities, i.e. life or non-life, significantly influence the amount of equity investments. Finally, while traditional policies continue to dominate and demand for guaranteed products remains strong, insurers have been

European Commission - Study on the drivers of investments in equity by insurers and pension funds
December 2019 I 20
reducing the volume of products with financial guarantees. The interviews and literature argue that the low interest rate environment is causing life insurers to depart from interest-bearing assets, towards more risky assets, in search of yield. The share of equity in unit-linked products is also generally higher than that of guaranteed products.
Within the EU, IFRS is the main accounting framework for insurers due to the importance of listed insurance groups, often having cross-border activities through their subsidiaries. Indeed, the application of internationally adopted accounting standards favours comparability across jurisdictions. The introduction in 2005 of IFRS, which generalises market valuation, also coincided with a downward trend on the amounts invested by insurers in (listed) equity. This decrease in direct equity investments may have been partially compensated by a switch towards indirect equity investments. The analyses for unlisted equity did not lead to conclusive results, possibly due to different types of equity included, such as unlisted participations and private equity.
Profit and loss volatility can arise when impairment triggers are reached and therefore the entire unrealised loss initially recognised in own funds is recycled into profit and loss. In addition, once an equity investment is impaired, a further decrease in fair value results in recording the additional loss into profit and loss. For some insurers, this still provides room for mitigating actions to manage the volatility. Other insurers are more concerned about the possible impact of short-term volatility on their profit and loss under IAS 39, and apply a confidence level dependent on the insurer’s risk appetite.
Alternatively, under IFRS 9 an insurer may irrevocably elect to present changes of the fair value in other comprehensive income on an instrument-by-instrument basis, directly recording unrealised and realised gains and losses in shareholders’ equity. The contribution of equity investments to the profit and loss account will then be limited to dividends received and insurers may then favour equities with a higher dividend pay-out.
In addition, the future application of IFRS 17 for insurance contracts will result in a broader application of current value measurement. Insurance contracts with direct participation features may gain in importance, as IFRS 17 is expected to mitigate to a large extent the potential volatility arising from the fair value measurement of financial assets; important for insurers aiming to limit unexpected profit and loss volatility coming from equity investments with fair value changes recorded through profit and loss. As
insurers are preparing for IFRS 9 and IFRS 17 in the upcoming years, the application of both standards need close monitoring to ensure that they do not introduce even more volatility to the financial accounts and therefore negatively impact equity investments.
The tax framework remains a national competency (contrary to the IFRS accounting framework) and consequently, is very difficult to test with regard to the role it plays in the equity consideration of insurers. The regressions applied to the tax on capital to GDP ratio suggest that insurers take into account the tax on capital in the equity investments decisions. However, due to the lack of data on the tax treatment of realised gains and losses on the sale of equity investments, or the tax treatment of dividends, we cannot conclude further. Interviewees emphasise that the tax framework does not have a meaningful role in their strategic asset allocation but will affect their tactical one.
As for the driver categories for the defined benefit pension funds, the conclusions that can be drawn from the analysis are comparable to what was found for insurance companies. Most pension funds note that the decision on the allocation to equity is primarily based on the ALM study, where the market conditions play an important role, next to the characteristics of the liability portfolio.

European Commission - Study on the drivers of investments in equity by insurers and pension funds
December 2019 I 21
In the context of pension funds, the financial strength of the corporate supporting the pension fund is considered of high importance. Pension funds have to invest the contributions they receive from sponsors and participants to be able to fulfil the financial promises of their sponsor. Market conditions are in that regard, crucial to achieve these objectives. Literature highlights the fact that pension funds take on more investment risk, and hence investments in equity, than European insurers over the period in scope.
The prudential framework currently depends on the various Member States’ local rules
and requirements, and hence does not have the same impact on the pension funds across the EU. The accounting framework and the taxation framework are also of less relevance (and also national in nature).

European Commission - Study on the drivers of investments in equity by insurers and pension funds
December 2019 I 22
Avertissement Les informations et points de vue exposés dans cette étude sont ceux de l'auteur et ne reflètent pas nécessairement l'opinion officielle de la Commission européenne. La Commission européenne ne garantit pas l'exactitude des données incluses dans cette étude. Ni la Commission européenne ni aucune personne agissant au nom de la Commission européenne ne saurait être tenue pour responsable de l'utilisation qui pourrait être faite des informations qui y figurent.
Résumé
Objectifs
Suite à l’examen de mi-parcours du plan d'action pour l'union des marchés des capitaux, la Commission européenne s’est engagée à évaluer les facteurs qui poussent les
compagnies d’assurance et des fonds de pensions à investir en actions.
Cette étude a pour objectif d’informer et soutenir les initiatives de l’Union Européenne (UE) promouvant des investissements accrus en actions par les compagnies d’assurance opérant dans l’UE en (1) identifiant les tendances des investissements en actions des compagnies d’assurance et des fonds de pension (CAFP) et (2) analysant et discutant des facteurs desdits investissements. Sur la base de cette étude, la Commission tirera
ses conclusions sur les facteurs les plus pertinents qui favorisent ou constituent un frein aux investissements en actions par les compagnies d’assurance et les fonds de pension à prestations définies de l’UE. Ces conclusions comprendront également une indication du degré de pertinence des facteurs identifiés.
Méthodologie
La présente étude a comme point de départ une revue approfondie de la littérature existante afin d’acquérir une meilleure compréhension des facteurs potentiels incitant les compagnies d’assurance et les fonds de pension à investir en actions. La revue comprend des articles académiques, des analyses ainsi que des rapports techniques d’organisations internationales et d’autorités de contrôle.
Nous avons obtenu les données relatives aux investissements en actions des CAFP par l’intermédiaire de l'Autorité Européenne des Assurances et des Pensions Professionnelles (EIOPA), de la Banque Centrale Européenne (BCE), des autorités de contrôle des Etats Membres (NSA), des rapports sur la solvabilité et la situation financière des compagnies d’assurance et des rapports financiers annuels. Ces sources contribuent à l’obtention d’une vision exhaustive des tendances desdits investissements au niveau des Etats Membres de l’Union Européenne. Lorsque cela s’est avéré pertinent, des données additionnelles ont été demandées auprès des régulateurs et des superviseurs afin d’obtenir une image plus complète des marchés de l’assurance et des
fonds de pension de l'UE. Certaines de ces données ne sont pas publiquement disponibles.
Des fiches d’information spécifiques par pays ont été produites afin de permettre une analyse comparative des marchés d’assurance et des fonds de pension. Les fiches relatives au marché de l’assurance ont été établies pour chacun des 28 Etats Membres de l’Union Européenne, ainsi que pour trois pays tiers, à savoir le Japon, la Suisse et les
Etats-Unis. Quant aux fonds de pensions, des fiches sont produites pour 5 Etats Membres à savoir la Belgique, l’Allemagne, l’Irlande, les Pays-Bas, et le Royaume Uni. Ces fiches comprennent des informations approfondies sur le bilan, les investissements, les revenus et les environnements comptables et fiscaux applicables par pays.

European Commission - Study on the drivers of investments in equity by insurers and pension funds
December 2019 I 23
Les informations reprises dans ces fiches d’information, y compris les données historiques collectées, sont utilisées pour compléter notre analyse de la tendance de marché relative aux investissements en actions et de mettre en évidence l’évolution des investissements des CAFP au cours du temps et leurs changements notables. Les facteurs potentiels d’investissement en actions sont ensuite analysés dans le cadre de régressions sur des données de panel. Nous avons spécifié différents types d’actions comme variables dépendantes afin de différencier les degrés d’association entre celles-ci et les facteurs potentiels. Lorsque cela s’est avéré possible, nous avons illustré nos analyses de facteurs par un modèle théorique simplifié de choix d’investissement d’une compagnie d’assurance vie.
Pour compléter l’évaluation des facteurs, nous avons mené des entretiens auprès d’un échantillon de CAFP constitué de 32 compagnies d’assurance et 5 fonds de pension à travers 17 pays, y compris trois pays tiers (le Japon, la Suisse et les Etats-Unis d’Amérique). L’objectif de cette phase d’entretiens était d’une part de classer les facteurs potentiels identifiés au préalable lors de la revue de la littérature et d’autre part
de mettre en évidence d’autres facteurs qui n’auraient pas été identifiés lors de l’analyse des données de marché et de la littérature. Enfin, les entretiens avaient pour objectif l’obtention d’informations plus granulaires sur les investissements en actions et autres investissements des CAFP. Nous avons effectué des consultations supplémentaires auprès des autorités nationales et supranationales, des associations d’actuaires, ainsi que des fédérations professionnelles d'assurance et fonds de pension pour confirmer ou nuancer les tendances et facteurs observés et leurs importances.
Limitations
Au cours des analyses effectuées durant cette étude, nous avons rencontré plusieurs difficultés. Le principal problème fut la disponibilité limitée de données historiques avec un niveau granularité suffisant permettant de mieux comprendre les tendances et facteurs d’investissements en actions par les CAFP. Les données collectées
avant l’entrée en application du régime prudentiel Solvabilité II diffèrent par leur contenu, leur fréquence de publication et leur granularité. Pour les analyses de régression de cette étude, les données utilisées vont jusqu'au premier trimestre 2018, ce qui signifie que seules deux années de données présentant le niveau de granularité de Solvabilité II ont été utilisées. Les informations sur les tendances et facteurs ne pourront donc être pleinement testées que dans les années à venir, en utilisant les
données granulaires plus récentes sur les marchés de l'assurance et les initiatives récentes de l'EIOPA visant à améliorer les données sur les investissements dans le secteur des fonds de pension de l'UE.
En outre, il convient de souligner que la partie quantitative des entretiens n’a finalement servi à l’analyse que de manière limitée, étant donné que le nombre de sociétés d’assurance et de fonds de pension qui ont été en mesure de fournir des informations suffisamment détaillées et d'une durée suffisante sur les investissements en actions est
très limité.
Par ailleurs, l'évolution des marchés et les changements politiques au cours de la période considérée interviennent dans l’analyse des autres facteurs, sans que nous ayons pu distinguer l’effet propre des uns (évolution du marché et changements de politiques) et des autres (autres facteurs). En outre, au cours des deux dernières décennies, il y a eu deux crises financières, un changement majeur dans les normes
comptables et un changement de cadre prudentiel pour les assureurs. L’évolution de ces marchés et de ces changements politiques qui se superposent ont des effets potentiels à long terme et pourraient affecter leurs impacts respectifs.

European Commission - Study on the drivers of investments in equity by insurers and pension funds
December 2019 I 24
Le choix méthodologique de recouper les informations et conclusions provenant de différentes sources (bibliographie, sources de données, entretiens) et de faire usage de modèles statistiques appropriés a été opéré afin d’atténuer le plus possible ces limitations.
Constatations
Les CAFP jouent un rôle prépondérant en tant qu’investisseurs institutionnels en Europe, et en particulier en tant qu’investisseurs en actions. Le secteur représente collectivement 12,8% des investissements du secteur financier de la zone euro. A fin 2017, le montant d’investissements effectués par plus de 2000 compagnies d’assurance qui appliquent la réglementation Solvabilité II est de 10 305 milliards d’euros (incluant les investissements en unités de compte) et 3 409 milliards d’euros par les fonds de pension.
Les deux dernières décennies sont caractérisées par deux crises financières, i.e.
l’éclatement de la bulle internet et la crise financière mondiale, ayant affecté les marchés. Parallèlement à cela, au cours de ces 20 dernières années, les investissements des assureurs en actions cotées (directs) ont significativement chuté, de 11,5% en 1999 à 3,3% après les crises financières. Depuis 2011, les allocations en actions cotées sont demeurées relativement stables autour de 3%, mais n’ont jamais recouvré leurs niveaux d’avant crises. Contrastant avec la tendance décroissante des actions cotées, les investissements des assureurs de l’UE en actions non cotés ont été relativement
stables entre 1999 et 2018 autour de 7% des investissements totaux.
Nous notons que les participations - définies comme étant la détention, directe ou par voie de contrôle, d’au moins 20% des droits de vote ou du capital d'une entreprise - ont actuellement une contribution importante au bilan dans la plupart des États Membres européens, ce qui est cohérent avec l’importance des groupes d’assurance en Europe. Sur la base des données de l’EIOPA à fin 2017, les détentions dans des entreprises liées, y inclus participations » s’élève à 800 milliards d’euros, soit 10,5% du total des investissements non liés à des contrats en unités de compte dans l’UE. Néanmoins, il existe peu de données granulaires sur l’évolution des participations au cours des 20 dernières années.
La tendance décroissante des investissements en actions (cotées en bourse) s’est produite parallèlement à une tendance à la hausse en faveur des investissements indirects en actions par le biais de fonds d’investissement. Les analyses de tendance montrent une augmentation des fonds non monétaires, de 14% en 1999 à 26% en 2018, en particulier après la crise financière de 2008. Sur la base des données de fin d'année 2017, environ un tiers des investissements dans des fonds est lié à des placements en actions. L’absence de données historiques ne permet pas de commenter l’évolution de ces fonds d’investissements. Par conséquent, on pourrait dire que d’une manière générale, lorsque les fonds d’investissement sont également pris en compte,
un assureur « moyen » théorique en 2018 pourrait investir - par le biais d’investissements directs et indirects - jusqu’à 10 à 20% en actions.
Les investissements relatifs aux contrats en unités de compte dans l’UE sont restés stables lors des deux dernières décennies aux alentours de 27% du total des investissements. Quant aux investissements en actions relatifs à des contrats en unités de compte, ceux-ci sont supérieurs à ceux des produits d’assurances traditionnels. Les entreprises d'assurance-vie semblent récemment transférer plus de risque auprès des assurés en augmentant leurs activités en unités de compte. L’environnement actuel de taux d’intérêt bas et la diminution des taux d’intérêt garantis offerts par les contrats d’assurance (vie) qui en découle peuvent inciter les preneurs d’assurance à rechercher un rendement supérieur, à travers des contrats en unités de compte.

European Commission - Study on the drivers of investments in equity by insurers and pension funds
December 2019 I 25
Enfin, particulièrement dans le secteur des fonds de pension, la part des actions dans les investissements totaux au niveau européen était considérablement plus élevée avant la crise (à hauteur de 50%) qu’actuellement. Ces dernières années, la part des actions au niveau européen dans les investissements totaux est restée stable, aux alentours de 30%. La tendance à la baisse peut être attribuée à la volonté des fonds de pension de réduire de façon générale leur exposition aux risques financiers depuis la crise financière (sortie des investissements en actions) et à une tendance à la baisse au Royaume-Uni, où ils investissent de plus en plus dans des titres de créance.
Les investissements en actions (cotées) de grands fonds de pension à prestations définies aux Pays-Bas et au Royaume-Uni étaient principalement dans de grandes sociétés (large-caps). Près du quart a été investi dans des sociétés actives dans les services financiers et les services d’assurance, et la localisation géographique peut varier significativement d’un fonds de pension à l’autre. En outre, les analyses révèlent une popularité croissante en faveur des plans de pension professionnels à contributions définies.
Les facteurs d’investissements en actions pour les assureurs interagissent entre eux de sorte qu’il est difficile de les isoler les uns des autres. Les tendances des investissements en actions ne peuvent être attribuées à un seul facteur, mais plutôt à la combinaison de plusieurs catégories de facteurs. Nous avons utilisé une méthodologie de triangulation i.e. combinant les analyses quantitatives, la revue de la littérature, et les entretiens, ainsi que des éléments d’appréciation provenant de notre modèle
théorique, pour tirer les conclusions suivantes.
Les résultats des analyses de régression, la revue de la littérature et les entretiens concordent sur le fait que les rendements du marché des actions et des conditions de marché favorables en général revêtent une importance capitale pour les assureurs dans la prise de décision en matière d’investissement. Un profil « rentabilité-risque » attrayant constitue un facteur important influençant l’investissement en actions, puisque ceux-ci sont considérés comme offrant un rendement plus élevé sur le long terme, tout en tenant compte de la volatilité et des risques potentiels liés à ce type d'investissement. Les personnes interrogées estiment également cette classe d'actifs attrayante du point de vue de la diversification et de la stratégie de couverture des risques afin de se protéger contre le risque d'inflation. D’une manière générale, les assureurs recherchent le portefeuille de placement optimal afin de maximiser leurs rendements, tout en tenant compte des différentes contraintes définies par leur appétit
pour le risque.
Alors que de solides fondamentaux économiques et la faiblesse des taux d’intérêts sont associés positivement aux investissements en actions, les événements de marché ont un impact négatif sur ceux-ci, en raison de l’impact de ces événements sur les stratégies de réduction de l’exposition aux risques de marché. Selon les entretiens et la revue de la littérature, le rendement moyen des dividendes et la
volatilité des marchés ont respectivement un impact positif et négatif sur le comportement des assureurs en matière d’investissements en actions. Cependant, nous n’avons pas été en mesure de réaliser une analyse de régression sur le rendement moyen du dividende en raison de l’absence de données historiques. Enfin, l'absence d'un marché obligataire national avec des échéances suffisamment longues peut être un élément déclencheur pour investir dans des actions. En Suède, le marché obligataire n'émet traditionnellement pas d'obligations à échéance supérieure à 10 ans, ce qui entraîne un déséquilibre de duration et peut avoir pour conséquence des investissements en actions. Les assureurs suédois ont une exposition aux actions (directe) nettement plus élevée que la moyenne de l'UE. Cependant, l’absence de données suffisantes pour vérifier cette assertion avec des régressions peut induire des biais dans la conclusion.
European Commission - Study on the drivers of investments in equity by insurers and pension funds
December 2019 I 26
La gestion actif-passif (ALM) influence le comportement des assureurs vis-à-vis de leurs investissements en actions car, une fois mise en œuvre de manière efficace conformément au profil du passif, elle permet d’atténuer un certain nombre de risques (de marché). Cependant, en l’absence de données historiques accessibles sur les principaux facteurs, nous n’avons pas pu procéder à des régressions pour étudier l’impact de la gestion ALM.
La littérature et les entretiens suggèrent que les flux de trésorerie liés aux investissements en actions peuvent jouer un rôle pour atténuer l’écart entre l’actif et le passif. Les assureurs-vie ne semblent vouloir tolérer qu'un faible écart de durée, tandis que les assureurs non-vie, basés sur leurs contrats qui sont généralement à court terme, sont moins concernés par cet écart. Ils indiquent également que plus la durée de leurs passifs est longue, plus leur proportion en actions est élevée. Cependant, nous constatons également que, malgré une longue duration du passif, les assureurs dans un certain nombre de pays n’investissent pas autant dans les actions que la duration du passif pourrait le laisser prévoir. Le profil des flux sortants est un élément essentiel
de la gestion ALM, étant donné qu’il s’agit le plus fréquemment du point de départ de l’ALM et la littérature suggère que l’incertitude sur les conditions des marchés financiers peut inciter les investisseurs à long terme à conserver des actifs liquides. La littérature évoque également qu'en termes de conséquences financières, le risque de souscription est l'un des risques les plus importants à prendre en compte pour les assureurs-vie. Toutefois, dans le contexte actuel caractérisé par des taux d’intérêt bas, les preneurs d’assurance pourraient ne pas trouver d’autres placements attrayants, ce qui, conjugué aux pénalités contractuelles en cas de rachat anticipé, rend les assurés moins susceptibles de résilier leurs contrats. Enfin, en raison de sa vocation, l’ALM interagit fortement avec les conditions de marché et le cadre prudentiel, dans la mesure où le coût du capital pour les assureurs orientera leur allocation d'actifs stratégique, à la recherche d'un rendement optimal dans les
limites de leur tolérance au risque.
Le cadre prudentiel affecte l’allocation des investissements du fait des limites définies dans le cadre de la définition de l’appétence pour le risque. En combinant une série de données de Solvabilité I et Solvabilité II, les analyses de régressions suggèrent que la taille de l’exigence de fonds propres réglementaires (c’est-à-dire une marge de solvabilité minimale ou des exigences de capital de solvabilité requis (SCR)) ait une influence sur le comportement des assureurs en matière d’investissement en actions, y
compris avant l’introduction du cadre du cadre Solvabilité II fondé sur les risques. Les analyses montrent que, sur la période allant de 1999 à 2017, un ratio de solvabilité élevé est associé à un niveau élevé d’investissements en actions, plus particulièrement en actions cotées. Cela est encore plus prononcé lorsque les mesures de garanties à long terme (LTG) sont appliquées. Cependant, avec uniquement deux année de données Solvabilité II (période T3 2016 – T1 2018), il est difficile de conclure sur l'impact
spécifique de l'introduction du cadre Solvabilité II.
Il ressort des entretiens que le passage à la valorisation de marché a mis en avant les effets des fluctuations de marché à court terme sur le bilan des assureurs. Selon les personnes interrogées, le cadre de Solvabilité II ne reflète pas l'horizon d'investissement à long terme de leurs activités d'assurance et ne favorise donc pas davantage d'investissements en actions. Toutefois, selon les entretiens et la littérature, les mesures transitoires intégrées dans le cadre de Solvabilité II atténuent cette
situation dans une certaine mesure.
L’approche basée sur la durée de détention, selon laquelle la période de détention des investissements en actions est prise en compte dans le calibrage du risque , ne semble actuellement pas apporter de solution, car les assureurs ne répondent souvent pas aux conditions requises pour pouvoir bénéficier de son application. Les nouvelles règles

European Commission - Study on the drivers of investments in equity by insurers and pension funds
December 2019 I 27
adoptées en 2019 sur les actions à long terme avec un choc de 22% visent à mieux répondre aux besoins des assureurs ayant un horizon d’investissement à long terme. Les entretiens suggèrent qu’en fonction de l’appétence au risque et du ratio de solvabilité d’une entreprise, Solvabilité II imposera un certain niveau de contrainte à l’augmentation des investissements en actions, si cela devait conduire l’entreprise à ne plus être en conformité avec son appétence au risque. Comme le montrent les données de l’EIOPA à fin 2017 et notre modèle théorique, les bénéfices de la diversification réduisent de manière significative les besoins en capital pour les actions. En outre, la diversification au sein et à travers différentes classes d'actifs, en particulier les actions, est également considérée comme une bonne pratique de gestion des risques. Des recherches récentes sur le cadre Solvabilité II démontrent qu'une bonne gestion du risque de taux d'intérêt, consistant à se couvrir contre le risque de taux et à se concentrer sur la maximisation du ratio de rendement excédentaire attendu sur le risque
marginal, peut permettre une allocation optimale des actifs. Ceci implique une augmentation significative de l'exposition aux actions. Notre modèle théorique montre également une relation positive entre des investissements en actions plus élevés et une augmentation du taux de rendement interne des fonds propres (compte tenu des rendements attendus plus élevés des actions). Cependant, cette observation dépend fortement de la période d'observation.
Les besoins en capital sur les placements en actions sont considérablement réduits pour des produits d'assurance spécifiques, en particulier des produits pour lesquels le preneur d'assurance est disposé à supporter le risque de marché en échange d'un rendement possible plus élevé, tels que les produits en unités de compte. Cela permet à l’assureur de transférer en partie le risque actions au preneur d’assurance et de développer ses portefeuilles d’assurances, tout en continuant d’investir dans des actions dans les limites de son appétit pour le risque.
En ce qui concerne les caractéristiques de l’entreprise, l’impact de la taille de l’entreprise n’est pas clair. Bien qu’il ressorte des entretiens et de certains articles que ce facteur joue un rôle mineur, plusieurs autres articles identifient une corrélation positive entre la taille de l’entreprise et les investissements en actions. Outre la taille de l’entreprise, les analyses de régressions révèlent que la concentration sur le marché et la part de marché en termes de branche d’activités, à savoir vie ou non-vie, influencent considérablement le montant des investissements en actions. Enfin, alors
que les polices traditionnelles continuent de dominer et que la demande pour des produits garantis reste forte, les assureurs réduisent le volume de produits assortis de garanties financières. Les entretiens et la littérature soutiennent que le contexte de faibles taux d’intérêt amène les sociétés d’assurance-vie à s’éloigner des actifs productifs d’intérêts pour se tourner vers des actifs plus risqués, à la recherche d’un meilleur rendement. La part des actions dans les produits en unités de compte est
également généralement supérieure à celle des produits garantis.
Dans l’UE, les normes IFRS constituent le principal cadre comptable pour les assureurs en raison de l’importance des groupes d’assurance cotés en bourse, qui ont souvent des activités transfrontières via leurs filiales. En effet, l’application des normes IFRS favorise la comparabilité d’une juridiction à l’autre. L’introduction en 2005 des normes IFRS, généralisant la valeur de marché, coïncide également avec le début de la tendance baissière des investissements en actions (cotées) par les assureurs.
Cette baisse d’investissements directs en actions pourrait avoir été compensée partiellement par un transfert vers des investissements en actions détenues indirectement. Les analyses portant sur les actions non cotées n’ont pas abouti à des résultats probants, probablement en raison des différents types d’investissements

European Commission - Study on the drivers of investments in equity by insurers and pension funds
December 2019 I 28
concernés, tels que les participations non cotées et les sociétés de capital investissement.
Une volatilité du compte de résultat peut survenir lorsque les facteurs entraînant une réduction de valeur sont présents. Dans ce cas, la moins-value latente initialement reconnue dans les fonds propres est entièrement recyclée en compte de résultat. En outre, une fois que les investissements en actions sont réduits de valeur, une nouvelle diminution de la juste valeur implique l’enregistrement d’une perte additionnelle en compte de résultat. Cela laisse à certains assureurs la latitude de mettre en place des mesures d’atténuation visant à gérer la volatilité. D’autres assureurs sont davantage intéressés par l’impact potentiel de la volatilité à court terme sur leur compte de résultat sous IAS 39 et appliquent un intervalle de confiance dépendant de leur appétit pour le risque. Alternativement, selon IFRS 9, un assureur peut également faire le choix irrévocable de présenter les variations de valeur de marché dans les autres éléments du résultat global, au cas par cas selon l’instrument financier, en comptabilisant directement tant les plus-values et moins-values non réalisées que réalisées dans les
fonds propres. Par conséquent, ce choix restreint la contribution des investissements en actions dans le compte des résultats aux seuls dividendes reçus et les assureurs pourraient alors favoriser les actions générant des dividendes importants.
En outre, l'application future de la norme IFRS 17 aux contrats d'assurance se traduira par une application plus large de l'évaluation à la valeur actuelle. Les contrats d’assurance comportant des caractéristiques de participation directe pourraient gagner
en importance. Cela s’explique par le fait qu’IFRS 17 devrait, dans une large mesure, atténuer la volatilité potentielle découlant de l’évaluation à la juste valeur des actifs financiers. Cela est important pour les assureurs qui cherchent à limiter la volatilité inattendue du compte de résultat provenant d’investissements en actions avec des variations de juste valeur comptabilisées en résultat. Etant donné que les assureurs se préparent à IFRS 9 et IFRS 17 dans les années à venir, l’application de ces deux normes doit faire l’objet d’un suivi étroit afin d’éviter toute volatilité accrue des états financiers
et générer un impact négatif sur les investissements en actions.
Le cadre fiscal reste une compétence nationale (contrairement aux normes IFRS) et par conséquent, il s’avère très difficile de tester son rôle dans les décisions des assureurs d’investir en actions. Les analyses de régressions appliquées au ratio taxe sur le capital sur le PIB laissent à penser que les assureurs prennent en compte le traitement fiscal des gains en capital dans leurs décisions d’investissements. Toutefois, en raison de
l’absence de données sur le traitement fiscal des plus-values et moins-values réalisées sur la vente d’actions, ou le traitement fiscal des dividendes, nous ne pouvons pas conclure plus en détail. Les personnes interrogées ont souligné que le cadre fiscal ne joue pas un rôle significatif dans la répartition stratégique de l'actif, mais aura une incidence sur l’allocation tactique.
En ce qui concerne les catégories de facteurs pour les fonds de pension à
prestations définies, les conclusions pouvant être tirées de l'analyse sont comparables à celles trouvées pour les sociétés d'assurance. La plupart des fonds de pension notent que la décision d’allocation en actions repose principalement sur la gestion ALM, où les conditions de marché jouent un rôle important, en plus des caractéristiques du portefeuille de passifs.
Dans le contexte des fonds de pension, la solidité financière de l'entreprise qui soutient le fonds de pension revêt une grande importance. Les fonds de pension doivent investir les contributions reçues des « sponsors » et des participants afin de pouvoir tenir les promesses financières faites par leurs sponsors. Les conditions du marché sont à cet égard essentielles pour atteindre ces objectifs. La littérature met en évidence que les fonds de pension assument davantage de risques de placement, et donc d’investissements en actions, que les assureurs européens sur la période visée.

European Commission - Study on the drivers of investments in equity by insurers and pension funds
December 2019 I 29
Le cadre prudentiel dépendant actuellement des règles et exigences locales des différents États Membres, et n’a pas dès lors le même impact sur les fonds de pension à travers l’UE. Le cadre comptable et le cadre fiscal sont également moins pertinents (et de nature nationale).

European Commission - Study on the drivers of investments in equity by insurers and pension funds
December 2019 I 30
1 Introduction
1.1 Study background and objectives
Delivering on the Capital Markets Union (CMU) initiative is critical for enhancing long-term economic growth, private risk sharing, financial development and integration. Well-functioning, highly interconnected and deeper European capital markets are expected to play a greater role in the future in providing alternative funding sources for companies and better savings/investment options for retail and institutional investors. Most importantly, larger equity markets can support innovation and productivity while cross-border equity holdings represent a stable form of integration.
At present, capital markets have reached different stages of development across the EU Member States, hence matching the supply and demand of capital on a cross-border basis remains problematic. Consequently, the degree of participation of retail investors in capital markets as well as the size and structure of the non-bank financial sector varies significantly across Member States.
Capital markets are designed to finance growth and encourage long-term value creation in the economy. Generating real positive returns for retail investments and saving products has proven increasingly difficult in recent years due to the prolonged low interest rate environment. It has been widely acknowledged that European retail investors need products with attractive risk-return profiles and transparent pricing and cost structures. Traditionally, insurance companies and pension funds (ICPFs) have been providers of long-term capital, aiming to match their assets and liabilities and exhibiting countercyclical investment behaviour. Their asset allocation significantly influences their capacity to fulfil financial obligations to policyholders and beneficiaries over various time horizons. Starting from their specific business models, the investment
decisions of ICPFs are driven by multiple (often interdependent) factors, such as market conditions, assets and liabilities management, prudential frameworks, undertaking characteristics, accounting frameworks and tax regimes.
ICPFs’ assets are mainly invested in fixed income assets, in spite of differences across Member States and different types of ICPFs, with increasing exposures to higher yielding instruments in recent years. A higher proportion of equity investment could provide
funding to companies across their lifecycle and allow indirect access to equity for European retail investors that channel their savings through ICPFs. The growing importance of sustainability/ESG (environmental/social/governance) factors may also make ICPFs reconsider their current asset allocation and risk-management practices, more specifically their equity investments.
The European Commission has committed to provide an assessment of the drivers of equity investments by ICPFs, including the potential impact of the tax and accounting framework in explaining the observed outcomes. This study by Deloitte Belgium and CEPS aims to inform the Commission’s policy initiatives in the area of fostering higher equity investment by institutional investors across the EU by (1) identifying the trends in equity investments by ICPFs and (2) analysing and discussing the drivers behind these investments levels.
To this end, a comprehensive analysis was undertaken in this study for both insurers and pension funds. For insurers, the analysis focused on the life and non-life insurance sectors in all 28 EU Member States and three third-country jurisdictions, namely Japan, United States and Switzerland. For pension funds, the analysis focused on the defined

European Commission - Study on the drivers of investments in equity by insurers and pension funds
December 2019 I 31
benefit pension funds sector in five EU Member States: Belgium, Germany, Ireland, the Netherlands and the United Kingdom. Compared to traditional insurance contracts, unit-linked and index-linked products that transfer part or all of the risk and returns to policyholders, were treated separately and less in depth within this study.
The potential drivers of investments in equity were identified and assessed using a combination of a literature review, a data collection, country factsheets, interviews and other stakeholder consultations, econometric analysis, and a theoretical model.

European Commission - Study on the drivers of investments in equity by insurers and pension funds
December 2019 I 32
1.2 Reading guide
Chapter 1 frames the study within the overall public debate about stimulating an ‘equity culture’ through retail and institutional investment in Europe, ideally on a cross-border basis. Chapter 2 provides an explanation on the types of equity under the scope of the study (non-listed vs. listed, held directly or through a fund, large cap vs. SMEs, minor share or active participation, domestic vs. foreign equity) as well as an overview of potential
drivers of investments in equity retrieved from the relevant literature. Chapter 3 describes in detail the quantitative and qualitative research methods that generated valuable inputs for the statistical/econometric analyses, the country factsheets and post-interview reports. Chapter 4 details the current state of play of equity investments, related trends and the underlying drivers for traditional business of insurance companies as well as a brief assessment of the equity investments in index-linked and unit-linked insurance products. Chapter 5 provides the current state of play, related trends and the underlying drivers for equity investments by defined benefit pension funds.
Chapter 6 draws the main conclusions and presents a ranking of the drivers of investments in equity.
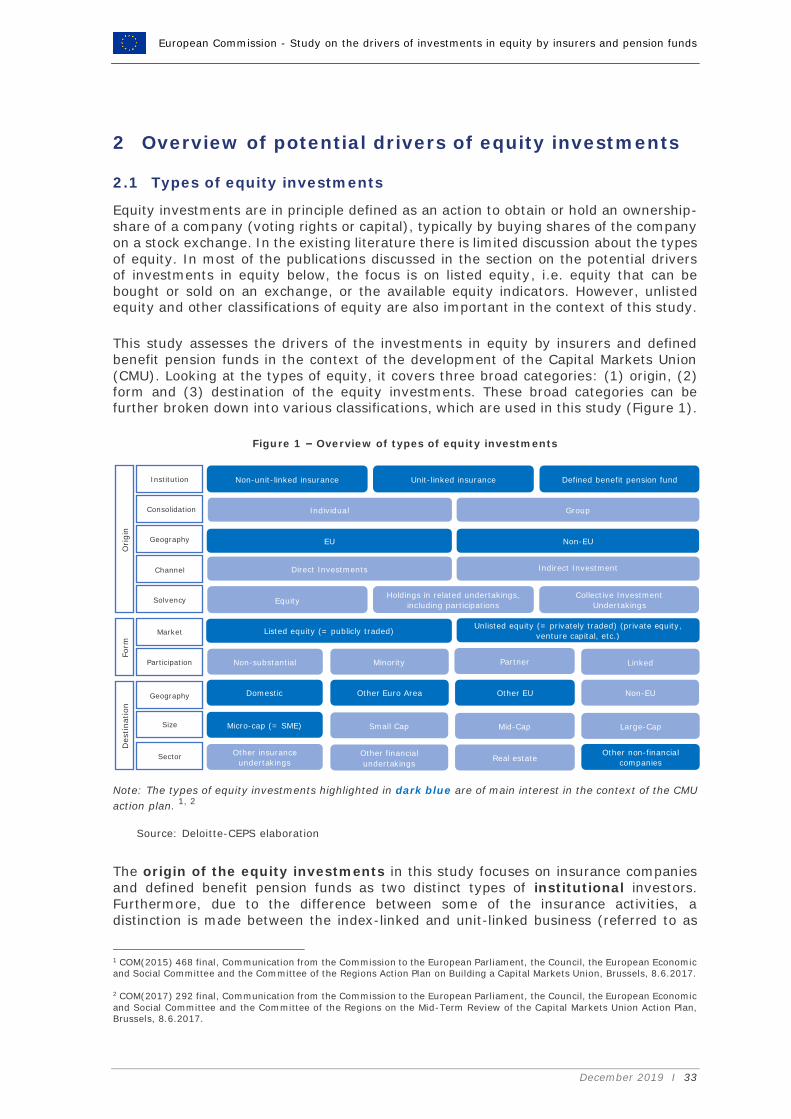
European Commission - Study on the drivers of investments in equity by insurers and pension funds
December 2019 I 33
2 Overview of potential drivers of equity investments
2.1 Types of equity investments
Equity investments are in principle defined as an action to obtain or hold an ownership-share of a company (voting rights or capital), typically by buying shares of the company on a stock exchange. In the existing literature there is limited discussion about the types of equity. In most of the publications discussed in the section on the potential drivers of investments in equity below, the focus is on listed equity, i.e. equity that can be bought or sold on an exchange, or the available equity indicators. However, unlisted equity and other classifications of equity are also important in the context of this study.
This study assesses the drivers of the investments in equity by insurers and defined benefit pension funds in the context of the development of the Capital Markets Union (CMU). Looking at the types of equity, it covers three broad categories: (1) origin, (2) form and (3) destination of the equity investments. These broad categories can be further broken down into various classifications, which are used in this study (Figure 1).
Figure 1 – Overview of types of equity investments
Note: The types of equity investments highlighted in dark blue are of main interest in the context of the CMU
action plan. 1, 2
Source: Deloitte-CEPS elaboration
The origin of the equity investments in this study focuses on insurance companies and defined benefit pension funds as two distinct types of institutional investors. Furthermore, due to the difference between some of the insurance activities, a distinction is made between the index-linked and unit-linked business (referred to as
1 COM(2015) 468 final, Communication from the Commission to the European Parliament, the Council, the European Economic and Social Committee and the Committee of the Regions Action Plan on Building a Capital Markets Union, Brussels, 8.6.2017.
2 COM(2017) 292 final, Communication from the Commission to the European Parliament, the Council, the European Economic
and Social Committee and the Committee of the Regions on the Mid-Term Review of the Capital Markets Union Action Plan, Brussels, 8.6.2017.
Non-unit-linked insurance Unit-linked insurance Defined benefit pension fund
Equity Holdings in related undertakings,
including participations
Collective Investment
Undertakings
Individual Group
EU Non-EU
Direct Investments Indirect Investment
Listed equity (= publicly traded) Unlisted equity (= privately traded) (private equity,
venture capital, etc.)
Non-substantial Minority Partner Linked
Domestic Other Euro Area Other EU Non-EU
Micro-cap (= SME) Small Cap Mid-Cap Large-Cap
Other insurance
undertakings Other financial
undertakings Real estate
Other non-financial
companies
Institution
Consolidation
Geography
Channel
Solvency
Market
Participation
Geography
Size
Sector
Ori
gin
Form
D
estination

European Commission - Study on the drivers of investments in equity by insurers and pension funds
December 2019 I 34
unit-linked), for which the investments are generally pre-defined, and non-index-linked and non-unit-linked business (referred to as non-unit-linked), for which the insurance company often determines the investment strategy with more discretion. This study also focuses on the equity investments of the insurance companies at an individual level, but considering the level of concentration of the insurance sector, the consolidation within groups is also considered.
The geographical aspect of equity investment is also important for the study. The CMU
could be developed with funds from institutional investors based in EU Member States and non-EU countries, such as Japan, the United States and Switzerland. Furthermore, potential differences between EU Member States are also considered.
Insurance companies and pension funds invest directly and indirectly in equities. The direct investments include all equity investments that are held by the insurance companies and pension funds themselves, whereas indirect investments in equity include all the equity investments that have been outsourced to other parties, including investment funds, private equity and asset managers. The differentiation between direct and indirect equity is not aligned with the equity classification under Solvency II. The latter covers equities, collective investment undertakings and holdings in related undertakings, including participations. The holdings in related undertakings can in some cases take the form of both direct and indirect equity. Indeed, in a first step holdings in related undertakings can be considered as direct equity because participations provide
an ownership share in a company. However, these investments can also contain holdings of insurance undertakings and investment vehicles, which in turn invest in other companies. This can make these investments also indirect investments, to the extent that the participations – in holdings of insurance undertakings and investment vehicles - invest in equity themselves. As the available public data do not allow to apply the look-through principle (like for investment funds), in this study the participations are considered direct equity investments (unless specified otherwise).
The equity investments can also take various forms. The main classification for
form is based on the type of market it is traded on. Publicly traded, listed equity consists of equity traded on regulated markets and multilateral trading facilities, while privately traded unlisted equities consist of all other equity investments, including private equity, venture capital, crowd funding and investments in related undertakings. A second
classification is based on the level or type of participation. Insurance companies and defined benefit pension funds can, as an investor, actively participate in the governance of the company they invest in, for example by voting at shareholder meetings or participating in the board.
The level of activity in the company is determined by the ownership stake the insurance company or pension fund takes, as investors are legally required to become more involved when their equity stake in the company becomes larger. Four categories of ownership exist: (1) non-substantial, (2) minority interest, (3) partnership interest, and (4) full control. The categories are based on the main regulatory thresholds for investors and consolidation for accounting purposes. Ownership stakes below 5% are considered non-substantial, as investors in most EU countries only need to register their investments in public limited liability companies when those exceed this threshold.3 Minority interests (ownership stakes between 5% and 25%) and partnerships interests (ownership stakes between 25% and 50%) are valued using the equity method for accounting purpose. Finally, companies in which the ownership stakes are 50% or more
3 ESMA (2018), National rules on notifications of major holdings under the Transparency Directive, Practical Guide, European Securities Market Authority.

European Commission - Study on the drivers of investments in equity by insurers and pension funds
December 2019 I 35
can be fully consolidated, as the owners are assumed to have full control over the company.
A third important aspect in the context of the CMU, besides origin and form, is the
destination of the equity investments. The objective of the CMU is to generate more cross-border equity investments as well as attract more EU equity investments from foreign investors. Moreover, the risk sharing is primarily supposed to take place between the Euro area countries. Therefore, for the geographical classification, a distinction is made between domestic or home country, other Euro area countries, other EU countries and non-EU countries.
Besides geography, size is also a relevant differentiator of equity investments. The CMU
Action Plan emphasises the importance of the development of equity markets for SMEs. In the context of capital markets these are often considered micro-caps. The definition for micro-caps has been based on the secondary markets in financial instruments directive (MIFID II - 2014/65/EU), which defines SMEs as companies with a market capitalisation of less than 200 million EUR. The micro-caps have been extended with the other company size categories that are generally used by European fund managers: small-caps (less than 1 billion EUR market capitalisation), mid-caps (between 1 and 5 billion EUR) and large-caps (5 billion EUR or more).
Finally, there is the sectoral distribution of the equity investments. The CMU is expected to unlock investments for the real economy, which can be interpreted as the end-users of this financing (all non-financial services and non-real estate companies).
The classifications discussed in this section are used throughout the study. In some instances, the various classifications are combined. In exceptional cases, we deviate from the classifications, as described above, because of data limitations.

European Commission - Study on the drivers of investments in equity by insurers and pension funds
December 2019 I 36
2.2 Potential drivers of investments in equity
This section provides an overview of the existing literature on the drivers of insurance companies and pension funds for investments in equity. These drivers can be classified into six broad groups: market conditions, asset and liability management, prudential framework, undertaking characteristics, accounting framework, and taxation.
The overall findings of the literature review are summarised in Table 1 as a list of
potential drivers for each of the mentioned categories. A full list of potential drivers, along with their relevance for equity investments of ICPFs, is given at the end of the study. Through the discussions of drivers of equity investments in Chapter 4 and Chapter 5, the list from the literature review is extended to analyse other potential drivers, such as transitional measures and application of the duration based approach under Solvency II, that are not covered in the reviewed literature from the perspective of equity investments. Other changes to the list are, for example, based on the availability of historical data for the quantitative analysis of the drivers. The accounting framework, for instance, could not be analysed via the two drivers noted in the table, but via a change in the overall accounting framework.
Table 1 – List of potential drivers of equity investments derived from the literature review
Market Conditions Asset Liability Management
Prudential Framework
Undertaking Characteristics
Accounting Framework
Tax Regime
Market volatility Average duration of liabilities
Solvency II short-
term volatility of own funds
Size of activities
Accounting
treatment of equity investments
Tax treatment of
realised gains and losses
Market events (financial crisis etc.)
Duration mismatch/gap
SCR treatment of equity investments
Type of insurance company
Impairment rules under local GAAP
and IFRS
Tax treatment of dividends
Equity premium
(market returns) Interest rate risk
Guaranteed returns
offered on products
Special tax
exemptions
Interest rate level IORP II
Economic developments
Inflation

European Commission - Study on the drivers of investments in equity by insurers and pension funds
December 2019 I 37
2.2.1 Market conditions
Market conditions influence the asset allocation of ICPFs in various ways. For example, a higher risk-return balance on equity, compared to other assets, such as bonds, might be an important incentive to invest more in equity and vice-versa. Moreover, market conditions can be exogenous or influenced by the developments within the ICPFs sectors. With rapidly growing assets under management, ICPFs have the potential to either stabilise (Arbel et al., 1983; Badrinath et al., 1989; de Haan and Kakes, 2011) or amplify swings in the financial markets and the real economy (Gompers and Metrick,
2001; Gabaix et al., 2006). This is because their investment behaviour could influence the stability of market prices and funding conditions, which consequently may intensify market volatility either directly, through investment losses, or indirectly, through supply and demand factors.
Using portfolio weights on eight asset classes4 for 306 UK pension funds5 over the period
between 1986 and 1994, Blake et al. (1999) find evidence of a positive correlation between asset class returns and investments in the corresponding asset class. In other words, asset classes that have relatively higher returns experience an increase in their investments. The authors attribute this to the passive investment strategy of ‘buy-and-hold’, reinvesting asset income in the same asset category, and distributing net inflows according to the ex-post asset allocation. However, this result holds only when examining the industry at the aggregate level, i.e. when considering the total holding in
a given asset class across all funds in the sample. Looking at individual funds’ asset allocation, i.e. cross-section analysis with a fund-specific effect, taking into account individual pension fund behaviour, the authors find a negative relationship between asset class return and net cash flow to that asset. Thus, the funds with the highest relative return on their equity investment are also those with the smallest cash flow into equity, suggesting that cash flows are used to stabilise the actual asset allocation around a common (and possibly dynamically changing) strategic asset allocation.
More recently, Bijlsma and Vermeulen (2016) examine the investment allocation of 63 of the largest Dutch insurance entities of all types – covering around 95% of the domestic insurance market – using data on the portfolios of tradeable assets held directly by the insurers from 2006 to 2013. They find that during the subprime crisis (2007 Q3 – 2008 Q2), Dutch insurers bought significantly more Northern and Southern European equities than domestic equities.6 However, this effect was partly reversed
during the post-Lehman phase (2008 Q3 – 2009 Q3) when insurers bought significantly more Dutch than North European equities. The authors find that during the ‘Draghi period’ (2012 Q3 – 2013 Q4)7, insurers also bought significantly more Dutch equities relative to North-South equities.8
Similarly, Duijm and Bisschop (2018) find that during the period between 2006 and
2014, Dutch insurance companies reacted procyclically to market sentiment. This means
4 The eight asset classes considered are: UK equities, international equities, UK bonds, international bonds, UK index-linked bonds, cash, UK property and international property.
5 The authors use data provided by a fund management group called WM Company, and as such, there is no distinction
between different types of pension funds. Instead, the dataset contains all of the funds that maintained the same single, externally appointed fund management group throughout the period and that submitted continuous return records to WM. 6 The North European countries are Austria, Belgium, Estonia, Finland, France, Germany and Slovakia. The South European countries are Cyprus, Greece, Italy, Portugal, Slovenia and Spain.
7 This is the period following the European Central Bank (ECB) Chairman’s speech that the ECB would do ‘whatever it takes’
to prevent the euro. Available at: https://www.ecb.europa.eu/press/key/date/2012/html/sp120726.en.html. 8 These results are largely attributed to the performance of life insurers, which represent about 80% of the assets of all insurers in the sample.
European Commission - Study on the drivers of investments in equity by insurers and pension funds
December 2019 I 38
that they were selling (buying) equities when equities underperformed (outperformed) other asset classes in the previous period. In particular, when returns on equity are 1% lower than the return on other assets, insurance companies sell on average between 0,17% and 0,24% of their equity portfolio. Moreover, the authors concluded that this procyclical behaviour is stronger to negative excess returns (when equities underperform relative to other assets), as well as during crises periods (2007 Q3 – 2009 Q2).
After examining 748 Dutch pension funds over the period between 1999 and 2006, Bikker et al. (2010) find that stock markets’ performance influences their equity allocation in two ways. In the short-term, the outperformance of equities over bonds and other investment categories, results in higher equity allocation (and vice versa). A 1% relative outperformance of equity leads to an increase in equity allocation of 0,2% in the following quarter. In the medium-term, outperformance of equities encourages pension funds to increase their strategic equity allocation (and vice versa). In particular,
a 1% increase in the strategic equity allocation causes an increase of around 0,9% in actual equity portfolio investments in the next period.
To analyse which investment strategy yields the better return over time, Lam (2014) examines the value of various portfolio rebalancing strategies using historical data for 20-years period for the United States, which includes business cycles. The author finds that a) rebalancing strategies improve return of a portfolio more than a buy-and-hold
strategy, b) the rebalancing strategies result in slightly lower risk than a buy-and-hold strategy, c) periodic rebalancing leads to a better risk-return outcome than a buy and-hold strategy, and d) portfolio rebalancing based on a certain threshold choice performs better than a buy-and-hold strategy in the long run. These findings are in contradiction with Spinu (2015) who finds, after undertaking a theoretical comparison between a buy-and-hold strategy and constantly rebalanced portfolios, that over a fixed time interval,
the buy-and-hold portfolio has the greater expected return, with equality if, and only if, the underlying assets have the same expected returns.
Along the same lines, Van Vliet, Pim (2012) analyses the relationship between risk and return within equity markets over the long-run through an empirical study. The author finds that, on the one hand, selecting stocks with a higher risk, does not automatically lead to a higher return. On the other hand, the author also finds that low-volatility portfolios are especially attractive because they increase the return per unit of risk.
Investigating investments in equities and the main drivers of changes in insurance companies’ portfolio allocation, Jakubik and Turturescu (2018) find that undertakings located in countries with a well-developed capital market are more prone to invest in equities. Hence, the stock exchange market capitalisation has a positive effect on insurers’ behaviour towards equity investments.
Another part of the literature provides evidence on the behaviour of different types of
institutional investors, such as, pension funds, life insurers, endowment funds, mutual funds, sovereign wealth funds, during recent financial stress episodes (i.e. 2001-2003 and 2007-2009). Using OECD Data, Papaioannou et al. (2013) show a mixed picture of pension funds’ equity allocation during the global financial crisis in 2008. Pension funds in some countries (e.g. Italy, Norway, Poland and Turkey) engaged in large net equity purchases as markets collapsed (acting in a countercyclical manner), and net equity sales, as markets recovered. Conversely, pension funds in countries such as Portugal, Spain and the US followed a more procyclical equity allocation strategy by selling equities during the economic downturn.

European Commission - Study on the drivers of investments in equity by insurers and pension funds
December 2019 I 39
The picture for life insurance companies is similar. Impavido and Tower (2009) find that life insurers sold equities during the fall in equity prices between 2001 and 2003, as well as during the 2007-2009 financial crisis. In an effort to bolster their balance sheets, major life insurers decreased the equity exposure of their portfolios by selling equities during this period. As a result, this led to further declines in market prices requiring further disposals of equity to prevent solvency margins from coming under pressure. According to Swiss Re Group (Swiss Re, 2008), life (non-life) insurance companies reduced their equity exposure by around 15-20 percentage points (10-15 percentage points) up to 2008 Q3, while the European Central Bank reported a decline of around 17 percentage points (ECB, 2008).9
The financial crisis, and the subsequent period of low economic growth, falling inflation and prolonged low interest rates environment - amplified by quantitative easing - posed serious challenges to insurance and pension systems (OECD, 2015a; EIOPA, 2017a). In particular, life insurance companies and defined benefit pension funds offering long-
term financial guarantees are directly affected by the changes in interest rates. Interest rates play a very important role for both the value of the assets and the commitments on the liability side of the balance sheet, and therefore can influence the equity allocation strategy.
Indeed, low interest rates affect the liabilities of pension funds and annuity providers, because the value of the liabilities is dependent on the discount rate (usually the risk-
free rate, e.g. the 10-year government bond yield) used to calculate the present value of future promises (Ai et al., 2015; EIOPA, 2015a). For example, the liabilities of a DB plan are equal to the discounted value of the promised cash flows, and as such low rates can imply a higher ongoing level of liabilities. The impact can be larger if future benefits are fixed10 and if the duration of liabilities is long. Moreover, the assets of a DC plan may also be affected by low interest rates. The size of the effect will depend on the
fund’s investment strategy and, in particular, on the equity part of the portfolio. Over the long-run, investment returns are likely to drop, while the value of outstanding assets is likely to increase due to a higher net present value (Antolin et al., 2011).
Low interest rates gradually reduce interest income. Evidence from the Spanish insurance market (Galdeano and Aumente, 2016) highlights that profit, i.e. investment income plus underwriting profit, fell for both life and non-life segments during 2015. As
the authors describe, the protracted episode of low interest rates is undermining insurers’ profits, particularly for entities that have underwritten life insurance with guaranteed long-term commitments. Thus, in order to be able to reach the guaranteed return, insurers and pension funds search for yield. This search can be in the form of listed equity, or less liquid and transparent assets such as alternative investments (e.g. hedge funds, private equity and commodities) and emerging-market bonds and stocks, as has occurred for pension funds in Denmark, the Netherlands, Ireland and Switzerland (OECD, 2010).
Examining more carefully the behaviour of pension funds in a low-interest rate environment, evidence suggests that pension funds may seek to hedge interest rate risk by increasing their allocation to bonds, increasing the duration of their investment portfolios and engaging in derivative transactions (Antolin et al., 2011). Such actions
9 According to Swiss Re Group (2008), this shift reflects mainly asset write-downs, as well as currency movements. The ECB
analysis is based on a sample of 19 listed insurers: composite, life and non-life insurers and financial conglomerates with large insurance activities.
10 For example, for pension funds offering a guaranteed return on pension fund contributions that is not linked to salaries or
inflation.

European Commission - Study on the drivers of investments in equity by insurers and pension funds
December 2019 I 40
are likely to be more evident in countries with quantitative, risk-based prudential rules for defined benefit pension funds, such as Denmark and the Netherlands. According to Yermo and Severinson (2010), the use of market prices for calculating pension assets and liabilities (e.g. the application of spot discount rates) and the implementation of quantitative, risk-based funding requirements have intensified procyclical behaviour in pension funds during the global financial crisis, for example in Denmark, Finland and the Netherlands.11
More recently, Jakubic, P. and E. Turturescu (2018) examined the effect of interest rates on 40 European insurers listed on stock exchange markets across 16 countries from 2006 to 2016. The authors find that interest rates have a negative and highly significant impact on the equity allocation of insurance companies’ portfolios: the higher the level of interest rates, the lower the level of equity investments. However, this result is not fully supported by EIOPA data. While from 2006 Q1 until 2008 Q3 the increase in interest rates was accompanied by a decrease in the share of equity investments as a percentage
of total investment assets, namely from 16,1% to 14,2%, the trend in interest rates has reversed since then. Yet, from the moment the ECB announced the first reduction in interest rates in October 2008 (2008 Q4), until the end of 2016 Q4 (sample period of Jakubic and Turturescu’s analysis), equity investments have not risen, but declined from 12,8% of total investment assets to 9,9%. While we observe that in absolute terms, the amount invested in equity increased by 16%, the total of financial assets increased much further, by 50%.
Studying the potential solutions the insurance sector has in the face of Europe’s low interest rate environment, Arias et al. (2016) examine the effects of the ECB quantitative easing (QE) on the equity investments. The authors find that theoretically, the QE policy might have an upward effect on equity market prices. Arias and Déderen present the three scenarios, which in their view would lead to that outcome. First, they present a scenario where a drop in interest rates caused by QE leads to a decline in the
yields of bond instruments, prompting investors to turn to riskier investments. This reallocation of portfolios can push the equity markets upwards. Secondly, they present a scenario where the low interest rate environment also influences the decisions of companies in terms of debt. This can lead to companies investing more and financing this investment through the acquisition of low interest debt, which can consequently lead to an increase in share prices. Thirdly, they present a scenario where the implementation of QE may cause a drop in the euro. This depreciation can be favourable
to European companies, for whom a large part of their turnover stems from abroad (namely in dollars). This increase in overseas sales and consequently in business profits can have an upward effect on share prices. The authors go on to say that historically, the announcement of a QE policy in the United States and in Japan boosted the stock markets and that in Europe, the ECB announcements in January 2015 have resulted in a short-term rise in the equity markets.
For insurers, there are empirical studies that analyse the economic environment and the level of the development of the insurance markets, as well as the level of equity investments. At the aggregate level, the literature (Bianchi et al., 2011; Focarelli, 2017) suggests that there is a link between higher economic development and higher assets of the insurance sector. Recently, Jakubik and Turturescu (2018) focus on equity
11 Denmark and Finland introduced regulatory changes to avoid sales of equities, mortgage bonds and other securities. However, Dutch pension funds used the spot swap curve to value their liabilities. As a result, the heavy demand for long-
term swaps put downward pressure on the long swap rate, which further intensified this demand. The Euro 50-year swap rate declined by 13% on 3 December 2008, and 18% on the following day. However, the market returned to pre-dip levels
within a few days (Geneva Association, 2010).
European Commission - Study on the drivers of investments in equity by insurers and pension funds
December 2019 I 41
investments, instead of total assets of the insurance industry, and they find empirical evidence that higher equity investments might be linked to higher economic growth.
Another important factor that can have a significant effect on the structure of a portfolio
and therefore affect asset allocation, is inflation (Jakubik and Turturescu, 2018). Starting with insurance companies, Ahlgrim and D’ Arcy (2012) distinguish between the effect of inflation on property-liability insurers and that on life insurers. For property-liability insurers, the clearest impact of inflation is the cost of future claims on current policies: as inflation increases the value of the property, the cost of claims increases. D’Arcy (1982) finds that both the underwriting profit margin and insurance investment returns were negatively correlated with the inflation rate during the period between 1951 and 1976 in the US. Krivo (2009) observes that although inflation and the underwriting profit margin were not significantly correlated over the subsequent period between 1977 and 2006, investment returns and the year-to-year change in underwriting profit margin were both significantly negatively correlated with inflation over that period.12
Unlike property-liability insurers, life insurers are less affected by claims inflation, since many products have policy pay-outs that are fixed in amount (Ahlgrim and D’ Arcy, 2012). However, life insurers are likely to be indirectly affected by the impact of inflation, as high inflation, for example, erodes the current value of fixed future payments, creating a disincentive for life insurance purchases and an increase in lapse
rates (Li et al., 2007). Any significant change in inflation is, however, also likely to have a large effect on insurers’ balance sheets. Browne et al. (2001) also show that financial performance measures, such as Return on Equity (ROE) and Return on Assets (ROA), are significantly negatively affected by unanticipated inflation, likely driven by the significant leverage of life insurers. Unlike the liabilities of property-liability insurers, the liabilities of life insurers commonly reflect the present value of future obligations. Higher
inflation may thus lead to increased liabilities for casualty companies. However, the present value of life insurers’ obligations, which are fixed in amount, may decline if interest rates increase as a result of inflation.
Inflation is also one of the most important drivers for pension funds. In fact, both assets and liabilities of the fund can be impacted by unexpected inflation shocks over time. Assets may suffer because an increase of inflation rate could trigger an interest rate up-
shift, and therefore negatively impact the nominal value of fixed-income assets. Liabilities can also come under pressure since the future salary of pensioners and active members can be sensitive to inflation. While equities have been used to achieve higher expected returns, meet future obligations and lower expected pension costs, according to Black (1989) they can also be used to hedge against a potential increase in pension liabilities. For example, equities can hedge against the risk of salary inflation, which causes an increase in liabilities. However, inflation risk may also lead away from equity
and towards real estate as a hedge for inflation, which is an essential part of a pension fund’s portfolio as shown by Hudson-Wilson et al. (2005).
A potential motivation for ICPFs to hold equity is thus to hedge their portfolio against inflation. Barnes, Boyd and Smith (1999) also show that stock returns and inflation are negatively correlated or uncorrelated for low inflation countries, and highly positively correlated in high inflation countries. According to Boudoukh and Richardson (1993),
12 In addition to the impact of inflation on the cost of future claims on current policies, property/liability insurers are also likely to experience adverse development on loss reserves if inflation increases. As explained in D’Arcy, Au and Zhang (2009)
and D’Arcy and Au (2011), loss reserves are commonly set based on the implicit assumption that the inflation rate experienced in the recent past will continue until these claims are closed. However, for some liability insurance lines, it can take decades
for these losses to close. If inflation increases, it will cost more than expected to settle these claims and the loss reserves will prove inadequate. Thus, insurers will be forced to increase these liabilities for losses that have already occurred.

European Commission - Study on the drivers of investments in equity by insurers and pension funds
December 2019 I 42
stocks can be used for inflation hedging in the long run. Alternatively, an empirical study of Bekaert and Wang (2010), on a broad set of countries, reports that standard securities such as stocks are poor hedges against inflation in both the short and long run. However, Verboon (2012) argues that the differences in studies on stocks and inflation hedging might be due to the periods and countries covered in the empirical investigations.
On a different note, Barber and Odean (2008) analyse the effects of attention and news
on the buying behaviour of individual and institutional investors. The authors test and confirm the hypothesis that individual investors are net buyers of attention-grabbing stocks, e.g. stocks in the news, stocks experiencing a high abnormal trading volume, and stocks with extreme one-day returns. Attention-driven buying of stocks results from the difficulty that investors experience with searching through the thousands of stocks they can potentially buy. Individual investors do not face the same search problem when selling stocks as they tend to sell only stocks they already own.
2.2.2 Asset and liability management
Asset and liability management (ALM) involves structuring the balance sheet in such a way that all changes in the value of liabilities correspond to an equivalent change in the value of assets and vice versa (Fleuriet and Lubochinsky, 2005). In other words, ALM refers to the portfolio choice problem of an investor who uses the principal and
investment returns on assets to satisfy future liabilities.13 For example, a defined benefit pension plan must pay promised benefit payments to the policyholder at a later point in time using pension contributions made by the policyholder and the investment returns accumulated on those contributions. Thus, in order for long-term investors to be able to make these benefit payments, ALM may influence their strategic asset allocation.
Davis (2002) states that an ALM approach aims at matching the assets and liabilities by
choosing a portfolio of assets with return, risk and duration characteristics similar to those of the portfolio of individual liabilities – although characteristics of individual assets may differ from those of liabilities. Therefore, any significant mismatch in duration14 of assets and liabilities is a potential concern for ICPFs.
In an effort to meet their future liabilities, pension funds and life insurance companies typically hold long-dated bonds (OECD, 2015a). However, their liabilities may have a
longer duration due to the horizon of their obligations (e.g. life expectancy at age 65 can exceed 20 years), resulting in a mismatch between assets and liabilities.
Holsboer (2000) stresses that the duration mismatch might put the performance of ICPFs under pressure, especially when interest rates decrease. For example, when prevailing interest rates are sufficiently below those that form the base for the
guarantees at the time of the creation of the contracts, the present value of the future commitments increases, as assets that mature are reinvested at a lower rate of return. Thus, unless they have developed ALM strategies, life insurance companies and pension funds may face reinvestment risk (OECD, 2015a).
Analysing the duration and convexity15 mismatch, using a theoretical model, Lee and Stock (2000) conclude that interest rate risk can be eliminated via a duration-match
13 Sometimes ALM is referred to as liability driven investing or LDI (van Binsbergen and Brandt, 2007). 14 The duration measures the sensitivity (in linear terms) of assets and liabilities to interest rate changes. 15 Convexity measures the curvature of the changes in assets and liabilities, in relation to interest rate changes.

European Commission - Study on the drivers of investments in equity by insurers and pension funds
December 2019 I 43
strategy. On the other hand, duration mismatch can be sought intentionally by financial institutions. Doff (2011) finds that although a mismatch can be undesirable, insurers often deliberately choose to create one in order to generate additional return. In other words, in order to achieve a higher return, insurers may accept a higher level of risk.
The outflow profile is one important factor of the ALM process. Gilbert (2016) finds that there are two general approaches used in the insurance industry to manage insurance company assets. One approach is to manage the assets separately against a benchmark within specified risk limits to achieve a specified investment objective. In the other
approach, asset management is executed within an ALM framework, meaning that ALM drives the investment process. In this case, the assets are managed directly against the liability cash flows, rather than a benchmark. This is done in such a way to achieve the financial objectives rather than the investment objectives. For some companies, especially P&C companies, the ALM process may also include liquidity targets.
Studying the problem of modelling policyholders' behaviours in life insurance, Milhaud and Dutang (2018) find that in terms of financial consequences, lapse risk is one of the biggest risks to consider for life insurers. The authors assert that lapses strongly affect insurers' Asset and Liabilities Management (ALM) since they trigger unexpected cash flows, and modify the insurers' commitments through changes in contractual guarantees.
Ideally, long-term investors could invest most of their assets in illiquid securities or
loans. Nonetheless, uncertainty about financial market conditions may also incentivise long-term investors to hold liquid assets (Gründl et al., 2016). As mentioned, studying the role of equity in the portfolio of pension funds, Black (1989) argues that while managers think about bonds as the only answer to hedge their pension liabilities, equities can also be viewed as a hedge against a potential increase in pension liabilities.
The author divides pension liabilities into two categories: (i) the narrow liability category, defined as the present value of all vested benefits for current employees, and (ii) the broad liability category, defined as the present value of all benefits to be paid. While hedging for the type of narrow liability can be done using bonds, the broad liability can be hedged using equities, because equities can be used to achieve higher expected return, and therefore, meet the pension obligation in the future while helping to lower expected pension costs.
Confirming the positive relationship between equities and pension liabilities, Peskin (1997) argues that pension funds’ equity exposure is critical to the future contribution cost. More specifically, the author finds that the optimal equity exposure of each fund can be determined by a number of factors. The first one is the volatility in the liabilities. If pension fund’s liabilities do not act like bonds (i.e. the relationship between bonds and liabilities is volatile) and the value of the liabilities moves around significantly, then
a pension fund should have greater equity exposure. Another important factor is the growth in workforce. A growing fund, in the sense that liabilities of active participants16 grow faster than those of retired participants, should have more equity exposure.
Furthermore, there is an important difference in the liabilities of insurance companies and pension funds. For insurance companies, the observed shift towards unit-linked products implies also a shift towards products in which the policyholder bears all of the risk. This change may have implications for asset allocation as individuals have preferences for particular asset types that are different from those of an insurance
16 Active participants refer to the share of participants in the total participants that are currently accruing pension rights.

European Commission - Study on the drivers of investments in equity by insurers and pension funds
December 2019 I 44
company, which is due to risk appetite, knowledge/understanding of certain types of financial assets, risk judgment capacity or shock-absorption capacity.
Looking at the assets of pension funds, a difference should be made between defined
benefit (DB) and defined contribution (DC) schemes. For example, the assets backing a DB pension holder’s benefits, at the beginning of the accumulation phase17, may be more genuinely illiquid, as they are more unlikely to be drawn or changed for a long period of time (BoE, 2014). On the other hand, DC policyholders, who bear the risk of investment decisions, actively choosing their asset allocation, might be more risk averse in aggregate than a DB pension fund. Thus, assets backing a DC pension holder are likely to be more liquid.
2.2.3 Prudential framework
The prudential framework is concerned with the objectives of policyholder protection
and financial stability. ICPFs subject to a prudential regime are therefore governed by and must conform with the rules and requirements of this prudential regime to be permitted to operate their business. Consequently, these rules and requirements influence ICPFs’ investment behaviour as they affect their financial performance.
In the EU, prior to the adoption of Solvency II, the current prudential regime for
insurers, Solvency I had been applicable since the 1970s. Doff (2011) notes that the non-life directive and the life directive (adopted in 1973 and 1979 respectively), set out financial requirements for technical provisions and regulatory capital, and included asset restrictions in order to ensure that liabilities would be paid to policyholders when due. In other words, under Solvency I, investment risk was addressed by setting asset limits, some of which applied to the total equity exposure of the portfolio and others that set maximum concentrations to investments to one single counterparty.
Because of the drawbacks of the Solvency I regime, of which some of the most important were that it was not risk-based and did not incentivise appropriate risk management on the part of companies, some countries (e.g. the Netherlands, the United Kingdom and the Nordic countries) developed alternative frameworks. In 2001 Denmark was one of the first countries, together with Sweden in 2006, to introduce and implement fair value for regulatory purposes, as well as supervisory stress tests for monitoring solvency positions for industry-wide pension funds and insurance companies (Severinson and Yermo, 2012). The so-called ‘traffic light system’ as part of the Danish supervisory tool, aimed to ensure that all life insurance companies and pension funds hold sufficient reserves to cover possible adverse economic developments.18 Examining the impact of this system, Andersen and Skjodt (2007) found a change in the asset allocation of Danish ICPFs. Immediately after the introduction of the traffic light system in 2001,
there was a shift away from equities, followed by a move towards foreign bonds in the following years. Investment in domestic (foreign) equities dropped from 13,4% (12,3%) in 1998 to 4,6% (8,3%) in 2004.19
17 The pre-retirement accumulation phase is the one in which contributions are being made and assets accumulated. The
post-retirement decumulation phase is where pension payments are being made. The assets held during these two phases may have different risk and liquidity profiles.
18 With the traffic light system, the Danish supervisor models the different market risks to which an insurance company or a
pension fund is exposed. This is done using stress tests to determine the likely solvency position of the entity in the coming year on a fair value basis, based on pre-defined financial scenarios.
19 While part of this drop (in 2000-2001) can be explained by the domestic and global collapse of stock markets, the rest, according to the authors, is purely attributed to portfolio reallocation, as equities outperformed bonds over this period.

European Commission - Study on the drivers of investments in equity by insurers and pension funds
December 2019 I 45
A similar effect was observed in the UK with the introduction of the Pensions Act in 2004 and the ICA in 2005. Greenwood and Vayanos (2010) argue that the new reform incentivised pension funds to increase their exposure to long-term government bonds and reduce that of equities.20 More specifically, the author finds that between 2003 and 2006, the cumulative net sales of equities were of the order of 50 billion GBP, compared to net purchases of just under 20 billion GBP of long-term bonds. BIS (2011) similarly finds that higher minimum capital requirements and the introduction of the accounting standard FRS 17 led to large purchases of long-term bonds by UK insurance companies and pension funds.
According to Eling et al. (2008), the Swiss Solvency Test (SST), introduced in Switzerland in 2006, creates an incentive for insurers to assume fewer risks by, for example, decreasing the portfolio amounts invested in equity and/or by increasing the amount invested in relatively safe assets such as high-rated bonds. The authors conclude that the new, risk-oriented control of asset management, as envisioned by the
SST, would change the investment policies of insurers and thus have a substantial impact on the capital markets. More specifically, they expect a shift towards long-term bonds and a flat term structure in the Swiss and other European capital markets.21
In order to address the drawbacks of Solvency I and avoid a patchwork of various prudential regimes across the EU, Solvency II was developed and came into effect on 1 January 2016. Solvency II’s Solvency Capital Requirement (SCR) is made up of a series
of capital requirements for the risk of different activities, such as underwriting risk, counterparty risk and market risk. For each kind of risk, Solvency II defines how much capital the insurer must hold. This means that insurers with higher-risk investments, such as equities, must maintain a higher buffer than those investing in lower-risk assets, such as government bonds. For example, a Solvency II ratio of 100% means that an insurer’s capital is such that it will still be able to meet its obligations in the event of a
severe shock that is expected to occur once in every 200 years. The target confidence level for insurers has been set at 99,5% over a one-year horizon (EIOPA, 2014). Also in addition to the SCR, Solvency II details a Minimum Capital Requirement (MCR).
Additionally, under the Solvency II regime, the overall risk exposure can be reduced by the diversity of the insurers’ business (EIOPA, 2014; EIOPA, 2015b). This is because the adverse outcome from one set of risks can be offset by a more positive outcome
from a different, uncorrelated set, meaning that the total risk of an insurer’s portfolio is less than the sum of the risks of its individual parts. As the capital requirements depend on diversification between different sources of risk, the ‘diversification benefit’ could lower the capital that an insurer is required to hold by up to 50%, according to the Institute of Risk Management (IRM, 2015).
There is a broad consensus on the advantages of Solvency II: the enhanced reporting
and transparency, alignment with internal risk management, and ability to capture the impact of both embedded options-guarantees and of asset/liability mismatch. However,
20 The Pensions Act created a government fund, which would serve as a lifeboat for defined benefit pension schemes whose
sponsor had become insolvent. Under this act the pensions regulator obtained the power to take over funds that were either perceived to be at risk or unable to meet their obligations. Underfunded pension funds could reduce the volatility of the gap in value between their assets and liabilities by buying government bonds. Funds were described as underfunded if they were
running an accounting deficit, which was measured as the difference between the market value of their assets and liabilities. 21 The SST promotes reducing the duration mismatch between assets and liabilities (similar to what Solvency II does via the interest rate risk module), which can lead to an increase in the demand for long-term bonds and trigger a capital shift
(especially in the life insurance business). Such shifts in demand occurred, for example, in the UK when the term premium was negative during the 2000s. In particular, higher minimum capital requirements (i.e. the enhanced capital requirement
(ECR) and the individual capital assessment (ICA)), and the introduction of the FRS 17 accounting standards, resulted to large purchases of long-term bonds by UK insurance companies and pension funds (BIS, 2006).

European Commission - Study on the drivers of investments in equity by insurers and pension funds
December 2019 I 46
there are also several concerns on the impact that the new regime might have on asset allocation, and particularly equity allocation. One of them raised by Persaud (2015) is the short-term volatility of own funds. The author argues that Solvency II would accelerate equity disposals, reduce the number of investors in equity and as a consequence increase the cost of long-term investment. According to the author, the main problem lies with the fact that the riskiness of the assets of a life insurer or pension fund, with liabilities that materialise after 10-20 years, cannot be measured by how much prices will change during the next year. This is because using market values to assess available capital may overstate the companies’ balance sheet exposure to short-term market volatility and so create a disincentive for investment in illiquid, long-term, risky assets such as equity, as shown by BlackRock (2012), Severinson and Yermo (2012) and Focarelli (2017).
McKinsey (2011) and G30 (2013) illustrate the disposal of equity by showing that for the period between 2000 and 2010, insurers reduced their allocation to equities, on
average, by 12 percentage points and more specifically, by 14 percentage points in Germany, 12 percentage points in the United Kingdom and 8 percentage points in France.22 During the same period, pension funds of both types (DB and DC) reduced their equity investment by 22% in the United Kingdom, 17% in the Netherlands and 9% in Switzerland. Furthermore, McKinsey (2011) expected that European insurers’ equity allocation would fall even further over the five-year period of 2010-2015. The study based its predictions on the fact that at a time when European banks needed to raise
more capital, Solvency II would constrain the insurance sector as a potential purchaser of that equity. However, this was not the case, as equity allocation remained stable over the period 2010 to 2016 at around 9% (EIOPA, 2017b).
In another study of the impact of Solvency II on investments, Morgan Stanley and Oliver Wyman (2015) examined the effect of the new regulation on four stereotype insurance
companies, in a simulation exercise based on the Quantitative Impact of Solvency II (QIS5).23 The study finds a shift away from equities and illiquid investments into short-dated corporate bonds. In particular, insurers are unlikely to increase equity allocations markedly given their less attractive return on Solvency II capital relative to bonds.
On a similar theme, Schlütter (2017) looked into the provisions to derive the interest rate risk capital charges under Solvency II. Under these, insurers calculate their capital
requirement as the maximal loss in capital that results from an upward or a downward movement of the yield curve. According to the author, this procedure is questionable for two reasons. First, the calibration of the stress factors appears to be too optimistic and does not reflect the 1-in-200-year event, which would correspond to the 99,5% Value-at-Risk.24 Secondly, the formula underestimates the risk from changes in the steepness and curvature of the yield curve, and thus incentivises an insurer to immunise against yield curve shifts by closing the duration gap.25 Consequently, the author finds
22 However, these studies do not explain how much of this decline is due to the two crises events that took place during the examined period, namely the dot.com crisis of 2000 and the global financial crisis of 2008, or due to the effect of the prudential framework on ICPFs’ equity allocation.
23 The four fictitious insurance companies are as follows: 1) Mosaic Composite Company: a composite insurer, writing mainly
life business, with exposure to US life; 2) Mystic Global Life: a pure global life insurer with a US life business; 3) Fantasy Re: a diversified reinsurer, writing both life and non-life reinsurance business; and 4) Accidental P&C: a primary commercial and
retail non-life insurer that does not write life business. 24 This is also confirmed by Gatzert and Martin (2012) who demonstrate deficiencies of the standard formula’s market risk assessment when comparing it to a partial internal model.
25 According to Litterman and Scheinkman (1991), closing the duration gap immunises a portfolio against parallel shifts in the yield curve. Given that the yield curve scenarios in the standard formula are not parallel shifts, Litterman and Scheinkman

European Commission - Study on the drivers of investments in equity by insurers and pension funds
December 2019 I 47
that not addressing those concerns can lead to substantial distortions in the risk measurement, restricting the choice of investments (to be relatively insensitive with regard to the duration gap between assets and liabilities), promoting inefficient over efficient portfolios (Braun et al., 2017), and forcing insurance companies to increase their asset allocation towards bonds, while reducing their equity exposure, as also shown by Rudschuck et al. (2010).
Focusing on the effect of Solvency II on insurers’ equity investments, Jakubik and
Turturescu (2018) examined whether insurance companies with high capital positions invest more in equities than less well-capitalised insurers. According to Solvency II regulation, insurance companies should hold eligible own funds at least to cover their SCR. Using the Solvency ratio in a pooled OLS model, the authors find that higher Solvency ratios imply higher share of equities in total investment assets.26 In other words, the share of equity investments is higher in better capitalised undertakings: an insurance company with a Solvency ratio between 200-250% typically allocates
approximately 17-18% of its total investment assets into equity, compared to a company with a SCR of 100-150% which typically allocates approximately half this level (around 8-9% of total assets) (EIOPA, 2017b).
Kouwenberg (2017) discusses how insurers can perform strategic asset allocation under the constraints of Solvency II capital requirements. The author bases his argumentation on two main ideas: (1) in their asset allocations, insurers should also look beyond the
1-year horizon of Solvency II. The insurers can reduce the amount of required capital by limiting the share of risky assets in their portfolios, but this would have a negative impact of the sustainability of their business in the long run (Van Bragt et al., 2010; Van Vliet and Brown, n.d.). (2) analysing the capital requirements in isolation might lead to the conclusion that shares of risky assets should be reduced (Rudschuck et al., 2010) while considering all requirements together would give a more realistic solution.
Based on these arguments, Kouwenberg (2017) uses risk budgeting methods to demonstrate that the asset allocation efficiency and solvency position of the representative European Life insurer can be improved by hedging and focusing on ‘marginals’.27 The author suggests a procedure whereby the insurance liabilities are hedged against interest rate risk as a first step. Then, in a second step, the insurer should focus on optimising the ’marginals’, in particular the ‘ratio of expected excess return to marginal risk’, i.e. assets offering the highest return to marginal risk ratio are
attractive to invest more in, until eventually the risk budget for SCR is exceeded.28 The author compares the improved asset allocation (based on the ratio of expected excess
(1991) apply a more general approach and construct a portfolio that is immunised against a particular movement (not necessarily a parallel shift) of the yield curve.
26 Due to the lack of time series for Solvency II data, the authors estimate the model using a pooled linear regression on 1683 individual insurers at end of 2016.
27 The marginal SCR i.e. the increase in the SCR for market risk when the value of a particular asset or liability increases by
1 unit. The marginal contribution to risk i.e. how much of the total SCR a particular asset contributes (in %), after accounting for diversification benefits. The adjusted marginal contribution to risk i.e. marginal contribution to risk, after netting out the
marginal contribution for interest rate risk and assigning it to the technical provisions. The return on SCR i.e. the expected increase in the insurer’s own funds divided by the SCR for market risk. The marginal return on capital i.e. the expected change
in the return on solvency capital when the weight of a particular asset or liability is increased by 1,0%. The marginal return on capital of an optimal asset-only portfolio (i.e. without liabilities). The ratio of expected return to marginal risk i.e. the expected return in excess of the risk-free rate divided by the marginal SCR.
28 The initial asset allocation consists of 7% equity, 11% property, 32% EEA government bonds and 29,5% corporate debt.
It results in an SCR of 297 million euro, own funds of EUR 400 million, Return on SCR equal to 0,5%, expected return on own funds which is negative (-0,3%), while the insurer is exposed to high interest rate risk, which shows that the initial asset
allocation is inadequate. The improved procedure leads to a portfolio consisting of 12% equity, 7% property, 146% EEA government bonds and 21,5% corporate debt which results in a reduction of SCR, an increased solvency ratio, an improved
return on SCR and an improved expected return on the insurer’s own funds. In particular, there is a significant increase in equity allocation from 7% to 12%.

European Commission - Study on the drivers of investments in equity by insurers and pension funds
December 2019 I 48
return to marginal risk) against an optimal portfolio derived via the formulation of an optimisation problem with non-negative constraints. Remarkably, the asset allocation found in the improved asset allocation based on the ’ratio of expected excess return to marginal risk’ is very close to the optimal solution.
The author therefore concludes that within the Solvency II Framework, for the insurance company that maximises the expected return on own funds, subject to an upper limit on the solvency capital requirement for market risk, the ratio of expected return to marginal risk of asset classes is the most useful measure for improving the efficiency of an asset allocation.
2.2.4 Undertaking characteristics
According to the existing literature, the risk-return preferences of ICPFs are an important driver of their equity investments. Theory provides two hypotheses on the
way in which the risk bearing capacity of a firm can affect its risk-taking investment behaviour. First, the risk-shifting or asset substitution hypothesis, which argues that financially distressed firms can benefit from increasing the risk of future cash flows and therefore invest in riskier assets such as equity (Galai and Masulis, 1976; Jensen and Meckling, 1976). Secondly, the risk-management hypothesis advocates that bankruptcy risk and the consequent inability to decline more profitable future investment projects provide an incentive to either limit risk exposure (for instance limit the investments in equity) or hedge through the purchase of derivatives (Smith and Stulz, 1985; Mayers and Smith, 1987).
Comparing the equity investment behaviour between insurance companies and pension
funds, Gorter and Bikker (2011) highlight a key difference between the two sectors, namely that while the former are facing financial distress costs, the latter are technically immune to default. The authors explain that pension funds are trusts, and when assets fall below liabilities, a fund does not go bankrupt, employees are not laid off and non-marketable assets are not lost. The authors argue that this is however not the case for insurers, which are more likely to lose policyholders when solvency capital runs low. The authors find empirical evidence that insurers do indeed face financial distress costs. As a result, insurers take less investment risk than pension funds, and are more responsive to changes in their buffer capacity. Using a sample of 12.866 institution-year observations on Dutch pension funds and insurance firms over the period 1995-2009,
Gorter and Bikker (2011) confirm that the relationship between capital and risk taking is significantly more pronounced for insurance companies than for pension funds. Hence, insurance companies choose their asset allocation in a more risk sensitive manner than pension funds.
Examining the equity allocation more closely, Gorter and Bikker (2011) find that this is
closely related to the equity cycle, over which pension funds tend to be more risk tolerant compared to insurance companies. Their empirical results show that pension funds rebalance on average about 40% of market price movements, in both increasing and decreasing markets. In contrast, insurance companies rebalance their portfolio only in increasing markets and not in decreasing markets, when they prefer not to buy equities. Thus in volatile times when the stock market falls and the risk bearing capacity has been eroded, insurance companies are more risk averse.
Within the insurance sector, Conforti (2015) looks into the investment strategies of property and casualty insurers. The author finds that because of the longer tailed nature of certain property and casualty insurers’ products, they typically have more flexibility when it comes to the investment side of the company to earn higher returns by investing

European Commission - Study on the drivers of investments in equity by insurers and pension funds
December 2019 I 49
longer term in risky assets. The article finds that this is particularly true for insurers who specialise in the commercial lines of business, as this side of the business includes longer tailed lines such as workers’ compensation and other liabilities. Personal lines usually call for more immediate payment, and cover items such as car and homeowners insurance. The majority of larger property and casualty insurers cover both commercial and personal lines, but are willing to take on a higher combined ratio through commercial lines because of the investment flexibility that commercial insurance brings.
Several papers discuss the ownership structure or organisational form of insurers. The ownership structure hypothesis posits that stock insurers have more incentives to take risk than mutual insurers. Commercial insurance companies or joint-stock owned insurers, which are owned by their shareholders, strive to maximise shareholder value (MacMinn and Ren, 2011). However, this is not the case for mutual insurance companies, which are owned entirely by their policyholders, as mutual ownership claims are principally inalienable (Lee et al., 1997; Powell, 2017). Furthermore, as mutual
insurers’ main source of capital is their policyholders, it would be very difficult to raise additional funding in a limited period of time, thus they are more long-term oriented investors (de Haan and Kakes, 2011).
In addition to the nature of the ICPFs, the lifecycle of their liabilities also plays an important part in determining their investment strategy. For example, Bikker et al. (2012) examine the effect of the age of Dutch pension fund’s participants on their
strategic equity allocation using data on 378 pension funds investment strategies for the year 2007. The authors find that the Dutch pension funds with participants with a higher average age, significantly reduce their equity exposure, compared to funds with younger participants. In particular, results show that a one-year increase in the average age of participants is associated with lowering equity exposure by 0,2% to 0,4%.29 Moreover, Bikker et al. (2012) find that active participants’ age – as opposed to retired
or dormant participants – has a stronger impact in the investment behaviour of the pension fund. Indeed, a one-year higher average age of active participants is associated with a drop in equity exposure of around 0,5%.30
Similar results are found by other studies. Analysing 44 Finnish DB pension funds, Alestalo and Puttonen (2006) report that an increase of the average participants’ age by one year reduced equity exposure in 2000 by 1,7%. For Switzerland, Gerber and
Weber (2007) document an equity decrease of 0,2% for a one-year increase in the average age of participants. This negative age-dependent equity allocation is in line with the optimal lifecycle saving and investing theory (Bodie et al., 1992; Campbell and Viceira, 2002; Cocco et al., 2005; Ibbotson et al., 2007). According to the optimal lifecycle saving and investing theory, the proportion of financial assets invested in equity
29 The 0,17% refers to the simplest model (unweighted) that the authors employ, which attaches equal weight to each
observation of a pension funds, irrespective of the size of its participants. On the other hand, the result of 0,38% refers to the weighted estimation, in which pension funds are weighted proportionally to their size. This implies that the difference
between the two results (i.e. in equity allocation) is better explained by the larger pension funds, than by the smaller ones. 30 The negative relationship between participants’ age and pension fund’s equity allocation is attributed to the theory of life-
cycle saving and investing. The theory, developed by Samuelson (1969) and Merton (1969) and further expanded by Hogan (2007) and Bodie et al. (1992), points out that each person has both human and financial capital, with the former usually
being the most important. In particular, the theory indicates that the fraction of an individual’s financial wealth optimally invested in equity should decline with age for two reasons. First, because human capital is usually less risky than equity and
the value of human capital usually declines as a proportion of an individual’s total wealth as he ages, an individual may need to invest a large share of his financial wealth in risky assets to achieve sufficient overall risk exposures. Second, the flexibility
that younger individuals have to alter their labour supply allows them to invest more heavily in risky assets. However, the opposite is also possible. For example, for an individual with risky human capital (e.g. a businessmen or a stock analyst, as
Samuelson used in his model), the optimal path may be to start out early in life with no stock market exposure in his investment portfolio and to increase that exposure as he ages.

European Commission - Study on the drivers of investments in equity by insurers and pension funds
December 2019 I 50
should decrease over the life-cycle, while the proportion of bonds should increase. This is based on the argument that young workers have more human capital than older workers, thus may better diversify away equity risk with their large holdings of human capital.31
Size is another important determinant of equity allocation by ICPFs. Examining 77 Dutch pension funds during 2002-2005, Kakes (2006) finds that larger institutions invest more in equity than smaller ones, as the former tend to be less risk averse. Bikker et al. (2010) confirm that larger pension funds invest relatively more in equities compared to smaller pension funds. The positive effect of size on equity investment has also been highlighted by Bikker et al. (2012), where an increase in the number participants from 10.000 to 100.000 is associated with an increase of equity allocation by 2,5%. The authors attribute this to two reasons. First, larger funds have a more elaborated risk management function compared to smaller funds, and secondly, the largest pension funds are of the industry-wide type, and a better ability to diversify risk over time and over generations (Bikker et al., 2012).
This is dissimilar to insurers’ behaviour, according to Athearn (1960). Analysing the percentage distribution of assets by size of life insurance companies, Athearn explores the form in which assets are held by categorising the companies in six groups from giants to very small. The author finds that for insurers, the bigger the size, the less equity holding. In particular, Athearn shows that the small companies hold twice the percentage of their assets in the form of stocks as do the medium-sized companies.
However, examining the investment policies of insurance companies’ equity portfolio managers, Badrinath, Kale, and Ryan (1996) find that size plays a minor role in the investment strategy. The authors compare the characteristics of their equity holdings with those of other financial equity portfolios. They show that surprisingly, the size of
the firm, measured as the logarithm of total assets, appears to play only a small role in determining insurance company equity investment.
The characteristics of their liabilities play a major role in ICPF’s investment behaviour. As mentioned earlier, De Haan and Kakes (2011) show that life insurance companies and pension funds have a relatively long investment horizon and are therefore more likely to absorb short-term market shocks. In contrast, non-life insurers are more
sensitive to short-term price changes. The authors state that this can partially be explained by looking at who bears the investment risk at ICPFs. For unit-linked products, the policyholder is the main carrier of the investment risk. However, insurers and pension funds who are offering defined benefit schemes or products with a financial guarantee are exposed to the investment risk themselves.
The guaranteed returns offered on products (the cost of liabilities reserves incurred on their balance sheet) can also impact the behaviour of insurers towards equity investments. Analysing the portfolio behaviour of a life insurance company, Stowe (1978) presents a chance-constrained model of life insurance company portfolio choice. He examines several hypotheses derived from the model using a cross-sectional, time-series panel of 15 annual observations of 92 large US life insurers. The author finds that a higher cost of liabilities reserves are associated with less risky portfolios. Typically, life insurers are the ones offering a guaranteed interest rate to their policyholders.
Studying the potential solutions the insurance sector has in the face of Europe’s low interest rate environment, Arias et al. (2016) also examine the direct impact of the drop
31 This theory assumes a low correlation between wage growth and stock returns.

European Commission - Study on the drivers of investments in equity by insurers and pension funds
December 2019 I 51
in interest rates on the balance sheet, and on the value of insurance assets and liabilities. The authors find that the drop of interest rates results in a higher market value of the bond assets held, but also in an increase in the value of the liability commitments held by the insurer. The overall effect depends on the duration mismatch between the assets and liabilities. The larger and more positive this mismatch is, the more substantial the downward interest rate impact will be, and this will result in a reduction of the company’s economic value, as the value of liabilities will be increasing faster than that of assets. Furthermore, Arias et al. note that contract characteristics, such as guarantees, options, duration, can amplify or reduce this interest rate sensitivity and exposure to interest rate risk. These findings are corroborated by a whole strand of literature. Finally, a survey carried out by OECD (2016) reports that as a result of pressure put by the prolonged low interest rate environment on their margins, the insurance business has generally reduced its offering of products with material investment guarantees and/or substantially reduced the nature of the guarantees that remain in the existing products.
2.2.5 Accounting framework
By prescribing the principles and methods to be used in preparing financial statements and requiring them to be disclosed, the accounting framework impacts stakeholders’ perception of the performance and growth prospects of ICPFs. As such, the accounting framework can influence the investment behaviour of ICPFs.
Impairment rules can influence a financial institution’s investment behaviour. Indeed, an asset write-off is supposed to reflect an economic value decline (impairment) that causes the carrying amount of the asset in question to fall below its fair value. In relation to this, Sellhorn (2004) indicates that most GAAP (generally accepted accounting principles) allow firms a high degree of discretion and flexibility in determining the
existence, magnitude and timing of any write-offs. The author finds that where a discretionary32 asset write-off reflects management's incentives rather than the asset's actual economic obsolescence, the applicable accounting guidance introduces a measurement error into the write-off amount, which might in turn harm financial statement relevance and reliability. This in turn provides erroneous indicators to the owners of the firm, which are more likely to approve misinformed investment decisions.
In addition, changes in the accounting framework may force ICPFs to move away from certain asset classes. For example, to assess whether accounting standards influence the asset allocation of German pension funds, Barthelme et al. (2018) examine the transition from IAS 19 to IAS 19R in 2013, which altered the recognition of actuarial gains and losses. The authors analyse financial statement and asset allocation data of 90 firms listed on the Deutsche Börse over the period 2010 to 2013 and show that firms affected by the adoption of IAS 19R significantly shift their pension assets from equities into bonds. Adopting the difference-in-differences (DID) estimation technique, they compare differences in pension asset allocations between a treatment group affected by IAS 19R and an unaffected control group across the pre- and post-IAS 19R periods. The results show that on average affected firms reduce the percentage of equity investments 2,5% more than non-affected firms, while at the same time increasing their allocation into bonds by 4,6%.33
32 The author refers a write-off is as discretionary if its existence, amount, and/or timing either are not regulated explicitly under existing GAAP or are governed by rules that allow an unusually high degree of flexibility and discretion
33 Similar results have been reported by Anantharaman and Chuk (2018) for 105 Canadian pension funds over the period 2010-2012: after adoption of IAS 19R firms reduced their equity allocation by 18,2%. However, this result cannot be

European Commission - Study on the drivers of investments in equity by insurers and pension funds
December 2019 I 52
Along the same lines, Amir at al. (2010) examine whether UK companies shifted pension funds from equities to bonds as a result of changes in the accounting standards for corporates (Financial Reporting Standard 17 issued in 2000, and International Accounting Standards 19 issued in 2005).34 Using data on pension asset allocation for 250 UK companies35 over the period 2000 through 2007, their study finds that the major factors of a subsequent shift in pension asset allocation away from equities and into bonds36 are the change in the valuation method introduced by FRS 17 and IAS 19 together with increased disclosure requirements. In effect, UK companies decreased their allocation to equities by 4,6% and increased their allocations to bonds by 3,7%.
Papaioannou et al. (2013) also point to increased disclosure requirements as potentially inducing procyclicality. The authors recognise that reporting could be an important tool to clearly communicate to investors why an institution sticks to its long-term investment strategy and acts against procyclicality in times of market stress. However, the authors argue that frequent reporting reduces the investment horizon due to a stronger focus on annual or quarterly results, and thereby can induce a procyclical behaviour.
Severinson and Yermo (2012) use OECD data and argue that the introduction of fair value accounting might have led to a decrease of investments in volatile financial instruments.37 The authors describe that since 2001 pension funds in the UK, Sweden and the Netherlands have experienced a decrease in actual equity allocation. In Sweden equity allocation declined from approximately 35% in 2001 to around 13% in 2010, and
in the Netherlands from around 48% to 35% over the same period. UK pension funds’ equity allocation experienced a more significant drop from around 60% in 2001 to 30% in 2010. This derisking trend, according to the authors’ interpretation, may have been due to significant regulatory changes that took place in these countries over that period. For example, the introduction of fair value accounting for pensions (Financial Reporting Standards 17, FRS 17) in the UK in 2003, of IFRS in the EU, and of the risk-based
solvency regime (Financieel Toetsings Kader, FTK) in the Netherlands in 2007.38 Similarly, but to a lesser extent, the authors observe the derisking of German pension funds, from 12% equity allocation in 2007 to 5% in 2010. Their study finds, nevertheless, an opposite trend in Finland, with equity allocation of Finnish pension funds increasing by 20% between 2001 and 2010 (from 28% to 48% of total assets).
According to the World Economic Forum and Oliver Wyman (2011), changes in the
accounting regime of ICPFs such as mark-to-market accounting may impede their
attributed exclusively to IAS 19R alone, as other macroeconomic and financial factors could have shifted contemporaneously, thus inducing asset allocation changes.
34 At the adoption of FRS 17/IAS 19, UK companies recognised the pension surplus/deficit as an asset/liability on the balance
sheet, while actuarial gains/losses recognised immediately in other comprehensive income (shareholders’ equity). As the authors describe, these changes introduced volatility to balance sheets of UK companies, especially when pension assets are mostly invested in equity securities. In particular, reporting actual returns on pension assets injects volatility into
shareholders’ equity, while the recognised net pension asset/liability is a significant portion of a company’s book value and market capitalisation.
35 The sample contains 250 of the 350 FTSE companies that sponsor defined benefit pension plans.
36 Other factors identified are as follows: higher funding requirements; shorter investment horizons; and an increase in overall
firm risk. 37 The authors perform a review of accounting and regulatory changes and list a summary of the evidence gathered to date
on their impact on long-term investing. However, no econometric analysis is performed to analyse the evidence. 38 Under fair value accounting, insurance products and pension plans carrying any form of guarantee – such as an investment return or a benefit guarantee – are priced using market discount rates. The investment portfolio is also priced at market
values. Thus, changes in market prices can cause wide swings in solvency levels. In other words, fair valuation of assets and liabilities on a market consistent basis (i.e. fair value accounting) implies that balance sheets, annual profits and solvency
margins are more volatile and ICPFs need to anticipate this in their asset allocation decisions, product design, and overall business decisions.

European Commission - Study on the drivers of investments in equity by insurers and pension funds
December 2019 I 53
countercyclical role in the markets by forcing them to be concerned with short-term changes in market prices. As a result, the investment strategies and behaviours of these institutions may become more procyclical.
2.2.6 Tax framework
Taxation may play an important role in equity allocation of ICPFs because it impacts the return on assets and hence, the strategy of the fund manager. Brentani (2004) finds
that the investment policies of both private and institutional investors will be partially determined by their tax status. The author notes that generally, pension funds are exempt from both income and capital gains tax, and contributions to a pension scheme are not taxable. Also, pension funds have fairly long time horizons and are thus able to take on more risk. In contrast, Brentani (2004) expresses the view that investment returns of life insurance businesses are subject to both capital gains tax and income tax, and as a result, life insurance portfolio managers will adjust their investment strategies accordingly to minimise the taxes paid on their funds.
Campbell and Viceira (2005) find that typically the tax burden on assets where the return comes mostly in the form of income, such as fixed-income securities, is higher than the tax burden on assets where the return comes mostly from capital gains, such as equities.
Analysing 250 FTSE companies that sponsor Defined Benefit plans from 2000 to 2007, Amir et al. (2010) find that tax policies affect equity allocation through funding levels. In general, the tax deductibility of pension contributions induces companies to pre-fund their pension plans; hence, those who are subject to higher tax rates have greater incentives to prefund their pension plans. The authors show that companies that experienced an increase in effective tax rates shift pension assets from equities to bonds.
In relation with funding levels, Black (1980) and Tepper (1981) argue that, since returns on pension assets are not taxed, these assets should be invested in the most heavily taxed securities, presumably bonds. Their argument suggests no association between funding levels and asset allocations as all companies invest in bonds regardless of funding levels.
Another important aspect of taxation that determines equity allocation is the overall distinction between the treatment of dividends and capital gains. In most countries, both capital gains and dividends have a unique treatment in the tax code such that tax efficiency can be the determining factor in asset allocation to equity. However, the more dividends are taxed, the lower the effective returns on equity investments, which makes
equity investments less attractive compared to other asset classes. BoE (2014) documents that changes to taxation of dividends in 1997 made UK equities less attractive as it removed a 20% tax credit for pension funds on dividends they received from equity investments.
Distortive tax effects under different tax regimes with capital gains taxation have also been identified analytically by König and Wosnitza (2000). Using Gordon’s growth model
to compare the tax system with and without capital gains taxation, the authors showed that capital gains taxation distorts price formation on the stock market due to temporary double taxation. This then leads to a discrimination of equity investments against debt capital, rendering the funding of businesses more difficult.

European Commission - Study on the drivers of investments in equity by insurers and pension funds
December 2019 I 54
3 Methodology
This chapter provides information on the various quantitative and qualitative research methods used in the study. The chapter starts by describing the steps performed for gathering input for the analyses. These steps include a literature review, data collection, compiling equity investment lists for ICPFs, the production of country factsheets, conducting interviews and other stakeholder consultations. Following this, detailed information on the econometric and theoretical models is given. All the information from these qualitative and quantitative research methods is then synthesised using a triangulation method. Finally, this chapter also discusses the main limitations to the analyses.
3.1 Literature review
As part of this study, a thorough literature review is performed to identify and assess
the importance of the potential drivers for equity investments by insurance companies and defined benefit pension funds.
The review covers a wide range of publicly available sources, including, papers, studies and reports published by academics, international organisations, policy-makers and supervisory authorities, industry and consumer associations, consultancies, and think tanks.
The literature review is presented in Section 2.2 and informs the assessment of the drivers for investments in equity by both insurance companies in Section 4.3 and defined benefit pension funds in Section 5.3.

European Commission - Study on the drivers of investments in equity by insurers and pension funds
December 2019 I 55
3.2 Data collection
Data on equity investments for insurance companies and pension funds are gathered from EIOPA, ECB, NSAs, SFCRs and financial statements. The various sources are combined to obtain a comprehensive view on the equity investments by insurance companies (unit-linked and non-unit-linked) and defined benefit pension funds.
EIOPA publishes data on the insurance companies under Solvency I and Solvency II,
and on occupational pension funds. The Solvency I dataset covers both the assets and liabilities of the insurance companies at an individual and group level. These data cover both unit-linked and non-unit linked investments by insurers of the European Economic Area (EEA) countries from 2005 to 2015. Due to its historical coverage and separate distinction for unit-linked investments, this dataset is used for the trend analyses part related to this category.
The Solvency II dataset also covers both the assets and liabilities of insurance companies. The dataset is published quarterly since Solvency II entered into force on 1 January 2016. Data under Solvency II are substantially more granular than they were under Solvency I. In this study, Solvency II data from 2016 Q3 to 2018 Q1 are used, more specifically from Solvency II Market Value Balance Sheet (S.02.01) and Solvency II Exposure List (S.06.02). The Solvency II Balance Sheet (S.02.01) follows the legal nature of the assets in terms of classification, which can differ from the exposures
reporting. The exposure list, on the other hand, provides further information on the asset classes in the balance sheet. Therefore, the exposure list is used to present the more detailed view of the distribution of equity investments across equity types.
The EIOPA Occupational Pension Funds dataset covers the aggregate assets and liabilities of DB, DC and hybrid scheme occupational pension funds. The dataset covers the period from 2004 to 2017 for 23 Member States.39 This dataset is used in Chapter 5 along with the equity lists, described in Section 3.3, and pension fund specific datasets, from De Nederlandsche Bank and the Office for National Statistics of which the features are described in Chapter 5.
The ECB provides the Quarterly Sectoral Accounts (QSA) dataset regarding the national insurance markets40 of the EU Member States (excluding the United Kingdom) as a part
of the National Financial Accounts (NFA) database. The dataset is compiled from data collected by the national authorities in accordance with the European Accounting Standards (ESA) 2010 guidelines.41 The dataset includes the aggregate financial assets and liabilities of insurance companies in the different Member States.
The QSA datasets are intended to represent all activities in a sector of a Member State using a host-based approach. Therefore, even if the data collected through national
sources do not cover 100% of a sector (e.g. a case in which only 95% of the insurance
39 There are no data available for Cyprus, Czech Republic, Estonia, France, and Lithuania in the EIOPA Occupational Pension
Funds dataset. 40 The ECB Statistical Data Warehouse (SDW) database provides two other datasets for the insurance corporations and pension funds. The first one is the Insurance Corporations & Pension Funds (ICPFs) dataset and the second one is Insurance
Corporations Assets and Liabilities (ICB) dataset. The former does not include equity exposures as an individual reporting item while ICB series started after Solvency II so its historical coverage is limited. Therefore, the QSA dataset is used for the
(historical) analyses. 41 The collected data go through internal quality and consistency checks and if needed, as a complementary step to the initial data collection process, questions can be sent to the national data providers in order to get explanations for unexpected values in the collected data.

European Commission - Study on the drivers of investments in equity by insurers and pension funds
December 2019 I 56
companies in an economy reports data), the collected data pass through statistical procedures to get estimates for the whole sector. In the case of the QSA dataset for the insurance markets, the data from the ECB are assumed to cover all insurance activities in a given Member State.
The ECB dataset covers the period from 1998 to 201742, but only for a few countries a full data history for all 19 years is available. Furthermore, the dataset is not as granular as the EIOPA Solvency II dataset. For instance, a distinction for unit-linked investments is not available, neither is a distinction for indirect equity investments. Nevertheless, because of the long historical coverage and data consistency, the ECB dataset is used for the trends analysis and econometric analyses.
The study mostly uses data at the individual level. There are several reasons for this selection. First, the ECB QSA dataset that is used in the historical trends and econometric analyses is provided at the individual level. Secondly, the structure of groups changes over time, for instance with mergers and acquisitions, making it difficult to have comparable data over a long period. Thirdly, local insurance market characteristics are reflected at the individual level. For instance, taxation policies in Europe are set at a national level, and therefore their effects are best captured on individual data rather than groups that have cross-border activities.
In the cases where group level data are needed, Solvency and Financial Condition Reports (SFCRs) of insurance companies are used as supporting data sources. The SFCRs of the 20 largest insurance groups that represent 46,1% of investments in the EU were collected for year-end 2017. The collected data are used in the discussions of the accounting framework as a potential driver of equity investments. Similarly, the SFCRs of the interviewed insurance companies are used to verify the information provided in the interviews.
In addition to the international data sources, a number of national data sources for both insurance companies and pension funds are used. One example of the data used from the national sources is the data received from the NSA survey, which is described in Section 3.4. Another example is the extension of the ECB data for Denmark with the quarterly equity data from the Danmarks Nationalbank.
Besides the data sources described above, various other sources were initially considered for the study. For instance, the ECB Statistical Data Warehouse also provides data on the pension funds markets. However, this dataset does not contain a split of the occupational pension fund data and share of defined benefit schemes. Thus, the ECB QSA data for pension funds was not used in the analyses in the study. Similarly, the OECD Insurance Statistics database provides data on the insurance markets of the EU
Member States that are OECD members. However, descriptions of the data series have changed as of 2009 with respect to the breakdown of business type and unit-linked products. A further change in the data series was implemented starting from the 2016 data to present investment allocation in detail. Due to these changes during the time span that is aimed to cover in the study, this dataset is not used.
The data collected for equity investments are used for both insurance companies and
pension funds throughout the study, but primarily to describe the current state of play, the trend analysis and econometric analysis.
42 At the time of the data collection from ECB, the data for 2018 Q1 were also available so it is used in the analyses of the study when possible, for instance in the econometric analyses.

European Commission - Study on the drivers of investments in equity by insurers and pension funds
December 2019 I 57
3.3 Equity lists
The level of detail on equity investments that can be obtained from EIOPA, ECB and NSAs is roughly limited to direct equity vs. indirect equity investments, listed equity vs. unlisted equity and domestic equity vs. foreign equity. In addition, as described in Section 3.5, the interviewed insurance companies and defined benefit pension funds were asked to provide information for several other classifications, including company size (SMEs vs. large enterprises), participation (active vs. passive) and sectors (financial corporations, real estate, other sectors). However, most of the insurers and defined
benefit pension funds did not provide the information on the other classifications. They indicated that they traditionally do not collect the information on these alternative classifications.
In order to obtain a view on other distributions across other classifications an additional data collection exercise was undertaken based on investments in listed companies that defined benefit pension funds undertake. This analysis was conducted for the defined benefit pension funds, who publish this information, unlike insurance companies. The analysis focuses on defined benefit pension funds in the Netherlands and the United Kingdom, which together represent more than 80% of the total investments of EU defined benefit pension funds. The Dutch pension funds are relatively concentrated, which means that with information on a relatively small number of large pension funds in the Netherlands (and to a lesser extent UK) a substantial part of the EU investments of defined benefit pension funds are covered.
In both the Netherlands and the United Kingdom, some of the pension funds provide an overview of the listed companies in which they invest. The format of the overviews differs across pension funds. The lists provide at least the name of all or the largest investments (e.g. top 25 in terms of investments). For some of the pension funds, these are complemented by information on the market value of the investments, country of origin and main sector in which the listed companies are active. For our analysis, we only consider those defined benefit pension funds that provide both the name of the listed company and amount of investments for all companies they invest in. This is the minimum information required for the other classifications.
In total nine defined benefit pension funds have been included in the sample. This
includes six of the largest pension funds from the Netherlands and three defined benefit pension funds from the United Kingdom. The six pension funds from the Netherlands43 are responsible for approximately 59% of the total Dutch pension fund investments at the risk of the fund (60%) and policy holders (2%), while the three pension funds from the United Kingdom44 represent approximately 4% of the British pension assets. The latest available overviews have been obtained during the course of January 2019 from the websites of the defined benefit pension funds. Most of the overviews provide information on the equity investments as of 30 June 2018. For some, however, the information is for 31 December 2017, 31 March 2018 or 30 September 2018.
The information on the investments in listed companies obtained from the pension funds has been enriched with information from other sources on these listed companies. This information has been retrieved from the websites of the stock exchanges, for data as per 30 June 2018, or before depending on the most recent available date. The data
obtained from the exchanges includes information on the exchange on which the share
43 The included pension funds are ABP, bpfBOUW, Pensioenfonds van de Metalektro, Pensionfonds Metaal & Techniek, SPW
and Zorg en Welzijn. 44 The included pension funds are Strathclyde Pension Fund, West Yorkshire Pension Fund and Greater Manchester Pension Fund.

European Commission - Study on the drivers of investments in equity by insurers and pension funds
December 2019 I 58
is traded, as well as the country of origin, main sector of activity and market value of the listed companies. The information obtained from the stock exchanges allows us to define for each of the listed companies; the company size, sector and participation.
The company size is based on the market value of the listed company. SMEs or micro-caps have been defined as companies with a market capitalisation of less than 200 million EUR. The SME definition is in line with the EU definition for SMEs in the context of capital markets as defined in the markets in financial instruments Directive (MIFID II - 2014/65/EU), but deviates from the common definition for SMEs. The latter defines an SME as an enterprise with less than 50 employees and a turnover of 50 million EUR or less or a balance sheet total of 50 million EUR or less (2003/361/EU). Besides SMEs, the company size categories include other size categories that are generally used by European fund managers: small-caps (less than 1 billion EUR market capitalisation), mid-caps (between 1 and 5 billion EUR) and large-caps (5 billion EUR or more).
The sector classification is in line with the widely used NACE sectoral classification, which allows us to get an understanding of the level of investments across sectors, including financial, insurance and real estate activities, as well as the level of investments of other non-financial sectors.
The participation classification assumes that pension funds become more active when
they have a larger stake in a listed company, i.e. the individual pension funds shareholding as share of the total outstanding shares of the listed company. This assumption is based on the notion that shareholders’ rights and obligations rise with the increase in shareholdings. We distinguish between four different types based on the notification threshold for substantial holdings applied in most EU Member States: non-substantial holding (less than 5%), minority holding (between 5% and 25%), partner holding (between 25% and 50%) and linked holding (more than 50%).
The results from the analysis of the equity lists are presented in Section 5.1 on the current status of equity investments of defined benefit pension funds.

European Commission - Study on the drivers of investments in equity by insurers and pension funds
December 2019 I 59
3.4 Country factsheets
Country factsheets are prepared for a comparative analysis of the EU insurance and pension funds markets. The factsheets for the insurance markets cover 28 EU Member States, the United States, Switzerland and Japan. The inclusion of three non-EU Member States allows for a comparison of the EU markets with other large global insurance markets. The factsheets for the defined benefit pension funds markets cover Belgium, Germany, Ireland, the Netherlands and the United Kingdom.
Each factsheet provides a general description of the respective insurance or pension fund market. More specifically, the factsheets provide information on the equity investments, balance sheets, products, accounting and tax frameworks. For each of these items, the most recent situations as well as the historical trends are provided to the extent that data are available.
The datasets of EIOPA and ECB formed the main sources for the country factsheets. These are complemented with national sources such as the national insurance associations, statistics offices and central banks. For instance, data from Fédération Française de l’Assurance (FFA) and Gesamtverband der Deutschen Versicherungswirtschaft (GDV) are used to describe the insurance products in the factsheets of France and Germany respectively.
In addition, a survey was conducted among the National Supervisory Authorities (NSAs) responsible for insurance and pension fund supervision in the selected countries. The survey consisted of two phases. In the first phase, the NSAs were asked to provide information on the equity investments in their respective countries. The NSAs of the 28 Member States and three non-EU countries were asked to provide data. NSAs provided data on a ‘best effort basis’ in terms of time horizon and the level of granularity. The amount of relevant data gathered or received varies across Member States, with some countries providing more granular data and/or covering a longer time period than others. The collected data are then used where relevant in the factsheets. For instance, the data gathered from the NSAs could be used to enrich the historical data of the unit-linked products in Member States.
In a second phase, the NSAs were provided the opportunity to validate the findings in
the country factsheets. Comments received from the NSAs were integrated into the factsheets.
The country factsheets form a separate Annex to this study. They are primarily used in the assessment of the drivers of investments in equity for both insurance companies in Section 4.3 and defined benefit pension funds in Section 5.3.

European Commission - Study on the drivers of investments in equity by insurers and pension funds
December 2019 I 60
3.5 Interviews
Interviews with insurance companies and pension funds aim to better understand the drivers that influence their equity investments. The objective of the interviews is to rank the list of drivers of equity investments identified through the literature review, but also to reveal other possible drivers, which are potentially not captured by the market-wide data analysis and literature study. Finally, the interviews intend to obtain more granular information on the equity investments and other investments by the insurance companies and pension funds.
First, a sample of insurance companies and pension funds is selected in the EU and in a number of third-countries, namely Japan, Switzerland and the United States. To ensure that this sample of insurance companies and pension funds allows for the validation of the main drivers of equity investments and is representative for the EU, as a whole, and the national markets, several criteria are used to compose the sample. The sample of insurance companies should:
Cover a substantial share of the investments of the insurance companies in the selected Member States, to be representative for the entire market;
Contain both smaller and larger insurance companies to be able to capture characteristics that might be size-dependent (home bias, proportion of equity investments, etc.);
Have both users of the standard formula and internal models to capture the main approaches for the calculation of their solvency requirements;
Cover different types of activities to detect differences and capture characteristics that are activity-dependent (life, non-life, etc.);
Cover various EU Member States to address the impact of national specificities (investment mandates, consumer protection rules, etc.);
Cover countries outside the EU with a (potential) interest in investing in the EU to detect the drivers that affect their equity investments in the EU (regulation [e.g. local, equivalence], taxation, capital controls, etc.).
The objective of the pension fund selection process for the defined benefit pension funds is similar to that of the insurance companies, but leaves less room for differentiation in size and activities as the sample size is substantially smaller. Therefore, only two criteria are used to compose this sample. The sample for pension funds should:
Cover a substantial share of the investments of the defined benefit pension funds in the selected Member States to be representative for the entire market;
Include pension funds from various EU Member States to address the impact of national specificities (investment mandates, consumer protection rules, etc.).
The potential interviewees are contacted through the Deloitte and CEPS network, which covers all large EU and global insurance companies and defined benefit pension funds, and a significant share of the smaller institutions. If the request for an interview was declined by the institution, it was replaced by a similar institution.
The interviews were conducted with 32 different insurance companies and 5 pension funds. Most of the interviewed insurance companies (26) are located in one of the 14
EU Member States covered in the sample: Belgium, Finland, France, Germany, Greece, Ireland, Italy, Luxembourg, the Netherlands, Poland, Portugal, Spain, Sweden and the United Kingdom. The remaining six insurance companies are located in Japan, Switzerland and the United States. In the sample of European insurers, there are 30

European Commission - Study on the drivers of investments in equity by insurers and pension funds
December 2019 I 61
traditional insurance companies and 2 reinsurance companies. The Solvency ratio of the insurance companies in the sample varies between 140% and 403%.
Table 2 – Profile of interviewed insurance companies and pension funds
Category Insurance companies Defined benefit pension funds
Number of institutions 32
(EU [26 institutions] and non-EU [6])
5
(EU [5])
Country of origin
Belgium (2), Finland (1), France (4), Germany (3), Greece (1), Ireland (1), Italy (2), Luxembourg (1), the Netherlands (1),
Poland (2), Portugal (2), Spain (2), Sweden (1), United
Kingdom (3), Japan (2), Switzerland (2) and United States (2).
Belgium (1), the Netherlands (1) and pan-European (3)
Coverage
(interviewees with EU origin only, end-2017)
2.298 billion EUR total assets
(approximately 20% of EU total insurance assets)
51 billion EUR total assets
(approximately 3% of EU defined benefit occupational pension funds assets)
Type of institution Insurance companies (30) and Reinsurance companies (2) N/A
Accounting framework IFRS (12), Local GAAP (8), IFRS & Local GAAP (10), no data
provided (2) Local GAAP (6)
Portfolios 50
(EU [44] and non-EU [6])
11
(EU [10] and non-EU [1])
Type of activities EU: Life (22 portfolios), Non-life (13), Composite (6), Other
(3) Non-EU: Life (3 portfolios), Non-life (1), Composite (2)
N/A
Consolidation EU: Group (1 portfolios) and Individual (43)
Non-EU: Group (3 portfolios) and Individual (3) N/A
Solvency
EU: Standard formula (31), Internal model (6) and Partial
internal model (7) Non-EU: Internal Model (4)
N/A
Source: Deloitte-CEPS analysis
The EU insurance companies, part of the sample, represent 2.298 billion EUR in total assets or about 20% of the European insurance market at the end of 2017. Since they did not provide data for all their portfolios, the sample covers less in portfolio data (2.071 billion EUR). The insurance companies provided information on 50 portfolios, 44
EU and 6 non-EU, of which at least 5 back personal pension products.45 The portfolios of the non-EU insurance companies together represent 1.520 billion EUR in assets. The portfolios in most cases represent different types of insurance activities, for example life and/or non-life insurance activities.
Overall, the majority of the insurance companies interviewed offer both life and non-life
insurance products (20 out of 32 insurance companies). However, five EU insurance companies and two non-EU insurance companies are purely life insurance companies. Whereas, two EU insurance companies and one non-EU insurance company are classified as purely non-life. Looking at the portfolios, the sample for EU portfolios includes, 2 life portfolios, 13 non-life portfolios, 6 composite portfolios and 3 classified as other by the insurance companies. For the non-EU portfolios, the sample includes three life portfolios, one non-life portfolio and two composite portfolios.
The insurance companies primarily report solo-level data, with one European insurance company and three non-European insurance companies reporting data at group-level. Moreover, most of the insurance companies apply standard formula for the calculation of their Solvency ratio calculations (for 31 out of 44 European insurance portfolios). The remaining insurance companies use either an internal or partial internal model. When comparing the European insurance companies in terms of portfolio size based on applied method for calculating the Solvency Capital Ratio, we find that companies using the standard formula represent 40,2% of the total portfolio assets of the sampled insurers, whereas insurers using an internal model or partial internal model represent respectively
45 Not all insurance companies provided data at a portfolio level.

European Commission - Study on the drivers of investments in equity by insurers and pension funds
December 2019 I 62
26% and 33,7% of the total portfolio assets of the sampled insurers. Four non-EU insurance companies indicate using internal models for their solvency calculations.
The pension funds interviews were conducted with five defined benefit pension funds.
Two are conventional occupational pension funds based in Belgium and the Netherlands, and the other three pension funds are pan-European pension funds. The latter have members in Belgium, Cyprus, Ireland, the Netherlands, Spain and Switzerland. The pension funds together provided 51 billion EUR in portfolio data, representing approximately 3% of the total EU defined benefit occupational pension funds market.
The interviews were conducted between October 2018 and March 2019 via phone or conference call; a limited number of interviews was performed face-to-face. The interviews were conducted in English or the native language of the interviewees.46
The interview consists of two parts, a semi-structured qualitative part with some
quantitative elements to assess the drivers and a structured quantitative part to get better insights into the equity investments. The structured format of the quantitative part contributes to obtaining comparable data for all portfolios in the sample. By preference, the response to the quantitative part of the interview was completed prior to the interview, so that the interview itself could be used to verify the accuracy of the data provided. In turn, the qualitative part of the interview was mostly semi-structured, allowing for a deeper insight into the drivers that are considered most important for the investments in equity by the insurance companies and defined benefit pension funds. To identify the most important drivers interviewees were asked to rate a list of pre-generated potential drivers before the interview.
This part of the interviews focuses on the potential drivers includes a quantitative element, as each of the potential drivers is given a score between 0 and 100, with 0
meaning not relevant at all and 100 meaning that the driver is of high importance. In the analysis these scores are normalised to improve the comparability. The scores, provided by insurance companies or pension funds, are then analysed and compared across business models, geographical origins and solvency calibration (standard formula vs. internal model users). The interviewees have the possibility to add additional drivers to the list of potential drivers to reduce the risk that potentially important drivers remain undetected.
The quantitative part of the interviews was ultimately of limited use to the analysis, as only a very limited number of insurance companies and pension funds were able to provide more granular information on equity investments and longer time-series than already published (see also discussion on limitations in Section 3.10).
The interviews contribute specifically to the assessment of the drivers for equity investments of both insurance companies in Section 4.3 and defined benefit pension funds in Section 5.3.
46 Several interviews were conducted in Dutch, namely for the Belgian and Dutch insurers and pension funds in the sample, and in French, for several French insurers in the sample.

European Commission - Study on the drivers of investments in equity by insurers and pension funds
December 2019 I 63
3.6 Other stakeholder consultations
During the course of the study, Deloitte-CEPS submitted additional data related requests to EIOPA and ECB to get additional data on the EU insurance and occupational pension funds markets and a better understanding of their datasets.
The requests to EIOPA were submitted in two main batches. The first submission requested data on a summary of assets by activities, duration of technical provisions,
projection of future cash flows by business type and SCR with its underlying components. The second submission focused on the investment class of participations and their distribution over listed equity, unlisted equity, direct equity exposure and indirect equity exposures. When relevant, data received from EIOPA are used in the discussions of the trends and drivers of equity investments of insurers.
Directorate General Statistics of the ECB was consulted to clarify various issues related
to the data on the EU insurance markets.
The other stakeholder consultations primarily contributed to the data collection, which is used in reviewing the current status, trends and econometric modelling for both insurance companies and pension funds.

European Commission - Study on the drivers of investments in equity by insurers and pension funds
December 2019 I 64
3.7 Econometric model
The econometric analyses assess the importance of the six driver categories on various types of equity investments. For both insurance companies and pension funds a base model is defined, which is extended with specifications for each of the driver categories (market conditions, ALM, prudential framework, undertaking characteristics, accounting framework and taxation).
3.7.1 Dependent variables47
The study aims to assess the drivers of investments in various types of equity (see Section 2.1). The types of equity explained as dependent variables for the econometric analyses are aligned between insurance and defined benefit pension funds markets to the extent that different data sources allow.
The econometric models for the insurance markets use investments in total equity as well as listed and unlisted equity48 as dependent variables. Both the absolute amounts, relative amounts (share of total investments) and price-adjusted amounts are considered. In total, seven dependent variables are defined: three variables for the listed equity, two variables for unlisted equity and two variables for total equity.
For the price adjusted listed equity variable, a weighted equity index is used. The need for such an index stems from the fact that the equity investments can be made in different countries and the exact allocation of the equities across countries is not provided. Therefore, a weighted equity index is constructed based on the weighted average of ten indices.49 This is similar to the construction of an equity index used for symmetric adjustment, which is known as the EIOPA Equity Dampener (EIOPA, 2015a).
In the case of pension funds, two regression analyses are carried out. In the first regression analysis, we use equity investments at country level. In this macro panel analysis of the DB pension funds, we use the EIOPA Occupational Pension Funds dataset. Within the data for investment assets, data are available for equity investments in ‘Equity and other variable-yield securities (excluding UCITS)’ and ‘UCITS’. Under the first category, data for listed equity investments are available, while within UCITS, ‘Equity securities’ are only given for a limited number of observations and countries.
The category ‘Equity and other variable-yield securities (excluding UCITS)’ is taken as total equity investments of the pension funds in a Member State, while the investments in total equity, other than listed equity investments, are considered as ‘unlisted equity’, in line with the variables used in the regressions for the insurers.
Similar to the case of the insurers, these equity investment series are used to create
seven dependent variables. However, for the case of pension funds, data are more limited and due to lack of desired data fields, we make assumptions in order to create data series for unlisted equity and total equity. Therefore, the results obtained with
47 Data used for the potential drivers (i.e. independent variables) in the econometric analysis come from different sources such as ECB, EUROSTAT, FRED and EIOPA. A detailed description of the data sources for potential drivers is given in Annex 1
and Annex 2. 48 Equity data used for the insurance markets come from the ECB QSA dataset. In this dataset, we observe that there were re-classifications in some countries between other equity and unlisted equity. When taken together, unlisted equity and other
equity gives a more consistent series for equity that is not listed. Therefore, unlisted equity and other equity as obtained from the ECB dataset are used as a variable for unlisted equity in this study.
49 Namely, AEX, CAC 40, GDAX, FTSE All-Share Index, FTSE MIB Index, IBEX 35, Nikkei 225, OMX 30, S&P 500 and SMI. The weighted equity index is indexed to 100 at the beginning of the available ECB QSA dataset history.

European Commission - Study on the drivers of investments in equity by insurers and pension funds
December 2019 I 65
these equity types may be biased compared to the ones obtained with listed equity variables.
In the macro panel analysis for pension funds, only Member States in which the size of
the DB pension funds is more than 70% are considered. Further, the number of countries is also limited by the availability of data for equity investments. For instance, according to the 2017 data, the share of DB schemes in Denmark is 100%. However, data for the listed equity investments do not exist.50 The final set of Member States for the macro panel analysis of pension funds include Belgium, Germany, Ireland, the Netherlands, Portugal and the United Kingdom.
In the second regression analysis for pension funds, we use pension fund specific
datasets from De Nederlandsche Bank (DNB) for the Dutch market. DNB provides two unique datasets that include individual pension fund data. The first dataset reports yearly information such as the number of members of pension funds, amounts paid by the members, and ratio of corporate funding for the period between 2014 and 2017. The second dataset includes data on the investments and funding ratios of pension funds on a quarterly basis for the period between 2015 Q1 and 2018 Q3. These two datasets are combined and merged with the quarterly macroeconomic data for the Netherlands51 in order to test hypotheses on the relation between the funding ratio of pension funds and financial strength of the corporates that support them. The analysis is included in Subsection 5.3.3 where we discuss prudential framework as a potential driver of equity investments of pension funds.
A distinction for the types of equity investments is not available in the DNB datasets used in the analysis. Therefore, the analysis uses total equity investments as the dependent variable.
3.7.2 Base model and driver categories
To assess the impact of the potential drivers on the investments in equity, a base model plus specifications are defined for each of the driver categories.
The potential drivers included in the base model were selected based on the existing
literature and the frequency with which they are discussed. The base model aims to be consistent in the specifications for both insurers and pension funds. Therefore, the base model contains market returns and economic conditions. The exact specifications are given in Subsection 4.3.1, where market conditions are discussed as potential drivers of equity investments.
The base model is then extended with specifications for each of the driver categories.
For instance, for the analysis of accounting framework as a driver, the base model is extended to include a dummy variable for IFRS. In the same manner, for the analysis of the prudential framework as a driver, the introduction of Solvency II is included, and for the analysis of the tax regime as a driver, the base model is extended to include the tax-on-capital to GDP ratio as an independent variable in the model. Even though dummy variables are widely used in policy analysis, it is difficult to deal with multiple
50 As explained above, listed equity investments is the most reliable data field within the equity investment fields. Therefore,
availability of data for listed equity is set as one of the criteria of the selection of countries. 51 Models with macroeconomic variables are used for robustness check.

European Commission - Study on the drivers of investments in equity by insurers and pension funds
December 2019 I 66
policy changes and to find a meaningful interaction term in practice. Regression results in our analyses should be interpreted within these limitations of dummy variables.
Finally, a full model with all variables of both the base model and specifications for the
driver categories is estimated. This full model allows to check the robustness of the results of the base model and specifications for the driver categories. All models, including the full model, are estimated for all seven dependent variables and types of equity defined above. This allows us to check both robustness within a specific model as well as the robustness across various types of equity.
3.7.3 Econometric model selection and specification
In line with the econometric model selection and specification cycle, a Pooled OLS model is used first for each of the dependent variables specified in the previous subsection. Next, using the same variables, alternatives of the Pooled OLS model are specified, which are Fixed Effects (FE) and Random Effects (RE) models.
For all equity investment variables for insurers and pension funds, the modelling cycle thus starts by specifying the pooled OLS, FE, and RE models for the full sample. Then, F-statistics for the country-specific variables in the FE model are calculated, and used to choose between the Pooled OLS and FE model52; a Hausman test is used to choose
between FE and RE models.53 After the model selection, the chosen model is diagnosed and adjustments are made to the model based on the diagnostic test results, for instance, using robust standards errors if necessary.
In comparison to the Pooled OLS model, FE models include country-specific variables that are assumed to capture time-invariant unobserved country-specific features. In the case of our study, these models are expected to capture the relationship between the equity investment variables and features that are not explicitly included in the models, but also that do not change over time, such as the specific business culture or legal precedents in a Member State.
According to our model specification tests, most of the analyses in the study should use an FE model. However, for the analysis of the individual pension funds data, the tests suggest a Pooled OLS model.
The econometric models contribute to the assessment of the drivers of investments in equity of both insurance companies (in Section 4.3) and defined benefit pension funds (in Section 5.3).
52 If the F-statistic for the country-specific coefficients is statistically significant, then an FE model should be preferred over
Pooled OLS. 53 The Hausman test is an overidentification test. If the Hausman test statistics is statistically significant, an FE model should be preferred over an RE model.

European Commission - Study on the drivers of investments in equity by insurers and pension funds
December 2019 I 67
3.8 Theoretical model
Besides the econometric analyses, a theoretical model of a life insurance company is also developed for the study to better understand the impact of various driver categories on equity investments. The theoretical model is a substantial simplification of reality, but it nevertheless allows us to illustrate some of the findings of the empirical analyses of various specific drivers, including the prudential framework (SCR treatment of equity investments under Solvency II), undertaking characteristics (internal rate of return on own funds), accounting framework (accounting treatment of equity investments) and tax framework.
The model considers a 20-year horizon from 1998 until 2017. At the start of the projection period a share capital of 4 million EUR is assumed. An initial premium income of 2 million EUR is included on an annual indexed basis for a single premium life insurance product, including a guaranteed interest rate for a period of 20 years and pay-out occurs at maturity date after 20 years (more detailed information is included in Annex 4).
The investment allocation used in the model is relatively simple. The investment portfolio includes equity, bonds and cash. The level of equity investments varies between 0% and 30% depending on the scenario. The range is based on the actual levels of investments in equity across the EU countries at year-end 2017, as observed in the country factsheets.
The share invested in equity is split over three types of equity:54
Type 155 or Type 256 strategic equity57: 15% of total investments in equity; Type 1 non-strategic equity: 55% of total investments in equity; Type 2 equity: 30% of total investments in equity.
For the returns on investments in equity, two options can be used: (i) a fixed yield of 7,0% for Type 1 equity and 9,0% for Type 2 equity, or (ii) a yield based on the weighted equity index (as explained in Section 3.7 Econometric model). The percentages used for the fixed yield are based on the information from CEIOPS’ advice on the equity risk sub-module, where mean returns are determined for the MSCI indices. The MSCI Europe
54 The allocation percentages applied between the different types of equity is based upon judgment and the observations made of the available data. We hereby refer to the information included in Subsection 4.3.3. Prudential Framework. 55 Type 1 equity is equity listed in regulated markets in countries which are member of the EEA or the OECD according to the Solvency II Directive (2009/138/EC).
56 Type 2 equity includes equity listed in countries which are not members of the EEA or OECD, unlisted equity, and private
equity, hedge funds and other alternative equity investments according to the Solvency II Directive (2009/138/EC). 57 Strategic equity investments are according to Article 171 of the Solvency II Directive (2009/138/EC) defined as equity investments for which the participating (re)insurance undertakings demonstrate that:
the value of the equity investments is likely to be materially less volatile for the following 12 months than the value
of other equities over the same period due to both the nature of the investment and the influence exercised by the participating undertaking in the related undertaking; and,
the nature of the investment is strategic, taking into account all relevant factors, including: (i) the existence of a clear decisive strategy to continue holding the participation for long period;
(ii) the consistency of the strategy referred to in the former point with the main policies guiding or limiting the actions of the undertaking;
(iii) the participating undertaking’s ability to continue holding the participation in the related undertaking; (iv) the existence of a durable link;
(v) where the (re)insurance participating company is part of a group, the consistency of such strategy with the main policies guiding or limiting the actions of the group.

European Commission - Study on the drivers of investments in equity by insurers and pension funds
December 2019 I 68
yields an average return of 7,1%.58 For the return on Type 2 equities, very limited information is available, however since Type 2 equity is riskier than Type 1 equity, a higher average return of 9% is assumed.
Furthermore, 8% of the portfolio is held in cash, which is used to pay corporate taxes. For the tax rate on equity investments, we consider two possible options regarding tax exemption: (i) a complete tax exemption of losses, gains and dividends through a tax rate of 0%, or (ii) no tax exemption and a tax rate of 25%. The other (non-equity) components are taxed at 25%. The tax rate was chosen based on EIOPA’s final report on the Public Consultation No. 17/004, indicating that the average tax rate in the EEA was 26,6%, ranging from as low as 10% to as high as 35%.
The remainder of the investments are equally split between government and corporate bonds. The investments in government bonds are discounted using discount factors based on the spot rates and a spread of 0,4%. For the spot rates, we use the EURIBOR rates between 2000 and 2013 (1998 and 1999 equal to 2000) and the EIOPA risk-free rate between 2014 and 2017. The interest rate shocks are applied according to the EIOPA Solvency II framework. The same methodology is used for corporate bonds, albeit with a spread of 1% (more detailed information is provided in Annex 4).
The SCR calculation applied within the model is based on the standard formula within
the Solvency II framework. For the SCR equity risk, a capital charge of 39% with a symmetric adjustment is applied for the Type 1 equity, while a capital charge of 49% is applied to the Type 2 equity, with the same symmetric adjustment. The strategic participations and duration-based equity are subject to a shock of 22%. The symmetric adjustment is in accordance with the Solvency II regulation and takes into account market volatility over the projected horizon.
For the scenario analysis, we use the following base case scenario: 10% equity investments at year-end 2017, a tax rate of 25% and a fixed yield return of 7,0% on Type 1 equities and 9,0% on Type 2 equities. The impact of investing 1% more in one of the three equity types opposed to government bonds is checked.
The theoretical model contributes to the assessment of the impact of the prudential
regime, accounting framework and tax framework on the investments in equity by insurance companies in Section 4.3.
58 Source: https://eiopa.europa.eu/CEIOPS-Archive/Documents/Advices/CEIOPS-L2-Advice-Design-and-calibration-of-the-equity-risk-sub-module.pdf

European Commission - Study on the drivers of investments in equity by insurers and pension funds
December 2019 I 69
3.9 Triangulation
Triangulation is a useful approach to cross-examine and synthesise evidence, and to avoid potential biases that can arise from using a single method, observer and theory studies. In this study, the gathered information and data were triangulated in the following ways:
Triangulation of the qualitative and quantitative evidence gathered from the literature review, country factsheets, interviews, other stakeholder
consultations, data collection, equity lists, econometric model and theoretical model;
Triangulation of information collected by different researchers, and through regular team briefing/de-briefing sessions; and
Methodological synthesis/triangulation of evidence gathered.
Conceptually, this approach can be summarised as follows:
Figure 2 – Identification process of the most relevant drivers
Source: Deloitte-CEPS elaborations
The initial set of specific drivers was identified based on an extensive literature review.
These drivers were then assessed further, combining the evidence obtained from the various methods including the country factsheets, the interviews, other stakeholder consultations, the data collection, the econometric model, and the theoretical model. Importantly, the methods used to determine whether driver categories affect the investments in equity differ across drivers as well as between insurance companies and defined benefit pension funds (see sections above on each of the methods).
The triangulation is used for the analysis of the drivers of investments in equity of
insurance companies in Section 4.3 and defined benefit pension funds in Section 5.3. In order to rank the possible drivers as part of the triangulation method, all available results from the different methods are combined. Most weight is assigned to the regression results from the econometric model, followed by the results from the literature review, and then followed by the information collected through the interviews, and insights gained through the theoretical model. Weights are assigned in line with a number of the limitations discussed below. The remaining methods (e.g. other
Literature
review
Equity
lists
Data collection
Data analysis
Information collection
Information analysis
Most relevant drivers of equity investments
Data
collection
Triangulation
Country
factsheets Interviews
Other
stakeholder consultations
Econometric
model
Theoretical
model

European Commission - Study on the drivers of investments in equity by insurers and pension funds
December 2019 I 70
stakeholder consultations) are added as a qualitative layer to challenge the ultimate ranking whenever relevant.

European Commission - Study on the drivers of investments in equity by insurers and pension funds
December 2019 I 71
3.10 Limitations
In our analysis of the drivers of equity investments by insurance companies and defined
benefit pension funds, we were confronted with several obstacles that could not or only
partially be addressed with the current information available.
International data sources, such as EIOPA, the ECB and the OECD, were considered for the purposes of the study, and tested for data availability, stability and consistency. The conclusion from the assessments is that consistent data, across all Member States, covering a sufficiently long period, and containing the required detail on equity (listed and non-listed equity, on participations, equity exposures within funds, etc.), is currently limited.59
The main reason for the limited data availability, including the required data granularity, is the fact that reporting in a detailed and comprehensive manner on the European
insurance sector to EIOPA has only started recently, more specifically, since the application of Solvency II as of 1 January 2016. Added to this, the fact that although EIOPA’s guidance exists towards the insurers and NSAs, inconsistencies still exist between different publicly available datasets provided by EIOPA, the individual NSAs and the ECB, due to different interpretations of guidance and data definitions.
The survey information collected on the insurers’ portfolios also yielded a very limited
number of observations and consequently a small dataset. Only a few companies were able to provide the full detail on the required equity splits, look-through information, etc. In particular, the ability to provide time series over the requested time period, including the requested granularity, proved to be very difficult. The main reason being that the reporting experience of the insurance companies in the required EIOPA format is something that has only been built up over the past two years.60 As a consequence, these sample sizes did not prove to be long enough to derive any statistically significant
relationships, and to consider relevant policy factors. However, whenever possible, for instance in the comparison of the equity investments by insurance business type, the data collected from insurers are used to confirm the analysis on trends and drivers.
Some of the data limitations mentioned above were mitigated partially by reaching out to NSAs, or by the data survey performed directly with individual insurers or pension
funds. In both cases, this information is able to confirm trends or drivers qualitatively, but comparability between individual datasets, and availability of the required fields and time series, remained a limitation.
For the pension funds, the data availability issue is partially mitigated by using the equity lists analysis referred to in Section 3.3 and using the pension funds data available on the DNB and the Office of National Statistics databases.
59 Data availability and quality proved to be a more challenging issue for the pension funds in practice. A recent EIOPA report
(Report on Consultation Paper CP 17-005 EIOPA's regular information requests towards NCAs regarding provision of occupational pensions information, 25 April 2018) on data of occupational pensions highlights this point. According to the
report, ‘…current submission of pension data to EIOPA exhibits slightly overlapping, misaligned and overall insufficient information as well as often disappointing data quality.’ The availability of data is rated as ‘unsatisfactory’, and the reporting processes as ‘inefficient’.
60 Insurers in general found submitting historical data for 20 years difficult for several reasons such as internal restructuring,
holiday periods, end of year closing time and other projects which weighed on the relevant departments, change of data systems (from paper to digital or from one digital system to another, but with significant difficulty retrieving data from the
other system in a similar way), and the fact that they have to transform the data to match SII. In some cases, the data for the insurer were not available due to a recent restructuring of the company, for instance through a merger. Nevertheless,
when taking into consideration the limited data submitted by the NSAs, the portfolio data from the insurers suggests that historical equity investment data might not be available in a detailed manner.

European Commission - Study on the drivers of investments in equity by insurers and pension funds
December 2019 I 72
An additional limitation was the potential reporting bias in the interviews with the insurers. When asked for their opinion, insurers may be inclined to confirm that the prudential framework has impacted their equity investments negatively. Part of our task during this study was to challenge and/or support this with data available, to the furthest extent possible, and to challenge quantitative portfolio data provided by individual insurers, by comparing it to individual SFCRs. Due to limited availability of the portfolio data, the results of the comparison are not further reflected in the study.
Furthermore, market development and policy changes, during the period under consideration, are embedded in the analysis of other drivers, and we were not able to fully distinguish the specific effect of the former (market developments and policy changes) from the ones of the latter (other factors). In the last two decades, there have been two financial crises, a major change in accounting standards and a prudential framework change for insurers. These overlapping events have long-term potential effects and might affect each other. Thus, special caution is given to these events in both quantitative and qualitative analyses.
The combination of these data challenges require the full use of econometric methods and this caveat is acknowledged throughout the report. To address these challenges, we perform several robustness checks of the regression results and compare these findings against the conclusions derived from market-wide data, qualitative inputs stemming from the interviews, the development of the theoretical model, and the
literature review. Consistency across these sources is key to obtaining reliable results. A final verification of the soundness of the results reported in this study is done by bringing the different sources together as part of the triangulation exercises in the discussion of the impact and relative importance of the drivers and the conclusion.

European Commission - Study on the drivers of investments in equity by insurers and pension funds
December 2019 I 73
4 Drivers of equity investments for insurers
In this chapter, we first provide an overview of the state of play within the EU insurance market, with a focus on the investments made in equity. Next, the observed trends within the market are discussed. A distinction is always made between traditional life and non-life insurance products and unit-linked insurance products because of their distinct product characteristics.
The main part of this chapter concerns the analysis of potential drivers of equity investments for EU insurers, discussed per driver category. For each of these, the subsequent sections will first give a short introduction to the considered driver, then discuss the results of the literature review, (regression) analyses and interviews, and finally highlight the main conclusions.
4.1 State of play
4.1.1 Total investments
At the end of 2017, there are more than 2.000 individual insurance undertakings in the EU, the total investments of which amount to about 10.305 billion EUR (incl. unit-linked investments) or 67% of the EU gross domestic product (GDP). To put the size of the
investments made by European insurers into perspective, the 2017 ECB Report on Financial Structures mentions that the sector of Insurance Companies and Pension Funds (ICPFs) collectively accounts for 12,8% of the overall euro area financial sector. This is significantly lower than the investments made by Monetary Financial Institutions (44,7%, incl. banks) and Other Financial Intermediaries (40,9%).61 On the basis of available EIOPA data, the size of the insurance sector (10.305 billion EUR) is three times larger than the pension fund sector (3.409 billion EUR).
As mentioned in the literature review, the size of the sector compared to the country’s GDP is used as an indicator of the level of market development. Based on this indicator, the insurance market in Luxembourg has the largest share of the total economy, with total investments exceeding three times national GDP. This is mainly due to the high amount of unit-linked business in that country. Denmark, France, and Ireland are the other EU Member States with investments exceeding 100% of GDP. In most Eastern European Member States, as well as the Baltic States, the market development (as measured by the size of the insurance market to the country’s GDP) lies significantly below the EU average at the end of 2017.
Comparing the above information to a number of third-countries, we note that the Swiss insurance market (solo level) has 587 billion CHF (500 billion EUR) of investments or
approximately 85% of GDP. In Japan, the total investments of the insurance market amount to 414.085 billion JPY (3.063 billion EUR), which is around 75% of GDP. In the United States, the insurance market invested in total about 7.436 billion USD (6.181 billion EUR) or 40% of GDP.
61 Source: https://www.ecb.europa.eu/pub/pdf/other/reportonfinancialstructures201710.en.pdf

European Commission - Study on the drivers of investments in equity by insurers and pension funds
December 2019 I 74
Figure 3 – Total investments of insurance companies across EU Member States as share of GDP at year-end 2017 (incl. unit-linked investments)
Source: EIOPA Solvency II exposure list (S.06.02) statistics and Deloitte-CEPS analysis
Looking at the distribution across EU Member States in terms of size, the EU insurance
sector is highly concentrated in a limited number of countries, and dominated by insurance companies in France, Germany and the United Kingdom, which collectively
account for about two-thirds of the EU insurance investments. Then Italy, the Netherlands, Denmark, Belgium, Ireland, Sweden and Spain contribute each more than 2.5% of the total EU investments (about 28% altogether). Combined, the insurance companies in the remaining eighteen EU Member States, account for just over 5% of the EU total investments.
Figure 4 – Total investments of insurance companies across EU Member States at year-end 2017
(incl. unit-linked investments)
Source: EIOPA Solvency II exposure list (S.06.02) statistics and Deloitte-CEPS analysis
317,9%
EU average
0,0%
10,0%
20,0%
30,0%
40,0%
50,0%
60,0%
70,0%
80,0%
90,0%
100,0%
110,0%
120,0%
130,0%
140,0%
150,0%
160,0%
170,0%
180,0%
190,0%
200,0%
LU DK FR IE GB MT BE SE DE NL IT AT FI PT ES CY SI HR PL GR CZ SK EE HU BG LT LV RO
Tota
l in
vestm
ents
(in
% o
f G
DP)
Total investments EU average
FR
24,3%
GB
22,3%
DE
19,8%
IT
8,5%
NL
4,3%
DK
3,9%
BE
3,0%
IE
3,0%
SE
2,9%ES
2,7%
Other
5,4%

European Commission - Study on the drivers of investments in equity by insurers and pension funds
December 2019 I 75
4.1.2 Equity investments
Equity investments in this context are in line with the Solvency II definition of equity, which includes all ownership of another corporation (listed and unlisted equity, holdings in related undertakings, and equity exposure within collective investment undertakings). This covers both direct and indirect equity investments, according to the Solvency II S.06.02 reporting template (cf. Section 2.1 Types of equity investments).
There is a lot of variety in the share of investments allocated to equity across the
different EU Member States. The average equity exposure (both direct and indirect)62 in the EU is 24% (incl. unit-linked investments). To put this percentage into perspective, the average investments in government and corporate bonds in the EU is 43,7%, while 21,1% is invested in collective investment undertakings, other than (private) equity funds.
Swedish and British insurance undertakings have the highest equity exposure – with 41,8% and 37,3% respectively – whereas most of the southern European Member States show a much lower equity exposure, with levels around 10% and below. In the Baltic States (Estonia, Latvia and Lithuania), most of the equity exposure concerns indirect equity exposure through funds.
Figure 5 – Direct and indirect equity exposure at year-end 2017 (incl. unit-linked investments)
Source: EIOPA Solvency II exposure list (S.06.02) statistics and Deloitte-CEPS analysis
62 We note that a number of differences and interpretations of definitions may exist when consulting national insurance
federation data on the level of direct vs. indirect equity exposures. For reasons of consistency, EIOPA data have been used for this purpose (in particular in Figure 5 and Figure 8).
0,0%
2,5%
5,0%
7,5%
10,0%
12,5%
15,0%
17,5%
20,0%
22,5%
25,0%
27,5%
30,0%
32,5%
35,0%
37,5%
40,0%
42,5%
45,0%
47,5%
50,0%
EU SE GB DK FI LU PL IE CY SI AT DE LT HU FR IT EE CZ MT RO SK BG NL PT BE HR ES GR LV
Equity e
xposure
(in
% o
f to
tal in
vestm
ents
)
Direct equity exposure Indirect equity exposure

European Commission - Study on the drivers of investments in equity by insurers and pension funds
December 2019 I 76
4.1.3 Non-unit-linked insurance
Non-unit-linked insurance concerns the traditional life and non-life insurance products (primary insurance) and reinsurance contracts. Life insurance undertakings offer their policyholders a protection against the risks of financial losses associated with death or longevity. Life insurance products typically have longer durations and incorporate a savings element. The most well-known life insurance products are whole life insurance, term life insurance, endowment insurance and annuities.
On the other hand, non-life insurance undertakings mostly offer property and casualty (P&C) insurance products. Key differences with life insurance policies are the shorter duration of mostly one year (or less) and the higher uncertainty about timing and volume of the claim payments. Typical non-life insurance products concern car insurance (motor third party liability insurance), fire insurance and liability insurance.
Total investments
Traditional life and non-life insurance accounts for 7.600 billion EUR or 73,8% of the total investments of 10.305 billion EUR of the insurance market at the end of 2017. Within the EU, on average the investments of the traditional insurance represents around half of the GDP. In France, Luxembourg and Denmark these values are significantly larger, with values above 85%, as shown in Figure 6. We note that in most Eastern European Member States and Baltic States, the (traditional) market
development (as measured by the share in the country’s GDP) lies significantly below the EU average.
Figure 6 – Total investments of the insurance market per undertaking type (in % of GDP) for all EU Member States at year-end 2017 (excl. unit-linked investments)
Note that for Finland, the Czech Republic, Bulgaria, Estonia, Latvia and Lithuania the undertaking type is not published to maintain anonymity in those countries where disclosing the undertaking type would risk
identifying individual insurers.
Source: EIOPA Solvency II exposure list (S.06.02) statistics and Deloitte-CEPS analysis
0,0%
5,0%
10,0%
15,0%
20,0%
25,0%
30,0%
35,0%
40,0%
45,0%
50,0%
55,0%
60,0%
65,0%
70,0%
75,0%
80,0%
85,0%
90,0%
95,0%
100,0%
EU FR LU DK MT BE DE NL GB IT SE IE AT ES PT FI SI CY HR GR CZ PL SK BG EE HU LV LT RO
Tota
l in
vestm
ents
(in
% o
f G
DP)
Life insurance undertakings Non-life insurance undertakings
Composite and reinsurance undertakings Undertaking type not published

European Commission - Study on the drivers of investments in equity by insurers and pension funds
December 2019 I 77
The total investments made by the close to 500 life insurers in the EU amount to 3.593 billion EUR at the end of 2017. The majority of those investments are made by insurers in France, Germany and the United Kingdom, which collectively account for 77,6% of the total investments, or 2.788 billion EUR. On a country-by-country level, the life insurance business is dominant in France, Luxembourg, Denmark, Germany, the Netherlands and the United Kingdom, as shown in Figure 6, representing more than 50% of total investments.
For the non-life business, there are more than 1.100 insurance companies across the EU, the total investments of which amount to 1.106 billion EUR. Germany represents almost half of the total EU non-life market. French non-life insurance undertakings represent a share of 18,8%. We remark that on a country-by-country level, the only two EU Member States where the non-life business is dominant are Cyprus and Poland.
The investments of close to 300 composite and reinsurance insurance undertakings
in the EU amount to 2.846 billion EUR. France, Italy and Germany together make up more than 60% or 1.792 billion EUR. Malta, Belgium, Italy, Sweden, Ireland, Austria, Spain, Slovenia, Croatia, Greece, Slovakia, Hungary and Romania are the EU Member States where the composite insurance undertakings represent the largest share of total investments. The reinsurance business is the most prominent in Ireland and Luxembourg, where almost 70% of all EU reinsurance undertakings are established.
Figure 7 – Total investments of life, non-life, and composite (re)insurers in the EU at year-end 2017 (excl. unit-linked investments)
Life insurance Non-life insurance
Composite and reinsurance
Source: EIOPA Solvency II exposure list (S.06.02) statistics and Deloitte-CEPS analysis
FR
29,2%
DE
28,7%
GB
19,6%
NL
8,2%
DK
4,8%
IT
4,8%Other
4,5%
DE
49,8%
FR
18,8%
GB
8,4%
SE
5,2%
NL
4,5%
IE
2,6%
DK
2,1%
Other
8,6%
FR
31,9%
IT
18,7%DE
12,4%
BE
8,7%
GB
8,6%
ES
7,1%
SE
3,7%
AT
3,2%
Other
5,7%

European Commission - Study on the drivers of investments in equity by insurers and pension funds
December 2019 I 78
The total investments of the countries for which no split is published regarding the undertaking type (see the note on Figure 6), account for 55 billion EUR, which is less than 1% of the total investments across the traditional insurance.
Equity investments
Compared to the total equity exposure (incl. unit-linked investments), as shown in Figure 5, the equity exposure for the non-unit-linked investments originates more from direct equity investments, and less from investments through funds. At an EU level, 12% of the 16% equity exposure relates to direct equity investments. This observation is valid for most EU Member States, with the exception of Denmark, Finland, Estonia and Latvia.
Figure 8 – Direct and indirect equity exposure at year-end 2017 (excl. unit-linked investments)
Source: EIOPA Solvency II exposure list (S.06.02) statistics and Deloitte-CEPS analysis
Compared to the EU insurance market and based on the received NSA data, non-unit-linked investments made by insurance undertakings in third-countries Switzerland and the United States have a similar direct equity exposure, with 13,7% and 12,3% of their total investments, respectively. On the other hand, Japanese insurance undertakings
have significantly less equity exposure with 11,1% of total investments, consisting of 8,2% direct equity and 2,9% indirect equity exposure.
0,0%
2,5%
5,0%
7,5%
10,0%
12,5%
15,0%
17,5%
20,0%
22,5%
25,0%
27,5%
30,0%
32,5%
35,0%
37,5%
40,0%
42,5%
45,0%
47,5%
50,0%
EU SE DK PL FI AT DE CY SI GB FR IT BG MT CZ LU PT HR RO NL ES BE HU SK IE GR EE LV LT
Equity e
xposure
(in
% o
f to
tal in
vestm
ents
)
Direct equity exposure Indirect equity exposure

European Commission - Study on the drivers of investments in equity by insurers and pension funds
December 2019 I 79
For the non-unit-linked equity investments, we can make a further distinction between listed equity, unlisted equity, and holdings in related undertakings, incl. participations, based on the Solvency II market value balance sheet (S.02.01).63
There are important differences between the EU Member States: Sweden, the United Kingdom, Finland and Malta invest significantly more in listed equity than the EU average of 3,0%. Furthermore, the holdings in related undertakings, incl. participations, constitute a very important equity category for most of the EU Member States, apart from Sweden, Finland and Malta.
Based on the data received from the NSA, Japanese insurance undertakings invest significantly more in listed equity, compared to the average EU insurer, with 8,1% of the total 8,2% in direct equity investments. Furthermore, 1,9% is allocated to holdings in related undertakings, incl. participations, which is significantly less than the EU average. For Switzerland, the NSA data show that the direct equity investments of Swiss insurers consist of 3,7% equity (listed and unlisted) and 9,9% participations.
Figure 9 – Listed equity, unlisted equity, and holdings in related undertakings, incl. participations at year-end 2017 (excl. unit-linked investments)
Source: EIOPA Solvency II market value balance sheet (S.02.01) statistics and Deloitte-CEPS analysis
63 Note that under Solvency II there are a number of differences between the market value balance sheet (S.02.01) and the asset exposure (S.06.02) reporting template with respect to the equity exposures.
Under the S.06.02 template, there is no separate category for Holdings in related undertakings, incl. participations nor is there a distinction between listed and unlisted equity. Equity is reported under CIC 3 – Equity, which is here considered as
direct equity exposure. Furthermore, the S.06.02 template further specifies the different subcategories within CIC 4 – Collective Investment Undertakings, which makes it possible to verify the equity exposure within this category, i.e. CIC 41 –
Equity funds and CIC 47 – Private equity funds, which is here considered as indirect equity exposure. Under the S.02.01 template, equity is classified as listed or unlisted equity (direct equity exposure). The category Holdings
in related undertakings, including participations is also considered as direct equity exposure. Furthermore, there is equity exposure within the Collective Investment Undertakings (indirect equity exposure). However, due to the non-existing split of
this category in S.02.01, we cannot provide a further split.
Due to lacking information with respect to a further split of the collective investment undertakings category in S.02.01, and the non-existing notion of participations in S.06.02, differences can exist on country level between both reporting templates for a number of EU Member States (as evidenced by the figures in this section).
0,0%
2,5%
5,0%
7,5%
10,0%
12,5%
15,0%
17,5%
20,0%
22,5%
25,0%
27,5%
30,0%
EU SE DK PL AT GB DE CY SI IT BG FR PT FI LU RO NL CZ MT HR BE ES HU IE SK GR LT LV EE
Equity e
xposure
(in
% o
f to
tal in
vestm
ents
)
Listed equity Unlisted equity Holdings in related undertakings, including particpations

European Commission - Study on the drivers of investments in equity by insurers and pension funds
December 2019 I 80
At an EU level, almost 90% of the equity investments are done within the EU, with a strong bias towards the home country. Nevertheless, there are important differences within the EU Member States, as shown in Figure 10. In Poland, the equity exposure is almost solely located in the home country. Furthermore, we observe that insurers in Italy, Belgium, Malta, Luxembourg, Ireland and the Baltic States invest more in EU countries other than their home country. Finally, Cyprus, Ireland, Malta, and the United Kingdom have the largest equity exposure outside the EU with more than 30% of the total equity exposure invested outside of the EU.64
Figure 10 – Equity exposure by location at year-end 2017 (excl. unit-linked investments)
Source: EIOPA Solvency II exposure list (S.06.02) statistics and Deloitte-CEPS analysis
Due to the nature of the insurance products sold by life insurers, durations are much
longer and technical provisions per product are much more sizeable than typical products sold by non-life insurers. As such, these characteristics are expected to cause different investment behaviours between life and non-life insurers. For non-life insurance undertakings, with shorter product durations, this duration gap is not a primary consideration as most non-life insurance contracts have a one-year policy term, allowing them more flexibility to invest in equity.
Furthermore, claims relating to non-life insurance contracts are more subject to inflation than life insurance claims, for which the benefit is agreed upon at the creation of the contract, for a longer contract maturity. Hence, non-life insurance might use equity investments as hedge against inflation, as also evidenced by a study by Swiss Re (2010) on the impact of inflation on insurers.65
In line with the above expectations, there are indeed important differences in the investment behaviour between life, non-life and composite insurance undertakings
64 The category ‘outside EU’ includes the following countries: Iceland, Liechtenstein, Norway, Switzerland, Australia, Canada,
Japan, the United States and countries grouped under the caption ‘Rest of World’. 65 Swiss Re (2010). The impact of inflation on insurers. Swiss Reinsurance Company.
0,0%
5,0%
10,0%
15,0%
20,0%
25,0%
30,0%
35,0%
40,0%
45,0%
50,0%
55,0%
60,0%
65,0%
70,0%
75,0%
80,0%
85,0%
90,0%
95,0%
100,0%
EU PL SI RO FR AT HU DE ES DK GR HR SK NL CZ BG SE GB FI PT IT LV CY BE EE MT LU IE LT
Type o
f equity e
xposure
(in
% o
f to
tal equity e
xposure
)
Equity exposure (EU home) Equity exposure (EU other) Equity exposure (outside EU)

European Commission - Study on the drivers of investments in equity by insurers and pension funds
December 2019 I 81
across the EU. Based upon the Solvency II exposure list (S.06.02) we notice that for almost all EU Member States, the equity exposure, as a percentage of total investments, for non-life insurance undertakings is higher than for life insurance undertakings, apart from Denmark, Malta, Hungary, Slovakia and Ireland, as shown in Figure 11.
Furthermore, at EU level, we see that composite insurers have a higher equity exposure than life insurers. This is confirmed by our interviews, where it shows that the average composite insurer in our sample has a higher equity exposure than the average life insurer.
At the country-specific level, we note that (1) life insurers in Denmark, the United Kingdom, Malta and Slovakia have a significantly higher (direct) equity exposure than the EU average, (2) non-life insurers in Sweden, Poland, Austria and France have a significantly higher (direct) equity exposure than the EU average, and (3) composite insurers in Sweden and Germany have a significantly higher (direct) equity exposure than the EU average.
Figure 11 – Equity exposure for life, non-life and composite insurance undertakings for all EU Member States at year-end 2017(excl. unit-linked investments)
Source: EIOPA Solvency II exposure list (S.06.02) statistics and Deloitte-CEPS analysis
0,0%
5,0%
10,0%
15,0%
20,0%
25,0%
30,0%
35,0%
40,0%
45,0%
50,0%
55,0%
60,0%
Life
Non-l
ife
Com
posite
Life
Non-l
ife
Com
posite
Life
Non-l
ife
Com
posite
Life
Non-l
ife
Com
posite
Life
Non-l
ife
Com
posite
Life
Non-l
ife
Com
posite
Life
Non-l
ife
Com
posite
Life
Non-l
ife
Com
posite
Life
Non-l
ife
Com
posite
Life
Non-l
ife
Com
posite
Life
Non-l
ife
Com
posite
Life
Non-l
ife
Com
posite
Life
Non-l
ife
Com
posite
Life
Non-l
ife
Com
posite
Life
Non-l
ife
Com
posite
Life
Non-l
ife
Com
posite
Life
Non-l
ife
Com
posite
Life
Non-l
ife
Com
posite
Life
Non-l
ife
Com
posite
Life
Non-l
ife
Com
posite
Life
Non-l
ife
Com
posite
Life
Non-l
ife
Com
posite
Life
Non-l
ife
Com
posite
EU SE DK PL AT DE CY SI GB FR IT MT LU PT HR RO NL ES BE HU SK IE GR
Equity e
xposure
(in
% o
f to
tal in
vestm
ents
)
Direct equity exposure Indirect equity exposure

European Commission - Study on the drivers of investments in equity by insurers and pension funds
December 2019 I 82
4.1.4 Unit-linked insurance
Unit-linked insurance products relate to insurance policies for which the policyholder’s premiums are invested in financial instruments of which the returns depend on the performance of an equity index or financial fund, but still with the coverage of an insurance policy. As a result, these products partially shift the financial risk from the (life) insurer towards the policyholder and are typically less capital-intensive for insurers. When looking into the drivers of equity investments, these insurance products should therefore be treated separately from traditional life and non-life insurance products, as the investment decision generally lies with the policyholder.
Total investments
At the end of 2017, the unit-linked investments in the EU amount to 2.705 billion EUR, out of which 46,3% or 1.253 billion EUR is made by insurance undertakings in the United Kingdom. France, Ireland, Italy, Denmark, Luxembourg, Sweden, Germany, the Netherlands and Finland are the other EU Member States whose share of unit-linked investments within the EU is larger than 1,0%. These ten countries combined represent 95,8% of the total amount of unit-linked investments in the EU.
Figure 12 – Unit-linked investments in the EU at year-end 2017
Source: EIOPA Solvency II exposure list (S.06.02) statistics and Deloitte-CEPS analysis
At the end of 2017, EU Member States allocate on average 27,8% of their total insurance investments to unit-linked contracts, a growth of 1,2% compared to 2016. Luxembourg
and Ireland show an allocation of more than 70%, while also the United Kingdom and Finland are significantly above the EU average, as shown in Figure 13.
Compared to 2016, the strongest growing countries (3,5% growth rate and more) in unit-linked investments are Finland, Luxembourg, Sweden and Denmark. This is in line with the observation in EIOPA’s 2018 LTG report, where they refer to the trend observed
by NSAs that there is a switch away from with-profits products66 towards unit-linked products, where in half of the jurisdictions an increase in the gross written premium on these contracts is observed.
66 With-profits insurance products are (life) insurance products for which the benefits are indirectly affected by investment performance, by means of bonuses, if any, added to the investment value.
GB
46,3%
FR
12,6%
IE
7,7%
IT
5,7%
DK
5,4%
LU
4,7%
SE
4,7%
DE
4,0%
NL
3,4%
FI
1,4%
Other
4,2%

European Commission - Study on the drivers of investments in equity by insurers and pension funds
December 2019 I 83
Figure 13 – Importance of unit-linked investments of EU Member States at year-end 2017
Source: EIOPA Solvency II exposure list (S.06.02) statistics and Deloitte-CEPS analysis
The majority of unit-linked investments in the EU are made through collective investment undertakings, with a total amount of 1.748 billion EUR or 64,6% of the total investments. Within the collective investment undertakings, 42,6% is allocated to equity funds (indirect equity). Furthermore, direct equity also represents an important share with 483 billion EUR or 17,9%.
Figure 14 – Asset allocation unit-linked investments in the EU at year-end 2017
Source: EIOPA Solvency II exposure list (S.06.02) statistics and Deloitte-CEPS analysis
Comparing a number of third-countries to the EU values at the end of 2017, we note that Japanese insurers have significantly less unit-linked investments, with 3,4% of their total investments. Swiss insurance undertakings have a very similar percentage (3,4%) of unit-linked investments.
0,0%
5,0%
10,0%
15,0%
20,0%
25,0%
30,0%
35,0%
40,0%
45,0%
50,0%
55,0%
60,0%
65,0%
70,0%
75,0%
80,0%
85,0%
90,0%
95,0%
100,0%
EU FR GB DE IT NL DK BE IE SE ES LU AT FI PT PL CZ GR HU MT SI SK HR CY RO BG EE LT LV
Type o
f in
sura
nce (
in %
of
tota
l in
vestm
ents
)
Life insurance undertakings Non-life insurance undertakings
Composite and reinsurance undertakings Undertaking type not published
Unit-linked investments
Collective
Investment
Undertakings
64,6%
Equity
17,9%
Government
bonds
5,9%
Corporate bonds
4,5%
Structured notes
1,6%Other investments
5,4%

European Commission - Study on the drivers of investments in equity by insurers and pension funds
December 2019 I 84
Equity investments
The total equity exposure of 46,7% at the EU level within unit-linked investments is much larger than the observed 16,0% for traditional insurance business. For most EU Member States this is mainly due to a much higher indirect equity exposure (through funds). The United Kingdom, Denmark, Ireland and Luxembourg show a direct equity exposure of more than 10% of the unit-linked investments, which is significantly higher than the other EU Member States, as shown in Figure 15.
Figure 15 – Direct and indirect equity exposure (unit-linked investments)
Source: EIOPA Solvency II exposure list (S.06.02) statistics and Deloitte-CEPS analysis
0,0%
5,0%
10,0%
15,0%
20,0%
25,0%
30,0%
35,0%
40,0%
45,0%
50,0%
55,0%
60,0%
EU DE GB SI LT EE SE DK CZ FR SK HU IE ES FI CY LU PL RO AT MT IT BG BE GR NL LV HR PT
Equity e
xposure
(in
% o
f to
tal in
vestm
ents
)
Direct equity exposure Indirect equity exposure

European Commission - Study on the drivers of investments in equity by insurers and pension funds
December 2019 I 85
4.2 Trends
In this section, we provide a view on the trends in equity investments by EU insurance companies over a 20-year history from 1999 until 2018. Trends in the insurers’ total investments, equity investments and unit-linked insurance are discussed. In order to position the EU insurance market in a broader perspective, we also look at a number of key trends of the insurance market in Japan, Switzerland and the United States.
4.2.1 Total investments
Overall, the size of the EU insurance market (excl. the United Kingdom)67, in terms of investments, has grown from 2.723 billion EUR at the beginning of 1999 to 8.041 billion EUR at the beginning of 2018, an increase of almost 200%. There was a drop of 7,8% around the period of the financial crisis in 2008. The majority of these investments, approximately two-thirds over the complete time horizon, are those of French and German insurers. At the end of 2017, French and German investments together make up 4.731 billion EUR or 58,8% of the total value. Furthermore, Italy (10,8%) and the Netherlands (5,7%) are the other EU Member States that contribute more than 5,0% each to the EU total.
Figure 16 – Total investments of the EU insurance market (incl. unit-linked investments)
The ten most important EU Member States in terms of amounts are shown separately, covering 95,1% of the total at 2018 Q1. The remaining EU Member States are clustered (‘Other’).
For Denmark, the observation period only starts at 2005 Q1, for Ireland the observation period only starts at
2002 Q1 and for Luxembourg the observation period only starts at 2001 Q1.
Source: ECB QSA dataset and Deloitte-CEPS analysis
67 The ECB QSA dataset does not provide data for the United Kingdom. A separate data source is used.
Dot-com crisis Financial crisis Solvency II reporting
0
500.000
1.000.000
1.500.000
2.000.000
2.500.000
3.000.000
3.500.000
4.000.000
4.500.000
5.000.000
5.500.000
6.000.000
6.500.000
7.000.000
7.500.000
8.000.000
8.500.000
9.000.000
9.500.000
10.000.000
1999 Q
1
2000 Q
1
2001 Q
1
2002 Q
1
2003 Q
1
2004 Q
1
2005 Q
1
200
6 Q
1
2007 Q
1
2008 Q
1
2009 Q
1
2010 Q
1
2011 Q
1
2012 Q
1
2013 Q
1
2014 Q
1
2015 Q
1
2016 Q
1
2017 Q
1
2018 Q
1
To
tal a
sse
ts (in
Mio
EU
R)
Other
SE
LU
IE
BE
ES
DK
NL
IT
DE
FR

European Commission - Study on the drivers of investments in equity by insurers and pension funds
December 2019 I 86
Data received from the Bank of England show that there is also a long-term upward trend for total investments in the British insurance market. The total investments increased from 1.043 billion GBP (1.743 billion EUR) in 1999 to 2.445 billion GBP (2.795 billion EUR) in 2018, an increase of almost 135%. Note that over this period, around 50% of these investments are linked to unit-linked insurance.
The overall growth of the EU insurance market can also be observed at individual
country level. Compared to the EU average, the growth of the insurance market in Croatia and the Netherlands lags behind. In Bulgaria, Estonia, Hungary, Lithuania and Malta on the contrary, the insurance market grew significantly more than the EU average. Only Sweden displayed a negative growth of -10,7%, which is due to the reclassification in 2009 of a number of insurance undertakings to pensions funds in the ECB dataset.68 After 2009, the Swedish insurance market grew by almost 70%.
Analyses of the third-countries, Japan, Switzerland, and the United States, show similar
results concerning the growth of the insurance market. In the United States, total investments increased by almost 150%, from 2.966 billion USD in 1998 to 7.328 billion USD in 2018. In Japan, total investments of the insurance market grew from 217.678 billion JPY in 2001 to 414.085 billion JPY in 2017, an increase of 90,2%. The Swiss insurance market grew almost 25% from 471 billion CHF in 2008 to 587 billion CHF in 2017.69
4.2.2 Equity investments
Investments in direct equity of the EU insurance market (excl. the United Kingdom)
increased from 512 billion EUR in 1999 to 812 billion EUR in 2018, an increase of almost 60%, while over the same period the total investments of the insurance market nearly tripled. The majority of the direct equity investments in the EU are made by French and German insurance undertakings, together covering 57% of the total at the end of 2017.
The share of total investments allocated to direct equity has decreased from 18,8% in 1999 to 10,1% in 2018. The most noticeable drops occurred during the dot-com and financial crises. In recent years, this downward trend has stabilised around the level of 10%, as shown in Figure 17. The interviews with insurance undertakings confirmed these trends in equity investments, showing a significant decline in equity investments after the financial crisis of 2008 and afterwards investments in equity stabilised over the last years, albeit at lower levels.
68 Considering the break in the data series for Sweden, in the quantitative regression analyses of the dataset, only the period after 2009 is used for Sweden.
69 The data regarding the Swiss insurance market are only used as from 2008 due to a change in the reporting method.

European Commission - Study on the drivers of investments in equity by insurers and pension funds
December 2019 I 87
Figure 17 – Direct equity investments of the EU insurance market (incl. unit-linked investments)
Source: ECB QSA dataset and Deloitte-CEPS analysis
The investments in listed equity of the EU insurance market (excl. the United Kingdom)
have dropped from 11,5% of total investments in 1999, just before the dot-com crisis, to around 3,3% after the financial crisis of 2008. We note that after both crises, the equity investments never recovered to their former levels. Since 2011, investments in listed equity have been relatively stable around the level of 3%, of which almost 40% are made by French insurers.
Figure 18 – Listed equity investments of the EU insurance market (incl. unit-linked investments)
Source: ECB QSA dataset and Deloitte-CEPS analysis
Dot-com crisis Financial crisis Solvency II reporting
0,0%
1,5%
3,0%
4,5%
6,0%
7,5%
9,0%
10,5%
12,0%
13,5%
15,0%
16,5%
18,0%
19,5%
21,0%
22,5%
24,0%
25,5%
27,0%
28,5%
30,0%1999 Q
1
2000 Q
1
2001 Q
1
2002 Q
1
2003 Q
1
2004 Q
1
2005 Q
1
2006 Q
1
2007 Q
1
2008 Q
1
200
9 Q
1
2010 Q
1
2011 Q
1
2012 Q
1
2013 Q
1
2014 Q
1
2015 Q
1
2016 Q
1
2017 Q
1
2018 Q
1
Direct e
qu
ity (
in %
of to
tal in
ve
stm
ents
) Other
SE
LU
IE
BE
ES
DK
NL
IT
DE
FR
Dot-com crisis Financial crisis Solvency II reporting
0,0%
1,0%
2,0%
3,0%
4,0%
5,0%
6,0%
7,0%
8,0%
9,0%
10,0%
11,0%
12,0%
13,0%
14,0%
15,0%
1999 Q
1
2000 Q
1
2001 Q
1
2002 Q
1
2003 Q
1
2004 Q
1
2005 Q
1
2006 Q
1
2007 Q
1
2008 Q
1
200
9 Q
1
2010 Q
1
2011 Q
1
2012 Q
1
2013 Q
1
2014 Q
1
2015 Q
1
2016 Q
1
2017 Q
1
2018 Q
1
Lis
ted e
qu
ity (
in %
of to
tal in
ve
stm
ents
) Other
SE
LU
IE
BE
ES
DK
NL
IT
DE
FR

European Commission - Study on the drivers of investments in equity by insurers and pension funds
December 2019 I 88
The observed trends in listed equity are valid for almost all EU Member States, apart from Luxembourg and Denmark, where the share of listed equity within total investments have picked back up after the financial crisis. In France, the investments in listed equity have remained fairly stable after the drop experienced during the financial crisis, around the level of 1,5% of the total EU investments, implying that almost 40% of all investments in listed equity made by EU insurers are currently done by French insurers.
The majority of the drop in listed equity in the EU can be attributed to Germany, Sweden and the Netherlands. While the share of these three countries was more important from the beginning of the observation period until the period of the financial crisis in 2008, it has decreased drastically since then.
June 2003 marks the insolvency of the German life insurer Mannheimer Leben, where a combination of an investment strategy tilted towards equities and declining equity prices, impacted the company’s solvency position and ultimately triggered its default. The portfolio of the defaulted insurer was since then managed in run-off by Protektor, a German insurance industry rescue vehicle. As referred to in an IMF paper70, the German regulators had already responded in early 2002 to the negative impact of declining equity prices on insurers’ capital positions, by amending the regulations governing the valuation of equities and other assets, while leaving in place the solvency requirements. Insurers were allowed to value equities at an ‘estimated ultimate
realizable value’, above current market prices. The paper notes that this action eased stability pressures, but many observers noted that it also reduced the transparency of reported solvency margins. We also refer to the discussion on the accounting framework as a driver of equity investments, and the impact of volatility on insurers’ results.
As mentioned earlier, for Sweden there was an important reclassification of a number of insurance undertakings to pension funds in 2009.
In contrast to the listed equity, the share of total investments allocated to unlisted equity in the EU has remained relatively stable over the period from 1999 until 2018, around the level of 7%. Within the EU, Germany and France combined make up for more than 60% of the total unlisted equity investments, over the complete observation period. The investments in unlisted equity in France decreased during the dot-com crisis,
and have remained relatively stable since. In contrast, investments in unlisted equity made by German insurers have been relatively stable over the full observation period.
In France, there was a fall between 2016 and 2017 in unlisted equity due to a reclassification, more specifically from participations to non-money market funds (see also in Figure 20). Furthermore, we note that Italy also represents an important (relatively stable) share of unlisted equity within the EU.
70 As referred to in the IMF paper on ‘Risk transfer and the insurance industry’ (21 Oct 2004)

European Commission - Study on the drivers of investments in equity by insurers and pension funds
December 2019 I 89
Figure 19 – Unlisted equity investments of the EU insurance market (incl. unit-linked investments)
Source: ECB QSA dataset and Deloitte-CEPS analysis
When comparing the trends in the EU insurance market to a number of third-countries, the decreasing trend in listed equity can also be observed for Japan. The percentage of investments of Japan (excl. unit-linked investments)71 allocated to listed equity decreased over the years, from 16,1% in 2001 to 8,1% in 2017, with the most noticeable drop around the financial crisis. In the United States, the investments in equity (listed and unlisted) decreased from 13,7% of total investments in 1998 to 6,9% in 2009, largely due to the financial crisis. However, in contrast to the EU insurance market, we observe that the percentage allocated to equity has picked back up since then, and is currently again around 12,1%. Based on the data received from the Swiss
NSA, we note that the observation made for the EU on the relative stability of equity investments after the financial crisis is also valid for the Swiss market. In Switzerland, total equity investments (incl. participations) made up 14,5% in 2008 and 13,2% in 2017.
71 In contrast to the ECB dataset, the available data on equity investments by Japanese insurers do not include unit-linked investments. Although this might hamper the comparison with EU Member States, we highlight that the unit-linked
investments by Japanese insurers are rather limited.
Dot-com crisis Financial crisis Solvency II reporting
0,0%
1,0%
2,0%
3,0%
4,0%
5,0%
6,0%
7,0%
8,0%
9,0%
10,0%
11,0%
12,0%
13,0%
14,0%
15,0%
1999 Q
1
2000 Q
1
2001 Q
1
2002 Q
1
2003 Q
1
2004 Q
1
2005 Q
1
2006 Q
1
2007 Q
1
2008 Q
1
200
9 Q
1
2010 Q
1
2011 Q
1
2012 Q
1
2013 Q
1
2014 Q
1
2015 Q
1
2016 Q
1
2017 Q
1
2018 Q
1
Un
liste
d e
qu
ity (
in %
of
tota
l inve
stm
ents
)
Other
SE
LU
IE
BE
ES
DK
NL
IT
DE
FR

European Commission - Study on the drivers of investments in equity by insurers and pension funds
December 2019 I 90
We note that participations72 currently have an important contribution to the balance sheet for most of the European Member States, coinciding with the importance of insurance groups in Europe. Based on EIOPA S.02.01 data at year-end 2017, ‘Holdings in related undertakings, incl. participations (R0090)’ amount to 800 billion EUR, or 10,5% of total non-unit-linked investments in the EU. The majority of these are to be found in Germany with 326 billion EUR or 16,4% of total non-unit-linked investments of German insurers. Germany is followed by France with 136 billion EUR or 6,3% of non-unit-linked investments of French insurers, and in third place is the United Kingdom with 119 billion EUR or 11,4% of total British non-unit-linked investments. Nevertheless, limited data exists on how participations have evolved over the last 20 years and more granular information within these participations is not available.
The decrease in the share of listed equity in insurers’ investment portfolios is accompanied by a gradual shift towards non-money market funds, as shown in Figure 20, and to a lesser extent towards debt securities.
An important note to make in this context, is that the change from Solvency I to Solvency II led to an important improvement in data granularity and availability, in particular for the investments in funds. Under Solvency II, insurers are incentivised to increasingly ‘look through’ their indirect investments (referred to Collective Investment Undertakings or CIUs), a practice which in most cases leads to a capital relief compared to the situation where look-through is not done. It is thus possible that between 2016 and 2017 there has been a look-through effect, through a number of reclassifications
(e.g. the aforementioned reclassification for French insurers between unlisted equity and non-money market funds). It is also likely that under Solvency II, a number of equity investments which were previously reported as non-money market funds, are now classified as bonds, listed and unlisted equity etc. This effect (if any) should in any case be limited to the last two years of the data series, i.e. under Solvency II reporting.73 However, given that this increased data granularity is only available under Solvency II, unfortunately the data do not allow to make the analysis, and confirm whether this drop in listed equity has been (partly) compensated by another equity investment.
Investments by EU insurance undertakings in non-money market funds have increased from 380 billion EUR in 1999 to 2.093 billion EUR in 2018, an increase of 450%. In terms of percentage of total investments, the share allocated to non-money market funds increased from 14% towards 26%, with strong country-specific trends. After the dot-com crisis and the financial crisis, the investments in non-money market funds decreased, but contrary to the investments in listed equity they recovered. Furthermore, as from 2009, the increasing trend was steeper than before. German and French insurance undertakings represent around two-thirds (or more) of non-money market funds over the complete observation period.
The increasing trend towards non-money market funds is observed for most EU Member
States, especially after the financial crisis in 2009, however with country-specific differences. Compared to the average EU growth of more than 150% after 2009, we
72 Participations are in this context defined as ‘the ownership, direct or by way of control, of 20% or more of the voting rights or capital of an undertaking’, following the definition given in art. 13 of the Solvency II Directive (2009/138/EC).
Due to limited data availability, i.e. only two years of Solvency II reporting, it is at the moment unfortunately not possible to track the trend of these participations over a longer period in time. Furthermore, granular information within participations
on listed and/or unlisted equity is not available. 73 Amongst other reasons, the stability of the data definitions applied in the ECB dataset has been one of the main reasons
why we decided to use this dataset for the 20-year trend analyses. This means that that the categories listed equity, unlisted equity and non-money market funds should be the same over the full observation period. Nevertheless, as this is the case
for the EIOPA dataset as well, the ECB dataset remains dependent on the data provided by the respective NSAs. Although guidance on data definitions and classification exists, any difference in national interpretation of data definitions will have an
impact on the consistency of the data series through the observation period. We also refer to the limitations section in Chapter 3.

European Commission - Study on the drivers of investments in equity by insurers and pension funds
December 2019 I 91
note that Bulgaria, Estonia, Latvia and Slovakia show even bigger growth percentages (>500%), while in Greece, the growth of non-money market funds was only 23,8% over the same period.
Figure 20 - Non-money market funds investments of the EU insurance market (incl. unit-linked investments)
Source: ECB QSA dataset and Deloitte-CEPS analysis
For French insurers investments in debt securities and non-money market funds have been rather stable over the last 20 years, at around 60% and 20%, respectively. As mentioned earlier, there has been a reclassification in 2016 from unlisted equity towards non-money market funds.
In Germany, there has been a shift from listed equity towards debt securities and non-money market funds. The percentage of total investments allocated to debt securities by German insurers have increased from 9,3% in 1999 to 20,4% in 2018, whilst the investments in non-money market funds increased from 21,9% in 1999 to 31,6% in 2018. We also refer to the paragraph above on the insolvency of Mannheimer Leben in 2003.
A very similar shift is also noticeable in the Netherlands, where the percentage allocated to debt securities has increased from 28,2% in 1999 to 40,6% in 2018, whilst an increase was also noted for non-money market funds from 3,1% in 1999 to 18,8% in 2019.
Swedish insurers have shifted their investments from listed equity towards non-money
market funds, which increased from 5,8% in 1999 to 41,4% in 2018. This trend coincides with a steady increase of the unit-linked business in Sweden, which may partly explain why, despite the formerly mentioned shift, the equity investments by Swedish insurance undertakings remain the highest in the EU.
Dot-com crisis Financial crisis Solvency II reporting
0,0%
2,5%
5,0%
7,5%
10,0%
12,5%
15,0%
17,5%
20,0%
22,5%
25,0%
27,5%
30,0%
1999 Q
1
2000 Q
1
2001 Q
1
2002 Q
1
2003 Q
1
2004 Q
1
2005 Q
1
2006 Q
1
2007 Q
1
2008 Q
1
2009 Q
1
2010 Q
1
2011 Q
1
2012 Q
1
2013 Q
1
2014 Q
1
2015 Q
1
2016 Q
1
2017 Q
1
2018 Q
1
No
n-m
one
y m
ark
et fu
nd
s (
in %
of to
tal in
ve
stm
ents
)
Other
SE
LU
IE
BE
ES
DK
NL
IT
DE
FR

European Commission - Study on the drivers of investments in equity by insurers and pension funds
December 2019 I 92
The same increasing trend towards funds is also noticed in the third-countries, although at a slower pace than observed for Germany, the Netherlands and Sweden.74 In Switzerland, investments in funds increased from 3,9% of total investments in 2008 to 8,2% in 2017. Also in the United States we notice an increasing trend towards funds, increasing from 15,6% in 1998 to 22,9% in 2018.
4.2.3 Unit-linked insurance
In this subsection, we provide an overview of the main trends for unit-linked investments. Since the ECB QSA dataset does not provide the distinction between non-unit-linked investments and unit-linked investments, the analysis is based on EIOPA Solvency I and Solvency II data for the period between 2005 and 2017.
The unit-linked investments in the EU have increased from around 1.611 billion EUR in 2005 to 2.728 billion EUR in 2017, an increase of 70%, with a noticeable drop around the period of the financial crisis in 2008. Over the same period, the total investments showed a similar growth. The United Kingdom, France, Ireland, Italy, Denmark, Luxembourg, Sweden, Germany, the Netherlands and Finland make up 95,8% of all unit-linked investments in the EU at year-end 2017. British insurance companies have historically dominated this market over the period in scope, although the share of the United Kingdom in the EU is gradually decreasing (from 59,1% in 2005 to 46,4% at the end of 2017), as shown in Figure 21.
Figure 21 – Trends of unit-linked investments across the EU for the period 2005-2017
The ten most important EU Member States in terms of amounts are shown separately, covering 95,8% of the total over all EU Member States at 2018 Q1. The remaining EU Member States are clustered.
Note that in 2015 there is a missing value for Luxembourg.
Source: EIOPA Solvency I and Solvency II statistics and Deloitte-CEPS analysis
74 For Japan, the available data was too limited to make similar analyses.
0,0%
2,5%
5,0%
7,5%
10,0%
12,5%
15,0%
17,5%
20,0%
22,5%
25,0%
27,5%
30,0%
32,5%
35,0%
37,5%
40,0%
42,5%
45,0%
47,5%
50,0%
0
150.000
300.000
450.000
600.000
750.000
900.000
1.050.000
1.200.000
1.350.000
1.500.000
1.650.000
1.800.000
1.950.000
2.100.000
2.250.000
2.400.000
2.550.000
2.700.000
2.850.000
3.000.000
2005 2006 2007 2008 2009 2010 2011 2012 2013 2014 2015 2016 2017
Unit-lin
ked investm
ents
(in
% o
f to
tal in
vestm
ents
)
Unit-lin
ked investm
ents
(in
Mio
EU
R)
Other
FI
SE
LU
IE
DK
NL
IT
DE
FR
GB
% EU

European Commission - Study on the drivers of investments in equity by insurers and pension funds
December 2019 I 93
The share of unit-linked investments in life insurance within the total investments across the EU has been relatively stable over this period at around 27%, with a (slight) increase since the entry into application of Solvency II). Note that this percentage is heavily influenced by the large share of the United Kingdom. If the United Kingdom were excluded, the share of unit-linked investments across the EU would drop to 19,2% at year-end 2017. Furthermore it then shows an increasing trend from 16,3% in 2005, mainly for Denmark, Finland and Sweden.
The slight upward trend observed since 2008 for life insurers outside the United Kingdom, to increasingly move a larger part of their business into unit-linked products, may have several reasons.
Firstly, life insurance products are typically very long-term and often linked to the wealth management business. Life insurance products can be seen in this way as an alternative to long-term savings products. Given the current low interest rate environment and the related decrease in guaranteed interest rates offered in (life) insurance contracts, policyholders are searching for higher yield through unit-linked products. Across countries, differences exist in (favourable) tax treatment exemptions on contributions and withdrawals.75 For example, governments can induce individuals to start organising their pension benefits themselves through succession planning.
Demographic trends in Europe may play a role as well: a combination of increasing life expectancy, decreasing birth rates, and expenses for pensions and social security gradually taking a more pronounced part in the government budgets may be inducing more individuals to start organising their own retirement planning. Interestingly, research by McKinsey (2018) also makes the link between these demographic evolutions and the launch of the European Commission’s pan-European Personal Pension (PEPP) program, which is expected to bring more competition and pressure (both on inflows and profitability) on the (traditional) life insurance industry in the coming years.76
Secondly, the combination of the aforementioned prolonged low interest rate environment with the Solvency II prudential framework has brought a change to insurers’ product offering and commercial strategy, shifting away from guaranteed products, towards offering of less capital intensive new insurance products. As part of this strategy, insurance companies are, for example, increasingly promoting
unit-linked products, thereby shifting the risks towards their policyholders. The shift is also accompanied by a search for a higher yield on the side of the policyholder. To be able to provide this higher yield, (indirect) equity investments (as opposed to fixed income) often represent a larger share of the asset allocation in unit-linked products, compared to traditional insurance products.
In its sixth Consumer Trends report (2017e), EIOPA states that, for the reasons above, guaranteed products have continued to decrease relative to non- or less guaranteed products.77 Products in which the policyholders bear the investment risk to a larger extent are increasingly replacing the more traditional insurance products for which the insurance companies guaranteed an annual benefit and hence bear the risk of adverse financial markets. Guarantees are much less common in index-linked and unit-linked insurance than other types of life insurance, and in general, the countries with a low
75 As an example, a study by EY (July 2017) on the European Personal Pension Framework confirms this (pages 10-13). 76 McKinsey (2018): A vision for European life insurance: the time for bold action has come 77 Source: https://eiopa.europa.eu/publications/reports/sixth%20consumer%20trends%20report.pdf (p. 14).

European Commission - Study on the drivers of investments in equity by insurers and pension funds
December 2019 I 94
proportion of products with guarantees have significant volumes of unit-linked life insurance. This trend is to a major extent driven by commercial strategies that are put in place by the insurers to incentivise their customers to switch from traditional products with guarantees to unit-linked policies offering fewer financial guarantees.
In their report on long-term guarantees measures and measures on equity risk of 2018, EIOPA discusses the impact of Long-Term Guarantees (LTGs) on consumers and products. Following the Solvency II lines of business, 89% of life insurance contracts with profit participation contain an interest rate guarantee. This type of guarantee is offered in almost all EU Member States, apart from Denmark, Ireland and the United Kingdom. Those three countries present a high amount of unit-linked business, where these guarantees are much less common. Only 15% of all unit-linked contracts in the European markets contain a guaranteed interest rate.
Furthermore, EIOPA distinguishes between products that are still commercialised and
products that are in run-off. The main observation is that the average guaranteed interest rates are much lower for products that are still commercialised today. In Austria, Germany and Luxembourg the decrease in guaranteed rates is partially due to changes in the legislations limiting the guaranteed rates insurers can offer.
In terms of share of total investments, compared to the EU as a whole, the United
Kingdom, Luxembourg and Ireland have historically significantly more exposure towards unit-linked investments, while France and Germany have significantly less. In Denmark, Sweden and Finland we observe a significant increase in the share of the investments related to unit-linked products over the period from 2005 until 2017.
Comparing this trend to a number of third-countries78, we observe that in Switzerland, for example, unit-linked investments have been very stable at the level of 3,3% of total
investments over the period between 2008 and 2017. The share allocated to unit-linked investments by Japanese insurers has shown more fluctuation around the level of 5% over the period between 2001 and 2017, and in recent years it has shown a decreasing trend.
The United Kingdom has historically been one of Europe’s largest life insurance
markets. Stakeholders from the British market agree that under Solvency II and the preceding British prudential regime ICAS79 (which came into force in 2004), with-profits business and annuities business is capital intensive, and has led insurers to focus more on capital-light business models and products. This has led to a significant amount of British insurance undertakings gradually pulling out of these markets, focusing on capital-light unit-linked products, thereby shifting the risk towards the policyholders.80
In Luxembourg, the share of unit-linked investments has been significantly higher than the EU average over the period 2005-2017 as well. The country has a number of benefits, which drive the high share of unit-linked products, around 70% of total
78 For the United States, the available data from the Federal Reserve do not include granular information on the unit-linked investments.
79 The Individual Capital Adequacy Standards (ICAS) framework was the predecessor of the Solvency II framework in the
United Kingdom, and came into force on 31 December 2004. Under this framework, insurance undertakings must undertake regular assessments of the amount and quality of capital which should be adequate for the size and nature of the business.
One of the main aims of the regime was to encourage better risk management and measurement practices, an element that also forms the foundations of the current Solvency II framework.
80 Based on feedback from the Association of British Insurers (ABI).

European Commission - Study on the drivers of investments in equity by insurers and pension funds
December 2019 I 95
investments. These benefits include the protection of the assets81 of the policyholder, the flexibility of investment and contract design, the fiscal neutrality, and confidentiality. Luxembourg’s political stability and economic strength have ensured the country a long lasting AAA credit rating by rating agencies Standard & Poor’s, Moody’s and Fitch.
Traditionally, Irish insurance companies predominantly sell unit-linked contracts. Unit-linked investments represent around 65% of total investments. Many Irish stakeholders corroborate that this has long been a feature of the market.
For Danish insurers, the share of the unit-linked investments, within the total investments, has increased from 3,5% in 2005 to 35,9% in 2017, especially in the first years following the financial crisis. The IMF report for Denmark (IMF, 2014) indicates that the Danish insurance market has been largely dominated by with-profit products offering guaranteed annual returns. However, the importance of unit-linked products is growing as insurers adjust to the low interest rate environment and the increased longevity, which are putting guaranteed rate products under pressure.
In Sweden, we note an increase in unit-linked investments from 14,6% in 2005 to 43,5% in 2017, a trend that is also mentioned in the IMF report for Sweden of October 2017 (IMF, 2017b). According to the Swedish NSA, Swedish insurance companies have promoted unit-linked business to the policyholders as a risk reduction measure, confirming this trend. This has especially been the case since interest rates started to decline in 2011. The fact that the tax regime on these products is favourable compared to investment income tax for the policyholder has also encouraged this trend.82
In Italy, however, we note – as from 2014 – an increasing trend of the share of the unit-linked investments within the total of investments. Before 2014, the share of unit-linked products decreased significantly, from 29,4% in 2007 to 17,2% in 2013. This
period was characterised by the financial crisis and a stronger demand for with-profit products in comparison to unit-linked products.
In the Netherlands, the share of unit-linked investments in comparison to total investments depicts a decreasing trend starting from 2009. In 2009, the share of unit-linked investments amounted to 30,2% and decreased to a level of 26,4% in 2017.
4.2.4 Conclusions
Based on the above analyses of the EU insurance market and third-countries Japan, Switzerland and the United States, we highlight a number of key trends for equity investments by EU insurers over the past 20 years.
Over the last two decades, the financial markets have been significantly affected by two financial crises, namely the dot-com bubble in 2002 and the global financial crisis in 2008. Coinciding with this, investments in listed equity by insurers dropped significantly over the last 20 years; from 11,5% of total investments in 1999 to 3,3% of total investments in 2009. The trend analyses show that, after each crisis, investments in listed equity never recovered to their pre-crisis levels. As from 2011,
81 The protection of a policyholder’s assets is specific to aspects of the Luxembourg regulation, and includes for example the fact that policyholders’ assets are segregated from the assets of the insurer, as described in ‘Quel avenir pour les fonds en
Euros?’ (Agefi, 28 January 2014). The protection is known as the ‘triangle of security’ and is effectively a legal obligation for the insurer to transfer the policyholder’s assets to a custodian bank approved by the regulator.
82 As confirmed by the Swedish Supervisory authorities and Insurance association.

European Commission - Study on the drivers of investments in equity by insurers and pension funds
December 2019 I 96
investments in listed equity remained relatively stable, with the exception for the insurance market in Denmark and Luxembourg, where we see an increasing trend.
In contrast to the decreasing trend in listed equity, EU insurers’ investments in unlisted
equity have been relatively stable around the level of 7% over the period between 1999 and 2018. Trend analyses of Japan and Switzerland show similar results, while in the US insurance market (total) equity investments have been increasing again in recent years.
The decrease in investments towards listed equity coincides with an increasing trend towards non-money market funds, from 14% in 1999 to 26% in 2018, with a significant increase after the financial crisis of 2008. EIOPA data indicate that at year-end 2017 approximately a third of investments in non-money market funds is related to equity exposures.
During the observation period, the possible effects of reclassifications, as e.g. in Sweden (2009) and France (2016), cannot be ignored. In this context, it is also likely that under Solvency II, a number of equity investments which were previously reported as non-money market funds, are now classified as bonds, listed and unlisted equity etc. This effect (if any) should in any case be limited to the last two years of the data series, i.e. under Solvency II reporting. Given that this increased data granularity is only available under Solvency II, unfortunately the ECB data do not further specify the equity exposures within these funds, nor allow to make the analysis, and confirm whether this drop in listed equity has been (partly) compensated by another equity investment.
At the EU level, unit-linked investments have remained relatively stable at around 27% of total investments over the last 20 years. Historically, almost half of the unit-linked business is represented by insurance undertakings in the United Kingdom. The
trend analyses for Switzerland show similar behaviour regarding the relative stability of the share of unit-linked business, albeit at a lower level than the EU average. In Japan, unit-linked investments show a decreasing trend in recent years.
Due to the current low interest rate environment and the related decrease in guaranteed
interest rates offered in (life) insurance contracts, policyholders are searching for higher yield through unit-linked products. In recent years following Solvency II, insurers are shifting the risks towards their policyholders by increasing their volume of unit-linked business. In order to provide this higher yield, equity investments – and in particular through indirect equity – within the unit-linked business are usually higher compared to traditional insurance products.
Finally, we stress some limitations. The lack of granularity of the data, especially with
respect to the equity exposure within collective investment undertakings, limits a number of the analyses, mainly with respect to trends in indirect equity. Furthermore, the fact that the considered period witnessed two financial crises, a major change in accounting framework (IFRS) and a change in the regulatory framework (Solvency II) cause inconsistencies in data definitions and reclassifications.

European Commission - Study on the drivers of investments in equity by insurers and pension funds
December 2019 I 97
4.3 Drivers
The current levels of equity investments by insurers and pension funds are the result of various drivers, which interplay to influence insurers’ and pension funds’ equity investments behaviour. The literature identifies six of these drivers as the most relevant driver categories of equity investments by these institutions, namely market conditions, Asset Liability Management, the prudential framework, undertaking characteristics, the accounting framework, and the tax framework. All of these drivers interact with each other.
4.3.1 Market conditions
Market conditions underpin the business model of insurers. Insurers receive premiums from policyholders in exchange for a financial promise. Insurers then invest a portion of these premiums in the capital markets to be able to obtain the returns necessary to fulfil their financial obligations and ensure a profit to sustain their activity. At any point in time, market conditions influence the volume of premiums insurers are likely to receive and the level of returns they are likely to obtain. As noted in the literature review, there is empirical evidence to support that prevailing market conditions are influential in the equity investments of the EU insurers. This section starts with a brief background on the development of market conditions in the EU during the last two decades, and then states the results of the drivers’ analysis for insurers.
The economic environment in which the European insurers have conducted business in the last two decades has included the introduction of the Euro, the enlargement of the EU, the bursting of the dot-com bubble, the global financial crisis and the sovereign debt crisis. The first two events created a stronger EU economy whereas the global financial crisis and its repercussions had an adverse effect on the economy.
Economic growth in the EU can be summarised in three periods (EUROSTAT, 2018).
Between 2000 and 2007, the EU GDP grew annually between 1% and 3%. The aftermath of the financial crisis between 2008 and 2013 was characterised by a strongly negative impact on the GDP. For example in 2009, the EU GDP shrank by 4% and another negative growth rate was registered in 2012. Post-2013, there has been a recovery period during which we observe growth rates of around 2%. According to the Winter
2019 Economic Forecast (EC, 2019), the GDP growth in both the euro area and the EU slipped to 1,9% in 2018, down from 2,4% in 2017. The EU economy is expected to grow for the seventh year in a row in 2019, with expansion forecast in every Member State. The pace of growth overall is projected to be moderate compared to the rates of recent years and the medium and long-term outlook is subject to large uncertainty.
The EU has experienced moderate inflation rates during the last two decades
(EUROSTAT, 2018). According to the Harmonised Index of Consumer Prices (HICP) data, the inflation rate has been at around 2% between 2001 and 2007. Starting from the financial crisis until 2011, the inflation rate has been more volatile and gradually decreased from 3% in 2011 to 0% in 2015. Recently, the inflation rate has been increasing again to 1,7% in 2017.

European Commission - Study on the drivers of investments in equity by insurers and pension funds
December 2019 I 98
Figure 22 – Evolution of EU government bond yield index
Source: Bloomberg
The global financial crisis has had important implications for the long-term interest rates. The 10-year interest rate in the EU was 5,3% in early 2000 (EUROSTAT, 2018). As can be observed in Figure 22, the EU 10-year government bond index fluctuated between 5% and 3% until 2011 with a drop of around 1% during the global financial
crisis. However, after 2011, the rates started decreasing gradually and even dropped to negative values in 2016. In the aftermath of the financial crisis, the ECB decreased policy rates and resorted to other non-standard monetary policy tools to stimulate the economy. The policy rate has not picked up again since then. In parallel, long-term yields also fell. At the end of 2017, the EU government bond yield was reported at 0,4%.
After 2008, the ECB lowered policy rates to the ‘zero-lower bound’ to stimulate
economic growth and bring back inflation rates to levels below, but close to, 2%. Furthermore, the ECB, similar to the FED in the US and Bank of England in the United Kingdom, implemented unconventional monetary policy tools and launched the ‘asset purchase programmes’ in 2009 to further provide stimulus. First, the Covered Bond Purchase programme (CBPP1) started on 2 July 2009. After that, the Securities Markets Programme (SMP) started on 10 May 2010, CBPP2 was launched in November 2011, the Asset-Backed Securities Purchase Programme (ABSPP) as well as CBPP3 were
launched in the fourth quarter of 2014, and the Public Sector Purchase Programme (PSPP) was launched on 9 March 2015. March 2015 is referred to as the start of the ECB’s Quantitative Easing (QE). Finally, the Corporate Sector Purchase Programme (CSPP) started in June 2016. In addition to the implementation of outright purchases of assets, the regular open market operations have been complemented by long-term refinancing operations (LTROs) and targeted longer-term refinancing operations (TLTROs) against adequate collateral (eligible assets), in order to further ease private sector credit conditions and stimulate bank lending to the real economy.
-1,0
-0,5
0,0
0,5
1,0
1,5
2,0
2,5
3,0
3,5
4,0
4,5
5,0
5,5
6,02000 Q
1
2001 Q
1
2002 Q
1
2003 Q
1
2004 Q
1
2005 Q
1
2006 Q
1
2007 Q
1
2008 Q
1
2009 Q
1
2010 Q
1
2011 Q
1
2012 Q
1
2013 Q
1
2014 Q
1
2015 Q
1
2016 Q
1
2017 Q
1
2018 Q
1
EU
Govern
ment
Bond Y
ield
Index

European Commission - Study on the drivers of investments in equity by insurers and pension funds
December 2019 I 99
Figure 23 – ECB assets and asset purchase programs
Source: ECB
Figure 23 shows the balance sheet of the ECB for the last two decades and the start dates of the various asset purchase programmes. As can be observed from this graph, the assets of the ECB have increases five-fold between 2009 and 2017. The growth in the assets is more pronounced after 2014 (due to Quantitative Easing).
As noted in the literature review, several studies refer to the relationship between stock markets and equity investments. Since 1998, there have been two important downturns in European and global stock markets. The first one was related to the bursting of the dot-com bubble between 2000 and 2003, and the second one was during the global financial crisis. As it can be seen in Figure 24, during the burst of the dotcom bubble, the STOXX50E stock market index plummeted to 2.000 points from 5.145 points. The
stock markets recovered to the level of 4.399 points at the end of 2007, were then hit by the financial crisis and dropped back to 2.000 points. Since the second quarter of 2009, markets have been recovering but it is interesting to note that the STOXX50E has still not reached the pre-global financial crisis level.
CBPP1 CBPP2SMP CSPP
PSPP
ABSPP and
CBPP3
0
250.000
500.000
750.000
1.000.000
1.250.000
1.500.000
1.750.000
2.000.000
2.250.000
2.500.000
2.750.000
3.000.000
1998 Q
4
1999 Q
4
2000 Q
4
2001 Q
4
2002 Q
4
2003 Q
4
2004 Q
4
2005 Q
4
2006 Q
4
2007 Q
4
2008 Q
4
2009 Q
4
2010 Q
4
2011 Q
4
2012 Q
4
2013 Q
4
2014 Q
4
2015 Q
4
2016 Q
4
2017 Q
4
ECB A
ssets
(in
Mio
EU
R)

European Commission - Study on the drivers of investments in equity by insurers and pension funds
December 2019 I 100
Figure 24 – Evolution of STOXX50E and drops in markets
Source: Yahoo Finance
Volatility in the markets is noted as one of the risk indicators that insurers take into account while deciding on their equity investments. In order to track the risk, the Chicago Board Options Exchange Volatility Index, or VIX, is plotted in Figure 25.83 After the dot-com crisis, the volatility in the markets gradually dropped and started to increase again in 2007. The index jumped during the financial crisis and then quickly went down again. After another increase is observed in 2011, due to the sovereign debt crisis, (though not as sharp as during the financial crisis), the index decreased to pre-2008 levels.
Figure 25 – Evolution of VIX
Source: Federal Reserve Database
83 VIX provides the market’s expectation of 30-day forward-looking volatility and uses S&P 500 index options for the calculations.
0
500
1.000
1.500
2.000
2.500
3.000
3.500
4.000
4.500
5.000
5.500
6.000
1998 Q
1
1999 Q
1
2000 Q
1
2001 Q
1
2002 Q
1
2003 Q
1
2004 Q
1
2005 Q
1
2006 Q
1
2007 Q
1
2008 Q
1
2009 Q
1
2010 Q
1
2011 Q
1
2012 Q
1
2013 Q
1
2014 Q
1
2015 Q
1
2016 Q
1
2017 Q
1
2018 Q
1
STO
XX50E I
ndex
0
5
10
15
20
25
30
35
40
45
50
55
60
65
70
1998 Q
1
1999 Q
1
2000 Q
1
2001 Q
1
2002 Q
1
2003 Q
1
2004 Q
1
2005 Q
1
2006 Q
1
2007 Q
1
2008 Q
1
2009 Q
1
2010 Q
1
2011 Q
1
2012 Q
1
2013 Q
1
2014 Q
1
2015 Q
1
2016 Q
1
2017 Q
1
2018 Q
1
VIX

European Commission - Study on the drivers of investments in equity by insurers and pension funds
December 2019 I 101
Quantitative analysis
The impact of market conditions on the behaviour of insurers towards equity investments is analysed through a number of variables: GDP, inflation rates, monetary policy, financial indicators and financial sophistication of domestic markets.
We study the relationship between equity investments and the macroeconomic variables via GDP, inflation rates, interest rates, policy rates, market returns, asset purchases of the ECB, a volatility index for stock markets, and a market capitalisation as independent
variables. For each EU Member State, nominal values of GDP are seasonally adjusted, and then further adjusted by the Harmonised Index of Consumer Prices (HICP) to create price adjusted (i.e. real) GDP series. Analysis of the real GDP data together with the inflation rate allows us to study the relationship of investments with the price changes and real economic activities separately. Based on the results from Jakubik and Turturescu (2018), a positive sign is expected for the coefficient of GDP. There is no a priori expectation for the sign of the coefficient of inflation.
For the monetary policy indicator, the ECB marginal lending facility interest rates are
used. However, the policy rate itself is not enough to capture the developments in the monetary policy, especially after the Global Financial Crisis. During this period, the ECB implemented the asset purchase programs to stimulate economic activities, the so-called Quantitative Easing (QE). Therefore, in addition to the policy rate, we use the volume of assets purchased by the ECB as an additional variable in the analysis.
EU government bond yields84 are added to the quantitative analysis in order to examine the relationship between equity investments and bond rates. Similar to the GDP variable, this variable is adjusted for the inflation rate and therefore, includes the real interest rates in the regressions. The literature (Jakubic and Turturescu, 2018) suggests that, as the bond yields drops, the insurers will search for yield and increase their equity investments. According to this study, a negative sign for the coefficient of the long-term interest rate variable should be expected.
For the stock market returns, several stock indices such as STOXX50E, MSCI Global, and EURONEXT are considered. By using a multinational index, the objective is to model the equity portfolios of European insurers. In the regressions, the STOXX50E index return results are the most robust, hence, the conclusions on regressions are based on this index. The relationship between equity investments and stock markets is one of the issues that draws a lot attention in the literature (Blake et al., 1999; Bijlsma and Vermeulen, 2016) and a positive sign is expected for this variable.
As explained in section 3.7, which describes the econometric models used in the study, the modelling approach first specifies a ‘base model’ and then adds variables in each
category of drivers. The base model can be regarded as the economic framework in which the insurers are operating. The quantitative analysis considers real GDP, inflation rates, real interest rates, policy rates and market returns in the base model.
As part of the analysis of the market conditions, the base model is extended with the
asset purchases of the ECB, a volatility index for stock markets and a market capitalisation variable. As described above, the asset purchase variable aims to capture the monetary conditions after the global financial crisis. The VIX volatility index is used as a proxy for the level of uncertainty in the stock markets. The assumption is that when
84 European Monetary Union (EMU) convergence bond yields are also considered in the study. However, the EU government
bond yields provides a complete dataset for the EU Member States, and return significant results. However, EMU convergence bond yields can also return negative coefficients.

European Commission - Study on the drivers of investments in equity by insurers and pension funds
December 2019 I 102
the volatility – and thus the level of uncertainty – increases, insurers will be less willing to invest in equities. Finally, the market capitalisation variable is included, normalised by the nominal GDP for each EU Member State, as a proxy for the level of development of the financial markets. The assumption is that a higher financial development of the markets will allow for more opportunities to invest in, and therefore result in higher equity investments.
As expected from the literature study, the regression results deliver a positive sign for
the real GDP with all dependent variables and across all model specifications. The exception is the regression where the dependent variable is the ratio of unlisted equity to total investments, for which the results are not robust.85 Furthermore, in the regressions where the dependent variables are the amounts invested in equity, the estimated coefficient is statistically significant in most of the model specifications. The significance is lost in the regressions where the dependent variable is the ratio of equity (listed, unlisted and total) to total investments. This result can be understood via the
studies of Bianchi et al. (2011) and Focarelli (2017), who find evidence for a positive relationship with total investments of insurance corporations and economic growth: when the ratio of equity investments to total investments is taken, the effect of economic growth on total investments and on equity investments may be cancelling each other out. Hence, the statistically insignificant coefficients with the variables of ratio.
Additionally, in the regressions where the dependent variables are the amounts invested
in equities, the estimated coefficients of the real GDP have the largest magnitudes. This observation, however, does not extend to the regressions where the dependent variables are the ratios.
The models with the dependent variable of listed equity provide statistically significant
and robust results for the coefficient of the stock market variable.86 Confirming the empirical findings of the literature, the estimated coefficient for this variable has a positive sign where the dependent variables are the amounts invested in listed equity and the ratio of listed equity to total investments. However, in line with expectations, it has a negative sign where the dependent variable is the adjusted amounts. In most of the model specifications, the coefficient is statistically significant at a 1% level.
Regarding the results for the inflation rate, in the regressions where the dependent variable is adjusted amounts of listed equity or the ratio of listed equity to total investments, the estimated coefficient is statistically significant at a 5% or 1% level for all model specifications and the significance is robust for all model specifications.87 Even though there is statistical significance with other dependent variables of equity, the significance is not robust within the models of the dependent variable.
85 See Table 9 of Annex 1. On the row ‘Real GDP’, the regression coefficient is positive for the first columns, but is negative
for the regression ‘Full Model with Solvency II Introduction - Fixed Effects’, and ‘Full Model with Solvency II Regulation – Fixed Effects’.
86 See Tables 5 & 6 of Annex 1. In Table 5, on the row ‘STOXX50E’, the regression coefficients are positive and statistically
significant for the ‘Base Model – Fixed Effects’ and for ‘Full Model with Solvency II Introduction - Fixed Effects’. In Table 6, on the row ‘STOXX50E’, the regression coefficients are negative and statistically significant for the ‘Base Model – Fixed Effects’
and for ‘Full Model with Solvency II Introduction - Fixed Effects’. 87 See Tables 6 & 7 of Annex 1. In Tables 6 and 7, on the row ‘Inflation Rate’, the regression coefficients are significant for the ‘Base Model – Fixed Effects’ and for ‘Full Model with Solvency II Introduction - Fixed Effects’.

European Commission - Study on the drivers of investments in equity by insurers and pension funds
December 2019 I 103
The estimated coefficients for the inflation rate variable are positive in the regressions where dependent variables are ratio of listed equity and total equity to total assets, and where the dependent variables are the ratio of unlisted equity to total investments.88 A positive sign is in line with the implications of Boudhoukh and Richardson (1993) and Black (1989) on equities as a hedge against inflation. However, as noted by Verboon (2012), results for the inflation are sensitive to the sample of countries and time period used in the empirical study.
The coefficients obtained for the real interest rate variable suggest that there is a positive relationship between the increases in the real interest rate and equity investments in listed equity and total equity. This result is statistically significant for the dependent variable of listed equity and robust for the dependent variables of listed equity and total equity across all model specifications.89 However, we do not obtain robust results with the dependent variables of unlisted equity.
The relationship suggested by the coefficients is not in line with the findings of the literature, namely a negative coefficient for the interest rate variable (Jakubic, P. and E. Turturescu, 2018). The obtained result may be influenced by our selection of the interest rate variable and the equity variables that are used in the regressions. The study by Jakubic, P. and E. Turturescu (2018) uses the EMU convergence bond yields while this study uses the EU 10-year government bond yield, based only on the German and French government bonds. Secondly, the equity data from the ECB does not contain
indirect equity investments. The findings in the literature may be relevant for the overall equity investments but when focusing on the direct investments, a deviation from the implications of the literature on the link between overall equity investments and long-term interest rates can be observed.
The results obtained for the coefficient of the policy rate variable show a mixed picture.
In the regressions where the dependent variable is either the adjusted listed equity amounts, the ratio of listed equity to total investments, or total equity to total investments, the sign of the coefficient is consistently positive.90 For the regressions where the dependent variable is the amount invested in unlisted equity, the sign becomes negative.91 For the remainder of the variables, there are no robust results. Therefore, no conclusions can be drawn on the link between the monetary policy and the equity investments.
Concerning the sign of the coefficient, the estimated coefficient of the volatility variable has a negative sign as expected in the regressions where the dependent variables are listed equity, ratio of listed equity to total investments, total equity amounts, or ratio of total equity to total investments, whereas for the other dependent variables no conclusive results are found. The most robust results regarding the sign of the coefficient are obtained for the variable of the market capitalisation. For all dependent variables and across all model specifications, a positive coefficient is obtained for this variable. The estimated coefficient for the ECB asset purchases is positive for the ratio of listed equity to total investments and the ratio of total equity to total investments. On the contrary, the estimated sign is negative for the amounts invested in unlisted equity.
When extending the base model with financial variables, we obtain statistically
insignificant results for the coefficients of the volatility variable. The ECB asset purchases and the market capitalisation give mixed results insofar as they are
88 See Tables 5 – 7, and 9 - 11 of Annex 1. In these tables, on the row ‘Inflation Rate, the regression coefficients are positive. 89 See Tables 5 and 10 of Annex 1. 90 See Tables 6, 7 and 10 of Annex 1. On the row, ‘Policy Rate’, the regression coefficients are positive. 91 See Table 8 of Annex 1. On the row, ‘Policy Rate’, the regression coefficients are negative and not statistically significant.

European Commission - Study on the drivers of investments in equity by insurers and pension funds
December 2019 I 104
statistically significant for some of the dependent variables, but for each of these, the significance is not robust across the model specifications.
Summary of the quantitative analysis
Firstly, the quantitative analysis on the regression results suggests that there is a procyclical relationship between economic development and amounts of equity investments of insurers; in a growing economy, insurers benefit from the positive impact of economic growth on the valuation of their balance sheet, but they also increase their exposure to equity by buying additional shares. The results with the ratio of investments to total investments suggest that this positive effect of the economic development might be valid for the whole balance sheet of insurers, since the significance of the results is lost in the regressions with the ratios. The impact on the equity investments and total investments might be offsetting each other as noted above.
Secondly, when inflation increases, insurers seem to react by increasing their
investments in equity and in particular, listed equity. An interpretation could be that insurers are using investments in equity as a hedge for inflation, which is a common portfolio management technique.
Thirdly, there is a positive relationship between the increase in stock market and the
ratio of listed equity to total investments. However, the relation is negative with the adjusted amount92 of listed equity. An interpretation could be that when stock markets are rising, insurers see their balance sheet expand via the market valuation effect on their stocks. They also use that period to divest from listed equity.
Fourthly, there is an indication of a negative, though not statistically significant, relationship between increases in the volatility in stock markets and investments in listed equity, ratio of listed equity to total investments, total equity amounts and ratio
of total equity to total investments. An interpretation of this could be that as the volatility in the market increases (risk indicator), insurers are less inclined to invest in equity.
Even though the results suggest that there is positive correlation with listed equity and
interest rates, this result is not supported by the literature. Furthermore, it is challenged by the interviews as it is described below.
Also, when extending the base model with financial variables, we obtain statistically mixed or insignificant results. As the significance, if present in some models, is not robust across the model specifications, they are considered not significant.
Finally, some findings (not statistically significant, but with a robust sign) may suggest
that more investments in equity will have a higher probability to be observed as financial markets become more developed.
Interview analysis Market volatility
Insurers point to market volatility as an important driver for asset allocation and individual stock picking. Market volatility is primarily factored in the risk-return assessment that determines the optimal portfolio allocation based on the relative
92 Adjusted amounts of equity investments refer to the amounts of equity investments that are adjusted for the changes in the stock markets. These amounts can be interpreted as adjusted for the valuation effect.

European Commission - Study on the drivers of investments in equity by insurers and pension funds
December 2019 I 105
attractiveness of certain asset classes. Due to the relatively higher returns and diversification characteristics of equity, several insurers indicate that it should always be part of the asset allocation. Given the inherently volatile nature of equity, the market volatility is therefore an important driver for equity investments.
Some insurers – both EU and non-EU – argue however for a lower importance of volatility because market volatility, and by extension asset allocation and ALM, needs to be looked at through the whole cycle and not at specific moments in time. This is because volatility has a tendency to cluster, being relatively high in periods of economic stress and relatively low in periods of economic stability. A non-EU insurer, for example, indicates that by cash-flow matching shorter duration cash flows, it is possible to hold equities through economic downturn and have time to recover before having to pay policyholders. Insurers sometimes deviate from the mandate of the strategic asset allocation by taking a tactical position in a certain asset class or have a pre-specified range for deviation; but in general, their allocation will not change much from one year
to another. For these insurers, investing in equity for the long run depends on the financial strength of the entity, as well as the capacity to smooth performance across the volatility cycles. In line with this, a non-EU insurer described market volatility as a short-term phenomenon. Due to the mid- to long-term focus of an insurer, they indicate this should be of secondary importance. An EU-insurer indicates that the importance of volatility or Earnings-at-Risk (EAR) is one of the main drivers during a crisis.
The interviewed insurers mentioned diversification as a driving factor arguing that
volatility and risk decreases in a well-diversified portfolio. Because of the inverted relationship between the returns of equity and interest rate bearing assets, some insurers thus believe that a proportion of equity is always desirable at any point in time.
During the interviews, one insurer indicates that they limit their exposure to the effect
of market volatility on their portfolio as much as possible by pursuing a low beta strategy93, and as such give lower importance to market volatility as a driver of equity. This is consistent with Van Vliet, P. (2012).
Some insurers are also concerned that the rising trend of index-linked and unit-linked investments is adding a new layer to the volatility of underlying assets. As policyholders do not necessarily have expert knowledge on equity and different attitudes toward risk,
they might sell during market downturns, thereby fuelling pro-cyclicality in the markets. Moreover, interviewees believe that policyholders might not be best placed or might not have the necessary tools at their disposal to extract/optimise performance and to decide on good market timing. This is in line with the findings of Barber and Odean (2008).
Finally, when looking at the relevance of the volatility as a driver of a certain type of
equity investments, the focus is mostly on listed equity. Six EU insurers and one non-EU insurer indicates that they consider market volatility in their decisions on listed equity investments, while there is no explicit comment for the unlisted equity. This is intuitive since market volatility can only be directly observed for the listed stocks.
In conclusion, the acceptance of equity volatility in the portfolios depends on the risk appetite of the insurers, and most insurers are prepared to manage a certain level of
volatility in their portfolios to achieve good performance irrespective of undertakings’
93 In classical finance, the beta of a stock is its exposure to macroeconomic risk and is measured as the covariance of that
stock with the portfolio benchmark (i.e. market portfolio that contains all risky assets) over the variance of the returns of the portfolio benchmark. A low beta strategy is a quantitatively driven strategy emphasising low beta stocks. Stocks are first
screened to remove those that score poorly on financial and growth measures. Those stocks that remain are then ranked according to their beta.

European Commission - Study on the drivers of investments in equity by insurers and pension funds
December 2019 I 106
characteristics (life vs. non-life, standard model vs. internal model, EU vs. non-EU, group vs. individual). It was also mentioned that the active use of management actions can have a strong countercyclical impact and equity needs to be monitored in a way that does not deteriorate performance.
Market events
Market events as a driver for equity investments scored medium to low among most
participants. Several interviewees mention that once the strategic asset allocation is set, market events do not significantly influence their holding of equity. Market events such as the dot-com bubble, the global financial crisis and the sovereign debt crisis, led some insurers to gradually de-risk their portfolios and lower their levels of listed equity. This was done in combination with other changes to their business models, for instance reducing/modifying policyholders’ benefits and their overall asset allocation. In particular, several participants indicated that the impact of the global financial crisis on the equity investments was minor, whereas that of the sovereign debt crisis was more
significant due to exposures to several southern European countries, for example in Italy, Greece, Portugal and Spain.
Average dividend yield
The interviewees consider the average dividend yield when deciding on whether to invest or not in equity, but it is not the main driver within the market conditions. Because of the current low interest rate environment, dividend yields overall are higher than the
interest rates available in the market, thereby also making investments in equity more attractive. However, the attractiveness of the average dividend yield also depends on the tax regime and the geographical location, in particular whether the investment is foreign-based and withholding taxes apply. In the future, the application of IFRS 9 could increase the importance of the average dividend yield, as dividends are always recorded in the profit and loss (P&L) account, regardless of fair value changes being recorded in the P&L or own funds.
One insurer indicates that the average dividend yield is less important than the overall
performance and the valuation of the equity. This insurer claims that if they had to decide on an asset class for its recurrent revenue, they would choose bonds. Several non-EU insurers indicate, however, that they consider the average dividend yield and stress the importance of dividend yield in combination with the interest rate. One insurer
indicates that they try to pay out the policyholder based on the running yield in various markets.
Market returns
Insurers rank risk-adjusted market returns the most important driver within the market conditions, but also overall across all six drivers categories surveyed, for both EU and non-EU insurers.
From an economic perspective, insurance companies try to maximise return and limit
their cost of capital. Overall, equities are expected to offer superior returns compared to Euro-dominated fixed income assets. Insurers indicate that therefore investing in equity makes sense from a return perspective, but they differ in the strategies they use to achieve good performance. In line with Lam (2014), some interviewees observe that investment experience shows that agility in rebalancing equity portfolios with proper market timing is instrumental to achieving superior performance. In contrast, the majority of insurers report having a buy-and-hold-(and hedge) investment strategy – as they mainly invest in equity with a long-term perspective, the return must be evaluated through the whole economic/financial cycle. For these insurers, from a strategic asset allocation perspective, equity allocations are quite stable, however, also

European Commission - Study on the drivers of investments in equity by insurers and pension funds
December 2019 I 107
allowing limited shifts between bonds and equities when it comes to tactical asset allocation.94 This corroborates the theoretical study of Spinu (2015) who proves that over a fixed time interval the buy-and-hold portfolio has the greater expected return versus a constantly rebalanced portfolio.
Similar to the market volatility, market returns are also expected to be more relevant for listed equity investments. This point is confirmed by reference to listed equity investments and market performance relationship by six EU insurers and one non-EU insurer.
Market structure
Differences in investment strategies might also be influenced by the availability of
certain financial products in the market. Governments, for example, might not issue enough bonds of a longer duration to meet the demand of the market or offer only bonds of a short to medium duration. One insurer indicates that Sweden, for example, only offers a limited amount of bonds and does not offer bonds with a duration of over ten years. The insurer indicates that, as a company, they are mainly invested in corporate bonds with regards to the fixed income assets. The insurer indicates that they still hold government bonds due to regulation and as part of the prudent approach.
One non-EU insurer indicates that the primary constraint on increasing their allocation
to equity is the market place. For private equity, for example, they mainly invest through funds and there are only a limited number of long-term successful private equity and hedge fund managers. Per the insurer, also the size of the investment can be a blocking factor. The possibility to make large allocations, for example, in the venture capital space or specific industries, are often limited.
Another non-EU insurer indicates that if the market does not provide the necessary
financial instruments, this is not an issue for them. An effective ALM and medium-term prospects allow the company to sustain obligations regardless of the availability of certain financial instruments. A non-EU insurer indicates that although the government issues sufficiently long durations of up to 30 years, the amount or the nominal issued, is not enough to meet market demand. As a large part of their business is also conducted within the EU, they also have significant exposure to Euro-denominated government bonds.
Interest rate level
Interviewees, in particular life insurers, explained that a prolonged period of low interest rates has adverse effects on their capital positions and profitability aspects. Life insurers, with sizeable proportions of traditional business, containing high levels of contractual guarantees on their books, are affected most when they do not have an effective ALM
in place, resulting in an ALM mismatch. The longer the duration of the liabilities, the more pressing this issue becomes. These comments from the insurers are in line with the findings of OECD (2015a) and EIOPA (2017c). Several insurers, however, anticipate an upward trend for the interest rates and decide to keep interest rate risk open in their portfolio, and as such accept a minimum level of duration mismatch.
94 Strategic asset allocation involves defining portfolio asset allocations from the outset, based on historical performance and volatility data over a representative period. Hence, strategic asset allocation aims to construct a portfolio allocation for
the long term by being indifferent to current market conditions, and leave it unchanged until risk tolerance changes.
Adopting the long-term asset class weightings of a strategic portfolio, tactical asset allocation gives investment managers the flexibility to vary those weightings according to market conditions within a risk-controlled framework. Hence, the manager
shifts around assets to the sectors or asset classes that the manager believes are strongest given their present market outlook.

European Commission - Study on the drivers of investments in equity by insurers and pension funds
December 2019 I 108
Interview participants indicate that on the assets side, the low interest rate environment also influences their search for yield. One insurer indicates that their search for investment income has pushed up their overall equity exposure. Several insurers indicate that they also look at alternative, more illiquid investments, especially if capital positions allow for this. Some, both EU and non-EU insurers have increased investments in privately sourced assets with an attractive illiquidity premium, such as private equity, private placement debt, commercial mortgage debt, agricultural mortgage debt, residential mortgages, home loans, direct lending, infrastructure and other types of assets.
Several participants also remarked that the lower interest rate levels in the north of Europe resulted in higher alternative investments, such as corporate bonds, private equity and infrastructure, whereas the higher interest rate levels in the south of Europe (i.e. 3-4%) make bonds still very attractive compared to equity investments.
One third-country insurer indicates that due to the low interest rate environment, they changed the guarantee level and then tried to move into the fee-based business, where the client bears the risk instead of the insurer.
Monetary policy
Monetary policy is seen by insurance companies to be of medium importance in
determining their investments in equities. Several insurers indicate that this not a primary concern, however, these insurers would welcome a normalisation of monetary policy conditions and a gradual exit from the Quantitative Easing programme by ECB.95 A non-EU insurer indicates that due to their investments in the European market, the monetary policies of the ECB influence their investments significantly.
One insurer indicates that due to negative policy rates, institutional investors, such as
insurers, will search for assets that generate positive real returns. Public and private equity are most likely to be chosen over fixed income assets for this purpose. However, these assets come with more stringent capital requirements. This then restrains the investments in these asset classes, per the insurer, and as a consequence also negatively impacts the overall capacity of an insurer to generate a return for investors and shareholders.
A similar remark is made by a Swiss insurer, who does not expect the Swiss central bank and other central banks to move interest rates higher in the near future and thus anticipates working in a low interest rate environment for a prolonged period of time. The insurer remarks that it will still invest in bonds, for ALM purposes. However, this also means that writing new life business with guarantees in Switzerland is economically unviable. Similarities can be drawn to Germany or other parts of the Eurozone with a
significant part of traditional business with a guarantee promised to the policyholder, for which the past guarantees put a lot of pressure on the new business. Having done ALM when yields were much higher, the insurer indicates that they are reasonably well protected against the past guarantees, but for new business and keeping the same guarantees, they face significant challenge to find financial products in the market with an attractive real return.
In anticipation of an increase in interest rates, several insurers indicate that they keep interest rate risk open in their portfolio. In case an increase would not happen, one
95 The ECB’s expansive monetary policy as part of its Quantitative Easing program consisted of a series of asset purchases which it carried out in response to the global financial crisis and the sovereign crisis that have hit markets in 2008 and 2011

European Commission - Study on the drivers of investments in equity by insurers and pension funds
December 2019 I 109
insurer indicates that they would think about increasing the duration of the assets significantly.
Quantitative Easing, among other things, also led to higher cross-asset correlations
(equity and fixed income markets), which in turn increased the return sensitivity to market-wide factors. Keeping the proportion of equity stable also derives from diversification considerations across asset classes, and within equity itself – geographical and sectorial. Nonetheless, equities can offer little diversification to other asset classes, as in times of crisis typically all correlations between risky assets, including equities, tend to increase.
Inflation
The non-EU insurers in the sample tend to find this driver more important than the EU companies. Notwithstanding that, all interviewees say that they monitor the expected evolution of inflation in order to hedge against it. In this context, many insurers observe that equity provides a sensible inflation hedge compared to fixed income. However, one EU insurer indicates that they do not use equity as a hedge against inflation and if they were to use it, they would prefer unlisted equity. Some insurers monitor inflation because their liabilities are sensitive to it. This is notably the case for insurers offering health insurance or inflation-adjusted annuities.
Macroeconomic fundamentals
The majority of participants rated macroeconomic fundamentals as very important for their investments in equities. In fact, an insurer sums up the point of view of the interviewees, i.e. investing in either equity or bonds requires looking at macroeconomic fundamentals, combined with data on inflation, interest rate level, valuation of equities, etc. As economic fundamentals, insurers use various variables that factor into their scenarios, e.g. GDP growth, Consumer Price Index (CPI), Purchase Manager Index (PMI) and Institute for Supply Management Index (ISM).
Summary of interview analysis
Overall, market conditions are described by the insurers as the most important category for determining their investments in equity. Indeed, market conditions underpin the business model of insurers, whereby the expected return is dependent on the assumptions they make on market conditions. The three most important drivers across
all interviews, namely market returns, market volatility and macroeconomic fundamentals, also stem from the category of market conditions. Insurers also agree across company differentiators – life vs. non-life, group vs. individual, EU vs. non-EU, etc. – on the importance of these three drivers. Not surprisingly, market volatility and market returns are drivers that are more pronounced for investments in listed equity.
Market volatility is an important driver for insurers for equity investments, as it is a central feature of their risk-return calculations and the capital requirements. For insurers, equity still has the best risk-return profile, but should be looked at from a long-term perspective. The acceptance of volatility in the insurers’ portfolio and the attractiveness of equity then depends on the risk appetite of the insurer, the financial strength of the insurers and the capacity to smooth the performance of equity across volatility cycles in line with a target asset allocation.
Market events are seen by most insurers as a short-term phenomenon and due to the long-term focus of the insurer, in general, per the participants, do not significantly influence their holding of equity. Several interviewees indicate that the decline in percentages for equity, are not to be attributed to a sale of equity, but for a large part

European Commission - Study on the drivers of investments in equity by insurers and pension funds
December 2019 I 110
to a market valuation effect caused by a slump in the market. Certain market events, such as the sovereign debt crisis, however structurally impacted the market and also impacted insurers more significantly due to higher exposures to several southern European countries.
In general, insurers tried to maximise their return, while limiting their cost of capital, based on several macroeconomic fundamentals. As equities historically still provided superior returns compared to the risk taken, many insurers prefer to hold a certain percentage of equity. An adequate real return is especially important, given the adverse effects the current monetary policy of prolonged period of low interest rates has had on the insurers’ profitability and capital positions. Insurers, however, do not exclude the possibility of a change in monetary policy and several insurers therefore kept interest rate risk open in their portfolio. In the search for yield, several insurers also indicate they have been looking at more illiquid investments, such as private equity, private debt and infrastructure investments.
As the low interest rate environment means dividend yields are higher than interest rates, equity investments still remain attractive. However, dividend yield, is for most insurers, just like expected evolution of inflation and market structure, not the main driver within the market conditions. Insurers are mainly interested in the expected evolution of inflation to hedge against it and equity is seen as an adequate asset class for this purpose. The availability of equity products is only a constraint for the private
equity products, for which the market place and the size of the investment were the limiting factors.
Conclusions
Market conditions underpin the business model of insurers and are core to their viability. In particular, the regressions, the literature review, and the interviews concur
that market returns are of utmost importance to insurers in conducting their investment decisions. Indeed, an attractive risk-return profile is an important incentive to invest in equity, given that equity is still considered to deliver a higher return over the long run, while taking into account the potential risks and volatility related to this kind of investment.
Next to equity returns, interviewees also refer to the attractiveness of this asset class
for two other reasons, namely from a diversification perspective, and from a hedging perspective to protect against inflation rate risk. Cash flows on the liability side are subject to inflation risk, which impacts directly the claims for non-life insurers and the premiums received for life insurers. As a result, higher inflation can be associated with a higher allocation to equity. Overall, insurers are searching for the optimal investment portfolio to maximise their returns, given the different constraints defined within their risk appetite.
Other elements positively associated with equity investments are economic
fundamentals and low interest rate levels. Market events (i.e. crises) negatively impact insurers’ investments in equity, as part of derisking behaviour.
According to interviews and the literature review, average dividend yield and market
volatility also play a respectively positive and negative role in the equity investments behaviour of insurers. While the regression results corroborate the finding for the market volatility, we have not been able to run a regression analysis on the average dividend yield due to a lack of historical data.

European Commission - Study on the drivers of investments in equity by insurers and pension funds
December 2019 I 111
Finally, market structure, seems to have very little influence on the equity investments of an insurer. In this regard, we point out that the absence of compelling information thereon in the literature and the lack of enough related data to test in the regressions could bias this conclusion. It is nonetheless worth mentioning the case of Sweden wherein the issuance of bonds over 10 year maturity is virtually inexistent leading to a duration mismatch which in turn could explain at least partially, why (composite) insurers in Sweden have a significantly higher (direct) equity exposure than the EU average.

European Commission - Study on the drivers of investments in equity by insurers and pension funds
December 2019 I 112
4.3.2 Asset and liability management
The core building blocks of an insurer’s Asset Liability Management (ALM) are the characteristics of its liabilities (duration, in- and outflows profile, product characteristics, including lapse rate) combined with the availability and suitability of assets to match these underlying liabilities. The key objective of ALM is then to limit the duration gap between assets and liabilities. In this section, the potential drivers concerning ALM are analysed only based on the outcome of the interviews and the literature as due to the lack of historical data for ALM variables, the section does not contain regression results.
Most insurance companies emphasise the importance of ALM principles as a driver of their asset allocation, including towards equity, and indicate that ALM policies are an integral part of their risk management frameworks and are generally aligned to their risk appetite and strategic objectives, in particular the optimisation of their long-term financial performance. This is in line with the findings of Gilbert (2016) who finds that companies manage their assets either within an ALM framework or separately, against a benchmark, within specified risk limits.
Many insurers indicate that their ALM policy results in target limits for asset allocation, i.e. a percentage per asset category not to be exceeded. While several insurers emphasise the liability-driven approach that ultimately determines the asset allocation, others describe their ALM policy as a hedging-driven approach.
It is interesting to note that several insurers apply a one balance sheet approach, especially at group level. Insurers then either work with internal targets for their life and non-life portfolios respectively, although still driven from a total portfolio level perspective, or without making a distinction between portfolios.
When a company is part of a group, the group investment policies are at the forefront of investment decisions and the flexibility given to local entities to depart from the group investment policies varies across insurance groups. Some insurance companies see the group policy as an aggregation of optimal investment plans for the underlying entities allowing for multinational implementation in local entities, requiring no deviations from the group policy. Others state that their governance and operating models allow for more delegation of responsibilities to the local entities when it comes to the country
specific characteristics of the insurance products offered, their guaranteed rate and profit sharing characteristics, and the overall cash flow and maturity profile of the liabilities. One insurer refers to a central steering mechanism, as knowledge and expertise around investment management are primarily maintained at the group level. This is echoed by another group, which reports having established a centre of excellence for cost-efficiency reasons, so that life and non-life business entities are no longer responsible for active asset management. In this respect, one respondent adds that the investment policy only sets out the principles and governance for internal asset management or mandated external asset managers, as well as the operating framework that the asset management company should follow.
As an example, one company refers to how they incorporate a long-term investment strategy and define a benchmark at the group level. The asset manager at group level
then manages the assets and aims to outperform this benchmark by tactically deviating from it within a specified set of risk limits defined by the risk management function.

European Commission - Study on the drivers of investments in equity by insurers and pension funds
December 2019 I 113
Average duration of liabilities
According to the EIOPA 2016 Insurance stress test report, the risk assessment of assets and liabilities can be done by means of duration estimation, for which the Macaulay duration is used.96 The scope of the stress test conducted by EIOPA includes 236 individual companies from 30 countries. In terms of technical provisions, the companies in the sample report 75% of their total technical provisions to be life insurance technical provisions, excluding index-linked and unit-linked contracts. Overall, the stress test report indicates a European market coverage of 77% of the total life technical provisions, excluding index-linked and unit-linked contracts, in the EEA.
The graph below shows the Macaulay duration (in number of years) across EU countries, and the equity exposures for these countries as percentage of total investments. The equity exposure of life insurance companies in the EU is positively correlated with the Macaulay duration for liabilities. The Pearson correlation coefficient ρ is equal to 0,36 and the R2 is 0,17.
Figure 26 – Macaulay duration for life insurance companies across EU Member States
Note that for Malta and Latvia no data is available in the EIOPA 2016 stress test report. For Finland, Czech Republic, Bulgaria, Estonia, Lithuania and Latvia the undertaking type is not published to maintain anonymity
in those countries where disclosing the undertaking type would risk identifying individual insurers. These countries are not included in the figure.
Source: EIOPA 2016 stress test report, EIOPA Solvency II statistics and Deloitte-CEPS analysis
From the EIOPA 2018 stress test report (EIOPA, 2018f), we note additionally that weighted97 average Macaulay duration of the technical provisions equals 12,5 years for life technical provisions and 4,1 years for non-life technical provisions.98
It emerges from the interviews that life insurance companies rank the duration of liabilities as a very important driver of their investment policies. Their strategic asset
96https://eiopa.europa.eu/Publications/Surveys/EIOPA-BOS-16302%20Insurance%20stress%20test%202016%20report .pdf
97 Durations of technical provisions are weighted by the best estimate of liabilities. 98 https://eiopa.europa.eu/Publications/Surveys/EIOPA%202018%20Insurance%20Stress%20Test%20Report.pdf
R² = 0,1713
0,0
2,0
4,0
6,0
8,0
10,0
12,0
14,0
16,0
18,0
20,0
22,0
24,0
26,0
0,0%
2,5%
5,0%
7,5%
10,0%
12,5%
15,0%
17,5%
20,0%
22,5%
25,0%
27,5%
30,0%
32,5%
35,0%
DK SK GB SE IE FR CY LU DE BE AT PL NL HU IT GR PT RO ES HRM
acaula
y d
ura
tion
Tota
l equity e
xposure
(in
% o
f to
tal in
vestm
ents
)
Equity exposure Duration

European Commission - Study on the drivers of investments in equity by insurers and pension funds
December 2019 I 114
allocations are tailored to capture a long-term view. Several participants indicate that the longer the duration of their liabilities, the higher the proportion of equities they consider holding. This can perhaps be explained by the finding of Gründl et al. (2016) that equity investments can help close a duration mismatch when liabilities’ duration is longer than the maturity of bonds available in the market.
In this regard, it is interesting to note the paradox with a number of countries, which,
despite a long liability duration are not investing in equity as much as could be expected. Looking at Germany, the duration of liabilities is high for its life insurers compared with other European countries. In addition, the average guaranteed rate for existing traditional products by German insurers is one of the highest among European countries. An analysis by the IMF (2016) shows that German life insurers invest conservatively, with rather limited exposures to equity and other risky asset classes.99 A German insurer refers to the search of minimum return to meet certain guarantees in their legacy life business, within a strategy of matching positions.
Another example is the Netherlands. An IMF report (IMF, 2017a) indicates that long liabilities of the Dutch life insurance market are traditionally matched by fixed income investments, typically in bonds, loans and mainly mortgages. Having a closer look into the balance sheet of the Dutch insurance market, one can see a relatively high allocation to mortgages, explained perhaps by the fact that Dutch mortgages are traditionally perceived as safe with very low default rates. Even in a low interest rate environment,
the return remains attractive. However, a Dutch insurer observes that while in the past they were mainly invested in safe Dutch and German government bonds, they have over time slightly moved towards investment-grade spread bearing assets.
For Sweden (IMF, 2017b), the duration gap is among the highest in the EU. Their long-duration contracts are difficult to match because the bond market structure is such that
there is almost no issuance of Swedish government bonds beyond a 10-year maturity. This could be one reason why Swedish insurance companies have traditionally higher equity exposures compared to their European peers. In addition, the prolonged low interest rate environment poses a supplementary challenge for life insurance companies that need to match asset durations to their long-term liabilities. As a result, in parallel with reducing/modifying guarantees offered in new business and increasing sales of unit-linked policies, insurers have been changing their asset allocation. The companies
with a solid financial position have been taking on more risk, for example moving out of sovereign bonds and into corporate bonds and equity. One participant indeed indicates the lack of access to long-dated fixed income assets within Sweden as one of the reasons for investing a higher percentage of the portfolio in equity.
A special case to mention is Spain. According to an ESRB report (2016, Section C) on the impact of low interest rates, the small duration mismatch for Spanish insurers is mainly a consequence of Spanish-specific regulation.100 Almost half of the long-term life insurance contracts are managed using ALM-immunisation techniques based on cash flow matching, in which guaranteed returns are based on the yield of matching assets. Companies are required to explicitly identify the assets backing these contracts. The vast majority of these assets are fixed-income bonds held to maturity. This was
99 German life insurers invest conservatively, with rather limited exposures to equity and other risky asset classes (IMF 2016).
From 2001 onwards, the ECB data shows a departure in the German insurance market from listed equity toward non-listed equity. A German insurer suggests that German insurance companies reviewed risk following the dotcom crisis, including risk
in listed equities, and, as a consequence, derisked their portfolios. As a secondary effect, they shifted their equity to illiquid, unlisted equity, at least partially explaining the observed decline in listed equity. 100 Almost half of the long-term life insurance contracts are managed using ALM-immunisation techniques based on cash flow matching, in which guaranteed returns are based on the yield of matching assets. Undertakings should explicitly identify the
assets backing these contracts. The vast majority of the assets are fixed-income bonds held to maturity (ESRB report Nov 2016 – C).

European Commission - Study on the drivers of investments in equity by insurers and pension funds
December 2019 I 115
confirmed by interviews with Spanish life insurers who invoked the Spanish regulation on ALM as the reason for their small equity investments.
Regarding non-life insurance companies, Gründl et al. (2016) point out that they offer
short-term policies, and their claim distributions are in general more volatile, making the management of their liquidity risks an important goal of the ALM, i.e. ensuring proper short-term liquidity management. They are therefore usually not able to invest a large part of their portfolio in illiquid, long-term investments.
Consistent with Doff (2011), a number of respondents indicate that they feel comfortable with a duration mismatch of up to three years due to the low interest rate environment, high return on Southern European government bonds and anticipated higher interest rates for the future. Interest rates have been low for quite a while in the Eurozone and hence one could assume that policyholders have kept their policies in force owing to the lack of investment opportunities. Interest rates could rise in the coming years if a series of structural, cyclical as well financial conditions were to materialise.
Outflow profile
Life insurers rate outflow profiles of liabilities as an especially important factor for asset
allocation. They tend to hold more liquidity in their portfolio through listed equity especially where the timing of liabilities is more unpredictable, for example in the case of contracts with surrender options. This is consistent with the finding of Gründl et al. (2016) that uncertainty about financial market conditions may also incentivise long-term investors to hold liquid assets. Some insurers refer in this respect to surrender penalties mitigating this risk. Non-life insurers indicate that even if they have short-term contracts, higher renewal rates therefore translate into the so-called ‘stickiness of liabilities’ and contribute to a better cash flow and liquidity management.
Lapse rate
The type of product and lapse rate may also influence an insurer’s investments in equity. To illustrate this, one participant indicates that they might need some additional liquidity in the portfolio when confronted with a lapse shock.
One French participant indicates that for its pension product portfolio (with a duration of 15-20 years), with almost no lapse risk, the investments in equity are higher than for their savings account portfolio, which is subject to considerably higher lapse risk and has a much shorter duration. However, the bulk of participants attribute low importance to the lapse rate in their investment decisions. This contradicts Milhaud and Dutang (2018) who find that in terms of financial consequences, lapse risk is one of the biggest risks to consider for life insurers and lapses strongly affect insurers' ALM since they trigger unexpected cash flows.
The low importance attributed by the interviewees may be explained by insurers using some risk management techniques to manage lapse risk or most likely by the low interest rate environment, due to which they expect less lapses. Indeed, Berdin et al. (2017) find that sharp or gradual increase in interest rates is associated with substantive and persistent liquidity needs, which are particularly sensitive to lapse rates. In order
to manage the lapse risk, one interviewee reports using duration matching as well as cash flow matching. Holding more liquid assets is also a way to manage and react to changes in lapse risk. Alternatively, a Finnish respondent refers to the presence of a lapse penalty as a deterrent for policyholders. Additionally, policyholders might lose tax beneficial features and therefore have limited or no incentive to leave prematurely,

European Commission - Study on the drivers of investments in equity by insurers and pension funds
December 2019 I 116
which is also the case for some retirement saving products in Belgium. Another German insurer explains that policyholders are prohibited from lapsing for traditional business contracts.
A Portuguese life insurer reports that more than half of their products have a guaranteed rate for one year, although a longer overall maturity. This results from the practice of not guaranteeing the return of its life products over a long period but periodically renegotiating the interest rate with the policyholder. As this is common practice in the Portuguese market, the lapse rate is not high because the policyholders are not able to find better guaranteed returns elsewhere in the market.
Risk-profile of clients
Asset Liability Management is primarily the concern of life insurers. Reducing the duration mismatch between assets and liabilities is crucial to their viability. In traditional life insurance, policyholders are typically offered a minimum guaranteed rate from times when interest rates were high and an option to lapse. The prolonged period of low interest rates is therefore putting a lot of pressure on the solvency of life insurers and they react by cutting down on the profit sharing on contracts for which the minimum guaranteed rate is deemed unsustainable. This in turn negatively impacts the returns that policyholders can expect from their life insurance contracts. As a result, policyholders are more willing to invest in risky assets through funds, and insurers are enlarging their offering of such products where the investment risk is borne by the
policyholder. During the interviews, some insurers indicate that they completely or partially discontinued guaranteed products after the 2008 or 2011 crises as a risk management measure and entered the unit-linked and index-linked investments related products market. In the current context, both parties benefit from this shift since the policyholder can now expect a better return and the insurer decreases the interest rate risk it faces.
Conclusions
Asset Liability Management (ALM) influences the insurers’ equity investments behaviour since when implemented effectively in line with the liability profile, it helps mitigate a number of market risks. Both literature and interviews confirm that the average duration of liabilities, the outflow profile and lapse rate of the liability portfolio
are important. This finding however could not be confirmed by the regression results due to a lack of publicly available historical information on the related factors.
Regarding the average duration of liabilities, the literature suggests that equity
investments can play a role in closing a duration mismatch, where liabilities duration is longer than the maturity of bonds in the market. Indeed, similar to what is done for the expected cash flows of fixed income investments, an equity investment’s expected cash flow pattern is modelled, including the flow of expected dividends, and matched to the liability profile. The interviews seem to confirm that finding as life insurance companies rank the duration of liabilities as a very important driver of their investment policies and state that the longer the duration of their liabilities, the higher their proportion of equities. In this regard, it is interesting to note the paradox we find with a number of countries, e.g. Germany and the Netherlands, which, despite a long liability duration are not investing in equity as much as could be expected, probably due to some specificities within their markets. German life insurers invest conservatively, with rather limited exposures to equity and other risky asset classes (IMF 2016). Also, long liabilities of the Dutch life insurance market are traditionally matched by fixed income investments, typically in bonds, loans and mainly mortgages (IMF, 2017a).

European Commission - Study on the drivers of investments in equity by insurers and pension funds
December 2019 I 117
In addition, the literature and the interviews seem to agree that in most cases, life insurers do not wish to have perfect matching and are willing to allow for a small duration gap in the event that interest rates would rise again in the very near future. In the meantime, they can close the gap by holding a small share of equity, which also helps improve their expected return.
The outflow profile and the lapse rate of the liability portfolio are other factors
that should not be ignored. The outflow profile is a very important component of ALM as it is most of the time the point of departure of the ALM framework as backed up by both interviews and the literature. For non-life insurance undertakings, with shorter product durations, the duration gap is not a primary consideration, as most non-life insurance contracts have a one-year policy term, allowing them more flexibility to invest in equity.
The literature suggests that in terms of financial consequences, lapse risk is one of the
biggest risks to consider for life insurers. The interviewees do not confirm this finding as they have ranked this factor as low in importance. However, this could be due to the low interest rate environment whereby policyholders do not see alternative attractive investments in the market and are therefore, not very likely to lapse. In any case, some insurers indicated during the interviews that policyholders are increasingly demanding unit-linked products and insurers are willing to offer these. Policyholders can then expect a higher return on their investment, while the insurer alleviates the pressure of low interest rate on their balance sheet.
Finally, it is important to note that owing to its purpose, ALM interplays strongly with market conditions and the prudential framework, insofar as the cost of capital for insurers will drive their strategic asset allocation, searching for an optimal return within their risk tolerance.

European Commission - Study on the drivers of investments in equity by insurers and pension funds
December 2019 I 118
4.3.3 Prudential framework
Since the beginning of the European Union, there have been two prudential frameworks for the insurance industry, referred to as Solvency I and Solvency II.
Solvency I was established in the 1970’s under the First Council Non-Life
Directive (73/239/EEC) in 1973 and the First Council Life Directive (79/267/EEC) in 1979. In effect, the Solvency I prudential regime consisted of national regulations that were prescriptive regarding insurers’ investment allocations.
Solvency II, the current prudential framework in the EU, replaced Solvency I when it came into force on 1 January 2016. However, the forecast effects of the current regulatory regime may have been affecting insurers’ investment decisions earlier than that. Indeed, the Solvency II Directive (2009/138/EC), which sets the high-level principles for the calculation of the capital requirements of insurance companies in the 28 Member States of the EU, was adopted in November 2009 following a number of Quantitative Impact Studies (QISs). Furthermore, companies had time to familiarise themselves with the new rules as of the fifth QIS in 2010, which served as the basis for the draft Delegated Acts. Finally, discussions around potential amendments to the Solvency II Delegated Acts (referred to as the Omnibus II Directive) already started in 2013. The Delegated Act was adopted in October 2014. The content of the Delegated
Act then effectively remained unchanged until Solvency II rules started to apply as of 1 January 2016. After the introduction of Solvency II there have been some amendments to the Directive (2009/138/EC). Recently, another amendment was made to the the Delegated Regulation (2015/35). In particular, article 171a on long-term equity investments is of interest to this study, as further discussed in this section.
The prudential framework has a dual objective: (1) policyholder protection and (2) financial stability, by ensuring that insurers’ actions are taken in the best interests of their policyholders and that insurers hold appropriate levels of capital to cover the risks they face. The rules and requirements that support the prudential framework are a primary consideration for insurers and they are likely to influence their investment behaviour.
This section analyses the effects of the most prominent factors related to the prudential framework on insurers’ investments in equity, namely the Solvency ratio and the Solvency Capital Requirement (SCR).
Solvency II ratio with and without transitional measures
The Solvency ratio is the metric used to measure the solvency position of an insurer.
This metric is computed as the ratio of the available (and eligible) own funds to the required capital. Intuitively, insurance companies with stronger solvency positions (higher Solvency ratio) have more capacity to withstand volatility in the equity markets, and therefore, are better able to handle higher equity exposures.
The Solvency I prudential regime was a model whereby the Solvency ratio was
determined using a set of accounting data and then applying predefined factors. The available capital was derived from the insurer’s own funds as reported in the balance sheet in accordance with local accounting principles. On the balance sheet, assets and liabilities were valued in line with these principles whereby, to a large extent, accrual principles (for instance measuring fixed income investments at amortised cost and using

European Commission - Study on the drivers of investments in equity by insurers and pension funds
December 2019 I 119
mathematical reserves to account for life technical provisions) were applied to assets and technical provisions.
Under the Solvency I framework, the minimum solvency margin was determined using
a limited number of factors derived from the commitments from the insurance companies towards clients (mathematical reserves, premiums, and claims). For life insurance companies, the required capital was a flat charge applied against the mathematical reserves and the sum-at-risk. Although differences could occur between local legislations, in most EU Member States a factor of 4% was applied to the mathematical reserves for non-unit-linked contracts. For unit-linked activities, however, a reduced factor of 1% was applied, taking into account the transfer of risk from the insurance company to the policyholder. Capital requirements for non-life activities focused on factors related to providing insurance coverage, such as premiums, claims and risk mitigation through reinsurance.
The Solvency I framework only indirectly considered market risk of investments in the capital requirement. The market risk, including equity risk, was reflected in the impairments, realised gains and losses on investments, which were included in the results and own funds that formed the base for the Solvency ratio. Indeed, an insurance company with a higher investment risk did not have a lower Solvency ratio in comparison to an insurer with relatively less risky investments, unless the risks would materialise and result in higher losses.
Although there was no adjustment for market risk included in the Solvency ratio, there were other elements in place to encourage prudent investment policies. Insurance companies had to comply with investment principles as well as restrictions on the allocation assets covering technical provisions. The investment principles101 stated that the assets had to be diversified and adequately spread, taking into account the safety,
yield and marketability of its investments. In addition, specific concentration limits were applicable to individual counterparties and asset categories.
Solvency II, which is a risk-based supervisory framework, stipulates that the available capital is derived from insurers’ assets and liabilities that are valued applying market valuation principles.102 In addition, the available capital is based on own funds with tiering limits for different types of capital and eligibility criteria to cover the required
capital. The calculation of the Solvency Capital Requirements (required capital) is based on a delta net asset value (Δ NAV) approach.103
The change in net asset value resulting from the various scenarios is used to calculate the required capital. The scenarios are calibrated to ensure that quantifiable risks to which a (re)insurance company is exposed are properly taken into account. This
corresponds to the Value-at-Risk of the net asset value subject to a confidence level of 99,5% over a one-year time horizon, as defined in article 101 of the Solvency II Directive (2009/138/EC). Changes in net assets are combined with correlation matrices
101 Articles 22, 23 and 24 of the Directive (2002/83/EC), covering life, non-life and composite insurance undertakings, specify rules with respect to assets covering technical provisions, categories of authorised assets and investment diversification.
102 Article 75 of the Solvency II Directive (2009/138/EC) states that assets shall be valued at the amount for which they could
be exchanged between knowledgeable willing parties in an arm’s length transaction, while the liabilities shall be valued at the amount for which they could be transferred, or settled, between knowledgeable willing parties in an arm’s length transaction.
103 The delta NAV approach considers the change in net asset value resulting from a particular shock. These shocks include:
asset shock, financial assumption change, decrement change and expense change. The majority of SCR components are calculated using this approach.

European Commission - Study on the drivers of investments in equity by insurers and pension funds
December 2019 I 120
to derive the Solvency Capital Requirement (SCR). Risk factors include market, default, health, life, non-life, intangible assets and operational risks.
With the transition from Solvency I to Solvency II, both the level and volatility of the
Solvency ratio changed. The introduction of Solvency II led to a significant decrease in the Solvency ratio of insurance companies. The Solvency ratio at EU level decreased from 362% at year-end 2015 (Solvency I) to 229% at year-end 2016 (Solvency II).
Figure 27 – Evolution of the Solvency ratio under Solvency I and Solvency II during 2005-2017
The figures for the period from 2005 to 2015 express the Solvency ratios under Solvency I and the figures for 2016 and 2017 express the Solvency ratios under Solvency II.
Source: EIOPA Solvency II statistics and Deloitte-CEPS analysis
The decrease of the Solvency ratio is entirely explained by the introduction of the Solvency II SCR. In fact, if the capital requirements had not changed, the Solvency ratio would have risen as a result of an increase of 45% in own funds. The increase in own funds is due to the application of the market value-based approach for valuating assets and liabilities. Amongst other items, this valuation approach takes into account future results of existing insurance portfolios, whereby profitable portfolios adjusted for non-hedgeable risk have positively impacted own funds. The minimum solvency margin
however increased by 128% between 2015 and 2016, primarily due to the introduction of market risks in the prudential framework.
The introduction of Solvency II has led to an increase in the use of advanced risk management techniques. In addition, the lower Solvency ratios under Solvency II have resulted in an increased awareness and focus on investments and other items that require insurance companies to hold more capital. Risk mitigating and optimisation strategies are implemented to mitigate the higher volatility in the SCR. Several insurance companies noted in the interviews that they apply an early warning system whereby if the Solvency ratio falls below a certain threshold, the asset allocation is evaluated and corrective measures are taken to reduce the required capital. Therefore, assets consuming higher capital need to deliver sufficient returns in order to justify their
100%
125%
150%
175%
200%
225%
250%
275%
300%
325%
350%
375%
400%
2005 2006 2007 2008 2009 2010 2011 2012 2013 2014 2015 2016 2017
Solv
ency r
atio (
in %
)

European Commission - Study on the drivers of investments in equity by insurers and pension funds
December 2019 I 121
capital requirement. According to the interviewed insurance companies, equity has become less attractive for reaching targeted Solvency ratios. However, it is still considered the best investment based on the balance between risk and return (see Box 1 below).
Looking at the impact of Solvency II across Member States, Sweden, France, Finland and the United Kingdom104 experienced the largest decrease in the Solvency ratio.105 Most of these Member States have significant equity exposures (direct and indirect) of more than 15%. However, not all countries with a high share of investments in equity noted a large drop in the Solvency ratio. Countries such as Germany, Malta, Denmark and Italy benefit from the loss-absorbing capacity of technical provisions. Indeed, in these countries part of the risk is transferred to the policyholder and/or they already had a risk-based approach in place prior to the introduction of Solvency II.
Figure 28 – Solvency ratio under Solvency I, Solvency II and equity exposure (excl. unit-linked
investments)
Source: EIOPA Solvency II statistics and Deloitte-CEPS analysis
From the analysed SFCRs, as discussed in Chapter 3, we note that a number of insurance companies have included a sensitivity analysis in their group SFCRs, which shows the impact of changes in equity markets on their Solvency II ratios. More specifically, the insurance groups using a scenario of a 20% or 25% increase/decrease in equity prices report an impact between -1% and -10% on their Solvency II ratio at year-end 2017. Various items, such as total equity exposure, type of equity investments, loss-absorption of technical provisions and deferred taxes, can explain the range of impacts and are specific to the insurance group’s individual situation.
104 Although unit-linked activities are very important in the United Kingdom, long-term guarantees related to life insurance
contracts still represent an important part of their insurance portfolios, resulting into a significant decrease of the Solvency ratio when applying Solvency II.
105 Note that the Solvency II framework is fundamentally different in comparison to the Solvency I framework. Observations
of changes in the Solvency ratio as illustrated in Figure 28 have to be seen in the context hereof, given the changes in the metrics (see explanations of both frameworks above).
1321%
0,0%
2,5%
5,0%
7,5%
10,0%
12,5%
15,0%
17,5%
20,0%
22,5%
25,0%
27,5%
30,0%
32,5%
35,0%
37,5%
40,0%
42,5%
45,0%
100%
125%
150%
175%
200%
225%
250%
275%
300%
325%
350%
375%
400%
425%
450%
475%
500%
DE MT DK AT PL CY SE HR IT FR SI ES CZ HU BG LU FI SK BE EE LT NL RO IE PT GR GB LV
Equity e
xposure
(exc
l. u
nit-lin
ked investm
ents
)
Solv
ency r
atio (
in %
)
SCR ratio year-end 2015 SCR ratio year-end 2016 Equity exposure (excl. unit-linked investments)

European Commission - Study on the drivers of investments in equity by insurers and pension funds
December 2019 I 122
However, not only the absolute capital charge for equity investments is important. The capital charges on other exposures also determine the relative attractiveness of different asset classes. According to articles 180(2)(b) and 187(3)(b) of the Solvency II Delegated Acts EU Member States’ central government bonds, dominated and funded in the domestic currency, are only included in interest and currency risk and not in the spread or concentration risk calibration of standard formula users.
During the interviews, one insurance company stated that the applicable capital charge
on equity in combination with the zero capital charge on most government bonds is counterproductive. This impacts standard formula users more than internal model users, as the latter generally calibrate spread risks coming from their own sovereign exposures.
Analysis at year-end 2017 indicates a positive relationship between the Solvency II ratio, excluding the application of long-term guarantees measures (LTGs)106, and total equity exposure (excl. unit-linked investments) per EU Member State . The Pearson (linear) correlation coefficient ρ is equal to 0,49, which further corroborates that an insurance company with a stronger solvency position is associated with an equity exposure aligned to its financial strength.
Figure 29 – Solvency II ratio and total equity exposure (excl. unit-linked investments) at year-end 2017
The undertakings located in Croatia, Estonia, Latvia, Lithuania, Poland, and Slovenia do not apply any of the
long-term guarantee or transitional measures.
Source: EIOPA Solvency II statistics and Deloitte-CEPS analysis
106 The long-term guarantees measures concern the extrapolation of risk-free interest rates, the matching adjustment, the volatility adjustment, the extension of the recovery period in case of non-compliance with the Solvency Capital Requirement,
the transitional measure on the risk-free interest rates and the transitional measure on technical provisions.
The equity risk measures are the application of a symmetric adjustment mechanism on the equity risk charge and the duration-based equity risk sub-module.
0,0%
2,5%
5,0%
7,5%
10,0%
12,5%
15,0%
17,5%
20,0%
22,5%
25,0%
27,5%
30,0%
32,5%
35,0%
37,5%
40,0%
75%
100%
125%
150%
175%
200%
225%
250%
275%
300%
325%
350%
375%
400%
DE MT DK AT PL CY SE HR IT FR SI ES CZ HU BG LU FI SK BE EE LT NL RO IE PT GR GB LV
Equity e
xposure
(excl. u
nit-lin
ked investm
ents
)
Solv
ency I
I ra
tio (
in %
)
Solvency ratio w/o transitionals and LTGs Impact transitionals
Impact LTGs 100%-threshold
Equity exposure (excl. unit-linked investments)

European Commission - Study on the drivers of investments in equity by insurers and pension funds
December 2019 I 123
When applying the LTGs, the Solvency II ratios increase and also the Pearson (linear) correlation coefficient ρ slightly increases to 0,55. This indicates that measures ensuring appropriate treatment of insurance products with long-term guarantees can have a positive impact on the level of equity investments.
Several of the interviewed insurance companies use transitional measures, which they state contribute to a significantly higher Solvency ratio. Furthermore, they believe that the equity investments would be below the current level in the absence of the applied transitional measures, as these measures provide significant relief to their solvency capital requirements, own funds and decrease the sensitivity to market developments, and thus the potential volatility of their Solvency II ratio.
However, we also note other relevant factors, such as the expected return on equity, which may influence insurance undertakings’ desire to hold or sell their equity investments.
Previous research has found that a higher Solvency ratio contributes to higher investments in equity. For example, the EIOPA thematic article on Potential drivers of insurers’ equity investments (Jakubic and Tuturescu, 2018) concluded, based on a pooled OLS regression on year-end 2016 Solvency II data for 1.683 individual insurance companies in 30 EEA countries, that insurance companies with a higher Solvency ratio invest more in equity.
The relation between the solvency ratios and equity investments is tested empirically. Our main hypothesis is that insurance companies with higher capital levels invest more in equity compared to less capitalised insurance companies. Moreover, focusing on the specific characteristics of Solvency II discussed above, one would expect a decrease in equity investments due to a drop in the Solvency ratio in most countries around the
time of the introduction of Solvency II. However, this decreasing trend can be expected to be less pronounced or not applicable for insurers that remain reporting Solvency ratios well above their minimum and in line with their target solvency levels under Solvency II. In addition, given the significant differences between the two frameworks, minimum and target solvency levels under an accounting-based framework in Solvency I, whereby market risks on assets are not sufficiently reflected, are expected to be higher in comparison to the application of the current risk-based framework under Solvency II.
In order to assess the impact of Solvency II, both the period before it entered into force and the first years under the framework are relevant. Our panel dataset covers the period from 2005 to 2017.107 The first Solvency II data available and published by EIOPA after the introduction of the framework on 1 January 2016 relates to the reporting date
2016 Q3. We define this date in the empirical analysis as the application date. Moreover, considering the fact that the Solvency II Directive has been adopted by the European Parliament and the EU Council before the application date and that there are various transitional measures that can be used, the potential changes in the investment portfolios might occur before or after the date on which Solvency II entered into force. Since the transitional measures are applicable until 2032, the impact of these measures cannot be fully assessed. In the empirical analysis, the adoption date has been set at 2014 Q3, which is aligned with the period when the Delegated Regulation (Delegated Regulation (EU) 2015/35) was adopted by the Commission on the 10th of October 2014. To capture the potential impact at both the adoption and application date we include
107 For the period between 2005 and 2015 the Solvency I ratio is reported at year-end. The values are interpolated to obtain quarterly results, similar to the quarterly Solvency II reporting.

European Commission - Study on the drivers of investments in equity by insurers and pension funds
December 2019 I 124
dummy variables and interaction terms with the Solvency ratio for both the adoption (2014 Q3) and application (2016 Q3) of the new prudential regime. The dummy variables allow us to capture changes in the level of equity investments and the interaction terms aim to capture the change in the relationship between the Solvency ratio and equity investments after these dates.
Considering now the regression results, we find a robust positive relationship between
the Solvency ratio and the share of both listed equity and total equity. For total equity,the relationship is significant at the 10% level for the full models tested to estimate the investments in total equity, however, the significance is not robust across all model specifications. Nevertheless, the robust positive signs are in line with our hypothesis that insurers with a higher Solvency ratio invest more in equity. Moreover, the positive coefficient for the interaction term for the Solvency ratio and the application of Solvency II for listed equity indicates that this relation is more pronounced under the Solvency II framework. Interestingly, the results for listed equity are stronger for the
application date than for the adoption date since the positive sign of the interaction term is robust only for the application date specifications. This suggests that the adoption of the new prudential framework formed a more important trigger for changes in the investments in equity than the application of Solvency II as from 2016. In the interviews, several insurance companies indicate they started anticipating the new rules in their investment strategy when the principles of Solvency II were announced.
The different models have also been tested for several other types of equity as
dependent variables. The results for the models with unlisted equity as dependent variables do not deliver consistent results for the sign of the coefficient of the Solvency ratio. For these types of equity, the regressions do not allow reaching a conclusion on the relationship with the Solvency ratio. This could be the result of the investment principles and specific limits in the allocation of the investment portfolio with respect to
assets covering technical provisions under Solvency I. For instance, the rules for investment diversification of the EU Directive 2002/83/EC required that a life insurance company could not invest more than 10% of its total gross technical provisions in equity or other securities treated as equity and debt securities, which were not traded on a regulated market.
When we look at the models that only include the dummy variables for the adoption and
application of the Solvency II framework, we do not observe a statistically significant and robust coefficient for the equity types. Hence, the regression analyses do not allow us to conclude whether there is an impact of the Solvency II framework on equity investments.

European Commission - Study on the drivers of investments in equity by insurers and pension funds
December 2019 I 125
Solvency II short-term volatility of own funds
The market value of an insurer’s investment portfolio can be impacted by short-term volatility of interest rates, spreads, equity prices and other changes. Under Solvency II, the impact on the insurer’s assets will be translated into more volatile available capital if the change on the insurer’s assets is not sufficiently absorbed by mitigating changes in the valuation of liabilities or the application of asset hedging strategies.
Research by Morgan Stanley and Oliver Wyman (2015) has found that applying market
value-based measurement such as the application of Market Consistent Embedded Value (MCEV) and Solvency II principles results in a higher volatility of own funds in comparison to Solvency I.
Most of the insurance companies interviewed stated that the move towards market value brings more attention to short-term market fluctuations while often pursuing a long-
term investment horizon in line with the insurance activities conducted. An insurer aiming to limit available capital volatility will have to closely monitor and probably limit investment classes bringing a higher volatility of own funds (and potentially higher returns). The importance of short-term volatility of own funds will depend on an insurer’s individual situation and how different stakeholders react to this volatility. Notwithstanding this, it can be expected that insurers with higher Solvency ratios can better handle short-term volatility without having to introduce corrective measures within their asset allocation.
Risk margin
The risk margin has its legal basis in article 77 of the Solvency II Directive. According
to this article, the risk margin shall be such as to ensure that the value of the technical provisions is equivalent to the amount an insurance company would be expected to require in order to take over and meet the insurance and reinsurance obligations.
Some of the participants in the interviews mention that the risk margin is not really a cash flow needed to pay claims. They argue that as such, the risk margin is an amount that could be put to better use if it were considered as own funds. One participant nuances this view by saying that although they agree with a sense of double counting concerning the risk margin, nothing indicates that the insurers would use it to invest in equity as long as the equity risk charge does not sufficiently reflect the long-term nature of equity. Several participants note that the available funds, in the absence of the risk margin, would not be allocated to equity, as their strategy of profit maximisation and SCR minimisation would still mean that due to the higher capital requirement, equity would not receive a relatively higher share of the asset allocation. Other participants do not feel strongly about the risk margin, arguing that it does not constitute a sizeable amount of their overall technical provisions.
Diversification and loss-absorbing capacity of technical provisions
The Solvency Capital Requirement aims to ensure that insurers hold sufficient capital against the risks of their activity. Solvency II introduced a capital charge based on market risk, including equity risk. Indeed, the insurance companies now have to hold capital for all their investments in equity.
The capital charge can be based on the standard formula, internal models or partial internal models. Under the standard formula the capital requirement is based on standard rates for different asset classes. These rates are the same across insurance companies using the standard models for the calculation of their capital requirements and calibrated based upon available data and the Solvency II confidence level. Under

European Commission - Study on the drivers of investments in equity by insurers and pension funds
December 2019 I 126
internal models, the rates for the same asset classes vary between insurance companies. Insurance companies use different models to determine the capital requirements under their internal models. Based on a sample of SFCR reports three main practices differentiating from the standard formula could be observed. Firstly, the internal model allows insurance companies to take into account the equity implied volatility. As detailed by EIOPA (2019), implied volatilities for equity risk are often modelled by internal model users. Secondly, the internal models allow users to calibrate the rates more precisely by differentiating between more specific and granular asset classes. Thirdly, the application of Value-at-Risk (VaR) models, which are based on an analytic variance-covariance approach, historical simulations or Monte Carlo simulations to derive the VaR.
The Solvency Capital Requirement (SCR) is composed of the basic SCR (BSCR), operational risk, adjustment for the risk absorbing effects of technical provisions and deferred taxes.
Figure 30 – Composition of Solvency Capital Requirement for standard formula users at year-end 2017
Denmark has a BSCR of 450,7%, operational risk of 7,7%, loss-absorbing capacity of technical provisions of
-354,2% and loss-absorbing capacity of deferred taxes of -4,3%.
Source: EIOPA Solvency II statistics and Deloitte-CEPS analysis
The characteristics of insurance products determine the overall loss-absorbing capacity of technical provisions, which is particularly important for Denmark, France, Germany and Italy. Danish insurers, who offer retirement savings products including a guaranteed amount lower than the received premiums or invested assets, apply the highest loss-absorbing capacity of technical provisions. A higher loss-absorbing capacity of technical provisions leaves more room for investments in equity, as part of the market risk is transferred to the policyholder. The analysis shows that EU Member States with equity exposures below 10% have no or a low loss-absorbing capacity of technical provisions.
-25,0%
-20,0%
-15,0%
-10,0%
-5,0%
0,0%
5,0%
10,0%
15,0%
20,0%
25,0%
30,0%
35,0%
40,0%
45,0%
-150,0%
-125,0%
-100,0%
-75,0%
-50,0%
-25,0%
0,0%
25,0%
50,0%
75,0%
100,0%
125,0%
150,0%
175,0%
200,0%
225,0%
250,0%
SE DK FR DE FI PL HU LU CZ AT NL SI IT PT GB BE IE ES GR SK CY HR BG MT LT RO LV EE
Equity e
xposure
(excl. u
nit-lin
ked investm
ents
)
Solv
ency C
apital Requirem
ent
BSCR Operational risk
Loss-absorbing capacity of technical provisions Loss-absorbing capacity of deferred taxes
Equity exposure (excl. unit-linked investments)

European Commission - Study on the drivers of investments in equity by insurers and pension funds
December 2019 I 127
In turn, the BSCR (before loss-absorbing capacity of technical provisions) is composed of six modules: market risk, life underwriting risk, non-life underwriting risk, health underwriting risk, counterparty default risk and intangible asset risk.
The capital requirements are calculated in these modules based on scenarios for each risk type within the modules. Capital requirements within a module are then computed by applying correlation matrices across the different risk types. The BSCR is subsequently calculated by aggregating the capital requirements of the different modules, using other correlation matrices. The impact of the correlation matrices is captured within the diversification effect.
Figure 31 – BSCR composition by module for standard formula users at year-end 2017
Source: EIOPA Solvency II statistics and Deloitte-CEPS analysis
The composition by module indicates that for most countries market risk is the most
important risk, accounting for between 15% and 80% of the BSCR. For Hungary, Estonia, Bulgaria, Malta, Lithuania, Romania, and Estonia non-life underwriting risk delivers the main contribution to the BSCR. Moreover, for the Czech Republic life underwriting risk delivers the main contribution to the BSCR. The diversification effect (within the main module) ranges between 8% in Denmark and 24% in Slovakia.
The relationship between the (gross) capital requirement for market risk as a share of the total BSCR and the total equity exposure per EU Member State at year-end 2017 results in a Pearson (linear) correlation coefficient of 0,75. This correlation already indicates that for most countries the current level of equity investments are strongly associated with the gross SCR market risk. Considering the overall importance of the capital requirement for market risk, equity risk forms an important part of the SCR,
which also means that most insurance companies will closely monitor the equity risk in their capital consumption and asset allocation.
Within the market risk module, the equity risk covers all assets and liabilities, which
are sensitive to changes in equity prices. Equity risk forms an important share of the
62%
77%
54%49%51%
31%19%
31%20%
50%
28%39%
44%42%40%41%
31%36%
24%24%
37%47%
27%27%
17%
23%
18%18%
-15,0%
-10,0%
-5,0%
0,0%
5,0%
10,0%
15,0%
20,0%
25,0%
30,0%
35,0%
40,0%
45,0%
-30%
-20%
-10%
0%
10%
20%
30%
40%
50%
60%
70%
80%
90%
100%
SE DK FR DE FI PL HU LU CZ AT NL SI IT PT GB BE IE ES GR SK CY HR BG MT LT RO LV EE
Equity e
xposure
(excl. u
nit-lin
ked investm
ents
)
BSCR c
om
positio
n b
y m
odule
Market risk Life underwriting risk
Non-life underwriting risk Health underwriting risk
Counterparty default risk Intangible asset risk
Diversification Equity exposure (excl. unit-linked investments)

European Commission - Study on the drivers of investments in equity by insurers and pension funds
December 2019 I 128
market risk for most EU Member States, ranging between 8% of the net SCR (after loss-absorbing capacity of technical provisions) in Estonia and 50% in Sweden.
Figure 32 – Market risk module for standard formula users at year-end 2017
Source: EIOPA Solvency II statistics and Deloitte-CEPS analysis
In addition to the diversification effect shown within the main module, an important
diversification benefit is noted between the various market risks, ranging between 13% in Belgium and 27% in Romania of the total net SCR market risk. A number of insurers note that diversification of assets is important when investing in various asset classes, including equity investments. Assuming that for individual assets no return vs. Cost-of-Capital optimisation can be realised, insurers are expected to strive towards having well diversified portfolios whereby more individual risk (and a higher expected return) can be taken while consuming the same or even a lower amount of capital in comparison to a non-diversified portfolio.
In addition, insurance companies indicate that they have diversified their equity portfolios in terms of sectoral and geographical distribution to avoid a high correlation between riskier assets in times of crisis. The interviewed insurance companies consider diversification across asset classes a necessity. They are therefore unlikely to fully divest their equity investments as diversification benefits will disappear.
In their group SFCRs and interviews, several insurance companies mention that
investments in equity provide additional diversification and higher average return on assets, usually backing long-term illiquid liabilities.
Our (simplified) theoretical model of a life insurance company shows that an increase in
equity investments results in a (possible) higher return on own funds and a lower Solvency II ratio. Depending on a company’s risk appetite and Solvency ratio, Solvency II will as of a certain level put constraints on increasing equity investments if these would result in breaching the company’s risk appetite. Other asset classes can also experience similar constraints depending on their capital requirement under
50%44%40%40%39%35%35%30%27%26%25%25%25%25%24%24%22%22%21%19%18%16%15%15%13%11%11%8%
-25,0%
-20,0%
-15,0%
-10,0%
-5,0%
0,0%
5,0%
10,0%
15,0%
20,0%
25,0%
30,0%
35,0%
40,0%
45,0%
-50,0%
-40,0%
-30,0%
-20,0%
-10,0%
0,0%
10,0%
20,0%
30,0%
40,0%
50,0%
60,0%
70,0%
80,0%
90,0%
100,0%
SE DK FR DE FI PL HU LU CZ AT NL SI IT PT GB BE IE ES GR SK CY HR BG MT LT RO LV EE
Equity e
xposure
(excl. u
nit-lin
ked investm
ents
)
Mark
et
risk c
om
positio
n b
y s
ub-m
odule
(net
SCR)
Equity risk Interest rate risk
Property risk Spread risk
Market risk concentrations Currency risk
Diversification within market risk module Equity exposure (excl. unit-linked investments)

European Commission - Study on the drivers of investments in equity by insurers and pension funds
December 2019 I 129
Solvency II. Insurers will therefore aim for an optimal asset allocation that provides them with the best possible return while staying within their risk appetite levels. Insurers set a minimum Solvency II ratio, amongst other items, as one of their risk appetite levels.
Based upon the annual reports and SFCRs of a number of large insurers, we note that the risk appetite of these companies and the associated target Solvency II ratio vary substantially. Some companies target a Solvency II ratio between 150% and 180%, while others mention a range of 180% to 230%. We note that these targeted ratios would correspond to different levels of equity investments, as further shown in Figure 33.108,109 110 As an example, and from a SCR-driven strategy111, the ‘optimal’ percentage allocated to equity investments would be around 20% for our theoretical life company with a risk appetite of 180%. From a return perspective, and based on our assumptions of asset return in the model, we also note that an asset allocation with a higher share of equity investments results in a higher internal rate of return (IRR) on own funds
during the projected horizon of 20 years. The steepening of this curve depends on various items, such as the investment returns of other investments, the pricing of financial guarantees and insurance coverage.
Furthermore, the instantaneous impact112 of investing 100 EUR in equity on the capital charge, considering the three different types of equity, is investigated. Based on the assumptions of our model, we note the following:
An additional 100 EUR investment in strategic equity leads to an actual capital charge of 13,84 EUR;
An additional 100 EUR investment in Type 1 non-strategic equity leads to an actual capital charge of 25,83 EUR; and
An additional 100 EUR investment in Type 2 non-strategic equity leads to an actual capital charge of 30,14 EUR.
Depending on the target Solvency II ratio level, this shows that the actual cost will be lower than applying the gross shocks for investing 100 EUR in the different types of equity investments. This is due to, amongst other factors, the type of insurance activities, the level of diversification and the loss-absorbing capacity of deferred tax. The underlying assumptions and simplifications, which form the basis of these results, are described in Annex 4.
108 For the example shown a fixed yield of 7,0% for Type 1 Equity and 9,0% for Type 2 Equity is used. In order to determine
the Solvency II ratio, Type 1 Equity is shocked at 39% with a symmetric adjustment of 1,9%, while Type 2 Equity is shocked at 49% with the same symmetric adjustment of 1,9%. A tax rate of 25% is used.
109 Note that Figure 33 is illustrative and that the crossing of both lines should not lead to any conclusion around the optimal amount invested in equity. The optimal amount will also depend on the risk appetite, business mix, and type of products.
110 The graphs in Figure 33 should be read as follows. Based on the calculations performed under our theoretical model the
impact of different equity exposures on the Solvency II ratio and IRR of a life insurance company are calculated. The top graph depicts the Solvency II ratio and IRR for different levels (0% up to 30%) of equity exposures. The middle graph depicts
the corresponding asset allocation for the respective levels of equity exposure, corresponding to the underlying assumptions as described in Annex 4. Finally, the bottom graph depicts the impact on the Solvency II ratio (for the different equity types)
of investing 1% more equity (for the different equity types) instead of in government bonds. E.g. for an initial equity exposure of 15%, investing 1% more in Type 1 Equity – Non-strategic would yield a decrease of
approx. 10% on the Solvency II ratio. Investing 1% more in Type 2 Equity – Non-strategic would yield a decrease of approx. 11% on the Solvency II ratio, etc.
111 Under a SCR-driven strategy, we assume an investment allocation that is aimed to minimise capital charges on the different
asset classes within a certain risk appetite, while seeking for the highest expected return of the investments. 112 The impact of investing 100 EUR in equity on the capital charge is determined at year-end 2017 and the impact on the SCR is determined at that point.

European Commission - Study on the drivers of investments in equity by insurers and pension funds
December 2019 I 130
This rational response based on the theoretical life insurance model was confirmed by several insurance companies in the interviews. An attractive risk-return profile is an important incentive to invest in equity. Equity is considered to deliver a higher return over the long run given its potential risks and volatility. Alternatively, several insurance companies mention in their group SFCRs that they are using derivatives to limit some of the downside risks of their equity investments. This strategy has, however, the disadvantage that some of the return is lost, due to the costs of the derivatives, as indicated by one insurance company during the interviews.

European Commission - Study on the drivers of investments in equity by insurers and pension funds
December 2019 I 131
Figure 33 – Impact of different equity exposures on Solvency II ratio and IRR based on (simplified) theoretical model of a life insurance company
Source: Deloitte-CEPS analysis
8,0%
8,5%
9,0%
9,5%
10,0%
10,5%
11,0%
11,5%
12,0%
100%
125%
150%
175%
200%
225%
250%
275%
300%
0% 5% 10% 15% 20% 25% 30%
IRR o
wn f
unds (
in %
)
Solv
ency I
I ra
tio (
in %
)
Solvency II ratio IRR own funds
0,0%
10,0%
20,0%
30,0%
40,0%
50,0%
60,0%
70,0%
80,0%
90,0%
100,0%
0% 5% 10% 15% 20% 25% 30%Asset
allocation (
in %
of
tota
l in
vestm
ents
)
Equity - Strategic Equity Type 1 - Non-strategic Equity Type 2 - Non-strategic
Government bonds Corporate bonds Cash
-25,0%
-22,5%
-20,0%
-17,5%
-15,0%
-12,5%
-10,0%
-7,5%
-5,0%
-2,5%
0,0%
0% 5% 10% 15% 20% 25% 30%
Impact
on S
olv
ency I
I ra
tio (
in a
bsolu
te %
)
Impact SCR Equity - Strategic Impact SCR Equity Type 1 - Non-strategic
Impact SCR Equity Type 2 - Non-strategic

European Commission - Study on the drivers of investments in equity by insurers and pension funds
December 2019 I 132
Considering the same assumptions as applied above, but changing the fixed yield of the equity investments to the weighted equity index (as described in Annex 4), we can re-determine the impact of different equity exposures on the IRR based on our theoretical model of a life insurance company. We note that for this case, a higher percentage invested in equity leads to a lower IRR on own funds. This observation is due to the fact that equity returns on average underperformed compared to fixed-income securities over the 20-year period, given the historically higher interest rates and returns on bonds and market events on the stock markets (two crises). This also illustrates the potential risk of long-term equity investments. Note however that no defaults on fixed-income investments were assumed in the simplified theoretical model.
Figure 34 – Impact of different equity exposures on IRR based on (simplified) theoretical model of a life insurance company – using weighted equity index
Source: Deloitte-CEPS analysis
Box 1. Return on solvency capital and risk appetite
In general, insurers are searching for the optimal investment portfolio to maximise their returns, given their constraints defined in their risk appetite.
Due to the high importance of market risk within the total SCR, insurers are encouraged to review their ALM on a regular basis. A study by Deloitte Luxembourg on innovative investment strategies shows that a switch between strategies is appropriate when the variation (Δ) in the expected financial return is strictly higher than the variation in the Cost-of-Capital (CoC). This would identify a strategy that has a net positive impact on the expected financial result over the CoC constraints generated by the market risk module.
2,5%
3,5%
4,5%
5,5%
6,5%
7,5%
8,5%
9,5%
10,5%
11,5%
12,5%
0% 5% 10% 15% 20% 25% 30%
IRR o
wn f
unds (
in %
)
IRR own funds (tax 25%)

European Commission - Study on the drivers of investments in equity by insurers and pension funds
December 2019 I 133
If the CoC perfectly reflected the risk/return relationship for each individual asset, having perfect information within efficient markets, opportunities could only be found in maximising diversification benefits between assets. However, as in the standard formula the CoC is not continuously recalibrated reflecting current market conditions and the CoC is determined for asset classes as a whole (no calibration is done at an individual investment level), opportunities can exist when the economic environment changes.
As discussed in the literature review, Kouwenberg (2017) analyses the asset allocation and solvency position of the representative European life insurer using ‘marginal’ concepts. The author proposes a three-step procedure whereby the insurance liabilities are hedged against interest rate risk at first. Then, the insurer should focus on optimising the marginals, particularly the ratio of expected excess return to marginal
risk. This procedure leads to a portfolio whereby among others, the equity allocation is significantly improved, and which results in a reduction of SCR, an increased solvency ratio, an improved return on SCR and an improved expected return on the insurer’s own funds. In the third step, the author compares the improved asset allocation (based on the expected excess return to marginal risk) against an optimal portfolio derived via the formulation of an optimisation problem with non-negative constraints. Remarkably, the asset allocation found in the improved asset allocation based on the ratios of expected excess return to marginal risk, is very close to the optimal solution.
The author therefore concludes that for the insurance company that maximises the expected return on own funds, subject to an upper limit on the SCR market risk, the ratio of expected return to marginal risk of asset classes is the most useful measure for improving the efficiency of an asset allocation, not the capital charge per se.
It is important to stress that analyses on the optimal risk/return equilibrium are highly dependent on the economic assumptions, including the expected yields of investments, and context. Furthermore, as mentioned earlier in the ALM section, the interplay between different elements, risk appetite of the undertaking, accounting and tax framework remains highly important.
CoC Δ
Return Δ
Opportunity
Lack of opportunity
0
Return
Solvency II ratio
risk appetite

European Commission - Study on the drivers of investments in equity by insurers and pension funds
December 2019 I 134
Capital requirement on equity investments
Solvency II considers four types of equity instruments, which can each either be of strategic or non-strategic nature:113
Type 1 equity: Listed equity in regulated markets in EEA and OECD countries; Type 2 equity: Listed equity in regulated markets outside the EEA and OECD,
unlisted equities, private equity, hedge funds and other alternative equity
investments; Qualifying infrastructure equity: Equity investments meeting the infrastructure
conditions as defined in the Commission Delegated Regulation (EU) 2016/467; and
Qualifying infrastructure corporate equity: Equity investments meeting the infrastructure conditions as defined in the Commission Delegated Regulation (EU) 2017/1542.
Furthermore, the European Commission has adopted new rules regarding the long-term equity asset class in the Commission Delegated Regulation (EU) 2019/981 of 8 March 2019 (see further Box 2).
The overall equity risk is calculated as the sum of the Type 1 and Type 2 equity capital
requirements (incl. qualifying infrastructure equity), with a 75% correlation between the two types.
Assets sensitive to equity risk are mainly non-strategic Type 1 and Type 2 equity exposures, including unit-linked exposures, as shown in Figure 35. Strategic participations are to a large extent composed of financial holdings and insurance companies and are traditionally related to non-unit-linked activities.114 At EU level qualifying infrastructure equities (incl. qualifying infrastructure corporate equities) and the application of the duration-based equity risk sub-module only represent a minor share of 2,1% of the total equity risk.
113 The following conditions are included in the Solvency II regulation with respect to the definition of strategic equities:
1. the value of the equity investment is likely to be materially less volatile for the following 12 months than the value of other equities over the same period as a result of both the nature of the investment and the influence exercised
by the participating undertaking in the related undertaking; 2. the nature of the investment is strategic, taking into account all relevant factors, including:
(a) the existence of a clear decisive strategy to continue holding the participation for long period; (b) the consistency of the strategy referred to in point (a) with the main policies guiding or limiting the
actions of the undertaking;
(c) the participating undertaking's ability to continue holding the participation in the related undertaking; (d) the existence of a durable link;
where the insurance or reinsurance participating company is part of a group, the consistency of such strategy with the main policies guiding or limiting the actions of the group. 114 EIOPA’s consultation paper on the second set of advice to the European Commission on specific items in the Solvency II delegated regulation states that strategic investments are related to financial and insurance holdings (21%), life insurance
companies (34%), non-life insurance companies (14%), other financial activities (16%), real estate entities (12%) and other (3%). (EIOPA, 2018b)

European Commission - Study on the drivers of investments in equity by insurers and pension funds
December 2019 I 135
Figure 35 – Composition of shock on assets sensitive to equity risk (incl. unit-linked investments) for standard formula users at year-end 2017
Source: EIOPA Solvency II statistics and Deloitte-CEPS analysis
For each type of equity, the capital requirement is calculated as a reduction in Basic own funds based on a shock in equity depending on the classification:
Strategic and long-term equities (Type 1, Type 2 and qualifying infrastructure (corporate) equity) - 22% shock;
Duration based approach equities (Type 1, Type 2) - 22% shock; Type 1 equity (Non-strategic) - 39% + symmetric adjustment115 shock with the
possibility to apply a grandfathering clause for equity investments purchase before 1 January 2016;
Type 2 equity (Non-strategic) - 49% + symmetric adjustment shock with the possibility to apply a grandfathering clause for equity investments purchase before 1 January 2016;
Qualifying infrastructure equity (Non-strategic) - 30% + 77% of the symmetric adjustment; and
Qualifying infrastructure corporate equity (Non-strategic) - 36% + 92% of the symmetric adjustment.
In addition, a transitional measure116 is applied for Type 1 equities acquired before 1 January 2016. Some insurers mention in the interviews that the currently lower transitional charge for equity risk contributes to them at least maintaining their investments in equity to the level from before 2016. They indicate that the further increase of the capital charge to 39% as from 2022 might result in divestments of older equity investments and search for alternative (equity) investments. In turn, several other insurance companies with higher Solvency ratios note that they are less concerned with the higher capital charge for equity. They already applied the 39% (and adding the symmetric adjustment) equity shock as from the initial application date of Solvency II
on all their Type 1 equity. One listed insurance company mentions that they do not apply the lower equity charge because rating agencies and analysts disregard the impact
115 The application of the symmetric adjustment adjusts the basic shock within a range of -10% and +10% depending on the equity market position in a 3 years cycle. Therefore the actual SCR shock lies between 29% and 49% for non-strategic Type 1 equity and between 39% and 59% for non-strategic Type 2 equity. For qualifying infrastructure equity 70% of the same
symmetric adjustment is accounted for. 116 The transitional measure of equity instruments finds its legal basis in article 308b(13) of the Solvency II Directive and article 173 of the Solvency II Delegated Acts. Under these articles, Type 1 equity investments that are not covered by the
duration-based equity module and were purchased on or before 1 January 2016 receive a reduced shock which gradually increases during a period of 7 years from 22% to 39%. Insurers not wishing to make use of this transitional measure apply
a 100% weighting on the underlying parameters and therefore use the 39% on which the symmetric adjustment is added subsequently.
Type 1 equity - Non-
strategic
52,9%
Type 1 equity - Strategic
participations
1,2%
Type 2 equity - Non-
strategic
36,7%
Type 2 equity - Strategic
participations
7,2%
Qualifying infrastructure
equity
2,0%
Duration-based
0,1%

European Commission - Study on the drivers of investments in equity by insurers and pension funds
December 2019 I 136
in their analysis of the financial position. The insurer also explains that applying the full equity shock was also easier to implement from an operational point of view.
The current capital charges for equity range between 22% and 49% (and adding the
symmetric adjustment), before diversification, is an important element that insurers say they consider when investing in equity. Some insurance companies are of the opinion that the capital charge in combination with their expected investment yields leads to a relatively low level of equity investments. In turn, one insurance company mentions that the 39% capital charge is well calibrated considering the amounts that might be lost in equity positions. This should not necessarily be an obstacle for investing in equity, considering the higher average returns on a long-term investment horizon. The latter should allow to realise the average return through the whole economic cycle. Several others stress that they have a long-term investment horizon, but that capital charges and other aspects do not sufficiently account for this. The interviews, although sometimes presenting opposite views, clarified that the investment yield that an insurer
expects to realise over a time horizon and the applicable equity charge are important factors when investing in equity.
Several insurance companies note in the interviews that Solvency II is based upon a one-year period VaR whereby short-term volatility as observed in the past is reflected in the calibration of the capital requirements. An exception to this is the duration-based equity risk sub-module whereby the holding period of the equity investments is
introduced in the calibration (see Box 2). Most insurers argue that Solvency II is based on the assumption of trading (i.e. selling their entire portfolio in the case of a market downturn) rather than buy and hold behaviour. However, due to their long-term commitments on the liability-side of their balance sheet insurance companies are less vulnerable for short-term changes in the asset prices that should recover over time. Several insurance companies indicate that they should be able to perform
countercyclical investments and thus not be incentivised to sell when there is unexpected (temporary) turmoil in the financial market.

European Commission - Study on the drivers of investments in equity by insurers and pension funds
December 2019 I 137
Box 2. Application of duration-based equity risk sub-module and long-term equity investments
Article 304 of the Solvency II Directive provides the EU Member States the possibility to allow insurance companies to apply a lower effective capital charge through the duration-based equity risk sub-module. Under this sub-module, life insurance companies can apply a capital charge of 22% for certain occupational retirement provisions or retirement benefits. This lower capital charge is the result of the calibration using a VaR measure taking into account the typical holding period of equity investments for these insurance activities.
Several conditions must be met in order for equity investments to be eligible for the sub-module. Amongst other conditions, the average duration of the liabilities should be at least 12 years and the equity investments should be held in line with the average duration of the liabilities. Moreover, the assets and liabilities must be ring-fenced and the premiums paid must be tax deductible by the policyholders.
The application of the duration-based equity risk sub-module by an insurance
undertaking is subject to supervisory approval. According to EIOPA’s report of December 2018 on long-term guarantee measures, only one French insurance company has been authorised to use the sub-module. For this insurance company the application of the duration-based equity risk sub-module contributes to a substantially higher Solvency ratio. However, at EU level the impact of the current application of the duration-based equity risk sub-module is negligible.
The fact that only one insurance company currently uses the sub-module is most probably largely due to the required supervisory approval, stringent conditions and limited scope (only pensions). Several insurance companies indicated in the interviews
that they would welcome a similar measure, which takes a long-term approach to equity. Such a measure would, according to one insurance company, rather focus on the ability to hold the equity instead of putting the focus on the holding period.
With the Commission Delegated Regulation (EU) 2019/981 of 8 March 2019, the European Commission has introduced a new asset class for long-term equity investments. Identical to the duration-based approach, a 22% equity capital shock will be applied. The conditions to be met for this sub-set of equity investments relate to, amongst other items, the holding period for each equity investment for which the average holding period exceeds 5 years, the identification of a clear relation with insurance activities and maintaining this relation over the lifetime of the insurance obligations and the implementation of appropriate risk management and Asset Liability Management policies.

European Commission - Study on the drivers of investments in equity by insurers and pension funds
December 2019 I 138
SCR risk reduction and product characteristics
Looking more closely at the shocks performed to obtain the SCR for equity risk, four steps are followed:
Step 1: Shock on all assets sensitive to equity risk; Step 2: Shock on all liabilities sensitive to equity risk; Step 3: Loss-absorbing capacity of technical provisions (LAC TP);117 and Step 4: Loss-absorbing capacity of deferred tax (LAC DT).
As shown in Figure 36, the shock on assets sensitive to equity risk (step 1) is reduced by to the shock on liabilities sensitive to equity risk (step 2) and LAC TP (step 3). The LAC DT is not shown because insurers do not report this risk reduction impact at the sub-module level of equity risk. In addition, the LAC DT is dependent on the overall tax position of an insurer. Taking this capital charge reduction into account, only 25,8% of
the total shock on assets exposed to equity risk remains as capital requirement for equity. After applying the diversification between Type 1 and Type 2 equity, this capital requirement is further diversified with other risks and applying the overall LAC DT.118
Figure 36 – Gross SCR equity risk to net SCR equity risk for standard formula users (incl. all activities)
Source: EIOPA Solvency II statistics and Deloitte-CEPS analysis
117 As explained in the Solvency II Directive (2009/138/EC), the adjustment shall take account of the risk mitigating effect
provided by future discretionary benefits of insurance contracts, to the extent insurance and reinsurance undertakings can establish that a reduction in such benefits may be used to cover unexpected losses when they arise. The risk mitigating effect
provided by future discretionary benefits shall be no higher than the sum of technical provisions and deferred taxes relating to those future discretionary benefits.
118 At EU level the diversification between Type 1 and Type 2 equity results into a decrease from 25,8% to 23,1%.
50,0%
51,9%
47,1%
60,5%
39,8%
50,0%
48,1%
52,9%
39,5%
60,2%
100,0% -60,2%
39,8% -14,0%
25,8%
Shock assets Shock liablities Gross SCR LAC TP Net SCR
Type 1 equity Type 2 equity
-35,2%

European Commission - Study on the drivers of investments in equity by insurers and pension funds
December 2019 I 139
Insurance product characteristics determine the observed SCR risk reductions and drive equity investments. Insurers invest the premiums received (partially) in equity investments for insurance products that provide an adequate solution to customers searching for benefits linked to the performance of equity investments, complementary to other coverages.
More specifically, the effect of insurance liabilities (-60,2%) mainly comes from unit-
linked products whereby policyholders bear the market risk to a large extent. However, insurance companies are still affected by adverse market developments for this type of insurance activities, since the future fee income is linked to the asset value. Also, the fact that the equity investments related to unit-linked activities are substantially higher in comparison to other activities, illustrates that current equity investments are mostly driven by insurance product types and product characteristics. Insurers are hereby providing investment and insurance solutions aligned to their customers needs and risk profiles.
The LAC TP also reduces an important part (-35,2%) of the remaining capital requirement for equity risks after the effect of the liabilities. This means that the capital charges are lower for investments that are backing insurance contracts with for instance profit sharing mechanisms or for which the received premiums from the customers are not fully guaranteed by the insurer.
In the product types described above, the policyholder participates directly or indirectly in the performance of the investments, of which amongst others, equity investments. The equity risk is partially transferred to the policyholder, and therefore providing insurers capacity to grow their insurance portfolios while continuing to invest in equity and meeting their risk appetite limits. One insurer also specifically mentions in its SFCR that there is a clear difference between participating, with a direct or indirect link to
underlying assets, and non-participating insurance contracts. This insurer mentions that the financial risk exposure for participating contracts is different from that of non-participating business. For the former, a greater emphasis is placed on investing to maximise future investment returns rather than matching assets to liabilities (as with annuities and protection).
At the level of the EU Member States, the LAC TP is an important item in limiting the
capital requirement coming from the equity investments. Between EU Member States significant differences are observed noting that, with the exception of Malta, all EU Member States with a loss-absorbing capacity above 30% of the equity capital requirement have equity exposures (excl. unit-linked investments) above 14%, which is well above the EU average.

European Commission - Study on the drivers of investments in equity by insurers and pension funds
December 2019 I 140
Figure 37 – Impact LAC TP and equity exposure (excl. unit-linked investments)
Source: EIOPA Solvency II statistics and Deloitte-CEPS analysis
Conclusions
The prudential framework affects the allocation of the (equity) investments, within the limits of the insurer’s risk appetite.
The introduction of Solvency II in 2016 replaced the former factor- and accounting-
based principle of the Solvency I framework. The Solvency ratio under the Solvency II framework is significantly lower than that under Solvency I for insurance companies. This was mainly a result of the implementation of a risk-based framework with Solvency II, applying market-consistent valuation principles for assets and liabilities and of the related Solvency Capital requirement, which resulted in a 128 percentage point increase between 2015 and 2016.
The move towards market valuation brings more attention to short-term fluctuations.
However, this is often done while pursuing a long-term investment horizon, which is in line with the insurance activities conducted. Insurers aiming to limit capital volatility will have to closely monitor and probably limit investment classes that bring about a higher volatility of their own funds (and potentially higher returns).
Our main hypothesis was that insurance companies with higher capital levels tend to invest a higher share (in percentage) of investments in equity compared to less capitalised insurance companies. Previous research found that a higher Solvency ratio contributes to higher investments in equity. Our econometric analysis shows that a strong Solvency ratio is correlated with a higher share of equity investments, mainly in listed equity.
However, our regression analyses do not allow for a robust conclusion as to whether
the introduction of Solvency II has limited the level of equity investments. On the one hand, we find that over the period between 1999 and 2018, a strong Solvency ratio is
3,9%
67,3%
42,5%
37,8%
7,4% 7,5%
20,0%
1,2%
16,5%
7,4%
0,3%
38,9%
3,4%
41,0%
9,8%
5,1%3,4%
0,7%
6,7%5,5%
3,0%2,9%
76,7%
0,7%
0,0%
2,5%
5,0%
7,5%
10,0%
12,5%
15,0%
17,5%
20,0%
22,5%
25,0%
27,5%
30,0%
32,5%
35,0%
37,5%
40,0%
0,0%
5,0%
10,0%
15,0%
20,0%
25,0%
30,0%
35,0%
40,0%
45,0%
50,0%
55,0%
60,0%
65,0%
70,0%
75,0%
80,0%
SE DK FR DE FI PL HU LU CZ AT NL SI IT PT GB BE IE ES GR SK CY HR BG MT LT RO LV EE
Equity e
xposure
(excl.
unit-lin
ked investm
ents
)
Loss a
bsorb
ing c
apaity t
echnic
al pro
vis
ions
(in %
gro
ss S
CR)
Type 1 equity Type 2 equity Equity exposure (excl. unit-linked investments)

European Commission - Study on the drivers of investments in equity by insurers and pension funds
December 2019 I 141
associated with more equity investments, mainly in listed equity. This association is more pronounced whenever the long-term guarantee measures are applied. In contrast, ceteris paribus, higher equity investments lead to higher capital requirements (like for any other asset class apart from government bonds under standard formula), hence a lower Solvency ratio, which was confirmed by the performed analyses on the simplified theoretical model. The regressions do not allow for a conclusion with respect to the relationship between the Solvency ratio and investments in unlisted equity.
The undiversified capital charges for equity introduced in the Solvency II framework, ranging between 22% and 49% (adding a symmetric adjustment capturing within a range of - 10% and +10% market evolutions for equities that are not strategic nor long-term investments), are an important element for insurers when considering investments in equity. Depending on a company’s risk appetite and Solvency ratio, the capital requirements could put restrictions on increasing equity investments if they result in breaching the company’s risk appetite.119
Furthermore, recent studies suggest that by hedging the interest rate risk and focusing on maximising the ratio of expected excess return to marginal risk rather than the actual capital charge, life insurers operating within the Solvency II framework can improve their key solvency and profitability indicators while possibly increasing their equity investments. Along these lines, our theoretical model shows a positive relationship between higher equity investments and an increase of the internal rate of return on
own funds (given the higher expected returns from equities). However, as also illustrated in our model and depending on the observed period and selected assets, equity investments may also risk to underperform compared to other asset classes. It is the case, for instance, when one observes the limited annualised historical yield of 1,7% of our weighted equity index during the period 1998-2017.
In addition, investing within and across various asset classes is a good risk management practice, bringing diversification benefits that cannot be ignored. In particular, it is widely (theoretically) accepted that equity investments also contribute towards diversified investment portfolios, what the participants to the interviews confirmed. The interviewees consider diversification across asset classes and across equity classes, in terms of sectoral and geographical distribution, as a necessity from a risk mitigation perspective. As shown by EIOPA’s data at year-end 2017 diversification benefits
significantly decrease the capital charges for equity. This is also confirmed by our theoretical model whereby the instantaneous impact of investing 100 EUR in equity on the capital charge is between 13,84 EUR and 30,14 EUR, depending on the type of equity and other assumptions made.
Insurance product types and characteristics determine the observed SCR risk reductions and are two important drivers for equity investments, as evidenced by the fact that equity investments related to unit-linked activities are substantially higher compared to traditional insurance. Insurers are hereby providing investment and insurance solutions aligned with their policyholders needs and demands. The loss-absorbing capacity of technical provisions reduces an important share of the remaining capital requirement for equity risks, after the effect of the liabilities, further indicating that the capital charges are less for investments backing insurance contracts with profit sharing mechanisms or whereby premiums from the customers are not fully guaranteed by the insurer.
119 Note that the framework does introduce capital charges for all categories of assets (except for sovereigns under standard formula), and not only for equity.

European Commission - Study on the drivers of investments in equity by insurers and pension funds
December 2019 I 142
Several insurance companies note in the interviews that Solvency II is based upon a one-year period Value-at-Risk, whereby short-term volatility as observed in the past is reflected in the calibration of the capital requirements and does not reflect the longer investment horizon for equity investments. The duration-based approach, whereby the holding period of the equity investments is introduced in the calibration, has currently not provided a solution as insurers often do not meet the application conditions. As there is no sufficient data yet, assessing the potential positive effect of the newly adopted long-term equity asset class with a 22% shock will only be possible at a later stage.

European Commission - Study on the drivers of investments in equity by insurers and pension funds
December 2019 I 143
4.3.4 Undertaking characteristics
As illustrated in the literature review, insurance market characteristics have an impact on insurers’ equity investment behaviour. The size of activities, the types of activities and the guaranteed returns of offered products, combined with the expected return on investments will all influence the composition of the balance sheet to various degrees and the investment decisions of an insurer.
Size of activities
When assessing the contribution of an insurer’s size to its behaviour towards investments in equity, two factors are taken into account: (1) the size of the market in which the insurer operates (as a proxy for the market development/penetration) and (2) the concentration ratio by life and non-life insurers in a country.
The percentage of total assets over GDP is used as proxy for the size of the insurance
market. This ratio is typically used as a measure of the level of development of the insurance sector in a country. Considering the role of insurers as institutional investors and that of equity in financing the real economy, a positive effect of the insurance market development on the amount of equity investments is expected. However, we draw on the findings of Athearn (1960) that a larger insurance market is associated with lower amounts invested in equities. Therefore, the tested hypothesis is a negative relationship whereby in more developed insurance markets a lower percentage of total assets is invested in equity.
The regressions where the dependent variables are the ratio of listed equity to total assets, the ratio of unlisted equity to total assets, and the ratio of total equity to total assets produce negative coefficients for the insurance market development, albeit statistically insignificant. This observation is robust across all model specifications, except for the ratio of listed equity to total assets. For the ratio of unlisted equity to total assets, the coefficient is also statistically significant at 5% level.
The results above indicate that as insurers expand their balance sheet and play a more prominent role in the economy, their total equity investments also increase in notional amounts as hypothesised. However, in line with Athearn (1960), insurers seem to allocate less of their assets to this class as compared to the rest of the balance sheet. This reduction in equity allocation seems more pronounced for unlisted equity.
Furthermore, a data series of concentration ratios was created by making use of the EIOPA Solvency I and Solvency II datasets, and EIOPA European Insurance Overview 2017 dataset. The Concentration Ratio-5 (CR-5) was used in particular, and indicates the market volume of gross written premiums that the five largest premium writers in a country account for.
As part of the regression model, the relationship between the concentration ratios of the life and non-life insurance undertakings as of year-end 2017 across the EU Member States and the respective behaviour of insurers towards equity is analysed in more detail.
A higher concentration ratio indicates less competition in the insurance market for that country. In a less competitive market, one may expect that insurers are less inclined to search for higher equity returns, as their position within the market is more secure. However, no hypothesis is tested in this case because various elements, such as insurance laws in each Member State (e.g. cap to the level of premiums priced in certain

European Commission - Study on the drivers of investments in equity by insurers and pension funds
December 2019 I 144
lines of business, minimum amount of profit sharing per year, etc.), or the risk appetite of each company, could influence the behaviour towards equity despite a quasi-dominance in terms of market share.
The concentration ratios vary substantially across the EU Member States and between life and non-life insurance undertakings.120 The smallest concentration ratio can be found in Germany for life insurance undertakings (32%) and in France for non-life insurance undertakings (21%).
Figure 38 – Concentration ratio for life and non-life insurers at year-end 2017
Source: EIOPA Solvency II statistics and Deloitte-CEPS analysis
A quarterly dataset is created by interpolating the yearly concentration ratio data. The resulting variables are then adjusted for the relevant business share within the insurance market of a given country in order to avoid any over- or underestimation of the effect of concentration in the business type.
The regression results show negative coefficients for the concentration ratio of the life business and overall positive coefficients for the concentration ratio of non-life business, respectively. For the ratio of listed equity and total equity to total assets, the regression results are significant and robust (with a positive sign) for the concentration ratio of non-life business. When the dependent variable is the ratio of unlisted equity to total assets, the results are not robust for non-life insurers.
For life insurers, these results suggest that as the market concentration increases, the companies scale down their direct equity exposure irrespective of listed or unlisted type of equity. For non-life insurers, the regression results suggest that as the market concentration increases, insurers grow their direct equity exposure, mainly to listed equity, by buying additional equities. This is in line with Conforti (2015) who finds that
120 Data used for the concentration ratio include (solo) life and non-life undertakings. No further data on composite insurance undertakings was available.
Source: https://eiopa.europa.eu/Publications/Insurance%20Statistics/SA_EIO.pdf .
0%
5%
10%
15%
20%
25%
30%
35%
40%
45%
50%
55%
60%
65%
70%
75%
80%
85%
90%
95%
100%
AT BE BG CY CZ DE DK EE ES FI FR GB GR HR HU IE IS IT LI LT LU LV MT NL NO PL PT RO SE SI SK
Concentr
ation r
atio (
CR
-5)
Life undertakings Non-life undertakings

European Commission - Study on the drivers of investments in equity by insurers and pension funds
December 2019 I 145
property and casualty insurers typically have more flexibility when it comes to the investment strategy and implementation.
From the interviews with the insurers, the size of the insurance company ranks at a
relatively low importance as a driver of equity investments. The majority of insurers mention that the size of the insurance company has no significant bearing on the investment in equity. This is consistent with the findings of Badrinath, Kale, and Ryan (1996) namely the size of the firm, measured as the logarithm of total assets, appears to play only a small role in determining an insurance company’s equity investment. However, several interviewees indicated that size matters to the extent that a critical mass comes with the flexibility to invest in traditional and non-traditional asset classes when needed without prohibitive constraints. Most of the companies that consider size as a decisive factor point out this is strongly related to the financial strength/solvency of the company.
Several insurers reflected on the issue of size in relation to the business model and the investment options. For example, the lack of access to alternative and illiquid asset classes (including private equity) and the need to reconsider their strategies with respect to the in(out)-sourcing of asset management was deemed more pressing for smaller and medium-sized insurers. Larger groups indicated that having the necessary resources to develop internal expertise in their own departments in addition to negotiating mandates with external managers allowed them to better navigate the low
yield environment. However, this cannot be generalised as smaller companies can also achieve a higher level of diversification and/or specialisation in their portfolio with both public and private equity, often on a cross-border basis.
Type of insurance activities
Initial regressions with the share of life and non-life insurance show that the relationship
between equity investments and non-life insurance share is statistically significant and more robust than the life insurance share. Only the share of the non-life business is included in the regressions considering that the life insurance share is complementary to the non-life insurance. This variable results from linear interpolation of the EIOPA Solvency I and Solvency II data on the shares of life and non-life insurers.
Non-life insurers typically have fewer constraints on asset and liability matching
compared to their life counterparts and therefore, they may be expected to be more flexible in investing in equities, as suggested by Conforti (2015). Hence, we expect a positive relation with the equity investments and share of non-life insurers in a country.
The estimated coefficients for the share of the non-life business indicate a positive relation between the share of this business type and equity investments (listed, unlisted
and total) considered in the models. This is robust across regressions with all dependent variables and all model specifications. The coefficients are statistically significant for the listed equity amount, the adjusted listed equity amount, the ratio of listed equity to total assets, the total equity amount and the ratio of equity amount to total assets.
This result suggests that if non-life insurers were to play a more important role in the market, they would increase their direct equity investments in notional amounts but
also as a share in total assets. With this, a non-life insurer could have an additional investment flexibility, in particular for commercial lines of business. Furthermore, the regression results suggest that the focus of the increase seems to be listed equity. Several interviewees from composite companies echoed this finding when explaining the investment strategies of their non-life versus life business. Following this reasoning,

European Commission - Study on the drivers of investments in equity by insurers and pension funds
December 2019 I 146
the ratio of life and non-life insurance business can also have an important impact on the share of equity investments of the total insurance market. A higher share of non-life business in the market will lead to an increase in the share of equity at the level of the whole market, which is higher than the relative increase in the non-life business share (see Box 3 below).
During the interviews, non-life insurers explained their allocation to riskier investments
in comparison to their life counterparts. First, the duration gap is less of a concern for non-life insurers due to the characteristics of their liabilities and they therefore have more flexibility towards equity investments. Non-life insurers’ liabilities are characterised by outstanding claims provisions, which partially can have long durations; and in comparison to life insurers have less fixed cash flows coming from guaranteed interest rates and premiums. Secondly, the claims in the non-life business are very sensitive to inflation and therefore, non-life insurers use equity investment as an inflation hedge. The first reason is consistent with the findings of Conforti.
Box 3. Ratio life and non-life insurance, and its influence on the share of equity investments of the total insurance market
In order to stress the importance of the ratio between life insurance (non-unit-linked) and non-life insurance business, in terms of influence on the share of equity investments of the total insurance market, let us consider this hypothetical example, in which the reinsurance sector is not taken into account.
We assume that the non-life insurance sector has structurally higher investments in equity than the life insurance sector. Therefore, we assume a 30% share of equity investments for the non-life insurance sector and a 10% share of equity investments for the life insurance sector (non-unit-linked).
A change in the business share from non-life to life (non-unit-linked) insurance can lower the share of equity investments of the total insurance market, although there was a 10% growth of equity investments per sector. This can happen when the sector of structurally lower equity investments, in this case the life insurance sector, increases its share in the total insurance market.
Although there is a growth by 10% of the equity share within the investments in both sectors (from 10% to 11% and from 30% to 33%), the equity share in the total sector declines by more than 10% (all other things/investments being equal). As explained above, this happens as the share of the life business (which is the business with the lower equity share) within the total sector grows in the meantime.
This example shows that a growing share of the life insurance sector (non-unit-linked)
has by itself a negative influence on the equity share of investments of the entire sector. The effect of this negative influence depends on the level of change of the ratio. In this

European Commission - Study on the drivers of investments in equity by insurers and pension funds
December 2019 I 147
particular example, the change of the ratio turns a 10% sectorial growth in a more than 10% decline of the share of equity investments of the total sector.
Guaranteed returns of offered products
The views on the significance of this factor for investments in equity differ widely among the interviewed insurers. For example, (1) French insurers rate the contribution of the cost of liabilities reserves significantly lower than German insurers, non-EU insurers and the European average; (2) non-EU insurers attribute to it a higher score than EU insurers.
In line with EIOPA’s 2018 report on Long Term Guarantee measures (EIOPA, 2018g), most participants to the interviews reported a decline in the number of guaranteed products offered121 and pointed to the recent market downturns, namely the global
financial crisis and the protracted low interest rate environment as the main causes. The interviewees indicated that with an average guaranteed rate between 1-4%, the implied cost of liabilities reserves has been putting pressure on their margins in the context of the prolonged low yield environment. This is consistent with the survey carried out by the OECD (2016).
The interviewees listed different ways to react to this pressure. On the asset side, most
insurers indicated an increased interest in private equity investments as an alternative to bonds. This is not consistent with Stowe (1978) who finds that a higher cost of reserve liabilities is associated with a less risky portfolio. This can however be explained by the fact that the findings of Stowe hold in normal market conditions with life insurers offering guaranteed rates that will, to a large extent, match the fixed income returns coming from their investment portfolio.
On the liability side, traditional policies continue to dominate and the demand for guaranteed products remains strong. However, insurers have not only been reducing the volume of financial guarantees products or altering their features they have also gradually switched towards unit-linked products. Several insurers indicated the complete or partial discontinuation of guaranteed products after the 2008 or 2011 crises and their entering the unit-linked products market as a risk management measure.
Other alternatives to guaranteed rates include the offering of (1) zero percent interest rate guarantee with profit sharing; (2) partial guarantee on the premiums invested with profit sharing or (3) protection of capital invested instead of guaranteed interest rates.
However, even in markets where unit-linked activities are significantly higher, products with a financial guarantee continue to be in high demand by the policyholders and therefore several insurers continue to provide them. In such cases, insurers mentioned
strong ALM as the key factor supporting the continuation of their guaranteed products offering. For the remainder, the reason for the continuation is that the average guaranteed rate in their portfolio is already quite low.
Composite insurers also reacted differently depending on their portfolio. An insurer mentioned that for their life portfolio the company divested from equity in order to
preserve the minimum guarantee for the policyholder. However, for the non-life portfolio they keep their equity holding to maximise the return to the shareholder.
121 This is also confirmed in EIOPA’s 2018 report on Long Term Guarantee measures.

European Commission - Study on the drivers of investments in equity by insurers and pension funds
December 2019 I 148
Conclusions
The three angles of approach, namely the literature review, regression analyses and interviews, do not provide the same perspective on the effect of size on insurers’ behaviour towards equity investments. The interviewees have almost unanimously ranked this driver as low in importance, arguing they would not invest more in equity if they exhibited a larger balance sheet. The literature review partially backs up this claim. On the one hand Badrinath, Kale, and Ryan (1996) find that the size of the firm appears to play only a minor role in determining insurance company equity investment. On the
other hand, Stowe (1978) expresses that insurer size is positively related to holdings of common equity.
Concerning the type of activities, the regressions suggest that the concentration in
the market and the business share in terms of types of activities i.e. life vs. non-life, have a significant influence on the actual share of equity investments due to the nature of their claims liabilities. Non-life insurers’ liabilities are characterised by outstanding claims provisions, which are sensitive to inflation and can have long durations, depending on the line of business. In comparison to life insurers, non-life insurers also have less fixed cash flows coming from guaranteed interest rates and premiums.
While traditional policies continue to dominate and the demand for guaranteed products
remains strong, insurers have been reducing the volume of financial guarantees products. Literature suggests that the higher cost of liabilities’ reserves are associated with less risky portfolios. However, it emerges from the interviews that the current economic conditions and particularly the low interest rate environment is exerting a heavy pressure on companies offering products with guaranteed returns. A whole strand of literature concurs with this view, arguing that the protracted low interest rate environment is causing life insurers to depart from interest-bearing assets, towards more risky assets, in search of yield. The interviews and literature suggest that many
life insurers have undergone (or are in the midst of) a shift in product offering towards less financial guarantees or products where the investment risk is borne by the policyholder (unit-linked insurance products). It is worth mentioning that in general the share of equity investments is higher in the case of unit-linked products than for guaranteed products.122
122 EIOPA (2017b, 2018c, 2018h) notes that the share of unit-linked business has increased from 2011 to 2018. Per EIOPA,
in terms of volume the business has more than doubled since 2011. In 2016, the vast majority of the UL/IL business (80%) was managed by DE, FR, NL and UK groups. More specifically, the total share of unit-linked business in life gross written
premiums has increased from 28% in 2016 Q4 tot 41% in 2017 Q4, while the share for the median insurance company has increased to 35% in 2017 compared to 30% in 2016. Growth slowed for unit-linked business in life, expressed in gross written
premiums, between 2017 Q2 and 2018 Q2, but the share of unit-linked business is expected to grow further over the coming years.

European Commission - Study on the drivers of investments in equity by insurers and pension funds
December 2019 I 149
4.3.5 Accounting framework
The literature review shows that the accounting framework can impact an insurance company’s investment behaviour. The expectation is that a number of changes to the accounting framework have led insurers to be more concerned with short-term changes in market prices, and volatility in the results, and for this reason may have shifted away from more volatile asset classes such as equities.
Firstly, the obligation (for listed companies) to report frequently can reduce a company’s
investment horizon due to a focus on semi-annual or annual results (behaviour that may potentially induce procyclicality). Secondly, and having the same consequence, the introduction of internationally applicable accounting standards has made it possible for investors to better compare companies (including comparison across countries). Thirdly, the introduction of fair value accounting introduced more volatility in the results of insurers. According to the World Economic Forum (2011), changes in the accounting framework towards fair value accounting have forced ICPFs to be more concerned with short-term changes in market prices.
In order to analyse the accounting framework as a potential driver, the accounting framework for European insurers is first briefly explained. The introduction of IFRS in 2005 marked an important move towards fair value accounting for insurers. This factor, as well as the potential impact of the entry into application of IFRS 9 and IFRS 17 for
insurers in the coming years are discussed in this section. This is complemented by the regression results and the information obtained as part of the interviews conducted. Finally, the potential impact of fair value accounting on the volatility of an insurer’s results is analysed as part of the theoretical model.
Applicable accounting framework
The accounting framework for insurers in Europe is currently only partially harmonised.
Harmonisation exists for listed European insurers with respect to the requirement to report their consolidated financial statements under International Financial Reporting Standards (IFRS).123 At statutory level, a more diverse accounting practice exists whereby these listed insurers are, either required or permitted to report under IFRS or required to apply local accounting principles.124
For unlisted insurers, the requirements are less strict and less harmonised across countries. However, IFRS is required or permitted for consolidated financial statements in a large number of countries. At a statutory level, local general accepted accounting principles (GAAP) still often apply. Unlisted subsidiaries of listed insurance groups are considered unlisted insurers. Although in a number of countries these entities are in principle not required to publish local financial statements under IFRS, this standard will
still generally be their leading accounting standard when analysing accounting impacts of investments, given its contribution to the IFRS reporting of the group to which they belong.
123 From a standards perspective, harmonisation is achieved by the application of IAS 39 or IFRS 9 for financial instruments.
However, IFRS 4 Insurance Contracts, which is applied as from the introduction of IFRS, is considered as the first guidance of the IASB relating to the accounting treatment of insurance contracts and still allows for non-uniform accounting policies
whereby local accounting practices can still to a large extent be continued. Further harmonisation will be achieved in the future with the application of IFRS 17, the first truly international standard for insurance contracts.
124 13 Member States require listed insurers to report their statutory accounts according to IFRS. 8 Member States permit the application of IFRS and 7 Member States do not allow IFRS to be applied in the statutory accounts.

European Commission - Study on the drivers of investments in equity by insurers and pension funds
December 2019 I 150
The comparative analysis of applicable accounting standards per country, for listed and unlisted insurers, at consolidated and statutory levels, is available in Annex 5.
The analysis of year-end 2017 EIOPA data shows that approximately 90%125 of total
investments were made by insurance groups being required to report consolidated figures under IFRS in case they are listed, and being permitted or required to report under IFRS in case they are unlisted. In addition, an analysis of 20 group SFCRs at year-end 2017 shows that, except for one insurance group, all insurers are reporting under IFRS. The 19 groups reporting under IFRS represent 57% of the total investments, deposits, cash and cash equivalents of all insurance groups in Europe. This confirms that, from a market coverage perspective, IFRS is the main accounting framework in Europe for insurance undertakings and is most relevant to perform the analysis upon. Given the cross-border activities of many insurance groups, a country-by-country analysis has not been performed.
Table 3 - Solvency II balance sheet (S.02.01) group and individual comparison
in number Solvency II
(group YE '17)
Solvency II
(individual Q4 '17) Difference
# % # % #
Life undertakings n/a n/a 492 23,9% n/a
Non-Life undertakings n/a n/a 1.169 56,8% n/a
Reinsurance undertakings n/a n/a 115 5,6% n/a
Undertakings pursuing both life and non-life insurance activity n/a n/a 282 13,7% n/a
Total 358 100,0% 2.058 100,0% -1.700
in Mio EUR Solvency II
(group YE '17) Solvency II
(individual Q4 '17) Difference
Amount % Amount % %
Holdings in related undertakings, incl. participations and equities 723.245 10,6% 1.076.107 14,1% -3,5%
Holdings in related undertakings, including participations 407.113 6,0% 799.665 10,5% -4,5%
Equities 316.132 4,6% 276.442 3,6% 1,0%
Equities – listed 261.043 3,8% 231.403 3,0% 0,8%
Equities – unlisted 55.089 0,8% 45.039 0,6% 0,2%
Collective Investments Undertakings 840.205 12,3% 1.320.845 17,3% -5,0%
Bonds 4.438.122 65,0% 4.399.148 57,5% 7,5%
Loans and mortgages 340.469 5,0% 368.575 4,8% 0,2%
Property 244.994 3,6% 152.175 2,0% 1,6%
Deposits 103.504 1,5% 212.623 2,8% -1,3%
Cash and cash equivalents 129.449 1,9% 110.554 1,4% 0,5%
Other investments 9.600 0,1% 11.265 0,1% 0,0%
Total Investments, deposits, cash and cash equivalents 6.829.588 100,0% 7.651.292 100,0% 0,0%
Source: EIOPA statistics and Deloitte-CEPS analysis
The analysis focuses first on assessing whether the introduction of IFRS in Europe as from 1 January 2005 has had an impact on the investments in equity. IFRS has made fair value accounting mandatory for all equity investments for which a fair value can be determined reliably.
It is also important to understand the changes brought by the accounting standard IAS 39, when looking at equity investments. Looking forward, the application of IFRS 9 is also taken into consideration. However, given the available deferral option as explained later, the changes brought by IFRS 9 are not considered relevant for the period before 2018. The analysis focuses on the concepts of fair value measurement and impairments, and the impact this may have on the volatility of insurers’ results.
The liability side is briefly introduced, namely by looking at the introduction of IFRS 17 for insurance contracts that will replace IFRS 4. IFRS 17 is considered to be the first 125 Total investments, deposits, cash and cash equivalents reported by insurance groups of 6 830 billion EUR divided by total
investments, deposits, cash and cash equivalents by individual insurance companies of 7 651 billion EUR. Also, the 10% remaining companies, are companies reporting on a solo level and that are not part of an insurance group.

European Commission - Study on the drivers of investments in equity by insurers and pension funds
December 2019 I 151
truly IFRS for insurance contracts and is having a major operational and financial impact on insurers’ financial reporting. IFRS 4 (an interim standard) was meant to limit changes to existing insurance accounting practices under local GAAP. As such, IFRS 4 has allowed insurers to apply different accounting policies to measure similar insurance contracts written in different countries. IFRS 17 should bring more harmonisation in how insurance contracts are accounted for.
Impact of the introduction of IFRS
The analysis of the 20-year ECB dataset confirms that the introduction of IFRS in 2005 coincided with a negative impact on the amounts invested in listed equity by insurers. The regression results are robust and significant for the share invested in listed equity and total equity. For unlisted equity, however, the sign of regressions outputs are robust across all results, but not significant across models. The decrease in direct listed equity, which has an impact on the total equity, may be partially compensated by a switch towards indirect equity investments for which limited historical data is available. In
addition, although from a coverage perspective IFRS is considered the main accounting framework, a data limitation exists as the dataset cannot be split up between insurers that apply IFRS for statutory and/or group reporting requirements, and insurers that solely apply local accounting principles that can differ from IFRS accounting principles.
The relationship between the accounting framework and the equity investment by insurers is studied by extending the base econometric model with a dummy variable for
IFRS. This dummy variable takes a value of 0 before the introduction of IFRS and 1 after the introduction of IFRS in 2005. The dummy variable is expected to capture the average impact of IFRS on the equity investments, if any. In order to take into account the global financial crisis and to isolate the relation of IFRS on equity investments, another dummy variable was introduced (which takes the value of 1 during the crisis period) (see section 3.10). The full results of the regression are presented in Annex 1.
The regression results with the variables for the listed equity and total equity suggest a negative relationship between equity investments and the introduction of IFRS. The coefficient of the IFRS dummy variable is consistently negative in the model specifications with these variables. Furthermore, the coefficients are significant at the 1% level with the specification for the ratio of listed equity to total assets, and significant at the 5% level for the ratio of total equity to total assets.
Note that in the specifications with the listed equity and total equity variables, the coefficients of the Global Financial Crisis dummy variable are also consistently negative, and thus robust. This result is in line with the observations on the trends in equity investments during the crisis. The analysis of the regression results for unlisted equity delivers robust results for the IFRS variable. However, unlisted equity provides nonrobust results for the Global Financial Crisis and neither of the variables for the accounting framework produces significant results. One possible reason for this might be the impact of participations within this category.
Firstly, the category in the ECB dataset on which the regressions are based may include a combination of different types of investments (e.g. unlisted participations, private equity) and as such lead to inconclusive regression results. Secondly, the regression results cannot fully capture the potential changes in equity investment behaviour by participations held by an insurer.126 On a country level, participations are included in 126 This implies that potential changes in equity exposure by an insurer via its subsidiaries would not be captured by the ECB data.

European Commission - Study on the drivers of investments in equity by insurers and pension funds
December 2019 I 152
the ECB data set as stand-alone investments, whereas usually under IFRS the full consolidation or equity method127 is applied by insurers. In addition, insurers may be less exposed to market price volatility for these participations. Thirdly, to support that these participations can have an important share in the unlisted equity category, as stated in the financial stability report of CEIOPS (2009), many insurance companies have increased their own funds as a result of the financial crisis, after which some insurers received capital injections from governments or third-party consortiums. Given the importance of insurance groups across Europe these capital increase measures could eventually have resulted in capital increases at subsidiary level within the insurance group and in an increased level of participations, during the period when IFRS is applicable.
For insurers’ reporting under IFRS, IAS 39 has been the applicable accounting standard since 1 January 2005 for their investments, including those in equity. Under IAS 39, equity instruments (other than those held-for-trading), were classified as Available-for-
Sale (AFS). These instruments were measured at fair value (subject to an exemption to use cost for equity securities that do not have a quoted market price in an active market and for which the fair value cannot be reliably measured) and changes in fair value were directly presented in Other Comprehensive Income of own funds and not in profit and loss. In other accounting models whereby equity investments are not recorded at fair value on the balance sheet, this information is disclosed in the notes of the financial statements.
IAS 39 also requires insurers to make an impairment on an equity investment, in case there is objective evidence to do so, including ‘information about significant changes with an adverse effect that have taken place in the technological, market, economic or legal environment in which the issuer operates, and indicates that the cost of the investment in the equity instrument may not be recovered’. IAS 39 also states that ‘a
significant or prolonged decline in the fair value of an investment in an equity instrument below its cost, is also objective evidence of impairment’.
Under IAS 39, profit and loss volatility can arise when impairment triggers are reached and therefore the entire unrealised loss recognised in own funds is entirely recycled into profit and loss. In addition, once an equity investment is impaired, a further decrease in fair value results into recording the additional loss into profit and loss. In contrast
hereof, an increase in fair value is required to be recognised directly into Other Comprehensive Income and only recycled into profit and loss when the investment is sold. Monitoring equity investments that show unrealised losses that are approaching the significant decline, prolonged decline impairment triggers, or impaired equity investment could result into risk mitigating actions in order to prevent further profit and loss volatility.
The accounting standards being ‘principle-based’ leave room for interpretation by the insurer. EFRAG (2018) states that ‘this significant or prolonged trigger has been the most determinative part of IAS 39’s impairment guidance in the context of equity instruments classified as AFS in practice, and confirmed that most entities in their sample indeed used a criterion of ‘significant or prolonged’ decline in fair value to assess impairment of equity instruments’. Moreover, the IASB explained that the impairment
127 The equity method is a method of accounting whereby the investment is initially recognised at cost and adjusted thereafter for the post-acquisition change in the investor's share of the investee's net assets determined applying IFRS. The investor's
Profit and Loss includes its share of the investee's profit and loss and the investor's Other Comprehensive Income includes its share of the investee's other comprehensive income.

European Commission - Study on the drivers of investments in equity by insurers and pension funds
December 2019 I 153
requirements for equity instruments classified as AFS under IAS 39 were very subjective and had created application problems.
Based on our own analysis of 20 large insurance groups across the EU, we note that the ‘significant or prolonged decline’ impairment trigger is applied as follows:
‘Significant decline’: 11 insurance groups consider 20%-30% to be a significant decline and 3 insurance groups consider 40%-50% to be a significant decline.
For the remaining insurance groups no information was immediately retrieved from the insurance group’s IFRS valuation rules.
‘Prolonged decline’: 8 insurance groups consider a period of 6 months as an impairment trigger for prolonged decline, 3 insurance groups apply a period of 12 months and 3 insurance groups apply a range between 18 and 36 months.
The range of the impairment triggers in the study sample is in line with the earlier
expectation that some insurers prefer to avoid volatility originating from short-term volatility in equity markets in their profit and loss account. Profit and loss volatility can arise when impairment triggers are reached and therefore the entire unrealised loss initially recognised in own funds is entirely recycled into profit and loss. In addition, once an equity investment is impaired, a further decrease in fair value results into recording the additional loss into profit and loss. It also shows that IAS 39 allows some time to circumvent possible volatility, as impairment trigger levels are often, with the exception of an instant crash of the stock markets, above the significant decline impairment triggers and not immediately reached. In a diversified portfolio, the negative performance of some investments can also be counterbalanced by a positive performance of other investments.
Several insurers stated during the interviews that accounting rules are too stringent and
do not give enough consideration to the long time horizon of certain investments. In case accounting rules result into recording short term volatility into their profit and loss account, this can result into an increased Earnings at Risk (EaR). Some insurers indeed stated that they are managing their EaR within a reasonable range. The EaR is an internal indicator evaluating the impact of a change in fair value of equity investments on the accounting profit and loss applying a Value at Risk approach whereby a confidence interval is assumed in line with the insurer’s individual risk appetite. It hereby
takes into account the insurer’s accounting policies, including the afore-mentioned impairment triggers, and possible actions related to the management of the investment portfolio. The EaR is perceived as an important risk driver that sets a limit to the share of equity investments, given that higher investments and possible impairments would make the profit and loss more volatile.
Other insurers mentioned that they are taking mitigating actions in order to manage the volatility related to fair value accounting of equity investments. Mitigating management actions can be for example the realisation of capital gains on equity investments or other type of investments to counterbalance the impairment volatility of equity investments in profit and loss. As mentioned above, the impairment triggers applicable under IAS 39 could leave some time for insurers to take mitigating actions. Looking forward, one of the goals of the IASB with the introduction of IFRS 9 is to avoid recycling of equity investments as an earnings management tool.
A number of insurers are concerned that the accounting treatment is putting additional constraints on their ability to invest in equity. One insurer stated that they decreased their equity investments in favour of investments in real estate in combination with

European Commission - Study on the drivers of investments in equity by insurers and pension funds
December 2019 I 154
long-term rental agreements. In doing so, they choose the cost model and therefore are applying an amortised cost approach that allows for more stable depreciation cost and (rental) income in their profit and loss account, and a possible upward return of realising gains in the long run upon sale of the real estate. A minority of insurance companies indicated, that they do not consider the accounting framework to be an important factor of the asset allocation.
Looking forward, IFRS 9 replaces the IAS 39 standard for equity investments, effective for annual periods beginning on or after 1 January 2018.
In accordance with IFRS 9, equity instruments are measured at fair value with fair value changes recognised in profit and loss (‘FVPL’). At initial recognition, an entity may however make an irrevocable election (business model decision) to present changes in the fair value of equity instruments in Other Comprehensive Income on an instrument-by-instrument basis (the ‘FVOCI election’). This FVOCI election is not available for equity instruments that are held for trading or contingent consideration recognised by an
acquirer in a business combination. Under FVOCI both unrealised and realised gains and losses are recorded in equity, and only dividends are recognised directly in profit.
In comparison to IAS 39, impairments on equity investments are no longer applicable under IFRS 9.
IFRS 9 is a further step into fair value accounting, whereby FVPL is considered as the default approach. The IASB is of the opinion that this approach is clearly in line with the recently revised Conceptual Framework for Financial Reporting. This conceptual framework determines that the profit and loss is the primary source of information about an entity’s financial performance for its financial period and therefore value changes are by default recorded in profit and loss. As explained by the Vice-Chair of the International Accounting Standards Board (2018), the IASB’s view is that ‘clearly visible information
about changes in the value of an equity investment is always important, even if the investment is not going to be sold in the near term. Value appreciation is probably the most important goal of any long-term investor. This is why the default [choice] in IFRS 9 is to recognise changes in the value of equity investments in profit and loss. If an equity investment is relevant to an entity’s performance, then the most useful information about that investment is provided by measuring it at fair value with value changes recognised in profit and loss, as those changes occur period by period. This will result in movements in P&L, but those movements reflect economic reality’.
In addition, the exception under IAS 39 not to apply fair value measurement due to the fair value not being reliably measured, is removed under IFRS 9.
The potential future impact of applying fair value through profit and loss accounting on
equity investments on a hypothetical insurer’s results is analysed through a theoretical model. We stress that this is only a partial analysis as the outcome has to be considered together with, depending on the characteristics of the insurance contracts, the relationship with the accounting treatment of the insurance contracts’ liabilities.
In this simulation, 10% of the premiums received are invested in equity. Equity movements follow the changes of the weighted equity index, as observed during the
period 1998-2017. The return on equity is calculated as the result for the period, applying FVPL accounting for equity investments and amortised cost accounting for bonds, divided by the reported own funds at the end of the previous period. The equity allocation as a percentage of the market value balance sheet and the evolution of the Solvency II ratio are included for reference purposes.

European Commission - Study on the drivers of investments in equity by insurers and pension funds
December 2019 I 155
This scenario shows high volatility of the return on equity from an accounting perspective, which demonstrates that FVPL can potentially result in high volatility, if no mitigating actions are taken by the insurer, or loss absorbing impacts through the measurement of technical provisions exist. In addition, we observe that the accounting volatility is significantly higher in comparison to the volatility of the Solvency ratio under Solvency II.128 The profit or loss is reflecting the performance results over a short period, from quarterly to annual results.
Figure 39 – Impact of FVPL accounting on equity return based upon weighted equity index
Source: Deloitte-CEPS analysis
Although IFRS 9 is effective as from 1 January 2018, entities undertaking insurance activities and meeting the predominance test129 are permitted to apply IFRS 9 at a later
date in order to align the application date of IFRS 9 with IFRS 17, for which mandatory application is expected to be at 1 January 2022. This temporary exemption is called the deferral approach.130 This leaves insurers with a few years to take actions in their investment allocation in case they are of the opinion that the application of IFRS 9 would have unfavourable impact on their financial statements.
We note that a number of large insurers in Europe have opted for the deferral of IFRS 9 and therefore aligning the timing of the application of IFRS 9 to the first time adoption of IFRS 17. Evidence for this is provided through our sample analysis of 20 large
128 In the theoretical model, a Solvency II ratio was calculated for the complete time series, as if the framework was already in place, to be able to compare the volatility across the time series. 129 The predominance test is focused on the proportion of insurance liabilities in proportion to the entity’s total liabilities. Liabilities connected with insurance comprise liabilities arising from contracts within the scope of IFRS 17, non-derivative
investment contract liabilities measured at FVTPL under IAS 39 and liabilities that arise because the insurer issues or fulfils obligations arising from the liabilities listed previously.
130 The deferral approach is a temporary exemption and is targeted at entities that are most affected by the different effective
dates of IFRS 9 and IFRS 17 because their activities are predominantly connected with insurance and they have not applied IFRS 9 previously. Insurers wanting to elect this option must pass what is being referred to as the ‘predominance test’.
-250%
-200%
-150%
-100%
-50%
0%
50%
100%
150%
200%
250%
300%
350%
400%
450%
-25,0%
-20,0%
-15,0%
-10,0%
-5,0%
0,0%
5,0%
10,0%
15,0%
20,0%
25,0%
30,0%
35,0%
40,0%
45,0%
1998
1999
2000
2001
2002
2003
2004
2005
2006
2007
2008
2009
2010
2011
2012
2013
2014
2015
2016
2017 Solv
ency I
I ra
tio (
in %
)
Retu
rn o
n e
quity (
in %
) and E
quity a
llocation m
ark
et
valu
e b
ala
nce s
heet
(in %
)
Return on equity - accounting Equity allocation MVBS Solvency II ratio

European Commission - Study on the drivers of investments in equity by insurers and pension funds
December 2019 I 156
insurance groups across Europe.131 Exceptions are, for instance, bancassurance groups, whereby the deferral option cannot be applied at group level and as a consequence these groups have opted to already apply IFRS 9 at lower reporting levels.
Taking into account the preference by insurers to apply the deferral approach and the recent application as from 1 January 2018 of IFRS 9 for insurers that already apply IFRS 9, we have so far today not noted any major changes with respect to insurers’ listed equity investments. In the upcoming years more focus could be placed on the potential IFRS 9 consequences for less liquid equity investments and collective investment undertakings/vehicles.
For example, certain investment funds may no longer be considered as equity
instruments under IFRS 9. When classified as debt instruments, these funds are consequently obliged to be classified under FVPL. The members of the European Fund and Asset Management Association (EFAMA) expressed their concern on this point in a separate memorandum (2016), namely on how IFRS 9 could negatively impact the investment levels in collective investments undertakings and therefore the level of (indirect) equity investments by long-term institutional investors.
When surveying for the potential impact of IFRS 9, EFRAG (2018) noted that most
respondents indicated that business, economic and regulatory factors are affecting their decisions to invest and hold equity instruments or other classes of assets. However, 12 entities (out of 26 respondents from the insurance, financial services and non-financial sectors), mainly insurance entities, expect to modify such decisions, although most did not specify to what extent. Some respondents indicated that they might shift some of their investments into different asset classes, including unquoted equities, as possible alternatives to quoted equities. They observed that returns from non-listed investments are mostly collected as dividends - which are recognised in profit and loss - and that
unlisted investments are less volatile. Due to the fact that dividend income will always be recognised into an insurer’s income statement, it could potentially result into favouring equities with a higher dividend pay-out.
During 2018 the IASB discussed the first time adoption date of IFRS 17. At the end of 2018 it was decided to issue an exposure draft during the first semester of 2019 in order to delay IFRS 17 adoption to 1 January 2022. As mentioned above, IFRS 9 will follow the same application date for insurers that have opted for the deferral approach.
IFRS 17 requires a company that issues insurance contracts to report these on the balance sheet, as the total of the fulfilment cash flows and the contractual service margin (‘CSM’), the latter representing the expected profit for providing future insurance coverage, or unearned profit. The measurement of the fulfilment cash flows includes the
current value of any interest-rate guarantees and financial options included in the insurance contracts.
In order to limit accounting mismatches, it can be expected that a wider application of current value measurement for insurance contracts under IFRS 17 will – in combination with the IFRS 9 application – result in a larger portion of financial instruments being measured at fair value, to present he economic matching between the financial
instruments and the insurance contracts. The way in which balance sheet items impact own funds and the income statement respectively, are an important consideration. EFRAG notes that most insurance entities are still at an early stage of assessing the
131 16 insurance groups state in their consolidated financial statements to apply the deferral approach, no information was retrieved for 3 insurance groups and 1 insurer is part of a bancassurance group applying IFRS 9 as from 1 January 2018.

European Commission - Study on the drivers of investments in equity by insurers and pension funds
December 2019 I 157
potential impact of the new accounting standard. Therefore no quantitative analysis can currently be performed as impacts, if any, will only occur in the years to come.
As detailed in the prudential framework section, an important driver of investments in
equity investments is the loss absorbing capacity of technical provisions. An important element will therefore be the treatment of indirect and direct participating contracts under IFRS 17, whereby the objective is to avoid accounting mismatches between the underlying assets and the insurance contracts liabilities for contracts with policyholder participation. This matching should result in a decreased profit and loss volatility of equity investments provided that a link with the insurance contracts is available. This future accounting treatment could potentially drive insurers towards having more insurance contracts with participating features. Nevertheless, the interplay of many factors will eventually determine future changes.
In its 2019 Annual Report on the enforcement and regulatory activities of European
accounting enforcers, ESMA reiterated that it will be providing input to consultations conducted by the IASB and EFRAG and will closely monitor and contribute to the endorsement process of IFRS 17.
During our interviews, a number of insurers made remarks in line with EFRAG’s view.132
Several insurers raised significant concerns that the application of IFRS 9 will drive them away from equity investments made directly and indirectly through funds. Most of them also confirm that due to the application of the deferral approach, they are able to manage the current volatility but still a lot of effort (including operational) is required going forward. None of the insurers mentioned during the interviews that IFRS 9 will drive them to invest more in equity investments.
For example, the need to preserve some margin of flexibility in the way they manage
their investment portfolio and smoothen their results was mentioned by several insurers. This would mean that the company would retain some control over how the capital gains/losses are reflected in the results, e.g. materialise them or make provisions in order to avoid unwanted volatility and send wrong signals to the market about the financial strength of the insurer). Shifting the equity exposure from the shareholders fund to the main fund of policyholders to avoid volatility may be a way to reduce the impact but is not equivalent to more control over capital gains losses through profit and loss.
One insurer specifically mentioned that accounting rules do not drive investment decision making on a standalone basis and are often exaggerated. Multiple factors determine the final outcome. Another insurer indicated the impact of IFRS 9 on equity investments could potentially have a larger impact than the introduction of Solvency II.
When it comes to third-country jurisdictions, insurers mentioned the advantages of the book value framework compared to mark-to-market (MTM) for investments in both listed and private equity. An early adopter of IFRS 9, indicated being prepared for
132 EFRAG notes that ‘If neither option in IFRS 9 is attractive to some long-term investors, there may be a disincentive for those investors to hold equity instruments on a long-term basis’. In its endorsement advice, based on the limited evidence available at that time, EFRAG assessed that it was unlikely that long-term investors would change their investment strategy
as a result of IFRS 9. EFRAG noted that broader economic considerations, such as the need for entities undertaking insurance activities to obtain a yield on their asset portfolio sufficient to meet their obligations to policyholders, are likely to outweigh
any accounting concerns. ‘In our view, clearly visible information about changes in the value of an equity investment is always important, even if the investment is not going to be sold in the near term. Value appreciation is probably the most important
goal of any long-term investor. This is why the default business model choice in IFRS 9 is to recognise changes in the value of equity investments in P&L. If an equity investment is relevant to an entity’s performance, then the most useful information
about that investment is provided by measuring it at fair value with value changes recognised in P&L, as those changes occur period by period. This will result in movements in P&L, but those movements reflect economic reality.’

European Commission - Study on the drivers of investments in equity by insurers and pension funds
December 2019 I 158
different standards (international or local GAAP) across the relevant business jurisdictions and takes investment decisions that factor in different valuation principles.
Conclusions
Both the literature review as well as the analyses above have shown that a change in the accounting framework for insurers can impact equity investments, and should be considered as an important driver. The aspect of fair value accounting is the main underlying factor insurers consider when investing. Having to report frequently to the market, companies are more exposed to short-term changes in market prices and volatility in their own funds and/or results. Moreover, the application of internationally adopted accounting standards exposes insurers to comparability to peers across jurisdictions.
Within the EU, IFRS is the main accounting framework for insurers due to the
importance of listed insurance groups, often having cross-border activities through their subsidiaries. Indeed, the application of internationally adopted accounting standards favours comparability across jurisdictions.
The introduction in 2005 of IFRS, which generalises market valuation, coincided with
a downward trend on the amounts invested by insurers in (listed) equity, as reflected in our regression analyses and discussed in the academic literature and during interviews. The decrease in direct equity investments may have been partially compensated by a switch towards indirect equity investments, for which very limited historical data is available. In addition, the data also includes insurers that solely apply local accounting principles that can differ from IFRS accounting principles. The analyses for unlisted equity did not lead to conclusive results, which might be due to different types of equity included in this category (such as unlisted participations and private
equity). The amount of insurers’ participations within this category, where insurers have the choice to apply either the full consolidation or equity method, make these equity investments less exposed to market price volatility and hence short-term volatility of the insurer’s result.
An analysis of a sample of insurers’ SFCRs indicates that insurance groups in Europe still apply IAS 39 and have opted for the deferral of IFRS 9 for which they are aligning
the first time adoption date with IFRS 17. Under IAS 39, equity investments impact an insurer’s profit and loss account mainly through either a prolonged or significant decline in fair value, dividends received, and/or realised results through the sale of equity investments.
Profit and loss volatility can arise when impairment triggers are reached and therefore
the entire unrealised loss initially recognised in own funds is recycled into profit and loss. In addition, once an equity investment is impaired, a further decrease in fair value results in recording the additional loss into profit and loss. As mentioned by insurers, this measurement still provides room for mitigating actions in order to manage the volatility related to fair value accounting of equity investments. Other insurers are more concerned about the possible impact of short-term volatility on their profit and loss under IAS 39, applying a confidence level that is dependent on the insurer’s risk appetite.
Alternatively, an insurer may under IFRS 9 irrevocably elect to present changes of the fair value in other comprehensive income on an instrument-by-instrument basis. Under this accounting policy choice, both the unrealised and the realised gains and losses are

European Commission - Study on the drivers of investments in equity by insurers and pension funds
December 2019 I 159
directly recorded in shareholders’ equity. As a result of this choice, the contribution of equity investments to the profit and loss account will be limited to dividends received. Insurers taking this accounting policy choice, may therefore have an incentive to favour equities with a higher dividend pay-out. In addition, the future application of IFRS 17 for insurance contracts during the upcoming years will result in a broader application of current value measurement. Therefore the interplay between IFRS 9 and IFRS 17 will be an important topic in the years to come. More specifically, insurance contracts with direct participation features may gain in importance. For these contracts, IFRS 17 is expected to mitigate to a large extent the potential volatility arising from the fair value measurement of financial assets.133 This measurement model will be important for insurers who are aiming to limit unexpected profit and loss volatility coming from equity investments with fair value changes recorded through profit and loss.
As insurers are preparing for IFRS 9 and IFRS 17 in the upcoming years, the application of both standards need close monitoring to ensure that they do not introduce even more volatility to the financial accounts and therefore negatively impact equity investments.
133 Under IFRS 17 insurance contracts with direct participation features create an obligation to pay policyholders an amount that is equal to the fair value of the underlying items, less a variable fee for service. This measurement model is referred to
as the variable fee approach whereby these contracts provide investment-related services and whereby a clear relation is identified between the underlying items and the insurance liabilities.

European Commission - Study on the drivers of investments in equity by insurers and pension funds
December 2019 I 160
4.3.6 Tax framework
As retrieved from the literature review, the features and provisions of the taxation regime per country can have an impact on the asset allocation of insurance companies. For example, Brentani (2004) advocates for returns made by insurers on any type of investments to be considered net of taxation effects.
Taxation policies are a competency of Member States, which is reflected in the substantial variation in the treatment of capital gains, losses and dividends across the EU. The mapping exercise of EU Member States according to the 13 different defined categories of taxation related to capital gains, losses and dividends shows a scattered landscape, also taking into account the level of equity investments (see Figure 40). The country overview is available in Annex 6. The specific taxation rules and exemption conditions related to gains, losses and dividends across EU Member States have made it difficult to undertake a complete comparative analysis.
Figure 40 – Equity exposures by taxation category of capital gains/losses and dividends on equity investments
Category Capital gains Capital losses Dividends
1 Exempt under certain conditions Deductible Exempt
2 Exempt under certain conditions Deductible Exempt under certain conditions
3 Exempt under certain conditions Deductible under certain conditions Exempt
4 Exempt under certain conditions Deductible under certain conditions Exempt under certain conditions
5 Exempt under certain conditions Deductible under certain conditions Not exempt
6 Exempt under certain conditions Not Deductible Exempt
7 Exempt under certain conditions Not Deductible Exempt under certain conditions
8 Not exempt Deductible Exempt
9 Not exempt Deductible Not exempt
10 Not exempt Deductible under certain conditions Exempt
11 Not exempt Deductible under certain conditions Exempt under certain conditions
12 Not exempt Deductible under certain conditions Not exempt
13 Not exempt Not Deductible Not exempt
Note that 2016 corporate tax rates are included per country in the figure.
Source: Deloitte-CEPS analysis
HU ; 19%
LU ; 27%
ES ; 30%
CY ; 13%
SE ; 22%
IT ; 24%
AT ; 25%
MT ; 35%
NL ; 25%
LV ; 15%
BE ; 34%
BG ; 10%
PL ; 19%
FI ; 20%
HR ; 20%
EE ; 25%
SI ; 19%
IE ; 13%
SK ; 22%
LT ; 15%
RO ; 16%
DK ; 22%
GR ; 29%
PT ; 30%
DE ; 30%
FR ; 34%
GB ; 20%
CZ ; 19%
0,0%
5,0%
10,0%
15,0%
20,0%
25,0%
30,0%
35,0%
40,0%
0 1 2 3 4 5 6 7 8 9 10 11 12 13
Equity e
xposure
(excl. u
nit-lin
ked investm
ents
)
Category

European Commission - Study on the drivers of investments in equity by insurers and pension funds
December 2019 I 161
In order to analyse the tax framework as a potential driver, the data was first analysed as part of the panel regression results. This analysis was further complemented with information from the interviews. Finally, the tax exemption impact on the Solvency ratio and internal rate of return was captured through the theoretical model.
The analysis based on ECB data for the period between 1998 and 2017 results in a robust positive relationship, though not significant, between taxation on capital134 as a share of GDP, and both listed equity and total equity. However, this result seems to contradict the findings of a recent study published by Jakubic, P. and E. Turturescu (2018), which found a negative relationship between tax on capital as share of GDP and share of assets invested in direct equity. This relation was not significant for a panel of 40 life and non-life insurers traded on stock exchange markets at group level, and highly significant for a sample of 1.683 insurers at individual level. This difference compared to the EIOPA study is explained by the use of individual undertakings data in order to better represent local market characteristics.
The model specifications with the variables for the unlisted equity category did not deliver robust results.
As also indicated by Jakubic, P. and E. Turturescu (2018), tax-to-GDP does not provide
any information on whether insurance companies are actually exempted from capital gains taxes or not, whether capital losses are deductible or not, and whether dividend income is tax exempted or not. Looking at the current situation, there is a large variety of tax treatment across EU Member States in terms of taxation of capital gains and losses, and dividend income.
In general, our model suggests that exemptions for capital gains, capital losses and dividends are associated with higher investments in equity. The impact of the exemptions is tested by including dummy variables as well as base model variables.135
Tax treatment of realised gains and losses
The regression results, based on ECB data for the period between 1998 and 2017, are consistently positive across equity types for capital loss exemption, but as they cannot be tested across models, they are considered neither robust, nor significant. For capital gains, the regression results are positive for listed and total equity, but negative for unlisted equity. As these can also not be tested across different models for each equity type, they are not considered robust or significant. This means that insurance companies in countries with a capital loss exemption have, on average, higher investments in equity than countries without such an exemption. Similarly, capital gains exemptions contribute to higher equity exposures, with the exception of the amounts invested in the unlisted equity (dependent variable).
The tax exemption impact on a hypothetical insurer’s internal rate of return (IRR) and on the Solvency ratio is analysed through a theoretical model, under the following assumptions: a corporate tax rate of 25% and applying or not applying a tax exemption on the fair value changes related to equity investments (see Figure 41). It is important
134 Capital taxes consist of taxes levied at irregular and very infrequent intervals on the values of the assets or net worth owned by institutional units or on the values of assets transferred between institutional units as a result of legacies, gifts
between persons or other transfers. 135 Note that since these dummy variables are country-specific and do not vary over time, a Random-Effects model is used instead of the Fixed-Effects model that is used for the rest of the model specifications (see section 3.10).
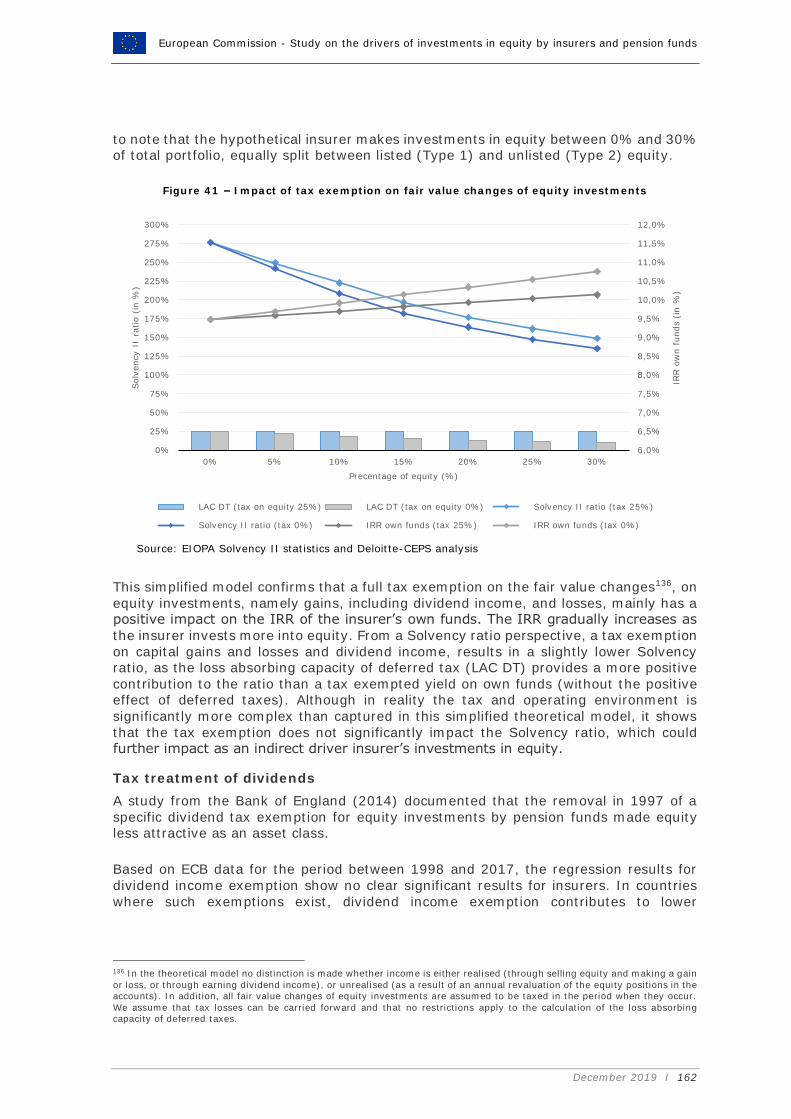
European Commission - Study on the drivers of investments in equity by insurers and pension funds
December 2019 I 162
to note that the hypothetical insurer makes investments in equity between 0% and 30% of total portfolio, equally split between listed (Type 1) and unlisted (Type 2) equity.
Figure 41 – Impact of tax exemption on fair value changes of equity investments
Source: EIOPA Solvency II statistics and Deloitte-CEPS analysis
This simplified model confirms that a full tax exemption on the fair value changes136, on
equity investments, namely gains, including dividend income, and losses, mainly has a positive impact on the IRR of the insurer’s own funds. The IRR gradually increases as the insurer invests more into equity. From a Solvency ratio perspective, a tax exemption on capital gains and losses and dividend income, results in a slightly lower Solvency ratio, as the loss absorbing capacity of deferred tax (LAC DT) provides a more positive contribution to the ratio than a tax exempted yield on own funds (without the positive effect of deferred taxes). Although in reality the tax and operating environment is
significantly more complex than captured in this simplified theoretical model, it shows that the tax exemption does not significantly impact the Solvency ratio, which could further impact as an indirect driver insurer’s investments in equity.
Tax treatment of dividends
A study from the Bank of England (2014) documented that the removal in 1997 of a specific dividend tax exemption for equity investments by pension funds made equity less attractive as an asset class.
Based on ECB data for the period between 1998 and 2017, the regression results for dividend income exemption show no clear significant results for insurers. In countries where such exemptions exist, dividend income exemption contributes to lower
136 In the theoretical model no distinction is made whether income is either realised (through selling equity and making a gain
or loss, or through earning dividend income), or unrealised (as a result of an annual revaluation of the equity positions in the accounts). In addition, all fair value changes of equity investments are assumed to be taxed in the period when they occur.
We assume that tax losses can be carried forward and that no restrictions apply to the calculation of the loss absorbing capacity of deferred taxes.
6,0%
6,5%
7,0%
7,5%
8,0%
8,5%
9,0%
9,5%
10,0%
10,5%
11,0%
11,5%
12,0%
0%
25%
50%
75%
100%
125%
150%
175%
200%
225%
250%
275%
300%
0% 5% 10% 15% 20% 25% 30%
IRR o
wn f
unds (
in %
)
Solv
ency I
I ra
tio (
in %
)
Precentage of equity (%)
LAC DT (tax on equity 25%) LAC DT (tax on equity 0%) Solvency II ratio (tax 25%)
Solvency II ratio (tax 0%) IRR own funds (tax 25%) IRR own funds (tax 0%)

European Commission - Study on the drivers of investments in equity by insurers and pension funds
December 2019 I 163
exposures to listed equity (which seems counterintuitive), but to higher exposures for the unlisted equity investment category.
The analysis across the EU Member States shows that the full tax exemption of dividend
income is currently only applicable in a limited number of countries (Bulgaria, Cyprus, Hungary, Latvia and Slovenia). In all other Member States, there is either no exemption (incl. the United Kingdom, France and Germany), or certain conditions apply (Belgium, Ireland and Italy).
Special tax exemptions
The general outcome of the interviews is that taxation is not considered one of the most important drivers in the strategic asset allocation in equity of insurers. The majority of insurers indicate that the current tax regime is neutral or favourable towards equity investments, but not as stand-alone factor, often describing their behaviour as ‘takers’ of the applicable tax regime. When tax exemptions of capital gains and dividends are applicable, most insurers consider them as a supporting, but not a decisive item, for strategic asset allocation purposes. When fiscal exemptions are applied, the tax treatment of dividends is ranked the highest, closely followed by tax treatment of realised gains and losses, and special country-specific tax exemptions (if any). When it comes to the trade-off between dividends and capital gains, one insurer argued that for any given company invested in, two-thirds of equity returns are generated by dividend income, and only one-third by capital gains on the equity investment.
Most interviewees acknowledged that for the purpose of their tactical allocation, the tax regime is factored into their risk-return optimisation analyses for potential equity investments. These interviewees mentioned that a beneficial tax treatment of equities remains central to obtaining an attractive risk-return that would balance the capital charges under Solvency II. They pointed out that if the beneficial equity tax treatment
is removed in a jurisdiction, it renders the equity investment less attractive. For example, one insurer stated that a less favourable or punitive tax regime might dissuade certain insurers from investing in equity.
However, for the insurers investing cross-border, country-specific tax exemptions are as important as the other exemptions detailed above, especially for investments outside the EEA. The absence of double taxation avoidance agreement in place between the
countries of the investor and the investee hinders investments. One insurer highlighted that the favourable tax treatment within his country tilted the balance in favour of their private equity investments.
With respect to intragroup transactions, a large insurer referred to a waiver on long-term held equity granted by the tax regime to dividends paid from affiliated companies.
Others have also referred to instances where the group decides to extract a dividend from one of the local subsidiaries or not, in an attempt to optimise taxes.
Within the EU, tax treatment and withholding tax procedures were flagged as a potential blocking factor for equity investments. Many interviewees mentioned that the administrative burden to recuperate the prepaid tax amount is putting a strain on investments in equity in certain countries. As the diligence and effectiveness of this
process vary significantly across Europe, this is considered a major impediment to invest in equity in certain jurisdictions, which in turn hinders geographical/regional diversification. To illustrate, one insurance company indicated that there are no or very limited incentives to invest in certain EU Member States in cases where the tax withholding procedures for investing in the targeted country are very lengthy and costly.

European Commission - Study on the drivers of investments in equity by insurers and pension funds
December 2019 I 164
This particular interviewee referred to a refund procedure of 18 months on average in certain countries where the process is currently not yet automated. A third-country insurer mentioned that the ‘tax leakage’ is less than 10% due to their optimisation/deference techniques while a large European insurer emphasised the use of local custodians when investing in equity funds as a way to avoid double taxation.
Finally, two composite insurers explicitly referred to existing special tax treatments
for strategic investments and long-term holdings as being an additional incentive to make investments in certain types of equity.
Linking to the undertaking characteristics across the sample of insurers, composite insurers attribute on average a slightly higher importance to the existence of tax exemptions than life insurers. This is in line with the observation that non-life and composite insurers are more invested in equity than their life counterparts, which can in turn be linked to their inherent characteristics (see section 4.3.4). This same observation was also valid for the importance attributed by these insurers to the impact of the applicable accounting framework.
Conclusions
In Europe, the taxation regime affecting insurers remains a national competency (as
opposed to the IFRS accounting framework) and consequently, is very difficult to test with regard to the role it plays in the equity consideration of insurers.
The regressions applied to the tax on capital to GDP ratio suggest that insurers take into account the tax on capital in the equity investments decisions. However, due to the lack of data on the tax treatment of realised gains and losses on the sale of equity investments by insurers, or the tax treatment of dividends, we cannot conclude further. Moreover, as also indicated by some pieces of literature, the tax-to-GDP does not
provide any information on whether insurance companies are actually exempted from capital gains taxes or not, whether capital losses are deductible or not, and whether dividend income is tax exempted or not.
There is not much literature focusing on the role of the tax framework as a primary
factor of equity investments. The literature focuses mainly on the difference between insurers and pension funds. In general, pension funds are exempt from both income and capital gains tax, and contributions to a pension scheme are not taxable whereas insurers are subject to both capital gains tax and income tax. As a result, life insurance portfolio managers will adjust their investment strategies accordingly to minimise the tax paid. This is perhaps the spirit of what the interviewees convey when they emphasise that the tax framework does not have a meaningful role in their strategic asset allocation but will affect their tactical one.
Notwithstanding the above, regression analyses may give an indication that the existence of specific capital losses and capital gains exemptions on equity investments could be associated with higher investments in this asset class. However, as the regression results could not be tested across different models, the results were not considered robust or significant.
Finally, another interesting result from the application of our theoretical model is that
the impact of tax application on the solvency ratio is quite limited, because of the existence of the loss-absorbing capacity of deferred taxes.

European Commission - Study on the drivers of investments in equity by insurers and pension funds
December 2019 I 165
5 Drivers of equity investments for pension funds
In this chapter, we first provide an overview of the state of play within the EU pension funds market, with a focus on the investments made by these institutional investors in equity. Next, the observed trends within the market are discussed. A distinction is made between defined benefits and defined contribution pension plans, because of their distinct product characteristics. The remaining part of this chapter focuses on the analysis of the key drivers of equity investments by EU pension funds.
5.1 State of play
Occupational pension funds operating in the EU are regulated by Directive 2003/41/EC,
also known as the IORP directive. The directive is designed to provide an internal EU market for occupational pension funds, and stipulates among others the minimum standards with respect to the funding requirements of pension schemes and the types of investments that are allowed. Furthermore, the directive also permits cross-border management of pension schemes, referred to as pan-European pension funds.
The IORP I directive, and expanded by the IORP II directive, seek to balance the interests of various stakeholders, primarily between beneficiaries (both current and future pensioners) and sponsors (mostly individual corporate entities).
Occupational pension funds or IORPs concern financial institutions that manage collective retirement schemes for employers to provide future benefits to their employees. In most EU Member States, IORPs concern the second pillar of the pension system, or work-related pension scheme support. The first pension pillar is provided for by the state, whereas the third pension pillar are the pension savings organised by private persons on an individual level.
The main types of retirement funds are defined benefit and defined contribution. defined benefit (DB) funds are those where the benefits payable to a member are given by a predefined formula, typically involving the member’s salary and service with the company.137 These benefits are typically funded, meaning a separate portfolio of assets is built up by the fund in order to pay these benefits when they fall due. Importantly, the benefits payable to members are independent of the performance of the assets, meaning the sponsoring entity has significant investment risk in the event the assets do not produce sufficient returns to pay the benefits in full. In contrast, a defined contribution (DC) fund is one whereby employer and employee contribute to a pot of assets (typically in the form of a fixed percentage of salary per month), which is invested. When the member reaches retirement age they are entitled to the accumulated value of these investments. As the benefits payable are equal to the value
of the investments, there is no funding risk for the sponsoring entity under a pure DC plan.
137 For example a typical DB fund in the United Kingdom may pay a lifetime pension, payable from age 65 equal to 1/60 * member’s salary * member’s service with the company in years.

European Commission - Study on the drivers of investments in equity by insurers and pension funds
December 2019 I 166
5.1.1 Total investments
The total investments of the occupational pension funds market in the EU138 amount to 3.409 billion EUR at year-end 2017. The occupational pension fund market is dominated by the United Kingdom and the Netherlands. When combined, these countries cover 2.900 billion EUR in total investments, or 85,1% of the total EU market. The ratio of investments to GDP (as a measure for the market development) in the EU amounts to 22% at year-end 2017, with substantial differences across EU Member States. The measure for market development ranges from less than 1% for a number
of countries mainly in Eastern Europe (e.g. 0,001% in Hungary), to 67% in the United Kingdom and 182% in the Netherlands.
Figure 42 – Total investments of EU pension fund market at year-end 2017
Source: EIOPA statistics and Deloitte-CEPS analysis
The prominence of the United Kingdom and the Netherlands stems from historical and legal elements. In the United Kingdom, the Pensions Act of 2008 introduced the auto-enrolment principle, which made it mandatory for all employers to enrol new employees into a pension scheme, and for the employer and employee to both make a mandatory minimum contribution. In the Netherlands, the so-called second pension pillar is one of the most-developed occupational pension systems in the EU and is available for almost all employees. Data for the Netherlands show that approximately 90% of employers in the Netherlands offer occupational pension schemes to their employees.139 Furthermore, some pension schemes are mandatory, such as the Dutch ABP pension fund for the government and education sector.
Other large European countries have less of a history in work-related pension schemes.
For instance in Germany, in the past, individuals mainly relied on state pensions (the first pension pillar). In France, many companies set up Company Saving Plans as a tax-efficient savings product for their employees, as an alternative to offering employer-financed occupational pension plans to their employees. In Spain, the pension system is also governed by a three-pillar system. However, the market is still dominated by the
138 Note that data for five countries (Cyprus, Czech Republic, Estonia, France and Lithuania) are not available within the EIOPA
dataset. Analysis of OECD data for occupational pension funds in 2017 allows to confirm that the pension sectors in these countries combined, are <1%. 139 In the Netherlands, there is no legal obligation to enrol in a pension fund. However, if the social partners decide to provide a pension scheme for these employees, the Dutch government can make a pension scheme mandatory for an entire sector
or profession. Source: http://www.pensiondevelopment.org/documenten/The%20Dutch%20Pension%20System.pdf?mod=article_inline
GB
45,6%
NL
39,5%
DE
6,6%
IT
2,9%
IE
1,5%
Other
3,9%

European Commission - Study on the drivers of investments in equity by insurers and pension funds
December 2019 I 167
first pillar (a state pension). The occupational pension plans are not very developed, as the first pillar provides sufficient security for most of the working population.
At the end of 2017, the total defined benefit (DB) pension fund market represents
86% of the EU occupational pension fund market. The pension markets for nine Member States are almost exclusively characterised by DB schemes (more than 80% of the market), which is the case in Belgium, Denmark, Germany, Finland, the Netherlands, Portugal, Sweden, Slovenia and the United Kingdom. The total investments of these countries cover 3.147 billion EUR or 92,3% of the total EU pension market. While the Irish and Luxembourgish markets have a mix of both schemes, the remaining twelve countries140 mainly offer defined contribution schemes.
Figure 43 – Composition of the pension fund market across EU Member States at year-end 2017
The breakdown between DB, DC and hybrid schemes is not available for Austria. Data for Cyprus, Czech
Republic, Estonia, France and Lithuania do not exist in the EIOPA dataset.
EIOPA data for the United Kingdom have been enriched with the split DB (incl. hybrid) vs. DC, as provided by
the NSA.
Source: EIOPA statistics and Deloitte-CEPS analysis
According to the OECD141, pensions legislation in a number of EU Member States requires the organiser of a DC scheme to provide for protection under the form of a financial guarantee. This is the case in Czech Republic, Slovakia, Belgium, Germany, Denmark, Hungary, Poland and Slovenia.
140 Note that data for five countries (Cyprus, Czech Republic, Estonia, France and Lithuania) are not available within the EIOPA
dataset. 141 Source: https://www.oecd-ilibrary.org/finance-and-investment/the-role-of-guarantees-in-defined-contribution-pensions_5kg52k5b0v9s-en
0%
5%
10%
15%
20%
25%
30%
35%
40%
45%
50%
55%
60%
65%
70%
75%
80%
85%
90%
95%
100%
AT BE BG DE DK ES FI GB GR HR HU IE IT LU LV MT NL PL PT RO SE SI SK
Co
mp
ositio
n p
en
sio
n fu
nd
ma
rke
t (in %
)
Defined Benefit schemes (DB) Defined Contributions schemes (DC) Hybrid schemes (HY)

European Commission - Study on the drivers of investments in equity by insurers and pension funds
December 2019 I 168
5.1.2 Equity investments
The investment allocation of the countries for which the pension fund sector is almost exclusively characterised by DB pension funds is shown in Figure 44. The majority of the investments, 1.685 billion EUR or 53,6% of total investments, is allocated to debt and other fixed income securities, while 1.010 billion EUR or 32,1% is allocated to equity and other variable-yield securities (excl. UCITS). Almost all of these (direct) equity investments are done by British and Dutch DB pension funds, with 510 billion EUR and 502 billion EUR, respectively. The majority of these EU equity investments relate to
listed equity positions, with 884 billion EUR, or 87,5% of total direct equity investments. In contrast to the EU insurance market, where insurers allocate on average 3% of their total investments to listed equity, DB pension funds have a much higher (listed) equity exposure.
Figure 44 – Investments for defined benefit pension fund countries at year-end 2017
Countries almost exclusively characterised by defined benefit (DB) schemes, and included in the analysis, are
Belgium, Denmark, Germany, Finland, the Netherlands, Portugal, Sweden, Slovenia and the United Kingdom.
Source: EIOPA statistics and Deloitte-CEPS analysis
For DC pension funds, 29,5% of their total investments is allocated to equity, of which
91,0% relates to listed equity positions, and other variable-yield securities (excl. UCITS), compared to 32,1% for DB pension funds. A similar share of the investments is allocated to UCITS, with 3,6% compared to 4,5% for DB pension funds.
For most of the EU Member States the allocation percentage towards equity within UCITS is very low. We observe percentages above 5% only for Belgium, Croatia, Germany, Italy, Luxembourg, Latvia and Portugal.
The remainder of this section shows the results of the analysis of the lists of listed equity investments of nine Dutch and British defined benefit pension funds. The analysis focuses on defined benefit pension funds in the Netherlands and the United Kingdom, because they represent most of the EU market with more than 80% of the total investments. The nine large pension funds included in the sample represent between 30 and 40% of the EU defined benefit pension fund investments.
Looking at the six Dutch DB pension funds that represent about 83% of the equity investments of the pension funds in the sample, they all allocate between 25% and 35% of their total investments (market value) to listed equity. They invest in between 2.000
Debt and other fixed
income securities
53,6%
Equity and other
variable-yield securities
(excl. UCITS)
32,1%
UCITS
4,5%
Loans
1,3%
Real estate
investments
6,2%
Other investments
2,4%

European Commission - Study on the drivers of investments in equity by insurers and pension funds
December 2019 I 169
and 4.000 listed companies each. This amounts to nearly 250 billion EUR, in both direct and indirect investments in listed equity.
The three British DB pension funds invest in substantially fewer listed companies. The
list of equities invested in by these DB pension funds comprises between 300 and 1.300 companies. In fact, a large share of their investments is allocated to various equity funds and real investment trusts, which are not included on a look-through basis. The equity investments accounted 22 billion EUR in direct investments in listed equity.
In total the nine DB pension funds invest in 5.400 listed companies. However, as shown in Figure 45 below, the large majority is invested in less than 10% of the listed companies. In fact, 10% or 540 listed companies constitute about 67% of the total investments by DB pension funds in listed equity. In turn, 10% of the total investments are allocated to 72% or 3.908 of the listed companies.
Figure 45 – Concentration of listed equity investments (in % of total listed equity investments)
Source: Pension funds equity lists and Deloitte-CEPS analysis
Most of the investments in equities are in equity of large-caps (87,5%). This is
understandable as large-caps are also responsible for the largest share in total market
capitalisation. However, a significant minority of about 10,8% of total listed equity is
allocated in mid-caps. The share of investments in mid-caps is consistent across pension
funds. The share of listed equity investments allocated to mid-caps ranges between 5%
and 14%. The share of equity allocated to micro-caps ranges between 0% and 0,14%
for pension funds in the Netherlands and between 0% and 2,4% for pension funds in
the United Kingdom. In general, the British pension funds have a larger share of their
equity investments allocated to micro-caps and/or SMEs than the pension funds in the
Netherlands.
0,0%
10,0%
20,0%
30,0%
40,0%
50,0%
60,0%
70,0%
80,0%
90,0%
100,0%
0%
5%
10%
15%
20%
25%
30%
35%
40%
45%
50%
55%
60%
65%
70%
75%
80%
85%
90%
95%
100%
Concentr
ation o
f liste
d e
quity investm
ents
Share in equity investments Equal allocation to all shares
10%
67%

European Commission - Study on the drivers of investments in equity by insurers and pension funds
December 2019 I 170
Figure 46 – Listed equity investments by size (% of total listed equity investments)
Source: Defined benefit pension funds equity overviews and Deloitte-CEPS analysis
The DB pension funds in the Netherlands and the United Kingdom have quite diversified portfolios based on the sectoral distribution. The manufacturing sector and financials and insurance are the largest sectors in terms of allocation, with 35,1% and 23,6% of the invested equity respectively. This means that a substantial share is invested in other financial intermediaries and not necessarily reaching the end-users of the capital. Smaller shares of investment are allocated to the energy sector (9,4%), health care sector (8,5%), and information and communication sector (5,5%).
Figure 47 – Listed equity investments by sector142 (% of total listed equity investments)
Source: Pension funds equity overviews and Deloitte-CEPS analysis
142 Only sectors with more than 1% of total investment value are represented.
Large caps 87,5%
Mid caps 10,8%
Small caps 1,5% Micro caps 0,2%
Manufacturing 35,1%
Financials and insurance
23,6%
Energy 9,4%
Health Care 8,5%
Other Services 8,3%
Information and
Communication 5,5%
Mining and Quarrying 2,0%
Real Estate 1,7%
Research and Consulting 1,3%Wholesale and Retail Trade 1,0%
Transportation 1,2%
Other 2,4%

European Commission - Study on the drivers of investments in equity by insurers and pension funds
December 2019 I 171
Most of the investments in equities are non-substantial investments (up to maximum
5% of the shares of the listed company), which is understandable since the pension
funds aim to have a diversified investment portfolio. Nevertheless, the pension funds
have some minority, partner and linked or majority stakes in several listed companies.
The figures show that in particular very large pension funds are holding more minority
interests. The limited number of substantial holdings suggest that the pension funds in
general can be considered as passive investors in most stocks.
Figure 48 – Listed equity investments by stakes (% of total listed equity investments)
Source: Pension funds equity overviews and Deloitte-CEPS analysis
The Dutch DB pension funds are investing most in listed companies incorporated in
Northern America, accounting for 47,7% of the total market value of the investments
in listed equity. Europe (23,6%) and Asia (21,3%) are responsible for most of the
remaining equity investments. Taking a closer look at the listed equity investments in
the European Union (14%), we see that only about 1,4% of the equity investments are
invested in companies incorporated domestically. The remainder of the Euro area
(9,7%) is responsible for the large majority of the equity investments in the EU.
Figure 49 – Listed equity investments by region for Dutch pension funds (% of total listed equity investments)
Source: Pension funds equity overviews and Deloitte-CEPS analysis
Non-substantial 97,0%
Minority 2,8%
Partner 0,2%Linked 0,01%
Domestic 1,4%Other Euro area 9,7%
Other European Union
2,4%
Other Europe
10,1%
Northern America 47,7%
Asia 21,3%
Latin America and the
Caribbean 3,6%
Oceania 2,7% Africa 0,9%

European Commission - Study on the drivers of investments in equity by insurers and pension funds
December 2019 I 172
The British DB pension funds are investing substantially more domestically and in the
remainder of Europe than the Dutch pension funds. The British pension funds in the
sample have almost four times more investments in the EU (54,7% of investments in
listed equity) than the Dutch pension funds (13,9%). Moreover, the domestic
investments account for a substantially larger share with a third of the listed equity
investments (36,8%). The other EU countries are representing about 15% of the listed
equity investments. Similar to the Dutch pension funds, the British pension funds have
most of their equity investments outside the EU allocated to Northern America (22,9%)
and to a lesser extent Asia (16,0%). The large difference between the British and Dutch
pension funds might be partially explained by the exclusion of the indirect investments
in listed equity, which might have a larger share of the listed equity investments
allocated internationally.
Figure 50 – Listed equity investments by region for British pension funds (% of total listed equity investments)
Source: Pension funds equity overviews and Deloitte-CEPS analysis
Domestic 36,8%
Euro area 13,1%Other European Union
2,3%
Other Europe 4,8%
Northern America 22,9%
Asia 16,0%
Latin America and the
Caribbean 1,6%
Oceania 2,2% Africa 0,4%

European Commission - Study on the drivers of investments in equity by insurers and pension funds
December 2019 I 173
5.2 Trends
In this section, we provide a view on the trends in equity investments by EU occupational pension funds. EIOPA data allows to get a view on the trends starting around 2006-2007. Whenever possible, data series have been extended with data from the national supervisors.
5.2.1 Total investments
The size of the EU pension market in terms of investments, has grown from 1.083 billion EUR in 1998 to 3.409 billion EUR in 2017, with a drop of 387 million EUR or almost 25% around the financial crisis in 2008. Over the 20-year period between 1998 and 2017, the United Kingdom and the Netherlands have clearly been the driving countries for the pension fund market in the EU, covering more than 80% of the investments between both.143
Figure 51 – Total investments pension funds across EU Member States (incl. defined contribution schemes)
For the United Kingdom, the EIOPA data from 2006 until 2017 were extended with data from the Office for National Statistics for the period between 1998 and 2005.
For the Netherlands, the EIOPA data from 2007 until 2017 were extended with data from the DNB for the
period between 1998 and 2006.
Source: EIOPA statistics and Deloitte-CEPS analysis
143 Given their prominence in the EU pension market, covering more than 80%, we focus on Dutch and British pension funds and therefore extended the available EIOPA data with national data sources to obtain a 20-year history. For the Netherlands,
data from DNB statistics are used to extend the observation period back to 1998. The total investments of Dutch pension funds increased from 330 million EUR in 1998 to 1 346 million EUR in 2017, a growth of more than 300%. Although the data contain, in contrast to the EIOPA dataset, more than solely occupational pension funds, growth percentages for both datasets
(for the period 2007-2017) are very similar. For the United Kingdom, data from the Office for National Statistics are used to extend the observation period back to 1998. The total investments of British pension funds increased from 753 million EUR
in 1998 to 1.554 million EUR in 2017, a growth of more than 100%.
Dot-com crisis Financial crisis
0
250.000
500.000
750.000
1.000.000
1.250.000
1.500.000
1.750.000
2.000.000
2.250.000
2.500.000
2.750.000
3.000.000
3.250.000
3.500.000
3.750.000
1998
1999
2000
2001
2002
2003
2004
2005
2006
2007
2008
2009
2010
2011
2012
2013
2014
2015
2016
2017
To
tal in
ve
stm
ents
(in
Mio
EU
R)
GB NL DE IT IE Other

European Commission - Study on the drivers of investments in equity by insurers and pension funds
December 2019 I 174
5.2.2 Defined benefit funds
For the DB pension funds in the EU, the total equity investments144 have increased from 757 billion EUR in 2006 to 1.116 billion EUR in 2017, with a drop of 335 billion EUR around the period of the financial crisis of 2008. The Netherlands and the United Kingdom cover more than 90% of the total equity investments over the observation period.
The EU share of equity in total investments was considerably higher (at 50%) before
the global financial crisis than it is today, while in recent years, the share remained relatively stable above 30%. The decreasing trend can be attributed to general de-risking after the financial crisis (away from equity), and the decreasing trend in the UK, away from equity investments, towards debt securities (see below).
Figure 52 – Equity exposure pension funds across EU Member States
Source: EIOPA statistics and Deloitte-CEPS analysis
In the United Kingdom, the percentage of the total investments allocated to equity gradually decreased from 65,2% in 2006 to 32,8% in 2017. Most of the equity investments are listed, covering 29,4% of the 32,8% at year-end 2017. The decrease in equity coincides with a gradual increase in debt securities from 30,2% in 2006 to
63,0% in 2017. As a possible explanation for this trend, Douglas and Roberts-Sklar (2018) refer to the possible linkages between the funding ratio of pension funds, financial stability of supporting corporates, economic conditions, and the asset allocation of the pension funds. They argue that the pension funds are trying to protect their higher funding positions by locking in their investments to debt securities.
For the Dutch pension fund market, the percentage allocated to equity has been more or less stable around the level of 35%. Similar to the United Kingdom, most of the equity investments concern listed positions.
144 Based on the EIOPA dataset for occupational pensions, the equity investments include the following categories: equity and other variable-yield securities (excl. UCITS) and UCITS of which in equity securities.
0,0%
5,0%
10,0%
15,0%
20,0%
25,0%
30,0%
35,0%
40,0%
45,0%
50,0%
55,0%
60,0%
65,0%
70,0%
75,0%
2007 2008 2009 2010 2011 2012 2013 2014 2015 2016 2017
Equity e
xposure
(in
% o
f to
tal in
vestm
ents
)
GB NL DE IT IE Other

European Commission - Study on the drivers of investments in equity by insurers and pension funds
December 2019 I 175
5.2.3 Defined contribution funds
As shown from the above analysis, the majority of EU pension funds’ investments are related to defined benefit schemes, mainly due to their historical importance in the United Kingdom and the Netherlands. However, increasing longevity, compounded to the low interest rate environment of the past decade, have made it a challenge for DB pension schemes to obtain the (high) returns in line with the guaranteed levels. As a result, several NSAs have observed a shift towards DC pension schemes, whereby the financial risks and costs are transferred from employers and IORPs towards the
employees. The IORP II Directive stipulates detailed requirements on the disclosure towards members and beneficiaries, to ensure they are adequately informed about the (increased) risks. This observation was confirmed during the sample interviews as well, where a participant explicitly stated to envision a strategy to shift more into DC schemes instead of DB.
Based on the EIOPA data, investments by DC pension schemes increased from 290 billion EUR in 2006 to 479 billion EUR in 2017, an increase of approximately 65%. Furthermore, we observe a similar decreasing trend in the percentage of investments allocated to equity, from 55,3% in 2006 to 31,0% in 2017, as for the DB funds (as shown in Figure 52).
For the United Kingdom, discussions with the Association of British Insurers indicate
that corporates are moving pensions from DB to DC models. Traditionally, occupational pension provision from employers has been on a defined benefit basis (i.e. a guaranteed benefit for employees, with all the risk exposure with the employer). These are however becoming increasingly unaffordable for corporates to run and maintain, with large deficits driven by low interest rates and increasing longevity. As a result, there has been a shift, starting about 15-20 years ago, towards offering occupational pension provision on a defined contribution basis.
According to the NSA, culturally, two factors have also encouraged this:
Auto-enrolment legislation: this makes it mandatory for all employers to enrol new employees into a pension scheme (most of which will be defined contribution) and for the employer and employee to both make a mandatory
minimum contribution. A desire by people to have flexible use of their pension wealth and not to have
it ‘locked up’ for years. Defined contributions schemes make this more easily achievable than defined benefit schemes.
The Pensions Regulator data confirms this trend, and shows that the total assets under DC schemes increased between 2006 (20,5 billion GBP) and 2017 (28,1 billion GBP), at
a rate which was higher than the growth in total pension fund assets over the same period. As a result the share of DC assets compared to the total market, increased from 2,2% to 3,0%.
In the Netherlands, occupational pension funds are still mainly DB schemes (per year-end 2017 only 0,5% of total assets is under DC schemes, according to EIOPA data).
However, the IMF states in its recent report (Gerard, 2019) that they observe an increasing popularity of defined contribution and hybrid schemes, mainly with smaller and medium-sized companies and start-ups, as the costs of the pension schemes are easily determined in a flexible framework. Nevertheless, the IMF remarks that since the majority of the pension market in the Netherlands consists of mandatory sector-wide

European Commission - Study on the drivers of investments in equity by insurers and pension funds
December 2019 I 176
plans, a real shift from DB towards DC will only be possible if those funds make the change towards DC schemes as well.
With the introduction of the IORP Directive (2003/41/EC) which came into force on 23
September 2003 and was to be transposed in national laws by 22 September 2005, the cross-border activities of IORPs have also increased. In the current years, the trend seems to have stabilised however, as reported in the 2018 EIOPA report on the topic.145
5.2.4 Conclusions
Over the period between 1998 and 2017 the total investments of the EU pension fund market have almost tripled, with the Netherlands and the United Kingdom as the driving countries covering more than 80% of total investments and equity investments by defined benefit pension funds (90%).
Regarding the investments of defined benefit pension funds in equity, Dutch and British IORPs cover more than 97,5%. The EU share of equity in total investments was considerably higher (at 50%) before the global financial crisis than it is today, while in recent years, the share remained relatively stable above 30%. The decreasing trend can be attributed to general derisking after the financial crisis, and the decreasing trend in the UK.
In the United Kingdom, investments in equity as a share of total investments have been decreasing from 65,2% to 32,8% in recent years, shifting the asset allocation more towards debt securities. Contrary to the situation on the EU insurance market, the majority of these equity investments (29,4% out of 32,8%), concern listed positions. In the Netherlands, equity investments have been relatively stable around 35%, and, similar to the United Kingdom, concerns mostly listed equity.
The historical importance of the Netherlands and the United Kingdom within the EU
pension fund market leads to the dominance of DB schemes. However, with increasing longevity and the current low interest rate environment, DB pension schemes are struggling to achieve the required returns in line with the guaranteed levels. As a result, analyses indicate an increasing popularity in recent years towards offering occupational
pensions on a defined contribution basis, a trend which is confirmed for the UK market where the share of DC assets in the total pension fund market increased from 2,2% (2006) to 3% (2017). Across all Member States however EIOPA data indicates a slight decrease over the same period (from 14,9% to 14,0%).
145 EIOPA (2018a) Market development report on occupational pensions and cross-border IORPs (Jan 2018).

European Commission - Study on the drivers of investments in equity by insurers and pension funds
December 2019 I 177
5.3 Drivers
This section provides an analysis of drivers of equity investments of DB pension funds, first with a macro panel data regression and then focusing on pension fund specific data for the Dutch DB pension funds. The first part of the analysis is carried out in a similar way as for the analysis for the insurance companies. The second part (pension fund specific analysis) tests some of the hypotheses that have recently been developed for the British DB pension funds market (Douglas and Roberts-Sklar, 2018), using the data for the Netherlands.
The six drivers are the same ones as investigated in the context of insurance companies in the previous chapter.
5.3.1 Market conditions
In light of the funding risks faced by DB funds, most funds define a strategic asset allocation (SAA) in order to maximise the likelihood of meeting their funding requirements, within an acceptable level of risk. They are also encouraged in that by national supervisors. To do this, funds typically conduct an Asset Liability Management (ALM) study, which looks to set an asset allocation tailored to the specific liabilities of the fund.
Literature suggests that market conditions are one of the drivers of equity investments by pension funds.
Overall, the regression results suggest some relations exist between variables, but none of these, however, are statistically significant and robust. We assume that this may be due to the limited number of observations.
During the interviews, several DB pension fund representatives confirmed that market conditions (market returns, volatility etc.) play an important role when determining the overall SAA, i.e. the allocation towards equity investments, bonds, real estate etc. in their portfolios.
The representatives of the pension funds note that the SAA exercise is built on ALM studies. The result of these exercises then leads to a recommended equity allocation, and managers adjust the amount of equity investments to be aligned with this investment strategy. Therefore, as one of the pension funds indicates in the interview, the ratios of the equity investments sometimes reflect the fluctuations in the stock markets, because of the revaluation effect.
One pension fund notes that market volatility and market returns are the main drivers for market conditions. To determine the investment strategy and strategic asset allocation, several economic scenarios are simulated. The (historical) market return and market volatility are used in these simulations to determine the discount rate, and as such have a direct impact on the outcome.
Another pension fund notes that the equity levels have been relatively stable over time and that post-crises the equity percentages reverted to the previous pre-crisis levels; and hence that market events like the financial crisis did not significantly influence the pension funds asset allocation. Yet another pension fund also refers to the stability of the equity percentages and attributes the declines in equity percentages not to the sales of equities, but rather to the general decline in the market value during the crisis years.

European Commission - Study on the drivers of investments in equity by insurers and pension funds
December 2019 I 178
Several pension funds also remark that they assess the market from time to time, but rarely deviate from the mandate and the existing asset allocation, as these are part of a long-term passive investment strategy.
Market conditions do not appear to be the main driver of the equity investment decisions for the DB pension funds however.
5.3.2 Asset and liability management
Literature suggests that an effective asset and liability management is one of the main drivers of equity investments by pension funds. This finding however could not be confirmed by regression results due to a lack of publicly available historical information on the related factors.
During the interviews, most pension funds remark that for the strategic asset allocation they base themselves on an ALM study, which usually takes place at regular intervals, but can also be performed on request or when material changes take place within the pension fund portfolio. A more mature scheme, with more pensioners than active members, will have a lower risk appetite and vice versa. This will then drive the weights allocated to the different asset classes in the portfolio. Several pension funds observe that the outflow profiles of the liabilities are of high importance for the percentage of
equity and the asset allocation as a whole, as the outflow profiles feed the ALM study. As one pan-European pension fund indicates, the strategic weights of equity can vary heavily from one portfolio to another, based on the risk profile of the member in DC pension funds or the maturity of the liabilities in DB pension funds, the duration of the portfolio and the risk appetite of the sponsoring entity.
In the case of a pan-European pension fund, it was observed by the pension funds that
each country scheme will usually have an individual investment strategy based on the scheme profile, sponsor’s risk appetite and other relevant factors. One pension fund explicitly notes that clients can choose from different investments strategies or asset allocations in line with different risk appetites.
Several pension funds observed that the portfolio was divided in two subportfolios: a
netting portfolio, aimed at meeting the obligations to the participants and often with the aim to match assets and liabilities as closely as possible, and a growth or return portfolio to increase the return. Equity forms the main asset class in the return portfolio for these pension funds.
Several pension funds also mention that they aim to diversify not only based on asset classes, but also within asset classes. Within the equity asset class, for example, a geographical or sectorial diversification is observed. One pension fund observes a significant home bias, meaning that they invest in EMU countries to avoid currency rate volatility. However, they also have non-EU investments, specifically chosen, and emerging markets for growth purposes; but the latter also introduces increased volatility in the portfolio. The combination of the different geographies results in a well-diversified portfolio, according to the interviewee.

European Commission - Study on the drivers of investments in equity by insurers and pension funds
December 2019 I 179
5.3.3 Prudential framework
In order to control and assess the funding risks of defined benefit plans, various funding measures have been developed to monitor the current level of assets against the benefits promised in the future. Central to this monitoring is the concept of a discount rate, which converts the value of pensions to be paid in the future to a current monetary value. The ratio of the value of the assets and the current value of retirement benefits is known as the funding or coverage ratio. If this funding ratio is above 100%, then the benefits are said to be fully funded. If this ratio is below 100% there is a deficit,
which may need to be recovered over a certain period of time (for example by increasing the company contributions).
There are a number of different funding measures used to assess the solvency of occupational pension funds. Under the IFRS accounting standard, best estimate assumptions should be used, meaning the actual cost of paying the benefits is assessed to be equally likely to be above or below the calculated value under this measure. In the United Kingdom for example, the national supervisor requires a prudent ‘funding’ measure to be calculated. This prudent measure means that the actual cost is likely to be lower than the calculated value under this measure, meaning there is a buffer. In the event of a deficit under this measure, the British supervisor requires the sponsor to set up a recovery plan to reverse this deficit.
In this context, the literature review (Gorter and Bikker, 2011) highlighted a key difference between the insurance and the pension fund sectors, namely that while the former are facing financial distress costs, the latter are technically immune to default. The authors explain that pension funds are trusts, and when assets should fall below liabilities, a fund does not go bankrupt, employees are not laid off and non-marketable assets are not lost. The authors argue that insurers are more likely to lose policyholders when solvency capital runs low, and find empirical evidence that insurers
indeed face financial distress costs. As a result, insurers take less investment risk than pension funds, and are more responsive to changes in their buffer capacity. Using a sample of 12.866 institution-year observations on Dutch pension funds and insurance firms over the period 1995-2009, the authors confirm that the relationship between capital and risk taking is significantly more pronounced for insurance companies than for pension funds. Hence, insurance companies choose their asset allocation in a more risk sensitive manner than pension funds.
For the analysis of the prudential framework, data for average coverage ratios of the pension funds are included in our regression models. The average coverage ratio of the pension funds are calculated as the ratio of the net assets covering the technical provisions to the technical provisions. The regression results suggest a positive relationship between high coverage ratios and high investments in listed equity, which could imply that as the ability of the pension funds to cover their liabilities increases, so does their willingness to invest in listed equity. Although this result is consistent for all dependent variables of listed equity, and with that of the solvency ratios for insurers, it lacks statistical significance. This is also in line with the observation of Gorter and Bikker (2011) that the relationship is more pronounced for insurance companies.
In a recent study, Douglas and Roberts-Sklar (2018) develop a model that relates the
investment behaviour of British DB pension funds and the financial strength of the sponsoring corporates. According to the implications of the model, when there is a deterioration in the funding ratios of pension funds that are supported by financially weak corporates, these pension funds will ‘switch some equity holding into bonds’. On the other hand, for the pension funds supported by relatively stronger corporates, a

European Commission - Study on the drivers of investments in equity by insurers and pension funds
December 2019 I 180
deterioration in the funding ratio will lead to more equity holdings. Finally, this study suggests that once the funding ratio increases to 100% or above, both types of pension funds will try to ‘lock’ their improved funding ratios by ‘increasing their bond holdings to better hedge against movements in the values of their pension liabilities’.
Another implication of the Douglas and Roberts-Sklar (2018) model is on the distance of the funding ratios of the pension funds to the full funding ratio of 100%. The authors argue that pension funds will switch from equities towards bonds after a shock in the economy that would cause their funding ratios to increase above 100%.
In this part of our report these same hypotheses are tested using the individual Dutch pension fund data from DNB, which is explained in Section 3.7. The model of Douglas and Roberts-Sklar (2018) has different implications based on the financial strength of the sponsoring corporates.
As the first step of our analysis, the Dutch pension funds are divided into two groups, we using the yearly corporate funding ratio as a proxy for the financial strength of the corporates, with the assumption that the stronger a corporate is financially, the better it will support the pension fund. Pension funds that have more or equal to 100% corporate funding are grouped as the ones that have stronger corporate support, while the remaining pension funds are grouped as the ones that have relatively weaker corporate support. It has to be noted that in the yearly dataset, the corporate funding is available only for the years 2016 and 2017, so the dataset is restricted by data availability.
In the Netherlands, pension funds have to satisfy a minimum required funding ratio. Such a requirement might change the focus of Dutch pension funds from full funding ratio to the required funding ratio. Therefore, in addition to the full funding ratio
discussed in Douglas and Roberts-Sklar (2018), we also consider the relation of equity investments and the required funding ratio. To this end, in the second step of the analysis, we define distances between the funding ratio of a pension fund and (1) the full funding ratio146 and (2) the required funding ratio.
In the final step of the analysis, we run simple OLS147 regressions with equity
investments as a ratio of total investments as the dependent variable and the distance variables as independent variables.148 For each defined distance variable and for each corporate support group, we run a different regression. Detailed regression results are reported in Annex 2.
The regression results for the Dutch pension funds suggest that, for the distance with regard to the full funding ratio, we can expect (i) the pension funds that are
supported by stronger corporates to decrease their equity investments if above the full funding ratio, and to increase the investments when they are below the ratio; and (ii) we can expect symmetrical behaviour from the pension funds with relatively weaker corporate support. For the distance with regard to the required funding ratio, we
146 Another funding ratio limit that is introduced by the Dutch prudential framework is 110%. We defined another distance using this variable. The results are similar to the ones gathered from the distance defined by 100% of full funding ratio. 147 The F-tests in the Fixed-Effects regressions reject the null hypothesis of the joint significance of the fixed effects variables, so a simple OLS regression is implemented.
148 As a robustness check for the possibility of endogeneity in the models, we run robustness checks with a two-stage least
squares models and a generalised method of moments (GMM) model. Results obtained from these models confirm the results obtained from the OLS regressions.

European Commission - Study on the drivers of investments in equity by insurers and pension funds
December 2019 I 181
can expect (iii) the pension funds that are supported by stronger corporates to increase their equity investments once they are above the required funding ratio, and to decrease the investments when they are below the ratio; and (iv) we can expect symmetrical behaviour from the pension funds with relatively weaker corporate support.
The results, except (ii), are robust to the inclusion of macroeconomic variables149, but only results (i) and (iv) are also statistically significant. It has to be noted however that the explanatory power of the models is low, so the regression results should be treated with caution.
The results are illustrated in Figure 53 and Figure 54, respectively for strong and weaker corporate support from the models that consider the funding ratio variables only. The dashed lines represent the results that are not statistically significant, namely results (ii) and (iii).
Figure 53 – Graphical illustration of the relation between funding ratio and equity investments for pension funds with strong corporate support
Source: DNB and Deloitte-CEPS Analysis
149 After the addition of macroeconomic variables to the regression model, we obtain a positive sign for the variable that is defined by the 100% funding ratio and this suggests the opposite behaviour than stated in (ii).
100% Funding Ratio Required Funding Ratio
Equ
ity In
ve
stm
ents
(as %
of T
ota
l In
ve
stm
ents
)
Funding Ratio

European Commission - Study on the drivers of investments in equity by insurers and pension funds
December 2019 I 182
Figure 54 – Graphical illustration of the relation between funding ratio and equity investments for pension funds with weaker corporate support
Source: DNB and Deloitte-CEPS Analysis
In conclusion, the analysis for the Dutch pension fund market provides evidence for the argument of Douglas and Roberts-Sklar (2018) that the pension funds will decrease their equity investments if their funding ratio passes 100%. We also find evidence that after decreasing their investments until the point of the required funding ratio, they will again start increasing their equity investments once their funding ratio is beyond the required funding ratio. The regression results have to been seen within the limitations mentioned earlier however.
The interviews confirm the importance of corporate support and the prudential framework (i.e. the focus on the funding ratio). Several of the pension fund representatives emphasise the financial strength of the corporate support. Regarding the prudential framework, one pension fund representative mentions that the minimal coverage ratio imposed by the regulations significantly influences their asset allocation.
Another participant notes in this context that the market valuation of pension liabilities results in a more volatile funding ratio.
The prudential framework currently still depends on the various Member States’ local rules and requirements, and hence does not have the same impact on the various pension funds across the EU. For the Dutch pension funds, for example, there are no specific legal restrictions on their equity exposures. However, there are restrictions on
investments in single issuers and issuers, namely, the pension funds may not acquire more than 10% in a single issue or from a single issuer. For the United Kingdom on the other hand, legislation introduced in 2013 places a 100% limit on direct equity exposure. In addition, pension funds are subject to a 100% ceiling in equity investment from a single issuer.
Looking ahead, the final text of EU Directive 2016/2431 (IORP II Directive) was published in December 2016 and EU countries were required to implement the new rules into national law by 13 January 2019. The impact of this change was not yet included as part of the dataset used in this study. The directive covers a broad range of issues relating to retirement provision, including governance aspects of retirement provision (including occupational pension schemes), prudential regulation and funding
100% Funding Ratio Required Funding Ratio
Equity Investm
ents
(as %
of T
ota
l In
vestm
ents
)
Funding Ratio
European Commission - Study on the drivers of investments in equity by insurers and pension funds
December 2019 I 183
requirements, harmonisation across Member States, and provision of adequate pension coverage.
The new governance requirements include the provision of risk management functions,
internal audit function and actuarial function (where applicable). There are also increased disclosure requirements, including the need for annual report and accounts and additional information to scheme members (for example on the details of their scheme membership and current level of benefits). The new prudential requirements include the need to calculate technical provisions for pension funds under a prudent basis, meaning the entity is projected to have a high probability of meeting their obligations to current and future pensioners. Adequate protections for members are also required in the event of the sponsoring entity becoming insolvent.
One participant mentions that they expect a decrease of the equity percentages in the future, partly due to demographic changes, more mature pension funds with less opportunity to take risk, and partly to increased regulation, which is expected to restrain the investment in equity, by setting higher equity capital charges. However, other pension funds note that, whereas IORP II will have an impact after it comes into force, it remains unclear how it will affect the asset allocation and as such, they do not anticipate any changes.
5.3.4 Undertaking characteristics
In line with a number of variables put forward in the literature review, the relation between the undertaking characteristics and equity investments of DB pension funds are analysed in our regressions through the market development level of the pension markets per country and through country market concentration ratios, similarly to what we did in the analyses of the insurance markets. We use the ratio of total assets of the
pension funds to the GDP of a Member State as a proxy for the development of the pension funds market in a country. As the market concentration ratio, we use the ratio of the total assets held by the five largest pension funds in a country to the country’s total assets.
The regression results deliver a positive coefficient for the concentration ratio with all
equity types considered, and suggest that as the pension fund market within a country gets more concentrated with a number of large pension funds, we can expect to observe more equity investments. These results are consistent for the unlisted and total equity variable. The regressions for the market development variable do not return consistent nor significant results.
As observed in the section on state of play and trends, we notice consistently higher
equity investment percentages for the pension fund sector than for the insurance sector. This percentage has also been relatively stable over time for most pension funds. We also refer to earlier findings of Gorter and Bikker (2011) on the difference between insurers and pension funds, where the latter are considered to be able to take on more investment risk. One interviewee acknowledges that pension funds generally have a higher equity percentage compared to insurers, although they note that over the last ten years the difference has started to narrow, as also confirmed by Douglas and
Roberts-Sklar (2018) for the British DB pension fund market. The pension fund ascribes this difference to the fact that at this point, the prudential framework for pension funds is not yet harmonised to the same extent as that of insurance companies under Solvency II, and allows for somewhat more flexibility within a pension fund’s investment strategy. In addition, the interviewee notes that pension funds can also take more risk if they

European Commission - Study on the drivers of investments in equity by insurers and pension funds
December 2019 I 184
have a financially strong sponsor, a point also referred to earlier, as part of the undertaking characteristics.
The size of the pension fund can also have an impact on the complexity of the strategy
and the asset allocation. For example, as one pension fund observes, smaller schemes, might have a more simplified strategy with less diverse asset classes. On the other hand, another pension fund notes that their size does not influence their investment behaviour.
During the interviews several pension funds indicate that they favoured a passive investment strategy, in line with their long-term investment strategy. In this context, one pension fund mentions that they recently changed from an active investment management strategy, to model-driven and passive management, mainly for cost-efficiency reasons (i.e. to reduce transaction costs). Along the same lines, another pension fund stresses that they mainly invest in funds due to their limited size, the cost involved in active management and as well as for simplicity reasons, e.g. in the sense that they do not wish to handle dividend payments on individual equity investments. One also notes the preference for simple governance structures, as a driver for their passive investment strategy. This pension fund also prefers to invest in larger funds for cost-efficiency reasons and as they do not wish to hold a substantial share in a fund they invest in.
5.3.5 Accounting framework
As it is the case for insurers, all listed companies in Europe should apply IFRS for annual
accounts starting on or after 1 January 2005. The introduction of the accounting framework IFRS for insurance companies impacted them in the sense that the application of fair value accounting and impairment rules introduced more (market)
volatility, through equity investments, in their profit and loss accounts; an observation which was also made in the literature. In the majority of the cases pension funds still apply local GAAP for their financial reporting, including for British and Dutch pension funds. It has to be noted however that under local GAAP, fair value measurement rules may already apply in many cases for pension funds.150
In line with these observations, regressions on pension fund data suggest that the introduction of IFRS, which generalises market valuation, in 2005 coincided with a downward trend on the amounts invested by insurers in (listed) equity. This is in line with the findings in some pieces of literature that the disclosure requirements and the change in the accounting valuation method used can be seen as one of the reasons for pension funds in some EU countries to move away from equities and into bonds.
Contrary to the regression results found for insurance companies, we do not find consistent and significant results across all model specifications. Again we note that the regression results should be treated with caution. Because most of the regression dataset covers the period after 2004 and IFRS was introduced in the EU in 2005, the IFRS dummy variable might actually fail to fully capture the true impact of the change in the accounting framework.
The representatives of the pension funds note during the interviews that in general they
do not consider the applicable accounting framework as a factor when determining the pension funds asset allocation; it is rather considered a secondary concern. One pension
150 Based on Deloitte-CEPS analyses of annual reports of British/Dutch pension funds and IFRS country profiles.

European Commission - Study on the drivers of investments in equity by insurers and pension funds
December 2019 I 185
fund noted that the introduction of IFRS 9 might bring more volatility to the balance sheet, but that this is not yet a concern for them. This comment is in line with various responses collected from interviews with insurers as well.
5.3.6 Tax framework
As discussed earlier in the analysis of the applicable tax regime for insurers, the tax regime remains a national competency, with many differences across Member States.
Literature confirms that any return coming from equity investments should be considered net of any taxes. In line with the earlier analysis, the potential impact is analysed through regressions via the tax-to-GDP variable and tax exemption country dummy variables.
While we do not obtain consistent results for the tax-to-GDP variables, the regression results deliver positive and statistically significant coefficients for the capital loss and capital gains exemption variables for all types of equity investments. Thus, the results suggest that there is a positive relation between the existence of tax exemptions and high levels of equity investments of pension funds. On the other hand, we observe a similar positive and statistically significant relation between dividends exemption and investments in listed equity and total equity. The observation is not valid for the models with unlisted equity. The results are in line with the findings from the literature review, which showed the positive impact of tax exemptions on the level of equity investments.
We note however that the regression results for the impact of the tax framework on equity investments by pension funds should be treated with caution. Many countries in the EU apply a variant of the ‘Exempt-Exempt-Taxed’ (EET) regime for pension funds (OECD, 2015b), where both contributions and returns on investment are exempted from taxation, while the benefits are treated as taxable income upon withdrawal. For both
the United Kingdom and the Netherlands, which account for the largest part of the dataset, this EET regime is applied.
During the interviews, several participants confirmed that the applicable tax regime does not drive the investment strategy, but is rather considered of a secondary concern when implementing the strategy. During the implementation of the allocation strategy, pension funds will seek to optimise the investments from a tax efficiency perspective, including to avoid too much withholding tax. Specifically for the pan-European pension funds, several tax exemptions are applicable through which they can credit withholding tax against corporate tax. Pan-European pension funds in Belgium, for example, also have a lower corporate tax rate, as they are taxed according to the special income tax regime, are not liable to capital gains tax, and also dividend income and interest income are not taxed in the hands of the IORP.151
151 Federal Public Service Finance, 2011, Belgium, Prime Location for Pan-European Pension Funds

European Commission - Study on the drivers of investments in equity by insurers and pension funds
December 2019 I 186
5.3.7 Conclusions
The conclusions that can be drawn from the analysis of the drivers of equity investments made by defined benefit pension funds are comparable to what was found for insurance companies.
Most pension funds note that the decision on the allocation to equity is primarily based on the ALM study, where the market conditions play an important role, next to the characteristics of the liability portfolio.
The prudential framework currently depends on the various Member States’ local rules and requirements, and hence does not have the same impact on the various pension funds across the EU.
In the context of pension funds, the financial strength of the corporate supporting the
pension fund is considered of high importance. Literature highlights this as an important difference between insurers and pension funds; the latter are considered to be able to take on more investment risk, and hence investments in equity. This observation is confirmed when comparing the equity holdings of European insurers and pension funds over the observation period.
In addition, an interesting result that is confirmed both for the British and Dutch DB pension fund market, based on results from a model developed by Douglas and Roberts-Sklar (2018), is that pension funds will tend to decrease their equity investments once their funding ratio passes 100%, until they reach the required funding ratio. They argue that the pension funds are trying to protect their higher funding positions by locking in their investments and shifting towards debt securities.
Finally, the 2005 introduction of IFRS that generalises market valuation coincided with a downward trend on the amounts invested by insurers in (listed) equity. This is in line with the literature, that the disclosure requirements and the change in the accounting valuation method used can be seen as one of the reasons for pension funds in some EU countries to move away from equities and into bonds. This could however not be confirmed consistently through the regression results.

European Commission - Study on the drivers of investments in equity by insurers and pension funds
December 2019 I 187
6 Conclusions
Insurance companies and pension funds (ICPFs) play an important role as institutional investors in Europe, and more specifically as investors in equity. In terms of size, the 2017 ECB Report on Financial Structures mentions that the sector collectively accounts for 12,8% of the overall euro area financial sector. At the end of 2017, the total investments reported by more than 2.000 individual insurance undertakings in the EU stood at 10.305 billion EUR (incl. unit-linked investments) while the total investments of the EU pension market stood at 3.409 billion EUR, i.e. 67% and 22% respectively of the total EU GDP.
ICPFs consider many dimensions when making their decisions to invest in equity. In this study, we try to confirm and broadly rank the relevance of these categories based upon the interviews, the literature, our theoretical model and quantitative analyses. We identify the six most relevant driver categories of equity investments for these
institutional investors, namely, market conditions, Asset Liability Management, prudential framework, undertakings’ characteristics, accounting framework and tax framework.
In the figure below, we have grouped the driver categories, making a distinction between the environment in which insurers and pension funds are operating and between individual entity or group specific items. All of these elements interact with each other.
Figure 55 – Potential drivers of equity investments

European Commission - Study on the drivers of investments in equity by insurers and pension funds
December 2019 I 188
6.1 Insurance sector
The insurance market development – as measured by the ratio of the total insurance investments to the country’s GDP – varies considerably between Member States. Luxembourg, Denmark, France and Ireland have the highest market development, while in Eastern Europe and the Baltic States the investments as share of GDP lie significantly below the EU average.
Life insurers’ investments represent almost half of the total investments of traditional
insurers, and are mainly carried out by French, German and British insurers. Germany represents 50% of total investments by pure non-life insurers152. The reinsurance business is most prominent in Ireland and Luxembourg, representing almost 70% of all EU reinsurance undertakings (in terms of total investments).
Over the last two decades, two financial crises, namely the dot-com crisis and the global
financial crisis, affected the markets. Coinciding with this, insurers’ investments in (direct) listed equity have dropped significantly over the last 20 years, from 11,5% of total investments (excl. UK) in 1999 to 3,3% after the financial crisis. Trend analyses show that after 2011, listed equity investments have remained stable at around 3%, but never fully recovered to their pre-crisis levels.
In contrast to the decreasing trend in listed equity, EU insurers’ investments in unlisted
equity remained relatively stable around 7% of total investments between 1999 and 2018. Germany and France combined make up more than 60% of the total unlisted equity investments, over the complete observation period.
We note that participations153 currently have an important contribution to the balance sheet for most of the European Member States, coinciding with the importance of insurance groups in Europe. Based on EIOPA data at year-end 2017, ‘Holdings in related undertakings, incl. participations’ amount to 800 billion EUR, or 10,5% of total non-unit-linked investments in the EU. Nevertheless, limited data exists on how participations have evolved over the last 20 years and more granular information within these participations is not available.
The decreasing trend in (listed) equity investments has occurred in parallel with an
increasing trend towards indirect equity investments through funds. The trend analyses show an increase in non-money market funds from 14% in 1999 to 26% in 2018, especially after the financial crisis of 2008. Based on year-end 2017 data, approximately one third of the investments through funds relate to equity funds. Unfortunately, the lack of historical data does not allow to further specify the evolution of equity investments within the funds.
Hence, one could say that in broad terms, when funds are also taken into account, a
2018 theoretical ‘average’ insurer might invest in total – through both direct and indirect investments – up to 10 to 20% in equity.
152 Please note that beyond non-life insurers, non-life business is also underwritten by composite undertakings.
153 Participations are in this context defined as ‘the ownership, direct or by way of control, of 20% or more of the voting rights
or capital of an undertaking’, following the definition given in art. 13 of the Solvency II Directive (2009/138/EC). The majority of these are to be found in Germany with 326 billion EUR, followed by France with 136 billion EUR, and the United Kingdom
with 119 billion EUR.

European Commission - Study on the drivers of investments in equity by insurers and pension funds
December 2019 I 189
Unit-linked investments in the EU have remained stable at around 27% of total investments over the last two decades. Historically, insurers in the United Kingdom represented almost half of these investments. One of the emerging trends in the life insurance market is that insurance undertakings are shifting more risk towards policyholders by increasing their unit-linked business. This is confirmed by several NSAs and stakeholders during the interviews. Also from a policyholder perspective, the current low interest rate environment and the corresponding decrease in guaranteed interest rates offered in (life) insurance contracts, may be causing policyholders to search for higher yield, through for example unit-linked products. Equity investments related to unit-linked contracts are higher than those of traditional insurance products.
The drivers of insurers’ equity investments interact with one another in such a way that it may be difficult to disentangle them. Trends in equity investments cannot be attributed to a single factor, but rather to a combination of several driver categories. As a result of the triangulation exercise for insurers, i.e. combining the quantitative
analyses results, the literature review, and the interviews, as well as the insights from our theoretical model, we come to the following conclusions.
6.1.1 Market conditions
The regression results, the literature review and the interviews concur that equity
market returns and favourable market conditions in general, are of utmost importance to insurers in conducting their investment decisions. An attractive risk-return profile is an important incentive to invest in equity, given that equity is still considered to deliver a higher return over the long run, while taking into account the potential risks and volatility related to this kind of investment.154
Next to equity returns, interviewees also refer to the attractiveness of the asset class
for two other reasons, namely from a diversification perspective, and from a hedging perspective to protect against inflation rate risk. Cash flows on the liability side are subject to inflation risk, which directly impacts the claims for non-life insurers and the premiums received for life insurers. As a result, higher inflation can be associated with a higher allocation to equity. Overall, insurers are searching for the optimal investment portfolio to maximise their returns, given the different constraints defined within their risk appetite.
Other elements positively associated with equity investments economic fundamentals and low interest rate levels. Market events (i.e. crises) negatively impact insurers’ investments in equity, as part of derisking behaviour.
According to interviews and the literature review, average dividend yield and market
volatility also play a respectively positive and negative role in the equity investments behaviour of insurers. While the regression results corroborate the finding for the market volatility, we have not been able to run a regression analysis on the average dividend yield due to a lack of historical data.
Finally, the specific case of Sweden is worth mentioning. Interviewees there confirm that traditionally the bond market in Sweden is less deep, and issuances with maturities
154 As an example, our theoretical model shows a limited annualised historical yield of 1,73% for the weighted equity index
during the period 1998-2017. Although this observation is of course dependent on the observed period and selected asset mix, it is an illustration of the fact that equity investments may underperform compared to other asset classes.

European Commission - Study on the drivers of investments in equity by insurers and pension funds
December 2019 I 190
over 10 years are virtually non-existent155, leading to a duration mismatch which cannot be closed by investments in bonds, which in turn can explain, at least partially, why (composite) insurers in Sweden have a significantly higher (direct) equity exposure than the EU average. The example indicates thus that the non-existence of a national bond market with sufficiently long maturities may be a trigger to invest in equity. It is important to note however that the absence of compelling information on this observation from existing literature, as well as the lack of sufficient data to test this with regressions, may bias this conclusion.
6.1.2 Asset Liability Management
Asset Liability Management (ALM) influences the insurers’ equity investments behaviour
since, when implemented effectively in line with the liability profile, it helps mitigate a number of (market) risks. Both literature and interviews confirm that the average duration of liabilities, the outflow profile and lapse rate of the liability portfolio are important. This finding however could not be confirmed by the regression results due to a lack of publicly available historical information on the related factors.
Regarding the average duration of liabilities, literature suggests that equity investments156 can play a role in closing a duration mismatch, where the duration of the liabilities is longer than the maturity of the bonds available in the market. The interviews seem to confirm this, as life insurance companies rank the duration of liabilities as a very important driver of their investment policies and state that the longer the duration of their liabilities, the higher their proportion of equities. In this regard, it is interesting to note the paradox we find with a number of countries, which, despite a long liability duration are not investing in equity as much as could be expected based on the duration of the liabilities (e.g. in Germany and the Netherlands). In addition, the literature and the interviews seem to agree that life insurers are in some cases willing to allow for a
small duration gap (as opposed to perfect matching), e.g. in the event that interest rates are expected to rise again in the near future. Meanwhile, they can close the duration gap by holding a small share of equity (see above), while also improving their expected return.
The outflow profile and the lapse rate of the liability portfolio are other factors that should not be underestimated. The outflow profile is a very important component
of ALM as it is most of the time the point of departure of the ALM framework, as backed up by both interviews and the literature.
In this regard, the literature suggests that uncertainty about financial market conditions may incentivise long-term investors to hold liquid assets. The duration gap is not a primary consideration for most non-life insurers, as their insurance contracts generally have a one-year policy term, allowing them more flexibility to invest in equity.
Literature suggests that in terms of financial consequences, lapse risk is one of the biggest risks to consider for life insurers. Interestingly, the interviewees do not confirm this finding as they have ranked this factor as low in importance. The reason for this can be twofold: the current low interest rate environment whereby policyholders do not
155 Traditionally the Swedish bond market has been less developed compared to other countries, due to two main reasons.
Swedish corporates traditionally obtain debt through bank loans, while the Swedish government debt office Riksgälden has pursued an active policy of avoiding long-term debt issues.
156 Similar to the approach followed for the expected cash flows of fixed income investments, an equity investment’s expected
cash flow pattern is modelled, including the flow of expected dividends, and matched to the liability profile.

European Commission - Study on the drivers of investments in equity by insurers and pension funds
December 2019 I 191
see alternative attractive investments in the market, as well as the existence of contractual lapse penalties, make it less likely for policyholders to lapse. In any case, policyholders are increasingly demanding unit-linked products and insurers are willing to offer these. Policyholders can then expect a higher return on their investment, while the insurer alleviates the pressure of low interest rate on their balance sheet.
Finally, it is important to note that owing to its purpose, ALM interplays strongly with
market conditions and the prudential framework, insofar as the cost of capital for insurers will drive their strategic asset allocation, searching for an optimal return within their risk tolerance.
6.1.3 Prudential framework
The prudential framework affects the asset allocation, within the limits of the insurer’s risk appetite.
Solvency I, the previous prudential framework, was not risk-based and prescribed the calculation of the minimum solvency margin, by focusing on the insurance contract liabilities, claims and premiums.
Solvency II, the current prudential regime, is a risk-based framework applying market-
consistent valuation principles for both assets and liabilities, and using a one-year period Value-at-Risk. Consequently, the short-term volatility as observed in the past is reflected in the calibration of the Solvency Capital Requirements (SCR).
When testing with Solvency I and Solvency II data combined, the regressions suggest that the size of a regulatory capital requirement (i.e. minimum solvency margin or SCR)
has an influence on insurers’ equity investments behaviour, including before the introduction of the SII risk sensitive framework. The analyses show that a strong solvency ratio is correlated with more equity investments, mainly in listed equity. This correlation is valid over the period between 1999 and 2017, and is even more pronounced whenever the LTG measures are applied. However, with two years of Solvency II data (period 2016 Q3 – 2018 Q1) as part of the series used, it is difficult to conclude on the specific impact of introducing the Solvency II framework.
On the short-term volatility of own funds, the interviews suggest that the move towards market valuation brought forward the effects of short-term market fluctuations in the balance sheet of insurers. Several insurance companies expressed the view that the Solvency II framework does not reflect the longer investment horizon in line with the insurance activities they conduct and is therefore not conducive to more equity investments. While there are articles in the literature that back up this claim, both interviews and literature broadly confirm that the transitional measures embedded within the Solvency II framework, alleviate this issue to some extent.
The duration-based approach, where the holding period of the equity investments is introduced in the calibration, does not currently seem to provide a solution as insurers often do not meet the conditions to qualify for its application. The adopted new rules in
2019 on long-term equity with a 22% shock aim to provide a better answer for insurers with a long-term investment horizon.
The undiversified capital charges for equity introduced in the Solvency II framework
range between 22% and 49% - adding a symmetric adjustment within a range of -10% and +10% capturing market evolutions for equities that are not strategic nor long-term

European Commission - Study on the drivers of investments in equity by insurers and pension funds
December 2019 I 192
investments. As shown by EIOPA’s data at year-end 2017, diversification benefits significantly decrease the capital charges for equity. This is also confirmed by our theoretical model whereby the instantaneous impact of investing 100 EUR in equity on the capital charge is between 13,84 EUR and 30,14 EUR, depending on the type of equity and other assumptions made. The interviews suggest that depending on a company’s risk appetite and Solvency ratio, Solvency II will as of a certain level put constraints on increasing equity investments if these would result in breaching the company’s risk appetite.
The literature provides a more nuanced view in terms of capital optimisation, with some articles stressing the need to address interest rate risk hedging first, in combination with the search for yield, to avoid sub-optimal or misguided equity allocation decisions. Recent research on the Solvency II framework goes further and demonstrates that good interest rate risk management, compounded with focusing on an appropriate measure of performance, can deliver an optimal asset allocation for the insurer, which
involves a significant increase in the equity exposure. In fact, these recent studies suggest that by hedging the interest rate risk and focusing on maximising the ratio of expected excess return to marginal risk rather than the actual capital charge, life insurers can improve their solvency and profitability key indicators, while possibly increasing their equity investments. Along the same lines, our theoretical model also shows a positive relationship between higher equity investments and an increase of the internal rate of return on own funds (given the higher expected returns from
equities). However, as mentioned earlier (cf. footnote 154), this observation is highly dependent on the observation period.
Furthermore, although the equity capital charge contributes significantly to the overall
capital requirement, analyses of EIOPA’s data at year-end 2017 show that the capital charges on equity investments are significantly reduced when related to specific
insurance product characteristics. This is specifically the case for products for which the policyholder is willing to accept equity risk, in exchange for a higher possible return. This is typically observed in unit-linked products and products with profit sharing features, but can also be observed with products for which the premiums received from customers are not fully guaranteed by the insurer. This allows the insurer to partly transfer the equity risk to the policyholder, and therefore provides insurers with the capacity to grow their insurance portfolios, while continuing to invest in equity and meeting their risk appetite limits.
Finally, the diversification benefits from investing within and across various asset classes is considered a good risk management practice. In particular, it is widely (theoretically) accepted that equity investments also contribute towards diversified investment portfolios, which the participants to the interviews confirmed. The interviewees consider diversification across asset classes and across equity classes, in
terms of sectoral and geographical distribution, as a necessity from a risk mitigation perspective.
6.1.4 Undertaking characteristics
The literature review and interviews do not provide the same perspective on the effect
of undertaking’s size on insurers’ behaviour towards equity investments. The interviewees have almost unanimously ranked this driver as low in importance. The literature partially backs up this claim, with some pieces of research finding that the undertaking’s size appears to play only a minor role in determining the undertaking’s equity investment. On the other hand, other pieces of research express that insurer’s size is positively related to holdings of common equity. Concerning the type of

European Commission - Study on the drivers of investments in equity by insurers and pension funds
December 2019 I 193
activities, the regressions suggest that the concentration in the market and the business share in terms of types of activities i.e. life vs. non-life, have a significant influence on the amount of insurers’ equity investments. In addition, literature mentions that non-life insurers are more inclined to invest in risky assets than life insurers, due to the nature of their claims liabilities. Non-life insurers’ liabilities are characterised by outstanding claims provisions, which are sensitive to inflation and can also have long durations, depending on the line of business. In comparison to life insurers, non-life insurers also have less fixed cash flows coming from guaranteed interest rates and premiums.
Finally, while traditional policies continue to dominate and demand for guaranteed products remains strong, insurers have been reducing the volume of products with financial guarantees. Literature suggests that the higher cost of liabilities’ reserves are associated with less risky portfolios. However, it emerges from the interviews that the current economic conditions and particularly the low interest rate environment is
exerting a heavy pressure on companies offering products with guaranteed returns. A whole strand of literature concurs with this view, arguing that the protracted low interest rate environment is causing life insurers to depart from interest-bearing assets, towards more risky assets, in search of yield. The interviews and literature suggest that many life insurers have undergone (or are in the midst of) a shift in product offering towards less financial guarantees or products where the investment risk is borne by the policyholder (unit-linked insurance products).157 It is worth mentioning that in general
the share of equity investments is higher in the case of unit-linked products than for guaranteed products.
6.1.5 Accounting framework
Within the EU, IFRS is the main accounting framework for insurers due to the
importance of listed insurance groups, often having cross-border activities through their subsidiaries. Indeed, the application of internationally adopted accounting standards favours comparability across jurisdictions.
The introduction in 2005 of IFRS, which generalises market valuation, coincided with a downward trend on the amounts invested by insurers in (listed) equity, as reflected in our regression analyses and discussed in the academic literature and during
interviews. The decrease in direct equity investments may have been partially compensated by a switch towards indirect equity investments, for which very limited historical data is available. In addition, the data also includes insurers that solely apply local accounting principles that can differ from IFRS accounting principles. The analyses for unlisted equity did not lead to conclusive results, which might be due to different types of equity included in this category (such as unlisted participations and private equity). The amount of insurers’ participations within this category, where insurers have the choice to apply either the full consolidation or equity method, make these equity investments less exposed to market price volatility and hence short-term volatility of the insurer’s result.
157 EIOPA (2017b, 2018c, 2018h) notes that the share of unit-linked business has increased from 2011 to 2018. Per EIOPA, in terms of volume the business has more than doubled since 2011. In 2016, the vast majority of the UL/IL business (80%)
was managed by DE, FR, NL and UK groups. More specifically for 2016 and 2017, the total share of unit-linked business in life gross written premiums has increased from 28% in 2016 Q4 tot 41% in 2017 Q4, while the share for the median insurance
company has increased to 35% in 2017 compared to 30% in 2016. Growth slowed for unit-linked business in life, expressed in gross written premiums, between 2017 Q2 and 2018 Q2, but the share of unit-linked business is expected to grow further
over the coming years (as several stakeholders confirm as an emerging trend that insurance undertakings are shifting more risk towards policyholders by increasing their unit-linked business).

European Commission - Study on the drivers of investments in equity by insurers and pension funds
December 2019 I 194
An analysis of a sample of insurers’ SFCRs indicates that insurance groups in Europe still apply IAS 39 and have opted for the deferral of IFRS 9 for which they are aligning the first time adoption date with IFRS 17. Under IAS 39, equity investments impact an insurer’s profit and loss account mainly through either a prolonged or significant decline in fair value, dividends received and/or realised results through the sale of equity investments.
Profit and loss volatility can arise when impairment triggers are reached and therefore
the entire unrealised loss initially recognised in own funds is recycled into profit and loss. In addition, once an equity investment is impaired, a further decrease in fair value results in recording the additional loss into profit and loss. As mentioned by insurers, this measurement still provides room for mitigating actions in order to manage the volatility related to fair value accounting of equity investments. Other insurers are more concerned about the possible impact of short-term volatility on their profit and loss under IAS 39, applying a confidence level that is dependent on the insurer’s risk appetite.
Alternatively, an insurer may under IFRS 9 irrevocably elect to present changes of the fair value in other comprehensive income on an instrument-by-instrument basis. Under this accounting policy choice, both the unrealised and the realised gains and losses are directly recorded in shareholders’ equity. As a result of this choice, the contribution of equity investments to the profit and loss account will be limited to dividends received.
Insurers taking this accounting policy choice may therefore have an incentive to favour equities with a higher dividend pay-out.
In addition, the future application of IFRS 17 for insurance contracts will result in a broader application of current value measurement. Therefore, the interplay between IFRS 9 and IFRS 17 will be an important topic in the years to come. More specifically,
insurance contracts with direct participation features may gain in importance. For these contracts, IFRS 17 is expected to mitigate to a large extent the potential volatility arising from the fair value measurement of financial assets. This measurement model will be important for insurers, which are aiming to limit unexpected profit and loss volatility coming from equity investments with fair value changes recorded through profit and loss.
As insurers are preparing for IFRS 9 and IFRS 17 in the upcoming years, the application of both standards need close monitoring to ensure that they do not introduce even more volatility to the financial accounts and therefore negatively impact equity investments.
6.1.6 Tax framework
The tax framework remains a national competency (contrary to the IFRS accounting framework) and consequently, is very difficult to test with regard to the role it plays in the equity consideration of insurers. The regressions applied to the tax on capital to GDP ratio suggest that insurers take into account the tax on capital in the equity investments decisions. However, due to the lack of data on the tax treatment of realised gains and losses on the sale of equity investments by insurers, or the tax treatment of dividends, we cannot conclude further. Moreover, as also indicated by some pieces of
literature, tax-to-GDP does not provide any information on whether insurance companies are actually exempted from capital gains taxes or not, whether capital losses are deductible or not, and whether dividend income is tax exempted or not.
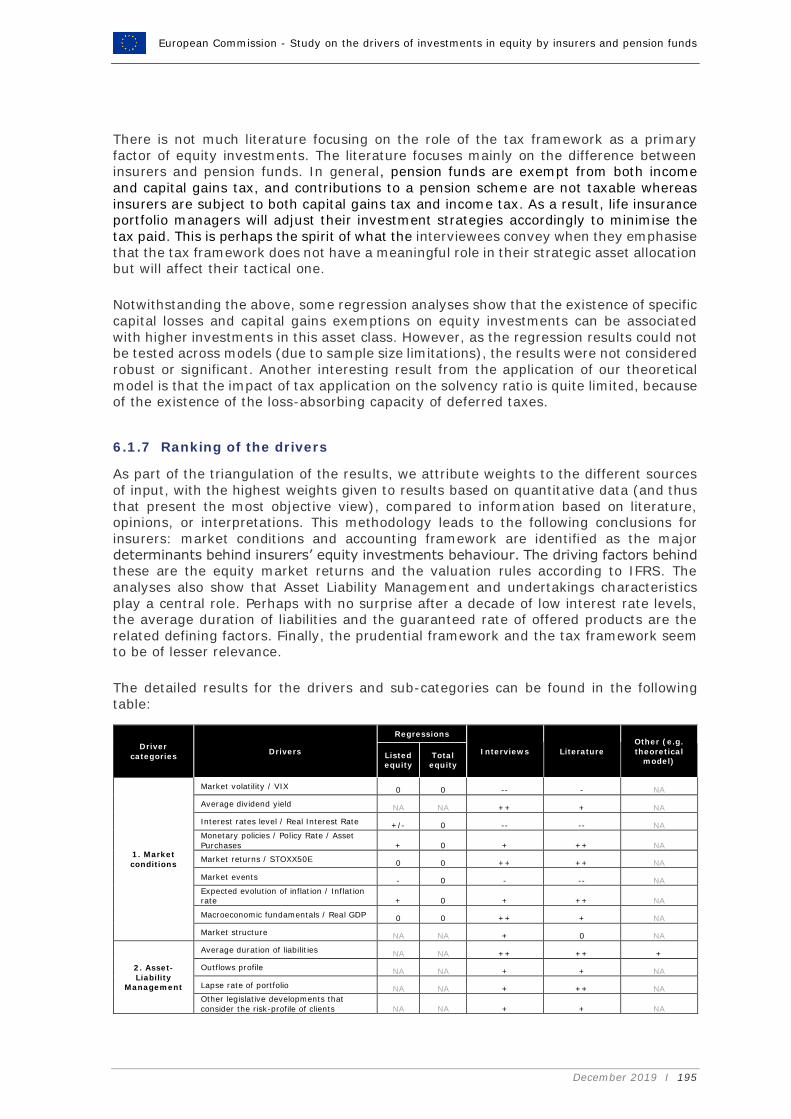
European Commission - Study on the drivers of investments in equity by insurers and pension funds
December 2019 I 195
There is not much literature focusing on the role of the tax framework as a primary factor of equity investments. The literature focuses mainly on the difference between insurers and pension funds. In general, pension funds are exempt from both income and capital gains tax, and contributions to a pension scheme are not taxable whereas insurers are subject to both capital gains tax and income tax. As a result, life insurance portfolio managers will adjust their investment strategies accordingly to minimise the tax paid. This is perhaps the spirit of what the interviewees convey when they emphasise that the tax framework does not have a meaningful role in their strategic asset allocation but will affect their tactical one.
Notwithstanding the above, some regression analyses show that the existence of specific capital losses and capital gains exemptions on equity investments can be associated with higher investments in this asset class. However, as the regression results could not be tested across models (due to sample size limitations), the results were not considered robust or significant. Another interesting result from the application of our theoretical
model is that the impact of tax application on the solvency ratio is quite limited, because of the existence of the loss-absorbing capacity of deferred taxes.
6.1.7 Ranking of the drivers
As part of the triangulation of the results, we attribute weights to the different sources
of input, with the highest weights given to results based on quantitative data (and thus that present the most objective view), compared to information based on literature, opinions, or interpretations. This methodology leads to the following conclusions for insurers: market conditions and accounting framework are identified as the major determinants behind insurers’ equity investments behaviour. The driving factors behind these are the equity market returns and the valuation rules according to IFRS. The analyses also show that Asset Liability Management and undertakings characteristics
play a central role. Perhaps with no surprise after a decade of low interest rate levels, the average duration of liabilities and the guaranteed rate of offered products are the related defining factors. Finally, the prudential framework and the tax framework seem to be of lesser relevance.
The detailed results for the drivers and sub-categories can be found in the following table:
Driver
categories Drivers
Regressions
Interviews Literature
Other (e.g.
theoretical model)
Listed equity
Total equity
1. Market
conditions
Market volatility / VIX 0 0 -- - NA
Average dividend yield NA NA ++ + NA
Interest rates level / Real Interest Rate +/- 0 -- -- NA
Monetary policies / Policy Rate / Asset
Purchases + 0 + ++ NA
Market returns / STOXX50E 0 0 ++ ++ NA
Market events - 0 - -- NA
Expected evolution of inflation / Inflation rate + 0 + ++ NA
Macroeconomic fundamentals / Real GDP 0 0 ++ + NA
Market structure NA NA + 0 NA
2. Asset-
Liability Management
Average duration of liabilities NA NA ++ ++ +
Outflows profile NA NA + + NA
Lapse rate of portfolio NA NA + ++ NA
Other legislative developments that
consider the risk-profile of clients NA NA + + NA

European Commission - Study on the drivers of investments in equity by insurers and pension funds
December 2019 I 196
Driver categories
Drivers
Regressions
Interviews Literature Other (e.g. theoretical
model) Listed equity
Total equity
3. Prudential
framework
Solvency II ratio with and without
transitional measures NA NA + + +
Solvency II short-term volatility of own-funds NA NA - - NA
Capital charges for equity exposures under Solvency II NA NA -- - -
Ability to implement an asset-liability management strategy for the purpose of the interest rate risk NA NA + + NA
Application of duration based approach NA NA + + NA
Solvency Margin 0 0 NA NA NA
Solvency II - Dummy 0 0 NA NA NA
4. Undertaking
characteristics
Guaranteed returns of offered products and expected return on investments NA NA -- -- NA
Insurance Market Development 0 0 NA - NA
D.Non-Life Business Share 0 0 NA 0 NA
D.Rescaled Concentration Ratio of Life
Business 0 0 NA 0 NA
D.Rescaled Concentration Ratio of Non-Life Business ++ ++ NA 0 NA
5. Accounting
framework
Accounting treatment cost versus fair
value treatment through P&L NA NA - -- --
Impairment rules under local GAAP and IFRS NA NA +/- +/- NA
IFRS Market Valuation -- -- NA -- NA
6. Tax regime
Tax treatment of realised gains and losses on the sale of equity investments /
Capital Gains/Losses Exemption NA NA + + +
Tax treatment of dividends / Dividends
Exemption NA NA + + NA
Special tax exemption NA NA + + NA
Tax on Capital to GDP ratio 0 0 NA 0 NA
++ High positive impact on equity share -- High negative impact on equity share
+ Low positive impact on equity share - Low negative impact on equity share
+/- Low impact on equity share and sign of the impact unclear 0 Limited to no impact on equity percentage
NA Not tested or no data available for testing
6.2 Pension fund sector
The share of equity investments by the pension fund sector has been consistently higher than in the insurance sector. The Netherlands and the UK pension fund sector account for the lion’s share of both the total investments (80%) and equity investments by defined benefit pension funds (90%).
The EU share of equity in total investments was considerably higher (at 50%) before
the global financial crisis than it is today, while in recent years, the share remained relatively stable above 30%. The decreasing trend can be attributed to general derisking after the financial crisis (away from equity), and the decreasing trend in the UK, increasingly allocating investments towards debt securities instead.
Based on detailed information on the investments in listed equity of several large defined benefit pension funds in the Netherlands and the UK, it appears that each of them invests in between 300 and 4.000 listed companies. Most of the funds flow to large-caps and only a small share is invested in micro (0,2% of listed equity investments), small (1,5%) and mid-caps (10,8%). Although most of the investments are in companies that can be considered the end-users of finance, nearly a quarter of the investments is in companies active in financial and insurance services. The

European Commission - Study on the drivers of investments in equity by insurers and pension funds
December 2019 I 197
geographical destination differs substantially between the pension funds from both countries. The Dutch pension funds invest only a limited amount in domestically incorporated companies (1,4%) and most of their listed equity investments are in non-EU companies (86,5%). UK pension funds in the sample on the other hand invest more than a third domestically (36,8%) and just over half of their investments are in other EU listed companies (15,3%, compared to 12,1% for Dutch pension funds).
In addition, analyses indicate an increasing popularity in recent years towards offering
occupational pensions on a defined contribution (DC) basis, a trend which is confirmed for the UK market where the share of DC assets in the total pension fund market increased from 2,2% (2006) to 3% (2017). Across all Member States however EIOPA data indicates a slight decrease over the same period (from 14,9% to 14,0%).
As for the ranking of the driver categories for the defined benefit pension funds, the conclusions that can be drawn from the analysis are comparable to what was found for insurance companies. Most pension funds note that the decision on the allocation to equity is primarily based on the ALM study, where the market conditions play an important role, next to the characteristics of the liability portfolio.
In the context of pension funds, the financial strength of the corporate supporting the
pension fund is considered of high importance. Pension funds have to invest the contributions they receive from sponsors and participants to be able to fulfil the financial promises of their sponsor. Market conditions are in that regard, crucial to achieve these objectives. Literature highlights this as an important difference between insurers and pension funds; the latter are considered to be able to take on more investment risk, and hence investments in equity. This observation is confirmed when comparing the equity holdings of European insurers and pension funds over the observation period.
Because of the nature of their liabilities, whereby lapses are less common and more restricted by the laws in the various Member States, pension funds are technically immune to default as noted in the literature review. As such, pension funds have more flexibility to adopt a riskier behaviour than their insurance counterparts do on the long-term.
The prudential framework currently depends on the various Member States’ local rules and requirements, and hence does not have the same impact on the various pension funds across the EU. While for Dutch and UK pension funds for example, there are no specific legal restrictions on their equity exposures (except for a number of restrictions on investments in shares of the sponsoring employer), for other pension funds in the EU, concentration limits or specific diversification requirements may apply. The accounting framework and the taxation framework are also of less relevance (and also national in nature).
The detailed results for the drivers and sub-categories can be found in the following table:
Driver categories Drivers
Regressions
Interviews Literature Listed
equity
Total
equity
1. Market conditions
Market volatility / VIX 0 0 -- -
Average dividend yield NA NA + +
Interest rates level / Real Interest Rate 0 0 +/- --
Monetary policies / Policy Rate / Asset Purchases
0 0 + ++
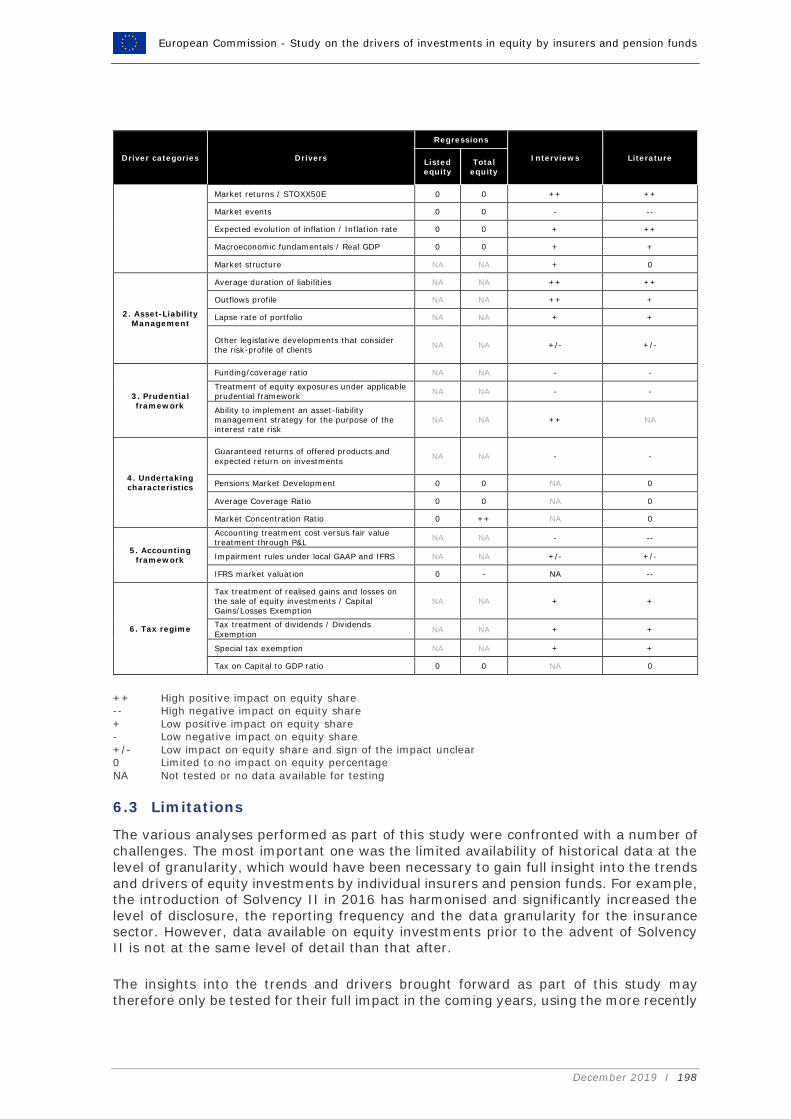
European Commission - Study on the drivers of investments in equity by insurers and pension funds
December 2019 I 198
Driver categories Drivers
Regressions
Interviews Literature Listed equity
Total equity
Market returns / STOXX50E 0 0 ++ ++
Market events 0 0 - --
Expected evolution of inflation / Inflation rate 0 0 + ++
Macroeconomic fundamentals / Real GDP 0 0 + +
Market structure NA NA + 0
2. Asset-Liability Management
Average duration of liabilities NA NA ++ ++
Outflows profile NA NA ++ +
Lapse rate of portfolio NA NA + +
Other legislative developments that consider the risk-profile of clients
NA NA +/- +/-
3. Prudential framework
Funding/coverage ratio NA NA - -
Treatment of equity exposures under applicable prudential framework
NA NA - -
Ability to implement an asset-liability management strategy for the purpose of the interest rate risk
NA NA ++ NA
4. Undertaking characteristics
Guaranteed returns of offered products and
expected return on investments NA NA - -
Pensions Market Development 0 0 NA 0
Average Coverage Ratio 0 0 NA 0
Market Concentration Ratio 0 ++ NA 0
5. Accounting framework
Accounting treatment cost versus fair value treatment through P&L
NA NA - --
Impairment rules under local GAAP and IFRS NA NA +/- +/-
IFRS market valuation 0 - NA --
6. Tax regime
Tax treatment of realised gains and losses on the sale of equity investments / Capital Gains/Losses Exemption
NA NA + +
Tax treatment of dividends / Dividends
Exemption NA NA + +
Special tax exemption NA NA + +
Tax on Capital to GDP ratio 0 0 NA 0
++ High positive impact on equity share
-- High negative impact on equity share
+ Low positive impact on equity share - Low negative impact on equity share
+/- Low impact on equity share and sign of the impact unclear 0 Limited to no impact on equity percentage
NA Not tested or no data available for testing
6.3 Limitations
The various analyses performed as part of this study were confronted with a number of challenges. The most important one was the limited availability of historical data at the level of granularity, which would have been necessary to gain full insight into the trends and drivers of equity investments by individual insurers and pension funds. For example, the introduction of Solvency II in 2016 has harmonised and significantly increased the level of disclosure, the reporting frequency and the data granularity for the insurance sector. However, data available on equity investments prior to the advent of Solvency II is not at the same level of detail than that after.
The insights into the trends and drivers brought forward as part of this study may therefore only be tested for their full impact in the coming years, using the more recently

European Commission - Study on the drivers of investments in equity by insurers and pension funds
December 2019 I 199
available granular data of insurance markets and the recent initiatives by EIOPA to enhance data on investments of the EU pension fund sector.
In addition, we must point out that the quantitative part of the interviews was ultimately
of limited use to the analysis, as only a very limited number of insurance companies and pension funds were able to provide information on equity investments that are sufficiently granular, and time-series of a sufficient duration.
Furthermore, market development and policy changes, during the period under consideration, are embedded in the analysis of other drivers, and we were not able to fully distinguish the specific effect of the former (market developments and policy changes) from the ones of the latter (other factors). In the last two decades, there have been two financial crises, a major change in accounting standards and a prudential framework change for insurers. These overlapping events have long-term potential effects and might affect each other.
The study methodology was set up aiming to mitigate these limitations to the furthest extent possible, by triangulating the inputs and conclusions from all different sources available (literature, data sources, interviews and stakeholder consultation), and by applying appropriate statistical methods.

European Commission - Study on the drivers of investments in equity by insurers and pension funds
December 2019 I 200
References Ahlgrim, K. and S. D’ Arcy (2012). The Effect of Deflation or High Inflation on the
Insurance Industry, CASUALTY Actuarial Society, Canadian Institute of Actuaries, Society of Actuaries
Alestalo, N. and V. Puttonen (2006). Asset allocation in Finnish pension funds. Journal of Pension Economics and Finance, 5(1): 27-44.
Amir, E. (2010). The Effect of Pension Accounting on Corporate Pension Asset Allocation. Review of Accounting Studies, 15(2): 345-366.
Anantharaman, D. and E. Chuk (2018). The Economic Consequences of Accounting Standards: Evidence from Risk-Taking in Pension Plans. Accounting Review, 93(4): 23-51.
Andersen, C. and P. Skjodt (2007). Pension Institutions and Annuities in Denmark. Policy Research Working Paper, No. 4437, World Bank.
Antolin, P., S. Schich and J. Yermo (2011). The Economic Impact of Protracted Low Interest Rates on Pension Funds and Insurance Companies. OECD Journal of Financial Markets and Trends, 2011(1): 1-20.
Arbel, A., S. Carvell and P. Strebel (1983). Giraffes, Institutions and Neglected Firms. Financial Analysts Journal, 39(3): 57-63.
Arias, L., G. Déderen, P. Foulquier and T-P. Maury (2016). What solutions does the insurance sector have in the face of Europe’s low interest rate. EDHEC Business School.
Athearn, J. (1960). The Structure of the Life Insurance Industry. Journal of Insurance, 29-36.
Badrinath, S., G. Gay and J. Kale (1989). Patterns of Institutional Investment, Prudence, and the Managerial "Safety-Net" Hypothesis. Journal of Risk and Insurance, 56(4): 605-629.
Badrinath, S., J. Kale and H. Ryan (1996). Characteristics of common stock holdings of insurance companies. Journal of Risk and Insurance, 63(1): 49-76.
Barber, B. and T. Odean (2008). All that glitters: The Effects of Attention and News on the Buying Behaviour of Individual and Institutional Investors. Review of financial studies, 21(2): 785–818.
Barnes, M., J. Boyd and B. Smith (1999). Inflation and asset returns. European Economic Review, 43(4-6), 737-754.
Barthelme, C., P. Kiosse and T. Sellhorn (2018). The Impact of Accounting Standards on Pension Investment Decisions, European Accounting Review, 28(1): 1-33.
Bekaert, G. and Wang, X. (2010). Inflation risk and the inflation risk premium. Economic Policy, 25(64), 755-806.
Berdin, E., H. Gründl and C. Kubitza (2017). Rising interest rates, lapse risk, and the stability of life insurers. ICIR Working Paper Series, No. 29/17.
Bianchi, et al. (2011). The Austrian Insurance Industry in CESEE: Risks and Opportunities from a Financial Stability Point of View.” Financial Stability Report, 22: 88–106
Bijlsma, M. and R. Vermeulen (2016). Insurance Companies’ Trading Behaviour During the European Sovereign Debt Crisis: Flight Home or Fight to Quality? Journal of Financial Stability, 27: 137-154.
Bikker, J., D. Broeders and J. De Dreu (2010). Stock Market Performance and Pension Fund Investment Policy: Rebalancing, Free Float, or Market Timing? International Journal of Central Banking, 6(2): 53-79.

European Commission - Study on the drivers of investments in equity by insurers and pension funds
December 2019 I 201
Bikker, J., D. Broeders, D. Hollanders and E. Ponds (2012). Pension Funds' Asset Allocation and Participant Age: A Test of the Life-Cycle Model. Journal of Risk and Insurance, 79(3): 595-618.
BIS (2011). Fixed income strategies of insurance companies and pension funds, Committee on the Global Financial System, CGFS Papers, No. 44, July.
Black, F. (1980). The tax consequences of long-run pension policy. Financial Analysts Journal, 36(4): 21-28.
Black, F. (1989). Should You Use Stocks to Hedge Your Pension Liability? Financial Analysts Journal, 45(1): 10-12.
BlackRock (2012). Balancing Risk, Return and Capital Requirements: The Effect of Solvency II on Asset Allocation and Investment Strategy. Economist Intelligence Unit, BlackRock.
Blake, D., B. Lehmann and A. Timmermann (1999). Asset Allocation Dynamics and Pension Fund Performance. Journal of Business, 72(4): 429-461.
Bank of England (2014). Procyclicality and Structural Trends in Investment Allocation by Insurance Companies and Pension Funds. Discussion Paper by the Bank of England and the Procyclicality Working Group, July, Bank of England.
Bodie, Z., R. Merton and W. Samuelson (1992). Labor supply flexibility and portfolio choice in a life cycle model. Journal of Economic Dynamics and Control, 16(3-4): 427-449.
Boudoukh, J. and M. Richardson (1993). Stock returns and inflation: A long-horizon perspective. American Economic Review, 83(5), 1346–1355.
Braun, A., H. Schmeiser and F. Schreiber (2017). Portfolio optimization under Solvency II: Implicit constraints imposed by the market risk standard formula. Journal of Risk and Insurance, 84(1): 177–207.
Brentani (2004). Portfolio management in practice.
Browne, M., J. Carson and R. Hoyt (2001). Dynamic Financial Models of Life Insurers. North American Actuarial Journal, 5(2): 11-26.
Campbell, J. and L. Viceira (2002). Strategic Asset Allocation: Portfolio Choice for Long-Term Investors. Oxford University Press.
Campbell, J. and L. Viceira (2005). Strategic Asset Allocation for Pension Plans. In Gordon, C., A. Minnell and M. Orszag (Eds.) The Oxford Handbook of Pensions and Retirement Income. Oxford University Press.
CEIOPS (2009). CEIOPS Spring Financial Stability Report. 22.
Cocco, J., F. Gomes and P. Maenhout (2005). Consumption and Portfolio Choice over the Life Cycle. Review of Financial Studies, 18(2): 491-533.
Conforti, R. (2015). Investment Strategies Amongst Property and Casualty Insurance Companies. Honors Scholar Theses, 438.
D'Arcy, S. (1982). A Strategy for Property-Liability Insurers in Inflationary Times. Proceedings of the Casualty Actuarial Society, 69(132): 163-186.
D’Arcy, S. and A. Au (2011). A Two-Factor Approach to Loss Reserve Variability. Casualty Actuarial Society, IAA Joint Colloquium, pp. 98-128.
D’Arcy, S., A. Au and L. Zhang (2009). Property-Liability Insurance Loss Reserve Ranges Based on Economic Value. Variance, 3(1): 42-61.
Davis, P. (2002). Prudent person rules or quantitative restrictions? The regulation of long-term institutional investors' portfolios. Journal of Pension Economics and Finance, 1(02): 157-191.
De Haan, L. and J. Kakes (2011). Momentum or contrarian investment strategies: Evidence from Dutch institutional investors. Journal of Banking and Finance, 35(9): 2245-2251.

European Commission - Study on the drivers of investments in equity by insurers and pension funds
December 2019 I 202
Doff, R. (2011), Risk Management for Insurers: Risk Control, Economic Capital and Solvency II, Risk Books.
Douglas, G. and M. Roberts-Sklar (2018). What drives UK defined benefit pension funds’ investment behaviour? Staff Working Paper No. 757, Bank of England.
Duijm, P. and S. Bisschop (2018). Short-termism of long-term investors? The investment behaviour of Dutch insurance companies and pension funds. Journal of Applied Economics, 50(31): 3376-3387.
EC (2015). Commission Delegated Regulation (EU) 2015/35 of 10 October 2014
supplementing Directive 2009/138/EC of the European Parliament and of the Council on the taking-up and pursuit of the business of Insurance and Reinsurance (Solvency II). January, European Commission.
EC (2017). Economic Analysis accompanying Communication on the Mid-Term Review of the Capital Markets Union Action Plan. Commission Staff Working Document, Brussels, June, European Commission.
EC (2019). European Economic Forecast. Winter 2019 (Interim). 07 February, European Commission.
EC (2019) Commission Delegated Regulation (EU) 2019/981 of 8 March 2019 amending Delegated Regulation (EU) 2015/35 supplementing Directive 2009/138/EC of the European Parliament and of the Council on the taking-up and pursuit of the business of Insurance and Reinsurance (Solvency II). March, European Commission.
ECB (2008). Financial Stability Review. December, European Central Bank.
EFAMA (2016). The IFRS 9 phase 1 implementation will have a negative impact on asset management industry.
EFRAG (2018). Endorsement Advice on IFRS 9 Financial Instruments.
EIOPA (2014). Technical specification for the preparatory phase (part I). EIOPA-14/209, 30 April, European Insurance and Occupational Pensions Authority.
EIOPA (2015a). Final report on public consultation No. 14/058 on the implementing technical standards on the equity index for the symmetric adjustment of the equity capital charge. EIOPA-Bos-15/120, 30 June, European Insurance and Occupational Pensions Authority.
EIOPA (2015b). Summary of Conclusions: Joint meeting of EIOPA Board of Supervisors with the Insurance and Reinsurance Stakeholder Group and the Occupational Pensions Stakeholder Group. No. 15/889, 01 December, European Insurance and Occupational Pensions Authority.
EIOPA (2016). Insurance stress test report. No. 16/302, 15 December, European Insurance and Occupational Pensions Authority.
EIOPA (2017a). Consultation Paper on EIOPA’s first set of advice to the European Commission on specific items in the Solvency II Delegated Regulation. No. CP 17/004. 4 July, European Insurance and Occupational Pensions Authority.
EIOPA (2017b). First set of advice to the European Commission on the Solvency II Delegated Regulation. No. 17/280, 30 October, European Insurance and Occupational Pensions Authority.
EIOPA (2017c). Investment Behaviour Report. No. 17/230, 16 November, European Insurance and Occupational Pensions Authority.
EIOPA (2017d). Occupational Pensions Stress Test. No. 17/370, 13 December, European Insurance and Occupational Pensions Authority.
EIOPA (2017e) Consumer trends report Source: https://eiopa.europa.eu/publications/ reports/sixth%20consumer%20trends%20report.pdf

European Commission - Study on the drivers of investments in equity by insurers and pension funds
December 2019 I 203
EIOPA (2018a). Market development report on occupational pensions and cross-border IORPs 2017. No. 18/013, 30 January, European Insurance and Occupational Pensions Authority.
EIOPA (2018b). Second set of advice to the European Commission on the Solvency II Delegated Regulation. No. 18/075, 28 February, European Insurance and Occupational Pensions Authority.
EIOPA (2018c). Financial Stability Report. June, European Insurance and Occupational Pensions Authority.
EIOPA (2018d). Report on Consultation Paper CP 17-005 EIOPA's regular information requests towards NCAs regarding provision of occupational pensions information. No. 18/227, 25 April, European Insurance and Occupational Pensions Authority.
EIOPA (2018e). Consultation Paper on Technical Advice on the integration of sustainability risks and factors in the delegated acts under Solvency II and IDD. No. 18/483, 26 November, European Insurance and Occupational Pensions Authority.
EIOPA (2018f). Insurance Stress Test. No. 18/523, 14 December, European Insurance and Occupational Pensions Authority.
EIOPA (2018g). Report on long-term guarantees measures and measures on equity risk. No. 18/471, 18 December, European Insurance and Occupational Pensions Authority.
EIOPA (2018h). Financial Stability Report. December, European Insurance and Occupational Pensions Authority.
EIOPA (2019). YE2017 Comparative Study on Market and Credit Risk Modelling. No. 19/121, 18 March, European Insurance and Occupational Pensions Authority.
Eling, M., N. Gatzert and H. Schmeiser (2008). The Swiss Solvency Test and its Market Implications. Geneva Papers on Risk and Insurance – Issues and Practice, 33(3): 418-439.
ESRB (2016). Section C: The impact of low interest rates and ongoing structural changes on noncredit institutions: vulnerabilities, systemic risks and implications for financial stability. In Macroprudential policy issues arising from low interest rates and structural changes in the EU financial system, November, European Systemic Risk Board.
EUROSTAT (2018). The European economy since the start of the millennium: A statistical report. 2018 Edition, Statistical Office of the European Communities.
Fleuriet, V. and C. Lubochinsky (2005). Interest Rate Risk Management by Life Insurance Companies and Pension Funds. Financial Stability Report, No. 6, June, Banque de France.
Focarelli, D. (2017). Why Insurance Regulation Is Crucial for Long-Term Investment and Economic Growth. In Marano, P. and M. Siri (Eds.) Insurance Regulation in the European Union. Palgrave Macmillan.
G30 (2013). Long-term Finance and Economic Growth. Working Group on Long-term Finance, Group of Thirty.
Gabaix, X., P. Gopikrishnan, V. Plerou and H. Stanley (2006). Institutional Investors and Stock Markets Volatility. Quarterly Journal of Economics, 121(2): 461-504.
Galai, D. and R. Masulis (1976). The option pricing model and the risk factor of stock. Journal of Financial Economics, 3(1-2): 53–81.
Galdeano, I. and P. Aumente (2016). The Impact of Low Interest Rates on the Insurance Sector. Spanish Economic and Financial Outlook, 5(5): 41-46.

European Commission - Study on the drivers of investments in equity by insurers and pension funds
December 2019 I 204
Gatzert, N. and M. Martin (2012). Quantifying credit and market risk under Solvency II: Standard approach versus internal model. Insurance: Mathematics and Economics, 51(3): 649–666.
Geneva Association (2010). Systemic Risk in Insurance: An analysis of insurance and financial stability. Special Report of The Geneva Association Systemic Risk Working Group, March 2010.
Gerard, M. (2019). Reform Options for Mature Defined Benefit Pension Plans: The Case of the Netherlands. 25 January, International Monetary Fund.
Gerber, D. and R. Weber (2007). Demography and investment behavior of pension funds: evidence for Switzerland. Journal of Pension Economics and Finance, 6(3): 313-337.
Gilbert, C. (2016). Asset Liability Management Techniques and Practices for Insurance Companies. Chapter 13. IAA Risk Book.
Gompers, P. and A. Metrick (2001). Institutional Investors and Equity Prices. Quarterly Journal of Economics, 116(1): 229-259.
Gorter and Bikker (2011). Investment Risk Taking by Institutional Investors. Netspar Discussion Papers. No. DP 05/2011-048.
Greenwood, R. and D. Vayanos (2010). Price Pressure in the Government Bond Market. American Economic Review, 100(2): 585-590.
Gründl, H., M. Dong and J. Gal (2016). The evolution of insurer portfolio investment
strategies for long-term investing. OECD Journal: Financial Market Trends, vol. 2016/2: 1-55.
Hogan (2007). Life cycle investing is rolling our way. Journal of Financial Planning. May, 46-54.
Holsboer, J. (2000). The Impact of Low Interest Rates on Insurers. The Geneva Papers on Risk and Insurance – Issues and Practice, 25(1): 38-58.
Hudson-Wilson, S., J. Gordon, F. Fabozzi, M. Anson and M. Giliberto (2005). Why Real Estate? Journal of Portfolio Management, Special Real Estate Issue, 31(5): 12-21.
International Accounting Standard Board (2018). Basis for Conclusions accompanies IFRS 9 Financial instruments.
Ibbotson, R., M. Milevsky, P. Chen and K. Zhu (2007). Lifetime Financial Advice: Human
Capital, Asset Allocation, and Insurance. CFA Institute, Research Foundation Publications, April.
IMF (2004). Risk Transfer and the insurance industry. Global Financial Stability Report.
IMF (2014). Denmark – Financial Sector Assessment Program – Insurance Sector Core principles – Detailed Assessment of observance. IMF Country Report No. 14/350.
IMF (2016). Germany: Financial Sector Assessment Program – Insurance Sector Supervision - Technical Notes. Country Report No. 16/192, 29 June.
IMF (2017a). Kingdom of the Netherlands – Netherlands: Financial Sector Assessment Program: Technical Note – Insurance and Pension Sectors. Country Report No. 17/94, 13 April.
IMF (2017b). Sweden: Financial Sector Assessment Program – Technical Note – Insurance Sector Regulation and Supervision. Country Report No. 17/307, 5 October.
Impavido, G. and I. Tower (2009). How the Financial Crisis Affects Pensions and Insurance and Why the Impacts Matter. IMF Working Papers 09/151, International Monetary Fund.

European Commission - Study on the drivers of investments in equity by insurers and pension funds
December 2019 I 205
IRM (2015). Internal Model Industry Forum: Diversification benefit: understanding its drivers and building trust in the numbers. Executive Summary, Institute of Risk Management.
Jakubic, P. and E. Turturescu (2018). Potential Drivers of Insurers Equity Investments. EIOPA Financial Stability Report - Thematic Articles 12, EIOPA, Risks and Financial Stability Department.
Jensen, M. and W. Meckling (1976). Theory of the firm: Managerial behavior, agency costs and ownership structure. Journal of Financial Economics, 3(4): 305–360.
Kakes, J. (2006). Financial behaviour of Dutch pension funds: a disaggregated approach. DNB Working Papers No. 108, Netherlands Central Bank.
König, R. and M. Wosnitza (2000). Zur Problematik der Besteuerung privater Aktienkursgewinne – eine ökonomische Analyse. Journal of Business Economics, 70: 781–801.
Kouwenberg, R. (2017). Strategic Asset Allocation and Risk Budgeting for Insurers under Solvency II. Journal of Asset Management, 19(7): 447-459.
Krivo, R. (2009). An Update to D’Arcy’s ‘A Strategy for Property-Liability Insurers in Inflationary Times. Casualty Actuarial Society E-Forum, Spring.
Lam, M. (2014). Is portfolio rebalancing good for investors?
Lee, J, D. Mayers and C. Smith (1997). Guaranty funds and risk-taking evidence from the insurance industry. Journal of Financial Economics, 44(1): 3-24.
Lee, J. and D. Stock (2000). Embedded options and interest rate risk for insurance companies, banks and other financial institutions. Quarterly Review of Economics and Finance, 40(2): 169-187.
Li, D., F. Moshirian, P. Nguyen and T. Wee (2007). The Demand for Life Insurance in OECD Countries. Journal of Risk and Insurance, 74(3): 637-652.
Litterman, R. and J. Scheinkman (1991). Common factors affecting bond returns. Journal of Fixed Income, 1(1): 54-61.
MacMinn and Ren (2011). Mutual versus Stock Insurers: A Synthesis of the Theoretical and Empirical Research. Journal of Insurance Issues. 8 (2), 101-111.
Mayers, D. and C. Smith (1987). Corporate Insurance and the Underinvestment Problem. Journal of Risk and Insurance, 54(1): 45-54.
McKinsey (2011). The Emerging Equity Gap: Growth and Stability in the New Investor Landscape. McKinsey Global Institute.
McKinsey (2018). A vision for European Life insurance: the time for bold action has come. June.
Merton, R. (1969). Lifetime Portfolio Selection under Uncertainty: The Continuous-Time Case. Review of Economics and Statistics, 51, 247–257
Milhaud, X. and C. Dutang (2018). Lapse tables for lapse risk management in insurance: a competing risk approach. European Actuarial Journal, 8(1): 97-126.
Morgan Stanley and Oliver Wyman (2015). European Insurance-Generating cash in a volatile Solvency II world. Morgan Stanley Research, London.
OECD (2010). Pension Markets in Focus. Issue 7, July, Organisation for Economic Co-operation and Development.
OECD (2015a). OECD Business and Finance Outlook 2015. Organisation for Economic Co-operation and Development.
OECD (2015b). Stocktaking of the tax treatment of funded private pension plans in OECD and EU countries. Organisation for Economic Co-operation and Development.

European Commission - Study on the drivers of investments in equity by insurers and pension funds
December 2019 I 206
OECD (2016). The economic Impact of Protracted Low Interest Rates on Pension Funds and Insurance Companies. 2011 (1).
Papaioannou, M., J. Park, J. Pihlman and H. Van der Hoorn (2013). Procyclical Behavior of Institutional Investors During the Recent Financial Crisis: Causes, Impacts, and Challenges. IMF Working Papers 13/193, International Monetary Fund.
Persaud, A. (2015). How Not to Regulate Insurance Markets: The Risks and Danger of Solvency II. Policy Brief No. 5, Peterson Institute for International Economics.
Peskin, M. (1997). Asset Allocation and Funding Policy for Corporate-Sponsored Defined-Benefit Pension Plans. Journal of Portfolio Management, 23(2): 66-73.
Powell (2017). What it means to be Mutual.
Rudschuck, N., T. Basse, A. Kapeller and T. Windels (2010). Solvency II and the investment policy of life insurers: Some homework to do for the sales and marketing departments. Interdisciplinary Studies Journal, 1(1), 57.
Samuelson, P. (1969). Lifetime Portfolio Selection by Dynamic Programming. Review of Economics and Statistics, 51, pp. 239–246.
Schlütter (2017). Scenario-based Capital Requirements for the Interest Rate Risk of Insurance Companies. ICIR Working Paper Series. No. 28/2017.
Sellhorn, T. (2004). Goodwill impairment: An empirical investigation of write-offs under SFAS 142. Berlin: Peter Lang International Academic Publishers.
Severinson, C. and J. Yermo (2012). The Effect of Solvency Regulations and Accounting Standards on Long-Term Investing: Implications for Insurers and Pension Funds. OECD Working Papers on Finance, Insurance and Private Pensions, No. 30, OECD Publishing, Paris.
Smith C. and R. Stulz (1985). The determinants of firms’ hedging policies. Journal of Financial and Quantitative Analysis, 20(4): 391-405.
Spinu, F. (2015). Buy-and-hold versus constantly rebalanced portfolios: A theoretical comparison. Journal of Asset Management, 16(2): 79-84.
Stowe, J. (1978). Life insurance company portfolio behaviour. Journal of Risk and Insurance, 45(3): 431-447.
Swiss Re (2008). Global Insurance Review 2008 and Outlook 2009: Weathering the Storm. Swiss Reinsurance Company Special Report, December.
Swiss Re (2010). The impact of inflation on insurers.
Tepper, I. (1981). Taxation and corporate pension policy. Journal of Finance, 36(1): 1-13.
van Binsbergen, J. and M. Brandt (2007). Optimal asset allocation in asset liability management. Working paper 12970. NBER working papers series.
Van Bragt, D., H. Steehouwer and B. Waalwijk (2010). Market Consistent ALM for Life Insurers—Steps toward Solvency II. The Geneva Papers on Risk and Insurance - Issues and Practice, 35(1), 92-10.
Van Vliet, A. and A. Brown (n.d.). The Investment Implications of Solvency II, Ortec Finance.
Van Vliet, P. (2012.). Low-volatility investing: a long-term perspective, Robecco Finance.
Verboon, L. (2012). Hedging against Inflation with Different Asset Classes: the Dutch Case. Master Thesis, Erasmus University Rotterdam.
World Economic Forum & Oliver Wyman (2011). The future of long-term investing. Retrieved from http://www3.weforum.org/docs/WEF_FutureLongTermInvesting _Report_2011.pdf.

European Commission - Study on the drivers of investments in equity by insurers and pension funds
December 2019 I 207
Yermo, J. and C. Severinson (2010). The Impact of the Financial Crisis on Defined Benefit Plans and the Need for Counter-Cyclical Funding Regulations. OECD Working Papers on Finance, Insurance and Private Pensions, No. 3, OECD Publishing, Paris.

European Commission - Study on the drivers of investments in equity by insurers and pension funds
December 2019 I 208
Annex 1 Econometric model – insurance companies The aim of this Annex is to provide the descriptions, sources, and transformations of the data series used in the quantitative analyses for the insurers. The quantitative analysis of the equity investments by insurance corporations uses the equity investments data available on the ECB QSA dataset. Three main equity investment categories are used from the ECB dataset, namely, listed equity, unlisted
equity, and total equity. These categories are the dependent variables (i.e. variables of interest) in the regression models. Four additional dependent variables are created based on these categories. Descriptions of all dependent variables used in the analyses are given in the upper panel of Table 4. For each dependent variable, potential drivers are analysed through a base model, driver category specific models, and a full model that contains all of the discussed
drivers. Therefore, we are able to compare the regression results in several dimensions. First, we compare the results from the driver specific model and the full model to see whether the results are robust to model specification. Second, we compare the results within equity types. Third, we check the robustness of the results across equity types. In the comparisons, we first check whether the statistical significance of a coefficient estimate is robust. The statistically significant result that is robust to model specification and robust within and across equity types is considered the strongest result. Then, we are interested statistically significant results within equity types. Such a case is still at the highest level of interest because the differences can sometimes be explained by the differences of the equity types, for instance stock markets returns can be statistically
significant driver for the listed shares but not for unlisted shares. On the other hand, we are also interested in coefficient estimates that are consistently have the same sign but not statistically significant. Such results give insights on the direction of the relation between equity investments and drivers. Furthermore, in some cases, the lack of statistical significance can be related to the lack of historical data or lack of an optimal proxy for a variable. Based on the driver categorisation in the study, data related to the drivers are collected from several data sources including EIOPA, ECB, Eurostat, Federal Reserve Economic Data, Bloomberg, Yahoo Finance, and Federation of European Securities Exchanges (FESE). Descriptions of the data series used in the creation of the independent variables (i.e. explanatory variables) are given in the lower panel of Table 4.
Some of the data series, for instance share of life business, are transformed to quarterly data using yearly data. For these transformations, we use linear interpolation. In addition to these variables, dummy variables for the application of Solvency II, adoption of Solvency II regulations, introduction of IFRS, Global Financial Crisis, and tax regulations are used in the models. The dates and details regarding these dummies are given in the study.

European Commission - Study on the drivers of investments in equity by insurers and pension funds
December 2019 I 209
Table 4 – Data series used in the analyses, data description and sources
Data Series Description Source
Dependent
Variables
Listed Equity
(amount)
Amount (EUR) invested in listed equity ECB QSA
Adjusted Listed
Equity (amount)
Amount (EUR)invested in listed equity adjusted by weighted equity index ECB QSA, Yahoo
Finance
Listed Equity (%
investments)
Ratio of listed equity to total investments ECB QSA
Unlisted equity
(amount)
Amount (EUR) invested in unlisted equity ECB QSA
Unlisted Equity (%
investments)
Ratio of unlisted equity to total investments ECB QSA
Total Equity
(amount)
Amount (EUR) invested in total equity ECB QSA
Total Equity (%
investments)
Ratio of total equity to total investments ECB QSA
Independent
Variables
GDP Seasonally and calendar adjusted GDP data Eurostat, Federal
Reserve Economic
Data
Inflation Rate Percentage change in Harmonised Index of Consumer Prices (HICP) Eurostat
Interest Rate (long-
term)
EU 10-year Government Bond Index Bloomberg
Policy Rate ECB marginal lending facility ECB
STOXX50E STOXX50E stock market index Yahoo Finance
VIX VIX volatility index Federal Reserve
Economic Data
ECB Asset
Purchases
Assets purchase of the ECB ECB
Market Capitalisation
Ratio of market capitalisation to domestic GDP FESE, Eurostat, Federal Reserve
Economic Data
Solvency ratio Solvency I and Solvency II, Solvency ratio of insurance corporations EIOPA
Insurance Market
Development
Ratio of total investments of insurance corporations to domestic GDP ECB QSA,
Eurostat, Federal
Reserve Economic Data
Non-life business
share
Ratio of non-life insurance corporations to the total domestic insurance market
(quarterly data is created by linear interpolation of the yearly data)
EIOPA
Rescaled
Concentration of
Life Business
Ratio of assets of 5 largest life insurance corporations to the total life insurance
market (quarterly data is created by linear interpolation of yearly data,
concentration ratios are scaled by the share of life business in a country)
EIOPA
Rescaled
Concentration of
Non-Life Business
Ratio of assets of 5 largest non-life insurance corporations to the total non-life
insurance market (quarterly data is created by linear interpolation of yearly data,
concentration ratios are scaled by the share of non-life business in a country)
EIOPA
Tax on capital to
GDP ratio
Ratio of government revenue by tax on capital to domestic GDP ECB

European Commission - Study on the drivers of investments in equity by insurers and pension funds
December 2019 I 210
In the regressions for the prudential framework, we have the following model specifications: 1. Model with Solvency ratio 2. Models with Solvency II Application dummy
2.a. Model with Solvency II Application dummy 2.b. Model with Solvency II Application, Solvency ratio and the interaction of
Application dummy with Solvency ratio 2.c. Model with Solvency II Application dummy, Solvency ratio and the interaction
of Application dummy with Solvency ratio, and all other drivers (i.e. the full model)
3. Models Solvency II Adoption dummy 3.a. Model with Solvency II Adoption dummy 3.b. Model with Solvency II Adoption dummy, Solvency ratio and the interaction of
Adoption dummy with Solvency ratio 3.c. Model with Solvency II Adoption dummy, Solvency ratio and the interaction of
Adoption dummy with Solvency ratio, and all other drivers (i.e. the full model) Models with only Solvency II application and adoption dummies (i.e. models 2.a. and 3.a.) aim to capture the change on equity investments after the Solvency II adoption and application dates respectively. On the other hand, models with the interaction dummies (i.e. 2.b. and 3.b.) aim to quantify the impact of, if there is any, the application (or adoption) of Solvency II via Solvency ratio. The full models (i.e. 2.c. and 3.c.) are used for robustness checks. Before the analysis, in order to avoid possible impact of outliers in the data series, the series are winsorised at 1% level. Then, the variables that take only positive values, for instance the dependent variables in the study and GDP, are transformed using natural logarithm.
A possible concern in the analysis was the non-stationarity of the series. After the transformations, each series is checked for panel stationarity using the Dickey-Fuller panel stationarity test. Based on the test results, first differences (i.e. percentage change from previous period) of ECB asset purchases, non-life business share, rescaled life business concentration ratio, and rescaled non-life business ratio have been used in the regressions. In the tables that provide the regression results below, these variables are denoted by ‘D.’ at the beginning of their names. ‘D.’ indicates the first difference transformation on these series. Following the modelling cycle that is described on the study and heteroscedasticity tests, in most of the regressions a Fixed-Effects model with robust standard errors is used. Table 11 report the regression results for each dependent variable. These tables include
information on the estimated coefficients, t-statistics of the coefficients, statistical significance level of the coefficients, explanatory power of the model, number of Member States and number of observations included in each regression. The explanatory power of the Fixed-Effects model, also known as the within-effects model, are given in the row denoted by ‘R2-within’. Other R2 data are reported for comparison purposes.

European Commission - Study on the drivers of investments in equity by insurers and pension funds
December 2019 I 211
Table 5 – Regression results, amount invested in listed equity
Driver Category Listed Equity
(amount)
Base Model - Fixed Effects
Market
Conditions Model - Fixed
Effects
Solvency
ratio Model - Fixed Effects
Solvency ratio Model
with Solvency II Application
Dummy -
Fixed Effects
Solvency ratio Model
with Solvency II Application Interaction -
Fixed Effects
Solvency ratio Model
with
Solvency II Adoption Dummy -
Fixed Effects
Solvency ratio Model
with Solvency II Adoption
Interaction -
Fixed Effects
Market
Development Model - Fixed
Effects
Non-Life Business
Share Model - Fixed
Effects
Business
Concentration Model - Fixed
Effects
IFRS
Framework Model - Fixed
Effects
Tax Regime Model -
Fixed Effects
Tax Regime
Model - Random Effects
Full Model with
Solvency II Introduction - Fixed Effects
Full Model
with Solvency II Regulation -
Fixed Effects
Full Model
with IFRS - Fixed
Effects
Base Model
(Macroeconomic fundamentals,
bond yields, and
market returns)
Real GDP 1,43** 1,62** 1,48** 1,42** 1,40** 1,42** 1,48** 1,22** 1,47* 1,52** 1,62** 1,61** 1,43*** 1,46** 1,69*** 1,75***
(2,30) (2,13) (2,48) (2,19) (2,28) (2,26) (2,37) (2,12) (2,00) (2,11) (2,56) (2,68) (4,20) (2,46) (2,89) (3,38)
Inflation Rate 0,075* 0,091** 0,055 0,076** 0,057 0,078* 0,044 0,14*** 0,059 0,058 0,057 0,078** 0,074** 0,075** 0,078*** 0,11***
(2,01) (2,16) (1,52) (2,07) (1,47) (1,95) (1,05) (3,34) (1,24) (1,21) (1,58) (2,35) (2,21) (2,74) (2,97) (4,28)
Real Interest Rate
0,082** 0,10** 0,042 0,083** 0,045 0,085* 0,031 0,14*** 0,048 0,048 0,067* 0,098*** 0,082** 0,081*** 0,084*** 0,13***
(2,11) (2,35) (1,38) (2,18) (1,45) (1,89) (0,91) (3,25) (1,27) (1,23) (2,03) (2,84) (2,25) (3,05) (3,25) (4,65)
Policy Rate 0,037 0,041 0,055* 0,038 0,056* 0,038 0,055* 0,063*** -0,014 -0,013 0,060** 0,037 0,038 0,062* 0,062* 0,10***
(1,38) (1,21) (2,01) (1,35) (2,04) (1,34) (2,01) (2,82) (-0,29) (-0,27) (2,27) (1,55) (1,56) (1,87) (1,82) (3,89)
STOXX50E 0,56*** 0,25 0,62*** 0,55*** 0,60*** 0,55*** 0,66*** 0,51*** 0,63*** 0,63*** 0,42*** 0,59*** 0,56*** 0,50*** 0,44*** 0,12
(4,62) (1,22) (3,54) (4,65) (3,19) (5,85) (4,06) (4,58) (3,30) (3,37) (3,04) (5,62) (4,68) (3,40) (3,74) (0,74)
Financial Variables
VIX -0,079 -0,043 -0,082 -0,12
(-0,70) (-0,62) (-1,28) (-1,35)
D.ECB Asset
Purchases
-0,13 -0,0081 -0,018 0,098
(-0,97) (-0,11) (-0,28) (1,07)
Market
Capitalisation
0,11 0,049 0,056 0,20
(0,69) (0,49) (0,58) (1,48)
Prudential Framework
Solvency ratio 0,16 0,15 0,13 0,13 0,15
(1,33) (1,14) (0,98) (0,90) (0,97)
Solvency II - Dummy
0,017 0,011 0,066
(0,21) (0,12) (0,67)
Solvency ratio - Solvency II
Interaction
0,17 0,19
(0,70) (0,69)
Solvency II - Regulation
Dummy
0,015 -0,060 0,042
(0,15) (-0,55) (0,56)
Solvency ratio - Solvency II
0,052 -0,023

European Commission - Study on the drivers of investments in equity by insurers and pension funds
December 2019 I 212
Driver Category Listed Equity
(amount)
Base Model
- Fixed Effects
Market
Conditions Model - Fixed
Effects
Solvency
ratio Model - Fixed Effects
Solvency ratio Model
with Solvency II Application
Dummy -
Fixed Effects
Solvency ratio Model
with Solvency II Application Interaction -
Fixed Effects
Solvency
ratio Model with
Solvency II Adoption Dummy -
Fixed Effects
Solvency ratio Model
with Solvency II Adoption
Interaction -
Fixed Effects
Market
Development Model - Fixed
Effects
Non-Life Business
Share Model - Fixed
Effects
Business
Concentration Model - Fixed
Effects
IFRS
Framework Model - Fixed
Effects
Tax Regime
Model - Fixed Effects
Tax Regime
Model - Random Effects
Full Model with
Solvency II Introduction - Fixed Effects
Full Model with
Solvency II Regulation - Fixed Effects
Full Model
with IFRS - Fixed
Effects
Regulation Interaction
(0,43) (-0,15)
Undertaking Characteristics
Insurance Market
Development
0,96*** 1,00** 0,96** 1,26***
(4,42) (2,87) (2,66) (4,02)
D. Non-Life Business
Share
1,08** 0,50 0,22
(2,25) (0,96) (0,48)
D. Rescaled
Concentration Ratio of Life Business
-0,032 -0,0082 -0,033
(-0,50) (-0,19) (-0,69)
D. Rescaled Concentration Ratio of Non-
Life Business
0,58*** 0,38* 0,43**
(3,24) (1,94) (2,64)
Accounting Framework
IFRS -0,074 -0,26**
(-0,61) (-2,26)
Global
Financial Crisis
-0,24*** -
0,086**
(-4,47) (-2,74)
Tax Regime Tax on Capital to
GDP Ratio
0,059 0,043** 0,043** 0,060
(1,28) (2,51) (2,45) (1,34)
Capital Gains Exemption
1,21
(1,13)
Capital Loses Exemption
1,51
(1,28)
Dividends Exemption
-0,014
(-0,01)
Constant -12,3* -12,0 -13,3** -12,1* -12,4* -12,2* -13,6** -9,90 -12,8* -13,3* -13,1* -14,5** -14,3***
-12,2** -14,1** -12,9**
(-1,95) (-1,49) (-2,36) (-1,81) (-2,05) (-1,86) (-2,21) (-1,67) (-1,81) (-1,88) (-2,02) (-2,40) (-3,50) (-2,23) (-2,39) (-2,19)

European Commission - Study on the drivers of investments in equity by insurers and pension funds
December 2019 I 213
Driver Category Listed Equity
(amount)
Base Model
- Fixed Effects
Market
Conditions Model - Fixed
Effects
Solvency
ratio Model - Fixed Effects
Solvency ratio Model
with Solvency II Application
Dummy -
Fixed Effects
Solvency ratio Model
with Solvency II Application Interaction -
Fixed Effects
Solvency
ratio Model with
Solvency II Adoption Dummy -
Fixed Effects
Solvency ratio Model
with Solvency II Adoption
Interaction -
Fixed Effects
Market
Development Model - Fixed
Effects
Non-Life Business
Share Model - Fixed
Effects
Business
Concentration Model - Fixed
Effects
IFRS
Framework Model - Fixed
Effects
Tax Regime
Model - Fixed Effects
Tax Regime
Model - Random Effects
Full Model with
Solvency II Introduction - Fixed Effects
Full Model with
Solvency II Regulation - Fixed Effects
Full Model
with IFRS - Fixed
Effects
Model Details Number of Observations
1608 1205 1239 1608 1239 1608 1239 1608 841 831 1608 1405 1608 604 604 1103
R2-between 0,623 0,592 0,604 0,623 0,605 0,623 0,604 0,848 0,609 0,608 0,623 0,619 0,672 0,832 0,801 0,896
R2-within 0,234 0,254 0,272 0,234 0,275 0,234 0,273 0,336 0,214 0,212 0,250 0,329 0,234 0,566 0,558 0,557
R2-overall 0,622 0,579 0,600 0,622 0,601 0,622 0,600 0,857 0,592 0,587 0,623 0,597 0,657 0,832 0,797 0,847
Number of Countries
27 23 27 27 27 27 27 27 26 26 27 24 27 19 19 21
t statistics in parentheses
* p<0,10 **
p<0,05 ***p<0,01

European Commission - Study on the drivers of investments in equity by insurers and pension funds
December 2019 I 214
Table 6 – Regression results, adjusted amount invested in listed equity
Driver Category
Adjusted Listed
Equity (amount)
Base Model -
Fixed Effects
Market Condit-ions
Model - Fixed Effects
Solvency ratio Model
- Fixed Effects
Solvency ratio Model with Solvency II
Application Dummy - Fixed
Effects
Solvency ratio Model with Solvency II
Application Interaction - Fixed Effects
Solvency ratio Model with Solvency II
Adoption Dummy - Fixed
Effects
Solvency ratio Model with Solvency II
Adoption Interaction - Fixed Effects
Market Develop-
ment Model - Fixed Effects
Non-Life Business
Share
Model- Fixed
Effects
Business Concentr-
ation Model- Fixed Effects
IFRS Framework
Model - Fixed Effects
Tax Regime Model -
Fixed Effects
Tax Regime Model -
Random Effects
Full Model with Solvency
II Introduction - Fixed Effects
Full Model with Solvency
II Regulation - Fixed Effects
Full Model
with IFRS - Fixed Effects
Base Model (Macroecono
mic
fundamentals, bond
yields, and market
returns)
Real GDP 1,24** 1,47* 1,23** 1,24* 1,16* 1,22* 1,17* 1,07* 1,39** 1,45** 1,47** 1,37** 1,33*** 1,31* 1,49** 1,62***
(2,06) (2,06) (2,19) (1,98) (2,03) (1,99) (2,01) (1,86) (2,09) (2,23) (2,40) (2,29) (4,08) (2,10) (2,45) (2,96)
Inflation
Rate
0,16*** 0,17*** 0,14**
*
0,16*** 0,13*** 0,17*** 0,13** 0,21*** 0,14** 0,14** 0,13*** 0,16*** 0,16*** 0,13*** 0,13*** 0,17***
(4,00) (3,86) (3,21) (4,01) (2,90) (3,95) (2,68) (4,68) (2,46) (2,38) (3,25) (4,61) (4,44) (4,35) (4,88) (5,99)
Real
Interest Rate
0,16*** 0,18*** 0,12**
*
0,16*** 0,12*** 0,18*** 0,12*** 0,21*** 0,12**
*
0,12** 0,14*** 0,18*** 0,17*** 0,13*** 0,14*** 0,19***
(4,20) (4,15) (3,95) (4,23) (3,62) (3,71) (3,10) (4,88) (2,88) (2,77) (4,18) (5,04) (4,58) (4,60) (5,07) (6,13)
Policy Rate 0,054** 0,049 0,062**
0,054** 0,064** 0,055** 0,063** 0,075*** 0,0071 0,0082 0,077*** 0,048** 0,052** 0,058* 0,059* 0,10***
(2,18) (1,72) (2,52) (2,12) (2,56) (2,15) (2,56) (3,48) (0,17) (0,21) (3,17) (2,15) (2,42) (1,85) (1,80) (3,99)
STOXX50E -0,42*** -0,65*** -0,42** -0,42*** -0,43** -0,47*** -0,42** -0,46*** -0,37* -0,37* -0,53*** -0,37*** -0,43*** -0,35** -0,42*** -0,78***
(-3,16) (-3,09) (-2,35) (-3,18) (-2,10) (-4,48) (-2,21) (-3,64) (-1,90) (-1,94) (-3,55) (-3,58) (-3,23) (-2,34) (-3,49) (-4,74)
Financial Variables
VIX -0,0093 0,024 -0,0090 -0,047
(-0,08) (0,39) (-0,16) (-0,51)
D.ECB Asset Purchases
-0,031 0,063 0,048 0,16*
(-0,24) (0,84) (0,78) (1,73)
Market Capitalisat-
ion
0,11 0,057 0,063 0,23
(0,73) (0,54) (0,62) (1,59)
Prudential Framework
Solvency ratio
0,14 0,12 0,082 0,13 0,16
(1,06) (0,82) (0,54) (1,04) (1,10)
Solvency II - Dummy
0,0013 -0,025 0,031
(0,02) (-0,26) (0,35)
Solvency ratio -
Solvency II Interaction
0,21 0,19
(0,90) (0,74)

European Commission - Study on the drivers of investments in equity by insurers and pension funds
December 2019 I 215
Driver Category Adjusted Listed
Equity
(amount)
Base Model -
Fixed Effects
Market Condit-ions
Model - Fixed Effects
Solvency ratio Model
- Fixed Effects
Solvency ratio
Model with Solvency II
Application Dummy - Fixed
Effects
Solvency ratio
Model with Solvency II
Application Interaction - Fixed Effects
Solvency ratio
Model with Solvency II
Adoption Dummy - Fixed
Effects
Solvency ratio
Model with Solvency II
Adoption Interaction - Fixed Effects
Market Develop-
ment Model - Fixed Effects
Non-Life
Business Share
Model- Fixed
Effects
Business Concentr-
ation Model- Fixed Effects
IFRS Framework
Model - Fixed Effects
Tax Regime Model -
Fixed Effects
Tax Regime Model -
Random Effects
Full Model with Solvency
II
Introduction - Fixed Effects
Full Model with Solvency
II Regulation - Fixed Effects
Full Model with IFRS -
Fixed Effects
Solvency II
- Regulation Dummy
0,067 -0,054 0,038
(0,61) (-0,45) (0,51)
Solvency ratio -
Solvency II Regulation Interaction
0,15 -0,0035
(1,04) (-0,02)
Undertaking
Characteris-tics
Insurance Market Develop-
ment
0,82*** 0,78** 0,75** 1,05***
(3,57) (2,62) (2,44) (3,54)
D. Non-Life
Business Share
1,04** 0,53 0,30
(2,30) (0,96) (0,65)
D .Rescaled Concentra-tion Ratio of
Life Business
-0,0017 0,019 0,00061
(-0,03) (0,41) (0,01)
D. Rescaled Concentra-
tion Ratio of Non-Life Business
0,52*** 0,38* 0,43**
(3,00) (1,92) (2,55)
Accounting Framework
IFRS -0,14 -0,28**
(-1,08) (-2,28)
Global
Financial Crisis
-0,20*** -0,11***
(-4,04) (-3,45)
Tax Regime
Tax on
Capital to GDP Ratio
0,056 0,042** 0,043** 0,062
(1,27) (2,54) (2,48) (1,35)

European Commission - Study on the drivers of investments in equity by insurers and pension funds
December 2019 I 216
Driver Category Adjusted Listed
Equity
(amount)
Base Model -
Fixed Effects
Market Condit-ions
Model - Fixed Effects
Solvency ratio Model
- Fixed Effects
Solvency ratio
Model with Solvency II
Application Dummy - Fixed
Effects
Solvency ratio
Model with Solvency II
Application Interaction - Fixed Effects
Solvency ratio
Model with Solvency II
Adoption Dummy - Fixed
Effects
Solvency ratio
Model with Solvency II
Adoption Interaction - Fixed Effects
Market Develop-
ment Model - Fixed Effects
Non-Life
Business Share
Model- Fixed
Effects
Business Concentr-
ation Model- Fixed Effects
IFRS Framework
Model - Fixed Effects
Tax Regime Model -
Fixed Effects
Tax Regime Model -
Random Effects
Full Model with Solvency
II
Introduction - Fixed Effects
Full Model with Solvency
II Regulation - Fixed Effects
Full Model with IFRS -
Fixed Effects
Capital Gains
Exemption
1,35
(1,28)
Capital
Loses Exemption
1,67
(1,29)
Dividends Exemption
-0,056
(-0,05)
Constant -2,96 -3,76 -2,85 -2,95 -2,14 -2,39 -2,22 -0,96 -4,31 -4,95 -4,28 -4,70 -5,98 -4,40 -5,66 -4,89
(-0,48) (-0,49) (-0,53) (-0,45) (-0,37) (-0,37) (-0,38) (-0,16) (-0,67) (-0,77) (-0,67) (-0,77) (-1,48) (-0,74) (-0,90) (-0,78)
Model Details
Number of
Observat-ions
1608 1204 1239 1608 1239 1608 1239 1608 841 831 1608 1405 1608 603 603 1102
R2-between 0,634 0,613 0,614 0,634 0,615 0,634 0,614 0,847 0,614 0,611 0,633 0,623 0,686 0,812 0,785 0,891
R2-within 0,276 0,329 0,264 0,276 0,268 0,277 0,270 0,341 0,210 0,196 0,293 0,358 0,276 0,447 0,440 0,546
R2-overall 0,628 0,597 0,606 0,628 0,607 0,628 0,605 0,852 0,605 0,598 0,629 0,603 0,664 0,824 0,794 0,842
Number of
Countries
27 23 27 27 27 27 27 27 26 26 27 24 27 19 19 21
t statistics in
parentheses
* p<0,10 **
p<0,05 ***p<0,01

European Commission - Study on the drivers of investments in equity by insurers and pension funds
December 2019 I 217
Table 7 – Regression results, ratio of listed equity to total investments
Driver Category Listed Equity
(%
investments)
Base Model -
Fixed Effects
Market Condit-
ions
Model - Fixed
Effects
Solvency ratio
Model -
Fixed Effects
Solvency ratio
Model with
Solvency
II Applica-tion
Dummy -
Fixed Effects
Solvency ratio
Model
with Solvency
II Applica-
tion Interac-
tion - Fixed
Effects
Solvency ratio
Model with
Solvency
II Adoption Dummy -
Fixed Effects
Solvency ratio
Model
with Solvency
II
Adoption Interac-
tion - Fixed
Effects
Market Develop-
ment
Model - Fixed
Effects
Non-Life Business
Share
Model- Fixed
Effects
Busi-ness Concentra
tion
Model- Fixed
Effects
IFRS Frame-
work
Model - Fixed
Effects
Tax Regi-me Model
- Fixed Effects
Tax Regi-me Model
- Random Effects
Full Model
with Solven-cy
II
Introduc-tion - Fixed
Effects
Full Model
with Solvency
II Regula-
tion - Fixed
Effects
Full Model with IFRS
- Fixed Effects
Base Model (Macroeconomic
fundamentals, bond yields, and
market returns)
Real GDP 0,073 0,20 0,32 0,0043 0,26 0,00015 0,28 0,11 0,12 0,17 0,48 0,26 0,11 0,41 0,62 0,75
(0,13) (0,33) (0,78) (0,01) (0,64) (0,00) (0,67) (0,18) (0,27) (0,37) (0,85) (0,49) (0,49) (0,72) (1,11) (1,48)
Inflation Rate 0,18*** 0,20*** 0,11*** 0,19*** 0,11*** 0,24*** 0,12** 0,17*** 0,11** 0,10** 0,12*** 0,20*** 0,19*** 0,092*** 0,100*** 0,13***
(4,25) (4,75) (3,07) (4,47) (2,96) (5,06) (2,71) (3,98) (2,50) (2,39) (3,36) (5,08) (5,17) (3,27) (3,70) (5,06)
Real Interest
Rate 0,19*** 0,21*** 0,10*** 0,20*** 0,11*** 0,24*** 0,11*** 0,18*** 0,100** 0,099** 0,13*** 0,22*** 0,19*** 0,10*** 0,11*** 0,16***
(4,25) (4,92) (3,35) (4,60) (3,45) (4,83) (3,07) (3,99) (2,75) (2,64) (3,71) (5,56) (5,17) (3,77) (4,18) (5,60)
Policy Rate 0,072*** 0,070** 0,10*** 0,075*** 0,11*** 0,078*** 0,10*** 0,068*** 0,045 0,046 0,11*** 0,064*** 0,071*** 0,068* 0,070* 0,11***
(3,25) (2,67) (4,98) (3,22) (4,99) (3,36) (5,01) (3,02) (1,26) (1,34) (5,01) (3,63) (3,67) (2,07) (2,02) (4,34)
STOXX50E 0,56*** 0,12 0,67*** 0,51*** 0,66*** 0,36*** 0,66*** 0,57*** 0,66*** 0,66*** 0,44*** 0,57*** 0,55*** 0,56*** 0,48*** 0,18
(5,07) (0,66) (4,20) (4,52) (3,74) (3,44) (3,78) (4,90) (3,86) (3,87) (3,63) (6,20) (5,08) (3,77) (3,93) (1,13)
Financial Variables
VIX -0,16 -0,034 -0,076 -0,11
(-1,68) (-0,51) (-1,19) (-1,25)
D.ECB Asset Purchases 0,13 0,041 0,024 0,16*
(1,04) (0,55) (0,38) (1,73)
Market
Capitalisation 0,18 0,054 0,060 0,20
(1,20) (0,52) (0,61) (1,45)
Prudential Framework
Solvency ratio 0,028 0,0097 0,0030 0,12 0,15
(0,26) (0,08) (0,02) (0,85) (0,93)
Solvency II -
Dummy 0,13 -0,018 0,061
(1,65) (-0,17) (0,64)

European Commission - Study on the drivers of investments in equity by insurers and pension funds
December 2019 I 218
Driver Category Listed Equity
(%
investments)
Base Model -
Fixed
Effects
Market
Condit-ions
Model -
Fixed Effects
Solvency ratio
Model -
Fixed Effects
Solvency ratio
Model
with Solvency
II Applica-
tion Dummy -
Fixed Effects
Solvency
ratio Model
with Solvency
II Applica-
tion Interac-
tion -
Fixed Effects
Solvency ratio
Model
with Solvency
II
Adoption Dummy -
Fixed Effects
Solvency
ratio Model
with Solvency
II
Adoption Interac-
tion -
Fixed Effects
Market
Develop-ment
Model -
Fixed Effects
Non-Life
Business Share
Model-
Fixed Effects
Busi-ness
Concentration
Model-
Fixed Effects
IFRS
Frame-work
Model -
Fixed Effects
Tax Regi-me Model
- Fixed
Effects
Tax Regi-me Model - Random
Effects
Full Model with
Solven-cy II
Introduc-
tion - Fixed
Effects
Full Model
with Solvency
II Regula-
tion - Fixed
Effects
Full Model with IFRS
- Fixed
Effects
Solvency ratio - Solvency II
Interaction 0,18 0,18
(0,77) (0,66)
Solvency II -
Regulation Dummy 0,26** -0,0083 0,055
(2,72) (-0,07) (0,73)
Solvency ratio - Solvency II
Regulation Interaction 0,067 -0,021
(0,50) (-0,14)
Undertaking
Characteristics
Insurance Market Development -0,16 -0,038 -0,066 0,21
(-0,72) (-0,11) (-0,19) (0,72)
D. Non-Life
Business Share 0,99** 0,54 0,27
(2,37) (1,02) (0,62)
D. Rescaled Concentration
Ratio of Life Business -0,047 -0,010 -0,033
(-0,88) (-0,24) (-0,73)
D. Rescaled Concentration
Ratio of Non-Life Business 0,47*** 0,38* 0,42**
(3,02) (1,99) (2,70)
Accounting Framework
IFRS -0,35*** -0,36***
(-3,48) (-3,31)
Global
Financial Crisis -0,23*** -0,12***

European Commission - Study on the drivers of investments in equity by insurers and pension funds
December 2019 I 219
Driver Category Listed Equity
(%
investments)
Base Model -
Fixed
Effects
Market
Condit-ions
Model -
Fixed Effects
Solvency ratio
Model -
Fixed Effects
Solvency ratio
Model
with Solvency
II Applica-
tion Dummy -
Fixed Effects
Solvency
ratio Model
with Solvency
II Applica-
tion Interac-
tion -
Fixed Effects
Solvency ratio
Model
with Solvency
II
Adoption Dummy -
Fixed Effects
Solvency
ratio Model
with Solvency
II
Adoption Interac-
tion -
Fixed Effects
Market
Develop-ment
Model -
Fixed Effects
Non-Life
Business Share
Model-
Fixed Effects
Busi-ness
Concentration
Model-
Fixed Effects
IFRS
Frame-work
Model -
Fixed Effects
Tax Regi-me Model
- Fixed
Effects
Tax Regi-me Model - Random
Effects
Full Model with
Solven-cy II
Introduc-
tion - Fixed
Effects
Full Model
with Solvency
II Regula-
tion - Fixed
Effects
Full Model with IFRS
- Fixed
Effects
(-3,88) (-3,81)
Tax Regime
Tax on Capital to GDP Ratio 0,048 0,043** 0,043** 0,064
(1,06) (2,55) (2,48) (1,40)
Capital Gains Exemption 0,80
(0,91)
Capital Loses Exemption 0,90
(1,15)
Dividends
Exemption -0,32
(-0,36)
Constant -9,28 -7,48 -12,7*** -8,20 -12,0*** -7,11 -12,1*** -9,67 -10,2** -10,6** -12,2** -11,4** -10,7*** -12,7** -14,2** -13,8**
(-1,61) (-1,16) (-3,27) (-1,32) (-2,95) (-1,19) (-2,94) (-1,62) (-2,35) (-2,35) (-2,08) (-2,12) (-3,66) (-2,40) (-2,50) (-2,39)
Model Details
Number of Observations 1608 1205 1239 1608 1239 1608 1239 1608 841 831 1608 1405 1608 604 604 1103
R2-between 0,132 0,163 0,066 0,112 0,070 0,103 0,067 0,005 0,101 0,076 0,095 0,032 0,201 0,041 0,065 0,001
R2-within 0,499 0,518 0,476 0,501 0,478 0,507 0,477 0,501 0,394 0,382 0,543 0,588 0,499 0,572 0,565 0,664
R2-overall 0,178 0,130 0,093 0,160 0,102 0,160 0,098 0,053 0,074 0,052 0,131 0,161 0,208 0,011 0,038 0,007
Number of
Countries 27 23 27 27 27 27 27 27 26 26 27 24 27 19 19 21
t statistics in
parentheses
* p<0,10 **
p<0,05 ***p<0,01

European Commission - Study on the drivers of investments in equity by insurers and pension funds
December 2019 I 220
Table 8 – Regression results, amount invested in unlisted equity
Driver Category
Unlisted Equity (amount)
Base Model -
Fixed
Effects
Market
Condit-ions
Model -
Fixed Effects
Solvency ratio
Model -
Fixed Effects
Solvency ratio Model
with Solvency II Application
Dummy - Fixed
Effects
Solvency ratio Model
with Solvency II Application
Interaction - Fixed
Effects
Solvency ratio
Model
with Solvency
II
Adoption Dummy -
Fixed Effects
Solvency ratio Model
with Solvency II
Adoption
Interaction - Fixed
Effects
Market
Develop-ment
Model -
Fixed Effects
Non-Life
Business Share
Model-
Fixed Effects
Business
Concent-ration
Model-
Fixed Effects
IFRS
Frame-work
Model -
Fixed Effects
Tax Regime Model -
Fixed Effects
Tax Regime Model -
Random Effects
Full Model
with Solvency
II
Introduc-tion - Fixed
Effects
Full Model
with Solvency II Regulation-
Fixed Effects
Full
Model with
IFRS -
Fixed Effects
Base Model
(Macroecono-mic
fundamen-
tals, bond yields, and
market returns)
Real GDP 2,00*** 1,94*** 1,82*** 2,00*** 1,86*** 2,02*** 1,87*** 1,94*** 1,46** 1,47*** 2,00*** 1,98*** 1,79*** 0,66 0,67 1,76***
(6,35) (5,61) (3,58) (5,96) (3,81) (6,16) (3,57) (5,87) (2,71) (2,80) (5,99) (5,89) (9,75) (1,21) (1,44) (4,02)
Inflation Rate 0,024 -0,037 0,028 0,024 0,030 0,0093 0,011 0,050 0,0038 0,0067 0,026 0,033 0,012 0,019 0,013 -
0,00024
(0,59) (-1,04) (0,58) (0,61) (0,74) (0,19) (0,20) (1,47) (0,10) (0,17) (0,61) (0,74) (0,32) (0,49) (0,26) (-0,01)
Real Interest
Rate -0,011 -0,073** -0,0068 -0,011 -0,0040 -0,025 -0,023 0,012 -0,014 -0,011 -0,0083 -0,0078 -0,023 0,0022 -0,0020 -0,034
(-0,31) (-2,19) (-0,14) (-0,31) (-0,09) (-0,55) (-0,38) (0,36) (-0,39) (-0,28) (-0,21) (-0,19) (-0,69) (0,06) (-0,04) (-0,77)
Policy Rate -0,045 -0,019 -0,054 -0,045 -0,055 -0,046 -0,054 -0,036 -0,035 -0,035 -0,045 -0,045 -0,039 -0,044 -0,045 -0,028
(-1,42) (-0,73) (-1,48) (-1,39) (-1,50) (-1,44) (-1,50) (-1,04) (-1,18) (-1,15) (-1,37) (-1,60) (-1,32) (-1,31) (-1,35) (-1,00)
STOXX50E 0,10 -0,22 0,061 0,10 0,054 0,16 0,12 0,087 -0,13 -0,15 0,096 0,17 0,12 -0,47** -0,44* -0,31
(0,88) (-1,25) (0,34) (0,96) (0,30) (1,63) (0,63) (0,70) (-0,81) (-0,90) (0,66) (1,35) (1,07) (-2,17) (-1,76) (-1,58)
Financial
Variables
VIX 0,0067 -0,0020 0,0071 0,013
(0,07) (-0,03) (0,12) (0,14)
D.ECB Asset Purchases -0,087 -0,036 -0,024 -0,10
(-0,62) (-0,49) (-0,47) (-1,08)
Market Capitalisation 0,27* 0,23 0,24 0,29*
(1,83) (1,02) (1,08) (1,87)
Prudential
Framework
Solvency ratio -0,074 -0,039 -0,064 0,071 0,097
(-0,79) (-0,33) (-0,56) (0,55) (0,79)
Solvency II - Dummy 0,0036 0,055 0,12
(0,03) (0,40) (0,98)
Solvency ratio - Solvency II
Interaction -0,28 -0,24

European Commission - Study on the drivers of investments in equity by insurers and pension funds
December 2019 I 221
Driver Category
Unlisted Equity (amount)
Base Model -
Fixed
Effects
Market
Condit-ions
Model -
Fixed Effects
Solvency
ratio Model -
Fixed
Effects
Solvency ratio Model
with Solvency II Application
Dummy - Fixed
Effects
Solvency ratio Model
with Solvency II Application
Interaction - Fixed
Effects
Solvency
ratio Model
with Solvency
II
Adoption Dummy -
Fixed
Effects
Solvency ratio Model
with Solvency II
Adoption
Interaction - Fixed
Effects
Market
Develop-ment
Model -
Fixed Effects
Non-Life
Business Share
Model-
Fixed Effects
Business
Concent-ration
Model-
Fixed Effects
IFRS
Frame-work
Model -
Fixed Effects
Tax
Regime Model -
Fixed
Effects
Tax
Regime Model -
Random
Effects
Full Model
with
Solvency II
Introduc-
tion - Fixed
Effects
Full Model
with Solvency II Regulation-
Fixed Effects
Full
Model with
IFRS -
Fixed Effects
(-1,30) (-1,36)
Solvency II - Regulation Dummy -0,067 -0,049 0,10
(-0,57) (-0,32) (0,67)
Solvency ratio
- Solvency II Regulation
Interaction -0,040 -0,22
(-0,36) (-1,49)
Undertaking Characteris-
tics
Insurance Market Development 0,38 0,56*** 0,57*** 0,40*
(1,21) (3,73) (3,99) (1,80)
D. Non-Life
Business Share 0,34 0,99** 1,00**
(0,98) (2,19) (2,24)
D .Rescaled Concentration
Ratio of Life Business -0,085 -0,061 -0,068
(-1,27) (-0,60) (-0,67)
D. Rescaled Concentration
Ratio of Non-Life Business 0,13 -0,064 -0,11
(0,51) (-0,25) (-0,39)
Accounting Framework
IFRS 0,019 0,049
(0,19) (0,47)
Global
Financial Crisis -0,014 -0,069
(-0,12) (-0,72)
Tax Regime
Tax on Capital to GDP Ratio -0,0012 0,0077 0,0075 0,040
(-0,03) (0,38) (0,37) (1,48)

European Commission - Study on the drivers of investments in equity by insurers and pension funds
December 2019 I 222
Driver Category
Unlisted Equity (amount)
Base Model -
Fixed
Effects
Market
Condit-ions
Model -
Fixed Effects
Solvency
ratio Model -
Fixed
Effects
Solvency ratio Model
with Solvency II Application
Dummy - Fixed
Effects
Solvency ratio Model
with Solvency II Application
Interaction - Fixed
Effects
Solvency
ratio Model
with Solvency
II
Adoption Dummy -
Fixed
Effects
Solvency ratio Model
with Solvency II
Adoption
Interaction - Fixed
Effects
Market
Develop-ment
Model -
Fixed Effects
Non-Life
Business Share
Model-
Fixed Effects
Business
Concent-ration
Model-
Fixed Effects
IFRS
Frame-work
Model -
Fixed Effects
Tax
Regime Model -
Fixed
Effects
Tax
Regime Model -
Random
Effects
Full Model
with
Solvency II
Introduc-
tion - Fixed
Effects
Full Model
with Solvency II Regulation-
Fixed Effects
Full
Model with
IFRS -
Fixed Effects
Capital Gains Exemption 0,069
(0,13)
Capital Loses
Exemption 0,91**
(2,20)
Dividends Exemption 0,52
(1,09)
Constant -14,0*** -12,0*** -11,7** -14,0*** -12,1** -14,6*** -12,6** -13,3*** -6,36 -6,32 -13,9*** -14,5*** -13,1*** 3,32 2,90 -9,89**
(-4,38) (-2,99) (-2,24) (-4,04) (-2,38) (-4,18) (-2,21) (-3,76) (-1,08) (-1,09) (-4,19) (-4,18) (-6,12) (0,56) (0,55) (-2,14)
Model Details
Number of Observations 1656 1242 1280 1656 1280 1656 1280 1656 864 854 1656 1435 1656 614 614 1122
R2-between 0,806 0,858 0,794 0,806 0,792 0,806 0,793 0,869 0,769 0,770 0,806 0,795 0,821 0,913 0,914 0,914
R2-within 0,221 0,346 0,158 0,221 0,164 0,222 0,159 0,236 0,126 0,122 0,222 0,216 0,221 0,338 0,341 0,382
R2-overall 0,784 0,823 0,770 0,784 0,769 0,784 0,770 0,845 0,783 0,783 0,784 0,769 0,798 0,908 0,908 0,875
Number of
Countries 27 23 27 27 27 27 27 27 27 27 27 25 27 20 20 22
t statistics in
parentheses
* p<0,10 **
p<0,05 ***p<0,01

European Commission - Study on the drivers of investments in equity by insurers and pension funds
December 2019 I 223
Table 9 – Regression results, ratio of unlisted equity to total investments
Driver Category
Unlisted Equity
(%
investments)
Base Model -
Fixed
Effects
Market Conditions
Model -
Fixed Effects
Solvency ratio
Model -
Fixed Effects
Solvency ratio Model
with Solvency II Application
Dummy - Fixed
Effects
Solvency ratio Model
with Solvency II Application
Interaction - Fixed
Effects
Solvency ratio
Model
with Solvency
II
Adoption Dummy -
Fixed Effects
Solvency ratio Model
with Solvency II
Adoption
Interaction - Fixed
Effects
Market
Develop-ment
Model -
Fixed Effects
Non-Life
Business Share
Model-
Fixed Effects
Business
Concentr-ation
Model-
Fixed Effects
IFRS
Frame-work
Model -
Fixed Effects
Tax Regime Model -
Fixed Effects
Tax Regime Model -
Random Effects
Full Model
with Solvency II Introduct-
ion - Fixed Effects
Full Model with
Solvency II
Regulat-
ion - Fixed
Effects
Full
Model with
IFRS -
Fixed Effects
Base Model
(Macroeconomic fundamentals,
bond yields, and market returns)
Real GDP 0,70 0,56 0,73 0,64 0,80 0,65 0,74 0,82** 0,16 0,17 0,89* 0,64 0,38** -0,39 -0,40 0,76
(1,63) (1,09) (1,12) (1,42) (1,26) (1,50) (1,11) (2,40) (0,21) (0,21) (1,87) (1,32) (2,47) (-0,73) (-0,87) (1,64)
Inflation Rate 0,13*** 0,072** 0,085* 0,14*** 0,086** 0,17*** 0,086 0,083** 0,056 0,058 0,094** 0,16*** 0,12*** 0,035 0,035 0,020
(3,00) (2,12) (1,77) (3,21) (2,11) (3,05) (1,45) (2,23) (1,39) (1,35) (2,15) (3,13) (2,82) (0,95) (0,68) (0,40)
Real Interest
Rate 0,095** 0,041 0,055 0,10*** 0,056 0,13** 0,055 0,049 0,041 0,044 0,051 0,11** 0,077** 0,025 0,025 -0,0091
(2,65) (1,37) (1,14) (2,93) (1,30) (2,76) (0,87) (1,39) (0,99) (0,97) (1,33) (2,66) (2,18) (0,64) (0,48) (-0,20)
Policy Rate -0,012 0,0088 -0,0067 -0,010 -0,0081 -0,0083 -0,0069 -0,030 0,020 0,022 0,0024 -0,017 -0,0047 -0,037 -0,038 -0,016
(-0,41) (0,39) (-0,20) (-0,34) (-0,24) (-0,28) (-0,21) (-0,87) (0,68) (0,74) (0,08) (-0,61) (-0,17) (-1,13) (-1,15) (-0,59)
STOXX50E 0,10 -0,37* 0,10 0,055 0,11 -0,037 0,10 0,14 -0,12 -0,13 0,11 0,15 0,13 -0,41* -0,40 -0,25
(0,83) (-1,94) (0,60) (0,46) (0,55) (-0,38) (0,48) (1,07) (-0,91) (-1,04) (0,75) (1,16) (1,02) (-1,86) (-1,58) (-1,28)
Financial
Variables
VIX -0,070 0,0039 0,011 0,025
(-0,63) (0,06) (0,19) (0,26)
D.ECB Asset Purchases 0,16 0,011 0,016 -0,044
(1,09) (0,15) (0,30) (-0,46)
Market Capitalisation 0,34** 0,23 0,24 0,30*
(2,47) (1,03) (1,08) (1,86)
Prudential Framework
Solvency ratio -0,19 -0,15 -0,17 0,065 0,091
(-1,47) (-1,03) (-1,22) (0,51) (0,75)
Solvency II - Dummy 0,11 0,038 0,12
(1,18) (0,25) (0,93)
Solvency ratio - Solvency II Interaction -0,31 -0,25
(-1,54) (-1,37)

European Commission - Study on the drivers of investments in equity by insurers and pension funds
December 2019 I 224
Driver Category
Unlisted Equity
(%
investments)
Base Model -
Fixed
Effects
Market
Conditions Model -
Fixed
Effects
Solvency
ratio Model -
Fixed
Effects
Solvency ratio Model
with Solvency II Application
Dummy - Fixed
Effects
Solvency ratio Model
with Solvency II Application
Interaction - Fixed
Effects
Solvency
ratio Model
with Solvency
II
Adoption Dummy -
Fixed
Effects
Solvency ratio Model
with Solvency II
Adoption
Interaction - Fixed
Effects
Market
Develop-ment
Model -
Fixed Effects
Non-Life
Business Share
Model-
Fixed Effects
Business
Concentr-ation
Model-
Fixed Effects
IFRS
Frame-work
Model -
Fixed Effects
Tax
Regime Model -
Fixed
Effects
Tax
Regime Model -
Random
Effects
Full Model
with Solvency II Introduct-
ion - Fixed Effects
Full Model with
Solvency II
Regulat-
ion - Fixed
Effects
Full
Model with
IFRS -
Fixed Effects
Solvency II -
Regulation Dummy 0,18 0,016 0,12
(1,60) (0,10) (0,76)
Solvency ratio
- Solvency II Regulation Interaction -0,050 -0,22
(-0,44) (-1,47)
Undertaking Characteristics
Insurance Market
Development -0,74** -0,48*** -0,47***
-0,64**
*
(-2,39) (-3,42) (-3,54) (-3,04)
D. Non-Life Business
Share 0,27 1,02** 1,04**
(1,02) (2,20) (2,29)
D. Rescaled Concentration
Ratio of Life Business -0,093 -0,062 -0,067
(-0,99) (-0,63) (-0,67)
D. Rescaled
Concentration Ratio of Non-
Life Business 0,025 -0,067 -0,12
(0,11) (-0,26) (-0,41)
Accounting Framework
IFRS -0,26** -0,056
(-2,26) (-0,52)
Global Financial Crisis 0,00017 -0,099
(0,00) (-1,02)
Tax Regime
Tax on Capital to GDP Ratio -0,0077 0,0083 0,0080 0,044
(-0,12) (0,42) (0,40) (1,69)

European Commission - Study on the drivers of investments in equity by insurers and pension funds
December 2019 I 225
Driver Category
Unlisted Equity
(%
investments)
Base Model -
Fixed
Effects
Market
Conditions Model -
Fixed
Effects
Solvency
ratio Model -
Fixed
Effects
Solvency ratio Model
with Solvency II Application
Dummy - Fixed
Effects
Solvency ratio Model
with Solvency II Application
Interaction - Fixed
Effects
Solvency
ratio Model
with Solvency
II
Adoption Dummy -
Fixed
Effects
Solvency ratio Model
with Solvency II
Adoption
Interaction - Fixed
Effects
Market
Develop-ment
Model -
Fixed Effects
Non-Life
Business Share
Model-
Fixed Effects
Business
Concentr-ation
Model-
Fixed Effects
IFRS
Frame-work
Model -
Fixed Effects
Tax
Regime Model -
Fixed
Effects
Tax
Regime Model -
Random
Effects
Full Model
with Solvency II Introduct-
ion - Fixed Effects
Full Model with
Solvency II
Regulat-
ion - Fixed
Effects
Full
Model with
IFRS -
Fixed Effects
Capital Gains
Exemption -0,22
(-0,50)
Capital Loses Exemption 0,32
(1,58)
Dividends Exemption 0,081
(0,17)
Constant -11,5** -7,81 -11,6* -10,5** -12,3* -10,0** -11,8 -13,0*** -4,16 -4,11 -13,3** -11,4** -8,66*** 2,90 2,89 -10,7**
(-2,58) (-1,42) (-1,73) (-2,20) (-1,79) (-2,19) (-1,56) (-3,60) (-0,52) (-0,51) (-2,76) (-2,25) (-4,41) (0,49) (0,55) (-2,17)
Model Details
Number of
Observations 1656 1242 1280 1656 1280 1656 1280 1656 864 854 1656 1435 1656 614 614 1122
R2-between 0,222 0,272 0,196 0,222 0,194 0,221 0,196 0,107 0,208 0,211 0,221 0,322 0,242 0,258 0,267 0,274
R2-within 0,073 0,117 0,058 0,076 0,066 0,078 0,059 0,134 0,047 0,048 0,095 0,091 0,070 0,203 0,206 0,207
R2-overall 0,172 0,202 0,153 0,173 0,152 0,173 0,153 0,100 0,213 0,227 0,171 0,254 0,190 0,161 0,169 0,213
Number of Countries 27 23 27 27 27 27 27 27 27 27 27 25 27 20 20 22
t statistics in parentheses
* p<0,10 ** p<0,05 ***p<0,01

European Commission - Study on the drivers of investments in equity by insurers and pension funds
December 2019 I 226
Table 10 – Regression results, amount invested in total equity
Driver Category
Total Equity (amount)
Base
Model - Fixed
Effects
Market Conditi-
ons Model - Fixed Effects
Solvency ratio
Model - Fixed
Effects
Solvency ratio Model
with
Solvency II Application
Dummy -
Fixed Effects
Solvency ratio Model
with
Solvency II Application
Interaction -
Fixed Effects
Solvency ratio Model
with
Solvency II Adoption Dummy -
Fixed Effects
Solvency ratio Model
with
Solvency II Adoption
Interaction -
Fixed Effects
Market Develop-
ment Model -
Fixed
Effects
Non-Life Business
Share Model-
Fixed
Effects
Business Concentr-
ation Model-
Fixed
Effects
IFRS Frame-
work Model -
Fixed
Effects
Tax Regime
Model - Fixed
Effects
Tax Regime
Model - Random
Effects
Full Model with
Solvency II Introduc-
tion - Fixed
Effects
Full Model with
Solvency II Regulation
- Fixed
Effects
Full Model
with IFRS - Fixed
Effects
Base Model
(Macroe-conomic
funda-mentals,
bond
yields, and
market returns)
Real GDP 1,68**
* 1,77*** 1,52*** 1,68*** 1,46*** 1,68*** 1,50*** 1,55*** 1,61*** 1,63*** 1,73*** 1,73*** 1,59*** 1,28*** 1,41*** 1,71***
(4,27) (3,71) (3,29) (4,09) (3,02) (4,16) (3,13) (4,53) (3,20) (3,24) (4,32) (3,86) (7,00) (2,97) (3,54) (4,17)
Inflation Rate 0,040 0,011 0,025 0,040 0,030 0,039 0,032 0,092*** 0,016 0,018 0,034 0,042 0,035 0,026 0,016 0,043
(1,32) (0,37) (0,68) (1,35) (0,86) (1,07) (0,78) (3,36) (0,45) (0,50) (0,99) (1,34) (1,19) (0,92) (0,58) (1,42)
Real Interest Rate 0,038 0,0046 0,017 0,038 0,023 0,037 0,023 0,084*** 0,0076 0,010 0,033 0,043 0,033 0,024 0,015 0,044
(1,40) (0,17) (0,52) (1,41) (0,79) (1,08) (0,69) (3,14) (0,24) (0,32) (1,11) (1,48) (1,23) (0,89) (0,56) (1,45)
Policy Rate -0,011 0,016 -0,0055 -0,011 -0,0044 -0,011 -0,0052 0,0071 -0,016 -0,017 -0,0052 -0,0026 -0,0091 0,028 0,028 0,040*
(-0,42) (0,69) (-0,17) (-0,42) (-0,14) (-0,41) (-0,17) (0,28) (-0,53) (-0,54) (-0,18) (-0,11) (-0,36) (1,05) (1,02) (1,81)
STOXX50E
0,31**
* 0,032 0,30** 0,31*** 0,28* 0,31*** 0,28** 0,27** 0,25* 0,25* 0,28** 0,41*** 0,32*** 0,071 0,092
-
0,00067
(2,83) (0,25) (2,20) (3,22) (1,96) (4,29) (2,36) (2,48) (1,80) (1,75) (2,11) (4,22) (3,03) (0,46) (0,57) (-0,01)
Financial
Variables
VIX -0,0024 -0,0069 -0,020 -0,017
(-0,03) (-0,10) (-0,35) (-0,28)
D.ECB Asset Purchases -0,070 -0,016 -0,0020 0,031
(-1,00) (-0,31) (-0,05) (0,55)
Market Capitalisation 0,17 0,070 0,077 0,22**
(1,71) (0,48) (0,54) (2,56)
Prudential Framework
Solvency ratio 0,12 0,12 0,11 0,22* 0,23*
(1,24) (1,12) (1,03) (1,94) (1,83)
Solvency II - Dummy -0,0051 0,046 0,11
(-0,08) (0,57) (1,36)
Solvency ratio - Solvency II
Interaction 0,069 -0,054
(0,43) (-0,26)

European Commission - Study on the drivers of investments in equity by insurers and pension funds
December 2019 I 227
Driver
Category
Total Equity
(amount)
Base Model -
Fixed Effects
Market Conditi-
ons Model - Fixed Effects
Solvency ratio
Model - Fixed
Effects
Solvency
ratio Model with
Solvency II Application
Dummy -
Fixed Effects
Solvency
ratio Model with
Solvency II Application
Interaction -
Fixed Effects
Solvency
ratio Model with
Solvency II Adoption Dummy -
Fixed Effects
Solvency
ratio Model with
Solvency II Adoption
Interaction -
Fixed Effects
Market Develop-
ment
Model - Fixed
Effects
Non-Life Business
Share
Model- Fixed
Effects
Business Concentr-
ation
Model- Fixed
Effects
IFRS Frame-
work
Model - Fixed
Effects
Tax Regime
Model - Fixed
Effects
Tax Regime
Model - Random
Effects
Full Model with
Solvency II
Introduc-tion - Fixed
Effects
Full Model with
Solvency II
Regulation - Fixed Effects
Full Model
with
IFRS - Fixed
Effects
Solvency II - Regulation Dummy -0,0057 0,020 0,044
(-0,06) (0,26) (0,58)
Solvency ratio
- Solvency II Regulation Interaction 0,015 -0,11
(0,17) (-0,93)
Undertak-ing
Characte
ristics
Insurance Market Development 0,75** 0,75** 0,74** 0,88***
(2,68) (2,17) (2,11) (3,45)
D .Non-Life
Business Share 0,52* 0,48 0,35
(1,81) (1,68) (1,36)
D. Rescaled Concentration
Ratio of Life Business -0,055 -0,028 -0,046
(-1,46) (-0,67) (-1,02)
D. Rescaled Concentration
Ratio of Non-Life Business 0,34** 0,32* 0,32*
(2,18) (2,06) (1,97)
Accounti
ng Framewo
rk
IFRS -0,030 -0,11
(-0,31) (-1,16)
Global
Financial Crisis -0,056 -0,022
(-0,84) (-0,64)
Tax Regime
Tax on Capital to GDP Ratio 0,010 0,013 0,013 0,038
(0,28) (0,99) (1,00) (1,50)
Capital Gains
Exemption 0,36
(0,64)

European Commission - Study on the drivers of investments in equity by insurers and pension funds
December 2019 I 228
Driver
Category
Total Equity
(amount)
Base Model -
Fixed Effects
Market Conditi-
ons Model - Fixed Effects
Solvency ratio
Model - Fixed
Effects
Solvency
ratio Model with
Solvency II Application
Dummy -
Fixed Effects
Solvency
ratio Model with
Solvency II Application
Interaction -
Fixed Effects
Solvency
ratio Model with
Solvency II Adoption Dummy -
Fixed Effects
Solvency
ratio Model with
Solvency II Adoption
Interaction -
Fixed Effects
Market Develop-
ment
Model - Fixed
Effects
Non-Life Business
Share
Model- Fixed
Effects
Business Concentr-
ation
Model- Fixed
Effects
IFRS Frame-
work
Model - Fixed
Effects
Tax Regime
Model - Fixed
Effects
Tax Regime
Model - Random
Effects
Full Model with
Solvency II
Introduc-tion - Fixed
Effects
Full Model with
Solvency II
Regulation - Fixed Effects
Full Model
with
IFRS - Fixed
Effects
Capital Loses Exemption 1,18*
(1,69)
Dividends
Exemption 0,59
(1,07)
Constant
-11,8**
* -11,2** -10,1** -11,8*** -9,31* -11,8*** -9,70* -10,2*** -10,3** -10,4** -12,0*** -13,1*** -12,4*** -6,04 -7,54* -10,7**
(-3,03) (-2,27) (-2,22) (-2,87) (-1,90) (-2,85) (-1,99) (-2,93) (-2,13) (-2,14) (-3,01) (-2,95) (-4,72) (-1,58) (-1,96) (-2,44)
Model Details
Number of Observations 1656 1242 1280 1656 1280 1656 1280 1656 864 854 1656 1435 1656 614 614 1122
R2-between 0,736 0,760 0,724 0,736 0,725 0,736 0,724 0,902 0,710 0,710 0,736 0,713 0,771 0,925 0,910 0,930
R2-within 0,181 0,293 0,134 0,181 0,136 0,181 0,134 0,268 0,168 0,168 0,182 0,226 0,181 0,491 0,489 0,508
R2-overall 0,721 0,726 0,707 0,721 0,708 0,721 0,707 0,887 0,697 0,694 0,722 0,689 0,751 0,907 0,890 0,901
Number of Countries 27 23 27 27 27 27 27 27 27 27 27 25 27 20 20 22
t statistics in parentheses
* p<0,10 ** p<0,05 ***p<0,01

European Commission - Study on the drivers of investments in equity by insurers and pension funds
December 2019 I 229
Table 11 – Regression results, ratio of total equity to total investments
Driver Category Total Equity
(%
investments)
Base Model -
Fixed
Effects
Market Conditions
Model -
Fixed Effects
Solvency ratio
Model -
Fixed Effects
Solvency ratio Model
with Solvency II Application
Dummy - Fixed
Effects
Solvency ratio Model
with Solvency II Application
Interaction - Fixed
Effects
Solvency ratio
Model
with Solvency
II
Adoption Dummy -
Fixed Effects
Solvency ratio Model
with Solvency II
Adoption
Interaction - Fixed
Effects
Market
Development
Model -
Fixed Effects
Non-Life
Business Share
Model-
Fixed Effects
Business Concentration Model-
Fixed Effects
IFRS
Frame-work
Model -
Fixed Effects
Tax Regime Model -
Fixed Effects
Tax Regime Model -
Random Effects
Full Model
with Solvency II Introductio
n - Fixed Effects
Full Model
with Solvency
II
Regulation - Fixed
Effects
Full Model with IFRS
- Fixed
Effects
Base Model
(Macroeconomic fundamentals,
bond yields, and
market returns)
Real GDP 0,37 0,40 0,43 0,32 0,40 0,31 0,38 0,44 0,31 0,33 0,63* 0,38 0,22* 0,23 0,34 0,70
(1,08) (1,09) (1,28) (0,87) (1,11) (0,86) (1,11) (1,25) (0,82) (0,86) (1,83) (1,02) (1,70) (0,57) (0,90) (1,71)
Inflation Rate 0,15*** 0,12*** 0,083** 0,16*** 0,086** 0,20*** 0,11** 0,13*** 0,068* 0,070* 0,10*** 0,16*** 0,14*** 0,042 0,037 0,063*
(4,07) (4,10) (2,22) (4,29) (2,55) (4,27) (2,45) (4,12) (2,00) (1,96) (2,85) (4,20) (4,11) (1,52) (1,35) (1,92)
Real Interest Rate 0,14*** 0,12*** 0,079** 0,15*** 0,082*** 0,19*** 0,10** 0,12*** 0,063* 0,065* 0,092*** 0,16*** 0,14*** 0,046* 0,042 0,069**
(4,76) (4,21) (2,38) (5,10) (2,94) (4,78) (2,77) (4,26) (1,88) (1,84) (3,31) (5,00) (4,96) (1,73) (1,59) (2,22)
Policy Rate 0,021 0,043*** 0,042* 0,023 0,042 0,027 0,042* 0,012 0,039* 0,039* 0,042* 0,025 0,025 0,035 0,035 0,051**
(1,00) (3,04) (1,71) (1,07) (1,70) (1,25) (1,74) (0,48) (1,86) (1,88) (1,73) (1,45) (1,25) (1,32) (1,29) (2,35)
STOXX50E 0,31*** -0,11 0,35** 0,26** 0,33** 0,12 0,26* 0,32*** 0,27* 0,26* 0,29** 0,39*** 0,32*** 0,13 0,13 0,056
(2,82) (-1,07) (2,45) (2,61) (2,06) (1,60) (1,86) (2,83) (1,97) (1,91) (2,22) (3,92) (3,11) (0,79) (0,75) (0,48)
Financial Variables
VIX -0,079 -0,0010 -0,016 -0,0051
(-1,28) (-0,02) (-0,29) (-0,09)
D.ECB Asset
Purchases 0,17** 0,031 0,038 0,088
(2,49) (0,66) (0,94) (1,57)
Market Capitalisation 0,25** 0,075 0,081 0,23**
(2,54) (0,49) (0,55) (2,45)
Prudential Framework
Solvency ratio 0,0061 0,010 0,011 0,22* 0,22*
(0,06) (0,08) (0,09) (1,88) (1,77)
Solvency II -
Dummy 0,10* 0,029 0,11
(1,84) (0,32) (1,27)
Solvency ratio - Solvency II Interaction 0,037 -0,063
(0,26) (-0,30)

European Commission - Study on the drivers of investments in equity by insurers and pension funds
December 2019 I 230
Driver Category Total Equity
(% investments)
Base Model -
Fixed
Effects
Market
Conditions Model -
Fixed
Effects
Solvency
ratio Model -
Fixed
Effects
Solvency ratio Model
with Solvency II Application
Dummy - Fixed
Effects
Solvency ratio Model
with Solvency II Application
Interaction - Fixed
Effects
Solvency
ratio Model
with Solvency
II
Adoption Dummy -
Fixed
Effects
Solvency ratio Model
with Solvency II
Adoption
Interaction - Fixed
Effects
Market
Development
Model -
Fixed Effects
Non-Life
Business Share
Model-
Fixed Effects
Business
Concentration Model-
Fixed
Effects
IFRS
Frame-work
Model -
Fixed Effects
Tax
Regime Model -
Fixed
Effects
Tax
Regime Model -
Random
Effects
Full Model
with Solvency II Introductio
n - Fixed Effects
Full Model with
Solvency II
Regulatio
n - Fixed Effects
Full Model with IFRS
- Fixed
Effects
Solvency II - Regulation
Dummy 0,24** 0,085 0,058
(2,67) (1,03) (0,72)
Solvency ratio - Solvency II Regulation
Interaction 0,0048 -0,11
(0,05) (-0,89)
Undertaking
Characteristics
Insurance Market
Development -0,37 -0,29 -0,30 -0,16
(-1,31) (-0,87) (-0,91) (-0,67)
D. Non-Life Business Share 0,46** 0,51 0,40
(2,41) (1,72) (1,54)
D. Rescaled
Concentration Ratio of Life
Business -0,063 -0,030 -0,045
(-1,61) (-0,72) (-1,05)
D. Rescaled
Concentration Ratio of Non-
Life Business 0,23** 0,32** 0,31*
(2,28) (2,13) (2,00)
Accounting
Framework
IFRS -0,31*** -0,22**
(-3,37) (-2,18)
Global Financial
Crisis -0,042 -0,052
(-0,59) (-1,47)
Tax Regime
Tax on Capital to GDP Ratio 0,0034 0,014 0,014 0,042
(0,07) (1,07) (1,07) (1,65)

European Commission - Study on the drivers of investments in equity by insurers and pension funds
December 2019 I 231
Driver Category Total Equity
(% investments)
Base Model -
Fixed
Effects
Market
Conditions Model -
Fixed
Effects
Solvency
ratio Model -
Fixed
Effects
Solvency ratio Model
with Solvency II Application
Dummy - Fixed
Effects
Solvency ratio Model
with Solvency II Application
Interaction - Fixed
Effects
Solvency
ratio Model
with Solvency
II
Adoption Dummy -
Fixed
Effects
Solvency ratio Model
with Solvency II
Adoption
Interaction - Fixed
Effects
Market
Development
Model -
Fixed Effects
Non-Life
Business Share
Model-
Fixed Effects
Business
Concentration Model-
Fixed
Effects
IFRS
Frame-work
Model -
Fixed Effects
Tax
Regime Model -
Fixed
Effects
Tax
Regime Model -
Random
Effects
Full Model
with Solvency II Introductio
n - Fixed Effects
Full Model with
Solvency II
Regulatio
n - Fixed Effects
Full Model with IFRS
- Fixed
Effects
Capital Gains Exemption 0,034
(0,11)
Capital Loses
Exemption 0,58*
(1,93)
Dividends Exemption 0,19
(0,66)
Constant -9,17** -7,04* -9,98*** -8,32** -9,52** -7,22* -8,85**
-
9,92*** -8,07** -8,21** -11,4*** -10,0** -8,32*** -6,47* -7,55* -11,5**
(-2,71) (-1,82) (-2,93) (-2,26) (-2,48) (-1,99) (-2,47) (-2,84) (-2,40) (-2,39) (-3,25) (-2,71) (-5,01) (-1,78) (-2,06) (-2,61)
Model Details
Number of Observations 1656 1242 1280 1656 1280 1656 1280 1656 864 854 1656 1435 1656 614 614 1122
R2-between 0,162 0,221 0,125 0,160 0,128 0,158 0,127 0,000 0,117 0,115 0,165 0,179 0,230 0,003 0,000 0,097
R2-within 0,312 0,431 0,225 0,315 0,226 0,324 0,227 0,330 0,223 0,218 0,352 0,381 0,311 0,378 0,376 0,530
R2-overall 0,179 0,169 0,122 0,186 0,126 0,189 0,127 0,016 0,068 0,068 0,161 0,205 0,243 0,008 0,007 0,054
Number of Countries 27 23 27 27 27 27 27 27 27 27 27 25 27 20 20 22
t statistics in parentheses
* p<0,10 ** p<0,05 ***p<0,01

European Commission - Study on the drivers of investments in equity by insurers and pension funds
December 2019 I 232
Annex 2 Econometric model – pension funds The aim of this section is to provide the descriptions, sources, and transformations of the data series used in the quantitative analyses of the study for the pension funds. There are two separate regression analyses included for the pension funds. The first one uses panel at the country level and called ‘macro panel analysis’ while the second one, for which the result are reported within the prudential framework category for pension funds, also uses pension fund specific data. The macro panel analysis of the equity investments by pension funds uses the equity investments data available on the EIOPA Occupational Pension Funds. Three main equity investment categories are used from the EIOPA dataset, namely, listed equity, unlisted equity, and total equity. These categories are the dependent variables (i.e. variables of
interest) of the study. Four additional dependent variables are created based on these categories. Descriptions of all dependent variables used in the analyses are given in the upper panel of Table 12. For each dependent variable, potential drivers are analysed through a base model, driver category specific models, and a full model that contains all of the discussed
drivers. Therefore, we are able to compare the regression results in several dimensions. First, we compare the results from the driver specific model and the full model to see whether the results are robust to model specification. Second, we compare the results within equity types. Third, we check the robustness of the results across equity types. In the comparisons, we first check whether the statistical significance of a coefficient estimate is robust. The statistically significant result that is robust to model specification and robust within and across equity types is considered the strongest result. Then, we are interested statistically significant results within equity types. Such a case is still at the highest level of interest because the differences can sometimes be explained by the differences of the equity types, for instance stock markets returns can be statistically significant driver for the listed shares but not for unlisted shares.
On the other hand, we are also interested in coefficient estimates that are consistently have the same sign but not statistically significant. Such results give insights on the direction of the relation between equity investments and drivers. Furthermore, in some cases, the lack of statistical significance can be related to the lack of historical data or lack of an optimal proxy for a variable.
Based on the driver categorisation in the study, data related to the drivers are collected from several data sources including EIOPA, ECB, Eurostat, Federal Reserve Economic Data, Bloomberg, Yahoo Finance, Federation of European Securities Exchanges (FESE). Descriptions of the data series used in the creation of the independent variables (i.e. explanatory variables) are given in the lower panel of Table 12.

European Commission - Study on the drivers of investments in equity by insurers and pension funds
December 2019 I 233
Table 12 - Data series used in the macro panel data analyses, data description and sources
Data Series Description Source
Dependent
Variables
Listed Equity
(amount)
Amount (EUR) invested in listed equity EIOPA
Adjusted Listed Equity
(amount)
Amount (EUR)invested in listed equity adjusted by weighted equity
index
EIOPA, Yahoo Finance
Listed Equity (%
investments)
Ratio of listed equity to total investments EIOPA
Unlisted Equity
(amount)
Amount (EUR) invested in other variable-yield securities EIOPA
Unlisted Equity (%
investments)
Ratio of other variable-yield securities to total investments EIOPA
Total Equity (amount) Amount (EUR) invested in listed equity and other variable-yield
equities (excluding UCITs)
EIOPA
Total Equity (%
investments)
Ratio of total listed equity and other variable-yield equities
(excluding UCITs) to total investments
EIOPA
Independent
Variables
GDP Seasonally and calendar adjusted GDP data Eurostat, Federal Reserve
Economic Data
Inflation Rate Percentage change in Harmonised Index of Consumer Prices (HICP) Eurostat
Interest Rate (long-
term)
EU 10-year Government Bond Index Bloomberg
Policy Rate ECB marginal lending facility ECB
STOXX50E STOXX50E stock market index Yahoo Finance
VIX VIX volatility index Federal Reserve Economic Data
ECB Asset Purchases Assets purchase of the ECB ECB
Market Capitalisation Ratio of market capitalisation to domestic GDP FESE, Eurostat, Federal Reserve
Economic Data
Pensions Market
Development
Ratio of total investments of pension funds to domestic GDP EIOPA, Eurostat, Federal Reserve
Economic Data
Average Cover Ratio Ratio of net assets covering technical provisions to technical
provisions for pensions
EIOPA
Concentration Ratio Total assets held by the largest 5 pension funds as a % of total
assets of the pension fund sector.
EIOPA
Tax on capital to GDP
ratio
Ratio of government revenue by tax on capital to domestic GDP ECB

European Commission - Study on the drivers of investments in equity by insurers and pension funds
December 2019 I 234
In addition to these variables, dummy variables for introduction of IFRS, Global Financial Crisis, and tax regulations are used in the models. The dates and details regarding these dummies are given in the study. Before the analysis, in order to avoid possible impact of outliers in the data series, the series are winsorised at the 1% level. Then, the variables that take only positive values, for instance the dependent variables in the study and GDP, are transformed using natural logarithm. A possible concern in the analysis was the non-stationarity of the series. After the transformations, each series is checked for panel stationarity using the Dickey-Fuller panel stationarity test. Based on the test results, first differences (i.e. percentage change from previous period) of ECB asset purchases have been used in the regressions. In the tables the provide the regression results below, this variable is denoted by ‘D.’ at the beginning of their names. ‘D.’ indicates the first difference transformation on the
series. Following the modelling cycle that is described on the study and heteroscedasticity tests, in most of the regressions a Fixed-Effects model with robust standard errors is used. Table 13 report the regression results for each dependent variable. These tables include information on the estimated coefficients, t-statistics of the coefficients, statistical significance level of the coefficients, explanatory power of the model, and number of Member States and number of observations included in each regression. The explanatory power of the Fixed-Effects model, also known as the within-effects model, are given in the row denoted by ‘R2-within’. Other R2 data are reported for comparison purposes. The second regression analysis focuses on the relation between equity investments of
pension funds and their funding ratio. This analysis is carried out using the quarterly and yearly pension fund specific data provided by De Nederlandsche Bank (DNB). Data treatment and model specification cycle follow the same cycle with the macro panel data. However, in this case, because of the short time span of the dataset, stationarity treatment is not applied to the series. Results for the second analysis are reported in Table 20. The table includes results for the models with only the funding ratio variables and other macroeconomic and financial variables that are included for robustness check. In the analysis ‘distance’ is defined as, for instance for the full funding ratio, funding ratio of the pension fund minus 1. Therefore, a positive value for this variable indicates that funding ratio of the pension fund is higher than the full funding ratio.

European Commission - Study on the drivers of investments in equity by insurers and pension funds
December 2019 I 235
Table 13 – Regression results, amount invested in listed equity
Driver Category Listed Equity
(amount)
Base
Model - Fixed Effects
Market
Conditions Model - Fixed
Effects
Market
Development Model - Fixed
Effects
Average Cover
Ratio Model - Fixed Effects
Market
Concentration Model - Fixed
Effects
IFRS
Framework Model - Fixed
Effects
Tax Regime
Model - Fixed
Effects
Tax Regime
Model - Random Effects
Full Model - Fixed Effects
Base Model (Macroeconomic
fundamentals, bond
yields, and market returns)
Real GDP -1,03 -0,56 0,19 -0,99 3,75 -0,85 -1,17* -0,11 6,03
(-1,49) (-0,59) (0,23) (-1,04) (1,98) (-0,94) (-2,09) (-0,12) (1,91)
Inflation Rate 0,019 0,035 0,13* 0,040 0,26* 0,022 -0,0020 1,61*** 0,39
(0,19) (0,27) (2,17) (0,40) (2,29) (0,19) (-0,02) (3,78) (1,92)
Real Interest Rate -0,044 -0,0063 0,069 -0,048 0,081 -0,035 -0,061 0,77*** 0,068
(-0,74) (-0,08) (1,06) (-0,76) (1,36) (-0,37) (-1,73) (4,92) (0,67)
Policy Rate -0,18 -0,21 -0,12 -0,22* -0,32* -0,21 -0,17 -1,55*** -0,69
(-1,38) (-1,17) (-0,89) (-2,10) (-2,58) (-1,75) (-1,31) (-2,63) (-1,61)
STOXX50E 1,73* 1,30 1,14 1,70 1,78* 1,64 1,81* 3,84** 3,11
(2,06) (1,02) (0,93) (1,74) (2,24) (1,84) (2,04) (2,45) (1,31)
Financial Variables
VIX -0,041 0,42
(-0,23) (0,78)
D.ECB Asset Purchases -0,16 -0,79
(-0,65) (-1,27)
Market Capitalisation 0,059 0,71
(0,56) (1,30)
Undertaking Characteristics
Pensions Market Development 1,41* -2,02
(2,13) (-1,15)
Average Cover Ratio 0,76 0,34
(1,67) (0,81)
Market Concentration Ratio 0,21 0,48
(0,29) (0,54)
Accounting Framework
IFRS -0,56* -0,34
(-2,51) (-0,81)
Global Financial Crisis -0,22 0,30
(-1,76) (0,74)

European Commission - Study on the drivers of investments in equity by insurers and pension funds
December 2019 I 236
Driver Category Listed Equity
(amount)
Base Model
- Fixed Effects
Market Conditions
Model - Fixed Effects
Market Development
Model - Fixed Effects
Average Cover
Ratio Model - Fixed Effects
Market Concentration
Model - Fixed Effects
IFRS Framework
Model - Fixed Effects
Tax Regime Model -
Fixed Effects
Tax Regime
Model - Random Effects
Full Model - Fixed
Effects
Tax Regime
Tax on Capital to GDP Ratio 0,036 0,039
(1,20) (0,85)
Capital Gains Exemption 5,27***
(4,30)
Capital Loses Exemption 8,58***
(8,79)
Dividends Exemption 3,27***
(4,53)
Constant 7,11 4,99 -8,54 3,56 -51,3 6,36 8,29 -31,1** -88,2
(0,76) (0,33) (-1,72) (0,28) (-1,66) (0,56) (0,97) (-2,46) (-1,74)
Model Details
Number of Observations 69 67 69 65 56 69 66 69 53
R2-between 0,000 0,010 0,849 0,000 0,015 0,000 0,002 0,657 0,055
R2-within 0,255 0,268 0,322 0,334 0,450 0,332 0,274 0,086 0,619
R2-overall 0,026 0,062 0,803 0,022 0,000 0,025 0,044 0,554 0,173
Number of Countries 6 6 6 6 5 6 6 6 5
t statistics in parentheses
* p<0,10 , ** p<0,05 , *** p<0,01

European Commission - Study on the drivers of investments in equity by insurers and pension funds
December 2019 I 237
Table 14 – Regression results, adjusted amount invested in listed equity
Driver Category Adjusted Listed Equity
(amount)
Base
Model - Fixed
Effects
Market
Conditions Model - Fixed
Effects
Market
Development Model - Fixed
Effects
Average
Cover Ratio Model -
Fixed Effects
Market
Concentration Model - Fixed
Effects
IFRS
Framework Model - Fixed
Effects
Tax Regime
Model - Fixed
Effects
Tax Regime
Model - Random
Effects
Full Model - Fixed Effects
Base Model (Macroeconomic
fundamentals, bond yields, and market
returns)
Real GDP -1,06 -0,60 0,077 -0,99 3,50 -0,89 -1,19* -0,10 5,70
(-1,63) (-0,68) (0,09) (-1,08) (1,82) (-1,02) (-2,23) (-0,12) (1,80)
Inflation Rate 0,056 0,064 0,16* 0,078 0,28* 0,054 0,038 1,65*** 0,40
(0,56) (0,50) (2,50) (0,83) (2,44) (0,46) (0,45) (3,82) (2,00)
Real Interest Rate 0,0097 0,039 0,12 0,0052 0,13 0,0056 -0,0057 0,83*** 0,090
(0,17) (0,50) (1,67) (0,08) (2,05) (0,06) (-0,15) (5,24) (0,91)
Policy Rate -0,13 -0,17 -0,079 -0,19 -0,28* -0,17 -0,13 -1,51** -0,65
(-1,05) (-0,92) (-0,58) (-1,79) (-2,15) (-1,41) (-1,00) (-2,54) (-1,51)
STOXX50E 0,68 0,22 0,12 0,64 0,70 0,62 0,75 2,79* 2,12
(0,80) (0,17) (0,10) (0,65) (0,87) (0,69) (0,85) (1,78) (0,89)
Financial Variables
VIX -0,038 0,44
(-0,21) (0,81)
D.ECB Asset Purchases -0,12 -0,75
(-0,49) (-1,22)
Market Capitalisation 0,068 0,75
(0,72) (1,33)
Undertaking
Characteristics
Pensions Market Development 1,32 -2,20
(1,89) (-1,21)
Average Cover Ratio 0,67 0,29
(1,37) (0,65)
Market Concentration Ratio 0,27 0,50
(0,35) (0,53)
Accounting Framework
IFRS -0,63** -0,35
(-2,89) (-0,81)
Global Financial Crisis -0,17 0,31
(-1,30) (0,77)
Tax Regime Tax on Capital to GDP Ratio 0,033 0,049

European Commission - Study on the drivers of investments in equity by insurers and pension funds
December 2019 I 238
Driver Category Adjusted Listed Equity
(amount)
Base Model -
Fixed Effects
Market Conditions
Model - Fixed Effects
Market Development
Model - Fixed Effects
Average Cover Ratio
Model - Fixed Effects
Market Concentration
Model - Fixed Effects
IFRS Framework
Model - Fixed Effects
Tax Regime Model -
Fixed Effects
Tax Regime Model -
Random Effects
Full Model - Fixed
Effects
(1,09) (1,05)
Capital Gains Exemption 5,27***
(4,28)
Capital Loses Exemption 8,53***
(8,76)
Dividends Exemption 3,25***
(4,50)
Constant 15,8 13,9 1,12 12,2 -40,1 14,9 16,8* -22,9* -75,8
(1,80) (0,98) (0,23) (1,02) (-1,27) (1,37) (2,07) (-1,81) (-1,50)
Model Details
Number of Observations 69 67 69 65 56 69 66 69 53
R2-between 0,000 0,005 0,869 0,001 0,015 0,000 0,001 0,651 0,084
R2-within 0,070 0,091 0,143 0,146 0,257 0,174 0,085 0,029 0,478
R2-overall 0,017 0,044 0,825 0,016 0,000 0,016 0,032 0,544 0,224
Number of Countries 6 6 6 6 5 6 6 6 5
t statistics in parentheses
* p<0,10 , ** p<0,05 , ***
p<0,01

European Commission - Study on the drivers of investments in equity by insurers and pension funds
December 2019 I 239
Table 15 – Regression results, ratio of listed equity to total investments
Driver Category Listed Equity
(% investments)
Base Model
- Fixed Effects
Market
Conditions Model - Fixed
Effects
Market
Development Model - Fixed
Effects
Average
Cover Ratio Model - Fixed
Effects
Market
Concentration Model - Fixed
Effects
IFRS
Framework Model - Fixed
Effects
Tax Regime
Model - Fixed
Effects
Tax Regime
Model - Random
Effects
Full Model - Fixed Effects
Base Model (Macroeconomic
fundamentals, bond yields, and market
returns)
Real GDP -1,12* -0,72 -0,79 -1,11 2,34 -0,96 -1,14* -1,15* 4,89
(-2,42) (-1,13) (-0,98) (-1,50) (1,07) (-1,36) (-2,32) (-1,92) (1,53)
Inflation Rate 0,13 0,14 0,16** 0,15* 0,30* 0,12 0,13 1,21*** 0,40
(1,88) (1,35) (2,65) (2,48) (2,49) (1,49) (1,78) (3,92) (2,02)
Real Interest Rate 0,071 0,10 0,10 0,063 0,16* 0,062 0,070 0,61*** 0,083
(1,95) (1,73) (1,47) (1,53) (2,72) (0,91) (1,80) (6,08) (0,84)
Policy Rate -0,12 -0,14 -0,10 -0,16 -0,23 -0,15 -0,13 -1,07** -0,67
(-1,03) (-0,89) (-0,75) (-1,65) (-1,68) (-1,35) (-1,05) (-2,48) (-1,58)
STOXX50E 1,29 0,85 1,13 1,31 1,35 1,25 1,37 2,87** 3,07
(1,40) (0,67) (0,92) (1,25) (1,50) (1,32) (1,41) (2,13) (1,31)
Financial Variables
VIX -0,081 0,42
(-0,53) (0,77)
D.ECB Asset Purchases -0,13 -0,76
(-0,63) (-1,22)
Market Capitalisation 0,060 0,76
(0,59) (1,35)
Undertaking
Characteristics
Pensions Market
Development 0,38 -3,15
(0,55) (-1,73)
Average Cover Ratio 0,55 0,26
(1,03) (0,61)
Market Concentration
Ratio 0,40 0,46
(0,39) (0,48)
Accounting Framework
IFRS -0,63** -0,36
(-2,72) (-0,85)
Global Financial Crisis -0,14 0,29
(-1,33) (0,71)

European Commission - Study on the drivers of investments in equity by insurers and pension funds
December 2019 I 240
Driver Category Listed Equity
(% investments)
Base Model
- Fixed Effects
Market Conditions
Model - Fixed Effects
Market Development
Model - Fixed Effects
Average Cover Ratio
Model - Fixed Effects
Market Concentration
Model - Fixed Effects
IFRS Framework
Model - Fixed Effects
Tax Regime Model -
Fixed Effects
Tax Regime Model -
Random Effects
Full Model -
Fixed Effects
Tax Regime
Tax on Capital to GDP
Ratio -0,0085 0,045
(-0,55) (0,96)
Capital Gains Exemption 2,64***
(3,08)
Capital Loses Exemption 4,17***
(6,14)
Dividends Exemption 2,17***
(4,38)
Constant 4,52 3,29 0,27 1,64 -39,1 3,64 4,19 -13,3 -76,6
(0,62) (0,29) (0,06) (0,17) (-1,07) (0,39) (0,54) (-1,37) (-1,50)
Model Details
Number of Observations 69 67 69 65 56 69 66 69 53
R2-between 0,291 0,325 0,700 0,269 0,193 0,285 0,298 0,661 0,640
R2-within 0,133 0,100 0,139 0,140 0,194 0,230 0,142 0,028 0,483
R2-overall 0,379 0,408 0,737 0,359 0,270 0,373 0,402 0,610 0,684
Number of Countries 6 6 6 6 5 6 6 6 5
t statistics in parentheses
* p<0,10 , ** p<0,05 ,
*** p<0,01

European Commission - Study on the drivers of investments in equity by insurers and pension funds
December 2019 I 241
Table 16 – Regression results, amount invested in unlisted equity
Driver Category Unlisted Equity
(amount)
Base
Model - Fixed
Effects
Market
Conditions Model - Fixed
Effects
Market
Development Model - Fixed
Effects
Average Cover Ratio
Model - Fixed
Effects
Market
Concentration Model - Fixed
Effects
IFRS
Framework Model - Fixed
Effects
Tax Regime
Model - Fixed
Effects
Tax Regime
Model - Random
Effects
Full Model - Fixed Effects
Base Model (Macroeconomic
fundamentals, bond yields, and market
returns)
Real GDP -0,14 -1,34 -0,48 -1,50 0,72 -0,86 -0,63 0,34 1,92
(-0,05) (-0,36) (-0,15) (-0,44) (0,45) (-0,30) (-0,20) (0,62) (1,90)
Inflation Rate -0,28 -0,33 -0,32 -0,32 -0,34** -0,28 -0,31 0,63** -0,17
(-1,81) (-1,95) (-1,72) (-1,94) (-3,37) (-1,93) (-1,95) (2,44) (-1,16)
Real Interest Rate -0,27* -0,32* -0,31 -0,31* -0,29** -0,22 -0,30* 0,14 -0,053
(-2,16) (-2,44) (-1,98) (-2,53) (-2,90) (-1,96) (-2,35) (0,89) (-0,53)
Policy Rate 0,17 0,23 0,14 0,20 0,20 0,18 0,19 -0,62*** 0,14
(0,84) (1,10) (0,82) (0,91) (1,76) (0,88) (0,90) (-3,57) (0,75)
STOXX50E 0,52 1,10 0,82 0,93 0,37 0,33 0,49 2,22** 0,45
(1,15) (1,31) (1,25) (1,25) (1,60) (0,71) (1,12) (2,02) (1,20)
Financial Variables
VIX -0,24 0,28
(-0,85) (1,16)
D.ECB Asset Purchases 0,035 -0,0038
(0,21) (-0,03)
Market Capitalisation -0,54* -0,21
(-2,18) (-0,52)
Undertaking
Characteristics
Pensions Market Development -0,62 1,35
(-0,57) (1,52)
Average Cover Ratio -0,60 -1,59
(-0,36) (-1,57)
Market Concentration Ratio 4,49*** 5,50**
(9,90) (4,29)
Accounting Framework
IFRS 0,38 0,22
(1,99) (0,48)
Global Financial Crisis -0,24 -0,42
(-1,25) (-2,06)
Tax Regime Tax on Capital to GDP Ratio 0,058 -0,16*

European Commission - Study on the drivers of investments in equity by insurers and pension funds
December 2019 I 242
Driver Category Unlisted Equity
(amount)
Base Model -
Fixed Effects
Market Conditions
Model - Fixed Effects
Market Development
Model - Fixed Effects
Average Cover Ratio
Model - Fixed
Effects
Market Concentration
Model - Fixed Effects
IFRS Framework
Model - Fixed Effects
Tax Regime Model -
Fixed Effects
Tax Regime Model -
Random Effects
Full Model -
Fixed Effects
(1,34) (-2,14)
Capital Gains Exemption 3,63***
(3,91)
Capital Loses Exemption 5,10***
(10,10)
Dividends Exemption 0
(,)
Constant 5,13 18,8 9,53 21,5 -19,5 15,0 11,1 -20,0* -36,0*
(0,16) (0,46) (0,26) (0,52) (-1,14) (0,48) (0,32) (-1,92) (-2,25)
Model Details
Number of Observations 55 53 55 51 51 55 55 55 51
R2-between 0,120 0,238 0,922 0,133 0,045 0,141 0,125 0,783 0,274
R2-within 0,208 0,296 0,226 0,243 0,628 0,238 0,217 0,009 0,737
R2-overall 0,001 0,112 0,796 0,029 0,001 0,046 0,047 0,712 0,354
Number of Countries 5 5 5 5 5 5 5 5 5
t statistics in parentheses
* p<0,10 , ** p<0,05 , *** p<0,01

European Commission - Study on the drivers of investments in equity by insurers and pension funds
December 2019 I 243
Table 17 – Regression results, ratio of unlisted equity to total investments
Driver Category Unlisted Equity
(% investments)
Base
Model - Fixed
Effects
Market
Conditions Model - Fixed
Effects
Market
Development Model - Fixed
Effects
Average
Cover Ratio Model -
Fixed Effects
Market
Concentration Model - Fixed
Effects
IFRS
Framework Model - Fixed
Effects
Tax Regime
Model - Fixed Effects
Tax Regime
Model - Random
Effects
Full Model - Fixed Effects
Base Model (Macroeconomic
fundamentals, bond yields, and market
returns)
Real GDP -0,89 -2,62 -1,77 -2,93 -0,66 -1,72 -1,00 -0,60** 0,74
(-0,30) (-0,75) (-0,55) (-0,94) (-0,45) (-0,65) (-0,30) (-2,21) (0,70)
Inflation Rate -0,18 -0,27 -0,30 -0,27 -0,29* -0,20 -0,19 0,25 -0,16
(-1,19) (-1,82) (-1,59) (-1,86) (-2,66) (-1,43) (-1,13) (1,43) (-1,16)
Real Interest Rate -0,16 -0,25* -0,28 -0,22* -0,20 -0,13 -0,17 0,033 -0,038
(-1,38) (-2,23) (-1,74) (-2,19) (-2,00) (-1,19) (-1,30) (0,27) (-0,41)
Policy Rate 0,23 0,34 0,16 0,29 0,29* 0,25 0,24 -0,14** 0,15
(1,13) (1,50) (0,96) (1,36) (2,61) (1,22) (1,09) (-2,34) (0,83)
STOXX50E 0,0037 0,59 0,78 0,45 -0,14 -0,15 -0,0017 0,80 0,41
(0,01) (0,70) (1,14) (0,56) (-0,50) (-0,28) (-0,00) (1,17) (1,00)
Financial Variables
VIX -0,29 0,27
(-1,06) (1,22)
D.ECB Asset Purchases 0,13 0,023
(0,70) (0,20)
Market Capitalisation -0,55 -0,16
(-1,58) (-0,41)
Undertaking
Characteristics
Pensions Market Development -1,58 0,20
(-1,42) (0,24)
Average Cover Ratio -0,69 -1,67
(-0,42) (-1,68)
Market Concentration Ratio 4,63*** 5,46**
(7,02) (4,18)
Accounting Framework
IFRS 0,41* 0,21
(2,44) (0,45)
Global Financial Crisis -0,18 -0,43
(-1,10) (-2,05)

European Commission - Study on the drivers of investments in equity by insurers and pension funds
December 2019 I 244
Driver Category Unlisted Equity
(% investments)
Base
Model - Fixed
Effects
Market
Conditions Model - Fixed
Effects
Market
Development Model - Fixed
Effects
Average
Cover Ratio Model -
Fixed Effects
Market
Concentration Model - Fixed
Effects
IFRS
Framework Model - Fixed
Effects
Tax Regime
Model - Fixed Effects
Tax Regime
Model - Random
Effects
Full Model - Fixed Effects
Tax Regime
Tax on Capital to GDP Ratio 0,012 -0,15
(0,25) (-2,10)
Capital Gains Exemption 1,14**
(2,51)
Capital Loses Exemption 1,75***
(5,28)
Dividends Exemption 0
(,)
Constant 10,8 30,9 22,1 35,4 -6,95 21,7 12,1 -1,11 -23,8
(0,34) (0,81) (0,60) (0,96) (-0,42) (0,78) (0,34) (-0,20) (-1,44)
Model Details
Number of Observations 55 53 55 51 51 55 55 55 51
R2-between 0,167 0,156 0,058 0,224 0,031 0,193 0,172 0,653 0,005
R2-within 0,135 0,293 0,251 0,277 0,666 0,166 0,135 0,002 0,762
R2-overall 0,145 0,146 0,083 0,222 0,033 0,167 0,148 0,515 0,004
Number of Countries 5 5 5 5 5 5 5 5 5
t statistics in parentheses
* p<0,10 , ** p<0,05 , ***
p<0,01

European Commission - Study on the drivers of investments in equity by insurers and pension funds
December 2019 I 245
Table 18 – Regression results, amount invested in total equity
Driver Category Total Equity (amount)
Base
Model - Fixed
Effects
Market
Conditions Model - Fixed
Effects
Market
Development Model - Fixed
Effects
Average
Cover Ratio Model -
Fixed Effects
Market
Concentration Model - Fixed
Effects
IFRS
Framework Model - Fixed
Effects
Tax Regime
Model - Fixed
Effects
Tax Regime
Model - Random
Effects
Full Model - Fixed Effects
Base Model (Macroeconomic
fundamentals, bond yields, and market
returns)
Real GDP -0,23 -0,045 0,37 -0,67 2,41 -0,19 -0,58 0,40 2,17
(-0,29) (-0,06) (0,74) (-1,29) (1,94) (-0,24) (-0,95) (0,46) (1,99)
Inflation Rate 0,023 0,0019 0,10 -0,029 0,063 0,018 -0,035 0,98*** 0,098
(0,18) (0,02) (1,83) (-0,33) (0,82) (0,15) (-0,42) (3,08) (0,84)
Real Interest Rate -0,016 -0,022 0,055 -0,076 0,025 -0,018 -0,055 0,32** 0,073
(-0,17) (-0,24) (1,40) (-1,27) (0,33) (-0,19) (-0,83) (2,18) (0,88)
Policy Rate 0,041 0,065 0,067** 0,022 -0,051 0,040 0,049* -0,53*** -0,053
(1,30) (1,90) (2,84) (0,38) (-1,97) (1,24) (2,19) (-3,64) (-0,57)
STOXX50E 0,90*** 0,50 0,36 0,85** 0,47 0,88*** 0,97*** 2,32*** 0,042
(5,09) (1,42) (0,96) (2,82) (1,18) (4,97) (6,49) (2,65) (0,08)
Financial Variables
VIX -0,064 0,22
(-0,53) (1,72)
D.ECB Asset Purchases 0,029 -0,17
(0,33) (-1,05)
Market Capitalisation 0,15 0,67**
(0,72) (3,85)
Undertaking
Characteristics
Pensions Market Development 1,38** 0,71
(2,75) (2,06)
Average Cover Ratio 0,41 -0,29
(0,53) (-0,74)
Market Concentration Ratio 2,50*** 3,52***
(7,51) (5,98)
Accounting Framework
IFRS -0,095 0,50***
(-0,69) (5,38)
Global Financial Crisis -0,031 0,037
(-0,39) (0,39)
Tax Regime Tax on Capital to GDP Ratio 0,065*** -0,062

European Commission - Study on the drivers of investments in equity by insurers and pension funds
December 2019 I 246
Driver Category Total Equity
(amount)
Base Model -
Fixed Effects
Market Conditions
Model - Fixed Effects
Market Development
Model - Fixed Effects
Average Cover Ratio
Model - Fixed Effects
Market Concentration
Model - Fixed Effects
IFRS Framework
Model - Fixed Effects
Tax Regime Model -
Fixed Effects
Tax Regime Model -
Random Effects
Full Model -
Fixed Effects
(6,89) (-1,35)
Capital Gains Exemption 4,11***
(3,38)
Capital Loses Exemption 8,11***
(9,81)
Dividends Exemption 2,73***
(6,55)
Constant 4,61 5,06 -4,01 8,67 -32,2* 4,38 8,15 -23,6** -35,8*
(0,53) (0,53) (-0,79) (1,64) (-2,74) (0,49) (1,24) (-2,31) (-2,19)
Model Details
Number of Observations 78 76 78 68 59 78 75 78 54
R2-between 0,069 0,135 0,902 0,060 0,010 0,093 0,023 0,559 0,248
R2-within 0,283 0,242 0,619 0,258 0,490 0,289 0,345 0,032 0,801
R2-overall 0,029 0,032 0,896 0,027 0,002 0,031 0,015 0,496 0,188
Number of Countries 6 6 6 6 5 6 6 6 5
t statistics in parentheses
* p<0,10 , ** p<0,05 , ***
p<0,01

European Commission - Study on the drivers of investments in equity by insurers and pension funds
December 2019 I 247
Table 19 – Regression results, ratio of total equity to total investments
Driver Category Total Equity
(% investments)
Base
Model - Fixed
Effects
Market
Conditions Model - Fixed
Effects
Market
Development Model - Fixed
Effects
Average
Cover Ratio Model -
Fixed Effects
Market
Concentration Model - Fixed
Effects
IFRS
Framework Model - Fixed
Effects
Tax Regime
Model - Fixed Effects
Tax Regime
Model - Random
Effects
Full Model - Fixed Effects
Base Model (Macroeconomic
fundamentals, bond yields, and market
returns)
Real GDP -0,76* -0,65 -0,60 -0,89** 0,12 -0,70 -0,88* -0,65 1,00
(-2,03) (-1,61) (-1,22) (-2,70) (0,26) (-1,86) (-2,41) (-1,15) (0,86)
Inflation Rate 0,11 0,089 0,13* 0,085 0,088 0,10 0,093 0,70*** 0,11
(1,66) (1,35) (2,32) (1,73) (2,01) (1,54) (1,48) (3,29) (0,95)
Real Interest Rate 0,069 0,057 0,087* 0,039 0,068** 0,057 0,055 0,27*** 0,083
(1,57) (1,31) (2,21) (1,35) (2,80) (1,26) (1,47) (3,19) (1,05)
Policy Rate 0,075* 0,11*** 0,081** 0,068 0,038 0,074* 0,077** -0,28*** -0,036
(2,54) (4,74) (3,66) (1,64) (1,85) (2,28) (2,77) (-3,39) (-0,39)
STOXX50E 0,48** 0,12 0,34 0,45 0,22 0,48* 0,51** 1,43** -0,014
(2,67) (0,35) (0,92) (1,25) (0,90) (2,28) (2,95) (2,37) (-0,03)
Financial Variables
VIX -0,13 0,21
(-1,63) (1,83)
D.ECB Asset Purchases 0,042 -0,14
(0,63) (-0,86)
Market Capitalisation 0,032 0,72**
(0,34) (4,16)
Undertaking
Characteristics
Pensions Market Development 0,35 -0,42
(0,68) (-1,12)
Average Cover Ratio 0,15 -0,34
(0,22) (-0,91)
Market Concentration Ratio 2,53*** 3,49***
(9,28) (5,75)
Accounting Framework
IFRS -0,18* 0,48***
(-2,54) (5,60)
Global Financial Crisis -0,0058 0,044
(-0,11) (0,44)
Tax Regime Tax on Capital to GDP Ratio 0,025 -0,053

European Commission - Study on the drivers of investments in equity by insurers and pension funds
December 2019 I 248
Driver Category Total Equity
(% investments)
Base Model -
Fixed Effects
Market Conditions
Model - Fixed Effects
Market Development
Model - Fixed Effects
Average Cover Ratio
Model - Fixed Effects
Market Concentration
Model - Fixed Effects
IFRS Framework
Model - Fixed Effects
Tax Regime
Model - Fixed Effects
Tax Regime Model -
Random Effects
Full Model -
Fixed Effects
(1,79) (-1,10)
Capital Gains Exemption 1,70**
(2,19)
Capital Loses Exemption 3,75***
(6,65)
Dividends Exemption 1,77***
(6,42)
Constant 7,01 8,81* 4,84 8,30** -10,4 6,51 8,27* -6,45 -23,9
(1,86) (2,48) (0,94) (3,12) (-1,76) (1,84) (2,15) (-1,03) (-1,40)
Model Details
Number of Observations 78 76 78 68 59 78 75 78 54
R2-between 0,188 0,187 0,657 0,169 0,058 0,178 0,214 0,508 0,431
R2-within 0,602 0,563 0,622 0,482 0,707 0,618 0,593 0,193 0,826
R2-overall 0,214 0,212 0,646 0,208 0,034 0,206 0,239 0,457 0,393
Number of Countries 6 6 6 6 5 6 6 6 5
t statistics in parentheses
* p<0,10 , ** p<0,05 , ***
p<0,01

European Commission - Study on the drivers of investments in equity by insurers and pension funds
December 2019 I 249
Table 20 – Regression results, pension fund specific data for funding ratio analysis
Models with Funding Ratios Robustness Check
Equity Investments (% investments)
Weak
Corporate Support –
Full Funding
Ratio Model
Strong
Corporate Support –
Full Funding
Ratio Model
Weak Corporate Support –
Full Funding
Ratio Model
(110%)
Strong Corporate Support –
Full Funding
Ratio Model
(110%)
Weak Corporate
Support -Required
Funding Ratio Model
Strong Corporate
Support – Required
Funding Ratio Model
Weak Corporate Support –
Full Funding
Ratio Model,
Robustness
Strong Corporate
Support – Full Funding
Ratio Model, Robustness
Weak
Corporate Support –
Full Funding
Ratio
Model (110%),
Robustness
Strong Corporate
Support – Full Funding Ratio
Model
(110%), Robustness
Weak Corporate Support -
Required Funding
Ratio Model,
Robustness
Strong Corporate
Support – Required Funding
Ratio Model, Robustness
Distance From Full Funding -0,014 -0,53*** 0,0016 -0,59***
(-0,17) (-2,60) (0,02) (-2,76)
Distance From Funding Ratio of 110 -0,014 -0,53*** 0,0016 -0,59***
(-0,17) (-2,60) (0,02) (-2,76)
Distance From Required Funding Ratio 0,25*** 0,20 0,27*** 0,20
(3,28) (1,11) (3,50) (1,10)
Real GDP 1,40 -3,32 1,40 -3,32 1,06 -2,80
(0,31) (-0,60) (0,31) (-0,60) (0,24) (-0,50)
Interest Rate -0,070 0,015 -0,070 0,015 -0,034 0,049
(-0,25) (0,04) (-0,25) (0,04) (-0,12) (0,12)
VIX 0,094 -0,49 0,094 -0,49 -0,079 -0,71
(0,10) (-0,39) (0,10) (-0,39) (-0,09) (-0,55)
Constant 3,91*** 3,75*** 3,91*** 3,80*** 3,88*** 3,79*** -13,2 45,2 -13,2 45,2 -8,79 39,4
(365,94) (143,29) (416,34) (227,28) (322,42) (191,11) (-0,24) (0,65) (-0,24) (0,65) (-0,16) (0,56)
Number of Observations 481 270 481 270 481 270 481 270 481 270 481 270
R2 0,000 0,025 0,000 0,025 0,022 0,005 0,002 0,029 0,002 0,029 0,027 0,006
t statistics in parentheses
* p<0,10 ** p<0,05 *** p<0,01

European Commission - Study on the drivers of investments in equity by insurers and pension funds
December 2019 I 250
Annex 3 Analysis of driver scores provided by interviewees
This Annex provides the analysis of scores provided by the insurers and pension funds for the potential drivers of investments in equity.
In order to provide a comparable view of the scores per classification of insurers and pension funds, for instance, by type of EU insurance undertaking, the collected scores are normalised with respect to the sample of all EU insurers. Thus, scores at the EU level are positioned as the reference points for the comparisons. For each driver 𝑑, the normalisation is done through the following formula:
[(𝜇𝑆𝑆𝑑 − 𝜇𝑆𝑆)
𝜎𝑆𝑆
𝜎𝐸𝑈] + 𝜇𝐸𝑈 (1)
where,
𝜇𝐸𝑈 is the average score of all drivers for the sample of the EU insurers 𝜎𝐸𝑈 is the standard deviation of the scores of all drivers for the sample of the EU
insurers 𝜇𝑆𝑆
𝑑 is the average score of a driver, for instance market returns and for a
subsample, for instance life insurers, non-EU insurers or EU pension funds 𝜇𝑆𝑆 is the average score of all drivers for a subsample 𝜎𝑆𝑆 is the standard deviation of all scores of all drivers for a subsample
Plugging in the EU scores to the formula will return the EU values. This method allows us to track the scores from different subsamples around the average EU scores, 𝜇𝐸𝑈.
The normalised score for the EU and different subsamples are reported in the figures below. In these figures, the dashed horizontal line represents the EU average of the scores. The shaded areas below and above the EU average represents one standard deviation distance from the EU average. If a driver has a score one standard deviation above the average,+1𝜎, that driver is considered as a relatively more important driver
than the average of drivers. On the other hand, if a driver has a score one standard deviation below the average,−1𝜎, that driver is considered as a relatively less important driver than the average of drivers. Below, we first present the average scores for per driver at EU level in Figure 56. In Figure 57, normalised scores of drivers by type of insurance undertaking, namely life, non-life and composite, are reported. Figure 58 groups the insurers by the model used. For this graph, a breakdown for standard model, internal model, and partial internal model is available. In Figure 59, a comparison between normalised scores of EU and non-EU insurers is available. It has to be noted that, for this comparison, the drivers of the prudential framework category is not relevant since it includes drivers that are specific to Solvency II.
Finally, Figure 60 reports the normalised scores received by the EU pension funds in comparison to the average scores from the EU insurers and the overall normalised scores. The prudential framework category is not relevant for the pension funds.

European Commission - Study on the drivers of investments in equity by insurers and pension funds
December 2019 I 251
Figure 56 - Average normalised scores per driver for the EU insurers
20,00
30,00
40,00
50,00
60,00
70,00
80,00
Mar
ket
vola
tilit
y
Ave
rage
div
iden
d y
ield
Inte
rest
rat
es
leve
l
Mo
net
ary
po
licie
s
Mar
ket
retu
rns
Mar
ket
even
ts
Mac
roec
on
om
ic f
un
dam
en
tals
Exp
ect
ed e
volu
tio
n o
f in
flat
ion
Mar
ket
stru
ctu
re (
typ
es
of
inve
stm
en
ts, h
edgi
ng,
etc
.)
Ave
rage
du
rati
on
of
liab
iliti
es
Ou
tflo
ws
pro
file
Lap
se r
ate
of
po
rtfo
lio
Oth
er
req
uir
eme
nts
on
ris
k-p
rofi
le o
f cl
ien
ts
Solv
ency
II r
atio
wit
h a
nd
wit
ho
ut
tran
siti
on
al m
eas
ure
s
Solv
ency
II s
ho
rt-t
erm
vo
lati
lity
of
ow
n-f
un
ds
SCR
tre
atm
ent
of
equ
ity
exp
osu
res
Ab
ility
to
imp
lem
en
t an
ass
et-
liab
ility
man
agem
ent
stra
tegy
fo
r in
tere
stra
te r
isk
Ap
plic
atio
n o
f d
ura
tio
n b
ase
d a
pp
roac
h
Size
of
the
co
mp
any
Gu
aran
teed
re
turn
s o
f o
ffer
ed p
rod
uct
s an
d e
xpec
ted
ret
urn
on
inve
stm
ents Ty
pe
of
eq
uit
y in
vest
men
ts
Acc
ou
nti
ng
trea
tmen
t co
st v
ersu
s fa
ir v
alu
e t
reat
me
nt
thro
ugh
P&
L
Imp
airm
ent
rule
s u
nd
er
loca
l GA
AP
an
d IF
RS
Tax
trea
tmen
t o
f re
alis
ed g
ain
s an
d lo
sse
s o
n t
he
sale
of
equ
ity
inve
stm
en
ts
Tax
trea
tmen
t o
f d
ivid
end
s
Spec
ial t
ax e
xem
pti
on
1. Market conditions 2. Asset-Liability Management 3. Prudential framework 4. Undertaking characteristics 5. Accountingframework
6. Tax regime
Average EU Overall average EU

European Commission - Study on the drivers of investments in equity by insurers and pension funds
December 2019 I 252
Figure 57 - Average normalised scores by type of EU insurance undertaking
20,00
30,00
40,00
50,00
60,00
70,00
80,00
Mark
et
vola
tility
Avera
ge d
ivid
end y
ield
Inte
rest
rate
s level
Moneta
ry p
olicie
s
Mark
et
retu
rns
Mark
et
events
Macro
econom
ic f
undam
enta
ls
Expecte
d e
volu
tion o
f in
flation
Mark
et
str
uctu
re (
types o
f in
vestm
ents
, hedgin
g,
etc
.)
Avera
ge d
ura
tion o
f liabilitie
s
Outf
low
s p
rofile
Lapse r
ate
of port
folio
Oth
er
requirem
ents
on r
isk-p
rofile
of
clients
Solv
ency I
I ra
tio w
ith a
nd w
ithout
transitio
nal m
easure
s
Solv
ency I
I short
-term
vola
tility
of
ow
n-f
unds
Capital charg
es f
or
equity e
xposure
s u
nder
Solv
ency I
I
Ability t
o im
ple
ment
an a
sset-
liability m
anagem
ent
str
ate
gy
for
inte
rest
rate
ris
k
Application o
f dura
tion b
ased a
ppro
ach
Siz
e o
f th
e c
om
pany
Guara
nte
ed r
etu
rns o
f off
ere
d p
roducts
and e
xpecte
d r
etu
rn
on investm
ents
Accounting t
reatm
ent
cost
vers
us fair
valu
e t
reatm
ent
thro
ugh P
&L
Impair
ment
rule
s u
nder
local G
AAP a
nd I
FR
S
Tax t
reatm
ent
of
realised g
ain
s a
nd losses o
n t
he s
ale
of
equity investm
ents
Tax t
reatm
ent
of
div
idends
Specia
l ta
x e
xem
ption
1. Market conditions 2. Asset-Liability Management 3. Prudential framework 4. Undertakingcharacteristics
5. Accountingframework
6. Tax regime
Average EU Life EU Non-Life EU Composite EU Overall average EU
+1
s
-1s

European Commission - Study on the drivers of investments in equity by insurers and pension funds
December 2019 I 253
Figure 58 - Average normalised scores by EU standard formula and (partial) internal model users
20,00
30,00
40,00
50,00
60,00
70,00
80,00
Mark
et
vola
tility
Avera
ge d
ivid
end y
ield
Inte
rest
rate
s level
Moneta
ry p
olicie
s
Mark
et
retu
rns
Mark
et
events
Macro
econom
ic f
undam
enta
ls
Expecte
d e
volu
tion o
f in
flation
Mark
et
str
uctu
re (
types o
f in
vestm
ents
, hedgin
g,
etc
.)
Avera
ge d
ura
tion o
f liabilitie
s
Outf
low
s p
rofile
Lapse r
ate
of port
folio
Oth
er
requirem
ents
on r
isk-p
rofile
of
clients
Solv
ency I
I ra
tio w
ith a
nd w
ithout
transitio
nal m
easure
s
Solv
ency I
I short
-term
vola
tility
of
ow
n-f
unds
Capital charg
es f
or
equity e
xposure
s u
nder
Solv
ency I
I
Ability t
o im
ple
ment
an a
sset-
liability m
anagem
ent
str
ate
gy
for
inte
rest
rate
ris
k
Application o
f dura
tion b
ased a
ppro
ach
Siz
e o
f th
e c
om
pany
Guara
nte
ed r
etu
rns o
f off
ere
d p
roducts
and e
xpecte
d r
etu
rn
on investm
ents
Accounting t
reatm
ent
cost
vers
us fair
valu
e t
reatm
ent
thro
ugh P
&L
Impair
ment
rule
s u
nder
local G
AAP a
nd I
FR
S
Tax t
reatm
ent
of
realised g
ain
s a
nd losses o
n t
he s
ale
of
equity investm
ents
Tax t
reatm
ent
of
div
idends
Specia
l ta
x e
xem
ption
1. Market conditions 2. Asset-Liability Management 3. Prudential framework 4. Undertakingcharacteristics
5. Accountingframework
6. Tax regime
Average EU Standard Formula EU Partial Internal Model EU Internal Model EU Overall average EU
+1
s
-1s

European Commission - Study on the drivers of investments in equity by insurers and pension funds
December 2019 I 254
Figure 59 - Average normalised scores by EU and Non-EU insurers
20,00
30,00
40,00
50,00
60,00
70,00
80,00
Mark
et
vola
tility
Avera
ge d
ivid
end y
ield
Inte
rest
rate
s level
Moneta
ry p
olicie
s
Mark
et
retu
rns
Mark
et
events
Macro
econom
ic f
undam
enta
ls
Expecte
d e
volu
tion o
f in
flation
Mark
et
str
uctu
re (
types o
f in
vestm
ents
, hedgin
g,
etc
.)
Avera
ge d
ura
tion o
f liabilitie
s
Outf
low
s p
rofile
Lapse r
ate
of port
folio
Oth
er
requirem
ents
on r
isk-p
rofile
of
clients
Solv
ency I
I ra
tio w
ith a
nd w
ithout
transitio
nal m
easure
s
Solv
ency I
I short
-term
vola
tility
of
ow
n-f
unds
Capital charg
es f
or
equity e
xposure
s u
nder
Solv
ency I
I
Ability t
o im
ple
ment
an a
sset-
liability m
anagem
ent
str
ate
gy
for
inte
rest
rate
ris
k
Application o
f dura
tion b
ased a
ppro
ach
Siz
e o
f th
e c
om
pany
Guara
nte
ed r
etu
rns o
f off
ere
d p
roducts
and e
xpecte
d r
etu
rn
on investm
ents
Accounting t
reatm
ent
cost
vers
us fair
valu
e t
reatm
ent
thro
ugh P
&L
Impair
ment
rule
s u
nder
local G
AAP a
nd I
FR
S
Tax t
reatm
ent
of
realised g
ain
s a
nd losses o
n t
he s
ale
of
equity investm
ents
Tax t
reatm
ent
of
div
idends
Specia
l ta
x e
xem
ption
1. Market conditions 2. Asset-Liability Management 3. Prudential framework 4. Undertaking
characteristics
5. Accounting
framework
6. Tax regime
Average EU Average Non-EU Overall average EU
+1
s
-1s

European Commission - Study on the drivers of investments in equity by insurers and pension funds
December 2019 I 255
Figure 60 - Average normalised scores by EU insurers and EU pension funds
20,00
30,00
40,00
50,00
60,00
70,00
80,00
Mark
et
vola
tility
Avera
ge d
ivid
end y
ield
Inte
rest
rate
s level
Moneta
ry p
olicie
s
Mark
et
retu
rns
Mark
et
events
Macro
econom
ic f
undam
enta
ls
Expecte
d e
volu
tion o
f in
flation
Mark
et
str
uctu
re (
types o
f in
vestm
ents
, hedgin
g,
etc
.)
Avera
ge d
ura
tion o
f liabilitie
s
Outf
low
s p
rofile
Lapse r
ate
of port
folio
Oth
er
requirem
ents
on r
isk-p
rofile
of
clients
Solv
ency I
I ra
tio w
ith a
nd w
ithout
transitio
nal m
easure
s
Solv
ency I
I short
-term
vola
tility
of
ow
n-f
unds
Capital charg
es f
or
equity e
xposure
s u
nder
Solv
ency I
I
Ability t
o im
ple
ment
an a
sset-
liability m
anagem
ent
str
ate
gy for
inte
rest
rate
ris
k
Application o
f dura
tion b
ased a
ppro
ach
Siz
e o
f th
e c
om
pany
Guara
nte
ed r
etu
rns o
f off
ere
d p
roducts
and e
xpecte
d r
etu
rn o
n
investm
ents
Accounting t
reatm
ent
cost
vers
us fair
valu
e t
reatm
ent
thro
ugh
P&
L
Impair
ment
rule
s u
nder
local G
AAP a
nd I
FR
S
Tax t
reatm
ent
of
realised g
ain
s a
nd losses o
n t
he s
ale
of
equity
investm
ents T
ax t
reatm
ent
of
div
idends
Specia
l ta
x e
xem
ption
1. Market conditions 2. Asset-Liability Management 3. Prudential framework 4. Undertaking
characteristics
5. Accounting
framework
6. Tax regime
Average EU Overall average EU EU PF
+1
s
-1s

European Commission - Study on the drivers of investments in equity by insurers and pension funds
December 2019 I 256
Annex 4 Theoretical model of a life insurance company
The assumptions used in the simplified theoretical model for a life insurance company developed in this study are further documented in this Annex.
Product characteristics
Single premium contracts with fixed maturity date after 20 years; Total gross written premiums of 66.131.908 EUR are projected during the 20
years period of 1998-2017: o During the first year annual gross written premiums of 2.000.000 EUR
are taken into account; o As from year 2 until year 20 an annual indexation of 5% is applied on
gross written premiums;
Guaranteed interest rate: o 20-year spot rate based on EURIBOR rates for 2000-2013 and EIOPA RFR
rates for 2014-2017. For the years 1998-1999, the EURIBOR rates are set identical to the year 2000;
o guaranteed interest rate based on 20-year spot rate reduced by profit margin;
o profit margin of 70 basis points (including insurance result and operating costs);
Profit sharing: o no profit sharing is modelled;
Volatility adjustment: o 4 basis points which is kept constant during the 20 years projection period
(spreads on corporate and government bonds is also kept constant);
Capital
Initial capital amounts to 4.000.000 EUR.
Asset allocation applied for investing gross written premiums
Government bonds: variable % set between 0%-30% depending on % of equity, depending on scenario;
Corporate bonds: fixed 40%; Equity: variable % set between 0%-30%, depending on scenario;
This variable equity exposure is o Type 1 – Strategic: 15% of total Equity exposure;
o Type 1 – Non-strategic: 55% of total Equity exposure; o Type 2 – 30% of total Equity exposure;
Cash: fixed 8% (in order to be able to pay corporate taxes).
Asset returns
Equity: two scenarios for the equity returns are taken into account: o Yield scenario 1:
Fixed yield of 7,0% on Type 1 equity and 9,0% on Type 2 equity; the percentages used for the fixed yield are based on the information from CEIOPS advice on the equity risk sub-module, where mean returns were determined for the MSCI indices. The MSCI Europe yields an average

European Commission - Study on the drivers of investments in equity by insurers and pension funds
December 2019 I 257
return of 7,1%.158 For the return on Type 2 equities, limited information is available. Given the calibration and applicable SCR equity shocks Type 2 equity is considered riskier than Type 1 equity whereby a higher average return of 9,0% is assumed. Furthermore, the relative difference 7% and 9% as return is similar as the relative difference between the Type 1 equity shock of 39% and Type 2 equity shock of 49%;
o Yield scenario 2: Yield based on weighted equity index based on historic returns of 10 indices for 1998-2017 (detailed further), used for historical simulations;
Government bonds: o 20-year spot rate based on EURIBOR rates for 1998-2013 and EIOPA RFR
rates for 2014-2017; o constant spread added of 40 basis points;
Corporate bonds: o A-rated corporate bonds;
o 20-year spot rate based on EURIBOR rates for 1998-2013 and EIOPA RFR rates for 2014-2017;
o constant spread added of 100 basis points; o interest rate shock according to Solvency II directive (2009/138/EC);
Cash: 0% return.
Solvency II
Solvency II ratio projection during 20 years period applying standard formula Annual projection of market value balance sheet based upon results of assets
and liabilities and risk free interest rates that are based on EURIBOR rates for 1998-2013 and EIOPA RFR rates for 2014-2017. For the years 1998-1999, the EURIBOR rates are set identical to the year 2000;
Application of the standard formula; SCR interest rate risk:
o interest rate shock according to Solvency II directive (2009/138/EC); SCR spread risk:
o calculated based on modified duration ; o A-rated corporate bonds – constant rating during the projection horizon;
SCR equity risk: o Type 1 equity: shock of 39% + symmetric adjustment; o Type 2 equity: shock of 49% + symmetric adjustment; o strategic equity: shock of 22% o symmetric adjustment is based upon historical symmetric adjustment
observed during the projection period 1998 until 2017 as published by EIOPA;
SCR counterparty default risk:
o A-rated bank located in the EU; Diversification:
o Correlation matrices BSCR, market risk and equity risk based on Solvency II directive (2009/138/EC) standard formula;
o Interest rate risk based on EIOPA RFR curves (w/ and w/o volatility adjustment);
Other: o no concentration risk assumed; o operational risk of 500.000 EUR during the first project year and 5%
annual indexation for the subsequent years;
158 Source: https://eiopa.europa.eu/CEIOPS-Archive/Documents/Advices/CEIOPS-L2-Advice-Design-and-calibration-of-the-equity-risk-sub-module.pdf

European Commission - Study on the drivers of investments in equity by insurers and pension funds
December 2019 I 258
o loss-absorbing capacity of deferred taxes: full recognition depending on assumed taxation in the model.
Accounting treatment
Corporate bonds and government bonds: amortised cost principle; Equity: fair value principle with changes in fair value recorded in profit and loss
account;
Insurance contracts: mathematical reserves whereby guaranteed interest rates are accrued. Current value measurement only applied in the Solvency II market value balance sheet.
Taxation
Taxation based upon accounting result; Variable taxation rate depending on scenario; Tax rate on equity investments can be set separately for tax rate on all other
components.
Figure 61 – Weighted equity index
Source: Deloitte-CEPS analysis
0
10
20
30
40
50
60
70
80
90
100
110
120
130
140
150
160
170
180
190
200
1998 Q
4
1999 Q
4
2000 Q
4
2001 Q
4
2002 Q
4
2003 Q
4
2004 Q
4
2005 Q
4
2006 Q
4
2007 Q
4
2008 Q
4
2009 Q
4
2010 Q
4
2011 Q
4
2012 Q
4
2013 Q
4
2014 Q
4
2015 Q
4
2016 Q
4
2017 Q
4
Weighted Equity Index

European Commission - Study on the drivers of investments in equity by insurers and pension funds
December 2019 I 259
Annex 5 Accounting framework
In order to provide a comparative analysis of the accounting framework within the EU, Table 21 depicts the overview of the applicable GAAP at consolidated and statutory level for all EU Member States.
Table 21 - Applicable GAAP at consolidated and statutory level for all EU member states
Country Applicable GAAP (consolidated level) Applicable GAAP (statutory level)
Listed companies Unlisted companies Listed companies Unlisted companies
AT IFRS required IFRS permitted Austrian GAAP Austrian GAAP
BG IFRS required IFRS required IFRS required IFRS required
BE IFRS required IFRS required Belgian GAAP Belgian GAAP
CY IFRS required IFRS required IFRS required IFRS required
CZ IFRS required IFRS permitted IFRS required IFRS permitted
DE IFRS required IFRS permitted German GAAP German GAAP
DK IFRS required IFRS permitted IFRS permitted159 IFRS permitted
EE IFRS required IFRS required IFRS required IFRS or Estonian GAAP
ES IFRS required IFRS permitted Spanish GAAP Spanish GAAP
FI IFRS required IFRS required IFRS required IFRS required
FR IFRS required IFRS permitted French GAAP French GAAP
GB IFRS required IFRS permitted IFRS permitted UK GAAP
GR IFRS required IFRS required IFRS required IFRS required
HR IFRS required IFRS required IFRS required IFRS or Croatian GAAP
HU IFRS required IFRS permitted Hungarian GAAP Hungarian GAAP
IT IFRS required IFRS required IFRS not permitted160 IFRS not permitted
IE IFRS required IFRS permitted IFRS required IFRS permitted
LV IFRS required IFRS required IFRS required IFRS required
LT IFRS required IFRS required IFRS required IFRS required
LU IFRS required IFRS permitted IFRS permitted IFRS permitted
MT IFRS required IFRS required IFRS required IFRS required
NL IFRS required IFRS permitted IFRS permitted IFRS permitted
PL IFRS required IFRS permitted IFRS permitted IFRS required
PT IFRS required IFRS required IFRS required IFRS permitted
RO IFRS required IFRS required IFRS required IFRS required
SI IFRS required IFRS required IFRS permitted IFRS required
SK IFRS required IFRS required IFRS required IFRS required
SE IFRS required IFRS permitted Swedish GAAP Swedish GAAP
Source: IASB and Deloitte-CEPS analysis
159 IFRSs not required for statutory financial statements, except that IFRS are required for listed insurance companies that
do not prepare consolidated financial statements. 160 IFRSs not permitted for statutory financial statements, except that IFRS are required for listed insurance companies that do not prepare consolidated financial statements.

European Commission - Study on the drivers of investments in equity by insurers and pension funds
December 2019 I 260
Annex 6 Tax framework
Table 22 – Tax treatment of capital gains, losses and dividends across EU Member States
Country
Corporate
tax rate 2016
Capital gains Capital losses Dividends
AT 25% Exempt under
certain conditions Deductible under certain conditions Exempt under certain conditions
BE 34% Exempt under
certain conditions Not Deductible Exempt under certain conditions
BG 10% Not exempt Deductible Exempt
CY 12,5% Exempt under
certain conditions Deductible under certain conditions Exempt
CZ 19% Not exempt Not Deductible Not exempt
DE 30% Not exempt Deductible under certain conditions Not exempt
DK 22% Not exempt Deductible under certain conditions Not exempt
EE 25% Not exempt Deductible Not exempt
ES 30% Exempt under
certain conditions Deductible Exempt under certain conditions
FI 20% Not exempt Deductible Not exempt
FR 34% Not exempt Deductible under certain conditions Not exempt
GB 20%, Not exempt Deductible under certain conditions Not exempt
GR 29% Not exempt Deductible under certain conditions Not exempt
HR 20% Not exempt Deductible Not exempt
HU 19% Exempt under
certain conditions Deductible Exempt
IE 12,5% Not exempt Deductible under certain conditions Exempt under certain conditions
IT 24% Exempt under
certain conditions Deductible under certain conditions Exempt under certain conditions
LT 15% Not exempt Deductible under certain conditions Not exempt
LU 27% Exempt under
certain conditions Deductible Exempt under certain conditions
LV 15% Exempt under
certain conditions Not Deductible Exempt
MT 35% Exempt under
certain conditions Deductible under certain conditions Exempt under certain conditions
NL 25% Exempt under
certain conditions Deductible under certain conditions Not exempt
PL 19% Not exempt Deductible Not exempt
PT 29,5% Not exempt Deductible under certain conditions Not exempt
RO 16% Not exempt Deductible under certain conditions Not exempt
SE 22% Exempt under
certain conditions Deductible under certain conditions Exempt under certain conditions
SI 19% Not exempt Deductible under certain conditions Exempt
SK 22% Not exempt Deductible under certain conditions Exempt under certain conditions
Source: Deloitte-CEPS analysis

European Commission - Study on the drivers of investments in equity by insurers and pension funds
December 2019 I 261
Glossary
Insurance
Alternative funds: Collective investment undertakings whose investment strategies include among others hedging, event driven, fixed income directional and relative value, managed futures, commodities etc. Annuities: A frequent stream of money, which can be used to help increase or protect
savings, or generate a stream of income. Annuities generally fall into two categories: deferred and income. Assistance: Insurance obligations which cover assistance for persons who get into difficulties while travelling, while away from home or while away from their habitual residence.
Asset allocation funds: Collective investment undertakings which invests its assets pursuing a specific asset allocation objective, e.g. primarily investing in the securities of companies in countries with nascent stock markets or small economies, specific sectors or group of sectors, specific countries or other specific investment objective. Asset-Backed Securities Purchase Programme (ABSPP): Part of the ECB’s asset purchase programme (APP). It enhances the transmission of monetary policy, facilitates the provision of credit to the euro area economy, eases borrowing conditions for households and firms and contributes to a sustained adjustment in inflation rates to levels that are below, but close to, 2%, helps banks to diversify funding sources and stimulates the issuance of new securities. Business angel: A wealthy person who invests personal capital in start-up companies.
They invest in return for an equity stake. Capital Markets Union: an EU initiative meant to deepen and further integrate the capital markets of the EU member states, aiming to provide new sources of funding for businesses, reduce the cost of raising capital, facilitate cross-border investing and attract more foreign investment into the EU and make the EU financial system more stable, resilient and competitive. Cash and cash equivalents: Notes and coins in circulation that are commonly used to make payments. Deposits exchangeable for currency on demand at par and which are directly usable for making payments by cheque, draft, giro order, direct debit/credit, or other direct payment facility, without penalty or restriction. Committee of European Insurance and Occupational Pensions Supervisors
(CEIOPS): a European Union financial regulatory institution, replaced by The European Insurance and Occupational Pensions Authority (EIOPA). Credit and suretyship insurance: Insurance obligations, which cover insolvency, export credit, instalment credit, mortgages, agricultural credit and direct and indirect suretyship. Collateralised securities : Securities whose value and payments are derived from a portfolio of underlying assets. Includes Asset Backed Securities (ABS), Mortgage Backed securities (MBS), Commercial Mortgage Backed securities (CMBS), Collateralised Debt Obligations (CDO), Collateralised Loan Obligations (CLO), and Collateralised Mortgage Obligations (CMO). Assets under this category are not subject to unbundling.

European Commission - Study on the drivers of investments in equity by insurers and pension funds
December 2019 I 262
Collective Investment Undertakings: Collective investment undertaking' means an undertaking for collective investment in transferable securities (UCITS) as defined in Article 1(2) of Directive 2009/65/EC of the European Parliament and of the Council or an alternative investment fund (AIF) as defined in Article 4(1) (a) of Directive 2011/61/EU of the European Parliament and of the Council. Common equity: Equity that represents basic property rights on corporations. Composite insurance: Includes a full range of insurance services, including accident, fire, health, investment, life, and pensions. Consumer Price Index (CPI): An economic indicator whose main task is to objectively reflect the price evolution over time for a basket of goods and services purchased by households and considered representative of their consumer habits.
Contractual service margin (‘CSM’): The amount available to provide for overhead expenses and profit. Corporate bonds: Bonds issued by corporations. Corporate Sector Purchase Programme (CSPP): A programme established by the ECB to purchase investment-grade euro-denominated bonds issued by non-bank corporations established in the euro area with the aim of further strengthening the pass-through of the Euro system’s asset purchases to the financing conditions of the real economy. Covered Bond Purchase Programme: Part of the APP (Asset Purchase Program) of the ECB, under which private sector securities and public sector securities are purchased
to address the risks of a too prolonged period of low inflation over the medium term. CMU Action Plan: Commission-adopted action plan setting out a list of key measures to achieve a true single market for capital in Europe. Cost-of-Capital: The minimum rate of return that a business must earn before generating value. Before a business can turn a profit, it must at least generate sufficient income to cover the cost of the capital it uses to fund its operations. Cost of capital consists of both the cost of debt and the cost of equity used for financing a business. Crowd funding: The practice of funding a project or venture by raising money from a large number of people who each contribute a relatively small amount, typically via the Internet.
Day one reporting: ‘Entry’ Reporting package that firms subjected to Solvency II had to submit to their national supervisory authorities on 31 December 2016. Debt funds: Collective investment undertakings mainly invested in bonds. Debt security: A document, which creates or evidences a debt obligation. Examples of the main types of debt securities issued are bonds and notes or commercial paper (CP). Deposits: Deposits other than transferable deposits, with remaining maturity inferior or equal to 1 year, that cannot be used to make payments at any time and that are not exchangeable for currency or transferable deposits without any kind of significant restriction or penalty. Deposits relating to reinsurance accepted.

European Commission - Study on the drivers of investments in equity by insurers and pension funds
December 2019 I 263
Dickey-Fuller panel stationarity test: Tests the null hypothesis that a unit root is present in an autoregressive model. Dotcom bubble: Historic speculative bubble and period of excessive speculation mainly in the United States that occurred roughly from 1995 to 2000, a period of extreme growth in the use and adoption of the Internet. Earning-at-risk (EAR): Measures the quantity by which net income is projected to decline in the event of an adverse change in prevailing interest rates. It provides a robust measure of a credit union’s exposure to adverse consequences from changes in prevailing interest rates. ECB: European Central Bank, the central bank of the 19 European Union countries, which have adopted the euro.
EIOPA Statistics: When referring to EIOPA statistics as a source, the following source documents are meant:
EIOPA Solvency I: Solvency I data as generated by EIOPA for the scope 2005
until 2015. EIOPA Solvency II: S.02.01 balance sheet by item. Quarterly data for period
2016 Q3 until 2018 Q1 Solvency Capital Requirements: S.23.01 own funds and SCR, quarterly data for
period 2016 Q3 until 2018 Q1. Asset exposure: S.06.02 asset exposure quarterly data for period 2017 Q4 until
2018 Q1.
All files are available via the following link: https://eiopa.europa.eu/Pages/Financial-stability-and-crisis-prevention/Insurance-Statistics.aspx
European Economic and Monetary Union (EMU): Involves the coordination of economic and fiscal policies, a common monetary policy, and a common currency, the euro, for all EU Member States. Endowment insurance: Marketed as a savings plan to help meet a specific financial goal, such as paying for children’s education, or building up a pool of savings over a fixed term. Unlike deposits, a part of the premiums go towards insurance coverage, while the rest is invested and subject to risk. ESG factors: Environmental, social and governance factors to be taken into account for investment decisions. Equity: Shares and other securities equivalent to shares representing corporations'
capital, i.e., representing ownership in a corporation. Equity funds : Collective investment undertakings mainly invested in equity. Equity of real estate related corporation: Equity representing capital from real estate related corporations. Equity rights: Rights to subscribe to additional shares of equity at a set price. Equity risk: The risk of investing cash in a company's stock. EU: European Union.

European Commission - Study on the drivers of investments in equity by insurers and pension funds
December 2019 I 264
EURIBOR: Euro Interbank Offered Rate, based on the average interest rates at which a large panel of European banks borrow funds from one another. Euro Area: formed of Member States that replaced their national currency with the Euro. European Accounting Standards (ESA): Internationally compatible EU accounting framework for a systematic and detailed description of an economy. ESA 2010 differs in scope as well as in concepts from its predecessor ESA 95 reflecting developments in measuring modern economies, advances in methodological research and the needs of users. Fédération Française de l’Assurance (FFA): An industry association of French insurance and re-insurance operating in France. It includes twenty-three members, including the eighteen largest groups and companies in terms of turnover.
FED (US Federal Reserve): Central Bank of the United States of America. Fire and other damage to property insurance: Insurance obligations which cover all damage to or loss of property other than those included in the lines other motor insurance or marine, aviation and transport insurance, due to fire, explosion, natural forces including storm, hail or frost, nuclear energy, land subsidence and any event such as theft. Fixed income: Any type of investment under which the borrower or issuer is obliged to make payments of a fixed amount on a fixed schedule. Fixed effects model: Explores the relationship between predictor and outcome variables within an entity (country, person, company, etc.). Each entity has its own
individual characteristics that may or may not influence the predictor variables; used when wanting to see the impact of variables that vary over time. GAAP: Generally Accepted Accounting Principles, developed and established by the Financial Accounting Standards Board (FASB) and the Governmental Accounting Standards Board (GASB), determining how those financial statements are prepared. General liability insurance: Insurance obligations, which cover all liabilities other than those covered by motor vehicle insurance and marine, aviation and transport insurance. Gesamtverband der Deutschen Versicherungswirtschaft (GDV): German Insurance Association.
Gross Domestic Product (GDP): A monetary measure of the market value of all the final goods and services produced in a period of time, often annually. Government bonds: Bonds issued by public authorities, whether by central governments supra-national government institutions, regional governments or local authorities and bonds that are fully, unconditionally and irrevocably guaranteed by the European Central Bank, Member States' central government and central banks denominated and funded in the domestic currency of that central government and the central bank, multilateral development banks referred to in paragraph 2 of Article 117 of Regulation (EU) No 575/2013 or international organisations referred to in Article 118 of Regulation (EU) No 575/2013, where the guarantee meets the requirements set out in Article 215 of Delegated Regulation 2015/35.

European Commission - Study on the drivers of investments in equity by insurers and pension funds
December 2019 I 265
Gross written premiums (GWP): The total premium (direct and assumed) written by an insurer before deductions for reinsurance and ceding commissions. Includes additional and/or return premiums. Written does not imply collected, but the gross policy premium to be collected as of the issue date of the policy, regardless of the payment plan. Harmonised Index of Consumer Prices (HICP): Consumer price inflation, as measured in the Euro area. It measures the change over time in the prices of consumer goods and services acquired, used or paid for by euro area households. The term ‘harmonised’ denotes the fact that all the countries in the European Union follow the same methodology. This ensures that the data for one country can be compared with the data for another. Hausman test: A statistical hypothesis test in econometrics, evaluating the consistency of an estimator when compared to an alternative, less efficient estimator, which is
already known to be consistent. It helps one evaluate if a statistical model corresponds to the data. Health insurance (direct business): Health insurance obligations where the underlying business is pursued on a similar technical basis to that of life insurance, other than those included in ‘Annuities stemming from non-life insurance contracts and relating to health insurance obligations’. IAS 39: An international accounting standard for financial instruments released by the International Accounting Standards Board (IASB). It was replaced in 2014 by IFRS 9, which becomes effective in 2018. IASB: the Independent, Accounting Standard-setting Body of the IFRS Foundation.
IORP II Directive: Sets common standards ensuring the soundness of occupational pensions and better protects pension scheme members and beneficiaries, by means of (i) new governance requirements, (ii) new rules on IORPs’ own risk assessment, (iii) new requirements to use a depositary, and (iv) enhanced powers for supervisors. IFRS 4: Superseded by IFRS 17, see below. IFRS 9: Specifies how an entity should classify and measure financial assets, financial liabilities, and some contracts to buy or sell non-financial items. IFRS 17: specifically refers to insurance contracts, reflects the presentation and disclosure requirements in IFRS 17 Insurance Contracts.
Income protection insurance: Income protection insurance obligations where the underlying business is not pursued on a similar technical basis to that of life insurance, other than obligations included in workers’ compensation insurance. Index-linked and unit-linked insurance: Insurance obligations with profit participation other than Annuities stemming from non-life insurance contracts. Individual Capital Adequacy Standards (ICAS): The previous capital adequacy requirements regime applicable to UK insurers. The ICAS regime was replaced by Solvency II. Infrastructure funds: Collective investment undertakings that invest in utilities such as toll roads, bridges, tunnels, ports and airports, oil and gas distribution,

European Commission - Study on the drivers of investments in equity by insurers and pension funds
December 2019 I 266
electricity distribution and social infrastructure such as healthcare and educational facilities. Institutional investor: Organisations or entities that pool money or resources to invest in securities and assets. Insurance with profit participation: Insurance obligations with profit participation other than obligations included in ‘Annuities stemming from non-life insurance contracts and relating to health insurance obligations’ or ‘Annuities stemming from non-life insurance contracts and relating to insurance obligations other than health insurance obligations’. LAC TP: Loss-absorbing capacity of technical provisions. Lapse risk: Captures the adverse change in the value of insurance liabilities, resulting
from changes in the level or volatility of the rates of policy lapses, terminations, renewals, and surrenders. Large cap companies: Large market capitalisation companies (the market value of a company's issued share capital). Life insurance: Category of insurance contracts for which the benefit payment is based on the occurrence of death, disability, or critical illness of the insured within the specified coverage term, or on the life status of the insured at maturity.
Legal expenses insurance: Insurance obligations, which cover legal expenses and cost of litigation. LTGs: Long-term guarantee measures.
Macaulay duration: Weighted average term to maturity of the cash flows from a bond, a measure of a bond's sensitivity to interest rate changes. Marine, aviation and transport insurance: Insurance obligations which cover all damage or loss to sea, lake, river and canal vessels, aircraft, and damage to or loss of goods in transit or baggage irrespective of the form of transport. Insurance obligations which cover liabilities arising out of the use of aircraft, ships, vessels or boats on the sea, lakes, rivers or canals (including carrier's liability). Mark-to-market (MTM): An accounting method that records the value of an asset according to its current market price. Market Consistent Embedded Value (MCEV): The difference between market value
of assets and market value of liabilities as of valuation date, excluding any item that is not considered shareholder interest. It is calculated on an after-tax basis taking into account current and known future changes in legislation. Medical expense insurance: Medical expense insurance obligations where the underlying business is not pursued on a similar technical basis to that of life insurance,
other than obligations included in workers’ compensation insurance.

European Commission - Study on the drivers of investments in equity by insurers and pension funds
December 2019 I 267
‘Medical expense insurance obligation’ or ‘Health insurance obligation’ means an insurance obligation that covers the following provision or financial compensation:
The provision of medical treatment or care including preventive or curative medical treatment or care due to illness, accident, disability or infirmity, or financial compensation for such treatment or care.
Financial compensation arising from illness, accident, disability or infirmity.
Micro caps: The stock of public companies in the United States which have a market
capitalisation of roughly $50 million to $300 million. Microcap stocks are different from
other stocks since they are from companies with a small market capitalisation and are
usually traded on stock exchanges that do not require minimum standards, such as a
minimum amount of net assets or a minimum number of stock holders.
Minimum Capital Requirement (MCR): The capital level representing the final
threshold that triggers ultimate supervisory measures in the event that it is breached.
Miscellaneous financial loss: Insurance obligations which cover employment risk, insufficiency of income, bad weather, loss of benefit, continuing general expenses, unforeseen trading expenses, loss of market value, loss of rent or revenue, indirect trading losses other than those mentioned above, other financial loss (non-trading) as
well as any other risk of non-life insurance not covered by the other business lines. Money market funds: Collective investment undertakings under the definition provided by ESMA (CESR/10-049). Monte Carlo simulations: A technique used to understand the impact of risk and uncertainty in financial, project management, cost, and other forecasting models. Mortgages and loans: Financial assets created when creditors lend funds to debtors, with collateral or not, including cash pools. Motor vehicle insurance: Insurance obligations, which cover all liabilities arising out of the use of motor vehicles operating on land (including carrier's liability).
MSCI World Index: A broad global equity index that represents large and mid-cap equity performance across 23 developed markets countries. It covers approximately 85% of the free float-adjusted market capitalisation in each country and does not offer exposure to emerging markets. Multilateral trading facility: European regulatory term for a self-regulated financial trading venue. NACE: Statistical classification of economic activities in the European Community (Nomenclature statistique des activités économiques dans la Communauté européenne). Non-life insurance: Generic term used to refer to all types of insurance business other
than Life insurance, including for example Property insurance, Liability insurance, Motor insurance, Accident insurance, and Health insurance.
Non-unit linked insurance: The person contracting cannot choose the investment avenue. The insurance company allocates the funds according to its discretion and strategy.

European Commission - Study on the drivers of investments in equity by insurers and pension funds
December 2019 I 268
Not Reported: Any assets not reported. NSA: National Supervisory Authorities. OECD: Organisation for Economic Co-operation and Development. Other (CIU): Other Collective investment undertakings, not classified under the above categories. Other equity : Other equity, not classified under the above categories. Other investments : Any other assets, not elsewhere shown. Other life insurance: Other life insurance obligations other than obligations included in the five lines of business specified above.
Other motor insurance: Insurance obligations, which cover all damage to or loss of land vehicles (including railway rolling stock). Pooled OLS model: Can be used to derive unbiased and consistent estimates of parameters even when time constant attributes are present, but random effects will be more efficient. Preferred equity: Equity security that is senior to common equity, having a higher claim on the assets and earnings than common equity, but is subordinate to bonds. Private equity funds: Collective investment undertakings used for making investments in equity securities following strategies associated with private equity.
Private placement debt: An alternative means for companies to raise capital, as opposed to traditional bank financing, private equity, mezzanine financing or issuing a corporate bond in the public market. Property: Buildings, land, other constructions that are immovable and equipment. Property and casualty (P&C) insurance: Types of coverage that help protect belongings and also provide liability coverage to help protect you if found legally responsible for an accident that causes injuries to another person or damage to another person's belongings. Public limited liability company: A public company where shareholders are not personally liable for any of the debts of the company, other than for the amount already
invested in the company and for any unpaid amount on the shares in the company, if any. Public Sector Purchase Programme (PSPP): Part of ECB’s asset purchase programme (APP), which includes all purchase programmes under which private sector securities and public sector securities are purchased to address the risks of a too prolonged period of low inflation over the medium term. Purchase Manager Index (PMI): A reflection of how many purchasing managers have reported better than normal business conditions in any given month. Quantitative easing (QE): An asset purchase program meant to prevent sub-zero inflation from further hitting an economy still reeling from the euro zone debt crisis.

European Commission - Study on the drivers of investments in equity by insurers and pension funds
December 2019 I 269
Random effects model: A statistical model where the model parameters are random variables. Real estate funds: Collective investment undertakings mainly invested in real estate. Reinsurance: Type of risk mitigation on the basis of an insurance contract between one insurer or pure reinsurer (the reinsurer) and another insurer or pure insurer (the cedent), to indemnify against losses, partially or fully, on one or more contracts issued by the cedent in exchange for a consideration (the premium).
Securities Markets Programme (SMP): Put in place by ECB to ensure depth and liquidity in malfunctioning segments of the debt securities markets and to restore an appropriate functioning of the monetary policy transmission mechanism.
SME: Small and Medium-sized Enterprises. Solvency I framework: 70’s under the First Council Non-Life Directive (73/239/EEC) in 1973 and the First Council Life Directive (79/267/EEC) in 1979. In effect, the Solvency I prudential regime consisted of national regulations that were prescriptive regarding insurers’ investment allocations. Solvency II framework: Sets the high-level principles for the calculation of the capital
requirements of insurance companies in the 28 Member States of the EU, was adopted in November 2009. Solvency Capital Requirement (SCR): The amount of capital to be held by an insurer to meet the Pillar I requirements under the Solvency II regime.
Solvency and Financial Condition Reports (SFCRs): According to Articles 51, 53,
54 and 256 of the Solvency II Directive, (re)insurance undertakings and insurance groups are required to produce and publicly disclose the Solvency and Financial Condition Reports.
Solvency margin: The insurer's unimpaired surplus as a percent of outstanding loss reserve (OLR).
Strategic Asset Allocation: A traditional approach to building a portfolio. With strategic asset allocation you determine how much of your money should be invested in broad categories of investments, such as stocks or bonds, and once you have decided upon an allocation you stick to that allocation for many years. Structured Notes: Hybrid securities, combining a fixed income (return in the form of fixed payments) instrument with a series of derivative components. Excluded from this
category are fixed income securities that are issued by sovereign governments. Concerns securities that have embedded one or a combination of categories of derivatives, including Credit Default Swaps (CDS), Constant Maturity Swaps (CMS), and Credit Default Options (CDOp). Assets under this category are not subject to unbundling. Technical provisions: The amount needed under a certain measurement of a present obligation to meet that obligation adequately. The term ‘technical provision’ is a part of the provision separated for presentation purposes, referring to parts subject to uncertainty.

European Commission - Study on the drivers of investments in equity by insurers and pension funds
December 2019 I 270
Term life insurance: Life insurance that provides coverage at a fixed rate of payments for a limited period of time, the relevant term. Unit-linked insurance: Unit-linked insurance relates to insurance policies for which the policyholder’s premiums are invested in financial instruments of which the returns depend on the performance of an equity index or financial fund, but still with the coverage of an insurance policy. Value-at-Risk: Largest loss likely to be suffered on a portfolio position over a holding period (usually 1 to 10 days) with a given probability (confidence level). VAR is a measure of market risk, and is equal to one standard deviation of the distribution of possible returns on a portfolio of positions. Variance-covariance approach: Makes use of covariances (volatilities and correlations) of the risk factors and the sensitivities of the portfolio values with respect
to these risk factors with the goal of approximating the value at risk. Venture capital: Start-up or growth equity capital or loan capital provided by private investors (the venture capitalists) or specialised financial institutions (development finance houses or venture capital firms). VIX volatility index: Measures the expectation of stock market volatility over the next 30 days implied by S&P 500 index options. Workers’ compensation insurance: Health insurance obligations, which relate to accidents at work, industrial injury and occupational diseases and where the underlying business is not pursued on a similar technical basis to that of life insurance.
Source: European Commission161 and EIOPA Annex IV and Annex V162
161 https://eur-lex.europa.eu/legal-content/EN/TXT/PDF/?uri=OJ:L:2015:012:FULL&from=EN 162 EIOPA, Annex IV and ANNEX V Reporting Templates

European Commission - Study on the drivers of investments in equity by insurers and pension funds
December 2019 I 271
Pension Funds
The following definitions explain the pension fund related terminology used for the country factsheets. Defined Benefit schemes (DB): Retirement benefit plans under which amounts to be paid as retirement benefits are determined by reference to a formula usually based on employees' earnings and/or years of service.
Defined Benefit contribution based schemes: A plan in which benefits are mostly determined by the contributions paid and the results of their investment, but that offers minimum guarantees and in the case of occupational pensions, the employer has the final responsibility for the minimum guarantees. Defined Contributions schemes (DC): A pension plan where the only obligation of the plan sponsor is to pay a specified contribution (normally expressed as a percentage of the employee’s salary) to the plan on the employee behalf. There are no further promises or ‘guarantees’ made by the sponsor. Defined Contribution with guarantees:
A plan, which operates like a DC scheme but which targets a specified level of benefits at retirement.
A plan which operates like a DC scheme but which guarantees a minimum rate of investment return on contributions paid.
A plan which operates like a DC scheme but which guarantees a certain annuity purchase price (annuity conversion factor).
A DC plan, which guarantees that at least the sum of contributions paid, is returned.
Hybrid schemes (HY): A plan which has two separate DB and DC components but which are treated as part of the same scheme. IAS 19: Outlines the accounting requirements for employee benefits, including short-term benefits (e.g. wages and salaries, annual leave), post-employment benefits such as retirement benefits, other long-term benefits (e.g. long service leave) and termination benefits.
Pan-European Personal Pension (PEPP) Plan: An initiative of the European Commission that ensures that all Pan-European Personal Pension Products will have the same standard features wherever they are sold in the EU and can be offered by a broad range of providers, such as insurance companies, banks, occupational pension funds, investment firms and asset managers. They will complement existing state-based, occupational and national personal pensions, but not replace or harmonise national personal pension regimes. Statutory pensions: The majority of gainfully active individuals working as employees, and some of those working on a self-employed basis, are subject to obligatory insurance under the statutory pension scheme. Occupational pension funds: Usually involve both employee and employer
contributions. This type of pension plan involves an employer contributing to an employee's pension within the DC scheme.
Source: EIOPA163
163 EIOPA, 2017, https://eiopa.europa.eu/Publications/Surveys/EIOPA_BoS-17-376_EEA_pension%20statistics%202004-2016_update_07-12-2017.xls