Dynamic security issues in autonomous power systems with increasing wind power penetration
Upload
khangminh22Category
view
1download
0

1
DECEMBER, 2018
Prepared by
World Institute of Sustainable Energy, Pune
Study of Wind Power Density Zones of 42 Wind Power Projects Commissioned under
MERC RE Tariff Regulations 2010
Submitted to:
Maharashtra Energy Development Agency MHADA Commercial Complex, II floor,
Opp: Tridal Nagar, Yerwada PUNE - 411 006 (Maharashtra), INDIA

2

3
Brief Background of the Study
Maharashtra Electricity Regulatory Commission had issued its first Renewable Energy Tariff
Regulations 2010 wherein it had specified Wind Power Density (WPD) Zone wise tariff for the projects
to be commissioned in Maharashtra over its control period. On completion of its tenure MERC had
revised its regulation and new regulation MERC Renewable Energy Tariff Regulations 2015 come into
effect after 1st April 2015.
Maharashtra Electricity Distribution Co. Ltd, the distribution licensee, had entered in to PPA with
wind generators for procurement of power generated from wind power projects commissioned
under the control period of the said regulation. MERC had issued annual tariff orders under this
regulation for procurement of wind power from the projects commissioned in the respective year.
As per MERC RE tariff Regulations 2010, the wind power procurement tariffs are linked with the wind
power density zones defined as follows:
Wind Zone Wind Power Density at 50 mtr (Watts/Sq mtr.)
CUF (%)
Zone 1 200 to 250 20%
Zone 2 250 to 300 23%
Zone 3 300 to 400 27%
Zone 4 > 400 30%
Maharashtra Electricity Distribution Company Ltd (MSEDCL), the purchaser of electricity generated
from the wind power projects observed that most of the wind projects commissioned under this
MERC RE Tariff Regulations 2010, were under Zone 1 where the maximum technical CUF of 20% was
determined. MSEDCL further observed that 42 wind power projects commissioned under Zone 1
were consistently generating electricity at CUF of more than 20% for consecutive two to three years.
Hence, MSEDCL filed a petition before Hon. MERC for
“Admit the present Petition as per the provisions of the Regulation 79, 80 & 81 of MERC (RE Tariff) Regulations, 2015.
Revise Wind Zone classification of 42 generators.
Devise a procedure to adopt 80 m. hub height (or more) data for Wind power density measurement, to link up actual generation data with Wind Zone classification.
To issue directives to MEDA to review the Wind Zone classification of 42 Wind generators & revise them as per the actual generation.
To issue direction to MEDA to adopt the methodology suggested by MSEDCL till the procedure to adopt 80 m hub height creation is finalized by MEDA….”

4
On the above prayers under MSEDCL petition, Hon MERC had issued its order on 03 April, 2018 on
the Case No. 41 of 2017, In the matter of Petition of Maharashtra State Electricity Distribution Co.
Ltd. for revision in Wind Zone classification of Wind Energy Projects with consistently higher
generation.
MSEDCL on 18 May 2018 had submitted its review petition on the MERC order dated 3 April 2018 on
the case no 41 of 2017. Based on the review petition Hon. MERC has issued its order dated 9 July
2018 on the case 152 of 2018 in the matter of “Petition of Maharashtra State Electricity Distribution
Co. Ltd. (MSEDCL) for Review of Order dated 03 April, 2018 in Case No. 41 of 2017 passed by the
Commission in the matter of Petition of MSEDCL for revision in Wind Zone classification of Wind
Energy Projects with consistently higher generation.”
In the order on case no 152 of 2018, Hon. MERC had issued its directives to Maharashtra Energy
Development Agency (MEDA), the state nodal agency to:
“to review the Wind Zone classification of the instant 42 Wind Generators and review the Wind Zone classification for all the remaining such Wind Generators at the end of the current financial year based on the actual generation data submitted by MSEDCL /Generators”
Further while undertaking this wind power density review study, Hon. Commission guided that MEDA
will consider following points:
If the generation is more than the allotted Wind Zones and CUF, then MEDA will make a
recommendation about change in wind zone classification after taking into consideration, the
wind power density and the technology employed by the generator.
the benefits of technology in terms of injecting more wind power into grid would need to be
passed on to the wind generator.
the generator cannot simultaneously take advantage of the higher tariff fixed for low wind
zone classification claiming just the technological superiority of the machine
CUF indicated in the respective wind zones is treated as the upper limit for claiming tariff of
that wind zone.
Any generation more than the assigned CUF would either change the classification or lapse the
additional generation or adjust the additional generation in the subsequent year.
annual verification needs to be carried out for the first three years from the date of
commissioning (COD) of such Wind Generators and the correct Wind Zone classification based
on average CUF as submitted by MSEDCL/Generators needs to be decided, which will be
applicable for the remaining tenure of the EPA, if any, with MSEDCL/Distribution Licensees, so
that the benefits of better efficiency can be availed by generators and proportionately shared
with consumers of Maharashtra.

5
With the above brief background and directives of Hon. Commission, MEDA entrusted the work to
World Institute of Sustainable Energy (WISE) to study, analyse wind power density of 42 wind power
projects referred by MSEDCL and prepare report as per Hon. MERC order dated 9th July 2018 in case
no 152 of 2018 regarding revision of Wind Zone classification of wind power projects.

6
MSEDCL’s submission/observation on CUF of 42 Wind Power Projects
In the matter of MERC case no.152 of 2018, MSEDCL had shortlisted 42 wind power projects commissioned under Wind Zone 1 and are consistently generating at higher CUF than determined by MERC under its RE Tariff Regulations 2010.
Following 42 wind power projects commissioned in Zone 1 are shortlisted by MSEDCL for revision of its wind zone and related tariff:
Name of Project District No of WTG MW
Year of Commissioning
Zone as per MEDA
Zone proposed by MSEDCL based on actual Generation
Applicable Tariff as per MERC RE Tariff Order
Tariff proposed by MSEDCL for revised Zone
Purushottam Lohia Satara 1 0.8 2010-11 Zone 1 Zone IV
5.07
3.38
Shraddha Energy & Infraprojects Pvt.Ltd.
Satara 4 6 2010-11 Zone 1 Zone II 4.41
Shraddha Energy & Infraprojects Pvt.Ltd.
Satara 1 1.5 2010-11 Zone 1 Zone III 3.75
Hindustan Zinc Ltd Nandurbar 2 3 2011-12 Zone 1 Zone II
5.37
4.67
S K Parik Satara 1 1.25 2011-12 Zone 1 Zone III 3.97
B. C. & Sons. Satara 1 1.25 2011-12 Zone 1 Zone III 3.97
Shraddha Energy & Infraprojects Pvt.Ltd.
Satara 6 9 2011-12 Zone 1 Zoen III 3.97
Pertinent Infra & Energy Ltd.
Satara 1 1.5 2011-12 Zone 1 Zone II 4.67
BMD Pvt. Ltd. Satara 3 4.5 2011-12 Zone 1 Zone III 3.97
Bhilwara Green Energy Ltd.
Satara 6 9 2011-12 Zone 1 Zone II 4.67
Bhilwara Green Energy Ltd.
Satara 6 9 2011-12 Zone 1 Zone II 4.67
Bhilwara Green Energy Ltd.
Satara 2 3 2011-12 Zone 1 Zone III 3.97
BMD Pvt. Ltd. Satara 1 1.5 2011-12 Zone 1 Zone III 3.97
Bhilwara Green Energy Ltd.
Satara 1 1.5 2011-12 Zone 1 Zone II 4.67
Green Infra BTV Ltd. Satara 1 1.5 2011-12 Zone 1 Zone III 3.97
Rajasthan Gum Pvt. Ltd., Sangli 1 2.1 2012-13 Zone 1 Zone II
5.67
4.93
Topaz Investments Pvt.Ltd. Satara 1 1.5 2012-13 Zone 1 Zone III 4.2
BLP Wind Project (Ambheri)Pvt. Ltd.
Satara 2 1.6 2012-13 Zone 1 Zone II 4.93

7
Bhilwara Green Energy Ltd.
Satara 3 4.5 2012-13 Zone 1 Zone III 4.2
Panama Wind Energy Pvt.Ltd.
Satara 5 8 2012-13 Zone 1 Zone III 4.2
Suyog Development Corporation Ltd.
Satara 2 1.6 2012-13 Zone 1 ZoneII 4.93
BLP Wind Project (Ambheri)Pvt. Ltd.
Satara 7 5.6 2012-13 Zone 1 Zone III 4.2
Ratnagiri Wind Power Project Pvt. Ltd.
Satara 9 14.4 2012-13 Zone 1 Zone II 4.93
Bhilwara Energy Limited Sangli 1 2 2013-14 Zone 1 Zone II
5.81
5.05
Priyadarshini Polysacks Ltd.
Satara 1 1.5 2013-14 Zone 1 Zone II 5.05
Panama Wind Energy Pvt.Ltd.
Satara 1 1.6 2013-14 Zone 1 Zone III 4.31
Bothe Wind Farm Development Pvt.Ltd.
Satara 1 2 2013-14 Zone 1 Zone II 5.05
Ratnagiri Wind Power Project Pvt.Ltd.
Satara 5 8 2013-14 Zone 1 ZoneII 5.05
Pristine Industries Ltd. Satara 1 1.5 2013-14 Zone 1 Zone II 5.05
Bhilwara Green Energy Ltd.
Satara 1 1.5 2013-14 Zone 1 Zone III 4.31
Ratnagiri Wind Power Project Pvt. Ltd.
Satara 4 8 2013-14 Zone 1 Zone II 5.05
Ratnagiri Wind Power Project Pvt. Ltd.
Satara 4 6.4 2013-14 Zone 1 Zone III 4.31
Green Infra Wind Energy Ltd.
Satara 5 7.5 2013-14 Zone 1 Zone III 4.31
Green Infra Wind Energy Ltd.
Satara 1 1.5 2013-14 Zone 1 Zone III 4.31
Green Infra Wind Energy Ltd.
Satara 6 9 2013-14 Zone 1 Zone II 5.05
Ratnagiri Wind Power Project Pvt.Ltd.
Satara 2 3.2 2013-14 Zone 1 Zone III 4.31
Khandke Wind Energy Pvt.Ltd.
Satara 13 10.4 2013-14 Zone 1 Zone III 4.31
Green Infra Wind Energy Ltd.
Satara 9 13.5 2013-14 Zone 1 Zone III 4.31
Green Infra Wind Energy Ltd.
Satara 8 12 2013-14 Zone 1 Zone III 4.31
Green Infra Wind Energy Ltd.
Satara 8 12 2013-14 Zone 1 Zone III 4.31
Green Infra Wind Energy Ltd.
Satara 4 6 2013-14 Zone 1 Zone III 4.31
NSL Wind Power Company(Satara)Pvt.Ltd.
Satara 3 4.5 2013-14 Zone 1 Zone III 4.31
Total 145 205.7

8
MSEDCL had shortlisted a sample of 340 wind power projects which are generating at higher CUF and out of which they further shortlisted 42 wind power projects which are consistently generating at higher CUF than 20% (which is a target for Zone I) for first two/three years. Based on the actual CUF MSEDCL had proposed change in zone of wind power project from Zone I to Zone II or III of IV. MSEDCL has also proposed to change the tariff of these projects as above. MSEDCL Observations:
MSEDCL had analyzed a sample size of 340 wind power projects for its annual CUF during the
financial year 2013-14, 2014-15, 2015-16.
Out of 340 wind projects, wind Zone I has been allotted to 328 projects and wind zone 2 has
been allotted to 12 projects by MEDA.
Out of 328 wind power projects, classified under wind zone 1, 42 wind power projects are
getting higher generation with CUF consistently more than 20%.
Out of the 42 wind projects, 30 projects are getting higher generation with CUF more than
20% for consecutive three years and 12 projects for consecutive two years.
Higher CUF implies that 19 wind power projects (CUF>20%) should have been classified in to
wind zone II, 22 wind power projects (CUF >23%) should have been classified in to wind zone
III and 1 wind power project (CUF >27%) should has been classified in to wind zone IV.
The wind zone classification by MEDA directly determines which tariff is applicable to the
wind project and thus huge financial implications on long term basis as long as the projects life
span of 25 year.
Considering the tariff determination of FY 2013-14, the tariff difference between wind zone 1
tariff of Rs 5.81 to tariff of Rs 3.88 p.u. for wind zone 4 is as huge as Rs 1.93 p.u.
Thus, wind generators are getting unduly benefitted twice; in terms of enhanced generation
and in terms of highest tariff at the same time whereas the financial burden is passed on to
the common consumers of the state.
Considering the actual data, the financial implications for 3 years under consideration
amounts to Rs. 139Crs.
In view of above, MSEDCL suggested:
o Wind zone classification needs to be reviewed at the end of financial year based on the
actual generation submitted by the generator.
o If the generation is more than wind zone 1CUF, the wind zone classification needs to
be changed accordingly and the amount should be reconciled.
o The relevant wind zone tariff needs to be made applicable for the next financial year.
o If the generation is within the range of classified wind zone, the same wind zone needs
to be considered for next financial year.
o Such type of annual verification needs to be carried out for the first three years from
the date of commissioning and correct wind zone classification based on average CUF

9
needs to be decided which will be applicable for the remaining tenure of EPA so that
benefits of better efficiency can be passed on to the common consumers.
o MSEDCL further clarified that, revision in classification of wind zone will not affect the
cost recovery of wind generators at all as they will get the MERC determined tariff in
accordance to their CUF, but it will certainly provide relief to common consumers
through reduction of power purchase cost.
o MSEDCL suggested that at least for 42 wind generators wind zone classification may be
reviewed and revised immediately.

10
Analysis: Based on the suggestions the MERC order 152 of 2018, the analysis of CUF and related issues is being conducted in two parts. In the Part I of the analysis includes only 42 wind power projects under objection. In Part II of the analysis all the projects commissioned under MERC RE Tariff Regulations 2010 are analyzed.
PART I 1.1 Analysis of Data Sample Size selected by MSEDCL
MSEDCL had shortlisted a sample of 42 wind power projects with total installed capacity of
205.7MW out of the shortlisted 340 wind power projects commissioned under control period
of MERC RE Tariff Regulations 2010 and were assigned Zones as per the wind power density at
50 mtr height.
Further, the shortlisted / analyzed 340 wind power projects were generating at annual CUF of
more than 20% (which is the upper limit for Zone 1) for first three years after their
commissioning. From the 340 shortlisted projects the 42 projects are consistently generating
at higher CUF than that of 20% for the first three years of commissioning.
The sample of projects studied by MSEDCL is not the complete sample of wind power projects
commissioned during the control period of MERC RE Tariff Regulations 2010.
Table: Installed Capacity of Wind Power Projects during the control Period of MERC TR Tariff Regulations 2010
Financial Year Installed capacity wind power projects (in MW) Commissioned under the control period of MERC RE Tariff Regulation 2010
2010-11 239.05
2011-12 407.6
2012-13 288.55
2013-14 1074
2014-15 364.15
Total 2373.35
From above table, it can be analyzed that the sample selected by MSEDCL is not a complete sample
and only 8.66% of wind power projects commissioned under MERC RE Tariff Regulations 2010 were
analyzed.

11
1.2 Requirement of analysis of CUF and wind power density on wind farm basis
As per wind zoning procedure adopted by MEDA, the wind zones have been defined as per the wind
power density of nearest wind mast at 50meter. Further, wind turbines within radial distance of 10
km are allowed to consider the mast data for wind zoning. Hence, the wind turbines close to the wind
mast and falling within 10km radial distance will have same wind zone. The sample selected by
MSEDCL is based on the higher generation for initial three years of period. The developer/investor
may have part of the wind turbines towards prominent wind direction and part of it behind the first /
second row of wind turbines which are bound to generate less due to array loss and/or due to
positioned at the opposite side of the prominent wind direction. Hence, while analyzing the CUF and
wind power density of selected 42 wind turbines the analysis has to be done for every wind mast and
all the wind turbines which are referring the same mast needs to be considered while accessing the
actual CUF achieved by these projects.
The shortlisted wind power projects and related wind masts, their installation date, ownership etc.
related information is tabulated as follows:
Sr. No Name of the Project Capacity in
MW Details of Ref Wind Mast Mast Ownership
Nandurbar District Mast 1
1 Hindustan Zinc Ltd 1.5 Village Chakla, Dist. Nandurabar 21°16'53.0'' 74°18'30.2''
Suzlon
2 Hindustan Zinc Ltd 1.5
Kolhapur District Mast 2
3 M/s Bhilwara Energy Ltd. 2 Village Katholi, Dist Kolhapur 16°57'54.2'' 73°58'28.4''
NIWE
Sangli District Mast 3
4 GREEN INFRA WIND ENERGY LTD.(BS10 TO 13 SM1,11 T 13.5 Village Bhud, Dist, Sangli 17°21'18.3'' 74°41'48.9''
ReGen Powertech
5 GREEN INFRA WIND ENERGY LTD. (BS15,4 TO 9 SM 2) 12
6 GREEN INFRA WIND ENERGY LTD. (BS16 TO 19,22,24, 12
7 GREEN INFRA WIND ENERGY LTD. (BS 20,25,27, SM7) 6
Mast 4
8 1)SHRADDHA ENERGY & INFRAPROJECTS PVT.LTD. (SH04 T 6 Village - Bhud (Kaledhon), Dist. Satara 17°27'52.8'' 74°40'25.0''
ReGen Powertech
9 2)SHRADDHA ENERGY & INFRAPROJECTS PVT.LTD. (SH 09) 1.5
10 5) PERTINENT INFRA & ENERGY LTD.( RB 08) 1.5
11 3)SHRADDHA ENERGY & INFRAPROJECTS PVT.LTD. (RB 01 9
12 6)TOPAZ INVESTMENTS PVT.LTD. (SH08) 1.5
13 3) NSL WIND POWER COMPANY (SATARA)PVT.LTD. (NSL-03, 4.5
14 7)PRIYADARSHINI POLYSACKS LTD. (RB 14) 1.5
15 8)PRISTINE INDUSRIES LTD. (RB 15) 1.5
16 Green Infra BTV Ltd. 1.50
Mast 5
17 Rajasthan Gum Pvt. Ltd.
2.1 Village - Jath II, Dist. Sangli 16°58'48'' 75°13'52.3''
Suzlon
Mast 6
18 3)SUYOG DEVELOPMENT CORPORATION LTD.(F17,18) 1.6 Village Jamb Ambheri, Dist. Satara 17°36'48.9'' 74°16'52.5''
Kenersys
19 2)BLP WIND PROJECT (AMBHERI)PVT LTD. ((F1 TO 7)) 5.6
20 3)BLP WIND PROJECT (AMBHERI)PVT LTD. ((F8 TO 9)) 1.6
Mast 7
21 1) KHANDKE WIND ENERGY PVT.LTD.(KH74,75,77 TO KH 8 10.4
Village - Kaledhon, Dist. Satara 17°26'37.1'' 74°40'25.1''
Enercon
Mast 8
22 17)S K PARIK ( S 021) 1.25 Village - Sadawaghapur, Dist. Satara 17°25'26.7'' 73°55'42.2''
Suzlon
23 18)B. C. & SONS. (S 023) 1.25
Mast 9

12
24 3)PURUSHOTTAM LOHIA(CHW03) 1.6
Village - Chavaneshware, Dist. Satara 17°52'48.8'' 74°02'32.9''
Suzlon
Mast 10
25 1) PANAMA WIND ENERGY PVT.LTD.(T8) 8
Village - Palsi, Dist. Satara 17°16'09.8'' 73°49'48.4''
NIWE
26 RATNAGIRI WIND POWER PROJECT PVT.LTD. (T27 TO T28) 3.2
27 1) RATNAGIRI WIND POWER PROJECT PVT. LTD. (T 13, 1 8
28 2) RATNAGIRI WIND POWER PROJECT PVT.LTD. ( T18,19, 6.4
Mast 11
29 1) GREEN INFRA WIND ENERGY LTD. ( GF 07, 08,09,11, 7.5 Village - Humbarne, Dist. Satara 17°16'17.3'' 73°48'01.5''
Suzlon
30 2) GREEN INFRA WIND ENERGY LTD. (GF 17) 1.5
31 3) GREEN INFRA WIND ENERGY LTD. (GF 10,GF12 TO 15 9
Mast 12
32 1)BOTHE WIND FARM DEVELOPMENT PVT.LTD. (I-7) 2
Village - Bothe, Dist. Satara 17°47'8.7'' 74°22'8.3''
Vestas Wind Technologies
Mast 13
33 RATNAGIRI WIND POWER PROJECT PVT.LTD. (T 32,34,36, 8 Village - Kalkewadi, Dist. Satara 17°17'54.7'' 73°54'08.7''
Green Mint Power Pvt. Ltd
Mast 14
34 BMD Pvt. Ltd. 4.50 Village - Agaswadi, Dist. Satara 17°33'28.9'' 74°37'22.0''
ReGen Powertech
35 Bhilwara Green Energy Ltd. 9.00
36 Bhilwara Green Energy Ltd. 9.00
37 Bhilwara Green Energy Ltd. 3.00
38 Bhilwara Green Energy Ltd. 4.50
39 BMD Pvt. Ltd. 1.50
40 Bhilwara Green Energy Ltd. 1.50
41 Bhilwara Green Energy Ltd. 1.50
Total 205.7 MW
From above table it can be seen that the 42 wind power projects shortlisted by MSEDCL are
spread across four districts and fourteen wind masts.
While defining wind zone, data of nearest wind mast was referred. It can be observed that
there will be additional wind power projects within the radial distance of 10km of the above
14 wind masts and hence the CUF data of all the projects within the radial distance of 10km
needs to be analyzed. Also in some cases there are two wind masts within the radial distance
of 10 km and the projects closest to wind mast were allotted wpd zone as per the nearest
wind mast.
Hence, analysis of CUF is done for a) wind farm located around the wind mast and b) for wind
projects connected to the neatest substation considering one wind farm is connected to one
substation.
The wind masts associated with the shortlisted 42 wind power projects, their location,
ownership details and installation date / data is as follows:
Table: List of Wind Masts Considered for Zoning of 42 wind power projects Sr. no
District Wind Farm/Mast details Date of Commissioning / Period of data considered
for zoning
Ownership of Wind Mast
1 Nandurbar Village - Chakla, Dist. Nandurabar 21°16'53.0'' 74°18'30.2''
Aug 2003 to Jul 2004 SUZLON
2 Kolhapur Kotoli Taluka - Shahuwadi District - Kolhapur ,Latitude- N 160 57’ 54.2’’ Longitude- E 730 58’ 28.4’’
May 1994 to Oct 1997 NIWE
3 Sangli 1 Village - Jath II, Dist. Sangli 16°58'48'' 75°13'52.3''
Aug 2008 to Jul 2009 SUZLON

13
4 Sangli 2 Village - Bhud, Dist. Sangli 17°21'18.3'' 74°41'48.9''
Dec 2010 to Nov 2011 ReGen Powertech
5 Sangli 3 Village Bhud Tal-Khatav Dist. Satara Latitude 170 27’ 52.8’’ N Longitude 740 40’ 25’’ E
May 2009 to Apr 2010 ReGen Powertech
6 Satara 1 Jamb Ambheri Tal. Khatav Dist. Satara Latitude - 170 36’ 48.9’’ N, Longitude - 740 16’ 52.5’’ E & Elevation- 990 m AMSL
Jan 2010 to Dec 2010 Kenersys
7 Satara 2 Khanapur, Tal. Khatav, Dist. Satara ,Latitude- 170 26’ 37.1’’ N Longitude- 740 40’ 25.1’’ E
Aug 2009 to July 2010 Enercon
8 Satara 3 Sadawaghapur Tal. Patan Dist. Satara Latitude - 170 25’ 26.7’’ N, Longitude - 730 55’ 42.2’’ E
Jul 2008 to Jun 2009 SUZLON
9 Satara 4 Village - Chavaneshware, Dist. Satara 17°52'48.8'' 74°02'32.9''
Aug 2009 to July 2010 Enercon
10 Satara 5 Palshi Tal. Patan Dist. Satara Latitude - 170 16’ 09.8” N, Longitude - 730 49’ 34.02” E & Elevation - 1008 m AMSL, having WPD - 203.00 W/m2 @ 50 m agl
21/10/2000
11 Satara 6 Village - Humbarne, Dist. Satara 17°16'17.3'' 73°48'01.5''
Apr 2010 to Mar 2011 Suzlon
12 Satara 7 Village - Bothe Taluka - Maan District - Satara (Latitude- N 170 47’ 08.7’’ Longitude- E 740 22’ 08.3’’
Jun 2006 to May 2007 Vestas Wind Technologies
13 Satara 9 Natoshi Tal. Patan Dist. Satara Latitude - 17 17’ 54.7” N, Longitude - 730 54’ 08.7” E
Dec 2008 to Nov 2009 Green Mint Power Pvt Ltd
14 Satara 10 Village - Agaswadi, Dist. Satara 17°33'28.9'' 74°37'22.0''
Dec 2008 to Nov 2009 ReGen Powertech
From above table it can be analyzed that out of these 14 wind masts one wind mast is owned
by NIWE and rest 13 wind masts are owned by private developers. Hence, complete wind data
of only one wind masts is available for analysis.
The masts date of commissioning is not available. However, the period of measurement
considered for wpd assessment is available and it is assumed that mast will be commissioned
one / two months prior to the period of data collection. Hence, all the wind masts are
commissioned prior to the date of publication of MERC RE tariff Regulations 2010 except one
located at Budh. The mast owned by ReGen Powertech located at Budh had considered the
data from Dec 2010 to Nov 2011 and mast owned by Suzlon located at Humbarne had
considered the data from Apr 2010 to Mar 2011.
1.3 Analysis of CUF data on wind farm basis
The wind power projects commissioned within the radial distance of 10km or the projects for whom
the wind mast data was referred were analyzed together considering to be a part of one wind farm.
The detailed list wind power projects around the 42 wind power projects spread across 14 wind
masts along with their actual CUF achieved is enclosed as Annexure 1 and its summary is presented
as follows:
Sr. no District Wind Farm/Mast details Total
Installed Capacity in MW
2010-11
2011-12
2012-13
2013-14
2014-15
2015-16
2016-17
2017-18
Wind farm
Average

14
1 Nandurbar Village - Chakla, Dist. Nandurabar 21°16'53.0'' 74°18'30.2''
73.8 25.04 25.23 19.27 22.16 23.46 20.31 22.58
2 Kolhapur Kotoli Taluka - Shahuwadi District - Kolhapur ,Latitude- N 160 57’ 54.2’’ Longitude- E 730 58’ 28.4’’
42 17.72 19.92 17.04 18.03
3 Sangli 1 Village - Jath II, Dist. Sangli 16°58'48'' 75°13'52.3''
14.7 9.05 16.20 17.69 16.94 14.42 14.86
4 Sangli 2 Village - Bhud, Dist. Sangli 17°21'18.3'' 74°41'48.9''
105 25.02 20.61 19.27 25.41 21.50 22.05
5 Sangli 3 Village Bhud Tal-Khatav Dist. Satara Latitude 170 27’ 52.8’’ N Longitude 740 40’ 25’’ E
97.5 25.30 20.97 22.83 26.18 22.20 23.40
6 Satara 1 Jamb Ambheri Tal. Khatav Dist. Satara Latitude - 170 36’ 48.9’’ N, Longitude - 740 16’ 52.5’’ E & Elevation- 990 m AMSL
13.6 20.25 21.16 21.92 18.29 20.41
7 Satara 2 Khanapur, Tal. Khatav, Dist. Satara ,Latitude- 170 26’ 37.1’’ N Longitude- 740 40’ 25.1’’ E
31.2 12.40 23.35 25.92 22.17 20.96
8 Satara 3 Sadawaghapur Tal. Patan Dist. Satara Latitude - 170 25’ 26.7’’ N, Longitude - 730 55’ 42.2’’ E
29.7 12.47 14.71 20.63 16.40 14.91 17.77 22.92 19.18 18.05
9 Satara 4 Village - Chavaneshware, Dist. Satara 17°52'48.8'' 74°02'32.9''
28.8 8.04 18.32 18.75 17.35 16.12 14.20 13.63 15.15
10 Satara 5 Palshi Tal. Patan Dist. Satara Latitude - 170 16’ 09.8” N, Longitude - 730 49’ 34.02” E & Elevation - 1008 m AMSL, having WPD - 203.00 W/m2 @ 50 m agl
121.6 11.97 16.91 20.12 24.20 21.11 19.59
11 Satara 6 Village - Humbarne, Dist. Satara 17°16'17.3'' 73°48'01.5''
20 11.77 10.96 9.83 14.93 22.14 15.76 15.21
12 Satara 7 Village - Bothe Taluka - Maan District - Satara (Latitude- N 170 47’ 08.7’’ Longitude- E 740 22’ 08.3’’
193.4 10.79 19.01 10.87 23.95 23.62 18.05
13 Satara 9 Natoshi Tal. Patan Dist. Satara Latitude - 17 17’ 54.7” N, Longitude - 730 54’ 08.7” E
44.8 21.67 15.08 19.76 22.01 19.13 19.65
14 Satara 10 Village - Agaswadi, Dist. Satara 17°33'28.9'' 74°37'22.0''
34.50 26.24 22.54 22.82 24.54 20.22 23.09
Total 850.6 Average CUF 19.36
From above it can be seen that out of 14 wind farms, 6 wind farm’s average CUF is above 20%. The
reasons for higher generation in the above wind farms may be any of the following:
Wind farm’s zone may be wrongly determined as Zone 1 instead of Zone II/III/IV.
Higher generation may be due to deployment of high hub height wind turbines than that of 50
mtr

15
Wind project / some of the wind turbines got the advantage of best location, elevation, lower
array loss etc.
Improved wind profile/pattern in the year when CUF was assessed as compared to that of the
wind profile when wind mast’s data was referred for measurement.
1.4 Analysis of technology deployed in the 42 wind power projects
The shortlisted 42 projects under study are evaluated from the point of technology deployment, hub
height, rotor diameter, installed capacity and make of wind turbine etc. The details are furnished as
follows:
Table: Wind Turbine Technology details of 42 wind power projects Sr.No Name of Generator WTG
Capacity in MW
Turbine Make
Hub Height Rotor Diameter
in mtr
1 Rajasthan Gum Pvt. Ltd., 2.1 Suzlon 80 mts 88
2 Bhilwara Energy Limited 2 Inox 80 mts 93
3 Hindustan Zinc Ltd 1.5
Suzlon
78.5 mts 82
1.5 78.5 mts 82
4 Purushottam Lohia 0.80 Enercon 57 mts 53
53
5 S K Parik 1.25 Suzlon 74.50 mts 66
6 B. C. & Sons. 1.25 Suzlon 74.50 mts 66
7 Shraddha Energy & Infra projects Pvt.Ltd. 1.50
Vensys 1.5 MW V77/82
85 mts
77
1.50 77
1.50 77
1.50 77
8 Shraddha Energy & Infraprojects Pvt.Ltd. 1.50 77
9 Shraddha Energy & Infraprojects Pvt.Ltd. 1.50 77
1.50 77
1.50 77
1.50 77
1.50 77
1.50 77
10 Priyadarshini Polysacks Ltd. 1.50 Vensys 82 85 mtr 82
11 Pertinent Infra & Energy Ltd. 1.50 Vensys 77 85 mtr 77
12 Topaz Investments Pvt.Ltd. 1.50 Vensys 77 85 mtr 77
13 BLP Wind Project (Ambheri)Pvt Ltd. 0.80 Gamesa Wind Turbine
60.6 mtr 59
0.80 59
14 BMD Pvt. Ltd. 1.50 Vensys V82 85 mtr 82
1.50 82
1.50 82
15 Bhilwara Green Energy Ltd. 1.50 Vensys 77 85 mtr 77

16
1.50 77
1.50 77
1.50 77
1.50 77
1.50 77
16 Bhilwara Green Energy Ltd. 1.50 77
1.50 77
1.50 77
1.50 77
1.50 77
1.50 77
17 Bhilwara Green Energy Ltd. 1.50 77
1.50 77
18 Bhilwara Green Energy Ltd. 1.50 77
1.50 77
1.50 77
19 Panama Wind Energy Pvt.Ltd. 1.60
G.E. Energy 80 mtr
82.5
1.60 82.5
1.60 82.5
1.60 82.5
1.60 82.5
20 Panama Wind Energy Pvt.Ltd. 1.60 82.5
21 Bothe Wind Farm Development Pvt.Ltd. 2.00 Vestas 95 mtr 100
22 Ratnagiri Wind Power Project Pvt.Ltd. 1.60 GE India Industrial Pvt
Ltd
80 mtr 82.5
1.60 82.5
1.60 82.5
1.60 82.5
1.60 82.5
23 Pristine Indusries Ltd. 1.50 Vensys 82 83.25 mtr 82
24 Suyog Development Corporation Ltd. 0.80 Gamesa 60.5 59
0.80 Gamesa 60.5 59
25 BLP Wind Project (Ambheri)Pvt Ltd. 0.80 Gamesa Wind Turbine
60.6 mtr 59
0.80 59
0.80 59
0.80 59
0.80 59
0.80 59
0.80 59
26 BMD Pvt. Ltd. 1.50 Vensys V82 85 mtr 82
27 Bhilwara Green Energy Ltd. 1.50 Vensys 77 85 mtr 77
28 Bhilwara Green Energy Ltd. 1.50 Vensys 77 85 mtr 77
29 Green Infra BTV Ltd. 1.50 Vensys 77 85 mtr 76.84
30 Ratnagiri Wind Power Project Pvt.Ltd. 1 to 5,7 to 1.60 GE india 83 mtr 82.5

17
10 1.60 Industrial Pvt Ltd
82.5
1.60 82.5
1.60 82.5
1.60 82.5
1.60 82.5
1.60 82.5
1.60 82.5
1.60 82.5
31 Ratnagiri Wind Power Project Pvt. Ltd. 8.00 GE india Industrial Pvt
Ltd
83 mtr 82.5
82.5
82.5
82.5
32 Ratnagiri Wind Power Project Pvt.Ltd. 1.60 GE India Industrial Pvt
Ltd
83 mtr 82.5
1.60 82.5
1.60 82.5
1.60 82.5
33 Green Infra Wind Energy Ltd. 1.50 Suzlon 78.5 mtr 82
1.50 82
1.50 82
1.50 82
1.50 82
34 Green Infra Wind Energy Ltd. 1.50 82
35 Green Infra Wind Energy Ltd. 1.50 Suzlon 78.5 mtr 82
1.50 82
1.50 82
1.50 82
1.50 82
1.50 82
36 Ratnagiri Wind Power Project Pvt.Ltd. 1.60 GE India Industrial Pvt
Ltd
83 mtr 82.5
1.60 82.5
37 Khandke Wind Energy Pvt.Ltd. 0.80 Wind World (erstwhile Enercon)
75 mtr 53
0.80 53
0.80 53
0.80 53
0.80 53
0.80 53
0.80 53
0.80 53
0.80 53
0.80 53
0.80 53
0.80 53
0.80 53

18
38 Green Infra Wind Energy Ltd. 1.50 Vensys 82 85 mtr 82
1.50 82
1.50 82
1.50 82
1.50 82
1.50 82
1.50 82
1.50 82
1.50 82
39 Green Infra Wind Energy Ltd. 1.50 Vensys 82 85 mtr 82
1.50 82
1.50 82
1.50 82
1.50 82
1.50 82
1.50 82
1.50 82
40 Green Infra Wind Energy Ltd. 1.50 Vensys 82 85 mtr 82
1.50 82
1.50 82
1.50 82
1.50 82
1.50 82
1.50 82
1.50 82
41 Green Infra Wind Energy Ltd. 1.50 Vensys 82 85 mtr 82
1.50 82
1.50 82
1.50 82
42 NSL Wind Power Company(Satara)Pvt.Ltd. 1.50 Vensys 87 85 mtr 87
1.50 87
1.50 87
Total Installed Capacity 205.70
From above it can be observed that the developers have installed wind turbines with higher hub
heights than that of 50mtr as considered in the MERC RE Tariff Regulations 2010 for wind zone
determination. The brief of Hub Height, Rotor diameter and make of wind turbines in the shortlisted
42 wind power projects is as follows:
Table: Brief list of wind turbine technology used in 42 projects
OEM No of WTG MW Total MW HH RD
Suzlon 1 2.1 2.1 80 88

19
Suzlon 2 1.25 2.5 74.5 66
Suzlon 14 1.5 21 78.5 82
Inox 1 2 2 80 93
Vestas 1 2 2 95 100
Enercon 14 0.8 11.2 75 53
GE 31 1.6 49.6 80/83 82.5
ReGen 71 1.5 106.5 85 77/82
Gamesa 11 0.8 8.8 60.6 59
205.7
From above table it can be analyzed that 42 shortlisted wind power projects includes turbines
from different OEMs.
The Hub height of wind turbines deployed is more than 50 mtr and is varying from 60.6 mtr to
95 mtr
The rotor diameter is varying from 59 mtr to 100 mtr.
The individual wind turbine capacity is varying from 0.8 MW to 2.1 MW
From above it is clear that all the wind turbines under 42 wind farms have hub height more than 60
meters. Whereas the CUF specified in the regulation is accessed at 50 mtr. Hence, the increased
generation may also be due to increased hub height and rotor diameter etc.
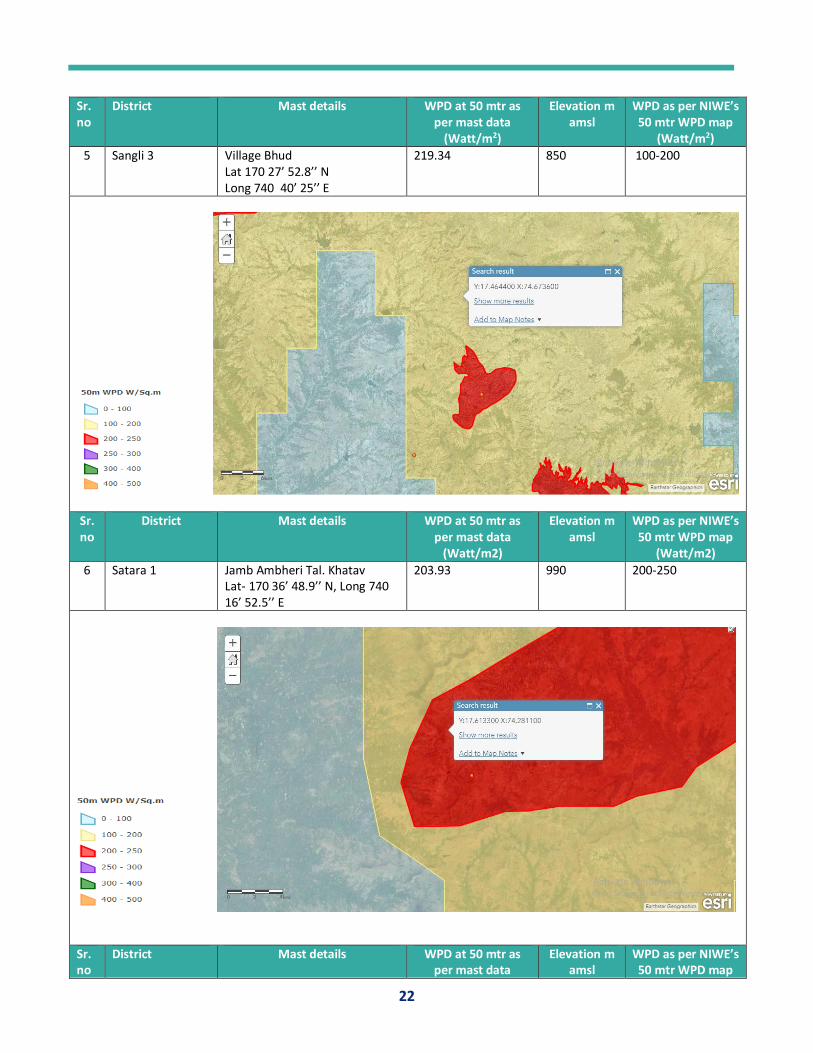
1.5 Analysis as per NIWE’s 50mtr WPD map at each wind project location:
NIWE had published 50 mtr WPD map which was used to verify the WPD and wind zone of the 42
wind power projects under study. The wind zoning was done as per the WPD at mats location at 50
mtr and made applicable for projects nearest to the mast and within maximum areal distance of 10
km. The wind masts locations were plotted on the NIWE’s 50 mtr WPD map in GIS arc and results are
shown as follows:
.

20
Sr. no
District Mast details WPD at 50 mtr as per mast data
(Watt/m2)
Elevation m amsl
WPD as per NIWE’s 50 mtr WPD map
(Watt/m2)
1 Nandurbar Village - Chakla, Lat 21°16'53.0'' Lon 74°18'30.2''
227.78 353 250-300
Sr. no
District Mast details WPD at 50 mtr as per mast data
(Watt/m2)
Elevation m amsl
WPD as per NIWE’s 50 mtr WPD map
(Watt/m2)
2 Kolhapur Kotoli Taluka - Shahuwadi Lat - N 160 57’ 54.2’’ Long E 730 58’ 28.4’’
180 782 100-200

21
Sr. no
District Mast details WPD at 50 mtr as per mast data
(Watt/m2)
Elevation m amsl
WPD as per NIWE’s 50 mtr WPD map
(Watt/m2)
3 Sangli 1 Village - Jath II, Dist. Sangli 16°58'48'' 75°13'52.3''
210.96 749 100-200
Sr. no
District Mast details WPD at 50 mtr as per mast data
(Watt/m2)
Elevation m amsl
WPD as per NIWE’s 50 mtr WPD map
(Watt/m2)
4 Sangli 2 Village - Bhud, Dist. Sangli 17°21'18.3'' 74°41'48.9''
225.99 840 200-250
22
Sr. no
District Mast details WPD at 50 mtr as per mast data
(Watt/m2)
Elevation m amsl
WPD as per NIWE’s 50 mtr WPD map
(Watt/m2)
5 Sangli 3 Village Bhud Lat 170 27’ 52.8’’ N Long 740 40’ 25’’ E
219.34 850 100-200
Sr. no
District Mast details WPD at 50 mtr as per mast data
(Watt/m2)
Elevation m amsl
WPD as per NIWE’s 50 mtr WPD map
(Watt/m2)
6 Satara 1 Jamb Ambheri Tal. Khatav Lat- 170 36’ 48.9’’ N, Long 740 16’ 52.5’’ E
203.93 990 200-250
Sr. no
District Mast details WPD at 50 mtr as per mast data
Elevation m amsl
WPD as per NIWE’s 50 mtr WPD map

23
(Watt/m2) (Watt/m2)
7 Satara 2 Khanapur, Tal. Khatav, Lat 170 26’ 37.1’’ N Long 740 40’ 25.1’’ E
211.66 942 200-250
Sr. no
District Mast details WPD at 50 mtr as per mast data
(Watt/m2)
Elevation m amsl
WPD as per NIWE’s 50 mtr WPD map
(Watt/m2)
8 Satara 3 Sadawaghapur Tal. Patan Dist. Satara Lat - 170 25’ 26.7’’ N, Long - 730 55’ 42.2’’ E
211.76 1074 200-250
Sr. no
District Mast details WPD at 50 mtr as per mast data
(Watt/m2)
Elevation m amsl
WPD as per NIWE’s 50 mtr WPD map
(Watt/m2)

24
9 Satara 4 Village - Chavaneshware, Dist. Satara 17°52'48.8'' 74°02'32.9''
234 1185 200-250
Sr. no
District Mast details WPD at 50 mtr as per mast data
(Watt/m2)
Elevation m amsl
WPD as per NIWE’s 50 mtr WPD map
(Watt/m2)
10 Satara 5 Palshi Tal. Patan Lat 170 16’ 09.8” N, Long 730 49’ 34.02” E
203 1008 200-250
Sr. no
District Mast details WPD at 50 mtr as per mast data
(Watt/m2)
Elevation m amsl
WPD as per NIWE’s 50 mtr WPD map
(Watt/m2)

25
11 Satara 6 Village - Humbarne, Lat 17°16'17.3'' Long 73°48'01.5''
222.59 1001 200-250
Sr. no
District Mast details WPD at 50 mtr as per mast data
(Watt/m2)
Elevation m amsl
WPD as per NIWE’s 50 mtr WPD map
(Watt/m2)
12 Satara 7 Village - Bothe Taluka - Maan Lat N 170 47’ 08.7’’ Lon E 740 22’ 08.3’’
214.2 1040 200-250
Sr. no
District Mast details WPD at 50 mtr as per mast data
Elevation m amsl
WPD as per NIWE’s 50 mtr WPD map

26
(Watt/m2) (Watt/m2)
13 Satara 9 Natoshi Tal. Patan Lat- 17 17’ 54.7” N, Long 730 54’ 08.7” E
222.15 979 200-250
Sr. no
District Mast details WPD at 50 mtr as per mast data
(Watt/m2)
Elevation m amsl
WPD as per NIWE’s 50 mtr WPD map
(Watt/m2)
14 Satara 10 Village - Agaswadi, Dist. Satara 17°33'28.9'' 74°37'22.0''
200 890 100-200
Observations:

27
All the fourteen wind masts under study falls under the WPD up to 250 watts / sq.mtr except
the mast located at Chakla in district Nandurbar.
As per the 50 mtr WPD map of NIWE it is observed that location Chakla falls under the WPD
250 to 300 watts/sq.mtr however, for the same location the extrapolated WPD from NIWE’s
mast is 323 i.e. within the WPD zone from 300 to 350. So there is in-consistency in NIWE’s
extrapolated WPD in the list of potential sites and that of GIS arc map.
Further, all the WTGs located in the Chakla site in Nandurbar are plotted on the GIS arc and all
of them except one WTG’s falls under WPD zone of 250 to 300 as per the map.
NIWE had studied the WPD for all the WTG locations in detail and certified the WPD. Based on
NIWE’s certified WPD for Chakla site the projects were allotted the Zone I WPD.
The deviations in the extrapolation of WPD as per the NIWE’s wind mast may be due to its
measurement height at 25 mtr and the measurement was done for the period between April
1999 to June 2000.On the contrary the measurement at Chakla for Suzlon mast was for the
period from August 2003 to July 2004 at 50 mtr height and there is no uncertainty with
measurement at 50 mtr than that of extrapolated data.
1.6 Analysis of extrapolated WPD at Hub Height
It was observed that there is elevation difference at wind mast and WTG location. Further, the WPD
was measured at 50 mtr and the same was made applicable for the wind turbines having higher hub
heights for wind zone determination. An analysis is being carried out by theoretically extrapolating
the wind speed and WPD at hub height. The revised WPD at hub height will be compared with the
wind zones specified in the Regulation 2010. The results of said exercise are presented as follows:
Sr. No
Name of Generator Capacity in MW
Hub Height
Mast height
Mast Elevation
WTG Elevation
WPD at 50 mtr height
WPD at extrapolated
height
WPD Zone for
extrapolated WPD at Hub
Height
1 Rajasthan Gum Pvt. Ltd.,
2.1 80 50.00 749 722 210.96 215.97 Zone I
2 Bhilwara Energy Limited
2 80 50.00 782 798 180 231.78 Zone I
3 Hindustan Zinc Ltd 1.5 78.5 50.00 353 397 227.78 320.69 Zone III
1.5 78.5 50.00 353 492 227.78 391.81 Zone III
4 Purushottam Lohia 0.80 57 50.00 1185 1019 234 Zone I
57 50.00 1185 1006 234 Zone I
5 S K Parik 1.25 74.50 50.00 1074 1065 211.76 235.74 Zone I
6 B. C. & Sons. 1.25 74.50 50.00 1074 1067 211.76 238.51 Zone I
7 Shraddha Energy & Infraprojects Pvt.Ltd.
1.50 85 50.00 850 884 219.34 305.59 Zone III
1.50 85 50.00 850 900 219.34 319.76 Zone III
1.50 85 50.00 850 900 219.34 319.76 Zone III

28
1.50 85 50.00 850 900 219.34 319.76 Zone III
8 Shraddha Energy & Infraprojects Pvt.Ltd.
1.50 85 50.00 850
901 219.34 320.60 Zone III
9 Shraddha Energy & Infraprojects Pvt.Ltd.
1.50 85 50.00 850 880 219.34 301.82 Zone III
1.50 85 50.00 850 885 219.34 306.52 Zone III
1.50 85 50.00 850 884 219.34 305.59 Zone III
1.50 85 50.00 850 887 219.34 308.35 Zone III
1.50 85 50.00 850 878 219.34 299.90 Zone II
1.50 85 50.00 850 886 219.34 307.44 Zone III
10 Priyadarshini Polysacks Ltd.
1.50 85 50.00 850 865 219.34 286.74 Zone II
11 Pertinent Infra & Energy Ltd.
1.50 85 50.00 850 902 219.34 321.44 Zone III
12 Topaz Investments Pvt.Ltd.
1.50 85 50.00 850 900 219.34 319.76 Zone III
13 BLP Wind Project (Ambheri)Pvt Ltd.
0.80 60.6 50.00 990 998 203.93 231.14 Zone I
0.80 60.6 50.00 990 984 203.93 211.27 Zone I
14 BMD Pvt. Ltd. 1.50 85 50.00 890 883 200 238.16 Zone I
1.50 85 50.00 890 881 200 235.81 Zone I
1.50 85 50.00 890 864 200 213.69 Zone I
15 Bhilwara Green Energy Ltd.
1.50 85 50.00 890 918 200 273.46 Zone II
1.50 85 50.00 890 928 200 281.99 Zone II
1.50 85 50.00 890 927 200 281.17 Zone II
1.50 85 50.00 890 922 200 276.94 Zone II
1.50 85 50.00 890 920 200 275.21 Zone II
1.50 85 50.00 890 916 200 271.68 Zone II
16 Bhilwara Green Energy Ltd.
1.50 85 50.00 890 913 200 268.97 Zone II
1.50 85 50.00 890 924 200 278.65 Zone II
1.50 85 50.00 890 919 200 274.34 Zone II
1.50 85 50.00 890 938 200 290.02 Zone II
1.50 85 50.00 890 922 200 276.94 Zone II
1.50 85 50.00 890 940 200 291.57 Zone II
17 Bhilwara Green Energy Ltd.
1.50 85 50.00 890 921 200 276.08 Zone II
1.50 85 50.00 890 944 200 294.61 Zone II
18 Bhilwara Green Energy Ltd.
1.50 85 50.00 890 918 200 273.46 Zone II
1.50 85 50.00 890 924 200 278.65 Zone II
1.50 85 50.00 890 938 200 290.02 Zone II
19 Panama Wind Energy Pvt.Ltd.
1.60 80 50.00 1008 970 203 189.02 Zone I
1.60 80 50.00 1008 970 203 189.02 Zone I
1.60 80 50.00 1008 972 203 192.69 Zone I
1.60 80 50.00 1008 981 203 207.82 Zone I
1.60 80 50.00 1008 978 203 203.00 Zone I

29
20 Panama Wind Energy Pvt.Ltd.
1.60 80 50.00 1008
1008 203 244.08 Zone I
21 Bothe Wind Farm Development Pvt.Ltd.
2.00 95 50.00 1040 1055 214.2 290.01 Zone II
22 Ratnagiri Wind Power Project Pvt.Ltd.
1.60 80 50.00 979 986 222.15 275.72 Zone II
1.60 80 50.00 979 895 222.15 Zone I
1.60 80 50.00 979 869 222.15 Zone I
1.60 80 50.00 979 974 222.15 260.60 Zone II
1.60 80 50.00 979 851 222.15 Zone I
23 Pristine Indusries Ltd. 1.50 83.25 50.00 850 853 219.34 271.34 Zone II
24 Suyog Development Corporation Ltd.
0.80 60.5 50.00 990 986 203.93 214.18 Zone I
0.80 60.5 50.00 990 985 203.93 212.66 Zone I
25 BLP Wind Project (Ambheri)Pvt Ltd.
0.80 60.6 50.00 990 992 203.93 223.03 Zone I
0.80 60.6 50.00 990 996 203.93 228.50 Zone I
0.80 60.6 50.00 990 986 203.93 214.33 Zone I
0.80 60.6 50.00 990 1004 203.93 238.74 Zone I
0.80 60.6 50.00 990 1005 203.93 239.96 Zone I
0.80 60.6 50.00 990 1017 203.93 253.76 Zone II
0.80 60.6 50.00 990 1014 203.93 250.45 Zone II
26 BMD Pvt. Ltd. 1.50 85 50.00 890 887 200 242.74 Zone I
27 Bhilwara Green Energy Ltd.
1.50 85 50.00 890 885 200 240.47 Zone I
28 Bhilwara Green Energy Ltd.
1.50 85 50.00 890 928 200 281.99 Zone II
29 Green Infra BTV Ltd. 1.50 85 50.00 850 872 219.34 293.98 Zone II
30 Ratnagiri Wind Power Project
Pvt.Ltd. 1 to 5,7 to 10
1.60 83 50.00 1008 983 203 215.43 Zone I
1.60 83 50.00 1008 987 203 221.18 Zone I
1.60 83 50.00 1008 1001 203 239.35 Zone I
1.60 83 50.00 1008 993 203 229.30 Zone I
1.60 83 50.00 1008 993 203 229.30 Zone I
1.60 83 50.00 1008 987 203 221.18 Zone I
1.60 83 50.00 1008 988 203 222.57 Zone I
1.60 83 50.00 1008 985 203 218.34 Zone I
1.60 83 50.00 1008 203 Zone I
31 Ratnagiri Wind Power Project Pvt. Ltd.
8.00 83 50.00 1008 986 203 219.77 Zone I
83 50.00 1008 983 203 215.43 Zone I
83 50.00 1008 962 203 179.27 Zone I
83 50.00 1008 898 203 Zone I
32 Ratnagiri Wind Power Project Pvt.Ltd.
1.60 83 50.00 1008 904 203 Zone I
1.60 83 50.00 1008 900 203 Zone I
1.60 83 50.00 1008 968 203 190.87 Zone I
1.60 83 50.00 1008 967 203 189.02 Zone I
33 Green Infra Wind 1.50 78.5 50.00 1001 1079 222.59 341.91 Zone III

30
Energy Ltd. 1.50 78.5 50.00 1001 1069 222.59 334.05 Zone III
1.50 78.5 50.00 1001 1068 222.59 333.25 Zone III
1.50 78.5 50.00 1001 1066 222.59 331.62 Zone III
1.50 78.5 50.00 1001 1007 222.59 273.24 Zone II
34 Green Infra Wind Energy Ltd.
1.50 78.5 50.00 1001 1022 222.59 290.45 Zone II
35 Green Infra Wind Energy Ltd.
1.50 78.5 50.00 1001 1067 222.59 332.43 Zone III
1.50 78.5 50.00 1001 1048 222.59 316.13 Zone III
1.50 78.5 50.00 1001 1032 222.59 300.87 Zone III
1.50 78.5 50.00 1001 1024 222.59 292.60 Zone II
1.50 78.5 50.00 1001 1019 222.59 287.18 Zone II
1.50 78.5 50.00 1001 981 222.59 237.02 Zone I
36 Ratnagiri Wind Power Project Pvt.Ltd.
1.60 83 50.00 1008 988 203 Zone I
1.60 83 50.00 1008 984 203 Zone I
37 Khandke Wind Energy Pvt.Ltd.
0.80 75 50.00 903 848 211.66 142.52 Zone I
0.80 75 50.00 903 845 211.66 132.10 Zone I
0.80 75 50.00 903 866 211.66 189.03 Zone I
0.80 75 50.00 903 884 211.66 221.51 Zone I
0.80 75 50.00 903 902 211.66 247.02 Zone I
0.80 75 50.00 903 886 211.66 224.62 Zone I
0.80 75 50.00 903 887 211.66 226.15 Zone I
0.80 75 50.00 903 886 211.66 224.62 Zone I
0.80 75 50.00 903 908 211.66 254.49 Zone II
0.80 75 50.00 903 901 211.66 245.73 Zone I
0.80 75 50.00 903 931 211.66 279.74 Zone II
0.80 75 50.00 903 904 211.66 249.56 Zone I
0.80 75 50.00 903 888 211.66 227.65 Zone I
38 Green Infra Wind Energy Ltd.
1.50 85 50.00 840 838 225.99 275.54 Zone II
1.50 85 50.00 840 849 225.99 288.73 Zone II
1.50 85 50.00 840 842 225.99 280.48 Zone II
1.50 85 50.00 840 841 225.99 279.26 Zone II
1.50 85 50.00 840 828 225.99 262.37 Zone II
1.50 85 50.00 840 831 225.99 266.46 Zone II
1.50 85 50.00 840 817 225.99 246.22 Zone I
1.50 85 50.00 840 814 225.99 241.46 Zone I
1.50 85 50.00 840 817 225.99 246.22 Zone I
39 Green Infra Wind Energy Ltd.
1.50 85 50.00 840 844 225.99 282.89 Zone II
1.50 85 50.00 840 844 225.99 282.89 Zone II
1.50 85 50.00 840 847 225.99 286.42 Zone II
1.50 85 50.00 840 846 225.99 285.25 Zone II
1.50 85 50.00 840 851 225.99 291.00 Zone II
1.50 85 50.00 840 856 225.99 296.53 Zone II

31
1.50 85 50.00 840 828 225.99 262.37 Zone II
1.50 85 50.00 840 809 225.99 233.10 Zone I
40 Green Infra Wind Energy Ltd.
1.50 85 50.00 840 856 225.99 296.53 Zone II
1.50 85 50.00 840 854 225.99 294.34 Zone II
1.50 85 50.00 840 856 225.99 296.53 Zone II
1.50 85 50.00 840 860 225.99 300.80 Zone II
1.50 85 50.00 840 889 225.99 328.58 Zone III
1.50 85 50.00 840 890 225.99 329.46 Zone III
1.50 85 50.00 840 886 225.99 325.94 Zone III
1.50 85 50.00 840 890 225.99 329.46 Zone III
41 Green Infra Wind Energy Ltd.
1.50 85 50.00 840 846 225.99 285.25 Zone II
1.50 85 50.00 840 859 225.99 299.74 Zone II
1.50 85 50.00 840 883 225.99 323.24 Zone III
1.50 85 50.00 840 894 225.99 332.90 Zone III
42 NSL Wind Power Company(Satara)Pvt.Ltd.
1.50 85 50.00 850 873 219.34 294.98 Zone II
1.50 85 50.00 850 869 219.34 290.92 Zone II
1.50 85 50.00 850 863 219.34 284.61 Zone II
205.7
The summary of the 42 wind power projects as per their revised zones if zone wise WPD considered
at actual hub height of installed wind turbine.
Summary
Zones ( as per WPD at Hub Height of Turbine)
No. of WTGs Capacity(MW)
Zone I 51 71.2
Zone II 55 80.4
Zone III 27 40.5
Zone I 11 13.6
205.7
Observations:
In the case of private wind masts, the measurements were done at 50mtr and hence the there
should not be error in WPD at 50 mtr. However, in the case of NIWE wind mast at Katoli Dist.
Kolhapur, the wind measurement and mast height was at 25 mtr and the same was
extrapolated to 50 mtr. Extrapolating the same data further to WTG hub height may be at 80
mtr will further add error in measurements.
The Wind Zone and related CUF determined in Regulation 2010 was at 50 mtr. If the WPD is
measured at hub height and for that WPD zones are determined as per Regulation 2010 then
it is observed that out of 205.7 MW commissioned in Zone I about 120.9 MW of installations
will fall under Zone II and III.
32
Here it needs to be understood that there are about 13.6MW of wind projects whose WTH
Hub height is below the mast elevation and are considered in Zone I. In every complex terrain
there will be some installations which will get the advantage of high elevation and may yield
more generation and some will be at lower elevation and will produce less energy due to
elevation.
Further, some of the WTGs will get the advantage of their location and will generate more
than the WTGs which are affect by high array loss within the same wind farm.
If the CUF has to be accessed for each turbine location then higher generating WTGs will fetch
low tariff and low generating WTGs will fetch high tariff. Hence, the issue needs to be
analyzed holistically in the generic tariff determination process or project specific tariff for all
the turbines will have to be accessed.
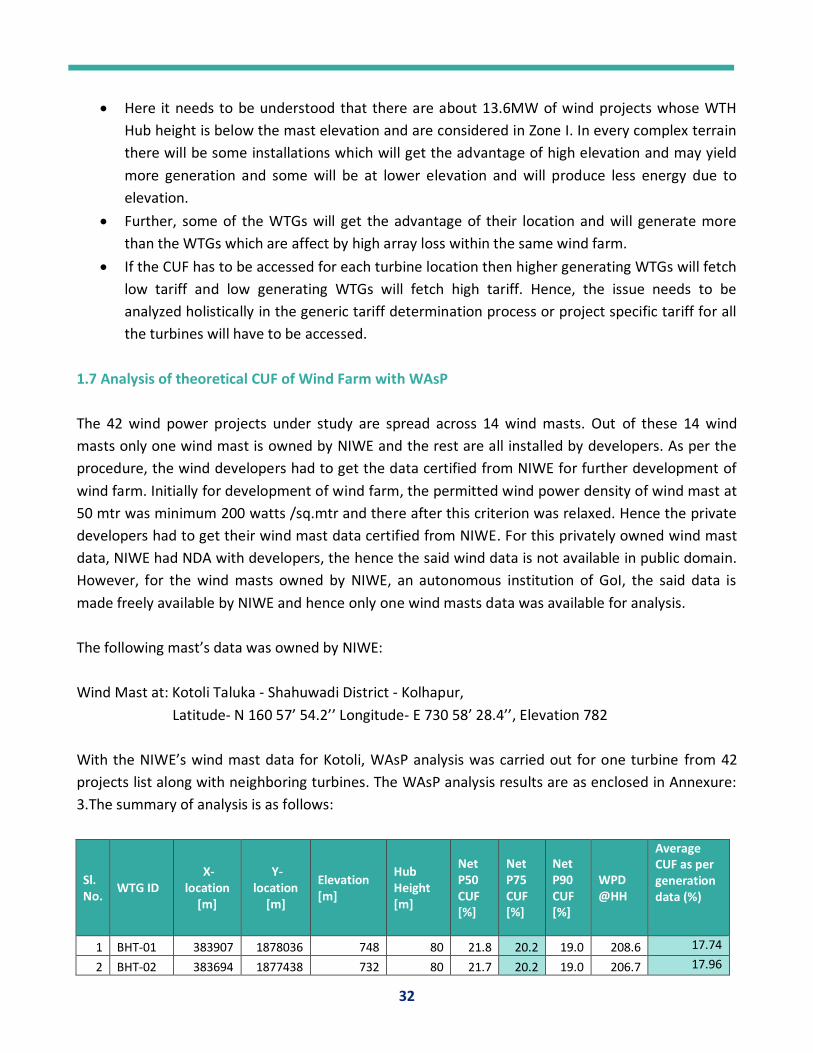
1.7 Analysis of theoretical CUF of Wind Farm with WAsP
The 42 wind power projects under study are spread across 14 wind masts. Out of these 14 wind
masts only one wind mast is owned by NIWE and the rest are all installed by developers. As per the
procedure, the wind developers had to get the data certified from NIWE for further development of
wind farm. Initially for development of wind farm, the permitted wind power density of wind mast at
50 mtr was minimum 200 watts /sq.mtr and there after this criterion was relaxed. Hence the private
developers had to get their wind mast data certified from NIWE. For this privately owned wind mast
data, NIWE had NDA with developers, the hence the said wind data is not available in public domain.
However, for the wind masts owned by NIWE, an autonomous institution of GoI, the said data is
made freely available by NIWE and hence only one wind masts data was available for analysis.
The following mast’s data was owned by NIWE:
Wind Mast at: Kotoli Taluka - Shahuwadi District - Kolhapur,
Latitude- N 160 57’ 54.2’’ Longitude- E 730 58’ 28.4’’, Elevation 782
With the NIWE’s wind mast data for Kotoli, WAsP analysis was carried out for one turbine from 42
projects list along with neighboring turbines. The WAsP analysis results are as enclosed in Annexure:
3.The summary of analysis is as follows:
Sl. No.
WTG ID X-
location [m]
Y-location
[m]
Elevation [m]
Hub Height [m]
Net P50 CUF [%]
Net P75 CUF [%]
Net P90 CUF [%]
WPD @HH
Average CUF as per generation data (%)
1 BHT-01 383907 1878036 748 80 21.8 20.2 19.0 208.6 17.74
2 BHT-02 383694 1877438 732 80 21.7 20.2 19.0 206.7 17.96

33
3 BHT-04 383566 1876867 704 80 22.6 21.0 19.8 209.4 16.69
4 BHT-05 383671 1877085 711 80 24.2 22.5 21.2 208.0 17.15
5 BHT-11 384929 1876663 751 80 21.3 19.8 18.6 205.0 18.26
6 BHT-13 385383 1877518 805 80 22.2 20.6 19.4 201.0 20.35
7 BHT-14 385599 1878012 807 80 20.9 19.4 18.2 203.0 19.29
8 BHT-15 385517 1877776 800 80 24.7 23.0 21.6 204.1 20.66
9 BHT-03 384138 1875865 716 80 24.5 22.8 21.4 201.8 19.96
10 BHT-07 384278 1875610 727 80 21.7 20.1 19.0 203.0 21.34
11 BHT-08 384032 1876047 723 80 22.1 20.5 19.3 204.7 18.66
12 BHT-10 385131 1876930 796 80 23.2 21.5 20.3 207.0 22.02
13 BHT-17 384703 1876440 741 80 24.2 22.5 21.2 208.0 19.72
14 BHT-18 384282 1876292 721 80 22.1 20.6 19.4 206.3 19.26
15 BHT-19 386384 1876658 798 80 24.7 23.0 21.6 207.0 23.27
16 BHT-23 387106 387106 775 80 22.7 21.1 19.8 200.4 20.35
17 BHT-24 387098 1875772 776 80 22.1 20.6 19.4 207.0 13.68
18 BHT-31 388167 1875533 778 80 21.5 20.0 18.8 201.8 20.69
Average 22.7 21.1 19.8 19.28
Observation:
From the WAsP analysis it is observed that WPD at WTG hub height is close to 200 Watts/sq
mtr and it was certified as 180 watts / sq. mtr at 50 mtr height at mast location.
The WTG no BHT-19 is showing highest generation of 23% at P75 probability and based on the
actual generation data it is observed that it is generating at average CUF of 23.27%. Average
CUF of the wind farm based on the actual generation was observed at 19.28% as against the
WAsP estimation of 21.1% at 75% probability.
Out of the 18 wind turbines about 13 wind turbines location is at elevation lower than that of
mast elevation and five turbines location is above the mast elevation of 782mtr. Because of
elevation also there is generation gain observed in WAsP analysis and also as per actual data.
Further, from the analysis it was observed that the turbine BHT-19 which is generating
consistently at higher annual CUF is due to its location as follows:

34
Figure: Location of WTG’s in Kotoli wind farm
1.8 Review of Sample wind projects data on field
From the wind farms actual generation analysis done as above it was found that six wind farms out of
14 had average CUF more than 20%. The details of the wind farm are as follows:
Sr. no District Wind Farm/Mast details Total
Installed Capacity in MW
2010-11
2011-12
2012-13
2013-14
2014-15
2015-16
2016-17
2017-18
Wind farm
Average
1 Nandurbar Village - Chakla, Dist. Nandurabar 21°16'53.0'' 74°18'30.2''
73.8 25.04 25.23 19.27 22.16 23.46 20.31 22.58
2 Sangli 2 Village - Bhud, Dist. Sangli 17°21'18.3'' 74°41'48.9''
105 25.02 20.61 19.27 25.41 21.50 22.05
3 Sangli 3 Village Bhud Tal-Khatav Dist. Satara Latitude 170 27’ 52.8’’ N Longitude 740 40’ 25’’ E
97.5 25.30 20.97 22.83 26.18 22.20 23.40
4 Satara 1 Jamb Ambheri Tal. Khatav Dist. Satara Latitude - 170 36’ 48.9’’ N, Longitude - 740 16’ 52.5’’ E & Elevation- 990 m AMSL
13.6 20.25 21.16 21.92 18.29 20.41
5 Satara 2 Khanapur, Tal. Khatav, Dist. Satara ,Latitude- 170 26’ 37.1’’ N Longitude- 740 40’ 25.1’’ E
31.2 12.40 23.35 25.92 22.17 20.96
6 Satara 10 Village - Agaswadi, Dist. Satara 17°33'28.9'' 74°37'22.0''
34.50 26.24 22.54 22.82 24.54 20.22 23.09
From above six shortlisted projects which are continuously generating at CUF higher than 20% the
following two wind farms are shortlisted for field verification who have highest CUF among the six.:

35
Sr. no District Wind Farm/Mast
details Wind Projects Capacity in MW from 42 project
No of Projects
No of WTGS
2012-13
2013-14
2014-15
2015-16
2016-17
2017-18
Wind farm
Average
3 Sangli 3 Village Bhud Tal-Khatav Dist. Satara Latitude 170 27’ 52.8’’ N Longitude 740 40’ 25’’ E
97.5 8 18 x 1.5MW
25.30 20.97 22.83 26.18 22.20 23.40
6 Satara 10 Village - Agaswadi, Dist. Satara 17°33'28.9'' 74°37'22.0''
34.50 8 23
x1.5MW
26.24 22.54 22.82 24.54 20.22 23.09
The above two shortlisted wind farms have 17 projects out of 42 projects under study. Further these
17 wind projects had multiple wind turbines. The wind farm around wind mast located at Budh,
Khatav has 18 wind turbines of 1.5MW of Regen Powertech and wind farm around wind mast located
at Agaswadi had 23 wind turbines of 1.5 MW of ReGen Powertech. Out of the above shortlisted wind
turbines field verification completed for following:
Verification of location and elevation of wind mast located at Village - Agaswadi, Dist. Satara
17°33'28.9'' 74°37'22.0''
Verification of 24 wind turbine locations (36MW) around wind mast located at Village -
Agaswadi completed
Verification of 14 wind turbine locations (21MW) around wind mast located at Village – Budh,
Khatav completed
Onsite verification of 57 MW of wind projects location out of the 205.7 MW completed.
Sample size 27%
Observations:
The latitude and longitude of above all wind turbine locations and that of one wind mast
located at Village - Agaswadi, Dist. Satara matched exactly. Minor deviation in last digits
observed in some cases. This may be due to the location of measurement around wind
turbine and this is accepted.
There is variation observed in elevation of some of the wind turbines. The variation was close
to 1 mtr to 5 mtr. Further, the elevation measurement was found to be different in the three
GPS instruments used. This may be due to instrument to instrument error and is accepted.
Further, it was observed in the field inspection that shortlisted wind turbines had location
advantage and hence may have generated at more CUF e.g. valley in front and back of the
wind turbine which has least array loss and best wind or the wind turbines located in the first
row of wind farm.
The hub height and rotor diameter could not be measured at site and same were verified with
the name plate as available at some locations.

36
The areal distance of wind turbine location and mast location was verified in office on google
earth and found to be within the permitted limit of 10 km for all the 38 wind turbines.
It was also observed that around the Agaswadi wind mast there were some wind turbines
owned by Tata power which were not in the list of MSEDCL. Hence, those wind turbines
generation couldn’t be clubbed together to access the average CUF of wind farm.

37
PART II
Part I of the study covers analysis of only 42 wind projects which were shortlisted by MSEDCL based
on the consistent higher CUF data. These 42 projects were having total installed capacity of
205.7MW. As per the mandate of the study it is required to analyze the CUF of these 42 wind power
projects and to propose revision in WPD and wind zone for these projects based on the actual
generation data.
The partially selected wind power projects will not give the clear picture and based on this partial
data it will not be prudent to comment on the WPD and revision in wind zone as allotted under MERC
RE Tariff Regulations 2010. Hence, analysis of all the the wind power projects commissioned during
the control period of MERC RE Tariff Regulations 2010 is required to access the possible revision in
WPD zone for to avoid any undue advantage to wind project developers and to protect the interest of
consumers of Maharashtra. Holistic review of data of wind projects commissioned during the control
period of this regulation is carried out.
2.1 Analysis of CUF of wind projects commissioned from 2010-11 to 2014-15 district wise
During the control period of MERC RE Tariff Regulation 2010, i.e. during FY 2010-11 to 2014-15 about
2373.35MW of wind power projects were commissioned in Maharashtra. Of these projects about
1918MW of wind power projects were commissioned for sale to MSEDCL under PPA at MERC
determined tariff. Out of 1918MW of wind power projects commissioned for sale to MSEDCL, only
205.7MW of projects were shortlisted by MESDCL for continuously generating more than 20%.
Holistic review of the complete 1918MW of wind power projects is done to access the substation
wise and district wise CUF of wind power projects so as to analyze if there is any trend that can be
considered for Wind Zone/benchmark CUF revision.
For undertaking the analysis of CUF, generation and CUF data shared by MSEDCL was used. As per
MSDECL generation data they had shared the data of following 43 substations totaling to 2107.3MW
as follows:
Sr.No. Name of Substation
Installed Capacity of Wind Project As per MSEDCL Data (in MW)
Installed Capacity of Wind Projects after 31 March 2015
Installed Capacity of Wind Projects During FY 2010-11 to 2014-15 (in MW)
1 132/33 KV Kombhalne 47.6 47.6
2 220 KV/33 KV Kaudgaon (Jeur) 20.00 20
3 33/11 KV. PATODA S/S 6.25 6.25
4 132/33 KV Aranvira S/S 73.50 73.50
5 132/33 KV Rajpimpri 80.00 80.00
6 132/33KV BAMBAVADE 22.95 0.85 22.10
7 220KV/33KV Gangapur 73.80 73.80

38
8 132/33KV Khaprale Substation 18.90 18.90
9 100/33 KV ANDRA LAKE 106.40 106.40
10 220/132/22 KV ALEPHATA SUB STN 7.20 7.20 0.00
11 33/11 KV DAFALAPUR S/S 10.00 10.00 0.00
12 33/11 KV Lengare S/S 1.50 1.50
13 110/33/11 KV Jath 33.90 4.00 29.90
14 110/33 KV Valsang S/S 104.00 104.00
15 132/33KV Rile (Shirala) S/s 42.00 42.00
16 132/33KV Vaspeth (Jath) S/s 196.15 196.15
17 220/33 kV Jath s/s MSETCL 19.55 19.55
18 220/33Kv Kadegaon S/s 14.80 14.80
19 220/33 KV Waiphale S/s. 30.00 30.00
20 220/33 KV Shedyal S/s. 201.20 64.65 136.55
21 220/33 KV Mendhegiri S/S 50.40 25.20 25.2
22 220/33 KV Khanapur S/s 66.00 42.00 24
23 33 KV SHEMBALPIMPRI 10.50 10.50 0
24 33 KV MULAWA SUBSTATION 9.00 9.00 0
25 33/11 KV KOREGAON 13.60 13.60
26 33/11 KV MEDHA SUBSTATION 5.70 5.70
27 33/22 KV VIKHALE SUBSTATION 4.50 4.50
28 132/33KV Satara Road S/Stn 12.00 12.00
29 110/33KV MAYANI SUB STATION 24.00 24.00
30 132/33/22 KV DAHIVADI SUBSTATION 20.20 0.00 20.4
31 132/33/22 WAI EHV SUBSTATION 5.10 5.10
32 132/33KV AUNDH SUB-STATION 28.25 28.25
33 132/33 kv AMBHERI 16.00 16.00
34 132/33KV KALEDHON SUBSTATION 31.20 31.20
35 220/33 KV Sadawaghapur S/Stn 29.70 29.70
36 220/33/11KV MALHARPETH SUBSTATION 41.25 41.25
37 220 / 33 KV Vankusawade S/Stn 14.70 6.30 8.4
38 220/33KV Chawaneshwar S/Stn 28.80 28.80
39 220/33KV PANAMA SUB-STATION 70.40 70.40
40 220/33KV RATNAGIRI WIND SUB-STATION 96.00 9.60 86.4
41 220/33KV NIGADE SUB-STATION 45.20 45.20
42 220/33KV HIVARVADI SUB-STATION 181.50 181.50
43 220/33 KV BOTHE SUB-STATION 193.40 193.40
Total 2107.1 189.3 1918.00
Out of the above 43 substations four substations had the wind projects commissioned in 2017 and
hence there were only 39 substations having wind power projects commissioned during the control
period of MERC RE Tariff Regulations 2010. Further, these substations had wind projects

39
commissioned after 31st March 2015 and hence the total installed capacity of wind power projects
during the control period reduced to 1918MW.
From the analysis it is observed as follows:
Districts with more than 20% Avg. CUF Pune (21.67%), Nandurbar (22.58%),
Districts with less than 20% Avg. CUF Ahmednagar (12.19%), Beed (19.83%), Kolhapur (18.18%), Sangli (18.88%),Satara (18.70%)
It can be observed that only two districts are having more than 20% average CUF. Five districts have
average CUF of less than 20%. However, there are some of the sites within these districts which are
generating at higher CUF and some sites are generating at lower CUF. The substation wise wind
power projects generation data is analyzed and is presented as follows:
District: Ahmednagar
Sr.No Name of Substation
Connected Load in MW
CUF in FY 2010-11
CUF in FY 2011-12
CUF in FY 2012-13
CUF in FY 2013-14
CUF in FY 2014-15
CUF in FY 2015-16
CUF in FY 2016-17
CUF in FY 2017-18
Average CUF of Wind Farm Connected to Substation
1 132/33 KV Kombhalne 47.6 0 0 0 0 9.72 11.74 8.14 12.25 10.71
2 220 KV/33 KV Kaudgaon (Jeur) 20 0 0 0 0 0.00 10.08 14.49 16.93 15.71
Total 67.6 Simple Average 13.21
Waited Avg CUF 12.19
District: Pune
Sr.No Name of Substation
Connected Load in MW
CUF in FY 2010-11
CUF in FY 2011-12
CUF in FY 2012-13
CUF in FY 2013-14
CUF in FY 2014-15
CUF in FY 2015-16
CUF in FY 2016-17
CUF in FY 2017-18
Average CUF of Wind Farm Connected to Substation
1 100/33 KV ANDRA LAKE 106.4 - 4.00 20.94 23.72 22.01 21.42 20.60 21.33 21.67
Total 106.4 Simple Average 21.67
Waited Avg CUF 21.67
District: Nandurbar
Sr.No Name of Substation
Connected Load in MW
CUF in FY 2010-11
CUF in FY 2011-12
CUF in FY 2012-13
CUF in FY 2013-14
CUF in FY 2014-15
CUF in FY 2015-16
CUF in FY 2016-17
CUF in FY 2017-18
Average CUF of Wind Farm Connected to Substation
1 220KV/33KV Gangapur 73.8 4.79 25.04 25.23 19.27 22.16 23.46 20.31 22.58
Total 73.8 Simple Average 22.58
Waited Avg CUF 22.58

40
District: Beed
Sr.No Name of Substation
Connected Load in MW
CUF in FY 2010-11
CUF in FY 2011-12
CUF in FY 2012-13
CUF in FY 2013-14
CUF in FY 2014-15
CUF in FY 2015-16
CUF in FY 2016-17
CUF in FY 2017-18
Average CUF of Wind Farm Connected to Substation
1 33/11 KV. PATODA S/S 6.25 4.79 5.13 9.03 7.99 9.37 4.74 5.05
2 132/33 KV Aranvira S/S 73.50 3.33 13.48 22.24 18.31 22.09 19.03
3 132/33 KV Rajpimpri 80.00 7.89 21.02 18.38 17.23 18.87
0 159.75 Simple Average 19.88
Waited Avg CUF 19.83
District: Kolhapur
Sr.No Name of Substation
Connected Load in MW
CUF in FY 2010-11
CUF in FY 2011-12
CUF in FY 2012-13
CUF in FY 2013-14
CUF in FY 2014-15
CUF in FY 2015-16
CUF in FY 2016-17
CUF in FY 2017-18
Average CUF of Wind Farm Connected to Substation
1 132/33KV BAMBAVADE 22.1 16.67 17.71 21.12 18.21 18.43
2 132/33KV Rile (Shirala) S/s-411 42.00
0.00 16.88 19.92 17.04 17.94
Total 64.1 Simple Average 18.18
Waited Avg CUF 18.11
District: Sangli
Sr.No Name of Substation
Connected Load in MW
CUF in FY 2010-11
CUF in FY 2011-12
CUF in FY 2012-13
CUF in FY 2013-14
CUF in FY 2014-15
CUF in FY 2015-16
CUF in FY 2016-17
CUF in FY 2017-18
Average CUF of Wind Farm Connected to Substation
1 132/33KV Khaprale Substation 18.9 13.39 24.92 17.83 22.46 25.61 21.18 22.40
2 33/11 KV Lengare S/S 1.5 19.30 21.20 18.44 19.65
3 110/33/11 KV Jath 29.9 21.42 15.87 16.86 17.43 17.46 15.18 17.37
4 110/33 KV Valsang S/S 104 25.77 12.40 16.68 20.28 20.80 18.37 19.05
5 132/33KV Vaspeth (Jath) S/s 196.15 4.68 11.85 18.68 20.96 21.14 18.85 15.93
6 220/33 kV Jath s/s MSETCL 19.55 9.21 17.11 15.86 16.57 16.86 14.98 16.28
7 220/33Kv Kadegaon S/s 14.8 19.90 21.82 17.40 19.71
8 220/33 KV Waiphale S/s. 30 1.59 25.09 14.13 28.97 26.13 23.58
9 220/33 KV Shedyal S/s. 136.55 0.63 8.56 18.64 20.84 16.01
10 220/33 KV Mendhegiri S/S 25.2 20.20 16.04 15.52 16.16 16.04 16.79
11 220/33 KV Khanapur S/s 24 3.26 22.65 21.77 22.21
12 220/33KV HIVARVADI SUB-STATION 181.5 25.83 20.36 20.16 26.15 21.86 22.87
13 110/33KV MAYANI SUB STATION 24 23.05 22.49 22.03 21.97 20.04 21.91
Total 806.05 Simple Average 19.52
Waited Avg CUF 18.88

41
District: Satara
Sr.No Name of Substation
Connected Load in MW
CUF in FY 2010-11
CUF in FY 2011-12
CUF in FY 2012-13
CUF in FY 2013-14
CUF in FY 2014-15
CUF in FY 2015-16
CUF in FY 2016-17
CUF in FY 2017-18
Average CUF of Wind Farm Connected to Substation
1 220/33 KV BOTHE SUB-STATION 193.4 10.79 19.01 10.87 23.95 23.62 19.36
2 220/33KV NIGADE SUB-STATION 45.2 11.77 10.85 10.76 16.43 17.19 22.42 17.60 15.87
3 220/33KV RATNAGIRI WIND SUB-STATION 86.4 18.20 18.72 22.23 22.98 20.47 20.52
4 220/33KV PANAMA SUB-STATION 70.4 9.95 15.09 17.79 23.83 20.62 19.33
5 220/33KV Chawaneshwar S/Stn 28.8 2.02 8.04 18.32 18.75 17.35 16.12 14.20 13.63 16.39
6 220 / 33 KV Vankusawade S/Stn 8.4 20.72 28.47 22.51 23.90
7 220/33/11KV MALHARPETH SUBSTATION 41.25 20.91 14.39 16.24 13.35 16.22
8 220/33 KV Sadawaghapur S/Stn 29.7 12.47 14.71 20.63 16.40 14.91 17.77 22.92 19.18 18.07
9 132/33KV KALEDHON SUBSTATION 31.2 12.40 23.35 25.92 22.17 23.81
10 132/33 kv AMBHERI 16 4.29 17.37 17.56 16.28 17.07
11 132/33KV AUNDH SUB-STATION 28.25 7.88 7.05 11.48 20.29 14.59 16.51 13.93 15.36
12 132/33/22 WAI EHV SUBSTATION 5.1 4.68 17.92 15.57 15.39 15.70 19.61 13.62 16.30
13 132/33/22 KV DAHIVADI SUBSTATION 20.4 16.04 14.57 12.67 14.64 13.86 14.35
14 33/11 KV KOREGAON 13.6 0 0 0 20.25 0.00 21.16 21.92 18.29 20.41
15 33/11 KV MEDHA SUBSTATION 5.7 0 0 0 18.83 11.91 18.55 33.06 22.11 19.48
16 33/22 KV VIKHALE SUBSTATION 4.5 0 0 0 0.00 2.69 24.12 27.04 19.02 23.39
17 132/33KV Satara Road S/Stn 12 0 0 0 0.00 0.00 15.93 13.87 14.90 14.90
Total 640.3 Simple Average 18.52
Waited Avg CUF 18.70
From above substation level data of wind power projects spread across the districts it can be
observed that out of 39 substations, only 12 substations are having wind power projects generating
at CUF more than 20% as follows:
Sr.No Name of Substation
Connected Load (in MW)
CUF in FY 2010-11
CUF in FY 2011-12
CUF in FY 2012-13
CUF in FY 2013-14
CUF in FY 2014-15
CUF in FY 2015-16
CUF in FY 2016-17
CUF in FY 2017-18
Average CUF of Wind Farm Connected to Substation
1 100/33 KV ANDRA LAKE 106.4 - 4.00 20.94 23.72 22.01 21.42 20.60 21.33 21.67
2 220KV/33KV Gangapur 73.8 4.79 25.04 25.23 19.27 22.16 23.46 20.31 22.58
3 132/33KV Khaprale Substation 18.9 13.39 24.92 17.83 22.46 25.61 21.18 22.40
4 220/33 KV Waiphale S/s. 30 1.59 25.09 14.13 28.97 26.13 23.58
5 220/33 KV Khanapur S/s 24 3.26 22.65 21.77 22.21
6 220/33KV HIVARVADI SUB-STATION 181.5 25.83 20.36 20.16 26.15 21.86 22.87
7 110/33KV MAYANI SUB STATION 24 23.05 22.49 22.03 21.97 20.04 21.91

42
8 220/33KV RATNAGIRI WIND SUB-STATION 86.4 18.20 18.72 22.23 22.98 20.47 20.52
9 220 / 33 KV Vankusawade S/Stn 8.4 20.72 28.47 22.51 23.90
10 132/33KV KALEDHON SUBSTATION 31.2 12.40 23.35 25.92 22.17 23.81
11 33/11 KV KOREGAON 13.6 0 0 0 20.25 0.00 21.16 21.92 18.29 20.41
12 33/22 KV VIKHALE SUBSTATION 4.5 0 0 0 0.00 2.69 24.12 27.04 19.02 23.39
602.7
The brief summary of district wise wind power generation projects substations with less than 20%
average CUF and above 20% average CUF is as follows:
District Total installed Capacity (MW)
Capacity of wind power projects with more than20% Avg CUF
Capacity of wind power projects with less than20% Avg CUF
Ahmednagar 67.60 0 67.6
Pune 106.40 106.4 0
Nandurbar 73.80 73.8 0
Beed 159.75 0 160
Kolhapur 64.10 0 64.1
Sangli 806.05 278.4 527.65
Satara 640.30 144.1 496.2
Total 1918.00 602.7 1315.3
From above table it can be seen that out of 1918MW of projects only 602.7MW (31%) of projects are
generating above benchmark of 20% and rest 1315.3MW (69%) are generating below benchmark of
20% CUF
2.2 Frequency and period of Generation data review for redetermination of CUF
The provision to re-determine the tariff as per actual CUF as specified in the regulation is as follows:
Regulation 28.1
………………”Provided that these CUF norms may be revised by the commission through general or
specific Order considering data that may become available subsequently”
The regulation intends to review the CUF based on the actual generation data so that no undue
benefit is given to the generators at the cost of consumers of Maharashtra. However, the regulation
is silent on the period of review.

43
MSEDCL proposed to revise the CUF of wind power projects commissioned during the control period
of MERC RE Tariff Regulations 2010 based on the actual generation/CUF data of first three years.
Hence, the substations which have more than 20% average CUF from the date of commissioning to
March 2018 are analyzed for average CUF for first three years as follows:
Sr.No Name of Substation
Connected Load in MW
CUF in FY 2011-12
CUF in FY 2012-13
CUF in FY 2013-14
CUF in FY 2014-15
CUF in FY 2015-16
CUF in FY 2016-17
CUF in FY 2017-18
Average CUF of Wind Farm from COD to FY 2017-18
Average CUF of Wind Farm for first three years
1 100/33 KV ANDRA LAKE 106.4 4 20.94 23.72 22.01 21.42 20.6 21.33 21.67 22.22
2 220KV/33KV Gangapur 73.8 4.79 25.04 25.23 19.27 22.16 23.46 20.31 22.58 23.18
3 132/33KV Khaprale S/s. 18.9 13.39 24.92 17.83 22.46 25.61 21.18 22.4 21.74
4 220/33 KV Waiphale S/s. 30 1.59 25.09 14.13 28.97 26.13 23.58 22.73
5 220/33 KV Khanapur S/s 24 3.26 22.65 21.77 22.21 22.21
6 220/33KV HIVARVADI S/S 181.5 25.83 20.36 20.16 26.15 21.86 22.87 22.12
7 110/33KV MAYANI S/S 24 23.05 22.49 22.03 21.97 20.04 21.91 22.52
8
220/33KV RATNAGIRI WIND
SUB-STATION 86.4 18.2 18.72 22.23 22.98 20.47 20.52 21.31
9 220/33kV Vankusawade S/S 8.4 20.72 28.47 22.51 23.9 23.90
10 132/33KV KALEDHON S/S 31.2 12.4 23.35 25.92 22.17 23.81 23.81
11 33/11 KV KOREGAON 13.6 0 0 20.25 0 21.16 21.92 18.29 20.41 20.46
12 33/22 KV VIKHALE S/S 4.5 0 0 0 2.69 24.12 27.04 19.02 23.39 23.39
602.7
The projects are commissioned in different years across the above twelve substations and
hence some of the projects have completed more than three years and some have not yet
completed three years.
Five projects average CUF till FY 2017-18 has been reduced than that of the first three years
average CUF
Four projects average CUF till FY 2017-18 has been increased than that of the first three years
average CUF
Four projects average CUF till FY 2017-18 is same as that of first three years average CUF as
they have just completed three years or completed less years.
The average CUF of wind power projects is dependent on the annual wind pattern which is
unknown and subject to change year on year. Hence, in some project the annual CUF has
been seen to be increased after three years and in some projects it was decreased after three
years.
The wind project is bound to degrade year on year and annual degradation factor was not
considered by most of the Commissions. However, due to the effect of changing wind pattern,
change in machine availability, change in grid availability it is very difficult to access and
comment on the annual degradation factor to be considered based on the actual generation
data.

44
The tariff is calculated for 13 years of PPA period by considering 20% CUF for Zone I. Even
though some of the projects are showing CUF more than 20% during initial few years, it is
likely that they may not able to achieve the similar CUF till the 13th year of PPA tenure. Hence,
applying the CUF derived from generation data of first three years will not be appropriate.
2.3 Analysis of State Average CUF of wind project commissioned under the control period of MERC
RE tariff Regulations 2010
The average CUF achieved across all the substations spread in seven districts shows that weighted
average CUF of wind projects commissioned in Pune and Nandurbar District are more than 20% and
the weighted average CUF of wind projects for rest of the districts is less than 20%. However, if we
consider the weighted average CUF of all the projects commissioned under MERC RE tariff Regulation
2010 is 18.86% which is less than that of 20% ceiling for Zone 1.
District
Average CUF (2010-11 to 2017-18)
Weighted Average CUF (2010-11 to2017-18)
Total installed Capacity (MW)
Ahmednagar 13.21 12.19 67.60
Pune 21.67 21.67 106.40
Nandurbar 22.58 22.58 73.80
Beed 18.95 18.95 159.75
Kolhapur 18.18 18.18 64.10
Sangli 19.52 18.88 806.05
Satara 18.52 18.70 640.30
State Simple Average CUF 18.95 1918.00
State Waited Average CUF 18.86
Hence, from the above state level actual wind generation CUF data it is clear that the wind power
projects are not generating more than 20% and there is no excess payment to developers for any
generation more than 20% if it is seen at macro level. However, the MERC RE tariff Regulations 2010
had specified wind power density zone wise tariff instead of having a common generic state average
CUF tariff to the wind power projects commissioned across the state. The Regulation had the
provision to re-determine the tariff as per the actual CUF as follows:
Regulation 28.1
………………”Provided that these CUF norms may be revised by the commission through general or
specific Order considering data that may become available subsequently”

45
Hence, the actual CUF achieved by some of the projects which is more than 20% needs to be
accessed along with the project specific techno-commercial parameters considered in the regulation
and that with the commissioned projects.
2.4 Analysis of Life time cost of wind power to DISCOM across the states
From the MERC order on case no 152 of 2018 dated 9th July 2018, it was observed that MSEDCL had
submitted that wind tariffs are highest in Maharashtra than that of the neighboring states for FY
2017-18 as follows:
(in Rs/kWh)
Maharashtra Zone I
Gujarat TamilNadu MP AP Karnataka
5.40 4.19 4.16 4.78 4.76 4.50
From above, it is observed that the tariff of wind power quoted for procurement by DISCOM is for FY
2017-18 which is out the control period of MERC RE Tariff Regulations 2010. Hence the comparison
has to be done for tariffs during the control period between 2010-11 to 2014-15. Further, it is
observed that the wind power is being purchased by DISCOMS for different PPA periods. In
Maharashtra the PPA and tariff is for 13 years however in other states the PPA and tariff is for 25
years of project life. Hence, comparison of tariff and cost to Distribution Company for procurement of
wind power can be done for first and last year of control period. Here it is assumed that if the wind
project is generating at 20% CUF then what could be the net cost to DISCOM over the project life, its
NPV at 10% for 25 and 13 years of cashflow as follows:
2010 Maharashtra Gujarat TamilNadu M.P. A.P Karnataka
Tariff (1 to 13 Years) without AD (Rs/kWh) 5.07 3.56 3.39 4.35 3.5 3.7
Tariff (14 to 25 Years) without AD (Rs/kWh) 2 3.56 3.39 4.35 3.5 3.7
Capital Cost (Rs. Lakhs) 467.13 462 535 500 470 470
CUF considered in Tariff Order (%) 20 23 27.15 20 24.5 26.5
One year Generation at 20% CUF 17,34,000 17,34,000 17,34,000 17,34,000 17,34,000 17,34,000
Total cost to DISCOM for purchase of wind power over 20 Years (in Rs) 15,59,03,940 15,43,26,000 14,69,56,500 18,85,72,500 15,17,25,000 16,03,95,000
NPV of 25 year Cashflow 6,92,93,039 5,60,32,931 5,33,57,201 6,84,67,205 5,50,88,556 5,82,36,473
NPV of 13 years Cashflow 6,24,48,304 4,38,49,302 4,17,55,375 5,35,79,906 4,31,10,269 4,55,73,713

46
2015 Maharashtra Gujarat TamilNadu M.P. A.P Karnataka
Tariff (1 to 13 Years) without AD (Rs/kWh) 5.7 4.15 3.51 5.92 4.83 4.5
Tariff (14 to 25 Years) without AD (Rs/kWh) 2 4.15 3.51 5.92 4.83 4.5
Capital Cost (Rs. Lakhs) 600.75 568.00 575 596.00 600 600
CUF considered in Tariff Order (%) 20 25 27.15 20 23.5 26.5
One year Generation at 20% CUF 17,34,000 17,34,000 17,34,000 17,34,000 17,34,000 17,34,000
Total cost to DISCOM for purchase of wind power over 20 Years 17,01,05,400 18,01,10,580 15,21,58,500 25,66,32,000 20,93,80,500 19,50,75,000
NPV of 25 year Cashflow 7,70,52,888 6,53,53,511 5,52,45,952 9,31,78,357 7,60,22,207 7,08,28,143
NPV of 13 years Cashflow 7,02,08,152 5,11,16,462 4,32,33,441 7,29,17,940 5,94,92,171 5,54,27,488
Observation:
The capital cost and CUF considered by MERC and other states Commissions are slightly
varying for 2010 and 2015 and also the tariff period. In Maharashtra the tariffs are
determined for 13 years whereas for other states it is 25 years. As the entire project located in
Maharashtra falls under Zone 1 i.e. 20% CUF the tariff is higher than other states where the
state average CUF is more than 20%.
For the sake of comparison of cost to DISCOM on common grounds it is considered that wind
project is generating at 20% CUF and then cost to DICOM for procurement of wind power
across the states is compared. It is observed that cost to procure wind power at 20% CUF is
higher in Maharashtra than some states and is also lower than some states. Same is the case
for NPV of 25 years cashflow discounted at 10%
However, it is observed that the NPV of first thirteen years of cashflow is highest in
Maharashtra than that of other states. This benefits the wind investors in early repayment of
debt and also reduces their risk.
It is also observed that, though the DISCOM of Maharashtra is paying higher tariff for first
thirteen years, their tariffs for the period between 14th year to 25 year are low as compared to
the other states and here they are been benefited with lower costs of procurement of wind
power. Hence, the overall cost to DISCOM over the 25 years project life is comparable with
other states and is win-win situation in Maharashtra for investors and DISCOM/consumers of
Maharashtra.
2.5 Generic vs project specific approach for wind project tariff determination

47
Wind power project uses multiple wind turbines of capacity more than 225kW, connected to utility
grid spread across different locations. While determining tariff for such multiple numbers of small
capacity generators generic tariff setting methodology is adopted by the Commissions. However, for
single large capacity wind power project or the project with new technology or hybrid projects using
wind turbines, the investors can approach the commission for project specific tariffs. In that case
Commission reviews operating and financial parameters of specific project and issues project specific
tariff.
In generic tariff setting approach SERC usually fixes the benchmark operating and financial
parameters for representative project for determination of tariff. Same tariff becomes applicable for
all projects commissioned during the control period of the said regulation/order. The benchmark
tariff approach could result in unattractiveness for projects that are above the cost benchmark /
below the performance benchmark and vice-versa. Also, unrealistic setting of the cost and
performance benchmark parameters can burden the developer or the licensee / consumers as the
case may be. Under benchmark costs approach the tariff structure and revenue represents
underlined cost and performance of the RE power projects.
Hence, under generic tariff approach, the developers are at the liberty to select and deploy
technology with lesser cost or with better operational parameters to minimise the risks and maximise
the returns.
Similarly in the present case, some of the wind projects will be generating at CUF above benchmark
due to better technology/operation and maintenance/resources. If the benchmark parameters are to
be revised for selected 42 projects then the demand may come from the projects which are
performing below benchmark parameters to reconsider the parameters and increase the tariff. This
will lead to unending process and may not promote the best technology or benefit the efforts in
optimizing the O&M.
If total capacity of wind power projects selling power to MSEDCL commissioned in the control period
of 2010 regulation is accessed it is observed that out of 1918 MW of projects only 602.7MW (31%) of
projects are generating above benchmark of 20% and rest 1315.3MW (69%) are generating below
benchmark of 20% CUF. Further, it is difficult to apportion the incremental cost of better technology,
increased cost of installation and commissioning at best strategic locations or the incremental cost of
effective O&M which is yielding more generation. Hence, after analyzing the statistics, at the macro
level the overall CUF of wind projects commissioned during the control period is less than 20% and
hence it is cannot be the case of undue benefit to developers and investors.

48
Observations and Conclusions:
Regulation 28.1 of the MERC RE Tariff Regulations 2010 had the provision as: “Provided that
these CUF norms may be revised by the commission through general or specific Order
considering data that may become available subsequently”. And accordingly the review of CUF
of wind power projects commissioned under this regulation’s control period was required.
However, while undertaking the review, MSEDCL had selected 42 wind power projects
comprising only 205MW out of the total installed capacity of 2373.25MW or 1918 MW the
capacity of projects selling power to MSEDCL under the said control period.
Further, the selected sample of 42 projects / 205 MW of commissioned projects were selected
for CUF / zone revision based on their two/three years of consistently higher generation
(more than 20% determined for Zone I). In every wind farm some of the turbines are bound to
generate more than that of other wind turbines of the same farm due to their strategic
location within the wind farm which permits the less array loss or faces more wind due to
their location facing prominent wind direction. Hence, while undertaking any study for
revision of CUF based on the actual generation data, complete wind farm’s sample needs to
be accessed.
While evaluation of these 42 projects, it was observed that their average generation over the
period starting from the date of commissioning of these wind turbines till March 2018, had
the average CUF more than 20%. These 42 projects were spread across 14 wind masts and
hence 14 wind farms were considered for evaluation of CUF. When the neighboring wind
turbines were added to these 42 projects so as to have a sample of complete wind farm it was
observed that about 869MW of wind turbines were spread across 14 projects. Out of these 14
wind farms only 6 wind farms had average generation more than 20%. Further, it was also
observed that zoning was offered based on the nearest wind mast and in some of the cases
there were two wind masts on single site. Hence, wind projects connected to one pooling
substation are also considered for average CUF calculation.
Field verification of 57MW of wind turbines out of 205.7MW of shortlisted projects (27%
sample) was undertaken to verify the location, elevation and technology deployed. It was
observed that these wind projects were falling within the areal distance of 10 km from the
wind mast complying with the wind zoning procedure of MEDA. It was observed that 57MW
of wind turbines visited had benefits due to their locations and may be due to the turbine hub
height, rotor diameter and technology etc.
All the 42 wind projects / 205MW of turbines were marked on google earth and verified the
distances from reference wind mast and its compliance with the MEDA zoning procedure.
All the fourteen wind masts under study were plotted on 50 mtr WPD map of NIWE in GIS arc
and found that all the masts falls under the WPD up to 250 watts / sq.mtr except the mast
located at Chakla in district Nandurbar. As per the 50 mtr WPD map of NIWE it is observed
that location Chakla falls under the WPD 250 to 300 watts/sq.mtr however, for the same
location the extrapolated WPD from NIWE’s mast is 323 i.e. within the WPD zone from 300 to

49
350. So there is in-consistency in NIWE’s extrapolated WPD in the list of potential sites and
that of GIS arc map. The deviations in the extrapolation of WPD as per the NIWE’s wind mast
may be due to its measurement height at 25 mtr and the measurement was done for the
period between April 1999 to June 2000.On the contrary the measurement at Chakla for
Suzlon mast was for the period from August 2003 to July 2004 at 50 mtr height and there is no
uncertainty as measurements were done at 50 mtr. It was found that NIWE had studied the
WPD for all the WTG locations in detail and certified the WPD. Based on NIWE’s certified WPD
for Chakla site and accordingly the projects were allotted the Zone I WPD. Hence, all the 42
projects are falling under the WPD specified for Zone I at 50mtr height.
Analysis of estimated wind power generation and WPD at hub height was carried out for only
one wind farm located at Kotoli in Dist Kolhapur. From the WAsP analysis it is observed that
WPD at WTG hub height is close to 200 Watts/sq mtr and it was certified as 180 watts / sq.
mtr at 50 mtr height at mast location. Further, the wind turbine location BHT-19 is showing
annual CUF of 23% at P75 probability and 23.27%. from the actual generation data. This
higher generation was observed to be due to its location within the wind farm. Further, the
average CUF of the wind farm was observed at 21.1% at 75% probability in WAsP as against
19.28% from actual generation data. Hence, actual generation is in line with WAsP estimation
for the complete wind farm.
Analysis of WPD at actual WTG Hub Height was done by extrapolating data to Hub Height of
42 wind power projects. And the revised WPD was compared with the zones as per Regulation
2010. From this it was observed that, out of 205.7MW of shortlisted projects 13.6MW of
projects / wind turbines hub height elevation was below the mast elevation and was
considered in Zone 1 and about 120.9MW of wind projects had higher WPD that of Zone II and
III. In every complex terrain there will be some installations which will get the advantage of
high elevation and may yield more generation and some will be at lower elevation and will
produce less energy due to elevation. Further, some of the WTGs will get the advantage of
their location and will generate more than the WTGs which are affect by high array loss within
the same wind farm. If the CUF has to be accessed for each turbine location then higher
generating WTGs will fetch low tariff and low generating WTGs will fetch high tariff. Hence,
the issue needs to be analyzed holistically in the generic tariff determination process or
project specific tariff for all the turbines will have to be accessed.
The 42 projects under study were accessed from the point of technology deployment and it
was observed that all these 205.7MW of projects had the wind turbine Hub Height varying
from 60.6 to 95mtr and rotor diameter varying from 53 to 100mtr. Hence, all the 42 projects
have benefited in generation due to technology and location. The increase in hub height and
rotor diameter increases the capital cost and also setting up the project at complex terrain
than that of flat terrain increases the cost of logistics and installation and commissioning. Also,
the incremental generation may be due to effective O&M. However, it is very difficult to
identify these incremental costs and related generation gains.

50
The regulation is silent on the period of review of CUF for revision of CUF norm / zone.
MSEDCL proposed to revise the CUF of wind power projects based on the actual
generation/CUF data of first three years. The average CUF of wind power projects is
dependent on the annual wind pattern which is unknown and subject to change year on year.
Further, wind project is bound to degrade year on year and annual degradation factor was not
considered by most of the Commissions. However, due to the effect of changing wind pattern,
change in machine availability, change in grid availability it is very difficult to access and
comment on the annual degradation factor to be considered based on the actual generation
data. The tariff is calculated for 13 years of PPA period by considering 20% CUF for Zone I.
Even though some of the projects are showing CUF more than 20% during initial few years, it
is likely that they may not able to achieve the similar CUF till the 13th year of PPA tenure.
Hence, applying the CUF derived from generation data of first three years will not be
appropriate.
The capital cost and CUF considered by MERC and other states Commissions are varying
slightly for 2010 and 2015 and also the tariff period considered in Maharashtra was for 13
years whereas for other states it was 25 years. For the sake of comparison of cost to DISCOM
on common ground it is considered that wind project is generating at 20% CUF and then cost
to DISCOM for procurement of wind power across the states is compared. It is observed that
cost to procure wind power at 20% CUF is higher in Maharashtra than some states and is also
lower than some states. Further, it is observed that the NPV of first thirteen years of cashflow
is highest in Maharashtra than any other state. This benefits the wind investors in early
repayment of debt and also reduces their risk. It is also observed that, though the DISCOM of
Maharashtra is paying higher tariff for first thirteen years, their tariffs for the period between
14th year to 25th year are low as compared to the other states and here they are been
benefited with lower costs of procurement of wind power. Hence, the overall cost to DISCOM
over the 25 years project life is comparable with other states and is win-win situation in
Maharashtra for investors and DISCOM/consumers of Maharashtra.
Out of 1918MW of projects only 602.7MW (31%) of projects are generating above benchmark
of 20% and rest 1315.3MW (69%) are generating below benchmark of 20% CUF. If on the basis
of CUF, the tariff / wind zone of 602.7MW (31%) of project is to be reduced, then it will lead to
the scope to increase the tariff for 1315.3MW (69%) of projects which are generating at less
CUF. Further, it is difficult to apportion the incremental cost of project due to increased hub
height, increased rotor diameter, incremental cost in developing project on high elevation and
complex terrains, incremental cost of effective O&M by IPPs etc. which is benefiting the wind
projects in terms of higher generations.
As per the MERC Regulation, the parameters considered for wind zoning are static and fixed
and there is hardly any possibility of its deviation while determining the wind zone. The
coordinates of wind turbine and mast are fix, their elevation is fix and the same can be
verified from Google earth for its permitted areal distance of 10 km. Further, in case of doubts

51
in wind zoning, MEDA has referred such cases to NIWE for its WPD certification. Wind zoning
was analyzed by the committee constituted by DG MEDA for the purpose and the MERC
Regulation specifying WPD measurement at 50mtr was strictly followed. If at all any new
methodology is to be adopted for WPD and zone certification the variable parameters like
turbine hub height, WTG elevation, turbine technology etc. needs to be correlated to derive
an acceptable formula for the new control period.
The weighted average CUF of all the projects commissioned under the control period of MERC
RE tariff Regulation 2010 is 18.86% which is less than that of 20% ceiling for Zone 1. Hence, it
is clear that the wind power projects are not generating more than 20% and there is no excess
payment to developers for any generation more than 20% if it is seen at macro level. Hence,
there seems no requirement for wind zone revision based on actual generation data and
change of tariff for part of the projects generating high due to technology and operational
parameters.

52
Annexure
1) Mapping of 42 Projects and wind masts on Google earth.
2) Mapping of WTG’s located in Chakla on NIWE’s 50 mtr WPD map and zone classification.
3) Estimated Wind Power generation derived WAsP for Kotoli Wind Site in Dist. Kolhapur.
4) Copy of excel sheet showing cost to DISCOM for procurement of wind power.

1
Annexure I
Mapping of WTGs under the referred mast
Observation:
All the WTGs under kotholi mast are mapped on google earth. It has been observed that all the
WTGs fall under 10 km radius of the mast referred. The WTGs plotted with the red pointer
indicates the ones under inspection. The masts are marked in Blue color. The WTGs marked with
yellow pointer are the neighboringWTGs under the same mast.
Sr. no Zones Mast details WPD at 50 mtr
Elevation m amsl
Zone WPD (Watt/m2)
1 Kolhapur Kotoli Taluka - Shahuwadi District - Kolhapur ,Latitude- N 160 57’ 54.2’’ Longitude- E 730 58’ 28.4’’
180 782 100-200

2
Sr. no Zones Mast details WPD at 50
mtr
Elevation m
amsl
Zone WPD
(Watt/m2)
2 Khanapur Khanapur, Tal. Khatav, Dist. Satara
,Latitude- 170 26’ 37.1’’ N Longitude-
740 40’ 25.1’’ E
211.66 942 200-250
Observation:
All the WTGs under khanapur mast are mapped on google earth. It has been observed that all
the WTGs fall under 10 km radius of the mast referred.

3
Sr. no Zones Mast details WPD at 50 mtr
Elevation m amsl
Zone WPD (Watt/m2)
3 Sangli 1 Village - Jath II, Dist. Sangli
16°58'48'' 75°13'52.3''
210.96 749 200-250
Observation:
All the WTGs under Jath II mast are mapped on google earth. It has been observed that all the
WTGs fall under 10 km radius of the mast referred.

4
Sr. no Zones Mast details WPD at 50 mtr
Elevation m amsl Zone WPD (Watt/m2)
4 Palshi Palshi Tal. Patan Dist.
Satara Latitude - 170 16’
09.8” N, Longitude - 730
49’ 34.02” E
203 1008 200-250
Observation:
All the WTGs under Palshi mast are mapped on google earth. It has been observed that all the
WTGs fall under 10 km radius of the mast referred.

5
Sr. no Zones Mast details WPD at 50 mtr
Elevation m amsl
Zone WPD (Watt/m2)
5 Bothe Village - Bothe Taluka - Maan District -
Satara (Latitude- N 170 47’ 08.7’’
Longitude- E 740 22’ 08.3’’)
214.2 1040 200-250
Observation:
All the WTGs under Bothe mast are mapped on google earth. It has been observed that all the
WTGs fall under 10 km radius of the mast referred.

6
Sr. no Zones Mast details WPD at 50 mtr
Elevation m amsl
Zone WPD (Watt/m2)
6 Sadawaghapur Sadawaghapur Tal. Patan Dist.
Satara Latitude - 170 25’ 26.7’’ N,
Longitude - 730 55’ 42.2’’ E
211.76 1074 200-250
Observation:
All the WTGs under Sadhwaghpur mast are mapped on google earth. It has been observed that
all the WTGs fall under 10 km radius of the mast referred.

7
Sr. no Zones Mast details WPD at 50 mtr
Elevation m amsl
Zone WPD (Watt/m2)
7 Chavaneshware Village - Chavaneshware,
Dist. Satara 17°52'48.8''
74°02'32.9''
234 1185 200-250
Observation:
All the WTGs under Chavaneshware mast are mapped on google earth. It has been observed
that all the WTGs fall under 10 km radius of the mast referred.

8
Sr. no Zones Mast details WPD at 50 mtr
Elevation m amsl
Zone WPD (Watt/m2)
8 Nandurbar Village - Chakla, Dist. Nandurabar 21°16'53.0'' 74°18'30.2''
227.78 353 250-300
Observation:
All the WTGs under Chakla, Nandurbar mast are mapped on google earth. It has been observed
that all the WTGs fall under 10 km radius of the mast referred.
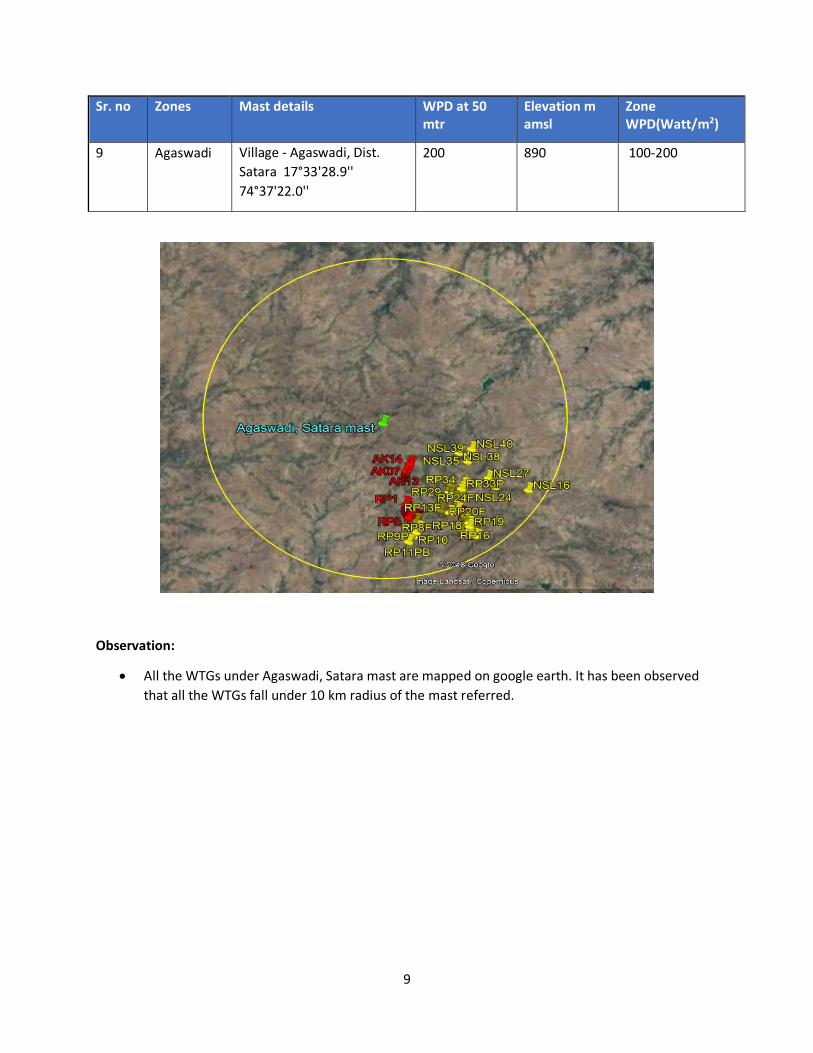
9
Sr. no Zones Mast details WPD at 50 mtr
Elevation m amsl
Zone WPD(Watt/m2)
9 Agaswadi Village - Agaswadi, Dist.
Satara 17°33'28.9''
74°37'22.0''
200 890 100-200
Observation:
All the WTGs under Agaswadi, Satara mast are mapped on google earth. It has been observed
that all the WTGs fall under 10 km radius of the mast referred.

Annexure II
Mapping of WTG’s located in Chakla on NIWE’s 50 mtr WPD map and zone classification
Sr. no
District Mast details WPD at 50 mtr as per mast data
(Watt/m2)
Elevation m amsl
WPD as per NIWE’s 50 mtr WPD map
(Watt/m2)
1 Nandurbar Village - Chakla, Lat 21°16'53.0'' Lon 74°18'30.2''
227.78 353 250-300
Observation:
As per the 50 mtr WPD map of NIWE it is observed that location Chakla falls under
the WPD 250 to 300 watts/sq.mtr. Further, all the WTGs located in the Chakla site in
Nandurbar are plotted on the GIS arc and all of them except one WTG’s falls under
WPD zone of 250 to 300 as per the map.

1
Annexure III: Estimated Wind Power generation derived WAsP for Kotoli Wind Site in
Dist. Kolhapur
Inox DF 92_80
Project Size (MW) 36
Gross Estimated Energy 81.13 GWh
Bhendawade Assessment Results
Wake Effects 94.8%
Internal Wake Effects 94.8%
External Wake Effects 100.0%
Future Wake Effects 100.0%
Availability 94.1%
Turbine Availability 98.0%
Balance of Plant availability 99.0%
Grid Availability 97.0%
Electrical Efficiency 97.0%
Operational electrical efficiency 97.0%
Wind Farm consumption 100.0%
Turbine Performance 98.5%
Generic Power Curve adjustment 99.5%
High wind speed hysteresis 100.0%
Site specific power curve adjustment 99.5%
Sub-optimal performance 100.0%
Blade degradation 99.5%
Environmental 100.0%
Icing degradation 100.0%
Icing shutdown 100.0%
Temperature shutdown 100.0%
Site access 100.0%
Tree Growth 100.0%
Curtailment 100.0%
Wind Sector Management 100.0%
Grid Curtailment 100.0%
Noise,Visual and Environmental Curtailment 100.0%

2
Uncertainity Assessment
Sr. No. Parameters Site Uncertainity (%)
1 Annual Wind Variation 4.0
2 Measurement error 2.0
3 Air Density Correction 3.0 4 Power Curve uncertainity 3.0 5 Terrain Description 1.5 6 Long term correlation 4.0 7 Wind Flow Modeling
(a) Vertical extrapolation 2.0 (b) Horizondal extrapolation 4.0 (c) Wake modeling 3.0 (d) Accuracy of terrain map 3.0 (e) Roughness 3.0
8 Mounting error 3.0
RMS Value 10.6
Loss Assumptions:
Machine Availability : 98.0%
Grid Availability : 97.0%
Transmission Efficiency 97.0%
Turbine Performance 98.5%
Balance of Plant Availability 99.0%
Blade Degradation 99.5%
Specific Power Curve Adjustment 99.5%
Environmental 99.5%
External Wake 100.0%
Overall Uncertainty 10.6% 0.106
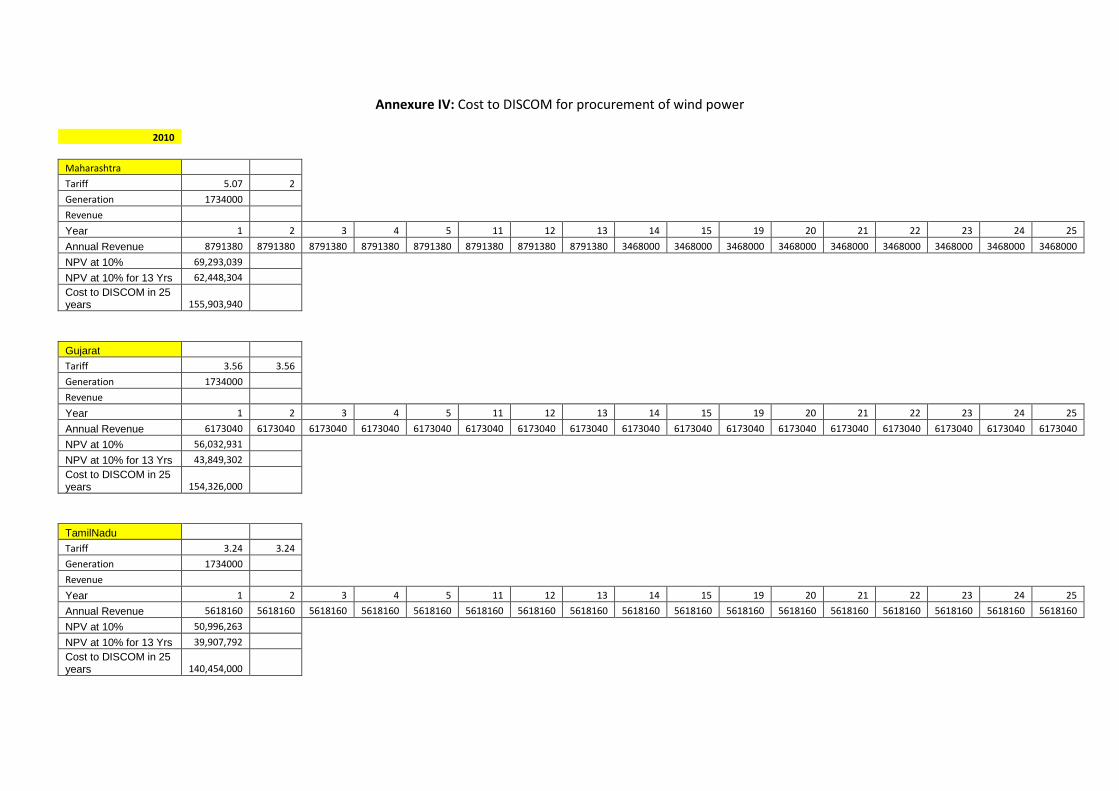
Annexure IV: Cost to DISCOM for procurement of wind power
2010
Maharashtra Tariff 5.07 2 Generation 1734000 Revenue Year 1 2 3 4 5 11 12 13 14 15 19 20 21 22 23 24 25
Annual Revenue 8791380 8791380 8791380 8791380 8791380 8791380 8791380 8791380 3468000 3468000 3468000 3468000 3468000 3468000 3468000 3468000 3468000
NPV at 10% 69,293,039 NPV at 10% for 13 Yrs 62,448,304 Cost to DISCOM in 25
years
155,903,940
Gujarat Tariff 3.56 3.56 Generation 1734000 Revenue Year 1 2 3 4 5 11 12 13 14 15 19 20 21 22 23 24 25
Annual Revenue 6173040 6173040 6173040 6173040 6173040 6173040 6173040 6173040 6173040 6173040 6173040 6173040 6173040 6173040 6173040 6173040 6173040
NPV at 10% 56,032,931 NPV at 10% for 13 Yrs 43,849,302 Cost to DISCOM in 25
years
154,326,000
TamilNadu Tariff 3.24 3.24 Generation 1734000 Revenue Year 1 2 3 4 5 11 12 13 14 15 19 20 21 22 23 24 25
Annual Revenue 5618160 5618160 5618160 5618160 5618160 5618160 5618160 5618160 5618160 5618160 5618160 5618160 5618160 5618160 5618160 5618160 5618160
NPV at 10% 50,996,263 NPV at 10% for 13 Yrs 39,907,792 Cost to DISCOM in 25
years
140,454,000

Madhya Pradesh Tariff 4.35 4.35 Generation 1734000 Revenue Year 1 2 3 4 5 11 12 13 14 15 19 20 21 22 23 24 25
Annual Revenue 7542900 7542900 7542900 7542900 7542900 7542900 7542900 7542900 7542900 7542900 7542900 7542900 7542900 7542900 7542900 7542900 7542900
NPV at 10% 68,467,205 NPV at 10% for 13 Yrs 53,579,906 Cost to DISCOM in 25
years
188,572,500
AP Tariff 3.43 3.43 Generation 1734000 Revenue Year 1 2 3 4 5 11 12 13 14 15 19 20 21 22 23 24 25
Annual Revenue 5947620 5947620 5947620 5947620 5947620 5947620 5947620 5947620 5947620 5947620 5947620 5947620 5947620 5947620 5947620 5947620 5947620
NPV at 10% 53,986,785 NPV at 10% for 13 Yrs 42,248,063 Cost to DISCOM in 25
years
148,690,500
Karnataka Tariff 3.7 3.7 Generation 1734000 Revenue Year 1 2 3 4 5 11 12 13 14 15 19 20 21 22 23 24 25
Annual Revenue 6415800 6415800 6415800 6415800 6415800 6415800 6415800 6415800 6415800 6415800 6415800 6415800 6415800 6415800 6415800 6415800 6415800
NPV at 10% 58,236,473 NPV at 10% for 13 Yrs 45,573,713 Cost to DISCOM in 25
years
160,395,000
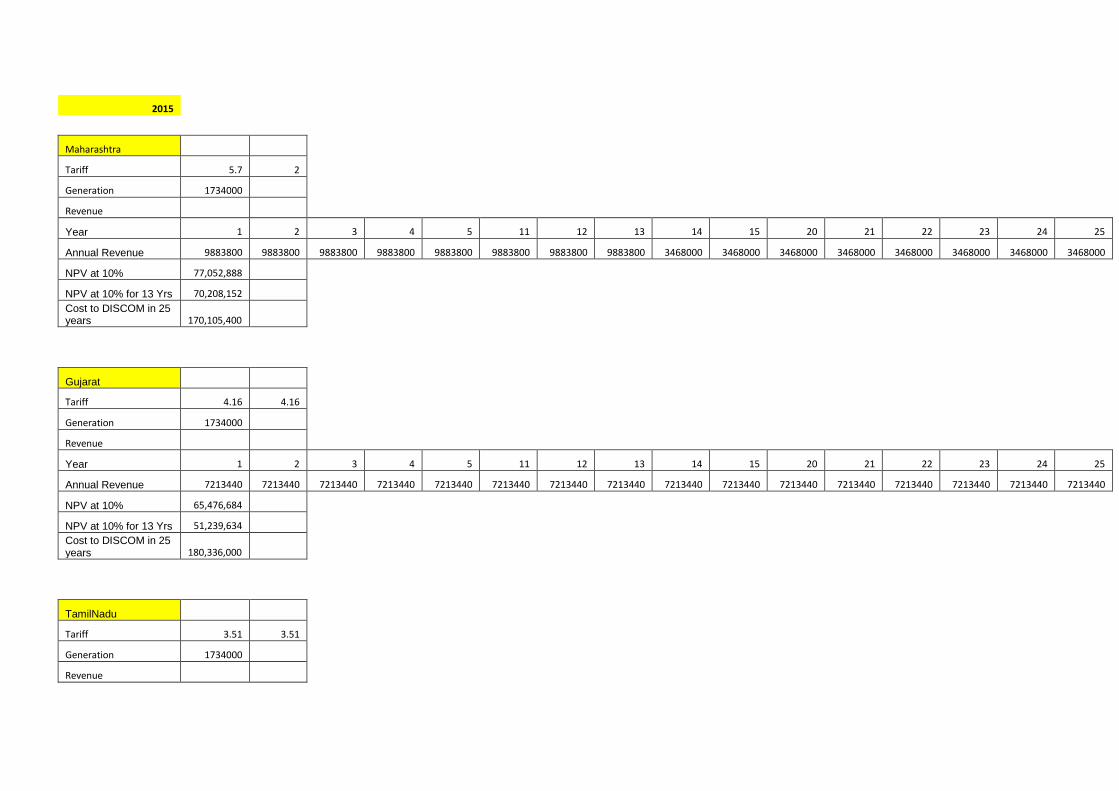
2015
Maharashtra
Tariff 5.7 2
Generation 1734000
Revenue
Year 1 2 3 4 5 11 12 13 14 15 20 21 22 23 24 25
Annual Revenue 9883800 9883800 9883800 9883800 9883800 9883800 9883800 9883800 3468000 3468000 3468000 3468000 3468000 3468000 3468000 3468000
NPV at 10% 77,052,888
NPV at 10% for 13 Yrs 70,208,152 Cost to DISCOM in 25
years
170,105,400
Gujarat
Tariff 4.16 4.16
Generation 1734000
Revenue
Year 1 2 3 4 5 11 12 13 14 15 20 21 22 23 24 25
Annual Revenue 7213440 7213440 7213440 7213440 7213440 7213440 7213440 7213440 7213440 7213440 7213440 7213440 7213440 7213440 7213440 7213440
NPV at 10% 65,476,684
NPV at 10% for 13 Yrs 51,239,634 Cost to DISCOM in 25
years
180,336,000
TamilNadu
Tariff 3.51 3.51
Generation 1734000
Revenue

Year 1 2 3 4 5 11 12 13 14 15 20 21 22 23 24 25
Annual Revenue 6086340 6086340 6086340 6086340 6086340 6086340 6086340 6086340 6086340 6086340 6086340 6086340 6086340 6086340 6086340 6086340
NPV at 10% 55,245,952
NPV at 10% for 13 Yrs 43,233,441 Cost to DISCOM in 25
years
152,158,500
Mahdya Pradesh
Tariff 5.92 5.92
Generation 1734000
Revenue
Year 1 2 3 4 5 11 12 13 14 15 20 21 22 23 24 25
Annual Revenue 10265280 10265280 10265280 10265280 10265280 10265280 10265280 10265280 10265280 10265280 10265280 10265280 10265280 10265280 10265280 10265280
NPV at 10% 93,178,357
NPV at 10% for 13 Yrs 72,917,940 Cost to DISCOM in 25
years
256,632,000
AP
Tariff 4.83 4.83
Generation 1734000
Revenue
Year 1 2 3 4 5 11 12 13 14 15 20 21 22 23 24 25
Annual Revenue 8375220 8375220 8375220 8375220 8375220 8375220 8375220 8375220 8375220 8375220 8375220 8375220 8375220 8375220 8375220 8375220
NPV at 10% 76,022,207
NPV at 10% for 13 Yrs 59,492,171 Cost to DISCOM in 25
years
209,380,500

Karnataka
Tariff 4.5 4.5
Generation 1734000
Revenue
Year 1 2 3 4 5 11 12 13 14 15 20 21 22 23 24 25
Annual Revenue 7803000 7803000 7803000 7803000 7803000 7803000 7803000 7803000 7803000 7803000 7803000 7803000 7803000 7803000 7803000 7803000
NPV at 10% 70,828,143
NPV at 10% for 13 Yrs 55,427,488 Cost to DISCOM in 25
years
195,075,000
Copyright © 2022 FDOKUMEN