saudi arabia culture minister prince badr visits ... - Arab News
ARTICLE IN PRESS
Renewable and Sustainable Energy Reviews
11 (2007) 937–950
1364-0321/$ -
doi:10.1016/j
�CorrespoE-mail ad
URL: htt
www.elsevier.com/locate/rser
Wind power resource assessmentfor Rafha, Saudi Arabia
S. Rehmana,�, I.M. El-Aminb, F. Ahmada, S.M. Shaahida,A.M. Al-Shehrib, J.M. Bakhashwainb
aCenter for Engineering Research, King Fahd University of Petroleum and Minerals, KFUPM Box #767,
Dhahran 31261, Saudi ArabiabElectrical Engineering Department, King Fahd University of Petroleum and Minerals,
Dhahran 31261, Saudi Arabia
Received 1 July 2005; accepted 7 July 2005
Abstract
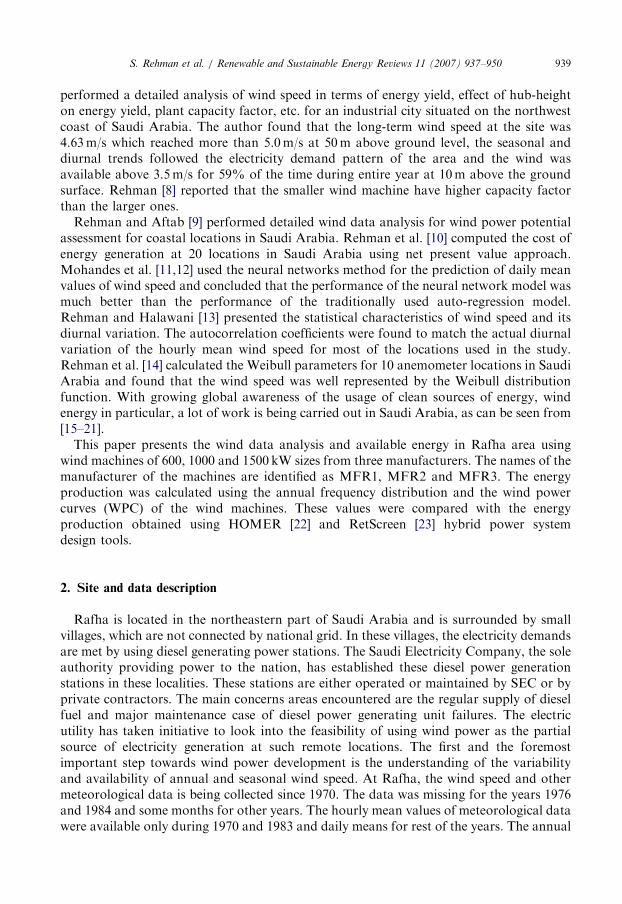
This paper, presents the analysis of wind speed data and available energy in Rafha area using wind
machines of 600, 1000 and 1500 kW sizes from three manufacturers. The long-term annual mean
values of wind speeds were found to vary between a minimum of 2.5m/s in the year 2002 and a
maximum of 4.9m/s in 1990. The frequency distribution showed that wind remained silent for 7% of
the time on an average during 24 years of data period and 35% between 0 and 3.5m/s. Wind speed
remained above 3.5m/s for 65% of the time and only 20% of the times above 6.5m/s. The annual
wind energy production and plant capacity factors, obtained using different methods and wind
machines of three sizes and from three manufacturers are also discussed and compared.
r 2006 Elsevier Ltd. All rights reserved.
Keywords: Wind speed; Wind power; Plant capacity factor; Wind machine
Contents
1. Introduction . . . . . . . . . . . . . . . . . . . . . . . . . . . . . . . . . . . . . . . . . . . . . . . . . . . . . . . 938
2. Site and data description . . . . . . . . . . . . . . . . . . . . . . . . . . . . . . . . . . . . . . . . . . . . . . 939
see front matter r 2006 Elsevier Ltd. All rights reserved.
.rser.2005.07.003
nding author. Tel.: +966 3 8603802; fax: +966 3 8603996.
dress: [email protected] (S. Rehman).
p://staff.kfupm.edu.sa/ri/srehman.
ARTICLE IN PRESSS. Rehman et al. / Renewable and Sustainable Energy Reviews 11 (2007) 937–950938
3. Results and discussion . . . . . . . . . . . . . . . . . . . . . . . . . . . . . . . . . . . . . . . . . . . . . . . . 940
3.1. Wind speed analysis . . . . . . . . . . . . . . . . . . . . . . . . . . . . . . . . . . . . . . . . . . . . . 940
3.2. Mean wind power density variation . . . . . . . . . . . . . . . . . . . . . . . . . . . . . . . . . . 942
3.3. Wind speed frequency distribution . . . . . . . . . . . . . . . . . . . . . . . . . . . . . . . . . . . 944
3.4. Renewable energy yield. . . . . . . . . . . . . . . . . . . . . . . . . . . . . . . . . . . . . . . . . . . 944
3.5. Green house gases (ghg) emissions . . . . . . . . . . . . . . . . . . . . . . . . . . . . . . . . . . . 947
4. Conclusions. . . . . . . . . . . . . . . . . . . . . . . . . . . . . . . . . . . . . . . . . . . . . . . . . . . . . . . . 948
Acknowledgements . . . . . . . . . . . . . . . . . . . . . . . . . . . . . . . . . . . . . . . . . . . . . . . . . . . . . . 948
References . . . . . . . . . . . . . . . . . . . . . . . . . . . . . . . . . . . . . . . . . . . . . . . . . . . . . . . . . . . . 949
1. Introduction
An accurate wind resource assessment is an important and critical factor to be wellunderstood for harnessing the power of the wind. It is well known that an error of 1% inwind speed measurements leads to almost 2% error in energy output. As we know thatwind resources are seldom consistent and vary with time of the day, season of the year,height above the ground, type of terrain and from year to year. As such it should beinvestigated carefully and completely. The surface roughness and the obstacle in thevicinity of wind measuring tower are also important factors to be considered for windresource assessment. According to Tennis et al. [1] the wind resource assessment poweringa wind farm project is as fundamental to the project’s success as rainfall is to alfalfaproduction. So, one who is interested in a wind farm development should know that howstrong are the winds at the site of interest and how much energy the wind farm will producein these winds.Michael et al. [2] presented the methodology and results of a wide area wind resources
assessment and site selection in Colorado. The authors accomplished the set objective ofidentifying 20 candidate locations for evaluation and long-term wind monitoring by usinga geographic information system (GIS). Potts et al. [3] performed the wind resourcesassessment of Western and Central Massachusetts using WindMap software, which isbased on geographic information systems (GIS). The authors utilized wind speed datafrom five locations and upper air data from one location as input to WindMap software toproduce estimates of wind speed at 50m. Potts et al. [3] found highest windy areas exist atthe corner of northwestern part of Massachusetts. Large winds were also found aroundWorcester region while weak winds were found near Connecticut River Valley. Brower [4]used GIS based tools to develop wind resource map for New Mexico using wind speeddata from 67 stations and elevation data in the region. Brower [5] developed maps formonthly and annual mean wind speeds in Iowa using GIS software. These maps weredeveloped using wind speed data from 21 locations, which would be helpful to interestedwind farms developers to obtain reasonably accurate estimates of potential wind energyproduction at any location in Iowa.In Saudi Arabia, work on wind resource assessment dates back to 1986 when a wind
atlas was developed by using wind speed data from 20 locations [6]. This atlas presentedthe monthly mean wind speed contours and frequency distribution for all the monthsduring the year. Rehman [7] presented the energy output and economical analysis of30MW installed capacity wind farms at five coastal locations in terms of unadjustedenergy, gross energy, renewable energy delivered, specific yield and wind farm capacityfactor using wind machines of 600, 1000 and 1500 kW. In another study, Rehman [8]
ARTICLE IN PRESSS. Rehman et al. / Renewable and Sustainable Energy Reviews 11 (2007) 937–950 939
performed a detailed analysis of wind speed in terms of energy yield, effect of hub-heighton energy yield, plant capacity factor, etc. for an industrial city situated on the northwestcoast of Saudi Arabia. The author found that the long-term wind speed at the site was4.63m/s which reached more than 5.0m/s at 50m above ground level, the seasonal anddiurnal trends followed the electricity demand pattern of the area and the wind wasavailable above 3.5m/s for 59% of the time during entire year at 10m above the groundsurface. Rehman [8] reported that the smaller wind machine have higher capacity factorthan the larger ones.
Rehman and Aftab [9] performed detailed wind data analysis for wind power potentialassessment for coastal locations in Saudi Arabia. Rehman et al. [10] computed the cost ofenergy generation at 20 locations in Saudi Arabia using net present value approach.Mohandes et al. [11,12] used the neural networks method for the prediction of daily meanvalues of wind speed and concluded that the performance of the neural network model wasmuch better than the performance of the traditionally used auto-regression model.Rehman and Halawani [13] presented the statistical characteristics of wind speed and itsdiurnal variation. The autocorrelation coefficients were found to match the actual diurnalvariation of the hourly mean wind speed for most of the locations used in the study.Rehman et al. [14] calculated the Weibull parameters for 10 anemometer locations in SaudiArabia and found that the wind speed was well represented by the Weibull distributionfunction. With growing global awareness of the usage of clean sources of energy, windenergy in particular, a lot of work is being carried out in Saudi Arabia, as can be seen from[15–21].
This paper presents the wind data analysis and available energy in Rafha area usingwind machines of 600, 1000 and 1500 kW sizes from three manufacturers. The names of themanufacturer of the machines are identified as MFR1, MFR2 and MFR3. The energyproduction was calculated using the annual frequency distribution and the wind powercurves (WPC) of the wind machines. These values were compared with the energyproduction obtained using HOMER [22] and RetScreen [23] hybrid power systemdesign tools.
2. Site and data description
Rafha is located in the northeastern part of Saudi Arabia and is surrounded by smallvillages, which are not connected by national grid. In these villages, the electricity demandsare met by using diesel generating power stations. The Saudi Electricity Company, the soleauthority providing power to the nation, has established these diesel power generationstations in these localities. These stations are either operated or maintained by SEC or byprivate contractors. The main concerns areas encountered are the regular supply of dieselfuel and major maintenance case of diesel power generating unit failures. The electricutility has taken initiative to look into the feasibility of using wind power as the partialsource of electricity generation at such remote locations. The first and the foremostimportant step towards wind power development is the understanding of the variabilityand availability of annual and seasonal wind speed. At Rafha, the wind speed and othermeteorological data is being collected since 1970. The data was missing for the years 1976and 1984 and some months for other years. The hourly mean values of meteorological datawere available only during 1970 and 1983 and daily means for rest of the years. The annual
ARTICLE IN PRESSS. Rehman et al. / Renewable and Sustainable Energy Reviews 11 (2007) 937–950940
mean values and standard deviations were used to synthesize the hourly values for theyears between 1985 and 2004.The long-term general meteorology of Rafha indicates: the temperature varying between
a minimum of �3:8 �C and a maximum of 48:4 �C while the mean remained as 23:73 �C; therelative humidity varied between 2 and 100% with a mean of 33.5%; and the surfacestation pressure extremes were 945.5 and 979.2 mb and the mean was 960.55mb.Moreover, the air density calculated using the temperature and surface pressure was foundto vary between a minimum of 1:03 kg=m3 and a maximum of 1:25 kg=m3, while the meanremained as 1:13 kg=m3.
3. Results and discussion
This section provides in-depth analysis of wind speed, energy yield and comparison ofenergy yield with different methods.
3.1. Wind speed analysis
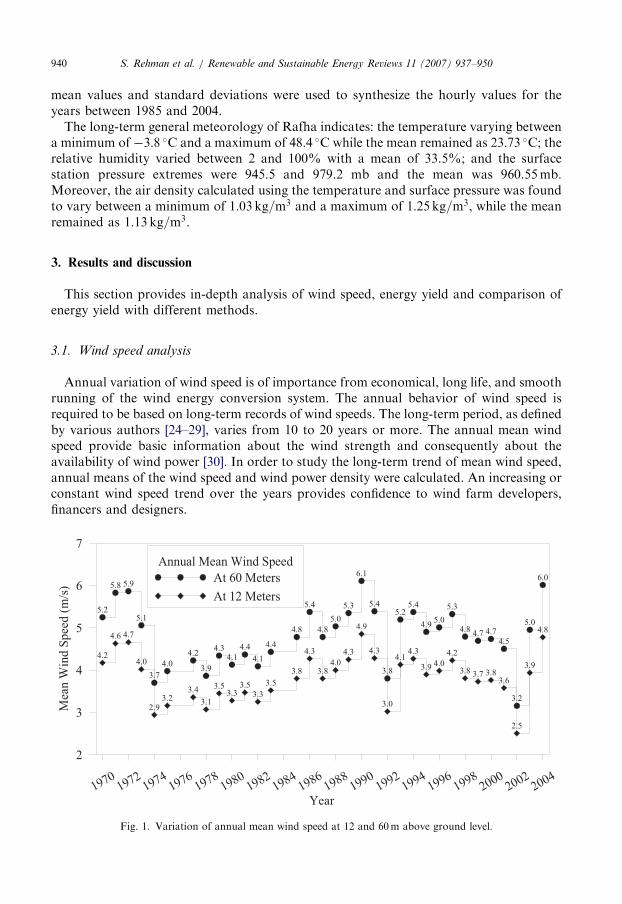
Annual variation of wind speed is of importance from economical, long life, and smoothrunning of the wind energy conversion system. The annual behavior of wind speed isrequired to be based on long-term records of wind speeds. The long-term period, as definedby various authors [24–29], varies from 10 to 20 years or more. The annual mean windspeed provide basic information about the wind strength and consequently about theavailability of wind power [30]. In order to study the long-term trend of mean wind speed,annual means of the wind speed and wind power density were calculated. An increasing orconstant wind speed trend over the years provides confidence to wind farm developers,financers and designers.
19701972
19741976
19781980
19821984
19861988
19901992
19941996
19982000
20022004
Year
2
3
4
5
6
7
Mea
n W
ind
Sp
eed
(m
/s)
4.2
4.6 4.7
4.0
2.93.2
3.4
3.1
3.53.3
3.53.3
3.5
3.8
4.3
3.84.0
4.3
4.9
4.3
3.0
4.14.3
3.9 4.0
4.2
3.8 3.7 3.83.6
2.5
3.9
4.8
5.2
5.8 5.9
5.1
3.7
4.0
4.2
3.9
4.34.1
4.4
4.1
4.4
4.8
5.4
4.8
5.0
5.3
6.1
5.4
3.8
5.25.4
4.95.0
5.3
4.84.7 4.7
4.5
3.2
5.0
6.0
Annual Mean Wind Speed
At 60 Meters
At 12 Meters
Fig. 1. Variation of annual mean wind speed at 12 and 60m above ground level.
ARTICLE IN PRESSS. Rehman et al. / Renewable and Sustainable Energy Reviews 11 (2007) 937–950 941
As shown in Fig. 1, the annual average wind speed varied between a minimum of 2.5m/sin 2002 and a maximum of 4.9m/s in 1990. The annual mean values of wind speed showeda cyclic change in the wind speed values after almost every 10 years. In 1970s the windspeed was high while in 1980s it became low and then attained higher values in 1990s.Finally, a decreasing trend was observed towards 2000 and then it increased beyond that.The wind speed calculated at 60m above ground level is also depicted in this figure. At60m, the maximum wind speed was observed in 1990 while the minimum was observed in
Jan Feb Mar Apr May Jun Jul Aug Sep Oct Nov DecMonths
2.0
2.5
3.0
3.5
4.0
4.5
5.0
5.5
Mo
nth
ly M
ean
Win
d S
pee
d (
m/s
)
Year
1990
1991
1992
1993
1994
1995
1996
1997
1998
1999
2000
2001
2002
2003
2004
Mean
Fig. 2. Seasonal variation wind speed at 12m above ground level.
Jan Feb Mar Apr May Jun Jul Aug Sep Oct Nov DecMonths
2.0
3.0
4.0
5.0
6.0
7.0 Year
1990
1991
1992
1993
1994
1995
1996
1997
1998
1999
2000
2001
2002
2003
2004
Mean
Fig. 3. Seasonal variation wind speed at 60m above ground level.
ARTICLE IN PRESSS. Rehman et al. / Renewable and Sustainable Energy Reviews 11 (2007) 937–950942
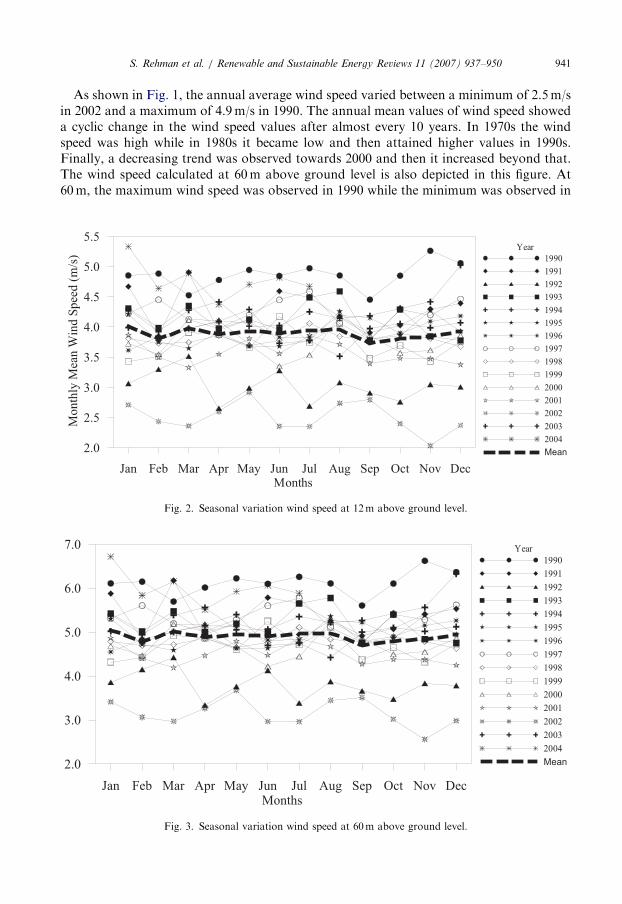
2002. The wind speed at 60m height followed the same trend as that at 12m height. Theseasonal trend of monthly mean values of wind speed at 12 and 60m above ground level isshown in Figs. 2 and 3, respectively.As seen from these figures, highest value of monthly mean wind speeds were observed in
the year 1990 while lowest was in 2002. During rest of the year the monthly mean valuesvaried between the values corresponding to values in 1990 and 2002. The overall meanmonthly values obtained using data collected over entire period does not reflect seasonalchange. The long-term monthly mean values found to be 4.0m/s or less at 12m aboveground level. At 60m, the long-term wind speed values were found to be 5.0m/s or less, asshown in Fig. 3.
3.2. Mean wind power density variation
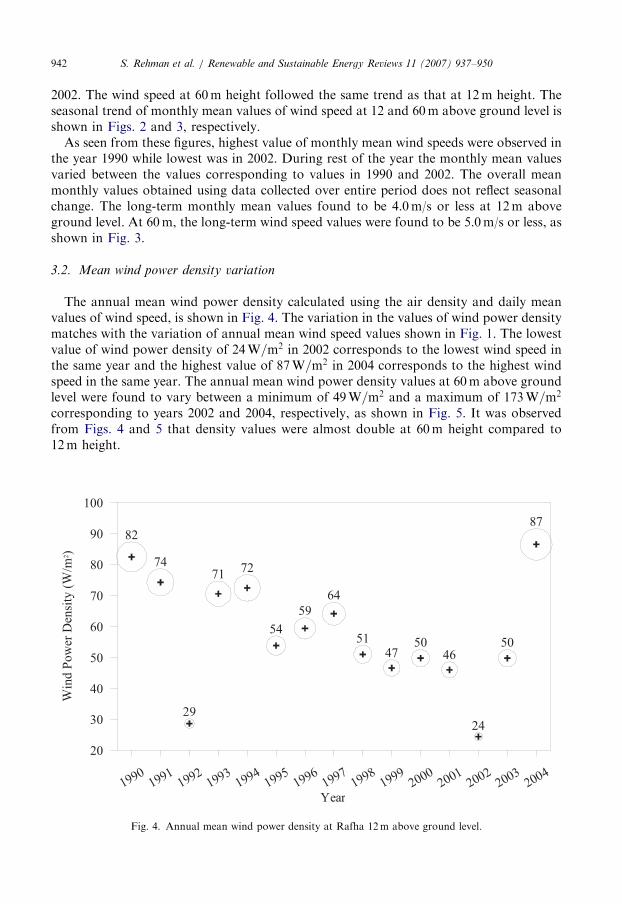
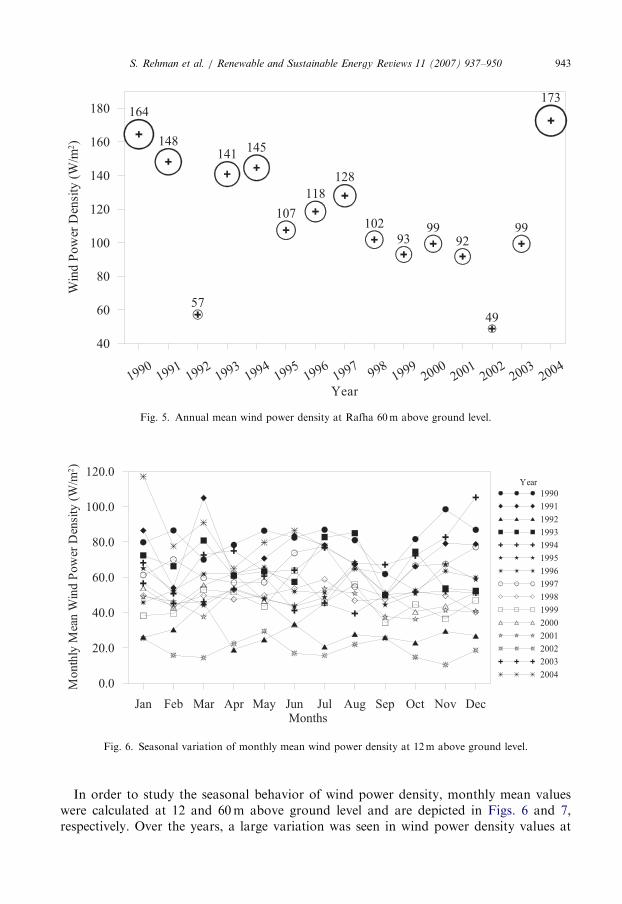
The annual mean wind power density calculated using the air density and daily meanvalues of wind speed, is shown in Fig. 4. The variation in the values of wind power densitymatches with the variation of annual mean wind speed values shown in Fig. 1. The lowestvalue of wind power density of 24W=m2 in 2002 corresponds to the lowest wind speed inthe same year and the highest value of 87W=m2 in 2004 corresponds to the highest windspeed in the same year. The annual mean wind power density values at 60m above groundlevel were found to vary between a minimum of 49W=m2 and a maximum of 173W=m2
corresponding to years 2002 and 2004, respectively, as shown in Fig. 5. It was observedfrom Figs. 4 and 5 that density values were almost double at 60m height compared to12m height.
19901991
19921993
19941995
19961997
19981999
20002001
20022003
2004
Year
20
30
40
50
60
70
80
90
100
Win
d P
ow
er D
ensi
ty (
W/m
2)
82
74
29
7172
54
59
64
5147
5046
24
50
87
Fig. 4. Annual mean wind power density at Rafha 12m above ground level.
ARTICLE IN PRESS
19901991
19921993
19941995
19961997
9981999
20002001
20022003
2004
Year
40
60
80
100
120
140
160
180
Win
d P
ow
erD
ensi
ty(W
/m2)
164
148
57
141145
107
118
128
102
9399
92
49
99
173
Fig. 5. Annual mean wind power density at Rafha 60m above ground level.
Jan Feb Mar Apr May Jun Jul Aug Sep Oct Nov DecMonths
0.0
20.0
40.0
60.0
80.0
100.0
120.0
Mo
nth
ly M
ean W
ind
Po
wer
Den
sity
(W
/m2)
Year
1990
1991
1992
1993
1994
1995
1996
1997
1998
1999
2000
2001
2002
2003
2004
Fig. 6. Seasonal variation of monthly mean wind power density at 12m above ground level.
S. Rehman et al. / Renewable and Sustainable Energy Reviews 11 (2007) 937–950 943
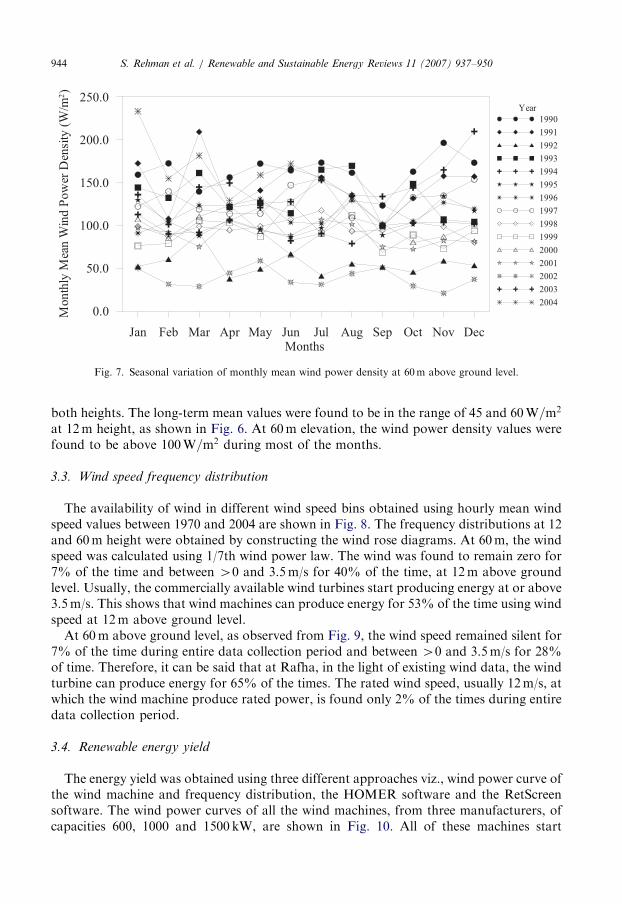
In order to study the seasonal behavior of wind power density, monthly mean valueswere calculated at 12 and 60m above ground level and are depicted in Figs. 6 and 7,respectively. Over the years, a large variation was seen in wind power density values at
ARTICLE IN PRESS
Jan Feb Mar Apr May Jun Jul Aug Sep Oct Nov DecMonths
0.0
50.0
100.0
150.0
200.0
250.0
Mon
thly
Mea
n W
ind
Po
wer
Den
sity
(W
/m2)
Year
1990
1991
1992
1993
1994
1995
1996
1997
1998
1999
2000
2001
2002
2003
2004
Fig. 7. Seasonal variation of monthly mean wind power density at 60m above ground level.
S. Rehman et al. / Renewable and Sustainable Energy Reviews 11 (2007) 937–950944
both heights. The long-term mean values were found to be in the range of 45 and 60W=m2
at 12m height, as shown in Fig. 6. At 60m elevation, the wind power density values werefound to be above 100W=m2 during most of the months.
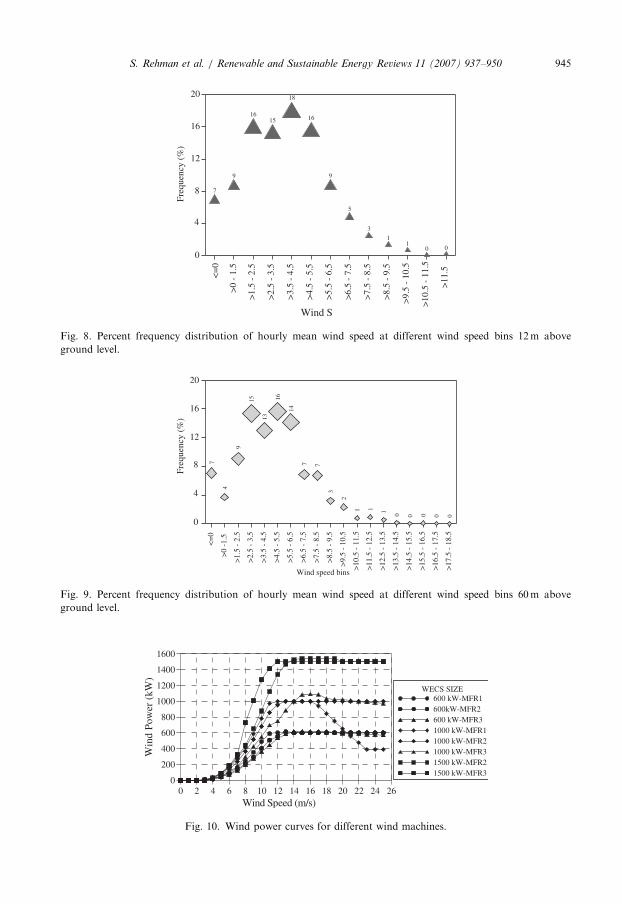
3.3. Wind speed frequency distribution
The availability of wind in different wind speed bins obtained using hourly mean windspeed values between 1970 and 2004 are shown in Fig. 8. The frequency distributions at 12and 60m height were obtained by constructing the wind rose diagrams. At 60m, the windspeed was calculated using 1/7th wind power law. The wind was found to remain zero for7% of the time and between 40 and 3.5m/s for 40% of the time, at 12m above groundlevel. Usually, the commercially available wind turbines start producing energy at or above3.5m/s. This shows that wind machines can produce energy for 53% of the time using windspeed at 12m above ground level.At 60m above ground level, as observed from Fig. 9, the wind speed remained silent for
7% of the time during entire data collection period and between 40 and 3.5m/s for 28%of time. Therefore, it can be said that at Rafha, in the light of existing wind data, the windturbine can produce energy for 65% of the times. The rated wind speed, usually 12m/s, atwhich the wind machine produce rated power, is found only 2% of the times during entiredata collection period.
3.4. Renewable energy yield
The energy yield was obtained using three different approaches viz., wind power curve ofthe wind machine and frequency distribution, the HOMER software and the RetScreensoftware. The wind power curves of all the wind machines, from three manufacturers, ofcapacities 600, 1000 and 1500 kW, are shown in Fig. 10. All of these machines start
ARTICLE IN PRESS
<=
0
>0
- 1.
5
>1.
5 -
2.5
>2.
5 -
3.5
>3.
5 -
4.5
>4.
5 -
5.5
>5.
5 -
6.5
>6.
5 -
7.5
>7.
5 -
8.5
>8.
5 -
9.5
>9.
5 -
10.5
>10
.5 -
11.
5
>11
.5
Wind S
0
4
8
12
16
20
7
9
1615
18
16
9
5
3
11
0 0
Freq
uenc
y (%
)
Fig. 8. Percent frequency distribution of hourly mean wind speed at different wind speed bins 12m above
ground level.
<=
0
>0
-1.5
>1.
5 -
2.5
>2.
5 -
3.5
>3.
5 -
4.5
>4.
5 -
5.5
>5.
5 -
6.5
>6.
5 -
7.5
>7.
5 -
8.5
>8.
5 -
9.5
>9.
5 -
10.5
>10
.5 -
11.
5
>11
.5 -
12.
5
>12
.5 -
13.
5
>13
.5 -
14.
5
>14
.5 -
15.
5
>15
.5 -
16.
5
>16
.5 -
17.
5
>17
.5 -
18.
5
0
4
8
12
16
20
7
4
9
15
13
16
14
7 7
3
2
1 1 1 0 0 0 0 0
Wind speed bins
Freq
uenc
y (%
)
Fig. 9. Percent frequency distribution of hourly mean wind speed at different wind speed bins 60m above
ground level.
0 2 4 6 8 10 12 14 16 18 20 22 24 260
200
400
600
800
1000
1200
1400
1600
WECS SIZE600 kW-MFR1600kW-MFR2600 kW-MFR31000 kW-MFR11000 kW-MFR21000 kW-MFR31500 kW-MFR21500 kW-MFR3
Wind Speed (m/s)
Win
d Po
wer
(kW
)
Fig. 10. Wind power curves for different wind machines.
S. Rehman et al. / Renewable and Sustainable Energy Reviews 11 (2007) 937–950 945
ARTICLE IN PRESS
Table 1
Energy yield and plant capacity factor for wind machines from different manufacturers obtained using wind speed
data at 60m
Wind machine size (kW) Energy yield (MWh/year) Plant capacity factor (%)
MFR1 MFR2 MFR3 MFR1 MFR2 MFR3
600 805 678 642 15.32 12.90 12.22
1000 1332 1180 928 15.20 13.47 10.59
1500 – 1502 1905 – 11.43 14.50
Table 2
Comparison of energy production from 600 kW WECS using different methods for Rafha
WECS type Wind Data 2002 energy output (MWh/year) Wind Data 2003 energy output (MWh/year)
WPC HOMER RetScreen WPC HOMER RetScreen
MFR1 308 304 215 680 681 807
MFR2 247 246 167 559 559 677
MFR3 236 236 162 532 533 638
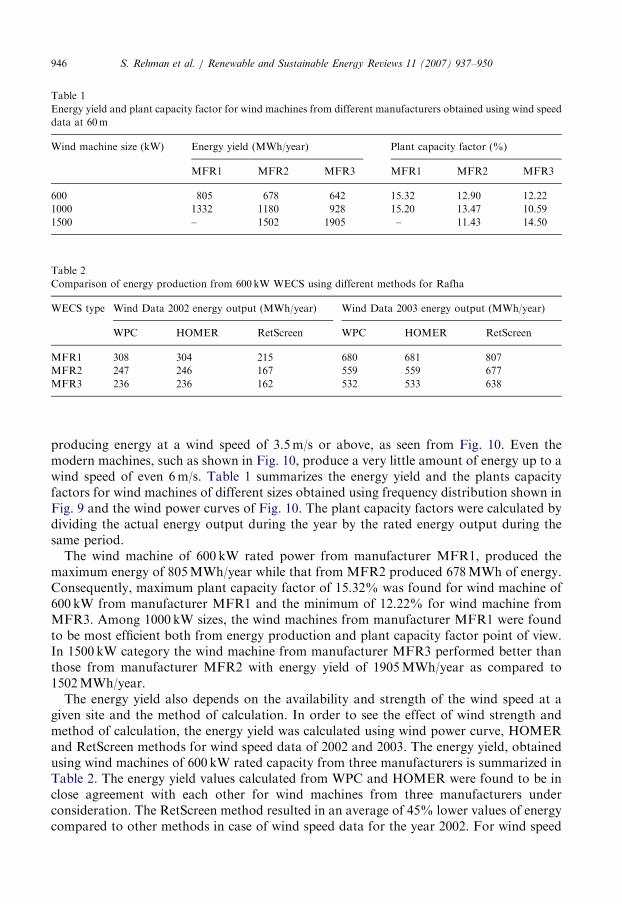
S. Rehman et al. / Renewable and Sustainable Energy Reviews 11 (2007) 937–950946
producing energy at a wind speed of 3.5m/s or above, as seen from Fig. 10. Even themodern machines, such as shown in Fig. 10, produce a very little amount of energy up to awind speed of even 6m/s. Table 1 summarizes the energy yield and the plants capacityfactors for wind machines of different sizes obtained using frequency distribution shown inFig. 9 and the wind power curves of Fig. 10. The plant capacity factors were calculated bydividing the actual energy output during the year by the rated energy output during thesame period.The wind machine of 600 kW rated power from manufacturer MFR1, produced the
maximum energy of 805MWh/year while that from MFR2 produced 678MWh of energy.Consequently, maximum plant capacity factor of 15.32% was found for wind machine of600 kW from manufacturer MFR1 and the minimum of 12.22% for wind machine fromMFR3. Among 1000 kW sizes, the wind machines from manufacturer MFR1 were foundto be most efficient both from energy production and plant capacity factor point of view.In 1500 kW category the wind machine from manufacturer MFR3 performed better thanthose from manufacturer MFR2 with energy yield of 1905MWh/year as compared to1502MWh/year.The energy yield also depends on the availability and strength of the wind speed at a
given site and the method of calculation. In order to see the effect of wind strength andmethod of calculation, the energy yield was calculated using wind power curve, HOMERand RetScreen methods for wind speed data of 2002 and 2003. The energy yield, obtainedusing wind machines of 600 kW rated capacity from three manufacturers is summarized inTable 2. The energy yield values calculated from WPC and HOMER were found to be inclose agreement with each other for wind machines from three manufacturers underconsideration. The RetScreen method resulted in an average of 45% lower values of energycompared to other methods in case of wind speed data for the year 2002. For wind speed
ARTICLE IN PRESSS. Rehman et al. / Renewable and Sustainable Energy Reviews 11 (2007) 937–950 947
data of 2003, the energy yields from WPC and HOMER were more than doubledcompared to those obtained using wind speed data for the year 2002, as given in Table 2. Itis worth mentioning that RetScreen software produced almost four times more energy in2003 compared to that obtained in 2002.
It is further noticed that RetScreen method produced about 20% more energy in 2003compared to WPC and HOMER methods for wind machines from all manufacturers. Thisshows that wind speed frequency distribution plays an important role in energy yield. Theenergy produced from 1000 kW rated power wind machines using WPC and HOMERmethods were found to be comparable with each other while RetScreen values were almost30% less than other two methods in 2002, as summarized in Table 3. In 2003, theRetScreen values were almost 20% higher than those obtained using WPC and HOMERmethods.
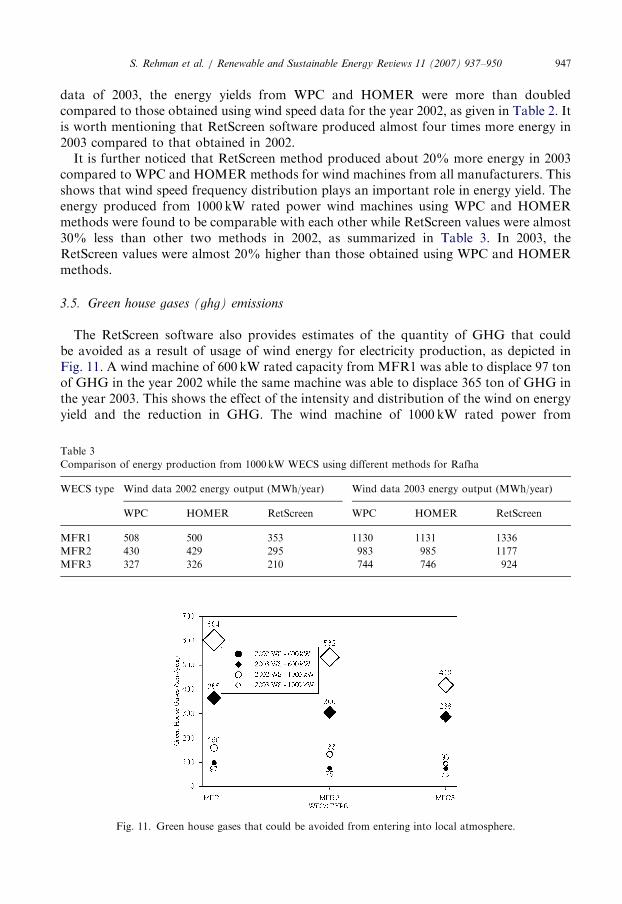
3.5. Green house gases (ghg) emissions
The RetScreen software also provides estimates of the quantity of GHG that couldbe avoided as a result of usage of wind energy for electricity production, as depicted inFig. 11. A wind machine of 600 kW rated capacity from MFR1 was able to displace 97 tonof GHG in the year 2002 while the same machine was able to displace 365 ton of GHG inthe year 2003. This shows the effect of the intensity and distribution of the wind on energyyield and the reduction in GHG. The wind machine of 1000 kW rated power from
Table 3
Comparison of energy production from 1000 kW WECS using different methods for Rafha
WECS type Wind data 2002 energy output (MWh/year) Wind data 2003 energy output (MWh/year)
WPC HOMER RetScreen WPC HOMER RetScreen
MFR1 508 500 353 1130 1131 1336
MFR2 430 429 295 983 985 1177
MFR3 327 326 210 744 746 924
Fig. 11. Green house gases that could be avoided from entering into local atmosphere.
ARTICLE IN PRESSS. Rehman et al. / Renewable and Sustainable Energy Reviews 11 (2007) 937–950948
manufacturer MFR1 was able to avoid 160 and 604 ton of GHG from entering intothe local atmosphere in the years 2002 and 2003, respectively. As seen from this figure, thewind machines from manufacturer MFR1 avoided maximum GHG from entering into theatmosphere compared to wind machines from other two manufacturers.
4. Conclusions
Based on the analysis of long-term wind speed data and annual energy yield, followingobservations were made:The long-term annual mean values of wind speeds were found to vary between a
minimum of 2.5m/s in the year 2002 and a maximum of 4.9m/s in 1990. The long-termmean wind speed over the entire data collection period was found to be 3.8m/s at 12mabove ground level. The wind speed at 60m above ground level, calculated using 1/7 powerlaw, was found to vary between 0 and 25.9m/s and the mean remained at 4.7m/s.The frequency distribution of wind speed at 60m above ground level in different wind
speed bins showed that wind remained silent for 7% of the time on an average duringentire data collection period and 35% between 0 and 3.5m/s. Wind speed remained above3.5m/s for 65% of the time and only 20% of the times above 6.5m/s. Furthermore, thewind hardly reached the rated speed of the wind turbine; hence the rated power of theturbine is hardly achieved. This shows that the power of the wind can be extracted only65% of the time during the year in small amounts because the larger wind power isavailable only at higher wind speeds.The annual wind energy production, obtained using frequency distribution during entire
data collection period (Table 1) and wind power curves of 600 kW wind machines, was 805,678 and 642MWh/year corresponding to MFR1, MFR2 and MFR3, respectively and theplant capacity factors were 15.32, 12.90 and 12.22%. Similarly, the energy production,obtained using wind machines of 1000 kW rated capacity, was 1332, 1180 and 928MWh/year corresponding to manufacturer MFR1, MFR2 and MFR3, respectively. The plantcapacity factors were found to be 15.20, 13.47 and 10.59%. Finally, 1502MWh/year ofelectricity was produced by 1500 kW machine from MFR2 with 11.43% capacity factorand 1905MWh/year by MFR3 with 14.5% capacity factor.As seen from the analysis, the wind machines of rated power 600 and 1000 kW from
MFR1 performed the best compared to the other two, both in terms of wind energyproduction and plant capacity factor. On the other hand, wind machine of 1500 kW ratedpower from MFR3 performed better than the one from MFR2. Theoretically, includingthe losses, a 10% of plant capacity factor can be achieved at Rafha. Better estimates maybe found, if wind measurements can be made at different heights at this location.The annual mean wind speed and frequency distribution plays an important role in
energy production, as seen from energy yields in the years 2002 and 2003. Since, the meanwind speed was higher in 2003 as compared to that in 2002, hence higher energy yields wereobtained.
Acknowledgements
The author wishes to acknowledge the support of The Research Institute of King FahdUniversity of Petroleum and Minerals, Dhahran, Saudi Arabia.
ARTICLE IN PRESSS. Rehman et al. / Renewable and Sustainable Energy Reviews 11 (2007) 937–950 949
References
[1] Tennis M.W., Clemmer S., and Howland J., Assessing Wind Resources: A Guide for Landowners, Project
Developers, and Power Suppliers, Union of Concerned Scientist.
[2] Michael C.B., Patrick H., and Rich S., A GIS Assisted Approach to Wide Area Wind Resource Assessment
and Site Selection for the State of Colorado, Presented at Windpower 1996, The Annual Conference and
Exhibition of the American wind Energy Association, Denever, Colorado, June 23-27, (1996).
[3] Potts J.R., Pierson S.W., Mathisen P.P., Hamel J.R., and Babau V.C., Wind Energy Assessment of Western
and Central Massachusetts, AIAA-2001-0060, 2001.
[4] Brower M., New Maxico Wind Resources: AGIS Approach, New Maxico Energy, Minerals, and Natural
Resources Department, Final Report, September, (1997).
[5] Brower M., Iowa Wind Resource Maps: AGIS Approach, Iowa Wind Energy Institute, Final Report,
February (1997).
[6] Ansari J., Madni I.K., and Bakhsh H, Saudi Arabian Wind Energy Atlas, KACST, Riyadh, Saudi Arabia,
(1986), pp. 1-27.
[7] Rehman S., Prospects of Wind Farm Development in Saudi Arabia, Renewable Energy, Vol. 30(3), (2004),
pp. 447-463.
[8] Rehman S., Wind Energy Resource Assessment for Yanbo, Saudi Arabia, Energy Conversion and
Management, Vol. 45(13-14), (2004), pp. 2019 - 2032.
[9] Rehman S. and Aftab A., Assessment of Wind Energy Potential for Coastal Locations of the Kingdom Saudi
Arabia, Energy - The International Journal, Vol. 29, (2004), pp. 1105 - 1115.
[10] Rehman S., Halawnai T.O., and Mohandes M., Wind Power Cost Assessment at Twenty Locations in the
Kingdom of Saudi Arabia, Renewable Energy, 28, (2003), pp. 573-583.
[11] Mohandes, M., Rehman, S., and Halawani, T.O. A Neural Networks Approach for Wind Speed Prediction,
Renewable Energy, 13(3), (1998), pp. 345-354.
[12] Mohandes M., Halawani T.O., Rehman S., and Husain, Support Vector Machines for Wind Speed
Prediction, Renewable Energy, Vol. 29(6), (2004), pp. 939 - 947.
[13] Rehman, S. and Halawani, T.O. Statistical Characteristics of Wind in Saudi Arabia, Renewable Energy, 4(8),
(1994), pp. 949-956.
[14] Rehman, S., Halawani, T.O., and Husain, T. Weibull Parameters for Wind Speed Distribution in Saudi
Arabia. Solar Energy, 53(6), (1994), pp. 473-479.
[15] El-Amin I, Shaahid S.M., Rehman S., Al-Shehri A., Bakashwain J. and Ahmad F., Performance and
Economic Analysis of Stand-alone Hybrid Wind-diesel Power System for Remote Area Applications of
Saudi Arabia, European Wind Energy Conference (EWEC), 22 - 25 November 2004, U.K.
[16] Rehman S, Ahmad F, El-Amin I, Bader MA, Ahmad A, Rahman MK, Mohandes M. Feasibility of Wind
Farm Development in Saudi Arabia. The 8th Arab International Solar Energy Conference & The Regional
World Renewable Energy Congress, Kingdom of Bahrain 2004;8-10:2004.
[17] Rehman S., (2004), Wind Energy Availability and Capacity Factor Analysis, Proceedings of the 2nd
BSMEASME International Conference on Thermal Engineering, BUET, Dhaka, Bangladesh, January 02 to
04, 2004, Vol. 2, pp. 900 - 905.
[18] Rehman S. and Ahmad A., (2004), Assessment of Wind Energy and Capacity Factor Calculations for Two
Locations of Saudi Arabia, Proceedings of the 2nd BSME-ASME International Conference on Thermal
Engineering, BUET, Dhaka, Bangladesh, January 02 to 04, 2004, Vol. 2, pp. 906 - 911.
[19] Rehman S., El-Amin I, AL-Shehri A., Bakhashwain J., Ahmad F., Shaahid S.M., Utilization of Wind-Diesel
Systems to Provide Power Requirements of Remote Settlements in Saudi Arabia, Fourth International
Workshop on Large-Scale Integration of Wind Power and Transmission Networks for Offshore Wind
Farms, Royal Institute of Technology, Electric Power Systems, 20-21 October 2003, Denmark.
[20] Siddiqui, A.H., Khan, S., and Rehman S., (2001), Wavelet based computer simulation for wind speed in
Saudi Arabia, Proceedings of the First Saudi Science Conference, King Fahd University of Petroleum and
Minerals, Dhahran, Saudi Arabia, Vol. (3), pp. 313-326, 9-11 April 2001.
[21] Rehman S., (2000), Renewable Energy Education - Its Need and Global Status. Proceedings of The
Workshop on Energy Conservation, pp. 389-392, King Fahd University of Petroleum and Minerals,
Dhaharn, Saudi Arabia.
[22] HOMER, National Renewable Energy Laboratory, www.nrel.gov/homer.
[23] RetScreen International, Software Manual, Chapter 2 -Wind Energy Project Analysis, www.retscreen.net.

ARTICLE IN PRESSS. Rehman et al. / Renewable and Sustainable Energy Reviews 11 (2007) 937–950950
[24] Carlin J. and Diesendorf M., Analysis of Some Wind Data from Southern Australia With Reference to
Potential Wind Energy Conversion. Wind Engineering, Vol. 7, No. 3, pp. 147-160, (1983).
[25] Palutikof J.P., Kelly P.M., and Davis T.D., Wind Speed Variations and Climate Change. Wind Engineering,
Vol. 10, No. 4, pp. 182-189, (1986).
[26] Putnam P.Z., Power from the Wind. Van Norstrand Reinhold, New York, (1948).
[27] Conard V. and Pollak L.K., Methods in Climatology. Harvard University Press, Cambridge, Mass, (1962).
[28] Justus C.G., Mane K., and Mikhail A.S., Interannual and Month-to-Month Variations of Wind Speed.
J. Appl. Meteor, Vol. 18, pp. 913-920, (1979).
[29] Pasharde S. and Christofides C., Statistical Analysis of Wind Speed and Direction in Cyprus, Solar Energy,
Vol. 55, No. 5, pp. 405-414, (1995).
[30] Baker R.W., Walker S.N., and Wade J.E., Annual and Seasonal Variations in Mean Wind Speed and Wind
Turbine Energy Production, Solar Energy, Vol. 45, No. 5, pp. 285-289, (1990).
Copyright © 2022 FDOKUMEN