Wind power insertion through energy auctions in Brazil
8
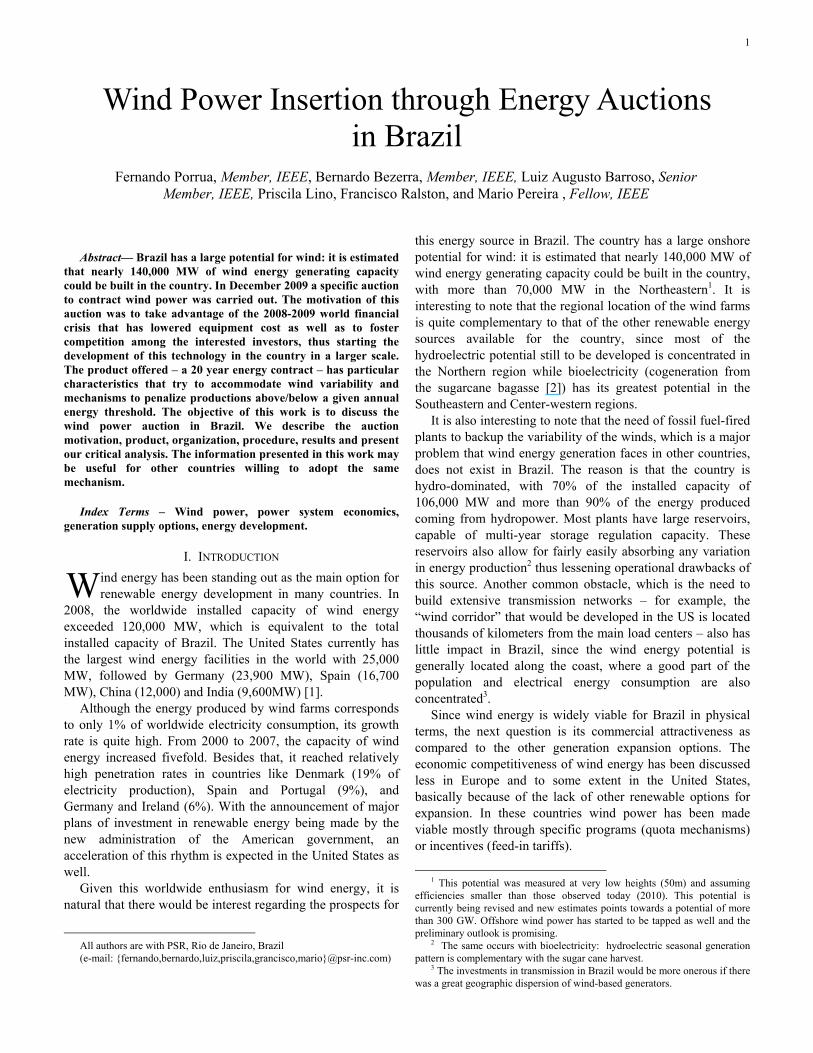
1 Abstract— Brazil has a large potential for wind: it is estimated that nearly 140,000 MW of wind energy generating capacity could be built in the country. In December 2009 a specific auction to contract wind power was carried out. The motivation of this auction was to take advantage of the 2008-2009 world financial crisis that has lowered equipment cost as well as to foster competition among the interested investors, thus starting the development of this technology in the country in a larger scale. The product offered – a 20 year energy contract – has particular characteristics that try to accommodate wind variability and mechanisms to penalize productions above/below a given annual energy threshold. The objective of this work is to discuss the wind power auction in Brazil. We describe the auction motivation, product, organization, procedure, results and present our critical analysis. The information presented in this work may be useful for other countries willing to adopt the same mechanism. Index Terms – Wind power, power system economics, generation supply options, energy development. I. INTRODUCTION ind energy has been standing out as the main option for renewable energy development in many countries. In 2008, the worldwide installed capacity of wind energy exceeded 120,000 MW, which is equivalent to the total installed capacity of Brazil. The United States currently has the largest wind energy facilities in the world with 25,000 MW, followed by Germany (23,900 MW), Spain (16,700 MW), China (12,000) and India (9,600MW) [1]. Although the energy produced by wind farms corresponds to only 1% of worldwide electricity consumption, its growth rate is quite high. From 2000 to 2007, the capacity of wind energy increased fivefold. Besides that, it reached relatively high penetration rates in countries like Denmark (19% of electricity production), Spain and Portugal (9%), and Germany and Ireland (6%). With the announcement of major plans of investment in renewable energy being made by the new administration of the American government, an acceleration of this rhythm is expected in the United States as well. Given this worldwide enthusiasm for wind energy, it is natural that there would be interest regarding the prospects for All authors are with PSR, Rio de Janeiro, Brazil (e-mail: {fernando,bernardo,luiz,priscila,grancisco,mario}@psr-inc.com) this energy source in Brazil. The country has a large onshore potential for wind: it is estimated that nearly 140,000 MW of wind energy generating capacity could be built in the country, with more than 70,000 MW in the Northeastern 1 . It is interesting to note that the regional location of the wind farms is quite complementary to that of the other renewable energy sources available for the country, since most of the hydroelectric potential still to be developed is concentrated in the Northern region while bioelectricity (cogeneration from the sugarcane bagasse [2]) has its greatest potential in the Southeastern and Center-western regions. It is also interesting to note that the need of fossil fuel-fired plants to backup the variability of the winds, which is a major problem that wind energy generation faces in other countries, does not exist in Brazil. The reason is that the country is hydro-dominated, with 70% of the installed capacity of 106,000 MW and more than 90% of the energy produced coming from hydropower. Most plants have large reservoirs, capable of multi-year storage regulation capacity. These reservoirs also allow for fairly easily absorbing any variation in energy production 2 thus lessening operational drawbacks of this source. Another common obstacle, which is the need to build extensive transmission networks – for example, the “wind corridor” that would be developed in the US is located thousands of kilometers from the main load centers – also has little impact in Brazil, since the wind energy potential is generally located along the coast, where a good part of the population and electrical energy consumption are also concentrated 3 . Since wind energy is widely viable for Brazil in physical terms, the next question is its commercial attractiveness as compared to the other generation expansion options. The economic competitiveness of wind energy has been discussed less in Europe and to some extent in the United States, basically because of the lack of other renewable options for expansion. In these countries wind power has been made viable mostly through specific programs (quota mechanisms) or incentives (feed-in tariffs). 1 This potential was measured at very low heights (50m) and assuming efficiencies smaller than those observed today (2010). This potential is currently being revised and new estimates points towards a potential of more than 300 GW. Offshore wind power has started to be tapped as well and the preliminary outlook is promising. 2 The same occurs with bioelectricity: hydroelectric seasonal generation pattern is complementary with the sugar cane harvest. 3 The investments in transmission in Brazil would be more onerous if there was a great geographic dispersion of wind-based generators. Wind Power Insertion through Energy Auctions in Brazil Fernando Porrua, Member, IEEE, Bernardo Bezerra, Member, IEEE, Luiz Augusto Barroso, Senior Member, IEEE, Priscila Lino, Francisco Ralston, and Mario Pereira , Fellow, IEEE W
Transcript of Wind power insertion through energy auctions in Brazil
1
Abstract— Brazil has a large potential for wind: it is estimated
that nearly 140,000 MW of wind energy generating capacity could be built in the country. In December 2009 a specific auction to contract wind power was carried out. The motivation of this auction was to take advantage of the 2008-2009 world financial crisis that has lowered equipment cost as well as to foster competition among the interested investors, thus starting the development of this technology in the country in a larger scale. The product offered – a 20 year energy contract – has particular characteristics that try to accommodate wind variability and mechanisms to penalize productions above/below a given annual energy threshold. The objective of this work is to discuss the wind power auction in Brazil. We describe the auction motivation, product, organization, procedure, results and present our critical analysis. The information presented in this work may be useful for other countries willing to adopt the same mechanism.
Index Terms – Wind power, power system economics, generation supply options, energy development.
I. INTRODUCTION ind energy has been standing out as the main option for renewable energy development in many countries. In
2008, the worldwide installed capacity of wind energy exceeded 120,000 MW, which is equivalent to the total installed capacity of Brazil. The United States currently has the largest wind energy facilities in the world with 25,000 MW, followed by Germany (23,900 MW), Spain (16,700 MW), China (12,000) and India (9,600MW) [1].
Although the energy produced by wind farms corresponds to only 1% of worldwide electricity consumption, its growth rate is quite high. From 2000 to 2007, the capacity of wind energy increased fivefold. Besides that, it reached relatively high penetration rates in countries like Denmark (19% of electricity production), Spain and Portugal (9%), and Germany and Ireland (6%). With the announcement of major plans of investment in renewable energy being made by the new administration of the American government, an acceleration of this rhythm is expected in the United States as well.
Given this worldwide enthusiasm for wind energy, it is natural that there would be interest regarding the prospects for
All authors are with PSR, Rio de Janeiro, Brazil (e-mail: {fernando,bernardo,luiz,priscila,grancisco,mario}@psr-inc.com)
this energy source in Brazil. The country has a large onshore potential for wind: it is estimated that nearly 140,000 MW of wind energy generating capacity could be built in the country, with more than 70,000 MW in the Northeastern1. It is interesting to note that the regional location of the wind farms is quite complementary to that of the other renewable energy sources available for the country, since most of the hydroelectric potential still to be developed is concentrated in the Northern region while bioelectricity (cogeneration from the sugarcane bagasse [2]) has its greatest potential in the Southeastern and Center-western regions.
It is also interesting to note that the need of fossil fuel-fired plants to backup the variability of the winds, which is a major problem that wind energy generation faces in other countries, does not exist in Brazil. The reason is that the country is hydro-dominated, with 70% of the installed capacity of 106,000 MW and more than 90% of the energy produced coming from hydropower. Most plants have large reservoirs, capable of multi-year storage regulation capacity. These reservoirs also allow for fairly easily absorbing any variation in energy production2 thus lessening operational drawbacks of this source. Another common obstacle, which is the need to build extensive transmission networks – for example, the “wind corridor” that would be developed in the US is located thousands of kilometers from the main load centers – also has little impact in Brazil, since the wind energy potential is generally located along the coast, where a good part of the population and electrical energy consumption are also concentrated3.
Since wind energy is widely viable for Brazil in physical terms, the next question is its commercial attractiveness as compared to the other generation expansion options. The economic competitiveness of wind energy has been discussed less in Europe and to some extent in the United States, basically because of the lack of other renewable options for expansion. In these countries wind power has been made viable mostly through specific programs (quota mechanisms) or incentives (feed-in tariffs).
1 This potential was measured at very low heights (50m) and assuming
efficiencies smaller than those observed today (2010). This potential is currently being revised and new estimates points towards a potential of more than 300 GW. Offshore wind power has started to be tapped as well and the preliminary outlook is promising.
2 The same occurs with bioelectricity: hydroelectric seasonal generation pattern is complementary with the sugar cane harvest.
3 The investments in transmission in Brazil would be more onerous if there was a great geographic dispersion of wind-based generators.
Wind Power Insertion through Energy Auctions in Brazil
Fernando Porrua, Member, IEEE, Bernardo Bezerra, Member, IEEE, Luiz Augusto Barroso, Senior Member, IEEE, Priscila Lino, Francisco Ralston, and Mario Pereira , Fellow, IEEE
W
2
In the case of Brazil, where the range of options for expansion based on renewable energy is wider [3] and energy prices significantly affect economic development, the subject of “price” is an important component of any energy policy. The Brazilian power system relies on an auction-based mechanism to foster supply expansion for the regulated market. The country carries out yearly auctions of long-term contracts for new generation for future delivery to supply distribution companies’ needs [4]. The future delivery allows investors to build the projects and the long-term contract creates conditions for project financing. Free consumers can negotiate their own supply contracts.
The development of wind projects based on direct contractual agreements with free consumers or based on the regular auctions of energy contracts called by distributors is commercially risky. The reason is twofold: (i) the wind energy price is above the price cap of the contract auctions to supply the captive market and (ii) the uncertainty in wind production, which can result in significant quantity-price risks in the spot market. Wind power insertion in Brazil has then occurred accordingly to incentive programs. The first one, a quota-based mechanism named “Proinfa”, is a classic subsidy program. It was implemented in 2002 but has been criticized on the grounds of its economic rationale. Other incentives for renewable were later introduced in the free market (discounts on transmission tariffs) but the market risks faced by wind producers have prevented the development of this technology even with those incentives.
In 2009, nevertheless, a new mechanism was tried: energy auctions. The Brazilian regulation allows the use of auctions as a backstop mechanism to the development of specific technologies driven by energy policy decisions. Specific auctions to foster the development of non-competitive technologies or to increase the competition among investors of specific projects or technologies are allowed by the regulation. In December 2009 a specific auction to contract wind power was carried out. The motivation of this auction was to take advantage of the 2008-2009 world financial crisis that has lowered equipment cost as well as to foster competition among the interested investors, thus starting the development of this technology in the country in a larger scale. The product offered – a 20 year energy contract for delivery in 2012 – has very specific characteristics to manage the quantity-price risk and mechanisms to incentivize and penalize production above/below a given energy threshold. The Brazilian approach, in essence, auctioned a feed-in tariff with an associated energy production per year offering remuneration according to production, with some revenue stabilization. The auction contracted some 1,800 MW of capacity with an average discount of 21% with respect to the initial auction price.
The objective of this work is to discuss the wind power auction in Brazil. It serves as basis for discussions in the panel session “Global impact of renewable energy: networks, prices, environment and the use of system resources”, held at the 2010 IEEE PES General Meeting, July 25-29 2010,
Minneapolis, USA. We describe the auction motivation, product, organization, procedure, results and present our critical analysis. The information presented in this work may eventually be useful for other countries willing to adopt the same mechanism.
This work is organized as follows: Section II discusses the mechanisms for the development of renewable in Brazil, with focus on wind power. Section III discusses the wind power auction and Section IV analyzes its results. Section V concludes and discusses perspectives for this technology in face of the auction results.
II. MECHANISMS FOR THE DEVELOPMENT OF RENEWABLES IN BRAZIL
Hydropower is currently still the cheaper expansion option and large hydros will drive system’s expansion for next years [3]. The “new renewable” candidates to complement the mainstream hydros in the supply expansion are small hydroelectric plants (hydro plants with installed capacity up to 30 MW or reservoir area smaller than 3 km2), wind power plants and biomass-burning plants, especially cogeneration plants using sugar cane bagasse (bioelectricity). Renewable in Brazil have several additional advantages when compared to the standard energy production sources, such as:
• Smaller-sized projects, which diversifies (“portfolio” effects) the risk of construction delays usually observed in large hydro projects;
• Wider range of investors (including local, foreign and hedge funds), which foster competition for contracts (as opposed to large hydros or fossil-fuel plants, where the number of investors is reduced);
• Local resources, such as work power and equipment; • Short construction time, which results in a good
attribute for load growth uncertainty. This is an advantage over hydro and coal power plants, which construction period takes 5-7 years;
• Easier environmental licensing, as opposed to fossil fuel plants and large hydros located in the environmentally sensitive Amazon region;
• Carbon credits: renewable generation qualifies for Certified Emission Reductions (CER) credits under the Clean Development Mechanism of the Kyoto protocol and, thus, provides further incentive for investors in these projects versus most coal, diesel, or gas plants.
As discussed in [3], renewable have several opportunities to trade their energy. This is reviewed next focusing on wind.
A. Regular energy auctions Because sales directly on spot market are too risky (price
volatility makes very difficult to arrange project financing), the first marketing alternative for these projects are the regular energy auctions called by the distribution companies (Distcos) [4]. These auctions offer 15 year contracts for delivery 3 and 5 years ahead. There are two main challenges for the renewable in these auctions (mainly for wind): (i) direct competition against all technologies (hydro and fossil fuel plants), which
3
might displace the renewable in the competition for contracts4 and (ii) the need to ensure a firm energy certificate (a “capacity credit”). The firm energy certificate (FEC) for non-dispatchable generation is defined as the maximum amount of energy that this source can commit to produce over a year. These values are declared by the agent and form a commitment. The regulation recognizes that historical records of wind measurement (speed, air pressure and temperature) with the needed precision are still small and rarely larger than 3 years. This absence of data impedes stochastic forecasting of wind scenarios using the same probabilistic techniques applied to future streamflow scenarios for hydro plants. Therefore, the FEC of a wind power plant is calculated by the maximum continuous energy delivery capability as follows:
8760
12
1∑
== mmE
FEC
where: Em: is the firm commitment of energy delivery (measured in MWh) declared by the agent for each month “m”. It should be smaller or equal than the estimated values of energy production measured in the anemometric tests.
The challenge for the investor is the fact that the actual energy production will be measured and compared to the FEC. In addition to the market settlement risk, the investor is subject to regulatory penalties if the verified energy production is lower than the declared values. Hence, this is a severe risk that cannot be easily mitigated (portfolio bidding is not allowed in the energy auctions, each project bids separately) and has prevented the participation of wind power.
B. Incentive program for renewable energy: Proinfa Proinfa – stands for “Incentive program for alternative
energy” – is an incentive program for renewable created by Law nº 10.438 in 2002 in order to increase the renewable energy participation (small hydro plants, wind power and biomass) in Brazil. Proinfa intended to promote the installation of 3,300 MW of renewable (divided equally among the three sources) until December 2008 through a long term PPA (20 years) between the renewable energy producer and Eletrobrás, the state-owned utility in Brazil. The cost of these contracts is collected from all energy consumers through a specific charge.
Proinfa is a “classical” subsidy program and offers each technology a specific economic value (a type of feed-in tariff, in $/MWh) that it will receive for the contract period (indexed to inflation). The economic value of wind farms is a function of the reference load factor of each project and the average value for 2010 is 143 US$/MWh5. In the Proinfa program the annual revenue of a wind producer is calculated based on a reference energy amount contracted by Eletrobrás (MWh) and the price the project is entitled to. Positives and negatives deviations with respect to the reference value can be offset in
4 As will be discussed in section IV.C, until the wind power auction, the
expected wind energy price was above the price cap of the regular auctions called by the Distcos.
5 Exchange rate (February 2010): 1 USD = 1,8 BRL (R$)
a yearly basis with some penalties if the project under produces successively.
Although the construction of all 900 MW of the country’s current (2009) wind power installed capacity has occurred through this program, Proinfa has been very much criticized on the grounds of its economic rationale. The first critic is the segregation of the 3,300 MW in equal shares of 1,100 MW for each source. If the three sources have different prices, this segregation questions its economic rationale. The criterion to select the projects was also somewhat weird: projects were selected to fulfill its respective technology’s quota according to the issuance date of the project’s environmental permit. The older the permit, the better the project was in the merit order for contracting. This ended up creating a “black market” for environmental licenses. Proinfa also required that 60% of the project’s equipment had to be locally produced. This turned out to be a deadlock because by that time Brazil had just one local wind manufacturer (Vestas6). Finally, Proinfa lacks economic signals for efficiency and technological improvement.
C. Discount on transmission tariffs for free market sales Renewable (small hydros, wind power and biomass) that
inject up to 30 MW into the transmission and distribution networks were also granted incentives to contract with regulated consumers that are not eligible to move to the free market7. This type of contracting establishes that regulated consumers demanding over 500 kW (e.g., a supermarket) will receive a 50% rebate from their “wire tariff”, if they contract their energy from alternative sources. Since it is a substantial deduction, these regulated consumers may offer attractive energy prices to alternative energy in general, above the “ceiling” of the regular contract auctions, that its total tariff (energy + wire) will still be worthy.
The challenge of this market for wind power is the quantity-price risk due to the wind production intermittency. For this reason, this option has not turned out to be attractive for wind power yet. This is the opposite situation of the small hydros and bioelectricity plants, which have been able to explore this market and make it the best road to develop these technologies. Both plants suffer from the highly seasonal availability of their resources, which forces producers to discount (or price) the risks faced when selling energy contracts and may ultimately lead to projects being commercially unattractive. However, the seasonal production pattern of small hydros is complementary to that of bioelectricity (the sugarcane harvest occurs in the dry season), which enables them to sell an energy contract which “blends” these two types of energy sources. In order to explore this synergy, a portfolio based on these two renewable sources that should be able to mitigate hydrological and fuel unavailability risks and provide a safe and competitive firm energy delivery over a given time horizon can be developed (see [5]).
6 IMPSA installed a factory in Brazil after Proinfa had been launched. 7 Free consumers in Brazil are those with peak demand higher than 3 MW
and connected to a voltage level higher than 69 kV.
4
D. Specific energy auctions The Brazilian regulation allows the use of auctions as a
backstop mechanism to the development of specific technologies driven by energy policy decisions. Specific auctions to foster the development of specific non-competitive technologies or to increase competition among investors of specific projects or technologies are allowed by the regulation. The cost of the energy bought in these auctions is shared by all consumers (regulated and free). These auctions are called reserve auctions. This mechanism was used by the government for the first time in 2008, to contract new energy from the cogeneration of sugarcane bagasse (“bioelectricity”). In December 2009 a reserve auction to contract wind power was carried out, as discussed next.
III. THE WIND POWER AUCTION
A. Motivation The motivation to carry out an auction to contract wind
power was twofold: to take advantage of the 2008-2009 world financial crisis that has lowered equipment cost and to foster competition among the interested investors, thus starting the development of this technology in the country in a larger scale.
B. Main requisites for participation In order to have its project registered for the auction, the
investor must fulfill the following main requirements: • Environmental impact studies – Greenfield projects need
to have the initial environmental permit (two others will be needed until the project’s implementation) and existing projects need to have a permit compatible with the project’s development stage (Initial License, Installation License and Operational License);
• Transmission or distribution network access – the investor must present a grid access approval issued by the system operator (in case of connection to the Basic Grid) or by the distribution company (in case of connection to voltage levels below 138 kV). This subject may bring some uncertainties concerning the economic evaluation of the project, since the connection point might not be fully known beforehand. This question will be further analyzed in a later section;
• Anemometric measurements and energy production estimates – the certification of anemometric data and the forecasted annual energy production must be issued by an independent company presented by the investor. The historical record of anemometric measurement must be at least one year long. The project’s site is defined as the circular area with a radius of 8km surrounding the towers of anemometric measurement. The annual energy production estimate provides a typical production profile on a monthly basis. This is directly related to the wind measurements and the technical characteristics of the plant. It is also provided by an independent certifier.
C. The product The product is the core of the auction and was designed to
conciliate the requirements of investors and financers of a long-term stable revenue stream (to allow project financing) but at the same time ensuring a secure supply. The need of a stable revenue stream impeded the adoption of a classic “feed-in tariff” scheme8, since the project’s revenue stream would be very volatile (dependent on the production profile) and would difficult project financing. The difficulty to manage the price-quantity risk without portfolio bidding also created barriers to adopt a standard financial forward contract backed by a FEC of the wind power9. The solution adopted was to create a product that offered such revenue stability with reduced market risks through a risk-sharing scheme among the investors and the consumers.
The product offered was a 20 year energy contract for delivery in two years’ time (2012). The contract establishes a fixed payment for a reference annual production (the price in $/MWh and the quantity in MWh/year are offered in the auction, as discussed next), which fits the bank’s needs. The contract also does not require monthly clearings of energy with respect to contracted amounts, which relieves the investor from the market risk. Instead, payment is fixed and a scheme to remunerate (penalize) yearly productions deviations above (below) the reference production value associated to an accounting scheme to help mitigation of the penalties is applied. In addition, every four years the contract reference energy for the following years is adjusted to the average of the historical production record. Finally, the reference annual production follow the concept of the FEC described in Section II.A: is the firm commitment of energy delivery declared by the agent for each month “m”. However, for the purposes of the wind power auction, the regulatory penalties related to a delivery smaller than the FEC were relieved. The deviations between the “promised” energy and the actual delivery are handled by the accounting scheme introduced earlier.
This is discussed next in more detail.
D. Incentives and penalties of the contract In order to manage production deviations, two complex set
of rules were created: the first set concerns annual deviations between actual production and contracted amount (it is the plant’s FEC as described in II.A) and is applied every year during the contract’s term. The second set of rules is applied every four years during the contract’s term. Its objective is to review the contracted amount according to the observed historical production. The producer is also allowed to accumulate and carry over productions within some limits to make up for under production risk in future years.
The key rules to verify yearly imbalances are: (i) If the annual energy production is below 90% of the
8 The feed-in tariff could be auctioned. 9 By price-quantity risks we mean purchases in the spot market whenever
production is below contracts. If the project under produces successively (on a yearly basis) with respect to its FEC, it also has additional regulatory penalties because its FEC is reduced (FEC for wind projects is a declaration by the agent of its yearly production).
5
energy contracted, the shortfall is penalized in 115% of the contract price and the remaining deficit of 10% is accumulated for the next year’s accounting.
(ii) If the annual energy production is above 130% of the energy contracted, the extra production receives a feed-in tariff equal to 70% of the contract price and the surplus of 30% is accumulated for the next year’s accounting.
(iii) Any deviation of the energy production which lies between 90% and 130% of the energy contracted (negative or positive) is accumulated for four years and can be used in the accounting process of any year.
Due to the accumulation of annual deviations defined in rule (iii), it is possible to have a project subjected to rule (i) or (ii) for a given year, even though it produces exactly the contracted amount in this year.
The key rules to verify four-year imbalances are: (iv) Any remaining production shortfall below 90% of the
energy contracted in the end of year 4 must be cleared according to rule (i). The remaining deficit of 10% must be either cleared at the contract price or bought from another project with surplus;
(v) Any remaining production surplus above 130% of the energy contracted in the end of year 4 must be cleared according to rule (ii). The remaining surplus of 30% must be cleared at the contract price (there is no 30% discount in this case), sold to compensate other producers’ shortfall – see rule (iv) above – or carried over the next year as energy credit10;
(vi) The energy contracted for the following four years is adjusted to the average of the historical production record and the fixed payment is adjusted accordingly.
In summary, the producer takes no market and production risk on a monthly basis because the accounting and clearing of the contract is done on a yearly basis with an incentive/penalization scheme.
E. Buyers and sellers All consumers (regulated and free) pay for this energy as a
system charge. As opposed to the regular auctions for the captive market, where Distcos declare their energy needs, in the wind auction the government defines the demand. Sellers can be any company that complies with the registration requirements, including those discussed in II.B.
F. The auction mechanism The auction mechanism follows a hybrid design, with a
dynamic descending price clock auction phase and a final pay as bid round. The auction works as follows:
(i) the auctioneer starts an auction round with an initial price IP ($/MWh);
(ii) each investor then either accepts the incumbent price and offers the project’s reference annual production, which is a value limited to the project’s FEC, or leaves
10 Both procedures of buying – rule (iv) – or selling – rule (v) – the energy
for accounting purposes are subject of a bilateral negotiation.
the auction11; (iii) if the total energy offered (sum of the energy offers of
the plants still in the auction) exceeds the total demand (this value is only known to the auctioneer), the incumbent price IP is reduced, a new round is started but with the amount of energy already defined and return to step (ii); otherwise, the auction is stopped and Phase 1 is finished;
(iv) there is a final round of offers where each investor still in the auction offers a final price for the quantities assigned in Phase 1 limited to the closing price of this phase. Offers are ranked in a merit order and contracted projects are paid according to their offers, in a discriminatory auction12.
Contract lots of 1 average MW (8,760 MWh/year) were offered. In order to avoid market power, the auction demand was not public before and during the auction. The opening price was 189 R$/MWh13 and publicly announced beforehand.
G. Transmission connection As in many other countries, transmission connection for
Wind Power in Brazil was an issue. Three possibilities were offered to each investor:
a. Connect to the closest distribution network: This is subject to the capability of the Distco to absorb the connection. It is also done on a first-come, first-serve basis and the resulting connection tariff is known only after the auction results (it will depend on the Distco’s investments to allow all approved connections) and can vary on an yearly basis according to new distribution network reinforcements;
b. Connect to the closest high-voltage (HV) network substation: this is subjected to the capability of the substation to absorb the connection. The difference with respect to (a) is the fact that the HV grid is centrally planned and transmission charges are known before the auction: the government company for planning studies estimate a reference transmission tariff in each available (HV) substation for each candidate project. These tariffs are fixed for 10 years and the consumer absorbs the difference between the estimated and the actual tariffs [6]. This scheme allows the investor to bid in the auction already knowing its transmission costs;
c. Connect to a shared high-voltage collector substation: distances from a candidate project to the closest HV substation as defined in (b) can be quite large, as well as its resulting connection cost14. Therefore, the government released some shared HV collector substations based on the clustering of candidate wind
11 The bidder did not have the option to reduce his offer during the
auction. Besides that, if the energy offered is smaller than the project’s reference energy, the investor is not allowed to sell this difference.
12 This process works because in Phase 1 the auction’s demand is slightly higher than the real demand, which is released in Phase 2. The auction is carried out through an electronic system using internet as transference protocol.
13 About 105 USD/MWh 14 This was observed for the majority of the candidate projects, which were
located at least 30 km from the closest existing HV substation.
6
projects according to their geographic dispersion. These shared facilities can be planned and accommodate wind projects’ clusters, connecting them jointly to the main HV grid. Connection costs for each candidate are then separated into two components: (i) an estimate of the reference transmission tariff in the point of connection to the main HV grid – similar to (b); and (ii) costs of the shared HV collector substations. Part (i) of the cost is known by the investor beforehand, as explained in (b). However, since it is impossible to know in advance the auction winners on each cluster, part (ii) of the cost is uncertain and must be priced by the investor on his bid. For more details please refer to [7,8].
Hence, the selection of the connection alternative involved the comparison among these three options and turned out to be another risk component that had to be priced in the auction.
H. Guarantees The auction process required the deposit of a bid bond equal to 1% of each candidate project’s estimated investment cost, which is declared by the investor beforehand and approved by the regulator. If an investor wins the auction this guarantee is returned after the contract is signed, otherwise it is returned within five days after the auction. Auction winners then have to deposit a guarantee for project’s completion, which equals 5% of the estimated investment cost and is released back to the investor after some project’s construction landmarks are met.
IV. WIND AUCTION RESULTS AND ANALYSIS The wind auction was carried out in December 14, 2009.
This section discusses its implementation and results. Some 1,800 MW of capacity was bought with an average discount of 21% with respect to the initial auction price. The auction results were a surprise, with prices lower than estimated by most if not all sector analysts.
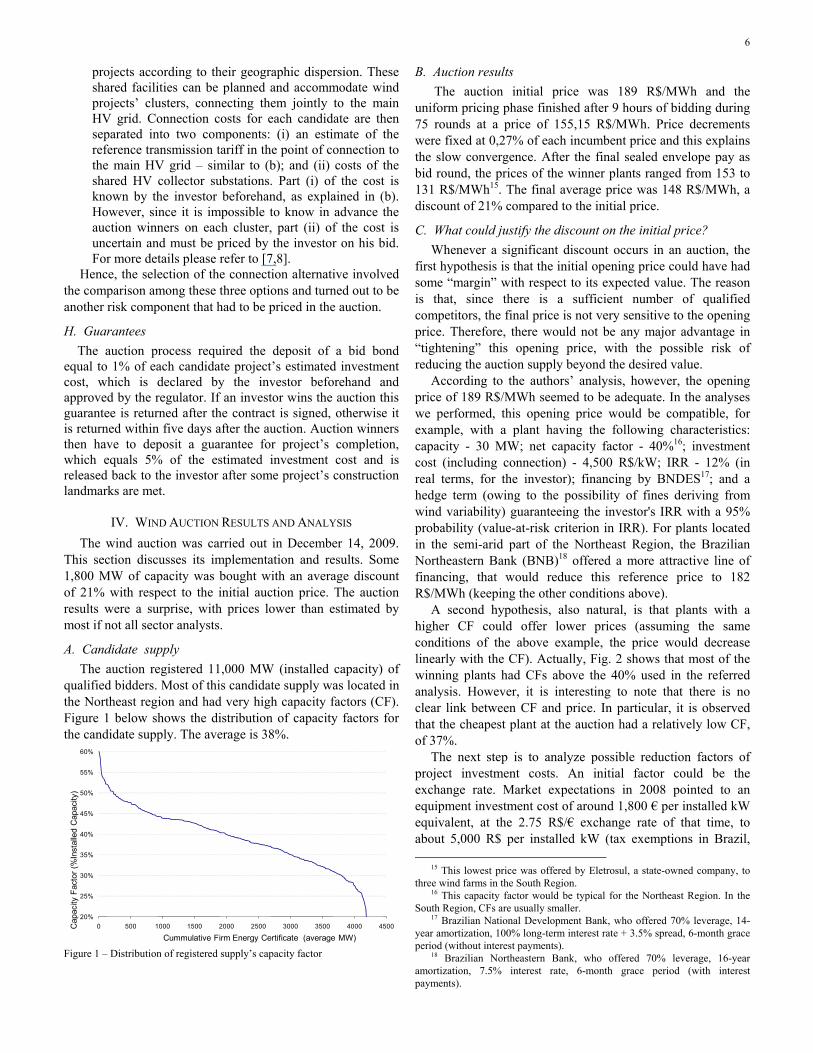
A. Candidate supply The auction registered 11,000 MW (installed capacity) of
qualified bidders. Most of this candidate supply was located in the Northeast region and had very high capacity factors (CF). Figure 1 below shows the distribution of capacity factors for the candidate supply. The average is 38%.
20%
25%
30%
35%
40%
45%
50%
55%
60%
0 500 1000 1500 2000 2500 3000 3500 4000 4500Cap
acity
Fac
tor (
%In
stal
led
Cap
acity
)
Cummulative Firm Energy Certificate (average MW) Figure 1 – Distribution of registered supply’s capacity factor
B. Auction results The auction initial price was 189 R$/MWh and the
uniform pricing phase finished after 9 hours of bidding during 75 rounds at a price of 155,15 R$/MWh. Price decrements were fixed at 0,27% of each incumbent price and this explains the slow convergence. After the final sealed envelope pay as bid round, the prices of the winner plants ranged from 153 to 131 R$/MWh15. The final average price was 148 R$/MWh, a discount of 21% compared to the initial price.
C. What could justify the discount on the initial price? Whenever a significant discount occurs in an auction, the
first hypothesis is that the initial opening price could have had some “margin” with respect to its expected value. The reason is that, since there is a sufficient number of qualified competitors, the final price is not very sensitive to the opening price. Therefore, there would not be any major advantage in “tightening” this opening price, with the possible risk of reducing the auction supply beyond the desired value.
According to the authors’ analysis, however, the opening price of 189 R$/MWh seemed to be adequate. In the analyses we performed, this opening price would be compatible, for example, with a plant having the following characteristics: capacity - 30 MW; net capacity factor - 40%16; investment cost (including connection) - 4,500 R$/kW; IRR - 12% (in real terms, for the investor); financing by BNDES17; and a hedge term (owing to the possibility of fines deriving from wind variability) guaranteeing the investor's IRR with a 95% probability (value-at-risk criterion in IRR). For plants located in the semi-arid part of the Northeast Region, the Brazilian Northeastern Bank (BNB)18 offered a more attractive line of financing, that would reduce this reference price to 182 R$/MWh (keeping the other conditions above).
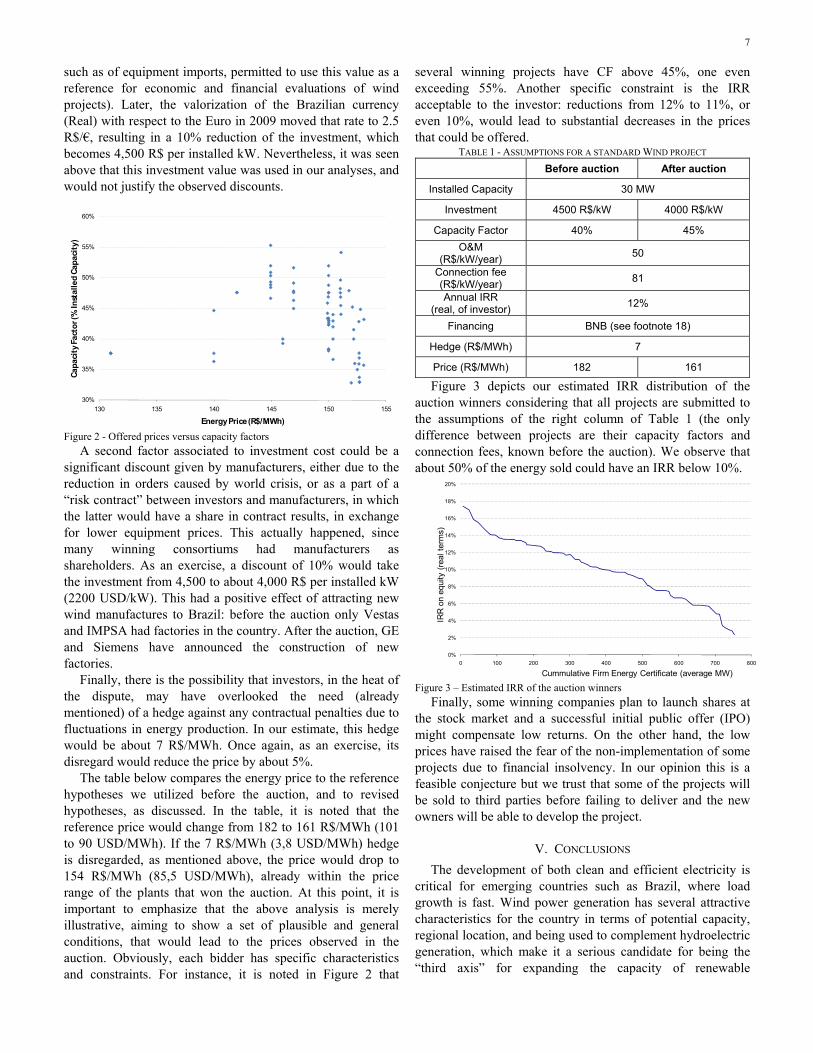
A second hypothesis, also natural, is that plants with a higher CF could offer lower prices (assuming the same conditions of the above example, the price would decrease linearly with the CF). Actually, Fig. 2 shows that most of the winning plants had CFs above the 40% used in the referred analysis. However, it is interesting to note that there is no clear link between CF and price. In particular, it is observed that the cheapest plant at the auction had a relatively low CF, of 37%.
The next step is to analyze possible reduction factors of project investment costs. An initial factor could be the exchange rate. Market expectations in 2008 pointed to an equipment investment cost of around 1,800 € per installed kW equivalent, at the 2.75 R$/€ exchange rate of that time, to about 5,000 R$ per installed kW (tax exemptions in Brazil,
15 This lowest price was offered by Eletrosul, a state-owned company, to three wind farms in the South Region.
16 This capacity factor would be typical for the Northeast Region. In the South Region, CFs are usually smaller.
17 Brazilian National Development Bank, who offered 70% leverage, 14-year amortization, 100% long-term interest rate + 3.5% spread, 6-month grace period (without interest payments).
18 Brazilian Northeastern Bank, who offered 70% leverage, 16-year amortization, 7.5% interest rate, 6-month grace period (with interest payments).
7
such as of equipment imports, permitted to use this value as a reference for economic and financial evaluations of wind projects). Later, the valorization of the Brazilian currency (Real) with respect to the Euro in 2009 moved that rate to 2.5 R$/€, resulting in a 10% reduction of the investment, which becomes 4,500 R$ per installed kW. Nevertheless, it was seen above that this investment value was used in our analyses, and would not justify the observed discounts.
30%
35%
40%
45%
50%
55%
60%
130 135 140 145 150 155
Capa
city
Fact
or (%
Inst
alle
d Ca
paci
ty)
Energy Price (R$/MWh) Figure 2 - Offered prices versus capacity factors
A second factor associated to investment cost could be a significant discount given by manufacturers, either due to the reduction in orders caused by world crisis, or as a part of a “risk contract” between investors and manufacturers, in which the latter would have a share in contract results, in exchange for lower equipment prices. This actually happened, since many winning consortiums had manufacturers as shareholders. As an exercise, a discount of 10% would take the investment from 4,500 to about 4,000 R$ per installed kW (2200 USD/kW). This had a positive effect of attracting new wind manufactures to Brazil: before the auction only Vestas and IMPSA had factories in the country. After the auction, GE and Siemens have announced the construction of new factories.
Finally, there is the possibility that investors, in the heat of the dispute, may have overlooked the need (already mentioned) of a hedge against any contractual penalties due to fluctuations in energy production. In our estimate, this hedge would be about 7 R$/MWh. Once again, as an exercise, its disregard would reduce the price by about 5%.
The table below compares the energy price to the reference hypotheses we utilized before the auction, and to revised hypotheses, as discussed. In the table, it is noted that the reference price would change from 182 to 161 R$/MWh (101 to 90 USD/MWh). If the 7 R$/MWh (3,8 USD/MWh) hedge is disregarded, as mentioned above, the price would drop to 154 R$/MWh (85,5 USD/MWh), already within the price range of the plants that won the auction. At this point, it is important to emphasize that the above analysis is merely illustrative, aiming to show a set of plausible and general conditions, that would lead to the prices observed in the auction. Obviously, each bidder has specific characteristics and constraints. For instance, it is noted in Figure 2 that
several winning projects have CF above 45%, one even exceeding 55%. Another specific constraint is the IRR acceptable to the investor: reductions from 12% to 11%, or even 10%, would lead to substantial decreases in the prices that could be offered.
TABLE 1 - ASSUMPTIONS FOR A STANDARD WIND PROJECT Before auction After auction
Installed Capacity 30 MW
Investment 4500 R$/kW 4000 R$/kW
Capacity Factor 40% 45% O&M
(R$/kW/year) 50
Connection fee (R$/kW/year) 81
Annual IRR (real, of investor) 12%
Financing BNB (see footnote 18)
Hedge (R$/MWh) 7
Price (R$/MWh) 182 161
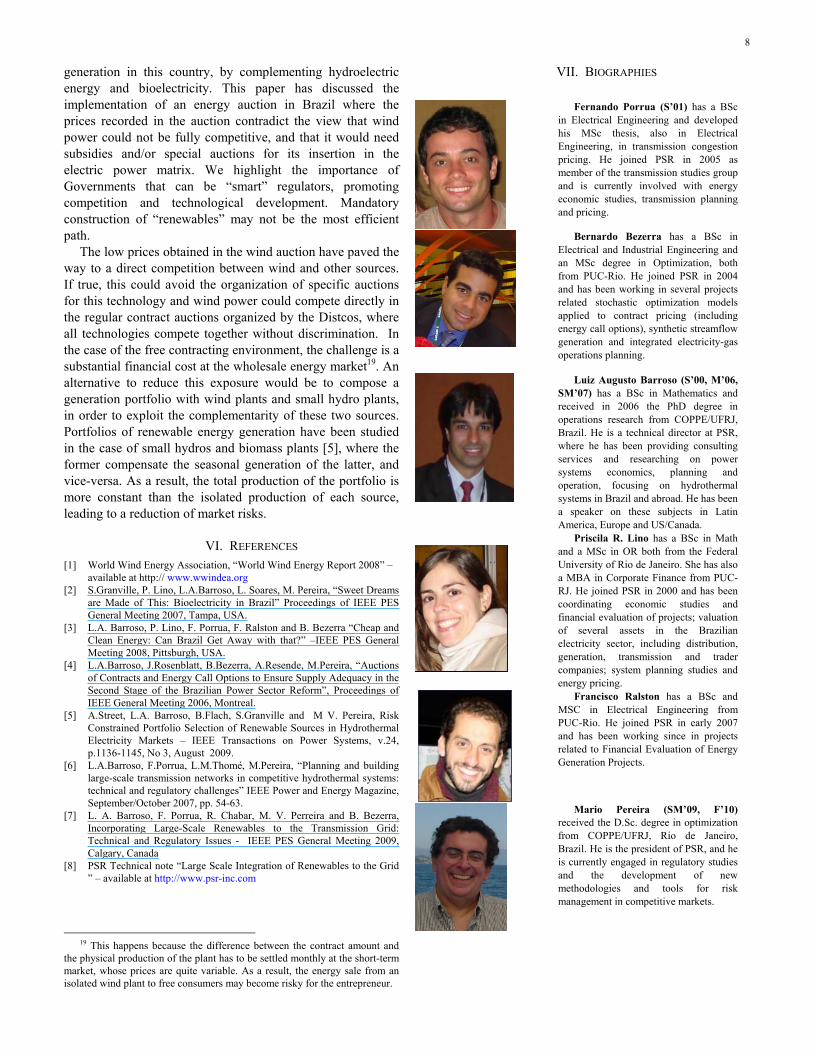
Figure 3 depicts our estimated IRR distribution of the auction winners considering that all projects are submitted to the assumptions of the right column of Table 1 (the only difference between projects are their capacity factors and connection fees, known before the auction). We observe that about 50% of the energy sold could have an IRR below 10%.
0%
2%
4%
6%
8%
10%
12%
14%
16%
18%
20%
0 100 200 300 400 500 600 700 800
IRR
on
equi
ty (r
eal t
erm
s)
Cummulative Firm Energy Certificate (average MW) Figure 3 – Estimated IRR of the auction winners
Finally, some winning companies plan to launch shares at the stock market and a successful initial public offer (IPO) might compensate low returns. On the other hand, the low prices have raised the fear of the non-implementation of some projects due to financial insolvency. In our opinion this is a feasible conjecture but we trust that some of the projects will be sold to third parties before failing to deliver and the new owners will be able to develop the project.
V. CONCLUSIONS The development of both clean and efficient electricity is
critical for emerging countries such as Brazil, where load growth is fast. Wind power generation has several attractive characteristics for the country in terms of potential capacity, regional location, and being used to complement hydroelectric generation, which make it a serious candidate for being the “third axis” for expanding the capacity of renewable
8
generation in this country, by complementing hydroelectric energy and bioelectricity. This paper has discussed the implementation of an energy auction in Brazil where the prices recorded in the auction contradict the view that wind power could not be fully competitive, and that it would need subsidies and/or special auctions for its insertion in the electric power matrix. We highlight the importance of Governments that can be “smart” regulators, promoting competition and technological development. Mandatory construction of “renewables” may not be the most efficient path.
The low prices obtained in the wind auction have paved the way to a direct competition between wind and other sources. If true, this could avoid the organization of specific auctions for this technology and wind power could compete directly in the regular contract auctions organized by the Distcos, where all technologies compete together without discrimination. In the case of the free contracting environment, the challenge is a substantial financial cost at the wholesale energy market19. An alternative to reduce this exposure would be to compose a generation portfolio with wind plants and small hydro plants, in order to exploit the complementarity of these two sources. Portfolios of renewable energy generation have been studied in the case of small hydros and biomass plants [5], where the former compensate the seasonal generation of the latter, and vice-versa. As a result, the total production of the portfolio is more constant than the isolated production of each source, leading to a reduction of market risks.
VI. REFERENCES [1] World Wind Energy Association, “World Wind Energy Report 2008” –
available at http:// www.wwindea.org [2] S.Granville, P. Lino, L.A.Barroso, L. Soares, M. Pereira, “Sweet Dreams
are Made of This: Bioelectricity in Brazil” Proceedings of IEEE PES General Meeting 2007, Tampa, USA.
[3] L.A. Barroso, P. Lino, F. Porrua, F. Ralston and B. Bezerra “Cheap and Clean Energy: Can Brazil Get Away with that?” –IEEE PES General Meeting 2008, Pittsburgh, USA.
[4] L.A.Barroso, J.Rosenblatt, B.Bezerra, A.Resende, M.Pereira, “Auctions of Contracts and Energy Call Options to Ensure Supply Adequacy in the Second Stage of the Brazilian Power Sector Reform”, Proceedings of IEEE General Meeting 2006, Montreal.
[5] A.Street, L.A. Barroso, B.Flach, S.Granville and M V. Pereira, Risk Constrained Portfolio Selection of Renewable Sources in Hydrothermal Electricity Markets – IEEE Transactions on Power Systems, v.24, p.1136-1145, No 3, August 2009.
[6] L.A.Barroso, F.Porrua, L.M.Thomé, M.Pereira, “Planning and building large-scale transmission networks in competitive hydrothermal systems: technical and regulatory challenges” IEEE Power and Energy Magazine, September/October 2007, pp. 54-63.
[7] L. A. Barroso, F. Porrua, R. Chabar, M. V. Perreira and B. Bezerra, Incorporating Large-Scale Renewables to the Transmission Grid: Technical and Regulatory Issues - IEEE PES General Meeting 2009, Calgary, Canada
[8] PSR Technical note “Large Scale Integration of Renewables to the Grid ” – available at http://www.psr-inc.com
19 This happens because the difference between the contract amount and
the physical production of the plant has to be settled monthly at the short-term market, whose prices are quite variable. As a result, the energy sale from an isolated wind plant to free consumers may become risky for the entrepreneur.
VII. BIOGRAPHIES
Fernando Porrua (S’01) has a BSc in Electrical Engineering and developed his MSc thesis, also in Electrical Engineering, in transmission congestion pricing. He joined PSR in 2005 as member of the transmission studies group and is currently involved with energy economic studies, transmission planning and pricing.
Bernardo Bezerra has a BSc in Electrical and Industrial Engineering and an MSc degree in Optimization, both from PUC-Rio. He joined PSR in 2004 and has been working in several projects related stochastic optimization models applied to contract pricing (including energy call options), synthetic streamflow generation and integrated electricity-gas operations planning.
Luiz Augusto Barroso (S’00, M’06, SM’07) has a BSc in Mathematics and received in 2006 the PhD degree in operations research from COPPE/UFRJ, Brazil. He is a technical director at PSR, where he has been providing consulting services and researching on power systems economics, planning and operation, focusing on hydrothermal systems in Brazil and abroad. He has been a speaker on these subjects in Latin America, Europe and US/Canada.
Priscila R. Lino has a BSc in Math and a MSc in OR both from the Federal University of Rio de Janeiro. She has also a MBA in Corporate Finance from PUC-RJ. He joined PSR in 2000 and has been coordinating economic studies and financial evaluation of projects; valuation of several assets in the Brazilian electricity sector, including distribution, generation, transmission and trader companies; system planning studies and energy pricing.
Francisco Ralston has a BSc and MSC in Electrical Engineering from PUC-Rio. He joined PSR in early 2007 and has been working since in projects related to Financial Evaluation of Energy Generation Projects.
Mario Pereira (SM’09, F’10) received the D.Sc. degree in optimization from COPPE/UFRJ, Rio de Janeiro, Brazil. He is the president of PSR, and he is currently engaged in regulatory studies and the development of new methodologies and tools for risk management in competitive markets.