Ultra-High Packing Density Next Generation Microtube Array ...
Upload
independentCategory
view
0download
0
JOURNAL OF CHROMATOGRAPHY A
ELSEVIER Journal of Chromatography A, 683 (1994) 293-309
Study of the packing behavior of radial compression columns for preparative chromatography
Matilal Sarker, Georges Guiochon* Department of Chemistry, University of Tennessee, Knoxville, TN 37996-1600, USA, and Division of Chemical and Analytical
Sciences, Oak Ridge National Laboratory, Oak Ridge, TN 37831, USA
First received 22 February 1994; revised manuscript received 18 May 1994
Abstract
The behavior of the packing of radial compression preparative columns (17.5 x 7.5 cm) was studied using C,, silica IMPAQ as the stationary phase and water-methanol solutions as the mobile phase. The retention volumes of phenol and cresol and the efficiency of their peaks were repeatedly measured on three different columns, over several hundred hours, during which repeated water-methanol gradient runs were conducted. No significant changes in the retention factors and the column efficiency were observed during the testing period. The effects of the mobile phase temperature and of the radial compression pressure on the column efficiency were also studied. The external porosity and the permeability of the packing were found to decrease slowly with increasing compression pressure. Finally, a set of experiments were performed to trigger the formation of channels and to show their possible repair by applying elevated radial compression pressures.
1. Introduction
Preparative high-performance liquid chroma- tography (HPLC) is now routinely used by production chemists for the purification of fine chemicals [l]. Although there is an abundant literature on the theory of preparative, e.g., non-linear, chromatography [2,3], and on the optimization of the experimental conditions of this process for laboratory or industrial applica- tions [3-91, there is a paucity of technical reports
* Corresponding author. Address for correspondence: De- partment of Chemistry, University of Tennessee, Knoxville, T’N 37996-1600, USA.
0021-9673/94/$07.00 0 1994 Elsevier Science B.V. All rights reserved SSDI 0021-9673(94)00503-2
investigating the structure, the performance and the stability of column packings.
Most studies made on column packing have focussed on the packing technology in view of the achievement of small plate heights. Admit- tedly, this is one of the basic goals of chro- matographers. However, the problem is too complex to be examined by considering a mere number, and especially one which is difficult to measure with great precision. Furthermore, if a poor column efficiency can often be ascribed to an inhomogeneous packing, other important factors, such as the distribution of the mobile phase stream at the column inlet, can explain why poor separations can be achieved with efficient columns. Packing homogeneity and

294 M. Sarker, G. Guiochon I J. Chromatogr. A 683 (1994) 293-309
stability are important properties which need to be investigated in detail to understand the be- havior of preparative columns. The importance of the contribution of large-scale fluctuations of the mobile phase velocity (i.e., of fluctuations at the column radius scale) to the apparent column efficiency has already been pointed out by Gid- dings, 30 years ago [lo].
Nicoud and Perrut [ll] have proposed a model of inhomogeneous preparative columns based on the theory of transfer functions in the Laplace domain and shown some limited experimental data supporting the conclusions of their model. Kaminski [12] has proposed a method to test for possible distortions of the flow profile across the column cross-section. Ideally, the flow profile should be piston-like. However, fluctuations of the packing density promote fluctuations of the local velocity, which, in turn and if these fluctua- tions take place over significant distances, may result in severe warping of the isoconcentration surfaces, which should be flat, and in serious band broadening. Although the test described by Kaminski [12] is useful, it demonstrates an unacceptable situation, but does not supply any course of action for possible remediation.
Recently, Marme et al. [13] investigated the structure and homogeneity of the bed of station- ary phase in an axially compressed column by NMR imaging. Because of the constraints of NMR which uses a very intense and homoge- neous magnetic field, only plastic materials could be used in the column design, and the compres- sion achieved was necessarily imperfect. The bed was found to be inhomogeneous, with regions containing ca. lo-20% more mobile phase than others. There are no doubts that NMR imaging can give much valuable information regarding the dynamics of flow in column packings, and will provide a better understanding of the phe- nomena which take place in all columns, but are enhanced in large-diameter columns. This, how- ever, requires some adjustments in the column technology to permit the investigation of col- umns representative of those in current use. In the same study, an unexpected enrichment in fine particles was found towards the end of an axial compression column after only 30 h of column use.
Most of the earlier work in preparative chro- matography was performed with columns ob- tained by packing empty steel tubings. Many operators have reported that voids or empty pockets appear frequently and unexpectedly at the top of the column bed, and result in a drastic and rapid loss of separation performance. A general agreement has now been reached that dynamic compression is necessary for long-term stable operation of preparative columns and permits a significant improvement of column performance. This has been related to the loss of wall support that the stationary phase ex- periences at distances from the wall exceeding the radius of typical analytical columns.
This phenomenon could be explained either by a loss of stationary phase or by a local or general increase of its apparent density. It does not seem that slow dissolution of the adsorbent in the mobile phase or the loss of its very fine particles in the exit stream could account for the volume of the voids formed. The silica content of even water-rich eluents is insufficient to account for the whole loss observed [14], although, under the proper set of circumstances, this could be a contributing factor. A change in apparent den- sity could be related to a change in the surface tension of the liquid impregnating the bed [15]. Such a rapid change occurs when the packing solvent is replaced by the mobile phase, when the separation is carried out in gradient elution, or when the high concentration bands of the major components of large size samples migrate along the column. More attention should proba- bly be paid to the subtle but far-reaching effects of such changes in the mobile phase surface tension, even though they are probably not the unique cause of an apparently most complex phenomenon.
Be like as it may, dynamic compression can oppose the formation of voids at the top of all columns and of channels in large diameter col- umns, if applied permanently, and possibly heal them if applied after the damage has appeared. There are three different bed compression tech- nologies available for large-size columns; annu- lar, axial and radial compression [16-U]. In principle, each of these compression modes could be implemented under static or dynamic

M. Sarker, G. Guiochon I J. Chromatogr. A 683 (1994) 293-309 295
conditions. However, for practical reasons, the proper instrumentation has been developed only for axial and radial dynamic compression. Static compression cannot, by principle, correct auto- matically for the formation of voids. Thus, columns using static compression are at an intrin- sic disadvantage when compared with dynamic compression columns. In a forthcoming paper, we discuss the behavior of the packing beds in axial compression columns [19]. The goal of the present paper is a study of packing performance in radial compression columns.
The first report on the dynamic radial com- pression was published by Little et al. [17]. The technology was patented by Waters Millipore Division for analytical and preparative applica- tions [20-221. The column packing is contained in a flexible-wall prepacked cartridge which is placed inside a stainless-steel chamber. The cartridge is compressed by injecting a pres- surized liquid between the steel and the plastic walls. Suitable fittings ensure leak proof insula- tion between the pressurizing fluid and the mobile phase. Typical compression pressures are between 6.9 and 13.8 bar. In this work we present the results of experimental investigations carried out with a 7.5 cm internal diameter radial compression column. We studied the perform- ance, the long-term stability and the reproduci- bility of the performance of this column, using an octadecyl bonded silica column, a standard methanol-water mobile phase and conventional samples. At the end of the study, a set of experiments were performed on one cartridge to demonstrate the formation of channels and their repair in a radial compression column.
Table 1 Column characteristics
2. Experimental
2.1. Chemicals
All chemicals used in this work were 99.9% pure or better. Acetone, m-cresol, phenol and methanol were purchased from Baxter (Atlanta, GA, USA). Distilled water was from the still of the Chemistry Department. It was filtered before use.
2.2. Column
Three 17.5 x 7.5 cm radial compression car- tridges were supplied by Biotage (Charlottesvil- le, VA, USA). The cartridges were packed with IMPAQ RG1020C18 irregular reversed-phase Cl8 bonded silica (BTR Separations, Wilming- ton, DE, USA; formerly The PQ Corporation). The product specifications provide for an aver- age particle size of 16.7 pm and an average pore size of 100 A. A 25 x 0.46 cm analytical column was packed in this laboratory with the same stationary phase, using a conventional slurry packing method at 345 bar [23]. The characteris- tics of these columns are summarized in Table 1.
2.3. Instrument
A Kiloprep 100 HPLC pump and a Kiloprep 100 radial compression module were obtained from Biotage. The pump is capable of delivering up to 500 ml/min at a maximum pressure of 138 bar. The radial compression module is capable of compressing either 30 cm or 17.5 cm long car- tridges. It is rated at 207 bar. For monitoring the
Column properties Column 1 Column 2 Column 3 Column 4
Dimensions (cm) 17.5 x 7.5 17.5 x 7.5 17.5 x 7.5 25 x 0.46 Dead volume (ml) 531-c8 532 + 7 554+5 2.89 0.08 2 Total porosity 0.69 0.69 0.71 0.70 Phase ratio 0.46 0.45 0.40 0.44 k’ (acetone) 0.32 f 0.02 0.33 2 0.02 0.30 + 0.01 0.28 -c 0.01 k’ (phenol) 2.58 f 0.04 2.67 2 0.3 2.66 + 0.07 2.55 0.10 ” k’ (m-cresol) 5.89 f 0.09 6.20 + 0.09 6.16-cO.18 5.79” 0.17
Values measured with methanol-water (4060, v/v) as eluent.

296 M. Sarker, G. Guiochon I J. Chromatogr. A 683 (1994) 293-309
column inlet pressure a Model PX603-2KG5V pressure transducer from Omega (Stamford, CT, USA) was used. This transducer gives a 1 to 5 V (dc.) output. After proper attenuation, the pressure was recorded with the data acquisition system between 0 and 138 bar. The dead volume of the transducer was decreased by adding PTFE packing inside the sensor head connector. The analytical system consisted of a Waters HPLC pump Model 510 (Waters, Milford, MA, USA) and a Spectraflow Model 757 detector (Kratos).
2.4. Detector
Two Model 204 UV-visible detectors (Linear Scientific, Reno, NV, USA), equipped with a variable path length preparative cell were used in this work. Because short path lengths can be used, the response of the detector remains linear up to much higher concentrations than that of conventional HPLC detectors. The cell is rated up to 500 ml/min and 138 bar pressure.
2.5. Data acquisition
The data system consisted of a Waters System Interface Module with two A/D convertor boards (Milford, MA, USA). These boards permit the simultaneous monitoring of four de- tectors. A Waters Maxima 820 version 3.3 soft- ware was used to collect the data. The data files were uploaded to the computer network of the University of Tennessee Computer Center. For further manipulation of these data, several DOS- and VMS-based softwares in BASIC and FOR- TRAN were developed in our laboratory.
2.6. Solvent
Methanol (99.9% pure) was used as solvent in some experiments, and in others a mixture of methanol-water (4060, v/v). In the following, we refer to pure methanol as solvent A and to the methanol-water (40:60, v/v) mixture as solvent B. For economical reasons, none of these solvents were HPLC grade. For the same, obvi- ous reasons and for better waste management, the mobile phase was pumped in closed circuit
with a 15-20-l buffer tank on the line. Large elution bands were collected separately and wasted. The solvent was changed and wasted whenever the baseline absorption exceeded a certain threshold.
2.7. Methods
In most experiments, the compression pres- sure is set at 6.9 bar while there is no mobile phase flow-rate through the column, and the compression chamber is sealed by closing a valve. In some experiments (e.g., influence of compression pressure on the flow-rate, study of channel healing), the compression pressure is set independently and controlled.
For the low-concentration experiments [e.g., height equivalent to a theoretical plate (HETP) determinations], solvents A and B were used successively as eluent. During all experiments, the mobile phase flow-rate was measured with appropriate graduated measuring cylinders. The samples for these experiments consisted of a 3% solution of acetone, phenol and m-cresol dis- solved in the eluent. The sample loop volume for the analytical injections was 1.5 ml on the preparative column and 20 ~1 on the analytical column.
The data collected by the Maxima 820 soft- ware were translated to ASCII format for further use. All detector outputs digitized and recorded by Maxima were in terms of volts. These volt- ages were then converted to the specific units by calibrated correlations, as indicated above. Sev- eral programs were written in BASIC to convert data. One of these programs calculates the column efficiency, using different equations among those suggested in the literature. In this work, however, the efficiency data were derived from the peak width at half-height. In all sets of experiments the reduced velocities and reduced plate heights were calculated. The classical Wilke and Chang [24] equation was used to estimate the diffusion coefficients. These data were fitted to the Van Deemter equation [25] by a non-linear regression and the parameters are reported in Table 2.

Table 2
M. Sarker, G. Guiochon I .I. Chromatogr. A 683 (1994) 293-309 297
Van Deemter parameters for the columns studied
Column Solvent Sample a b C ‘cni, V0pt Hours used
A
B
Acetone
Acetone
Acetone
Acetone Phenol m-Cresol
2.595 4.411 0.0982 3.90 6.62
1.999 5.273 0.1382 3.70 6.18
1.989 4.701 0.1397 3.61 5.58
4.304 0.774 0.0397 4.65 4.15 2.980 2.988 0.0956 4.05 5.44 3.134 1.401 0.0815 3.81 4.1s
1 B Acetone 1.490 16.14 0.1177 4.25 11.6 Phenol 1.388 11.78 0.131s 3.87 9.30 m-Cresol 0.641 20.48 0.1319 3.93 12.5
1 B Acetone 3.594 13.83 0.0720 5.59 13.8 Phenol 0.999 22.62 0.1462 4.64 12.5 m-Cresol 0.782 21.42 0.1210 4.40 13.4
Acetone
Acetone Phenol m-Cresol
7.030 4.285 0.0628 8.07 8.27
6.629 7.533 0.0591 7.96 8.27 8.005 15.09 0.0606 9.92 11.2 7.355 28.82 0.0837 10.5 15.8
2 B Acetone 4.474 36.27 0.1107 8.45 18.1 Phenol 2.654 59.98 0.1877 9.37 16.9 m-Cresol 3.919 58.70 0.1574 9.90 19.4
3
3b
3
A
A
B
Acetone
Acetone
Acetone Phenol m-Cresol
1.941 5.894 0.2464 4.35 4.84
2.075 5.410 0.2431 4.37 4.72
2.582 8.075 0.0961 4.34 9.36 2.252 5.217 0.1422 3.97 6.14 1.774 8.207 0.137s 3.90 7.52
3 B Acetone 2.792 9.796 0.0842 4.61 10.74 Phenol 1.697 10.002 0.1475 4.13 8.21 m-Cresol 0.571 17.004. 0.1753 4.02 9.82
4’ A Acetone 3.330 1.29 0.0823 3.85 3.98
15
25
3s
SO
65
90
6
26
110
8
19
69
123
Solvents: A= pure methanol, B = methanol-water (4050, v/v). ‘JW Data shown in Fig. 1.
3. Results and discussion
The efficiency of the three radial compression cartridges packed by Riotage were measured at the plant, using pure methanol as the eluent and
acetone as the test sample. The values obtained were 3435, 3413 and 2029 theoretical plates at 150 ml/min (reduced mobile phase velocity, v = 5.68, reduced plate height, h = 3.05; Y = 5.74, h = 3.07 and v = 5.60, h = 5.16), respectively.

298 M. Sarker, G. Guiochon 1 J. Chromatogr. A 683 (1994) 293-309
We repeated the measurements using the same eluent and sample. Then, we performed various experiments with these cartridges over an ex- tended period of time and repeated periodically the efficiency measurements (cf. Table 2). Al- though longer periods would have been useful for the purpose of our study, the first cartridge was used for a total period of time of nearly 300 h, the second and third cartridges for slightly more than 100 h each. Because of safety regula- tions, the pump could not be left operating alone, so no overnight or week-end runs could be completed, as normally done in production. It would have been impractical to use the car- tridges for longer periods. The efficiency of the analytical column was measured under the same conditions, but no long-term study of the evolu- tion of its efficiency was done.
The experiments performed on the cartridges between successive HETP measurements in- cluded repeated concentration gradients as fol- lows. The methanol concentration in water is raised linearly from 40 to 80% in 30 min, followed by an abrupt jump to O%, and then by a linear gradient from 0 back to 40% methanol. The purpose of these experiments was not to wear down the stationary phase, but the column itself. There are more aggressive experiments to accelerate the aging of the stationary phase. This gradient seemed appropriate to test the stability of the bed itself.
3.1. Results obtained with pure methanol as the eluent
The column efficiencies were measured at different flow velocities, using methanol as the eluent and a 3% acetone solution in methanol as the sample. Acetone is practically not retained in pure methanol, and its retention time can be taken as a good estimate of the column hold up time (to). Plate numbers were derived from the bandwidth at half-height. Similar trends are obtained when the plate number is derived from the second moment the.determination of which is less accurate. This measurement permits also a qualitative comparison with the factory results. The parameters of the Knox equation obtained
are reported in Table 2. As an example, Fig. 1 shows the data obtained (symbols) with columns 1 (Table 2, row 3) and 3 (Table 2, row ll), and with the analytical column (Table 2, last row), as plots of h versus Y (data labelled a, b, c in Table 2). The solid line represents the result of a non-linear fit of the data to the Van Deemter equation [25]. In Fig. 1, minimum values of h equal to 3.6 and 4.4 occur around v = 5.6 and 4.7 for columns 1 and 3, respectively; the corre- sponding flow-rates are 120 and 100 ml/min, respectively. These values are in reasonable agreement with the factory values, considering
A 2
A A A
.
1
J 6 9 i2
Reduced Velocity
Fig. 1. Plot of the reduced plate height versus the reduced mobile phase velocity representative of the results obtained with the first radial column (l), third radial column (2) and the analytical column (3). Eluent: pure methanol. Sample for analytical column was 20 ~1 of a 1% acetone solution in the eluent. Sample for the radial columns: 1.5 ml of a 3% acetone solution in methanol. Radial compression for first radial column 6.9 bar and for the third column was 5.2 bar. Experimental data points (symbols) from Table 2 (rows labelled a, b, c) and best fit to the Van Deemter equation (lines).
M. Sarker, G. Guiochon I .I. Chromatogr. A 683 (1994) 293-309 299
that two different instrumental settings were used, that the calculation procedures are differ- ent, and that efficiency determinations are not highly precise. The values observed for the optimum reduced velocities seem high, consider- ing the efficiencies measured for the columns. Usually, values of the optimum reduced velocity between 2 and 3 are associated with minimum reduced plate heights between 4 and 5. Indepen- dent measurements reported elsewhere [19] demonstrate that the extra-column contributions to band broadening due to tubings, valves, connections, injection device and detector cell are negligible.
The agreement was not as good for the second column which, although its characteristics are quite similar to those of column 1 (Table l), gave only half the efficiency, for no apparent good reasons. This second cartridge, which sat on the shelf for about five months before the beginning of its tests, never gave good perform- ance, with the possible exception of the last test (Table 2). The third cartridge gave performance comparable with that of the first cartridge. The analytical column (column 4) gave an HETP curve in good agreement with the curves ob- tained for the first and third column, in spite of the large difference in their internal diameters (0.46 vs. 7.5 cm, or a ratio of 266 in cross-section areas). Note, however, that, if the efficiency of the analytical column is intermediate between that of the two cartridges (Fig. l), the slopes of the asymptotes of the HETP plots and the c terms are larger for the two cartridges than for the analytical column, while the a term is lower. Since the same packing material was used in all columns, a somewhat opposite result was ex- pected, with similar values for the c terms of the different columns, and different values of the a terms for the cartridges and the analytical col- umn, since a characterizes the packing homo- geneity [25].
3.2. Results obtained with a methanol-water (4O:iSO) solution as the eluent
The components of the test sample were chosen so that the first one (acetone, k’ = 0.32)
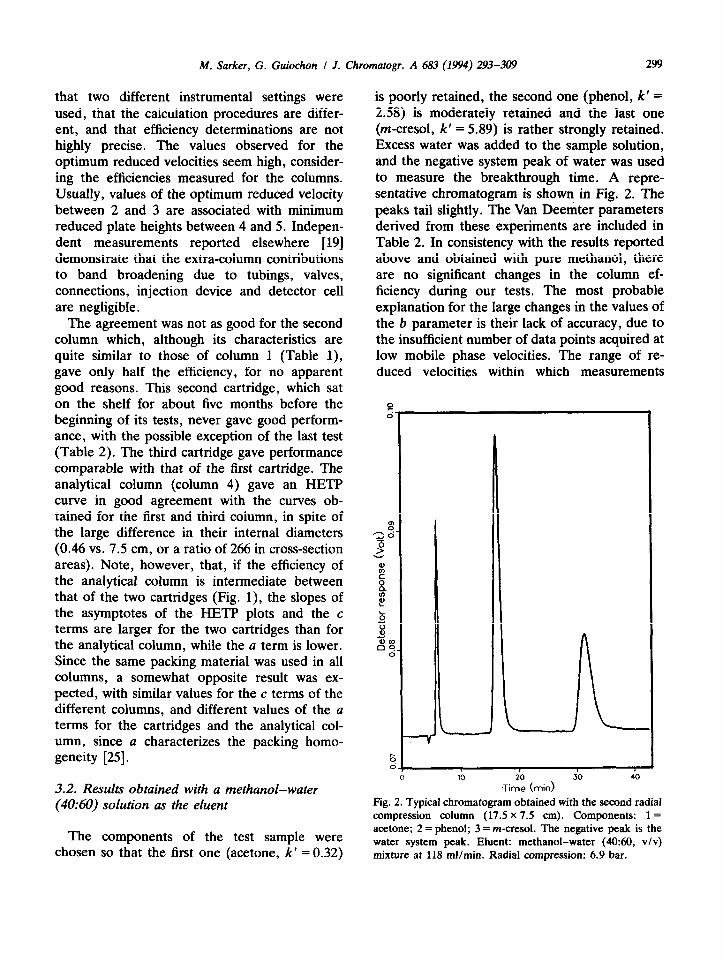
is poorly retained, the second one (phenol, k’ = 2.58) is moderately retained and the last one (m-cresol, k’ = 5.89) is rather strongly retained. Excess water was added to the sample solution, and the negative system peak of water was used to measure the breakthrough time. A repre- sentative chromatogram is shown in Fig. 2. The peaks tail slightly. The Van Deemter parameters derived from these experiments are included in Table 2. In consistency with the results reported above and obtained with pure methanol, there are no significant changes in the column ef- ficiency during our tests. The most probable explanation for the large changes in the values of the b parameter is their lack of accuracy, due to the insufficient number of data points acquired at low mobile phase velocities. The range of re- duced velocities within which measurements
10 20 30 40
.Time (mid
Fig. 2. Typical chromatogram obtained with the second radial compression column (17.5 X 7.5 cm). Components: 1 = acetone; 2 = phenol; 3 = m-cresol. The negative peak is the water system peak. Eluent: methanol-water (4050, v/v) mixture at 118 ml/min. Radial compression: 6.9 bar.

300 M. Sarker, G. Guiochon I J. Chromatogr. A 683 (1994) 293-309
were done barely exceeds half an order of magnitude. For this reason, it is not justified to attempt to draw conclusions from the fluctua- tions of the Van Deemter parameters. What is important is the very slow, almost negligible increase in the minimum plate height with pass- ing time, in spite of the punishments inflicted to the column (see above). Repeated steep mobile phase composition gradients are known to trig- ger rapid degradation of column performance. Radial compression seems to be effective in keeping the packing structure stable.
Some column characteristics are given in Table 1. The dead volumes and the retention factors k’ were measured with solvent B for a series of experiments made at ten different values of the flow rate. The standard deviations of the results (a few percents) are low for that kind of data. The results in the Table suggest that the four columns have nearly identical initial packing density, since their total porosity and the re- tention factors of the three components are the same.
3.3. Correlation between the radial compression pressure, the column inlet pressure and the flow- rate
The inlet pressure, Pi, required to achieve a certain flow-rate cannot be completely indepen- dent from the radial compression pressure, P,, since the column shrinks slightly under the influence of the radial compression, which is the purpose of the design. The inlet pressure is related to the mobile phase flow velocity, u, the mobile phase viscosity, n, the column length, L, and its permeability, k, through the conventional Darcy equation [3,26]
k Pi
u=G’x (1)
Under the influence of the compression pres- sure, the external or extra-particle porosity, E,, decreases slightly. The Blake-Kozeny equation (see Ref. [26]) relates the column permeability, k, its external porosity the specific surface area up of the particles (m /m3)
k= 4 die:
h,azeT(l - E,)* = h,(q + e,J(l - l ,)’ (2)
where h, and h, are numerical coefficients. In classical chemical engineering textbooks, the Blake-Kozeny equation does not contain l ~, the total porosity, but then, the flow velocity used is the superficial velocity, v = F,l?rDi, with F, = flow rate and D, = column diameter, i.e., the velocity which would be reached in an empty tube. In chromatography, the velocity is the ratio L/t,, of the column length to the hold-up time. Obviously v = E+, and the two ways to write the equation are equivalent.
For spheres, up is equal to 6/d,. Packing particles are generally not spheres, so the nu- merical coefficient h, will depend on the shape of the particles, and will vary from one brand to another. The total porosity, E-,., is the sum of the external porosity (E,) and the internal porosity, l i, or pore volume. The latter is constant for silica particles which we assume to be incom- pressible in the pressure range investigated. Thus, ei should be the same for all columns. The experimental results used to illustrate the follow- ing discussion have all been obtained with the second cartridge. Data for the third cartridge are also given in the figures.
When the compression pressure is increased, the particles are compressed together, shift slightly, and the external porosity decreases. This process should take some time, however, and we may expect it to cause a degree of particle abrasion or cracking, hence to result in the formation of fine particles. As a result of the decrease in the external porosity, the flow-rate should decrease if the inlet pressure is kept constant. This point is well supported by the experimental results. As shown in Fig. 3, the hold-up volumes at constant flow-rate of the second and third cartridges (these measurements were not carried out on the first cartridge) decrease with increasing radial compression pres- sure, showing that the column external porosity decreases. In the range investigated here, the decrease is linear, with a slope equal to -1.03 ml/bar. To keep the flow-rate constant at 200 ml/min, the column inlet pressure must be

M. Sarker, G. Guiochon I J. Chromatogr. A 683 (1994) 293-309 301
Radial f%npression (Bar) 25
Fig. 3. Variation of the hold-up time of the second (W) and third (Cl) radial columns with the compression pressure. Constant flow-rates, 200 ml/min (second radial column) and 142 mllmin (third radial column).
raised. When the compression pressure is in- creased from 6.9 to 31.0 bar, the inlet pressure required to keep a constant flow-rate of 200 ml/min increases by more than 30%, from 8.0 to 10.6 bar (data not shown). The data fits well to a third-degree polynomial (Pi = a + b PC + cPf + dPz), with coefficients a = 7.58, b = 5.74 * lo-*, c = - 5.559 - 1o-4 and d = 6.085 * 10e5 (all pressures in bar), although a linear fit would be nearly as good. Using the experimental values of the inlet pressure, we can use the Darcy equa- tion (Eq. 1) to calculate the permeability as a function of the compression pressure. The plot of k, = k/d; versus the radial cdmpression pres- sure is given in Fig. 4. Eq. 2 then permits the calculation of an apparent Ed. A plot of C~ versus PC is shown in Fig. 5. As can be seen, the decrease in E, is quite significant.
10
Rod& Canp~ssion (Zs5or) 30
Fig. 4. Plot of the permeability of the second (H) and third (0) radial columns versus the compression pressure. Value of the permeability derived from the data in Figs. 5 and 6, using Eq. 1.
This dependence of the inlet pressure on both the required flow-rate and the selected compres- sion pressure is important to understand when operating a radial compression column. The normal mode of operation consists in setting a compression pressure of ca. 6.9 bar when the column is filled with mobile phase, but there is still no inlet pressure applied, and no flow-rate. The valve to the compression chamber is then closed tightly, and the column inlet pressure raised to the required value. Because the com- pression chamber is closed, the compression pressure rises. The hydrodynamic behavior of the column is complex, and we cannot calculate it at this stage. The actual stress applied, to the packing bed at the wall results from the differ- ence between the pressure of the mobile phase at the column wall and the compression pressure
> i-
, ,
, 1
5
M. Sarker, G. Guiochon I J. Chromatogr. A 683 (1994) 293-309
10 Rad~l Compksion c2eJor) 30
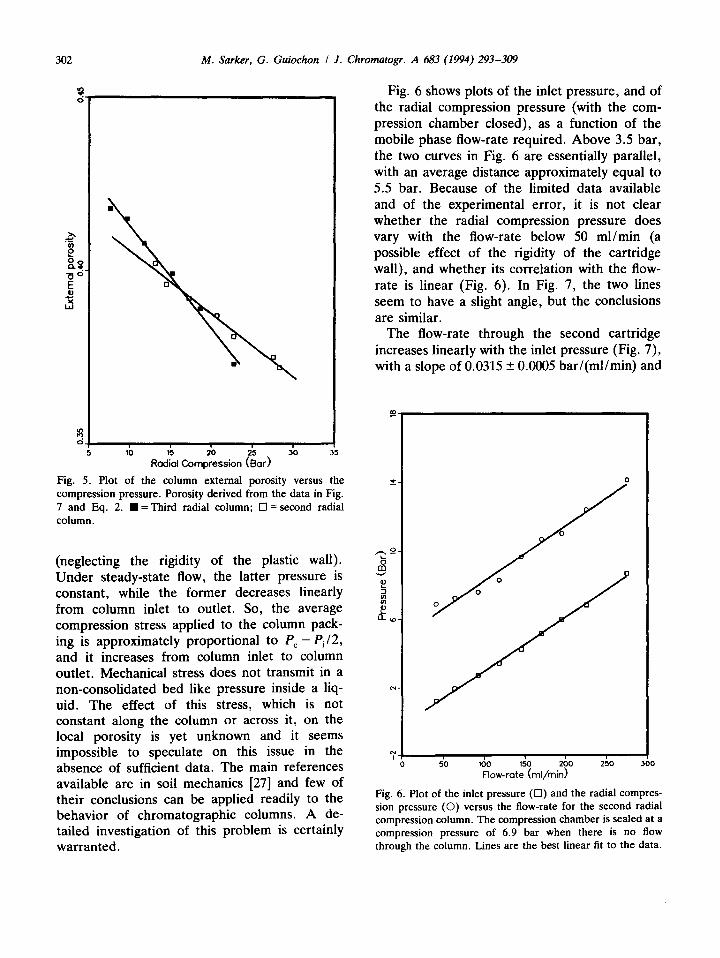
Fig. 5. Plot of the column external porosity versus the compression pressure. Porosity derived from the data in Fig. 7 and Eq. 2. n = Third radial column; 0 = second radial
(neglecting the rigidity of the plastic wall). Under steady-state flow, the latter pressure is constant, while the former decreases linearly from column inlet to outlet. So, the average compression stress applied to the column pack- ing is approximately proportional to PC - Pi/2, and it increases from column inlet to column outlet. Mechanical stress does not transmit in a non-consolidated bed like pressure inside a liq- uid. The effect of this stress, which is not constant along the column or across it, on the local porosity is yet unknown and it seems impossible to speculate on this issue in the absence of sufficient data. The main references available are in soil mechanics [27] and few of their conclusions can be applied readily to the behavior of chromatographic columns. A de- tailed investigation of this problem is certainly warranted.
Fig. 6 shows plots of the inlet pressure, and of the radial compression pressure (with the com- pression chamber closed), as a function of the mobile phase flow-rate required. Above 3.5 bar, the two curves in Fig. 6 are essentially parallel, with an average distance approximately equal to 5.5 bar. Because of the limited data available and of the experimental error, it is not clear whether the radial compression pressure does vary with the flow-rate below 50 ml/mm (a possible effect of the rigidity of the cartridge wall), and whether its correlation with the flow- rate is linear (Fig. 6). In Fig. 7, the two lines seem to have a slight angle, but the conclusions are similar.
The flow-rate through the second cartridge increases linearly with the inlet pressure (Fig. 7), with a slope of 0.0315 + 0.0005 bar/(ml/min) and
50 100 150 200 250 ?
Flow-rote (ml/mid
Fig. 6. Plot of the inlet pressure (0) and the radial compres- sion pressure (0) versus the flow-rate for the second radial compression column. The compression chamber is sealed at a compression pressure of 6.9 bar when there is no flow through the column. Lines are the best linear fit to the data.

M. Sarker, G. Guiochon I J. Chromatogr. A 683 (1994) 293-309
100 200
Flow-Rate (ml/mid
Fig. 7. Plot of the inlet pressure (0) and the radial compres- sion pressure (0) versus the flow-rate for the third radial compression column. The compression chamber is sealed at a compression pressure of 5.2 bar when there is no flow through the column. Lines are the best linear fit to the data.
an intercept of -0.159 + 0.088 bar, not signifi- cantly different from 0. From this slope it is easy to derive the apparent column permeability, hence an average hydrodynamic particle size using Eq. 2. However, the external porosity decreases during these measurements and it is not possible at this stage to account correctly for this effect. For example, the average hydro- dynamic particle sizes derived from Darcy’s equation (Eq. 1) from the data obtained with the three columns are 24.60 + 0.60 pm, 21.20? 0.60 pm, and 16.90 kO.20 km for values of the compression pressure of 5.2, 6.9 and 20.7 bar, respectively. Obviously, the particle size cannot vary that much with the compression pressure, but this variation reflects the change in the column permeability due the variation of the external porosity.
303
Thus, the hydrodynamics in a radial compres- sion column is slightly more complicated than in a regular column. This complexity must be taken into account in method development if the dependence of the flow-rate on the column characteristics is calculated from classical corre- lations, using Darcy’s law and the dependence of the permeability on the particle size as derived from measurements made on an analytical col- umn packed with the same stationary phase. The interdependence of the inlet pressure, the com- pression pressure and the flow-rate may make calibrations and calculations more complex. In production operation, however, there will be no differences with a conventional column. Possible small flow-rate and compression pressure fluctua- tions (if the compression chamber is kept close) will be proportional to the inlet pressure fluctua- tions.
After finishing all experiments with the second radial cartridge it was cut open to inspect its inside. There was a 6 mm thick void space at the column entrance (volume 26.5 cm3, 3.4% of the total volume). This void volume is nearly equal to the decrease in hold-up volume measured during the experiment reported in Fig. 3, and discussed above. The whole stationary phase was found as a semi-compact, cylindrical block of silica, that could be taken out as one piece and inspected, but crumbled easily in the hand. The appearance of the stationary phase was similar in all parts of the column. Six samples of silica were collected from different sites of the cartridge for particle size analysis. The sites were (1) center of the column entrance, (2) a few mm from the wall at the column entrance, (3) center of the middle cross-section, (4) a few mm from the wall at the middle cross-section, (5) center of the column exit and (6) a few mm from the wall at the exit of column.
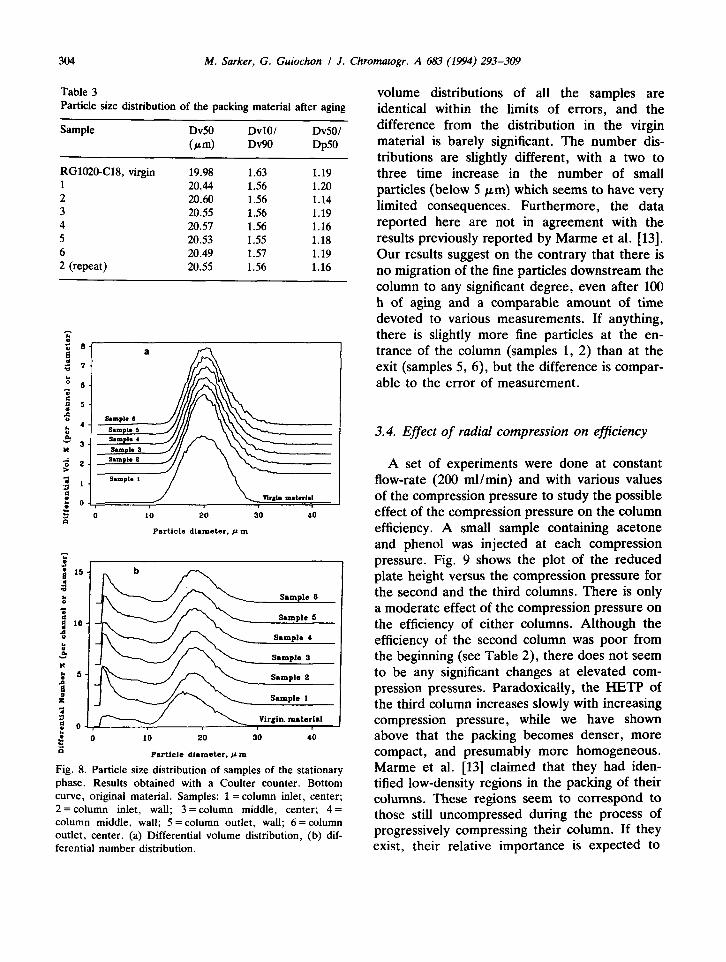
The results of the particle size analysis carried out with a Coulter Multisizer are reported in Table 3 and Fig. 8. They show that in spite of the punishing treatments administered (see below, Section 3.6), the packing itself has not suffered to any significant extent. The particle size dis- tributions based on particle volumes and num- bers are given in Fig. 8a and b, respectively. The
304 M. Sarker, G. Guiochon I J. Chromatogr. A 683 (1994) 293-309
Table 3 Particle size distribution of the packing material after aging
Sample Dv50 DvlOl
(pm) Dv90
DvSO/ Dp50
RG102OC18, 1 2 3 4 5 6 2 (repeat)
19.98 1.63 1.19 20.44 1.56 1.20 20.60 1.56 1.14 20.55 1.56 1.19 20.57 1.56 1.16 20.53 1.55 1.18 20.49 1.57 1.19 20.55 1.56 1.16
5 0 10 20 30 40 cl
Parlicls dhmetsr. &I m
Virgin. material J
ii * 0 10 20 30 40 !J
Perticlc dhmeter. pm
Fig. 8. Particle size distribution of samples of the stationary phase. Results obtained with a Coulter counter. Bottom curve, original material. Samples: 1 = column inlet, center; 2 = column inlet, wall; 3 =column middle, center; 4 = column middle, wall; 5 = column outlet, wall; 6= column outlet, center. (a) Differential volume distribution, (b) dif- ferential number distribution.
volume distributions of all the samples are identical within the limits of errors, and the difference from the distribution in the virgin material is barely significant. The number dis- tributions are slightly different, with a two to three time increase in the number of small particles (below 5 pm) which seems to have very limited consequences. Furthermore, the data reported here are not in agreement with the results previously reported by Marme et al. [13]. Our results suggest on the contrary that there is no migration of the fine particles downstream the column to any significant degree, even after 100 h of aging and a comparable amount of time devoted to various measurements. If anything, there is slightly more fine particles at the en- trance of the column (samples 1, 2) than at the exit (samples 5, 6) but the difference is compar- able to the error of measurement.
3.4. Effect of radial compression on efficiency
A set of experiments were done at constant flow-rate (200 ml/min) and with various values of the compression pressure to study the possible effect of the compression pressure on the column efficiency. A small sample containing acetone and phenol was injected at each compression pressure. Fig. 9 shows the plot of the reduced plate height versus the compression pressure for the second and the third columns. There is only a moderate effect of the compression pressure on the efficiency of either columns. Although the efficiency of the second column was poor from the beginning (see Table 2), there does not seem to be any significant changes at elevated com- pression pressures. Paradoxically, the HETP of the third column increases slowly with increasing compression pressure, while we have shown above that the packing becomes denser, more compact, and presumably more homogeneous. Marme et al. [13] claimed that they had iden- tified low-density regions in the packing of their columns. These regions seem to correspond to those still uncompressed during the process of progressively compressing their column. If they exist, their relative importance is expected to

M. Sarker, G. Guiochon I J. Chromatogr. A 683 (1994) 293-309
RadLl Compression (285~~)
Fig. 9. Effect of the radial compression pressure on the efficiency of the second and third radial columns (17.5 x 7.5 cm). Eluent methanol-water (4060). Sample: 1.5 ml of acetone (0) and phenol (0) in the eluent. Second radial column (upper data points); flow-rate 200 mUmin. Third radial column (lower data points with fitted line); flow-rate 142 ml/min.
decrease with increasing compression pressure, causing a decrease in the column HETP. This effect does not take place in our experiments. However, as explained above, the packing den- sity of a radially compressed column cannot be entirely homogeneous. This lack of homogen- eity, however, does not seem to affect much the efficiency.
3.5. Effect of temperature on the efficiency
Because of the huge thermal mass of the column and the compression chamber, and of the additional influence of the thermal insulation provided by the compression liquid and the
305
plastic wall of the cartridge, the column tempera- ture remains highly constant in a temperature- controlled laboratory. It is nearly impossible to control the temperature of the packing in a radial compression column, nor even the tem- perature of the column wall itself. Accordingly, no efforts were made to change the column temperature. The only possibility of changing simply the operation temperature is to control the temperature of the mobile phase pumped into the column.
Experiments were carried out to study the possible influence of the eluent temperature if it is different from the initial column temperature, a situation which may occur in practice, either willfully or accidentally. A 2-l bottle of eluent was placed in a temperature-controlled water bath. The bottle content was stirred constantly. The solvent was pumped from the bottle, through the column, and back to the bottle, in closed circuit. At all temperatures different from ambient, there was a slight temperature differ- ence between the solvent in the bottle and the solvent eluting from the column. This difference was minimized by letting the column equilibrate for a long period of time and maintaining a flow-rate of 200 ml/min. When thermal equilib- rium was reached (i.e. the solvent temperatures in the bottle and at the column exit were con- stant), a sample of acetone and phenol was injected, and the column efficiency measured.
The results are reported in Fig. 10, as a plot of the reduced plate height versus the average of the solvent temperatures in the bottle and at the column exit. The effect observed is rather small, may be because the column efficiency is poor (h = 12) under the selected experimental con- ditions (high u) and it is unexpected. The column HETP is minimum at room temperature (ca. 22°C). When the mobile phase and the column wall temperatures are different, a thermal flux takes place, and a radial temperature gradient forms inside the column. The mobile phase viscosity is different along the wall and at the center. The radial thermal flux explains also the temperature difference between the solvent in the bottle and at column exit. As a consequence, the viscosity varies along the column. The vis-

306 M. Sarker, G. Guiochon I J. Chromatogr. A 683 (1994) 293-309
s
9
E .P
I” 8’3
%
E 0 3
UZ
d
0
0
0
0
0 0
00 0
0 0
0 O
Fig. 10. Effect of the eluent temperature on the efficiency of the second radial column. Eluent: methanol-water (4050, v/v). Sample: 1.5 ml of a solution of 4% acetone (0) and 4 g/l phenol (0) dissolved in the eluent. Constant flow-rate 200 mllmin. Temperature shown in figure is the average of the temperatures at the inlet and outlet of the column.
cosity gradient causes a mobile phase velocity gradient between the center and the wall, and the isoconcentration surfaces of the sample bands, which should be flat and perpendicular to the column axis, become warped.
This effect increases with increasing tempera- ture difference between column wall and mobile phase. The end result is difficult to predict, however, as we have shown above that the compression stress also is not constant along the column nor along the column radius either. Thus, we superimpose a mobile phase viscosity gradient and a packing density gradient which, both, have probably an approximately cylindrical symmetry. The combination of their effects can- not be predicted at this stage. It could result in
an improvement, a degradation, or an insig- nificant change of the column performance.
It is difficult, however, to explain why the curve is not nearly symmetrical around ambient temperature, and why the HETP goes through a maximum around 30°C and tends to decrease beyond this temperature. Experiments could not be done at temperatures below 15°C. It does not seem that the decrease in HETP observed at temperatures higher than 30°C could be related to the increase in the diffusion coefficient with increasing temperature, a relatively minor effect [28]. - -
3.6. Channel formation and repair by applying radial compression
Channel formation can take place inside large- diameter columns. A set of experiments were done to test the feasibility of the application of an elevated radial compression pressure to repair these channels. Biotage has demonstrated pub- licly that if a cartridge was dropped several times from a sufficient height, its efficiency decreased dramatically, but that this efficiency could be restored by applying a higher radial compression pressure. However, no evidence was produced for the presence of channels in the column. We found that it is easy to destroy the column efficiency by running the eluent for several minutes without applying any radial compression pressure. This could be expected since when the mobile phase flows through the column there is an axial pressure gradient. The mobile phase under pressure at the column inlet tends to expand the cartridge wall, fragmenting the packed bed in the process. We performed two sets of similar experiments with the first and the second cartridges.
Fig. 11 shows chromatograms which demon- strate the presence of channels in the degraded column and their repair by applying a high radial compression pressure. This figure was obtained for the second column, at a flow-rate of 206 ml/min. The five chromatograms were obtained for increasing values of the radial compression pressure, from 0 to 27.6 bar. The y-axis gives the detector response (UV absorbance). The con-
M. Sarker, G. Guiochon I J. Chromatogr. A 683 (1994) 293-309 307
2 4 6
Time (mi”n) IO 12 14
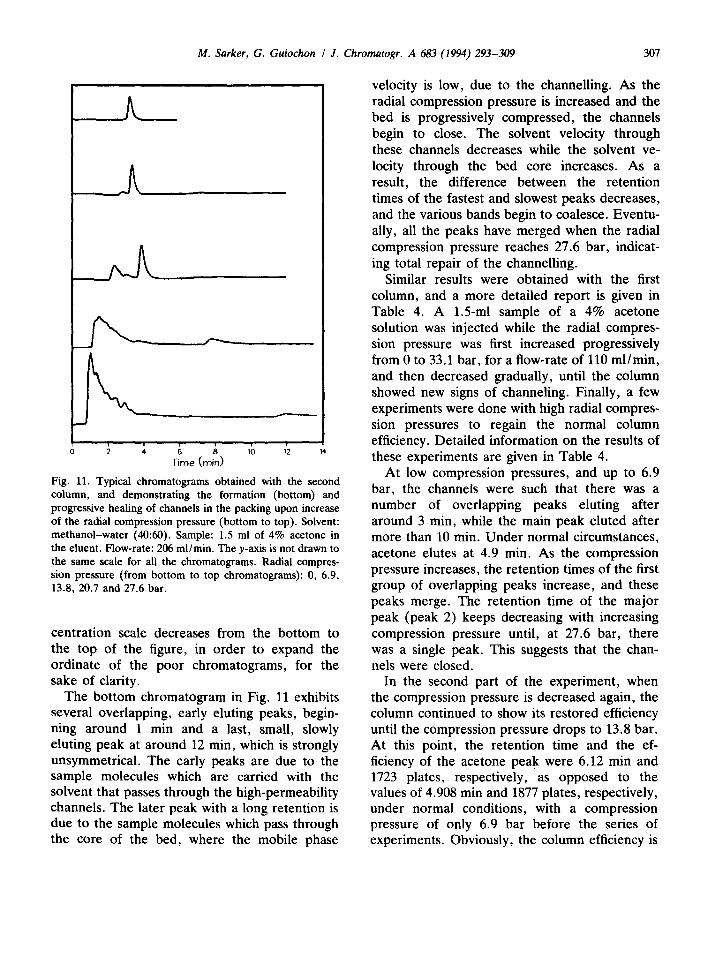
Fig. 11. Typical chromatograms obtained with the second column, and demonstrating the formation (bottom) and progressive healing of channels in the packing upon increase of the radial compression pressure (bottom to top). Solvent: methanol-water (40:60). Sample: 1.5 ml of 4% acetone in the eluent. Flow-rate: 206 mUmin. The y-axis is not drawn to the same scale for all the chromatograms. Radial compres- sion pressure (from bottom to top chromatograms): 0, 6.9, 13.8, 20.7 and 27.6 bar.
centration scale decreases from the bottom to the top of the figure, in order to expand the ordinate of the poor chromatograms, for the sake of clarity.
The bottom chromatogram in Fig. 11 exhibits several overlapping, early eluting peaks, begin- ning around 1 min and a last, small, slowly eluting peak at around 12 min, which is strongly unsymmetrical. The early peaks are due to the sample molecules which are carried with the solvent that passes through the high-permeability channels. The later peak with a long retention is due to the sample molecules which pass through the core of the bed, where the mobile phase
velocity is low, due to the channelling. As the radial compression pressure is increased and the bed is progressively compressed, the channels begin to close. The solvent velocity through these channels decreases while the solvent ve- locity through the bed core increases. As a result, the difference between the retention times of the fastest and slowest peaks decreases, and the various bands begin to coalesce. Eventu- ally, all the peaks have merged when the radial compression pressure reaches 27.6 bar, indicat- ing total repair of the channelling.
Similar results were obtained with the first column, and a more detailed report is given in Table 4. A 1.5-ml sample of a 4% acetone solution was injected while the radial compres- sion pressure was first increased progressively from 0 to 33.1 bar, for a flow-rate of 110 ml/min, and then decreased gradually, until the column showed new signs of channeling. Finally, a few experiments were done with high radial compres- sion pressures to regain the normal column efficiency. Detailed information on the results of these experiments are given in Table 4.
At low compression pressures, and up to 6.9 bar, the channels were such that there was a number of overlapping peaks eluting after around 3 min, while the main peak eluted after more than 10 min. Under normal circumstances, acetone elutes at 4.9 min. As the compression pressure increases, the retention times of the first group of overlapping peaks increase, and these peaks merge. The retention time of the major peak (peak 2) keeps decreasing with increasing compression pressure until, at 27.6 bar, there was a single peak. This suggests that the chan- nels were closed.
In the second part of the experiment, when the compression pressure is decreased again, the column continued to show its restored efficiency until the compression pressure drops to 13.8 bar. At this point, the retention time and the ef- ficiency of the acetone peak were 6.12 min and 1723 plates, respectively, as opposed to the values of 4.908 min and 1877 plates, respectively, under normal conditions, with a compression pressure of only 6.9 bar before the series of experiments. Obviously, the column efficiency is

308 M. Sarker, G. Guiochon I J. Chromtiogr. A 683 (1994) 293-309
Table 4 Packing repair by radial compression
Bar No. of major peaks
t, (min)
Peak 1 Peak 2
Efficiency Peak 2
Inference
6.9 1 0 2 4.1 2 5.5 2 6.9 2 8.3 2
10.3 2 12.4 2 13.8 2
13.8 2 20.7 2
27.6 1 33.1 1 27.6 1 24.1 1 20.7 1 17.2 1 13.8‘ 1 10.3 2 13.8 2 27.6 1 22.8 1
1.88 2.61 2.68 3.07 3.33 2.69 4.32 4.96
5.18 5.19
5.50 5.36
4.908
> 12 > 10 10.35 9.28 8.06 7.03 7.00
6.51 6.28
6.03 5.92 5.97 6.02 6.01 6.06 6.12 6.24 6.22 5.95 5.93
1877
- - - 976 1695 1658
1871 17404
1573 1519 1524 1605 1638 1720 1723 1927 1997 1591 1545
NormaI operation Multiple overlapping peaks in the first peak Same as above Same as above Same as above Same as above 2nd peak larger than the first peak Intensity of 2nd peak larger than 1st peak 2nd peak 5 times larger than first; column left overnight at 13.8 bar 2nd peak 7 times larger than first 2nd peak 12 times larger than the first; average of two injections Average of three injections Average of three injections Average of three injections Average of three injections Average of two injections Average of three injections Average of three injections Average of three injections 2nd peak 16 times larger than the first
Column left overnight at 27.6 bar but compression decreased to 22.8 bar
completely destroyed by dropping too low the compression pressure, It can be restored to a large extent by applying again a high compres- sion pressure. Note that at 10.3 bar (bottom of Table 4) the column efficiency is high although it still has some channels as indicated by the presence of a second peak.
4. Conclusions
The radial compression technology achieves its goal of offering stable columns with reasonable, reliable efficiency. After several hundred hours of continuous operation, including a number of stressful concentration gradients of the mobile phase composition, the efficiency of the columns did not exhibit any significant changes (Table 2), nor did the stationary phase characteristics.
Applying a high radial compression pressure can be used to restore the performance of a badly damaged column, suffering from an acute case of channelling. However, radial compression does not improve significantly the efficiency of good columns. The availability of columns made to order by a specialist is an advantage of the current implementation of this dynamic compres- sion technology. On the other hand, a possible source of loss of efficiency under long term operation arises from the practical impossibility to wash and clean the column inlet and outlet frits without replacing the whole cartridge. These disks are presumably clean on a new cartridge but they are crimped in the cartridge and cannot be replaced by the user.
The study of the influence of the eluent temperature on the column efficiency should be pursued further. It is doubtful, however, that it

M. Sarker, G. Guiochon I J. Chromatogr. A 683 (1994) 293-309 309
will lead to another conclusion than pointing out the need to keep the column temperature con- stant and pump into the column an eluent which is at the same temperature as the column wall. We are of the opinion, however, that the most important problems to study in the near future are those related to the porosity and the per- meability of columns, in connection with dy- namic compression technologies, and those in- volved in the scaling-up of the process, when chromatographic, thermodynamic, kinetic, and hydrodynamic data acquired on analytical size columns are used to predict the behavior of large size preparative columns. Work is in progress along these directions and results will be re- ported in the near future.
Acknowledgements
This work has been supported in part by Grant CHE-9201662 of the National Science Founda- tion and by the cooperative agreement between the University of Tennessee and the Oak Ridge National Laboratory. We acknowledge the long- term, free loan by Biotage, Inc. (Charlottesville, VA, USA) of the Model Kiloprep 100 pump, the Model Kiloprep 100 radial compression module and the Linear Scientific UV detector, and the gift of the column cartridges. We thank The PQ Corporation (Conshohocken, PA, USA) for the generous gift of 5 kg of IMPAQ RG1020C18 and the loan of a Linear Scientific UV detector. We appreciate the measurements of the particle size distributions of samples taken from the second cartridge, made by Neil Miller.
We are grateful to Kevin Holland (Biotage), Neil Miller (The PQ Corporation), Klaus Lohse (BTR Separations) and A.M. Katti (Mallinck- rodt Specialty Chemicals, St. Louis, MO, USA) for insightful discussions.
References
[l] J. Chromatogr. ,Vols. 484 (1989), 556 (1991), 557 (1991) and 590 (1992).
(21 J.H. Knox and H.M. Pyper, J. Chromatogr., 363 (1986) 1.
[3] G. Guiochon, S. Golshan-Shiraxi and A.M. Katti, Fundamentals of Preparative and Non-Linear Chroma- tography, Academic Press, Boston, MA, 1994.
[4] L.R. Snyder, J.W. Dolan, D.E. Antle and G.B. Cox, Chromatographia, 24 (1987) 24.
[5] J.E. Eble, R.L. Grob and L.R. Snyder, J. Chromatogr., 405 (1987) 1.
161
I71
PI
[91
[lOI WI
WI 1131
u41
P51
WI
1171
WI
1191
PO1
WI
P21
i231
[241 [251
PI
[271
PI
L.R.. Snyder, J.W. Dolan and G.B. Cox, J. Chroma- togr., 484 (1989) 437. S. Golshan-Shiraxi and G. Guiochon, Anal. Chem., 61 (1989) 1368. S. Golshan-Shirazi and G. Guiochon, J. Chromatogr., 517 (1990) 229. A. Felinger and G. Guiochon, Biotechnol. Bioeng., 41 (1993) 134. J.C. Giddings, J. Chromatogr. Sci., 1 (1963) 11. R.M. Nicoud and M. Perrut, in G. Ganetsos and P.E. Barker (Editors), Preparative and Production Scale Chromatography, Marcel Dekker, New York, 1992, p. 47. M. Kaminski, J. Chromatogr., 589 (1992) 61. S. Marme, M. Hallmann, K.K. Unger, E. Baumeister, K. Albert and E. Bayer, in M. Perrut (Editor), PREP’92, SociCtC Fransaise de Chimie, Paris, 1992, p. 135. J.G. Atwood, G.J. Schmidt and W. Slavin, J. Chroma- togr., 171 (1979) 109. D.R. Absolom and R.A. Barford, Anal. Chem., 60 (1988) 210. E. Godbille and P. Devaux, J. Chromatogr., 122 (1976) 317. J.N. Little, R.L. Cotter, J.A. Prendergast and P.D. McDonald, J. Chromatogr., 126 (1976) 439. H. Colin, P. Hilaireau and J. de Tournemire, LC. CC, 8(4) (1990). M. Sarker and G. Guiochon, J. Chromatogr. A, sub- mitted for publication. P.D. McDonald, R.V. Vivilecchia and D.R. Lorenz, US Pat., 4 211 658 (1980). C.W. Rausch, Y. Tuvin and U.D. Neue, US Pat., 4 228 007 (1980). P.D. McDonald and C.W. Rausch, US Pat., 4 250 035 (1981). M. Verzele, M. de Coninck, J. Vindevogel and C. Dewaele, J. Chromatogr., 450 (1988) 47. C.R. Wilke and P. Chang, AZChE J., 1 (1955) 264. J.J. Van Deemter, F.J. Zuiderweg and A. Klinkenberg, Chem. Eng. Sci., 5 (1956) 271. R.B. Bird, W.E. Stewart and E.N. Lightfoot, Transport Phenomena, Wiley, New York, 1960. D.W. Taylor, Fundamentals of Soil Mechanics, Wiley, New York, 1948. H. Colin, J.C. Diez-Masa, T. Czaychowska, I. Miedziak and G. Guiochon, J. Chromatogr., 167 (1978) 41.
Copyright © 2022 FDOKUMEN