Study of the ATLAS MDT spectrometer using high energy CERN combined test beam data
42
Study of the ATLAS MDT Spectrometer using High Energy CERN combined Test beam Data C. Adorisio f , G. Aielli k , Th. Alexopoulos r , M. Alviggi h , C. Amelung b , Ch. Anastopoulos ah , G. Avolio f ,5 , R. Avramidou m,5 , K. Bachas ah , P. Bagnaia j , R. Ball m , M. Barisonzi o , A. Baroncelli ‘ , M. Barone c , F. Bauer v,1 , M. Bellomo i , Y. Benhammou z , J. Bensinger a , M. Beretta c , R.M. Bianchi ‘,6 , M. Bianco g , C. Bini j , G. Bobbink o , A. Borisov u , H. Boterenbrood o , I. Boyko d , P. Branchini ‘ , E. Brambilla g , G. Brandenburg ad , U. Bratzler aa , S. Bressler y , G. Brouwer o , M. Cambiaghi i , V. Canale h , M. Caprio h , R. Cardarelli k , F. Cerutti b,7 , J. W. Chapman m , G. Chelkov d , L. Chevalier v , G. Chiodini g , M. Cirilli b,9 , R. Coco af , M. Curatolo c , T. Dai m , R. De Asmundis h , D. Dedovich d , M. Della Pietra h , D. Della Volpe h , G. DeZorzi j , A. Di Ciaccio k , A. DiDomenico j , S. Di Luise ‘ , A. Di Simone k , M. Dris r , A. Dushkin a , J. Ernwein v , B. Esposito c , E. Etzion z , R. Fakhrutdinov u , S. Falciano j , D. Fassouliotis s , R. Ferrari i , A. Formica v , C.Fukunaga aa , G. Gaudio i , Ev. Gazis r , P.-F. Giraud v , E. Gorini g , F. Grancagnolo g , J. A. Gregory m , H. Groenstege o , J. Guimaraes da Costa ad , C. Guyot v , A. Harel y , R. Hart o , K. Hashemi a , S. Hassani v , G. Herten ac , S. Horvat n , P. Hurst ad , R. Ichimiya q , P. Iengo h , M. Ikeno p , P. Ioannou s , M. Iodice ‘ , M. Ishino e , H. Iwasaki p , Y. Kataoka e , A. Khodinov ag , A. Konig ai , O. Kortner n , S. Kotov n , C. Kourkoumelis s , A. Kozhin u , A. Krepouri ah , H. Kroha n , Z. Krumshteyn d , H. Kurashige q , U. Landgraf ac , F. Lacava j , E. Lan¸ con v , A. Lanza i , J.-F. Laporte v , D. Lellouch ab , D. S. Levin m , L. Levinson ab , B. Liberti k , R. Lifshitz y , F. Linde o , C. Luci j , N. Lupu y , G. Maccarrone c , T. Maeno b , K. Mair b , S. Maltezos r , A. Manz n , M. Marchesotti b,11 , 2 April 2008 ATL-MUON-PUB-2008-005 08 April 2008
Transcript of Study of the ATLAS MDT spectrometer using high energy CERN combined test beam data

Study of the ATLAS MDT Spectrometer
using High Energy CERN combined Test
beam Data
C. Adorisio f, G. Aielli k, Th. Alexopoulos r, M. Alviggi h,
C. Amelung b, Ch. Anastopoulos ah, G. Avolio f,5,R. Avramidou m,5, K. Bachas ah, P. Bagnaia j, R. Ball m,M. Barisonzi o, A. Baroncelli `, M. Barone c, F. Bauer v,1,
M. Bellomo i, Y. Benhammou z, J. Bensinger a, M. Beretta c,R.M. Bianchi `,6, M. Bianco g, C. Bini j, G. Bobbink o,
A. Borisov u, H. Boterenbrood o, I. Boyko d, P. Branchini `,E. Brambilla g, G. Brandenburg ad, U. Bratzler aa, S. Bressler y,
G. Brouwer o, M. Cambiaghi i, V. Canale h, M. Caprio h,R. Cardarelli k, F. Cerutti b,7, J. W. Chapman m, G. Chelkov d,
L. Chevalier v, G. Chiodini g, M. Cirilli b,9, R. Coco af,
M. Curatolo c, T. Dai m, R. De Asmundis h, D. Dedovich d,M. Della Pietra h, D. Della Volpe h, G. DeZorzi j,
A. Di Ciaccio k, A. DiDomenico j, S. Di Luise `, A. Di Simone k,M. Dris r, A. Dushkin a, J. Ernwein v, B. Esposito c, E. Etzion z,
R. Fakhrutdinov u, S. Falciano j, D. Fassouliotis s, R. Ferrari i,A. Formica v, C.Fukunaga aa, G. Gaudio i, Ev. Gazis r,
P.-F. Giraud v, E. Gorini g, F. Grancagnolo g, J. A. Gregory m,H. Groenstege o, J. Guimaraes da Costa ad, C. Guyot v,
A. Harel y, R. Hart o, K. Hashemi a, S. Hassani v, G. Herten ac,
S. Horvat n, P. Hurst ad, R. Ichimiya q, P. Iengo h, M. Ikeno p,P. Ioannou s, M. Iodice `, M. Ishino e, H. Iwasaki p, Y. Kataoka e,
A. Khodinov ag, A. Konig ai, O. Kortner n, S. Kotov n,C. Kourkoumelis s, A. Kozhin u, A. Krepouri ah, H. Kroha n,
Z. Krumshteyn d, H. Kurashige q, U. Landgraf ac, F. Lacava j,E. Lancon v, A. Lanza i, J.-F. Laporte v, D. Lellouch ab,
D. S. Levin m, L. Levinson ab, B. Liberti k, R. Lifshitz y,F. Linde o, C. Luci j, N. Lupu y, G. Maccarrone c, T. Maeno b,
K. Mair b, S. Maltezos r, A. Manz n, M. Marchesotti b,11,
2 April 2008
AT
L-M
UO
N-P
UB
-200
8-00
508
Apr
il 20
08

E. Meoni f , G. Mikenberg ab, W. Mohr ac, S. Mohrdieck-Moeck n,K. Nagano p, R. Nicolaidou v,2, K. Nikolaev d, K. Nikolopoulos s,
A. Nisati j, H. Nomoto e, J. Oliver ad, D. Orestano `,L. S. Osborne af , A. Ouraou v, S. Palestini b, E. Pasqualucci j,
A. Passeri `, F. Pastore j, S. Patricelli h, R. Perrino g,Ch. Petridou ah, F. Petrucci `,3, S. Podkladkin g, A. Policicchio f,
D. Pomarede v, P. Ponsot v, L. Pontecorvo j, M. Primavera g,D. Rebuzzi i,10, R. Richter n, A. Rimoldi i, S. Rosati b,4,8,
J. Rothberg w, H. Sakamoto e, D. Salvatore f, D. Sampsonidis ah,R. Santonico k, O. Sasaki p, A. Schricker a, S. Schuh b,P. Schune v, M. Shoa ab, N. Skvorodnev a, K. Sliwa x,
E. Solfaroli Camillocci k,8, S. Spagnolo g, L. Spogli `,E. Strauss ag, Y. Sugaya t, S. Tanaka p, S. Tarem y,
F. E. Taylor af, S. Todorova x, I. Trigger b,12, I. Tsiafis ah,G. Tsipolitis r, Ch. Valderanis ah, P. Valente j, W. Vandelli i,5,
H. van der Graaf o, R. Vari j, S. Veneziano j, A. Ventura g,S. Ventura c, J. Vermeulen o, S. Vlachos r, M. Vreeswijk o,
Y. Yasu p, H. Wellenstein a, P. Werneke o, T. Wijnen ai,M. Wolter x, J. Wotschack b, M. Woudstra ae, F. Zema f,5,
Z. Zhao m, A. Zhemchugov d, B. Zhou m, S. Zimmerman ac
aBrandeis University, Mailstop 057, 415 South Street, Waltham, MA 02454, USAbCERN, CH-1211 Geneve 23, Switzerland
cINFN Laboratori Nazionali di Frascati, via Fermi, 40, I-00044, Frascati, ItalydJoint Inst. for Nuclear Research (JINR), 141980, Dubna, Moscow Region, RussiaeICEPP, University of Tokyo, 7-3-1 Hongo, Bunkyo-ku, Tokyo 113-8654, JapanfUniversita della Calabria and INFN, Cosenza, p. Bucci, I-87036 Arcavacata di
Rende (Cosenza), ItalygUniversita del Salento and INFN, Lecce, via Arnesano, 73100 Lecce, Italy
hUniversita di Napoli ”Federico II” and INFN, Napoli, via Cintia, I-80126,Napoli, Italy
iUniversita di Pavia and INFN, Pavia, via Bassi, 6, I-27100, Pavia, ItalyjUniversita di Roma La Sapienza and INFN, Roma, p.le Moro 2, I-00185, Roma,
ItalykUniversita di Roma Tor Vergata and INFN, Roma 2, v. Ricerca Scientifica 1,
I-00133, Roma, Italy
2

`Universita di Roma Tre and INFN, Roma Tre, via della Vasca Navale, 84,I-00146, Roma, Italy
mMichigan University, Ann Arbor, MI 48109, USAnMax-Planck-Institut fur Physik, Fohringer Ring 6, 80805 Munchen, GermanyoNikhef National Institute for Subatomic Physics, and University of Amsterdam,
Kruislaan 409, P.O. Box 41882, NL-1009 DB Amsterdam, The NetherlandspHigh Energy Accelerator Res. Organ. (KEK), 1-1 Oho, Tsukuba, Ibaraki
305-0801 JapanqKobe University, 1-1 Rokkodai-cho, Nada-ku, Kobe 657-8501 Japan
rNational Technical University Athens, Zografou Campus, GR-157, 80 Zografou,Greece
sUniversity of Athens, 15701 Ilissia, Greece
tResearch Center for Nuclear Physics, Osaka University, Osaka, JapanuInstitute for High Energy Physics (IHEP), Pobeda str. 1, 142281, Protvino,
Moscow Region, RussiavDapnia, CEA - Saclay, F-91191 Gif sur Yvette Cedex, France
wUniversity of Washington, 3910 15th Ave. NE, Seattle, WA 98195-1560, USAxTufts University, Medford, MA 02155, USA
yTechnion - Israel Institute of Technology, Haifa 32000, IsraelzTel Aviv University, P.O. Box 39040, Tel Aviv 69978, Israel
aaTokyo Metropolitan University, 1-1 Minami-Osawa, Hachioji-shi Tokyo,192-0397 Japan
abWeizmann Institute of Science, P.O. Box 26, Rehovot 76100, Israel
acUniversity of Freiburg, Fakultat fur Physik, Hermann-Herder-Str. 3, 79104Freiburg i. Br., Germany
adHarvard University, LPPC, 18 Hammond Street Cambridge, MA 02138, USAaeUniv. of Massachusetts, Department of Physics 1126 Lederle Graduate Research
Tower (LGRT) Amherst, MA 01003-9337 USAafMassachusetts Institute of Technology, LNS, 77 Massachusetts Avenue,
Cambridge, MA 02139-4307, USAagPhysics and Astronomy, SUNY, Stony Brook, NY 11794-3800, USAahDepartment of Physics, Aristotle University of Thessaloniki, 54124,
Thessaloniki, GreeceaiRadboud University Nijmegen/Nikhef, Dept. of Exp. High Energy Physics,
Toernooiveld 1, NL - 6525 ED Nijmegen , The Netherlands
3

Abstract
In 2004, a combined system test was performed in the H8 beam line at the CERNSPS with a setup reproducing the geometry of sectors of the ATLAS Muon Spec-trometer, formed by three stations of Monitored Drift Tubes (MDT). The full AT-LAS analysis chain was used to obtain the results presented in this paper. Thebasic design performances of the Muon Spectrometer were verified. The stability ofMDT calibration constants, the alignment system using optical devices and highenergy tracks, as well as the intrinsic sagitta resolution of the Muon Spectrometerwere studied and found to agree with expectations. The reconstruction of muontracks using the combined information from both the Inner Detector and the MuonSpectrometer are also presented.
1 Corresponding author. E-mail address : [email protected] Corresponding author. E-mail address : [email protected] Corresponding author. E-mail address : [email protected] Corresponding author. E-mail address : [email protected] Now at CERN, CH-1211 Geneve 23, Switzerland6 Now at University of Freiburg, Fakultat fur Physik, Hermann-Herder-Str. 3, 79104Freiburg i. Br., Germany7 Now at INFN Laboratori Nazionali di Frascati, via Fermi, 40, I-00044, Frascati,Italy8 Now at Universita di Roma La Sapienza and INFN, Roma, p.le Moro 2, I-00185,Roma, Italy9 Now at Michigan University, Ann Arbor, MI 48109, USA10 Now at Max-Planck-Institut fur Physik, Fohringer Ring 6, 80805 Munchen, Ger-many11 Now at Universita di Pavia and INFN, Pavia, via Bassi, 6, I-27100, Pavia, Italy12 Now at TRIUMF, 4004 Wesbrook Mall, Vancouver, BC, V6T 2A3 Canada.
4

1 Introduction
The Muon Spectrometer [1] of the ATLAS detector was designed to pro-vide a stand-alone trigger for muons with transverse momentum of severalGeV/c as well as a measurement of final state muons with a momentum reso-lution of about 3% over most of the momentum range. Tracking in the MuonSpectrometer is based on the magnetic deflection of muon tracks in large su-perconducting air-core toroid magnets. Over the range |η| ≤ 1.0, magneticbending is provided by the large barrel toroid which provides a field integral∫
Bdl between 2 and 6 Tm. For 1.4 ≤ |η| ≤ 2.7 muon tracks are bent bytwo smaller end-cap toroid magnets contributing between 4 and 8 Tm. Thebending in the region 1.0 ≤ |η| ≤ 1.4, usually referred to as the transitionregion, is provided by a combination of barrel and end-cap fields.
The Muon Spectrometer is a 4π detector, which consists of four detec-tor technologies. Over most of the spectrometer acceptance, Monitored DriftTube (MDT) chambers are used for the precision measurement of muon trackswith Cathode Strip chambers (CSC) deployed in the high rapidity region(2.0 ≤ |η| ≤ 2.7) of the first detection layer of each end-cap. The MDTs aremade of gas filled aluminum tubes with a central wire and measure chargedparticle tracks with an average spatial resolution of 80 µm. Resistive PlateChambers (RPC) provide the trigger for muons in the barrel region, whereasThin Gap Chambers (TGC) serve the same purpose in the higher backgroundregion of the end-cap. The signals from the trigger chambers are digitized onthe detector and sent to ASIC-based coincidence matrix boards. These boardsperform the functions needed for the trigger algorithms and apply pT cutsaccording to preset thresholds. The trigger chambers are also used to providethe coordinate along the drift tubes (the second coordinate), which is notmeasured by MDT chambers.
The determination of the muon momentum is based on the measurementof three points along the track of the particle deflected in the magnetic field.Each of the three stations 13 in the muon system provides one measurementpoint along the track. It is convenient to express the curvature in terms of thesagitta, which is the distance from the point measured in the middle stationto the straight line connecting the points in the inner and outer stations. Theprecision of the sagitta measurement is a direct measure of the precision ofthe muon momentum.
A muon of momentum 1 TeV/c has a sagitta of about 500 µm in the bar-
13 An ATLAS muon station is made of 6 to 8 layer of Monitored Drift Tubes (MDT)for precision measurements, which in addition can be equipped with trigger cham-bers: Resistive Plate Chambers (RPC) in the barrel, Thin Gap Chambers (TGC)in the end-cap. The MDTs (and CSCs) provide a number of hits reconstructed asa segment.
5

rel. The target momentum measurement precision of ∆pT /pT = 10% requiresa sagitta precision of 50 µm. The actual precision depends not only on thelocal precision of the points measured in the muon chambers, but also on therelative positions of the three stations. These positions need therefore to beknown with an accuracy that is comparable to the individual chamber pointmeasurement precision. The total contribution of the chamber point measure-ments to the sagitta precision should be less than 40 µm. Permanently activealignment systems are needed to continuously monitor the chamber positionsand deformations with the needed accuracy.
The reconstruction of muon tracks is also affected by the accuracy of therelation between drift times and impact radii in the tubes (r(t) in the follow-ing). A 30 µm uncertainty in the knowledge of this relation combined withan average single-wire resolution of 80 µm has an effect on the momentumresolution for η ≤ 1.4 (the barrel region) which varies between 1% and 10%for muon momenta in the range 100 to 1000 GeV/c. For η > 1.4 (the end-capregion) the effect on momentum resolution varies between 1% and 6% for thesame muon momenta range.
A large test stand of ATLAS detectors, including all the Muon Spectrom-eter components was operated at CERN in the H8 beam line from 2000 to2004. A detailed description of the system test performed at the H8 beamline during 2003 can be found in [2]. The setup exposed to the beam repre-sented about 1 % of the ATLAS detector including two sectors of the MuonSpectrometer for both the barrel and the end-cap, Inner Tracking detectors[3], modules of the hadronic calorimeter [4] and of the electromagnetic Liq-uid Argon calorimeter [5]. Large samples of events were collected with variousoperating conditions and layouts. Data were taken either independently withthe various subdetectors (non-combined runs) or using the same trigger andDAQ (combined runs). A particle beam of momentum up to 350 GeV/c fromthe SPS accelerator was used to study various aspects of the spectrometer. Inthis paper the performance of the muon system and its components during the2004 H8 test period is reported. The results are based on tools and analysisthat are reported in detail in the following references [6],[7],[8],[9] and [10].
2 The experimental setup
The setup of the 2004 ATLAS System Test consists of four parts: the InnerDetector, the Calorimeters, the Muon Detectors and the beam line elements.In the Combined Test Beam (CTB), the Inner Detector consisted of three lay-ers of silicon pixel modules, four layers of two silicon strip detectors (SCT) andtwo wedges of the straw drift tube detector (TRT). The Liquid Argon (LAr)electromagnetic calorimeter module and the hadronic calorimeter (TileCal)modules were both placed on a table which could be rotated and translated
6
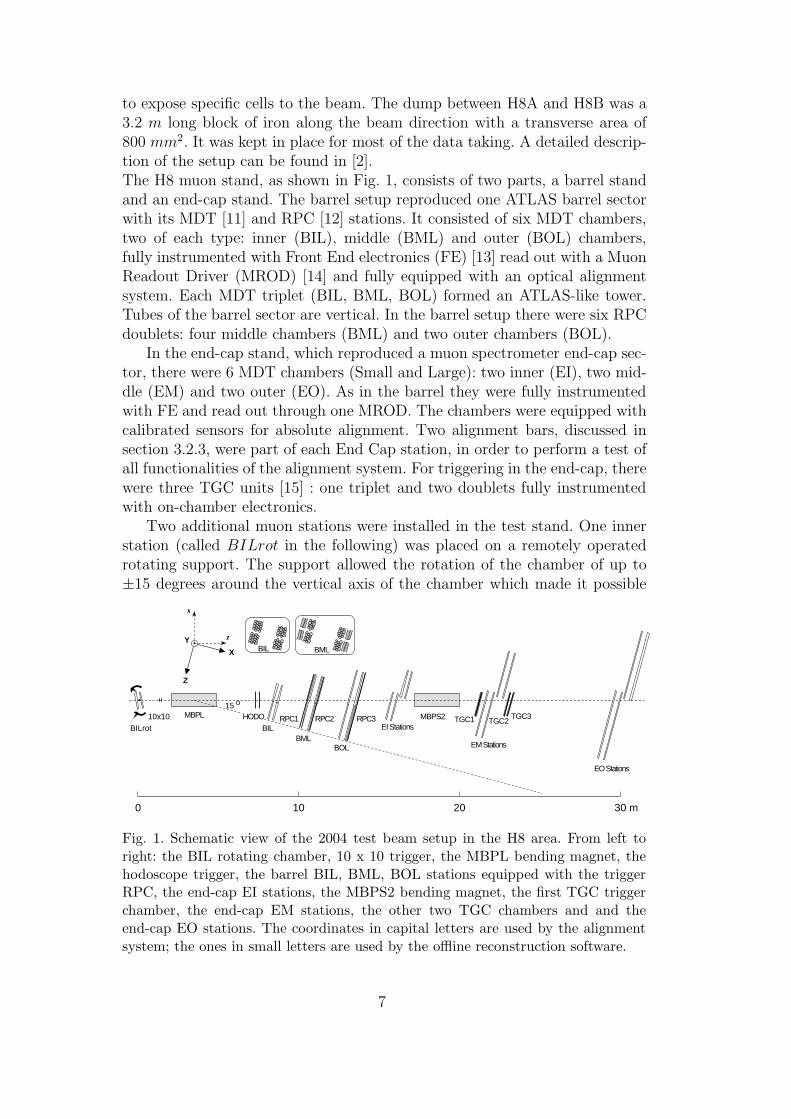
to expose specific cells to the beam. The dump between H8A and H8B was a3.2 m long block of iron along the beam direction with a transverse area of800 mm2. It was kept in place for most of the data taking. A detailed descrip-tion of the setup can be found in [2].The H8 muon stand, as shown in Fig. 1, consists of two parts, a barrel standand an end-cap stand. The barrel setup reproduced one ATLAS barrel sectorwith its MDT [11] and RPC [12] stations. It consisted of six MDT chambers,two of each type: inner (BIL), middle (BML) and outer (BOL) chambers,fully instrumented with Front End electronics (FE) [13] read out with a MuonReadout Driver (MROD) [14] and fully equipped with an optical alignmentsystem. Each MDT triplet (BIL, BML, BOL) formed an ATLAS-like tower.Tubes of the barrel sector are vertical. In the barrel setup there were six RPCdoublets: four middle chambers (BML) and two outer chambers (BOL).
In the end-cap stand, which reproduced a muon spectrometer end-cap sec-tor, there were 6 MDT chambers (Small and Large): two inner (EI), two mid-dle (EM) and two outer (EO). As in the barrel they were fully instrumentedwith FE and read out through one MROD. The chambers were equipped withcalibrated sensors for absolute alignment. Two alignment bars, discussed insection 3.2.3, were part of each End Cap station, in order to perform a test ofall functionalities of the alignment system. For triggering in the end-cap, therewere three TGC units [15] : one triplet and two doublets fully instrumentedwith on-chamber electronics.
Two additional muon stations were installed in the test stand. One innerstation (called BILrot in the following) was placed on a remotely operatedrotating support. The support allowed the rotation of the chamber of up to±15 degrees around the vertical axis of the chamber which made it possible
10x10 HODO
BILBML
BOL
RPC2RPC1 RPC3MBPL
EI Stations
EM Stations
EO Stations
TGC1 TGC2TGC3
15 o
Z
X
YBIL BML
0 10 20 30 m
BILrot
x
z
MBPS2
Fig. 1. Schematic view of the 2004 test beam setup in the H8 area. From left toright: the BIL rotating chamber, 10 x 10 trigger, the MBPL bending magnet, thehodoscope trigger, the barrel BIL, BML, BOL stations equipped with the triggerRPC, the end-cap EI stations, the MBPS2 bending magnet, the first TGC triggerchamber, the end-cap EM stations, the other two TGC chambers and and theend-cap EO stations. The coordinates in capital letters are used by the alignmentsystem; the ones in small letters are used by the offline reconstruction software.
7

to enlarge the angular range of muon tracks for the calculation of the spaceversus time relation (r(t) in the following). One inner station (BIS) was placedin front of the Liquid Argon Calorimeter to measure accurately the particletrajectory at the entrance of the calorimeter, in order to study in detail theresponse of the calorimeter for different impact points within the electrodestructure.
Three bending magnets, namely MBPSID, MBPL, and MBPS2, were usedduring different periods. Both the pixel and the SCT detectors were locatedinside the magnetic field of the MBPSID magnet not shown in Fig. 1, whereasthe TRT was installed outside the magnet. The orientation of the field washorizontal to deflect particles vertically, a geometry which emulates the layoutin ATLAS. The MBPL magnet was installed in front of the muon barrel standand was used to bend tracks horizontally, in the plane perpendicular to theMDT tubes, in order to move the beam spot over the muon chambers, emu-lating tracks of different polar angle, and allowing a more complete validationof the system. This magnet was operated with various currents and both po-larities. Finally, the MBPS2 magnet was installed between the EI and the EMstations of the end-cap muon stand for muon momentum measurements.
Two coordinate systems are used throughout this paper and are identifiedby capital and small letters as shown in Fig. 1. In the first one (used by thealignment system), the X-axis is along the H8-beam, the Z-axis is horizontaland the Y-axis is vertical to form an orthogonal reference frame. In the sec-ond one (used by the offline reconstruction software), the z-axis is along theH8-beam and the x-axis is horizontal. The origins of the systems (perigee) areon the axis of the H8 beam-line, at the entrance surface of the Inner Detectormagnet (MBPSID). It was chosen as similar as possible to the ATLAS refer-ence system for the barrel stand.
Two trigger systems were available: a small area trigger given by the coin-cidence of two (10 x 10) cm2 scintillators centered on the beam line and a largearea trigger of (60 x 100) cm2, called hodoscope trigger, given by the coinci-dence of the signals from two planes of six scintillator slabs of (10 x 100) cm2
each and the small area trigger in negative logic.The monitoring of the parameters of the detectors working conditions was
realised via the Detector Control System (DCS) [16]. This included the set-tings of the programmable parameters of the front-end electronics and themonitoring of the environmental parameters. The discriminator threshold wasset between 34 and 52 mV in different runs. The nominal discriminator thresh-old of 40 mV corresponded to about 16 primary electrons. In particular thetemperature of each chamber was measured at regular time intervals at severallocations by means of temperature probes. The measurements were recordedin the Conditions Data Base.
The MDT gas mixture was the nominal [17] Ar(93%) and CO2(7%) at3 bar absolute pressure. The gas gain was set to 2 · 104.
8

3 Data analysis
Data samples corresponding to different operating conditions were takenwith the muon system only (non-combined runs) during summer 2004, andlater during fall together with the Tile and LAr calorimeters (combined runs).In the runs taken with the (10 x 10) cm2 trigger, the beam spot illuminatesthree tubes and was observed to be stable, from summer to fall, within ap-proximately one tube width. For some runs, a scan of beam momentum wasperformed between 100 and 250 GeV/c, by varying the settings of the H8beam-line. These nominal values refer to the beam momentum at the H8 en-trance, before the calorimeters and the beam dump. Alignment studies relatedto controlled movements of the MDT chambers were performed with runs fromboth data taking periods. The data from summer were used for testing thealignment with tracks and for determining the efficiency of MDTs for variousbeam momenta and signal thresholds. The effect of placing material in frontof a barrel MDT was studied with the fall data.
3.1 Calibration procedures
A sequence of calibrations have to be performed to reconstruct tracks fromraw MDT data (i.e. tube identifiers and TDC information). The first step isthe determination of the t0 for each tube defined as the drift time associated toa particle crossing the tube at a distance r=0 from the wire and representinga relative delay between different channels. This value has to be subtractedfrom the time measurements. t0 is computed using a fit procedure to thedrift time distributions which yields also other parameters of the drift timedistribution such as the maximum drift time t1. This first procedure does notrequire any track reconstruction. Drift times are expressed in units of TDCcounts, one TDC count corresponding to 25 ns/32 = 0.78125 ns. The drifttime distribution of each MDT tube is fitted with an analytic function whichconsists of two distinct Fermi Dirac functions describing the leading edge, thetrailing edge and an exponential function for the central part. The analyticexpression of the function is given below:
f(t) = p1 +p2
(
1 + p3e−
t−p5
p4
)
(
1 + e−
t−p5
p7
) (
1 + et−p6
p8
) (1)
The parameter p1 is the uncorrelated (assumed flat) background, p2, p3 andp4 describe the shape of the central part of the distribution, p5 is an estimateof t0 of that given tube, p6 is the maximum drift time, p7 and p8 describe theleading and trailing edges. As an example, a typical drift-time distribution and
9

P1P2
P4
P5 P6
P7 P8
P3
P1+
P2(
1+P
3)
TDC counts (0.78 ns)
Fig. 2. Typical drift time distribution at nominal operatingconditions. The fitted Classic t0 function described in thetext is also shown.
the corresponding fit is shown in Fig. 2. p5 does not correspond to the startof the physical drift time window but it is close to the half height position ofthe leading edge and is thus significantly shifted to later times with respectto the start of the physical drift time window. However, as all drift times arerelated to this value, determined for each tube, the systematic shift will bereabsorbed in the definition of the r(t) relation.
The leading edge slope and p5 are observed to be correlated. This observa-tion suggests that the start of the MDT drift distribution is better identifiedby a combination of the two parameters. The use of Monte Carlo generatedsamples shows that the optimal combination is t0 = p5 − 1.5× p7. This defini-tion will be used in the rest of the paper. The algorithm gives a resolution of0.75 TDC counts for samples of 5k events and 0.25 TDC counts for samplesof 50k events.
A procedure similar to that used to find the best t0 indicator has beenused to study the measurement of the drift spectrum length tmax. The FermiDirac function which describes the trailing edge of the drift time spectrum ischaracterized by a p6 value and by a trailing edge slope p8. As in the previouscase the drift spectrum length tmax, defined to be t1 − t0, has been studied
10

and found to reach the minimum spread for a value of the correction factorwhich is equal to 1.2. A resolution of 1.9 and 1.0 TDC counts is observed forsample sizes of 5k and 50k events, respectively.
The drift time distribution depends on a number of environmental param-eters like pressure, temperature, B field, gas composition. At H8 there was noB field inside the MDT chambers, the pressure was expected to be stable, thetemperature was continuously monitored. The effects of temperature variationare studied in this paper.
Once the drift time has been computed, it is converted into a drift radiusassuming an r(t) relation. This relation is determined by an iterative pro-cedure, autocalibration, that minimizes the space residuals in a straight linefit to the drift circles of a candidate track. The procedure starts with a trialr(t) relation to convert the drift time measurements into drift radii that areused in the track fit. The mean value of the residuals, as a function of r, arethen used to obtain the first-order correction to the r(t) relation. After a fewiterations the minimization procedure converges to a stable solution. As anestimator of the stability of the solutions the mean square correction, definedas ∆2
k =∑
j(d2kj)/N , is used. In this expression (d2
kj) is the mean value of theresiduals in the time bin j for the kth iteration and N is the number of bins. Agood solution corresponds to a value of ∆ below 20 microns. The mean valueof the distribution of the residuals and the number of iterations are figures ofmerit in evaluating the overall performance of a chamber. All the calibrationanalysis presented in this work was performed using the Calib program [18].
Comparison between data and the result of the simulation packageGARFIELD [19], that describes in details the response of gaz ionization de-tectors, are discussed in section 4.1.
3.2 Alignment procedures
3.2.1 Alignment devices
The ATLAS muon alignment system [20] is based on optoelectronic sensorsthat measure the positions and the deformations of the MDT chambers. Inaddition, temperature sensors are used to correlate chamber expansions withtemperature. In the barrel part, the optical sensors are placed on the chambersto directly determine their alignment. In the end-cap, chambers are alignedrelative to a set of aluminum bars [21] whose positions and deformations aremonitored by optical and temperature sensors.
Two different optical systems are used in the ATLAS alignment: RASNIKsand BCAMs/SaCams. Both systems are based on the principle of a three-point straightness monitor: an optoelectronic image sensor (CCD or CMOS)monitors the position of an illuminated target through a lens. The sensorimage is analysed online and converted into four parameters characterising
11

the deviation from the nominal geometry: two translations perpendicular tothe optical axis, the rotation around and the longitudinal position along theaxis, the latter being derived from the optical magnification.
In the RASNIK [22] system, an image sensor monitors through a lens anilluminated target carrying a chessboard-like pattern imprinted on a mask. Fora symmetric RASNIK with the lens halfway between image sensor and mask,a transverse resolution of 1 µm and a magnification resolution of 2 × 10⁻⁵
have been obtained.The BCAM [24] is a camera consisting of a CCD image sensor which
monitors the position of a laser diode through a lens. The BCAM housingalso contains a set of two or four laser diodes which can be used as targetsby another BCAM. BCAMs are mostly used in pairs, facing each other. Theimage sensor is placed close to the focal plane of the lens (76 mm), while thetarget with the laser diodes is placed at a distance of 0.5 m to 16 m. Theimage of a laser diode on the CCD appears as a circular spot.
BCAMs achieve a relative resolution of 5 µrad for a target distance of16 m. If the target consists of two or more laser diodes with a known separation,relative angles can be extracted, which yield magnification and rotation aroundthe optical axis. If BCAM’s are used in pairs, the absolute angular position ofthe partner can be determined with 50 µrad accuracy.
Like the BCAM, the SaCam [23] consists of a camera with an image sensorand a lens at fixed distance. The target consists of four back-illuminated holes,covered by a light diffuser. The lens is mounted at distances ranging from25 mm to 80 mm, depending on the distance between image sensor and target.A relative resolution of 5 µrad has been achieved with the SaCam, a resultsimilar to that of the BCAM.
3.2.2 Barrel alignment setup
The corner stone of the barrel alignment system are optical lines called theprojective lines, pointing toward the interaction point and connecting the threelayers of BIL, BML and BOL chambers. The used technology is the RASNIKsystem, where the mask is placed on BIL, the lens on BML and the imagesensor on BOL chambers. In ATLAS, the 6 MDT towers of one half sectorwill be typically equipped with 8 projective lines. In H8 the 2 MDT towerswere equipped with 8 projective line, leading to an overconstrained systemwhich permits to better study systematic effects.
Besides the projective system, other systems used in ATLAS were studied.These systems are: (1) the inplane system, which monitors deformation ofthe mechanical structure supporting the multilayer, (2) the axial and praxialsystem which permits to monitor the translation/orientation of 2 adjacentchambers in one layer, (3) the reference system which permits to monitor theposition of the chambers relative to a reference system connected to the coilsof the barrel toroid. In H8, the reference system was mounted on a stable
12

external structure.
3.2.3 End-cap alignment setup
The alignment strategy used in the barrel would require many projectivelines of sight traversing the closed vessel of the end-cap toroidal magnets,which turned out to be impossible. The solution that was adopted is a gridof optically connected alignment bars which are used as precision referencerulers. The bars are equipped with internal RASNIKs and temperature sen-sors to determine their deviations from the initial shape (measured prior toinstallation with a long range 3D coordinate measuring machine). The spatialrelationship between the bars is established by a network of BCAMs on thebars, each measuring the bearing angle of laser diodes on BCAMs on otherbars. The chambers in turn are referenced to the alignment grid using theproximity system, where cameras on chambers view RASNIK masks on barsor other chambers, and laser sources on chambers are viewed by BCAMs onbars.
The end-cap setup in H8 corresponds to one octant of an ATLAS end-cap,consisting of six alignment bars and six chambers (two bars and two chambersin each station, EI, EM and EO), and a complete set of alignment sensors.
3.2.4 Alignment software
Two geometry reconstruction software have been developed, called ASAP 14
[25] for the Barrel and ARAMyS 15 [26] for the end-cap. The aim of these 2packages is to convert the optical sensor measurements into MDT positions, ro-tations and internal deformations, using standard fitting methods. The mainfeature of both software packages is their precise description of the opticalelements within the barrel or End-cap detector, taking into account all theindividual sensor calibration constants which have previously been measuredin the laboratories.
Using the same parameters provided by the online image analysis, twoalignment modes are implemented, relative and absolute. In the relative mode,the current positions of the MDT chambers are calculated with respect to ini-tial positions - the reference geometry - previously measured by other means,e.g. with straight tracks. In the more ambitious absolute alignment, the po-sitions of the chambers are estimated using only the current measurements.This mode requires an accurate calibration of the geometry of all alignmentcomponents.
The resulting data is stored in the Conditions Database for later use bythe muon tracking software packages. Both alignment procedures are internal
14 ASAP: Atlas Spectrometer Alignment Program15 AlignmentReconstruction and Simulation for the Atlas Myon Spectrometer
13

to either the barrel or the end-cap part of the Muon Spectrometer; in both theH8 setup and in ATLAS no optical link exists between the Muon Spectrometerand other detectors. Particle tracks will be used for aligning, e.g., the InnerDetector and the Muon Spectrometer.
3.3 Data analysis programs
A prototype of the full ATLAS software chain was tested to analyze thedata collected in the H8 test-beam. The event reconstruction was performedwithin the ATLAS offline reconstruction framework ATHENA [27]. The in-puts of the muon reconstruction package are the calibration constants, thealignment corrections, and the magnetic field map. In this framework, thevarious inputs needed to run the reconstruction packages, are stored in aConditions Data Base and are fed to the packages through dedicated ATHENAservices. During the H8 beam test, the Conditions Data Base was opera-tional only for the alignment corrections.
• The calibration constants (t0 and r(t) relation) needed to make the trans-formation from time to radius for each MDT hit were produced for differentconfigurations of H8 test-beam data; they were written to ASCII files andfed to the reconstruction packages through a dedicated ATHENA service.
• The alignment data, taken asynchronous to the test-beam data every 15 min-utes, were written into the Conditions Data Base and provided the inputsto the alignment reconstruction packages (ASAP and ARAMyS) which wereoperated outside ATHENA. Using this information, the alignment packagescalculated the difference between the nominal detector geometry (providedby the ATLAS muon system data base AMDB ) and the actual geometry.The results were written back into the Conditions Data Base. A dedicatedalignment ATHENA service was retrieving the result of the alignment fromthe Conditions Data Base to feed it to the reconstruction packages.
• Finally for the magnetic field response a dedicated ATHENA service pro-vided the map of the magnetic field at every point in space.
Muonboy is the track pattern recognition program used in the ATHENAframework for most of the analysis presented in this paper. The pattern recog-nition strategy in Muonboy is to proceed sequentially through the followingsteps:
• Identification of regions of activity (ROAs), guided by trigger chamber in-formation
• Reconstruction of local straight track segments in each muon station be-longing to a ROA
14

• Combination of track segments from different muon stations, to form muoncandidate tracks
• Global re-fit of muon track candidates using individual hit information.
Details concerning the algorithm can be found in [1]. The command parame-ters of Muonboy can be set to produce straight track segments only, or theycan be set to provide fully reconstructed tracks by performing a full fit, whichincludes the effects of material traversed. Straight track segments were usedin this paper for the alignment studies and for the MDT efficiency analysis,whereas fully reconstructed tracks were used to perform tracking analysis.
The analysis of MDT sagitta resolution described in section 6.2 and 6.3 hasbeen performed using the reconstruction algorithm MOORE in the ATHENAframework. A detailed description of the MOORE algorithm can be found in[28]. The pattern recognition and track reconstruction steps in MOORE canbe summarized as follows:
• Track patterns are built in the x-y plane of the ATLAS reference system,starting from RPC/TGC strips measuring φ;
• Track segments in the r-z plane are built from hits in the MDT detectorsand combined to φ patterns to build roads of hits; the r-z MDT segmentsare fitted;
• A track is fitted out of each road found in the event, and accepted if the fitis successful.
3.4 Determination of the intrinsic MDT sagitta resolution
The measured sagitta resolution depends not only on the intrinsic chamberresolution and alignment but also on multiple scattering. A momentum scanis thus needed to disentangle the two contributions. The method is describedhere. The rotating BIL chamber measures the angle (ϑRotBIL) between thez−axis and the muon track upstream of the MBPL magnet (see Fig.1). Thebarrel chambers measure the same angle for the deflected track downstreamof the magnet (ϑbarrel). The track is computed as the line that connects thetwo super-points associated with the track segments separately in the BILand BOL chambers, where the super-point is calculated as the crossing pointof the track segment, reconstructed through a linear fit of the chamber hits,at the center of the chamber. Using the difference between these two angles(∆ϑB) the beam momentum is calculated through the formula:
p (GeV/c) =0.3BL (Tm)
∆ϑB (rad)(2)
where BL is the bending power of the magnetic field, which is known as afunction of the magnet current. As for a given run, the actual orientation of the
15
rotating BIL chamber and the barrel chambers is not known, the measurementof the deflections ∆ϑB as in (2) has to be repeated with the magnetic fieldswitched off (∆ϑ0). The final formula is then:
p (GeV/c) =0.3BL (Tm)
(∆ϑB − ∆ϑ0) (rad)(3)
The measurement of the momenta cannot be performed in the same way as inATLAS, since in the H8 setup the tracks crossing the chambers are straightlines. With this method the muon momentum has been measured using theMuon Spectrometer chambers for the first time.
4 Study of MDT calibration constants
A detailed report on the analysis of MDT calibration constants using testbeam data can be found in [6]. While tmax has a well known and significanttemperature and gas composition dependence, t0 is expected to be almosttemperature independent but sensitive to the electronics threshold settings.The effect of the variation of these environmental parameters on t0 and tmax
will be studied in sections 4.1 and 4.2 respectively.
4.1 t0 Systematics
The most illuminated tube of each layer of each chamber was used to studythe time stability of t0. The three barrel chambers and three end-cap cham-bers give a total of 40 layers. Trace plots of these tubes are observed to bemore scattered in summer than in fall runs due to a significant difference inthe average run length. The t0 distribution for each tube and separately forthe summer and for the fall, has been constructed and fitted with a Gaussdistribution to quantify the stability of the measured t0 values. The fitted rmswidth has been taken to be a good indication of the stability of tubes. Thewidth of t0 fall data taking period is seen to cluster around a value of about 0.5TDC counts (0.4 ns) dispersion. The spread of t0 observed during the summerdata taking period is larger than in the fall by a factor of about 2 and is againfully understood as being due to a difference in statistics. In particular the t0average spread observed in the summer and in the fall agrees well with thecalculation described in section 3.1 for an average run length of 5k and 10kevents, respectively.The distribution of the difference of the average t0 value between summer andfall is shown in Fig. 3. The distribution has been fitted with a Gaussian withan average value of 0.85 TDC counts (0.66 ns) and a rms width of 0.30 TDC
16

0
2.5
5
7.5
10
12.5
15
17.5
20
22.5
-4 -2 0 2 4 6 8 10 12 14
0.2871 / 1Constant 20.54 4.036Mean 0.8513 0.4883E-01Sigma 0.3029 0.3450E-01
t0summer-t0fall (TDC counts)
Ent
ries
Fig. 3. Distribution of t0 variation between summer and fall.
counts (0.23 ns). This effect has also been studied using GARFIELD [19]. Thepredicted shift for a temperature difference of 5oC was found to be 0.6 ± 0.1TDC counts (∼ 0.47 ± 0.08 ns), in qualitative agreement with experimentalfindings. A variation of about +5◦C between summer and fall induces an in-crease of the drift spectrum length (p6 - p5) which may result in a change ofthe correlation between p5 and p7. As a counter-proof no significant shift inthe t0 is observed (both in the data and in the simulation) if only the first partof the distribution is fitted using the function of Eq. 1. The observed temper-ature variation of about 5◦C between summer and fall induces a reduction ofthe gas density in a regime of constant pressure which accounts for this effect.At small radii this causes a reduction of the ionization density and thus anincrease of the time until the signal crosses the threshold, i.e. t0. At large radiithe reduction of the gas density causes an increase of the drift velocity and acorresponding reduction of the length of the drift time distribution.
The MDT readout electronics has an adjustable discriminator thresholdvalue which affects the value of t0. Data taken at different thresholds havebeen used to study the variation of t0 at different electronics thresholds. Sincemost data were taken at a threshold value of 40 mV, chosen as the standardworking point of MDT chambers, the difference tthreshold
0 − t40mV0 , expected
to be the same for all chambers, was chosen to quantify the variation of t0with threshold. The same sample of well populated tubes in different cham-
17

-1.5
-1
-0.5
0
0.5
1
1.5
2
2.5
30 32.5 35 37.5 40 42.5 45 47.5 50
Data
GARFIELD
threshold (mV)
t 0(40
mV
) -
t 0(th
resh
old)
(T
DC
)
Fig. 4. Variation of t0 as a function of threshold.
bers used in the analysis of stability of single t0’s has also been used to studytthreshold0 − t40mV
0 . Fig. 4 shows t40mV0 − tthreshold
0 with respect to tthreshold0 in
the range between 34 and 48 mV for the rotating BIL chamber. Stars wereobtained using GARFIELD at 30, 35 and 45 mV. The agreement betweendata and simulation is good. As expected the slope of the variation is nega-tive and amounts to about 0.13 ns/mV. The same quantity computed usingGARFIELD gives a value of 0.15 ns/mV, in good agreement with data.
4.2 tmax temperature systematics.
While t0 is known to have very little temperature dependence, tmax is ex-pected to have a significant dependence on temperature. Due to the non neg-ligible systematic temperature difference among the different chambers thecomparison of the length of the drift time distribution tmax of different cham-bers was studied as a function of the chamber temperature. The correlationplot between tmax and temperature is shown in Fig. 5 for the BIL chamber.The GARFIELD simulation was used to compute tmax for a temperature of27◦ C and for three different CO2 fractions of the MDT gas and not con-sidering the presence of other contaminants in the mixture. The point at thenominal gas composition is observed to disagree with data while a good agree-ment is observed for a gas composition of about Ar:CO2 of 93.5:6.5. It has tobe observed that while the gas composition is believed to be stable in time,
18

820
840
860
880
900
920
940
22 23 24 25 26 27 28
Temperature(°C)
t max
(TD
C c
ount
s)
BIL
92.5
93
93.5
H8-2004 data
Garfield simulation
Fig. 5. Observed drift spectrum length temperature dependence for theBIL chamber. GARFIELD simulated points at 27◦ C and for differentgas compositions are also shown.
the absolute gas mixture, as produced by the gas system is not accuratelyknown. However, the disagreement can be also explained by the presence ofother contaminants as discussed below.
The correlation plot between tmax and temperature for different chamberswas then fitted with a straight line defined as tmax = (T-24◦ C) · slope + t24
◦
max CThe average value of the distribution of the slope and of t24
◦
max for the differentchambers has a mean value -(2.5±0.1) ns/◦C and of 673.9±0.5 ns respectively.The spread of the two distributions is of 0.4±0.1 ns/◦C and of 2.0±0.4 ns, re-spectively. The spread of t24
◦
max is non negligible and can attributed to differentgas properties in the different chambers as discussed in section 4.3.
4.3 Study of r(t) relation.
The r(t) relation depends on pressure, temperature and gas composition.The gas distribution system of the H8 setup was made of a single gas mixerwhich supplies all the chambers. Thus the gas composition (Ar/CO2 percent-age) is assumed to be the same for all chambers while a difference in gascontamination (air or water vapor) and in pressure can occur because of leaksin any gas connection. The only directly measured parameter is the tempera-ture which changes with time and, at the same time, for the different chambersbecause of the different positions. A mean temperature difference of the orderof 5◦C is observed between summer and fall while a difference of the order of
19

-0.1-0.05
00.05
0.1
0 200 400 600
time (TDC counts)
δr (
mm
)-0.1
-0.050
0.050.1
0 200 400 600
time (TDC counts)
-0.1-0.05
00.05
0.1
0 200 400 600
time (TDC counts)
δr (
mm
)
-0.1-0.05
00.05
0.1
0 200 400 600
time (TDC counts)
-0.1-0.05
00.05
0.1
0 200 400 600
time (TDC counts)
δr (
mm
)
-0.1-0.05
00.05
0.1
0 200 400 600
time (TDC counts)
Fig. 6. Temperature effects as measured in the summer as obtained usingBILrot data for different temperature variations
2◦C is measured between the coldest and the warmest chamber at the sametime.
The effect of temperature variation on the r(t) has already been studied inlaboratory tests [29] and presented as difference between two r(t)s as measuredat two different temperatures T0 and T . The difference has been observed tovary with the drift time and in particular for a positive temperature differenceit is lower than zero for small drift times (lower than approximately 100 TDCcounts) and smoothly rising for larger drift times up to a value which proved toscale linearly with the temperature differences as 25 µm/◦C. In Fig. 6 the r(t)difference as measured in different pairs of runs is shown. These variations,δr(t), can be parametrized with the function:
δr(t) =(
T0 + ∆ T
T0
− 1)
[
r(t) − t ·dr(t)
dt
]
(4)
where T0 is the reference absolute temperature, ∆T = T−T0 is the temper-ature difference, the r(t) function is the one at the reference temperature andthe time derivative of the r(t) function is computed with a fit with Chebytchevpolynomials to the r(t) function at the reference temperature. To check thisparametrization, the parameter ∆T has been determined with a fit to δr(t)
20

Measured T (oC)
Fitte
d T
(o C
)
18
20
22
24
26
28
18 20 22 24 26 28
Fig. 7. Correlation plot between temperature as measured with probesand as derived from the variation of the r(t) relation in BILrot data.
-0.05-0.04-0.03-0.02-0.01
00.010.020.030.040.05
100 200 300 400 500 600
Residuals in Barrel Chambers
Barrel ChambersBarrel ChambersBarrel ChambersBarrel Chambers time (tdc counts)
resi
dual
s (m
m)
BOLBMLBIL
Barrel ChambersBarrel ChambersBarrel ChambersBarrel Chambers time (tdc counts)
resi
dual
s (m
m)
BOLBMLBIL
-0.05-0.04-0.03-0.02-0.01
00.010.020.030.040.05
100 200 300 400 500 600
Fig. 8. Residuals versus time for barrel chambers and for two differentruns as obtained using a temperature corrected r(t) relation extrapolatedfrom BILrot
and compared with the measured temperature changes. This correlation plotas obtained using runs with a 40 mV threshold, with the BILrot in rotationby more than 6 degrees and with a number of events larger than 20k, is shown
21

in Fig. 7. It has to be underlined that the set of runs with a temperaturelower than 22◦C refers to the fall period while the others to the summer time.The line shown in the figure is the bisector line. The good agreement betweenfitted and measured temperature values over a period of many months indi-cates the stability of the r(t) over time once corrected for temperature effectsusing equation (4). The r(t) computed in the rotating BIL can be used forreconstruction in the other chambers as well once corrected for temperaturevariation. This leads to good average residuals (of less than 20 µm) only if thegas properties of the chamber under study are close to those of the rotatingBIL itself.
The temperature correction can be checked, for example, looking at thevalue of t24
◦
max introduced in the previous section. Fig. 8 shows the average resid-uals of barrel chambers as a function of time as obtained using a temperaturecorrected r(t) relation extrapolated from BILrot. The two parts of the figurerefer to two different runs. Solid line histograms of each part refer to BILand BML chambers while full points refer to BOL chamber. In both runs thepattern is the same: while the residuals of inner chambers are within 20 µmat all times (and normally less than 10 µm) the BOL chamber shows averageresiduals that are significantly larger than for the other two chambers. The dif-ference in residuals observed in different chambers can be correlated to the factthat the average tmax value of BOL is 4 TDC counts larger than the average ofBIL and BML chambers. Furthermore the tmax rms value of BIL and BMLchambers of 0.70 TDC counts indicates that the difference is statistically sig-nificant. The observed change ∆tmax is expected to induce residuals at a timet of the order ≈ ∆tmax/tmax × vd(t) in good agreement with findings. Thisfinding suggests a slightly different gas composition in the different chambers.In [30] the effect of the presence of water, Nitrogen, Oxygen, Methane in thestandard MDT gas mixture has been studied. While water is shown to inducea variation ∆tmax in the tmax value like ∆tmax = .066 ns / (ppm of water),the other contaminants have a negligible effect. The observed difference ofthe tmax value between BOL and BIL and BML chambers may then be at-tributed to the presence of ≈ 50 (ppm of water) due to the permeability ofthe plastic gas pipes, the tube O-rings and endplugs to water.
5 Study of MDT chamber alignment
The large amount of data provided by the alignment system of both thebarrel and the end-cap muon stand during the 2004 test-beam period has beenanalysed. Results are presented in this section.
22

-0.24
-0.22
-0.2
-0.18
-0.16
-0.14
-0.12
-0.1
-0.08
-0.06
20 22 24 26 28 30
Sagi
tta (
mm
)
Temperature (0C)
0.46
0.48
0.5
0.52
0.54
0.56
0.58
0.6
0.62
0.64
20 22 24 26 28 30
Fig. 9. Left (right) plot: sagitta variations as a function of temperature in thebarrel before (after) applying the relative alignment corrections
5.1 Monitoring MDT alignment with optical sensors
The continuous monitoring of chamber distortions and shifts of chamberspositions was done with alignment data. The variations of the relative positionsof the chambers are mostly due to the daily temperature variations withina chamber itself and are reflected in the change of the mean value of thesagitta distribution. The sagitta was calculated separately in the barrel andthe end-cap stands by considering straight track segments. Quality criteriawere applied to reconstructed tracks: only one segment per chamber with atmost one missing hit. Therefore accepted segments had at least 7 associatedhits in the BIL/EIL chambers made of 2 x 4 layers of tubes and 5 hits in theBML, BOL/EML, EOL chambers made of 2 x 3 layers.
5.1.1 Temperature effects
Day/night temperature variations induce large variations of the sagitta ofreconstructed muon tracks in the end-cap stand, which covers a period of oneweek. Before applying alignment corrections, variations of the order of several
23
Sagitta(mm)
Ent
ries
0
2
4
6
8
10
12
14
16
0.1 0.125 0.15 0.175 0.2 0.225 0.25 0.275 0.3 0.325 0.35
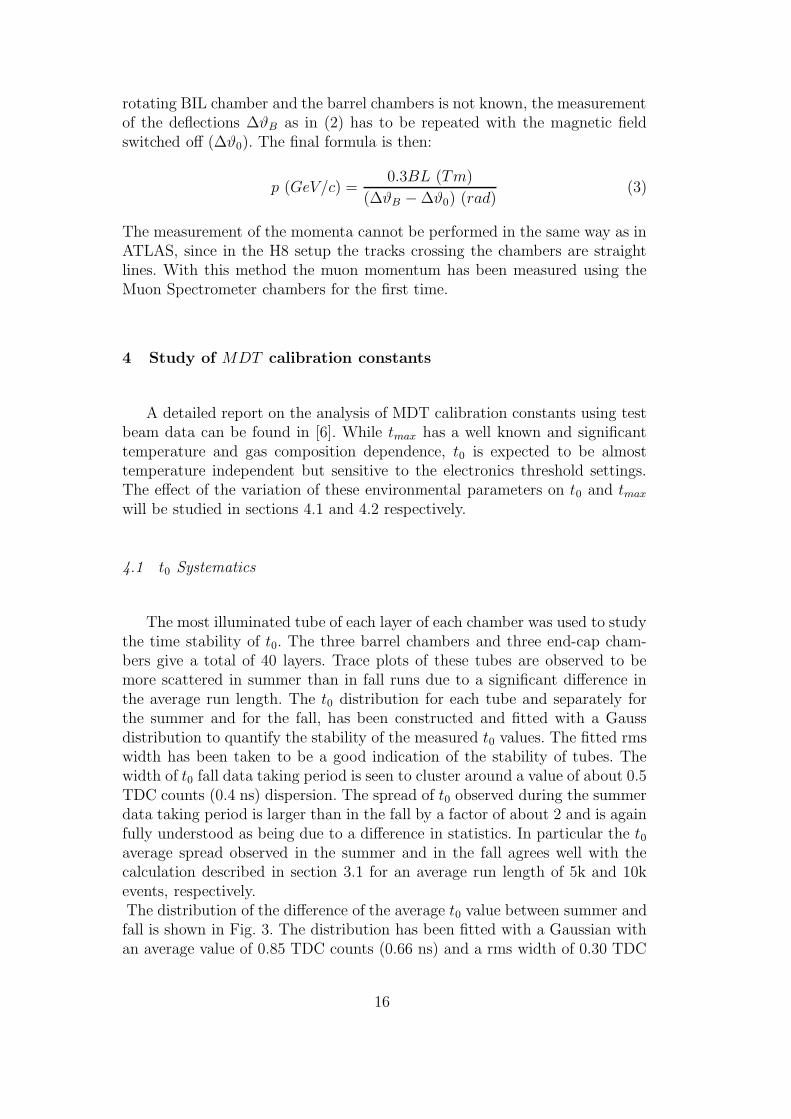
Fig. 10. Mean values of the sagitta in the end-cap, calculated after applyingthe alignment corrections, for various runs recorded during a one week period.Note that the definition of the sign of the sagitta in this plot is the oppositeof what was used in a previous analysis [2].
hundred microns are seen.In the barrel muon stand the sagitta distribution for events taken over
a period of one month is shown in Fig. 9 as a function of the temperature,before (left plot) and after (right plot) applying the alignment corrections.In the barrel stand, the temperature variations explain most of the sagittavariations. Furthermore, the mean values of the sagitta distribution in thebarrel muon stand are stable within a few microns over this one month period.
The distribution of mean values of the sagitta distribution in the end-cap,calculated after applying the alignment corrections, is shown in Fig. 10 for aperiod of one week. The stability of the results is reflected in the rms dispersionof this distribution (19 µm) which is well within specifications.
5.1.2 Controlled movements of barrel MDT chambers
Several runs were recorded to check the response of the alignment systemto controlled movements of all barrel MDT chambers in conditions close tothe dynamical range of the optical alignment sensors. Translations were in thehorizontal Z direction and rotations around the vertical Y axis, parallel tothe tubes. Table 1 summarizes the range of these movements. Both alignmentmodes, relative and absolute, were tested by studying the distributions of the
24

Period Chamber Translation Rotation
not combined BIL 0 to 20 mm -8 to +8 mrad
combined BIL 0 to 4.5 mm -3 to +2 mrad
BML 0 to 4 mm -3 to +3 mrad
BOL 0 to 6 mm -2 to 0 mrad
Table 1Range of barrel MDT movements during the 2004 test beam period.
track sagitta. In July 2004, three runs with barrel chamber movements weretaken and data were recorded with a hodoscope triggered beam of pions. Thesagitta residuals have a dispersion of 78 µm after absolute alignment correc-tions and 14 µm in the relative alignment mode. In the November 2004 testbeam period, 18 runs were recorded with controlled movements (translationsand rotations) of all barrel MDT chambers. This time, a muon beam wasused and the trigger was (10 x 10) cm2. Data from some of these runs werediscarded as several optical sensors were either out of range or did not workproperly. Results are shown in Fig. 11: before the alignment corrections areapplied, the mean value of the sagitta varies by several millimeters reflectingMDT chamber movements. After alignment corrections are applied, all sagittadistributions are centered at the same mean value around zero, as expected.The sagitta residuals have a dispersion of 18 µm in the relative alignmentmode. In the absolute mode, the mean value of the sagitta is ∼ 350 µm whichindicates that final calibrations of the optical sensors are needed to improvethe alignment performance.
This study shows that the geometrical range of operation of the alignmentsensors is adequate for accommodating several mm of misplacements of themuon chambers, which is the accuracy achieved when installing some ”diffi-cult” chambers in ATLAS. Using the alignment corrections delivered by thesystem, muons can be reconstructed with the required accuracy.
5.2 Results on alignment with tracks
An essential part of the alignment is to find the initial geometry. Thisserves as a reference which is extrapolated to any later time using the opticalsystem in relative mode. A survey may be used for this, but it lacks the neces-sary precision and it cannot be performed for the entire ATLAS spectrometer.Therefore the initial geometry needs to be determined with tracks. The H8test beam data were used to check the feasibility of this method.
25

sagitta (mm)-4 -2 0 2 4
En
trie
s
0
200
400
600
800
1000
nominal positions
BOL2 6mm in z
BOL2 4mm in z
BOL2 shift, BML2 shift+rot, BIL2 rot
BOL2 shift, BML2 shift+rot, BIL2 shift+rot
BOL2 shift, BML2 shift+rot, BIL2 shift+rot
sagitta (mm)-2 -1 0 1 2
En
trie
s
0
200
400
600
800
1000
nominal positions
BOL2 6mm in z
BOL2 4mm in z
BOL2 shift, BML2 shift+rot, BIL2 rot
BOL2 shift, BML2 shift+rot, BIL2 shift+rot
BOL2 shift, BML2 shift+rot, BIL2 shift+rot
Fig. 11. Left plot: sagitta distribution for 6 runs in which different controlledmovements of MDT chambers were performed, before alignment corrections.Right plot: sagitta distribution for the same runs, after applying the absolutealignment corrections.
Tools to perform alignment with straight tracks have been developed [7]and applied in several H8 runs. A track may be seen as a collection of hits,produced by a pattern recognition algorithm. A χ2 function is built for eachtrack, which will depend on track parameters and on the spatial coordinatesand orientation of the sensitive devices producing the hits. The alignment con-sists in finding the best set of track and chamber parameters using a sample ofseveral thousand tracks. An optimizing track fitting procedure is developpedfor that purpose.
For performing track-based alignment, it is essential to illuminate thelargest possible portion of the chambers with the beam. Given this require-ment, only runs recorded using the hodoscope trigger were used. However,tracks from hodoscope samples are parallel at the level of 5 mrad, and also,the illuminated portion of the chambers, even with the hodoscope runs, is verysmall. This implies that some degrees of freedom may not be fitted at H8. Thealignment obtained using tracks was found to be consistent with the surveypositions and with the movements of the chambers that were made betweenthe period of the survey and the period of the recording of the run. Fig. 12shows the sagitta of the selected tracks, before and after the alignment fit.The mean value of the sagitta is corrected within 5 µm, and the width of thedistribution is also improved.
In order to assess the performance of the track-based alignment, a proce-dure was set up to compare it with the optical relative alignment. The startingpoint is a pair of runs, between which some movements of the chambers havebeen performed. Track-based alignment is applied to these two runs producingthe alignment corrections A1 and A2. The first set of corrections A1 is thenused as reference geometry for ASAP in relative mode, which can in turn ex-trapolate the geometry to the period of the second run by using the response
26

Sagitta(mm)
Ent
ries
0
100
200
300
400
500
600
-4 -3 -2 -1 0 1 2 3 4
Sagitta(mm)
Ent
ries
0
100
200
300
400
500
600
700
800
-4 -3 -2 -1 0 1 2 3 4
Fig. 12. Sagitta distribution of selected tracks before and after the align-ment fit. Left: Distribution of sagitta of selected tracks with the cham-bers at the survey position. The muon sagitta is centered at -351 mi-crons. Right: Distribution of sagitta after alignment fit. The mean valueof sagitta is now 5 microns.
of the optical sensors only. This extrapolated alignment will be called A′
2. Ifthere is no systematic bias, then A2 and A′
2 should both result in a similarsagitta distribution. Fig. 13 shows the sagitta of reconstructed tracks for align-ments A2 and A′
2 performed on data from the second run, after rotating theBIL chambers by 6 mrad around the beam axis. The two alignments showsimilar small biases on the sagitta (34 and 39 µm). The track-based alignment
Sagitta(mm)
Ent
ries
0
20
40
60
80
100
120
140
-4 -3 -2 -1 0 1 2 3 4
Sagitta(mm)
Ent
ries
0
20
40
60
80
100
-4 -3 -2 -1 0 1 2 3 4
Fig. 13. Sagitta distribution of tracks in a run where the BIL cham-bers were rotated by 6mrad around the beam direction. Left: aftertrack-based alignment corrections (alignment A2 in the text). Right:track-based alignment is performed on a run where the chambers werein the nominal position and ”ASAP” alignment corrections in relativemode is used to extrapolate the alignment to the time of the plot (align-ment A′
2 in the text).
27

appears to be very precise in the degrees of freedom to which H8 tracks aresensitive. The feasibility study shows that the initial geometry can certainlybe determined in ATLAS, given a sample of straight tracks. In ATLAS ad-ditional degrees of freedom wil be fitted, given that the tracks will have alarger angular spread. A combination of cosmics tracks and tracks issued fromcollisions where the toroid magnet is off is foreseen for that purpose.
5.3 Combining tracks in the Inner Detector and the Muon Spectrometer
With the combined test beam data it is possible to correlate measurementsmade in the muon spectrometer with those made in other detectors of thesetup. The track reconstruction in the Inner Detector is performed by theStraightLineF itter package and the track reconstruction in the muon systemis performed using Muonboy. The track correlation is evaluated at the perigee(x = 0). The muon track needs to be extrapolated back to the perigee, takinginto account the substantial energy losses in the calorimeters and the irondump. This back-tracking is performed within Muonboy which uses a detaileddescription of the H8 setup (geometry and material). The correlation in the zcoordinate (the precision coordinate for MDT’s), shown in Fig. 14, has a slopecompatible with 1. The −7.9 mm offset represents the small misalignment of
zID(mm)
z MS(
mm
)
-60
-40
-20
0
20
40
60
-20 -10 0 10 20 30
Fig. 14. Correlation between the muon system tracking and the InnerDetector tracking.
28

the Inner Detector with respect to the muon system.The accuracy of the relative alignment of the Muon Spectrometer and the
Inner Detector is limited by and depends crucially on the multiple scatteringof particles in the material between these two detectors. A detailed descriptionof this material will be needed by the reconstruction programs in ATLAS.
6 Reconstruction efficiencies and sagitta measurement
In this section, the efficiency for reconstructing track segments is studiedand the single hit efficiency for MDT chambers is calculated for various oper-ational conditions. The data used in these studies, come from runs recordedwith the (10 x 10) cm2 trigger for a number of H8 beam energies and MDToperational thresholds. The runs analysed were restricted to those where thebeam was deflected into the second BML chamber by the BMPL magnet toprevent the beam from crossing the boundary area between the adjacent BMLchambers, a source of large inefficiency. The track segment efficiency of oneMDT chamber is calculated as follows.
Two of the three stations (barrel or end-cap) belonging to the same towerare chosen as reference stations, the third being the tested station. Only eventswith one reconstructed segment in each reference station, are accepted, witha total number of hits not smaller than (ntotal − 1), where ntotal = 8 or 6is the number of tube layers in a given chamber, as described in 5.1. Withthe two reconstructed segments of the reference stations, the sagitta is cal-culated for all the reconstructed segments of the tested station. The sagittadistribution, with standard deviation σ, is used to select good segments in thefollowing way: the segments with the correct minimum number of hits andwithin ± (n × σ) of the mean value are counted as good segments. The ratioof good segments to the reference sample reaches a plateau after 3 × σ. A fitof the plateau region with a constant level is assumed to be representative ofthe track segment efficiency. This method is applied to both the barrel andend-cap chambers and the results are presented in Table 2.By analysing runs with various beam energies, it was found that the track
segment efficiency is independent on particle momentum for the nominal MDTthreshold (40 mV ) as expected. The effect of varying the threshold is shown inFig. 15: the track segment efficiency is stable for thresholds above the nominalvalue and drops by ≈ 1% for the lower threshold (36 mV ) and by ≈ 2% whenthe most stringent requirements are used. This efficiency drop is due to theincreased noise when the MDT signal threshold is lowered.
29

Track segment efficiency (%)
Barrel chamber (ntotal) BIL (8) BML (6) BOL (6)
Nhits ≥ ntotal-1 93.2 ± 0.2 94.3 ± 0.1 96.3 ± 0.2
= ntotal 68.2 ± 0.3 71.5 ± 0.3 76.3 ± 0.4
End-cap chamber (ntotal) EIL (8) EML (6) EOL (6)
Nhits ≥ ntotal − 1 89.8 ± 0.2 94.9 ± 0.2 95.3 ± 0.1
= ntotal 63.7 ± 0.3 74.4 ± 0.4 75.6 ± 0.2
Table 2Track segment efficiency (%), for different number of hits, for barrel and end-cap chambers. The number of tube layers ntotal is indicated for each type ofMDT chamber. The threshold is nominal, at 40 mV .
threshold (mV)36 38 40 42 44 46 48 50 52
Eff
icie
ncy
0.65
0.7
0.75
0.8
0.85
0.9
0.95
1
nhits = max
nhits>=max-1
Fig. 15. Track segment efficiency versus MDT threshold of the EOL chamber,for two cases: a) when the most stringent requirement to validate a tracksegment (Nhits = ntotal) and b) when (Nhits = ntotal − 1) are used. The beammomentum is 180 GeV/c.
6.1 Hit and track efficiency
The track segment efficiency (εsegment) is related to the single hit efficiency(εhit) through:
ε(nhits/ntotal) = εsegment =ntotal!
nhits!(ntotal − nhits)!(εhit)
nhits(1 − εhit)ntotal−nhits
(5)
30
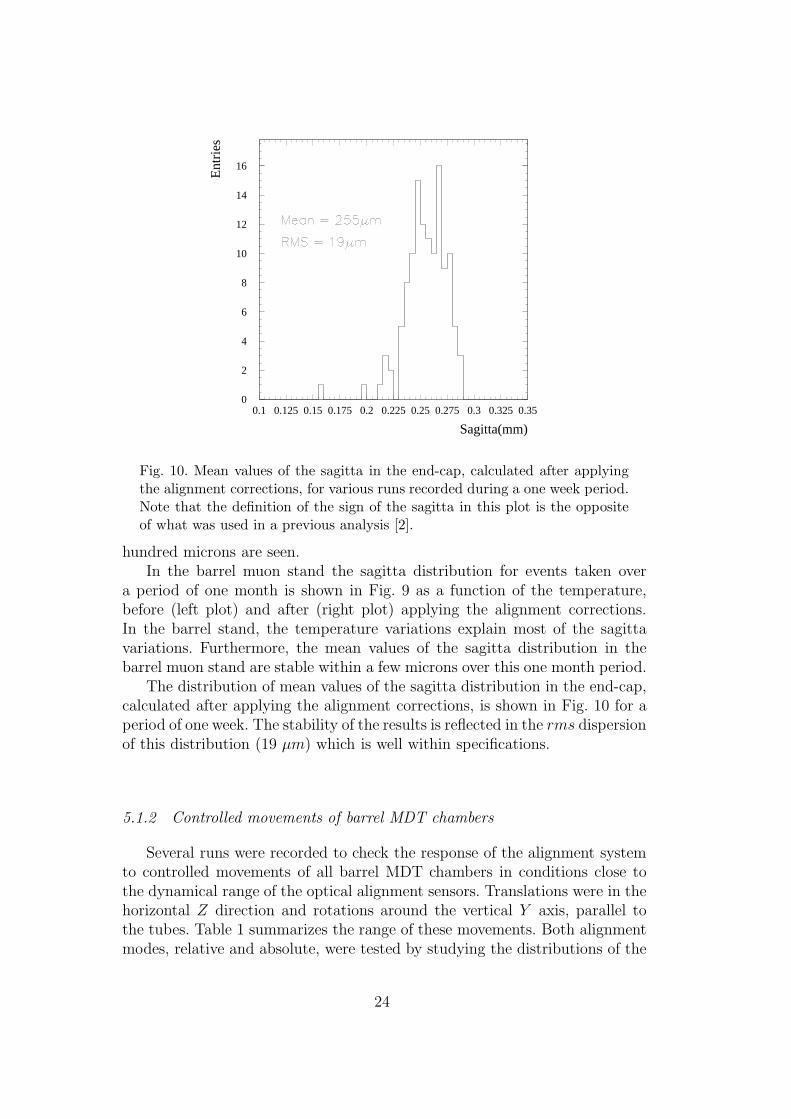
where nhits is the minimum number of required hits and ntotal is the total num-ber of possible hits in a segment. Table 3 shows single hit efficiencies, extractedfrom the track segment efficiencies, for barrel and end-cap chambers and fortwo cases: nhits = ntotal − 1 and nhits = ntotal. Similar single hit efficiencies arefound for both the barrel and end-cap chambers, as expected.
The measured single hit efficiencies of 95 − 96% are in line with previousmeasurements [18] and with expectations from simulations documented in [1](p. 178), where a 5% inefficiency is attributed to the walls of the tubes and toδ-ray electrons which obscure the muon signal.
Single hit efficiency (%)
Number of required hits BIL BML BOL
= ntotal-1 95.8 ± 0.1 95.1 ± 0.2 95.9 ± 0.2
= ntotal 95.3 ± 0.1 94.6 ± 0.1 95.6 ± 0.1
Nhits EIL EML EOL
= ntotal-1 95.5 ± 0.1 95.8 ± 0.2 95.9 ± 0.2
= ntotal 94.5 ± 0.1 95.2 ± 0.1 95.4 ± 0.1
Table 3Single hit efficiency (%), for different number of hits, for barrel and end-cap
chambers
For some runs of the last running period (November 2004), a(15 × 15 × 1) cm3 block of stainless steel was placed in the beam path infront of all barrel chambers, BIL, BML and BOL. This was done to study theeffect of this added material on the performance of the pattern recognitionalgorithm. The analyzed runs were at a fixed beam energy. A 1% drop of thesingle hit efficiency in the presence of material is observed.
6.2 Sagitta measurement
The momentum measurement has been performed as described in section3.4. For each beam momentum, first the angular difference ∆ϑ0 has beenmeasured to correct for misalignment due to rotation about the y−axis. Then,∆ϑB has been computed. The distributions of the two angular differences areshown in Fig. 16 for the runs with 120 GeV/c nominal beam momentum and40 mV threshold. Also the measured momentum spectrum, computed withequation (3), is shown. The measured momentum distributions for all thedata sets at the 44 mV threshold, are illustrated in Fig. 17. In Table 4, themean values and the standard deviation of the momentum distributions at
31

the three different threshold, obtained with a Gaussian fit are shown. Thedifference observed between the nominal and measured momentum is mainly
05
10152025303540
0.128 0.132 0.1360
100200300400500600700
0.14 0.145 0.15
∆Θo
Ent
ries
∆ΘB
p(GeV/c)
Ent
ries
0
200
400
600
800
1000
1200
0 20 40 60 80 100 120 140 160 180 200
Fig. 16. Top left: the distribution of ∆ϑ0. Top right: distribution of ∆ϑB.Bottom: distribution of the beam momentum. The figures refer to the dataset at 120 GeV/c.
0200400600800
100012001400
0 100 200 3000
200
400
600
800
1000
0 100 200 300
0100200300400500600700800
0 100 200 300
Ent
ries
p(GeV/c)
Ent
ries
p(GeV/c)
020406080
100120140
0 100 200 300
Fig. 17. Momentum distribution for the different samples at 44 mV threshold.
32

due to the beam energy loss in the calorimeter material and in the beam dump,upstream of the muon area.
The sagitta resolution for each data set has been evaluated after two cuts.First RPC strips have been used to select events crossing a limited portion inthe Y coordinate of the MDT tubes. Second only events with a momentumlarger than pmean − 2σp have been selected. The final sagitta distributionsare shown in Fig. 18 for the 44 mV threshold. The mean sagitta value andstandard deviations obtained with the Gaussian fit are reported in Table 5.
The measured sagitta resolution as a function of the measured momentum
36 mV 40 mV 44 mV
Nominal
momentum pmean σp pmean σp pmean σp
(GeV/c) (GeV/c) (GeV/c) (GeV/c) (GeV/c) (GeV/c) (GeV/c)
100 88.7 4.5 88.8 4.2
120 108.0 4.2 108.1 4.1
150 136.9 6.1 135.0 5.8 136.1 6.0
180 163.5 7.5 163.4 7.4
220 203.2 11.6 206.7 11.3 202.9 11.5
250 229.4 14.9 230.1 15.1
Table 4Measured momentum mean value (pmean) and the standard deviation (σp) at dif-ferent nominal momenta for the three thresholds.
36 mV 40 mV 44 mV
Nominal
momentum σS σS σS
(GeV/c) (µm) (µm) (µm)
100 98 ± 2 102 ± 1
120 90.6 ± 0.8 92 ± 1
150 75 ± 1 76.5 ± 0.6 78.8 ± 0.8
180 70 ± 1 71.5 ± 0.7
220 63 ± 2 65 ± 2 67 ± 1
250 60 ± 2 62 ± 1
Table 5Measured sagitta resolution for different beam momenta after applying the con-straints described in the text.
33
0
200
400
600
800
1000
1 1.5 2 2.5 30
200400600800
10001200
1 1.5 2 2.5 3
0200400600800
100012001400
1 1.5 2 2.5 3
Sagitta(mm)
Ent
ries
Sagitta(mm)
Sagitta(mm)
Ent
ries
Sagitta(mm)
050
100150200250300350400
1 1.5 2 2.5 3
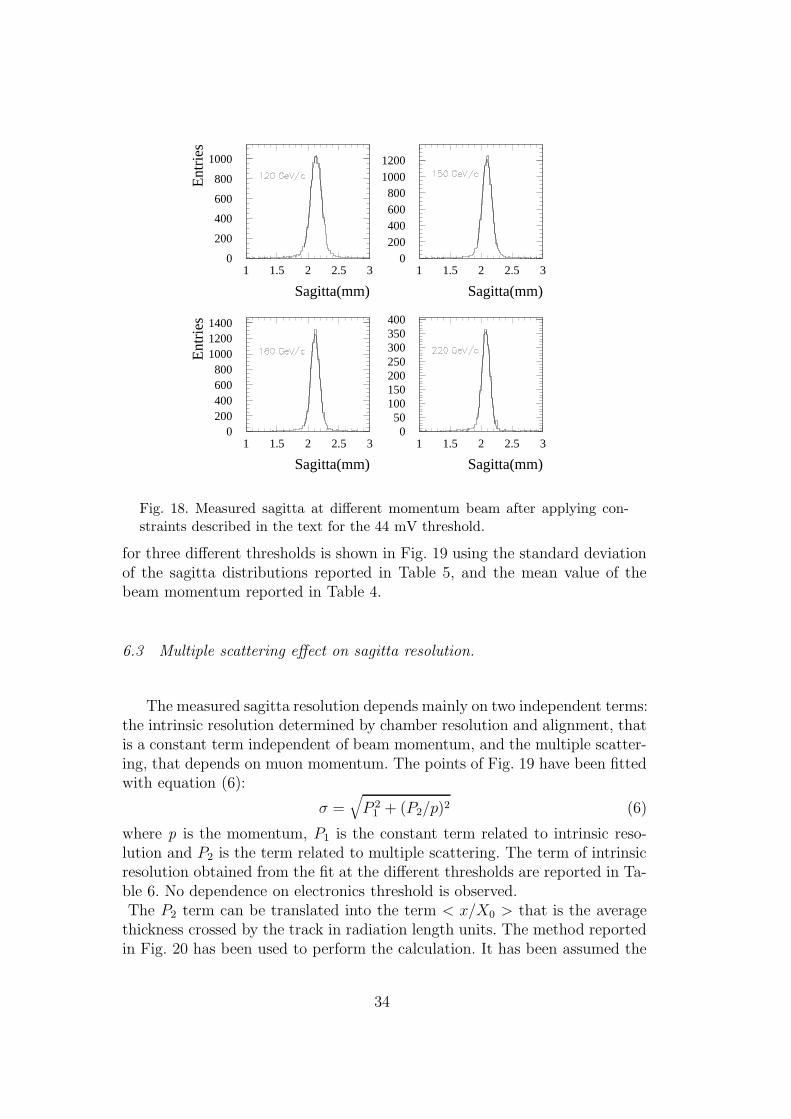
Fig. 18. Measured sagitta at different momentum beam after applying con-straints described in the text for the 44 mV threshold.
for three different thresholds is shown in Fig. 19 using the standard deviationof the sagitta distributions reported in Table 5, and the mean value of thebeam momentum reported in Table 4.
6.3 Multiple scattering effect on sagitta resolution.
The measured sagitta resolution depends mainly on two independent terms:the intrinsic resolution determined by chamber resolution and alignment, thatis a constant term independent of beam momentum, and the multiple scatter-ing, that depends on muon momentum. The points of Fig. 19 have been fittedwith equation (6):
σ =√
P 21 + (P2/p)2 (6)
where p is the momentum, P1 is the constant term related to intrinsic reso-lution and P2 is the term related to multiple scattering. The term of intrinsicresolution obtained from the fit at the different thresholds are reported in Ta-ble 6. No dependence on electronics threshold is observed.The P2 term can be translated into the term < x/X0 > that is the average
thickness crossed by the track in radiation length units. The method reportedin Fig. 20 has been used to perform the calculation. It has been assumed the
34

50
60
70
80
90
100
110
80 100 120 140 160 180 200 220 240
P(GeV/c)
σ Sa
gitta
(µm
)44 mV40 mV36 mV
1/P2(1/GeV2)
σ Sa
gitta
2 (µm
2 )
44 mV
40 mV
36 mV
3000400050006000700080009000
1000011000
0.02 0.04 0.06 0.08 0.1 0.12 0.14x 10
-3
Fig. 19. Sagitta resolution as a function of momentum (top) and as a function of1/p (bottom). The extrapolation and its error when the momentum tends to infinityare immediate in the bottom plot.
Threshold (mV ) Intrinsic sagitta resolution (µm)
36 51.8 ± 1.9
40 50.7 ± 1.5
44 52.3 ± 1.7
Table 6Intrinsic sagitta resolution values obtained by fit at the different thresholds
scattering takes place exactly at the BML super-point. The sagitta resolutionterm related to multiple scattering is given by the formula :
σs(multiple scatt) =P2
p'
(z2 − z1)(z3 − z2)
(z3 − z1)σθ0
(7)
where (z2 − z1), (z3 − z2) and (z3 − z1) are the known distances between the
chambers, σθ0is the r.m.s. of the multiple scattering angle ' 13.6MeV
p
√
x/X0.
The relationship between P2 and < x/X0 > is then given by the following
35

BIL
BML
BOL
δδδδs
z1 z2 z3
θθθθ0
Fig. 20. A top schematic view of the barrel chambers. The method to evaluate themultiple scattering contribution to sagitta resolution is shown.
expression:
P2 '(z2 − z1)(z3 − z2)
(z3 − z1)13.6MeV
√
< x/X0 > (8)
The values of < x/X0 > obtained by the fit are reported in Table 7. This termaccounts for about 8 mm of aluminum of MDT tubes and for the material ofthe two RPC chambers. As expected the values of < x/X0 > are compatiblewith each other within statistical errors.
Threshold < x/X0 >
36 26.1 ± 2.1
40 29.3 ± 1.0
44 30.5 ± 1.7
Table 7< x/X0 > values (in %) obtained by the fit at the different thresholds. All < x/X0 >values are statistically compatible and give an average of 29.1%±0.8%.
6.4 Muon catastrophic energy losses in Calorimeters
Muons traversing matter lose energy mainly via ionization. Their energyloss increases with increasing momentum. After a critical energy, radiativemechanisms become the major contribution to the energy loss and producelarge tails in the energy loss spectrum. The probability for muons to suffer asevere energy loss, known as catastrophic, increases after the critical energy.Energy loss parametrization can only account for the ionization mechanismand should be complemented with direct measurement of the energy loss inthe calorimeters before the Muon Spectrometer.
The total energy deposited in the calorimeters for these data was estimatedby measuring the energy response in LAr calorimeter and in each of the Tilecompartments. In the Tile, given the narrow beam profile and the large gran-ularity of the compartments (∆η × ∆φ = 0.1 × 0.1 and 0.2 × 0.1 in the last
36

Energy in Tile Compartments (GeV)
Ent
ries
0
500
1000
1500
2000
2500
3000
3500
0 0.5 1 1.5 2 2.5 3 3.5 4
Fig. 21. Energy deposition in the Tile calorimeter.
layer) only the most energetic cell in each layer was added to the total energy.In LAr the most energetic cell from each compartment and its neighbours inη and φ with energy 2σ above the noise were added to the total energy.
On the basis of the energy deposited in LAr and in each one of the threeTile compartments events were classified in two mutually exclusive categories:
• Muons with no catastrophic energy loss were required to have a track in theMuon Spectrometer and energy loss of a Minimum Ionizing Particle (MIP)in LAr and in each one of the Tile compartments. The MIP upper energyvalue was taken as the value 5σ’s away from the most probable value of themuon energy loss distribution, obtained from fitting a Landau distributionto the data. The muon energy loss distribution in each of the Tile compart-ments is shown in Fig. 21. The corresponding MIP upper energy was 0.8GeV, 2.2 GeV and 1 GeV in each of the three compartments respectively.In LAr the MIP upper energy range is 1.5 GeV.
• Muons with catastrophic energy loss were required to have a track in theMuon Spectrometer and energy deposition larger than the MIP upper en-ergy in one or two consecutive calorimeter compartments, where LAr istreated as a compartment.
37

Energy loss in calorimeters (GeV)
Ent
ries
Data
Monte Carlo
1
10
10 2
10 3
10 4
0 50 100 150 200 250 300 350
Fig. 22. Energy deposited in the calorimeters by particles tagged as muons.
The total energy deposited as measured in the calorimeters, for all muonevents in a sample at 350 GeV momentum is shown in Fig. 22. The shapeof the spectrum is consistent with the energy loss expected for muons. Theagreement with MC expectations is good. The probability for a muon to sufferenergy loss above a threshold is computed on the basis of the above resultsand shown in Fig. 23. In the same figure the values obtained from Monte Carloare superimposed.
7 Summary
Results obtained using large samples of test beam data taken in the H8beam line at the CERN SPS in 2004 are presented in this paper. The ATLASoffline framework ATHENA was used for reconstruction.
The analysis has shown that the MDT drift time constants are stable overtime. This result is reproduced for all chambers and the time stability wasobserved over a period of several months. The variation of the maximum drifttime tmax with temperature has also been studied and a linear dependenceof tmax with respect to temperature with a slope of 2.5 ns/◦C was found inagreement with previous measurements.
The r(t) relation has also been studied using data from an MDT chambermounted on a rotating support which allowed a proper angular spread for the
38

Energy loss in calorimeters (GeV)
Prob
abili
ty(%
)Data
Monte Carlo
0.2
0.3
0.4
0.5
0.60.70.80.9
1
2
3
10 102
Fig. 23. Probability(%) for catastrophic Eloss vs Etotloss in the calorimeters.
calculation. Once corrected for trivial temperature effects, the r(t) relation isfound to be stable in time.
Results on the alignment of MDT chambers using optical sensors werepresented. Both alignment modes (relative and absolute) were studied. Theresults are within specifications for both the barrel and end-cap relative align-ment, where a precision of approximately 20 µm was obtained. For the ab-solute mode, the mean value of the sagitta calculatted by optical means isoff by 350 µm in the barrel and 250 µm in the end-cap, compared to theone calculated with straight tracks. This shows that some of the calibrationentered for the optical alignment sensors, have still to be understood. Theconcept of alignment was tested and validated for the first time using straighttracks from the H8 data. Finally, a first attempt of relative alignment betweenthe Inner Detector and the Muon Spectrometer was also performed. An offsetof -7.9±0.4 mm of the muon system with respect to the Inner Detector wasmeasured over a distance of about 40 meters.
MDT chamber efficiencies were tested for different beam energies, MDTthresholds, and in the presence of material in front of the chambers. Single hitefficiencies, derived from measured track segment efficiencies, are above 95 %for all chambers as expected from simulations.
An intrinsic sagitta resolution of 51±1 µm was measured, in good agree-ment with the MDT design performance. The sagitta resolution as a func-tion of the muon momentum has been measured for momenta ranging from100 GeV/c to 250 GeV/c, and for various electronics threshold settings on the
39

MDT precision tracking detectors. Within the statistical errors no dependenceof the sagitta resolution on electronics threshold settings has been observed.The beam momentum was measured at the entrance of the barrel Muon Spec-trometer sector, to account for energy losses in the upstream material, andremove tails in the beam energy distributions. The sagitta dependence onbeam momentum makes it possible to disentangle the contributions comingfrom multiple scattering and the intrinsic resolution of the tracking detectors.
The study of muon catastrophic energy losses was also made possible bythe use of calorimeter data. Results are compared with Monte Carlo simulationand found to be in very good agreement.
With the results presented in this paper, the basic parameters determiningthe performance of the ATLAS Muon Spectrometer have been measured andfound to be within design specifications. They include MDT drift space-timecalibrations, optical alignment of muon chambers, alignment with straighttracks, single hit efficiency of MDTs and sagitta resolution as a function ofparticle momentum. The H8 beam test experiment also constituted an excel-lent training ground for the actual commissioning of the ATLAS detector.
Acknowledgments
We thank the CERN-SPS team for the efficient and smooth operation of thebeam line and our friends of the ATLAS Collaboration who participated inthe organization of the beam test. The effort of assembling together the manycomponents of the system was made possible thanks to the dedication andskill of the technical staff of our Institutions and we are grateful for theirexcellent work. We want to acknowledge C. Ferrari for his help during designand construction of the supports of the Endcap stations and W. Andreazzaand B. Di Girolamo who have contributed with quality and continuity tothe project. We thank T. Del Prete, S. Paganis and G. Usai for the usefuldiscussions regarding the analysis with calorimeters data.
NOTE: Referenced ATLAS notes are public on the web sitehttp://cdsweb.cern.ch/collection/ATLAS.
References
[1] The ATLAS Muon Spectrometer Technical Design Report, CERN-LHCC/97-22 (1997);S. Palestini, Nuclear Physics B (Proc.Suppl.) 125 (2003) 337.
[2] C. Adorisio et al., System Test of the ATLAS Muon Spectrometer in the H8Beam at the CERN SPS, ATL-MUON-PUB-2007-005, submitted to Elsevier.
[3] Inner Detector Technical Design Report, CERN-LHCC/97-16 and CERN-LHCC/97-16 (1997).
40

[4] Tile Calorimeter Technical Design Report, CERN-LHCC/96-42 (1996).
[5] Liquid Argon Calorimeter, Technical Design Report, CERN-LHCC/96-41(1996).
[6] A. Baroncelli et al., Study of MDT calibration constants using H8 testbeamdata of year 2004, ATL-MUON-PUB-2007-004.
[7] P.F. Giraud et al., Track-based absolute alignment in the ATLAS muonspectrometer and in the H8 test beam, ATL-MUON-PUB-2006-012.
[8] F. Bauer et al., ATLAS 2004 Combined Test Beam results: Muon ChamberAlignment and Muon Reconstruction, ATL-MUON-PUB-2007-003.
[9] G. Avolio et al., ATLAS Muon Barrel Sagitta Resolution versus Momentumat 2004 H8 Test Beam and comparison with Geant4 Simulation, ATL-MUON-PUB-2006-011.
[10] T. Bachas et al., Studies of catastrophic muon energy losses in ATLAS H8combined Testbeam data - in publication on Nuclear Physics B, ProceedingsSupplement.
[11] M. Livan, Monitored drift tubes in ATLAS, Nucl. Instr. and Meth. in Phys.Res. A384 (1996) 214;F. Bauer et al., Construction and test of MDT chambers for the ATLAS muonspectrometer, Nucl. Instr. and Meth. in Phys. Res. A461 (2001) 17.
[12] A. Di Ciaccio, Resistive Plate Chambers in ATLAS, Nucl. Instr. and Meth. inPhys. Res. A384 (1996) 222;A. Aloisio et al., The Trigger Chambers of the ATLAS Barrel Spectrometer:Production and Tests, Nucl. Instr. and Meth. in Phys. Res. A535 (2004) 265.
[13] J. Chapman et al., Data flow simulations through the ATLAS Muon front-end electronics, Proceedings of the 5th Conference on Electronics for LHCExperiments, Snowmass, CO, USA, 20-24 September 1999, p.448.
[14] H. Beterenbrood et al., The Read Out Driver for the ATLAS MDT MuonPrecision Chambers, IEEE Trans. Nucl. Sci. 53 (2006) 741.
[15] S. Tanaka et al., Techniques Developed for the ATLAS Thin Gap ChambersMass Production, IEEE Trans. Nucl. Sci. 51 (2004) 934.
[16] M. Boterenbrood et al., Design and implementation of the ATLAS detectorcontrol system, IEEE Trans. Nucl. Sci., 51 (2004) 495-501;M. Boterenbrood, B. Hallgren, The development of Embedded Local Monitor(ELMB), Proceedings of the 9th Workshop on electronics for the LHCExperiments, LECC 2003, Amsterdam, The Netherlands, 29 Sep - 3 Oct 2003,p.331-334;J. Rothberg, Detector Control Systems in the LHC Experiments, 9th Workshopon Electronics for LHC Experiments, Amsterdam, Netherlands, 29 September2003.
41

[17] M. Aleska, W. Riegler, Non linear MDT drift gases like Ar/CO2, ATLASInternal Note, ATL-MUON-98-268.
[18] P. Bagnaia et al., CALIB: a Package for MDT Calibration Studies, ATL-MUON-2005-013 (2002);G. Avolio et al., Test of the first BIL tracking chamber for the ATLAS muonspectrometer, NIM A523(2006) 309.
[19] R. Veenhof, GARFIELD, Recent Developments, Nucl. Instr. and Meth. in Phys.Res. A419 (1998) 726.
[20] C. Amelung et al., The alignment system of the ATLAS muon spectrometer,Eur. Phys. J. C33, s01 (2004) 999.Ch. Amelung et al, Results on the Test of the Muon End-Cap Alignment systemin the H8 Beam Line, ATL-MUON-2004-009.
[21] C. Amelung et al., Reference Bars for the Alignment of the ATLAS MuonSpectrometer, Nucl. Instr. and Meth. in Phys. Res. A555 (2005) 36.
[22] H. Dekker et al., The RASNIK-3dimensional alignment system, Proceedingsof the 3rd International Workshop on Accelerator Alignment, Annecy, France,28-30 September 1993, p.147;H. van der Graaf et al., First system performance experience with the ATLAShigh-precision muon drift tube chambers, Nucl. Instr. and Meth. in Phys. Res.A419 (1998) 336.
[23] C. Amelung et al., The ATLAS Muon Alignment System, Proceedings of thefirst LHC Detector Alignment Workshop, CERN, 4-9 September 2006, YellowReport.
[24] K. Hashemi and J. Bensinger, The BCAM Camera, ATLAS note ATL-MUON-2000-024, 15.9.2000.
[25] F. Bauer et al., Optical alignment system for the ATLAS muon spectrometer,Proceeding of IEEE Nuclear Science Symposium, Rome (2004).
[26] C. Amelung: ARAMyS - Alignment Reconstruction Software for the ATLASMuon Spectrometer, Proceedings of the 10th Topical Seminar on InnovativeParticle and Radiation Detectors (IPRD 2006), Nuclear Physics B (Proc.Suppl.) 172 (2007) 132-134.
[27] The ATLAS Computing Technical Design Report, CERN-LHCC/2005-022,20.6.2005, ISBN 92-9083-250-9.
[28] D. Adams et al, Track reconstruction in the ATLAS muon spectrometer withMOORE, ATLAS note ATL-SOFT-2003-007.
[29] P. Branchini et al., Study of drift properties of high pressure drift tubes for theATLAS muon spectrometer, IEEE Trans. Nucl. Sci. 53-1 (2006) 317;F. Cerutti et al., Study of the MDT drift properties under different gasconditions, ATLAS-MUON-PUB-2006-004.
[30] R. M. Avramidou, E. N. Gazis, R. Veenhof, Drift properties of the ATLASMDT chambers, NIM A 568 (2006) 672.
42