Study of the adsorption of cholate anions at the mercury- electrolyte solution interface by means of...
13
223 Bioelectrochemistry and Bioenergetics, 29 (1992) 223-235 Elsevier Sequoia S.A., Lausanne JEC BB 01552 Study of the adsorption of cholate anions at the mercury- electrolyte solution interface by means of three-dimensional phase-sensitive a.c. voltammetry Nikos Papadopoulos, Antonis Avranas and Sotiris Sotiropoulos Laboratory of Physical Chemistry, Department of Chemistry, Aristotle Unicersi& 54006 Thessaloniki (Greece) (Received 19 November 1991; in revised form 10 March, 1992) Abstract The dependence of the differential capacitance (C) of the electrode double layer of a hanging mercury drop electrode in sodium cholate (NaCh) solutions on electrode potential (E) and time is measured. A new methodology is used, namely three-dimensional phase-sensitive a.c. voltammetry, which gives a different picture for the transition peaks than that obtained by classical a.c. voltammetry. It is based on the reconstruction of C vs. E curves from isochronous C data, sampled after many chronoamperometric experiments. This methodology provides the equilibrium C vs. E curves for long time periods and permits a detailed study of adsorption phenomena. The shape of the C vs. E curves allows an estimation of the structure of the layer of NaCh molecules adsorbed at the electrode surface. The effect of electrode potential and NaCh concentration on the structure of the surface NaCh layer is discussed. NaCh molecules form micelles in bulk solutions and they also associate into surface aggregates which depend on their concentration and applied potential. The NaCh micelle formation influences the shape and number of capacitance peaks at cathodic polarizations. INTRODUCTION Sodium cholate (NaCh) belong to the group of bile salts. The term bile salts covers several derivatives of NaCh which differ in the number and position of a-hydroxy substituents and in its conjugation with glycine or taurine residues [l]. The bile salts are detergents which are synthesized in the liver. They are among the most important biological detergent-like molecules (biosurfactants) and partici- pate in many physiological processes [2,31. They are involved in intestinal hydroly- sis and emulsify or solubilize lipids which are adsorbed through intestine walls. 0302-4598/92/$05&l 0 1992 - Elsevier Sequoia S.A. All rights reserved
Transcript of Study of the adsorption of cholate anions at the mercury- electrolyte solution interface by means of...
223
Bioelectrochemistry and Bioenergetics, 29 (1992) 223-235
Elsevier Sequoia S.A., Lausanne
JEC BB 01552
Study of the adsorption of cholate anions at the mercury- electrolyte solution interface by means of three-dimensional phase-sensitive a.c. voltammetry
Nikos Papadopoulos, Antonis Avranas and Sotiris Sotiropoulos
Laboratory of Physical Chemistry, Department of Chemistry, Aristotle Unicersi&
54006 Thessaloniki (Greece)
(Received 19 November 1991; in revised form 10 March, 1992)
Abstract
The dependence of the differential capacitance (C) of the electrode double layer of a hanging mercury drop electrode in sodium cholate (NaCh) solutions on electrode potential (E) and time is measured. A new methodology is used, namely three-dimensional phase-sensitive a.c. voltammetry, which gives a different picture for the transition peaks than that obtained by classical a.c. voltammetry. It is based on the reconstruction of C vs. E curves from isochronous C data, sampled after many chronoamperometric experiments. This methodology provides the equilibrium C vs. E curves for long time periods and permits a detailed study of adsorption phenomena. The shape of the C vs. E curves allows an estimation of the structure of the layer of NaCh molecules adsorbed at the electrode surface. The effect of electrode potential and NaCh concentration on the structure of the surface NaCh layer is discussed. NaCh molecules form micelles in bulk solutions and they also associate into surface aggregates which depend on their concentration and applied potential. The NaCh micelle formation influences the shape and number of capacitance peaks at cathodic polarizations.
INTRODUCTION
Sodium cholate (NaCh) belong to the group of bile salts. The term bile salts covers several derivatives of NaCh which differ in the number and position of a-hydroxy substituents and in its conjugation with glycine or taurine residues [l]. The bile salts are detergents which are synthesized in the liver. They are among the most important biological detergent-like molecules (biosurfactants) and partici- pate in many physiological processes [2,31. They are involved in intestinal hydroly- sis and emulsify or solubilize lipids which are adsorbed through intestine walls.
0302-4598/92/$05&l 0 1992 - Elsevier Sequoia S.A. All rights reserved

224
()I A ( > B
Fig. 1. (A) The structure of sodium cholate. (B) Schematic representation of a sodium cholate micelle, primary and secondary: 0, OH groups; 0, negatively charged ionic group of sodium cholate.
Bile salts in solution are known to associate to form micelles. The structure of bile salt micelles, however is, different from the more commonly studied detergent micelles owing to their very different chemical structure. Usually the detergent molecules have a hydrophobic and a hydrophilic moiety which are clearly sepa- rated and form aggregates which are stabilized by hydrophobic interactions be- tween the hydrocarbon chains [4]. Bile salts have a different structure. They have a hydrophobic and a hydrophilic surface rather than the hydrophobic tail and the hydrophilic head group of conventional detergent molecules [3,5] (Fig. l(A)).
Most authors agree [6,7] that primary micelles of up to 10 molecules are formed through hydrophobic interactions, while at higher concentrations of bile salts longer secondary micelles are formed. The latter are stabilized either through hydrophobic interactions of a narrow cross-sectional area or through hydrogen bonding between the -OH groups of primary micelles [6-91 (Fig. l(B)). Many attempts have been made to clarify the mechanism of association of bile salt monomers and to find the aggregation number of bulk micelles using various techniques such as fluorescence probing [6,8], high resolution proton nuclear magnetic resonance (NMR) [9], conductivity [lo], light scattering [ll], etc.
Investigations of the behaviour of bile salts at interfaces below and above their critical micellar concentration (CMC) are few [12,13]. Interfacial phenomena that take place at real biological interfaces would be the final goal in order to elucidate the role of bile salts in biological phenomena. However, the first step of such an investigation should be the use of model interfaces to study the interfacial behaviour of biosurfactants. The model hydrophobic surface which is usually chosen is mercury. Bile salts, in addition to their ability to form ordered assemblies in aqueous solutions, are strongly adsorbed at the mercury-solution interface [14-161. Their adsorption on mercury is analogous to their interaction with biological membranes, since there also exist charged interfaces of high field gradients. A question which arises when bulk micelle-forming surfactants are

225
adsorbed at charged interfaces is whether under the strong influence of the electric field their aggregation tendency is affected. Furthermore, the fact that their orientation is mainly determined by the electric field makes the study of their intermolecular interactions easier, since we are dealing with entities of a fixed geometry on the electrode surface.
The adsorption of bile salts on mercury causes a change in the electrode double-layer differential capacitance which is the result of an exchange between the counter-ions and water molecules on the electrode surface with surfactant molecules from the solution. Numerous works have been published concerning the study of the adsorption of bulk micelle-forming surfactants on mercury by means of differential capacitance measurements and seeking a correlation between the properties of the differential capacitance (C) vs. applied potential (El curves and the bulk CMC value 117-211. Recently, a thermodynamic treatment of micelliza- tion at charged interfaces has been attempted in our laboratory [22]. According to it, surface micellization is a surface phase transition which in the case of bulk micelle-forming surfactants and for adequately high concentrations is likely to extend within several sublayers of a multilayer adsorption layer. This situation can hold for cholate anions too, since they are bulk micelle-forming biosurfactants. Since phase changes are usually kinetically hindered processes [23,24] and surface micellization can be regarded as a surface phase change, the adsorption of cholate anions on mercury is a time-dependent process. Therefore it cannot be studied safely either with a dropping mercury electrode DME which has a very limited drop time, or with a hanging mercury drop electrode (HMDE) using semistatic a.c. voltammetry, since the equilibrium may not be established quickly enough. In addition, it would be interesting to study the kinetics of the adsorption of cholate anions on the polarized mercury electrode, since many biological phenomena taking place at charged membranes are time consuming. A new fully automated methodology has recently been developed in our laboratory 1251 which allows the study of the kinetics of slowly proceeding phase changes on mercury using an HMDE. This methodology, called three-dimensional phase-sensitive a.c. voltam- metry (3D/a.c./V), consists of the reconstruction of the differential capacitance C vs. applied potential E curves for selected time values t. This is done by sampling the capacitance current after a potential step has been applied to the electrode and then plotting isochronous C data against the final potential values of the corresponding pulse experiments. 3D/a.c./V allows the study of the whole ad- sorption phenomenon to be carried out with respect to both potential and time under strictly potentiostatic conditions. Thus it provides both the equilibrium C vs. E curves when it is applied for extremely long periods, and useful information about the evolution of the adsorption phenomenon at intermediate times. The I,-E-t surface for 1 X 10e5 M NaCh is given in Fig. 2, which provides an overall picture of the whole adsorption phenomenon.
The aim of the present work is to investigate whether cholate anions (Ch-) retain their tendency to associate even when they are under the influence of the strong electric field of a model charged interface such as the polarized mercury

Fig. 2. I,-E-t surface for 1 X 10-j M NaCh aqueous solution in 0.1 M Na,SO,.
electrode. The surface association of Ch- can be studied on a qualitative level from its impact upon the C vs. E curves. Furthermore, any correlation between the CMC of NaCh and a change in the shape of the C vs. E curves (which is of practical interest) is also investigated.
EXPERIMENTAL
NaCh was obtained from Riedel-de HIen (99%) and used as received. No minimum was observed in the surface tension vs. log(concentration) curve of the aqueous solution of NaCh, indicating the absence of surface-active impurities. The surface tension of NaCh solutions was measured with a Kriiss electronic tensiome- ter K 10, employing the Wilhelmy plate method [26]. The accuracy of the measurements was estimated to be kO.2 mN m-l. Na,SO, from Fluka (puriss p.a. 99.5%) served as the supporting electrolyte. The stock 0.1 M aqueous Na,SO, was treated with activated charcoal for a few days in order to eliminate possible co-adsorption of surface-active impurities. The experiments were carried out at 25°C using NaCh concentrations ranging from lo-’ to lo-* M, i.e., above and below its CMC.
The capacitive current (1,) of the double layer formed between an HMDE and aqueous 0.1 M Na,SO, solutions of NaCh was recorded by means of a.c. phase- sensitive chronoamperometry using a PAR model 170 electrochemistry system interfaced to an AT compatible (VIP 200, 12 MHz) via a 14 bit AD/DA card. The a.c. modulation was 5 mV p-p (peak to peak) at 370 Hz.
Each mercury drop was formed within a 3 s period at - 1.8 V vs. the saturated calomel electrode (SCE), to which all potential in this paper are referred, where preliminary DME experiments for short drop times showed a limited adsorption. After a 0.5 s rest time a potential step with a 5 mV p-p modulation at 370 Hz was applied to the clear electrode surface and the capacitive current (900 out-of-phase signal) was recorded as a function of time. In order to produce drops of standard size, an isochronous motor (five rotations per minute) was adjusted on top of a Metrohm type E410 HMDE. The rotation of the motor giving drops of repro-

(a)
electrolyte *waler
01 I -0.5 0 0.5 ., I 1.5 2
-E/V(vs. SCE)
01 -0.5 0 0.6 1 1.5
-E/V(vs. SCE)
(b)
-E/V(vs.SCEI
25 ,KF/crn2
It_ 0.5 set 20.
15.
IO-
UL
-0.5 0 0.5 1 1.5
-E/V (vs. SCEl
Fig. 3. Differential capacitance vs. applied potential curves, for selected time periods, of the interface formed between an HMDE and a 0.1 M Na,SO, aqueous solution of (a) 1O-5, (b) 5x10-‘, (c) 7x low5 and (d) 1O-4 M NaCh.
ducible size was controlled by the computer via a relay. The electrode surface was calibrated using Grahame’s data [27] and was found to be equal to 0.002615 cm*. Preliminary experiments proved that with this experimental set-up the drop’s size reproducibility was better than 1%. In order to have even better accuracy in ‘our results, we measured the capacitive current at the birth potential (- 1.8 V> just before the application of the potential step. This value was stored in a file on the computer disk and was used to correct for the actual drop surface. At the end of each experiment the mercury was dislodged by intense deaeration, which was controlled by an electromagnetic relay. The experiments were performed succes- sively in 10 mV intervals for the whole potential range studied (i.e. - 1.8 to 0.2 V) and the capacitive current was sampled every 5 ms. The entire C vs. E curve was afterwards constructed for selected time values.
RESULTS AND DISCUSSION
The differential capacitance vs. applied potential curves of the double layer formed between the polarized hanging mercury electrode and aqueous solutions of
228
01 J -0.5 0 0.5 1 1.5 a
-E /V(vr. SCE )
25.‘“’
20.
15.
‘O- LO
5- D
-0.5 0 0.5 1 1.5 2
-E/V(vs.SCE)
(cl
25.
20.
15-
10.
5. 10
0 -0.5 0 0.5 1 1.5 a
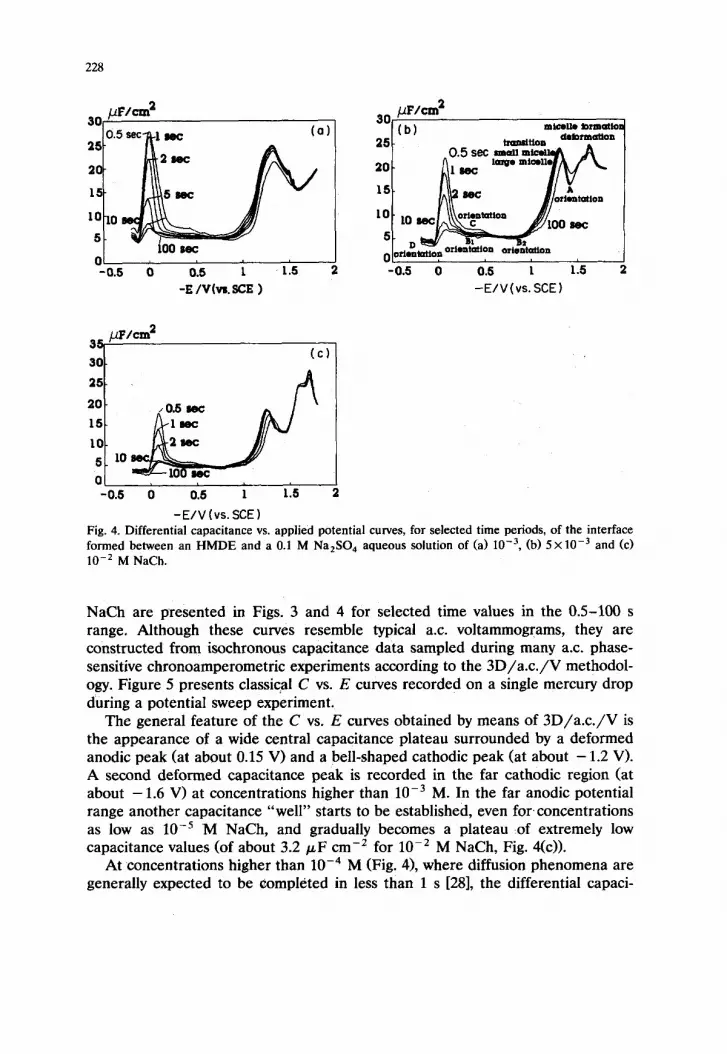
-E/V(vs.SCE) Fig. 4. Differential capacitance vs. applied potential curves, for selected time periods, of the interface formed between an HMDE and a 0.1 M Na,SO, aqueous solution of (a) 10e3, (b) 5X10m3 and (c) 10m2 M NaCh.
NaCh are presented in Figs. 3 and 4 for selected time values in the OS-100 s range. Although these curves resemble typical a.c. voltammograms, they are constructed from isochronous capacitance data sampled during many a.c. phase- sensitive chronoamperometric experiments according to the 3D/a.c./V methodol- ogy. Figure 5 presents classical C vs. E curves recorded on a single mercury drop during a potential sweep experiment.
The general feature of the C vs. E curves obtained by means of 3D/a.c./V is the appearance of a wide central capacitance plateau surrounded by a deformed anodic peak (at about 0.15 V) and a bell-shaped cathodic peak (at about - 1.2 V). A second deformed capacitance peak is recorded in the far cathodic region (at about - 1.6 V) at concentrations higher than lop3 M. In the far anodic potential range another capacitance “well” starts to be established, even for concentrations as low as 10m5 M NaCh, and gradually becomes a plateau of extremely low capacitance values (of about 3.2 PF cm-’ for lo-* M NaCh, Fig. 4(c)).
At concentrations higher than 10m4 M (Fig. 4), where diffusion phenomena are generally expected to be completed in less than 1 s [28], the differential capaci-

229
3. pF/crn2 3. ,uF/ctn2
;i & &//La) i; k jkJQtbj
0, 0 -0.5 0 0.5 1 1.5 2 -0.5 0 0.5 1 1.5 2
-E/V(vs.SCE ) -E P.‘(vs. SCE )
Fig. 5. Differential capacitance vs. applied potential curves recorded on an HMDE at an 8 mV s-l scan rate for a 0.1 M Na,SO, aqueous solution of (a) 10m4 and (b) lo-* M NaCh.
tance of the double layer keeps on changing with time. This is especially observed in the anodic part of the central capacitance plateau (from about - 0.1 to - 0.5 V) and in the region of the anodic peak (at about 0.15 V), which finally “degenerates” into a “hump”.
The C vs. E curves at long time periods (i.e. for 100 s) can safely be considered as equilibrium curves. Two concentration regions with respect to the behaviour of sodium cholate at cathodic polarizations can be defined: when the concentration is below lop3 M, a single, bell-shaped cathodic peak is recorded (at about - 1.2 V), while above 10m3 M another deformed capacitance peak is recorded. It is very interesting that the “threshold” concentration of 10e3 M, where a change in the behaviour of cholate anions on mercury is observed, is very close to 1.7 x 10v3 M, the CMC of NaCh in 0.1 M Na,SO, measured with the plate method (Fig. 6).
I I , I I
-4 -3.5 -3 -2.5 -2 -1.5
log c
Fig. 6. Surface tension vs. log(concentration) (molar) of sodium cholate in the presence of 0.1 M Na,SO,.

230
The appearance of deformed or even split-up differential capacitance peaks at cathodic polarizations on the mercury electrode is well known to be a common feature of the adsorption behaviour of almost all micelle-forming surfactants [17-211. The earlier interpretation of the phenomenon was mainly based on the idea that at concentrations at or around the CMC both micellar and monomeric entities are adsorbed on mercury at different potential values. Then, for the adsorption-desorption of each surfactant form, a different peak should be ex- pected, finally leading to the existence of merged or split-up peaks. If we accept this approach, then for concentrations higher than 10e3 M (Figs. 4(b) and 4(c) the three peaks recorded in the cathodic potential region should be attritubed to the adsorption-desorption of monomers and two types of micelles of sodium cholate. This would be compatible with the generally accepted idea that cholate salts initially associate into primary micelles which under favourable conditions further associate into secondary micelles [6-91. However, since primary cholate micelles are usually present in the pre-micellar range while in the post-micellar concentra- tion range they are completely transformed into secondary micelles, for bulk concentrations as high as lo-* M the above-mentioned three peaks should turn into two.
An alternative treatment of the adsorption of micelle-forming surfactants on mercury, based on the application of classical thermodynamics in phase changes occurring at charged interfaces, has recently been developed in our laboratory [22]. The existence of micelles within the charged interface is treated as a phase change: the transition of a saturated surface solution of monomers into a surface micellar phase. At concentrations around or above the CMC, surface micellization is likely to extend several molecular diameters within the adsorption layer, i.e. multilayer micellization. Since each micellization process leads (as any phase change on mercury does [24,29]) to a capacitance peak, the micellization within successive layers should lead to deformed or split-up peaks.
If we accept the second approach, then the deformed far cathodic peak of Figs. 4(b) and 4(c), which leads to a cathodic capacitance “well” at about - 1.4 V, corresponds to the formation-deformation of cholate surface micelles within two (at least) layers on the mercury-solution interface.
The continuous decrease in the capacitance value of the cathodic “well” with increasing bulk concentration is due perhaps to multilayer formation across the interface.
At a molecular level it is expected that the NaCh micelles in contact with the electrode surface are two-dimensional aggregates, as is also proposed for other micelle-forming anionic surfactants such as sodium dodecyl sulphate [22,30,31]. This is due to the strong orientational field and hydrophobic forces exercised upon the adsorbate by the electrode.
Thus, in the potential region where the electrode carries a considerable nega- tive charge, the adsorbed cholate anions must have their hydrophobic surface adjacent to the mercury surface and their hydrophilic surface, together with their charged -COO- groups, towards the solution. The flat orientation of cholate

231
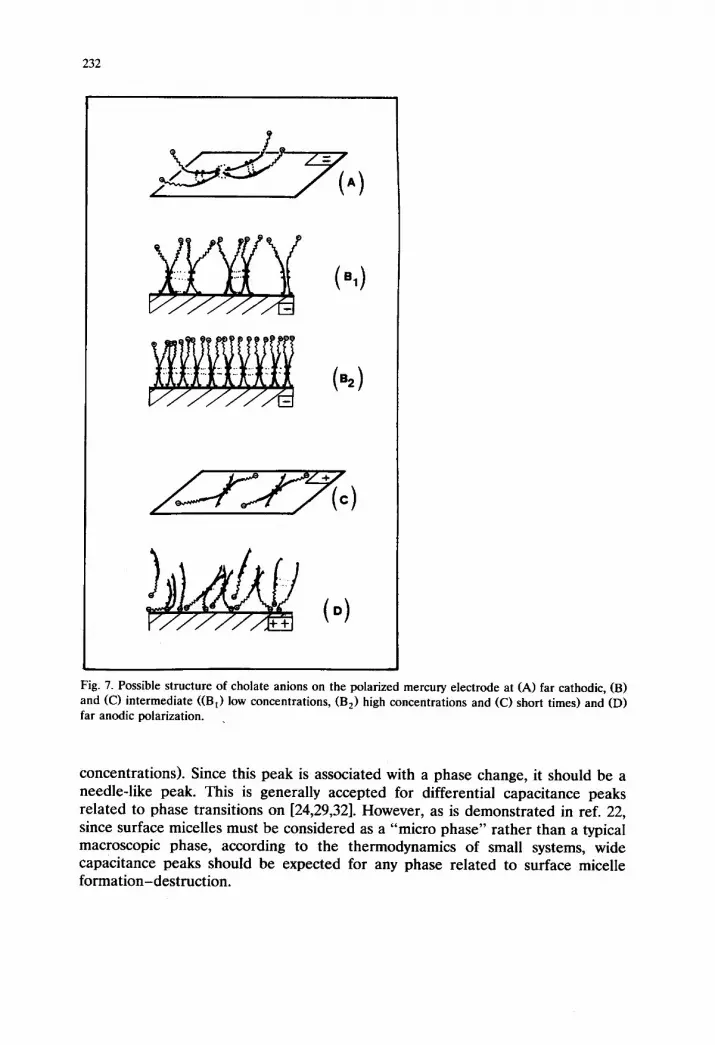
anions at cathodic polarizations was also verified by Milberg et al. [15] while studying the suppression of polarographic maxima in the presence of bile salts. These authors proposed that the adsorption at mercury involves predominantly the hydrophobic hydrocarbon portion of rings B and C, possibly also those of rings A and D, in agreement with the space-filling model. This orientation may explain the high capacitance value. Then the surface micelles formed in the far cathodic region should be flat, disk-like aggregates mainly stabilized by the hydrogen bonding of their monomeric units (Fig. 7(A)). However, we should point out that although the structure of the surface micelles is expected to be determined by the electrode charge, the micelles of the outer adsorption layers are more likely to be three-dimensional “bulk-like” micelles.
At about - 1.2 V a bell-shaped capacitance peak is encountered for both pre- and post-micellar concentrations.
At lower concentrations (lo-‘, 5 X 10F5, 7 X lo-’ MI this wide cathodic peak leads to an extended, uniform capacitance plateau which extends from about - 0.1 to - 1.00 V with a capacitance value of about 5.5 PF cm-*. We believe that the adsorbate’s state in the plateau region is that of a micellar film with its monomeric cholate units vertically oriented on the electrode and the -COO- groups directed to the solution. The surface micelles most likely result from the interaction of the cholate hydrophobic surfaces and from a limiting number of hydrogen bonds (Fig. 7(B,)). Such a situation is in complete analogy with that proposed for secondary cholate bulk micelles [6-91. Furthermore, the vertical orientation of surface micelles at intermediate polarizations rather than the flat one at cathodic polariza- tions may explain the much lower capacitance value of the central micellar plateau than that of the cathodic micellar “well”. This orientation results in an increase in the thickness of the inner layer capacitor and thus in a decrease in its capacity.
At higher concentrations (10-3, 5 x 10P3, lo-* MI the central micellar plateau is less uniform. On increasing the potential to more negative values, the capaci- tance decreases from 5.5 to about -4.7 PF cm-*. This could be explained by a further association of small surface micelles into larger and more cohesive ones through extended hydrogen bonding and hydrophobic forces (Fig. 7(B,)). For short time periods (up to 2 s) the anodic part of the central plateau lies somewhat higher (at about 5.5 PF cm-*), before finally collapsing to a value around 5 p.F cm-*. This is due perhaps to the “lag time” needed for the initially flat oriented anions at anodic polarizations (Fig. 7(C)) to reorientate to the vertical position of Fig. 7(B,) as the surface concentration increases with time. This view is also supported by the fact that the “inflection” point in the central capacitance plateau lies at around -0.5 V, the potential of zero charge of this system [15]. It is interesting that an analogous reorientation induction period was also found for SDS in the anodic region [25].
From a strictly thermodynamic point of view there seems to be an apparent inconsistency concerning the broad cathodic peak at about - 1.2 V attributed to the transition of a surface solution of monomers into a micellar film (low concen- trations) or to the transition of small surface micelles to larger ones (high
232
Fig. 7. Possible structure of cbolate anions on the polarized mercury electrode at (A) far cathodic, (B) and (0 intermediate ((B,) low concentrations, (B,) high concentrations and (C) short times) and (D) far anodic polarization.
concentrations). Since this peak is associated with a phase change, it should be a needle-like peak. This is generally accepted for differential capacitance peaks related to phase transitions on [24,29,321. However, as is demonstrated in ref. 22, since surface micelles must be considered as a “micro phase” rather than a typical macroscopic phase, according to the thermodynamics of small systems, wide capacitance peaks should be expected for any phase related to surface micelle formation-destruction.
233
At positive polarizations and at concentrations higher than 5 X 10e5 M NaCh a wide, deformed peak which depends strongly upon time connects the micellar plateau present at intermediate polarizations with a capacitance well at about 0.1 V, which becomes extremely deep as the concentration increases. According to the thermodynamics of ref. 22, such a deformed peak should be attributed to phase transitions occurring at successive sublayers of the interface. The distinction between a micellar multilayer (such as that present at cathodic and intermediate polarizations at higher concentrations) and a typical polylayer of closely packed adsorbate molecules (which we believe is the case at far positive polarizations) can only be made by means of extra thermodynamic arguments. That is, a typical polylayer is expected to be much more cohesive than a micellar film corresponding to a lower capacitance value.
At a molecular level the transition from the micellar plateau to the polylayer “well” can be vizualised as a reorientation process of the anions in direct contact with the electrode. The -COO- groups of the molecules lie on the positively charged electrode. As the bulk concentration increases, more anions are added in the interface on top of the first anions (Fig. 7(D)).
Comparison of Figs. 3(d) and 4(c) with Figs. 5(a) and 5(b) shows the differences between the C vs. E curves recorded by means of classical phase-sensitive a.c. voltammetric (i.e. potential sweep) experiments on the HDME and those recon- structed from chronoamperometric data according to 3D/a.c./V. The experimen- tal conditions were the same as those used in the 3D/a.c./V methodology. The electrode surface was clean when the scan was started. The picture is more or less the same at lower concentrations (Figs. 3(d) and 5(a)); however, at higher concen- trations there are considerable differences concerning the height and shape of the peaks, related to the formation-destruction of the central micellar plateau (Figs. 4(c) and 5(b)). That is, even at the relatively slow potential sweep rate of 8 mV s-l, typical a.c. voltammetry gives sharp peaks which could lead to the erroneous conclusion of phase changes occurring at a single interface sublayer and leading to the formation-destruction of a condensed phase [24,29,32]. However, the equilib- rium C vs. E curves recorded for periods as long as 100 s and under strictly potentiostatic conditions provide a different picture for these two peaks. The cathodic peak at about - 1.2 V obtained by 3D/a.c./V is a bell-shaped peak, indicating [22] the formation of a micellar rather than a compact film. The far cathodic peak proves to be deformed, indicating polylayer formation, and what is more, its height diminishes drastically with time. A hysteresis effect is also observed in Fig. 5.
CONCLUSIONS
The study of the adsorption of sodium cholate on the polarized mercury electrode by means of differential capacity measurements revealed the existence of deformed capacitance peaks, capacitance “wells’ and capacitance plateaux of low capacitance values. According to many empirical criteria [17-21,24,25] and recent
234
thermodynamic studies 122,281, these are indicative of association phenomena on the mercury electrode.
This means that even under the influence of the strong electric field around a charged interface (possibly including charged biological membranes), cholate an- ions are still able to aggregate through hydrophobic and hydrogen bond interac- tions.
Our new methodology, three-dimensional phase-sensitive a.c. voltammetty, is very useful for following the change in phase transition peaks and for obtaining their equilibrium shape and height. The latter is very important for the characteri- zation of a surface phase transition.
Finally, the CMC value of electrolyte solutions of NaCh can roughly be determined by the appearance of split or deformed peaks in the cathodic region of the C vs. E curves.
REFERENCES
1 J.P. Kratohvil, Adv. Colloid Interface Sci., 26 (1986) 131. 2 M.C. Carey, in I. Arias, H. Poppen, D. Schachter and D.A. Shafritz (Eds.), The Liver: Biology and
Pathobiology, Raven, New York, 1982, p. 429. 3 D.M. Small, in P.P. Nair and D. Kritchevsky fEds.1, The Bile Salts, Vol. 1, Plenum, New York, 1971,
p. 249. 4 L.R. Fisher and D.G. Oakenfull, Chem. Sot. Rev., 6 (1977) 2.5. 5 D.M. Small, in Molecular Association in Biological and Related Systems, American Chemical
Society, Washington, DC, 1968, p. 31. 6 R. Zana and D. Guveli, J. Phys. Chem., 89 (1985) 1687. 7 N.A. Mazer, M.C. Carey, R.F. Kuvasnick and G.B. Benedek, Biochemistry, 18 (1979) 3064. 8 M. Ueno, Y. Kimoto, Y. Ikeda, H. Momose and R. Zana, J. Colloid Interface Sci., 117 (1987) 179. 9 D.M. Small, S.A. Penkett and D. Chapman, Biochim. Biophys. Acta, 176 (1969) 178.
10 D.G. Oakenful and L.R. Fisher, J. Phys. Chem., 81 (1977) 1838. 11 J.P. Kratohvil, W.P. Hsu, M.A. Jacobs, T.M. Aminabhavi and Y. Mukonoki, Colloid Polym. Sci., 261
(1983) 781. 12 N.W. Tietz, J.R. Astles and O.F. Shuey, Clin. Chem., 3.5 (1989) 1688. 13 D. Lairon, G. Nalbone, H. Lafont, J. Leonardi, J.L. Vigne, C. Chabert, J.C. Hauton and R. Verger,
Biochim. Biophys. Acta, 618 (1980) 119. 14 V. Zambotti and L. Rocco, Arch. Sci. Biol., 26 (1940) 384. 15 G. Milberg, J.P. Kratohvil and P. Zuman, J. Colloid Interface Sci., 126 (1988) 63. 16 W. Kutner, B. Behr and W. Kemula, Fresenius’ Z. Anal. Chem., 312 (1982) 121. 17 D. Vollhardt, Colloid Polym. Sci., 229 (1969) 15. 18 D. Vollhardt, Colloid Polym. Sci., 254 (1976) 64. 19 H.D. Dofler and E. Miiller, Tenside Deterg., 13 (1976) 322. 20 E. Miiller and H.D. DBfler, Tenside Deterg., 14 (1977) 75. 21 E. Miiller, H. Emons and H.D. Dofler, J. Colloid Interface Sci., 79 (1981) 567. 22 P. Nikitas, S. Sotiropoulos and N. Papadopoulos, submitted to J. Phys. Chem. 23 M. Avrami, J. Chem. Phys., 7 (1939) 1103; 8 (1940) 212. 24 C. Buess-Herman, J. Electroanal. Chem., 186 (1985) 27. 25 N. Papadopoulos, S. Sotiropoulos and P. Nikitas, J. Electroanal. Chem., 324 (1992) 375. 26 G.L. Gaines, in Insoluble Monolayers at Liquid-liquid Interfaces, Wiley, New York, 1966, p. 44. 27 D. Grahame, J. Am. Chem. Sot., 71 (1949) 2975.
235
28 R. Guidelli and M.R. Moncelli, J. Electroanal. Chem., 89 (19781 2. 29 P. Nikitas, J. Electroanal. Chem., 300 (1991) 607. 30 P. Somasundaran and D.W. Fuesternau, J. Phys. Chem., 70 (1966) 90. 31 B. Damaskin, N.V. Nikolaeva-Fedorovich and R.V. Ivanova, Russ. J. Phys. Chem., 34 (1960) 894. 32 S. Sathayanarayanan and V.G. Baikerikar, J. Electroanal. Chem., 21 (196912469.