Study of hydrographs of karstic aquifers by means of correlation and cross-spectral analysis
17
Journal of Hydrology ELSEVIER Journal of Hydrology 168 (1995) 73-89 [4] Study of hydrographs of karstic aquifers by means of correlation and cross-spectral analysis Alberto Padilla, Antonio Pulido-Bosch* Departamento de Geodindmica, Facultad de Ciencias, Avda. Fuentenueva s/n, 18071 Granada, Spain Received 1 January 1994; revisionaccepted 10 October 1994 Abstract Correlation and cross-spectral analysis can be applied to the study of karstic aquifers to characterize the transformations in these systems between the input function (precipitation) and the output function (discharge). The parameters that can be deduced are the response time, the distinction between quickflow, intermediate flow and baseflow, and the mean delay. This method offers quantifiable and objective criteria for differentiation and comparisons of karstic aquifers. 1. Introduction In karstic aquifers there are usually very few wells which permit hydrogeological observation, and, when observation is possible, its validity is limited by the great complexity and discontinuity of the medium. In great part, therefore, studies on the functioning and hydrodynamics of karstic aquifers have been based on analysing the hydrograph (depletion and/or recession; Maillet, 1905; Schoeller, 1965; Drogue, 1972; Mangin, 1977; Bonacci, 1987, 1993) or on the complete hydrograph corre- sponding to an identifiable rainfall event (Galabov, 1972). Most conceptual models for karstic aquifers take into account the highly transmis- sive conduits and discontinuities together with blocks of low transmissivity, which might account for a much greater volume of the total aquifer (Kiraly, 1975; Drogue, 1980, 1992). The karstification processes acting on the most transmissive discontinu- ities end in a 'hierarchization' of the flow (Mangin, 1975; Bakalowicz, 1986) in such a way that in the recharge areas many relatively small conduits would increase in size (although also decreasing in numbers) in the direction of the groundwater flow. A well * Corresponding author. 0022-1694/95/$09.50 © 1995 - ElsevierScienceB.V. All rights reserved SSDI 0022-1694(94)02648-3
-
Upload
independent -
Category
Documents
-
view
0 -
download
0
Transcript of Study of hydrographs of karstic aquifers by means of correlation and cross-spectral analysis

Journal of Hydrology
ELSEVIER Journal of Hydrology 168 (1995) 73-89
[4]
Study of hydrographs of karstic aquifers by means of correlation and cross-spectral analysis
Alberto Padilla, Antonio Pulido-Bosch* Departamento de Geodindmica, Facultad de Ciencias, Avda. Fuentenueva s/n, 18071 Granada, Spain
Received 1 January 1994; revision accepted 10 October 1994
Abstract
Correlation and cross-spectral analysis can be applied to the study of karstic aquifers to characterize the transformations in these systems between the input function (precipitation) and the output function (discharge). The parameters that can be deduced are the response time, the distinction between quickflow, intermediate flow and baseflow, and the mean delay. This method offers quantifiable and objective criteria for differentiation and comparisons of karstic aquifers.
1. Introduction
In karstic aquifers there are usually very few wells which permit hydrogeological observation, and, when observation is possible, its validity is limited by the great complexity and discontinuity of the medium. In great part, therefore, studies on the functioning and hydrodynamics of karstic aquifers have been based on analysing the hydrograph (depletion and/or recession; Maillet, 1905; Schoeller, 1965; Drogue, 1972; Mangin, 1977; Bonacci, 1987, 1993) or on the complete hydrograph corre- sponding to an identifiable rainfall event (Galabov, 1972).
Most conceptual models for karstic aquifers take into account the highly transmis- sive conduits and discontinuities together with blocks of low transmissivity, which might account for a much greater volume of the total aquifer (Kiraly, 1975; Drogue, 1980, 1992). The karstification processes acting on the most transmissive discontinu- ities end in a 'hierarchization' of the flow (Mangin, 1975; Bakalowicz, 1986) in such a way that in the recharge areas many relatively small conduits would increase in size (although also decreasing in numbers) in the direction of the groundwater flow. A well
* Corresponding author.
0022-1694/95/$09.50 © 1995 - Elsevier Science B.V. All rights reserved SSDI 0022-1694(94)02648-3

74 A. Padilla, A. Pulido-Bosch / Journal of Hydrology 168 (1995) 73-89
in the discharge area has a higher probability of providing a greater yield than one in the recharge area (Pulido-Bosch and Castillo, 1984).
From these conceptual models of karstic aquifers, we can deduce that after intense precipitation, the flow primarily follows the most transmissive conduits ('quickftow'), whereas in depletion the relative importance of the flow through these great conduits is less, or even negligible ('baseflow'). The quantification of the relative importance of these two types of flow provides valuable information about the karstic organization of the massif. An abrupt and pronounced response to precipitation, translated into a strong discharge over a short period of time, would imply an important, well- organized karstic network which quickly drains the aquifer. Deconvolution tech- niques can be used in these calculations (Pulido-Bosch et al., 1987), although correlation and spectral analyses applied to time series of precipitation and discharge have been more frequently applied. In general, this involves daily records over four or more years, for which the hydrographs of discharge reflect numerous rainy periods and as many low-water periods. Mangin (1982a,b) has established a classification of the karstic aquifers from these techniques.
Time series analyses, as developed principally by Jenkins and Watts (1968), Hannan (1970), Brillinger (1975) and Box and Jenkins (1976) have been applied in hydrology by Delleur (1971), Yevjevich (1972), Spolia and Chander (1973), Spolia et al. (1980), Ledolter (1978), Lettenmaier (1980) and others. These works have been oriented essentially towards forecasting, completion of data and estimation of parameters of stochastic models. Methods for the description and the functioning of karstic aquifers appear in Mangin (1981), Mangin and Pulido-Bosch (1983), and Mangin (1984). These works analyze primarily the univariate spectral and the cross- correlation functions, without analyzing or going deeply into the other functions of the cross-spectral analysis.
A conventional study of a time series by correlation and spectral methods of analysis uses both univariate and cross analysis. Univariate analysis characterizes the individual structure of the time series, the functions applied being autocorre- lation (in the time domain) and spectral density (in the frequency domain). Cross analysis characterizes the transformation of an input function into an output func- tion. The cross-correlation function is analysed in the time domain, and the cross- amplitude, phase, coherence and gain functions are analysed in the frequency domain.
The interpretation of the correlation and spectral-analysis functions is not difficult when the aquifer systems studied have simple internal structures, such as homo- geneous systems of continuous porous media. In these cases, it is sufficient to follow the models and ranges of standardized validity found in the literature. However, the interpretation is complicated when dealing with heterogeneous and discontinuous aquifers, and above all where cross-spectral functions in the frequency domain must be used, as in karstic systems where the quickflow is superimposed on the baseflow.
In this study, the intent is to go deeply into the interpretation of the results obtained with correlation and cross-spectral analysis applied to the time series of precipitation and flow in four karstic springs. For a better interpretation of the functions, we begin

A. Padilla, A. Pulido-Bosch / Journal of Hydrology 168 (1995) 73-89 75
by applying correlation and spectral analysis to theoretical time series obtained by deconvolution; the kernel functions (unit hydrographs) used are intended to charac- terize extreme types of responses in springs of karstic systems that can be found in nature. A second objective includes establishing the duration of the response flow, the mean delay and the differentiation of the quickflow, intermediate flow and baseflow in the four karstic systems studied.
2. M e t h o d s
The expressions used to obtain the coefficients for correlation and cross-spectral analysis functions follow Jenkins and Watts (1968).
2.1. Cross-correlation function
Let there be two discretized chronological series: the first, xt (xl, x 2 , . . . , Xn), is the cause of the second, Y, (Yl, Yz , . . . ,Yn), where n is the total number of data pairs available. The cross-correlation function obtained with the two series is not symme- trical; that is, r+k ~ r-k. The expressions with a truncation point, m, for k = 0, 1, 2 , . . . , m, are:
Cyy(k ) (1) r+k = rxy(k ) = ~C2x(0)C2(0)
¥ - -
Cfx(k) (2) r k = ryx (k ) = ~ / C 2 ( 0 ) C 2 ( 0 )
where
1 n-k Cxy(k) = n t~=l (xt - x)(y,+k --.V) (3)
1 n-k Cyx(k) = n t~=l (y' - Y)(Xt+k -- 2) (4)
cx(o) = (x, - (5) t=l
n
Cy(O) _ 35)2 (6)
2 and 37 are the means of the series xt and Yt, respectively. The cross-correlation function r+k (Eq. (1)) represents the impulse response of the
aquifer when, as in most cases in south Europe, the rainfall series can be considered to be a white noise (Mangin and Pulido-Bosch, 1983).

76 A. Padilla, A. Pulido-Bosch / Journal of Hydrology 168 (1995) 73-89
2.2. Cross spectrum
The asymmetry of the cross-correlation function makes it necessary to express the spectral-density function with a complex number:
r x y ( f ) = laxy(f) l exp [-irbxy(f)] (7)
in which i represents x/Z-f, axy(f) and ~b~y(f) are the values of the cross amplitude and the phase functions for the frequency f , the expressions of which are:
axy(f) = V/~2y(f) + A2xy(f)
• Axy(f) ~xy(f) = a r c t a n - -
tI'x, ( f )
Where the co-spectrum, ~xy(f) , and quadrature spectrum, Axy(f), are: { m } gJxy(f ) = 2 rxy(O ) + E[rxy(k) + ryx(k)]D k cos (27rfk)
k=l
Axy(f) =2{~__l[rXy(k)-ryx(k)]Dksin(27rfk)}
(8)
(9)
(10)
(11)
in which D k is a weighting function necessary to overcome bias in the coefficients of ~xy(f) and Axy(f). Of the many weighting functions, the one which best adapts to the analysis of the hydrological series (Mangin, 1984) is that proposed by Tukey (Jenkins and Watts, 1968), which is expressed:
D k = ½ [1 + cos (~rk/m)] (12)
From the standpoint of its application to hydrological series, the cross-amplitude function, axy(f), can be associated with the duration of the impulse response func- tion, and indicates the filtering of the periodic components of the rainfall data. This characterizes the modulating effect of the aquifer in the short, medium and long term. The phase function, ~bxy(f), shows the delay, for different frequencies, between the precipitation and the flow. Its variation range is 27r, generally between -~r and +Tr. It should be taken into account that the values of 4~xy(f) = ~r + c will give values of (~xy(f) = -Tr + c in the function; this ambiguity should be interpreted according to the tendency of the function. An excessive attenuation of the input data for the system appears in the cross-amplitude and gain functions; the mean delay, d, can be obtained by the slope (equal to 27rd) of the line of best fit to:
~ x y ( f ) = 27rdf (13)
2.3. Coherence and gain functi'ons
With the cross-amplitude function (CAF) and the simple-density spectrum, new functions can be defined, such as the coherence function, nxy(f), and the gain

A. Pudilla. A. Pulido-Bosch / Journal of Hydrology 168 (1995) 73 89 77
function, G x y ( f ) , expressed as:
CtxY(f) (14) ~ x y ( f ) = x / F x ( f ) p y ( f )
a x y ( f ) (15) G x y ( f ) - v / ~ f )
where Fx ( f ) and F y ( f ) are the spectral-density functions of the series x, and y,, respectively. These can be expressed as:
1 [ m 1 Px(f) = ~ 1 + ~ Okrx(k)cos (27rfk) (16) x = l
where r~(k) is the function of autocorrelation of the xt series, expressed as:
Cx(k) (17) rx(k) -
1 n-k Cx(k) = n ~ = ( x , - ~)(xt+k - X) (18)
The coherence function shows whether variations in the output series respond to the same type of variations in the input series, and thereby indicates the correlation between the periodic variables. The gain function expresses the amplification or attenuation of the input data, attributable to the intervening system.
3. Simulated theoretical examples
With many theoretical simulations possible, we have chosen to include only three in this work, two of which are representative of extreme functioning (extremely and slightly karstified aquifers), the third being intermediate. For the input series we have used the daily rainfall recorded at the meteorological station of El Torcal from 1 September 1974 to 30 October 1981. The output series has been simulated by the following convolution function:
n
Qt = Et + Z Pt_jAj (19) j=0
where E is a random function of the same variance as P; Pt-j is the rainfall on the day t - j ; Aj are the kernel-function coefficients, for which the number and values vary in the different examples studied; in all cases the variation range is between 0 and 1. This is an error function of random characteristics. In all functions applied, the truncation point (m) has been 100.
3.1. Example 1
The results obtained in this first example are presented in Fig. 1. In this case, we

78 A. Padilla, A. Pulido-Bosch / Journal of Hydrology 168 (1995) 73-89
1
0.9
0.8
0.7
KERNEL COEFFICIENTS
0.6
0.5
0.4
0.3
0.2
0.1
0 ,-- .,- --,-- -,----, ---,----, ..... .--...---,.- , 45 40 35 30 25 20 15 10 5 0
J
0.8 Z o
0.6
o L) 0.2
, , , ,.2 o 0
o -0.2
-10 0 10 20 30 40 50
LAGS (days)
PERIOD (days)
100 20 10 5 4 2.5 20 I I I I I I
m 15
5 lO
,,=c
09 o') o 5 n- o
0 0.1 0.2 0.3 0.4 0.5
FREQUENCY
>- (0 z w rr uJ "7- 0 0
100 20 10 1
0.9
0.8
0.7
0.6
0.5
0.4
0.3
0.2
0.1
0
PERIOD (days)
5 4 2.5 ] I I I L
0.1 0.2 0.3 0.4 0.5
FREQUENCY
_Z
C9 1
PERIOD (days)
100 20 10 5 4 2.5 3 1 I I 1 I
AMPUFICATION v v v ~
PERIOD (days)
100 20 10 5 4 2.5 2 1 i i I i I I
~ 0 . 5
u.I
-0.5
0.1 0.2 0.3 0.4 0.5 0 0.1 0.2 0.3 0.4 0.5
FREQUENCY FREQUENCY
Fig. 1. Plot of the functions obtained in simulated Example 1.

A. Padilla, A. Pulido-Bosch / Journal of Hydrology 168 (1995) 73-89 79
have simulated the series with a kernel function of three coefficients having decreasing values of between 1 and 0.1 without a delay. Here the intent is to simulate an extremely karstified system which hardly modifies the input function. The rainfall does not remain in the aquifer more than 3 days and the main portion of the water exits by way of the spring during the first day.
The cross-correlation function (CCF) is very similar to the impulse response with which the output series was simulated. In the CAF, we find that at virtually no frequency does the system alter the input signal, which remains almost constant; only a small increase in the signal is detected at very low frequencies.
In the coherence function (COF), there is a small loss of correlation for frequencies above 0.33 (equivalent to periods of less than 3 days) which coincide with the duration of the kernel function introduced. For these same frequencies the gain function (GAF) indicates a greater attenuation of the signal than for the lesser frequencies.
Despite not having introduced any delay, the phase function (PHF) shows a good alignment in the frequencies of less than 0.33. For greater frequencies, considerable distortion occurs, owing to the loss of signal in these frequencies, as can be deduced from the interpretation of the GAF. Although apparently no delay has been intro- duced, it occurs in reality. It is the mean delay (time from the origin to the centre of the kernel function). The mean delay, calculated by means of the expression (13) proves to be 0.25 days. As can be seen, it is possible to calculate delays smaller than the discretization interval of the series.
3.2. Example 2
In this second example, we have simulated a drainage record on the basis of a kernel function which introduces a control into the long-term rainfall. The number of coefficients is 50, decreasing from A0 = 0.4. This case would correspond to that of a very slightly karstified system, similar to a porous medium, in which there is no quickflow. The five functions obtained applying the correlation and spectral analyses are shown in Fig. 2.
The CCF has a gentle slope, characteristic of a system where quickflow is absent; the mean delay of the response is hardly appreciable. The CAF and the GAF show how the system notably filters and attenuates the input signal at the high frequencies and increases at the low frequencies. The values of these functions decrease slowly between the frequencies 0.04 and 0.2, and reach practically null values for frequencies of over 0.2. This is equally observable in the COF. Variations in the precipitation between these two frequencies (corresponding to periods of 25 and 5 days) continue to have a response in the output signal, although it is very filtered and attenuated.
The PHF shows an alignment only at frequencies between 0 and 0.2, above which the input signal is very attenuated, distorted and incoherent. From the analysis of the slope of the function in this interval, we deduce that there is a mean delay of 14 days.
3.3. Example 3
Lastly, we have simulated an output series with the kernel function shown in Fig. 3.

8O
1
0.9
0.8
0.7
0.6
0.5
0 . 4
0.3
0.2
o.1
0
A. Padilla, A. Pulido-Bosch / Journal of Hydrology 168 (1995) 73-89
KERNEL COEFFICIENTS
45 40 35 30 25 20 15 10 5 0
J
0 . 8 z O <~ 0.6
LU n- 0.4 n" O (J 0.2 CO CO o o r r (..)
-0.2 -10 0 10 20 30 40 50
LAGS (days)
100 20 10 20 t i
w 15 r't -'3
5
co co o 5
o
0
PERIOD (days)
5 4 2.5 L I I
- ~ - . . . , . - ~ , - . . . . - . . , ~ -..7.... T - 0.1 0.2 0.3 0.4 0.5
Z Ill n" uJ "I- O O
PERIOD (days)
100 20 10 5 4 2.5 1 I ~ J 1 I
0.9
0.8
0.7
0.6
0.5
0.4
0.3
0.2
0.1
0 0 0.1 0.2 0.3 0.4 0.5
FREQUENCY FREQUENCY
100 20 10 3 I I
2
Z ,< (5
PERIOD (days)
5 4 2.5 i I I
0 . . . . . . . . , - - " - " - , - - - - ' " , ' - - - - - , - - - - - - , " - - - - - , - " - - - - , - - - - , - - - - - - - , - - - - - ,
0 0.1 0.2 0.3 0.4 0.5
2 2
PERIOD (days)
100 20 10 5 4 2.5 1 I I I I 1 t I
0.5 ,~ ,* * ** * *
x
m 0 < T
-0.5
* l . * . k "
0 0.1 0.2 0.3 0.4
FREQUENCY FREQUENCY
0.5
Fig. 2. Plot o f the funct ions ob ta ined in s imula ted Example 2.

A. Padilla, A. Pulido-Bosch / Journal of Hydrology 168 (1995) 73-89 81
1
0.9
0.8
0.7
0.6
0,5
0.4
0.3
0.2
0.1
0
KERNEL COEFFICIENTS
45 40 35 30 25 20 15 10 5 0 J
0.8 Z o_ 0.6
' " 0.4 n . - r r
8 0.2 m m 0 0 I12
~ -0.2 -10 0 10 20 30 40 50
LAGS (days)
100 20 10 20 I I
15
10
5
0
PERIOD (days)
5 4 2.5 I I I
0 0.1 0.2 0.3 0.4 0.5 0
FREQUENCY
100 20 10 1 I I
0.9
0.8 0.7
r~ 0.6 z 0.5
0.4 ~) 0.3 O 0.2
0.1
0
PERIOD (days)
5 4 2.5 2 I I I
0.1 0.2 0.3 0.4 0.5
FREQUENCY
Z
(.9 1
PERIOD (days)
100 20 10 5 4 2.5 2 3 J I I I I
100 20 10 1
0.5
m 0
I
~.5
PERIOD (days)
5 4 2.5 2
AMPLIFICATION
-1 0 0.1 0.2 0.3
0.1 0.2 0.3 0.4 0.5
FREQUENCY FREQUENCY
Fig. 3. Plot of the functions obtained in simulated Example 3.
0 . 4 0 . 5
82 A. Padilla, A. Pufido-Bosch / Journal of Hydrology 168 (1995) 73-89
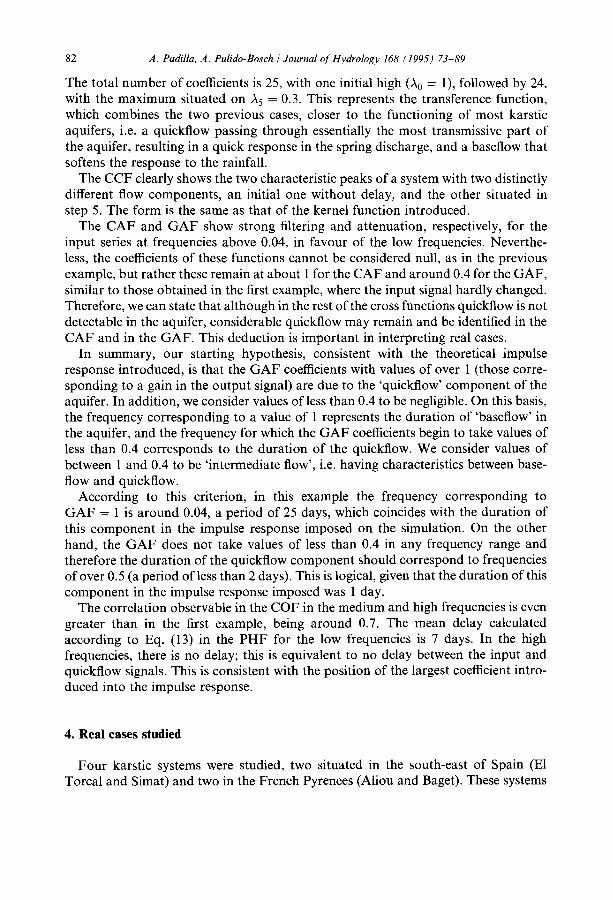
The total number of coefficients is 25, with one initial high (A0 = 1), followed by 24, with the maximum situated on A5 = 0.3. This represents the transference function, which combines the two previous cases, closer to the functioning of most karstic aquifers, i.e. a quickflow passing through essentially the most transmissive part of the aquifer, resulting in a quick response in the spring discharge, and a baseflow that softens the response to the rainfall.
The CCF clearly shows the two characteristic peaks of a system with two distinctly different flow components, an initial one without delay, and the other situated in step 5. The form is the same as that of the kernel function introduced.
The CAF and GAF show strong filtering and attenuation, respectively, for the input series at frequencies above 0.04, in favour of the low frequencies. Neverthe- less, the coefficients of these functions cannot be considered null, as in the previous example, but rather these remain at about 1 for the CAF and around 0.4 for the GAF, similar to those obtained in the first example, where the input signal hardly changed. Therefore, we can state that although in the rest of the cross functions quickflow is not detectable in the aquifer, considerable quickflow may remain and be identified in the CAF and in the GAF. This deduction is important in interpreting real cases.
In summary, our starting hypothesis, consistent with the theoretical impulse response introduced, is that the GAF coefficients with values of over 1 (those corre- sponding to a gain in the output signal) are due to the 'quickflow' component of the aquifer. In addition, we consider values of less than 0.4 to be negligible. On this basis, the frequency corresponding to a value of 1 represents the duration of 'baseflow' in the aquifer, and the frequency for which the GAF coefficients begin to take values of less than 0.4 corresponds to the duration of the quickflow. We consider values of between 1 and 0.4 to be 'intermediate flow', i.e. having characteristics between base- flow and quickflow.
According to this criterion, in this example the frequency corresponding to GAF = 1 is around 0.04, a period of 25 days, which coincides with the duration of this component in the impulse response imposed on the simulation. On the other hand, the GAF does not take values of less than 0.4 in any frequency range and therefore the duration of the quickflow component should correspond to frequencies of over 0.5 (a period of less than 2 days). This is logical, given that the duration of this component in the impulse response imposed was 1 day.
The correlation observable in the COF in the medium and high frequencies is even greater than in the first example, being around 0.7. The mean delay calculated according to Eq. (13) in the PHF for the low frequencies is 7 days. In the high frequencies, there is no delay; this is equivalent to no delay between the input and quickflow signals. This is consistent with the position of the largest coefficient intro- duced into the impulse response.
4. Real cases studied
Four karstic systems were studied, two situated in the south-east of Spain (El Torcal and Simat) and two in the French Pyrenees (Aliou and Baget). These systems

TOR
CA
L D
E
AN
TEQ
UER
A S
YS
TEM
S
IMA
T S
YS
TEM
[-.
,e,.- I
~
t'-)
__
~/
]
i i
I ~t
/
-~
.f-i
i
i i
I [
i ~"
i
' I
] [
, I
I I/J
L
"-
'/
~A
"'
i
i i
, I ~-
',~,
~...
--..
~1
I I
| I
. l~
.J
I.
),q~
1
%
I 1
I I
~1
_ l
I
I \
l
i i
l d
~ ~
~tJ
I t
' I
~'
, ~,
'
,',,
--"
~1
\,
,
, ,
| ,
a
] __
_j._
_..~
i
/l
]
J
.~
0 1
2Kin
"
I"
14
~
I~
-----~
-
0 I
ZKm
t
I
ALIO
U SY
STEM
/~
Ai~
BA
GET
SY
S?
E~
•
A1
41
7
Fig.
4.
Sim
plif
ied
geol
ogic
map
of
the
four
kar
stic
aqu
ifer
s st
udie
d.
I

84 A. Padilla, A. Pulido-Bosch / Journal of Hydrology 168 (1995) 73-89
have been shown to be fairly well isolated by surrounding impermeable materials (Mangin, 1975; Pulido-Bosch, 1979; Pulido-Bosch and Padilla, 1990). Fig. 4 is a generalized map of these four aquifers and related karst springs.
The system at E1 Torcal has a surface area of 28 km2; it is drained almost exclu- sively by the La Villa spring (Mangin and Pulido-Bosch, 1983; Pulido-Bosch and Padilla, 1990). The period studied was from 1 October 1974 to 30 September 1981; the average daily discharge for this period was 0.411 m 3 s -1, and the average daily rainfall was 2.26 mm.
We use only rainfall without taking evapotranspiration into account, owing to the difficulty in evaluating it in the studied karstic areas (Pulido-Bosch et al., 1987).
Simat aquifer has a surface area of 20 km 2, which constitutes an independent subsystem of the hydrogelogical unit of Sierra Grossa (Pulido-Bosch, 1979). The aquifer is drained mainly by the Fuente Mayor spring of which the average daily discharge was 0.224 m 3 s -l and the average daily rainfall was 2.26 mm, for the period from 1 October 1973 to 30 September 1977.
The Aliou aquifer has a surface area of 12 km 2 and is drained exclusively by the Aliou spring (Mangin, 1975). For the period studied, from 1 October 1970 to 30 September 1975, the average daily discharge was 0.467 m 3 s -1, and the average daily rainfall recorded nearby in the pluviometric station of Balague was 4.6 mm.
Baget, with a surface of 14 km 2, is drained principally by the Baget spring (Mangin, 1975). The period studied was the same as at Aliou. The average daily discharge was 0.542 m 3 s -] and, for the rainfall data, we have used the measurements of the Balague pluviometric station, which is also near this aquifer.
The aquifers studied differ markedly in certain hydrodynamic characteristics. Whereas the aquifers of the Mediterranean have a very important baseflow com- ponent, those of the Pyrenees are highly karstified and have a predominant quick- flow component (Mangin and Pulido-Bosch, 1983). For this reason, these aquifers are especially useful in establishing criteria for comparing and distinguishing quickflow
0.6
0.5
z Q 0.4
"~ 0.3 rr n- O 0.2 O co 0.1 c0 O t r 0 O
-0.1
-0.2 . . . . . . . . .
El Torcal Simat
Aliou ii Baget
',if '.
~::-:,L ¢.~k~').;-..-,..,~',, ,~
, , , , , , , , ,
-100 -80 -60 -40 -20 0 20 40 60 80 100
LAGS (days)
Fig. 5. Plot of the cross-correlation function obtained for the aquifers studied.

A. Padilla, A. Pufido-Bosch / Journal of Hydrology 168 (1995) 73 89 85
PERIOD (days) 100 20 10 5 4
2o ] I I I [
15 El Torcal ,, - . . . . . Simat
- .......... Aliou
Baget ~ lO
0 5 I,-..:,-..,' ~,; . . . .
V " , t, .."--. \ .~ . - , , ~:~- --~ . . . . . . . " " " - - - - . . . . . " - ' % r ~ , . . . - o~.~ '~"~'~.~. , .~ .......
0 0.05 0.1 0.15 0.2 0.25 0.3
FREQUENCY
Fig. 6. Plot o f the funct ion of the cross ampli tude obtained for the aquifers studied.
and baseflow, by applying the correlation and cross-spectral analysis. The truncation point used in the calculations of all the functions was 100 days.
The CCF of Fig, 5 clearly shows the difference in the response to rainfall of the four springs. The response times at Aliou and Baget proved very short, 12 and 20 days, respectively; in Simat the response time was 60-80 days, and in E1 Torcal, over 100 days. The response at Aliou and Baget was immediate, while at Simat the response was 2 days and at Torcal from 12-35 days.
At both Aliou and Baget a series of peaks in the CCF were observed after the first peak. It might appear that these were caused by one or more other flow components within the same aquifer. However, these peaks are also reflected in the negative part of the abscissa axis, giving rise to a rather symmetrical CCF, if we disregard the sharp initial descent. The response to this behavior must be sought in the slight control exercised by the system on the input function. Thus, periodic components of the rainfall are detected in the discharge. In the case of the precipitation used for the aquifers of the Pyrenees, there is a notable periodic component for the 30-day period (Padilla, 1990).
Fig. 6 presents the way in which the CAF tends to zero in E1 Torcal for frequencies above 0.05 (periods of less than 20 days). In the other three aquifers, if there is a clear decrease in the function values in middle and high frequencies in favour of the low ones, this would not totally cancel itself in Aliou and Baget. In Simat the CAF cannot be considered zero for frequencies not higher than 0.15-0.20. That is, as in Example 3, there is clearly a quickflow in these last three aquifers which is not detected at E1 Torcal, although in these there is also a baseflow.
This characteristic can be easily seen in the GA F of Fig. 7. We consider that the value 1 of the GAF coincides with the duration of the impulse response of the aquifer's baseflow component, and that the value of 0.4 corresponds with the

86
uJ (D
" r t.i
A . P a d i l l a , A . P u l i d o - B o s c h / Journal o f H y d r o l o g y 1 6 8 ( 1 9 9 5 ) 7 3 8 9
1.0
100 20 I [
F I T o m a l . . . . . . Simat . . . . . . . . . . . Aliou
PERIOD (days) 10 5 4
I I I e
. r . - o ~ • . o
c c ~
0.6
" " "t / ~ J
0.4 t t ~ , - ~ - ' - b
. z ~ - t ~ , : : : ...... ~ ". t
I , , l - - " . " " ...... ." ". ." "~ ' i "1-" ' " "~ " ~ : .... " ~ : i
o . , , . . , . . . . . . . . . . -
i'..:, j:" :".C."" -....
0,0 :: . . . . . . . . , . . . . . . . . . . . . . . . . . . . . . . . . . . . . . . . . . . . . . . . . . . . . . . . 0 0.05 0.1 0.15 0.2 0.25 0.3
FREQUENCY
Fig. 7. P lo t o f the coherence function obtained for the aquifers studied.
duration of the quickflow component, as explained above. Between these two ranges, we would find the conditions of intermediate flow. These values coincide with those obtained in the simulated examples. Transforming the frequencies into periods, we calculate, with these conditions, that the baseflow at El Torcal is 63 days, at Simat 38 days, at Aliou and Baget 24 days. The duration of the quickflow response is 38 days in E1 Torcal (this case cannot be considered quickflow, given its long duration), 9 days in Simat, 5 days in Baget, and 3 days in Aliou.
Fig. 8 confirms, as stated above, that in E1 Torcal the COG has a form very close to
>- o z LU rr
0
1.0
0.9
0.8
0.7
0.6
0.5
0.4
0.3
0.2
0.1
0.0
PERIOD (days) 100 20 10 5 4
I I I I
,x,~~# ,.. _. :,:.', • ,,~. . . ~ . , , , ~ , , j \ , - ,
"" k ! "~,..LS.,J,'. '%, ," ", t . . -~k. % --I.. ""'" """" ~'~::"~. " k z..- : '-',~ ,-,
• ~ ~ - v V : : ~ . V I . . . . . . , , ~ / - . . ~ j~ ',, : .~ ._..:..:,.~:......,
........... Aliou Baget
. . . . . . . . . , . . . . . . . . . i . . . . . . . . . i . . . . . . . . . i . . . . . . . . . , . . . . . . . .
0 0.05 0.1 0.15 0.2 0.25 0.3
FREQUENCY
Fig. 8. P lo t o f the phase function obtained for the aquifers studied.

A. Padilla, A. Pulido-Bosch / Journal of Hydrology 168 (1995) 73-89 87
z_ < (9
2.0
1 . 8
1.6
1 . 4
1.2
1.0
0.8
0.6
0.4
0.2
0.0
PERIOD (days) 100 20 10 5 4
I I I I
t L 1 i .
r:; AMPLIFICATION
El Torcal . . . . . . Simat ........... Ali0u
Baget
'."'~, ~ - ' ~ " ATTENUATION : ~: t........ :.~: • .,.-.....
, ~ i . : ' : :..
i ', ., ~ / i , i ~:. .v" . . . . . . . , -".. : " . . . 1, ~,: J , ~ \ ' . : : : ' - ..."" ~..-.
~_i i " ' " ' " ' , , '",,.,, " ~:~f~?, , . , , , ,~ J:!~i'a -" . . . ' . .---"... . . . '". ..
0.05 0.1 0.15 0.2 0.25 0.3 0.35 0.4 0.45 0.5
F R E Q U E N C Y
Fig . 9. P l o t o f t h e g a i n f u n c t i o n o b t a i n e d f o r t he a q u i f e r s s tud ied .
that obtained in the second simulated example. We find a great decrease in coherence for periods of less than 60 to 50 days. In the other three aquifers (even at Simat, where the baseflow component is quite important), the COF is maintained with relatively high values for frequencies of less than 0.25 (periods of more than 5 days), reflecting the existence of a quickflow component.
The study of the PHF (Fig. 9) obtained in these aquifers presents particularly noteworthy results. In E1 Torcal the mean delay calculated, with Eq. (13) in the low frequencies is 20 days. In the other three aquifers, it would be risky to try to calculate the delay corresponding to these first points, given the small number involved. Nevertheless, it is possible to calculate the delay in the intermediate frequencies (corresponding to the spring's response to quickflow). Conversely, in the high frequencies we have been unable to calculate the delay in E1 Torcal, given that there is no quickflow, and therefore the PHF is distorted by the attenuation of the output series. At Simat, the mean delay proved to be 1 day, while at Aliou and Baget it was 0.5 days.
5. Discussion and conclusions
The cross-correlation and cross-spectral analyses enable the study of the whole of the hydrographs of the karst springs and their relationship with the input function (precipitation, essentially), as opposed to many other methods which use only recession or another part of the hydrograph. This method could complement the deductions from correlation and simple spectral analyses and those from decon- volution (de Marsily, 1978). Nevertheless, the methodology proposed treats the series at the frequency level, and thus differentiates between short and long periods

88 A. Padilla, A. Pulido-Bosch / Journal of Hydrology 168 (1995) 73-89
of rainfall and discharge, which are impossible to differentiate using deconvolution or simple visualization of the unit hydrograph, or with any other method which does not discriminate the spectral variation.
The study of correlogram and amplitude cross functions enables us to obtain the duration of the impulse response of the karstic aquifer. The gain function allows us to differentiate quickflow, intermediate flow and base flow. As we have tried to demon- strate, the theoretic examples given have served as a basis for appropriately interpret- ing the results obtained. The delay in the responses can be deduced from the phase and coherence functions. The latter allows us to identify at which frequencies there is consistency between the input and output functions.
In view of the above, the method followed constitutes a valuable tool for identify- ing parameters and comparing karstic aquifers in an objective manner. The appli- cation of this method to four karstic aquifers situated in areas of relatively different climatic and geologic conditions, though of quite similar surface areas, has served to test the usefulness of this tool. Thus, the aquifers of Aliou and Baget are highly karstified, with flow predominating by way of very transmissive drains; neverthe- less, in Baget the less karstified sectors have greater influence. At the other extreme we find E1 Torcal, in which the quickftow is practically absent. We interpret this absence as being caused by a saturated, homogeneously karstified zone. The Simat aquifer presents characteristics which are intermediate between El Torcal and Aliou, al though quantitatively the circulation predominates through the sectors of low transmissivity.
Acknowledgment
This work was carried out in the f ramework of the project AMB92-0211, financed by the Comisi6n Interministerial de Ciencia y Tecnologia (CICYT).
References
Bakalowicz, M., 1986. De l'hydrogbologie en karstologie. Jornadas Karst Euskadi, San Sebastian, 2: 105-129.
Bonacci, O., 1987. Karst Hydrology. Springer, Berlin, 173 pp. Bonacci, O., 1993. Karst springs hydrographs as indicators of karst aquifers. Hydrol. Sci., 38:51-62. Box, G.E.P. and Jenkins, G.M., 1976. Time Series Analysis: Forecasting and Control. Holden Day, San
Francisco, CA, 575 pp. Brillinger, D.R., 1975. Time Series Data Analysis and Theory. Holt, Rinehart & Winston, New York,
500 pp. Delleur, M., 1971. D6veloppements r6cents en mati6re d'analyse des chroniques d'6v6nements hydrologi-
ques: liaison en cha~ne, analyse spectrale. Houille Blanche, 2: 147-157. de Marsily, G., 1978. De l'identification des syst6mes hydrog~ologiques. Th6se Doct. Sci. Nat. Paris VI.
215 pp. Drogue, C., 1972. Analyse statistique des hydrogrammes de d~crue des sources karstiques. J. Hydrol., 15:
49-68.

A. Padilla, A. Pulido-Bosch / Journal of Hydrology 168 (1995) 73 89 89
Drogue, C., 1980. Essai d'identification d'un type de structure de magasins carbonat6s fissur6s. Application l'interpr6tation de certains aspects du fonctionnement hydrog6ologique. Mere. S6r. Soc. G6ol. France,
11: 101-108. Drogue, C., 1992. Hydrodynamics of karstic aquifers: Experimental sites in the Mediterranean karst,
Southern France. Int. Contrib. Hydrogeol. International Association of Hydrogeologists, 13:133-149. Galabov, M., 1972. Sur l'expression math+matique des hydrogrammes des sources et le pronostic du d6bit.
Bull. Bureau de Recherches G+ologiques et Mini6res, Paris 2:51 57. Hannan, E.J., 1970. Multiple time series. Wiley, New York, 536 pp. Jenkins, G.M. and Watts, D.G., 1968. Spectral analysis and its applications. Holden Day, San Francisco,
CA 525 pp. Kiraly, L., 1975. Rapport sur l'~tat actuel des connaissances dans le domaine des caract~res physiques des
roches karstiques. In: A. Burger and L. Dubertret (Editors), Hydrogeology of Karstic Terrains. 1AH, Paris. pp. 53-67.
Ledolter, A.J., 1978. The analysis of multivariate time series applied to problems in hydrology. J. Hydrol., 36:327 352.
Lettenmaier, D.P., 1980. Intervention analysis with missing data. Water Resour. Res., 16: 159-171. Maillet, E., 1905. Essais d'hydraulique souterraine et fluviale. Hermann, Paris, 218 pp. Mangin, A., 1975. Contribution ~ l'~tude hydrodynamique des aquif~res karstiques. Th6se Doct. ~s. Sci.,
Universit6 de Dijon, Dijon (Ann. Sp61eol., 1974, 29: 283-332; 1974, 29:495 601; 1975, 30: 21-124. Mangin, A., 1977. Le karst et son originalit~ d6finie fi partir des r+sultats obtenus par l'hydrodynamique.
Speleon., 23:59 65. Mangin, A., 1981. Utilisation des analyses corr61atoire et spectrale dans l'approche des syst~mes hydro-
logiques. Computers Rendues Acad. Sci. Paris, 293:401 404. Mangin, A., 1982a. L'approche syst~mique du karst, consequences conceptuelles et m6thodologiques. Proc.
Reun. Mon. Karst Larra, pp: 141 157. Mangin, A., 1982b. Mise en 6vidence de l'originalit~ et de la diversit6 des aquif6res karstiques. Ann. Sci.
Univ. Besan~on, 1:159 172. Mangin, A., 1984. Pour une meilleure conaissance des syst6mes hydrologiques fi partir des analyses
corr61atoire et spectrale. J. Hydrol., 67: 25-43. Mangin, A. and Pulido-Bosch, A., 1983. Aplicaci6n de los an~.lisis de correlaci6n y espectral en el estudio de
los acuiferos k~trsticos. Tecniterrae, 51: 53. Padilla, A., 1990. Los modelos matem~,ticos aplicados al estudio de acuiferos k~rsticos. Tes. Doct. Univ.
Granada, 267 pp. Pulido-Bosch, A., 1979. Contribuci6n al conocimiento de la hidrogeologia del Preb6tico Nororiental
(Provincias de Valencia y Alicante). Tes. Doct. Univ. Granada, 410 pp. Pulido-Bosch, A. and Castillo, E., 1984. Quelques consid6rations sur la structure des aquif~res carbonat+s
du Levant espagnol, d'apr+s les donn6es de captages d'eau. Karstologia, 4:38 44. Pulido-Bosch, A., de Marsily, G. and Benavente, J., 1987. An~tlisis de la descarga del Torcal de Antequera
mediante deconvoluci6n. Hidrogeologia, 2: 17-28. Pulido-Bosch, A. and Padilla, A., 1990. Evaluation des ressources hydriques de l'aquif~re karstique du
Torcal de Antequera (Mfilaga, Espagne). Hidrogeologia, 5:11-22. Schoeller, H., 1965. Hydrodynamique dans le karst (~coulement de emmagasinement). Hydrog+ologie des
Roches Fissur~es. IAHS Coll. Hydrol. des Roches Fissur+es, Dubrovnik (Yougoslavie), 1: 3-20. Spolia, S.K. and Chander, S., 1973. Modelling of surface runoff systems by ARMA model. J. Hydrol., 22:
317-332. Spolia, S.K., Chander, S. and O'Connor, K.M., 1980. An autocorrelation approach for parameter estima-
tion of fractional order equal-root autoregressive models using hyper geometric functions. J. Hydrol., 47: 1-17.
Yevjevich, V., 1972. Stochastic Processes in Hydrology. Water Resources Publications, Fort Collins, CO, 302 pp.