
Leaf-shaped Lithic and Osseous Tools from Old Excavated Cave Sites Demonstrating Associations
Upload
independentCategory
view
1download
0
Study of electronic and structural features of thiosemicarbazoneand thiosemicarbazide derivatives demonstrating
anti-HSV-1 activity
Ah. Altuna,*, M. Kumrua, A. Dimoglob
aPhysics Department, Faculty of Arts and Sciences, Fatih University, 34900, B. Cekmece, Istanbul, TurkeybInstitute of Technology, PK 141, 41400, Gebze, Turkey
Received 20 December 1999; revised 13 April 2000; accepted 8 May 2000
Abstract
The structure±activity relationships (SAR) in a series of thiosemicarbazone and thiosemicarbazide derivatives (60
compounds) have been investigated by means of the Electron-Topological Method (ETM). All derivatives in the training
set are potent inhibitors of herpes simplex virus type 1 (HSV-1) replication (C. Shipman, S.H. Smith, J.C. Drach, D.L. Klayman,
Antiviral Research, 6 (1986) 197±222). On the basis of geometrical and electronic data calculated for each compound and
arranged in a matrix form, two features of activity and three breaks of activity have been revealed. By means of the method of
multivariable regression a quantitative model was built to express the activity dependence on some physicochemical and
structural parameters. q 2001 Elsevier Science B.V. All rights reserved.
Keywords: Structure±activity relationships (SAR); Electron topological method (ETM); Herpes simplex virus (HSV); Inhibitory activity
1. Introduction
In 1950 Hamre et al. [2] found that derivatives of
benzaldehyde thiosemicarbazone were active against
neurovaccinial infection in mice when given orally. It
was the ®rst study on the antiviral activity of thiose-
micarbazones that prompted further investigation of
their properties. The thiosemicarbazone of isatin was
found strongly active [3]. A clinical trial of the
N-methyl derivative of isatin-b-thiosemicarbazone
(methisazone) was carried out in India [4±6]. These
studies have been widely accepted as evidence of the
effective antiviral activity of methisazone in humans
[7]. Even though the drug has been used to treat
patients with genital lesions caused by herpes simplex
virus (HSV), it had little effect on the severity or
duration of the lesions [8].
Sidwell and co-workers evaluated a series of purine
analogs as antiviral agents [9]. This was the ®rst report
of a substituted thiosemicarbazone being active
against a herpes virus. Brockman and co-workers
examined the effect of heterocyclic thiosemicarba-
zones such as pyridine, isochinoline, purine, and isatin
derivatives on HSV. They found that only those
compounds were active in which the thiosemicar-
bazide moiety was af®xed to the heterocyclic ring
in the alpha position relative to the ring nitrogen
[10].
The synthesis of new compounds that can be used
as drugs in everyday life is one of the most important
tasks of molecular design. Detailed considerations
Journal of Molecular Structure (Theochem) 535 (2001) 235±246
0166-1280/01/$ - see front matter q 2001 Elsevier Science B.V. All rights reserved.
PII: S0166-1280(00)00582-0
www.elsevier.nl/locate/theochem
* Corresponding author.
E-mail address: [email protected] (Ah. Altun).

limited by the expenses required for experts,
laboratory equipment and millions of animals used
in experiments are necessary when testing the
compounds on bio-receptors. That is why computer-
ized approaches are widely used for biological activ-
ities investigation at present. The so called
ªStructure±Activity Relationship (SAR)º studies are
mainly based upon establishing correlation between
structures of compounds and their activities, compu-
ter-assisted screening and the activity prognostication,
prior to experiments [11,12].
In this study, a series of thiosemicarbazones of 2-
acetylpyridine, 2-acetylquinoline, 1-acetylisoquino-
line, and related compounds (Tables 1 and 2) have
been investigated as inhibitors of herpes simplex
virus-1 (HSV-1) by means of ETM for SAR
studies.
2. Materials and methods
SAR investigations were performed with the aid of
a modi®ed version of the Electron Topological
Method (ETM)[13±17]. ETM deals with three-
dimensional discrete characterizations of molecular
structures. When compared with the majority of
other approaches to SAR study, ETM shows the
following advantages:
1. ETM is capable of processing series of compounds
with quite diverse structures.
2. ETM estimates the activity qualitatively, but quan-
titative estimation can be also done after this, if
needed. Meanwhile in the frameworks of the
other SAR methods just quantitative study can be
applied.
Ah. Altun, et al. / Journal of Molecular Structure (Theochem) 535 (2001) 235±246236
Table 1
Skeleton types of the compounds in the training set
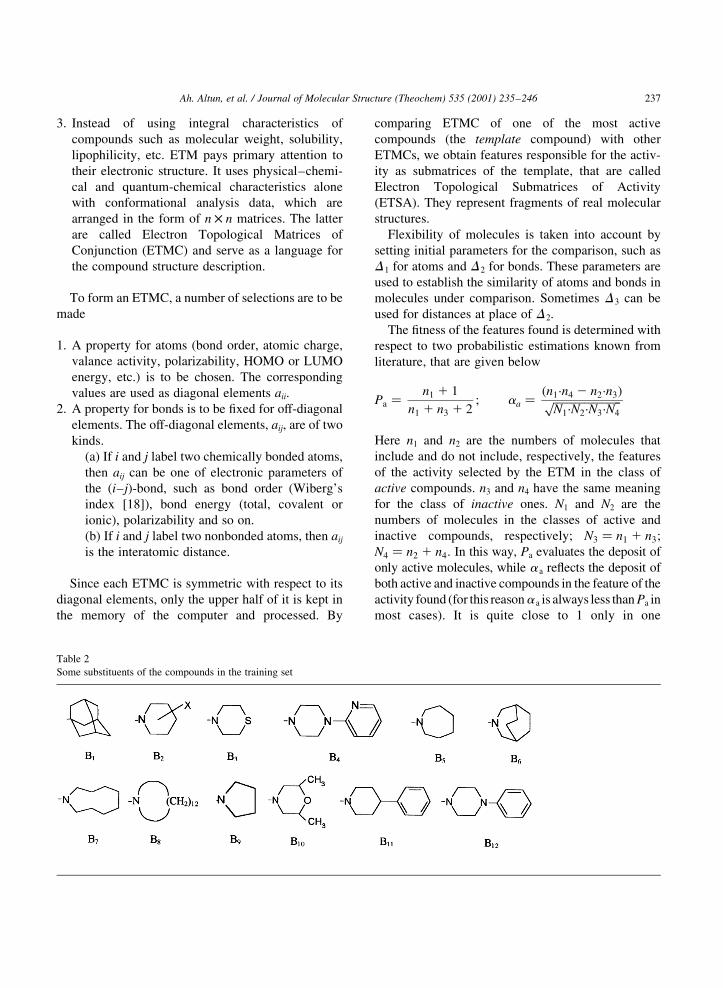
3. Instead of using integral characteristics of
compounds such as molecular weight, solubility,
lipophilicity, etc. ETM pays primary attention to
their electronic structure. It uses physical±chemi-
cal and quantum-chemical characteristics alone
with conformational analysis data, which are
arranged in the form of n £ n matrices. The latter
are called Electron Topological Matrices of
Conjunction (ETMC) and serve as a language for
the compound structure description.
To form an ETMC, a number of selections are to be
made
1. A property for atoms (bond order, atomic charge,
valance activity, polarizability, HOMO or LUMO
energy, etc.) is to be chosen. The corresponding
values are used as diagonal elements aii.
2. A property for bonds is to be ®xed for off-diagonal
elements. The off-diagonal elements, aij, are of two
kinds.
(a) If i and j label two chemically bonded atoms,
then aij can be one of electronic parameters of
the (i±j)-bond, such as bond order (Wiberg's
index [18]), bond energy (total, covalent or
ionic), polarizability and so on.
(b) If i and j label two nonbonded atoms, then aij
is the interatomic distance.
Since each ETMC is symmetric with respect to its
diagonal elements, only the upper half of it is kept in
the memory of the computer and processed. By
comparing ETMC of one of the most active
compounds (the template compound) with other
ETMCs, we obtain features responsible for the activ-
ity as submatrices of the template, that are called
Electron Topological Submatrices of Activity
(ETSA). They represent fragments of real molecular
structures.
Flexibility of molecules is taken into account by
setting initial parameters for the comparison, such as
D 1 for atoms and D 2 for bonds. These parameters are
used to establish the similarity of atoms and bonds in
molecules under comparison. Sometimes D 3 can be
used for distances at place of D 2.
The ®tness of the features found is determined with
respect to two probabilistic estimations known from
literature, that are given below
Pa � n1 1 1
n1 1 n3 1 2; aa � �n1´n4 2 n2´n3�����������������
N1´N2´N3´N4
p
Here n1 and n2 are the numbers of molecules that
include and do not include, respectively, the features
of the activity selected by the ETM in the class of
active compounds. n3 and n4 have the same meaning
for the class of inactive ones. N1 and N2 are the
numbers of molecules in the classes of active and
inactive compounds, respectively; N3 � n1 1 n3;
N4 � n2 1 n4: In this way, Pa evaluates the deposit of
only active molecules, while a a re¯ects the deposit of
both active and inactive compounds in the feature of the
activity found (for this reasona a is always less than Pa in
most cases). It is quite close to 1 only in one
Ah. Altun, et al. / Journal of Molecular Structure (Theochem) 535 (2001) 235±246 237
Table 2
Some substituents of the compounds in the training set
ªidealº case, namely, when all active compounds
and none of inactive ones include the feature
under estimation.
To ®nd the features of activity, the steps listed
below are to be carried out [19,20]. By this, it is
presupposed that we have a proper series of
compounds, active alone with inactive ones, whose
structures are known, activities evaluated quantita-
tively (or, at least, qualitatively as 1 or 0). The steps
are:
1. Make quantum chemistry calculations and geo-
metry optimization for a training set.
2. Fix a property for atoms and a property for bonds.
Form ETMC for every compound (active or inac-
tive), based on the results obtained at Step 1.
3. Choose a template compound (one of the most
active ones, if known).
4. Choose desirable level of activity to split all the
series into classes of activity (initially into two
classes, but, possibly, more than two) and para-
meters D 1 and D 2.
5. Compare the template chosen with the rest of
molecules. If the features selected are not represen-
tative enough, change some of the initial para-
meters or all of them (the template, D i, level of
activity, properties for atoms and bonds).
6. After obtaining satisfactory features, take a testing
set of molecules and repeat all previous steps. If the
same features of the activity are found with the
same values of probabilities as at the last step of
the training set investigation, the features are
Ah. Altun, et al. / Journal of Molecular Structure (Theochem) 535 (2001) 235±246238
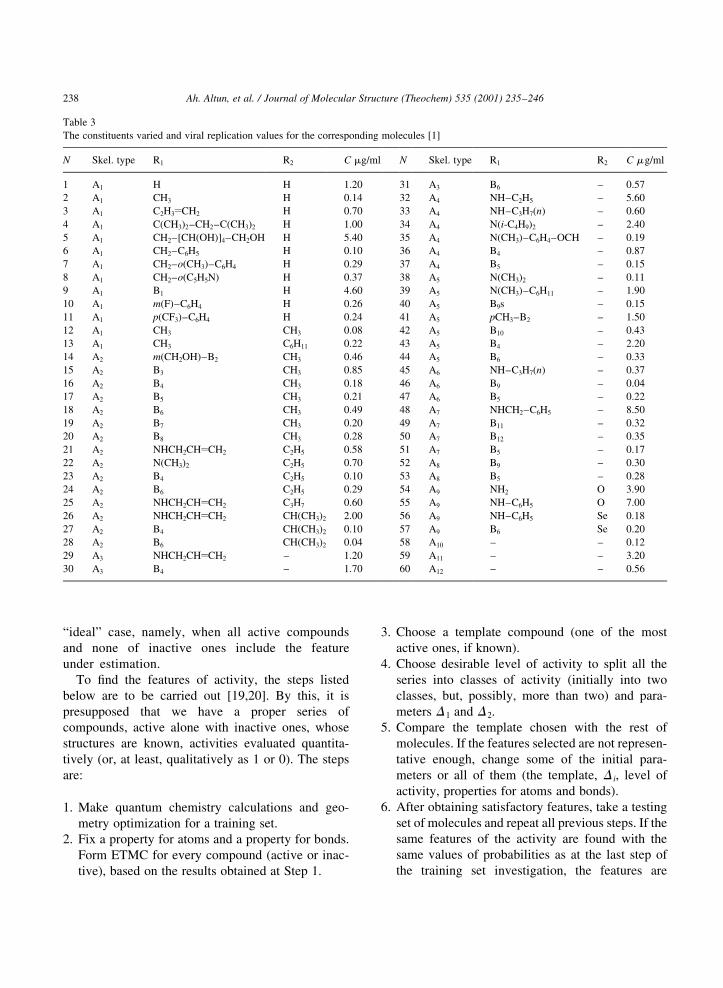
Table 3
The constituents varied and viral replication values for the corresponding molecules [1]
N Skel. type R1 R2 C mg/ml N Skel. type R1 R2 C mg/ml
1 A1 H H 1.20 31 A3 B6 ± 0.57
2 A1 CH3 H 0.14 32 A4 NH±C2H5 ± 5.60
3 A1 C2H3yCH2 H 0.70 33 A4 NH±C3H7(n) ± 0.60
4 A1 C(CH3)2±CH2±C(CH3)2 H 1.00 34 A4 N(i-C4H9)2 ± 2.40
5 A1 CH2±[CH(OH)]4±CH2OH H 5.40 35 A4 N(CH3)±C6H4±OCH ± 0.19
6 A1 CH2±C6H5 H 0.10 36 A4 B4 ± 0.87
7 A1 CH2±o(CH3)±C6H4 H 0.29 37 A4 B5 ± 0.15
8 A1 CH2±o(C5H5N) H 0.37 38 A5 N(CH3)2 ± 0.11
9 A1 B1 H 4.60 39 A5 N(CH3)±C6H11 ± 1.90
10 A1 m(F)±C6H4 H 0.26 40 A5 B9s ± 0.15
11 A1 p(CF3)±C6H4 H 0.24 41 A5 pCH3±B2 ± 1.50
12 A1 CH3 CH3 0.08 42 A5 B10 ± 0.43
13 A1 CH3 C6H11 0.22 43 A5 B4 ± 2.20
14 A2 m(CH2OH)±B2 CH3 0.46 44 A5 B6 ± 0.33
15 A2 B3 CH3 0.85 45 A6 NH±C3H7(n) ± 0.37
16 A2 B4 CH3 0.18 46 A6 B9 ± 0.04
17 A2 B5 CH3 0.21 47 A6 B5 ± 0.22
18 A2 B6 CH3 0.49 48 A7 NHCH2±C6H5 ± 8.50
19 A2 B7 CH3 0.20 49 A7 B11 ± 0.32
20 A2 B8 CH3 0.28 50 A7 B12 ± 0.35
21 A2 NHCH2CHyCH2 C2H5 0.58 51 A7 B5 ± 0.17
22 A2 N(CH3)2 C2H5 0.70 52 A8 B9 ± 0.30
23 A2 B4 C2H5 0.10 53 A8 B5 ± 0.28
24 A2 B6 C2H5 0.29 54 A9 NH2 O 3.90
25 A2 NHCH2CHyCH2 C3H7 0.60 55 A9 NH±C6H5 O 7.00
26 A2 NHCH2CHyCH2 CH(CH3)2 2.00 56 A9 NH±C6H5 Se 0.18
27 A2 B4 CH(CH3)2 0.10 57 A9 B6 Se 0.20
28 A2 B6 CH(CH3)2 0.04 58 A10 ± ± 0.12
29 A3 NHCH2CHyCH2 ± 1.20 59 A11 ± ± 3.20
30 A3 B4 ± 1.70 60 A12 ± ± 0.56
considered appropriate for the activity prediction.
If not, then the more profound study of the features
violation is to be undertaken, and all the steps are to
be repeated again. If no testing series, the sliding
examination can be carried out instead.
The procedure for searching features of inactivity,
or ªbreaks of activityº, is the same as the one for the
features of activity selection. The only difference is
that the template compound is an inactive one.
In this study, the compounds whose viral replica-
tion values are smaller than 0.4 have been presup-
posed to be active. The training set (see Table 3)
includes 32 active and 28 inactive compounds. A
molecular mechanics program (MMX) [21] and a
semi-empirical quantum-chemical approach (CNDO/
2) [22,23] were used to determine structural and elec-
tronic parameters for each compound in the series.
Their results were used to form electron-topological
matrices of conjunction (ETMC). To validate the
features obtained, the sliding examination has been
carried out.
3. Results and discussion
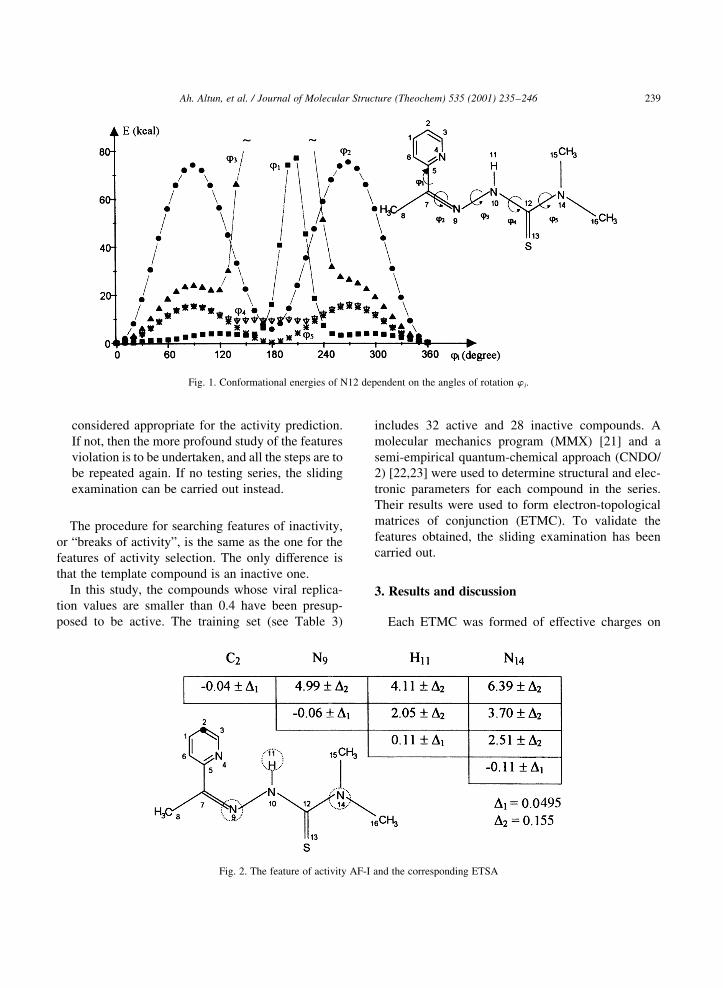
Each ETMC was formed of effective charges on
Ah. Altun, et al. / Journal of Molecular Structure (Theochem) 535 (2001) 235±246 239
Fig. 2. The feature of activity AF-I and the corresponding ETSA
Fig. 1. Conformational energies of N12 dependent on the angles of rotation w i.
atoms (Qii), the Wiberg's indices (Wij) for chemically
bonded atoms, and optimized distances between
chemically nonbonded atoms in molecules (Rij). The
electronic charges are given in electronic charge unit
e, and the distances are given in AÊ .
Structures of the molecules under study were opti-
mized, and the rotation of separate groups of atoms
around the most labile bonds was taken into account
to make an unambiguous choice among possible
conformations. As an example, dependence of the
rotation energies on the values of rotation angles
(w 1±w 5) is shown in Fig. 1 for the molecule N12.
For w 2 and w 5 at 1808 there exists a minimum close
to the minimum at 08. The w 5 rotation of 1808 results
in the same conformation since each CH3 replaces the
other one. The w 2 rotation proceeds under high values
of energy of the internal rotation barrier. Hence, the
energy of the given conformation is less than the one
obtained when w 2 rotation is performed with 1808.Since the rotation for w 3 is suppressed, it is more
pro®table to leave the system in its initial position.
For the w 1 and w 4 rotations, the given conformation
is more stable again.
After comparing all the compounds with template
Ah. Altun, et al. / Journal of Molecular Structure (Theochem) 535 (2001) 235±246240
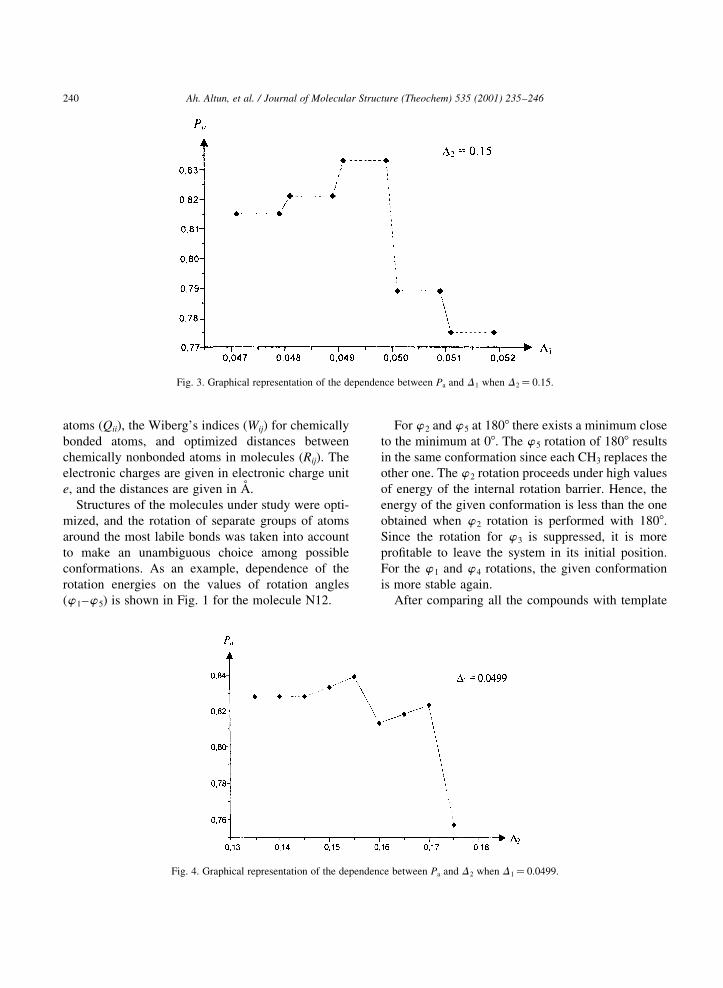
Fig. 4. Graphical representation of the dependence between Pa and D 2 when D1� 0.0499.
Fig. 3. Graphical representation of the dependence between Pa and D 1 when D2� 0.15.
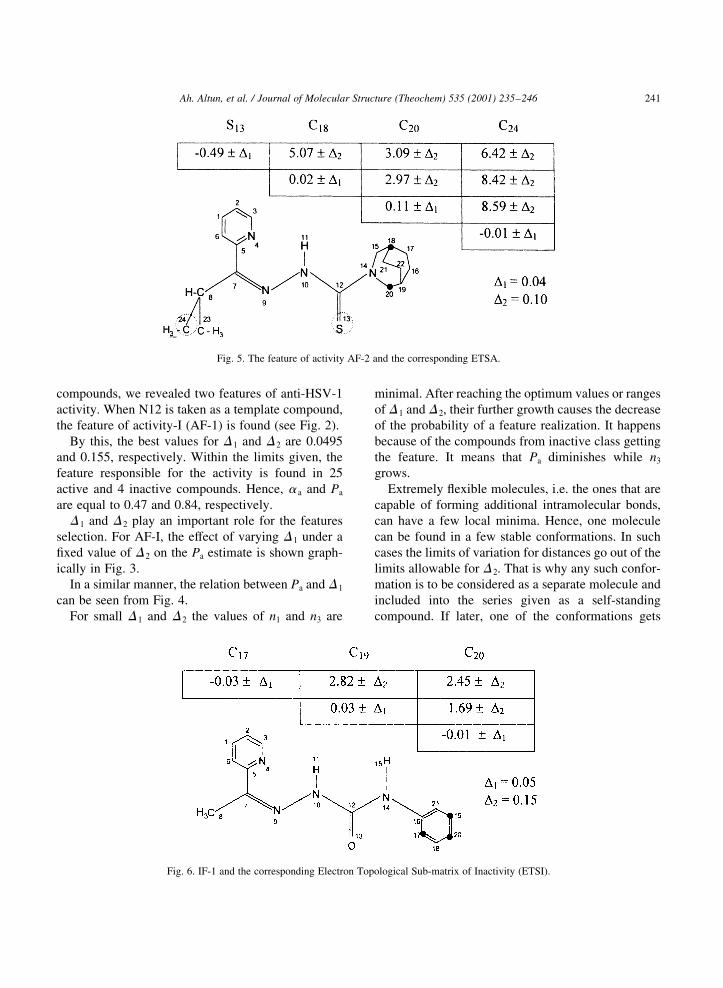
compounds, we revealed two features of anti-HSV-1
activity. When N12 is taken as a template compound,
the feature of activity-I (AF-1) is found (see Fig. 2).
By this, the best values for D 1 and D 2 are 0.0495
and 0.155, respectively. Within the limits given, the
feature responsible for the activity is found in 25
active and 4 inactive compounds. Hence, a a and Pa
are equal to 0.47 and 0.84, respectively.
D 1 and D 2 play an important role for the features
selection. For AF-I, the effect of varying D 1 under a
®xed value of D 2 on the Pa estimate is shown graph-
ically in Fig. 3.
In a similar manner, the relation between Pa and D 1
can be seen from Fig. 4.
For small D 1 and D 2 the values of n1 and n3 are
minimal. After reaching the optimum values or ranges
of D 1 and D 2, their further growth causes the decrease
of the probability of a feature realization. It happens
because of the compounds from inactive class getting
the feature. It means that Pa diminishes while n3
grows.
Extremely ¯exible molecules, i.e. the ones that are
capable of forming additional intramolecular bonds,
can have a few local minima. Hence, one molecule
can be found in a few stable conformations. In such
cases the limits of variation for distances go out of the
limits allowable for D 2. That is why any such confor-
mation is to be considered as a separate molecule and
included into the series given as a self-standing
compound. If later, one of the conformations gets
Ah. Altun, et al. / Journal of Molecular Structure (Theochem) 535 (2001) 235±246 241
Fig. 6. IF-1 and the corresponding Electron Topological Sub-matrix of Inactivity (ETSI).
Fig. 5. The feature of activity AF-2 and the corresponding ETSA.
the feature of activity while others do not possess the
feature, it means that this active conformation is char-
acteristic of the molecule in reality.
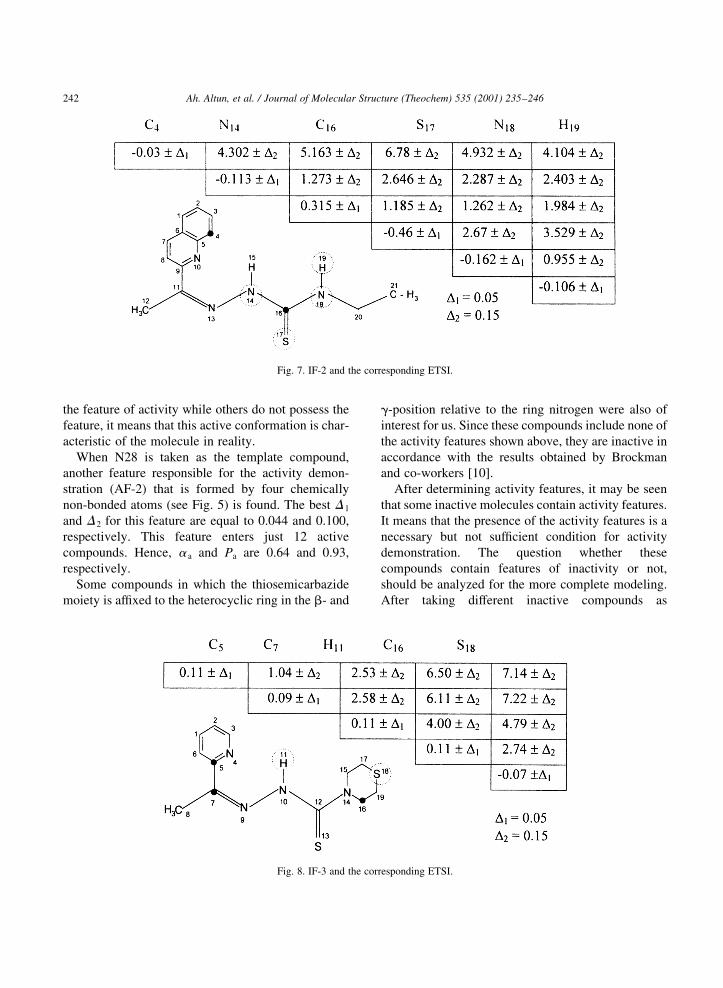
When N28 is taken as the template compound,
another feature responsible for the activity demon-
stration (AF-2) that is formed by four chemically
non-bonded atoms (see Fig. 5) is found. The best D 1
and D 2 for this feature are equal to 0.044 and 0.100,
respectively. This feature enters just 12 active
compounds. Hence, a a and Pa are 0.64 and 0.93,
respectively.
Some compounds in which the thiosemicarbazide
moiety is af®xed to the heterocyclic ring in the b- and
g-position relative to the ring nitrogen were also of
interest for us. Since these compounds include none of
the activity features shown above, they are inactive in
accordance with the results obtained by Brockman
and co-workers [10].
After determining activity features, it may be seen
that some inactive molecules contain activity features.
It means that the presence of the activity features is a
necessary but not suf®cient condition for activity
demonstration. The question whether these
compounds contain features of inactivity or not,
should be analyzed for the more complete modeling.
After taking different inactive compounds as
Ah. Altun, et al. / Journal of Molecular Structure (Theochem) 535 (2001) 235±246242
Fig. 8. IF-3 and the corresponding ETSI.
Fig. 7. IF-2 and the corresponding ETSI.
templates, three features of inactivity have been
revealed.
Inactivity feature IF-1 is found when the molecule
N55 is chosen as the template compound (see Fig. 6).
The most satisfactory result is obtained when
D 1� 0.05 and D 2� 0.15. This feature is found in 12
inactive compounds of the training set. None of the
active compounds includes this feature. As a result,
probabilistic estimates a a and Pa are 0.56 and 0.93,
respectively.
Inactivity feature IF-2, found when the template
compound is N32, enters just 9 inactive compound
(see Fig. 7). Hence, the probabilistic estimations a a
and Pa are 0.45 and 0.91, respectively. D 1 and D 2
appeared to be the same as in IF-1.
The third inactivity feature (IF-3) is found when the
template compound is N15 (see Fig. 8). It enters just 7
inactive compounds. D 1 and D 2 are again as in IF-1.
Probabilistic estimations a a and Pa are 0.4 and 0.89,
respectively.
Shipman et al. [1] have demonstrated that the
azomethine bond reduction in a molecule (i.e. conver-
sion of a thiosemicarbazone to thiosemicarbazide) did
not produce a proportional decrease in the antiviral
activity. With the activity features found as a result
of the ETM application, the reason of this becomes
more understandable.
The azomethine bond (i.e. the bond between the
atoms 7 and 9 shown in Figs. 2, 5, 6 and 8) does not
affect anti-HSV-1 activity directly since both activity
features do not contain chemically bonded atoms
and all the inactivity features are not related to
that bond.
The analysis of the found features shows that the
presence of a hydrophobic part in the form of aliphatic
groups (alkanes, cycloalkanes or any their deriva-
tives) is necessary for the activity demonstration by
a molecule. The size of the cyclic groups (R1) does not
in¯uence the level of activity in view. The groups'
symmetrical arrangement relative to the nitrogen
atom is the most desirable one. Obviously, the groups
are capable of hydrophobic interaction with the corre-
sponding bio-receptor.
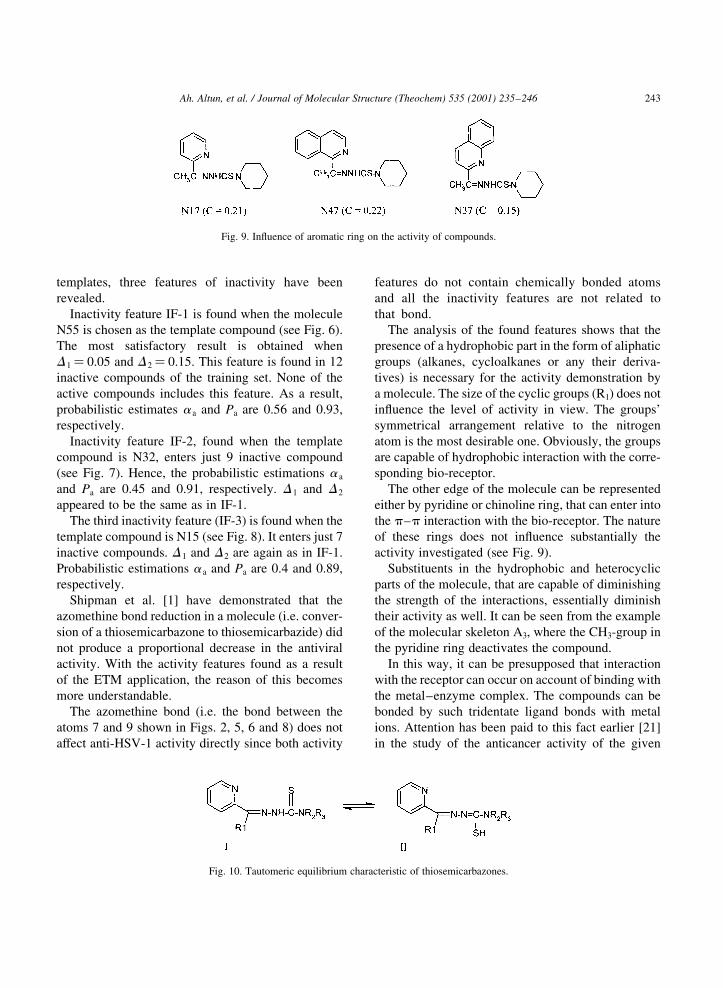
The other edge of the molecule can be represented
either by pyridine or chinoline ring, that can enter into
the p±p interaction with the bio-receptor. The nature
of these rings does not in¯uence substantially the
activity investigated (see Fig. 9).
Substituents in the hydrophobic and heterocyclic
parts of the molecule, that are capable of diminishing
the strength of the interactions, essentially diminish
their activity as well. It can be seen from the example
of the molecular skeleton A3, where the CH3-group in
the pyridine ring deactivates the compound.
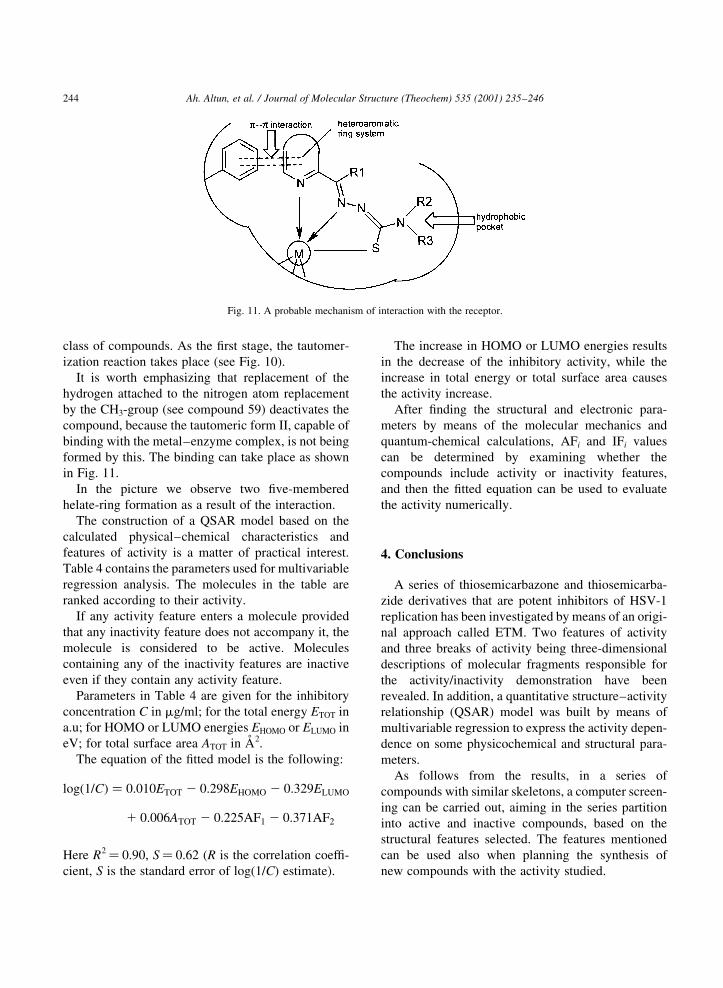
In this way, it can be presupposed that interaction
with the receptor can occur on account of binding with
the metal±enzyme complex. The compounds can be
bonded by such tridentate ligand bonds with metal
ions. Attention has been paid to this fact earlier [21]
in the study of the anticancer activity of the given
Ah. Altun, et al. / Journal of Molecular Structure (Theochem) 535 (2001) 235±246 243
Fig. 10. Tautomeric equilibrium characteristic of thiosemicarbazones.
Fig. 9. In¯uence of aromatic ring on the activity of compounds.
class of compounds. As the ®rst stage, the tautomer-
ization reaction takes place (see Fig. 10).
It is worth emphasizing that replacement of the
hydrogen attached to the nitrogen atom replacement
by the CH3-group (see compound 59) deactivates the
compound, because the tautomeric form II, capable of
binding with the metal±enzyme complex, is not being
formed by this. The binding can take place as shown
in Fig. 11.
In the picture we observe two ®ve-membered
helate-ring formation as a result of the interaction.
The construction of a QSAR model based on the
calculated physical±chemical characteristics and
features of activity is a matter of practical interest.
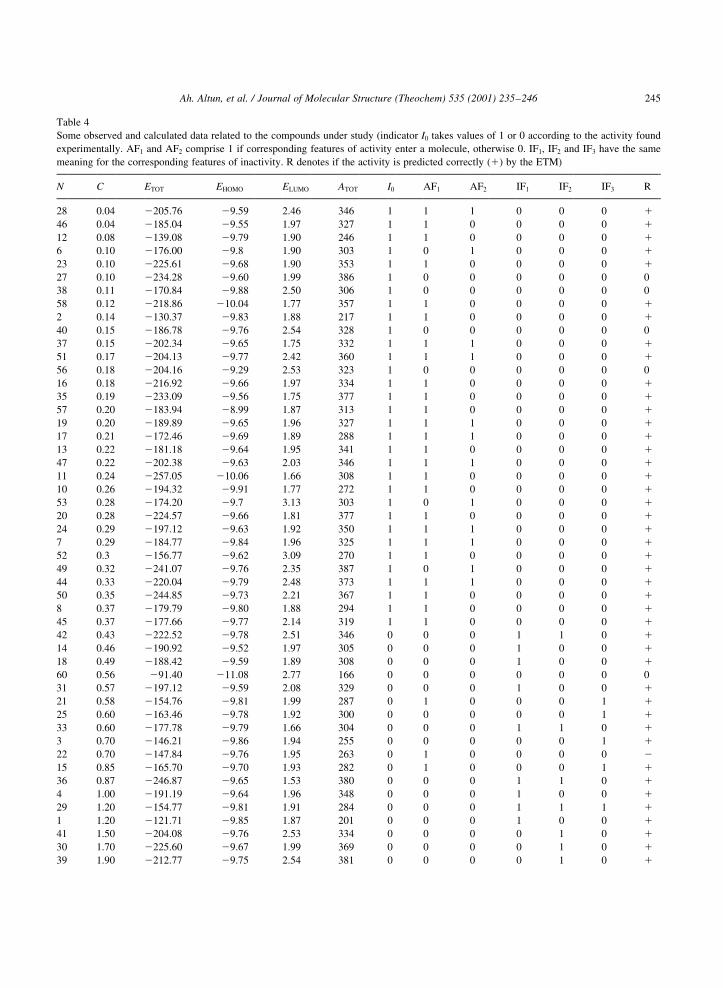
Table 4 contains the parameters used for multivariable
regression analysis. The molecules in the table are
ranked according to their activity.
If any activity feature enters a molecule provided
that any inactivity feature does not accompany it, the
molecule is considered to be active. Molecules
containing any of the inactivity features are inactive
even if they contain any activity feature.
Parameters in Table 4 are given for the inhibitory
concentration C in mg/ml; for the total energy ETOT in
a.u; for HOMO or LUMO energies EHOMO or ELUMO in
eV; for total surface area ATOT in AÊ 2.
The equation of the ®tted model is the following:
log�1=C� � 0:010ETOT 2 0:298EHOMO 2 0:329ELUMO
1 0:006ATOT 2 0:225AF1 2 0:371AF2
Here R2� 0.90, S� 0.62 (R is the correlation coef®-
cient, S is the standard error of log(1/C) estimate).
The increase in HOMO or LUMO energies results
in the decrease of the inhibitory activity, while the
increase in total energy or total surface area causes
the activity increase.
After ®nding the structural and electronic para-
meters by means of the molecular mechanics and
quantum-chemical calculations, AFi and IFi values
can be determined by examining whether the
compounds include activity or inactivity features,
and then the ®tted equation can be used to evaluate
the activity numerically.
4. Conclusions
A series of thiosemicarbazone and thiosemicarba-
zide derivatives that are potent inhibitors of HSV-1
replication has been investigated by means of an origi-
nal approach called ETM. Two features of activity
and three breaks of activity being three-dimensional
descriptions of molecular fragments responsible for
the activity/inactivity demonstration have been
revealed. In addition, a quantitative structure±activity
relationship (QSAR) model was built by means of
multivariable regression to express the activity depen-
dence on some physicochemical and structural para-
meters.
As follows from the results, in a series of
compounds with similar skeletons, a computer screen-
ing can be carried out, aiming in the series partition
into active and inactive compounds, based on the
structural features selected. The features mentioned
can be used also when planning the synthesis of
new compounds with the activity studied.
Ah. Altun, et al. / Journal of Molecular Structure (Theochem) 535 (2001) 235±246244
Fig. 11. A probable mechanism of interaction with the receptor.
Ah. Altun, et al. / Journal of Molecular Structure (Theochem) 535 (2001) 235±246 245
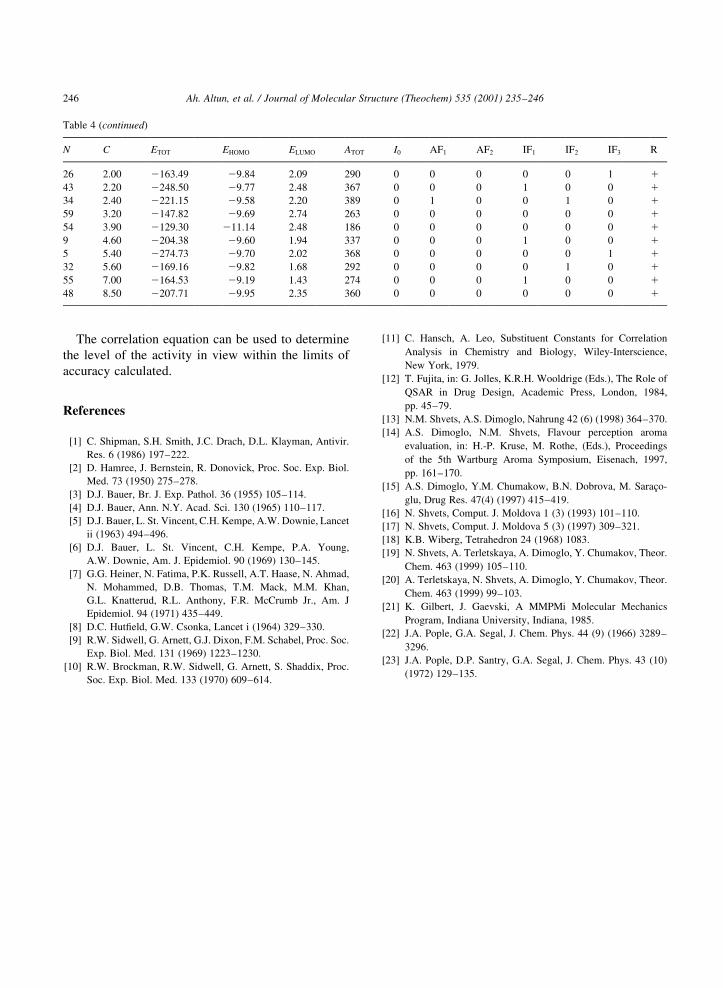
Table 4
Some observed and calculated data related to the compounds under study (indicator I0 takes values of 1 or 0 according to the activity found
experimentally. AF1 and AF2 comprise 1 if corresponding features of activity enter a molecule, otherwise 0. IF1, IF2 and IF3 have the same
meaning for the corresponding features of inactivity. R denotes if the activity is predicted correctly (1) by the ETM)
N C ETOT EHOMO ELUMO ATOT I0 AF1 AF2 IF1 IF2 IF3 R
28 0.04 2205.76 29.59 2.46 346 1 1 1 0 0 0 1
46 0.04 2185.04 29.55 1.97 327 1 1 0 0 0 0 1
12 0.08 2139.08 29.79 1.90 246 1 1 0 0 0 0 1
6 0.10 2176.00 29.8 1.90 303 1 0 1 0 0 0 1
23 0.10 2225.61 29.68 1.90 353 1 1 0 0 0 0 1
27 0.10 2234.28 29.60 1.99 386 1 0 0 0 0 0 0
38 0.11 2170.84 29.88 2.50 306 1 0 0 0 0 0 0
58 0.12 2218.86 210.04 1.77 357 1 1 0 0 0 0 1
2 0.14 2130.37 29.83 1.88 217 1 1 0 0 0 0 1
40 0.15 2186.78 29.76 2.54 328 1 0 0 0 0 0 0
37 0.15 2202.34 29.65 1.75 332 1 1 1 0 0 0 1
51 0.17 2204.13 29.77 2.42 360 1 1 1 0 0 0 1
56 0.18 2204.16 29.29 2.53 323 1 0 0 0 0 0 0
16 0.18 2216.92 29.66 1.97 334 1 1 0 0 0 0 1
35 0.19 2233.09 29.56 1.75 377 1 1 0 0 0 0 1
57 0.20 2183.94 28.99 1.87 313 1 1 0 0 0 0 1
19 0.20 2189.89 29.65 1.96 327 1 1 1 0 0 0 1
17 0.21 2172.46 29.69 1.89 288 1 1 1 0 0 0 1
13 0.22 2181.18 29.64 1.95 341 1 1 0 0 0 0 1
47 0.22 2202.38 29.63 2.03 346 1 1 1 0 0 0 1
11 0.24 2257.05 210.06 1.66 308 1 1 0 0 0 0 1
10 0.26 2194.32 29.91 1.77 272 1 1 0 0 0 0 1
53 0.28 2174.20 29.7 3.13 303 1 0 1 0 0 0 1
20 0.28 2224.57 29.66 1.81 377 1 1 0 0 0 0 1
24 0.29 2197.12 29.63 1.92 350 1 1 1 0 0 0 1
7 0.29 2184.77 29.84 1.96 325 1 1 1 0 0 0 1
52 0.3 2156.77 29.62 3.09 270 1 1 0 0 0 0 1
49 0.32 2241.07 29.76 2.35 387 1 0 1 0 0 0 1
44 0.33 2220.04 29.79 2.48 373 1 1 1 0 0 0 1
50 0.35 2244.85 29.73 2.21 367 1 1 0 0 0 0 1
8 0.37 2179.79 29.80 1.88 294 1 1 0 0 0 0 1
45 0.37 2177.66 29.77 2.14 319 1 1 0 0 0 0 1
42 0.43 2222.52 29.78 2.51 346 0 0 0 1 1 0 1
14 0.46 2190.92 29.52 1.97 305 0 0 0 1 0 0 1
18 0.49 2188.42 29.59 1.89 308 0 0 0 1 0 0 1
60 0.56 291.40 211.08 2.77 166 0 0 0 0 0 0 0
31 0.57 2197.12 29.59 2.08 329 0 0 0 1 0 0 1
21 0.58 2154.76 29.81 1.99 287 0 1 0 0 0 1 1
25 0.60 2163.46 29.78 1.92 300 0 0 0 0 0 1 1
33 0.60 2177.78 29.79 1.66 304 0 0 0 1 1 0 1
3 0.70 2146.21 29.86 1.94 255 0 0 0 0 0 1 1
22 0.70 2147.84 29.76 1.95 263 0 1 0 0 0 0 2
15 0.85 2165.70 29.70 1.93 282 0 1 0 0 0 1 1
36 0.87 2246.87 29.65 1.53 380 0 0 0 1 1 0 1
4 1.00 2191.19 29.64 1.96 348 0 0 0 1 0 0 1
29 1.20 2154.77 29.81 1.91 284 0 0 0 1 1 1 1
1 1.20 2121.71 29.85 1.87 201 0 0 0 1 0 0 1
41 1.50 2204.08 29.76 2.53 334 0 0 0 0 1 0 1
30 1.70 2225.60 29.67 1.99 369 0 0 0 0 1 0 1
39 1.90 2212.77 29.75 2.54 381 0 0 0 0 1 0 1
The correlation equation can be used to determine
the level of the activity in view within the limits of
accuracy calculated.
References
[1] C. Shipman, S.H. Smith, J.C. Drach, D.L. Klayman, Antivir.
Res. 6 (1986) 197±222.
[2] D. Hamree, J. Bernstein, R. Donovick, Proc. Soc. Exp. Biol.
Med. 73 (1950) 275±278.
[3] D.J. Bauer, Br. J. Exp. Pathol. 36 (1955) 105±114.
[4] D.J. Bauer, Ann. N.Y. Acad. Sci. 130 (1965) 110±117.
[5] D.J. Bauer, L. St. Vincent, C.H. Kempe, A.W. Downie, Lancet
ii (1963) 494±496.
[6] D.J. Bauer, L. St. Vincent, C.H. Kempe, P.A. Young,
A.W. Downie, Am. J. Epidemiol. 90 (1969) 130±145.
[7] G.G. Heiner, N. Fatima, P.K. Russell, A.T. Haase, N. Ahmad,
N. Mohammed, D.B. Thomas, T.M. Mack, M.M. Khan,
G.L. Knatterud, R.L. Anthony, F.R. McCrumb Jr., Am. J
Epidemiol. 94 (1971) 435±449.
[8] D.C. Hut®eld, G.W. Csonka, Lancet i (1964) 329±330.
[9] R.W. Sidwell, G. Arnett, G.J. Dixon, F.M. Schabel, Proc. Soc.
Exp. Biol. Med. 131 (1969) 1223±1230.
[10] R.W. Brockman, R.W. Sidwell, G. Arnett, S. Shaddix, Proc.
Soc. Exp. Biol. Med. 133 (1970) 609±614.
[11] C. Hansch, A. Leo, Substituent Constants for Correlation
Analysis in Chemistry and Biology, Wiley-Interscience,
New York, 1979.
[12] T. Fujita, in: G. Jolles, K.R.H. Wooldrige (Eds.), The Role of
QSAR in Drug Design, Academic Press, London, 1984,
pp. 45±79.
[13] N.M. Shvets, A.S. Dimoglo, Nahrung 42 (6) (1998) 364±370.
[14] A.S. Dimoglo, N.M. Shvets, Flavour perception aroma
evaluation, in: H.-P. Kruse, M. Rothe, (Eds.), Proceedings
of the 5th Wartburg Aroma Symposium, Eisenach, 1997,
pp. 161±170.
[15] A.S. Dimoglo, Y.M. Chumakow, B.N. Dobrova, M. SaracËo-
glu, Drug Res. 47(4) (1997) 415±419.
[16] N. Shvets, Comput. J. Moldova 1 (3) (1993) 101±110.
[17] N. Shvets, Comput. J. Moldova 5 (3) (1997) 309±321.
[18] K.B. Wiberg, Tetrahedron 24 (1968) 1083.
[19] N. Shvets, A. Terletskaya, A. Dimoglo, Y. Chumakov, Theor.
Chem. 463 (1999) 105±110.
[20] A. Terletskaya, N. Shvets, A. Dimoglo, Y. Chumakov, Theor.
Chem. 463 (1999) 99±103.
[21] K. Gilbert, J. Gaevski, A MMPMi Molecular Mechanics
Program, Indiana University, Indiana, 1985.
[22] J.A. Pople, G.A. Segal, J. Chem. Phys. 44 (9) (1966) 3289±
3296.
[23] J.A. Pople, D.P. Santry, G.A. Segal, J. Chem. Phys. 43 (10)
(1972) 129±135.
Ah. Altun, et al. / Journal of Molecular Structure (Theochem) 535 (2001) 235±246246
Table 4 (continued)
N C ETOT EHOMO ELUMO ATOT I0 AF1 AF2 IF1 IF2 IF3 R
26 2.00 2163.49 29.84 2.09 290 0 0 0 0 0 1 1
43 2.20 2248.50 29.77 2.48 367 0 0 0 1 0 0 1
34 2.40 2221.15 29.58 2.20 389 0 1 0 0 1 0 1
59 3.20 2147.82 29.69 2.74 263 0 0 0 0 0 0 1
54 3.90 2129.30 211.14 2.48 186 0 0 0 0 0 0 1
9 4.60 2204.38 29.60 1.94 337 0 0 0 1 0 0 1
5 5.40 2274.73 29.70 2.02 368 0 0 0 0 0 1 1
32 5.60 2169.16 29.82 1.68 292 0 0 0 0 1 0 1
55 7.00 2164.53 29.19 1.43 274 0 0 0 1 0 0 1
48 8.50 2207.71 29.95 2.35 360 0 0 0 0 0 0 1
Copyright © 2022 FDOKUMEN


![SAR of a series of anti-HSV-1 acridone derivatives, and a rational acridone-based design of a new anti-HSV-1 3 H-benzo[ b]pyrazolo[3,4- h]-1,6-naphthyridine series](https://static.fdokumen.com/doc/165x107/631beba7665120b3330b99e5/sar-of-a-series-of-anti-hsv-1-acridone-derivatives-and-a-rational-acridone-based.jpg)