Characterization of Wear Mechanisms in Sintered Fe-1.5 Wt % Cu Alloys

A
spawi©
K
1
nBtfiojuie
essrca
0d
Electrochimica Acta 52 (2007) 6799–6810
Study of Cu–18Ni–20Zn Nickel Silver and other Cu-based alloysin artificial sweat and physiological solution
Ingrid Milosev a,b,∗,1, Tadeja Kosec a
a Jozef Stefan Institute, Department of Physical and Organic Chemistry, Jamova 39, Ljubljana SI-1000, Sloveniab Orthopaedic Hospital Valdoltra, Jadranska c. 31, Ankaran SI-6280, Slovenia
Received 22 December 2006; received in revised form 25 April 2007; accepted 26 April 2007Available online 6 May 2007
bstract
The electrochemical behaviour of ternary Nickel Silver Cu–18Ni–20Zn alloy has been investigated in artificial sweat and in Ringer physiologicalolution. The characteristics of binary Cu–20Zn and Cu–20Ni alloys and pure metal components have been compared under electrochemicalolarization. The solid and dissolved products formed on the ternary Cu–18Ni–20Zn alloy have been analysed by X-ray photoelectron spectroscopy
nd polarographic methods, respectively. In the low potential region (E < 0 V) the surface layer consists primarily of a thin cuprous oxide layer,hereas at high positive potentials (E > 0 V) the layer is composed of a thick copper chloride/oxychloride layer. Its formation is accompanied byncreased dissolution of zinc and nickel.2007 Elsevier Ltd. All rights reserved.
S; Co
ss
witoeetlscoar
eywords: Nickel Silver; Potentiodynamic polarization; Metal dissolution; XP
. Introduction
Nickel Silver is a general term for alloys that contain copper,ickel and zinc. Other common names are German Silver, Nickelronze and Alpaca Silver. The alloys are hard, corrosion resis-
ant and ductile, and contain no elemental silver. Nickel Silverrst became popular as a base metal for silver plated cutlery andther silverware, notably electro-plated Nickel Silver (EPNS),ewellery and coins (e.g., 1-euro). Its industrial and technicalses include marine fittings and plumbing fixtures because ofts corrosion resistance, and heating coils because of its highlectrical resistance.
The release of nickel from the present 1- and 2-euro coinsxceeds the acceptable value for prolonged contact with humankin by a factor of between 240 and 320 [1] more than the EUtandard [2]. The 1-euro coin consists of a yellow nickel-brass
ing and a white cupro-nickel inner pill, and the 2-euro coin aupro-nickel ring and nickel brass pill [1]. Part of the problemppears to be the bimetallic structure of these coins. An XPS∗ Corresponding author. Tel.: +386 1 4773 452; fax: +386 1 4773 822.E-mail address: [email protected] (I. Milosev).
1 ISE member.
aCpN[
Ci
013-4686/$ – see front matter © 2007 Elsevier Ltd. All rights reserved.oi:10.1016/j.electacta.2007.04.105
pper alloys
tudy showed a clear nickel enrichment of both pill and ringurfaces [3].
Because many of its applications involve prolonged contactith human skin, for example in jewellery, nickel dissolution
s important since nickel is often responsible for allergic reac-ions, such as contact dermatitis [4]. Release of Ni from nickelr nickel-plated metals has been documented [5]. Haudrechyt al. studied the release of nickel from stainless steels bylectrochemical experiments, leaching tests and clinical patchests [6]. Whereas AISI 304, AISI 316 and AISI 430 stain-ess steels release nickel in very small amounts, resulphurisedtainless steel AISI 303 releases nickel in large amounts, espe-ially at acidic pH, which was ascribed to the dissolutionf MnS inclusions accompanied by nickel. Ni-plated steels,s well as pure nickel, have been shown to elicit strongeactions in patients [6]. Colin et al. studied copper–nickellloys with different nickel contents, Cu–2Ni–10Zn–5Sn,u–23Ni–12Zn–2.5Sn and Ni–32Cu–2Fe, and identified cop-er(I) oxide containing chloride ions as the main surface product.i-rich alloys also contained Ni-compounds, Ni(OH)2, and NiO
7].The electrochemical behaviour of binary Cu–Ni [9–13] and
u–Zn [14–19] alloys in chloride containing solutions has beennvestigated extensively, and is beyond the scope of the present

6 himic
pNpoiwCbCswdctetiaa
2
2
(ACo1ifwbew
wcalCsm
2
tipir1vs−
Ctc
Mssijosm
2e
cfpdcsta[dotmwtt
dCibmtccict4inN≈ssc
800 I. Milosev, T. Kosec / Electroc
aper. The electrochemical behaviour of ternary alloys likeickel Silver has not attracted any significant attention. In ourrevious publication we compared the polarization behaviourf binary Cu-based alloys and ternary Cu–18Ni–20Zn alloyn borate buffer containing chloride ions [20]. In the presentork we investigated the electrochemical behaviour of ternaryu–18Ni–20Zn alloy in artificial sweat and compared it with theehaviour of the related binary alloys, Cu–20Ni and Cu–20Zn.u–18Ni–20Zn alloy was also studied in Ringer physiological
olution. Electrochemical measurements were complementedith measurement of the concentration of metal ions dissolveduring potentiostatic oxidation at the potentials of interest. Thehemical composition of the surface layer formed during elec-rochemical oxidation was also analysed. Such an approach hasnabled us to understand the processes occurring during elec-rochemical polarization in these two physiological solutions, todentify the solid and dissolved products formed and, finally, toccess possible physiological reactions of Cu–18–20Zn ternarylloy.
. Experimental details
.1. Materials and solutions
Three copper-based alloys were used: Cu–18Ni–20ZnGoodfellow, Cambridge Ltd., UK), Cu–20Zn (Wieland-WerkeG, Ulm, Germany) and Cu–20Ni (Zlatarna Celje, Slovenia).opper (99.9%), nickel (99%) and zinc specimens (98.8%) werebtained from Goodfellow, Cambridge Ltd., UK. Samples of5 mm diameter were cut from the sheet and served as work-ng electrodes. The thickness of all sheets was 2.0 mm exceptor Cu–18Ni–20Zn, which was 0.6 mm. Samples were abradedith emery papers down to 4000 SiC, cleaned in an ultrasonicath for 2 min and finally rinsed with distilled water. They werembedded in a Teflon holder so that only one side of the sampleas exposed to the solution.Measurements were performed at 37 ◦C in a glass cell
ith a thermostatic jacket in the following solutions: artifi-ial sweat (AS) (0.5% NaCl, 0.1% lactic acid and 0.1% urea,djusted to pH 6.5 with ammonia [2], and Ringer physio-ogical solution (RPS) (8.60 g NaCl, 0.3 g KCl and 0.33 gaCl2·2H2O in 1 L, pH 7.4, commercialized by B. Braun, Mel-
ungen, Germany). The solutions were not deaerated during theeasurements.
.2. Electrochemical measurements
To investigate corrosion parameters the sample was allowedo stabilize at open circuit potential, Eoc, for 1 h. Linear polar-zation was measured in the range ± 20 mV from Eoc, using aotential scan rate of 0.1 mV/s, to determine the value of polar-zation resistance, Rp. Anodic polarization curves were thenecorded, starting at −0.25 V versus Eoc and increasing up to
.1 V versus SCE using a potential scan rate of 1 mV/s. Cyclicoltammograms were recorded at a scan rate of 10 mV s−1. Thetart potentials were as follows: −1.6 V for Zn, −1.4 V for Ni,1.35 V for Cu–18Ni–20Zn and −1.3 V for Cu, Cu–20Zn andaO1[
a Acta 52 (2007) 6799–6810
u–20Ni. The curves were always recorded in the anodic direc-ion up to the anodic potential limit and refer to the first scanycle.
Electrochemical instrumentation consisted of a PAR EG&Godel 263 potentiostat/galvanostat controlled by PowerSuite
oftware. Carbon rods and a saturated calomel electrode (SCE)erved as counter electrode and reference electrode respectively,n a three-electrode 300 ml corrosion cell with a thermostaticacket. Potentials in the text refer to the SCE scale unless statedtherwise. After electrochemical measurement, the electrodeurface was checked routinely with an Olympus BX 51 opticalicroscope.
.3. X-ray photoelectron spectroscopy analysis followinglectrochemical polarization
The sample Cu–18N–20Zn was scanned potentiodynami-ally in artificial sweat and in RPS, at a scan rate of 10 mV/srom −1.2 V to two final potentials: −0.2 and 0.5 V. The sam-le was then held potentiostatically for 300 s, then rinsed andried. The composition of the surface layer formed by electro-hemical polarization was investigated by X-ray photoelectronpectroscopy (XPS) using a TFA Physical Electronics Inc. spec-rometer with Al K� radiation (1486.6 eV) and a hemisphericalnalyzer. The experimental details were previously described in17]. After taking the surface spectra, depth profiles of the oxi-ized layers were determined. An Ar+ ion beam with energyf 1 keV and a raster of 3 mm × 3 mm was used for sput-ering. This resulted in a sputtering rate of about 1 nm/min
easured relative to the Ta2O5 standard [21]. The value athich the intensity of the oxygen signal reaches half that of
he intensity at the surface is taken as a measure of the layerhickness.
Cu and Zn XPS spectra were deconvoluted as previouslyescribed in detail [17,18]. In the case of cuprous oxide, theu 2p3/2 signal is located at a binding energy, Eb, of 932.5 eV,
dentical to that of copper metal (within ± 0.1 eV). Species coulde differentiated based on Auger [Cu(L3M4,5M4,5)] spectra. Theetal shows an Auger peak at Eb of 568.5 eV, while in Cu2O
his peak is located at 571.2 eV. Cuprous and cupric oxidesan be distinguished in the photoelectron spectra, since cupricompounds show two strong shake-up peaks located approx-mately 10 eV above the principal Cu 2p3/2 peak. Similar toopper, Auger [Zn(L3M4,5M4,5)] spectra allowed Zn and ZnOo be differentiated. The Auger line for Zn is identified at Eb of94.2 eV, and that for ZnO at 500.0 eV. In contrast, the chem-cal shift between Zn and ZnO XPS 2p3/2 of only 0.2 eV doesot enable differentiation between these two oxidation states.i metal shows a main 2p3/2 peak at 852.9 eV and a satellite6.5 eV above it at 859.4 eV. Ni(II) oxide shows a complex
tructure, including the main oxide peak at 853.5 eV and twoatellite peaks at 856.3 and 861.5 eV [22]. The position of theentre of the O 1s peak depends on the hydration of the layer,
nd shifts from 532.5 to 530.1 eV as O2− species prevail overH− and H2O. The centre of the Cl 2p3/2 peak is located at99 eV, in accordance with the formation of metal chlorides23].
himic
2e
spscwaaEsps
n(1bsstt(pfi
srdMstapstp
MaT(a
dwr
dNsdcwr
p(
3
3
a(wpsAtccc−1.2 V for Ea > −1.0 V. The anodic peaks of nickel are locatedat more positive potentials than for zinc, as expected from ther-modynamic data [25]. In artificial sweat two anodic peaks at−0.44 and −0.08 V, are observed and a small cathodic peak at
I. Milosev, T. Kosec / Electroc
.4. Measurement of dissolved metal ions released duringlectrochemical polarization
The Cu–18N–20Zn sample was abraded and rinsed in theame manner as for electrochemical measurements. It waslaced in an electrochemical cell containing artificial sweat,tepped from Eoc to the potential of interest, Et, and then keptonstant potentiostatically at Et for up to 6 h. Three values of Etere chosen according to the cyclic voltammogram: −0.2, −0.1
nd 0 V. During potentiostatic oxidation at Et −0.2 and −0.1 V,liquots of 1.5 ml were taken every hour, and every 20 min att of 0 V. Shortly before the aliquot was taken, the solution wastirred to achieve homogeneity. Each aliquot was transferred byipette directly to the polarographic cell containing 8.5 ml ofupporting electrolyte.
Nickel was determined in a supporting electrolyte of ammo-ium chloride buffer (8 ml NH3 and 0.8 ml HCl concentratedSuprapur grade, Merck, Darmstadt) in 100 ml distilled water.00 �l of 0.1 mol/L dimethylglyoxime (DMG) solution preparedy dissolving the appropriate amount of DMG (Merck, Darm-tadt) in 96% ethanol (Carlo Erba, Milan) was added to theupporting electrolyte prior to measurements. The solution washen stirred and de-aerated with nitrogen for 1 min. The concen-ration of nickel was determined using square wave voltammetrySWV) with the following parameters: scan increment 4 mV,ulse height 50 mV, frequency 100 Hz, initial potential −0.4 V,nal potential −1.6 V.
The concentrations of copper and zinc were determinedimultaneously in 0.2 M ammonium citrate buffer, (4.25 g cit-ic acid monohydrate (Merck, Darmstadt) dissolved in 100 mlistilled water) adjusted to pH 3.0 with NH3 (Suprapur grade,erck, Darmstadt). Prior to measurement the solution was
tirred and de-aerated with nitrogen for 3 min. The concentra-ions of copper and zinc were determined using a differentialnodic pulse stripping (DAPS) technique with the followingarameters: initial potential −1.3 V, final potential −0.05 V,can increment 2 mV, deposition time 60 s, deposition poten-ial −1.3 V, pulse height 50 mV. Details of the experimentalrocedure are published [24].
Polarographic instrumentation consisted of a PAR EG&Godel 394 Model Trace Analysis System, a Model 303A cell,
nd Model 394S software for data sampling and analysis.he three-electrode system comprised a hanging mercury drop
HMDE) as working electrode, an Ag/AgCl reference electrodend a Pt counter electrode.
The concentration of the sample was determined by the stan-ard addition method. The current of the peaks increased linearlyith the additions. Concentrations of dissolved metal ions are
eported as the average of two samples.Working Ni(II), Cu(II) and Zn(II) solutions were prepared
aily from 1000 mg/l CertiPur standard solutions of Cu(NO3)2,i(NO3)2 and Zn(NO3)2 in 0.5 mol/l HNO3 (Merck, Darm-
tadt). All solutions were prepared with de-ionized and double
istilled water. Strict precautions were taken in order to keepontamination to a minimum. Voltammetric flasks were filledith HNO3 (65%), heated on a hot plate for 30 min at 60 ◦C,insed carefully with distilled water, then dried and stored inFs
a Acta 52 (2007) 6799–6810 6801
olyethylene bags. All other glassware was washed in HNO365%), rinsed, dried and stored in polyethylene bags.
. Results
.1. Electrochemical measurements
Cyclic voltammograms recorded for Zn, Cu and Ni met-ls in artificial sweat (AS) and Ringer physiological solutionRPS) are compared in Fig. 1. The anodic potential limits, Ea,ere −0.9 V for Zn, 0 V for Cu, and 0.4 V for Ni. The anodicarts of the cyclic voltammograms recorded for zinc in the twoolutions are similar. Zinc shows an anodic peak at −1.15 V inS and −1.25 V in RPS. These values are close to the poten-
ials of ZnO formation at pH values 6.5 and 7.4, respectively,alculated from thermodynamic data [25]. The correspondingathodic peak is located at −1.25 V. In Ringer solution twoathodic peaks are observed, at −1.35 V for Ea < −1.0 V, and at
ig. 1. Cyclic voltammograms recorded for Zn, Ni and Cu metals in (a) artificialweat and (b) Ringer physiological solution. dE/dt = 10 mV/s.
6 himic
−fbppt
F(
cpI
802 I. Milosev, T. Kosec / Electroc
0.72 V. The cyclic voltammogram recorded in RPS is quite dif-erent. A well-defined anodic peak appears at −0.6 V, followedy passive region up to 0.2 V, at which voltage the breakdown
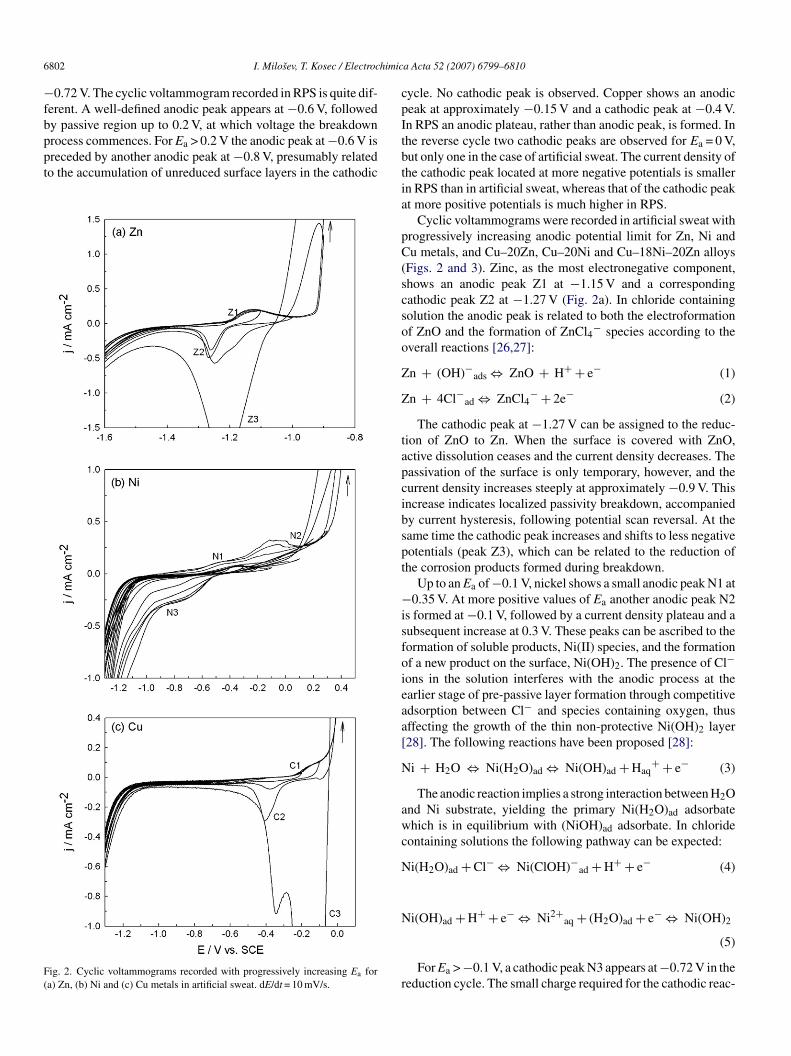
rocess commences. For Ea > 0.2 V the anodic peak at −0.6 V isreceded by another anodic peak at −0.8 V, presumably relatedo the accumulation of unreduced surface layers in the cathodicig. 2. Cyclic voltammograms recorded with progressively increasing Ea fora) Zn, (b) Ni and (c) Cu metals in artificial sweat. dE/dt = 10 mV/s.
tbtia
pC(scsoo
Z
Z
tapcibspt
−isfoieaa[
N
awc
N
N
r
a Acta 52 (2007) 6799–6810
ycle. No cathodic peak is observed. Copper shows an anodiceak at approximately −0.15 V and a cathodic peak at −0.4 V.n RPS an anodic plateau, rather than anodic peak, is formed. Inhe reverse cycle two cathodic peaks are observed for Ea = 0 V,ut only one in the case of artificial sweat. The current density ofhe cathodic peak located at more negative potentials is smallern RPS than in artificial sweat, whereas that of the cathodic peakt more positive potentials is much higher in RPS.
Cyclic voltammograms were recorded in artificial sweat withrogressively increasing anodic potential limit for Zn, Ni andu metals, and Cu–20Zn, Cu–20Ni and Cu–18Ni–20Zn alloys
Figs. 2 and 3). Zinc, as the most electronegative component,hows an anodic peak Z1 at −1.15 V and a correspondingathodic peak Z2 at −1.27 V (Fig. 2a). In chloride containingolution the anodic peak is related to both the electroformationf ZnO and the formation of ZnCl4− species according to theverall reactions [26,27]:
n + (OH)−ads ⇔ ZnO + H+ + e− (1)
n + 4Cl−ad ⇔ ZnCl4− + 2e− (2)
The cathodic peak at −1.27 V can be assigned to the reduc-ion of ZnO to Zn. When the surface is covered with ZnO,ctive dissolution ceases and the current density decreases. Theassivation of the surface is only temporary, however, and theurrent density increases steeply at approximately −0.9 V. Thisncrease indicates localized passivity breakdown, accompaniedy current hysteresis, following potential scan reversal. At theame time the cathodic peak increases and shifts to less negativeotentials (peak Z3), which can be related to the reduction ofhe corrosion products formed during breakdown.
Up to an Ea of −0.1 V, nickel shows a small anodic peak N1 at0.35 V. At more positive values of Ea another anodic peak N2
s formed at −0.1 V, followed by a current density plateau and aubsequent increase at 0.3 V. These peaks can be ascribed to theormation of soluble products, Ni(II) species, and the formationf a new product on the surface, Ni(OH)2. The presence of Cl−ons in the solution interferes with the anodic process at thearlier stage of pre-passive layer formation through competitivedsorption between Cl− and species containing oxygen, thusffecting the growth of the thin non-protective Ni(OH)2 layer28]. The following reactions have been proposed [28]:
i + H2O ⇔ Ni(H2O)ad ⇔ Ni(OH)ad + Haq+ + e− (3)
The anodic reaction implies a strong interaction between H2Ond Ni substrate, yielding the primary Ni(H2O)ad adsorbatehich is in equilibrium with (NiOH)ad adsorbate. In chloride
ontaining solutions the following pathway can be expected:
i(H2O)ad + Cl− ⇔ Ni(ClOH)−ad + H+ + e− (4)
i(OH)ad + H+ + e− ⇔ Ni2+aq + (H2O)ad + e− ⇔ Ni(OH)2
(5)
For Ea > −0.1 V, a cathodic peak N3 appears at −0.72 V in theeduction cycle. The small charge required for the cathodic reac-

I. Milosev, T. Kosec / Electrochimic
Fig. 3. Cyclic voltammograms recorded with progressively increasing Ea for(d
ttdc
rcff
2
shtlrut[
C
ob
C
C
siy[
C
tapistFdf(nird
Ceocason the former alloys. The potential values at which the increase
a) Cu–20Zn, (b) Cu–20Ni and (c) Cu–18Ni–20Zn alloys in artificial sweat.E/dt = 10 mV/s.
ion to occur in the potential range of this peak can be assigned
o the reduction of the thin layer of Ni(OH)2 [28]. The electrore-uction appears to be practically independent of both chlorideoncentration and hydrodynamic conditions [28].iai
a Acta 52 (2007) 6799–6810 6803
Copper shows a small anodic peak C1 at −0.15 V and a cor-esponding cathodic peak C2 at about −0.4 V. The anodic peakan be attributed to the formation of a surface layer. In chloride-ree solution at pH 6.5 this surface layer would consist of Cu2O,ormed according to the reaction [25]:
Cu + H2O ⇔ Cu2O + 2H+ + 2e− (6)
In chloride containing solution, however, the formation ofoluble species is thermodynamically preferred, due to theigh stability of copper chloride complexes. The tendencyo form copper chloride complexes is dominant, it destabi-izes the formation of copper oxides and extends the solubilityange of copper in near-neutral solutions to higher pH val-es and lower potentials [29]. Copper dissolves anodicallyo form CuCl2− complexes according to the global reaction30]:
u + 2Cl− ⇔ CuCl2− + e− (7)
r, in a two-step reaction where the first reaction is assumed toe fast [31]:
u + Cl− ⇔ CuCl + e− (8)
uCl + Cl− ⇔ CuCl2− (9)
The anodic peak at −0.15 V thus denotes the formation of aurface layer formed as a result of these competitive reactions,.e., the formation of Cu2O directly from Cu metal or by hydrol-sis of soluble complexes in the vicinity of the electrode surface10,32]:
uCl2− + H2O ⇔ Cu2O + 4Cl− + 2H+ (10)
The latter reaction appears more feasible to occur duringhe potentiodynamic experiments due to the pre-conditioningt Eoc and slow scan rate used. The formation of a partiallyrotective surface layer leads to the passivation of the surfacen the potential range between −0.2 and −0.1 V. In the reversecan, a cathodic peak C2 appears at −0.4 V and is related tohe reduction of the surface layer formed in the anodic cycle.or Ea > −0.1 V the current density increases due to increasedissolution which, at even higher anodic potentials, leads to theormation of CuCl, as will be shown below in polarization curvesFig. 4). The current increase in the anodic scan is accompa-ied by the cathodic peak C3 at approximately −0.1 V, whichncreases greatly as Ea becomes more positive. This peak iselated to the reduction of copper chloride compounds formeduring dissolution.
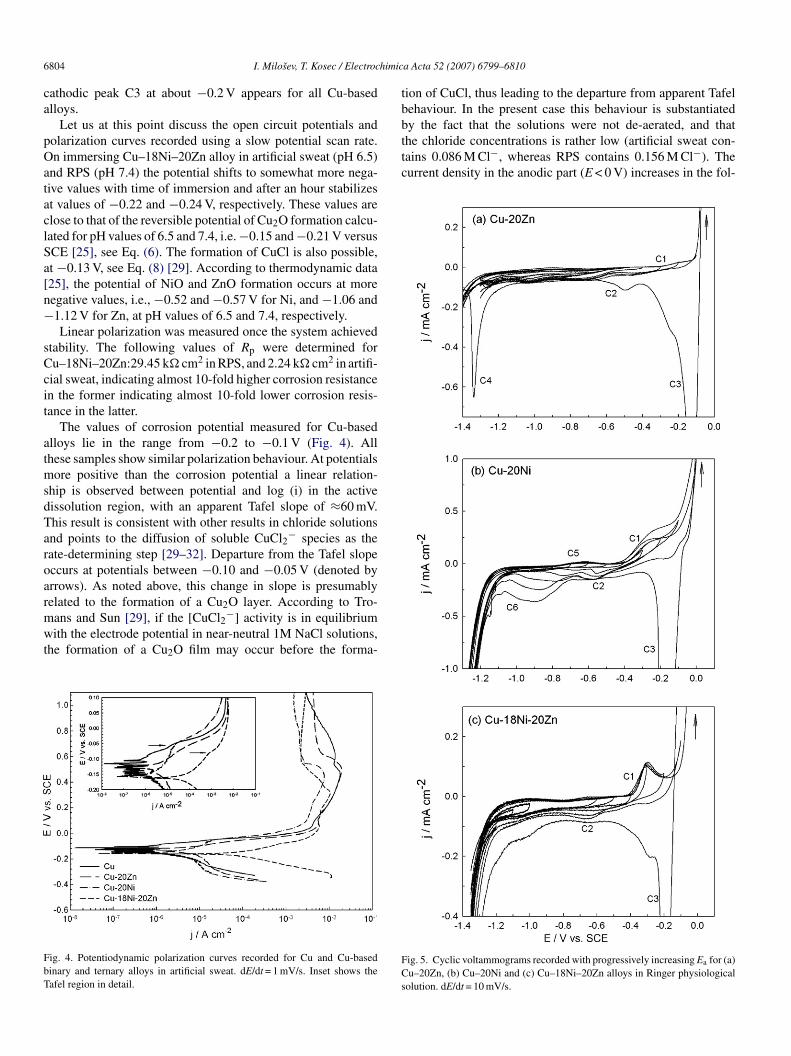
Fig. 3 presents the cyclic voltammograms recorded foru–20Zn, Cu–20Ni and Cu–28Ni–20Zn in artificial sweat. Gen-rally, the shape of cyclic voltammograms is very similar to thatf Cu metal. The shape of the anodic part of the voltammogramhanges from a hump for binary alloys to a peak for a ternarylloy. The surface layer formed on the latter thus appears to beomewhat more protective in chloride media than that formed
n current density occurs are similar for all three alloys andre located in the range between −0.03 and 0.02 V. Follow-ng the passivity breakdown and current hysteresis, the second
6 himic
ca
pOataclSa[n−
sCcit
atmsdTaroarmwt
FbT
tbby the fact that the solutions were not de-aerated, and thatthe chloride concentrations is rather low (artificial sweat con-tains 0.086 M Cl−, whereas RPS contains 0.156 M Cl−). Thecurrent density in the anodic part (E < 0 V) increases in the fol-
804 I. Milosev, T. Kosec / Electroc
athodic peak C3 at about −0.2 V appears for all Cu-basedlloys.
Let us at this point discuss the open circuit potentials andolarization curves recorded using a slow potential scan rate.n immersing Cu–18Ni–20Zn alloy in artificial sweat (pH 6.5)
nd RPS (pH 7.4) the potential shifts to somewhat more nega-ive values with time of immersion and after an hour stabilizest values of −0.22 and −0.24 V, respectively. These values arelose to that of the reversible potential of Cu2O formation calcu-ated for pH values of 6.5 and 7.4, i.e. −0.15 and −0.21 V versusCE [25], see Eq. (6). The formation of CuCl is also possible,t −0.13 V, see Eq. (8) [29]. According to thermodynamic data25], the potential of NiO and ZnO formation occurs at moreegative values, i.e., −0.52 and −0.57 V for Ni, and −1.06 and1.12 V for Zn, at pH values of 6.5 and 7.4, respectively.Linear polarization was measured once the system achieved
tability. The following values of Rp were determined foru–18Ni–20Zn:29.45 k� cm2 in RPS, and 2.24 k� cm2 in artifi-ial sweat, indicating almost 10-fold higher corrosion resistancen the former indicating almost 10-fold lower corrosion resis-ance in the latter.
The values of corrosion potential measured for Cu-basedlloys lie in the range from −0.2 to −0.1 V (Fig. 4). Allhese samples show similar polarization behaviour. At potentials
ore positive than the corrosion potential a linear relation-hip is observed between potential and log (i) in the activeissolution region, with an apparent Tafel slope of ≈60 mV.his result is consistent with other results in chloride solutionsnd points to the diffusion of soluble CuCl2− species as theate-determining step [29–32]. Departure from the Tafel slopeccurs at potentials between −0.10 and −0.05 V (denoted byrrows). As noted above, this change in slope is presumablyelated to the formation of a Cu2O layer. According to Tro-
ans and Sun [29], if the [CuCl2−] activity is in equilibriumith the electrode potential in near-neutral 1M NaCl solutions,he formation of a Cu2O film may occur before the forma-
ig. 4. Potentiodynamic polarization curves recorded for Cu and Cu-basedinary and ternary alloys in artificial sweat. dE/dt = 1 mV/s. Inset shows theafel region in detail.
FCs
a Acta 52 (2007) 6799–6810
ion of CuCl, thus leading to the departure from apparent Tafelehaviour. In the present case this behaviour is substantiated
ig. 5. Cyclic voltammograms recorded with progressively increasing Ea for (a)u–20Zn, (b) Cu–20Ni and (c) Cu–18Ni–20Zn alloys in Ringer physiological
olution. dE/dt = 10 mV/s.

I. Milosev, T. Kosec / Electrochimica Acta 52 (2007) 6799–6810 6805
F ugeri
lClp
rw
C
b
Fs
ig. 6. XPS (a) Cu 2p, (b) X-ray induced Cu Auger and (c) X-ray induced Zn An artificial sweat and Ringer physiological solution.
owing order: Cu < Cu–20Zn ∼= Cu–20Ni < Cu–18Ni–20Zn. Theu–18Ni–20Zn alloy exhibits the highest current density in the
ower potential region (E < 0 V); however, it decreases at higherotentials.
Current peaks in the range from 0 to 0.3 V are assumed to beelated to the formation of CuCl once the solubility equilibrium
as exceeded [29]:uCl + Cl− ⇔ CuCl2−, log[CuCl2
−] = log [Cl−] − 1.815
(11)
acc
ig. 7. XPS (a) Ni 2p and (b) Cl 2p spectra recorded for Cu–18Ni–20Zn after 300olution.
spectra recorded for Cu–18Ni–20Zn after 300 s oxidation at −0.2 V and 0.5 V
The chemical equilibrium between Cu and CuCl is definedy:
CuCl + e− ⇔ Cu + Cl−, ECuCl/Cu
= 0.117 − 0.0591 log [Cl−] (12)
Therefore, in the course of electrochemical polarization inrtificial sweat, the surfaces of Cu and Cu-based alloys areovered with a layer of corrosion products, chloride and/or oxy-hlorides, as will be shown below.
s oxidation at −0.2 V and 0.5 V in artificial sweat and Ringer physiological
6 himica Acta 52 (2007) 6799–6810
pioRtlcprTasatfascfbnao
3C
co−otaCwltdCCltia(pbszZlTms8
FdS
tsttic−R
tbAdaca
806 I. Milosev, T. Kosec / Electroc
General differences for cyclic voltammograms recorded forure metal samples in artificial sweat and RPS are demonstratedn Fig. 1. In contrast to artificial sweat, where voltammogramsf all three Cu-based alloys are quite similar, curves recorded inPS show more diverse behaviour, with pronounced differen-
iation of Ni and Zn components added to alloys (Fig. 5). Theowest current density was measured for Cu–20Zn alloy. Besidesathodic peaks C2 and C3, ascribed to reduction of copper com-ounds, a third cathodic peak C4 appears at −1.25 V, obviouslyelated to the reduction of zinc compounds (see Figs. 1 and 2).he Cu–20Ni alloy shows interesting behaviour, with a smallnodic peak C5 at about −0.6 V related to the formation of NiO,ince it appears as the peak N1 for Ni metal (Fig. 2), and a secondnodic peak C1. The latter peak probably includes a contribu-ion from both copper and nickel dissolution, since it is observedor other Cu-based alloys, but it is accompanied by the appear-nce of peak C6 in the potential range from −0.6 to −0.9 V,imilar to peak N3 for Ni metal (Fig. 1). For Ea ≥ 0 V, anotherathodic peak, C3, appears at about −0.2 V, as observed alsoor other Cu and Cu-based alloys. The Cu–18Ni–20Zn alloyehaves similarly to Cu–20Zn alloy, however, with a more pro-ounced anodic peak C1 at −0.3 V. In contrast to Cu–20Znlloy, no peak related to the reduction of zinc compound wasbserved.
.2. X-ray photoelectron spectroscopy of theu–18Ni–20Zn alloy polarized in artificial sweat
The samples of Cu–18Ni–20 alloys were oxidized electro-hemically in artificial sweat and RPS up to two final potentialsf interest in relation to the electrochemical measurements, i.e.,0.2 V, where the small anodic peak, ascribed predominantly to
xide formation, is located (Figs. 3 and 5), and 0.5 V, followinghe second anodic peak where high values of current density arettained and formation of copper chlorides is expected (Fig. 4).u 2p, Cu LMM and Zn LMM, Ni 2p and Cl 2p XPS spectraere recorded on the surface of the electrochemically prepared
ayers (Figs. 6 and 7). After oxidation up to −0.2 V, the cen-re of the Cu 2p3/2 is located at 932.5 eV (Fig. 6a). As alreadyiscussed in the Experimental section, the chemical shift of theu 2p XPS peak does not allow differentiation between Cu andu(I) species. The principal Cu metal peak in Auger spectra is
ocated at 568.5 eV, and at 571.2 eV for Cu2O. The centre ofhe Cu LMM spectrum recorded after oxidation up to −0.2 Vs located at 568.5 eV and is related to the metal component,nd only a small peak at 571.2 eV denotes Cu2O formationFig. 6b). In RPS the formation of Cu2O at −0.2 V is moreronounced, the intensities of the oxide and metal componentsecoming comparable. Like that for Cu, the Zn LMM spectrumhows that, following oxidation up to −0.2 V, the amount ofinc oxide is small, since the centre of the peak related to then metal peak is still located at 494 eV, (Fig. 6c). In RPS the
atter peak decreases and that of the oxide at 500 eV increases.
he Zn 2p spectra are not reported, since no conclusive infor-ation concerning the speciation could be obtained, due to themall chemical shift. The Ni metal component is located at52.9 eV and the oxide at 853.5 V, with a complex satellite struc-
lR
s
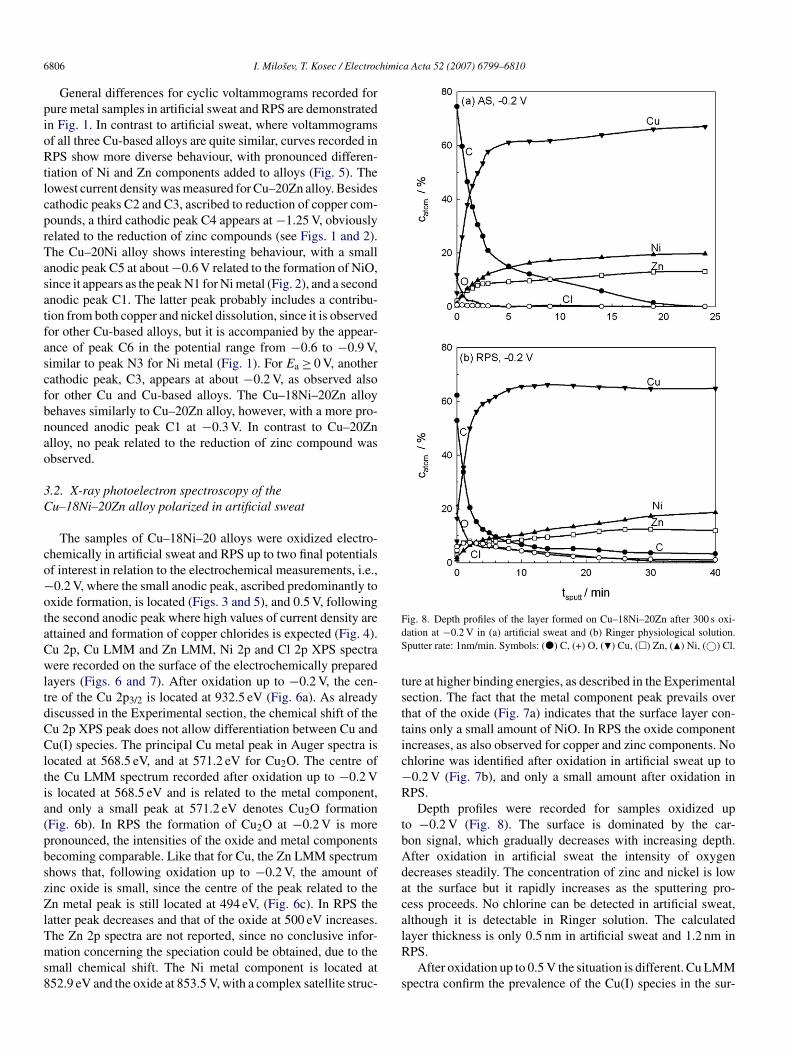
ig. 8. Depth profiles of the layer formed on Cu–18Ni–20Zn after 300 s oxi-ation at −0.2 V in (a) artificial sweat and (b) Ringer physiological solution.putter rate: 1nm/min. Symbols: (�) C, (+) O, (�) Cu, (�) Zn, (�) Ni, (©) Cl.
ure at higher binding energies, as described in the Experimentalection. The fact that the metal component peak prevails overhat of the oxide (Fig. 7a) indicates that the surface layer con-ains only a small amount of NiO. In RPS the oxide componentncreases, as also observed for copper and zinc components. Nohlorine was identified after oxidation in artificial sweat up to0.2 V (Fig. 7b), and only a small amount after oxidation inPS.
Depth profiles were recorded for samples oxidized upo −0.2 V (Fig. 8). The surface is dominated by the car-on signal, which gradually decreases with increasing depth.fter oxidation in artificial sweat the intensity of oxygenecreases steadily. The concentration of zinc and nickel is lowt the surface but it rapidly increases as the sputtering pro-ess proceeds. No chlorine can be detected in artificial sweat,lthough it is detectable in Ringer solution. The calculated
ayer thickness is only 0.5 nm in artificial sweat and 1.2 nm inPS.After oxidation up to 0.5 V the situation is different. Cu LMMpectra confirm the prevalence of the Cu(I) species in the sur-

I. Milosev, T. Kosec / Electrochimic
Ftr
fsiaaipppofCiwi
aoad
2edmwasctfC
3polarized in artificial sweat
Representative voltammograms recorded for dissolved cop-per, zinc and nickel ions in aliquots taken during potentiostatic
ig. 9. Depth profiles of the layer formed on Cu–18Ni–20Zn after 300 s oxida-ion at 0.5 V in (a) artificial sweat and (b) Ringer physiological solution. Sputterate: 1nm/min. Symbols: (�) C, (+) O, (�) Cu, (�) Zn, (�) Ni, (©) Cl.
ace layers formed in each solution, as the peak centre is nowhifted to 571.2 eV (Fig. 6b). At the same time, Cu 2p spectradentify the formation of a small amount of cupric compound,s evidenced by the peaks at 936 and 941.5 eV (Fig. 6a). Whilelmost no zinc and no nickel can be identified in the layer, thentensity of Cl 2p is very high. The position of the Cl 2p3/2eak centre at 199 eV confirms the presence of chloride com-ounds. Since no zinc and nickel can be identified, this resultroves the formation of copper chlorides, as hypothesized basedn the electrochemical results in the previous section. The sur-ace layer is green, characteristic for the oxychloride atacamite,u2(OH)3Cl (or CuCl2·3Cu(OH)2), which is almost insoluble,
n contrast to CuCl2·2H2O, which is very soluble [33]. Thisould be consistent with the presence of the cupric compound
dentified in the Cu 2p XPS spectra.Depth profiles recorded for samples oxidized up to 0.5 V
re presented in Fig. 9. The intensity of chlorine now prevailsver the oxygen signal. The layer thickness is much larger thanfter oxidation up to −0.2 V. The thickness calculated from theecrease in oxygen intensity is 23 nm in artificial sweat and
Fo0f
a Acta 52 (2007) 6799–6810 6807
0 nm in Ringer physiological solution. At the same time, how-ver, the intensity of chlorine remains high throughout the layerepth, indicating that the thickness of the surface layer is actuallyuch greater. Cupric compounds are present only at the surfacehereas, within the layer, copper is present in the cuprous form,
s evident from the Cu Auger spectra recorded as a function ofputter time (results not shown). We may thus assume a gradedomposition of the surface layer, with an approximately 20 nmhick layer of oxychloride, presumably Cu2(OH)3Cl, at the sur-ace, the bulk of the layer being composed of a thick layer ofuCl.
.3. Dissolution of metal ions from Cu-18-20Zn alloy
ig. 10. Voltammograms for dissolved (a) Cu and Zn and (b) Ni as a functionf immersion time of Cu–18Ni–20Zn alloy during potentiostatic polarization atV in artificial sweat. The supporting electrolyte was ammonium-citrate buffer
or Cu and Zn, and ammonium buffer for Ni.

6 himic
psow
Fa
T
808 I. Milosev, T. Kosec / Electroc
olarization of Cu–18Ni–20Zn in artificial sweat at 0 V are pre-
ented in Fig. 10. Depending on the concentration, the peakf copper is located in the range from −0.176 to −0.196 V,hereas that of zinc is in the range from −1.140 to −1.172 V.ig. 11. The concentrations of dissolved Cu, Ni and Zn as a function of potentialnd time of potentiostatic polarization of Cu–18Ni–20Zn in artificial sweat.
n0b1
tiddapmodpsFcrcl5iAi60Cdtdi2oootd
4
ftzcntanottcoa
a Acta 52 (2007) 6799–6810
hese two elements were determined simultaneously in ammo-ium citrate buffer in the potential range between −1.3 andV. Nickel was determined separately in ammonium chlorideuffer. Its peak is located in the range from −1.160 and −.192 V.
Since the height of the peak is proportional to the concen-ration, it is evident that the concentration of dissolved metalons increases with increasing time of polarization. The timeependence of the concentration of copper, zinc and nickel ionsissolved during immersion of Cu–18Ni–20Zn in artificial sweatt −0.2 V, −0.1 V and 0 V is shown in Fig. 11. The polarizationotentials, Et, were chosen on the basis of the cyclic voltam-ogram in Fig. 3c: at the anodic peak (−0.2 V), in the range
f current density decrease (−0.1 V), and following the currentensity increase (0 V). At the two former potentials, the overallolarization time was 6 h, since the current density, and con-equently the concentration of dissolved ions, was very low.or Et = 0 V, the polarization time was shorter due to the higheroncentration of dissolved metal ions. Copper dissolves most,eaching approximately 0.9 mg/l after 6 h at −0.2 V. The con-entrations of both nickel and zinc are approximately five timesower. The ratios Cu/Ni and Cu/Zn in the solution are 4.8 and.3, respectively. These values are higher than the correspond-ng ratios in the bulk alloy, i.e. 3.4 for Cu/Ni, and 3.1 for Cu/Zn.s Et is increased to −0.1 V, the concentrations in the solution
ncrease. The concentration of copper reaches 1.44 mg/l afterh, whereas the concentrations of nickel and zinc are 0.8 and.6 mg/l. Compared to values at −0.2 V, the ratios Cu/Ni andu/Zn decrease to 1.7 and 2.2, respectively, indicating higherissolution of Ni and Zn from the alloy. The selective dissolu-ion becomes even more pronounced at 0 V. All three elementsissolve in much higher concentrations, in accordance with thencrease in current density in this potential range. After onlyh the following concentrations of copper, nickel and zinc werebserved: 6.15, 2.8 and 2.6 mg/L, giving ratios Cu/Ni and Cu/Znf 2.2 and 2.4, respectively. Therefore, for Et ≥ −0.1 V, the ratiof dissolved ions – Cu/Ni and Cu/Zn – decreases in respect tohe ratio in the bulk alloy indicating the process of selectiveissolution of Ni and Zn.
. Discussion
The anodic peak at approximately −0.15 V is related to theormation of a thin layer about 0.5 nm thick. In artificial sweathis layer is composed mainly of Cu2O and contains traces ofinc and nickel oxides and no chlorine. In Ringer physiologi-al solution, the thickness of the layer is greater, although stillot exceeding 1.5 nm, and it contains some chlorine. The lat-er may be incorporated into the defective Cu2O structure, aslready proposed by Colin et al. [8]. Increased layer thick-ess is probably related to the formation of small amountsf ZnO and NiO. Their formation is evident also in the elec-rochemical measurements, where several features related to
he formation of zinc and nickel oxide are recognized, espe-ially in binary alloy. It is noteworthy that the concentrationf chloride ions in RPS (0.156 M Cl−) is almost double that inrtificial sweat (0.086 M Cl−). However, it should be taken into
himic
acblZcdpbbTiisaifiwrcztims
socap
4
hzftla[haf
5
oaarto
isiwo
A
vvsi
R
[
[[[[
[
[
[
[[
[[[[
[[
[[
I. Milosev, T. Kosec / Electroc
ccount that artificial sweat contains urea and lactic acid, whichan act as complexing agents. Lactic acid forms relatively sta-le complexes with all metal ions, i.e., log K1 = 3.02 for Cu2+,og K1 = 2.216 for Ni2+ and log K1 = 2.239 for complexes withn2+ [34]. No data could be found ion the stability of metalomplexes with urea. Complexing agents are able to promoteissolution, as described earlier [22,35]. The impact of com-lexing agent on the electrochemical parameters was found toe related to its concentration in the electrolyte and to the sta-ility constant of the complex formed with the metal ion [35].herefore, although the concentration of chloride ions is higher
n RPS, the process of metal complex formation taking placen artificial sweat may prevail. It appears that the increased dis-olution resulting from the presence of complexing agents inrtificial sweat predominates over complexation with chlorideons in RPS, which would lead to a thinner surface layer in theormer solution, as observed experimentally. This is especiallymportant in the case of zinc and nickel, since both form veryeak complexes with chloride ions, with log Ks of 0.51 and 0.62,
espectively, approximately 10 times lower than that for cuproushloride complexes (log Ks = 5.7) [36]. On the other hand, bothinc and nickel ions form relatively strong complexes with lac-ic acid [34]. The more protective nature of the layers formedn RPS than in artificial sweat is also proved by the more than a
agnitude higher value of polarization resistance in the formerolution.
Following polarization up to high positive potentials, theurface layer consists primarily of copper chloride and copperxychloride, CuCl and Cu2(OH)3Cl. Partial transformation ofhloride to oxychloride at these high positive potentials waslso assumed in the Cu–Cl–H2O equilibrium potential versusH diagrams of Verink and Heidersbach [37]:
CuCl + 6H2O → 3Cu(OH)2CuCl2 + 2Cl− + 6H+ + 4e−
(13)
No zinc or nickel were observed in the surface layer, althoughigh concentrations of both were found in solution. Thus, theinc and nickel compounds, presumably ZnCl2 and NiCl2,ormed at these high potentials dissolve, which is understandableaking into account their high solubility [33]. In our next pub-ication results obtained under the open circuit potential, whichre more relevant for physiological conditions will be presented38]. The surface layers formed in artificial sweat and RPS atigh positive potentials are similar, meaning that the differencesre more pronounced in the lower potential range where oxideormation occurs.
. Conclusions
The electrochemical behaviour of pure metal components andf binary and ternary copper–nickel–zinc alloys, investigated inrtificial sweat and RPS, is complex. It includes the formation of
thin oxide layer in the lower potential region and a thick chlo-ide/oxychloride layer at high positive potentials. Differences inhe composition and thickness of the surface layers are basedn the stability of complexes of the metal ions with chloride
[
[[[
a Acta 52 (2007) 6799–6810 6809
ons and with complexing agents present in artificial sweat. Theurface layer formed under electrochemical polarization in RPSs more protective than that in artificial sweat. Results of thisork indicate that during polarization a significant dissolutionf nickel takes place.
cknowledgements
The authors thank Mrs. E. Blazevic and Mr. S. Peljhan foraluable experimental work. The authors thank Dr. J. Kovac foraluable comments in evaluation of XPS spectra. The financialupport by the Slovenian Research Agency (grant No. P2-0148)s acknowledged.
eferences
[1] F.O. Nestle, H. Speidel, M.O. Speidel, Nature 419 (2002) 132.[2] British Standard, BS EN 1811:1999, Reference test method for release of
nickel from products intended to come into direct and prolonged contactwith the skin.
[3] F. Gou, M.A. Gleeson, J. Villette, S.E.F. Kleyn, A.W. Kleys, Appl. Surf.Sci. 225 (2004) 47.
[4] J. Black, Biological Performance of Materials, third ed., Marcel Dekker,Inc., New York, Basel, 1999, pp. 215–232.
[5] J.D. Hemingway, M.M. Molokhia, Contact Derm. 16 (1987) 99.[6] P. Haudrechy, J. Foussereau, B. Mantout, B. Baroux, Corros. Sci. 35 (1993)
329.[7] S. Colin, G. Krier, H. Jolibois, A. Hachimi, J.F. Muller, A. Chambaudet,
Appl. Surf. Sci. 125 (1998) 29.[8] S. Colin, E. Beche, R. Berjoan, H. Jolibois, A. Chambaudet, Corros. Sci.
41 (1999) 1051.[9] P. Druska, H.-H. Strehblow, Surf. Int. Anal. 23 (1995) 440.10] W.A. Badawy, K.M. Ismail, A.M. Fathi, Electrochim. Acta 50 (2005)
3603.11] R.F. North, M.J. Pryor, Corros. Sci. 10 (1970) 297.12] Milosev, M. Metikos-Hukovic, Electrochim. Acta 42 (1997) 1537.13] I. Milosev, M. Metikos-Hukovic, J. Appl. Electrochem. 29 (1999) 393.14] J. Morales, P. Esparza, G.T. Fernandez, S. Gonzales, J.E. Garcia, J. Caceres,
R.C. Salvarezza, A.J. Arvia, Corros. Sci. 37 (1995) 231.15] J. Morales, G.T. Fernandez, P. Esparza, S. Gonzales, R.C. Salvarezza, A.J.
Arvia, Corros. Sci. 37 (1995) 177.16] R.M. El-Sherif, K.M. Ismail, W.A. Badawy, Electrochim. Acta 49 (2004)
5139.17] I. Milosev, T. Kosec Mikic, M. Gaberscek, Electrochim. Acta 52 (2006)
415.18] I. Milosev, H.-H. Strehblow, J. Electrochem. Soc. 150 (2003) B517.19] T. Kosec Mikic, I. Milosev, B. Pihlar, J. Appl. Electrochem. 35 (2005)
975.20] T. Kosec Mikic, I. Milosev, Mater. Chem. Phys., in press.21] M. Sanz, S. Hofmann, Surf. Int. Anal. 5 (1983) 210.22] I. Milosev, H.-H. Strehblow, J. Biomed. Mater. Res. 52 (2000) 404.23] J.F. Moulder, W.F. Stickle, P.E. Sobol, K.D. Bomben, in: J. Chastain, R.C.
King Jr. (Eds.), Handbook of X-ray Photoelectron Spectroscopy, PhysicalElectronics, Inc., Eden Prairie, Minnesota, 1995.
24] I. Milosev, A. Kocijan, Annal. Chim. 91 (2001) 343.25] A.J. Bard, R. Parsons, J. Jordan (Eds.), Standard Potentials is Aqueous
Solution, IUPAC, Marcel Dekker, Inc., New York and Basel, 1985.26] R. Guo, F. Weinberg, D. Tromans, Corrosion 51 (1995) 356.27] F.H. Assaf, S.S. Abd El-Rehiem, A.M. Zaky, Mater. Chem. Phys. 58 (1999)
58.
28] S.G. Real, M.R. Barbosa, J.R. Vilche, A.J. Arvia, J. Electrochem. Soc. 137(1990) 1696.29] D. Tromans, R.-H. Sun, J. Electrochem. Soc. 138 (1991) 3235.30] A.L. Bacarella, J.C. Griess, J. Electrochem. Soc. 120 (1973) 459.31] H.P. Lee, K. Nobe, J. Electrochem. Soc. 133 (1986) 2035.

6 himic
[
[
[
[
[
810 I. Milosev, T. Kosec / Electroc
32] C. Deslouis, B. Tribollet, G. Mengoli, M.M. Musiani, J. Appl. Electrochem.18 (1988) 374.
33] W.M. Latimer, J.H. Hildebrand, Reference book of Inorganic Chemistry,
third ed., The Mcmillan Company, New York, 1951.34] Stability Constants, Supplement No. 1, Stability Constants of Metal-IonComplexes, Part II – Organic Ligands, compiled by A.E. Martell, TheChemical Society, Burlington House, London, 1964.
35] M. Slemnik, I. Milosev, J. Mater. Sci. Mater. Med. 17 (2006) 911.
[
[
a Acta 52 (2007) 6799–6810
36] Stability Constants, Supplement No. 1, Stability Constants of Metal-IonComplexes, Part I – Inorganic Ligands, compiled by L.G. Sillen, TheChemical Society, Burlington House, London, 1964.
37] E.D. Verink Jr., R.H. Heidersbach Jr, in: M. Pourbaix (Ed.), Use ofElectrochemical Hysteresis Techniques in Developing Alloys for SalineExposures, Corrosion, SBIIA, vol. 27 (12), 1971, pp. 303–322.
38] I. Milosev, T. Kosec, Applied Surf. Sci., Manuscript submitted for publi-cation.
Copyright © 2022 FDOKUMEN