STUDIES OF WAX GENES IN COTTON (Gossypium arboreum)
186
STUDIES OF WAX GENES IN COTTON ( Gossypium arboreum ) MUHAMMAD YOUNAS NATIONAL CENTRE OF EXCELLENCE IN MOLECULAR BIOLOGY UNIVERSITY OF THE PUNJAB LAHORE PAKISTAN (2009)
-
Upload
khangminh22 -
Category
Documents
-
view
4 -
download
0
Transcript of STUDIES OF WAX GENES IN COTTON (Gossypium arboreum)
STUDIES OF WAX GENES IN COTTON
(Gossypium arboreum)
MUHAMMAD YOUNAS
NATIONAL CENTRE OF EXCELLENCE IN
MOLECULAR BIOLOGY UNIVERSITY OF THE PUNJAB LAHORE PAKISTAN
(2009)
STUDIES OF WAX GENES IN COTTON (Gossypium arboreum)
A THESIS SUBMITTED TO
UNIVERSITY OF THE PUNJAB
IN FULFILLMENT OF THE REQUIREMENTS
FOR THE DEGREE OF
DOCTOR OF PHILOSOPHY IN
MOLECULAR BIOLOGY
BY
MUHAMMAD YOUNAS
SUPERVISOR:
DR. TAYYAB HUSNAIN
NATIONAL CENTRE OF EXCELLENCE IN MOLECULAR BIOLOGY UNIVERSITY OF THE PUNJAB LAHORE PAKISTAN
(2009)

DEDICATED TO:
THE NO OF CJ
TABLE OF CONTENTS
LIST OF FIGURES X
LIST OF TABLES XIV
ABBREVIATIONS XV
ACKNOWLEDGEMENTS XVII
SUMMARY XIX
1 INTRODUCTION 1
2 LITERATURE VIEW 4
2.1 COTTON 4
2.2 BIOTIC AND ABIOTIC RESISTANCE 6
2.3 WAX 8
2.3.1 EPICUTICULAR WAX 8
2.3.2 EPICUTICULAR WAX ROLE AND SIGNIFICANCE IN PLANTS 9
2.3.3 EPICUTICULAR WAX GENES 10
2.3.4 EPICUTICULAR WAX AND COTTON 13
2.4 MUTATION 13
2.4.1 INDUCED MUTATION 13
2.4.2 WAX MUTANTS 15
2.4.3 MUTANTS AND GENES IDENTIFICATION 17
2.5 MICROARRAY 17
2.5.1 TYPES OF DNA MICROARRAY 18
2.5.2 MICROARRAY AND MUTANTS 19
2.5.3 MICROARRAY AND GENES IDENTIFICATION
20
3 MATERIALS AND METHODS 23
3.1 DEVELOPMENT OF WAX MUTANTS 23
3.1.1 MUTATION INDUCTION 23
3.1.2. WAX MUTANT SELECTION 25
3.1.3 WAX MUTANTS CONFIRMATION 26
3.1.3.1 SCANNING ELECTRON MICROSCOPY (SEM) 27
3.1.3.2 GC-MS ANALYSES 27
3.2 CONSTRUCTION OF cDNA LIBRARY 28
3.2.1 TOTAL RNA ISOLATION 28
3.2.2 AGAROSE GEL ELECTROPHORESIS 29
3.2.3 QUANTIFICATION OF TOTAL RNA 29
3.2.4 DNase TREATMENT 29
3.2.5 ISOLATION OF mRNA FROM TOTAL RNA 30
3.2.6 PRECIPITATION OF mRNA 31
3.2.7 DOUBLE STRAND cDNA CONSTRUCTION 31
3.2.8 LIGATING THE attB1 ADAPTER 33
3.2.9 cDNA SIZE SELECTION 33
3.2.10 GEL ELUTION 34
3.2.11 PERFORMING THE BP RECOMBINATION REACTION 34
3.3 PREPARATION OF CDNA MICROARRAY PLATFORM 36
3.3.1 CLONE PICKING AND CULTURING 36
3.3.2 PCR AMPLIFICATION OF INSERTS 37
3.3.3 CLONE SEQUENCING 38
3.3.4 SPOTING OF SLIDES 38
3.4 HYBRIDIZATION OF TARGET WITH cDNA MICROARRAY PLATFORM
39
3.4.1. TARGET PREPARATION 39
3.4.1.1. AMINOALLYL LABELING 39
3.4.1.2 REMOVAL OF UNINCORPORATED aa-dUTP AND FREE AMINES
40
3.4.1.3 COUPLING aa-cDNA TO CYANINE DYE ESTER 40
3.4.1.4 REMOVAL OF UNCOUPLED DYE 40
3.4.2 HYBRIDIZATION 41
3.4.2.1 PRE-HYBRIDIZATION 41
3.4.2.2 HYBRIDIZATION 41
3.4.2.3 SLIDE WASHING 41
3.5. SLIDE SCANNING 42
3.5.1 IMAGES PROCESSING AND RAW DATA GENERATION 42
3.6. DATA NORMALIZATION AND ANALYSIS 42
3.6.1. DATA NORMALIZATION 42
3.6.2. THE MIDAS PROJECT 43
3.6.3. TM4 MEV ANALYSIS 43
3.7. SEQUENCING OF DIFFERENTIALLY EXPRESSED TRANSCRIPTS
43
3.8. VALIDATION STUDIES BY QUANTITATIVE REAL-TIME PCR 44
3.9. BIOINFORMATIC STUDIES 45
3.9.1. BLAST SEARCH 45
3.9.2. GENE ONTOLOGY (GO) AND FUNCTIONAL ANNOTATION 46
3.9.3. GENE INVESTIGATOR BY RESPONSE VIEWER
46
4 RESULT 47
4.1 CHEMICAL AND PHYSICAL MUTAGENESIS 47
4.2 WAX MUTANTS 52
4.2.1 WAX MUTANTS SELECTION 52
4.2.2 WAX MUTANTS CONFIRMATION 57
4.2.2.1. EPICUTICULAR WAX MORPHOLOGY 57
4.2.2.2. GAS CHROMATOGRAPHY AND MASS SPECTROPHOTOMETER (GC-MS) ANALYSES
61
4.2.3 COMPOSITION OF EPICUTICULAR WAX 65
4.2.4 COMPARISON OF COTTON (G. arboreum) WILD AND WAX MUTANT PLANTS
68
4.3. cDNA LIBRARY 70
4.3.1 TOTAL RNA 70
4.3.2. SIZE SELECTION 72
4.3.3. cDNA LIBRARY CFU 73
4.3.4 PCR AMPLIFICATION 73
4.3.5 cDNA LIBRARY CLONE SEQUENCING 75
4.3.6 BIOINFORMATIC ANALYSES OF cDNA LIBRARY SEQUENCED CLONES
76
4.3.6.1. HOMOLOGY SEARCH 76
4.3.6.2. GENE ONTOLOGY (GO) AND FUNCTIONAL ANNOTATION 77
4.4. cDNA MICROARRAY 80
4.4.1. cDNA LABELING / TARGET PREPARATION 80
4.4.2 HYBRIDIZATION AND SCANNING 81
4.4.3. DATA NORMALIZATION 82
4.4.4. MICROARRAY DATA ANALYSIS 83

4.4.5. MICROARRAY RESULTS VALIDATION STUDIES 86
4.4.6. WAX POTENTIAL CANDIDATE ESTs FUNCTIONAL CATEGORIZATION By GO (GENE ONTOLOGY) ANNOTATION
87
4.4.7. GENE INVESTIGATOR EXPRESSIONAL ANALYSIS BY RESPONSE VIEWER
89
5 DISCUSSION 91
6 REFFERENCES 119
7 APPENDICES 159

X
LIST OF FIGURES Figure1. Thermocycling profile for the amplification of inserts by PCR 37
Figure2. Thermocycling profile for the sequencing PCR 38
Figure3. Thermocycling profile for the validation of the microarray results by Real-Time PCR
44
Figure4. Detrmination of 50% SGD (Dose responsible for the 50% seed germination) treated with gamma rays, by plotting germination percentage on Y-axis and Gamma rays Doses on X-axis.
48
Figure5. Detrmination of 50% SGD (Dose responsible for the 50% seed germination) treated with Sodium Azoid (SA), by plotting germination percentage on Y-axis and mutagen Doses on X-axis
48
Figure6. Detrmination of 50% SGD (Dose responsible for the 50% seed germination) treated with Gamma rays +Sodium Azoid (SA), by plotting germination percentage on Y-axis and mutagen Doses on X-axis.
49
Figure7. Detrmination of 50% SGD (Dose responsible for the 50% seed germination) treated with Di-Ethyl Sulfate (DES), by plotting germination percentage on Y-axis and mutagen Doses on X-axis
49
Figure8. Detrmination of 50% SGD (Dose responsible for the 50% seed germination) treated with Gamma rays+Di-Ethyl Sulfate (DES), by plotting germination percentage on Y-axis and mutagen Doses on X-axis
50
Figure9. Detrmination of 50% SGD (Dose responsible for the 50% seed germination) treated with Ethyl Methane Sulphonate (EMS), by plotting germination percentage on Y-axis and mutagen Doses on X-axis.
50
Figure10. Detrmination of 50% SGD (Dose responsible for the 50% seed germination) treated with Gamma rays + Ethyl Methane Sulphonate (EMS), by plotting germination percentage on Y-axis and mutagen Doses on X-axis.
50
Figure11. Wax mutant selection in M2 generation on the basis of glossy leaves (A) Wild plant, showing non-glossy leaves. (B) M2 mutant plant with glossy leaves; a wax mutant's trait.
53
Figure12. Wax mutant selection in M2 generation on the basis of rapid chlorophyl extraction in 80% Ethanol for 1 h from leaves. (A) Wild plant and (B) M2 mutant plant, wax mutant showed rapid chlorophyll leaching in 80% Ethanol by greenish appearance.
53
XI
Figure13. Wax mutant selection in M2 generation on the basis of flower size (A) Normal flower size in wild plant. (B) Small flower size in M2 mutant plant, a wax mutant's trait.
54
Figure14. Wax mutant selection in M2 generation on the basis of aerial fusion. (A) Wild plant without aerial fusion. (B). Aerial fusion, indicated by arrows, in M2 mutant plant, a wax mutant's trait.
54
Figure15. Wax mutant selection in M2 generation on the basis of wrinkled leaves (A). Wild plant leaf, showing smooth margins, (B). M2 mutant plant leaf, with wrinkled margins, indicating by arrows, a wax mutant's trait.
55
Figure16. Wax mutant selection in M2 generation on the basis of stomatal indices. Comparison of wild (cont) and M2 mutant plants stomatal indices measured. Wax mutants showed increased stomatal indices compare to wild.
55
Figure17. Wax mutant selection in M2 generation on the basis of wax Gravimetric analysis. Gravimetric analysis and comparison in epicuticular wax load of wild (cont) and M2 mutant plants. Wax mutants have less wax load compared to wild.
56
Figure18. Hexane treated wild plant leaf (adaxial), showing no wax deposition. Arrow indicating stoma. Bar=5µm
58
Figure19. Wild plant (adaxial) leaf showing wax stripy layers (indicated by arrows). Bar= 5µm
59
Figure20. Cotton (G. arboreum) wax mutant (GaWM1) leaf (adaxial) showing alteration in wax deposition (dull thick embedded fiber like, indicated by arrows). Bar=5µm
59
Figure21. Cotton (G. arboreum) wax mutant (GaWM2) leaf (adaxial), showing alteration in wax deposition (irregular patches, indicated by arrows). Bar=5µm
60
Figure22. Cotton (G. arboreum) Wax mutant (GaWM3) leaf (adaxial) showing alteration in wax deposition (thin layers, indicated by arrows). Bar=5µm
60
Figure23. A portion of the cotton (G. arboreum) wild plant leaf total wax GC-MS TIC (total ion current trace), showing more wax concentrations in the form of peaks
62
Figure24. A portion of the cotton (G. arboreum) wax mutant (GaWM1) leaf total wax GC-MS TIC (total ion current trace), showing less wax concentrations compare to wild type in the form of peaks.
62
Figure25. A portion of the cotton (G. arboreum) wax mutant (GaWM2) leaf total wax GC-MS TIC (total ion current trace), showing less wax
63
XII
concentrations as compare to wild type in the form of peaks
Figure26. A portion of the cotton (G. arboreum) wax mutant (GaWM3) leaf total wax GC-MS TIC (total ion current trace), showing less wax concentrations compare to wild type in the form of peaks.
63
Figure27. Comparison of leaf total wax load in cotton (G. arboreum) wild and wax mutant plants (GaWM1, GaWM2, GaWM3)
64
Figure28. Comparison of cotton (G. arboreum) leaf epicuticular wax classes in wild and wax mutant (GaWM1, GaWM2, GaWM3) plant
67
Figure29. G. arboreum wild (Wt) and wax deficient mutants (GaWM1, GaWM2, & GaWM3) plants. The three wax mutants showing little glossiness as compare to wild (Wt) plant
69
Figure30. Comparison of hair-like trichomes (indicated by arrows) in cotton (G. arboreum) wild and wax mutant (GaWM1, GaWM2, & GaWM3) plants. Wax deficient mutants have showed more hairy trichomes than wild.
70
Figure31. Total RNA from cotton (G. arboreum) plant, showing two intact rRNA bands with mRNA smears.
71
Figure32. Nanodrop plots showing cotton (G. arboreum) total RNA, the single peak is the evidence of purity
71
Figure33. dscDNA synthesized for cDNA library construction resolved by gel electrophoresis for the size selection ≥ 1000 bp (1kb). M= 1Kb DNA ladder
72
Figure34. Confirmation of clones by PCR amplification Lane 1-96, PCR amplified cDNA clones M = 1Kb DNA Ladder
74
Figure35. A single sequenced clone from G. arboreum cDNA library, showing quality of sequence
75
Figure36. cDNA library sequences homology search result against non-redundant database (using BLASTN program)
76
Figure37. GO Molecular Functional categorization by annotation 78
Figure38. GO Cellular components categorization by annotation 78
Figure39. GO Cellular processes categorization by annotation 78
Figure40. Qualitative and quantitative confirmation of microarray target by Nanodrop (ND-1000).
80
XIII
Figure41. Microarray image showing hybridization of wild and wax deficient mutant (GaWM3) labeled cDNAs on cotton (G. arboreum) cDNA platform
81
Figure42. R-I plot for Raw Data on left and normalized data on right 82
Figure43. BLAST results for forty (40), wax potential candidate ESTs, against protein, nucleotide and EST databases
83
Figure44: Relative fold expression of Wax potential candidate ESTs in leaves of wild and wax mutant (GaWM3) cotton plants through Real-time PCR. Solid bars represent FAM (carboxyfluorescein) signals during the reaction
86
Figure45. Cotton (G .arboreum) wax potential candidate ESTs Cellular component categorization by GO annotation
88
Figure46. Cotton (G .arboreum) wax potential candidate ESTs Molecular Functional categorization by GO annotation
88
Figure47. Cotton (G .arboreum) wax potential candidate ESTs Biological Process categorization by GO annotation
88
Figure48. The expressional profile of wax potential candidate ESTs and their Arabidopsis orthologs (under biotic, abiotic & UV stresses), validating and strengthening of their candidateship
90

XIV
LIST OF TABLES
Table1. Actual Surface Water Availability (Million Acre Feet (MAF)
6
Table2. Plant groups with mutagenic treatments and pre-soaking time.
23
Table3. Sequences of the primers used in Real-time PCR with their GenBank Acc_No. and product sizes.
45
Table4. 50% seed germination doses of the physical, chemical mutagens and their combinations.
47
Table5. Selected wax mutant Lines with traits of selection and No: of plants in M2.
52
Table6. Wild cotton (G. arboreum) leaf epicuticular wax components and their retention time (Rt).
65
Table7. Leaf epicuticular wax classes in cotton (G. arboreum) wild and wax mutants (GaWM1, GaWM2, & GaWM3 )
67
Table8. Cotton (G. arboreum) biotic and abiotic stress responsive ESTs, their annotations and E-values
79
Table9. Cotton (G. arboreum) wax potential candidates ESTs, their accession numbers, mean expression ratios (log2), p values and homology with NCBI GenBank against nucleotide, EST and protein data bases.
84
XV
ABBREVIATIONS
mRNA Messenger ribonucleic acid
RNA Ribonucleic acid
DNA Deoxyribonucleic acid
cDNA Complementary Deoxyribonucleic acid
Cy3 Cyanine 3
Cy5 Cyanine 5
dNTP Deoxy nucleotide triphosphate
aadUTP Amino allyl Deoxy uridine triphosphate
ABA Abscic acid
LEA Late embryogenesis abundant
BSA Bovine serum albumin
TE Tris EDTA
EDTA Ethylene diamine tetra acetic acid
CTAB Cetyl Trimethyl Ammonium Bromide
PVP POLYVINYLPYRROLIDONE
SDS sodium dodecyl sulfate
DEPC Diethyl pyro carbonate
DTT Dithiothretol
SEM Scanning electron microascopy
GCMS Gas chromatograph mass spectrophotometer
EMS Ethyl methane sulphonate
DES Diethyl sulfate
SA Sodium azoid
Gy Gray
RT Reverse transcriptase
Rt Retention time
MS Mass spectra
LB Luria-Bertani
PCR Polymerase chain reaction
MIDAS Microarray data analysis system
MeV MultiExperiment Viewer
SSC Saline sodium citrate
XVI
SSTE Saline sodium tris EDTA
PCI Phenol chloroform isoamyl alcohol
UV Ultraviolet
ssDNA Single stranded deoxyribonucleic acid
dscDNA Double stranded complementary deoxyribonucleic acid
C Carbon
CAT Chloramphenicol O-acyltransferase
FAE1 Fatty acid elongation1
MMLV Moloney Murine Leukemia Virus
Pfu Pyrococcus Furiosus
Cfu Clone forming units
LET Linear energy transfer
cer Eceriferum
EST Expressed sequence tags
AARI Ayub Agriculture Research Institute
CEMB Centre of Excellence in Molecular Biology
PARAS Pakistan Radiation Services
PST Pre-soaking time
BSTFA Bis-(N,N-trimethylsilyl)-trifluoroacetamide
SOC Super Optimal broth with Catabolite repression
TAE Tris-acetate-EDTA
rpm Round per minute
DMSO Dimethyl sulfoxide
His Histidine
GAPDH Glyceraldehyde 3-phosphate dehydrogenase
GO Gene Ontology
SGD Seed Germination Dose
TIC Total ion current
kb Kilo-bases
VLCF Very long chain fatty acid

XVII
ACKNOWLEDGEMENTS
I am extremely grateful to almighty “ALLAH” whose bountiful blessing enabled me to
complete this research project as well as to write this thesis. He bestowed us with his "HOLY
QURAN", and prophet “MUHAMMAD” (Peace be upon him), who enlightens the hearts of us
in our lives. I wish to acknowledge several key figures that contributed much to my research
endeavor.
Firstly, I would like to acknowledge my gratitude to our greatly erudite and dignified
Professor Dr SHEIKH RIAZUDDIN, Director National Center of Excellence in Molecular
Biology, University of Punjab, for his compassion and help for the Ph.D. enrollment and
providing all necessary facilities during my research work.
I would like to express my heartful thanks to my kind and worthy supervisor Dr.
TAYYAB HUSNAIN Professor National Centre of Excellence in Molecular Biology,
University of the Punjab for his continuous support and encouragement from the
commencement to the submission in the present research studies. His wide knowledge and
logical way of thinking have been of great value for me. His understanding, encouraging and
personal guidance have provided a good basis for my research studies.
My gratitude is also extended to Dr. Bushra Rasheed and Dr. Ahmad Ali Shahid, for
their inspiring guidance and all that I learned from them in theory and practical research.
I would like to thank Dr. Zia-ur-rehman (PCSIR, Lahore) for GC-MS analyses and Dr.
Riaz (Director, Central Resources Lab, university of the Peshawar) for providing Scanning
Electron Microscopy (SEM) facilities.
Many thanks go in particular to Muhammad Irfan, Miss Muzna Zahur, Miss Assma
Maqbool and Miss Uzma Qaiser for their help, guidance, cooperation, advice, discussion and to
their critical comments during my research studies. I gratefully thank Mr. Abdul Qayyum Rao,
and Mr. Allah Bakhsh for their advice and guidance.

XVIII
Special thanks to my lab fellows, Mr. Adil Jamal, Mr. Naveed Shaid, and Miss Benish
Aftab, for their assistance and kind behavior.
I also want to thank Muhammd Ilyas (Scientific assistant), Muhammad Nisar,
Muhammad Azam (Lab Attendents), Muhammad Mumtaz and Muhammad Nazir (Field
assistants) for their assistance and timely help in lab and field work.
I would also like to thank my family and friends. Without their emotional support, this
project would not have been possible. Finally, I would like to thank my mother, brothers,
sisters, wife, daughter, sons and especially my cousin, Mr. Muhammad Ayub Barozai for their
endless love and sacrifice. This work is as much their as it is mine.
Muhammad Younas
XIX
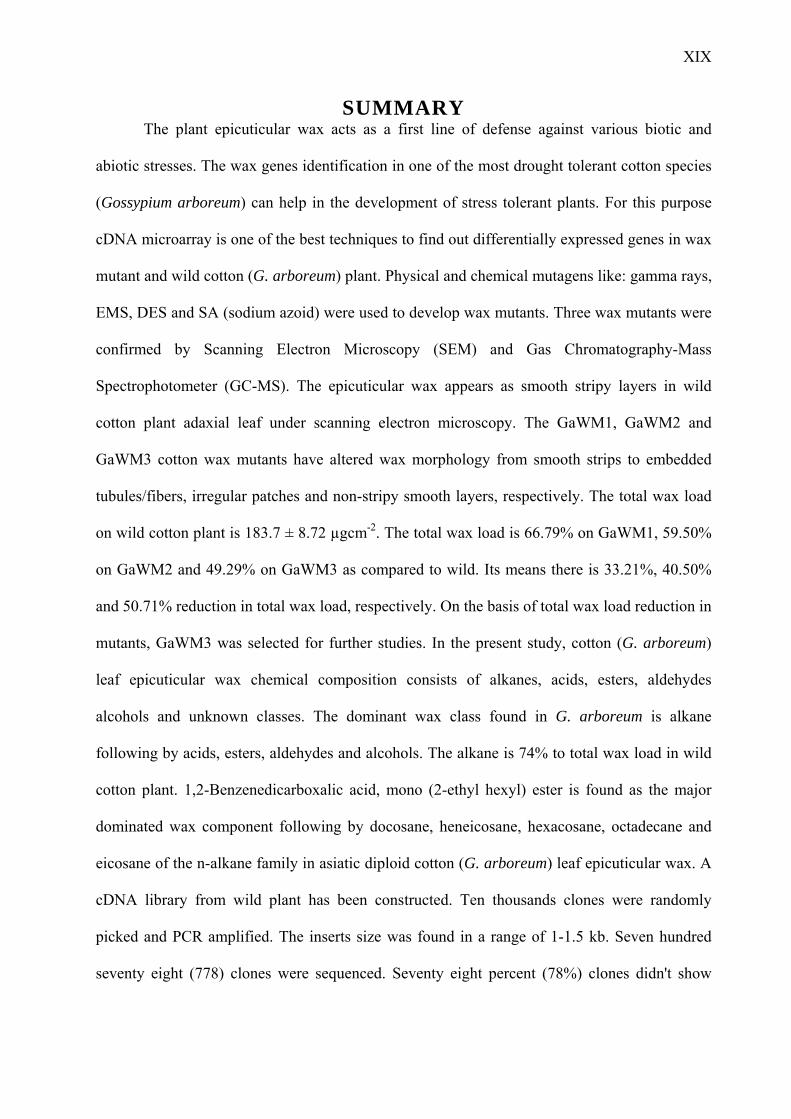
SUMMARY The plant epicuticular wax acts as a first line of defense against various biotic and
abiotic stresses. The wax genes identification in one of the most drought tolerant cotton species
(Gossypium arboreum) can help in the development of stress tolerant plants. For this purpose
cDNA microarray is one of the best techniques to find out differentially expressed genes in wax
mutant and wild cotton (G. arboreum) plant. Physical and chemical mutagens like: gamma rays,
EMS, DES and SA (sodium azoid) were used to develop wax mutants. Three wax mutants were
confirmed by Scanning Electron Microscopy (SEM) and Gas Chromatography-Mass
Spectrophotometer (GC-MS). The epicuticular wax appears as smooth stripy layers in wild
cotton plant adaxial leaf under scanning electron microscopy. The GaWM1, GaWM2 and
GaWM3 cotton wax mutants have altered wax morphology from smooth strips to embedded
tubules/fibers, irregular patches and non-stripy smooth layers, respectively. The total wax load
on wild cotton plant is 183.7 ± 8.72 µgcm-2. The total wax load is 66.79% on GaWM1, 59.50%
on GaWM2 and 49.29% on GaWM3 as compared to wild. Its means there is 33.21%, 40.50%
and 50.71% reduction in total wax load, respectively. On the basis of total wax load reduction in
mutants, GaWM3 was selected for further studies. In the present study, cotton (G. arboreum)
leaf epicuticular wax chemical composition consists of alkanes, acids, esters, aldehydes
alcohols and unknown classes. The dominant wax class found in G. arboreum is alkane
following by acids, esters, aldehydes and alcohols. The alkane is 74% to total wax load in wild
cotton plant. 1,2-Benzenedicarboxalic acid, mono (2-ethyl hexyl) ester is found as the major
dominated wax component following by docosane, heneicosane, hexacosane, octadecane and
eicosane of the n-alkane family in asiatic diploid cotton (G. arboreum) leaf epicuticular wax. A
cDNA library from wild plant has been constructed. Ten thousands clones were randomly
picked and PCR amplified. The inserts size was found in a range of 1-1.5 kb. Seven hundred
seventy eight (778) clones were sequenced. Seventy eight percent (78%) clones didn't show
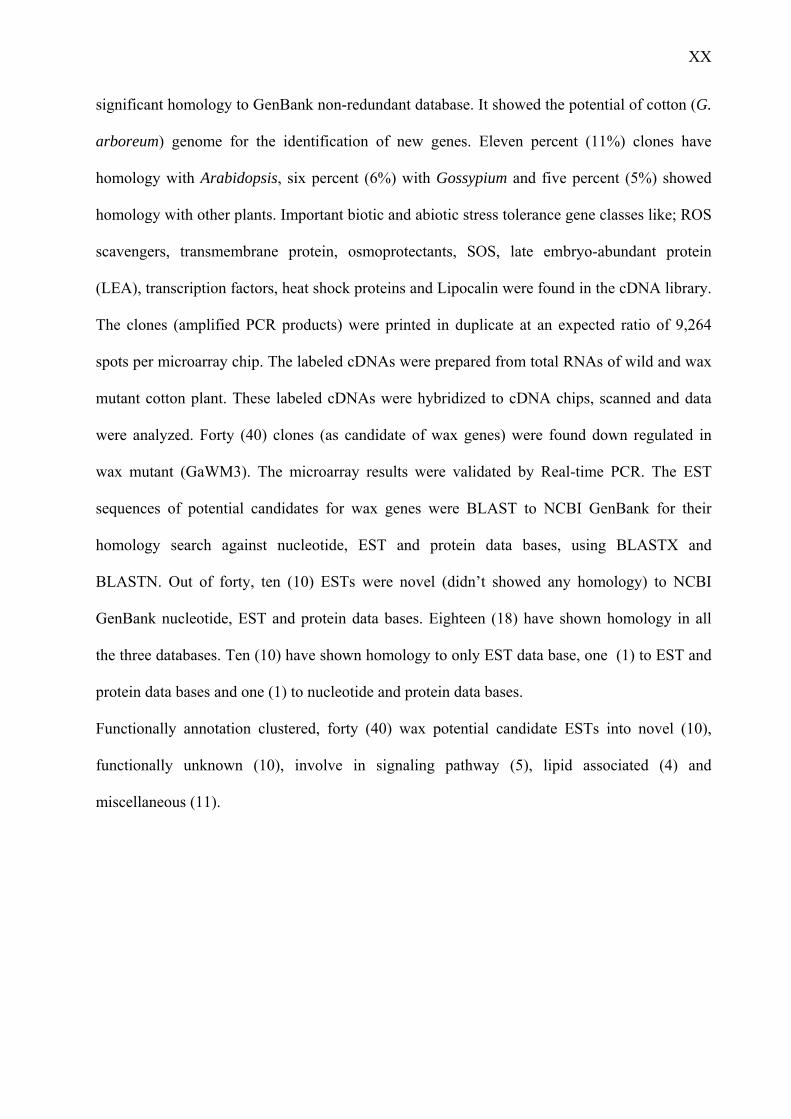
XX
significant homology to GenBank non-redundant database. It showed the potential of cotton (G.
arboreum) genome for the identification of new genes. Eleven percent (11%) clones have
homology with Arabidopsis, six percent (6%) with Gossypium and five percent (5%) showed
homology with other plants. Important biotic and abiotic stress tolerance gene classes like; ROS
scavengers, transmembrane protein, osmoprotectants, SOS, late embryo-abundant protein
(LEA), transcription factors, heat shock proteins and Lipocalin were found in the cDNA library.
The clones (amplified PCR products) were printed in duplicate at an expected ratio of 9,264
spots per microarray chip. The labeled cDNAs were prepared from total RNAs of wild and wax
mutant cotton plant. These labeled cDNAs were hybridized to cDNA chips, scanned and data
were analyzed. Forty (40) clones (as candidate of wax genes) were found down regulated in
wax mutant (GaWM3). The microarray results were validated by Real-time PCR. The EST
sequences of potential candidates for wax genes were BLAST to NCBI GenBank for their
homology search against nucleotide, EST and protein data bases, using BLASTX and
BLASTN. Out of forty, ten (10) ESTs were novel (didn’t showed any homology) to NCBI
GenBank nucleotide, EST and protein data bases. Eighteen (18) have shown homology in all
the three databases. Ten (10) have shown homology to only EST data base, one (1) to EST and
protein data bases and one (1) to nucleotide and protein data bases.
Functionally annotation clustered, forty (40) wax potential candidate ESTs into novel (10),
functionally unknown (10), involve in signaling pathway (5), lipid associated (4) and
miscellaneous (11).

CHAPTER: 1
INTRODUCTION
1
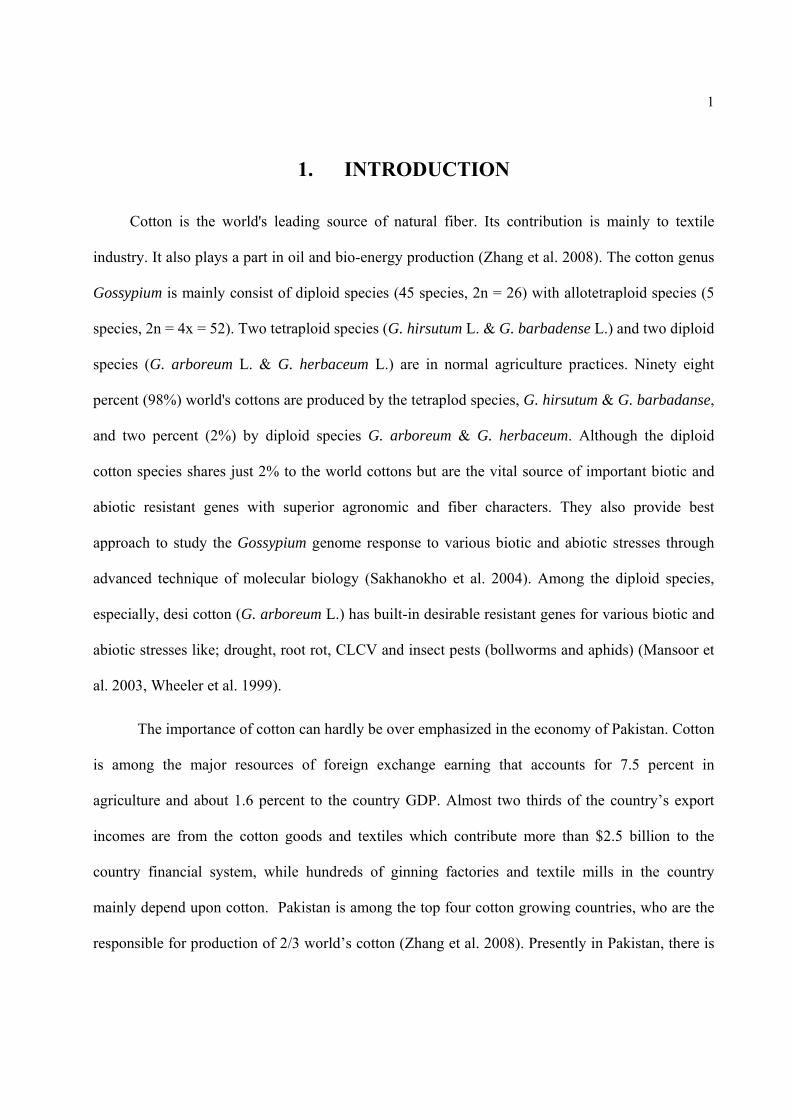
1. INTRODUCTION
Cotton is the world's leading source of natural fiber. Its contribution is mainly to textile
industry. It also plays a part in oil and bio-energy production (Zhang et al. 2008). The cotton genus
Gossypium is mainly consist of diploid species (45 species, 2n = 26) with allotetraploid species (5
species, 2n = 4x = 52). Two tetraploid species (G. hirsutum L. & G. barbadense L.) and two diploid
species (G. arboreum L. & G. herbaceum L.) are in normal agriculture practices. Ninety eight
percent (98%) world's cottons are produced by the tetraplod species, G. hirsutum & G. barbadanse,
and two percent (2%) by diploid species G. arboreum & G. herbaceum. Although the diploid
cotton species shares just 2% to the world cottons but are the vital source of important biotic and
abiotic resistant genes with superior agronomic and fiber characters. They also provide best
approach to study the Gossypium genome response to various biotic and abiotic stresses through
advanced technique of molecular biology (Sakhanokho et al. 2004). Among the diploid species,
especially, desi cotton (G. arboreum L.) has built-in desirable resistant genes for various biotic and
abiotic stresses like; drought, root rot, CLCV and insect pests (bollworms and aphids) (Mansoor et
al. 2003, Wheeler et al. 1999).
The importance of cotton can hardly be over emphasized in the economy of Pakistan. Cotton
is among the major resources of foreign exchange earning that accounts for 7.5 percent in
agriculture and about 1.6 percent to the country GDP. Almost two thirds of the country’s export
incomes are from the cotton goods and textiles which contribute more than $2.5 billion to the
country financial system, while hundreds of ginning factories and textile mills in the country
mainly depend upon cotton. Pakistan is among the top four cotton growing countries, who are the
responsible for production of 2/3 world’s cotton (Zhang et al. 2008). Presently in Pakistan, there is
2
9.3 percent reduction in the cotton crop due to various reasons, including biotic and abiotic stresses
(Economic Survey 2007-08).
In this stares we required those cotton varieties which resist these biotic and abiotic stresses.
This resistance in cotton to various stresses can be gained by improving the cotton plant through
stress resistant genes. The identification of stress resistant genes toward stress tolerant cotton is the
former step. There are several classes of genes for stress tolerance like transcription factor,
antioxidant, heat shock proteins, ion transporters, LEA protein, osmolyte (Wang et al. 2003), and
epicuticular wax genes (Jenks et al. 1994).
Epicuticular wax is one of the special features developed by plants to seal the aerial organs to
face and tolerate various biotic and abiotic stresses. It serves as a first line of defense to avoid non-
stomatal destructive water loss (Baur, 1998). The epicuticular waxes also contribute to other
additional functions in plant protection like, ultraviolet (UV) light reflection (Reicosky & Hanover,
1978, Kakani et al. 2003), restrict the attachment and growth of insects (Müller, 2006), increased
plant resistance against pathogens like bacteria and fungi (Carver & Gurr, 2006) and decreased
water deposition on the surface of the plant thus reducing retention of dust, pollen and air pollutants
(Kerstiens, 1996).
The plant epicuticular wax genes identification through molecular biology advances are
linked with the analyses of epicuticular wax mutants (Kunst et al. 2003). Deficiencies in the wax
layer are easily visible because mutant plants have a glossy appearance. This trait has become a
precise genetic marker, and several mutants affected in wax biosynthesis and deposition have been
isolated and studied in different plant species (Mariani et al. 2000). Various physical and chemical
mutagens have been used to develop wax-deficient mutants in various plant species like,
3
Arabidopsis (Koornneef et al. 1989), sorghum bicolor (Jenks et al. 1994), barley (Hordeum
vulgare) (von Wettstein-Knowles 1987), and maize (Zea mays)( Bianchi et al. 1978). According to
the literature the maximum number of identified loci involved in wax production and deposition
was reported in barley, which are 85. Next is Arabidopsis, with total 25 known wax mutants
showing different degrees of waxlessness is reported. The wax mutant varieties in Arabidopsis and
sorghum were produced by chemical and physical mutagens. Sorghum bicolor wax mutant plants
were produced by induced mutagenesis through diethyl sulfate and ethyl methane sulphonate
(Jenks et al. 1994) and in Arabidopsis through ethyl methane sulphonate (Koornneef et al. 1989).
Microarray provides an enormous stage for the identification of differentially expressed genes
in wild versus mutants (Girgis et al. 2007, Costaglioli et al. 2005). The microarray is basically used
for the differentially expressed gene studies (Hughes et al. 2001). Oligonucleotides and cDNA
based microarrays have great potential, for un-raveling gene functions and applications in various
fields of basic and applied research (Rishi et al. 2002). Transcriptional response of a genome
against a specific mutational event or environmental insult can be better understood using the
microarray technology. This technique has already been applied for identification of differentially
expressed genes in cancer and non-cancer, tissue and organ development, abiotic, biotic stresses,
chemical and toxicity treated organisms coupling with forward and reverse genetics (Alignan et al.
2006, Wu et al. 2005, Seki et al. 2002, Beth et al. 2005)
The present study is aimed to achieve a better understanding of the genes involved in wax
production and deposition in Gossypium arboreum leaves. An approach to develop epicuticular
wax mutants, construction of cDNA library from wild plant leaves and differential screening
through cDNA microarray was used. Potential wax candidate genes were identified along with
sequencing and blasting against already known genes.
CHAPTER: 2
REVIEW OF LITERATURE
4
2. REVIEW OF LITERATURE
2.1. COTTON
The word “cotton” is a modified form of “al qatan” (an Arabic word). No one knows how old
the cotton plant is. One of the first archeological discoveries of cotton usage in the world is located
in Pakistan at Mohenjo Daro. This site is over 5000 years old. Present day breeding and selection
are a continuation of the domestication process. The cotton plant is perennial tree but has been
domesticated to be grown as a pseudo-annual shrub. Wild species of cotton generally occur in frost-
free areas of the subtropical and tropical regions. Freezing temperatures kill the protoplast of all
cultivated species and most wild species. Therefore, cotton is a warm climate crop. It is planted in
spring or early summer and harvested in late fall or early winter. Cotton is sun loving plant but not
a water loving plant. Water requirements of cotton depend on weather conditions, but a successful
cotton harvest require at least 75cm of rain or irrigation water on average cotton is primarily grown
between 37 degree north and 32 degree south (ICAC, http://www.icac.org/cotton).
Cottons (Gossypium spp.) is a member of the genus Gossypium and the family Malvaceae.
Gossypium has 45–50 species. Majority of the species are diploids (2n = 26). Five (5) species are
allotetraploids (2n = 52). The species are clustered into eight (8) genome groups, referred as A to G
and K, on the basis of chromosome pairing affinities (Endrizzi et al. 1984). The species, referred as
(AD)1 to (AD)5 on the basis of their genome constitutions. Phylogenetic studies grouped the
diploid species of Gossypium into two major lineages, one is the 13 D-genome species lineage and
the other is 30-32 A-, B-, E-, F-, C-, G-, and K-genome species lineage, and the tetraploid species
into one lineage (5 AD). Only four species, two allotetraploids (G. hirsutum and G. barbadense)
and two diploids (G. herbaceum and G. arboreum) are cultivated (Wendel and R.C, 2003).
5
Gossypium hirsutum, also called as Upland cotton, Long Staple Cotton, or Mexican Cotton,
shares more than 90% of the world’s cotton, G. barbadense, also called as Sea Island Cotton, Extra
Long Staple Cotton, American Pima, or Egyptian Cotton, shares 8% of the world’s cotton, and G.
herbaceum, also known as Levant Cotton, and G. arboreum, also known as Tree Cotton, together
contribute 2% of the world’s cotton (Jiang et al. 1998).
Cotton is not only a source of textile fiber and oilseed crop, but also has importance for foil
energy and bioengergy production. According to the Food and Agriculture Organization (FAO) of
the United Nations (http://www.fao.org), the cotton planting area is almost 35 million hectares and
the total world’s cotton production had a record of about twenty three million metric tones in
2004/2005.
G. arboreum ( A genome ), has a number of better agronomic traits, such as disease and
insect resistance, high fiber strength, and tremendous plasticity, which upland cotton cultivars lack.
Due to these reasons G. arboreum is still planted. G. arboreum is generally considered as one of the
best member of the A genome (Endrizzi et al. 1984, Wendel et al. 1995). Therefore, the G.
arboreum species is important for agricultural production, genomic and evolution research in
cotton.
General belief that G. arboreum is low yielder but in fact it can grows under the poorest
cotton growing situations and low management. Due to inherent abiotic tolerance in G. arboreum,
the effect of environmental stresses is reflected less in reduction of its acreage and product as
compared to other species. Due to this the decrease in G. arboreum between normal and stressed is
25 per cent compare to over 75 per cent in G.hirsutum (Borole, 2000).
6
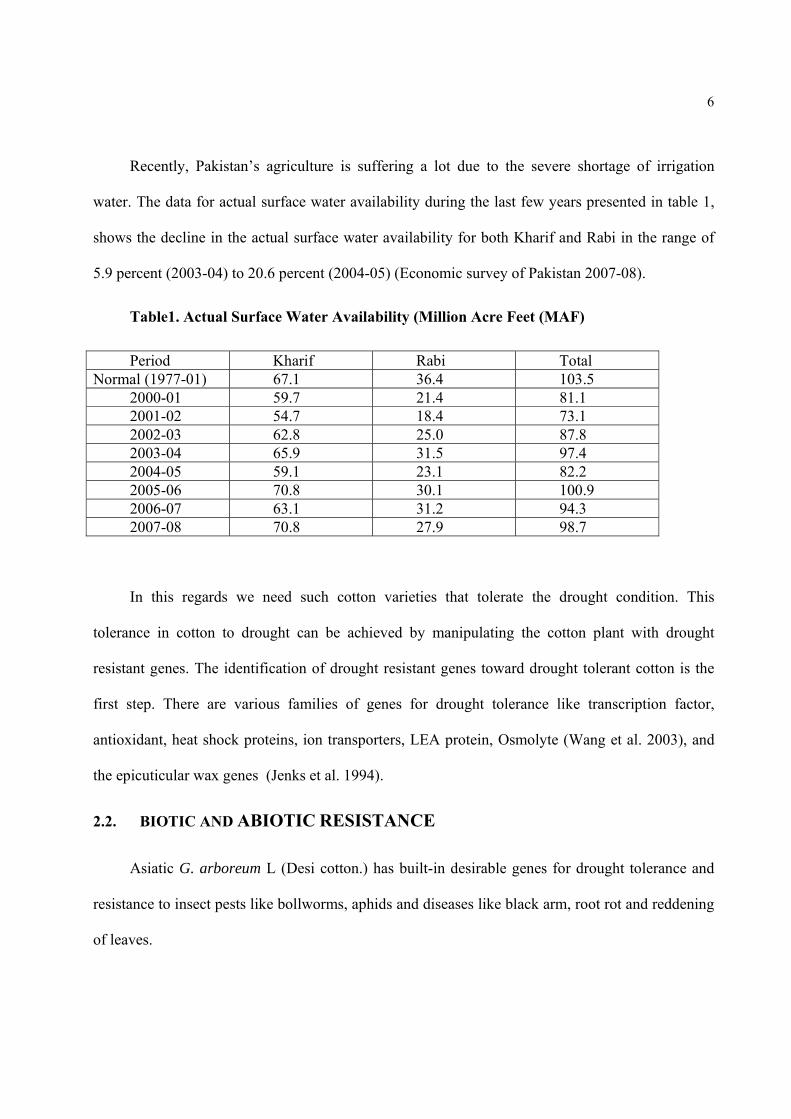
Recently, Pakistan’s agriculture is suffering a lot due to the severe shortage of irrigation
water. The data for actual surface water availability during the last few years presented in table 1,
shows the decline in the actual surface water availability for both Kharif and Rabi in the range of
5.9 percent (2003-04) to 20.6 percent (2004-05) (Economic survey of Pakistan 2007-08).
Table1. Actual Surface Water Availability (Million Acre Feet (MAF)
Period Kharif Rabi Total Normal (1977-01) 67.1 36.4 103.5
2000-01 59.7 21.4 81.1 2001-02 54.7 18.4 73.1 2002-03 62.8 25.0 87.8 2003-04 65.9 31.5 97.4 2004-05 59.1 23.1 82.2 2005-06 70.8 30.1 100.9 2006-07 63.1 31.2 94.3 2007-08 70.8 27.9 98.7
In this regards we need such cotton varieties that tolerate the drought condition. This
tolerance in cotton to drought can be achieved by manipulating the cotton plant with drought
resistant genes. The identification of drought resistant genes toward drought tolerant cotton is the
first step. There are various families of genes for drought tolerance like transcription factor,
antioxidant, heat shock proteins, ion transporters, LEA protein, Osmolyte (Wang et al. 2003), and
the epicuticular wax genes (Jenks et al. 1994).
2.2. BIOTIC AND ABIOTIC RESISTANCE
Asiatic G. arboreum L (Desi cotton.) has built-in desirable genes for drought tolerance and
resistance to insect pests like bollworms, aphids and diseases like black arm, root rot and reddening
of leaves.
7
Drought is a world-wide problem, limiting global crop production and quality seriously and
recent global climate change has made this situation more serious (Apel and Hirt 2004, Chen and
Gallie 2004, Chandler and Bartels 2003, Munnus 2002). The G. arboreum has the ability to tolerate
and cope from the adverse effects of the drought (Pundir, 1972, Borole, 2000).
Root rot caused by over-watering and fungal attack. Thielaviopsis basicola is the cause of
black root rot of cotton seedlings. Upland cotton did not show resistance to black root rot (Wang
and Davis, 1997). Wheeler et al. (1999) reported diploid cotton (Gossypium arboreum) with visible
high resistance to Thielaviopsis basicola. Hence Asiatic G. arboreum L. (Desi cotton) is suitable
for dry land conditions and low input technology.
The Asiatic G. arboreum is also resistant to the leaf curl disease. The cotton leaf curl disease
is a serious threat to subcontinent cotton (Mansoor et al. 2003). The cotton leaf curl disease is
caused by geminiviruses, single stranded DNA (SSDNA) viruses with circular genomes that are
grouped in the family Geminivirdae. The whitefly-transmitted geminivirus (genus Begomovirus) is
the most import group of geminiviruses. The Asiatic G. arboreum is resistant to this virus (Yusuf et
al. 2003).
The above discussions prove that the G. arboreum is more suitable for the identification of
stress resistant genes on the basis of its tolerance to biotic and abiotic stresses. The Gossypium
arboreum has also got importance in genomic studies by sharing it’s A genome to modern upland
cotton, G. hirsutum. Its diploid nature of genome made it right choice for identification of novel
genes in genus Gossypium and mutation studies (Udall et al. 2006).
8
2.3. WAX
2.3.1. EPICUTICULAR WAX
Plant surfaces are sheltered by an epicuticular wax layer which is highly variable depending
on species, cultivar or plant part. A chemical basis advance definition of plant surface wax is as a
polyester matrix of hydroxy- and hydroxy epoxy fatty acids C16 and C18 long (cutin) embedded
and overlaid with cuticular wax. For molecular genetic analysis of wax related genes, the wax has
been defined as the “lipids which are removed from plant surfaces after brief immersion in an
organic (nonpolar) solvent, like chloroform, hexane” (Post-Beittenmiller D, 1998).
The nonwoody surfaces of plants are protected from the environmental threats by the cuticle,
a layer composed of cutin and wax (Jetter et al. 2006). This wax is both impregnated in
(intracuticular) and exterior to (epicuticular) the cutin biopolymer. Epicuticular wax may exist as a
smooth film in some species, typically rendering their surfaces glossy, or it may be textured by
protruding wax crystals in other species (Jeffree, 2006).
Plant cuticular waxes consist of complex mixtures of very-long-chain aliphatics and cyclic
compounds. The aliphatics compounds are consist of fatty acids, aldehydes, primary and secondary
alcohols, ketones, and alkanes, with chain lengths ranging from C16 to C36 in homologous series.
Along with aliphatic compounds, cyclic compounds such as triterpenoids, tocopherols, and
aromatic compounds may be present in either large or small quantities, depending on the species
(Jetter et al. 2006).
In addition to epidermal cells, on which a waxy layer is present, the fatty acids are also
present on specialized cells of plant reproductive organs. Stigmatic papillae is an example of such
specialized cell, which as wax layer (Lolle and Pruitt 1999). Sporopollenin is a much stable
9
polymer containing long-chain fatty acids and phenylpropanoids which forms the external wall of
the pollen, or the exine (Guilford et al. 1988).
2.3.2. EPICUTICULAR WAX ROLE AND SIGNIFICANCE IN PLANTS
The plants are sessile, so they did not cope from the extreme biotic and abiotic stresses by
physical motion as the animals. They developed special features to face and tolerate these stresses.
Epicuticular wax is on of them, which acts as a first line of defense to prevent non-stomatal harmful
water loss, which is the primary function of the cuticle (Baur, 1998). Other secondary functions in
plant protection have been also suggested for epicuticular waxes, such as ultraviolet (UV) light
reflection (Reicosky & Hanover 1978, Kakani et al. 2003), first physical barrier faced by external
organisms, the wax likely plays a role in plant–insect (Müller 2006) and plant–pathogen
interactions (Carver & Gurr 2006).
The chemical components of epicuticular waxes are involved to form a continuous
hydrophobic water barrier, which obstructed water loss from plant organs. Reduced amounts of
epicuticular wax on plant surface have been shown to be associated with increased rates of
transpiration. Brushing waxes off the excised leaves significantly increased the rate of water loss
(Hall and Jones 1961). Similarly, leaves of rice (Oryza sativa), dipped for two seconds in
chloroform to remove epicuticular waxes, and exhibited more than a two fold increase in cuticular
conductance to water vapor compared to control leaves (O’Toole et al. 1979a). Leaf glaucousnees
(waxinees) is a characteristic that has been referred as a plant adaptation to drought (Johnoson et al.
1983). The leaf epicuticular wax layer thickness has been shown to increase by as much as 30-40%
with exposure to water deficit in various plant species (Oosterhuis et al. 1991a, Weete et al. 1978).
10
The epicuticular wax not only prevent non-stomatal water loss, sheltered plants against
ultraviolet radiation (Reicosky et al. 1978) and decreases water deposition on the surface of the
plant thus reducing retention of dust, pollen and air pollutants (Kerstiens G. 1996). In addition,
surface wax also plays important roles in plant tolerance against pathogens like bacteria and fungi
(Jenks et al. 1994) and resist in a variety of plant-insect interactions (Eigenbrode et al 1995).
The epicuticular wax layer of plants has been involved to manipulate the foraging success of
natural predators (Eigenbrode 2004). For example, on wax-deficient pea mutants, Aphidius ervi
spent more time actively foraging and a larger number of aphids were parasitised than on wild
plants (Chang et al. 2004). The accumulation of epicuticular waxes on the plant surfaces is helpful
in reducing the foraging success of predators or parasitoids by limitizing their attachment to plant
surface. Abridged wax loads regularly linked with better insect attachment to the plant surface
(Eigenbrode and Jetter 2002). For the evaluation of foraging success of natural enemies there
should be a consideration of potential effects of the wax layer on kairomone detectability alongwith
the attachment differences.The biological control of pests and efficiency of parasitoids can be
improved by the selection of crop plant varieties with higher wax contents on aerial parts (Rostás et
al. 2008).
2.3.3. EPICUTICULAR WAX GENES
Molecular biology advances in identification of plant epicuticular wax genes are linked
with thorough biochemical analysis of mutant phenotypes. Deficiencies in the wax layer are easily
visible because mutant plants have a glossy appearance. This glossy trait has become a precise
genetic marker, and several mutants affected in wax biosynthesis have been isolated and studied in
different plant species (Mariani et al. 2000).
11
The gene encoding an aldehyde decarbonylase, a key wax biosynthetic enzyme involved in
the conversion of aldehydes to alkanes was thought to be a reason in decreased intensity of alkanes,
secondary alcohols and ketones and high aldehyde levels on the surface of cer1 mutants (McNevin
et al. 1993), but the cloning of CER1 gene did not confirmed this prediction (Aarts et al. 1995).
Moreover, CER1 is the homologue of EPI-23, a Kleinia odora epidermis-specific protein
(Kolattukudy et al. 1996) and GLOSSY1 (GL1) protein of maize (Zea mays) (Hannoufa et al. 1993)
which have 5-7 predicted transmembrane domains. On this basis they may be considered as
membrane transporters engaged in wax secretion (Hansen et al. 1997).
The wax composition in cer2 suggested an obstructs in the elongation of fatty acids C26
(Hannoufa et al. 1993). When the CER2 gene was isolated (Xia et al. 1996, Negruk et al. 1996), the
resulted amino acid sequence had no homology to any previously known gene product, giving no
idea of its biochemical function. With the passage of time and advances in the nucleic acid and
protein databases, however, suggested that CER2 may be a member of a large family of coenzyme
A-dependent acyltransferases (St-Pierre et al. 1998) that act by a catalytic mechanism related to
chloramphenicol O-acyltransferase (CAT). This prediction is based on two highly conserved
consensus motifs, one of which is belong to the catalytic site of CAT.
Attempts to find out the biochemical function of CER3 were also not easy. The epicuticular
wax of the cer3 mutant showed an increase in the chain length of primary alcohols and alkanes, it
means a fault in the discharge of fatty acids from fatty acid elongation complexes (Hannoufa et al.
1993, Kolattukudy et al. 1996). When the CER3 gene is sequenced and in-siliko translated, it
showed no homology with proteins of known function, it has a putative nuclear localization
sequence (NLS) (Hannoufa et al. 1996). It had also two predicted phosphorylation sites, known to
be involved in transport of proteins to the nucleus (Lemieux et al. 1996). On the basis of NLS
12
sequence in CER3 gene and expression in all tissues, it is considered to encode a novel regulatory
protein. The bioinformatics analysis of in-situ translation of CER3 sequence shows its homology
with E3-ubiquitin ligases engaged in the N-end rule pathway (Kwon et al. 1998).
Similarly, seven fold increases in the levels of C24 acyl groups were observed in the CER6
wax mutant plants, over wild type levels. It is suggesting that the product of the CER6 gene has a
role in the elongation of acyl chains longer than 24 carbons (Millar et al. 1999). Cloning of the
CER6 gene (Millar et al. 1999, Fiebig et al. 2000) showed that CER6 encodes an elongase
condensing enzyme involved in the synthesis of very long chain fatty acid precursors for stem and
pollen epicuticular wax deposition.
A wide-ranging of mutant monitor for alteration in very long chain fatty acid composition in
Arabidopsis seeds resulted in identification of a single class of mutants with a defect in the gene
referred as fatty acid elongation1 (FAE1). The FAE1A mutation affected only seed VLCFA
composition, is a clue that FAE1 was particularly has a role in VLCFA elongation reactions in the
seed (Kunst et al. 1992). Cloning and following characterization of the FAE1 gene (Millar et al.
1997) showed that it code for only a condensing enzyme and not all four functions of the elongase.
Till now, three (3) similar enzymes: KCS1 (Tood et al. 1999), FIDDLEHEAD (FDH) (Yephremov
et al. 1999) and CER6 (Millar et al. 1999, Fiebig et al. 2000) have been finding out in the synthesis
of VLCFA precursors for wax production in plant shoots. The maize wax mutant, showing a
decreased level of wax ester components longer than C24, suggested a mutation at the GL8 locus
(Kunst et al. 2003). The GL8 gene was isolated by transposon tagging and suggested to encode a
reductase involved in fatty acid elongation (Xu et al. 1997). Beaudoin et al. (2002) confirmed that,
the maize GL8 functions as a b-ketoacyl-reductase of the FAE has a role in wax deposition.
13
2.3.4. EPICUTICULAR WAX AND COTTON
The upper and lower surfaces of the cotton leaf are sheltered with an amorphous layer of
cuticle with plentiful epicuticular wax ridges (Wullschleger and Oosterhuis 1989, Oosterhuis et al.
1991b). The leaf epicuticular wax layer thickness in cotton is about 30µm, and this thickness has
been found to increase by as much as 30% with treatment of dehydration (Oosterhuis et al. 1991a,
Weete et al. 1978). The water stress increases the wax deposition on the leaf; bract and boll of
cotton (Gossypium hirsutum) that act as barrier against non-stomatal water lose. The increase in the
wax concentration on the leaf was 68.57%, on bract 46.8% and on boll was 4.1% only (Bondada et
al. 1996).
According to Bondada et al. (1996) the long chain alkanes like, n-octacosane, n-nonacosane,
n-triacontane, dotricontane, and n-tetracontane were the chief constituents of the water stress leaf
epicuticular wax. Similarly, the bract wax contained n-octacosane and n-tricontane. n-octacosane,
n-nonacosane and n-tricontane were present as major constituents of long chain alkanes in boll.
Scanning electron microscopy showed that the leaf, bract and boll have similar wax morphology
under both water stressed and well watered condition. The cotton leaf epicuticular wax also
increased, when exposed to UV-B radiation (Kakani et al. 2003).
2.4. MUTATION
2.4.1. INDUCED MUTATION
Mutagenesis is described as the exposure or treatment of biological material to a mutagen, i.e.
a physical or chemical agent that raises the frequency of mutation above the spontaneous rate
(Rieger et al. 1991). Physical and chemical mutagens have been successfully used in plant breeding
programs to generate genetic variation for the development of new varieties with improved
14
characters such as increased yield, earliness, reduced plant height, and resistance to diseases
(Maluszynksi 2001). In recent year, mutation induction became also a powerful tool for
investigation of gene function and expression (Li et al. 2001).
Mutation is a random process at the single cell level. Therefore, the population size of the
M1 and M2 generation must be sufficient to manage with the working objective. This size depends
on the probability to generate the desired mutants and on the inheritance pattern of genes (Brock
1977). The increasing mutagen dose causes a reduction in germination or emergence, length of
root, seedling height, survival and fertility in M1 plants (Brunner 1995). Delayed germination may
be observed in mutagenized seeds as compared to control. When planting seeds in soil, emergence
is taken as the mutagenic criterion instead of germination. Germination is not a good indicator for
an effective dose, because in the initial stage of germination mainly performed organs are
developing, a process that is fairly insensitive to mutagenesis. Only in the phase of active cell
division the effects of mutation is shown (Mick et al. 1997).
Selection of mutants having desirable traits starts in M2 population or in the M3 on the
basis of segregating. Only dominant mutation, that is very rare, can be selected in M1. Alkylating
agent like diethylsulfate and ethyl methane sulphonate (DES and EMS) has been shown to be very
effective and efficient mutagen (Heslot et al. 1961) and has probably become the most popular
chemical mutagen. Alkylation’s of DNA leads to the development of unstable trimesters, which
discharge the alkyl group and interface with DNA replication. Sometimes the phosphate trimesters
are hydrolyzed to produce sugar and phosphate, which causes the breakage of the DNA backbone.
Alkylation’s of nitrogen bases occurs as well, as the reaction with guanine at the N-7 position is the
most frequent event followed by adenine at N-3 and cytosine at N-1. Alkalized guanine is assumed
to ionize differently than the normal guanine, and in such way that guanine can pair with thymine,
15
thus leading to base pair error. The alkalized guanine can be separated from the deoxyribose
leaving it depurinated. Depurination will leave a gap in the DNA template, thus after replication,
either a deletion will result, or any of the four bases may be inserted in the new strands opposite to
deletion (Siddique and Khan 1999).
Gamma rays are a kind of electromagnetic waves of very short wavelength and are
obtained by breakup of the radioisotopes Co-60 or Cs-137. Gamma rays source are suitable for seed
irradiation. Gamma rays produce a few ionizing radiations (Brunner, 1991). When these radiation
passes from biological material, physical processes such as ionizations (ejection of electrons from
molecules) and excitations (process of raising electron to a higher energy state) occur and lead to
damage the DNA. Secondary, chemical events are also take place that start with the formation of
activated molecules, called as free radicals (OH and H) (Van Harten 1998). In case of low LET
(linear energy transfer (LET), which is the transfer of energy along the ionizing track) radiation, the
formation of peroxyradicals is favored. In high LET radiation, the formation of hydrogen peroxide
(H2O2) by recombination of free radicals is favored that causes DNA adducts.
The physical and chemical mutagens were used for a number of plants to produce mutant
varieties (Odeigah et al. 1998, Parsad 1979, Henikoff et al. 2003).
2.4.2. WAX MUTANTS
The epicuticular wax genes identification through molecular biology approaches are coupled
with the analysis of wax mutant phenotypes. Most wax mutants have visual morphology similar to
wildtype, except for their glossy appearance.
Dellaert et al. (1979) identified the first epicuticular wax mutants in Arabidopsis and referred
them as eceriferum (cer), which in Latin is “without wax”. The first allelism studies were reported
16
by Koorneef et al, (1989). A common pleiotropic effect of wax mutations is reduced fertility in
water stressed condition that can be restored by providing high humidity environments, as observed
in cer1, cer2, cer3,cer6, cer8, cer9, cer10, cer22, cer25, ded, and wax1 (Koorneef et al. 1989).
Experiments on cer2 and cer6 showed that this infertility is male gamete specific and that the
mutant pollen coats didn't have certain waxes (Preuss et al. 1993).
Sixty percent reduction of wax contents in cer2, a wax deficient mutant Arabidopsis plant,
was noted by the analysis of waxes of several cer mutants in comparison to the wild plants
(Hannoufa et al. 1993), with a significant decrese in aldehydes, alkanes, secondary alcohols, and
ketones that was two or four carbons shorter than that in wild-type plants. The similar features were
also observed in cer6 mutants.
Wax-deficient mutants have been isolated in a number of plant species, including barley
(Hordeum vulgare), Arabidopsis, maize (Zea mays), and Brassica napus. The mutant loci in barley
and Arabidopsis are so-called eceriferum (cer), whereas loci identified in maize and B. napus are
termed as glossy.
Eighty five (85) cer loci were identified in Barley (Kunst 2003). In Arabidopsis, there are
currently 25 known cer mutants displaying varying degrees of waxlessness are reported. cer1 to
cer10 have very glossy appearance and cer 11- cer22 are displaying less glossy (Koornneef et al.
1989). Complex alterations in wax composition in the majority of wax-deficient mutants may be a
outcome of the visual displays engaged to identify lines with reduced wax loads. Only mutants with
considerable reduction in epicuticular wax deposition would be identified in such a screen, most
likely those with defects in regulatory genes, or genes affecting epidermal development. Mutants
17
affecting individual biosynthetic enzymes would be difficult to find due to their subtler biochemical
phenotypes.
The wax mutant varieties in Arabidopsis and maize were produced by chemical and physical
mutagens (Koorneef et al. 1989, Jenks et al. 1994). Sorghum bicolor wax mutant plants were
produced by induced mutagenesis through diethyl sulfate and ethylmethanesulfate (Jenks et al.
1994) and in Arabidopsis through ethylmethanesulfate (Koornneef et al. 1989).
2.4.3. MUTANTS AND GENES IDENTIFICATION
Mutagenesis is a powerful tool for gene identification in the field of forward genetics. A
number of mutants were used in plants and animals for understanding the functions of nucleic
acids. The metabolic, developmental and regulatory genes were identified in an Arabidopsis carbon
and light insensitive (cli) mutants that is specifically affected in the integration of both carbon and
light signals (Thum et al. 2008). Many genes of the autonomous floral-promotion pathway (AP)
were identified in Arabidopsis AP mutants (Veley and Michaels 2008).
The Arabidopsis wax mutants (cer) were used to understand the unrevealed genes involved in
the wax biosynthetic pathway. The fatty acid desaturases and alkane hydroxylase genes were
identified in the cer1 mutant. The cer2 mutants played role in identification of cuticular wax
accumulation genes. Similarly the fatty acid elongase (FAE1) related genes were identified in cer6
Arabidopsis mutant (Samuels et al. 2008).
2.5. MICROARRAY
In microarray-based technologies, hundreds to thousands of DNA (probe) spots immobilized
on the solid surface, like glass slide, can be simultaneously hybridized with two samples (targets)
labeled with different fluorescent dyes. The terms "probe" and "target" have been used to describe
18
immobilized DNA on slide and labeled cDNA or aRNA synthesized from an RNA sample,
respectively, by the group of developers (Shalon et al. 1996).
Microarray data offer an insight into the transcriptional responses of a genome to a particular
mutational event or environmental insult. The expression profile of thousands of genes can be
generated in a single experiment using Microarray-based technology. The concept of this
technology began with as an oligonucleotide array on a solid surface in the early 1990s (Fodor et al.
1991, 1993, Chetverin and Kramer 1993, Pease et al. 1994). Later, the complementary DNA
(cDNA) microarray was developed by Patrick O. Brown's group at Stanford University in 1995
(Schena et al. 1995). The technique is already applied for differentially expressed genes
identification in condition of cancer, tissue and organ development, abiotic and biotic stresses,
chemical and toxicity treated organisms, and in forward and reverse genetics (Paul et al. 2004,
Alignan et al. 2006, Yahyaoui et al. 2004, Wu et al. 2005, Brinker et al. 2004, Klok et al. 2002,
Seki et al. 2001, Seki et al. 2002, Beth et al. 2005).
2.5.1. TYPES OF DNA MICROARRAY
So for, there are two different kinds of microarray-based technologies on the basis of
immobilized nucleic acid components, i.e. the oligonucleotide array and the cDNA microarray. The
oligonucleotide array consists of oligonucleotide, generally less than 25 mer in length (Shoemaker
et al. 1996, Fambrough et al. 1999, Lipshutz et al. 1999), which are developed in-situ on a solid
surface by light-directed synthesis (GeneChip®, Affymetrix, Inc. Santa Clara, CA, USA) (Fodor et
al. 1991, Hacia et al. 1996). In contrast, the cDNA microarray is generated by the printing of PCR-
amplified cDNAs onto the solid surface. The advantages of the cDNA microarray compared with
19
the oligonucleotide array have been thought to include less susceptibility and higher specificity due
to the longer sequences of the targets (Bilban et al. 2000).
In cDNA microarrays, comparatively extended DNA molecules are spoted by high-speed
robots on a solid surface such as membranes, glass or silicon chips (Schena et al. 1995). The spoted
DNAs are amplified by the polymerase chain reaction (PCR) and usually are longer than 100
necleotides. This type of arrays is used mostly for large-scale screening and expression studies,
especially for those organisms whose genome is not sequenced. The oligonucleotide arrays are
printed either by in situ light-directed chemical synthesis or by conventional synthesis followed by
spoting on a glass substrate (Wallack 2001).
2.5.2. MICROARRAY AND MUTANTS
Microarray provides an enormous stage for the differentially expressed genes identification in
wild versus mutant plants and animals. Girgis et al. (2007) identified 36 novel genes in bacteria
responsible for the bacterial motion using mutant expressional studies through microarray.
Phytohormone genes were studied in light signaling mutants through DNA microarray (Michael et
al. 2008).
To obtain detailed information about gene expression during stamen development in
Arabidopsis (Arabidopsis thaliana), Alves-Ferreira et al. (2007) compared, by microarray analysis,
the gene expression profile of wild-type inflorescences to those of the floral mutants apetala3,
sporocyteless/nozzle, and male sterile1 (ms1), in which different aspects of stamen formation are
disrupted. These experiments led to the identification of groups of genes with predicted expression
at early, intermediate, and late stages of stamen development.

20
Similarly, Gibberellin (GA) deficient mutant (ga1-3), were used to find the DELLA target
genes during Arabidopsis flower development (Hou et al. 2008).
The expression profiling of Arabidopsis SIS7/NCED3/STO1 or SIS10/ABI3 mutants that are
tolerant to the inhibitory effects of icreased concentrations of exogenous glucose and sucrose,
depicted the downregulation of a significant number of genes in comparison to wild plants during
the seed germination. These downregulated genes are involved in auxin production or transport,
suggesting cross-talk between ABA and auxin response pathways (Huang et al. 2008).
Carrera et al. (2008) used the Arabidopsis thaliana mutants deficient in seed ABA production
or perception to understand the relationship between phytohormone, abscisic acid (ABA) and after-
ripening (AR). Although, the imbibed mutant seeds didn’t show dormancy, however, the
expression prolfiling showed remarkable up and down regulation in a set of genes as compared to
wild. A number of AR dependant and independent genes were resulted from this expressional
anaylsis of mutants.
2.5.3. MICROARRAY AND GENES IDENTIFICATION
For genes identification traditional techniques of crossing, mapping, PCR, northern and
southern blotting has limitations of few genes screening. Through microarray thousands of genes
can be screened and identified by comparison of control and experimental organism genes on
microarray chip.
Monghan et al. (2009) identified many new genes of wound healing, epigenetics, genome
stability, and nerve-dependent blastema formation in salamanders.
The expression profiling of B. cenocepacia, grown in CF sputum, revealed the pathogen
altered expression of 723 genes and its microarray analysis showed new genetic pathways involved
21
in responses to antimicrobial resistance, oxidative stress, and iron metabolism (Ian et al. 2008,
Drevinek et al. 2008). Similarly, 335 unique ESTs were identified with atleast 2 fold differential
expression through Microarray analysis of watermelon fruits during the early, ripening, or mature
stage when compared to leaf (Wechter et al. 2008).
Tommasini et al. (2008), identified 4153 barley genes responding to cold/drought stress.
Almost forty four percent genes (1,822 of 4,153) were differentially expressed under drought, while
only 3.8% (158 of 4,153) were cold responsive, 2.8% (119 of 4,153) freeze-thaw specific, and
34.1% responsive to freeze-thaw and drought.
Kloosterman et al. (2008) used a newly designed POCI (Potato Oligo Chip Initiative) array
to identify many genes involved in tuber initiation and growth in potato.
Fernandes et al. (2008), studied maize seedling transcriptome responses to six abiotic
stresses (heat, cold, darkness, desiccation, salt, ultraviolet-B). They identified that a total of 384
ESTs were expressed in all stresses and not present in light-grown seedlings, 146 ESTs were
present in light-grown seedlings and absent from all stress treatments.
Pavy et al. (2008) identified 360 xylem-preferential genes using White spruce transcript
profiling experiments that compared secondary xylem to phloem and needles. Several spruce genes
have not previously been linked to xylem differentiation (including genes encoding TUBBY-like
domain proteins (TLPs) and a gibberellin insensitive (gai) gene sequence) or were shown to encode
proteins of unknown function encompassing diverse conserved domains of unknown function.
From the above literature survey it is concluded that over production of the wax has potential
to increase plant tolerance against biotic and abiotic stresses. Wax mutants have crucial role in wax
genes identification. cDNA microarray is a reasonable approach in identification of differentially

22
expressed genes in wild and mutant plants. In the present study we have focused Gossypium
arboreum as a source for the identification of wax genes and according to the literature survey any
wax gene in G. arboreum is not reported todate.

CHAPTER: 3
MATERIALS
&
METHODS
23
3. MATERIALS AND METHODS
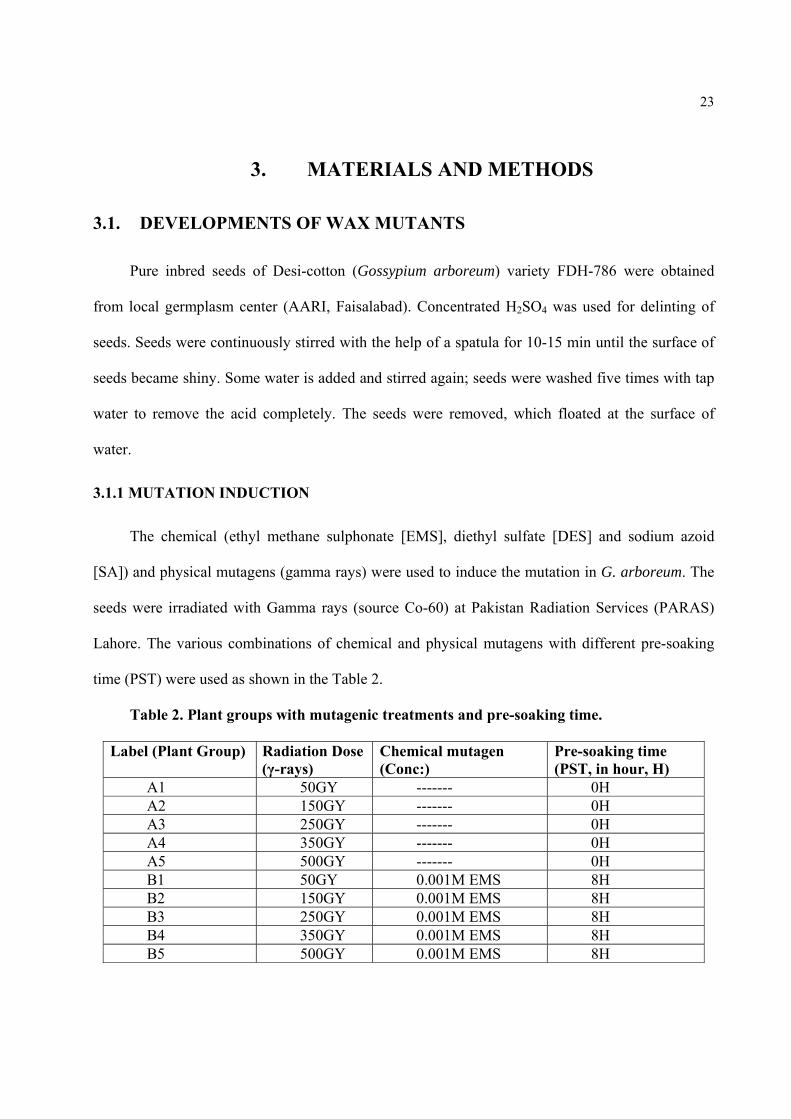
3.1. DEVELOPMENTS OF WAX MUTANTS
Pure inbred seeds of Desi-cotton (Gossypium arboreum) variety FDH-786 were obtained
from local germplasm center (AARI, Faisalabad). Concentrated H2SO4 was used for delinting of
seeds. Seeds were continuously stirred with the help of a spatula for 10-15 min until the surface of
seeds became shiny. Some water is added and stirred again; seeds were washed five times with tap
water to remove the acid completely. The seeds were removed, which floated at the surface of
water.
3.1.1 MUTATION INDUCTION
The chemical (ethyl methane sulphonate [EMS], diethyl sulfate [DES] and sodium azoid
[SA]) and physical mutagens (gamma rays) were used to induce the mutation in G. arboreum. The
seeds were irradiated with Gamma rays (source Co-60) at Pakistan Radiation Services (PARAS)
Lahore. The various combinations of chemical and physical mutagens with different pre-soaking
time (PST) were used as shown in the Table 2.
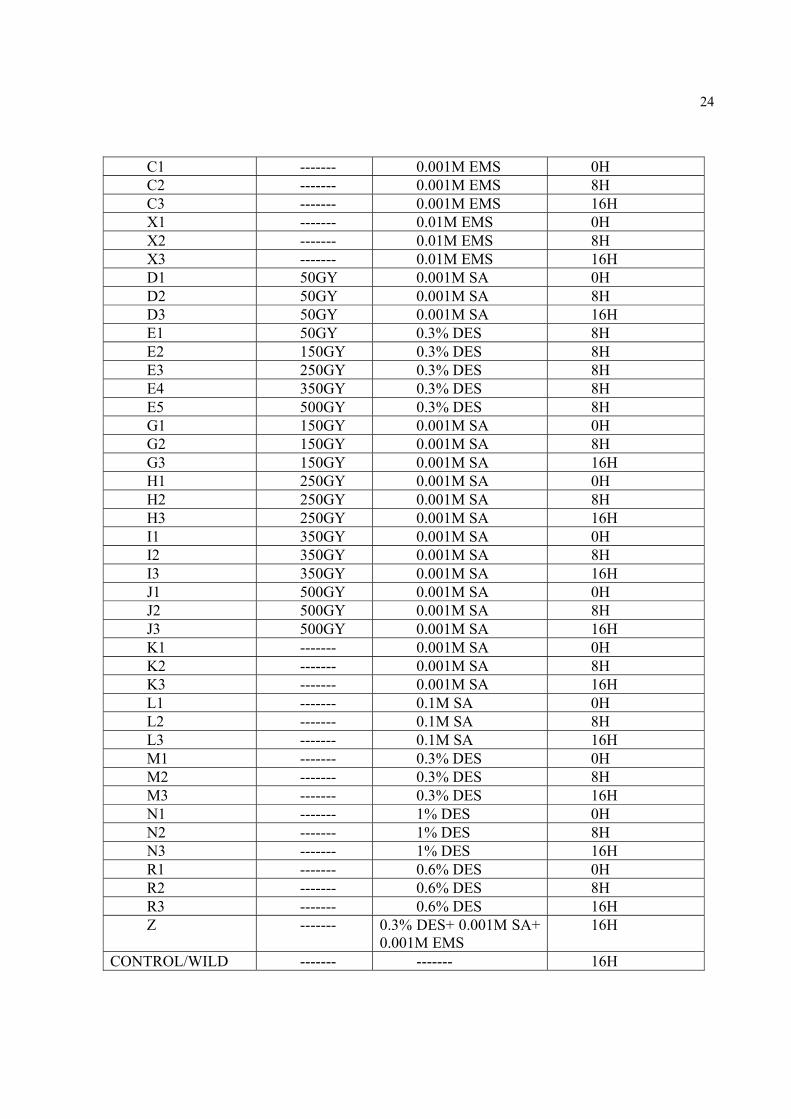
Table 2. Plant groups with mutagenic treatments and pre-soaking time.
Label (Plant Group) Radiation Dose (γ-rays)
Chemical mutagen (Conc:)
Pre-soaking time (PST, in hour, H)
A1 50GY ------- 0H A2 150GY ------- 0H A3 250GY ------- 0H A4 350GY ------- 0H A5 500GY ------- 0H B1 50GY 0.001M EMS 8H B2 150GY 0.001M EMS 8H B3 250GY 0.001M EMS 8H B4 350GY 0.001M EMS 8H B5 500GY 0.001M EMS 8H
24
C1 ------- 0.001M EMS 0H C2 ------- 0.001M EMS 8H C3 ------- 0.001M EMS 16H X1 ------- 0.01M EMS 0H X2 ------- 0.01M EMS 8H X3 ------- 0.01M EMS 16H D1 50GY 0.001M SA 0H D2 50GY 0.001M SA 8H D3 50GY 0.001M SA 16H E1 50GY 0.3% DES 8H E2 150GY 0.3% DES 8H E3 250GY 0.3% DES 8H E4 350GY 0.3% DES 8H E5 500GY 0.3% DES 8H G1 150GY 0.001M SA 0H G2 150GY 0.001M SA 8H G3 150GY 0.001M SA 16H H1 250GY 0.001M SA 0H H2 250GY 0.001M SA 8H H3 250GY 0.001M SA 16H I1 350GY 0.001M SA 0H I2 350GY 0.001M SA 8H I3 350GY 0.001M SA 16H J1 500GY 0.001M SA 0H J2 500GY 0.001M SA 8H J3 500GY 0.001M SA 16H K1 ------- 0.001M SA 0H K2 ------- 0.001M SA 8H K3 ------- 0.001M SA 16H L1 ------- 0.1M SA 0H L2 ------- 0.1M SA 8H L3 ------- 0.1M SA 16H M1 ------- 0.3% DES 0H M2 ------- 0.3% DES 8H M3 ------- 0.3% DES 16H N1 ------- 1% DES 0H N2 ------- 1% DES 8H N3 ------- 1% DES 16H R1 ------- 0.6% DES 0H R2 ------- 0.6% DES 8H R3 ------- 0.6% DES 16H Z ------- 0.3% DES+ 0.001M SA+
0.001M EMS 16H
CONTROL/WILD ------- ------- 16H

25
Seeds of each mutagenic treatment and wild plants were sown in a separately single tray with
dimensions (76.2cm×121.9cm×15.24cm), filled with composite soil (peat, sand, soil, 1:1:1) in
CEMB green house at temperature 25±2°C, and relative humidity near 50%. Metal halide
illumination lamps (400 W) were used to supplement natural radiation. Light radiation reached a
maximum of 1,500µmpl m2s-1 at the top of canopy at midday. The plants were regularly watered on
alternate day.
The following parameters were recorded for the mutagenic studies:
1. No. of germinated plants per treatment after 7 days. The germination percentage was
calculated as:
Germenation % = [No. of germinated plants / Total No. of sown seeds] ×100
2. The lethality percentage per treatment calculated as:
Lethality % = [Total No. of sown seeds- No. of survived plants / Total No. of sown seeds] ×
100
After initial growth the M1 plants were transferred to CEMB cotton field. Each flowering bud
were covered in paper envelop for self pollination to get homogenize plants in M2.
3.1.2. WAX MUTANT SELECTION
M2 seeds were sown in the same way as mentioned above. The M2 plants were screened and
initial potential candidates of wax mutants were selected on the basis of following traits, reported
for wax mutants:
1. Glossy leaves appearance, as a phenotypic genetic marker for wax mutants (Mariani
et al. 2000).

26
2. Infertility, a pleotropic marker for wax mutant in water stress condition (Koornneef
et al. 1989).
3. Curved/wrinkled leaves and flowers size were slightly smaller than wild type
(Aharoni et al. 2004).
4. Fusion of aerial parts in mutants plant (Chen at al. 2003).
5. Rapidly chlorophyll extraction in 80% ethanol (Kerstiens et al. 2006).
Further, the following analyses were done on the initial potential wax mutant candidates.
1. Gravimetric Wax analysis, extraction and quantification by immersing leaf in non-
polar solvent like hexane and comparing it to wild plant (Sturaro et al. 2005).
2. Increased stomatal indices, wax mutants possess greatly increased stomatal indices
(Holroyd et al. 2002).
The flowers of the selected initial potential wax mutant candidate plants were covered with
paper envelop for self pollination to get homogenize seeds.
M3 seeds of the selected lines were sown in the CEMB in the same pattern as mentioned
above. The final potential wax mutant candidates in M3 plants, showing the above mentioned wax
mutant’s traits were selected for further confirmation.
3.1.3. WAX MUTANT CONFIRMATION
The final potential wax mutant candidates, selected in M3 plants, were analyzed for
confirmation. The conformation was done by Scanning Electron Microscopy (SEM) and Gas-
Chromatography - Mass Spectrophotometer (GC-MS).
27
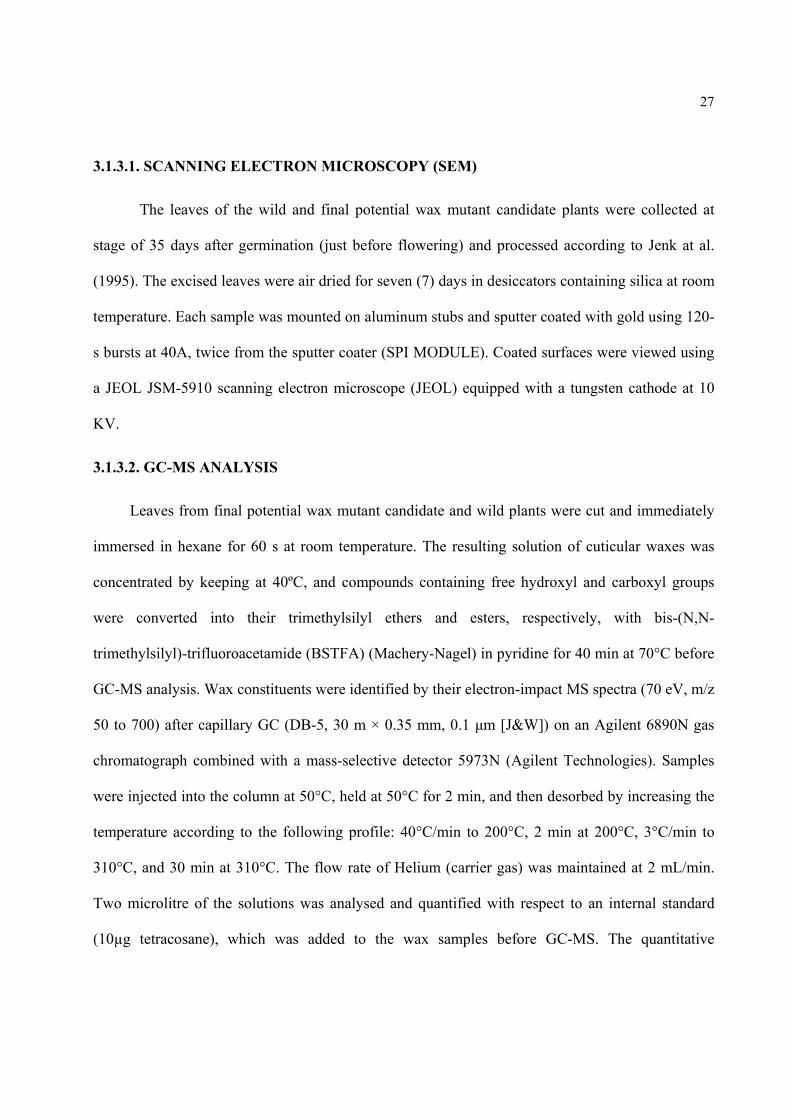
3.1.3.1. SCANNING ELECTRON MICROSCOPY (SEM)
The leaves of the wild and final potential wax mutant candidate plants were collected at
stage of 35 days after germination (just before flowering) and processed according to Jenk at al.
(1995). The excised leaves were air dried for seven (7) days in desiccators containing silica at room
temperature. Each sample was mounted on aluminum stubs and sputter coated with gold using 120-
s bursts at 40A, twice from the sputter coater (SPI MODULE). Coated surfaces were viewed using
a JEOL JSM-5910 scanning electron microscope (JEOL) equipped with a tungsten cathode at 10
KV.
3.1.3.2. GC-MS ANALYSIS
Leaves from final potential wax mutant candidate and wild plants were cut and immediately
immersed in hexane for 60 s at room temperature. The resulting solution of cuticular waxes was
concentrated by keeping at 40ºC, and compounds containing free hydroxyl and carboxyl groups
were converted into their trimethylsilyl ethers and esters, respectively, with bis-(N,N-
trimethylsilyl)-trifluoroacetamide (BSTFA) (Machery-Nagel) in pyridine for 40 min at 70°C before
GC-MS analysis. Wax constituents were identified by their electron-impact MS spectra (70 eV, m/z
50 to 700) after capillary GC (DB-5, 30 m × 0.35 mm, 0.1 μm [J&W]) on an Agilent 6890N gas
chromatograph combined with a mass-selective detector 5973N (Agilent Technologies). Samples
were injected into the column at 50°C, held at 50°C for 2 min, and then desorbed by increasing the
temperature according to the following profile: 40°C/min to 200°C, 2 min at 200°C, 3°C/min to
310°C, and 30 min at 310°C. The flow rate of Helium (carrier gas) was maintained at 2 mL/min.
Two microlitre of the solutions was analysed and quantified with respect to an internal standard
(10µg tetracosane), which was added to the wax samples before GC-MS. The quantitative
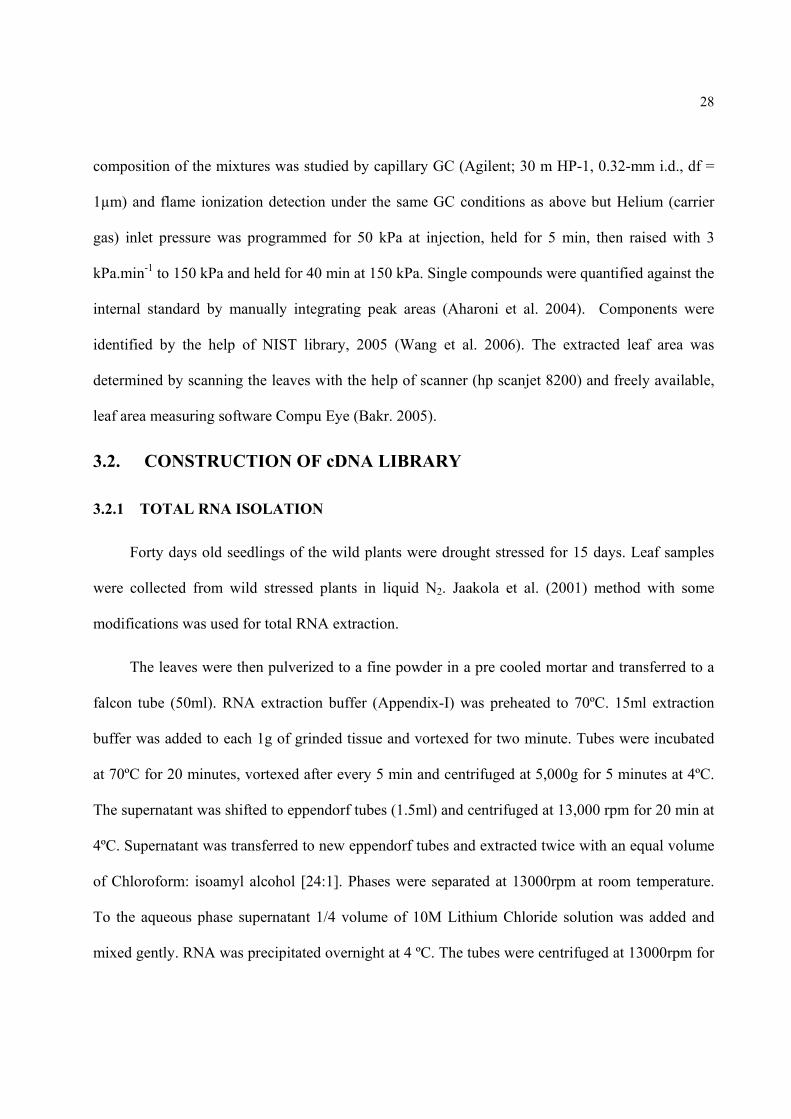
28
composition of the mixtures was studied by capillary GC (Agilent; 30 m HP-1, 0.32-mm i.d., df =
1µm) and flame ionization detection under the same GC conditions as above but Helium (carrier
gas) inlet pressure was programmed for 50 kPa at injection, held for 5 min, then raised with 3
kPa.min-1 to 150 kPa and held for 40 min at 150 kPa. Single compounds were quantified against the
internal standard by manually integrating peak areas (Aharoni et al. 2004). Components were
identified by the help of NIST library, 2005 (Wang et al. 2006). The extracted leaf area was
determined by scanning the leaves with the help of scanner (hp scanjet 8200) and freely available,
leaf area measuring software Compu Eye (Bakr. 2005).
3.2. CONSTRUCTION OF cDNA LIBRARY
3.2.1 TOTAL RNA ISOLATION
Forty days old seedlings of the wild plants were drought stressed for 15 days. Leaf samples
were collected from wild stressed plants in liquid N2. Jaakola et al. (2001) method with some
modifications was used for total RNA extraction.
The leaves were then pulverized to a fine powder in a pre cooled mortar and transferred to a
falcon tube (50ml). RNA extraction buffer (Appendix-I) was preheated to 70ºC. 15ml extraction
buffer was added to each 1g of grinded tissue and vortexed for two minute. Tubes were incubated
at 70ºC for 20 minutes, vortexed after every 5 min and centrifuged at 5,000g for 5 minutes at 4ºC.
The supernatant was shifted to eppendorf tubes (1.5ml) and centrifuged at 13,000 rpm for 20 min at
4ºC. Supernatant was transferred to new eppendorf tubes and extracted twice with an equal volume
of Chloroform: isoamyl alcohol [24:1]. Phases were separated at 13000rpm at room temperature.
To the aqueous phase supernatant 1/4 volume of 10M Lithium Chloride solution was added and
mixed gently. RNA was precipitated overnight at 4 ºC. The tubes were centrifuged at 13000rpm for
29
20 min at 4ºC. The pellet was washed with 500ul of 70% ice cold ethanol. After air drying the
pellet was dissolved in 100ul of SSTE buffer (Appendix-II). SSTE buffer was pre-warmed at 65 ºC.
Four tubes were combined in a single tube. The contents of tubes were extracted once with an
equal volume of acidic Phenol: Chloroform: isoamyl alcohol [25:24:1]. To the supernatant two
volume of ice cold absolute ethanol was added to precipitate RNA at -20 ºC overnight. The tubes
were centrifuged at 13000rpm for 20 min at 4ºC. The pellet was washed with 500ul of 70% ice cold
ethanol. The pellet was air dried and resuspended in DEPC treated deionized water.
3.2.2. AGAROSE GEL ELECTROPHORESIS
Agarose gel electrophoresis was used to check integrity of RNA. Agarose gel of 1% was
prepared in 0.5xTAE buffer (Appendix III). Ethidium bromide to a concentration of 0.5-1μg/ml
was added. Gel was run at 70-80V for 1-2 hours and visualized with the help of Gel documentation
system using program Grabit.
3.2.3. QUANTIFICATION OF TOTAL RNA
RNA conc. was measured with nanodrop, ND-1000 (NanoDrop Technologies, Inc),
spectrophotometer using the nucleic acid program. Two (2) μL DEPC treated deionized water was
taken to blank the spectrophotometer. Two (2) μL of RNA was measured and results were taken at
A260/280 and A260/230.
3.2.4. DNase TREATMENT
The DNA contamination from RNA was removed with the help of Ambion’s DNAfree™ Kit.
0.1 volume of 10X DNase 1 Buffer and 1 μl of DNase 1 (2 units) was added to the RNA and
incubated at 37°C for 30 min. 0.1 volume of DNase Inactivation Reagent was added to the sample
and incubated the tube for 2 min at room temp. The tube was flicked once more during the
30
incubation to re-disperse the DNase Inactivation Reagent. The tube was centrifuge at 10,000 x g for
~1 min to pellet the DNase Inactivation Reagent. The supernatant was taken in a new tube.
3.2.5. ISOLATION OF mRNA FROM TOTAL RNA
mRNA was isolated from total RNA using the oligotex mRNA mini kit (Qiagen). To isolate
mRNA from total RNA 0.50mg of total RNA was taken in an eppendorf tube and its volume was
made upto 500µl with RNase-free water. To completely homogenize the RNA, tube was heated for
3 min at 60°C followed by vortexing for 5 s and sharply flicking the tube. This process was
repeated twice. The tube was placed on ice and 500µl of Buffer OBB was added followed by the
addition of 30µl Oligotex Suspension kept at 37°C. Contents of the tube were thoroughly mixed by
gentle pipetting. The sample was incubated for 3 min at 70°C in a water bath to disrupt secondary
structures of RNA. After 3 min sample was removed from the water bath and placed at 30°C for 10
min to hybridize poly-A tail of the mRNA to oligo dT30 of the Oligotex particle. Oligotex-mRNA
complex was pellet down by centrifugation for 2 min at maximum speed (13,200 rpm), and the
supernatant was carefully removed by pipetting. Approximately 50 μl of the supernatant was left in
the microcentrifuge tube to avoid the loss of the Oligotex resin. Oligotex mRNA pellet was
resuspended in 400 μl Buffer OW2 by pipetting and loaded onto a small spin column placed in a
1.5 ml microcentrifuge tube. Column was centrifuged for 1 min at maximum speed. After
centrifugation the spin column was transferred to a new RNase-free 1.5 ml microcentrifuge tube
and washed with 400 μl Buffer OW2 for 1 min at maximum speed and the flow-through was
discarded. Spin column was transferred to a new RNase-free 1.5 ml microcentrifuge tube and 100
μl hot (70°C) Buffer OEB was loaded onto the column. The resin was resuspended 3 - 4 times by
pipetting and centrifuged for 1 min at maximum speed. To get maximal yield, elution with buffer
OEB was repeated once again. mRNA isolated was kept on ice, quantified with the help of
31
nanodrop, ND-1000 (NanoDrop Technologies, Inc), spectrophotometer and was used for the
construction of cDNA libraries.
3.2.6. PRECIPITATION OF mRNA:
mRNA isolated from total RNA was ethanol precipitated by adding 2.5 volume ethanol, 0.1
volume 3M sodium acetate (pH 6.0) and incubated overnight at -20oC. On the next day the tubes
were centrifuged at full speed (13,200 rpm) for 25 min at 4oC to pellet down mRNA followed by
washing with 70% ethanol for 5 min. The pellet was air dried at room temperature and resuspended
in 10 μl of RNase-free water. This mRNA was used for first strand cDNA synthesis.
3.2.7. DOUBLE STRAND cDNA CONSTRUCTION
For the construction of cDNA libraries “CloneMinerTM cDNA library Construction Kit”
(Invitrogen) was used with minor modifications. mRNA isolated in the previous step was used for
first strand cDNA synthesis as following:
mRNA + DEPC-treated water 11 μl
Biotin-attB2-Oligo(dT) Primer (30 pmol/μl) 1 μl
10 mM (each) dNTPs 1 μl
The contents were mixed gently by pipetting and centrifuged for 2 seconds to collect the
sample.
The mixture was incubated at 65°C for 5 minutes and cooled to 45°C for 2 minutes and the
following reagents were added in a fresh tube:
5X First Strand Buffer 4 μl
0.1 M DTT 2 μl
32
The contents were mixed gently by pipetting and centrifuged for 2 seconds to collect the
sample. After the priming reaction has cooled to 45°C for 2 minutes, the above mixture was added
to the priming reaction tube and, mixed gently and incubated at 45°C for 2 minutes. After 2 min
keeping the tube in thermal cycler 1 μl of SuperScript II RT (200 U/μl) was added and the whole
contents were incubated at 45°C for 60 minutes. After the completion of incubation the first strand
reaction was processed immediately for Second Strand synthesis. The tube containing first strand
cDNA was kept on ice and the following reagents were added:
DEPC-treated water 91 μl
5X Second Strand Buffer 30 μl
10 mM (each) dNTPs 3 μl
E. coli DNA Ligase (10 U/μl) 1 μl
E. coli DNA Polymerase I (10 U/μl) 4 μl
E. coli RNase H (2 U/μl) 1 μl
Total volume 150 μl
The contents were mixed gently by pipetting and centrifuged for 2 seconds to collect the
sample. The mixture was incubated at 16°C for 2 hours. After the completion incubation 2 μl of T4
DNA Polymerase was added to create blunt-ended cDNA. Contents were mixed gently by
pipetting, centrifuge for 2 seconds to collect the sample and incubated at 16°C for 5 minutes. After
5 minutes 10 μl of 0.5 M EDTA, pH 8.0 was added to stop the reaction and the reaction was
preceded to Phenol/Chloroform Extraction. 160 μl of phenol:chloroform:isoamyl alcohol (25:24:1)
was added, shake by hand thoroughly for approximately 30 seconds and centrifuged at room
temperature for 5 minutes at 14,000 rpm. Upper aqueous phase after transferring to a fresh 1.5 ml
tube was ethanol precipitated as following:
33
Glycogen (20 μg/μl) 1 μl
7.5 M NH4OAc 80 μl
100% ethanol 600 μl
The tube was inverted several times to mix the contents and incubated at -80 °C for 10
minutes. After 10 minutes the sample was centrifuged at +4°C for 25 minutes at 14,000 rpm
followed by washing with 70% ethanol for 5 minutes at 14,000 rpm. The cDNA palette was dried
in speedVac for 2 min and resuspended in 18 μl DEPC-treated water by pipetting up and down 30-
40 times. The tube was centrifuged for 2 seconds to collect the sample and place on ice to proceed
to attB1 adapter ligation.
3.2.8. LIGATING THE attB1 ADAPTER
The blunt ended double strand cDNA was kept on ice and the following reagents were added:
5X Adapter Buffer 10 μl
attB1 Adapter (1 μg/μl) 10 μl
0.1 M DTT 7 μl
T4 DNA Ligase (1 U/μl) 5 μl
Total volume 50 μl
The contents were gently mixed by pipetting and the mixture was incubated at 16°C for 24
hours.
3.2.9. cDNA SIZE SELECTION
The adapter ligated cDNA was subjected to size selection by gel electrophoresis. 1% agarose
gel was prepared in 0.5 X TAE buffer with the addition of ethidium bromide to a concentration of
0.5μg/ml. cDNA was loaded in the gel well with 1Kb ladder on both sides leaving one well empty.
Gel was run at 80 volts for 25 minutes. After running gel was visualized on UV transluminator and
34
gel slice containg cDNA ≥ 1000 bp (1kb) was excised. This excised gel slice was used to elute
cDNA from the gel.
3.2.10. GEL ELUTION
The dscDNA from the gel is eluted through Fermentas DNA Gel Extraction Kit, briefly, to 1
volume of excised gel slice 3 volumes of Binding solution were added and incubated for 5 minutes
at 55°C to dissolve agarose. Then resuspended silica powder suspension was added upto 2µl/1µg of
DNA and incubated for 5 minutes at 55°C and mixed by vortexing every 2min to keep silica
powder in suspension. After incubation silica powder/DNA complex was spin for 5 seconds to form
a pellet and supernatant was removed. The pellet was washed three times with 500 µl of ice cold
wash buffer. During each washing the pellet was resuspended completely. After the last washing
the pellet was air-dried for 10-15 min.
To elute DNA into water the pellet was resuspended in 20µl of sterile deionized water and
incubated the tube at 55°C for 5 minutes. After Spinning the tube supernatant was taken into a new
tube avoiding the pellet. The elution was repeated with another 20 µl of water. For the removal of
small amounts of the silica powder the tube was spin again for 30 sec at max. speed and the
supernatant was shifted into a new tube. The eluted cDNA was quantified using nanodrop, ND-
1000 (NanoDrop Technologies, Inc), and was used for BP recombinant reaction.
3.2.11. PERFORMING THE BP RECOMBINATION REACTION
For the BP recombination reaction 100 ng size selected cDNA was used in the following
reaction:
attB1-flanked cDNA + TE Buffer pH 8.0 7 μl pDONR 222 (250 ng/μl) 1 μl 5X BP Clonase Reaction Buffer 2 μl
35
BP Clonase enzyme mix was removed from -80°C, thawed on ice and vortexed briefly. 3μl of
BP Clonase enzyme was added to reaction mix and the mix was incubated at 25oC for 20 hours.
After the completion of incubation 2 μl of proteinase K was added to reaction mix to inactivate BP
Clonase and the reaction mix was incubated at 37oC for 15 minutes followed by 75oC for 10
minutes. To the tube added the following reagents:
Sterile water 90 μl
Glycogen (20 μg/μl) 1 μl
7.5 M NH4OAc 50 μl
100% ethanol 375 μl
The tube was inverted several times to mix the contents and incubated at -80 °C for 10
minutes. After 10 minutes the sample was centrifuged at +4°C for 25 minutes at 14,000 rpm
followed by washing with 70% ethanol for 5 minutes at 14,000 rpm. The cDNA palette was dried
in Vacuum concentrator for 2 min and resuspended in 9 μl TE buffer (Appendix III). Six aliquots of
the resuspended cDNA were made in six new 1.5 ml eppendorf tubes by adding 1.5 μl cDNA in
each tube and then 50 μl thawed ElectroMAX DH10B competent cells were added to each tube.
The contents were mixed gently by pipetting up and down two times keeping the care that no air
bubble gets introduced in the tubes. The entire contents of the tube were transferred to a cold
cuvette (0.1 cm). Distributed the contents evenly by gently tapping each side of the cuvette and
electroporated the samples under following conditions:
Voltage 2.0 kV
Resistance 200 Ω
Capacity 25 μF
36
Added 1 ml of S.O.C. medium to the cuvette containing electroporated cells and transfer the
entire solution to a 15 ml snap-cap tube with the help of a pipette. The same procedure of
electroporation was repeated to all the six aliquots. The electroporated cells were shaked for 1 hour
at 37°C at 225-250 rpm to allow expression of the kanamycin resistance marker. After the one hour
incubation at 37°C, all cells were pooled into a 15 ml snap-cap tube and an equal volume of sterile
freezing media (60% S.O.C. medium:40% glycerol) was added to it. Aliquots containing 200 μl of
the cDNA library were made and these aliquots were stored at -80°C. Five (5) and fifteen (15) μl
volume from cDNA library was speared on LB plates containing 50μg/ml Kanamycin. The plates
were incubated at 37ºC for overnight. The colonies on each plate were counted after overnight
incubation at 37ºC. The cfu/ml for the cDNA library was calculated according to the following
equation:
cfu/ml = colonies on plate × dilution factor
volume plated (ml)
Total cfu = average titer (cfu/ml) x total volume of cDNA library (ml)
3.3. PREPARATION OF cDNA MICROARRAY PLATFORM
3.3.1. CLONE PICKING AND CULTURING
For the picking of clones, aliquote of cDNA library containg ~1000-1500 clones was spread
on LB Agar plates (245 x 245 x 18 mm). Indivdual clones were picked and used to culture in 96
well culture plates containing LB-Kanamycin Broth. The plates after sealing were incubated over-
night at 37oC in an incubator shaker at 200 rpm.
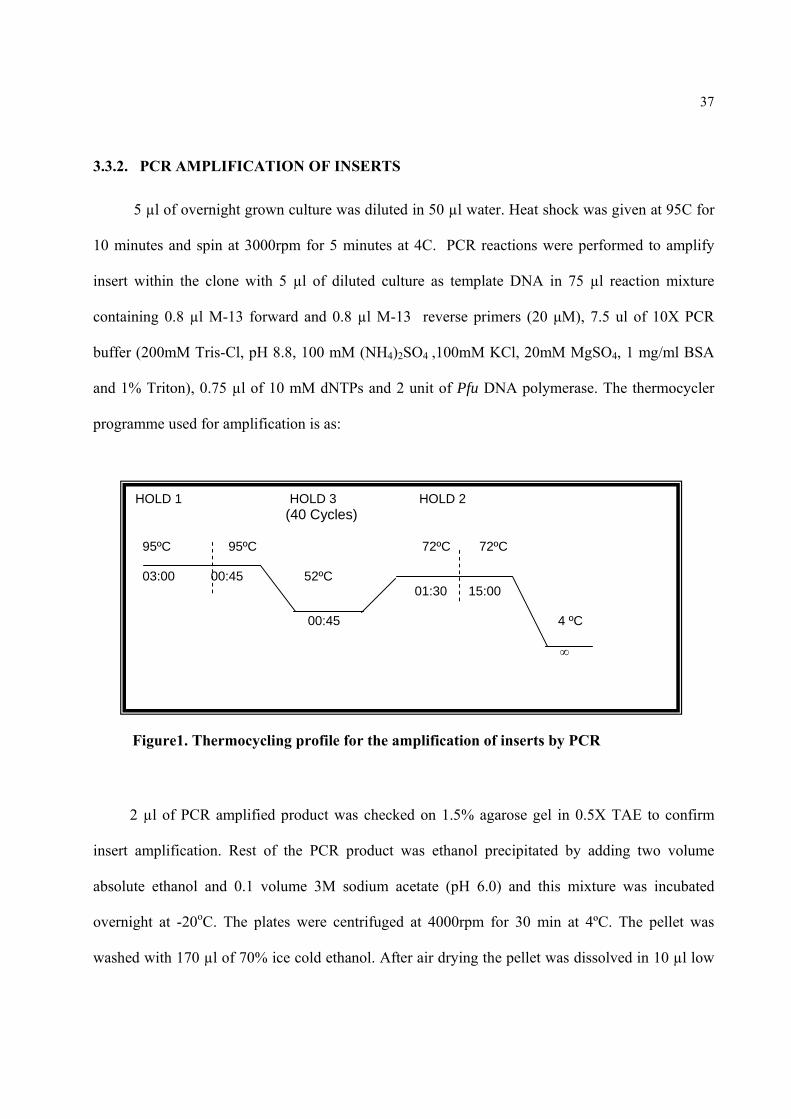
37
3.3.2. PCR AMPLIFICATION OF INSERTS
5 µl of overnight grown culture was diluted in 50 µl water. Heat shock was given at 95C for
10 minutes and spin at 3000rpm for 5 minutes at 4C. PCR reactions were performed to amplify
insert within the clone with 5 µl of diluted culture as template DNA in 75 µl reaction mixture
containing 0.8 µl M-13 forward and 0.8 µl M-13 reverse primers (20 μM), 7.5 ul of 10X PCR
buffer (200mM Tris-Cl, pH 8.8, 100 mM (NH4)2SO4 ,100mM KCl, 20mM MgSO4, 1 mg/ml BSA
and 1% Triton), 0.75 µl of 10 mM dNTPs and 2 unit of Pfu DNA polymerase. The thermocycler
programme used for amplification is as:
2 µl of PCR amplified product was checked on 1.5% agarose gel in 0.5X TAE to confirm
insert amplification. Rest of the PCR product was ethanol precipitated by adding two volume
absolute ethanol and 0.1 volume 3M sodium acetate (pH 6.0) and this mixture was incubated
overnight at -20oC. The plates were centrifuged at 4000rpm for 30 min at 4ºC. The pellet was
washed with 170 µl of 70% ice cold ethanol. After air drying the pellet was dissolved in 10 µl low
HOLD 1 HOLD 3 HOLD 2 (40 Cycles) 95ºC 95ºC 72ºC 72ºC 03:00 00:45 52ºC
01:30 15:00 00:45 4 ºC
∞
Figure1. Thermocycling profile for the amplification of inserts by PCR
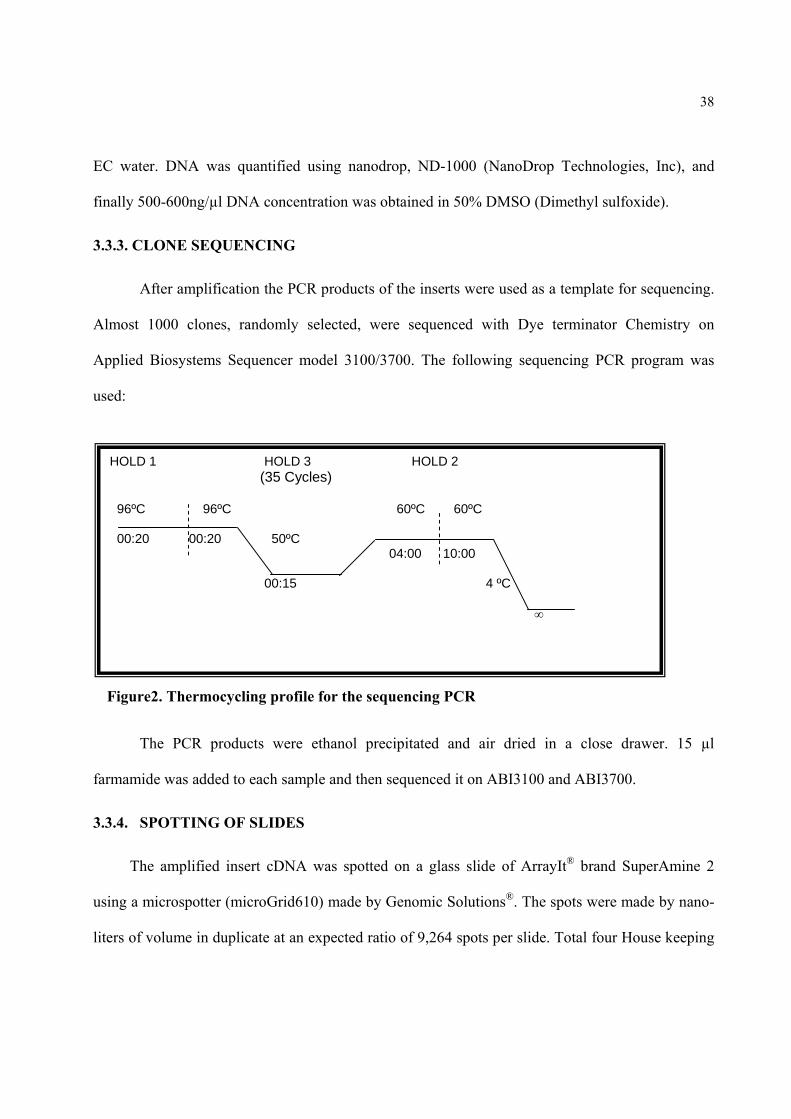
38
EC water. DNA was quantified using nanodrop, ND-1000 (NanoDrop Technologies, Inc), and
finally 500-600ng/µl DNA concentration was obtained in 50% DMSO (Dimethyl sulfoxide).
3.3.3. CLONE SEQUENCING
After amplification the PCR products of the inserts were used as a template for sequencing.
Almost 1000 clones, randomly selected, were sequenced with Dye terminator Chemistry on
Applied Biosystems Sequencer model 3100/3700. The following sequencing PCR program was
used:
The PCR products were ethanol precipitated and air dried in a close drawer. 15 µl
farmamide was added to each sample and then sequenced it on ABI3100 and ABI3700.
3.3.4. SPOTTING OF SLIDES
The amplified insert cDNA was spotted on a glass slide of ArrayIt® brand SuperAmine 2
using a microspotter (microGrid610) made by Genomic Solutions®. The spots were made by nano-
liters of volume in duplicate at an expected ratio of 9,264 spots per slide. Total four House keeping
HOLD 1 HOLD 3 HOLD 2 (35 Cycles) 96ºC 96ºC 60ºC 60ºC 00:20 00:20 50ºC
04:00 10:00 00:15 4 ºC
∞
Figure2. Thermocycling profile for the sequencing PCR
39
genes, founded in library, homologe to His3 (GE653512); His4 (GE653669), Actin (GE653433)
and GAPDH (GE653450) were used as internal controls for the normalization of data. The clones
were printed in a format of 14×14 sub-grids, leaving four (4) blank spots per sub-grid for
background correction. Total 12×4 sub-grids were printed per slide with the help of solid pins
(Genomic Solutions®). The slide printing conditions were 20±2oC and 45±2% humidity. The slides
were dried and stored for future use. The Platform has been deposited in NCBI's Gene Expression
Omnibus (Edgar et al. 2002) and are accessible through GEO Platform accession number
GPL8266.
3.4. HYBRIDIZATION OF TARGET WITH cDNA MICROARRAY PLATFORM
3.4.1. TARGET PREPARATION
3.4.1.1. AMINOALLYL LABELING
For the aminoallyl labeling of cDNA, 45 μg of total RNA, DNA free, was taken from wild
and wax mutant plant, and 2 μg of OligodT18 primer was added to it and final volume was made up
to 18.0 μL with RNase-free water. The contents were mixed well and incubated at 70oC for 10
minutes. After incubation the mixture was placed on ice for 30 seconds, centrifuged and following
contents were added:
5X First Strand buffer 6.0 μL 0.1 M DTT 3.0 μL 50X aminoallyl-dNTP mix 0.5 μL SuperScript III RT (200U/μL) 2.0 μL RNAse inhibitor 0.5 μL
The contents were mixed well, centrifuged briefly and incubated at 42oC for 3 hours. Then to
hydrolyze RNA, 2U of RNAse H were added, mixed and incubated at 37oC for 15 minutes and to
the mix 25μL of 1M Tris (pH 6.8) was added to nutrilize pH.
40
3.4.1.2 REMOVAL OF UNINCORPORATED aa-dUTP AND FREE AMINES
cDNA synthesized was mixed with 300 μL (5X reaction volume) buffer PB (Qiagen
supplied) and transferred to QIAquick column placed in a 2ml collection tube (Qiagen supplied),
centrifuged at 13,000 rpm for 1 minute and flow through was discarded. 750μL phosphate wash
buffer was added to the column, centrifuged at 13,000 rpm for 1 minute, flow through was
discarded and repeated the wash step. Column was placed in new collection tube and centrifuged
for 1 minute at maximum speed. Column was transferred to a new 1.5 mL microfuge tube, 30 μL
phosphate elution buffers was applied to the center of the column membrane and incubate for 1
minute at room temperature. cDNA was eluted by centrifugation at 13,000 rpm for 1 minute.
Second elution was done in the same way and sample was dried in a speed vac.
3.4.1.3. COUPLING aa-cDNA TO CYANINE DYE ESTER
Single foil pack of dye cyanine (Cy) 3/cyanine (Cy) 5 (Amersham- PA23001) was re-
suspended in 40µl DMSO. Dry cDNA was dissolved in 5µl 0.1M sodium carbonate (pH 9.0) and 5
µl Cy3/Cy5 dye was added to sample and mixed. The reaction was incubated for 1 hour in the dark
at room temperature.
3.4.1.4 REMOVAL OF UNCOUPLED DYE
Dye coupled cDNA was mixed with 250 μL (5X reaction volume) buffer PB (Qiagen
supplied) and transferred to QIAquick column placed in a 2ml collection tube (Qiagen supplied),
centrifuged at 13,000 rpm for 1 minute and flow through was discarded. 750μL phosphate wash
buffer was added to the column, centrifuged at 13,000 rpm for 1 minute, flow through was
discarded and repeated the wash step. Column was placed in new collection tube and centrifuged
for 1 minute at maximum speed. Column was transferred to a new 1.5 mL microfuge tube, 40 μL
41
elution buffer (EB) was applied to the center of the column membrane and incubate for 1 minute at
room temperature. cDNA was eluted by centrifugation at 13,000 rpm for 1 minute. Second elution
was done in the same way. The concentration and the dye incorporation of labeled cDNA were
measured by Nano Drop (NanoDrop Technologies, Inc), using program “Microarrays”.
3.4.2 HYBRIDIZATION
3.4.2.1. PRE-HYBRIDIZATION
Spotted slide was rehydrated by array facing down on water at 40oC. The slide was cross
linked in a Stratagene® UV linker twice at 1600 µJ x 100. Slide was placed in pre-heated prehyb
(Appendix VI) buffer in 42oC water bath and incubated for 45 min with occasional shaking. Slide
was washed in millipore water for two times, once in isopropanol and then spin dried by keeping
slide in 50 ml tube with kimwipe stuffed in the bottom in a swing bucket rotor at 2000 rpm for
1min.
3.4.2.2. HYBRIDIZATION
Equal concentrations of Cy3 and Cy5 probes (300 pmole each) in terms of dye pmoles were
taken and mixed in the 2X hybridization buffer (Appendix VII). The target was heated to 95oC for
three minutes and then immediately put on ice. Slide was placed in chamber of hybstation
(Genomic Solutions®) with array side up. Target was injected to slide in chamber at 65oC and then
slide was incubated at 42oC for 24 hours.
3.4.2.3. SLIDE WASHING
Slide was removed from hybstation and washed in solution containing 1X SSC, 0.2% SDS at
42oC for 2 min with agitation. Then, slide was shifted to second wash solution containing 0.1X
42
SSC, 0.2% SDS at room temperature and incubated for 2 min with agitation. After 2 min slide was
moved to third wash solution containing 0.1X SSC and kept for 2 min with agitation. Slide was
spin dried immediately by keeping slide in 50 ml tube with kimwipe stuffed in the bottom in a
swing bucket rotor at 2000rpm for 1min and preceded for slide scan.
3.5. SLIDE SCANNING
Slides were scanned in Cy3 and Cy5 channels with the help of scanner UC 4X4 (Genomic
solution®). The 16-bit tiff images of Cy3 and Cy5 channels were saved.
3.5.1 IMAGES PROCESSING AND RAW DATA GENERATION
The 16-bit scanned tiff images of Cy3 and Cy5 were initially analysed with the help of
TIGER SPOTFINDER software available freely on line from the TM4 website (Saeed et al. 2003).
Poor-quality spots (sum of median <500) were filtered from the raw data before analysis.
Background was subtracted and the signal ratio between Cy3 and Cy5 was calculated. The
initial/raw data were saved as mev file.
3.6. DATA NORMALIZATION AND ANALYSIS
3.6.1. DATA NORMALIZATION
The data normalization and analysis was done by the help of freely available software
Microarray Data Analysis Software (MIDAS) and Microarray Experiment Viewer (MEV) from the
TM4 website (Saeed et al. 2003). Data normalization methods proceed from the assumption that
only a relatively small proportion of the genes change significantly in expression level between the
two hybridized mRNA samples. The house keeping genes were used for the normalization of spot
signal intensities within the slide. The signal intensity was calculated as the mean intensities of the
43
two replicates minus the background signal. The MIDAS component of TM4 provides a number of
data normalization methods and filters and supports applying them in a pipelined fashion.
3.6.2. THE MIDAS PROJECT
A MIDAS project was applied consisting of total intensity normalization, lowess
normalization, standard deviation regularization, and low intensity filtering to microarray data.
MIDAS default parameters were used throughout, the default low intensity filter cut-off is RiGi <
10,000/1000.
3.6.3. TM4 MEV ANALYSIS
The Multi Experiment Viewer (MEV) component of TM4 provides a number of statistical
analyses and clustering algorithms to identify differentially expressed genes. We report results from
the one-class t-test analysis applied to output of the MIDAS pipeline. This test assumes that the
paired distribution of treated and control groups is normally distributed. Since the intensities
measured from the same spot are correlated, we can apply the one-class t-test for the two-group
comparison. The spot showing signal intensities ≥/≤ 1.5-fold were considered differentially
expressed transcripts with p ≤ 0.05 was defined as the threshold for significant differential
expression.
3.7. SEQUENCING OF DIFFERENTIALLY EXPRESSED TRANSCRIPTS
After microarray analyses, the plasmids containing the differentially expressed transcripts,
were isolated and sequenced with dye terminator chemistry on Applied Biosystems Sequencer
model 3100/3700 as mention above.
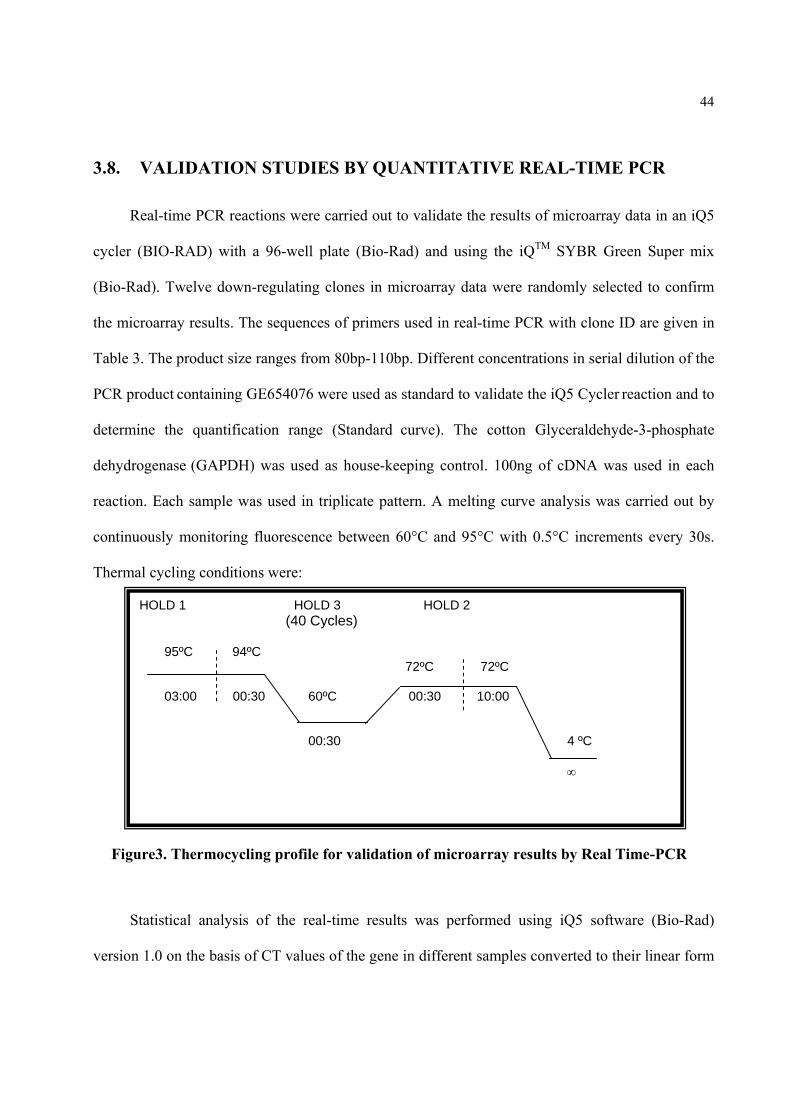
44
3.8. VALIDATION STUDIES BY QUANTITATIVE REAL-TIME PCR
Real-time PCR reactions were carried out to validate the results of microarray data in an iQ5
cycler (BIO-RAD) with a 96-well plate (Bio-Rad) and using the iQTM SYBR Green Super mix
(Bio-Rad). Twelve down-regulating clones in microarray data were randomly selected to confirm
the microarray results. The sequences of primers used in real-time PCR with clone ID are given in
Table 3. The product size ranges from 80bp-110bp. Different concentrations in serial dilution of the
PCR product containing GE654076 were used as standard to validate the iQ5 Cycler reaction and to
determine the quantification range (Standard curve). The cotton Glyceraldehyde-3-phosphate
dehydrogenase (GAPDH) was used as house-keeping control. 100ng of cDNA was used in each
reaction. Each sample was used in triplicate pattern. A melting curve analysis was carried out by
continuously monitoring fluorescence between 60°C and 95°C with 0.5°C increments every 30s.
Thermal cycling conditions were:
Statistical analysis of the real-time results was performed using iQ5 software (Bio-Rad)
version 1.0 on the basis of CT values of the gene in different samples converted to their linear form
HOLD 1 HOLD 3 HOLD 2 (40 Cycles)
95ºC 94ºC 72ºC 72ºC 03:00 00:30 60ºC 00:30 10:00 00:30 4 ºC
∞
Figure3. Thermocycling profile for validation of microarray results by Real Time-PCR
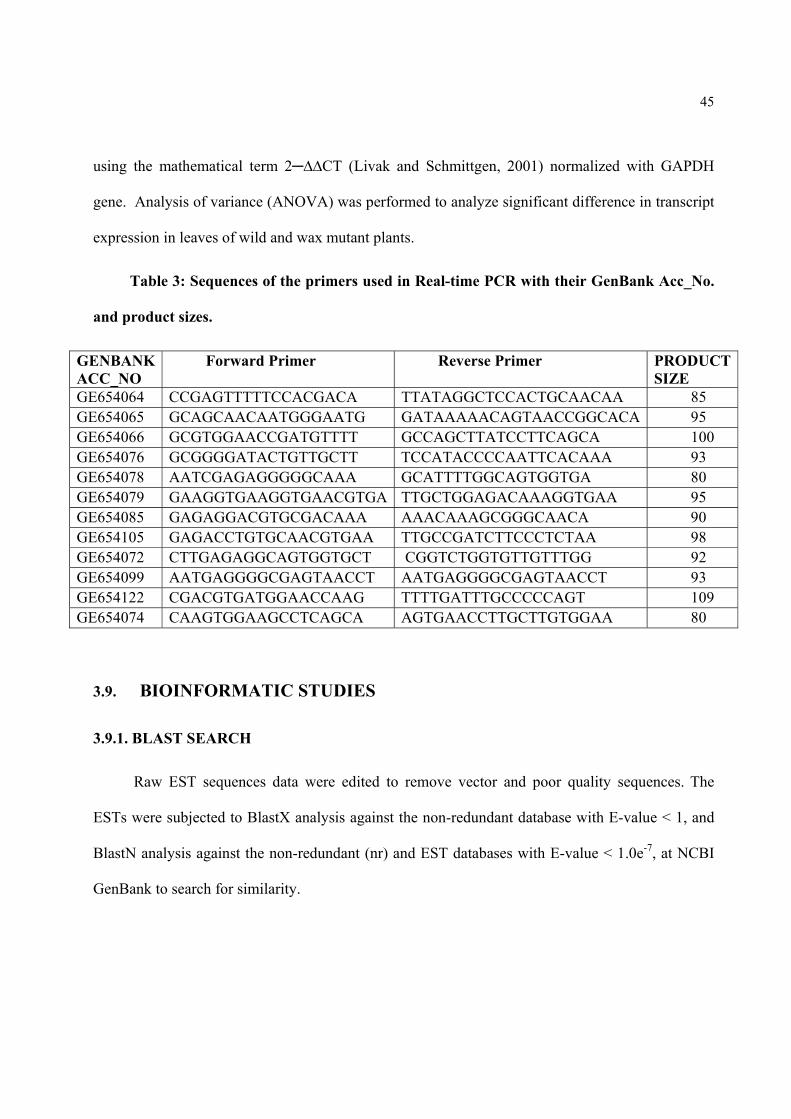
45
using the mathematical term 2∆∆CT (Livak and Schmittgen, 2001) normalized with GAPDH
gene. Analysis of variance (ANOVA) was performed to analyze significant difference in transcript
expression in leaves of wild and wax mutant plants.
Table 3: Sequences of the primers used in Real-time PCR with their GenBank Acc_No.
and product sizes.
GENBANK ACC_NO
Forward Primer Reverse Primer PRODUCT SIZE
GE654064 CCGAGTTTTTCCACGACA TTATAGGCTCCACTGCAACAA 85 GE654065 GCAGCAACAATGGGAATG GATAAAAACAGTAACCGGCACA 95 GE654066 GCGTGGAACCGATGTTTT GCCAGCTTATCCTTCAGCA 100 GE654076 GCGGGGATACTGTTGCTT TCCATACCCCAATTCACAAA 93 GE654078 AATCGAGAGGGGGCAAA GCATTTTGGCAGTGGTGA 80 GE654079 GAAGGTGAAGGTGAACGTGA TTGCTGGAGACAAAGGTGAA 95 GE654085 GAGAGGACGTGCGACAAA AAACAAAGCGGGCAACA 90 GE654105 GAGACCTGTGCAACGTGAA TTGCCGATCTTCCCTCTAA 98 GE654072 CTTGAGAGGCAGTGGTGCT CGGTCTGGTGTTGTTTGG 92 GE654099 AATGAGGGGCGAGTAACCT AATGAGGGGCGAGTAACCT 93 GE654122 CGACGTGATGGAACCAAG TTTTGATTTGCCCCCAGT 109 GE654074 CAAGTGGAAGCCTCAGCA AGTGAACCTTGCTTGTGGAA 80
3.9. BIOINFORMATIC STUDIES
3.9.1. BLAST SEARCH
Raw EST sequences data were edited to remove vector and poor quality sequences. The
ESTs were subjected to BlastX analysis against the non-redundant database with E-value < 1, and
BlastN analysis against the non-redundant (nr) and EST databases with E-value < 1.0e-7, at NCBI
GenBank to search for similarity.
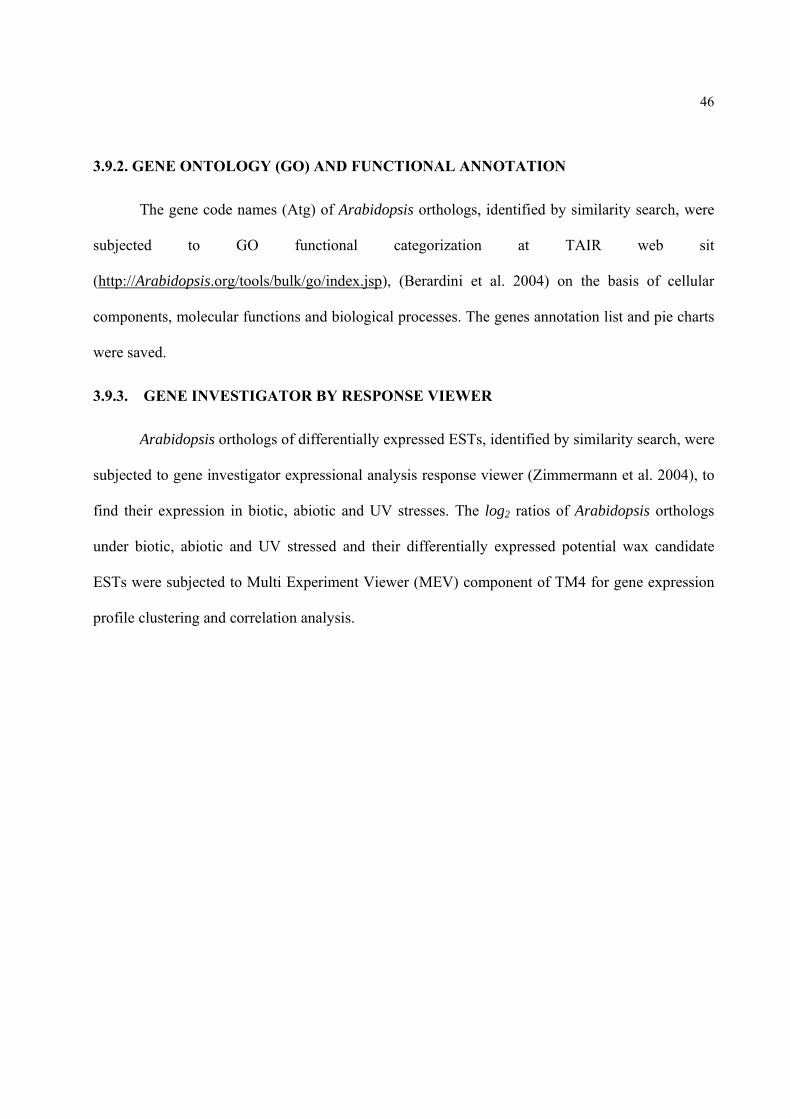
46
3.9.2. GENE ONTOLOGY (GO) AND FUNCTIONAL ANNOTATION
The gene code names (Atg) of Arabidopsis orthologs, identified by similarity search, were
subjected to GO functional categorization at TAIR web sit
(http://Arabidopsis.org/tools/bulk/go/index.jsp), (Berardini et al. 2004) on the basis of cellular
components, molecular functions and biological processes. The genes annotation list and pie charts
were saved.
3.9.3. GENE INVESTIGATOR BY RESPONSE VIEWER
Arabidopsis orthologs of differentially expressed ESTs, identified by similarity search, were
subjected to gene investigator expressional analysis response viewer (Zimmermann et al. 2004), to
find their expression in biotic, abiotic and UV stresses. The log2 ratios of Arabidopsis orthologs
under biotic, abiotic and UV stressed and their differentially expressed potential wax candidate
ESTs were subjected to Multi Experiment Viewer (MEV) component of TM4 for gene expression
profile clustering and correlation analysis.

CHAPTER: 4
RESULTS
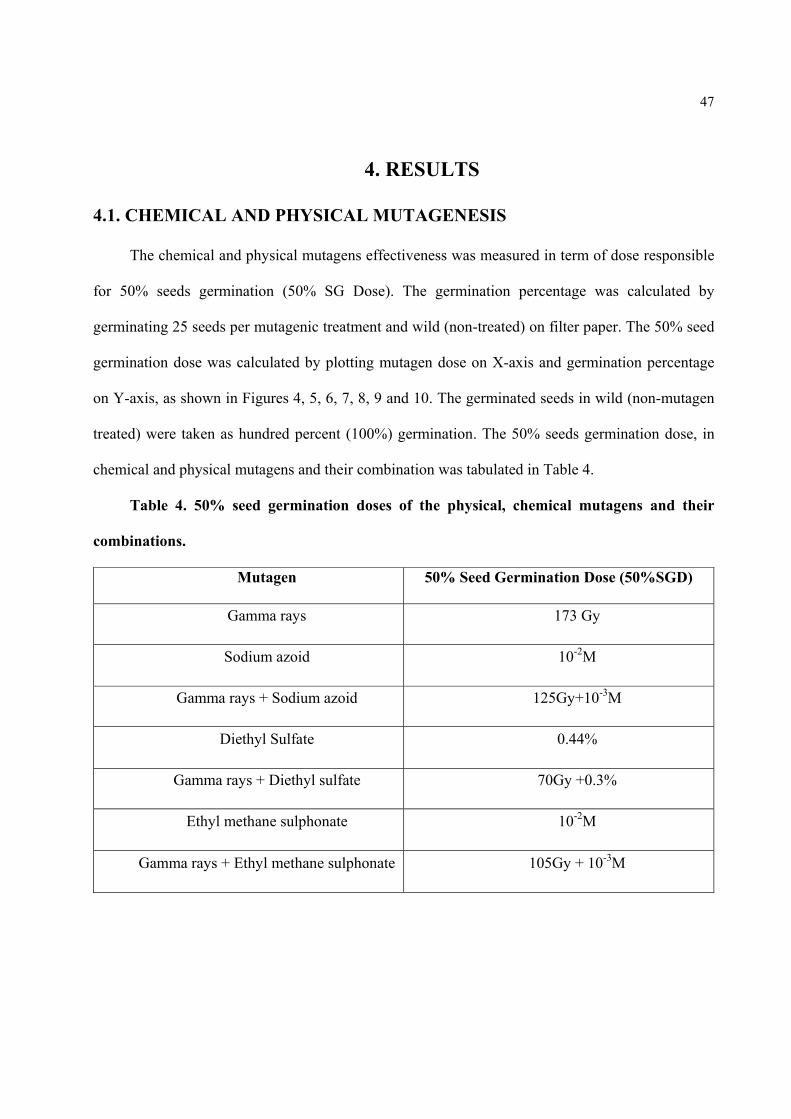
47
4. RESULTS
4.1. CHEMICAL AND PHYSICAL MUTAGENESIS
The chemical and physical mutagens effectiveness was measured in term of dose responsible
for 50% seeds germination (50% SG Dose). The germination percentage was calculated by
germinating 25 seeds per mutagenic treatment and wild (non-treated) on filter paper. The 50% seed
germination dose was calculated by plotting mutagen dose on X-axis and germination percentage
on Y-axis, as shown in Figures 4, 5, 6, 7, 8, 9 and 10. The germinated seeds in wild (non-mutagen
treated) were taken as hundred percent (100%) germination. The 50% seeds germination dose, in
chemical and physical mutagens and their combination was tabulated in Table 4.
Table 4. 50% seed germination doses of the physical, chemical mutagens and their
combinations.
Mutagen 50% Seed Germination Dose (50%SGD)
Gamma rays 173 Gy
Sodium azoid 10-2M
Gamma rays + Sodium azoid 125Gy+10-3M
Diethyl Sulfate 0.44%
Gamma rays + Diethyl sulfate 70Gy +0.3%
Ethyl methane sulphonate 10-2M
Gamma rays + Ethyl methane sulphonate 105Gy + 10-3M
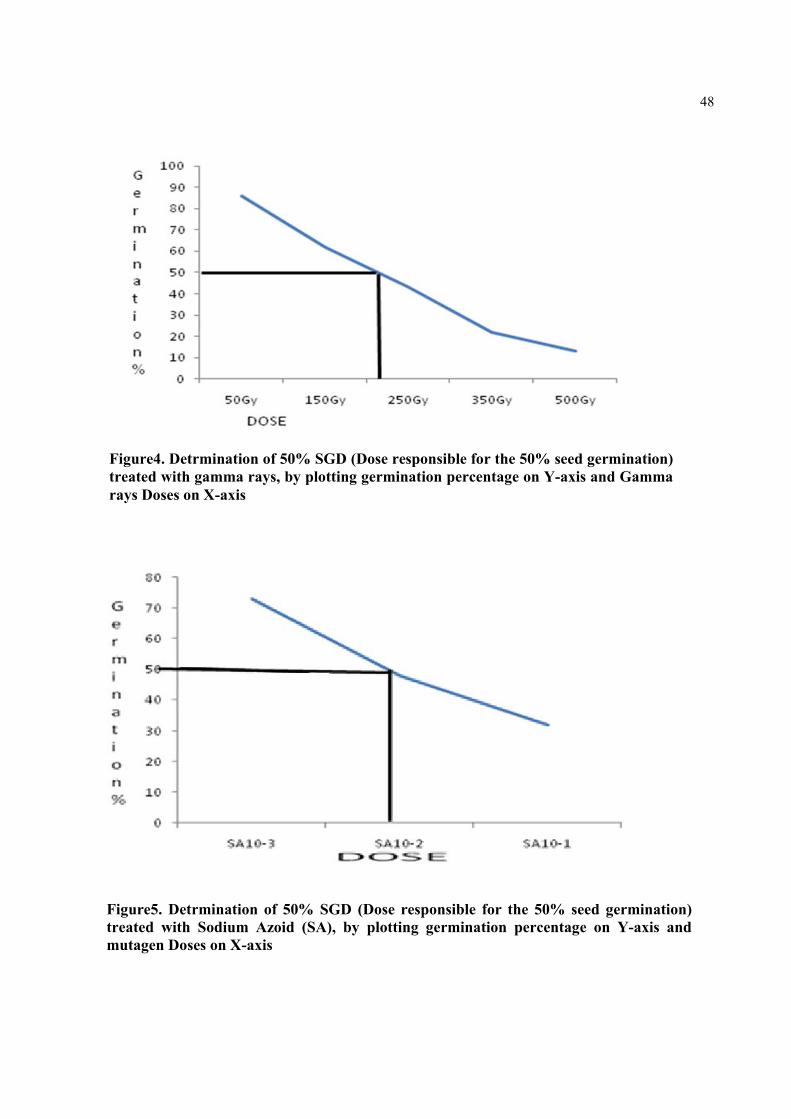
48
Figure4. Detrmination of 50% SGD (Dose responsible for the 50% seed germination) treated with gamma rays, by plotting germination percentage on Y-axis and Gamma rays Doses on X-axis
50%SGD=173Gy
Figure5. Detrmination of 50% SGD (Dose responsible for the 50% seed germination) treated with Sodium Azoid (SA), by plotting germination percentage on Y-axis and mutagen Doses on X-axis
50%SGD=10-2M
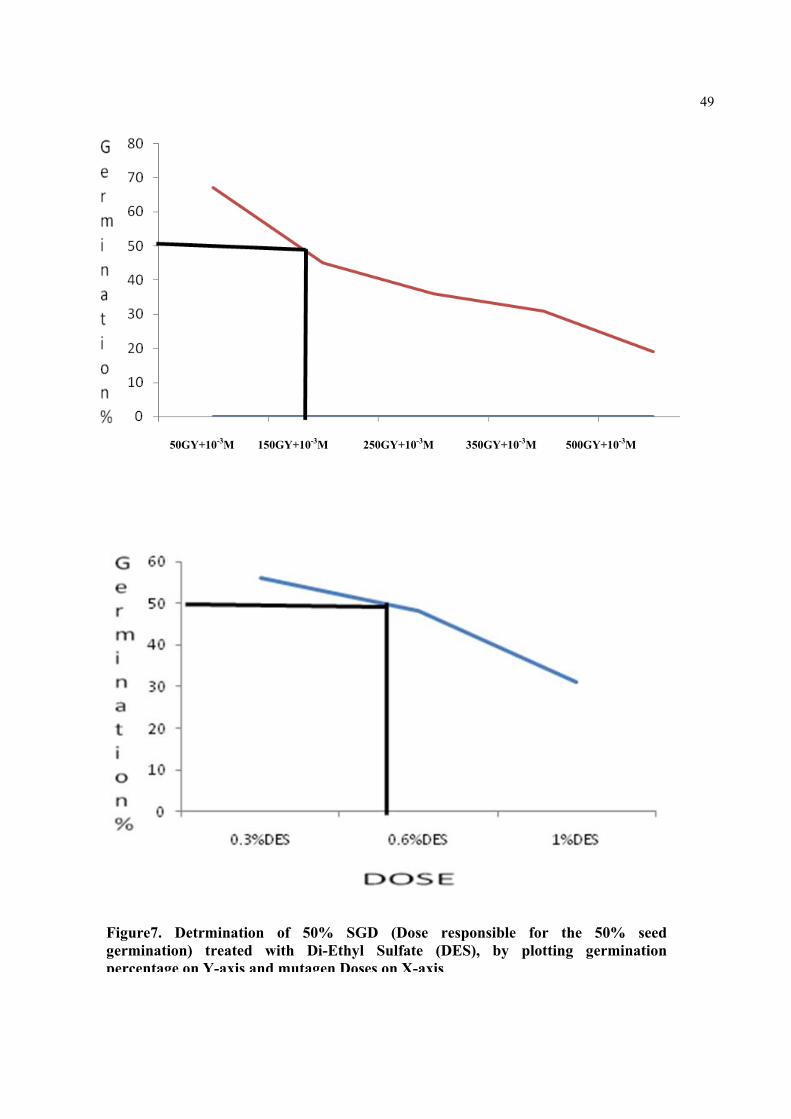
49
Figure6. Detrmination of 50% SGD (Dose responsible for the 50% seed germination) treated with Gamma rays +Sodium Azoid (SA), by plotting germination percentage on Y-axis and mutagen Doses on X-axis
50GY+10-3M 150GY+10-3M 250GY+10-3M 350GY+10-3M 500GY+10-3M
50%SGD=125Gy+10-3M
Figure7. Detrmination of 50% SGD (Dose responsible for the 50% seed germination) treated with Di-Ethyl Sulfate (DES), by plotting germination percentage on Y-axis and mutagen Doses on X-axis
50%SGD=0.44%DES
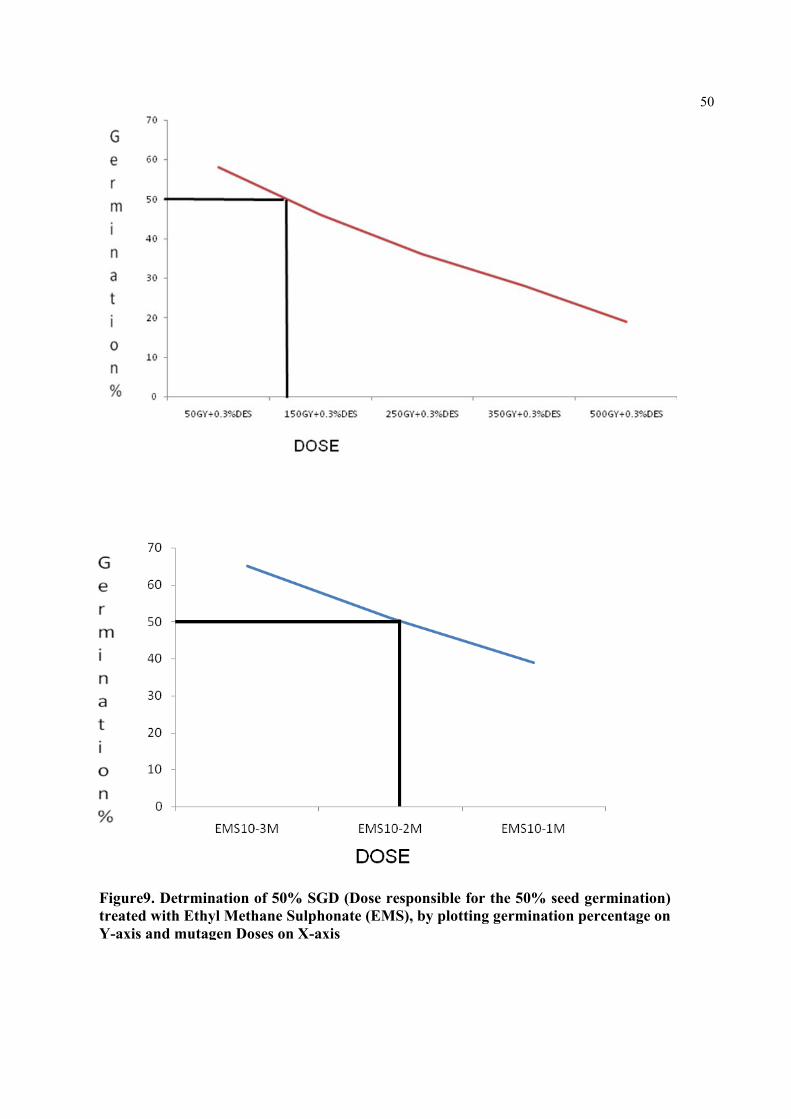
50
Figure8. Detrmination of 50% SGD (Dose responsible for the 50% seed germination) treated with Gamma rays+Di-Ethyl Sulfate (DES), by plotting germination percentage on Y-axis and mutagen Doses on X-axis
50%SGD=70Gy+0.3%
Figure9. Detrmination of 50% SGD (Dose responsible for the 50% seed germination) treated with Ethyl Methane Sulphonate (EMS), by plotting germination percentage on Y-axis and mutagen Doses on X-axis
50%SGD=10-2M

51
Figure10. Detrmination of 50% SGD (Dose responsible for the 50% seed germination) treated with Gamma rays + Ethyl Methane Sulphonate (EMS), by plotting germination percentage on Y-axis and mutagen Doses on X-axis
50%SGD=105Gy+10-3M
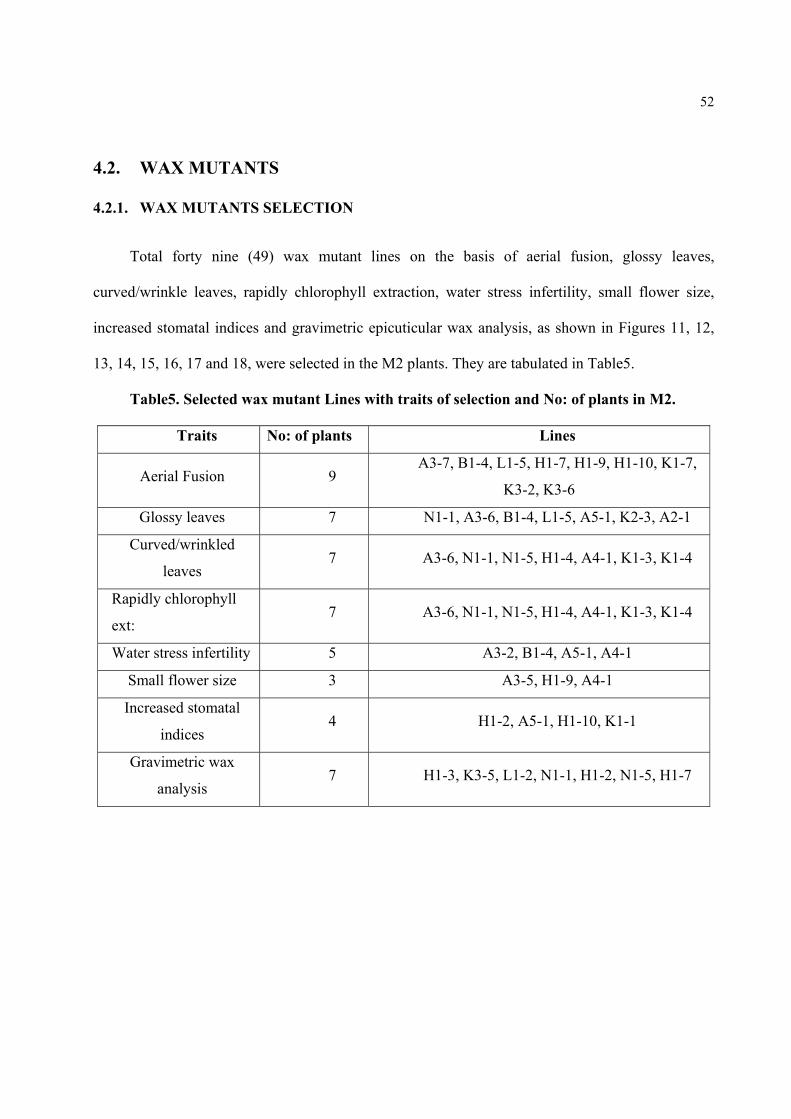
52
4.2. WAX MUTANTS
4.2.1. WAX MUTANTS SELECTION
Total forty nine (49) wax mutant lines on the basis of aerial fusion, glossy leaves,
curved/wrinkle leaves, rapidly chlorophyll extraction, water stress infertility, small flower size,
increased stomatal indices and gravimetric epicuticular wax analysis, as shown in Figures 11, 12,
13, 14, 15, 16, 17 and 18, were selected in the M2 plants. They are tabulated in Table5.
Table5. Selected wax mutant Lines with traits of selection and No: of plants in M2.
Traits No: of plants Lines
Aerial Fusion 9 A3-7, B1-4, L1-5, H1-7, H1-9, H1-10, K1-7,
K3-2, K3-6
Glossy leaves 7 N1-1, A3-6, B1-4, L1-5, A5-1, K2-3, A2-1
Curved/wrinkled
leaves 7 A3-6, N1-1, N1-5, H1-4, A4-1, K1-3, K1-4
Rapidly chlorophyll
ext: 7 A3-6, N1-1, N1-5, H1-4, A4-1, K1-3, K1-4
Water stress infertility 5 A3-2, B1-4, A5-1, A4-1
Small flower size 3 A3-5, H1-9, A4-1
Increased stomatal
indices 4 H1-2, A5-1, H1-10, K1-1
Gravimetric wax
analysis 7 H1-3, K3-5, L1-2, N1-1, H1-2, N1-5, H1-7
B
FigWilmu
Fepa
gure11. Wald plant, sh
utant's trait
Figure12. Wextraction iplant, wax appearance
ax mutant howing nont.
Wax mutanin 80% Ethmutant sh
e.
selection i
n-glossy lea
nt selectionhanol for 1owed rapid
in M2 geneaves. (B) M
n in M2 gen1 h from led chloroph
eration on M2 mutant p
neration oneaves. (A) Whyll leachin
the basis plant with
n the basisWild plantng in 80%
of glossy lglossy leav
s of rapid ct and (B) MEthanol b
leaves (A) ves; a wax
chlorophylM2 mutantby greenish
53
l t h
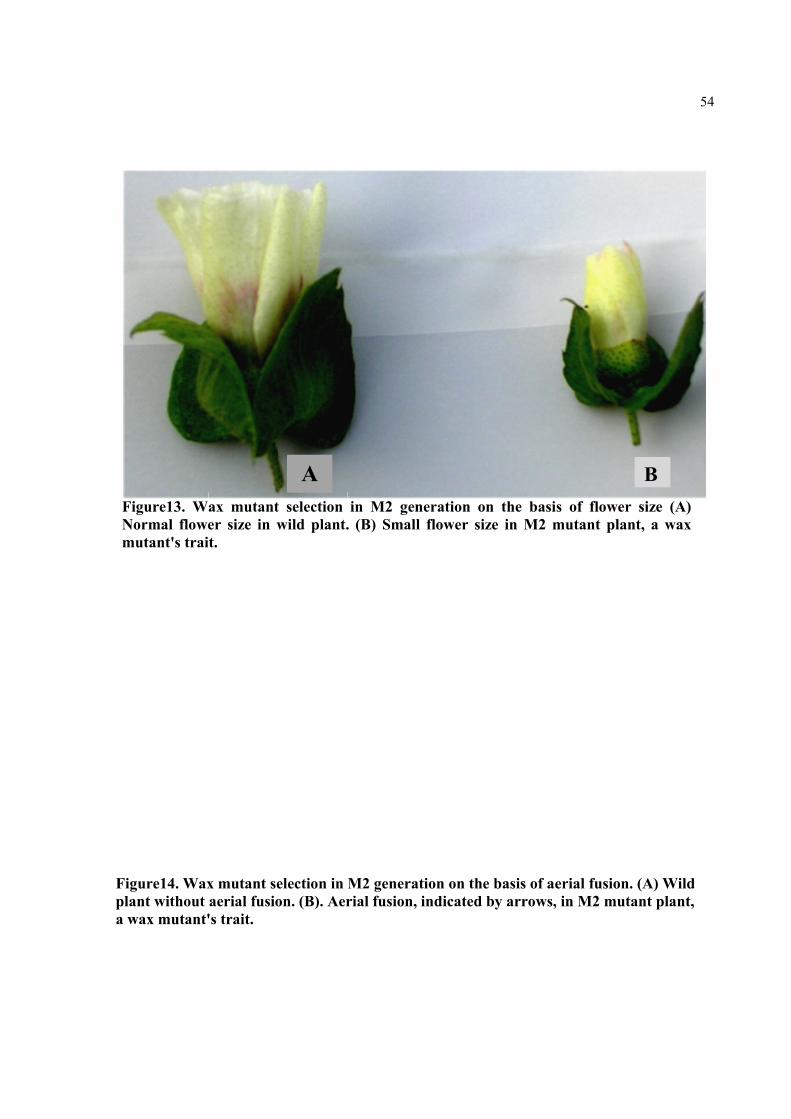
Figuplana w
FigNomu
ure14. Waxnt without ax mutant'
gure13. Wormal floweutant's trai
x mutant seaerial fusio's trait.
ax mutanter size in wt.
election in on. (B). Aer
A t selection wild plant.
A
M2 generarial fusion,
in M2 gen. (B) Small
ation on theindicated b
neration onl flower siz
e basis of aeby arrows,
n the basize in M2 m
erial fusion in M2 mut
s of flowermutant pla
n. (A) Wild tant plant,
Br size (A)
ant, a wax
B
54
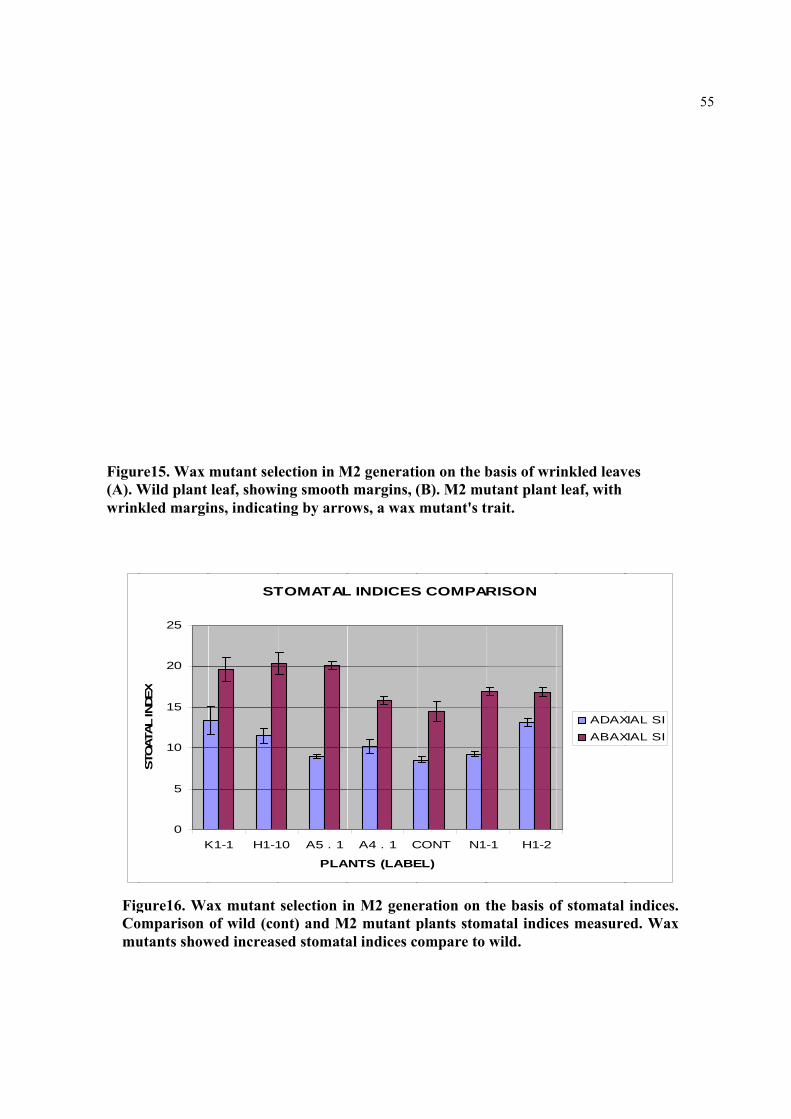
Figur(A). Wwrink
FigComu
re15. Wax Wild plant kled margi
gure16. Waomparison utants show
0
5
10
15
20
25
K
STO
ATAL
INDE
X
mutant selleaf, showi
ins, indicati
ax mutant of wild (co
wed increas
ST
K1-1 H1-1
ection in Ming smoothing by arro
selection inont) and Msed stomata
TOMATAL
10 A5 . 1
PLA
M2 generatih margins, (ows, a wax
n M2 geneM2 mutant p
al indices c
L INDICES
A4 . 1 C
ANTS (LABE
ion on the b(B). M2 mumutant's t
eration on tplants stomompare to
S COMPAR
CONT N1
EL)
basis of wriutant plantrait.
the basis omatal indic
wild.
ARISON
-1 H1-2
inkled leavt leaf, with
of stomatal es measure
ADAXABAX
ves
indices. ed. Wax
XIAL SIXIAL SI
55
Figana(co
gure17. Waalysis. Gr
ont) and M2
ax mutant savimetric 2 mutant p
selection inanalysis anlants. Wax
n M2 genernd comparx mutants h
ration on thrison in ephave less wa
he basis oficuticular ax load com
f wax Gravwax load
mpared to w
imetric of wild wild.
56

57
4.2.2. WAX MUTANTS CONFIRMATION
The initial potential wax mutant plants in M2 were covered with paper envelope to get more
homogenize seeds in M3. Almost 3000 seeds of M3 were sown and screened for wax mutant's
traits. Eighteen (18) plants in M3 have shown wax mutant traits. Triplicate of All eighteen (18),
final wax candidates were analyzed by scanning electron microscopy (SEM) and Gas
chromatography-mass spectrophotometer (GC-MS) for confirmation as wax mutants.
Three (3) out of eighteen (18) plants in M3 were confirmed as wax deficient mutants by
SEM and GC-MS.
4.2.2.1. EPICUTICULAR WAX MORPHOLOGY
No studies of desi cotton (G. arboreum) leaf epicuticular wax have been reported. For this
reason, a hexane treated (epicuticular wax removed), leaf (adaxial) was visualized by SEM as
reference, (Figure18), to better understand the desi cotton (G. arboreum) leaf epicuticular wax
deposition pattern and morphology. In wild plant the leaf epicuticular wax appear as smooth stripy
layers, (Figure 19). The absence of these stripy layers in hexane treated leaf, confirmed them as an
epicuticular wax. In fact it is less stripy than layers. The wild leaf epicuticular wax stripy layers are
sharp and shiny under SEM.
In all the three wax mutants, these sharp, shiny and stripy layers are absent and modified in a
new morphological pattern. The first cotton (G. arboreum) wax mutant, designated as GaWM1,
(Gossypium arboreum Wax Mutant 1) shows epicuticular wax morphological pattern as embedded
dull thick fibers (Figure 20). These embedded dull thick fibers are much less in density than the
wild stripy layers.
The second cotton (G. arboreum) wax mutant, designated as GaWM2, (Gossypium
arboreum Wax Mutant 2) shows epicuticular wax morphology as irregular dispersed patches
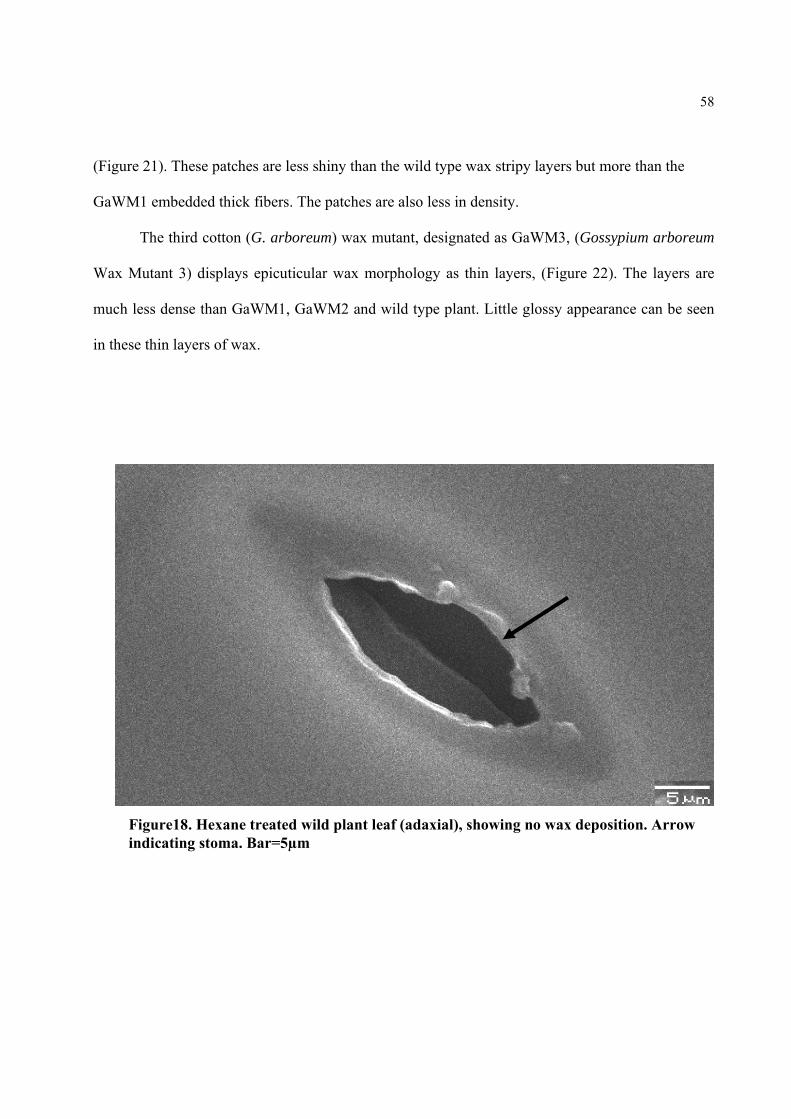
(Figure
GaWM
Wax M
much le
in these
Fiin
21). These
M1 embedded
The third c
Mutant 3) di
ess dense th
e thin layers
igure18. Hendicating st
patches are
d thick fibe
cotton (G. a
isplays epic
han GaWM
s of wax.
exane treattoma. Bar=
e less shiny
rs. The patc
rboreum) w
cuticular wa
1, GaWM2
ted wild pla=5µm
than the wi
ches are also
wax mutant,
ax morphol
2 and wild t
ant leaf (ad
ild type wax
o less in den
, designated
ogy as thin
type plant. L
daxial), sho
x stripy laye
nsity.
d as GaWM
n layers, (Fi
Little glossy
owing no w
ers but more
M3, (Gossyp
igure 22). T
y appearanc
ax depositi
e than the
ium arbore
The layers
ce can be se
ion. Arrow
58
um
are
een

Figur5µm
Figuin w
re19. Wild
ure20. Cottwax deposit
plant (ada
ton (G. arbotion (dull th
xial) leaf sh
oreum) waxhick embed
howing wax
x mutant 1dded fiber l
x stripy lay
1 (GaWM1)like, indica
yers (indica
) leaf (adaxated by arro
ated by arr
xial) showinows). Bar=
rows). Bar=
ng alteratio5µm
59
=
on
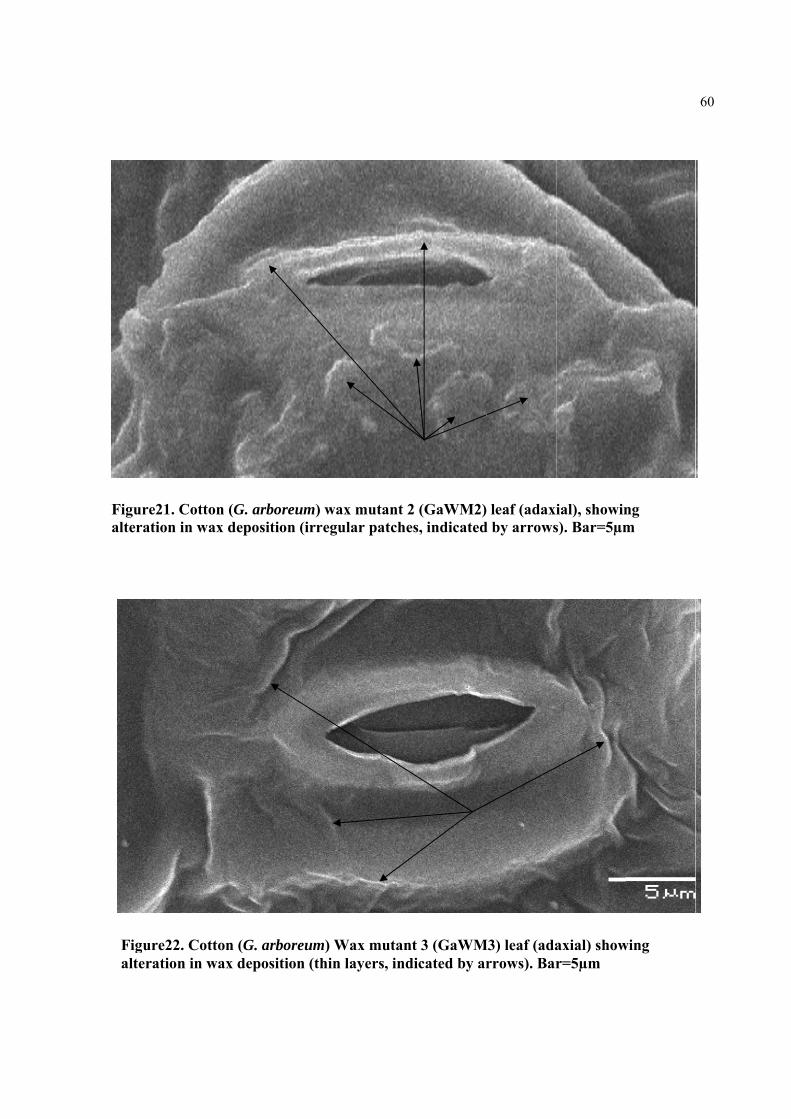
Figalte
Figualter
gure22. Coteration in w
ure21. Cottoration in wa
tton (G. arbwax deposi
on (G. arboax depositi
boreum) Wition (thin l
oreum) waxion (irregul
Wax mutantlayers, indi
x mutant 2lar patches
3 (GaWMicated by ar
(GaWM2)s, indicated
M3) leaf (adarrows). Bar
leaf (adaxid by arrows
axial) showr=5µm
ial), showins). Bar=5µm
wing
ng m
60
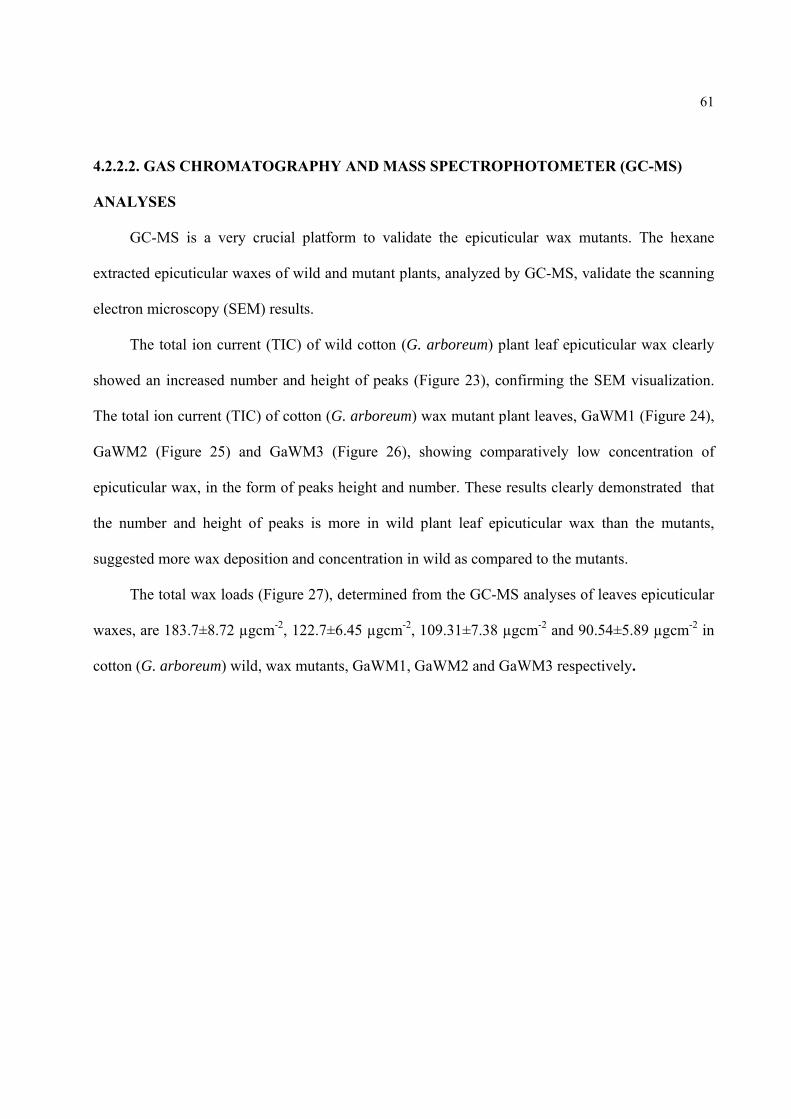
61
4.2.2.2. GAS CHROMATOGRAPHY AND MASS SPECTROPHOTOMETER (GC-MS)
ANALYSES
GC-MS is a very crucial platform to validate the epicuticular wax mutants. The hexane
extracted epicuticular waxes of wild and mutant plants, analyzed by GC-MS, validate the scanning
electron microscopy (SEM) results.
The total ion current (TIC) of wild cotton (G. arboreum) plant leaf epicuticular wax clearly
showed an increased number and height of peaks (Figure 23), confirming the SEM visualization.
The total ion current (TIC) of cotton (G. arboreum) wax mutant plant leaves, GaWM1 (Figure 24),
GaWM2 (Figure 25) and GaWM3 (Figure 26), showing comparatively low concentration of
epicuticular wax, in the form of peaks height and number. These results clearly demonstrated that
the number and height of peaks is more in wild plant leaf epicuticular wax than the mutants,
suggested more wax deposition and concentration in wild as compared to the mutants.
The total wax loads (Figure 27), determined from the GC-MS analyses of leaves epicuticular
waxes, are 183.7±8.72 µgcm-2, 122.7±6.45 µgcm-2, 109.31±7.38 µgcm-2 and 90.54±5.89 µgcm-2 in
cotton (G. arboreum) wild, wax mutants, GaWM1, GaWM2 and GaWM3 respectively.
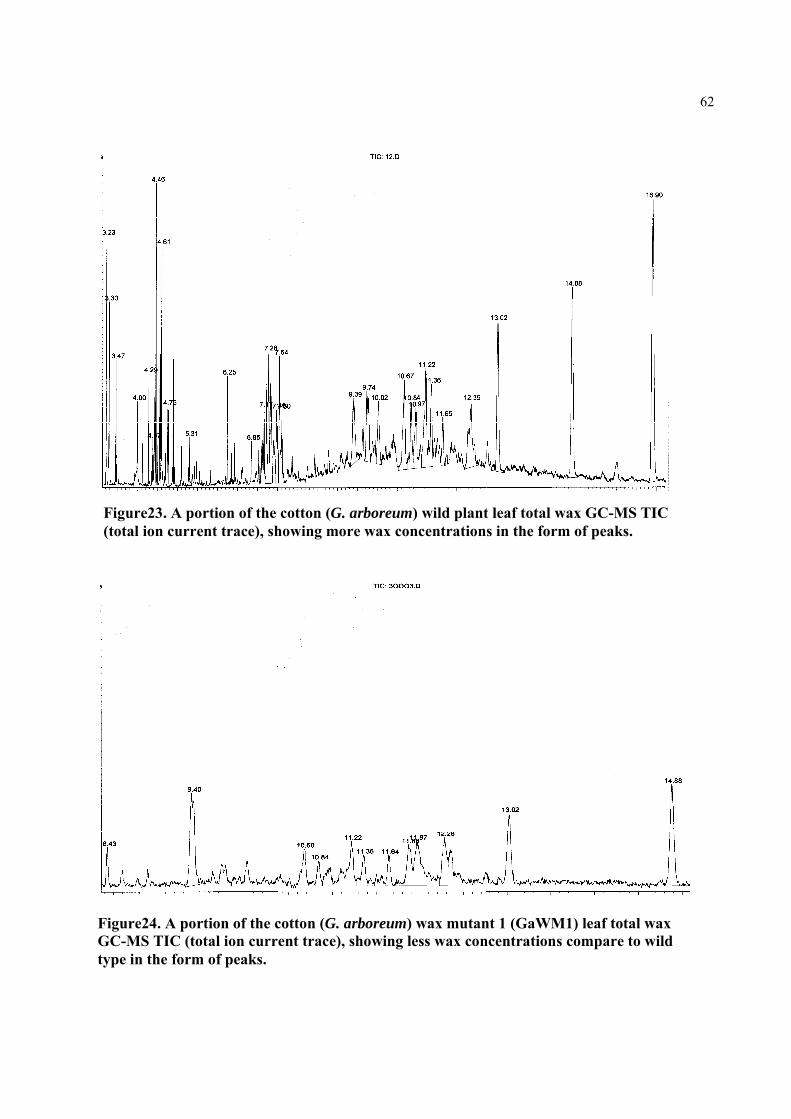
FigureGC-Mtype in
Figur(total
e24. A portiMS TIC (tota
n the form o
re23. A porion curren
ion of the cal ion currof peaks.
rtion of the nt trace), sh
cotton (G. aent trace),
cotton (G. howing mor
arboreum) wshowing le
arboreum)re wax con
wax mutaness wax con
wild plantncentration
nt 1 (GaWMncentration
t leaf total ws in the for
M1) leaf tots compare
wax GC-Mrm of peaks
tal wax to wild
MS TIC s.
62
FigurGC-Mwild t
FigureGC-Mtype in
re25. A porMS TIC (totype in the
e26. A portMS TIC (tot
n the form
rtion of the otal ion cur
form of pe
tion of the ctal ion currof peaks.
cotton (G. rent trace)
eaks.
cotton (G. arent trace),
arboreum), showing l
arboreum) wshowing le
) wax mutaless wax co
wax mutaness wax con
ant 2 (GaWncentration
nt 3 (GaWMncentration
WM2) leaf tons as comp
M3) leaf totns compare
otal wax pare to
tal wax to wild
63
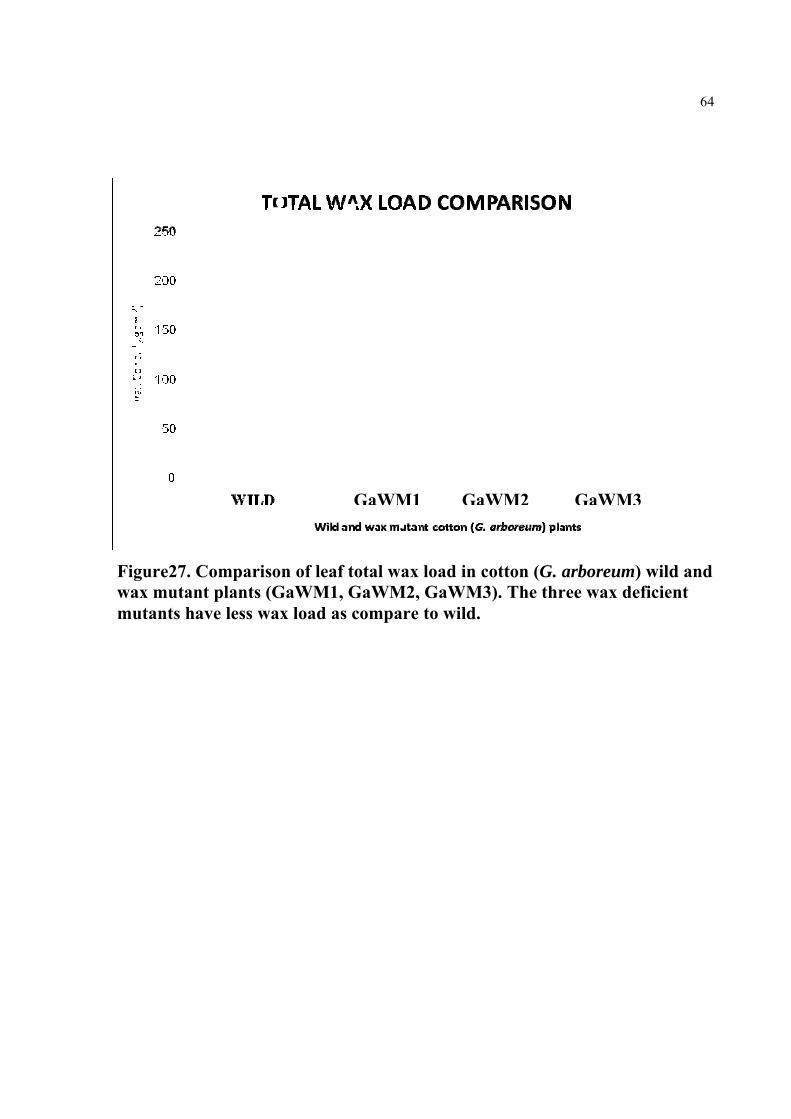
Figwamu
gure27. Cx mutant
utants hav
omparisot plants (Gve less wa
on of leaf GaWM1, ax load as
total waxGaWM2,compare
GaWM1
x load in c, GaWM3
e to wild.
1 GaW
cotton (G.3). The th
WM2
arboreumhree wax d
GaWM
m) wild andeficient
M3
64
nd
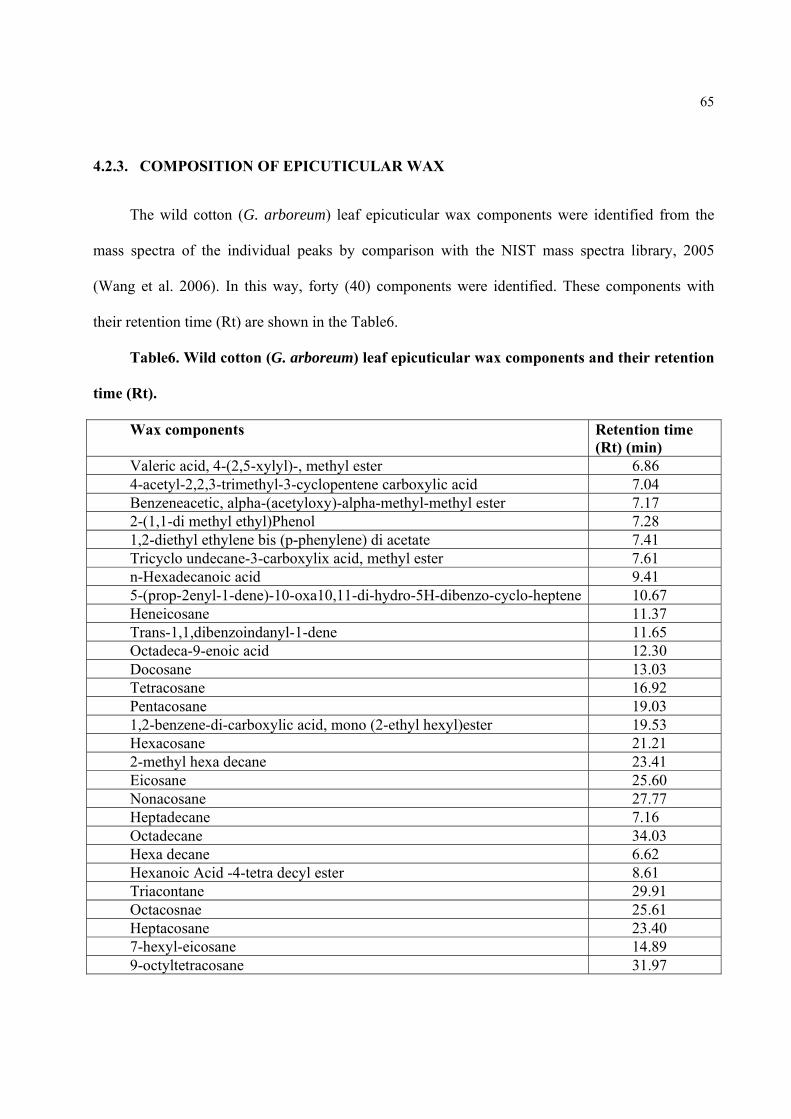
65
4.2.3. COMPOSITION OF EPICUTICULAR WAX
The wild cotton (G. arboreum) leaf epicuticular wax components were identified from the
mass spectra of the individual peaks by comparison with the NIST mass spectra library, 2005
(Wang et al. 2006). In this way, forty (40) components were identified. These components with
their retention time (Rt) are shown in the Table6.
Table6. Wild cotton (G. arboreum) leaf epicuticular wax components and their retention
time (Rt).
Wax components Retention time (Rt) (min)
Valeric acid, 4-(2,5-xylyl)-, methyl ester 6.86 4-acetyl-2,2,3-trimethyl-3-cyclopentene carboxylic acid 7.04 Benzeneacetic, alpha-(acetyloxy)-alpha-methyl-methyl ester 7.17 2-(1,1-di methyl ethyl)Phenol 7.28 1,2-diethyl ethylene bis (p-phenylene) di acetate 7.41 Tricyclo undecane-3-carboxylix acid, methyl ester 7.61 n-Hexadecanoic acid 9.41 5-(prop-2enyl-1-dene)-10-oxa10,11-di-hydro-5H-dibenzo-cyclo-heptene 10.67 Heneicosane 11.37 Trans-1,1,dibenzoindanyl-1-dene 11.65 Octadeca-9-enoic acid 12.30 Docosane 13.03 Tetracosane 16.92 Pentacosane 19.03 1,2-benzene-di-carboxylic acid, mono (2-ethyl hexyl)ester 19.53 Hexacosane 21.21 2-methyl hexa decane 23.41 Eicosane 25.60 Nonacosane 27.77 Heptadecane 7.16 Octadecane 34.03Hexa decane 6.62 Hexanoic Acid -4-tetra decyl ester 8.61 Triacontane 29.91 Octacosnae 25.61 Heptacosane 23.40 7-hexyl-eicosane 14.89 9-octyltetracosane 31.97
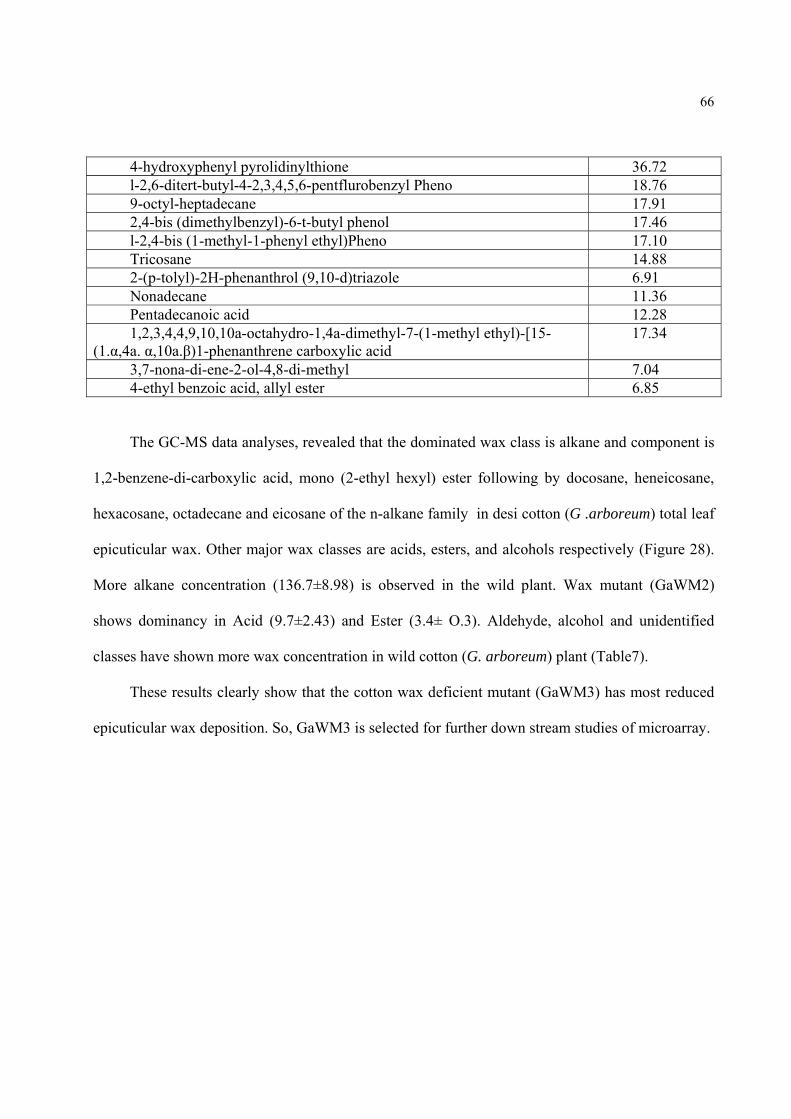
66
4-hydroxyphenyl pyrolidinylthione 36.72 l-2,6-ditert-butyl-4-2,3,4,5,6-pentflurobenzyl Pheno 18.76 9-octyl-heptadecane 17.91 2,4-bis (dimethylbenzyl)-6-t-butyl phenol 17.46 l-2,4-bis (1-methyl-1-phenyl ethyl)Pheno 17.10 Tricosane 14.88 2-(p-tolyl)-2H-phenanthrol (9,10-d)triazole 6.91 Nonadecane 11.36 Pentadecanoic acid 12.28 1,2,3,4,4,9,10,10a-octahydro-1,4a-dimethyl-7-(1-methyl ethyl)-[15-
(1.α,4a. α,10a.β)1-phenanthrene carboxylic acid 17.34
3,7-nona-di-ene-2-ol-4,8-di-methyl 7.04 4-ethyl benzoic acid, allyl ester 6.85
The GC-MS data analyses, revealed that the dominated wax class is alkane and component is
1,2-benzene-di-carboxylic acid, mono (2-ethyl hexyl) ester following by docosane, heneicosane,
hexacosane, octadecane and eicosane of the n-alkane family in desi cotton (G .arboreum) total leaf
epicuticular wax. Other major wax classes are acids, esters, and alcohols respectively (Figure 28).
More alkane concentration (136.7±8.98) is observed in the wild plant. Wax mutant (GaWM2)
shows dominancy in Acid (9.7±2.43) and Ester (3.4± O.3). Aldehyde, alcohol and unidentified
classes have shown more wax concentration in wild cotton (G. arboreum) plant (Table7).
These results clearly show that the cotton wax deficient mutant (GaWM3) has most reduced
epicuticular wax deposition. So, GaWM3 is selected for further down stream studies of microarray.
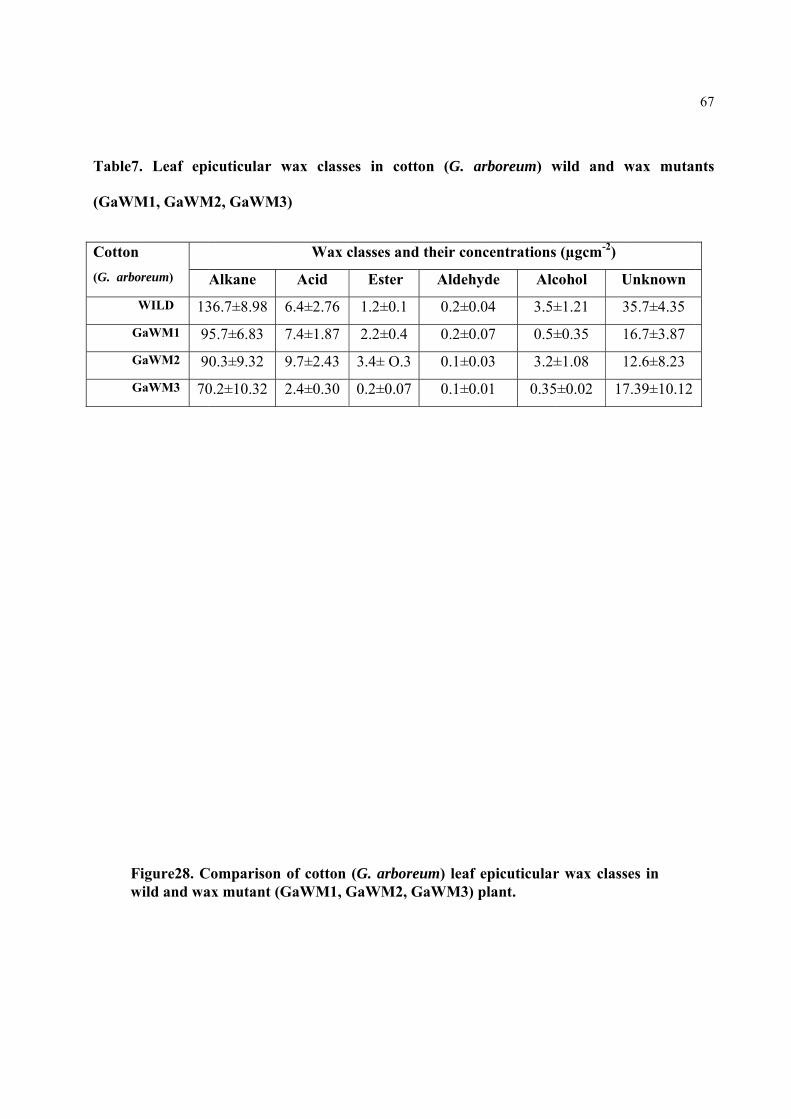
Table7
(GaWM
Cotton (G. arbo
W
G
G
G
Fw
. Leaf epi
M1, GaWM
oreum)
WILD 13GaWM1 9GaWM2 9GaWM3 70
Figure28. Cwild and wa
icuticular
M2, GaWM
Alkane
36.7±8.98
5.7±6.83
0.3±9.32
0.2±10.32
Comparisonax mutant (
wax class
M3)
Wax c
Acid
6.4±2.76
7.4±1.87
9.7±2.43
2.4±0.30
n of cotton (GaWM1, G
es in cott
classes and
Ester
1.2±0.1
2.2±0.4
3.4± O.3
0.2±0.07
(G. arboreGaWM2, G
ton (G. ar
d their conc
Aldehyd
0.2±0.0
0.2±0.0
0.1±0.0
0.1±0.0
eum) leaf eGaWM3) pl
rboreum) w
centrations
de Alc
04 3.5±
07 0.5±
03 3.2±
01 0.35
picuticularlant.
wild and w
(µgcm-2)
cohol U
±1.21 3
±0.35 1
±1.08 1
±0.02 17
r wax class
wax mutan
Unknown
35.7±4.35
16.7±3.87
12.6±8.23
7.39±10.12
ses in
67
nts

68
4.2.4. COMPARISON OF COTTON (G. arboreum) WILD AND WAX MUTANT PLANTS MORPHOLOGY
The three (3) confirmed cotton (G. arboreum) wax mutant plants leaves showed a little glossy
appearance, compared to wild plant (Figure 29). The wax mutant plant stem, at vegetative growth
stage, show more dense hair-like trichomes than the wild plant stem. The hair-like trichomes
density is observed in inverse proportional to the wax deposition. More hair-like trichomes is
observed in wax mutants (GaWM3, GaWM2 and GaWM1), while showing less wax deposition
respectively (Figure 30).
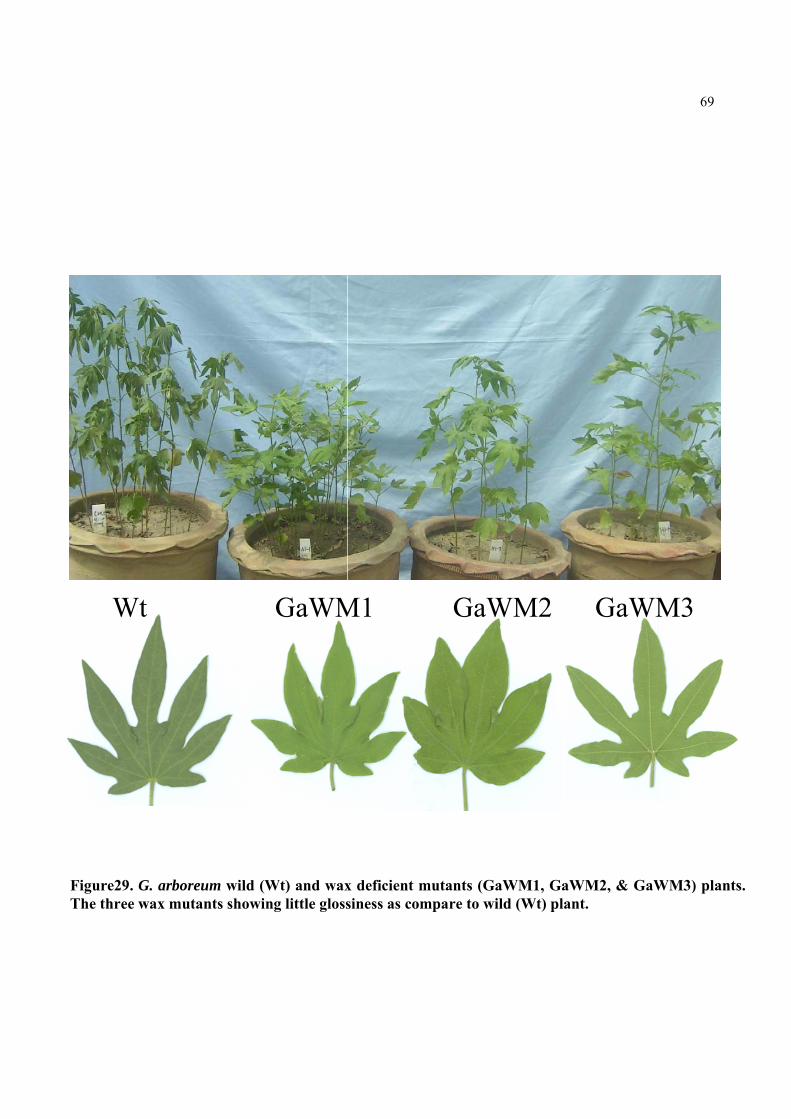
Figure29. The three w
W
G. arboreuwax mutan
t
m wild (Wnts showing
G
Wt) and waxg little gloss
GaWM
x deficient siness as co
M1
mutants (Gompare to w
GaW
GaWM1, Gwild (Wt) p
WM2
GaWM2, &plant.
Ga
& GaWM3)
aWM3
69
) plants.

70
4.3. cDNA LIBRARY
4.3.1 TOTAL RNA
Total RNA quality and integrity is a crucial requirement for the construction of cDNA library
and microarray experiments. The cotton plant (G. arboreum) contains carbohydrates and phenolic
compounds that cause hurdles in nucleic acid (DNA and RNA) isolation by forming quinines and
conjugating with nucleic acid. It is never easy to get good quality and quantity RNA from such
plant. No commercial kit is suitable for RNA extraction from cotton (G. arboreum) plant. Jakola et
al. (2001), method with little modification is used to get good quality and quantity RNA from
M3
Figure30. Comparison of hair-like trichomes (indicated by arrows) in cotton (G. arboreum) wild and wax mutant plants. Wax deficient mutants have showed more hairy trichomes than wild.
Wild GaWM1 GaWM2 GaWM3
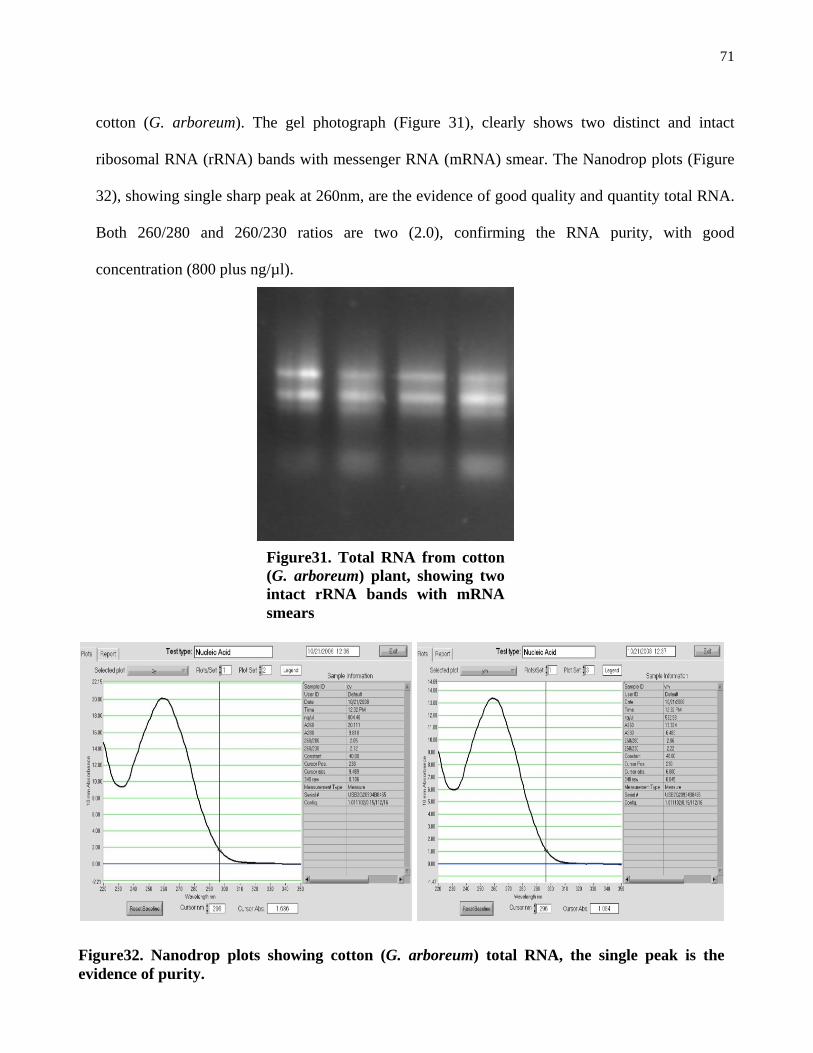
71
cotton (G. arboreum). The gel photograph (Figure 31), clearly shows two distinct and intact
ribosomal RNA (rRNA) bands with messenger RNA (mRNA) smear. The Nanodrop plots (Figure
32), showing single sharp peak at 260nm, are the evidence of good quality and quantity total RNA.
Both 260/280 and 260/230 ratios are two (2.0), confirming the RNA purity, with good
concentration (800 plus ng/µl).
Figure32. Nanodrop plots showing cotton (G. arboreum) total RNA, the single peak is the evidence of purity.
Figure31. Total RNA from cotton (G. arboreum) plant, showing two intact rRNA bands with mRNA smears
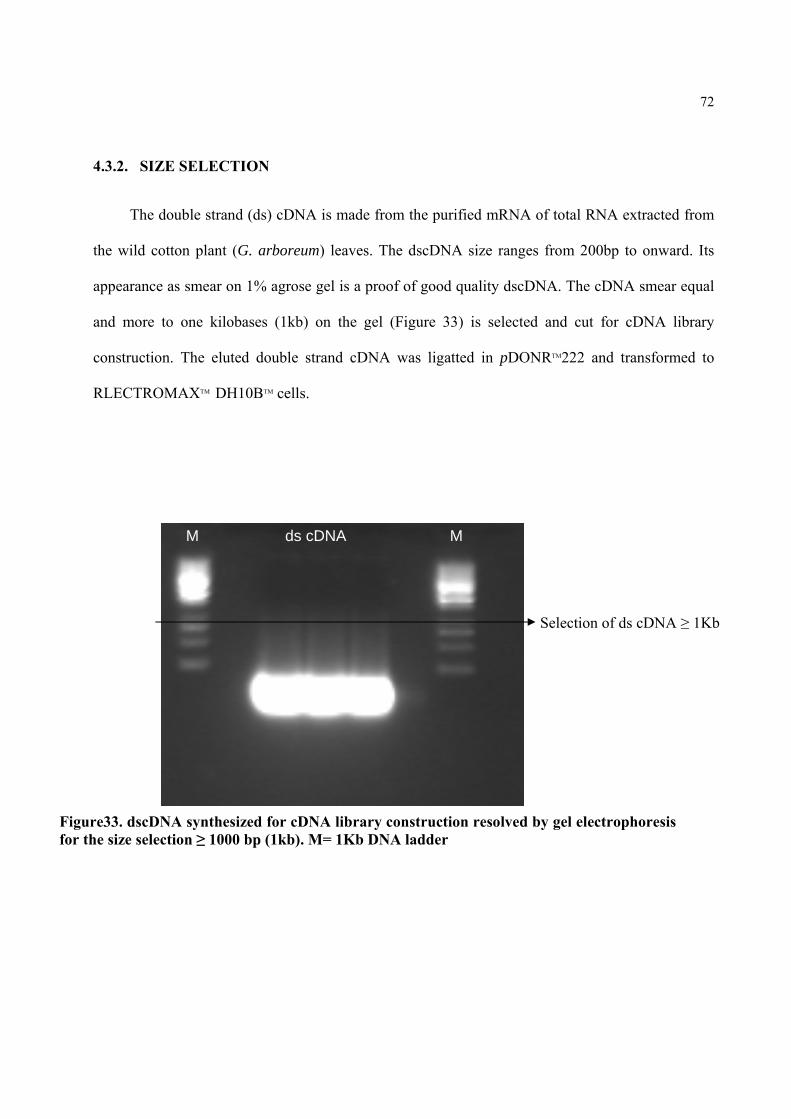
72
Selection of ds cDNA ≥ 1Kb
Figure33. dscDNA synthesized for cDNA library construction resolved by gel electrophoresis for the size selection ≥ 1000 bp (1kb). M= 1Kb DNA ladder
4.3.2. SIZE SELECTION
The double strand (ds) cDNA is made from the purified mRNA of total RNA extracted from
the wild cotton plant (G. arboreum) leaves. The dscDNA size ranges from 200bp to onward. Its
appearance as smear on 1% agrose gel is a proof of good quality dscDNA. The cDNA smear equal
and more to one kilobases (1kb) on the gel (Figure 33) is selected and cut for cDNA library
construction. The eluted double strand cDNA was ligatted in pDONRTM222 and transformed to
RLECTROMAXTM DH10BTM cells.
M ds cDNA M
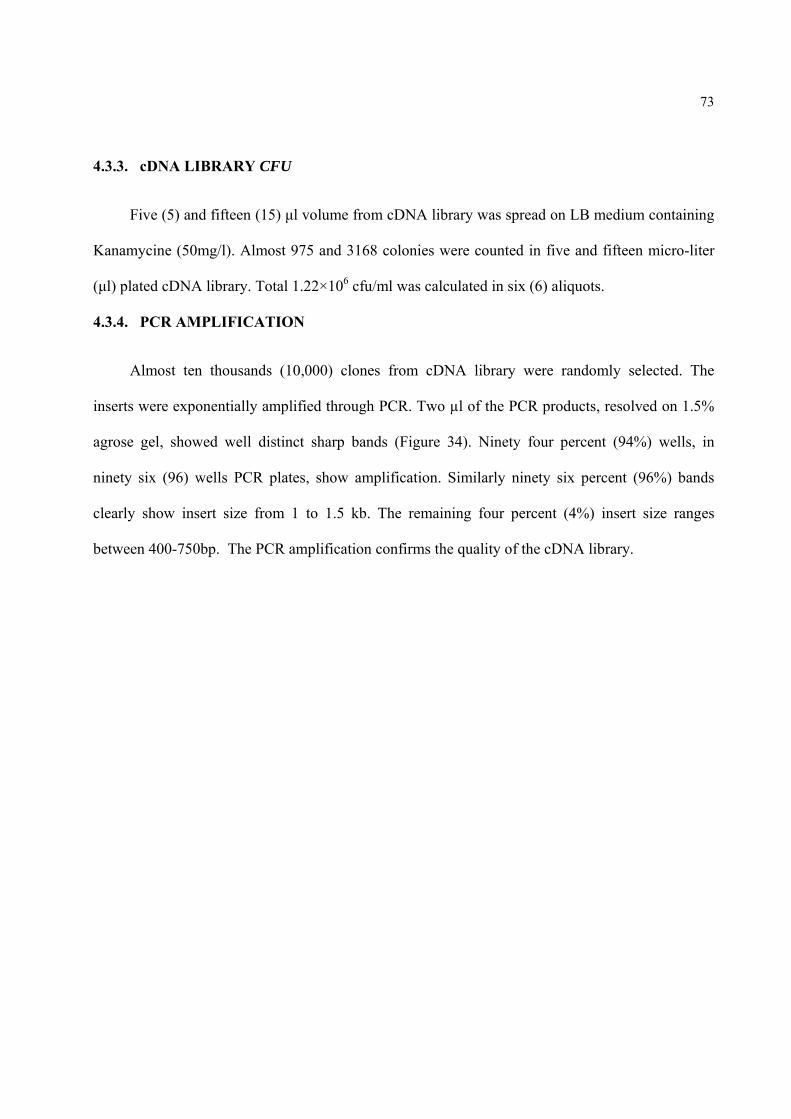
73
4.3.3. cDNA LIBRARY CFU
Five (5) and fifteen (15) μl volume from cDNA library was spread on LB medium containing
Kanamycine (50mg/l). Almost 975 and 3168 colonies were counted in five and fifteen micro-liter
(μl) plated cDNA library. Total 1.22×10⁶ cfu/ml was calculated in six (6) aliquots.
4.3.4. PCR AMPLIFICATION
Almost ten thousands (10,000) clones from cDNA library were randomly selected. The
inserts were exponentially amplified through PCR. Two µl of the PCR products, resolved on 1.5%
agrose gel, showed well distinct sharp bands (Figure 34). Ninety four percent (94%) wells, in
ninety six (96) wells PCR plates, show amplification. Similarly ninety six percent (96%) bands
clearly show insert size from 1 to 1.5 kb. The remaining four percent (4%) insert size ranges
between 400-750bp. The PCR amplification confirms the quality of the cDNA library.
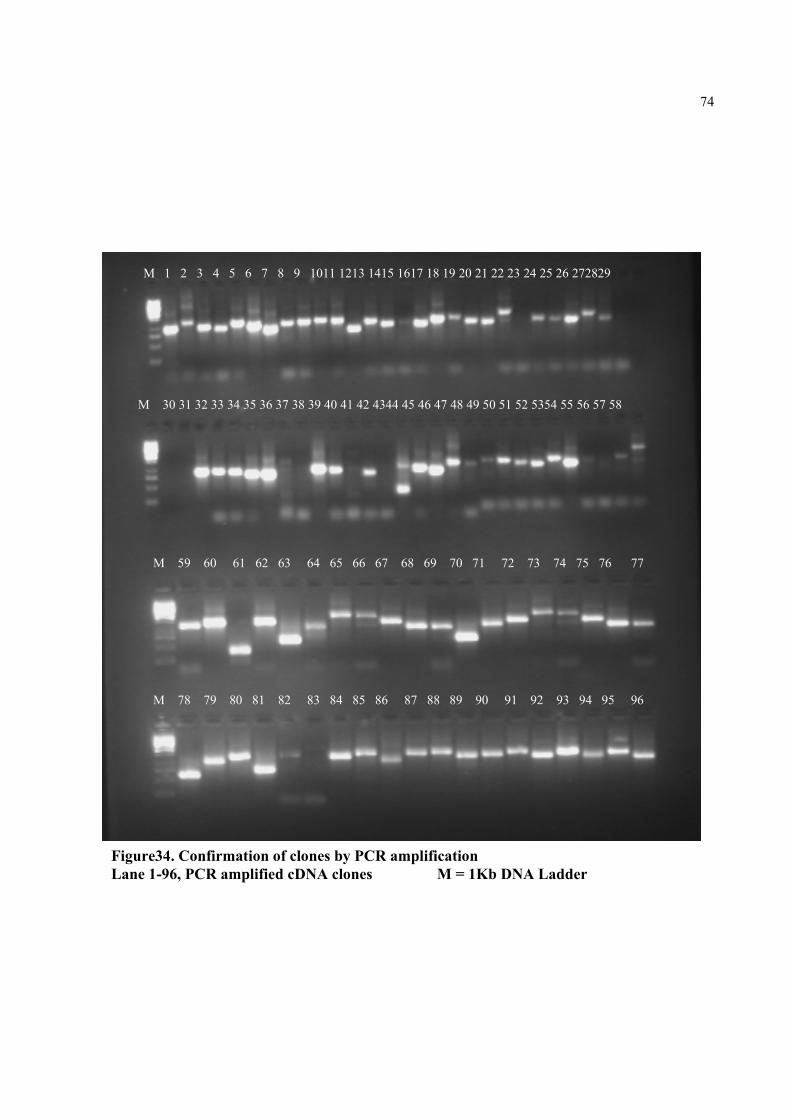
74
M 1 2 3 4 5 6 7 8 9 1011 1213 1415 1617 18 19 20 21 22 23 24 25 26 272829
M 30 31 32 33 34 35 36 37 38 39 40 41 42 4344 45 46 47 48 49 50 51 52 5354 55 56 57 58
M 59 60 61 62 63 64 65 66 67 68 69 70 71 72 73 74 75 76 77
M 78 79 80 81 82 83 84 85 86 87 88 89 90 91 92 93 94 95 96
Figure34. Confirmation of clones by PCR amplification Lane 1-96, PCR amplified cDNA clones M = 1Kb DNA Ladder
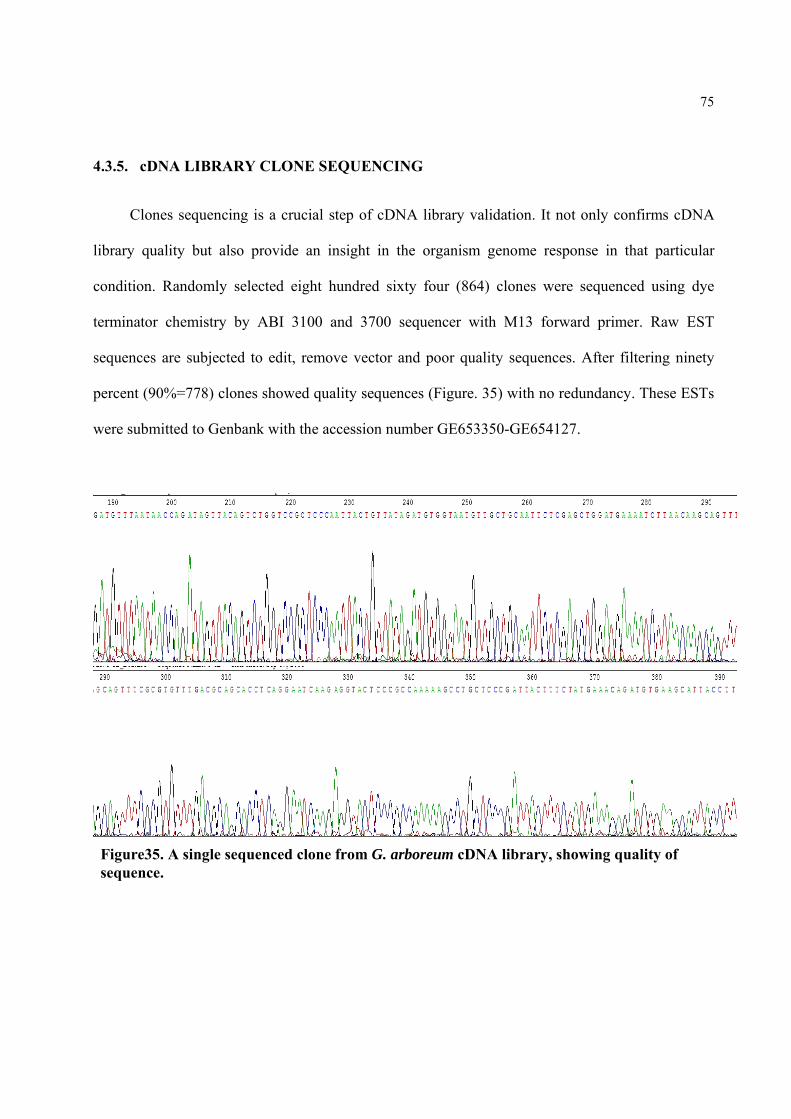
75
4.3.5. cDNA LIBRARY CLONE SEQUENCING
Clones sequencing is a crucial step of cDNA library validation. It not only confirms cDNA
library quality but also provide an insight in the organism genome response in that particular
condition. Randomly selected eight hundred sixty four (864) clones were sequenced using dye
terminator chemistry by ABI 3100 and 3700 sequencer with M13 forward primer. Raw EST
sequences are subjected to edit, remove vector and poor quality sequences. After filtering ninety
percent (90%=778) clones showed quality sequences (Figure. 35) with no redundancy. These ESTs
were submitted to Genbank with the accession number GE653350-GE654127.
Fig----. Illustration of clone sequence quality.
Figure35. A single sequenced clone from G. arboreum cDNA library, showing quality of sequence.
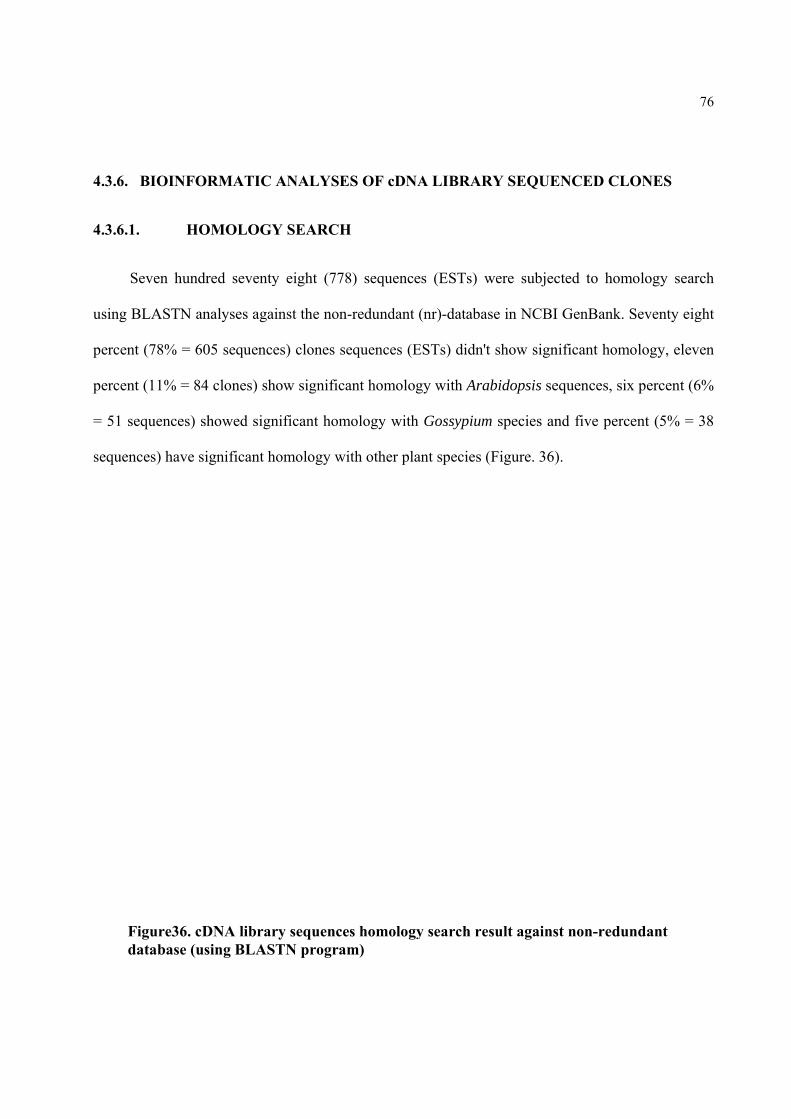
4.3.6.
4.3.6.1.
Se
using B
percent
percent
= 51 se
sequenc
Fida
BIOINFOR
. HO
even hundr
BLASTN an
(78% = 60
(11% = 84
equences) sh
ces) have si
igure36. cDatabase (us
RMATIC A
OMOLOGY
red seventy
nalyses agai
05 sequence
clones) sho
howed sign
gnificant ho
DNA librarsing BLAST
ANALYSE
Y SEARCH
y eight (778
nst the non-
es) clones se
ow significa
nificant hom
omology wi
y sequenceTN program
ES OF cDNA
H
8) sequence
-redundant
equences (E
ant homolog
mology with
ith other pla
es homologym)
A LIBRAR
es (ESTs) w
(nr)-databa
ESTs) didn't
gy with Ara
h Gossypium
ant species (
y search re
RY SEQUE
were subjec
ase in NCBI
t show sign
abidopsis se
m species an
(Figure. 36)
esult agains
ENCED CL
cted to hom
I GenBank.
nificant hom
equences, si
nd five perc
).
st non-redu
LONES
mology sear
Seventy eig
mology, elev
ix percent (6
cent (5% =
undant
76
rch
ght
ven
6%
38
77
4.3.6.2. GENE ONTOLOGY (GO) AND FUNCTIONAL ANNOTATION
The Arabidopsis homologs of cotton (G. arboreum) are further categrized on the basis of
molecular functions, cellular components and biological processes by annotation through gene
ontology (GO). The GO molecular function reveals that the majority of the ESTs are engaged in
other enzyme activity (22.727%), following by other binding (13.636%), structural molecule
activity (10.227%), protein binding (9.091%), kinase activity (7.955%), other molecular funtions
(7.955%), transferase activity (6.818%), unknown molecular functions (6.818%), transporter
activity (5.682%), DNA or RNA binding (4.545%), hydrolase activity (2.273%) and nucleotide
binding (2.273%) (Figure 37).
The GO categorization for cellular components by annotation showed that mostly ESTs are
involved in other intracellular components (25.352%), following by chloroplast (18.712%), other
cytoplasmic components (18.31%), plastid (12.676%), other membranes (8.451%), ribosome
(3.219%), nucleus (2.817%), extracellular (2.616%), cytosol (2.414%), plasma membrane
(2.414%), mitochondria (1.408%), cell wall (0.805%) and unknown cellular components (0.805%)
(Figure 38).
The GO biological process annotation categorized the greater part of cotton (G. arboreum)
homologs in other cellular processes (28.75%), following by other metabolic processes (27.5%),
protein metabolism (8.333%), response to stress (8.333%), response to abiotic and biotic stimulus
(6.667%), other biological processes (4.583%), developmental processes (3.75%), cell organization
and biogenesis (3.75%), electron transport or energy pathway (3.75%), transport (2.083%),
unknown biological processes (1.25%), signal transduction (0.833%) and transcription (0.417%)
(Figure 39).
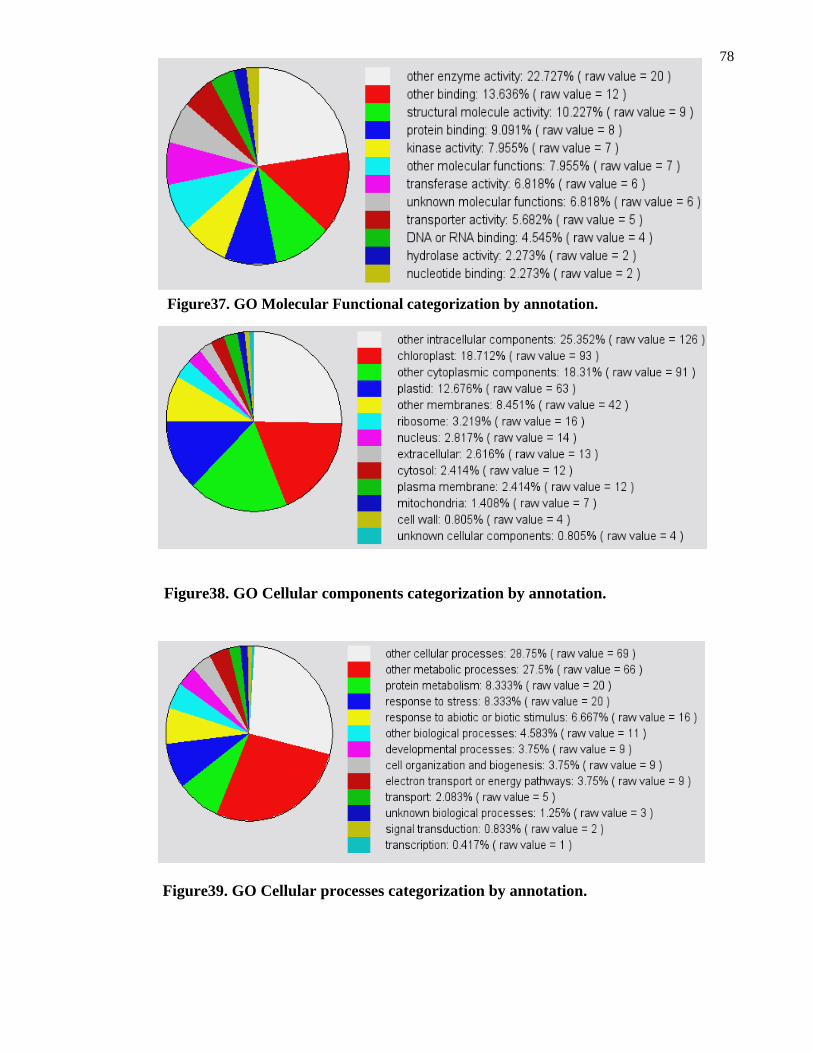
78
Figure38. GO Cellular components categorization by annotation.
Figure39. GO Cellular processes categorization by annotation.
Figure37. GO Molecular Functional categorization by annotation.

79
Some important ESTs in cotton (G. arboreum) cDNA library, involved in various biotic and
abiotic stresses are listed in Table8. These stress responsive ESTs are clustered as, Seven (7) in
reactive oxygen species (ROS) scavenger, four (4) in osmoprotectants, two (2) in each
transmembrane proteins, defense related proteins, salt responsive, late embryo-abundant protein,
transcription factor, heat shock, lipocalin and miscellaneous.
Table8. Cotton (G. arboreum) biotic and abiotic stress responsive ESTs, their annotations and E-values
Genbank _acc# Annotation e-value
ROS Scavengers
GE653421 Metallothionein-like protein 4e-110
GE653602 Gamma-tocopherol methyltransferase 8e-43
GE654005 Metallothionein-like protein (met-1) 4e-72
GE654017 Metallothionein-like protein MT2A 1e-61
GE653440 Catalase
GE654123 Copper/Zinc super oxide dismutase
GE653373 Thioredoxin 5e-28 Transmembrane protein
GE653432 Aquaporine PIP1 protein 5e-70 GE654065 Na+/H+ antiporter 1e-64
Defense Related GE653410 Cyclophilin protein 4e-17
GE653418 Rosa roxburghii clone C5 defense-related 6e-05
Osmoprotectants GE653776 Sorbitol related enzyme 2e-51
GE653841 Glutamine synthetase (GS) 1e-21
GE654075 Betaine aldehyde dehydrogenase 1e-65
GE654075 Putative betaine aldehyde dehydrogenase 1e-65
Genbank _acc# Annotation e-value
salt responsive GE653998 salt tolerance protein 6 2e-41
GE653487 Salt Overly Sensitive (SOS4) 3e-140
Late Embryo-abundant protein
GE653439 Late embryogenesis-
abundant protein (Lea5-A)
2e-46
GE653992 Late embryogenesis-
abundant protein (Lea5-D)
1e-80
Transcription factor GE653510 Zinc finger 7e-46
GE654100 RNA polymerase II transcription factor 2e-50
Heat shock GE653474 Heat shock protein 70 2e-37 GE653491 DnaJ-like protein 7e-89
Lipocalin GE654013 zeaxanthin epoxidase 1e-113
GE653653 Temperature-induced lipocalin 5e-53
Miscellaneous GE653741 Stress-induced cysteine
proteinase 4e-125
GE653602 Gamma-tocopherol methyltransferase 8e-43
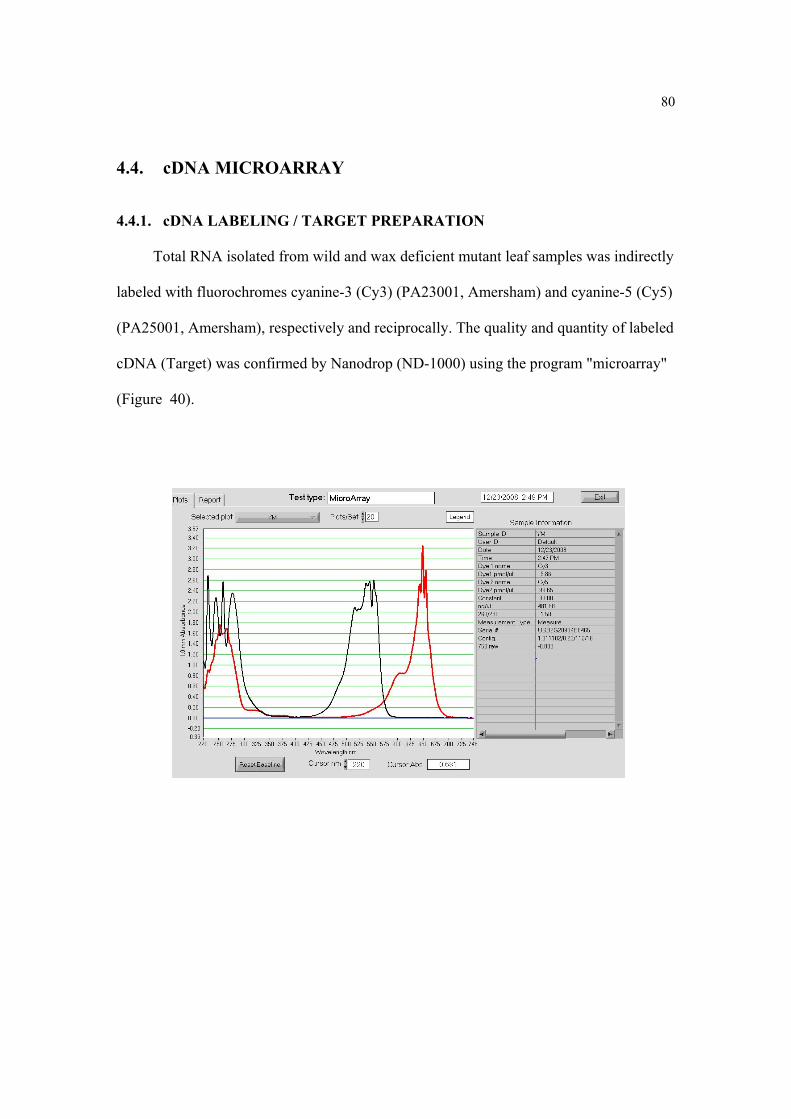
80
4.4. cDNA MICROARRAY
4.4.1. cDNA LABELING / TARGET PREPARATION
Total RNA isolated from wild and wax deficient mutant leaf samples was indirectly
labeled with fluorochromes cyanine-3 (Cy3) (PA23001, Amersham) and cyanine-5 (Cy5)
(PA25001, Amersham), respectively and reciprocally. The quality and quantity of labeled
cDNA (Target) was confirmed by Nanodrop (ND-1000) using the program "microarray"
(Figure 40).
Figure40. Qualitative and quantitative confirmation of microarray target by Nanodrop (ND-1000)
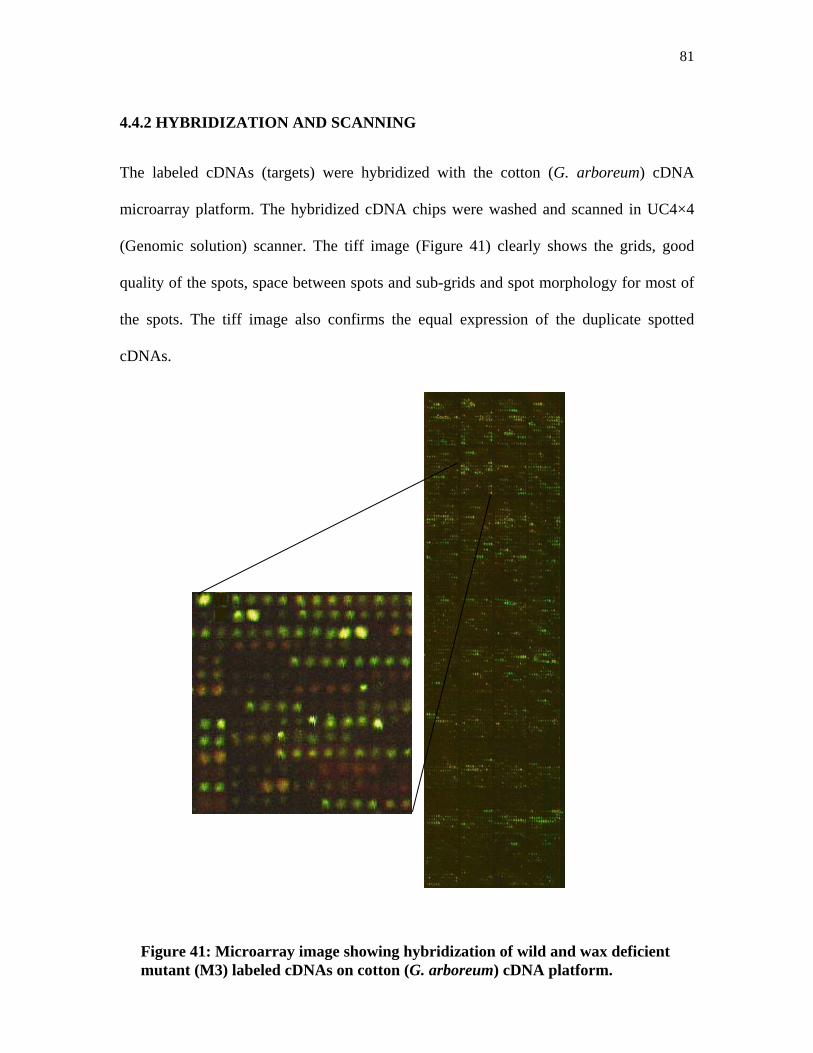
81
4.4.2 HYBRIDIZATION AND SCANNING
The labeled cDNAs (targets) were hybridized with the cotton (G. arboreum) cDNA
microarray platform. The hybridized cDNA chips were washed and scanned in UC4×4
(Genomic solution) scanner. The tiff image (Figure 41) clearly shows the grids, good
quality of the spots, space between spots and sub-grids and spot morphology for most of
the spots. The tiff image also confirms the equal expression of the duplicate spotted
cDNAs.
Figure 41: Microarray image showing hybridization of wild and wax deficient mutant (M3) labeled cDNAs on cotton (G. arboreum) cDNA platform.
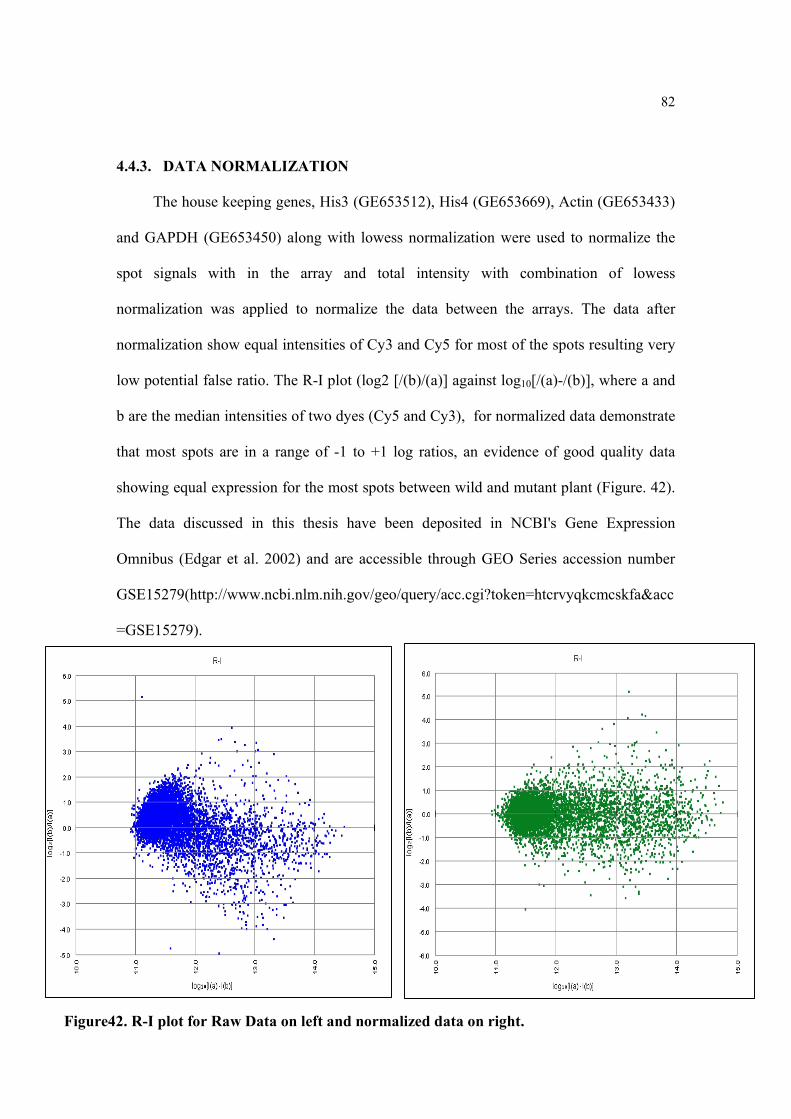
82
4.4.3. DATA NORMALIZATION
The house keeping genes, His3 (GE653512), His4 (GE653669), Actin (GE653433)
and GAPDH (GE653450) along with lowess normalization were used to normalize the
spot signals with in the array and total intensity with combination of lowess
normalization was applied to normalize the data between the arrays. The data after
normalization show equal intensities of Cy3 and Cy5 for most of the spots resulting very
low potential false ratio. The R-I plot (log2 [/(b)/(a)] against log10[/(a)-/(b)], where a and
b are the median intensities of two dyes (Cy5 and Cy3), for normalized data demonstrate
that most spots are in a range of -1 to +1 log ratios, an evidence of good quality data
showing equal expression for the most spots between wild and mutant plant (Figure. 42).
The data discussed in this thesis have been deposited in NCBI's Gene Expression
Omnibus (Edgar et al. 2002) and are accessible through GEO Series accession number
GSE15279(http://www.ncbi.nlm.nih.gov/geo/query/acc.cgi?token=htcrvyqkcmcskfa&acc
=GSE15279).
Figure42. R-I plot for Raw Data on left and normalized data on right.
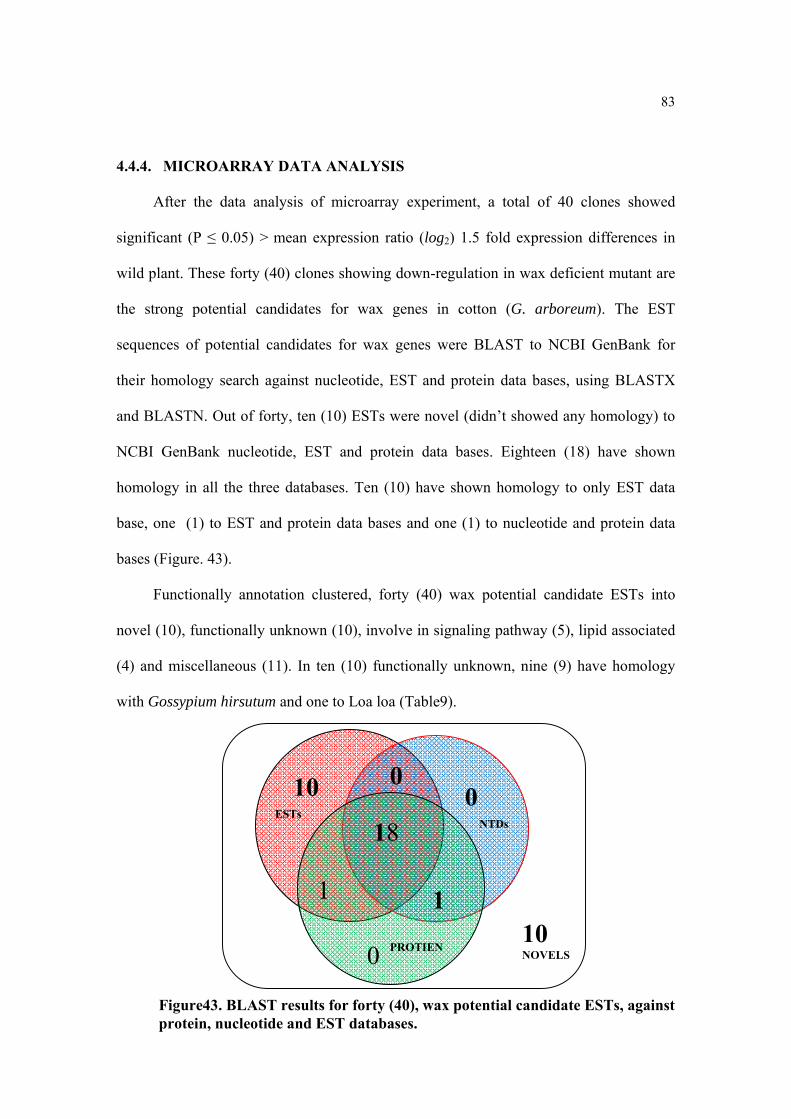
83
4.4.4. MICROARRAY DATA ANALYSIS
After the data analysis of microarray experiment, a total of 40 clones showed
significant (P ≤ 0.05) > mean expression ratio (log2) 1.5 fold expression differences in
wild plant. These forty (40) clones showing down-regulation in wax deficient mutant are
the strong potential candidates for wax genes in cotton (G. arboreum). The EST
sequences of potential candidates for wax genes were BLAST to NCBI GenBank for
their homology search against nucleotide, EST and protein data bases, using BLASTX
and BLASTN. Out of forty, ten (10) ESTs were novel (didn’t showed any homology) to
NCBI GenBank nucleotide, EST and protein data bases. Eighteen (18) have shown
homology in all the three databases. Ten (10) have shown homology to only EST data
base, one (1) to EST and protein data bases and one (1) to nucleotide and protein data
bases (Figure. 43).
Functionally annotation clustered, forty (40) wax potential candidate ESTs into
novel (10), functionally unknown (10), involve in signaling pathway (5), lipid associated
(4) and miscellaneous (11). In ten (10) functionally unknown, nine (9) have homology
with Gossypium hirsutum and one to Loa loa (Table9).
10 NOVELS
ESTs NTDs
PROTIEN
10 00
1
18
1
0
Figure43. BLAST results for forty (40), wax potential candidate ESTs, against protein, nucleotide and EST databases.
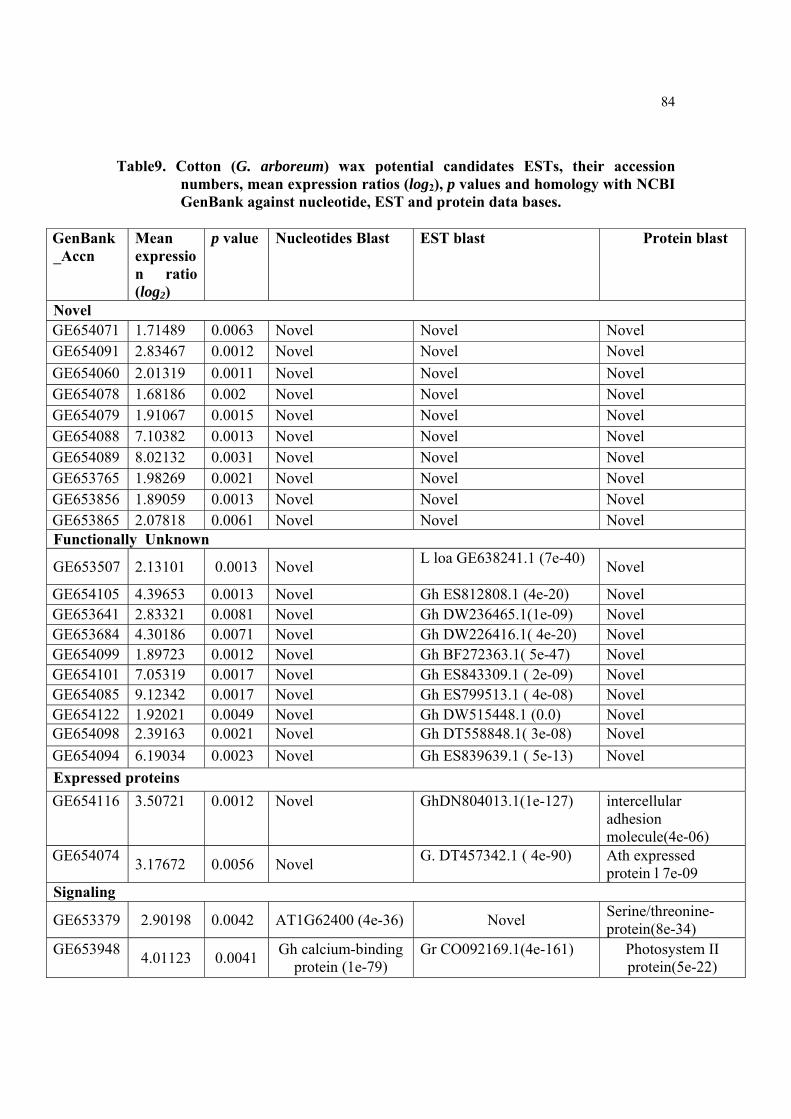
84
Table9. Cotton (G. arboreum) wax potential candidates ESTs, their accession numbers, mean expression ratios (log2), p values and homology with NCBI GenBank against nucleotide, EST and protein data bases.
GenBank_Accn
Mean expression ratio (log2)
p value Nucleotides Blast EST blast Protein blast
Novel GE654071 1.71489 0.0063 Novel Novel Novel GE654091 2.83467 0.0012 Novel Novel Novel GE654060 2.01319 0.0011 Novel Novel Novel GE654078 1.68186 0.002 Novel Novel Novel GE654079 1.91067 0.0015 Novel Novel Novel GE654088 7.10382 0.0013 Novel Novel Novel GE654089 8.02132 0.0031 Novel Novel Novel GE653765 1.98269 0.0021 Novel Novel Novel GE653856 1.89059 0.0013 Novel Novel Novel GE653865 2.07818 0.0061 Novel Novel Novel Functionally Unknown
GE653507 2.13101 0.0013 Novel L loa GE638241.1 (7e-40) Novel
GE654105 4.39653 0.0013 Novel Gh ES812808.1 (4e-20) Novel GE653641 2.83321 0.0081 Novel Gh DW236465.1(1e-09) Novel GE653684 4.30186 0.0071 Novel Gh DW226416.1( 4e-20) Novel GE654099 1.89723 0.0012 Novel Gh BF272363.1( 5e-47) Novel GE654101 7.05319 0.0017 Novel Gh ES843309.1 ( 2e-09) Novel GE654085 9.12342 0.0017 Novel Gh ES799513.1 ( 4e-08) Novel GE654122 1.92021 0.0049 Novel Gh DW515448.1 (0.0) Novel GE654098 2.39163 0.0021 Novel Gh DT558848.1( 3e-08) Novel GE654094 6.19034 0.0023 Novel Gh ES839639.1 ( 5e-13) Novel Expressed proteins GE654116 3.50721 0.0012 Novel GhDN804013.1(1e-127) intercellular
adhesion molecule(4e-06)
GE654074 3.17672 0.0056 Novel G. DT457342.1 ( 4e-90)
Ath expressed protein l 7e-09
Signaling
GE653379 2.90198 0.0042 AT1G62400 (4e-36) Novel Serine/threonine-protein(8e-34)
GE653948 4.01123 0.0041 Gh calcium-binding
protein (1e-79) Gr CO092169.1(4e-161)
Photosystem II protein(5e-22)
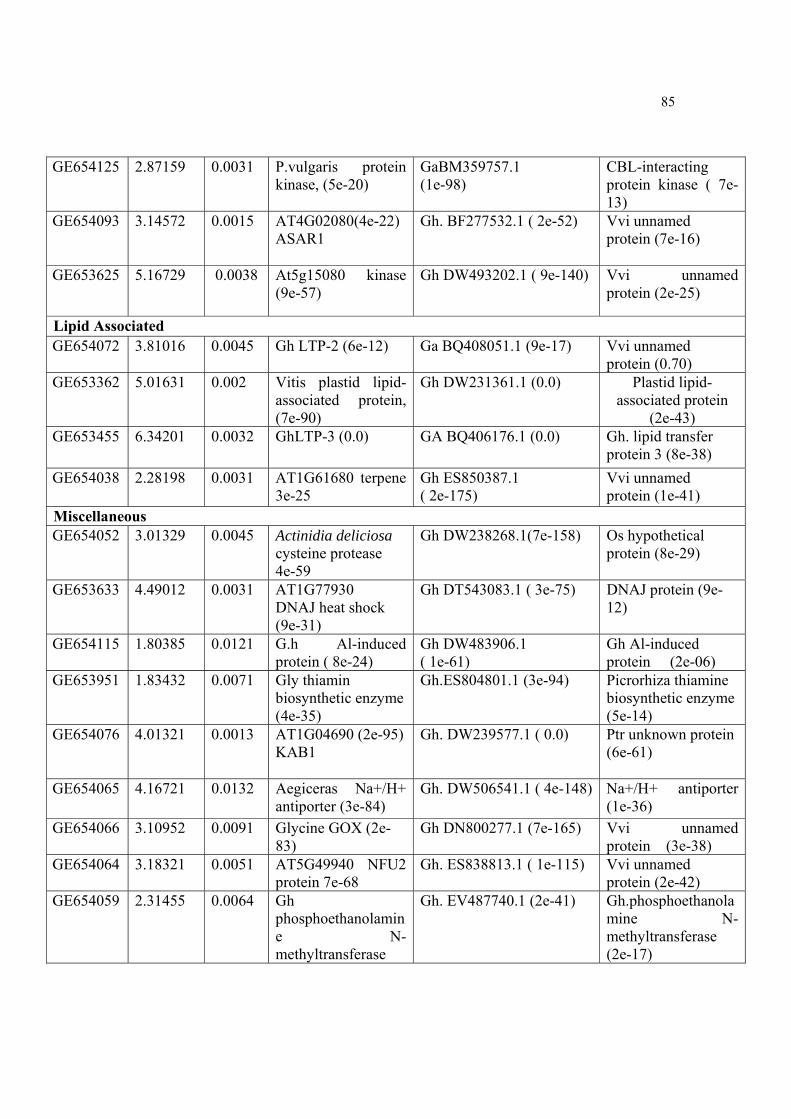
85
GE654125 2.87159 0.0031 P.vulgaris protein kinase, (5e-20)
GaBM359757.1 (1e-98)
CBL-interacting protein kinase ( 7e-13)
GE654093 3.14572 0.0015 AT4G02080(4e-22) ASAR1
Gh. BF277532.1 ( 2e-52) Vvi unnamed protein (7e-16)
GE653625 5.16729 0.0038 At5g15080 kinase (9e-57)
Gh DW493202.1 ( 9e-140) Vvi unnamed protein (2e-25)
Lipid Associated GE654072 3.81016 0.0045 Gh LTP-2 (6e-12) Ga BQ408051.1 (9e-17)
Vvi unnamed protein (0.70)
GE653362
5.01631 0.002 Vitis plastid lipid-associated protein, (7e-90)
Gh DW231361.1 (0.0)
Plastid lipid-associated protein
(2e-43) GE653455 6.34201 0.0032 GhLTP-3 (0.0) GA BQ406176.1 (0.0) Gh. lipid transfer
protein 3 (8e-38) GE654038 2.28198 0.0031 AT1G61680 terpene
3e-25 Gh ES850387.1 ( 2e-175)
Vvi unnamed protein (1e-41)
Miscellaneous GE654052 3.01329 0.0045 Actinidia deliciosa
cysteine protease 4e-59
Gh DW238268.1(7e-158) Os hypothetical protein (8e-29)
GE653633 4.49012 0.0031 AT1G77930 DNAJ heat shock (9e-31)
Gh DT543083.1 ( 3e-75) DNAJ protein (9e-12)
GE654115 1.80385 0.0121 G.h Al-induced protein ( 8e-24)
Gh DW483906.1 ( 1e-61)
Gh Al-induced protein (2e-06)
GE653951
1.83432 0.0071 Gly thiamin biosynthetic enzyme (4e-35)
Gh.ES804801.1 (3e-94)
Picrorhiza thiamine biosynthetic enzyme (5e-14)
GE654076 4.01321 0.0013 AT1G04690 (2e-95) KAB1
Gh. DW239577.1 ( 0.0) Ptr unknown protein (6e-61)
GE654065 4.16721 0.0132 Aegiceras Na+/H+ antiporter (3e-84)
Gh. DW506541.1 ( 4e-148) Na+/H+ antiporter (1e-36)
GE654066 3.10952 0.0091 Glycine GOX (2e-83)
Gh DN800277.1 (7e-165) Vvi unnamed protein (3e-38)
GE654064 3.18321 0.0051 AT5G49940 NFU2 protein 7e-68
Gh. ES838813.1 ( 1e-115) Vvi unnamed protein (2e-42)
GE654059 2.31455 0.0064 Gh phosphoethanolamine N-methyltransferase
Gh. EV487740.1 (2e-41) Gh.phosphoethanolamine N-methyltransferase (2e-17)

86
Figure44: Relative fold expression of Wax potential candidate ESTs in leaves of wild andwax mutant cotton plants through Real-time PCR. Solid bars represent FAM(carboxyfluorescein) signals during the reaction.
4.4.5. MICROARRAY RESULTS VALIDATION STUDIES
The cotton (G. arboreum) wax potential candidates ESTs, resulted from microarray
data are further confirmed by quantitative Real Time PCR to eliminate any false positive
results. The twelve transcripts were selected randomly for real-time RT-PCR and
GAPDH gene was used as the reference gene to normalize the expression levels. All
transcripts showed different level of down-expression in wax mutant (GaWM3) as
compared to wild plant and these results were the confirmation of microarray data. There
is 8.5 fold down expression of GE654079, 8 fold of GE654085, GE654105, GE654066, 7
fold of GE654122, GE654074, 6 fold of GE654078, GE654060, 5.5 fold of GE654065, 5
fold of 654072, 654099 and 4 fold of 654076 observed in wax mutant plant (Figure. 44).
87
4.4.6. WAX POTENTIAL CANDIDATE ESTS FUNCTIONAL
CATEGORIZATION BY GO (GENE ONTOLOGY) ANNOTATION
The Arabidopsis homologs of cotton (G. arboreum) wax potential candidates ESTs
are subjected to Gene Ontology for their functional categorization on the basis of cellular
components, molecular functions and biological processes.
The GO cellular component categrorization for the wax potential candidate ESTs
showed that 22.4% genes belong to chloroplast, 20.7% to other intracellular components,
17.2% to other cytoplasmic components, 13.8% to plastid, 12.1% to other membranes,
5.1% to plasma membrane, 1.7% to extracellular, cytosol, ribosome, nucleus, and
mitochondria (Figure 45).
The GO molecular function categorization revealed that cotton (G. arboreum) wax
potential candidate ESTs are mostly involved in other binding, transport and other
enzymes activity (20% each), following by protein binding (13.3%), kinase activity,
transferase activity, nucleotide binding, and structural molecule activity (6.7%) (Figure
46).
The GO biological processes annotation showed that the mostly cotton (G.
arboreum) wax potential candidate ESTs are engaged in other metabolic processes
(33.3%), following by, other cellular processes (27.3%), protein metabolism (12.1%),
transport (9.1%), response to stress and biotic, abiotic stresses (6.1, in each), signal
transduction (3.1%), cell organization and biogenesis (3.0%) (Figure 47).
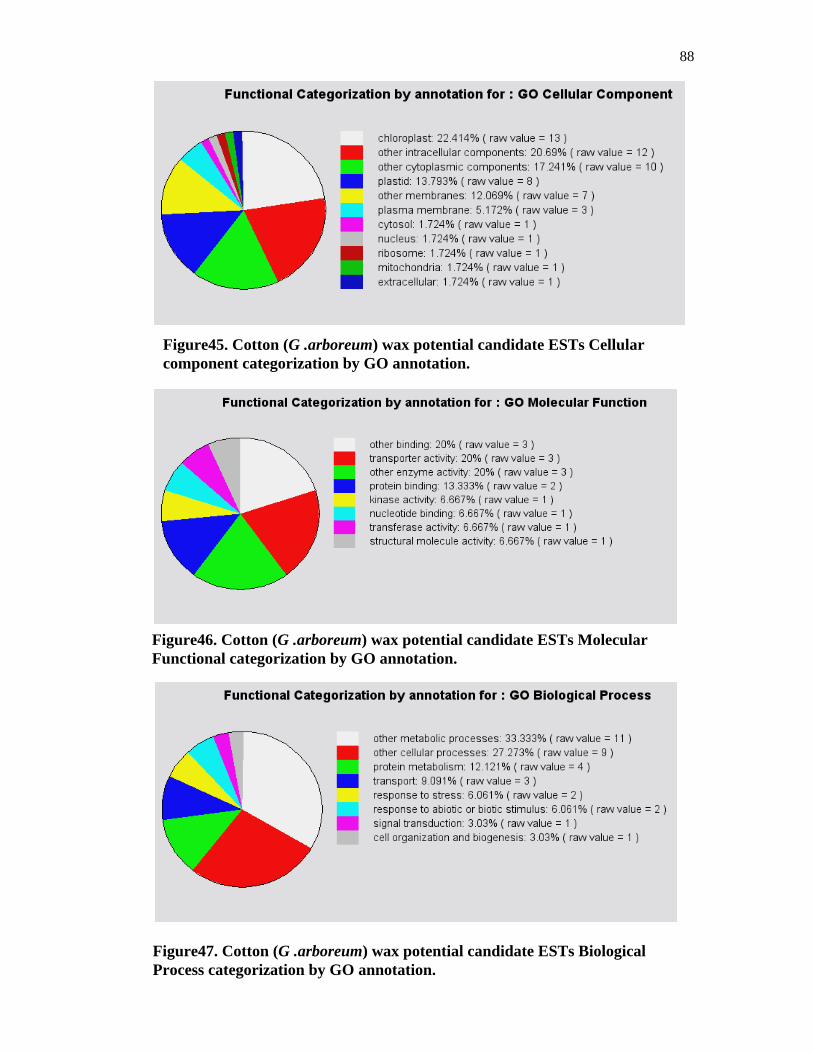
88
Figure45. Cotton (G .arboreum) wax potential candidate ESTs Cellular component categorization by GO annotation.
Figure46. Cotton (G .arboreum) wax potential candidate ESTs Molecular Functional categorization by GO annotation.
Figure47. Cotton (G .arboreum) wax potential candidate ESTs Biological Process categorization by GO annotation.

89
4.4.7. GENE INVESTIGATOR EXPRESSIONAL ANALYSIS BY RESPONSE
VIEWER
Arabidopsis orthologs of cotton (G. arboreum) wax potential candidate ESTs,
subjected to gene investigator expressional analysis response viewer (Zimmermann et al.
2004), to find their expression in biotic, abiotic and UV stresses. The log2 ratios of
Arabidopsis orthologs under biotic, abiotic and UV stressed and their cotton (G.
arboreum) potential wax candidate ESTs showed similar pattern of gene expression,
when subjected to Multi Experiment Viewer (MEV) analysis. No down regulation is
found in this expressional analysis (Figure. 48).
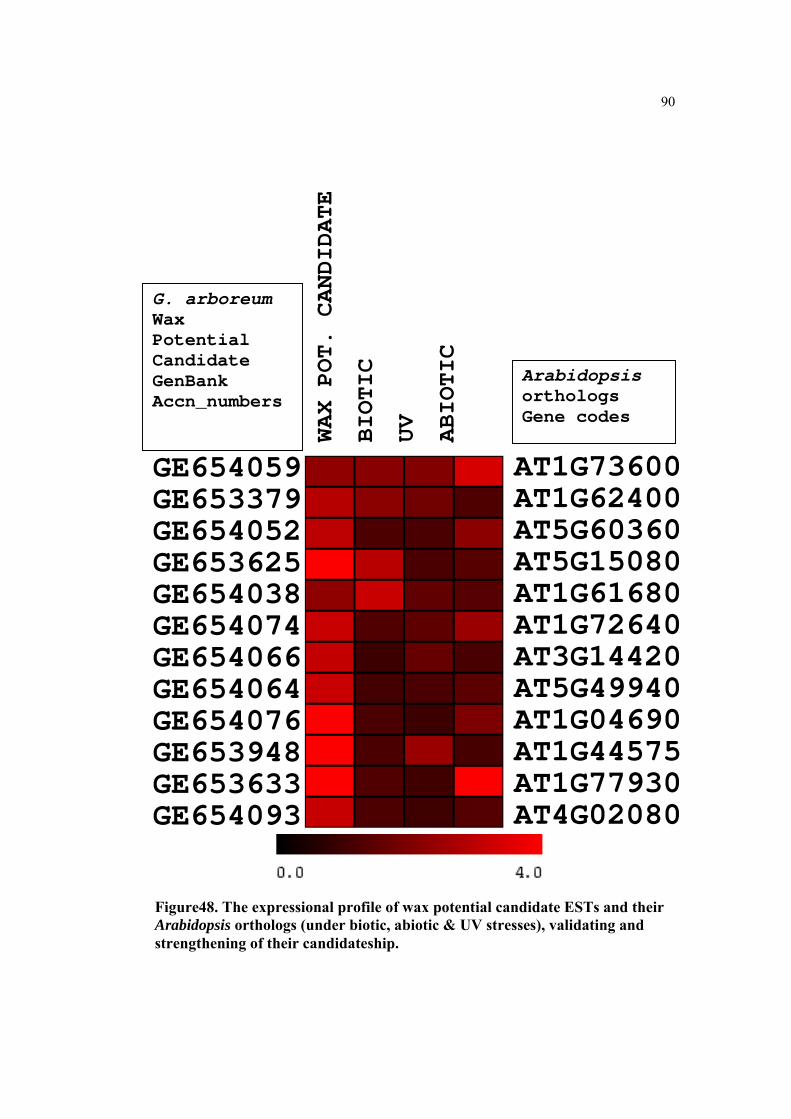
90
Arabidopsis orthologs Gene codes
G. arboreum Wax Potential Candidate GenBank Accn_numbers
AT1G73600AT1G62400AT5G60360AT5G15080AT1G61680AT1G72640AT3G14420AT5G49940AT1G04690AT1G44575AT1G77930AT4G02080
WAX POT. CANDIDATE
BIOTIC
UV
ABIOTIC
GE654059 GE653379 GE654052 GE653625 GE654038 GE654074 GE654066 GE654064 GE654076 GE653948 GE653633 GE654093
Figure48. The expressional profile of wax potential candidate ESTs and their Arabidopsis orthologs (under biotic, abiotic & UV stresses), validating and strengthening of their candidateship.

CHAPTER: 5
DISCUSSION
&
REFERENCES

91
5. DISCUSSION
Presently no studies of leaf epicuticular wax composition, morphology and genes
in Asiatic diploid cotton (G. arboreum) reported. The aim of the present study is to better
understand and reveal the G. arboreum leaf epicuticular wax composition, morphology
and genes involve in their production and deposition. Forward genetic screens based on
plant phenotypes are very powerful toll to find the cotton (G. arboreum) wax genes
because the approach does not depend on prior knowledge. To find the potential wax
candidate genes in Asiatic diploid cotton (G. arboreum), known for its tolerance against
biotic and abiotic stresses (Mansoor et al. 2003), a strategy of wax mutant development
and its differential expression studies on cDNA microarray platform of wild cotton (G.
arboreum) plant has been adopted. Similar approach has been reported for the profiling
candidate genes in wax biosynthesis in Arabidopsis thaliana (Costaglioli et al. 2005) and
in other mutants (Garbay et al. 2007, Huang et al. 2008).
Wax mutants have important role in the identification of genes involved in wax
biosynthetic pathway (Kunst et al. 2003). A number of wax-deficient mutants were
developed and confirmed by various physical and chemical mutagens in various plant
species like, Arabidopsis (Koornneef et al. 1989), sorghum bicolor (Jenks et al. 1994),
barley (Hordeum vulgare) (von Wettstein-Knowles 1987), and maize (Zea mays)(
Bianchi et al. 1978). The most loci involved in wax biosynthetic pathway were identified
in barley, which are 85. Next is Arabidopsis, with total 25 known wax mutants showing
different degrees of waxlessness is reported.
92
In the present study physical mutagen (Gamma rays) and chemical mutagens like,
ethyl methane sulphonate (EMS), diethyl sulfate (DES) and sodium azoid (SA), in
combination and separately with various pre-soaking time is used to develop the wax
mutants in Asiatic diploid cotton (G. arboreum). Total three wax deficient mutants were
confirmed by scanning electron microscopy (SEM) and GC-MS. All the three mutants
are resulted from the chemical mutagens. Two are developed by EMS and one is by DES.
Koornef et al. (1982) developed a number of wax deficient mutants in Arabidopsis
thaliana by EMS. The wax mutant varieties in sorghum bicolor (L.) were produced by
mutagens diethyl sulfate (DES) and ethyl methane sulphonate (EMS) (Jenks et al. 1994).
The developed cotton (G. arboreum) wax mutants show glossy leaves as compared
to wild. The Arabidopsis, wax (cer) mutants showing varying degrees of glossiness as,
cer1- cer10 are very glossy and cer 11- cer22 are less so (Koornneef et al. 1989). The
wax mutants identified in several plant species due to its glossy appearance, termed as
glossy mutants like, the dicots rape (Brassica napus), cabbage (Brassica oleracea), pea
(Pisum sativum), and Arabidopsis thaliana, and the monocots barley (Hordeum vulgare),
sorghum (Sorghum bicolor), and maize (Zea mays) (e.g. Holloway et al. 1977, Lundqvist
& Lundqvist 1988, Eigenbrode et al. 1991, Schnable et al. 1994, Jianguo etal. 1995,
Jenkset al. 1996). Eighteen (18) glossy loci have been identified by the help of mutants in
maize (Hansen et al. 1997).
The wax mutant plant stem, at vegetative growth stage, showed more dense hair-
like trichomes than the wild plant stem. The hair-like trichomes density is observed in
inverse proportional to the wax deposition. More hair-like trichomes is observed in wax
mutants (GaWM3, GaWM2 and GaWM1), while showing less wax deposition

93
respectively. The observation of more dense hair-like trichomes, in wax deficient mutant
plants suggest, it may be an alternate adaptation of plant to compensate the lesions of wax
reduction.
The epicuticular wax appears as smooth stripy layers in wild cotton plant adaxial
leaf under scanning electron microscope. The similar finding was observed in
Arabidopsis leaf (Jenks et al. 1995). Jenk et al. (1996) reported crystal less smooth
epicuticular wax in wild-type Arabidopsis adaxial and abaxial leaf surfaces. The G.
hirsutum leaf epicuticular wax shows fine, selender striations morphology in SEM
(Bondada et al. 2000). It suggests a variation in epicuticular wax morphology among
species within a genus. As G. arboreum is more water stressed tolerant than G. hirsutum
so, it suggest, smooth waxy layer may have role in sufficient protection of plant from
dehydration by preventing non-stomatal water evaporation. The Arabidopsis stem shows
epicuticular wax as crystalline tubules instead of smooth layers. The maize leaf
epicuticular wax appears as membraneous platelets crystals (Beattie et al. 2002). The
GaWM1, GaWM2 and GaWM3 cotton wax mutant have altered wax morphology from
smooth strips to embedded tubules/fibers, irregular patches and non-stripy smooth layers
respectively.
The total wax load on wild cotton plant is 183.7 ±8.72 µgcm-2. It is almost six
fold to the Arabidopsis stem total wax load that is 32 µgcm-2 (Suh et al. 2005). As G.
arboreum show more tolerant to biotic and abiotic stress, as compare to Arabidopsis, so
it may be due to the over wax deposition on the leaves of G. arboreum. Bondada et al.
(1996) reported 154.60µgcm-2 total wax load in G. hirsutum leaf epicuticular wax.
Similarly total wax load on tobacco tree leaves is 10-26 µg cm-2 (Cameron et al. 2006).
94
The carnauba palm (Copernicia cerifera) has most total wax load on leaf cuticles among
plant species. It has the total leaf wax load in the range of 300–1000 µg /cm2 on leaves
(Tulloch, 1976), following by cotton (Gossypium hirsutum) and sorghum leaf epicuticular
wax loads which is in the range of 100 - 300 µg/cm2 (Premachandra et al. 1994, Bondada
et al. 1996). Arabidopsis thaliana, rice (Oryza sativa), willow (Salix spp.), poplar hybrid
(Populus spp.), and oat (Avena sativa) have total wax load ≤ to 25 µg cm -2 on leaves
(Bengtson et al. 1978, O’Toole et al. 1979b, Hietala et al. 1995, Jenks et al. 1995,
Cameron et al. 2002).
The total wax load is 66.79% on GaWM1, 59.50% on GaWM2 and 49.29% on
GaWM3 as compared to wild. Its means there is 33.21%, 40.50% and 50.71% reduction
in total wax load respectively. The Arabidopsis cer mutants have total wax load reduction
in a range of 10 -90% to wild. The Cer1, Cer2, Cer3 and Cer6 have only 13%, 25%, 20%
and 10% total wax load as compared to wild (Aarts et al. 1995, Fiebig et al. 2000, Negruk
et al. 1996, Rowland et al. 2007). Cer4 and WSD1 Arabidopsis wax mutants have similar
wax load to wild type but reduced primary alcohols and wax esters (Rowland et al. 2006,
Samuels et al. 2008).
The epicuticular wax chemical composition and their percentage to total wax load
varies among plant not only in plant species but even also within plant organs. The
chemical wax composition depends on plant species and genotypes. This variation in wax
chemical composition and concentration bring resistance to various biotic and abiotic
stresses in plants (Eigenbrod et al. 1995, Jetter et al. 2006, Eltz 2006, Wilms and Eltz
2008). In the present study, cotton (G. arboreum) leaf epicuticular wax chemical
composition consists of alkanes, acids, esters, aldehyds alcohols and unknown classes.
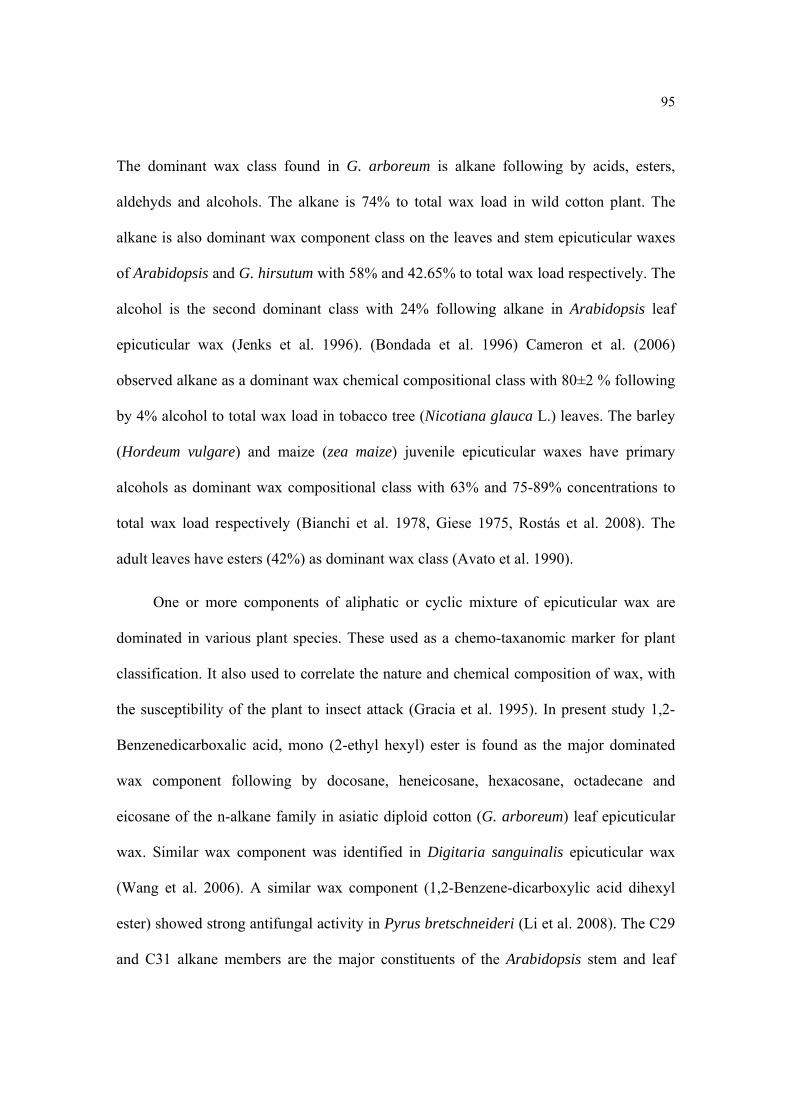
95
The dominant wax class found in G. arboreum is alkane following by acids, esters,
aldehyds and alcohols. The alkane is 74% to total wax load in wild cotton plant. The
alkane is also dominant wax component class on the leaves and stem epicuticular waxes
of Arabidopsis and G. hirsutum with 58% and 42.65% to total wax load respectively. The
alcohol is the second dominant class with 24% following alkane in Arabidopsis leaf
epicuticular wax (Jenks et al. 1996). (Bondada et al. 1996) Cameron et al. (2006)
observed alkane as a dominant wax chemical compositional class with 80±2 % following
by 4% alcohol to total wax load in tobacco tree (Nicotiana glauca L.) leaves. The barley
(Hordeum vulgare) and maize (zea maize) juvenile epicuticular waxes have primary
alcohols as dominant wax compositional class with 63% and 75-89% concentrations to
total wax load respectively (Bianchi et al. 1978, Giese 1975, Rostás et al. 2008). The
adult leaves have esters (42%) as dominant wax class (Avato et al. 1990).
One or more components of aliphatic or cyclic mixture of epicuticular wax are
dominated in various plant species. These used as a chemo-taxanomic marker for plant
classification. It also used to correlate the nature and chemical composition of wax, with
the susceptibility of the plant to insect attack (Gracia et al. 1995). In present study 1,2-
Benzenedicarboxalic acid, mono (2-ethyl hexyl) ester is found as the major dominated
wax component following by docosane, heneicosane, hexacosane, octadecane and
eicosane of the n-alkane family in asiatic diploid cotton (G. arboreum) leaf epicuticular
wax. Similar wax component was identified in Digitaria sanguinalis epicuticular wax
(Wang et al. 2006). A similar wax component (1,2-Benzene-dicarboxylic acid dihexyl
ester) showed strong antifungal activity in Pyrus bretschneideri (Li et al. 2008). The C29
and C31 alkane members are the major constituents of the Arabidopsis stem and leaf
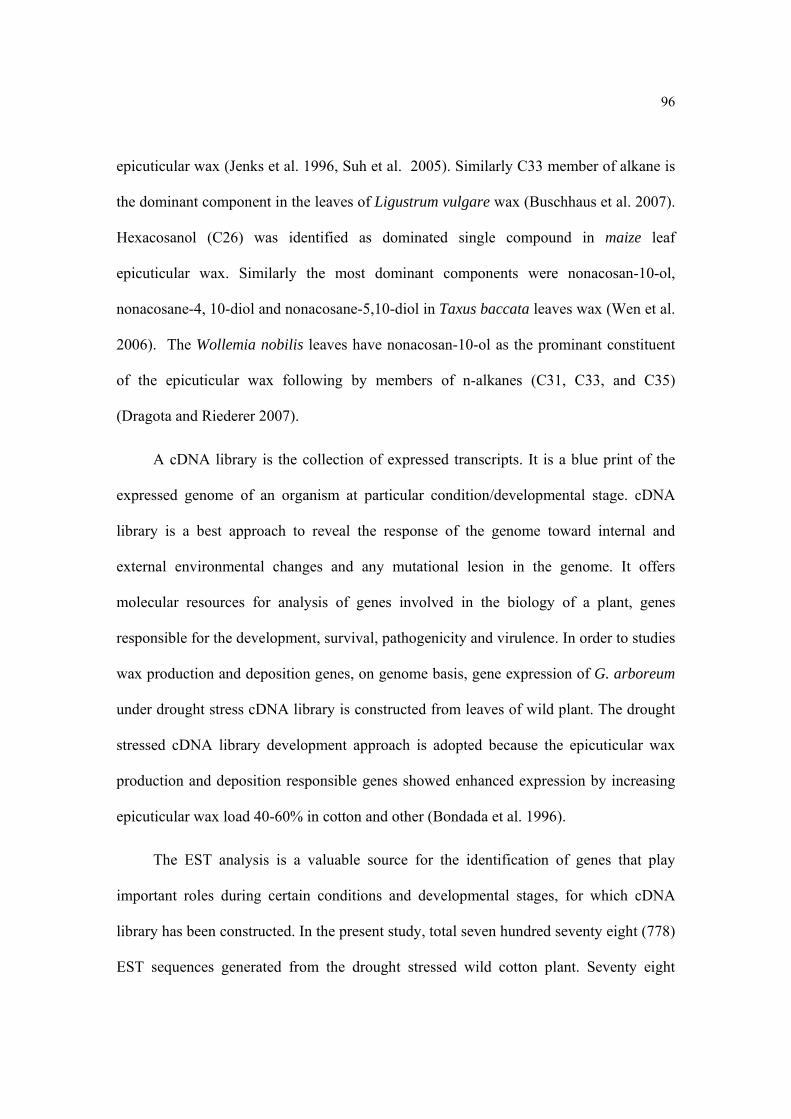
96
epicuticular wax (Jenks et al. 1996, Suh et al. 2005). Similarly C33 member of alkane is
the dominant component in the leaves of Ligustrum vulgare wax (Buschhaus et al. 2007).
Hexacosanol (C26) was identified as dominated single compound in maize leaf
epicuticular wax. Similarly the most dominant components were nonacosan-10-ol,
nonacosane-4, 10-diol and nonacosane-5,10-diol in Taxus baccata leaves wax (Wen et al.
2006). The Wollemia nobilis leaves have nonacosan-10-ol as the prominant constituent
of the epicuticular wax following by members of n-alkanes (C31, C33, and C35)
(Dragota and Riederer 2007).
A cDNA library is the collection of expressed transcripts. It is a blue print of the
expressed genome of an organism at particular condition/developmental stage. cDNA
library is a best approach to reveal the response of the genome toward internal and
external environmental changes and any mutational lesion in the genome. It offers
molecular resources for analysis of genes involved in the biology of a plant, genes
responsible for the development, survival, pathogenicity and virulence. In order to studies
wax production and deposition genes, on genome basis, gene expression of G. arboreum
under drought stress cDNA library is constructed from leaves of wild plant. The drought
stressed cDNA library development approach is adopted because the epicuticular wax
production and deposition responsible genes showed enhanced expression by increasing
epicuticular wax load 40-60% in cotton and other (Bondada et al. 1996).
The EST analysis is a valuable source for the identification of genes that play
important roles during certain conditions and developmental stages, for which cDNA
library has been constructed. In the present study, total seven hundred seventy eight (778)
EST sequences generated from the drought stressed wild cotton plant. Seventy eight
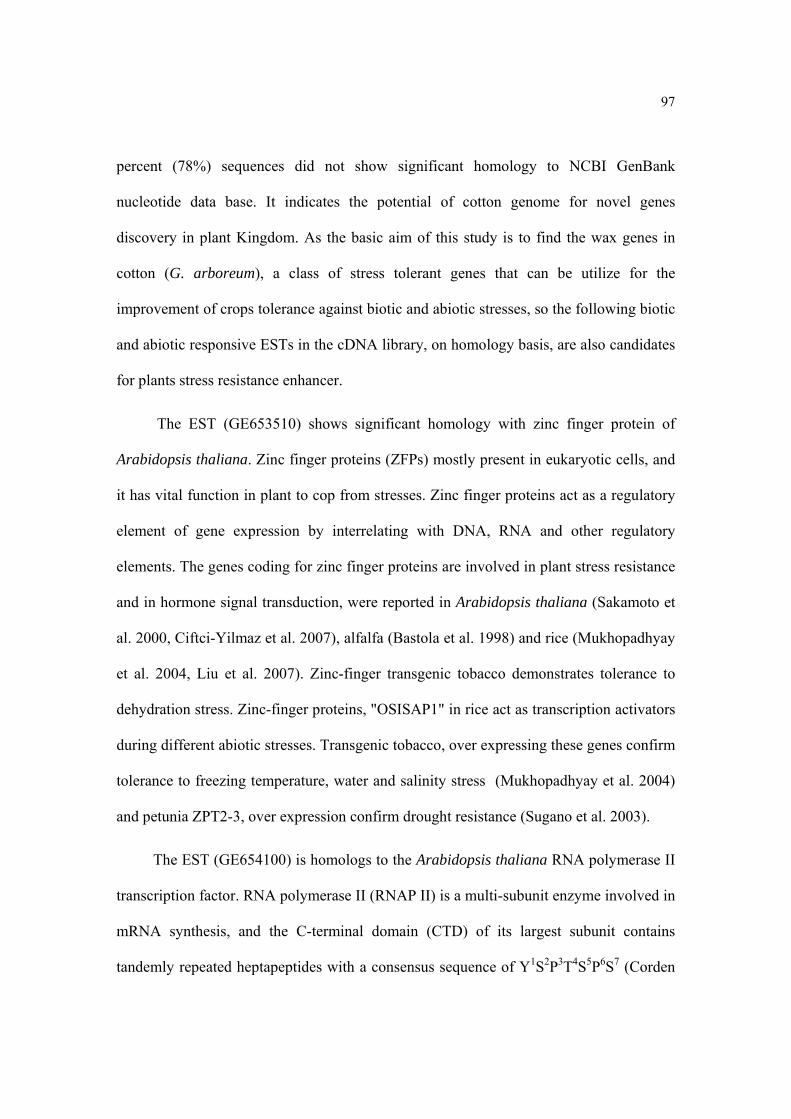
97
percent (78%) sequences did not show significant homology to NCBI GenBank
nucleotide data base. It indicates the potential of cotton genome for novel genes
discovery in plant Kingdom. As the basic aim of this study is to find the wax genes in
cotton (G. arboreum), a class of stress tolerant genes that can be utilize for the
improvement of crops tolerance against biotic and abiotic stresses, so the following biotic
and abiotic responsive ESTs in the cDNA library, on homology basis, are also candidates
for plants stress resistance enhancer.
The EST (GE653510) shows significant homology with zinc finger protein of
Arabidopsis thaliana. Zinc finger proteins (ZFPs) mostly present in eukaryotic cells, and
it has vital function in plant to cop from stresses. Zinc finger proteins act as a regulatory
element of gene expression by interrelating with DNA, RNA and other regulatory
elements. The genes coding for zinc finger proteins are involved in plant stress resistance
and in hormone signal transduction, were reported in Arabidopsis thaliana (Sakamoto et
al. 2000, Ciftci-Yilmaz et al. 2007), alfalfa (Bastola et al. 1998) and rice (Mukhopadhyay
et al. 2004, Liu et al. 2007). Zinc-finger transgenic tobacco demonstrates tolerance to
dehydration stress. Zinc-finger proteins, "OSISAP1" in rice act as transcription activators
during different abiotic stresses. Transgenic tobacco, over expressing these genes confirm
tolerance to freezing temperature, water and salinity stress (Mukhopadhyay et al. 2004)
and petunia ZPT2-3, over expression confirm drought resistance (Sugano et al. 2003).
The EST (GE654100) is homologs to the Arabidopsis thaliana RNA polymerase II
transcription factor. RNA polymerase II (RNAP II) is a multi-subunit enzyme involved in
mRNA synthesis, and the C-terminal domain (CTD) of its largest subunit contains
tandemly repeated heptapeptides with a consensus sequence of Y1S2P3T4S5P6S7 (Corden
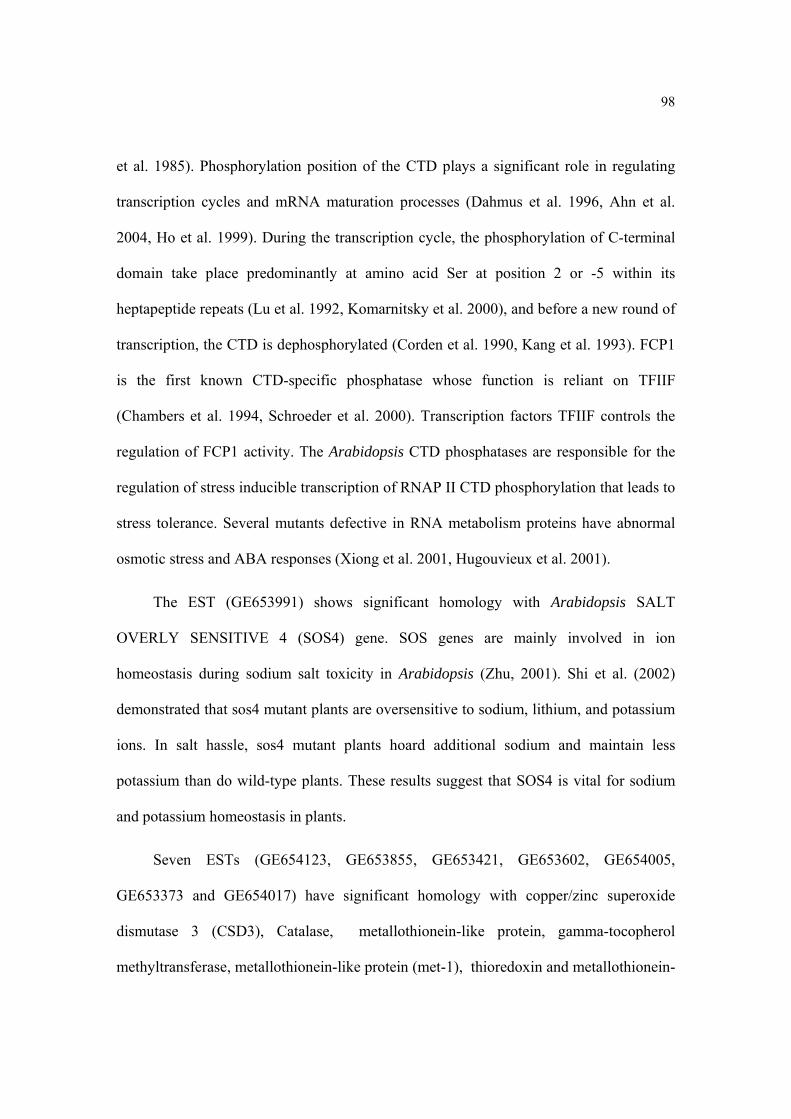
98
et al. 1985). Phosphorylation position of the CTD plays a significant role in regulating
transcription cycles and mRNA maturation processes (Dahmus et al. 1996, Ahn et al.
2004, Ho et al. 1999). During the transcription cycle, the phosphorylation of C-terminal
domain take place predominantly at amino acid Ser at position 2 or -5 within its
heptapeptide repeats (Lu et al. 1992, Komarnitsky et al. 2000), and before a new round of
transcription, the CTD is dephosphorylated (Corden et al. 1990, Kang et al. 1993). FCP1
is the first known CTD-specific phosphatase whose function is reliant on TFIIF
(Chambers et al. 1994, Schroeder et al. 2000). Transcription factors TFIIF controls the
regulation of FCP1 activity. The Arabidopsis CTD phosphatases are responsible for the
regulation of stress inducible transcription of RNAP II CTD phosphorylation that leads to
stress tolerance. Several mutants defective in RNA metabolism proteins have abnormal
osmotic stress and ABA responses (Xiong et al. 2001, Hugouvieux et al. 2001).
The EST (GE653991) shows significant homology with Arabidopsis SALT
OVERLY SENSITIVE 4 (SOS4) gene. SOS genes are mainly involved in ion
homeostasis during sodium salt toxicity in Arabidopsis (Zhu, 2001). Shi et al. (2002)
demonstrated that sos4 mutant plants are oversensitive to sodium, lithium, and potassium
ions. In salt hassle, sos4 mutant plants hoard additional sodium and maintain less
potassium than do wild-type plants. These results suggest that SOS4 is vital for sodium
and potassium homeostasis in plants.
Seven ESTs (GE654123, GE653855, GE653421, GE653602, GE654005,
GE653373 and GE654017) have significant homology with copper/zinc superoxide
dismutase 3 (CSD3), Catalase, metallothionein-like protein, gamma-tocopherol
methyltransferase, metallothionein-like protein (met-1), thioredoxin and metallothionein-
99
like protein MT2A genes respectively. The products of these genes act as antioxidant
enzymes playing an important role in conferring abiotic and biotic stress tolerance by
scavenging Reactive oxidative species (ROS). Reactive oxidative species (ROS), can
cause cell death due to their highly reactive and toxic nature by demaging cellular
proteins, lipids, carbohydrates and DNA (Mittler et al. 2004). Several abiotic stresses like
dehydration, salinity, high temperature, cold, nutrient deficiency and intense light are
responsible for increased production of ROS (Malan et al. 1990, Prasad et al. 1994,
Tsugane et al.1999, Desikan et al. 2001, Mittler, 2002). Some biotic stresses, such has
pathogen infection and wounding, also trigger an ROS burst (Chen and Schopfer, 1999,
Orozco-Cardenas and Ryan 1999, Torres et al. 2002). Superoxide dismutase (SOD) is the
first enzyme in the enzymatic antioxidative pathway. Some abiotic stresses like,
dehydration, salinity, freezing and heat disturbing the oxidation metabolism in plant cells
by the inhibition of superoxide dismutase (SOD) and other endogenous active oxygen
species eliminators. Production of reactive oxygen species such as O-2, OH-2, OH-1, and
H2O2 is hurtful to proteins, membranes lipid, DNA and other cell components. As a
result, several physiological and biochemical processes and normal growth and
development of plants are seriously affected (Du et al. 2001, Pastori et al. 2000,
Prasad,1997, Shen et al. 1995, Zhu and Scandalios, 1994). Many plants have shown
improved abiotic stress tolerance by transforming with superoxide dismutase (SOD)
gene. The transgenic clover plants, transformed with superoxide dismutase, demonstrated
a considerable increase in growth vitality and yield under dehydration (Bowler et al.
1994). The resistance to ROS, in the water stressed condition, also shown to considerably
enhance within transgenic tobacco, over expressing a copper/zinc superoxide dismutase
100
gene (Cu/ZnSOD) (Simontacchi et al. 1993). Zhang, et al. (2008) found that CuZnSOD
gene in wheat (Triticum aestivum L.) was significantly stimulated under the dehydration,
salinity, freezing and heat conditions, suggesting that SOD could be a useful target gene
in improvement the plant injury which caused by adverse environmental and other
oxidative stresses. The hydrogen per oxide and Methyl viologen (MV) treatment induced
enhance in oxidation in Arabidopsis. In the presence of MV, the expression intensities for
catalase 3, ascorbate peroxidase and superoxide dismutase also increased (Xiong et al.
2007).
Metallothioneins (MTs) have been reported in animals, plants, fungi, and
cyanobacteria. All MTs belong to plants are placed in Class II (Robinson et al. 1993,
Palmiter 1998, Cobbett and Goldsbrough, 2002). In animals, MTs involved in regulation
of metal homeostasis and the response to ROS (Mattie and Freedman, 2004, Zatta et al.
2005, Stankovic et al. 2007). Similarly fungal MTs are also engaged in the response to
metal toxicity (Lanfranco et al. 2002, Tucker et al. 2004). In recent years, growing
numbers of reports have showed that plant Metallothioneins may have vital roles as they
perform in animals and fungi (Adams et al. 2002, Cobbett and Goldsbrough, 2002,
Chiang et al. 2006, Zhigang et al. 2006). The Arabidopsis MTs show significant utility in
sustenance the homoeostasis of vital metals, detoxification of toxic metals, and protection
against ROS stress (Robinson et al. 1996, Murphy et al.1997, Garcia-Hernandez et al.
1998, Miller et al. 1999, Kiddle et al. 2003, Lee et al. 2004). Xue et al. (2008)
demonstrated that the mRNA level of GhMT3a in cotton (G. hirsutum) seedlings was
increased by many environmental stresses like, salt, drought, and low temperature.
Transgenic tobacco and yeast that over expressing cotton MT3a, showed more tolerance
101
to abiotic stresses. It shows GhMT3a function in response to environmental stresses by
regulating the ROS balance as a ROS scavenger in plants.
Vitamin E is also involved in the ROS scavenging (Dat et al. 2000, Alscher and
Heath, 2002). Eight (8) tocochromanols are commonly considered as vitamin E, namely
tocopherols and tocotrienols. The, Alpha-tocopherol has been engaged to take part in the
removal of ROS along with the glutathione and ascorbate (Foyer and Noctor, 2003).
Based on inhibitor studies it has been shown that tocopherol acts as singlet oxygen
scavenger in PSII of Chlamydomonas reinhardtii (Trebst et al. 2002, Kruk et al. 2005).
Abbasi et al. (2007) demonstrated that the knockdown of gamma-tocopherol
methyltransferase in transgenic plants showed increased sensitivity under various
stresses.
Two ESTs (GE654075 and GE653776) show significant homology with
Arabidopsis thaliana putative betaine aldehyde dehydrogenase involves in the production
of glycine betaine and sorbitol related enzyme respectively. Plants have the ability to
tolerate stress by a mechanism called as osmotic regulation. In this process, cellular
osmotic potential is decreased by the addition of solutes. Many metabolic pathways are
involved in the production of these osmo-regulators under the various stresses. The
increased solute concentration in the cytoplasm, helped in the maintenance of leaf turgor.
These solutes are termed as osmoprotectants like, proline, sucrose, sorbitol, raffinose, and
glycine betaine. These osmoprotectants accumulate in the cells at elevated concentration
during osmotic stress without affecting the normal cellular metabolism (Chen and Murata
2000) and may have a basic function in maintaining turgor, alleviating proteins and cell
structures (Yancey et al. 1982), and scavenging ROS (Chen and Murata 2000). The
102
Genes related to sucrose, raffinose, and glycine betaine were also induced by low
temperature and water stress in barely (Tommasini et al. 2008).
The ESTs (GE653633 and GE653474) are homologous to Arabidopsis thaliana
DNAJ and heat shock protein 70. Heat-shock proteins (Hsps) showed increased
expression under various stresses such as, salinity, extreme temperature and dehydration.
These proteins have been demonstrated to be engaged in cellular protection during the
stress (Vierling and Kimpel 1992, Boston et al. 1996, Ingram and Bartels 1996, Waters et
al. 1996, Thomashow 1998). Heat-shock proteins (Hsps) are produced when abiotic
stresses perturb an organism’s whole physiological system to such an extent that results
in misfolding of proteins. These Hsps function as molecular chaperones, playing
important role in protein synthesis, maturation, degradation, and targeting in a broad
array of normal cellular processes. Furthermore, molecular chaperones are responsible for
stabilization of proteins and membranes, as well as they help in refolding of protein under
stress conditions (Vierling 1991, Hendrick and Hartl 1993, Boston et al. 1996, Hartl
1996, Waters et al. 1996, Torok et al. 2001, Hartl and Hayer-Hartl, 2002). Increase in
level of Hsp in different plant species under abiotic stress conditions has been studied
extensively by proteomics and functional genomics (Sun et al. 2002, Wang and Luthe
2003). From various studies it has been demonstrated that plant Hsps are not only
produced in response to high temperature but also under oxidative, salinity, drought, and
at freezing temperature stress (Almoguera et al. 1993, Alamillo et al. 1995, Sabehat et al.
1998, Hamilton and Heckathorn, 2001). Gazanchian et al. (2007) identified two small
heat shock proteins (sHsps) that were expressed in tall wheat grass (Elymus elongatum)
shoots after progressive water stress. These proteins have shown engagement in
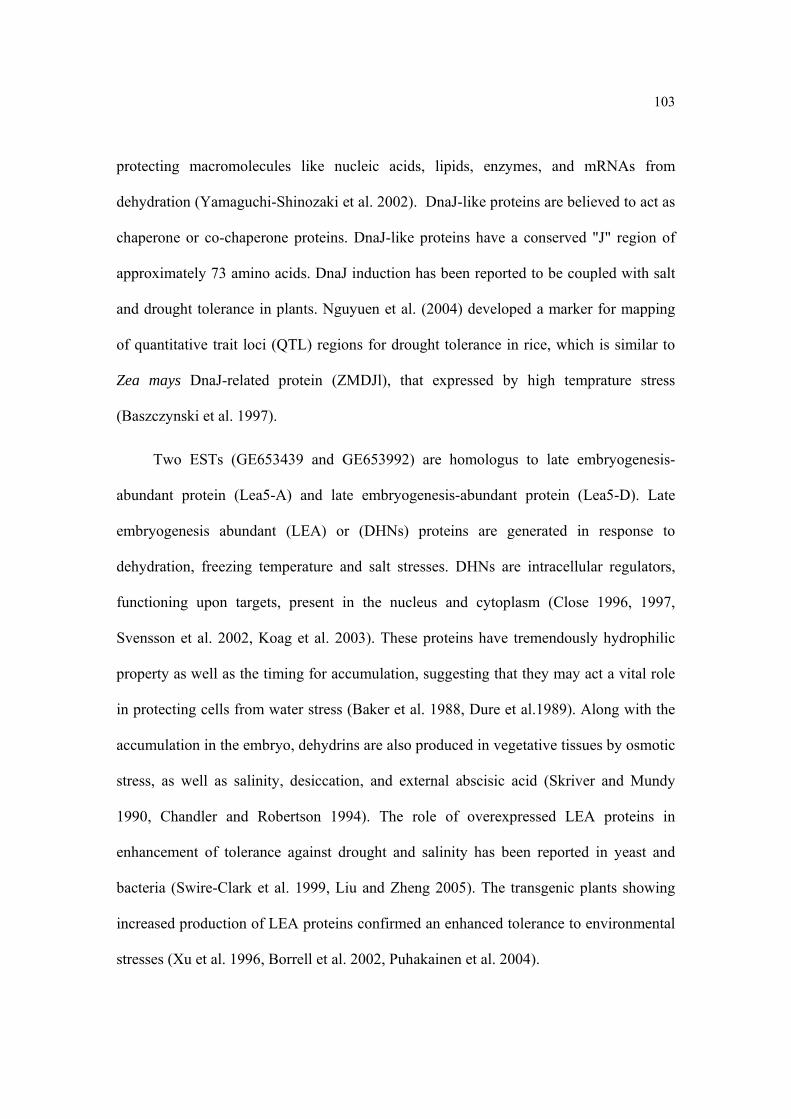
103
protecting macromolecules like nucleic acids, lipids, enzymes, and mRNAs from
dehydration (Yamaguchi-Shinozaki et al. 2002). DnaJ-like proteins are believed to act as
chaperone or co-chaperone proteins. DnaJ-like proteins have a conserved "J" region of
approximately 73 amino acids. DnaJ induction has been reported to be coupled with salt
and drought tolerance in plants. Nguyuen et al. (2004) developed a marker for mapping
of quantitative trait loci (QTL) regions for drought tolerance in rice, which is similar to
Zea mays DnaJ-related protein (ZMDJl), that expressed by high temprature stress
(Baszczynski et al. 1997).
Two ESTs (GE653439 and GE653992) are homologus to late embryogenesis-
abundant protein (Lea5-A) and late embryogenesis-abundant protein (Lea5-D). Late
embryogenesis abundant (LEA) or (DHNs) proteins are generated in response to
dehydration, freezing temperature and salt stresses. DHNs are intracellular regulators,
functioning upon targets, present in the nucleus and cytoplasm (Close 1996, 1997,
Svensson et al. 2002, Koag et al. 2003). These proteins have tremendously hydrophilic
property as well as the timing for accumulation, suggesting that they may act a vital role
in protecting cells from water stress (Baker et al. 1988, Dure et al.1989). Along with the
accumulation in the embryo, dehydrins are also produced in vegetative tissues by osmotic
stress, as well as salinity, desiccation, and external abscisic acid (Skriver and Mundy
1990, Chandler and Robertson 1994). The role of overexpressed LEA proteins in
enhancement of tolerance against drought and salinity has been reported in yeast and
bacteria (Swire-Clark et al. 1999, Liu and Zheng 2005). The transgenic plants showing
increased production of LEA proteins confirmed an enhanced tolerance to environmental
stresses (Xu et al. 1996, Borrell et al. 2002, Puhakainen et al. 2004).

104
Two ESTs (GE653432 and GE654065) share significant homology with aquaporine
PIP1 protein and Na+/H+ antiporter respectively. Aquaporins are transmembrane channel
proteins that are selectively permeable to water (Froger et al. 1998). Aquaporins are
present in the plasma membranes of nearly all organisms from bacteria to plants and
animals. These special proteins consist of four units (monomers), forming a tetramer that
are formed from six transmembrane domains, with two highly conserved amino acid
sequences like, asparagine, proline, and alanine (NPA) that mirror one another in the
center of the channel (deGroot et al. 2003, Heymann and Engel, 1999, Weig et al. 1997).
Cell membrane intrinsic proteins (PIPs), a class of aquaporine are found fixed within the
cell membranes of most cell types and are involved in water movement in and out of the
cell (Chaumontet al. 2000). Their expressions depend on the environmental stresses, pH,
divalent cations, and even the existence of other aquaporins (Aroca et al. 2005). The
regulation of aquaporins can be controlled at transcription, translationand and post-
translation levels (Aroca et al. 2005, Vera-Estrella et al. 2004). The plant aquaporins,
PIPs, TIPs, and NIPs are regulated at post-translational level through phosphorylation at
single or multiple sites (Johansson et al. 1998, Maurel et al. 1995, Lee et al. 1995). The
induced phosphorylation of aquaporins by biotic and abiotic stresses; like drought,
salinity, high light, pathogens and various harmones in plants suggested their role in
stresses (Aroca et al. 2005).
The ESTs (GE654013 and GE653653) are homologus to zeaxanthin epoxidase
(ZE) and temperature-induced lipocalin (TIL). Plant lipocalins can be categorized into
two classes, temperature induced lipocalins (TILs) and chloroplastic lipocalins (CHLs).
In addition, violaxanthin de-epoxidases (VDEs) and zeaxanthine epoxidases (ZEPs) are
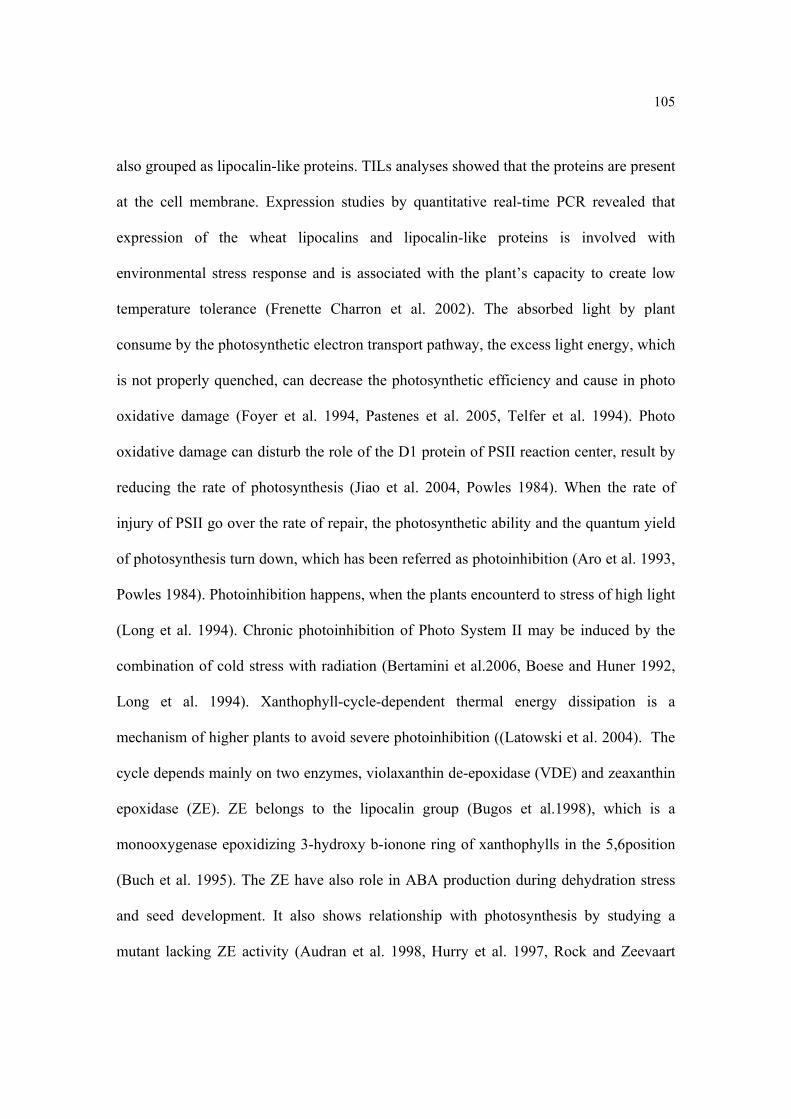
105
also grouped as lipocalin-like proteins. TILs analyses showed that the proteins are present
at the cell membrane. Expression studies by quantitative real-time PCR revealed that
expression of the wheat lipocalins and lipocalin-like proteins is involved with
environmental stress response and is associated with the plant’s capacity to create low
temperature tolerance (Frenette Charron et al. 2002). The absorbed light by plant
consume by the photosynthetic electron transport pathway, the excess light energy, which
is not properly quenched, can decrease the photosynthetic efficiency and cause in photo
oxidative damage (Foyer et al. 1994, Pastenes et al. 2005, Telfer et al. 1994). Photo
oxidative damage can disturb the role of the D1 protein of PSII reaction center, result by
reducing the rate of photosynthesis (Jiao et al. 2004, Powles 1984). When the rate of
injury of PSII go over the rate of repair, the photosynthetic ability and the quantum yield
of photosynthesis turn down, which has been referred as photoinhibition (Aro et al. 1993,
Powles 1984). Photoinhibition happens, when the plants encounterd to stress of high light
(Long et al. 1994). Chronic photoinhibition of Photo System II may be induced by the
combination of cold stress with radiation (Bertamini et al.2006, Boese and Huner 1992,
Long et al. 1994). Xanthophyll-cycle-dependent thermal energy dissipation is a
mechanism of higher plants to avoid severe photoinhibition ((Latowski et al. 2004). The
cycle depends mainly on two enzymes, violaxanthin de-epoxidase (VDE) and zeaxanthin
epoxidase (ZE). ZE belongs to the lipocalin group (Bugos et al.1998), which is a
monooxygenase epoxidizing 3-hydroxy b-ionone ring of xanthophylls in the 5,6position
(Buch et al. 1995). The ZE have also role in ABA production during dehydration stress
and seed development. It also shows relationship with photosynthesis by studying a
mutant lacking ZE activity (Audran et al. 1998, Hurry et al. 1997, Rock and Zeevaart
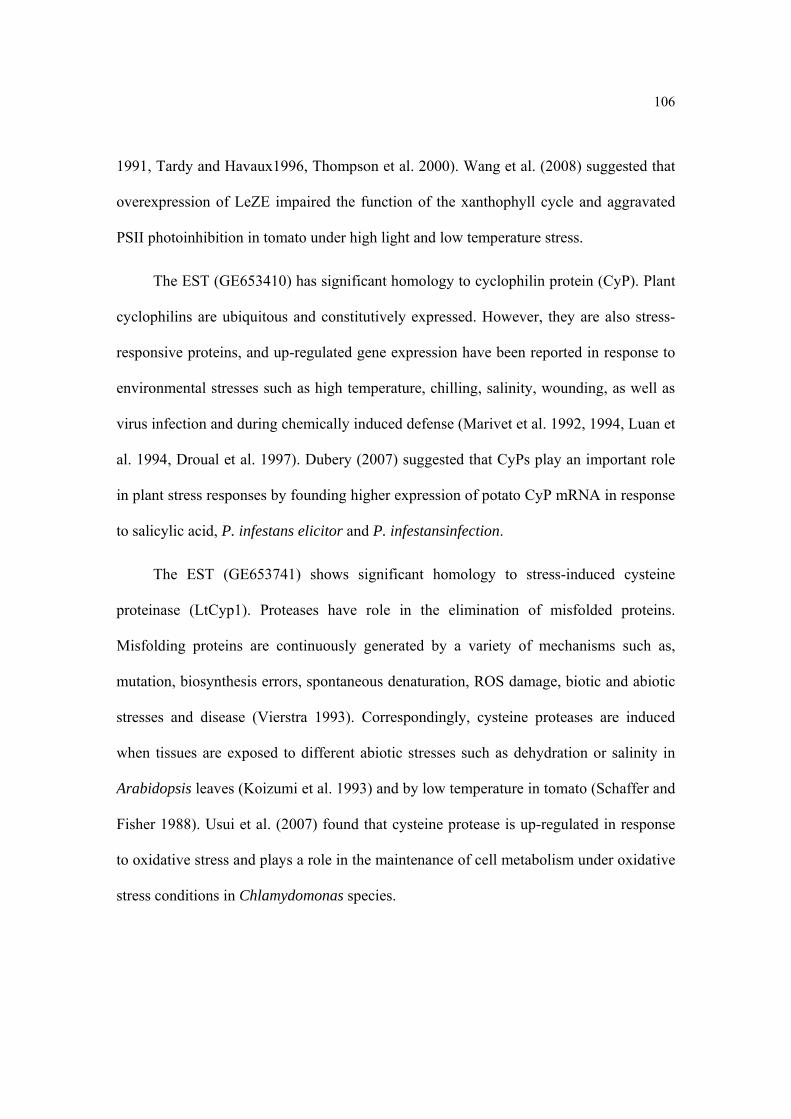
106
1991, Tardy and Havaux1996, Thompson et al. 2000). Wang et al. (2008) suggested that
overexpression of LeZE impaired the function of the xanthophyll cycle and aggravated
PSII photoinhibition in tomato under high light and low temperature stress.
The EST (GE653410) has significant homology to cyclophilin protein (CyP). Plant
cyclophilins are ubiquitous and constitutively expressed. However, they are also stress-
responsive proteins, and up-regulated gene expression have been reported in response to
environmental stresses such as high temperature, chilling, salinity, wounding, as well as
virus infection and during chemically induced defense (Marivet et al. 1992, 1994, Luan et
al. 1994, Droual et al. 1997). Dubery (2007) suggested that CyPs play an important role
in plant stress responses by founding higher expression of potato CyP mRNA in response
to salicylic acid, P. infestans elicitor and P. infestansinfection.
The EST (GE653741) shows significant homology to stress-induced cysteine
proteinase (LtCyp1). Proteases have role in the elimination of misfolded proteins.
Misfolding proteins are continuously generated by a variety of mechanisms such as,
mutation, biosynthesis errors, spontaneous denaturation, ROS damage, biotic and abiotic
stresses and disease (Vierstra 1993). Correspondingly, cysteine proteases are induced
when tissues are exposed to different abiotic stresses such as dehydration or salinity in
Arabidopsis leaves (Koizumi et al. 1993) and by low temperature in tomato (Schaffer and
Fisher 1988). Usui et al. (2007) found that cysteine protease is up-regulated in response
to oxidative stress and plays a role in the maintenance of cell metabolism under oxidative
stress conditions in Chlamydomonas species.
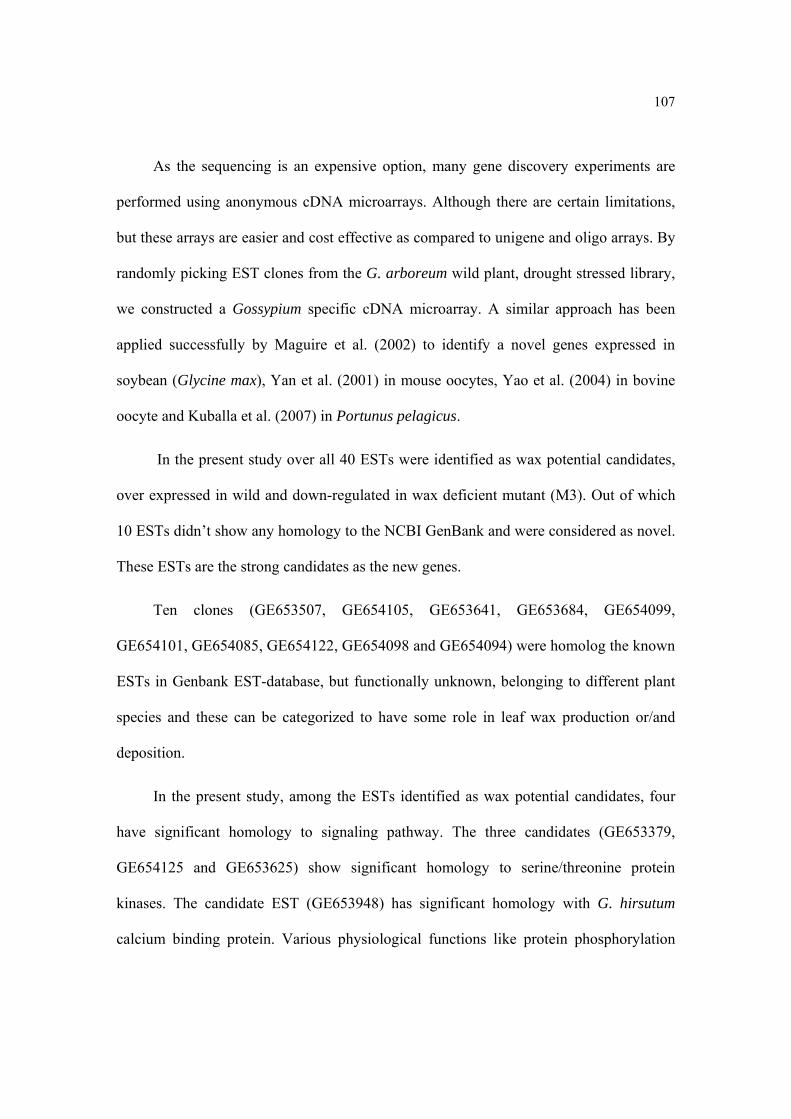
107
As the sequencing is an expensive option, many gene discovery experiments are
performed using anonymous cDNA microarrays. Although there are certain limitations,
but these arrays are easier and cost effective as compared to unigene and oligo arrays. By
randomly picking EST clones from the G. arboreum wild plant, drought stressed library,
we constructed a Gossypium specific cDNA microarray. A similar approach has been
applied successfully by Maguire et al. (2002) to identify a novel genes expressed in
soybean (Glycine max), Yan et al. (2001) in mouse oocytes, Yao et al. (2004) in bovine
oocyte and Kuballa et al. (2007) in Portunus pelagicus.
In the present study over all 40 ESTs were identified as wax potential candidates,
over expressed in wild and down-regulated in wax deficient mutant (M3). Out of which
10 ESTs didn’t show any homology to the NCBI GenBank and were considered as novel.
These ESTs are the strong candidates as the new genes.
Ten clones (GE653507, GE654105, GE653641, GE653684, GE654099,
GE654101, GE654085, GE654122, GE654098 and GE654094) were homolog the known
ESTs in Genbank EST-database, but functionally unknown, belonging to different plant
species and these can be categorized to have some role in leaf wax production or/and
deposition.
In the present study, among the ESTs identified as wax potential candidates, four
have significant homology to signaling pathway. The three candidates (GE653379,
GE654125 and GE653625) show significant homology to serine/threonine protein
kinases. The candidate EST (GE653948) has significant homology with G. hirsutum
calcium binding protein. Various physiological functions like protein phosphorylation
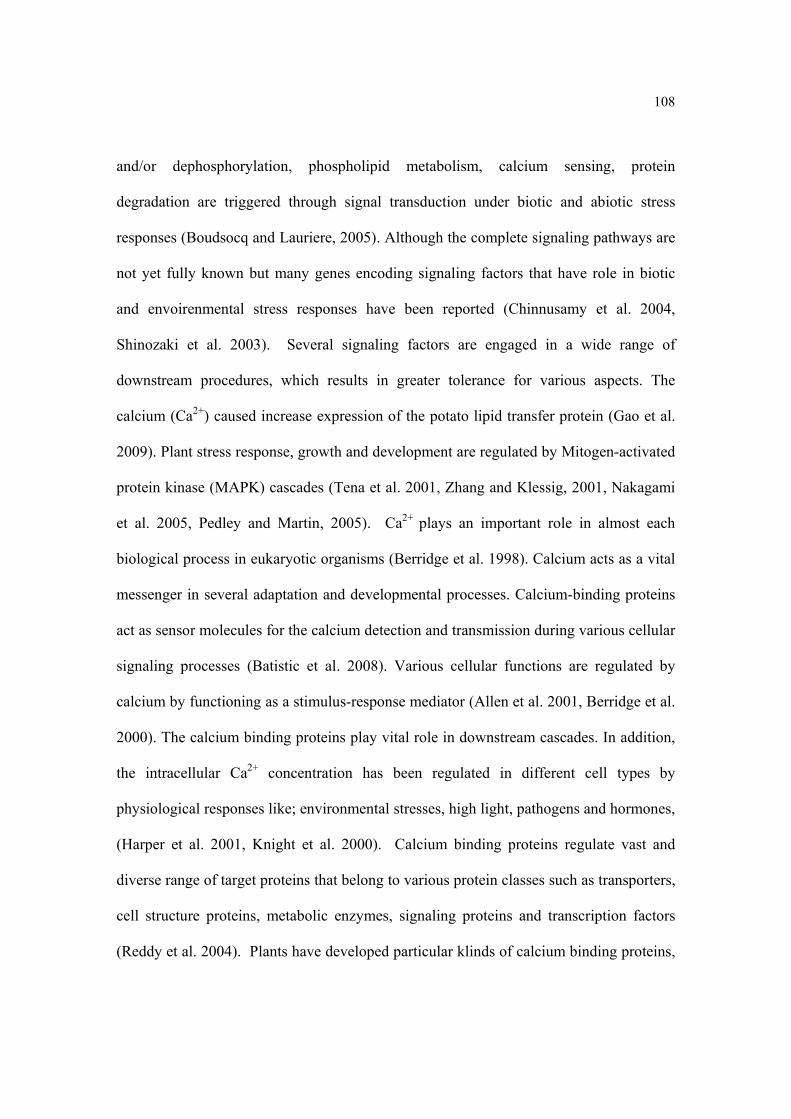
108
and/or dephosphorylation, phospholipid metabolism, calcium sensing, protein
degradation are triggered through signal transduction under biotic and abiotic stress
responses (Boudsocq and Lauriere, 2005). Although the complete signaling pathways are
not yet fully known but many genes encoding signaling factors that have role in biotic
and envoirenmental stress responses have been reported (Chinnusamy et al. 2004,
Shinozaki et al. 2003). Several signaling factors are engaged in a wide range of
downstream procedures, which results in greater tolerance for various aspects. The
calcium (Ca2+) caused increase expression of the potato lipid transfer protein (Gao et al.
2009). Plant stress response, growth and development are regulated by Mitogen-activated
protein kinase (MAPK) cascades (Tena et al. 2001, Zhang and Klessig, 2001, Nakagami
et al. 2005, Pedley and Martin, 2005). Ca2+ plays an important role in almost each
biological process in eukaryotic organisms (Berridge et al. 1998). Calcium acts as a vital
messenger in several adaptation and developmental processes. Calcium-binding proteins
act as sensor molecules for the calcium detection and transmission during various cellular
signaling processes (Batistic et al. 2008). Various cellular functions are regulated by
calcium by functioning as a stimulus-response mediator (Allen et al. 2001, Berridge et al.
2000). The calcium binding proteins play vital role in downstream cascades. In addition,
the intracellular Ca2+ concentration has been regulated in different cell types by
physiological responses like; environmental stresses, high light, pathogens and hormones,
(Harper et al. 2001, Knight et al. 2000). Calcium binding proteins regulate vast and
diverse range of target proteins that belong to various protein classes such as transporters,
cell structure proteins, metabolic enzymes, signaling proteins and transcription factors
(Reddy et al. 2004). Plants have developed particular klinds of calcium binding proteins,
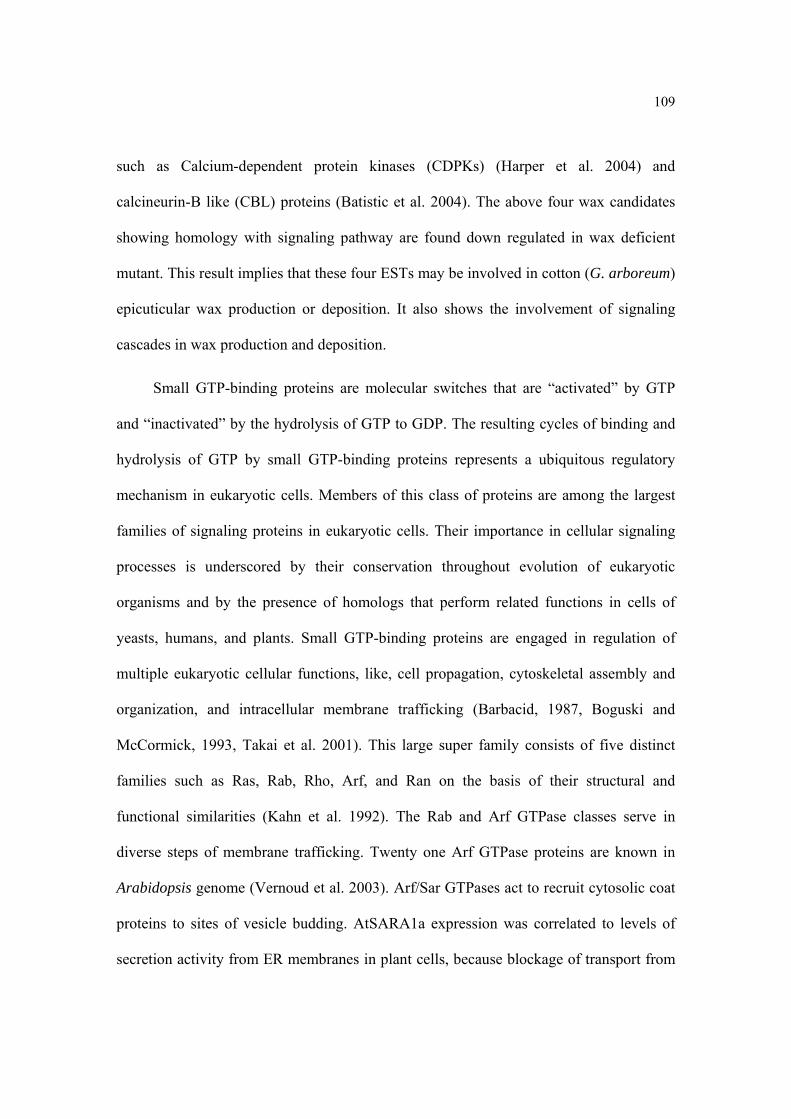
109
such as Calcium-dependent protein kinases (CDPKs) (Harper et al. 2004) and
calcineurin-B like (CBL) proteins (Batistic et al. 2004). The above four wax candidates
showing homology with signaling pathway are found down regulated in wax deficient
mutant. This result implies that these four ESTs may be involved in cotton (G. arboreum)
epicuticular wax production or deposition. It also shows the involvement of signaling
cascades in wax production and deposition.
Small GTP-binding proteins are molecular switches that are “activated” by GTP
and “inactivated” by the hydrolysis of GTP to GDP. The resulting cycles of binding and
hydrolysis of GTP by small GTP-binding proteins represents a ubiquitous regulatory
mechanism in eukaryotic cells. Members of this class of proteins are among the largest
families of signaling proteins in eukaryotic cells. Their importance in cellular signaling
processes is underscored by their conservation throughout evolution of eukaryotic
organisms and by the presence of homologs that perform related functions in cells of
yeasts, humans, and plants. Small GTP-binding proteins are engaged in regulation of
multiple eukaryotic cellular functions, like, cell propagation, cytoskeletal assembly and
organization, and intracellular membrane trafficking (Barbacid, 1987, Boguski and
McCormick, 1993, Takai et al. 2001). This large super family consists of five distinct
families such as Ras, Rab, Rho, Arf, and Ran on the basis of their structural and
functional similarities (Kahn et al. 1992). The Rab and Arf GTPase classes serve in
diverse steps of membrane trafficking. Twenty one Arf GTPase proteins are known in
Arabidopsis genome (Vernoud et al. 2003). Arf/Sar GTPases act to recruit cytosolic coat
proteins to sites of vesicle budding. AtSARA1a expression was correlated to levels of
secretion activity from ER membranes in plant cells, because blockage of transport from
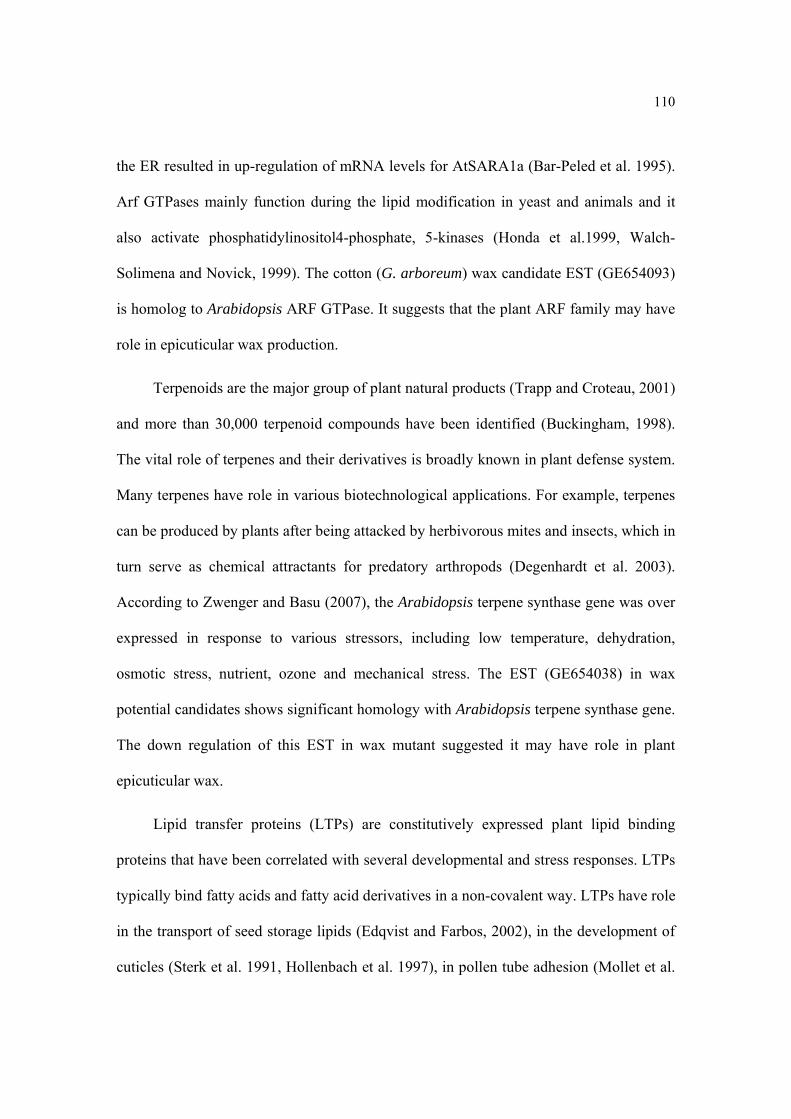
110
the ER resulted in up-regulation of mRNA levels for AtSARA1a (Bar-Peled et al. 1995).
Arf GTPases mainly function during the lipid modification in yeast and animals and it
also activate phosphatidylinositol4-phosphate, 5-kinases (Honda et al.1999, Walch-
Solimena and Novick, 1999). The cotton (G. arboreum) wax candidate EST (GE654093)
is homolog to Arabidopsis ARF GTPase. It suggests that the plant ARF family may have
role in epicuticular wax production.
Terpenoids are the major group of plant natural products (Trapp and Croteau, 2001)
and more than 30,000 terpenoid compounds have been identified (Buckingham, 1998).
The vital role of terpenes and their derivatives is broadly known in plant defense system.
Many terpenes have role in various biotechnological applications. For example, terpenes
can be produced by plants after being attacked by herbivorous mites and insects, which in
turn serve as chemical attractants for predatory arthropods (Degenhardt et al. 2003).
According to Zwenger and Basu (2007), the Arabidopsis terpene synthase gene was over
expressed in response to various stressors, including low temperature, dehydration,
osmotic stress, nutrient, ozone and mechanical stress. The EST (GE654038) in wax
potential candidates shows significant homology with Arabidopsis terpene synthase gene.
The down regulation of this EST in wax mutant suggested it may have role in plant
epicuticular wax.
Lipid transfer proteins (LTPs) are constitutively expressed plant lipid binding
proteins that have been correlated with several developmental and stress responses. LTPs
typically bind fatty acids and fatty acid derivatives in a non-covalent way. LTPs have role
in the transport of seed storage lipids (Edqvist and Farbos, 2002), in the development of
cuticles (Sterk et al. 1991, Hollenbach et al. 1997), in pollen tube adhesion (Mollet et al.
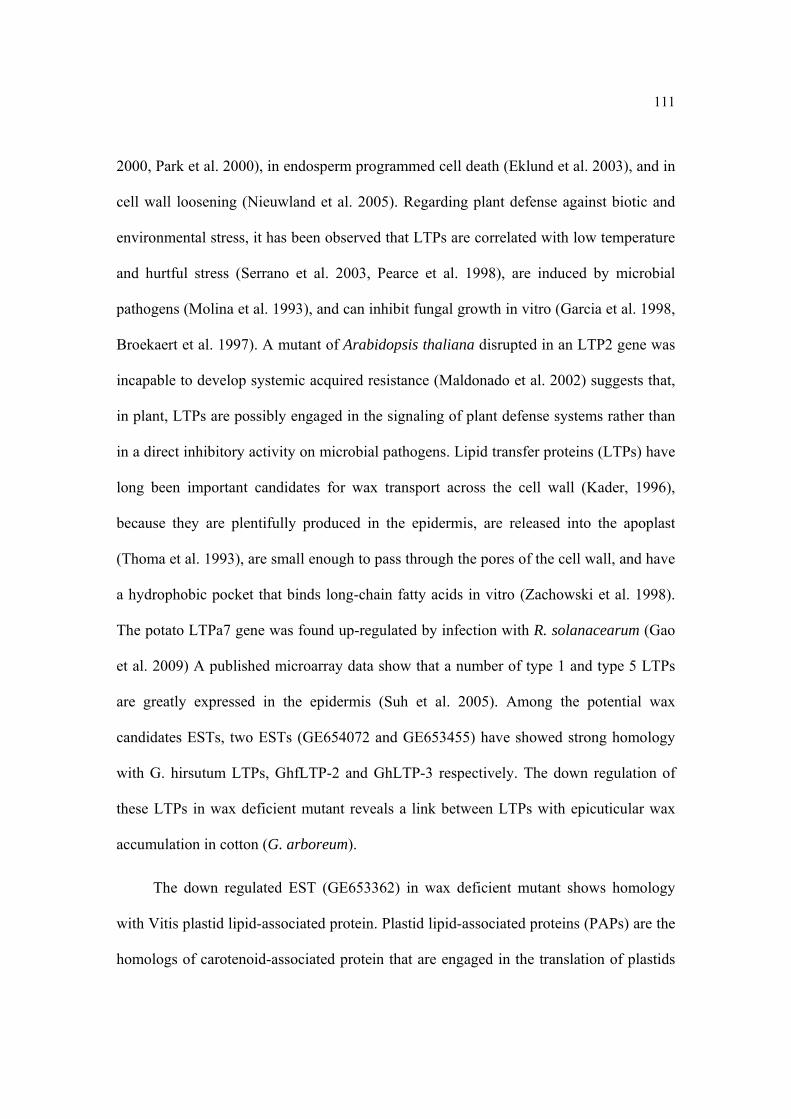
111
2000, Park et al. 2000), in endosperm programmed cell death (Eklund et al. 2003), and in
cell wall loosening (Nieuwland et al. 2005). Regarding plant defense against biotic and
environmental stress, it has been observed that LTPs are correlated with low temperature
and hurtful stress (Serrano et al. 2003, Pearce et al. 1998), are induced by microbial
pathogens (Molina et al. 1993), and can inhibit fungal growth in vitro (Garcia et al. 1998,
Broekaert et al. 1997). A mutant of Arabidopsis thaliana disrupted in an LTP2 gene was
incapable to develop systemic acquired resistance (Maldonado et al. 2002) suggests that,
in plant, LTPs are possibly engaged in the signaling of plant defense systems rather than
in a direct inhibitory activity on microbial pathogens. Lipid transfer proteins (LTPs) have
long been important candidates for wax transport across the cell wall (Kader, 1996),
because they are plentifully produced in the epidermis, are released into the apoplast
(Thoma et al. 1993), are small enough to pass through the pores of the cell wall, and have
a hydrophobic pocket that binds long-chain fatty acids in vitro (Zachowski et al. 1998).
The potato LTPa7 gene was found up-regulated by infection with R. solanacearum (Gao
et al. 2009) A published microarray data show that a number of type 1 and type 5 LTPs
are greatly expressed in the epidermis (Suh et al. 2005). Among the potential wax
candidates ESTs, two ESTs (GE654072 and GE653455) have showed strong homology
with G. hirsutum LTPs, GhfLTP-2 and GhLTP-3 respectively. The down regulation of
these LTPs in wax deficient mutant reveals a link between LTPs with epicuticular wax
accumulation in cotton (G. arboreum).
The down regulated EST (GE653362) in wax deficient mutant shows homology
with Vitis plastid lipid-associated protein. Plastid lipid-associated proteins (PAPs) are the
homologs of carotenoid-associated protein that are engaged in the translation of plastids
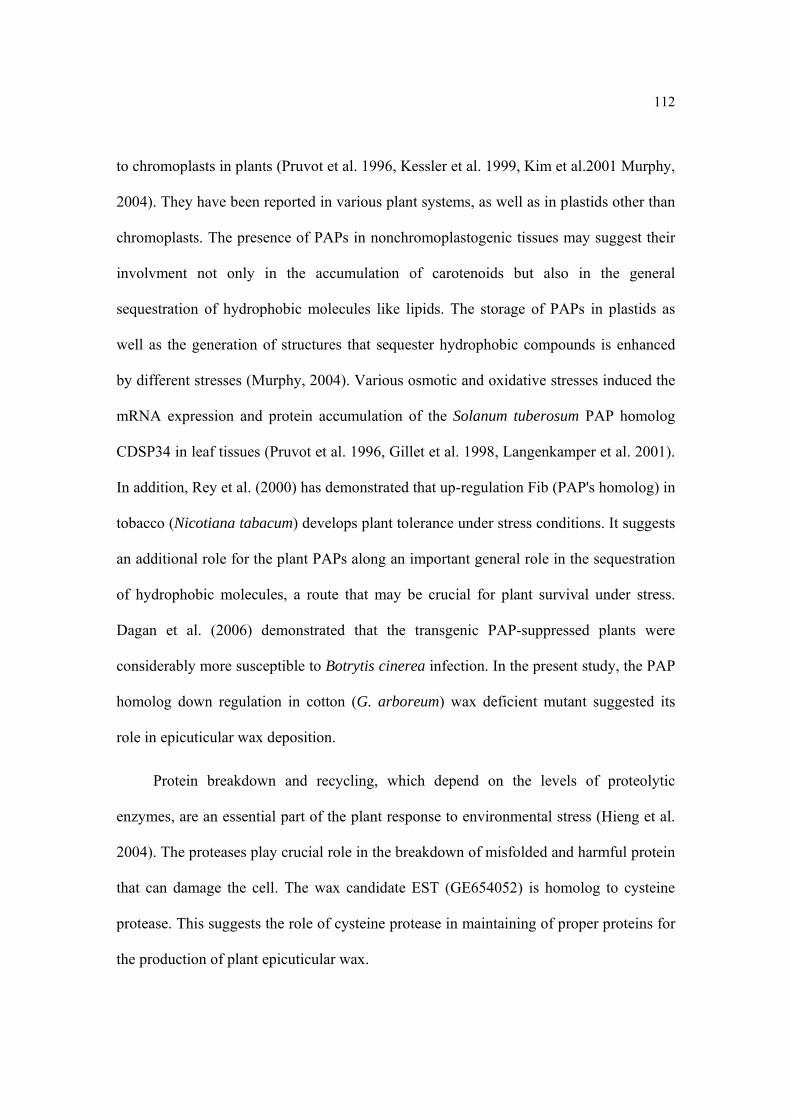
112
to chromoplasts in plants (Pruvot et al. 1996, Kessler et al. 1999, Kim et al.2001 Murphy,
2004). They have been reported in various plant systems, as well as in plastids other than
chromoplasts. The presence of PAPs in nonchromoplastogenic tissues may suggest their
involvment not only in the accumulation of carotenoids but also in the general
sequestration of hydrophobic molecules like lipids. The storage of PAPs in plastids as
well as the generation of structures that sequester hydrophobic compounds is enhanced
by different stresses (Murphy, 2004). Various osmotic and oxidative stresses induced the
mRNA expression and protein accumulation of the Solanum tuberosum PAP homolog
CDSP34 in leaf tissues (Pruvot et al. 1996, Gillet et al. 1998, Langenkamper et al. 2001).
In addition, Rey et al. (2000) has demonstrated that up-regulation Fib (PAP's homolog) in
tobacco (Nicotiana tabacum) develops plant tolerance under stress conditions. It suggests
an additional role for the plant PAPs along an important general role in the sequestration
of hydrophobic molecules, a route that may be crucial for plant survival under stress.
Dagan et al. (2006) demonstrated that the transgenic PAP-suppressed plants were
considerably more susceptible to Botrytis cinerea infection. In the present study, the PAP
homolog down regulation in cotton (G. arboreum) wax deficient mutant suggested its
role in epicuticular wax deposition.
Protein breakdown and recycling, which depend on the levels of proteolytic
enzymes, are an essential part of the plant response to environmental stress (Hieng et al.
2004). The proteases play crucial role in the breakdown of misfolded and harmful protein
that can damage the cell. The wax candidate EST (GE654052) is homolog to cysteine
protease. This suggests the role of cysteine protease in maintaining of proper proteins for
the production of plant epicuticular wax.
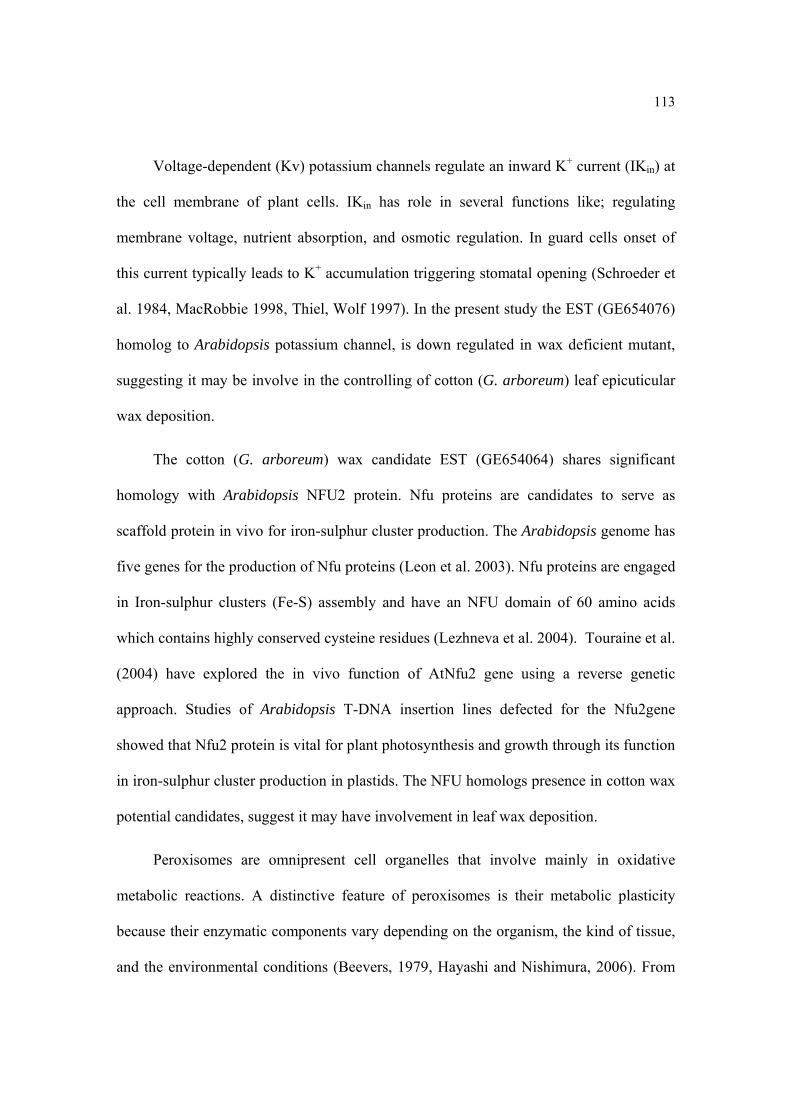
113
Voltage-dependent (Kv) potassium channels regulate an inward K+ current (IKin) at
the cell membrane of plant cells. IKin has role in several functions like; regulating
membrane voltage, nutrient absorption, and osmotic regulation. In guard cells onset of
this current typically leads to K+ accumulation triggering stomatal opening (Schroeder et
al. 1984, MacRobbie 1998, Thiel, Wolf 1997). In the present study the EST (GE654076)
homolog to Arabidopsis potassium channel, is down regulated in wax deficient mutant,
suggesting it may be involve in the controlling of cotton (G. arboreum) leaf epicuticular
wax deposition.
The cotton (G. arboreum) wax candidate EST (GE654064) shares significant
homology with Arabidopsis NFU2 protein. Nfu proteins are candidates to serve as
scaffold protein in vivo for iron-sulphur cluster production. The Arabidopsis genome has
five genes for the production of Nfu proteins (Leon et al. 2003). Nfu proteins are engaged
in Iron-sulphur clusters (Fe-S) assembly and have an NFU domain of 60 amino acids
which contains highly conserved cysteine residues (Lezhneva et al. 2004). Touraine et al.
(2004) have explored the in vivo function of AtNfu2 gene using a reverse genetic
approach. Studies of Arabidopsis T-DNA insertion lines defected for the Nfu2gene
showed that Nfu2 protein is vital for plant photosynthesis and growth through its function
in iron-sulphur cluster production in plastids. The NFU homologs presence in cotton wax
potential candidates, suggest it may have involvement in leaf wax deposition.
Peroxisomes are omnipresent cell organelles that involve mainly in oxidative
metabolic reactions. A distinctive feature of peroxisomes is their metabolic plasticity
because their enzymatic components vary depending on the organism, the kind of tissue,
and the environmental conditions (Beevers, 1979, Hayashi and Nishimura, 2006). From
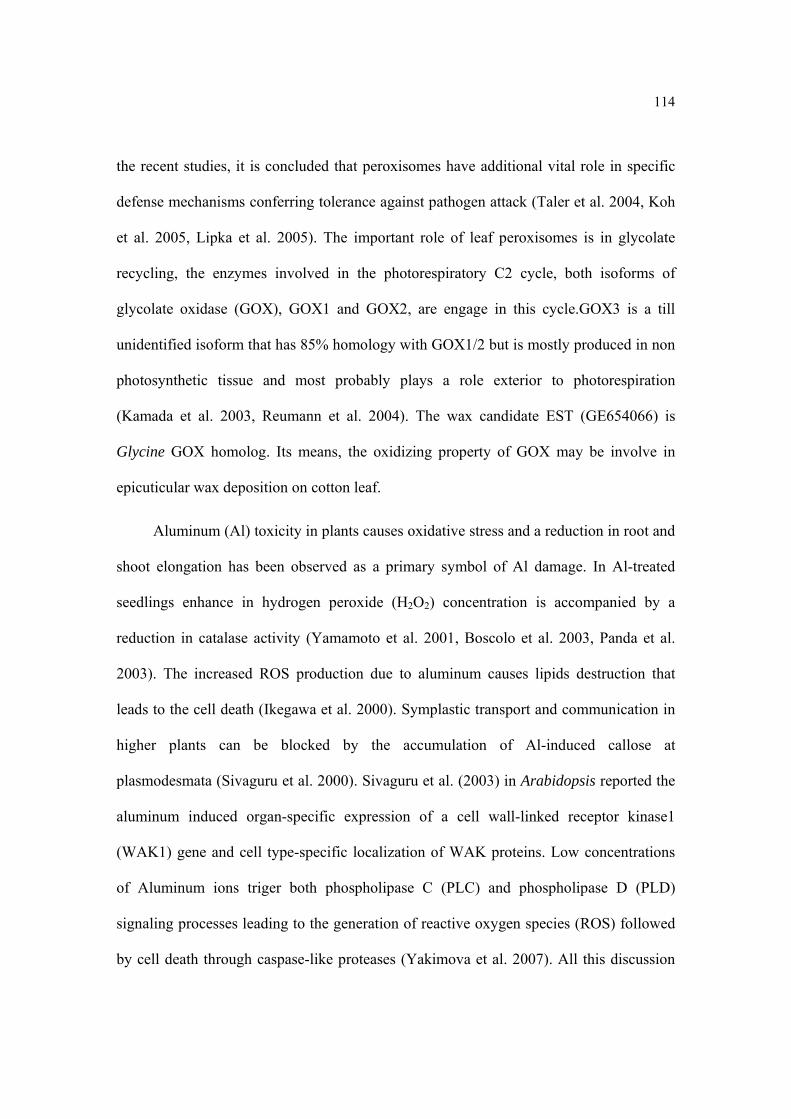
114
the recent studies, it is concluded that peroxisomes have additional vital role in specific
defense mechanisms conferring tolerance against pathogen attack (Taler et al. 2004, Koh
et al. 2005, Lipka et al. 2005). The important role of leaf peroxisomes is in glycolate
recycling, the enzymes involved in the photorespiratory C2 cycle, both isoforms of
glycolate oxidase (GOX), GOX1 and GOX2, are engage in this cycle.GOX3 is a till
unidentified isoform that has 85% homology with GOX1/2 but is mostly produced in non
photosynthetic tissue and most probably plays a role exterior to photorespiration
(Kamada et al. 2003, Reumann et al. 2004). The wax candidate EST (GE654066) is
Glycine GOX homolog. Its means, the oxidizing property of GOX may be involve in
epicuticular wax deposition on cotton leaf.
Aluminum (Al) toxicity in plants causes oxidative stress and a reduction in root and
shoot elongation has been observed as a primary symbol of Al damage. In Al-treated
seedlings enhance in hydrogen peroxide (H2O2) concentration is accompanied by a
reduction in catalase activity (Yamamoto et al. 2001, Boscolo et al. 2003, Panda et al.
2003). The increased ROS production due to aluminum causes lipids destruction that
leads to the cell death (Ikegawa et al. 2000). Symplastic transport and communication in
higher plants can be blocked by the accumulation of Al-induced callose at
plasmodesmata (Sivaguru et al. 2000). Sivaguru et al. (2003) in Arabidopsis reported the
aluminum induced organ-specific expression of a cell wall-linked receptor kinase1
(WAK1) gene and cell type-specific localization of WAK proteins. Low concentrations
of Aluminum ions triger both phospholipase C (PLC) and phospholipase D (PLD)
signaling processes leading to the generation of reactive oxygen species (ROS) followed
by cell death through caspase-like proteases (Yakimova et al. 2007). All this discussion

115
reveals that versatile genes induction caused by Aluminum stress. In the present study the
wax candidate EST (GE654115), a homolog of Al-induced protein, suggest there may be
a common component in the epicuticular wax deposition and Al responding pathways.
Thiamine (vitamin B1) functions as a precursor of thiamine diphosphate (TDP)
which serves as a coenzyme in a number of the major metabolic pathways, including
acetyl-CoAsynthesis, the tricarboxylic acid cycle, anaerobic ethanolic fermentation, the
oxidative pentose phosphate pathway, the Calvin cycle, the branched–chain amino acid
pathway, and plant pigment biosynthesis (Friedrich, 1987). Animals can only produce
TDP from external thiamine sources but bacteria, yeasts, and higher plants produce it
from simple universal precursors (Begley et al. 1999, Nosaka, 2006, Roje, 2007).
Thiazole and pyrimidine are the products of thiamine biosynthetic pathways. Rapala-
Kozik et al. (2008), suggested a role of thiamine metabolism in the plant response to
abiotic stress by finding a reasonable enhance in the activity of trans ketolase, one of the
major TDP-dependent enzymes, under conditions of salinity and oxidative stress. The
presence of thiamin biosynthetic enzyme homolog (GE653951) in the wax candidate
ESTs, suggests it may have role in cotton (G. arboreum) leaf epicuticular wax
production.
Choline (Cho) is a crucial metabolite in plants because it is required to produce the
major membrane lipid phosphatidylcholine (PC), which shares for 40 to 60% of lipids in
non plastid plant membranes (Moore, 1990, Bolognese and McGraw, 2000). Freezing
tolerance is associated with changes in the amount and degree of poly unsaturation of PC
(Sikorska and Kacperska-Palacz, 1980, Kinney et al. 1987). In addition, it has been
shown that salinity stress induces an increase in the expression of PC in Arabidopsis
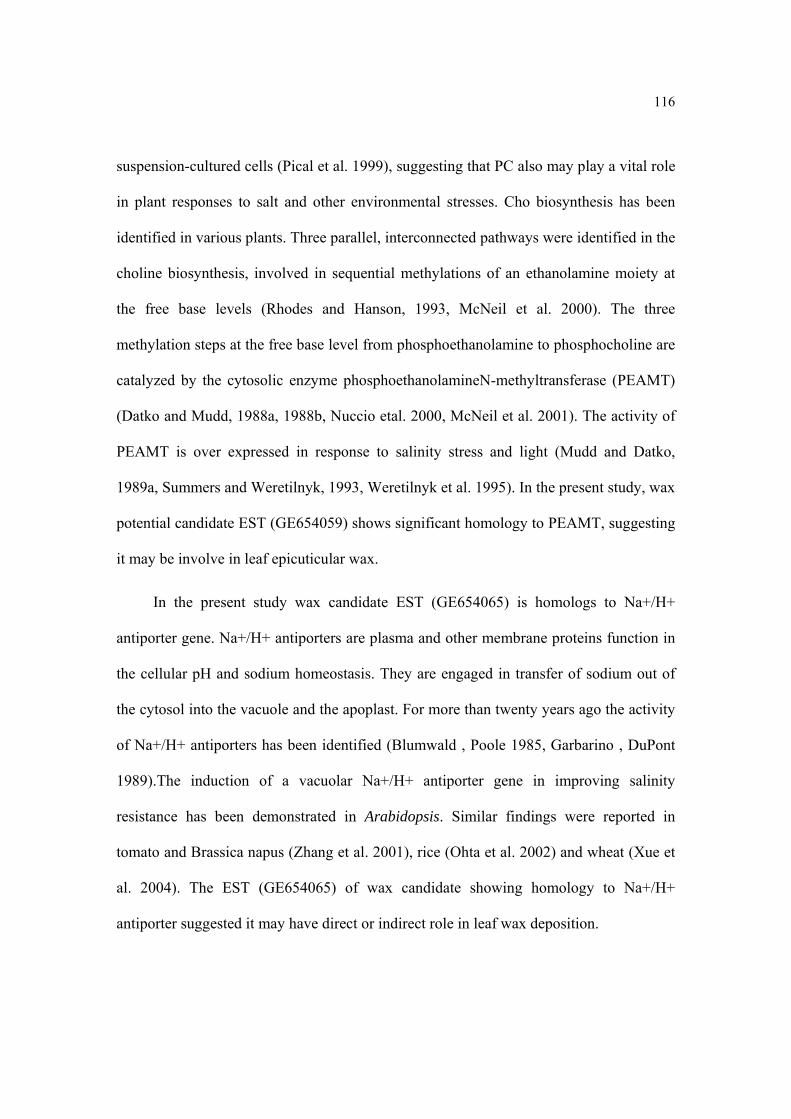
116
suspension-cultured cells (Pical et al. 1999), suggesting that PC also may play a vital role
in plant responses to salt and other environmental stresses. Cho biosynthesis has been
identified in various plants. Three parallel, interconnected pathways were identified in the
choline biosynthesis, involved in sequential methylations of an ethanolamine moiety at
the free base levels (Rhodes and Hanson, 1993, McNeil et al. 2000). The three
methylation steps at the free base level from phosphoethanolamine to phosphocholine are
catalyzed by the cytosolic enzyme phosphoethanolamineN-methyltransferase (PEAMT)
(Datko and Mudd, 1988a, 1988b, Nuccio etal. 2000, McNeil et al. 2001). The activity of
PEAMT is over expressed in response to salinity stress and light (Mudd and Datko,
1989a, Summers and Weretilnyk, 1993, Weretilnyk et al. 1995). In the present study, wax
potential candidate EST (GE654059) shows significant homology to PEAMT, suggesting
it may be involve in leaf epicuticular wax.
In the present study wax candidate EST (GE654065) is homologs to Na+/H+
antiporter gene. Na+/H+ antiporters are plasma and other membrane proteins function in
the cellular pH and sodium homeostasis. They are engaged in transfer of sodium out of
the cytosol into the vacuole and the apoplast. For more than twenty years ago the activity
of Na+/H+ antiporters has been identified (Blumwald , Poole 1985, Garbarino , DuPont
1989).The induction of a vacuolar Na+/H+ antiporter gene in improving salinity
resistance has been demonstrated in Arabidopsis. Similar findings were reported in
tomato and Brassica napus (Zhang et al. 2001), rice (Ohta et al. 2002) and wheat (Xue et
al. 2004). The EST (GE654065) of wax candidate showing homology to Na+/H+
antiporter suggested it may have direct or indirect role in leaf wax deposition.
117
The wax candidate EST (GE653633) is sharing significant homology with
Arabidopsis DNAJ heat shock protein. DnaJ-like proteins serve as chaperone or co-
chaperone proteins, helping in the proper folding, maintaining and functioning of cellular
proteins. The stresses cause disruption of cellular life by misfolding of vital cellular
proteins. The accumulations of such redundant proteins are dangerous to organism. The
chaperone helps in chopping of these perilous proteins in stress (Sabehat et al. 1998). The
DnaJ homologs down regulated in wax deficient mutant suggests it may be involved in
the cotton leaf epicuticular wax maintenance.
The wax candidate EST (GE654116) is homolog of intercellular adhesion molecule
(ICAM-2). No ICAM, for the best of my knowledge, is reported in plants. ICAM plays a
critical role in leukocyte function in animals (Huang et al. 2006). The presence of ICAM
homologs in wax potential candidate ESTs reaveled that it may have some role in
epicuticular wax deposition.
As the leaf epicuticular wax shows more deposition in biotic, abiotic and UV
stresses (Baur, 1998, Kakani et al. 2003, Müller, 2006), the Arabidopsis homologs of
potential wax candidate genes, identified in the present study, were subjected to gene
investigator response viewer (Zimmermann et al. 2004), to find their expression in biotic,
abiotic and UV stresses. According to gene investigator response viewer, the majority of
Arabidopsis homologs show up-regulation in biotic, abiotic and UV stresses as shown in
Figure 48. No down regulation of these Arabidopsis orthologs suggests the involvement
of wax potential candidate ESTs in biotic, abiotic and UV stresses.

118
The above discussions strengthen all the identified down-regulated ESTs in wax
deficient mutant as strong potential wax candidates in cotton (G. arboreum).
As biotic and abiotic stresses is becoming the major problem for the whole world
and especially the developing countries like Pakistan. So it is need of time to produce
stress tolerant crops which have the ability to give better yields under biotic and abiotic
stresses. The present study reports identification of forty (40) wax potential candidate
transcripts through microarray in cotton (G. arboreum). These novel findings will help to
develop stress resistant crop varieties in Pakistan.
119
REFRENCES
Aarts MGM, Keijzer CJ, Stiekema WJ, Pereira A. (1995) Molecular characterization of
the CER1 gene of Arabidopsis involved in epicuticular wax biosynthesis and pollen
fertility. Plant Cell 7: 2115–27.
Abbasi AR, Hajirezaei M, Hofius D, Sonnewald U, and Voll L M. (2007) Specific Roles
of a- and g-Tocopherol in Abiotic Stress Responses of Transgenic Tobacco. Plant
Physiol 143: 1720–1738.
Adams TK, Saydam N, Steiner F, Schaffner W, Freedman JH. (2002) Activation of gene
expression by metal-responsive signal transduction pathways. Environ Health
Perspectives 110, Supplement 5, 813–817.
Aharoni A, Dixit S, Jetter R, Thoenes E, Van Arkel G, Pereira A. (2004) The SHINE
clade of AP2 domain transcription factors activates wax biosynthesis, alters cuticle
properties, and confers drought tolerance when overexpressed in Arabidopsis. Plant
Cell 16: 2463-2480.
Ahn SH, Kim M, Buratowski S. (2004) Phosphorylation of serine 2 within the RNA
polymerase II C-terminal domain couples transcription and 30 end processing,
Mol. Cell 13: 67–76.
Alamillo J, Almogura C, Bartels D, Jordano J. (1995) Constitutive expression of small
heat shock proteins in vegetative tissues of the resurrection plant Craterostigma
plantagineum. Plant Mol Biol 29: 1093-1099.
Alignan M, Hewezi T, Petitprez M, Dechamp-Guillaume G, Gentzbittel L. (2006) A
cDNA microarray approach to decipher sunflower (Helianthus annuus) responses
to the necrotrophic fungus Phoma macdonaldii. New Phytol. 170(3): 523-536.
Allen GJ, Schroeder JI. (2001) Combining genetics and cell biology to crack the code of
plant cell calcium signaling. Sci. STKE 1,RE13.
Almoguera C, Coca MA, Jordano J. (1993) Tissue-specific expression of sunflower heat
shock proteins in response to water stress. Plant J 4: 947–958.
120
Alscher RGEN, Heath LS. (2002) Role of superoxide dismutases (SODs) in controlling
oxidative stress in plants. J Exp Bot 53: 1331–1341
Alves-Ferreira M, Wellmer F, Banhara A, Kumar V, Riechmann J L, Meyerowitz EM.
(2007) Global Expression Profiling Applied to the Analysis of Arabidopsis Stamen
Development. Plant Physiol. 145: 747–762.
Apel K, Hirt H. (2004) Reactive oxygen species: metabolism, oxidative 613 stress, and
signal transduction, Annu. Rev. Plant Biol., 55: 373–399.
Aro EM, Virgin I, Andersson B. (1993) Photoinhibition of photosystem II: inactivation,
protein damage and turnover. Biochim Biophys Acta 1143: 113–134.
Aroca R., Amodeo G, Fernandez-Illescas S, Herman EM, Chaumont F, Chrispeels MJ.
(2005) The role of aquaporins and membrane damage in chilling and hydrogen
peroxide induced changes in the hydraulic conductance of maize roots. Plant
Physiology 137: 341-353.
Audran C, Borel C, Frey A, Sotta B, Meyer C, Simonneau T, Marion-Poll A. (1998)
Expression studies of the zeaxanthin epoxidase gene in Nicotiana plumbaginifolia.
Plant Physiol 118: 1021–1028.
Avato P, Bianchi G, Pogna N. (1990) Chemosystematics of surface lipids from maize and
some related species. Phytochemistry 29: 1571–1576.
Baker J, Steele C, Dure L III. (1988) Sequence and characterization of 6 lea proteins and
their genes from cotton. Plant Mol Biol 11:277–291.
Bakr EM. (2005) A new software for measuring leaf area, and area damaged by
Tetranychus urticae Koch. Journal of Applied Entomology 129 (3), 173-175.
Barbacid M. (1987) Ras genes. Annu Rev Biochem 56: 779–827.
Bar-Peled U, Maltz E, Bruckental I, Folman Y, Kali Y, Gacitua H, Lehrer AR, Knight
CH, Robinzon B, Voet H et al. (1995) Relationship between frequent milking or
suckling in early lactation and milk production of high producing dairy cows. J
Dairy Sci 78: 2726–2736.
121
Bastola DR, Pethe VV, Winicov I. (1998) Alfin1, a novel zinc-finger protein in alfalfa
roots that binds to promoter elements in the saltinducible MsPRP2 gene. Plant Mol.
Biol. 38: 1123–1135.
Baszczynski CL, Barbour E, Zeka BL, Maddock SE, Swenson JL. (1997)
Characterization of a genomic clone for a maize DnaJ-related gene, ZmdJ1, and
expression analysis of its promoter in transgenic plants. Maydica 42: 189-201.
Batistic O, Kudla J, (2004) Integration and channeling of calcium signaling through the
CBL calcium sensor/CIPK protein kinase network, Planta 219 915–924.
Batistič O, Kudla J. (2008). Plant calcineurin B-like proteins and their interacting protein
kinases. Biochimica et Biophysica Acta. doi:10.1016/j.bbamcr.2008.10.006.
Baur P. (1998) Mechanistic aspects of foliar penetration of agrochemicals and the effect
of adjuvants. Recent Res. Dev. Agric. Food Chem. 2,809–837.
Beattie, G. A. and L. M. Marcell. (2002) Effect of alterations in cuticular wax
biosynthesis on the physicochemical properties and topography of maize leaf
surfaces. Plant Cell and Environment 25: 1-16
Beaudoin F, Gable K, Sayanova O, Dunn T, Napier JA. (2002). A Saccharomyces
cerevisiae gene required for heterologous fatty acid elongase activity encodes a
microsomal β-ketoreductase. J. Biol. Chem. 277: 11481–88.
Beevers H. (1979). Microbodies in higher plants. Annu. Rev. Plant Physiol. 30: 159–193.
Begley T., Downs D, Ealick S, McLafferty F, Van Loon D, Taylor S, Campobasso N,
Chiu J, Kinsland C, Reddick J, Xi J. (1999) Thiamin biosynthesis in prokaryotes.
Arch. Microbiol. 171: 293-300.
Bengtson C, Larsson S, Liljenberg C (1978) Effects of water stress on cuticular
transpiration rate and amount and composition of epicuticular wax in seedlings of
six oat varieties. Physiol Plant 44: 319–324.
Berardini TZ, Mundodi S, Reiser R, Huala E, Garcia-Hernandez M, Zhang P, Mueller
LM, Yoon J, Doyle A, Lander G, Moseyko N, Yoo D, Xu I, Zoeckler B, Montoya
122
M, Miller N, Weems D, Rhee SY. (2004) Functional annotation of the Arabidopsis
genome using controlled vocabularies. Plant Physiol. 135(2):1-11.
Berridge MJ et al. (2000) The versatility and universality of calcium signalling. Nat. Rev.
Mol. Cell Biol. 1, 11–21.
Berridge MJ, Bootman MD, Lipp P. (1998) Calcium, a life and death signal, Nat 395:
645–648.
Bertamini M, Muthuchelian K, Rubinigg M, Zorer R, Velasco R, Nedunchezhian N.
(2006) Low-night temperature increased the photoinhibition of photosynthesis in
grapevine (Vitis vinifera L. cv. Riesling) leaves. Environ Exp Bot 57: 25–31.
Beth L. Fatland, Basil J. Nikolau, Eve Syrkin Wurtele. (2005) Reverse Genetic
Characterization of Cytosolic Acetyl-CoA Generation by ATP-Citrate Lyase in
Arabidopsis. Plant Cell 17(1): 182–203
Bianchi G, Avato P, Salamini F. (1978) Glossy mutants of maize. VIII. Accumulation of
fatty aldehydes in surface waxes of gl5 maize seedling. Biochem. Genet. 16:1015–
21.
Bilban M, Head S, Desoye G, Quaranta V. (2000) DNA microarrays: a novel approach to
investigate genomics in trophoblast invasion—a review. Placenta 21(Suppl A):S99-
S105.
Blumwald E, Poole RJ. (1985) Na+/H+ antiport in isolated tonoplast vesicles from
storage tissue of Beta vulgaris, Plant Physiol. 78: 163–167.
Boese SR, Huner NPA. (1992) Developmental history affects the susceptibility of
spinach leaves to in vivo low temperature photoinhibition. Physiol Plant 99: 1141–
1145.
Boguski MS, McCormick F. (1993) Proteins regulating Ras and its relatives. Nat 366:
643–654.
Bolognese, C.P, McGraw P. (2000) The isolation and characterization in yeast of a gene
for Arabidopsis S-adenosyl methionine: phospho-ethanolamine N-
methyltransferase. Plant Physiol.124: 1800–1813.
123
Bondada B.R., Oosterhuis DM, Murphy JB, Kims KS. (1996) Effect of water stress on
the epicuticular wax composition and ultrastructure of cotton (Gossypium hirsutum
L.) leaf, bract and boll. Environ Exp. Bot. 36: 61-69.
Bondada, B.R, Oosterhuis D.M.. (2000). Comparative epidermal ultrastructure of cotton
(Gossypium hirsutum L.) leaf, bract and stomatal occurrence. Ann. Bot. 86:1143–
1152.
Borole, V. K. (2000). Embryo culture studies in interspecific crosses between Gossypium
arboreum and Gossypium hirsutum cotton. Ind J of Gen and Plant Breed. 60(1):
105-110.
Borrell A, Cutanda MC, Lumbreras V, Pujal J, Goday A, Culianez-Macia FA, Pages M.
(2002) Arabidopsis thaliana Atrab28: a nuclear targeted protein related to
germination and toxic cation tolerance. Plant Mol Biol 50:249–259.
Boscolo PRS, Menossi M, Jorge RA. (2003) Aluminum-induced oxidative stress in
maize. Phytochem 62:181–9.
Boston RS, Viitanen PV, Vierling E. (1996) Molecular chaperones and protein folding in
plants. Plant Mol Biol 32:191–222.
Boudsocq M, Laurière C. (2005) Osmotic signaling in plants. Multiple pathways
mediated by emerging kinase families. Plant Physiol. 138(3): 1185–1194.
Bowler C, Van Camp W, Van Montagu M, Inze´ D (1994). Superoxide dismutase in
plants. Crit Rev Plant Sci, 13: 199–218.
Brinker M, Van Zyl L, Liu W, Craig D, Sederoff RR, Clapham DH, Von Arnold S.
(2004) Microarray analyses of gene expression during adventitious root
development in Pinus contorta. Plant Physiol 135: 1526–1539
Brock RD. (1977) When to use mutation ion plant breeding, in Manual on mutation
Breeding. IAEA Technical Reports Series, No. 119, 2nd ed., pp, 213-219.
Broekaert WF, Cammue BPA, DeBolle M FC, Thevissen K, DeSamblanx GW, Osborn
RW. (1997) CRC Crit. Rev. Plant Sci. 16: 297–323.
124
Brunner H. (1991) Methods of induction of mutations, in Advances in Plant Breeding,
Vol. 1. (Mandal, A.K., Ganguli, P.K., and Banerjee, S.P., eds). CBS publishers,
Dehli, pp. 187-252)
Brunner H. (1995) Radiation induced mutation for plant selection. Appl. Radiant. Isot.
46: 589-594
Bu¨ch K, Stransky H, Hager A. (1995) FAD is a further essential cofactor of the
NAD(P)H and O2-dependent zeaxanthin-epoxidase. FEBS Lett 376: 45–48.
Buckingham J. Dictionary of natural products on CD-ROM, version 6.1. London:
Chapman and Hall, 1998.
Bugos RC, Hieber D, Yamamoto HY. (1998) Xanthophyll cycle enzymes are members of
the lipcolin finity, the first identified from plants. J Biol Chem 273: 15321–15324.
Buschhaus C., Herz H. and Jetter R. (2007). Chemical composition of the epicuticular
and intracuticular wax layers on the adaxial side of Ligustrum vulgare leaves. New
Phytologist176: 311–316.
Cameron K D, Teece M A, Bevilacqua E, Smart L B (2002) Diversity of cuticular wax
among Salix species and Populus species hybrids. Phytochemistry 60: 715–725.
Cameron K D, Teece MA, Smart L B. (2006) Increased Accumulation of Cuticular Wax
and Expression of Lipid Transfer Protein in Response to Periodic Drying Plant
Physiol 140: 176–183.
Carrera E, Holman T, Medhurst A, Dietrich D, Footitt S, Frederica L, Theodoulou MJ,
Holdsworth. (2008) Seed after-ripening is a discrete developmental pathway
associated with specific gene networks in Arabidopsis. The Plant Jou 53: 214–224.
Carver TLW, Gurr SJ. (2006) Filamentous fungi on plant surfaces. In MRiederer, C Mu¨
ller, eds, Annual Plant Reviews 23: Biology of the PlantCuticle. Blackwell, Oxford,
pp 368–397.
Chachar1 QI, Solangil AG, Verhoef A. (2008) Influence of sodium chloride on seed
germinationa nd seedling root growth of cotton (Gossypium Hirsutum L.) Pak. J.
Bot. 40(1): 183-197.
125
Chambers RS, Dahmus ME. (1994) Purification and characterization of a phosphatase
from HeLa cells which dephosphorylates the C-terminal domain of RNA
polymerase II, J. Biol. Chem. 269: 26243–26248.
Chandler PM, Robertson M. (1994) Gene expression regulated by abscisic acid and its
relation to stress tolerance. Annu Rev Plant Physiol Plant Mol Biol 45:113–141.
Chandler, J.W. and Bartels, D. (2003) Drought avoidance and drought adaptation.
Encyclopedia of Water Sci. 163–165.
Chang GC, Neufeld J, Durr D, Duetting PS, Eigenbrode SD (2004) Waxy bloom in peas
influences the performance and behavior of Aphidius ervi, a parasitoid of the pea
aphid. Entomol Exp Appl110:257–265.
Chaumont, F., F. Barrieu, R. Jung, and M.J. Chrispeels. (2000) Plasma membrane MIP
proteins from maize cluster in two sequence subgroups with differential aquaporin
activity. Plant Physiol 122:1025-1034.
Chen SX, Schopfer P (1999) Hydroxyl-radical production in physiological reactions. A
novel function of peroxidase. Eur J Biochem 260: 726-735.
Chen THH, Murata N. (2000) Enhancement of tolerance of abiotic stress by metabolic
engineering of betaines and other com-patible solutes. Curr. Opin. Plant Biol 5:
250–257.
Chen XB, Goodwin SM, Boroff VL, Liu XL, Jenks MA. (2003) Cloning and
characterization of the WAX2 gene of Arabidopsis involved in cuticle membrane
and wax production. The Plant Cell 15: 1170–1185.
Chen Z, Gallie DR. (2004) The ascorbic acid redox state controls guard cell signaling and
stomatal movement. Plant Cell 16 (5): 1143–1162.
Chetverin AB, Kramer FR. (1993) Sequencing of pools of nucleic acids on
oligonucleotide arrays. Biosystems 30:215–231
Chiang HC, Lo JC, Yeh KC. (2006) Genes associated with heavy metal tolerance and
accumulation in Zn/Cd hyperaccumulator Arabidopsis halleri: a genomic survey
with cDNA microarray. Environ Sci and Tech 40: 6792–6798.
126
Chinnusamy V, Schumaker K, Zhu JK (2004) Molecular genetic perspectives on cross-
talk and specificity in abiotic stress signaling in plants. J Exp Bot 55: 225-236.
Ciftci-Yilmaz ., Mors, MR, Song L, Coutu A, Krizek BA, Lewis MW, Warren D,
Cushman J, Connolly EL, Mittler R. (2007) The EAR-motif of the Cys2/His2-type
Zinc Finger Protein Zat7 Plays a Key Role in the Defense Response of Arabidopsis
to Salinity Stress J. Biol. Chem. 282: 9260-9268.
Close TJ. (1996) Dehydrins: emergence of a biochemical role of a family of plant
dehydration proteins. Physiol Plant 97: 795–803.
Close TJ. (1997) Dehydrins: a commonalty in the response of plants to dehydration and
low temperature. Physiol Plant 100: 291–296.
Cobbett C, Goldsbrough P. (2002) Phytochelatins and metallothioneins: roles in heavy
metal detoxification and homeostasis. An Rev of Plant Bio 53: 159–182.
Corden JL, Cadena DL, Ahearn JM, Dahmus ME, (1985) A unique structure at the
carboxyl terminus of the largest subunit of eukaryotic RNA polymerase II, Proc.
Natl. Acad. Sci. USA 82: 7934–7938.
Corden JL. (1990) Tails of RNA polymerase II, Trends Biochem. Sci. 15: 383–387.
Costaglioli P, Joubes J, Garcia C, Stef M, Arveiler B, Lessire R, Garbay B. (2005)
Profiling candidate genes involved in wax biosynthesis in Arabidopsis thaliana by
microarray analysis, Biochem. Biophys. Acta 1734: 247–258.
Dagan YL, Ovadis M, Shklarman E, Elad Y, David DR, Vainstein A. (2006) Expression
and Functional Analyses of the Plastid Lipid-Associated Protein CHRC Suggest Its
Rolein Chromoplastogenesis and Stress. Plant Physiol 142: 233–244.
Dahmus ME. (1996) Reversible phosphorylation of the C-terminal domain of RNA
polymerase II, J. Biol. Chem. 271: 19009–19012.
Dat JVS, Vranova E, Van Montagu M, Inze´ D, Van Breusegem F. (2000) Dual action of
the active oxygen species during plant stress responses. Cell Mol Life Sci 57: 779–
795.

127
Datko AH, Mudd SH. (1988a). Enzymes of phosphatidylcholine synthesis in Lemna,
soybean and carrot. Plant Physiol. 88: 1338–1348.
Datko AH, Mudd SH. (1988b) Phosphatidylcholine synthesis. Plant Physiol. 88: 854–
861.
Degenhardt J, Gershenzon J, Baldwin IT, Kessler A. (2003) Attracting friends to feast on
foes; engineering terpene emission to make crop plants more attractive to herbivore
enemies. Curr Opin Biotechnol 14:169-76.
deGroot BL, Frigato T, Helms V, Grubmuller H. (2003) The mechanism of proton
exclusion in the aquaporin-1 water channel. J of Mol Bio 333: 279-293.
Dellaert LMW. (1979) Eceriferum mutants in Arabidopsis thaliana (L.) Heynh. II.
Phenotypic and genetic analysis. Arabid. Inf. Serv. 16: 10-26.
Desikan R, A-H Mackerness S, Hancock JT, Neill SJ. (2001) Regulation of the
Arabidopsis transcriptome by oxidative stress. Plant Physiol 127: 159-172.
Dragota S, Riederer M. (2007), Epicuticular Wax Crystals of Wollemia nobilis:
Morphology and Chemical Composition. Ann of Botan 100: 225–231.
Drevinek P, Matthew TG H, Zhaoping Ge, Andrew M J, El Y F, Kuster H, Ben Amor B,
Hohnjec N, Puhler A, Becker A, Gouzy J, Vernie T, Gough C, Niebel A. (2004)
Expression profiling in Medicago truncatula identifies more than 750 genes
differentially expressed during nodulation, including many potential regulators of
the symbiotic program. Plant Physiol 136: 3159–3176
Droual AM., Maaroufi H, Creche J, Chenieux JC, Rideau M, Hamadi S. (1997) Changes
in the accumulation of cytosolic cyclophilin transcripts in cultured periwinkle cells
following hormonal and stress treatments. J. Plant Physiol 151: 142-150.
Du X M, Yin W X, Zhao Y X, Zhang H. (2001) The production and scavenging of
reactive oxygen species in plants. Chin J Biotech, 17: 121–125.
Dubery IA. (2007). An elicitor- and pathogen-induced cDNA from potato encodes a
stress-responsive cyclophilin. Biologia Plantarum 51 (2): 327-332, 2007.
128
Dure L III, Crouch M, Harada J, Ho T-HD, Mundy J, Quatrano R, Thomas T, Sung R
(1989) Common amino acid sequence demains among the LEA proteins of higher
plants. Plant Mol Biol 12: 475–486.
Economic Survey of Pakistan 2007-2008. http://www.finance.gov.pk/survey/chapters/02-
Agriculture.PDF
Edgar R, Domrachev M, Lash AE. (2002) Gene Expression Omnibus: NCBI gene
expression and hybridization array data repository. Nucl Acids Res. 1; 30(1): 207-
10
Edqvist J, Farbos I. (2002) Characterization of germination-specific lipid transfer proteins
from Euphorbia lagascae. Planta 215: 41–50
Eigenbrode S D, Moodie S, Castagnola T. (1995) Generalist predators mediate resistance
to a phytophagous pest in cabbage with glossy leaf wax. Entomol. Exp. Applic, 77:
335-342.
Eigenbrode SD, Espelie KE. (1995) Effects of plant epicuticular lipids on insect
herbivores. Ann. Rev. Entomol. 40: 171–194.
Eigenbrode SD, Jetter R. (2002) Attachment to plant surface waxes by an insect predator.
Integr Comp Biol 42: 1091–1099.
Eigenbrode SD, Stoner KA, Shelton AM, Kain WC. (1991) Characteristics of glossy leaf
waxes associated with resistance to diamondback moth (Lepidoptera: Plutellidae) in
Brassica oleracea. J of Econ Ent 84: 1609–1618.
Eigenbrode SD. (2004) The effects of plant epicuticular waxy bloomson attachment and
effectiveness of predatory insects. ArthropodStruct Dev 33: 91–102.
Eklund DM, Edqvist J. (2003). Localization of Nonspecific Lipid Transfer Proteins
Correlate with Programmed Cell Death Responses during Endosperm Degradation
in Euphorbia lagascae Seedlings. Plant Physiol 132: 1249–1259.
Eltz T. (2006) Tracing pollinator footprints on natural flowers. J Chem Ecol 32: 907–915
129
Endrizzi J E, Turcotte E L, Kohel RJ. (1985) Genetics, cytology and evolution of
Gossypium. Adv in Gen 23: 271–375.
Endrizzi JE, Turcotte EL, Kohel RJ, (1984) ualitative genetics,cytology, and
cytogenetics, in Cotton, R. J. Kohel andC. F. Lewis, Eds., pp. 81–129, American
Society of Agronomy, Madison, Wis, USA,.
Fambrough D, McClure K, Kazlauskas A, Lander E. (1999) Diverse signaling pathways
activated by growth factor receptors induce broadly overlapping, rather than
independent, sets of genes. Cell 97: 727–741
Fernandes J, Morrow DJ, Casati P, Walbot V. (2008) Distinctive transcriptome responses
to adverse environmental conditions in Zea mays L. Plant Biotechnol J. 6(8): 782-
98.
Fiebig A, Mayfield JA, Miley NL, Chau S, Fischer RL, Preuss D. (2000) Alterations in
CER6, a gene identical to CUT1, differentially affect long-chain lipid content on
the surface of pollen and stems. Plant Cell 12: 2001–8
Fodor SPA, Rava RP, Huang XC, Pease AC, Holmes CP, Adams CL. (1993) Multiplexed
biochemical assays with biological chips. Nat 364: 555–556.
Fodor SPA, Read JL, Pirrung MC, Stryer L, Lu AT, Solus D. (1991) Light-directed,
spartially addressable parallel chemical synthesis. Science 251:767–773
Foyer CH, Lelandais M, Kunert KJ. (1994) Photooxidative stress in plants. Physiol Plant
92: 696–717.
Foyer CH, Noctor G. (2003) Redox sensing and signalling associated with reactive
oxygen in chloroplasts, peroxisomes and mitochondria. Physiol Plant 119: 355–
364.
Frenette Charron JB, Breton G, Badawi M, Sarhan F. (2002) Molecular and structural
analyses of a novel temperature stress-induced lipocalin from wheat and
Arabidopsis. FEBS Lett 517: 129–132.
Friedrich W. (1987) Thiamin (Vitamin B1, aneurin). in: Hanbuch der Vitamine, Urban &
Schwarzenberg, München, Vien, Baltimore, , 240-258.
130
Froger A, Tallur B, Thomas D, Delamarche C. (1998) Prediction of functional residues in
water channels and related proteins. Protein Science 7: 1458-1468.
Gao G, Jin LP, XIE KY, Qu DY. (2009) The potatoStLTPa7gene displays a complex
Ca2+-associated patternof expression during the early stage of potato–Ralstonia
solanacearum interaction. Mol P Pathol 10 ( 1 ): 15–27.
Garbarino J, DuPont FM. (1989) Rapid induction of Na+/H+ exchange activity in barley
root tonoplast, Plant Physiol 89: 1–4.
Garbay B, Tautu MT, Costaglioli P. (2007) Low level of pathogenesis-related protein 1
mRNA expression in 15-day-old Arabidopsis cer6-2 and cer2 eceriferum mutants.
Plant Science 172: 299–305.
García S, Heinzen H, Hubbuch C, Martínez R, DeVries JX, Moyna P. (1995) Triterpene
methyl ethers from Palmae epicuticular waxes. Phytochem 39: 1381-1382
Garcia-Hernandez M, Murphy A, Taiz L. (1998). Metallothioneins 1 and 2 have distinct
but overlapping expression patterns in Arabidopsis. Plant Physiol 118: 387–397.
Garcia-Olmedo F, Molina A, Alamillo J M, Rodriguez-Palenzuela P. (1998) Plant
defense peptides. Biopolymers 47: 479–491
Gazanchian A, Hajheidari M, Sima NK, Salekdeh GH. (2007) Proteome response of
Elymus elongatum to severe water stress and recovery. J Exp Bot 58 (2): 291–300.
Giese BN. (1975). Effects of light and temperature on the composition of epicuticular
wax of barley leaves. Phytochemistry 14: 921–929.
Gillet B, Beyly A, Peltier G, Rey P. (1998) Molecular characterization ofCDSP 34, a
chloroplastic protein induced by water deficit in Solanumtuberosum L. plants, and
regulation of CDSP 34 expression by ABA andhigh illumination. Plant J 16: 257–
262.
Girgis HS, Liu Y, Ryu WS, Tavazoie S. (2007) A Comprehensive Genetic
Characterization of Bacterial Motility. PLoS Genetics. 3 (9): e154.
131
Gloria M Coruzzi (2008). An integrated genetic, genomic and systems approach defines
gene networks regulated by the interaction of light and carbon signaling pathways
in Arabidopsis. BMC Sys Bio 2:31.
Guilford WJ, Schneider DM, Labovitz J, Opella SJ. (1988) High resolution solid state
13C NMR spectroscopy of sporopollenins from different plant taxa. Plant Physiol.
86: 134-136.
Hacia JG, Brody LC, Chee MS, Fodor SPA, Collins FS. (1996) Detection of
heterozygous mutations in BRCA1 using high density oligonucleotide arrays and
two-color fluorescence analysis. Nat Genet 14: 441-447.
Hall DM, Jones R.L. (1961) physiological significance of surface wax on leaves. Nature
191: 95-96.
Hamilton EW, Heckathorn SA. (2001) Mitochondrial adaptations to NaCl. Complex I is
protected by anti-oxidants and small heat shock proteins, whereas complex II is
protected by proline and betaine. Plant Physiol 126: 1266–1274.
Hannoufa A, McNevin J, Lemieux B. (1993). Epicuticular waxes of eceriferum mutants
of Arabidopsis thaliana. Phytochemistry 33: 851–55.
Hannoufa A, Negruk V, Eisner G, Lemieux B. (1996) The CER3 gene of Arabidopsis
thaliana is expressed in leaves, stems, roots, flowers and apical meristems. Plant J
10: 459–467.
Hansen JD, Pyee J, Xia Y, Wen TJ, Robertson DS, Kolattukudy PE, Nikolau BJ,
Schnable PS. (1997) The glossy1 locus of maize and an epidermis-specific cDNA
from Kleinia odora define a class of receptor-like proteins required for the normal
accumulation of cuticular waxes. Plant Physiol 113: 1091–1100.
Harper JF, Breton G, Harmon A. (2004) Decoding Ca(2+) signals through plant protein
kinases, Annu. Rev. Plant Biol. 55: 263–288.
Harper JF. (2001) Dissecting calcium oscillators in plant cells. Trends Plant Sci. 6: 395–
397.
132
Hartl FU, Hayer-Hartl M. (2002) Molecular chaperones in the cytosol: from nascent
chain to folded protein. Sci 295: 1852–1858.
Hartl FU. (1996) Molecular chaperones in cellular protein folding. Nature 381: 571-580.
Hayashi M, Nishimura M. (2006). Arabidopsis thaliana – A model organism to study
plant peroxisomes. Biochim. Biophys. Acta 1763: 1382–1391.
Hendrick JP, Hartl FU. (1993) Molecular chaperone functions of heat-shock proteins.
Annu Rev Biochem 62: 349-384.
Henikoff S, Comai L. (2003) Single-nucleotide mutations for plant functional genomics.
Annu. Rev. Plant Biol. 54: 375–401.
Heslot H, Ferrary R, Levy R, Monard C. (1961) Induction de mutations chezjorge.
Effecacite relatives des rayons gamma, desulfated ethyl, dumethanesulfonate
d’ethyl et de quelques autres substances. Effects of ionizing radiation on seeds
(Proc.Conf. Karlsruhe, 1960), IAEA, Vienna. 243-250
Heymann JB, Engel A. (1999). Aquaporins: Phylogeny, Structure, and Physiology of
Water Channels. NIPS 14: 187-194.
Hieng B, Ugrinovi´c K, Jelka SV, Marjetka K. (2004) Different classes of proteases are
involved in the response to drought of Phaseolus vulgaris L. cultivars differing in
sensitivity. J. Plant Physiol. 161: 519–530.
Hietala T, Laakso S, Rosenqvist H. (1995) Epicuticular waxes of Salix species in relation
to their overwintering survival and biomass productivity. Phytochemistry 40: 23–
27.
Ho CK, Shuman S. (1999) Distinct roles for CTD ser-2 and ser-5 phosphorylation in the
recruitment and allosteric activation of mammalian mRNA capping enzyme, Mol.
Cell 3: 405–411.
Hollenbach B, Schreiber L, Hartung W, Dietz KJ. (1997) Cadmium leads to stimulated
expression of a lipid transfer protein (ltp) in barley: Implications for the
involvement of LTP in wax assembly. Planta 203: 9–19.
133
Holloway PJ, Hunt GM, Baker EA, Macey MJK. (1977) Chemical composition and
ultrastructure of the epicuticular wax in four mutants of Pisum sativum (L.). Chem
and Phy of Lipids 20: 141–155.
Holroyd GH, Hetherington AM, Gray JE. (2002) A role for the cuticular waxes in the
environmental control of stomatal development. New Phytol 153: 433–439.
Honda A, Nogami M, Yokozeki T, Yamazaki M, Nakamura H, Watanabe H, Kawamoto
K, Nakayama K, Morris AJ, Frohman MA et al. (1999) Phosphatidylinositol 4-
phosphate 5-kinase alpha is a downstream effector of the small G protein ARF6 in
membrane ruffle formation. Cell 99: 521–532.
Hou M, Wen-Wei Hu2, Lisha Shen, Li Yen Candy Lee, Zhen Tao, Jin-Hua Han, Hao Yu.
(2008) Global Identification of DELLA Target Genes during Arabidopsis Flower
Development. Plant Physiol 147(3): 1126–1142.
http://www.ers.usda.gov/ Briefing/Cotton/trade.htm
http://www.fao.org.
Huang Y, Chun Yao Li, Kelly D Biddle, Susan, Gibson. (2008) Identification, cloning
and characterization of sis7 and sis10 sugar-insensitive mutants of Arabidopsis.
BMC P Bio 8: 104.
Hughes TR, Shoemaker DD. (2001) DNA microarrays for expression profiling. Curr
Opinion Chem Biol. 5: 21-25.
Hugouvieux V, Kwak JM, Schroeder JI. (2001) An mRNA cap binding protein, ABH1,
modulates early abscisic acid signal transduction in Arabidopsis. Cell 106: 477-
487.
Hurry V, Andersson JM, Chow WS, Osmond CB. (1997) Accumulation of zeaxanthin in
abscisic acid-deficient mutants of Arabidopsis does not affect chlorophyll
quenching or sensitivity to photoinhibition in vivo. Plant Physiol 113: 639–648.
Ian K, Ryan T G, Eshwar M. (2008) Gene expression changes linked to antimicrobial
resistance,oxidative stress, iron depletion and retained motility are observed when
Burkholderia cenocepacia grows in cystic fibrosis sputum BMC Infec Dis 8: 121.
134
Ikegawa H, Yamamoto Y, Matsumoto H. (2000) Responses to aluminum of suspension
cultured tobacco cells in a simple calcium solution. Soil Sci Plant Nutr 46: 503–14.
Ingram J, Bartels D. (1996) The molecular basis of dehydration tolerance in plants. Annu.
Rev. Plant Physiol. and Plant Mol. Biol. 47: 377–403.
International Cotton Advisory Committee (ICAC).
http://www.icac.org/cotton_info/publications/samples/cotton_facts/cotton_facts_p1
7.pdf.
Jakola L, Anna MP, Minna H, Anja H. (2001) Isolation of high quality RNA from
Bilberry (Vaccinum myrtillus l.) fruit. Mol Bio 19: 201-203.
Jeffree CE. (2006) The fine structure of the plant cuticle. In M Riederer, CMu¨ ller, eds,
Annual Plant Reviews 23: Biology of the Plant Cuticle.Blackwell, Oxford, pp 11–
125.
Jenks MA, Joly RJ, Peters PJ, Rich PJ, Axtell JD, Ashworth EA. (1994) Chemically-
induced cuticle mutation affecting epidermal conductance to water vapor and
disease susceptibility in Sorghum bicolor (L.) Moench. Plant Physiol 105:1239-
1245.
Jenks MA, Rashotte AM, Tuttle HA. Feldmann KA. (1996) Mutants in Arabidopsis
thaliana altered in epicuticular wax and leaf morphology. Plant Physiol 110: 377–
385.
Jenks MA, Rich PJ, Ashworth EN. (1994). Involvement of cork cells in the secretion of
epicuticular wax filaments on Sorghum bicolor (L) Moench. Int. J. Plant Sci. 155:
506–18.
Jenks MA, Tuttle HA, Eigenbrode SD, Feldmann KA. (1995) Leaf epicuticular waxes of
the eceriferum mutants in Arabidopsis. Plant Physiol. 108: 369–377.
Jetter R, Kunst L, Samuels AL. (2006) Composition of plant cuticular waxes. In M
Riederer, C Mu¨ller, eds, Annual Plant Reviews 23: Biologyof the Plant Cuticle.
Blackwell, Oxford, pp 145–181.
135
Jiang C, Wright RJ, El-Zik KM, Paterson AH. (1998) Polyploid formation created unique
avenues for response to selection in Gossypium.Proc Natl Acad Sci USA, 95: 4419-
4424.
Jianguo M, Wanqu L, Qin Y, Bodnaryk RP. (1995) Inheritance of the waxless character
of Brassia napus Nilla glossy. Canad J of Plant Sci 75: 893–894.
Jiao S, Emmanuel H, Guikema JA. (2004) High light stress inducing photoinhibition and
protein degradation of photosystem I in Brassica rapa. Plant Sci 167: 733–741.
Johansson I, Karlsson M, Shukla VK, Chrispeels MJ, Larsson C, Kjellbom P. (1998)
Water transport activity of the plasma membrane aquaporin PM28A is regulated by
phosphorylation. The Plant Cell 10: 451-459.
Johnson DA, Richards RA, Turner N C. (1983) Yield, water relations, gas exchange, and
surface reflectances of near isogenic wheat lines differing in glaucousnees. Crop
Sci. 23: 318-325.
Kader JC. (1996) Lipid-transfer proteins in plants. Annu. Rev. Plant Physiol. Plant Mol.
Biol. 47: 627–54.
Kahn RA, Der CJ, Bokoch GM. (1992) The ras superfamily of GTP-binding proteins:
guidelines on nomenclature. FASEB J 6: 2512–2513.
Kakani VG, Reddy JR, Zhaq D, Mohammad AR. (2003) Effect of ultraviolet-B radiation
on cotton (Gossypium hirsutum L.) morphology and anatomy. Annals of Botany 91:
817-826.
Kamada T, Nito K, Hayashi H, Mano S, Hayashi M, Nishimura M. (2003) Functional
differentiation of peroxisomes revealed by expression profiles of peroxisomal genes
in Arabidopsis thaliana. Plant Cell Physiol. 44: 1275–1289.
Kang ME, Dahmus ME. (1993) RNA polymerases IIA and IIO have distinct roles during
transcription from the TATA-less murine dihydrofolate reductase promoter, J. Biol.
Chem. 268: 25033–25040.
Kerstiens G, Schreiber L, Lendzian KJ. (2006) Quantification of cuticular permeability in
genetically modified plants. J of Exp Bot 57: 2547–2552.
136
Kerstiens G. (1996) Signaling across the divide: A wider perspective of cuticular
structure-function relationship. Trends Plant Sci 1: 125-129.
Kessler F, Schnell D, Blobel G. (1999) Identification of proteins associated with
plastoglobules isolated from pea (Pisum sativum L.) chloroplasts. Planta 208: 107–
113.
Kiddle G, Pastori GM, Bernard S, Pignocchi C, Antoniw J, Verrier PJ, Foyer CH. (2003)
Effects of leaf ascorbate content on defense and photosynthesis gene expression in
Arabidopsis thaliana. Antioxidant Redox Signal 5: 23–32.
Kim HU, Wu SH, Ratnayake C, Huang AHC. (2001) Brassica rapa has three genes that
encode proteins associated with different neutral lipids in plastids of specific
tissues. Plant Physiol 126: 330–341.
Kinney AJ, Clarkson DT, Loughman BC. (1987) The regulation of phosphatidylcholine
biosynthesis in rye (Secale cereale) roots: Stimulation of the nucleotide pathway by
low temperature. Biochem. J. 242: 755–759.
Kira MV, Michaels SD. (2008) Functional redundancy and new roles for genes of the
autonomous floral-promotion pathway. Plant Physiol 147: 682–695.
Klok EJ, Wilson IW, Wilson D, Chapman SC, Ewing RM, Somerville SC, Peacock WJ,
Dolferus R, Dennis ES. (2002) Expression profile analysis of the low-oxygen
response in Arabidopsis root cultures. Plant Cell 14: 2481–2494
Kloosterman B, De Koeyer D, Griffiths R, Flinn B, Steuernagel B, Scholz U, Sonnewald
S, Sonnewald U, Bryan GJ, Prat S, Bánfalvi Z, Hammond JP, Geigenberger P,
Nielsen KL, Visser RG, Bachem CW. (2008) Genes driving potato tuber initiation
and growth: identification based on transcriptional changes using the POCI array.
Funct Integr Genomics. 8(4):329-40.
Knight H. (2000) Calcium signaling during abiotic stress in plants. Int. Rev. Cytol. 195:
269–324.
Koag MC, Fenton RD, Wilkens S, Timothy JC. (2003) The binding of maize DHN1 to
lipid vesicles. Gain of structure and lipid specificity. Plant Physiol 131: 309–316.
137
Koh S, Andre A, Edwards H, Ehrhardt D, Somerville S. (2005). Arabidopsis thaliana
subcellular responses to compatible Erysiphe cichoracearum infections. Plant J. 44:
516–529.
Koizumi M, Yamaguchi-Shinozaki K, Tsuji K, Shinozaki K. (1993) Structure and
expression of two genes that encode distinct drought-inducible cysteine proteases in
Arabidopsis thaliana. Gene 129: 175–182.
Kolattukudy PE. (1996). Biosynthetic pathways of cutin and waxes, and their sensitivity
to environmental stresses. In: Kerstiens G, editor. Plant cuticles. Oxford: BIOS
Scientific Publishers; pp. 83–108.
Komarnitsky P, Cho EJ, Buratowski S. (2000) Different phosphorylated forms of RNA
polymerase II and associated mRNA processing factors during transcription, Genes
Dev. 14: 2452–2460.
Koornneef M, Dellaert LMW, Van der Veen JH. (1982) EMS- and radiation-induced
mutation frequencies at individual loci in Arabidopsis thaliana (L.) Heynh. Mutat
Res 93:109-123.
Koornneef M, Hanhart CJ, Thiel F. (1989) A genetic and phenotypic description of
eceriferum (cer) mutants in Arabidopsis thaliana. J. Hered. 80: 118–122
Kruk J, Holla¨nder-Czytko H, Oettmeier W, Trebst A. (2005) Tocopherol as singlet
oxygen scavenger in photosystem II. J Plant Physiol 162: 749–757
Kuballa AV, Merritt DJ, Elizur A. (2007) Gene expression profiling of cuticular proteins
across the moult cycle of the crab Portunus pelagicus. BMC Biol. 5(45): 1-26.
Kunst L, Samuels AL. (2003) Biosynthesis and secretion of plant cuticular wax. Progr.
Lipid Res. 42:51-80.
Kunst L, Taylor DC, Underhill EW. (1992) Fatty acid elongation in developing seeds of
Arabidopsis. Plant Physiol Biochem 30: 425–434.
Kwon YT, Reiss Y, Fried VA, Hershko A, Yoon JK, Gonda DK, et al. (1998) Proc Natl
Acad Sci USA, 95: 7898–903.
138
Lanfranco L, Bolchi A, Ros EC, Ottonello S, Bonfante P. (2002) Differential expression
of a metallothionein gene during the presymbiotic versus the symbiotic phase of an
arbuscular mycorrhizal fungus. Plant Physiol 130: 58–67.
Langen-kamper G, Manac’h N, Broin M, Cuine S, Becuwe N, Kuntz M, Rey P. (2001)
Accumulation of plastid lipid-associated proteins (fibrillin/CDSP34) upon oxidative
stress, ageing and biotic stress in Solanaceaeand in response to drought in other
species. J Exp Bot 52: 1545–1554.
Latowski D, Grzyb J, Strzalka K. (2004) The xanthophyll cycle – molecular mechanism
and physiological significance. Acta Physiol Plant 26: 197–212.
Lee J, Shim D, Song WY, Hwang I, Lee Y. (2004) Arabidopsis metallothioneins 2a and 3
enhance resistance to cadmium when expressed in Vicia faba guard cells. Plant
Molecular Biology 54: 805–815.
Lee JW, Zhang Y, Weaver CD, Shomer NH, Louis CF, Roberts DM. (1995)
Phosphorylation of nodulin 26 on serine 262 affects its voltage sensitive channel
activity in planar lipid bilayers. J of Bio Chem 270: 27051-27057.
Lemieux B. (1996) Molecular genetics of epicuticular wax biosynthesis. Trends Plant Sci
1: 312–8.
Leon S, Touraine B, Ribot C, Briat JF, Lobreaux S. (2003) Iron-sulphur cluster assembly
in plants: distinct NFU proteins in mitochondria and plastids from Arabidopsis
thaliana. Biochem. J.371: 823–830.
Lezhneva L, Amann K, Meurer J. (2004) The universallyconserved HCF101 protein is
involved in assembly of [4Fe-4S]-cluster-containing complexes in Arabidopsis
thaliana chloroplasts. Plant J. 37: 174–185.
Li X, Song Y, Century K, et al., (2001) A fast neutron deletion mutagenesis based reverse
genetics system for plants. Plant J. 27: 235-242
Li YC, An LZ, Ge1 YH, Li Y, Bi1 Y. (2008). Detection and Isolation of Preformed
Antifungal Compounds from the Peel of Pyrus bretschneideri Rehd. cv. Pingguoli
at Different Stages of Maturity. J. Phytopathol 156: 115–119.
139
Lipka, V., et al. (2005) Pre- and postinvasion defenses both contribute to non host
resistance in Arabidopsis. Science 310: 1180–1183.
Lipshutz RJ, Fodor SPA, Gingeras TR, Lockhart DJ. (1999) High density synthetic
oligonucleotide arrays. Nat. Genet. 21(1): 20-24.
Liu K, Wang L, Xu Y, Chen N, Ma Q, Li F, Chong K. (2007) Overexpression of
OsCOIN, a putative cold inducible zinc finger protein, increased tolerance to
chilling, salt and drought, and enhanced proline level in rice. Planta 226: 1007–
1116.
Liu Y, Zheng Y. (2005) PM2, a group 3 LEA protein from soybean, and its 22-mer
repeating region confer salt tolerance in Escherichia coli. Biochem Biophys Res
Commun 331: 325–332.
Livak KJ and Schmittgen TD. (2001) Analysis of relative gene expression data using
real-time quantitative PCR and the 2-∆∆CT method. Methods 25: 402 – 408.
Lolle S, Pruitt RE. (1999) Epidermal cell interactions: A case for local talk. Trends Plant
Sci. 4: 14-20.
Long SP, Humphries S, Falkowski PG. (1994) Photoinhibition of photosynthesis in
nature. Annu Rev Plant Physiol Plant Mol Biol 45: 633–662.
Lu H, Zawel L, Fisher L, Egly JMD. (1992) Reinberg, Human general transcription
factor IIH phosphorylates the C-terminal domain of RNA polymerase II, Nat 358:
641–645.
Luan S, Lane WS, Schreiber SL. (1994) pCyP B: a chloroplastlocalized, heat shock-
responsive cyclophilin from fava bean. Plant Cell 6: 885-892.
Lundqvist U, Lundqvist A. (1988) Mutagen specificity in barley for 1580 eceriferum
mutants localized to 79 loci. Hereditas 108: 1–12.
MacRobbie EA, Philos Trans, Soc R, London B Biol. (1998) Signal transduction and ion
channels in guard. cells. Sci. 1374: 1475–1488.

140
Maguire TL, Grimmond S, Forrest A, Iturbe-Ormaetxe I, Meksem K, Gresshoff P.
(2002) Tissue-specific gene expression in soybean (Glycine max) detected by
cDNA microarray analysis. J. Plant Physiol 159: 1361–1374.
Malan C, Gregling MM, Gressel J. (1990) Correlation between CuZn superoxide
dismutase and glutathione reductase and environmental and xenobiotic stress
tolerance in maize inbreds. Plant Sci 69: 157-166.
Maldonado AM, Doerner P, Dixon RA, Lamb CJ, Cameron RK. (2002) A putative lipid
transfer protein involved in systemic resistance signalling in Arabidopsis. Nat 419:
399–403.
Maluszynksi M. (2001) Officially released mutant varieties-The FAO/IAEA Database.
Plant Cell Tissue Organ Cult. 65: 175-177
Mansoor S, Briddon RW, Zafar Y, Stanley J. (2003) Geninivirus disease complexes: an
emerging threat. Tren in P Sci 8: 128- 134.
Mariani C. (2000) In this issue: Complex Waxes The Plant Cell 12: 1795-1798.
Marivet J, Frendo P, Bukard G. (1992) Effects of abiotic stresses on cyclophilin gene
expression in maize and bean and sequence analysis of bean cyclophilin cDNA.
Plant Sci 84: 171-178.
Marivet J, Margis-Pinheiro M, Frendo P, Bukhard G. (1994) Bean cyclophilin gene
expression during plant development and stress conditions. Plant mol. Biol 26:
1181-1189.
Mattie MD, Freedman JH. (2004). Copper-inducible transcription: regulation by metal-
and oxidative stress-responsive pathways. Amer J of Physiol and Cell Physiol 286:
C293–301.
Maurel C, Kado RT, Guern J, Chrispeels MJ. (1995). Phosphorylation regulates the water
channel activity of the seed-specific aquaporin α-TIP. The EMBO Journal 14:
3028-3035.
141
Mazzucotelli E, Mastrangelo AM, Crosatti C, Guerra D, Stanca AM, Cattivelli L. (2008)
Abiotic stress response in plants: When post-transcriptional and post-translational
regulations control transcription. Plant Sci 174: 420–431
McNeil SD, Nuccio ML, Rhodes D, Shachar-Hill Y, Hanson AD. (2000) Radiotracer and
computer modeling evidence that phospho-base methylation is the main route of
cholines synthesis in tobacco. Plant Physiol. 123: 371–380.
McNeil SD, Nuccio ML, Ziemak, M.J, Hanson AD. (2001). Enhanced synthesis of
choline and glycine betaine in transgenic tobacco plants that overexpress
phosphoethanolamine N-methyltransferase. Proc. Natl. Acad. Sci. USA 98: 10001–
10005.
McNevin JP, Woodward W, Hannoufa A, Feldmann KA, Lemieux B. (1993). Isolation
and characterization of eceriferum (cer) mutants induced by T-DNA insertions in
Arabidopsis thaliana. Genome 36: 610–18.
Michael TP, Breton G, Hazen SP, Priest H, Mockler TC, Kay SA, Chory J. (2008) A
Morning-Specific Phytohormone Gene Expression Program underlying Rhythmic
Plant Growth. PLoS Biology 6 (9): e225.
Mick A. (1997) Mutation and induzierte Mutationen in der Zuchtung, in Biogische
Grundlagen der Pflanzenzuchtung (Odenbach, W., ed.), Parey Buchverlag, Berlin,
pp. 218-239
Millar AA, Clemens S, Zachgo S, Giblin EM, Taylor DC, Kunst L. (1999) CUT1, an
Arabidopsis gene required for cuticular wax biosynthesis and pollen fertility,
encodes a very-long-chain fatty acid condensing enzyme. Plant Cell 11: 825–838.
Millar AA, Kunst L. (1997). Very-long-chain fatty acid biosynthesis is controlled through
the expression and specificity of the condensing enzyme. Plant J 12: 121–31.
Miller JD, Arteca RN, Pell EJ. (1999) Senescence-associated gene expression during
ozone-induced leaf senescence in Arabidopsis. Plant Physiol 120: 1015–1024.
Mittler R, Vanderauwera S, Gollery M, Breusegem F. (2004) Reactive oxygen gene
network of plants. Trends Plant Sci 9: 490-498
142
Mittler R. (2002) Oxidative stress, antioxidants and stress tolerance. Trends Plant Sci 7:
405-410.
Molina A, Segura A, Garcia-Olmedo F. (1993) Lipid transfer proteins (nsLTPs) from
barley and maize leaves are potent inhibitors of bacterial and fungal plant
pathogens. FEBS Lett. 316: 119–122.
Mollet JC, Park SY, Nothnagel EA, Lord EM. (2000) A lily stylar pectin is necessary for
pollen tube adhesion to an in vitro stylar matrix. Plant Cell 12: 1737–1750.
Monaghan JR, Leonard GE, Srikrishna P, Robert BP, Walker JA , Beachy CK , Zhu W,
Pao GM , Verma IM, Hunter T, Bryant SV , Gardiner DM , Harkins TT, Voss SR.
(2009) Microarray and cDNA sequence analysis of transcription during nerve-
dependent limb regeneration . BMC Bio 7:1
Moore TS. (1990) Biosynthesis of phosphatidylinositol. Inositol Metab. Plant 9: 107–
112.
Mu¨ller C. (2006) Plant-insect interactions on cuticular surfaces. In MRiederer, C Mu¨
ller, eds, Annual Plant Reviews 23: Biology of the Plant Cuticle. Blackwell,
Oxford, pp 398–422.
Mudd SH, Datko AH. (1989) Synthesis of EA and its regulation in Lemna paucicostata.
Plant Physiol. 91: 587–597.
Mukhopadhyay, A., Vij, S. and Tyagi, A. K. (2004) Overexpression of a zinc finger
protein gene from rice confers tolerance to cold, dehydration, and salt stress in
transgenic tobacco. Proc. Natl. Acad. Sci. USA 101: 6309–6314.
Munnus, R. (2002) Comparative physiology of salt and water stress, Plant 616 Cell
Environ. 25 (2): 239-250.
Murphy A, Zhou J, Goldsbrough PB, Taiz L. (1997) Purification and immunological
identification of metallothioneins 1 and 2 from Arabidopsis thaliana. Plant Physiol
113: 1293–1301.
Murphy DJ. (2004) The roles of lipid bodies and lipid-body proteins in the assembly and
trafficking of lipids in plant cells. In Proceedings of the16th International Plant
143
Lipid Symposium. Hungarian Scientific Societyfor Food Industry and Budapest
University of Economic Sciences and Public Administration Faculty of Food
Science Budapest, Budapest, pp 55–62.
Nakagami H, Pitzschke A, Hirt H. (2005). Emerging MAP kinase pathways in plant
stress signalling. Trends Plant Sci. 10: 339–346.
Negruk V, Yang P, Subramanian M, McNevin JP, Lemieux B. (1996). Molecular cloning
and characterization of the CER2 gene of Arabidopsis thaliana. Plant J. 9:137–45.
Nguyen TTT, Klueva N, Chamareck V, Aarti A, Magpantay G, Millena ACM, Pathan
MS and Nguyen HT. (2004) Saturation mapping of QTL regions and identification
of putative candidate genes for drought tolerance in rice. Mol. Gen. and Genomics,
272: 35-46.
Nieuwland J, Feron R, Huisman BA, Fasolino A, Hilbers CW, Derksen J, Mariani C.
(2005) Lipid transfer proteins enhance cell wall extension in tobacco. Plant Cell 17:
2009–2019.
Nosaka K. (2006) Recent progress in understanding thiamin biosynthesis and its genetic
regulation in Saccharomyces cerevisiae. Appl. Microbiol.Biotechnol. 72: 30-40.
Nuccio ML, Ziemak MJ, Henry SA, Weretilnyk EA, Hanson AD. (2000) cDNA cloning
of phosphoethanolamine N-methyltransferase from spinach by complementation in
Schizosaccharomyces pombe and characterization of the recombinant enzyme. J.
Biol. Chem. 275, 14095–14101.
Odeigah PGC, Osanyinpeju AO. (1998) Induced mutations in cowpea, Vigna unguiculata
(Leguminosae). Revista de Biologia Tropical. 46(3): 579-586.
Ohta M, Hayashi Y, Nakashima A, Hamada A, Tanaka A, Nakamura T, Hayakawa T.
(2002) Introduction of a Na+/H+ antiporter genefrom Atriplex gmelini confers salt
tolerance to rice, FEBS Lett. 532 279–282.
Oosterhuis DM, Hampton R E, Wullschleger SD. (1991a) Water deficit effects on cotton
leaf cuticule and the efficiency of defoliants. J. Agron. Prod. 4: 260-265
144
Oosterhuis DM, Hampton RE, Wullschleger SD, Kim KS. (1991b) Characteristics of the
cotton leaf cuticle. Arkansas Farm Res. 40 (5): 12-13
Orozco-Cardenas ML, Ryan C. (1999) Hydrogen peroxide is generated systemically in
plant leaves by wounding and system in via the octadecanoid pathway. Proc Natl
Acad Sci USA 96: 6553-6557.
O'Toole JC, Chang TT. (1979a) Drought resistance in cereals-rice: a case study. In H
Mussell, RC Staples, eds, Physiology of Crop Plants. John Wiley & Sons, New
York, pp 374–405.
O'Toole JC, Cruz RT, Seiber JN. (1979b) Epicuticular wax and cuticular resistance in
rice. Physiol Plant 47: 239–244.
Palmiter RD. (1998). The elusive function of metallothioneins. Proc of the Nat Acad of
Sci, USA 95: 8428–8430.
Panda SK, Singha LB, Khan MH. (2003) Does aluminum phytotoxicity induce oxidative
stress in green gram (Vignaradiata) Bulg J Plant Physiol 29:77–86.
Park SY, Jauh GY, Mollet JC, Eckard KJ, Nothnagel EA, Walling LL, Lord EM. (2000)
A Lipid Transfer–like Protein Is Necessary for Lily Pollen Tube Adhesion to an in
Vitro Stylar Matrix. Plant Cell 12: 151–164.
Parsad G. (1987) Increased Frequency and Wider Spectrum of Mutation Induced By
Presoaking and Combined Mutagen Treatments in Barley. Barley Genetics
Newsletter 17:71-73
Pastenes C, Pimentel P, Lillo J. (2005) Leaf movements and photoinhibition in relation to
water stress in field-grown beans. J Exp Bot 56: 425–433.
Pastori G, Foyer CH, Mullineaux P. (2000) Low temperature induced changes in the
distribution of H2O2 and antioxidants between the bundle sheath and mesophyll
cells of maize leaves. J Exp Bot 51: 107–113.
Paul SM, Timothy FC, Stanley FN. (2004) DNA-microarray analysis of brain cancer:
molecular classification for therapy Nature Reviews Neuroscience 5: 782-792.
145
Pavy N, Boyle B, Nelson C, Paule C, Giguère I, Caron S, Parsons LS, Dallaire N, Bedon
F, Bérubé H, Cooke J, Mackay J. (2008) Identification of conserved core xylem
gene sets: conifer cDNA microarray development, transcript profiling and
computational analyses. New Phytol. 180: 766-786.
Pearce RS, Houlston CE, Atherton KM, Rixon JE, Harrison P, Hughes MA, Alison Dunn
M. (1998) Localization of expression of three cold-induced genes, blt101, blt4.9,
and blt14, in different tissues of the crown and developing leaves of cold-
acclimated cultivated barley. Plant Physiol. 117: 787–795.
Pease AC, Solas D, Sullivan EJ, Cronin MT, Holmes CP, Fodor SP. (1994) Light-
generated oligonucleotide arrays for rapid DNA sequence analysis. Proc Natl Acad
Sci USA 91:5022–5026.
Pedley KF, Martin GB. (2005) Role of mitogen-activated protein kinases in plant
immunity. Curr. Opin. Plant Biol. 8: 541–547.
Pical C, Westergren T, Dove SK, Larsson C, Sommarin M. (1999) Salinity and
hyperosmotic stress induce rapid increases in phosphatidylinositol 4,5-
bisphosphate, diacylglycerol pyrophosphate, and phosphatidylcholine in
Arabidopsis thaliana cells. J.Biol. Chem. 274: 38232–38240.
Post-Beittenmiller D. (1998) The cloned Eceriferum genes of Arabidopsis and the
corresponding Glossy genes in maize Plant Physiol Biochem 1998; 36:157–66.
Powles SB. (1984) Photoinhibition of photosynthesis induced by visible light. Annu Rev
Plant Physiol 35: 15–44.
Prasad T K. (1997) Role of catalase in inducing chilling tolerance in pre-emergent maize
seedlings. Plant Physiol 114: 1369–1376.
Prasad TK, Anderson MD, Martin BA, Stewart CR. (1994) Evidence for chilling-
inducedoxidative stress in maize seedlings and a regulatory role for hydrogen
peroxide. Plant Cell 6: 65-74.
146
Premachandra GS, Hahn DT, Axtell JD, Joly RJ. (1994) Epicuticular wax load and
water-use efficiency in bloomless and sparse-bloom mutants of Sorghum bicolor L.
Environ Exp Bot 34: 293–301.
Preuss D, Lemieux B, Yen G, Davis RW. (1993) A conditional sterile mutation
eliminates surface components from Arabidopsis pollen and disrupts cell signaling
during fertilization. Genes Develop. 7:974-985
Pruvot G, Cuine S, Peltier G, Rey P. (1996) Characterization of a novel drought-induced
34-kDa protein located in the thylakoids of Solanum tuberosum L. plants. Planta
198: 471–479
Puhakainen T, Hess MW, Makela P, Svensson J, Heino P, Palva ET. (2004)
Overexpression of multiple dehydrin genes enhances tolerance to freezing stress in
Arabidopsis. Plant Mol Biol 54:743–753.
Pundir NS. (1972) Experimental embryology of Gossypium arboreum L. and G. hirsutum
L. and their reciprocal crosses. Bot. Gaz. 133: 7–26.
Rapala-Kozik M, Kowalska E, Ostrowska K. (2008) Modulation of thiamine metabolism
in Zea mays seedlings under conditions of abiotic stress. J. of Exp Bot 59: (15)
4133–4143.
Reddy VS, Reddy AS. (2004) Proteomics of calcium-signaling components in plants,
Phytochem 65: 1745–1776.
Reicosky DA, Hanover JW. (1978) Physiological effects of surfacewaxes I. Light
reflectance for glaucous and nonglaucous Picea pungens. Plant Physiol. 62: 101–
104.
Reumann S, Ma C, Lemke S, Babujee L. (2004) AraPerox. A database of putative
Arabidopsis proteins from plant peroxisomes. Plant Physiol. 136: 2587–2608.
Rey P, Gillet B, Romer S, Eymery F, Massimino J, Peltier G, Kuntz M. (2000) Over-
expression of a pepper plastid lipid-associated protein intobacco leads to changes in
plastid ultrastructure and plant developmentupon stress. Plant J 21: 483–494.

147
Rhodes D, Hanson AD. (1993) Quaternary ammonium and tertiary sulfonium compounds
in higher plants. Annu. Rev. Plant Physiol. Plant Mol. Biol. 44: 357–384.
Rieger R, Michaelies A, Green M. (1976) Glossary of genetics and cytogenetics. Springer
Verlag, New York.
Robinson NJ, Tommey AM, Kuske C, Jackson PJ. (1993) Plant metallothioneins.
Biochem J 295: 1–10.
Rock CD, Zeevaart JAD. (1991) The aba mutant of Arabidopsis thaliana is impaired in
epoxy-carotenoid biosynthesis. Proc Natl Acad Sci USA 88: 7496–7499.
Roje S. (2007) Vitamin B biosynthesis in plants. Phytochem 68: 1904–1921.
Rostás M, Ruf D, Zabka V, Hildebrandt U. (2008) Plant surface wax affects parasitoid’s
response to host footprints. Naturwissenschaften 95: 997–1002.
Rowland O, Lee R, Franke R, Schreiber L, Kunst L. (2007). The CER3 wax biosynthetic
gene from Arabidopsis thaliana is allelic to WAX2/YRE/FLP1. FEBS Lett. 581:
3538–44.
Rowland O, Zheng H, Hepworth SR, Lam P, Jetter R, Kunst L. (2006). CER4 encodes an
alcohol-forming fatty acyl-Coenzyme A reductase involved in cuticular wax
production in Arabidopsis. Plant Physiol. 142: 866–77.
Sabehat A, Lurie S, Weiss D. (1998) Expression of small heat-shock proteins at low
temperatures. Plant Physiol.117: 651–658.
Saeed AI, Sharov V, White J, Li J, Liang W, Bhagabati N, Braisted J, Klapa M, Currier
T, Thiagarajan M, Sturn A, Snuffin M, Rezantsev A, Popov D, Ryltsov A,
Kostukovich E, Borisovsky I, Liu Z, Vinsavich A, Trush V, Quackenbush J. (2003)
TM4: a free, open-source system for microarray data management and analysis.
Biotech 34(2): 374-8.
Sakamoto H, Araki T, Meshi T, Iwabuchi M. (2000) Expression of a subset of the
Arabidopsis Cys(2)/His(2)-type zinc-finger protein gene family under water stress.
Gene 248: 23–32.
148
Sakhanokho HF, Zipf A, Rajesekaram K, Saha S, Sharma GC, Chee PW. (2004) Somatic
embryo initiation and germination in diploid cotton (Gossypium arborium L.). In
Vitro Cell. Dev. Biol. 40:177-181.
Samuels L, Kunst L, Jetter R. (2008) Sealing Plant Surfaces: CuticularWax Formation by
Epidermal Cells. ANRV 342: 59-27.
Schaffer MA, Fisher RL. (1988) Analysis of mRNAs that accumulate in response to low
temperature identifies a thiol protease gene in tomato. Plant Physiol 87: 431–436.
Schena M, Shalon D, Davis RW, Brown PO. (1995) Quantitative monitoring of gene
expression patterns with a complementary DNA microarray. Sci. 270: 467-470.
Schnable PS, Stinard PS, Wen TJ, Heinen S, Weber D, Schneerman M, Zhang L, Hansen
JD, Nikolau BJ. (1994) The genetics of cuticular wax biosynthesis. Maydica 39:
279–287.
Schroeder JI, Hedrich R, Fernandez JM. (1984) Cytosolic calcium regulates ion channels
in the plasma membrane of Vicia faba guard cells. Nature 338: 427–430.
Schroeder SC, Schwer B, Shuman S, Bentley D. (2000) Dynamic association of capping
enzymes with transcribing RNA polymerase II, Genes Dev. 14: 2435–2440.
Seki M, Narusaka M, Abe H, Kasuga M, Yamaguchi-Shinozaki K, Carninci P,
Hayashizaki Y, Shinozaki K. (2001) Monitoring the expression pattern of 1300
Arabidopsis genes under drought and cold stresses by using a full-length cDNA
microarray. The Plant Cell 13(1): 61-72.
Seki M, Narusaka M, Ishida J, Nanjo T, Fujita M, Oono Y, Kamiya A, Nakajima M, Enju
A, Sakurai T, Satou M, Akiyama K, Taji T, Yamaguchi-Shinozaki K, Carninci P,
Kawai J, Hayashizaki Y, Shinozaki K. (2002)
Monitoring the expression profiles of 7000 Arabidopsis genes under drought, cold,
and high-salinity stresses using a full-length cDNA microarray.
Plant J. 31: 279-292.
149
Serrano YEM, MoyanoE, Medina-Escobar N, Munoz-Blanco J, Caballero JL. (2003)
Identification of a strawberry gene encoding a non-specific lipid transfer protein
that responds to ABA, wounding and cold stress. J. Exp. Bot. 54: 1865–1877.
Shalon D, Smith SJ, Brown PO. (1996) A DNA microarray system for analyzing
complex DNA samples using two-color fluorescent probe hybridization. Genome
Res 6: 639-645.
Shen XY, Xu SC, Dai JY. (1995) Effects of drought on the activities of SOD, CAT and
acid phosphatase in maize leaves. Plant Physiol Commun 31: 183–186.
Shi H, Quintero FJ, Pardo JM, Zhu JK (2002) The putative plasma membrane
Na(+)/H(+) antiporter SOS1 controls long distance Na(+) transport in plants. Plant
Cell. 14: 465–477.
Shinozaki K, Dennis ES. (2003) Cell signaling and gene regulation global analyses of
signal transduction and gene expression profiles. Curr Opin Plant Biol 6(5): 405-
409.
Shoemaker DD, Lashkari DA, Morris D, Mittmann M, Davis RW. (1996) Quantitative
phenotypic analysis of yeast deletion mutations using a highly parallel molecular
bar-coding strategy. Nat Genet 14: 450-456.
Siddique BA Khan S. (1999) Mutagenesis: tools and techniques- a practical view, in
Breeding in Crop Plants: Mutations and In Vitro Mutations Breeding. Kalyani
Publishers, Ludhiana, New Delhi. pp. 20-32.
Sikorska E, Kacperska-Palacz A. (1980) Frost-induced phospholipid changes in cold-
acclimated and non acclimate drape leaves. Physiol. Plant. 48: 201–206.
Simontacchi M, Caro A, Fraga CG, Puntarulo S. (1993) Oxidative stress affects a-
tocopherol content in soybean embryonic axes upon inhibition and following
germination. Plant Physiol, 103: 949–953.
Sivaguru M, Ezaki B, He ZH, Tong H, Osawa H, Balusˇka F, Volkmann D, Matsumoto
H. (2003) Aluminum-Induced Gene Expression and Protein Localization of a Cell
Wall-Associated Receptor Kinase in Arabidopsis. Plant Physiol 132: 2256–2266.
150
Sivaguru M, Fujiwara T, Amaj J, Balusˇka Yang Z, Osawa H, Maeda T, Mori T,
Volkmann D, Matsumoto H. (2000) Aluminum-induced 1–3-d-glucan inhibits cell-
to-cell trafficking of molecules through plasmodesmata: A new mechanism of Al
toxicity in plants. Plant Physiol 124:991–1018.
Skriver K, Mundy J. (1990) Gene expression in response to abscisic acid and osmotic
stress. Plant Cell 2: 503–512
Stankovic RK, Chung RS, Penkowa M. (2007) Metallothioneins I and II: neuroprotective
significance during CNS pathology. Int J of Biochem and Cell Bio 39: 484–489.
Sterk P, Booij H, Schellekens GA, Van Kammen A, De Vries SC. (1991) Cell-specific
expression of the carrot EP2 lipid transfer protein gene. Plant Cell 3: 907–921.
St-Pierre B, Laflamme P, Alarco AM, De Luca V. (1998) The terminal O-
acetyltransferase involved in vindoline biosynthesis defines a new class of proteins
responsible for coenzyme A-dependent acyl transfer. Plant J 14:703–13.
Sturaro M, Hartings H, Schmelzer E, Velasco R, Salamini F, Motto M. (2005) Cloning
and characterization of GLOSSY1, a maize gene involved in cuticle membrane and
wax production. Plant Physiol 138: 478–489.
Sugano S, Kaminaka H, Rybka Z. (2003) Stress-responsive zinc finger gene ZPT2-3
plays a role in drought tolerance in petunia. Plant J. 36: 830–841.
Suh MC, Samuels AL, Jetter R, Kunst L, Pollard M, et al. (2005) Cuticular lipid
composition, surface structure, and gene expression in Arabidopsis stem epidermis.
Plant Physiol. 139: 1649–65.
Summers P, Weretilnyk EA. (1993) Choline synthesis in spinach in relation to salt stress.
Plant Physiol. 103: 1269–1276.
Sun W, Van-Montagu M, Verbruggen N. (2002) Small heat shock proteins and stress
tolerance in plants. Biochim Biophys Acta 1577: 1-9.
Susan VB, David MG, Tim TH, Voss SR. (2009) Microarray and cDNA sequence
analysis of transcription during nerve-dependent limb regeneration BMC Bio 7:1
151
Svensson J, Ismail AM, Palva ET, Close TJ. (2002) Dehydrins. In: Storey KB, Storey JM
(eds) Sensing, signaling and cell adaptation. Elsevier, Amsterdam.
Swire-Clark GA, Marcotte WR. (1999) The wheat LEA protein Em functions as an
osmoprotective molecule in Saccharomyces cerevisiae. Plant Mol Biol 39: 117–
128.
Takai Y, Sasaki T, Matozaki T. (2001) Small GTP-binding proteins. Physiol Rev 81:
153–208.
Taler D, Galperin M, Benjamin I, Cohen Y, Kenigsbuch D. (2004) Plant eR genes that
encode photorespiratory enzymes confer resistance against disease. Plant Cell 16:
172–184.
Tardy F, Havaux M. (1996) Photosynthesis, chlorophyll fluorescence, light-harvesting
system and photoinhibition resistance of a zeaxanthin-accumulating mutant of
Arabidopsis thaliana. J Photochem Photobiol B 34: 87–94.
Telfer A, Dhami S, Bishop SM, Phillips D, Barber J. (1994) Beta-carotene quenches
singlet oxygen formed by isolated photosystem II reaction centers. Biochem 33:
14469–14474.
Tena G, Asai T, Chiu WL, Sheen J. (2001) Plant mitogen activated protein kinase
signaling cascades. Curr. Opin. Plant Biol. 4: 392–400.
Thiel G, Wolf AH. (1997) Operation of K+-channels in stomatal movement. Trends Plant
Sci. 2: 339–345
Thoma S, Kaneko Y, Somerville C. (1993) A nonspecific lipid transfer protein from
Arabidopsis is a cell wall protein. Plant J. 3: 427–36.
Thomashow MF. (1998) Role of cold-responsive genes in plant freezing tolerance. Plant
Physiol 118: 1–7.
Thompson AJ, Jackson AC, Parker RA, Morpeth DR, Burbidge A, Taylor IB. (2000)
Abscisic acid biosynthesis in tomato: regulation of zeaxanthin epoxidase and 9-cis-
epoxycarotenoid dioxygenase mRNAs by light/dark cycles, water stress and
abscisic acid. Plant Mol Biol 42: 833–845.
152
Thum KE, Shin MJ, Gutiérrez RA, Mukherjee I, Katari MS, Nero D, Shasha D, Coruzzi
GM. (2008) An integrated genetic, genomic and systems approach defines gene
networks regulated by the interaction of light and carbon signaling pathways in
Arabidopsis. BMC Sys Bio 2:31.
Todd J, Post-Beittenmiller D, Jaworski JG. (1999) KCS1 encodes a fatty acid elongase 3
ketoacyl-CoA synthase affecting wax biosynthesis in Arabidopsis thaliana. Plant J.
17: 119–130.
Tommasini L, Svensson JT, Rodriguez EM, Wahid A, Malatrasi M, Kato K, Wanamaker
S, Resnik J, Close TJ. (2008) Dehydrin gene expression provides an indicator of
low temperature and drought stress: transcriptome-based analysis of Barley
(Hordeum vulgare L.). Function & integr genomics 8(4):387.
Torok Z, Goloubinoff P, Horvath I, Tsvetkova NM, Glatz A, Balogh G, Varvasovszki V,
Los DA, Vierling E, Crowe JH, Vıgh L. (2001) Synechocystis HSP17 is an
amphitropic protein that stabilizes heat-stressed membranes and binds denatured
proteins for subsequent chaperone-mediated refolding. Proc Natl Acad Sci USA 98:
3098–3103.
Torres MA, Dangl JL, Jones JDG. (2002) Arabidopsis gp91phox homologues AtrbohD and
AtrbohF are required for accumulation of reactive oxygen intermediates in the plant
defense response. Proc Natl Acad Sci USA 99: 517-522.
Touraine B, Boutin JP, Poll AM, Briat JF, Peltier G, Lobre´aux S. (2004) Nfu2: a
scaffold protein required for [4Fe-4S] and ferredoxin iron-sulphur cluster assembly
in Arabidopsis chloroplasts. The Plant J 40: 101–111.
Trapp SC, Croteau RB. (2001) Genomic organization of plant terpene synthases and
molecular evolutionary implications. Genetics 158: 811–832.
Trebst A, Depka B, Holla¨nder-Czytko H. (2002) A specific role for tocopherol and of
chemical singlet oxygen quenchers in the maintenance of photosystem II structure
and function in Chlamydomonas reinhardtii. FEBS Lett 516: 156–160.
153
Tsugane K, Kobayashi K, Niwa Y, Ohba Y, Wada K, Kobayashi H. (1999) A recessive
Arabidopsis mutant that grows photoautotrophically under salt stress shows
enhanced active oxygen detoxification. Plant Cell 11: 1195-1206.
Tucker SL, Thornton CR, Tasker K, Jacob C, Giles G, Egan M, Talbot NJ. (2004) A
fungal metallothionein is required for pathogenicity of Magnaporthe grisea. The
Plant Cell 16: 1575– 1588.
Tulloch AP. (1976) Chemistry of waxes of higher plants. In Chemistry and Biochemistry
of Natural Waxes (Kolattukudy, P.E., ed.). Amsterdam: Elsevier, pp. 235–287.
Udall JA, Swanson JM, Haller K, Rapp RA, Sparks ME, Hatfield J, Yu Y, Wu Y, Dowd
C, Arpat AB, et al. (2006) A global assembly of cotton ESTs. Genome Res 16:
441–450.
Usui M, Tanaka S, Miyasaka H, Suzuki Y, Shioi Y. (2007). Characterization of cysteine
protease induced by oxidative stress in cells of Chlamydomonas sp. strain W80.
Physiologia Plantarum 131: 519–526.
Van Harten, AM. (1998) Mutation Breeding Theory and Practical Applications.
Cambridge University Press, Cambridge.
Vera-Estrella R, Barkla BJ, Bohnert HJ, Pantoja O. (2004) Novel regulation of
aquaporins during osmotic stress. Plant Physiol 135: 2318-2329.
Vernoud V, Horton AC, Yang Z, Nielsen E. (2003) Analysis of the Small GTPase Gene
Superfamily of Arabidopsis. Plant Physiol 131: 1191–1208.
Vierling E. (1991) The roles of heat shock proteins in plants. Annu Rev Plant Physiol
Plant Mol Biol 42: 579–620.
Vierling E. Kimpel JA. (1992) Plant responses to environmental stress. Curr Opin
Biotechnol 3: 164–170.
Vierstra RD. (1993) Protein degradation in plants. Annu Rev Plant Physiol Plant Mol
Biol 44: 385–410.
154
von Wettstein-Knowles P. (1987) Barley raincoats: Biosynthesis and genetics. In: Plant
molecular biology. (Von Wettstein D, and Chua NH, eds). New York: Plenum;
305-314.
Walch-Solimena C, Novick P. (1999) The yeast phosphatidylinositol-4-OH kinase pik1
regulates secretion at the Golgi. Nat Cell Biol 1: 523–525.
Walker CKB, Wei Z, Gerald M P, Inder M V, Tony H, Wechter WP, Amnon L, Karen R
H, Angela RD, Zhangjun F, Nurit Kr, James J G, Ayelet SM, Alvaro H, Jyothi T,
Yaakov T, Vitaly P, Tova T. (2008) Gene expression in developing watermelon
fruit. BMC Gen 9:275.
Wallack D. (2001) Genomics and microarrays in an undergraduate research class. Cur. Q.
21: 126–129.
Wang D Luthe DS. (2003) Heat sensitivity in a bentgrass variant. Failure to accumulate a
chloroplast heat shock protein isoform implicated in heat tolerance. Plant Physiol
133: 319-327.
Wang F, Zhang P, Qiang S, Xu LL. (2006). Interaction of Plant Epicuticular Waxes and
Extracellular Esterases of Curvularia eragrostidis during Infection of Digitaria
sanguinalis and Festuca arundinacea by the Fungus. Int. J. Mol. Sci., 7: 346-357.
Wang H, Davis RM. (1997). Susceptibility of selected cotton cultivars to seedling disease
pathogens and benefits of chemical seed treatments. Plant Dis. 81:1085-1088.
Wang N, Fang W, Han H, Sui N, Li B, Meng QW. (2008) Overexpression of zeaxanthin
epoxidase gene enhances the sensitivity of tomato PSII photoinhibition to high light
and chilling stress. Physiol Plant 132: 384-396.
Wang WX, Vinocur B, Altman A. (2003) Plant Responses to Drought, Salinity and
Extreme Temperatures: Towards Genetic Engineering for Stress Tolerance. Planta
218: 1–14.
Waters ER, Lee GJ, Vierling E. (1996) Evolution, structure and function of the small heat
shock proteins in plants. J Exp Bot 47: 325–338.
155
Weete JD, Leek GL, Peterson CM, Currie HE, Branch WD. (1978) Lipid and surface
wax synthesis in water stressed cotton leaves. Plant Physiol. 62: 675-677.
Weig A, Deswarte C, Chrispeels M.J. (1997) The Major Intrinsic Protein Family of
Arabidopsis has 23 members that form three distinct groups with functional
aquaporins in each group. Plant Physiol 114: 1347-1357.
Wen M, Buschhaus C, Jetter R. (2006) Nanotubules on plant surfaces: Chemical
composition of epicuticular wax crystals on needles of Taxus baccata L.
Phytochem 67: 1808–1817.
Wendel AS, Seelanan T. (1995) Bi-directional interlocus concerted evolution following
allopolyploid speciation in cotton (Gossypium), PNAS 92: (1) 280–284.
Wendel JF, Cronn RC. (2003) Polyploidy and the evolutionaryhistory of cotton, Adv in
Agron 78: 139–186,.
Weretilnyk EA, Smith DD, Wilch GA, Summers PS. (1995). Enzymes of Cho synthesis
in spinach: Response of P-base N-methyltransferase activities to light and salinity.
Plant Physiol. 109: 1085–1091.
Wheeler TA, Gannaway JR, Keating K. (1999) Identification of Resistance to
Thielaviopsis basicola in Diploid Cotton J.plant diseases, 83: 831-833.
Wilms J, Eltz T. (2008) Foraging scent marks of bumblebees: footprint cues rather than
pheromone signals. Naturwissenschaften 95:149–153.
Wu MS, Yi SL, Yu TC, Chia TS, Ming TL, Jaw TL. (2005) Gene expression profiling of
gastric cancer by microarray combined with laser capture microdissection; World J
Gastroenterol 21;11(47): 7405-7412
Wullschleger SD, Oosterhuis DM. (1989) The occurrence of an internal cuticle in cotton
(Gossypium hirsutum) leaf stomataes. J. Environ. Exp. Bot. 29: 229-235.
Xia Y, Nikolau BJ, Schnable PS. (1996) Cloning and characterization of CER2, an
Arabidopsis gene that affects cuticular wax accumulation. Plant Cell 8:1291–304.
156
Xiong L, Gong Z, Rock CD, Subramanian S, Guo Y, Xu W, Galbraith D, Zhu JK. (2001)
Modulation of abscisic acid signal transduction and biosynthesis by an Sm-like
protein in Arabidopsis. Dev. Cell 1: 771-781.
Xiong Y, Anthony L, Contento1, Nguyen PQ, Bassham DC. (2007). Degradation of
oxidized proteins by autophagy during oxidative stress in Arabidopsis. Plant
Physiol 143: 291-299.
Xu D, Duan X, Wang B, Hong B, Ho T, Wu R. (1996). Expression of a late
embryogenesis abundant protein gene, HVA1, from barley confers tolerance to
water deficit and salt stress in transgenic rice. Plant Physiol 110:249–257.
Xu X, Dietrich CR, Delledonne M, Xia Y, Wen TJ. (1997) Sequence analysis of the
cloned glossy 8 gene of maize suggests that it may code for a β-ketoacyl reductase
required for the biosynthesis of cuticular waxes. Plant Physiol. 115: 501–10.
Xue T, Li X, Zhu W, Wu C, Yang G and Zheng C, (2008). Cotton metallothionein
GhMT3a, a reactive oxygen species scavenger, increased tolerance against abiotic
stress in transgenic tobacco and yeast.
Xue ZY, Zhi DY, Xue GP, Zhang H, Zhao YX, Xia GM. (2004) Enhanced salt tolerance
of transgenic wheat (Triticum aestivum L.) expressing a vacuolar Na+/H+
antiporter gene with improved grain yields in saline soils in the field and a reduced
level of leaf Na+, Plant Sci. 167: 849–859.
Yahyaoui El F, Kuster H, Ben Amor B, Hohnjec N, Puhler A, Becker A, Gouzy J, Vernie
T, Gough C, Niebel A, et al. (2004) Expression profiling in Medicago truncatula
identifies more than 750 genes differentially expressed during nodulation, including
many potential regulators of the symbiotic program. Plant Physiol 136: 3159–3176.
Yakimova E T, Toteva VMK, Woltering EJ. (2007) Signal transduction events in
aluminum-induced cell death in tomato suspension cells. J of Plant Physiol 164:
702-708.
157
Yamaguchi-Shinozaki K, Kasuga M, Liu Q, Nakashima K, Sakuma Y, Abe H, Shinwari
ZK, Seki M, Shinozaki K. (2002) Biological mechanisms of drought stress
response. JIRCAS Working Report.
Yamamoto Y, Kobayashi Y, Matsumoto H. (2001) Lipid peroxidationas an early
symptom triggered by alluminum, but not the primary cause of elongation
inhibition in pea roots. Plant Physiol 125:199–208.
Yan C, Pendola FL, Jacob R., Lau AL, Eppig JJ, Matzuk MM. (2001) Oosp1 encodes a
novel mouse oocyte-secreted protein. Genesis 31: 105-110.
Yancey PH, Clark ME, Hand SC, Bowlus RD, Somero GN (1982) Living with water
stress: evolution of osmolyte systems. Sci 217: 1214–1222.
Yao J, Ren X, Ireland JJ, Coussens PM, Smith TPL, Smith GW. (2004) Generation of a
bovine oocyte cDNA library and microarray: resources for identification of genes
important for follicular development and early embryogenesis. Physiol Genomics
19: 84–92.
Yephremov A, Wisman E, Huijser P, Huijser C, Wellesen K, Saedler H. (1999)
Characterization of the FIDDLEHEAD gene of Arabidopsis reveals a link between
adhesion response and cell differentiation in the epidermis. Plant Cell 11: 2187–
202.
Yusuf Z, Shahid M, Shaheen A, Rob B, Idrees M, Waheed SK, Peter M, Judith KB
Kauser AM. (2003) Genome Characterization of Whitefly-transmitted Geminivirus
of Cotton and Development of Virus resistant Plants Through Genetic Engineering
and Conventional Breeding. ICAC 12-16.
Zachowski A, Guerbette F, Grosbois M, Jolliot-Croquin A, Kader JC. (1998)
Characterisation of acyl binding by a plant lipid-transfer protein. Eur. J. Biochem.
257: 443–48.
Zatta P, Raso M, Zambenedetti P, Wittkowski W, Messori L, Piccioli F, Mauri PL,
Beltramini M. (2005) Copper and zinc dismetabolism in the mouse brain upon
chronic cuprizone treatment. Cell and Molecular Life Science 62: 1502–1513.
158
Zhang H, GUO C, LI C, XIAO K. (2008) Cloning, characterization and expression
analysis of two superoxide dismutase (SOD) genes in wheat (Triticum aestivum L.)
Front. Agric. China. 2(2): 141–149.
Zhang HX, Blumwald E. (2001) Transgenic salt-tolerant tomato plants accumulate salt in
foliage but not in fruit, Nat. Biotech. 19: 765–768.
Zhang, S., and Klessig, D.F. (2001). MAPK cascades in plant defense signaling. Trends
Plant Sci. 6: 520–527.
Zhigang A, Cuijie L, Yuangang Z, Yejie D, Wachter A, Gromes R, Rausch T. (2006)
Expression of BjMT2, a metallothionein 2 from Brassica juncea, increases copper
and cadmium tolerance in Escherichia coli and Arabidopsis thaliana, but inhibits
root elongation in Arabidopsis thaliana seedlings. J of Exp Bot 57: 3575–3582.
Zhu D, Scandalios JG. (1994) Differential accumulation of manganese-superoxide
dismutase transcripts in maize in response to absicisic acid and high osmoticum.
Plant Physiol 106: 173–178.
Zhu, JK. (2001) Plant salt tolerance. Trends Plant Sci. 6: 66–71.
Zimmermann P, Hirsch-Hoffmann M, Hennig L, Gruissem W. (2004)
GENEVESTIGATOR. Arabidopsis Microarray Database and Analysis Tool box.
Plant Physiol. 136: 2621-2632.
Zwenger S, Basu C. (2007) In silico analysis of terpene synthase genes in Arabidopsis
thaliana. EXCLI Journal 6:203-211.
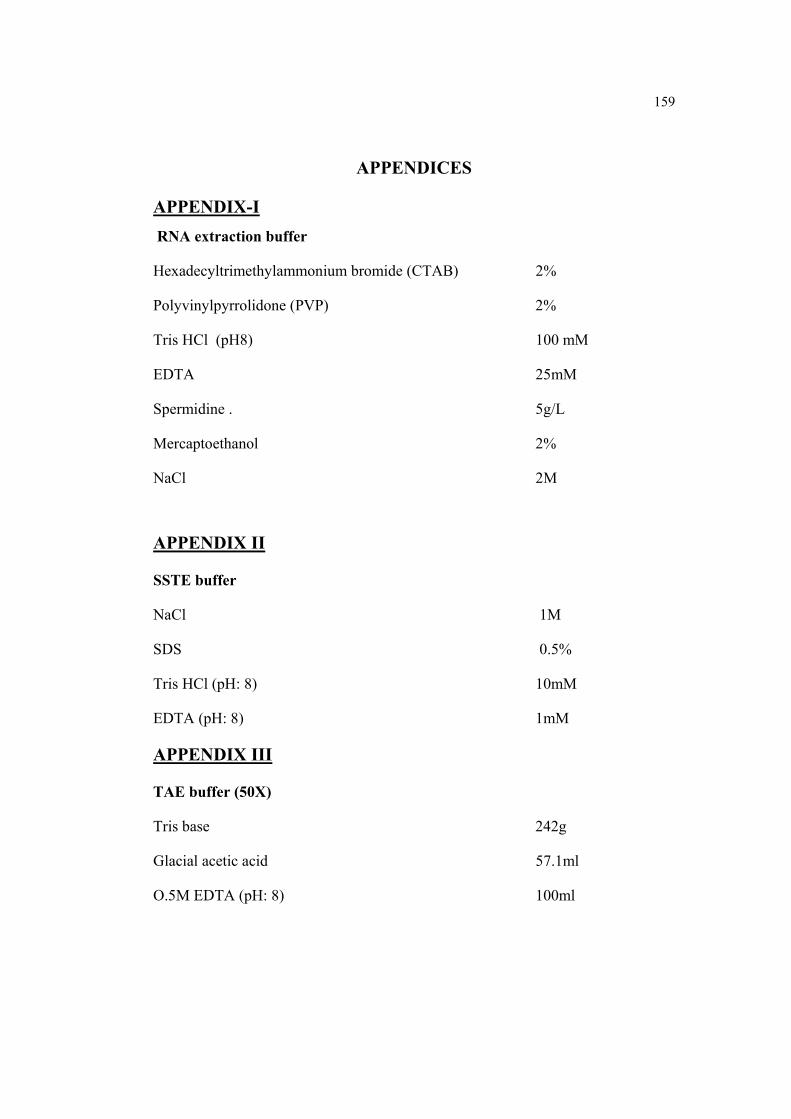
159
APPENDICES
APPENDIX-I RNA extraction buffer
Hexadecyltrimethylammonium bromide (CTAB) 2%
Polyvinylpyrrolidone (PVP) 2%
Tris HCl (pH8) 100 mM
EDTA 25mM
Spermidine . 5g/L
Mercaptoethanol 2%
NaCl 2M
APPENDIX II
SSTE buffer
NaCl 1M
SDS 0.5%
Tris HCl (pH: 8) 10mM
EDTA (pH: 8) 1mM
APPENDIX III
TAE buffer (50X)
Tris base 242g
Glacial acetic acid 57.1ml
O.5M EDTA (pH: 8) 100ml
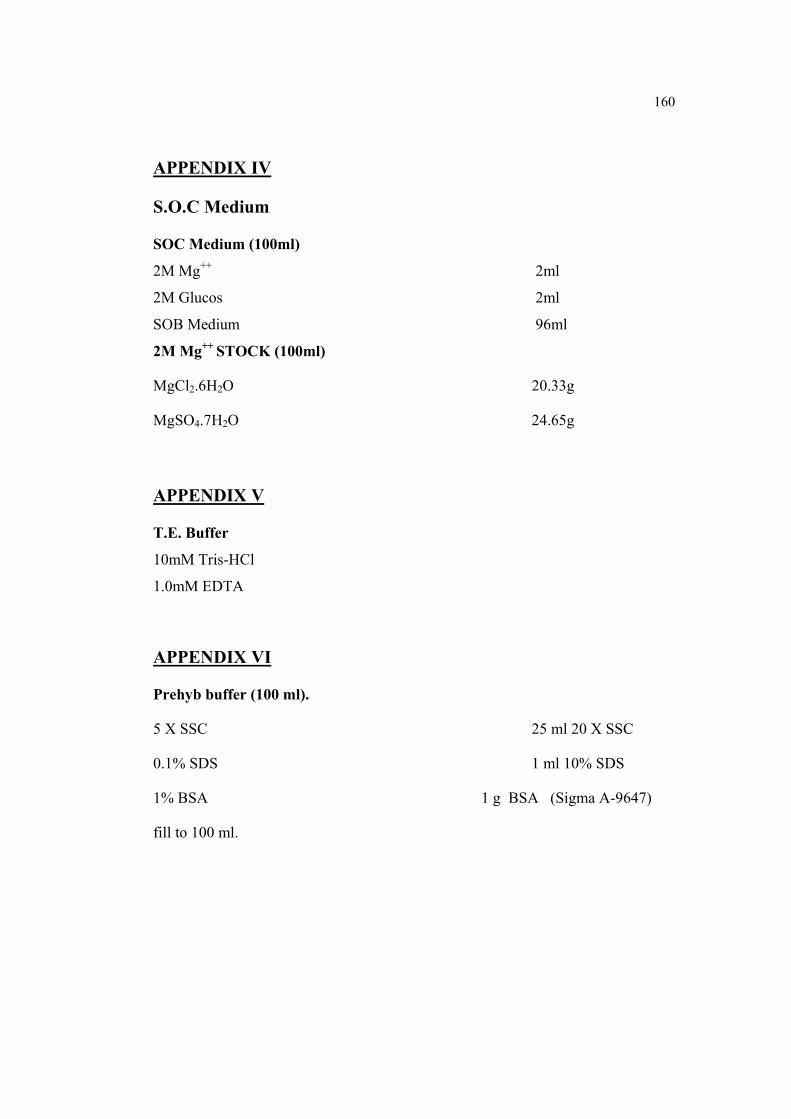
160
APPENDIX IV
S.O.C Medium
SOC Medium (100ml)
2M Mg++ 2ml
2M Glucos 2ml
SOB Medium 96ml
2M Mg++ STOCK (100ml)
MgCl2.6H2O 20.33g
MgSO4.7H2O 24.65g
APPENDIX V
T.E. Buffer
10mM Tris-HCl
1.0mM EDTA
APPENDIX VI
Prehyb buffer (100 ml).
5 X SSC 25 ml 20 X SSC
0.1% SDS 1 ml 10% SDS
1% BSA 1 g BSA (Sigma A-9647)
fill to 100 ml.

161
APPENDIX VII
2X Hybridization buffer:
50% Formamide 5 ml
10X SSC 5 ml 20X SSC
0.2% SDS 200 ul 10% SDS