Global patterns of bacterial beta-diversity in seafloor and seawater ecosystems

Article
Volume 13, Number 4
19 April 2012
Q04007, doi:10.1029/2011GC003990
ISSN: 1525-2027
Structure, temporal evolution, and heat flux estimatesfrom the Lucky Strike deep-sea hydrothermal fieldderived from seafloor image mosaics
Thibaut Barreyre and Javier EscartínMarine Geosciences Group, Institut de Physique du Globe de Paris, CNRS, UMR 7154–Univ. ParisDiderot, Sorbonne Paris Cité, Paris CEDEX 5, France ([email protected])
Rafael GarciaComputer Vision and Robotics Group, University of Girona, Girona E-17001, Spain
Mathilde CannatMarine Geosciences Group, Institut de Physique du Globe de Paris, CNRS, UMR 7154–Univ. ParisDiderot, Sorbonne Paris Cité, Paris CEDEX 5, France
Eric MittelstaedtWoods Hole Oceanographic Institution, Woods Hole, Massachusetts 02543, USA
Ricard PradosComputer Vision and Robotics Group, University of Girona, Girona E-17001, Spain
[1] Here we demonstrate with a study of the Lucky Strike hydrothermal field that image mosaicing overlarge seafloor areas is feasible with new image processing techniques, and that repeated surveys allowtemporal studies of active processes. Lucky Strike mosaics, generated from >56,000 images acquired in1996, 2006, 2008 and 2009, reveal the distribution and types of diffuse outflow throughout the field,and their association with high-temperature vents. In detail, the zones of outflow are largely controlledby faults, and we suggest that the spatial clustering of active zones likely reflects the geometry of theunderlying plumbing system. Imagery also provides constraints on temporal variability at two time-scales.First, based upon changes in individual outflow features identified in mosaics acquired in different years,we document a general decline of diffuse outflow throughout the vent field over time-scales up to 13 years.Second, the image mosaics reveal broad patches of seafloor that we interpret as fossil outflow zones,owing to their association with extinct chimneys and hydrothermal deposits. These areas encompass theentire region of present-day hydrothermal activity, suggesting that the plumbing system has persistedover long periods of time, loosely constrained to hundreds to thousands of years. The coupling of mosaicinterpretation and available field measurements allow us to independently estimate the heat flux of theLucky Strike system at�200 to 1000 MW, with 75% to >90% of this flux taken up by diffuse hydrothermaloutflow. Based on these heat flux estimates, we propose that the temporal decline of the system at shortand long time scales may be explained by the progressive cooling of the AMC, without replenishment.The results at Lucky Strike demonstrate that repeated image surveys can be routinely performed to char-acterize and study the temporal variability of a broad range of vent sites hosting active processes (e.g., coldseeps, hydrothermal fields, gas outflows, etc.), allowing a better understanding of fluid flow dynamicsfrom the sub-seafloor, and a quantification of fluxes.
Copyright 2012 by the American Geophysical Union 1 of 29

Components: 15,100 words, 11 figures, 5 tables.
Keywords: heat fluxes; hydrothermal activity; image mosaics; mid-ocean ridges; temporal variability.
Index Terms: 0540 Computational Geophysics: Image processing; 3017 Marine Geology and Geophysics: Hydrothermalsystems (0450, 1034, 3616, 4832, 8135, 8424); 3035 Marine Geology and Geophysics: Midocean ridge processes.
Received 8 December 2011; Revised 21 February 2012; Accepted 28 February 2012; Published 19 April 2012.
Barreyre, T., J. Escartín, R. Garcia, M. Cannat, E. Mittelstaedt, and R. Prados (2012), Structure, temporal evolution, and heatflux estimates from the Lucky Strike deep-sea hydrothermal field derived from seafloor image mosaics, Geochem. Geophys.Geosyst., 13, Q04007, doi:10.1029/2011GC003990.
1. Introduction
[2] Hydrothermal activity along mid-ocean ridgesaccounts for �30% (�11 TW) of the oceanicheat flux (�32 TW), and is therefore responsiblefor approximately �25% of the Earth’s heat loss(�43 TW) [Stein and Stein, 1994; Elderfield andSchultz, 1996]. Convection of fluids in the litho-sphere is driven by heat sources at depth (magmabodies, hot lithospheric material, exothermic reac-tions [e.g., Wilcock and Delaney, 1996; Emmanueland Berkowitz, 2006]), and plays a major role inoceanic crust formation on-axis. The dynamics ofthese systems depends on numerous parameters,including the presence of tectonic features (i.e.,faults and cracks) acting as fluid pathways, thephysical properties of the substrate (porosity, per-meability), and the nature and distribution of heatsources, as well as temporal variability (seismicity,magmatic injections, lithospheric thermal evolu-tion). Fluid discharge at the seafloor often occurs inwell-defined hydrothermal fields that extend overareas of up to�1 km2, along mid-ocean ridges [e.g.,German et al., 2010a]. The nature and geometry offluid recharge at hydrothermal systems is poorlyknown, but assumed to occur over a broader areathan that of the discharge zone (e.g., along faultedzones flanking the ridge axis) [Lister, 1982; Alt,1995; Wilcock and Delaney, 1996]. The focusingof hydrothermal discharge is most extreme at slow-spreading ridges [Fontaine and Wilcock, 2007],where sites are larger and associated with higherheat fluxes than those along intermediate- and fastspreading ridges [Baker, 2007].
[3] Two major types of hydrothermal outfloware often distinguished: a) focused, high tempera-ture (>300�C) vents [Spiess et al., 1980; VonDamm, 1990] and b) diffuse flow [Baker et al.,1993; Fisher and Becker, 1991; Trivett andWilliams, 1994] at temperatures that vary from afew degrees above ambient seawater to �150�C.
The partitioning of heat flux between diffuseand focused flow is variable, from sites showingno apparent diffuse flow (e.g., Rainbow [Germanet al., 2010b]), to sites with diffuse flow takingfrom 50% [e.g., Veirs et al., 2006] up to 90% [e.g.,Schultz et al., 1992; Ramondenc et al., 2006] of theheat flux. These disparities likely reflect fundamentaldifferences in the subsurface outflow structure asso-ciated with discharge zones, impacting on themixing of cold seawater and hydrothermal fluids.
[4] To date, the extent of diffuse outflow is poorlyconstrained, owing to the fact that hydrothermalsites are characterized largely through visualobservations during ROV and submersible dives,providing only local and partial information, and inthe absence of systematic image seafloor surveys.The first of such surveys was carried out in 1976,and provided sparse coverage along the FAMOUSsegment (Mid-Atlantic Ridge) [Brundage andPatterson, 1976]. The first optical mapping ofhydrothermal fields was conducted with the ARGOIIdeep-towed system at the TAG and Lucky Strikefields [Kleinrock and Humphris, 1996; Humphriset al., 2002]. Recent developments in image acqui-sition techniques and underwater vehicles haveallowed a wide range of new seafloor studies (e.g.,archeology [Foley et al., 2009], seeps [Valentineet al., 2010; Lessard-Pilon et al., 2010], asphaltflows [Brüning et al., 2010], whale falls [Lundstenet al., 2010], as well as hydrothermal fields [Makiet al., 2008]). However, all these more recent sur-veys are limited to a small surface area (e.g.,10,000 m2 [Maki et al., 2008]), and thus not welladapted to map a complete hydrothermal fieldsuch as that of Lucky Strike. In recent years, wehave developed new image-processing techniques[Escartín et al., 2008a; Garcia et al., 2011; Pradoset al., 2011] tailored to map large areas of upto 1 km2 or more, thus expanding the possibleapplications for seafloor image surveying and theirquantitative interpretation.
GeochemistryGeophysicsGeosystems G3G3 BARREYRE ET AL.: HYDROTHERMAL OUTFLOW AND IMAGE MOSAICS 10.1029/2011GC003990
2 of 29

[5] For the first time, we present a systematic imagemapping of a complete hydrothermal field, at theLucky Strike segment along the Mid-AtlanticRidge (MAR), one of the largest and best-knowndeep-sea systems of its kind (see Section 2). Here,the hydrothermal outflow is located at the segmentcenter [Langmuir et al., 1997], overlying a 3-kmdeep magma chamber [Singh et al., 2006], andalong an axial extensional graben at the summit ofa central volcano. The image mosaics, generatedusing new image processing techniques, togetherwith ground-truthing from submersible dives, con-strain the surface structure, nature, and distributionof active hydrothermal venting throughout thewhole Lucky Strike hydrothermal site. In contrast,discrete observations at individual sites (e.g., visualinspection with remotely operated vehicles – ROVs -or submersibles) preclude the type of comprehen-sive characterization of the seafloor that imagemosaics provide. Prior studies have suggested anassociation between hydrothermal outflow andsmall-scale tectonic features (faults, fissures), bothat the Lucky Strike hydrothermal field [Ondréaset al., 2009] and elsewhere [Haymon et al., 2005;Bohnenstiehl and Kleinrock, 2000a, 2000b]; thisassociation to tectonic structures is also foundwithin well-developed fault zones (e.g., oceanicdetachments [e.g., McCaig et al., 2007; Escartínet al., 2008b]). Mosaic interpretation allow us toevaluate and quantify this association betweenhydrothermal outflow and faulting, while con-straining the overall distribution of active venting.We propose that the outflow geometry derivedfrom the image mosaics can be used to infer thegeometry of underlying plumbing system. Fur-thermore, repeated surveys reveal change inhydrothermal activity at time-scales of 1 to13 years at the Lucky Strike site, while theirgeological interpretation indicates variability atlonger time scales (100 s to 1000 s of years?).We combine the mosaic interpretation withavailable field measurements of fluid flow andtemperature to provide an estimate of heat flux,which is independent of estimates based on watercolumn studies yielding fluxes of 100 to�4000 MW [Wilson et al., 1996; Jean-Baptisteet al., 1998], and its partition between focused anddiffuse flow.
2. Geological Setting of the Lucky StrikeSegment and Hydrothermal Field
[6] The �80 km long Lucky Strike ridge segmentextends along the Mid-Atlantic Ridge between
37�03′N and 37�37′N (Figure 1a), is located�400 km southwest of the Azores Islands, andspreads at a full rate of �22 mm/yr [DeMets et al.,1990; Cannat et al., 1999]. It has a well-developedrift valley with a central volcano underlain by a3-km deep axial magma chamber (AMC) [Singhet al., 2006; Combier, 2007] (Figures 1b and 1c).The volcano summit hosts the Lucky Strike field(LS), with hydrothermal activity surrounding afossil lava lake [Fouquet et al., 1995; Ondréaset al., 1997, 2009; Humphris et al., 2002], andassociated with a local low in seafloor magnetization[Miranda et al., 2005] likely due to basalt alteration[Tivey and Johnson, 2002]. Discovered during the1992 FAZAR cruise [Langmuir et al., 1993;Wilsonet al., 1996], the Lucky Strike hydrothermal fieldhas been extensively studied during recent expedi-tions (DIVA1 and FLORES, 1994; LUSTRE, 1996;MoMARETO and Graviluck, 2006; MoMAR,2008; Bathyluck, 2009; MoMARSAT 2010 and2011), and is the object of long-term monitoring[e.g., Ballu et al., 2009; Colaço et al., 2011],including a seafloor observatory (ESONET-EMSOEuropean project [Ruhl et al., 2011]). Hydrothermalchimneys, mounds, and associated areas of diffuseoutflow [Humphris et al., 2002; Ondréas et al.,2009] extend over 1 km2. The substrate is primar-ily basalt, locally overlain by either massive sulfidedeposits (NE of the hydrothermal field), or bya hydrothermally cemented breccia forming a‘hydrothermal slab’ cap [Langmuir et al., 1997;Ondréas et al., 1997, 2009]. The area is crosscutby numerous normal faults [e.g., Scheirer et al.,2000; Humphris et al., 2002; Ondréas et al., 1997,2009], associated with a small axial graben (�1 kmwide) that runs along the axial valley floor and thatdissects the volcano. These faults may operateas outflow conduits, controlling hydrothermal dis-charge to the seafloor and spatial distribution ofmain vents [Ondréas et al., 2009]. The geochem-istry of hydrothermal fluids reveals a reaction zonewhose depth is poorly constrained at 1 km to 3 km[Charlou et al., 2000; Fontaine et al., 2009], butlimited to the crust above the AMC. Furthermore,there is both a spatial and limited temporal variabilityin end-member major elements compositions ofthe vent fluids, whose origin is not well-understood(e.g., plumbing system, reaction zone at depth). Ithas been suggested that these reflect two majordistinct source waters feeding the southeastern, andthe northeastern and western vents [e.g., Von Dammet al., 1998; Charlou et al., 2000]. This site wit-nessed a possible dike intrusion in 2002, whichmay have reinvigorated hydrothermal activity asindicated by an apparent and local increase in
GeochemistryGeophysicsGeosystems G3G3 BARREYRE ET AL.: HYDROTHERMAL OUTFLOW AND IMAGE MOSAICS 10.1029/2011GC003990
3 of 29

Figure 1
GeochemistryGeophysicsGeosystems G3G3 BARREYRE ET AL.: HYDROTHERMAL OUTFLOW AND IMAGE MOSAICS 10.1029/2011GC003990
4 of 29

microbial activity observed between 1997 and 2003[Dziak et al., 2004].
[7] Recent geophysical studies also constrain thenature and properties of the crust above the AMC.Seismic reflection and refraction studies reveal thatthe crustal volume underlying the hydrothermalfield (below the central volcano and above the axialmagma chamber) is characterized by a low-velocityanomaly both from refraction and reflection data[Seher et al., 2010a, 2010b], in addition to reflec-tors that correspond to the main faults developedwithin the rift valley floor [e.g., Combier, 2007;V. Combier et al., Three-dimensional geometry ofaxial magma chamber roof and faults at LuckyStrike volcano on the Mid-Atlantic Ridge, submit-ted to Journal of Geophysical Research, 2011].This low-velocity anomaly is interpreted to bedue to increased porosity relative to surroundingcrust. However, the spatial resolution of these data(�50 m along seismic profiles and >100 m acrossthem for reflection data [Seher et al., 2010b],and >1 km for seismic refraction data [Seheret al., 2010a]) is too coarse to relate the surfacedistribution of discharge zones to the underlyingplumbing system (porosity and fluid contents)below the seafloor.
3. Methodology
3.1. Seafloor Image Surveys
[8] Image surveys of the seafloor at Lucky Strikewere carried out in 1996, 2006, 2008, and 2009,using down-looking electronic black-and-white stillcameras (Figure 1b). Deep-towed systems wereused during the LUSTRE’96 cruise (ARGO IIsystem, WHOI, USA) [Humphris et al., 2002;Escartín et al., 2008a] and the 2006 GraviluckCruise (TowCam system [Fornari, 2003]). A high-sensitivity, black and white electronic still camera(OTUS [Simeoni et al., 2007]) mounted on theROV VICTOR6000 (IFREMER, France) was usedduring the Momareto 2006, MoMAR2008, andBathyluck 2009 cruises. All these surveys focused
on the known active vents at the Lucky Strikehydrothermal field. The 1996 and 2008 surveyswere the most extensive throughout the LuckyStrike field, allowing a detailed characterization ofactively venting areas, including the spatial distri-bution of outflow zones, their styles, and theirrelationship to substrate and structure. The 2006and 2009 surveys, while more limited, allowed theextension of the area surveyed in 1996 and 2008.These also provided overlap for temporal studies,particularly at well-known and studied sites (e.g.,Tour Eiffel and Montsegur vents). The TowCamtrack across the field (Graviluck 2006) was excludedfrom this study due to its limited coverage andoverlap with the other surveys (Figure 1b). We havefully imaged �0.65 km2 of seafloor with >56,000electronic still-images, with a coverage of >60%for the combined mosaic. Survey geometries andtheir characteristics are reported in Figure 2 andTable 1. This is the most extensive and completeimage survey of an underwater hydrothermal ventfield, and the resulting seafloor image mosaics arethe largest of their kind to date.
[9] Owing to the lower image quality and char-acteristics of the Lustre’96 mosaic, this data set wasnot used in the digitization of active venting fea-tures. Individual images from this survey underwenta contrast-limited adaptive histogram equalization,and the original unequalized images are no longeravailable (see Escartín et al. [2008a] for details).The resulting mosaic is thus more difficult to inter-pret than those derived from OTUS imagery (2006,2008, 2009 surveys), and here it is solely used toidentify temporal variation in areas where activehydrothermal areas can be positively identified.
3.2. Image Processing and Mosaic Building
[10] Images were vertically acquired with an elec-tronic still camera mounted on a deep-tow systemor ROV and flown at an altitude of �5–10 m fromthe seafloor. In all surveys, image acquisitionwas synchronized with strobe lights. The mosaic-building procedure is briefly summarized here and
Figure 1. (a) Bathymetric map of the Lucky Strike segment. Black box shows the location of Figures 1b, 1c, and 1d,the summit of the central volcano of Lucky Strike. (b) Bathymetric map zoomed and without any tracklines. Black lineshows the contour of MoMARETO’06 bathymetic map box used for interpretation in Figures 5, 7, and 8; and redshaded area show emplacement of the AMC. (c) Navigation tracks for image surveys, acquired using the OTUS systemmounted on ROV Victor 6000 (MoMARETO’06, MOMAR’08 and Bathyluck’09) and the ARGO II and TowCamdeep-towed systems (Lustre’96 and Graviluck’06, respectively). The limits of the AMC are also indicated; the north-ern and southern terminations correspond to the limits of the seismic survey, and hence the AMC may extend furtheralong-axis. (d) Navigation tracks of ROV VICTOR and HOV Nautile, with video imagery used to ground-truth theinterpretation of the image mosaics. Bathymetry in Figures 1b, 1c, and 1d is from combined high-resolution seismics[Combier, 2007] and multibeam bathymetry [Cannat et al., 1999; Escartín et al., 2001].
GeochemistryGeophysicsGeosystems G3G3 BARREYRE ET AL.: HYDROTHERMAL OUTFLOW AND IMAGE MOSAICS 10.1029/2011GC003990
5 of 29

Figure 2. Maps showing the image mosaic coverage (white) for the electronic still image surveys at the Lucky Strikevent field for the (a) 1996, (b) 2006, (c) 2008, and (d) 2009 surveys. (e) The overall coverage and areas of overlap(tones of gray) are shown.
GeochemistryGeophysicsGeosystems G3G3 BARREYRE ET AL.: HYDROTHERMAL OUTFLOW AND IMAGE MOSAICS 10.1029/2011GC003990
6 of 29
a full description and technical details are availableelsewhere [Prados et al., 2011]. First, acquiredraw images are pre-processed to a) correct foruneven illumination from the lighting system andimaging geometry, b) equalize overall intensityamong images, and c) correct the optical geometricdistortion due to the camera lenses. This last cor-rection requires a calibration to recover the intrinsiccamera parameters, which was performed during theBathyluck’09 cruise for the OTUS camera, and thenused for the 2006, 2008 and 2009 mosaics, whichwere acquired with the same imaging system. Pre-processed images are scaled, rotated, and projected,to generate a navigation-based mosaic [Escartín etal., 2008a] using vehicle navigation (location, alti-tude, heading, pitch and roll). Navigation was givenby an USBL acoustic system, and location errors(�1–10 m depending on water depth and surveyconditions) are orders of magnitude higher than theimage (pixel) resolution (�1–10 mm). Image-basedre-navigation of all surveys is therefore required.Matching of features from both consecutive andnon-consecutive images is used to correct camera(vehicle) navigation. Feature matching and naviga-tion corrections are iterated through an optimiza-tion. The final camera navigation trajectory allowsthe projection and geographical co-registrationof images at the pixel level for all surveys. Imageblending techniques are then applied to the mosaicto remove image edges and other mosaicing arti-facts, and to insure that higher resolution imageryacquired closer to the seafloor is retained preferen-tially in areas with overlapping frames. This pro-cessing renders a seamless, single mosaic image[Prados et al., 2011], with �230,000 � 150,000pixels at a resolution of 5 to 10 mm for the LuckyStrike data set (Table 1). Available near-bottom mul-tibeam bathymetry (Momareto’06 cruise [Ondréaset al., 2009]), which has a nominal horizontal reso-lution of 0.4 m and 1.5 m, provides information
on seafloor morphology and tectonic structures (i.e.,faults) that may be associated with hydrothermaldischarge. As the navigation and processing ofimagery and multibeam data were carried outindependently, these data sets show relative offsetsthat are typically less than 10 m for well-knownsites (e.g., Tour Eiffel, Montsegur, and Sintra).
3.3. Identification of Active HydrothermalOutflow Zones
[11] Hydrothermal structures are clearly identifiablein the acquired seafloor imagery, and ground-truthed with in situ observations (e.g., video andstill images from ROV or HOV dives, Figure 3).High temperature vents, with outflow temperaturesof >200�C, are associated with plumes. Diffuseoutflow at Lucky Strike is often associated withareas that contain white mats of philamentous bac-teria in addition to macrofauna (e.g., mussels)(Figure 3a) [Sarradin et al., 1999; Desbruyèreset al., 2001; Martins et al., 2009], in associationwith anhydrite deposits, which have a white-mottledsurface [e.g., Langmuir et al., 1997; Cuvelier et al.,2009]. Bacterial mats develop at temperatures<50�C [Sarrazin et al., 2009], while anhydrateprecipitates from seawater due to its retro-saturationwhen heated by hydrothermal fluids to tempera-tures of ≥100–150�C [Bischoff and Seyfried, 1978;Møller, 1988]; anhydrite deposits in contact withambient-temperature seawater are re-dissolved[Van Dover, 2000]. Bacterial mats thus developeither in association with lower-temperature fluids(<50�C), or in the area of mixing of higher-tem-perature fluids and seawater. Consequently boththe bacterial mats and anhydrite are reliable indi-cators of zones of hydrothermal outflow that areprimarily diffuse with fluid temperatures as highas 150�C locally. Where bacterial mats are absent,hydrothermal deposits (anhydrite) are systematically
Table 1. Characteristics of Electronic Still Camera Image Surveys and Resulting Mosaics at the Lucky StrikeHydrothermal Field
Cruise Year Vehicle Number of Photos Surfacea (m2) Coverageb (%) Hours of Survey Resolutionc (mm)
Lustre 1996 ARGOII 20283 388080 39 117 10Momareto 2006 Victor 4626 149881 63 34 10MoMAR 2008 Victor 21262 267179 80 101 10Bathyluck 2009 Victor 10331 201592 72 33 5Combined mosaic 56502 645339d 62 285 5, 10
aSurface of imaged seafloor by final seafloor image mosaics.bCoverage: % of seafloor imaged by the mosaic imagery, within the surveyed area as delimited by the outline of survey tracks.cThe mosaic resolution corresponds to the pixel size in the final image.dWith repeated surveys, the reported surface corresponds to that of the final, combined mosaic, and does not include areas previously imaged
(overlapping).
GeochemistryGeophysicsGeosystems G3G3 BARREYRE ET AL.: HYDROTHERMAL OUTFLOW AND IMAGE MOSAICS 10.1029/2011GC003990
7 of 29

Figure 3. Photos and mosaic images of active diffuse outflow observed at Lucky Strike. (a) Two pictures showingbacterial mats, mussels and hydrothermal deposits associated to low-temperature diffuse venting. Examples of imagemosaics (left) and corresponding oblique-view ROV imagery (right) of focused (Figure 3b) and diffuse venting(Figures 3c–3f), and of fossil outflow zones (Figures 3g and 3h). (b) South Crystal vent site, showing a hydrother-mal mound with four high-temperature vents (numbers). (c) Patch of diffuse venting and associated bacterial mat.(d) Network of cracks at the Y3 site, at the base of a �20-m high chimney. (e) North section of a hydrothermalmound at the Montsegur site. (f) Streaks of hydrothermal deposits remobilized downslope by gravitational processes.Numbers indicate matching features. The zone of diffuse active hydrothermal outflow is located under 2 (right image).(g and h) Dark seafloor patches interpreted as fossil outflow zones. Dashed line in the oblique view (right) correspondsto the limits mapped in the mosaic (left). Numbers indicate matching features at the oblique-view and mosaic images,and the arrows in the mosaic indicate the direction of the oblique view (Figures 3b–3h).
GeochemistryGeophysicsGeosystems G3G3 BARREYRE ET AL.: HYDROTHERMAL OUTFLOW AND IMAGE MOSAICS 10.1029/2011GC003990
8 of 29

associated with focused high temperature sources,and therefore indicate recent or active outflow.
[12] Actively venting areas can thus be readily iden-tified through visual inspection of image mosaics and
associated oblique-view imagery. Using dedicatedimage-viewing software (see Escartín et al. [2008a]for details), we digitized the limits of individualfeatures, based on the full-resolution mosaic scenes(areas �10 m wide, with a pixel resolution of
Figure 3. (continued)
GeochemistryGeophysicsGeosystems G3G3 BARREYRE ET AL.: HYDROTHERMAL OUTFLOW AND IMAGE MOSAICS 10.1029/2011GC003990
9 of 29

5–10 mm), as described below. Close inspection ofthe data have allowed us to identify active and fossilhigh temperature vents, and four types of diffuseoutflow at Lucky Strike, likely associated with dif-ferent flow regimes, and these have been digitizedseparately. For the purpose of this digitization, weprimarily use the 2008 mosaic, which provides themost complete coverage of the field. The remainingmosaics complement the interpretation at gaps andunmapped areas (Figures 1b and 2).
[13] In addition to hydrothermal deposits and bac-terial mats, the imagery reveals other white areasthat are not related to hydrothermal activity. Theseinclude sediments with a white appearance in theblack-and white imagery, overexposed frames dueto image acquisition at close range, or shell chaff onseafloor, primarily in the vicinity of actively vent-ing sites. These features are readily distinguishable
from the active hydrothermal areas, and are there-fore not included in the interpretation. Features thatwe could not positively identify as hydrothermalwere not digitized.
3.3.1. Active High-Temperature Ventsand Chimneys
[14] High-temperature fluids venting at chimneysand hydrothermal mounds are easily recogniz-able visually in oblique-view imagery (ROV orsubmersible) owing to their morphology and size,and the presence of plumes in the water column(Figure 3b). Their identification is more difficult invertical-view imagery, owing to their sub-verticalstructure and small footprint (Figure 3b), even ifthe main venting areas are well known [Langmuiret al., 1997; Humphris et al., 2002; Ondréas et al.,2009]. Vent locations are determined primarily in
Table 2. List of Active, High-Temperature Hydrothermal Sites at Lucky Strike, With Their Position and Depth,Identified From Mosaic Images and ROV Observationsa
Sites Xutm (m) Yutm (m) Lon. (W) Lat. (N) Depth (m) Matching
SEMontsegurb 564214 4127075 32� 16.534′ 37� 17.284′ 1701 U.S.4/U.S.6?U.S.4? 564217 4127064 32� 16.532′ 37� 17.278′ 1700c vent 2607?U.S.6? 564186 4127071 32� 16.553′ 37� 17.282′ 1703c
U.S.7? 564186 4127079 32� 16.553′ 37� 17.286′ 1700c Cimendef?Tour Eiffelb 564216 4127184 32� 16.532′ 37� 17.343′ 1684Aisicsb 564219 4127176 32� 16.530′ 37� 17.338′ 1689.3Isabelb 564059 4127247 32� 16.638′ 37� 17.377′ 1683.7P.Chimiste? 564069 4127274 32� 16.631′ 37� 17.392′ 1648c
PP4? 564124 4127349 32� 16.593′ 37� 17.432′ 1665X10b 564059 4127193 32� 16.638′ 37� 17.348′ 1700d PPS?X3b 564233 4127074 32� 16.521′ 37� 17.283′ 1700d
NNEY3b 564008 4127495 32� 16.671′ 37� 17.512′ 1727.3Sintrab 564263 4127529 32� 16.498′ 37� 17.529′ 1614.7St. Libertyc - - 32� 16.470′ 37� 17.560′ 1628St. Libertye - - 32� 16.490′ 37� 17.590′ 1646
SWWhite Castleb 563717 4127255 32� 16.869′ 37� 17.383′ 1708.9Crystalb 563640 4127384 32� 16.921′ 37� 17.453′ 1723.3S. Crystalb 563619 4127368 32� 16.935′ 37� 17.445′ 1720.5Pico (mosaic)? 563722 4127277 32� 16.866′ 37� 17.395′ 1725Pico (ROV)b 563651 4127395 32� 16.913′ 37� 17.459′ 1725Cypresb 563725 4127379 32� 16.863′ 37� 17.450′ 1738.7Snowmanb 563625 4127383 32� 16.931′ 37� 17.453′ 1722Nuno? 563621 4127460 32� 16.933′ 37� 17.494′ 1727c
Helene? 563687 4127469 32� 16.888′ 37� 17.499′ 1722c
Sapinsb 563614 4127359 32� 16.938′ 37� 17.439′ 1718.6NWBairro Alto? N/A N/A N/A N/A N/A Elisabeth/Jason?Jason? 563615 4127723 32� 16.936′ 37� 17.637′ - Elisabeth/B.A?Elisabeth? 563643 4127743 32� 16.917′ 37� 17.647′ - Jason/B.A?aThe correspondence to other site names in the literature is also provided. Uncertainty in naming correspondences is indicated by question marks.bThis study.cAs reported by Charlou et al. [2000].dDepth of Montsegur and nearby sites.eAs reported by Langmuir et al. [1997].
GeochemistryGeophysicsGeosystems G3G3 BARREYRE ET AL.: HYDROTHERMAL OUTFLOW AND IMAGE MOSAICS 10.1029/2011GC003990
10 of 29

ROV video imagery coupled with its navigation(more than 1000 h of video available fromMoMAR’08, Bathyluck’09, MoMARSAT’10 and‘11 cruises; see tracks in Figure 1c), in additionto matching features in the mosaics images(Figure 3b), as well as the correspondence to sitesreported in the literature (Table 2).
3.3.2. Types of Diffuse Outflow
[15] Image mosaics reveal four types of diffuseoutflow (Figure 3): flow through irregular, contin-uous seafloor areas (referred to as patches fromhere on); through well-defined fractures (cracks);through the flanks of hydrothermal constructions(mounds); and flow indicated by streaks of hydro-thermal minerals mobilized down steep slopes fromthe sources (streaks). These diffuse outflow typesoften show a continuum between them, with grad-ual transitions and complex associations.
[16] Individual digitized features are assigned toone of the four diffuse outflow types, allowing us toquantify the abundance and distribution of activelyventing areas throughout the field. Large featuresare digitized as polygons, from which we can esti-mate the area of active hydrothermal outflow. Smallfeatures with average diameters of less than�0.20 m are arbitrarily digitized as single points,and assigned a surface area of 0.01 m2, correspondingto the average size of a representative sample ofsuch features digitized throughout the study area.These small patches are a minor fraction of thetotal surface area of active diffuse outflow, andhence inherent errors in surface calculations are
negligible. Overall, the surface area calculated hereis likely a minimum estimate, first due to the partialseafloor imaging (62%). Even if image surveyslocally had 100% coverage at active sites (seeFigure 2e), some active areas may have not beenimaged or identified. Second, additional hydro-thermal activity may be present beyond the sur-veyed areas (Figure 1). Systematic searches andtransits in successive cruises have yielded noadditional active vents (see Figure 1d), suggestingthat the extent of active venting at the Lucky Strikefield is well-defined.
[17] Patches. We define patches as irregular, dis-crete areas of the seafloor that display a more orless continuous white surface throughout, with noapparent hydrothermally constructed feature asso-ciated (Figures 3c). Their size is highly variable,and can range from a diameter of a few centimeters(limit of the mosaic resolution) to tens meters in afew instances. In situ ROV observations indicatethat these correspond to either diffuse fluid dis-charge through a porous surface, or to areas con-ductively heated from below. Individual patchescan exceed 20 m2, with a typical area of �0.5 m2.
[18] Cracks. Hydrothermal fluids may outflowalong individual fissures or networks of fractures,around which bacterial mats and hydrothermaldeposits concentrate (Figure 3d). As in the case ofpatches, we digitize the edges of individual cracksand associated mats and deposits when they aresufficiently wide (>10 cm). Networks of narrowcracks preclude this analysis (e.g., Figure 3d), andare instead digitized as lines with lengths varyingfrom centimeters to meters. We have carried outsystematic measurements within a crack network atboth the Y3 site (this study) and the Tour Eiffel site[Mittelstaedt et al., 2012], yielding in both casesan average crack width of �4 cm, a value usedto estimate the surface area associated with thesenarrow cracks. In situ temperature measurementsand close-up video imagery show convective out-flow that varies significantly along individual frac-tures, with measured fluid temperatures rangingfrom <20 to�100�C over distances of <10 m along asingle crack.
[19] Mounds. Several sites are characterized bybroad sulfide mounds, with base diameters rangingfrom 1 m to 20 m, and an elevation of up to severalmeters above surrounding seafloor (e.g., Figure 3e).At Lucky Strike, these structures display diffuseventing across their flanks, which are extensivelycovered by bacterial mats and hydrothermal depos-its, and often colonized bymacrofauna (e.g., mussels).
Table 3. Summary of Distribution of HydrothermalOutflow Types Identified at Lucky Strike, Includingthe Number of Structures Identified, Mapped Surface,and Relative Proportions for the Site, for the ThreeDifferent Substrate Types Defined at Lucky Strike
Numberof
Structures
TotalSurface(m2)
DiffuseOutflowType(%)
S1(%)
S2(%)
S3,W/Ea (%)
Patch 4742 975 55 41 72 76.5/79Cracks 687 143.5 8 9 6 6.5/11Mounds 36 630 36 50 21.5 16.9/0Streaksb 247 20.25 1 0 <0.5 0.1/10Active Vents 67 - - 55 3 9/0
aRelative importance of diffuse hydrothermal outflow types varysignificantly between the W and E fault scarps, and are thereforereported separately here.
bThe surface of active venting associated with streaks is estimated to5% of the digitized area, as these correspond primarily to gravity-driven remobilization of hydrothermal deposits (see text for details).
GeochemistryGeophysicsGeosystems G3G3 BARREYRE ET AL.: HYDROTHERMAL OUTFLOW AND IMAGE MOSAICS 10.1029/2011GC003990
11 of 29
In extreme cases of fluid flow localization, suchas the Y3 hydrothermal vent, outflow is focusedalong a single chimney several to tens of m high,with limited diffuse outflow on its walls; thesestructures are identified as high-temperature vents(See section 3.3.1) and not as mounds.
[20] Streaks. In areas of steep topography such asfault scarps and the flanks of major hydrothermaldeposits, we find white streaks up to several metersin length and a few tens of centimeters in width(Figure 3f), elongate downslope, and emplaced ontalus (Figure 3f, right). Video observations indicatethat these structures originate upslope at crackswith active, diffuse venting, and that they are notassociated with philamentous bacteria and otherhydrothermal fauna (e.g., mussels). This morphologyand geometry indicates a gravity-driven downsloperemobilization of hydrothermal deposits, probablyanhydrite. Unlike the three other diffuse outflowtypes described above, the digitized surface does notcorrespond to actively venting area, but to that ofhydrothermal materials remobilized from its source.From systematic video observations we estimatethat the fraction of active diffuse outflow along astreak feature is very small (5% or less) relative tothe total digitized area (see examples in Figure S1in the auxiliary material).1 To correct this bias,values of the surface area of active venting reportedin Table 3 are corrected accordingly.
3.4. Temporal Variability in Active VentingFrom Image Mosaics
[21] The Lustre (1996), Momareto (2006), Gravyluck(2006), MoMAR (2008) and Bathyluck (2009)mosaics provide overlapping coverage of the sea-floor at the Lucky Strike hydrothermal field(Figures 2a–2d) over more than 40% of the sur-veyed seafloor. This overlap occurs primarily at oraround active hydrothermal sites (Figure 2e). Imagemosaics can thus be used to identify variations inthe size, nature, and/or distribution of hydrothermalactivity as described above, at time-scales that varybetween 1 year (2008–2009 surveys) and 13 years(1996–2009). In addition, we can determine iftemporal changes are local or occur at a field-scale.Figure 4 shows examples from four active sites,displaying an overall reduction or increase in theirsize, changes in their continuity and intensity, or theappearance or disappearance of active areas. Dif-ferences in image quality between different surveys
(e.g., imaging conditions, resolution of originalimages) preclude a quantitative evaluation of thesechanges, and hence observations reported here arequalitative. A systematic inspection of all the imagemosaics allowed us to identify 100 active sites withoverlapping imagery distributed throughout theLucky Strike hydrothermal field.
3.5. Fossil Hydrothermal Outflow
[22] Processed image mosaics reveal distinctly darkseafloor areas (Figures 3g and 3h) with sharp limitsagainst surrounding sedimented terrain of a lightertone, which are particularly visible in zones of sea-floor with low relief associated with the ‘hydro-thermal slab’ substrate (e.g., SE of the survey area).These structures are not identified in steep terrainsuch as fault scarps and flanks of massive hydro-thermal deposits, likely owing to the relief, changesof lightning, and the heterogeneous and discontin-uous nature of the seafloor texture. ROV and HOVobservations demonstrate that numerous inactiveand active hydrothermal structures are foundwithin. Numerous inactive chimneys, both standingand fallen, testify for a history of focused, high-temperature venting. Traces of fossil diffuse out-flow are more difficult to identify, but the presenceof yellow bulbous hydrothermal constructs several10s of cm in height, often lined up along fractures,indicate prior diffuse activity. No samples todetermine the composition and origin of this yellowmaterial exist, but their morphology and associa-tion with fissures suggest that they originated fromprecipitation at outflow along cracks (Figures 3gand 3h). Submersible observations demonstratethat the dark areas correspond to a superficial patinacovering the seafloor, which has not been sampledto date ascertain its nature. We propose that thedark areas may correspond to hydrothermal pre-cipitates (oxides) from diffuse outflow through theseafloor, from hydrothermal fallout from nearbyvents, or a combination of both, owing to the clearassociation with fossil venting structures.
[23] Available microbathymetry also reveals hydro-thermal deposits E and NE of the lava lake,described in detail by Ondréas et al. [2009], andcorresponding to the hydrothermal deposit sub-strate defined below. Here individual conical hillsup to 15 m in height and 25 m in diameter com-posed of sulfide blocks and hydrothermal rubble,likely pinpoint extinct hydrothermal sites of asimilar size to that of the present-day Tour Eiffelsite. The summits of these structures, clearly iden-tifiable in the bathymetry (Figure 5), are used to
1Auxiliary materials are available in the HTML. doi:10.1029/2011GC003990.
GeochemistryGeophysicsGeosystems G3G3 BARREYRE ET AL.: HYDROTHERMAL OUTFLOW AND IMAGE MOSAICS 10.1029/2011GC003990
12 of 29
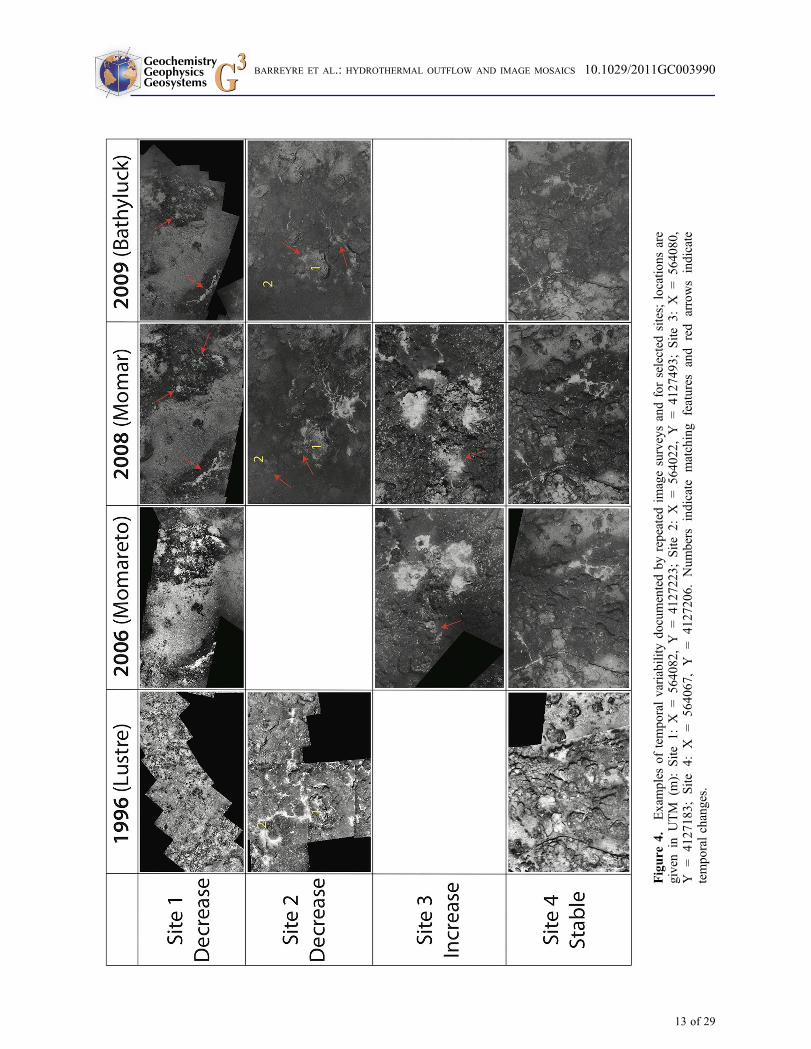
Figure
4.Examples
oftemporalvariability
documentedby
repeated
imagesurveysandforselected
sites;
locatio
nsare
givenin
UTM
(m):
Site
1:X
=564082,Y
=4127223;
Site
2:X
=564022,Y
=4127493;
Site
3:X
=564080,
Y=
4127183;
Site
4:X
=564067,Y
=4127206.
Num
bers
indicate
matching
features
and
red
arrowsindicate
temporalchanges.
GeochemistryGeophysicsGeosystems G3G3 BARREYRE ET AL.: HYDROTHERMAL OUTFLOW AND IMAGE MOSAICS 10.1029/2011GC003990
13 of 29

complement the map of fossil structures identifiedin the image mosaics (Figures 6 and 7).
3.6. Nature of Substrate and FaultIdentification
[24] Substrate nature, which varies throughout theLucky Strike area, may play a role in the geometryand nature of hydrothermal discharge. We havedefined three substrate types, based on their morpho-tectonic character, on prior geological and geo-physical studies in the area [Humphris et al., 2002;Ondréas et al., 1997, 2009], and in situ ROVobservations (this study, Figures 1d and 3). The firsttype of substrate corresponds to the “hydrothermalslab (i.e., a cap of hydrothermally cemented breccia[Langmuir et al., 1997; Ondréas et al., 1997,2009]). Slab is identified in relatively smooth sea-floor that is cross-cut by normal faults with smallvertical relief (typically 10 m or less), readily rec-ognizable in the bathymetry data (previously iden-tified as H3 by Ondréas et al. [2009]). Thissubstrate, which is found at the E and S of the lava
lake (S1 in Figure 7), hosts several hydrothermallyactive areas with associated hydrothermal deposits(see image mosaic example in Figure 6), as well asdark areas interpreted as fossil outflow zones. Thesecond substrate type corresponds to laterally con-tinuous, massive hydrothermal deposits located E ofthe lava lake and the bounding fault scarp (S2 inFigure 7; referred to as H2 by Ondréas et al.[2009]). S2 deposits extend �300 m along-axis,and �200 m across it, corresponding to ruggedterrain, and composed of several mounds 10–20 mhigh with slopes of >30� (Figure 5). The thirdsubstrate (S3 in Figure 7) corresponds to the slopesof the major axial graben-bounding fault scarps,identified E andW of the lava lake (graben boundingfaults). The scarps, �100 m in vertical relief andsloping >30�, display a complex morphology withtalus, blocks, and rubble. In plan view, this substratecovers �550 m along-axis and has a variablewidth, with a maximum of 350 m on the W faultscarp. The top of the E fault scarp is ill-defined, as ittransitions to the hydrothermal deposits to the East(S2). While hydrothermal activity is found withinthese fault scarps, the associated deposits are not
Figure 5. Slope map derived from multibeam bathymetry [Ondréas et al., 2009], showing the interpreted summitof fossil hydrothermal mounds (yellow), as well as active diffuse outflow and vents digitized from the imagemosaics.
GeochemistryGeophysicsGeosystems G3G3 BARREYRE ET AL.: HYDROTHERMAL OUTFLOW AND IMAGE MOSAICS 10.1029/2011GC003990
14 of 29

continuous, likely due to gravitational collapse overthe history of hydrothermal activity. Individual faultscarps are identified and digitized from multibeambathymetry [Ondréas et al., 2009] (Figures 5, 7and 8a). In addition to the fault substrate (S3), wedigitized well-defined upper and lower scarp limitsfor the larger faults (vertical throws of 5 m ormore). Smaller faults with throws of <5 m, aredigitized as single lines through the center of thescarp (Figure 7 and 8a).
4. Results
4.1. Distribution and Natureof Hydrothermal Outflow
[25] The image mosaics of the Lucky Strikehydrothermal field document activity over an area
900 m across-axis and �600 m along it (Figures 1and 2). As described in prior studies, active sitessurround the central depression (‘lava lake’) [e.g.,Langmuir et al., 1997; Humphris et al., 2002;Ondréas et al., 2009], but are absent from itsinterior (Figure 7). Systematic optical mappingof the field demonstrates that diffuse outflow,corresponding to <0.5% or the surveyed seafloorsurface (�0.65 km2; Table 1), occurs over an arealarger than that defined by known high-temperaturevents [e.g., Humphris et al., 2002; Ondréas et al.,2009]. The distribution and relative abundance ofdiffuse outflow types is highly variable (Figure 7),both at the scale of a single site and amongdifferent sites. The dominant outflow types arepatches and mounds, corresponding to 55% and36% of the surface of active diffuse outflow(Table 3). Individual mounds can cover large areas
Figure 6. (a and b) Detail of the image mosaic of the southeastern part of Lucky Strike hydrothermal field (Figure 6a)and identified hydrothermal features (Figure 6b), both active and inactive, obtained from image mosaic interpretationand in situ observations. Note that all the active focused and diffuse hydrothermal discharge is located within the areasinterpreted as fossil outflow (dark seafloor). The seafloor imagery is the 2008 mosaic complemented in the backgroundby the 2006 and 2009 mosaics to reduce imaging gaps. Axes correspond to UTM coordinates in meters. Names of sites:MS: Montsegur, TE: Tour Eiffel. Note that round dark areas not digitized correspond to feature made by the Nautilesubmarine ballast, thus aren’t from hydrothermal origin.
GeochemistryGeophysicsGeosystems G3G3 BARREYRE ET AL.: HYDROTHERMAL OUTFLOW AND IMAGE MOSAICS 10.1029/2011GC003990
15 of 29

Figure 7. (a) High-resolution bathymetry map, from the MoMARETO’06 cruise (see Ondréas et al. [2009] fordetails), gridded at 0.5 m. (b) Map showing all identified active and inactive hydrothermal features from the LuckyStrike field, the substrates as defined in the text, and the fault scarps found in the study area. The map extend corre-sponds to the 2006 MoMARETO bathymetry survey, which covers all the known areas of active venting of the LuckyStrike field. Substrates: S1: cap of hydrothermally cemented breccia, referred to as ‘slab’ in the text. S2: laterally con-tinuous, massive hydrothermal deposits forming a rugged terrain. S3: slopes of the major axial graben-bounding faultscarps displaying a complex morphology with gravity collapses, as blocks and rubble, associated with talus. Names ofsites: CR: Crystal, CY: Cypres, IS: Isabel, MS: Montsegur, SI: Sintra, TE: Tour Eiffel, Y3: Y3.
GeochemistryGeophysicsGeosystems G3G3 BARREYRE ET AL.: HYDROTHERMAL OUTFLOW AND IMAGE MOSAICS 10.1029/2011GC003990
16 of 29

(e.g., 107 m2 and 134 m2 at the Montsegur andTour Eiffel sites, respectively), and hence a rela-tively low number of these structures account for asizable proportion of the documented diffuse flow.
[26] There is a link between substrate type and theobserved style of diffuse outflow (Figure 7), indi-cating that the permeability structure of the shallowcrust plays a role on the nature of discharge at thisfield. The relatively flat seafloor morphology of the‘slab’ substrate in the southern part of the studyarea (substrate S1, Figure 7) more clearly shows theorganization of diffuse outflow, due to the lack of
complex topography. Here, we observe diffuseflow associated with high-temperature venting inwell-defined clusters that are separated by seafloorshowing no active hydrothermal discharge. Thisarea also has the highest concentration of both theidentified high-temperature vents (55 out of 67vents) and the zones of diffuse outflow (�1090 m2
and 62% of the surface of mapped structures, seeTable 3). The surface area of diffuse outflow isdominated by the presence of large mounds (�50%)surrounded by patches (�40%), while zones withactively venting cracks account for <10% of theactive area of diffuse outflow.
Figure 8. (a) Map showing the distribution of active venting areas (diffuse) and faults identified from microbathy-metry. (b) The corresponding histogram of distance to the closest fault for each active feature identified. Notethat >75% of the features are within less than 10 m from fault scarps, and only 5% of them are at distance >20 m.The latter are concentrated over the hydrothermal substrate that likely masks underlying faults dissecting the basement.Names of sites are the same as ones given in Figure 7.
GeochemistryGeophysicsGeosystems G3G3 BARREYRE ET AL.: HYDROTHERMAL OUTFLOW AND IMAGE MOSAICS 10.1029/2011GC003990
17 of 29

[27] The nature of discharge and its abundancethrough the hydrothermal substrate (S2, Figure 7)and on major fault scarps (S3) are different fromthat hosted by the slab substrate. The hydrothermalsubstrate (S2) is characterized by coalescing fossilhydrothermal edifices [Ondréas et al., 2009], pri-marily hosting patches of diffuse outflow (�70%of S2 active surface), while active high temperaturevents are scarce (3 vents concentrated at the Sintrasite, out of a total of 67 for the whole field). Out-flow along the fault scarps (S3) differs between theE and W scarps flanking the lava lake. The E scarp,which is the steepest, lacks mounds but displaysstreaks of hydrothermal deposits remobilizeddownslope (10% of active surface). In contrast, theW scarp is less steep, lacks streaks, and hosts twoactive hydrothermal mounds. Outflow throughpatches dominates the diffuse outflow on the faultscarps. High-temperature vents are documentedat the Y3 site on the E flank and the Helene
and Barrio Alto sites on the W flank, althoughadditional, unmapped high-temperature vent sitesmay exist, particularly on the W fault scarp. Thedistribution of hydrothermal activity is unequalamong the sites. Substrates S1, S2 and S3 host63%, 10%, and 27% of the active diffuse ventingsurface area documented at the Lucky Strikehydrothermal field and account for 0.6%, �0.3%and 0.2% respectively of the total surface.
[28] The detailed image mosaic interpretationreveals variability in the structure of hydrothermaloutflow among individual sites. For example, theY3 hydrothermal site is dominated by a 20-m highchimney with numerous vents at the summit.Around the Y3 chimney, diffuse outflow principallyoccurs at patches, but is also observed across anextended crack network adjacent to this chimney(72% patches, 28% cracks; Figure 3d). In contrast,at the Tour Eiffel and Montsegur sites (Figure 6),
Figure 9. Temporal evolution of diffuse hydrothermal activity at the Lucky Strike site based on the comparison ofmosaics at overlapping areas (1996–2009) and from limited in situ observations (1993–2009) at the Statue of Libertysite (now extinct). Note that changes are documented at time-scales varying between 1 and 13 years, denoted by thesize of the symbols.
GeochemistryGeophysicsGeosystems G3G3 BARREYRE ET AL.: HYDROTHERMAL OUTFLOW AND IMAGE MOSAICS 10.1029/2011GC003990
18 of 29

hosted in the slab substrate, outflow is dominatedby active hydrothermal mounds (72% and 92% ofthe mapped diffuse outflow surface area, at eachsite respectively), with outflow through patchesdiffering significantly between the two sites (23%and 4% respectively; Figures 3 and 6). Theseinter-site variations demonstrate that heat flux esti-mates cannot be reliably extrapolated from indi-vidual sites to the entire hydrothermal vent field.
[29] To investigate the relationship between digi-tized faults and active vents in our study area, wecalculate the distance from outflow zones to thenearest mapped faults (Figure 8). For hydrothermalzones within the scarps of larger faults (e.g., sub-strate S3, or the larger faults, Figure 8a), we assigna distance of 0 m. We observe that >75% of theactive sites occur within 10 m of a fault scarp(Figure 8b), with an average distance of �7 m, andhence within the error in of geographic registrationbetween multibeam bathymetry and image mosaics(�10 m). Sites hosted in substrate S2 (Figure 7)may show a bias toward longer distances. Here, thehydrothermal deposits likely cover normal faultsdissecting the basaltic basement that serve aspresent-day and paleo-conduits for the active andinactive vents in the area. However, these sitesrepresent a small fraction (�10%) of the totalactive sites identified.
4.2. Temporal Variability From RepeatedImage Mosaics and in Situ Observations:1–20 Years Time Scales
[30] Systematic examination of mosaics reveals 100locations with active venting and overlappingimagery, encompassing the four types of diffuseoutflow described (Figures 4 and 9). Comparisonsamong mosaics at these sites, summarized inFigure 9, indicate a systematic decrease in activityat 67 of the 100 sites, while only 5 sites show anapparent increase, and the remaining are stable.This pattern is consistent at all time-scales investi-gated, from 1 year (2008–2009 mosaics) to 13 years(1996–2009), although the number of observationsfor the longer time scale is reduced owing to theimage quality of the Lustre’96 mosaics (Figure 4).Despite this overall diffuse venting decrease, thelocation and general structure of the hydrothermaloutflow remained stable over the 1996–2009 timeperiod. Furthermore, we observed no developmentof new outflow zones or the full disappearance ofthose existing.
[31] In addition to direct observation of changesin diffuse outflow from mosaics, circumstantial
evidence of temporal change exists from submers-ible and ROV observations. For example, theStatue of Liberty site was active at the time of itsdiscovery in 1993 [Langmuir et al., 1997], butsubsequent observations 26 years later (ROVVICTOR Dive #389, Bathyluck’09 cruise report)demonstrate that this site is now inactive. Anoverall decline was also observed during divesbetween 2008 and 2010 at hydrothermal sites at thebase of the western fault scarp. Here hydrothermalmounds with extensive diffuse outflow show aclear decrease of the continuity and intensity ofbacterial mats on vertical walls. Hence, while theseobservations cannot be validated with the existingmosaics at individual sites (i.e., at Statue of Lib-erty), they indicate an overall pattern of declinewhich is consistent with in situ observations fromROV and HOV dives to the Lucky Strike hydro-thermal field during the last two decades.
4.3. Temporal Variability From MosaicInterpretation and Multibeam Bathymetry:Long Time Scales
[32] In areas with ‘slab’ substrate (S1, Figure 7), theprocessed image mosaics reveal the distinct darkzones with well-defined edges (Figures 3g, 3hand 6), described in detail in section 3.5, that weinterpret as zones of fossil hydrothermal discharge.These structures thus record a change in the size ofdischarge zones at Lucky Strike, but not in theirspatial distribution, as indicated by their systematicassociation with active venting.
[33] Outside the hydrothermal slab substrate, suchdark features are not observed. The substrate asso-ciated with both the hydrothermal deposits and thefault scarps (S2 and S3, Figure 7), display alocally rugged terrain, as well as steeper slopes(e.g., flanks of hydrothermal mounds and thesloping fault scarps and associated talus). Withsuch complex topographies relative to the smoothand slightly sedimented slab terrain, evidence ofpast hydrothermal activity may have not beenpreserved in these areas (e.g., mass wasting andgravity movements), or may not be readily identi-fiable due to relief and illumination conditions.
[34] Another source of evidence for long-termvariability in the activity of the field comes fromseafloor observations and multibeam bathymetryfrom substrate S2 (Figures 5 and 7). This areahosts more than 10 fossil hydrothermal structures(i.e., piled blocks of sulfides) with a size andheight similar to those of the Tour Eiffel site. Theonly active structure at the present time is Sintra,
GeochemistryGeophysicsGeosystems G3G3 BARREYRE ET AL.: HYDROTHERMAL OUTFLOW AND IMAGE MOSAICS 10.1029/2011GC003990
19 of 29

which shows a weak discharge with relativelylow outflow temperatures (207�C in 2009), andno venting at higher temperatures. The Statue ofLiberty site, active in 1993 is now extinct, andthe rest of the hydrothermal piles do not showany signs of recent activity. Furthermore, diffuseoutflow throughout S2 is restricted to only asmall fraction of the seafloor (Figures 5 and 7).The presence of several hydrothermal moundsclosely associated spatially is thus consistent withenhanced discharge in the past, at least relative tothe present-day observed activity.
5. Discussion
5.1. Surface Distribution of HydrothermalDischarge and Its Plumbing System
[35] The spatial distribution and structure ofhydrothermal outflow at the seafloor may be usedas a proxy for the subseafloor geometry of fluiddischarge. Numerical models suggest that, for uni-form crustal permeabilities, upwelling of hydro-thermal fluids is organized in a discrete plume witha discharge zone at the seafloor that has a footprintof a few hundred meters in diameter [Fontaineet al., 2008]. This spatial scale is similar to thatof the entire Lucky Strike hydrothermal field,and much larger than the typical size of individualsites observed within it (from a few m to tens of min diameter). This disparity in spatial scales maybe explained by a hydrothermal discharge origi-nating from a single upwelling zone at depth, andthat it is re-organized and split in the shallow crustalong smaller upwelling zones, which woulddirectly feed the discharge zones identified at theseafloor (Figures 6 and 7).
[36] Maps in Figure 10 show the distance to thenearest active hydrothermal feature, and reveal theoverall spatial organization of the hydrothermaldischarge. This distribution is similar for bothfocused and diffuse venting (Figures 10a and 10brespectively). Differences in structure are restrictedto the NE, where Sintra is the single site withfocused, high-temperature venting and where therest of the activity is diffuse (Figure 10b). At thelevel of the Lucky Strike field there is a clear splitof the hydrothermal outflow into two zones, E andW,which correspond to the faults flanking the axialgraben dissecting the central volcano. At smallerspatial scales, and within each of the graben flanks,the distribution of hydrothermal features revealsdifferent levels of clustering. Using the distributionof sites (Figure 7) and distance maps (Figures 10a
and 10b), we identify twelve main clusters basedprimarily on the focused flow sites (Figure 10a,black dashed lines, also reported in Figure 10bfor comparison diffuse flow structure). The over-all agreement in the structure of both focusedand diffuse outflow suggests that both modes ofdischarge are closely related, reflecting mixingbetween cold seawater and upwelling high-tem-perature fluids within the upper crust.
[37] We propose that outflow distribution at theseafloor and the clustering of sites reflect, to a firstorder, the plumbing system underlying this hydro-thermal field, in terms of geometry, branching pathsof the upflow, and its depth. We use a k-meansclustering technique based on the Euclidian posi-tion and relative distance between all features asdefined by their centroid position, and determinedfrom the digitized geometry of individual features.Clusters are hierarchically related, based on theirrelative mean distances (between cluster centroids).Figure 10c shows the structure for 12 clusters,which corresponds to the number of outflow zonesdefined visually in Figure 10a. Assuming that theclustering distance (horizontal) is a proxy for depth(vertical distance), we obtain a geometrical modelof the branching structure with depth, as repre-sented in Figure 10c. The actual vertical scalingrequires independent geological constraints.
[38] The first constraint corresponds to the maxi-mum depth of the hydrothermal reaction zone, andtherefore the base of the hydrothermal upflow sys-tem. The Lucky Strike site is located above anAMC (Figure 1), and its seismically imaged roof,located �3 km below the seafloor [Singh et al.,2006] is likely the deeper limit of the system.
[39] The main split of the hydrothermal discharge(E versus W sites), visible in the distance maps(Figures 10a and 10b) and in the clustering, isclearly associated with the faults (Figure 8a)[Ondréas et al., 2009; Tolstoy et al., 2008] thatbound the central graben. Upwelling hydrothermalfluids thus likely exploit high-permeability zonesassociated with the fault networks at both flanks ofthe graben, efficiently steering the fluids away fromits axis (Figure 11a). An estimate of this E-Wbranching depth (Figure 10c) may be obtained fromintersection of faults at depth. Assuming that the1 km-wide graben is symmetrical, and that faultsdip between 45� to 60� [e.g., Thatcher and Hill,1995], the depth of fault intersection (and there-fore fluid divergence) may vary between �500 mand 900 m (Figure 10c and 11a).
GeochemistryGeophysicsGeosystems G3G3 BARREYRE ET AL.: HYDROTHERMAL OUTFLOW AND IMAGE MOSAICS 10.1029/2011GC003990
20 of 29

[40] The apparent clustering of hydrothermalactivity (Figure 10c) suggests a further organizationof the outflow along smaller channels at levelsshallower than the 500 m–900 m inferred for themain E-W fault split. These outflows are directlylinked to the shallow fault network within each of
the fault branches of the graben. Lacking directdepth constraints, we estimate that characteristicdepths may correspond to half of the branchingdepth (500–200 m) or less (Figures 10c and 11b).
[41] The inferred plumbing system is based on thespatial structure of outflow zones, and does not take
Figure 10. (top) Maps of distance to (a) the nearest focused vent or (b) diffuse outflow feature, with interpretedprimary outflow zones (dashed lines). (c) Plumbing structure interpreted from a clustering analysis of diffusehydrothermal outflow features (see text for details). The distance between the centers of the different clusters isassumed to be a proxy for the vertical dimension (clustering distance, black in Figure 10c) of the underlyingplumbing system. Actual depths inferred from geological constraints, given in red, correspond to a) the baseof the hydrothermal system (top of the AMC, �3000 m); b) the main split of the outflow (E and W) at the intersectio-n of rift bounding faults at depth (500–900 m); and c) shallow-level branching along faults at inferred depthsof <500 m. (1) and (2) numbers correspond to two different hypothesis for clustering: chemical differences inhydrothermal fluids are (1) due to two different fluid sources in depth or (2) associated with nature of the differ-ent substrates.
GeochemistryGeophysicsGeosystems G3G3 BARREYRE ET AL.: HYDROTHERMAL OUTFLOW AND IMAGE MOSAICS 10.1029/2011GC003990
21 of 29

Figure
11.
(a)Conceptualmodel
oftheLucky
Strikehydrotherm
alplum
bing
system
structureat
depth,
with
the
upwellin
gof
asingleplum
eabovetheAMCthatisfocusedalonghigh-porosity
areasassociated
with
themainfaults
bounding
theaxialg
raben.The
maxim
umdepthof
thisbranchingmay
beconstrainedby
theintersectio
nof
thebound-
ingfaults,here
assumed
todipbetween45
�and60
� .(b)Atshallower
levels,hydrotherm
aloutflow
intheEandW
exploitsexistin
gsm
aller-scalefaults,as
suggestedby
theassociationof
hydrotherm
alfeatures
andfaultscarps.The
nature
ofthedischargeat
thescaleof
individual
sitesis
likelycontrolledby
theperm
eabilitystructureof
thecrust
immediately
below
theseafloor
(<100m?).Inthepresence
of(c)thehydrotherm
al“slab”
substrate
sitestend
todis-
play
ahigh-tem
perature
dischargezone
(ventsin
moundsor
chim
neys),with
diffuseoutflow
insurroundingareas.In
thepresence
of(d)hydrotherm
aldeposits,faults
actin
gas
fluidconduitsmay
beburied.D
ischarge
thus
occursthrough
hydrotherm
alrubble.(e)
Faultscarps
show
evidence
ofmasswastin
g,andarelik
elyassociated
with
alayerof
uncon-
solid
ated
andheterogeneousmaterial,in
which
hydrotherm
aldischargetakesplace.
GeochemistryGeophysicsGeosystems G3G3 BARREYRE ET AL.: HYDROTHERMAL OUTFLOW AND IMAGE MOSAICS 10.1029/2011GC003990
22 of 29
into account other information such as the geo-chemistry of fluids. The SE hydrothermal sites(e.g., Tour Eiffel and Montsegur) display a fluidgeochemistry that indicates a different fluid sourcefrom the rest of the Lucky Strike sites [Langmuiret al., 1997; Von Damm et al., 1998; Charlou et al.,2000]. If these geochemical differences are associ-ated with reaction zones that are distinct at depth,the plumbing system would require that thesesites root independently (dashed line, Figure 10c).Alternatively, these chemical differences may becaused instead by the nature of the substrate andchemical reactions within the upwelling zone, andthus may be consistent with the plumbing systemproposed here.
[42] Variations in the style of venting associatedwith the various substrates throughout the LuckyStrike field (Figure 7) suggest that the permeablestructure of the crust immediately below the sea-floor may control hydrothermal outflow throughout(Figure 11c–11e). Most of the discharge from theslab substrate is organized around a chimney ormound hosting high temperature vents, and sur-rounded by diffuse outflow (Figure 11c). The rela-tive size of the area with diffuse outflow is highlyvariable, and we find no correlation with the natureand number of high-temperature vents associatedwith it.
[43] The nature of the present-day hydrothermaloutflow and its relation to structure is more clearlydefined in the south of the hydrothermal field, hos-ted by the slab substrate. Mixing and dispersion ofhigh-temperature fluids may occur at the base of theslab, and move away from the focused venting areasthrough percolation along cracks [e.g., Cooperet al., 2000]. In contrast, along the slopes of bothfault scarps and inactive hydrothermal mounds,focused venting is currently scarce and diffuse out-flow results in ill-defined clusters of actively vent-ing areas. In these zones the subsurface is composedof rubble and unconsolidated materials (talus),possibly promoting the dispersion of hydrothermalfluids (Figure 11d–11e). The lack of a systematicassociation between the type of diffuse dischargeand substrate indicates that other parameters mayplay a role, such as the size of individual dischargezones at depth and their flux.
5.2. Heat Flux Estimates Using SeafloorImagery
[44] Heat flux, and its partition between focused anddiffuse outflow, may be estimated from the area ofventing, constrained by the mosaics presented here,
in addition to the temperature of the fluids, and theiraverage outflow speed, based on prior studies[Cooper et al., 2000; Sarrazin et al., 2009;Mittelstaedt et al., 2012]. Available heat flux esti-mates based upon water column studies of thehydrothermal plume for the Lucky Strike hydro-thermal field vary by an order of magnitude.Wilsonet al. [1996] estimated it at 118–399 MW based onplume height modeling and buoyancy arguments.Jean Baptiste et al. [1998] propose a much highervalue of 3800 � 1200 MW, based on 3He analysesof the plume and its relationship to heat flux.
[45] Focused hydrothermal outflow through ventscan be evaluated for the whole field using heat fluxcalculated for individual vents. Tour Eiffel is theonly location where detailed heat flux measure-ments have been performed, based on temperaturemeasurements and video estimates of fluid veloci-ties [e.g., Mittelstaedt et al., 2012], yielding anaverage heat flux of �0.12 MW per focused vent.This estimate is significantly lower than theinferred �0.8 MW of focused vents at the EPR,measured with flowmeters [Ramondenc et al.,2006]. As no systematic study has been performthroughout the entire hydrothermal field, usingthese two heat flux estimates as minimum andmaximum values, and based on the number ofidentified sites (67), we estimate that the focusedflow observable at the present time may be between�8 and 50 MW.
[46] The heat flux associated with diffuse flowand cracks is poorly constrained, owing to thevariability and heterogeneity in the temperaturesand velocities of fluids, even at small spatial scales.Heat flux may be calculated from
Q ¼ DT � f� v� Cp � S ð1Þ
where f is density of seawater (1025 kg.m�3), Cp isthe specific heat of the diffuse fluid (4.2 103 J.kg�1.�C�1), DT is temperature difference T–T0between outflow temperature T and ambient sea-water T0 (4.4�C), v is the diffuse effluent velocity,and S the area of considered diffuse outflow (m2)which is constrained from the image mosaic (seeTable 4).
[47] Data on velocity and temperature of diffusefluids is limited, and thus we use a broad rangeof plausible values to obtain a range of field-based heat-flux estimates for each of type of dif-fuse outflow. Sarrazin et al. [2009] deployed aflowmeter over patches of bacterial mats at LuckyStrike, yielding minimum and maximum tempera-tures of 8� and 20�C, and minimum and maximum
GeochemistryGeophysicsGeosystems G3G3 BARREYRE ET AL.: HYDROTHERMAL OUTFLOW AND IMAGE MOSAICS 10.1029/2011GC003990
23 of 29

velocities of 1 to 5 mm/s, which we apply to bothpatches and mounds owing to the similarity in typeof outflow. We obtain a range of heat fluxes of15 to 327 MW for the patches, and of 10 to212 MW for the mounds (Table 4). Flowmetermeasurements along cracks have been performedat Lucky Strike by Cooper et al. [2000]. A total of10 measurements throughout the field yield anaverage temperature and fluid flow velocity of 33�Cand 19 mm/s respectively. More recent experimentswere carried out at the Tour Eiffel site (MOMAR’08and Bathyluck’09 cruises [Mittelstaedt et al., 2012])yielded average temperatures of 17.5�C and similaroutflow velocities of 21 mm/s (Table 4). We thusestimate that heat fluxes associated with cracksrange from 154 to 372 MW. Our heat flux estimatefor streaks is the least constrained, lacking anydirect measurements. The outflow fluid tempera-tures associated with these structures may rangefrom 100�C to 150�C, which are used as the mini-mum and maximum for the heat flux estimate inTable 4, so as to allow the formation of anhydrate[Møller, 1988; Bischoff and Seyfried, 1978]. Theseelevated temperatures, in the absence of signifi-cant mixing at the source, may also preclude thedevelopment of bacterial mats. Examination ofvideo imagery from transits over these areas showsno significant or pervasive simmering, nor thepresence of plumes indicating elevated flow rates.To fully cover the range of likely values in the field,and lacking direct measurements, we arbitrarilyadopt as a minimum that of Sarrazin et al. [2009] of1 mm/s, and a maximum speed equal to twice thatreported by these authors, 10 mm/s. Based on theseassumptions, we obtain a broad range of heatfluxes, from 8 to 125 MW.
[48] Combining all these results, our best estimatesof the heat flux for the entire Lucky Strike fieldrange from 187 to 1036 MW for diffuse areas, andfrom 8 to 50 MW for focused vents, yielding a totalheat flux of 195–1086 MW. Based on the distri-bution of active venting areas, we also predict astrong asymmetry in heat flux across axis, with�70% of it being delivered on the East flank. Thesemosaic-based heat flux estimates are closer to thoseofWilson et al. [1996] (118–399 MW), and suggestthat He-based estimates [Jean-Baptiste et al., 1998](3800 � 1200 MW) are an overestimate, probablydue to the limitations and assumptions involved.
5.3. Decline of Lucky Strike HydrothermalActivity
[49] Image mosaics document a systematic andwidespread decline of diffuse hydrothermal outflowat Lucky Strike over the last 13 years, which weattribute to an overall reduction in the mass flux ofhydrothermal discharge across field. Diffuse out-flows result from mixing of ascending, high-temperature hydrothermal fluids with seawaterwithin the shallow, permeable crust. Based solelyon outflow temperature, the diffuse venting con-tains a small fraction of hydrothermal fluids (e.g.,<10% for a 10�C outflow resulting from mixing ofcold seawater and 300�C fluids). Diffuse ventingis thus sensitive to small variations in the overallhydrothermal flux at depth, which may be due toeither a reduction of the upflow speed, a decreasein the size (diameter) of discharge zones and henceof the associated mixing zone surrounding them,or both. The temporal variability that we reporthere is qualitative, and lacking other independentmeasurements (e.g., systematic estimates basedon plume studies at the scale of the site) we can-not quantify the heat flux reduction over thistime span. However, based on the stability of thelocation of the outflow zones and of their geo-metry, as well as on the local nature of thesechanges, we propose that the observed decadal-scale decline is small relative to the overall heatflux of the site.
[50] Temperature measurements over the last20 years (Table 5) at the Tour Eiffel, Sintra, and Y3sites, in addition to the now extinct Statue ofLiberty (measurements available in 1993 and 1994,and extinct by 2009) support this interpretation.Each of the now active sites is located on a dif-ferent substrate type (S1, S2 and S3, respectively,Figure 7). Table 5 reports the highest temperaturesmeasured at any given year for each of the sites
Table 4. Heat Flux Estimates (Q) Associated WithDiffuse Outflow at the Lucky Strike HydrothermalField, Based on Measured Surface Area (S), Temperature(T) and Velocity (V) for Each Type of Diffuse Outflowa
Sb
(m2)Tmin/Tmax
(�C)Vmin/Vmax
(mm/s)Qmin/Qmax
(MW)
Patch 975 8c/20c 1c/5c 15/327Mound 630 8c/20c 1c/5c 10/212Cracks 144 17.5d/33e 19e/21d 154/372Streaks 20 100f/150f 1c/10f 8/125Total 187/1036
aMinimum and maximum (min and max respectively) values ofT, V and Q are given.
bFrom this study.cFrom Sarrazin et al. [2009].dFrom Mittelstaedt et al. [2012].eFrom Cooper et al. [2000].fTemperatures inferred fromMøller [1988] and Bischoff and Seyfried
[1978]. The maximum velocity is arbitrarily set to double of the maximumvelocity reported by Sarrazin et al. [2009] (see text for discussion).
GeochemistryGeophysicsGeosystems G3G3 BARREYRE ET AL.: HYDROTHERMAL OUTFLOW AND IMAGE MOSAICS 10.1029/2011GC003990
24 of 29

available in the literature. We have excluded someanomalously low values, that show departures of30�C and up to >100�C, which we attribute tomeasurements performed within the mixing zoneand thus not corresponding to the high-temperaturefluids. The remaining outflow temperatures havebeen very stable, and show variations of <15�C(e.g., 325�C in 1993 and 2009 for Tour Eiffel),although we cannot determine if there havebeen volume flux variations over this same periodof time.
[51] The short-term decline in diffuse outflow isconsistent with an apparent decrease in the extentand intensity of hydrothermal activity at longerperiods of time, as interpreted from observationsin S and E of the Lucky Strike site, over the S1and S2 substrates. Inferences of temporal evolu-tion on fault scarps (S3) are hindered by theinherently unstable nature of these areas, charac-terized by mass wasting on talus. Identified fossilhydrothermal outflow (dark areas of the seafloorin S1, and extinct hydrothermal constructions inS2) occurred over a larger area than that of thepresent-day activity. For example, in the ‘slab’substrate (S1) the fossil outflow zones cover anarea an order of magnitude larger than the present-day diffuse outflow area (Figure 6). While we lackdating to constrain the age of fossil hydrothermalstructures here (chimneys, bulbous features), weestimate a maximum age, based upon spreading(�10 km/Ma) and distance from the graben axis(�300 m for the furthest sites), at �30,000 years.This area has been resurfaced by recent volcaniceruptions, as demonstrated by the volcanic historyat the lava lake [Ondréas et al., 2009], and thus theactual age may be considerably younger. We pro-pose that the age of these fossil outflow zoneslikely spans between a few thousands of years to a
few tens of thousands of years [e.g., Humphriset al., 2002], sufficient to allow the formationand death of the largest hydrothermal chimneysand mounds that are now extinct in the area. Thesystematic occurrence of present-day activity withinthe fossil outflow zones suggests a significantreduction of the surface area of both focused anddiffuse hydrothermal outflow that may be linked toan overall mass and heat flux reduction throughoutthe field. This interpretation is consistent with theshorter-term decline documented from imagery.
[52] Alternatively, a translation with time of thehydrothermal activity would also yield large areasof fossil outflow. However, based on a) the geo-metrical association of inactive and active flowwithin former outflow areas over substrate S1, b)the well-defined limits of these fossil outflowzones, and c) the consistent decline in activity overthe last �20 years, our preferred interpretation is anoverall and continuous decline of the site. Further-more, we observe no reactivation or appearance ofnew sites, nor active sites outside the dark areas inS1, which would be expected with spatial shiftingof the outflow at the seafloor.
[53] While the underlying causes of the decline inhydrothermal activity are not well known, the heatextracted by the hydrothermal discharge at theLucky Strike field is likely associated with thecooling and crystallization of melt in the underlyingmagma chamber. We consider now two values ofheat flux, a lower bound of �100 MW based uponthe minimum estimate of Wilson et al. [1996],and upper bound using our maximum estimate of�1000 MW. Assuming a latent heat of crystalliza-tion for basalt of 0.5 MJ/kg [Kojitani and Akaogi,1997] and a melt density of 2800 kg/m3, these heatflux estimates would thus represent the crystalliza-tion of 2.3–22.5 � 106 m3/yr of melt. Seismic
Table 5. In Situ Measurements of High-Temperature Outflow at Selected Hydrothermal Vents From the LuckyStrike Field (Temperatures in �C)a
1993b 1994c 1996d 1997e 2008f,g 2009g 2010g 2011g Average � STDh
Tour Eiffel 325 324 323 324 184g 317 296 325 323.0 � 3.0Sintra 212 215 222 176 200f 217 207 302.3 � 7.8Y3 333 324 328 319f 321 325.0 � 5.6Statue of Liberty 202 185 Extinct
aNumbers in italics correspond to values significantly lower than the average, and that we attribute to measurements within the mixing zone ofseawater and hydrothermal fluids.
bFAZAR cruise [Langmuir et al., 1997].cDIVA 1 cruise [Charlou et al., 2000].dLUSTRE cruise [Von Damm et al., 1998; Charlou et al., 2000].eFlores cruise [Charlou et al., 2000].fKNOX18RR cruise (data from WHOI Deep Submergence database, JASON VirtualVan available at http://4dgeo.whoi.edu/jason/).gThis study, from cruises MoMAR (2008), Bathyluck (2009), MoMARSAT (2010 and 2011).hAverage and standard deviation do not include the temperatures in italics, that are considered anomalously low.
GeochemistryGeophysicsGeosystems G3G3 BARREYRE ET AL.: HYDROTHERMAL OUTFLOW AND IMAGE MOSAICS 10.1029/2011GC003990
25 of 29

observations suggest that the AMC extends �6 kmalong-axis and �2 km across-axis [Singh et al.,2006; Combier, 2007]. If crystallization were dis-tributed throughout the melt lens, the heat flux canpotentially represent the freezing of a melt thick-ness of 0.2–1.9 m/year. Neither the thickness northe volume of melt of the Lucky Strike AMC arewell constrained, but assuming an AMC thicknessof 200 m, similar to that inferred at the EPR[e.g., Collier and Singh, 1998], with 100% melt(i.e., no previous crystallization), and no magmarecharge events, the melt lens would freeze in 100–1000 years. A slower rate of melt freezing timemay be achieved if the heat were mined from otherareas along the axis and not solely from the AMC[e.g., Fontaine et al., 2008], and/or by replenish-ment of the magma chamber. We expect that, atlonger time scales, this AMC replenishment willresult in volcanic eruptions and resurfacing of theseafloor, in addition to a resetting of the hydro-thermal system at the segment center. The recur-rence time of such magmatic events is unknown,but we speculate that it would be up to severalorders of magnitude longer than the observeddecline of hydrothermal activity reported here(1000 to 10s of thousands of years).
6. Conclusions
[54] We have demonstrated that repeated photo-graphic surveys of the seafloor using video andelectronic still cameras can be used to constructimage mosaics over large areas of the seafloor. Newimage processing techniques also allow us to geo-graphically register repeated surveys that can thenbe used for temporal studies. We applied thesetechniques at the Lucky Strike hydrothermal fieldto construct mosaics with a resolution of <10 mmand covering an area of �1 km2.
[55] We have identified four types of diffuse outflow(hydrothermal mounds, diffuse patches, cracks, andstreaks of hydrothermal deposits on slopes) fromimage mosaics. Outflow type and venting areaseem to be correlated with the nature of the sub-strate. We find more focused and organized out-flow in areas where the hydrothermal ‘slab’ ispresent, whereas outflow through older hydrother-mal deposits and fault scarps is characterized by arelatively low number of high-temperature vents,and more pervasive diffuse outflow. We interpretdark seafloor patches containing dead hydrother-mal structures as areas of fossil hydrothermal out-flow, within which the present-day hydrothermalactivity concentrates.
[56] The geometry of hydrothermal discharge at theseafloor reveals a pattern of clustering that we suggestreflects the underlying plumbing system at depth.Two main venting areas are observed, E and W,probably controlled by the set of faults bounding theaxial graben, and redistribution of outflow at shallowlevels exploits existing faults (90% of outflow struc-tures are within 20 m of a fault scarp).
[57] Quantification of both the number of vents andthe surface area with diffuse venting, in combina-tion with field measurements, allow us to provideindependent constraints on the total heat flux atLucky Strike. We estimate that the total heat flux isbetween �200 MW and 1000 MW, with 75% to90% of it taken up by diffuse outflow. We alsoestimate that the activity is concentrated in the Ewhere �70% of the hydrothermal dischargeappears to take place.
[58] Repeated image surveys reveal a decline in theintensity of diffuse hydrothermal outflow at theLucky Strike field over the last 10–20 years, con-sistent with an apparent longer-term decrease. Wespeculate that this decline may be explained by thecooling of the AMC, as our heat flux estimatessuggest that the AMC will freeze within �100–1000 years if there is no magmatic replenishment.
Acknowledgments
[59] We thank the captain, officers, and crew on board N/OPourquoi Pas? that made the series of Lucky Strike cruises pos-sible. The performance of the ROV Victor Team insured dataacquisition and operations that have allowed us to develop thisproject. This project was funded by CNRS/IFREMER throughthe 2006, 2008, 2009 and 2010 cruises within the MoMARprogram (France), by ANR (France) Mothseim Project NT05-342213 to J. Escartín, and by grant CTM2010-15216/MAR fromthe Spanish Ministry of Science to R. Garcia and J. Escartín.T. Barreyre was supported by University Paris Diderot (Paris 7–France) and Institut de Physique du Globe de Paris (IPGP,France). E. Mittelstaedt was supported by the InternationalResearch Fellowship Program of the U.S. National ScienceFoundation (OISE-0757920). We are grateful for constructivereviews by William Chadwick, one anonymous reviewerand Editor James Tyburczy. IPGP contribution 3279. Finally,I dedicate this paper to L.V.
References
Alt, J. C. (1995), Subseafloor processes in mid-ocean ridgehydrothennal systems, in Seafloor Hydrothermal Systems:Physical, Chemical, Biological, and Geological Interactions,Geophys. Monogr. Ser., vol. 91, edited by S. E. Humphriset al., pp. 85–114, AGU, Washington, D. C., doi:10.1029/GM091p0085.
GeochemistryGeophysicsGeosystems G3G3 BARREYRE ET AL.: HYDROTHERMAL OUTFLOW AND IMAGE MOSAICS 10.1029/2011GC003990
26 of 29

Baker, E. T. (2007), Hydrothermal cooling of mid ocean ridgeaxes: Do measured and modeled heat fluxes agree?, EarthPlanet. Sci. Lett., 263, 140–150, doi:10.1016/j.epsl.2007.09.010.
Baker, E. T., G. Massoth, S. Walker, and R. W. Embley(1993), A method for quantitatively estimating diffuse anddiscrete hydrothermal discharge, Earth Planet. Sci. Lett.,118, 235–249, doi:10.1016/0012-821X(93)90170-E.
Ballu, V., et al. (2009), A seafloor experiment to monitor verticaldeformation at the Lucky Strike volcano, Mid-Altantic Ridge,J. Geod., 83, 147–159, doi:10.1007/s00190-008-0248-3.
Bischoff, J. L., and W. E. Seyfried (1978), Hydrothermalchemistry of seawater from 25� to 350�C, Am. J. Sci., 278,838–860, doi:10.2475/ajs.278.6.838.
Bohnenstiehl, D., and M. C. Kleinrock (2000a), Evidence ofspreading-rate dependence in the displacement-length ratios ofabyssal hill faults at mid-ocean ridges, Geology, 28, 395–398,doi:10.1130/0091-7613(2000)28<395:EFSDIT>2.0.CO;2.
Bohnenstiehl, D. R., and M. C. Kleinrock (2000b), Fissuringnear the TAG active hydrothermal mound 26�N on the Mid-Atlantic Ridge, J. Volcanol. Geotherm. Res., 98, 33–48,doi:10.1016/S0377-0273(99)00192-4.
Brundage, W. L., and R. B. Patterson (1976), LIBEC photogra-phy as a sea floor mapping tool, in Oceans’76, pp. 156–166,Mar. Technol. Soc., Washington, D. C.
Brüning, M., H. Sahling, I. R. MacDonald, F. Ding, andG. Bohrmann (2010), Origin, distribution, and alteration ofasphalts at Chapopote Knoll, Southern Gulf of Mexico, Mar.Pet. Geol., 27, 1093–1106, doi:10.1016/j.marpetgeo.2009.09.005.
Cannat, M., et al. (1999), Mid-Atlantic ridge–Azores hotspotinteractions: Along-axis migration of a hotspot-derived mag-matic pulse 14 to 4 myrs ago, Earth Planet. Sci. Lett., 173,257–269, doi:10.1016/S0012-821X(99)00234-4.
Charlou, J. J., J. P. Donval, E. Douville, P. Jean Baptiste,J. Radford-Knoery, Y. Fouquet, A. Dapoigny, andM. Stievenard(2000), Compared geochemical signatures and the evolutionof Menez Gwen (37�50′N) and Lucky Strike (37�17′N)hydrothermal fluids, south of the Azores Triple Junction onthe Mid-Atlantic Ridge, Chem. Geol., 171, 49–75, doi:10.1016/S0009-2541(00)00244-8.
Colaço, A., et al. (2011), MoMAR-D: A technological challengeto monitor the dynamics of the Lucky Strike vent ecosystem,ICES J. Mar. Sci., 68, 416–424, doi:10.1093/icesjms/fsq075.
Collier, J. S., and S. C. Singh (1998), A seismic inversion studyof the axial magma chamber reflector beneath the EastPacific Rise near 10�N, in Modern Ocean Floor Processesand the Geological Record, edited by R. A. Mills andK. Harrison, Geol. Soc. Spec. Publ., 148, 17–28.
Combier, V. (2007), Mid-ocean Ridge Processes: InsightsFrom 3D Reflection Seismics at the 9�N OSC on the EastPacific Rise, and the Lucky Strike Volcano on the Mid-AtlanticRidge, 261 pp., Inst. de Phys. du Globe, Paris.
Cooper, M. J., H. Elderfield, and A. Schultz (2000), Diffusehydrothermal fluids from Lucky Strike hydrothermal ventfield: Evidence for a shallow conductively heated system,J. Geophys. Res., 105(B8), 19,369–19,375, doi:10.1029/2000JB900138.
Cuvelier, D., J. Sarrazin, A. Colaço, J. Copley, D. Desbruyères,A. G. Glover, P. Tyler, and R. S. Santos (2009), Distributionand spatial variation of hydrothermal faunal assemblages atLucky Strike (Mid-Atlantic Ridge) revealed by high-resolutionvideo image analysis, Deep Sea Res., Part I, 56, 2026–2040,doi:10.1016/j.dsr.2009.06.006.
DeMets, C., R. G. Gordon, D. F. Argus, and S. Stein (1990),Current plate motions, Geophys. J. Int., 101, 425–478,doi:10.1111/j.1365-246X.1990.tb06579.x.
Desbruyères, D., et al. (2001), Variations in deep-sea hydro-thermal vent communities on the Mid-Atlantic ridge nearthe Azores plateau, Deep Sea Res., Part I, 48, 1325–1346,doi:10.1016/S0967-0637(00)00083-2.
Dziak, R. P., D. K. Smith, D. R. Bohnenstiehl, C. G. Fox,D. Desbruyères, H. Matsumoto, M. Tolstoy, and D. J. Fornari(2004), Evidence of a recent magma dike intrusion at theslow spreading Lucky Strike segment, Mid-Atlantic Ridge,J. Geophys. Res., 109, B12102, doi:10.1029/2004JB003141.
Elderfield, H., and A. Schultz (1996), Mid-ocean ridge hydro-thermal fluxes and the chemical composition of the ocean,Annu. Rev. Earth Planet. Sci., 24, 191–224, doi:10.1146/annurev.earth.24.1.191.
Emmanuel, S., and B. Berkowitz (2006), Suppression and stim-ulation of seafloor hydrothermal convection by exothermicmineral hydration, Earth Planet. Sci. Lett., 243, 657–668,doi:10.1016/j.epsl.2006.01.028.
Escartín, J., M. Cannat, G. Pouliquen, A. Rabain, and J. Lin(2001), Crustal thickness of V-shaped ridges south of theAzores: Interaction of the Mid-Atlantic Ridge (36�–39�N) andthe Azores hot spot, J. Geophys. Res., 106, 21,719–21,735,doi:10.1029/2001JB000224.
Escartín, J., et al. (2008a), Globally aligned photo mosaic of theLucky Strike hydrothermal Vent Field (Mid-Atlantic Ridge,37�18.5′N): Release of geo-referenced data, mosaic construc-tion and viewing software, Geochem. Geophys. Geosyst., 9,Q12009, doi:10.1029/2008GC002204.
Escartín, J., D. K. Smith, J. Cann, H. Schouten, C. H. Langmuir,and S. Escrig (2008b), Central role of detachment faults inaccretion of slow-spreading oceanic lithosphere, Nature,455, 790–794, doi:10.1038/nature07333.
Fisher, A. T., and K. Becker (1991), Heat flow, hydrothermalcirculation and basalt intrusions in the Guaymas Basin, Gulf ofCalifornia, Earth Planet. Sci. Lett., 103, 84–99, doi:10.1016/0012-821X(91)90152-8.
Foley, B. P., et al. (2009), The 2005 Chios ancient shipwrecksurvey. New methods for underwater archaeology, Hesperia,78, 269–305, doi:10.2972/hesp.78.2.269.
Fontaine, F. J., and W. S. D. Wilcock (2007), Two-dimensionalnumerical models on open-top hydrothermal convection onhigh Rayleigh and Nusselt numbers: Implications for mid-ocean ridge hydrothermal circulation, Geochem. Geophys.Geosyst., 8, Q07010, doi:10.1029/2007GC001601.
Fontaine, F. J., M. Cannat, and J. Escartín (2008), Hydrother-mal circulation at slow-spreading mid-ocean ridges: The roleof along-axis variations in axial lithospheric thickness,Geology, 36, 759–762, doi:10.1130/G24885A.1.
Fontaine, F. J., S. D. Wilcock, D. I. Foustoukos, and D. A.Butterfield (2009), A Si-Cl geothermobarometer for thereaction zone of high-temperature, basaltic-hosted mid-oceanridge hydrothermal systems, Geochem. Geophys. Geosyst.,10, Q05009, doi:10.1029/2009GC002407.
Fornari, D. J. (2003), A new deep-sea towed digital cameraand multi-rock coring system, Eos Trans. AGU, 84, 69–76,doi:10.1029/2003EO080001.
Fouquet, Y., H. Ondréas, J.-L. Charlou, J.-P. Donval, J. Radford-Knoery, I. Costa, N. Lourenco, and M. K. Tivey (1995),Atlantic lava lakes and hot vents, Nature, 377, 201,doi:10.1038/377201a0.
Garcia, R., R. Campos, and J. Escartín (2011), High-resolution3D reconstruction of the seafloor for environmental monitor-ing and modelling, paper presented at IEEE/RSJ InternationalConference on Intelligent Robots and Systems, Workshop onRobotics for Environmental Monitoring, Inst. of Electr. andElectron. Eng., San Francisco, Calif.
GeochemistryGeophysicsGeosystems G3G3 BARREYRE ET AL.: HYDROTHERMAL OUTFLOW AND IMAGE MOSAICS 10.1029/2011GC003990
27 of 29

German, C. R., et al. (2010a), Diverse styles of submarineventing on the ultraslow spreading Mid-Cayman Rise, Proc.Natl. Acad. Sci. U. S. A., 107, 14,020–14,025, doi:10.1073/pnas.1009205107.
German, C., A. M. Thurnherr, J. Knoery, J.-L. Charlou,P. Jean-Baptiste, and H. N. Edmonds (2010b), Heat, volumeand chemical fluxes from submarine venting: A synthesis ofresults from the Rainbow hydrothermal field 36�N MAR,Deep Sea Res., Part I, 57(4), 518–527, doi:10.1016/j.dsr.2009.12.011.
Haymon, R. M., K. C. Macdonald, S. B. Benjamin, and C. J.Ehrhardt (2005), Manifestations of hydrothermal dischargefrom young abyssal hills on the fast-spreading East PacificRise flank, Geology, 33, 153–156, doi:10.1130/G21058.1.
Humphris, S. E., Fornari, D. J., Scheirer, D. S., German, C. R.,and Parson, L. M. (2002), Geotectonic setting of hydrother-mal activity on the summit of Lucky Strike seamount(37�17′N, Mid-Atlantic Ridge), Geochem. Geophys. Geosyst.,3(8), 1049, doi:10.1029/2001GC000284.
Jean-Baptiste, P., H. Bougault, A. Vangriesheim, J.-L. Charlou,J. Radford-Knoery, Y. Fouquet, H. D. Needham, andC. German (1998), Mantle 3He in hydrothermal vents andplume of the Lucky Strike site (MAR 37�17′N) and associatedgeothermal heat flux, Earth Planet. Sci. Lett., 157, 69–77,doi:10.1016/S0012-821X(98)00022-3.
Kleinrock, M. C., and S. E. Humphris (1996), Structural asym-metry of the TAG rift valley: Evidence from a near-bottomsurvey for episodic spreading, Geophys. Res. Lett., 23,3439–3442, doi:10.1029/96GL03073.
Kojitani, H., and M. Akaogi (1997), Melting enthalpies ofmantle peridotite: Calorimetric determinations in the systemCaO-MgO-Al2O3-SiO2 and application to magma genera-tion, Earth Planet. Sci. Lett., 153, 209–222, doi:10.1016/S0012-821X(97)00186-6.
Langmuir, C. H., et al. (1993), Geological setting and charac-teristics of the Lucky Strike vent field at 37�17′N on theMid-Atlantic Ridge, Eos Trans. AGU, 74, 99.
Langmuir, C., et al. (1997), Hydrothermal vents near a mantlehot spot: The Lucky Strike vent field at 37�N on the Mid-Atlantic Ridge, Earth Planet. Sci. Lett., 148, 69–91,doi:10.1016/S0012-821X(97)00027-7.
Lessard-Pilon, S., M. D. Porter, E. E. Cordes, I. MacDonald,and C. R. Fisher (2010), Community composition and tem-poral change at deep Gulf of Mexico cold seeps, Deep SeaRes., Part II, 57, 1891–1903, doi:10.1016/j.dsr2.2010.05.012.
Lister, C. R. B. (1982), “Active” and “passive” hydrothermalsystems in the ocean crust. Predicted physical conditions, inThe Dynamic Seafloor, edited by K. A. Fanning and F. T.Manheim, pp. 441–470, Heath, Lexington, Mass.
Lundsten, L., K. L. Schlining, K. Frasier, S. B. Johnson, L. A.Kuhnz, J. B. J. Harvey, G. Clague, and R. C. Vrijenhoek(2010), Time-series analysis of six wale-fall communities inMonterey Canyon, California, USA, Deep Sea Res., Part I,57, 1573–1584, doi:10.1016/j.dsr.2010.09.003.
Maki, T., H. Kondo, T. Ura, and T. Sakamaki (2008), Large-area visual mapping of an underwater vent field using theAUV “Tri-Dog 1”, in Oceans 2008, pp. 1135–1702, IEEEPress, Piscataway, N. J.
Martins, I., A. Colaço, R. S. Santos, F. Lesongeur, A. Godfroy,P.-M. Sarradin, and R. P. Cosson (2009), Relationshipbetween the occurrence of filamentous bacteria on Bathymo-diolus azoricus shell and the physiological and toxicologicalstatus of vent mussel, J. Exp. Mar. Biol. Ecol., 376, 1–6,doi:10.1016/j.jembe.2009.05.001.
McCaig, A., R. A. Cliff, J. Escartín, A. E. Fallick, and C. J.MacLeod (2007), Oceanic detachment faults focus very largevolumes of black smoker fluids, Geology, 35, 935–938,doi:10.1130/G23657A.1.
Mittelstaedt, E., J. Escartín, N. Gracias, J.-A. L. Olive,T. Barreyre, A. Davaille, M. Cannat, and R. Garcia (2012),Quantifying diffuse and discrete venting at the Tour Eiffelvent site, Lucky Strike hydrothermal field,Geochem. Geophys.Geosyst., 13, Q04008, doi:10.1029/2011GC003991.
Miranda, J. M., J. F. Luis, N. Lourenço, and F. M. Santos(2005), Identification of the magnetization low of the LuckyStrike hydrothermal vent using magnetic data, J. Geophys.Res., 110, B04103, doi:10.1029/2004JB003085.
Møller, N. (1988), The prediction of mineral solubilities innatural waters: A chemical equilibrium model for theNa-Ca-Cl-SO4–H2O system, to high-temperature and concentra-tion, Geochim. Cosmochim. Acta, 52, 821–837, doi:10.1016/0016-7037(88)90354-7.
Ondréas, H., Y. Fouquet, M. Voisset, and J. Radford-Knoery(1997), Detailed study of three contiguous segments of theMid-Atlantic Ridge, South of the Azores (37�N to 38�30′N),using acoustic imaging coupled with submersible observa-tions, Mar. Geophys. Res., 19, 231–255, doi:10.1023/A:1004230708943.
Ondréas, H., M. Cannat, Y. Fouquet, A. Normand, P.-M.Sarradin, and J. Sarrazin (2009), Recent volcanic events andthe distribution of hydrothermal venting at the Lucky Strikehydrothermal field, Mid-Atlantic Ridge, Geochem. Geophys.Geosyst., 10, Q02006, doi:10.1029/2008GC002171.
Prados, R., R. Garcia, J. Escartín, and L. Neumann (2011),Challenges of close-range underwater optical mapping, inOceans 2011, pp. 1–10, IEEE Press, Piscataway, N. J.
Ramondenc, P., L. N. Germanovich, K. L. Von Damm, andR. P. Lowell (2006), The first measurements of hydrother-mal heat output at 9�50′N, East Pacific Rise, Earth Planet.Sci. Lett., 245, 487–497, doi:10.1016/j.epsl.2006.03.023.
Ruhl, H. A., et al. (2011), Societal need for improved under-standing of climate change, anthropogenic impacts, andgeo-hazard warning drive development of ocean observatoriesin European Seas, Prog. Oceanogr., 91, 1–33, doi:10.1016/j.pocean.2011.05.001.
Sarradin, P. M., J. C. Caprais, R. Riso, R. Kerouel, andA. Aminot (1999), Chemical environment of the hydrothermalmussel communities in the Lucky Strike andMenez Gwen ventfields, Mid Atlantic Ridge, Cah. Biol. Mar., 40, 93–104.
Sarrazin, J., P. Rodier, M. K. Tivey, A. Schultz, and P.-M.Sarradin (2009), A dual sensor device to estimate fluidflow velocity at diffuse hydrothermal vents, Deep SeaRes., Part I, 56, 2065–2074, doi:10.1016/j.dsr.2009.06.008.
Scheirer, D. S., D. J. Fornari, S. E. Humphris, and S. Lerner(2000), High-resolution seafloor mapping using the DSL-120sonar system: Quantitative assessment of sidescan andphase-bathymetry data from the Lucky Strike segment of theMid-Atlantic Ridge, Mar. Geophys. Res., 21, 121–142,doi:10.1023/A:1004701429848.
Schultz, A., J. R. Delaney, and R. E. McDuff (1992), On thepartitioning of heat flux between diffuse and point sourceseafloor venting, J. Geophys. Res., 97(B9), 12,299–12,314,doi:10.1029/92JB00889.
Seher, T., S. C. Singh, W. C. Crawford, and J. Escartín(2010a), Upper crustal velocity structure beneath the centralLucky Strike Segment from seismic refraction measurements,Geochem. Geophys. Geosyst., 11, Q05001, doi:10.1029/2009GC002894.
GeochemistryGeophysicsGeosystems G3G3 BARREYRE ET AL.: HYDROTHERMAL OUTFLOW AND IMAGE MOSAICS 10.1029/2011GC003990
28 of 29

Seher, T., W. C. Crawford, S. C. Singh, and M. Cannat(2010b), Seismic layer 2A variations in the Lucky Strike seg-ment at the Mid‐Atlantic Ridge from reflection measurements,J. Geophys. Res., 115, B07107, doi:10.1029/2009JB006783.
Simeoni, P., J. Sarrazin, H. Nouzé, P. M. Sarradin, H. Ondréas,C. Scalabrin, and J. M. Sinquin (2007), Victor 6000: newhigh resolution tools for deep sea research; Module deMesures en Route, in Oceans 2007, p. 133–138, IEEE Press,Piscataway, N. J.
Singh, S. C., W. C. Crawford, H. Carton, T. Seher, V. Combier,M. Cannat, J. P. Canales, D. Dusunur, J. Escartín, and J. M.Miranda (2006), Discovery of a magma chamber and faultsbeneath a Mid-Atlantic Ridge hydrothermal field, Nature,442, 1029–1032, doi:10.1038/nature05105.
Spiess, F. N., et al. (1980), East Pacific Rise: Hot springsand geophysical experiments, Science, 207, 1421–1433,doi:10.1126/science.207.4438.1421.
Stein, C. A., and S. Stein (1994), Constraints on hydrothermalheat flux through the oceanic lithosphere from global heatflow, J. Geophys. Res., 99(B2), 3081–3095, doi:10.1029/93JB02222.
Thatcher, W., and D. P. Hill (1995), A simple model for thefault-generated morphology of slow-spreading mid-oceanridges, J. Geophys. Res., 100(B1), 561–570, doi:10.1029/94JB02593.
Tivey, M. A., and H. P. Johnson (2002), Crustal magnetizationreveals subsurface structure of Juan de Fuca hydrothermalvent fields, Geology, 30, 979–982, doi:10.1130/0091-7613(2002)030<0979:CMRSSO>2.0.CO;2.
Tolstoy, M., F. Waldhauser, D. R. Bohnenstiehl, R. T. Weekly,and W.-Y. Kim (2008), Seismic identification of along-axishydrothermal flow on the East Pacific Rise, Nature, 451,181–184, doi:10.1038/nature06424.
Trivett, D. A., and A. J. I. Williams (1994), Effluent from dif-fuse hydrothermal venting: 2. Measurement of plumes fromdiffuse hydrothermal vents at the southern Juan de FucaRidge, J. Geophys. Res., 99(C9), 18,417–18,432, doi:10.1029/94JC00096.
Valentine, D. L., et al. (2010), Asphalt volcanoes as a potentialsource of methane to late Pleistocene coastal waters, Nat.Geosci., 3, 345–348, doi:10.1038/ngeo848.
Van Dover, C. L. (2000), The Ecology of Deep-Sea Hydrother-mal Vents, Princeton Univ. Press, Princeton, N. J.
Veirs, S. R., R. E. McDuff, and F. R. Stahr (2006), Magnitudeand variance of near-bottom horizontal heat flux at the MainEndeavour hydrothermal vent field, Geochem. Geophys.Geosyst., 7, Q02004, doi:10.1029/2005GC000952.
Von Damm, K. L. (1990), Seafloor hydrothermal activity: Blacksmoker chemistry and chimneys,Annu. Rev. Earth Planet. Sci.,18, 173–204, doi:10.1146/annurev.ea.18.050190.001133.
Von Damm, K. L., A. M. Bray, L. G. Buttermore, and S. E.Oosting (1998), The geochemical controls on vent fluidsfrom the Lucky Strike vent field, Mid-Atlantic Ridge, EarthPlanet. Sci. Lett., 160, 521–536, doi:10.1016/S0012-821X(98)00108-3.
Wilcock, W. S. D., and J. R. Delaney (1996), Mid-ocean ridgesulfide deposits: Evidence for heat extraction from magmachambers or cracking fronts?, Earth Planet. Sci. Lett., 145,49–64, doi:10.1016/S0012-821X(96)00195-1.
Wilson, C., J.-L. Charlou, E. Ludford, G. Klinkhammer,C. Chin, H. Bougault, C. German, K. G. Speer, andM. Palmer (1996), Hydrothermal anomalies in the LuckyStrike segment on the Mid-Atlantic Ridge (37�17′N),Earth Planet. Sci. Lett., 142, 467–477, doi:10.1016/0012-821X(96)00100-8.
GeochemistryGeophysicsGeosystems G3G3 BARREYRE ET AL.: HYDROTHERMAL OUTFLOW AND IMAGE MOSAICS 10.1029/2011GC003990
29 of 29
Copyright © 2022 FDOKUMEN