Structure-specific selection of earthquake ground motions for ...
29
General rights Copyright and moral rights for the publications made accessible in the public portal are retained by the authors and/or other copyright owners and it is a condition of accessing publications that users recognise and abide by the legal requirements associated with these rights. Users may download and print one copy of any publication from the public portal for the purpose of private study or research. You may not further distribute the material or use it for any profit-making activity or commercial gain You may freely distribute the URL identifying the publication in the public portal If you believe that this document breaches copyright please contact us providing details, and we will remove access to the work immediately and investigate your claim. Structure-specific selection of earthquake ground motions for the reliable design and assessment of structures Katsanos, E. I.; Sextos, A. G. Published in: Bulletin of Earthquake Engineering Link to article, DOI: 10.1007/s10518-017-0226-3 Publication date: 2018 Document Version Peer reviewed version Link back to DTU Orbit Citation (APA): Katsanos, E. I., & Sextos, A. G. (2018). Structure-specific selection of earthquake ground motions for the reliable design and assessment of structures. Bulletin of Earthquake Engineering, 16(2), 583-611. https://doi.org/10.1007/s10518-017-0226-3 brought to you by CORE View metadata, citation and similar papers at core.ac.uk provided by Online Research Database In Technology
-
Upload
khangminh22 -
Category
Documents
-
view
0 -
download
0
Transcript of Structure-specific selection of earthquake ground motions for ...
General rights Copyright and moral rights for the publications made accessible in the public portal are retained by the authors and/or other copyright owners and it is a condition of accessing publications that users recognise and abide by the legal requirements associated with these rights.
Users may download and print one copy of any publication from the public portal for the purpose of private study or research.
You may not further distribute the material or use it for any profit-making activity or commercial gain
You may freely distribute the URL identifying the publication in the public portal If you believe that this document breaches copyright please contact us providing details, and we will remove access to the work immediately and investigate your claim.
Downloaded from orbit.dtu.dk on: Oct 21, 2019
Structure-specific selection of earthquake ground motions for the reliable design andassessment of structures
Katsanos, E. I.; Sextos, A. G.
Published in:Bulletin of Earthquake Engineering
Link to article, DOI:10.1007/s10518-017-0226-3
Publication date:2018
Document VersionPeer reviewed version
Link back to DTU Orbit
Citation (APA):Katsanos, E. I., & Sextos, A. G. (2018). Structure-specific selection of earthquake ground motions for the reliabledesign and assessment of structures. Bulletin of Earthquake Engineering, 16(2), 583-611.https://doi.org/10.1007/s10518-017-0226-3
brought to you by COREView metadata, citation and similar papers at core.ac.uk
provided by Online Research Database In Technology
1
Structure-specific selection of earthquake ground motions for the reliable design and assessment of structures
E. I. Katsanos1* & A. G. Sextos2,3
1Department of Civil Engineering, Technical University of Denmark, Kgs. Lyngby 2800, Denmark 2 Faculty of Engineering, Department of Civil Engineering, Aristotle University, Thessaloniki, 54124, Greece
3Faculty of Engineering, Department, of Civil Engineering, University of Bristol, Bristol, BS8 1TR, UK
* Corresponding author – Contact details, email: [email protected]. Phone: 0045-45255031
Abstract
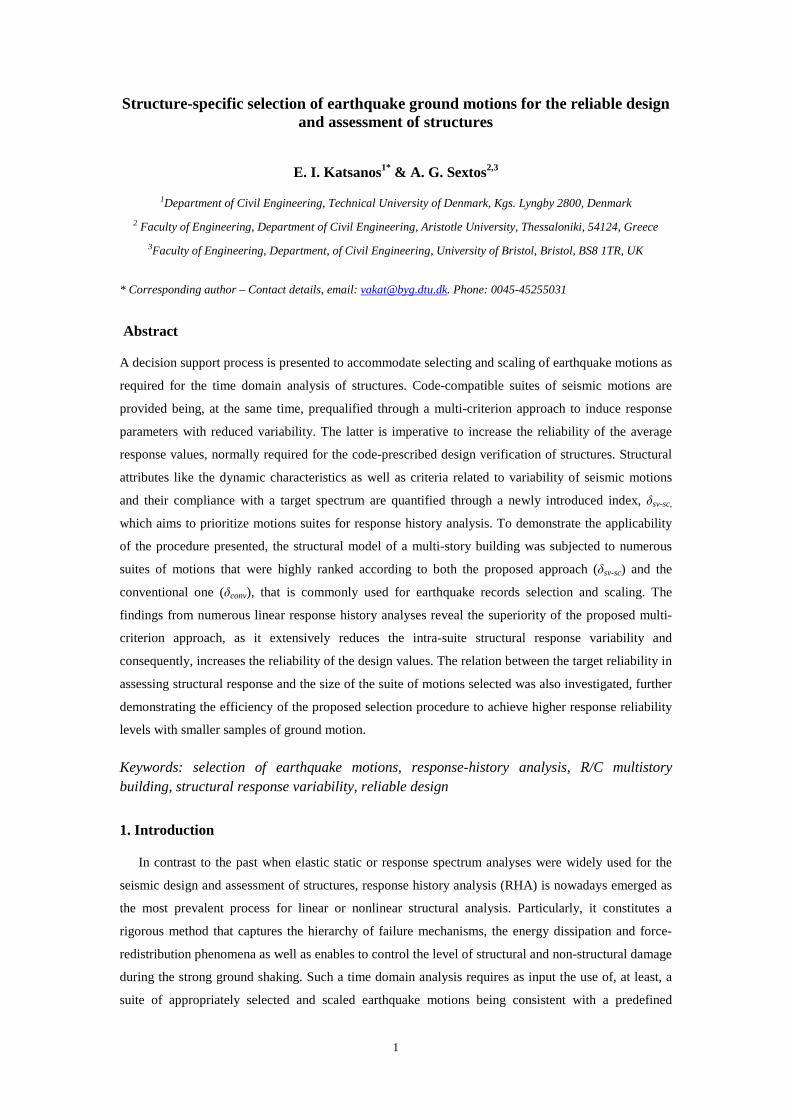
A decision support process is presented to accommodate selecting and scaling of earthquake motions as
required for the time domain analysis of structures. Code-compatible suites of seismic motions are
provided being, at the same time, prequalified through a multi-criterion approach to induce response
parameters with reduced variability. The latter is imperative to increase the reliability of the average
response values, normally required for the code-prescribed design verification of structures. Structural
attributes like the dynamic characteristics as well as criteria related to variability of seismic motions
and their compliance with a target spectrum are quantified through a newly introduced index, δsv-sc,
which aims to prioritize motions suites for response history analysis. To demonstrate the applicability
of the procedure presented, the structural model of a multi-story building was subjected to numerous
suites of motions that were highly ranked according to both the proposed approach (δsv-sc) and the
conventional one (δconv), that is commonly used for earthquake records selection and scaling. The
findings from numerous linear response history analyses reveal the superiority of the proposed multi-
criterion approach, as it extensively reduces the intra-suite structural response variability and
consequently, increases the reliability of the design values. The relation between the target reliability in
assessing structural response and the size of the suite of motions selected was also investigated, further
demonstrating the efficiency of the proposed selection procedure to achieve higher response reliability
levels with smaller samples of ground motion.
Keywords: selection of earthquake motions, response-history analysis, R/C multistory building, structural response variability, reliable design
1. Introduction
In contrast to the past when elastic static or response spectrum analyses were widely used for the
seismic design and assessment of structures, response history analysis (RHA) is nowadays emerged as
the most prevalent process for linear or nonlinear structural analysis. Particularly, it constitutes a
rigorous method that captures the hierarchy of failure mechanisms, the energy dissipation and force-
redistribution phenomena as well as enables to control the level of structural and non-structural damage
during the strong ground shaking. Such a time domain analysis requires as input the use of, at least, a
suite of appropriately selected and scaled earthquake motions being consistent with a predefined
2
earthquake scenario. Nevertheless, research has shown that among all possible uncertainty sources
stemming from structural and soil material properties, the modeling approximations, the design and
analysis assumptions as well as the earthquake-induced ground motion, the latter yields the highest
effect on structural response (Elnashai and McGlure 1996, Padgett and Desroches 2007). Inevitably,
the above uncertainty propagates to structural demand and the selected seismic motions may ultimately
govern the reliability of the seismic design or assessment outcome.
Since 1990's, various techniques have been developed to address the complex problem of selecting
and scaling earthquake ground motions (PEER GMSM 2009, Katsanos et al. 2010). From the objective
point of view, most of the ground motion selection and scaling procedures aim to determine either the
central estimate (i.e., mean or median) of the structural response or its full probability distribution (i.e.,
median response and standard deviation). The rationale to calculate the central tendency of an
appropriately chosen engineering demand parameter, EDP, (e.g., element forces and deformations,
interstory drifts) is directly related to the code-based design verification of structures, where stable
estimates of the average structural response have to be achieved to ensure the reliability of the design
outcome (EN1998-Part 1 2004, ICC 2009, ASCE 7-10 2010, Hancock et al. 2008). On the other hand,
when the seismic performance of existing structures is evaluated, knowledge of the central response
estimate is unlikely to be adequate and the full response distribution is required to consider, for
example, the damage associated with the entire range of the structural behavior. The probabilistic, risk-
based assessment (FEMA P-58-1 2012) requires also a comprehensive evaluation of structural
behavior; hence, the use of the full response distribution is dictated.
Numerous seismological (i.e., earthquake magnitude, distance between the seismic source and the
site of interest, fault rupture mechanism and the directivity of seismic waves), strong-motion (i.e.,
duration and amplitude of seismic waves) as well as site parameters (i.e., the soil conditions at the
structure’s site) have been employed to select ground motions (e.g., Malhotra 2003, Kwon and
Elnashai 2006, Dhakal et al. 2006, Iervolino et al. 2006, Youngs et al. 2006, Kurama and Farrow 2003,
Lee et al. 2000, Sorabella et al. 2006). However, the concurrent application of multiple selection
criteria may significantly restrict the available number of earthquake records (Stewart et al. 2001,
Bommer and Acevedo 2004). Thus, a balance has to be preserved between the extent of the selection
criteria applied and the number of seismic motions required for the RHA. To compromise the above,
most of the current state-of-the-art methods designate earthquake magnitude, M, and source-to-site
distance, Rs, as the criteria for the preliminary selection of seismic motions. These seismological
parameters are familiar to structural engineers, while they can be readily obtained either by
deterministic seismic hazard analysis, SHA, or by disaggregating the probabilistic SHA (Kramer 1996,
Bazzurro and Cornell 1999).
Once the strong ground motions have been selected from an earthquake records archive, the most
compatible records with a predefined target spectrum are primarily preferred for the structural analysis.
The Conditional Mean Spectrum, CMS, (Baker 2011) and the related Conditional Spectrum, CS,
(Jayaram et al. 2011) can be used as target spectra, being the most prevalent alternatives to the Uniform
Hazard Spectra, UHS (Reiter 1990). The latter serves the basis to define the smooth code spectra and
assumes equal probability of exceedance for the spectral accelerations along the entire period range of
3
structural interest. Nevertheless, spectral values of high amplitude, computed for each period, are
unlikely to occur simultaneously in a single ground motion (Bommer et al. 2000, Naeim and Lew
1995, McGuire 1995); hence, significant conservatism is related to the use of UHS especially for the
rare levels of seismic hazard. On the contrary, CMS accounts for correlations among spectral
accelerations at all periods, while it introduces the use of the epsilon parameter1, ε, that has been found
to be an efficient predictor of the spectral shape and thus the structural response (Baker and Cornell
2006). Recently, this approach was extended to consider conditional values of any ground motion
properties (e.g., duration) rather than only spectral values (Bradley 2010). However, the application of
those conditional spectra is relatively limited, since they are site-specific and advanced seismic hazard
disaggregation information is required, while their spectral shape and amplitude are sensitive to the
user-defined, conditioning period. Thus, inaccuracies in period estimation may adversely affect the
structural analysis results (O’Donnel et al. 2013).
Independently on the target spectrum adopted, several methods have been developed to modify the
ground motions and hence to achieve matching with the reference spectrum. A basic method is to scale
the amplitude of ground motions in order to establish the required compatibility between the average
earthquake records’ response spectrum and the target one. Various metrics have been employed to
quantify the spectral compatibility (Beyer and Bommer 2007, Buratti et al. 2011). This type of
amplitude scaling attempts preserving the inherent variability of the recorded ground motions as well
as their frequency content and the spectral shape. Unbiased response results can be also derived unless
extensive scaling factors (more than three to five or even higher - this issue is still controversial) are
employed (e.g., Luco and Bazzurro 2007, Watson-Lamprey and Abrahamson 2006, Huang et al. 2011,
Grigoriu 2011). For nonlinear RHA of both symmetric and asymmetric in-plan buildings, modal
pushover-based scaling procedures have been recently introduced (Kalkan and Chopra 2011, Reyes and
Quintero 2013, Reyes et al. 2015) and their performance was found to provide superior response results
in terms of accuracy and efficiency than the strong motions scaling procedure prescribed by ASCE/SEI
7-10 standard. Alternatively, the frequency content of the recorded accelerograms can be modified
using techniques from stochastic or random vibration theory (e.g., Naeim and Lew 1995, Hancock et
al. 2006, Barenberg 1989, Carballo and Cornell 2000, Silva and Lee 1987, Boore 2000, Giaralis and
Spanos 2009, Cacciola 2010, Lee and Han 2002). In this way, artificial accelerograms are generated
that match a given target spectrum for a specific period range. The reduced record-to-record variability,
commonly identified for this category of spectrally matched accelerograms, enables calculating mildly-
scattered response results. However, due to this artificially reduced variability, the artificial seismic
records can be mainly used to determine mean (or median) response and not the full distribution.
Moreover, these spectral matching techniques commonly result in accelerograms with excessive
number of strong motion cycles and thus unreasonable high energy content (Bommer and Acevedo
2004). Finally, a systematic unconservative bias in the estimation of the mean structural response has
been identified (Luco and Bazzurro 2007, Huang et al. 2011, Carballo and Cornell 2000).
1 The epsilon parameter, ε, is defined as the number of standard deviations, by which an observed logarithmic spectral acceleration deviates from the mean logarithmic spectral acceleration of a ground-motion prediction equation.
4
2. Challenges and Objectives
Based on the discussion made above, substantial progress has been made for selecting and scaling
strong motions. Nevertheless, the main findings of these evolutionary methods are still not reflected on
the present state-of-the-practice and the seismic codes drafting. The current code provisions provide
marginal and simplified guidance for such a critical issue. Thus, the practitioners take often subjective
decisions that may lead to structural solutions of limited confidence. Along these lines, Sextos et al.
(2011) showed that the nonlinear RHA of a multistory building using, different but fully legitimate,
Eurocode 8-compatible suites of ground motions leaded to highly scattered response results, thus
undermining the desired reliability for the structural analysis. The extensive variability in the predicted
response is corroborated by relevant studies (e.g., Reyes and Kalkan 2012, Araújo et al. 2016), while a
more accurate determination of the variation range for the M,Rs-based selection criterion is not
expected to reduce the response variability, since structural behavior and M-Rs pairs were found only
partially correlated (Shome et al. 1998, Baker and Cornell 2005, Krawinkler et al. 2003). Moreover,
the absence in code drafting of explicit criteria to ensure the quality of the required compatibility
between code spectrum and ground motions spectra was found to be responsible for overconservatism
in the design outcome, being a-priori evident due to the uniform hazard-type (UHS) of the code
spectrum (Sextos et al. 2011). The limited consensus of the designers for this complex issue of high,
though, importance for the structural analysis reliability blurs further the application of the code-
prescribed framework, already identified with deficiencies. Hence, the lack of a supportive background
with reasonable rules, based on the state-of-the-art progress, often leads structural engineers to decide
without the justifying appropriately their ground motion selection and scaling procedure.
To counteract this problem, innovative techniques, associated with robust algorithms and software,
were recently made available to accommodate selecting and scaling of ground motions. Apart from the
aforementioned advancements from Baker’s research group (e.g., Baker 2011, Jayaram et al. 2011) and
Bradley (2010,2012), Iervolino et al. (2010) developed a computational tool that enables the selection
of suites of multi-component ground motions compatible with either code-based or user-defined
pseudo-acceleration response spectra. Moreover, Smerzini et al. (2014) focused on selecting
displacement-spectrum-compatible seismic ground motions, while the latter was also elaborated by
Corigliano et al. (2012), who introduced an automated procedure to select seismic motions for RHA on
the basis of a wealth database with good-quality seismic records. A web-based application, released by
Dias et al. (2010), is capable of selecting ground motions accounting for geophysical and strong ground
motion parameters, while spectral compatibility criteria have been also introduced therein. The
presence of velocity pulses in near-fault time series was considered, among others, as a seismic records
selection criterion via the Design Ground Motion Library (DGML, Wang et al. 2013), which utilizes
the Next Generation Attenuation Strong-Motion Database, PEER-NGA (Chiou et al. 2008). A semi-
automated algorithm was also proposed by Kottke and Rathje (2008) for selecting and scaling of strong
motions that fit both to a target spectrum and a target standard deviation.
Nevertheless, all these cases cannot be either easily applied in a design-office environment, unless
either hazard disaggregation data is requested (note that for several earthquake-prone areas of the world
this data is not readily available to the designers) or the reduced structural response variability is not
5
considered as an objective. Thus, structural design solutions with limited confidence may be emerged.
Along these lines, it is doubtful whether the designers are adequately supported to decide: (a) which
records to be selected for the RHA and the consequent code-compatible design or assessment of
structures, (b) how the selected records must be grouped into suites to match the spectral compatibility
requirements, (c) which are the substantial structural properties that have to be considered when
seismic records are to be selected and scaled for RHA of a given structure and (d) how the reliability of
the response estimates can be ensured in order to achieve a design outcome with a predefined level of
confidence.
Given the above considerations, the scope of this study is to improve the existing seismic design
and assessment framework by introducing a decision support process, which provides prequalified
suites of seismic motions that induce stable, and thus reliable, design (average2) response values. Along
these lines, the proposed process can be applied for the code-conformed design verification of
buildings and bridges, since in this case stable central estimates of structural response are to be
predicted. The process introduced herein may be also employed to evaluate the seismic performance
under an arbitrary shaking intensity represented by a user-defined target spectrum (i.e., intensity-based
assessment as defined by FEMA P-58-1 2012). It is notable that the current decision support process is
implemented into a newer version of the computational system ISSARS (Katsanos and Sextos 2013),
developed by the authors, which facilitates structure-dependent selection and scaling of earthquake
ground motions rapidly formed into numerous suites that can be used for the RHA of structures. These
suites of motions are ranked by a complex system that designates those motions that lead to structural
response results of limited variability, and thus, increased reliability. To achieve this target, the
proposed ranking system, quantifies both: (a) the spectral variability among the selected motions of
each suite and, (b) the convergence between the suites average spectrum and the target one. Moreover,
the dynamic characteristics of the structure studied, such as the elastic vibrations periods and the
inelastic ones due to the nonlinear structural behavior during the earthquake excitation as well as the
modal mass participation factors are explicitly accounted for within the current framework so as a
structure-specific process for earthquake records selection and scaling is materialized.
In the following, the above response-oriented process is presented and its efficiency is evaluated
through numerous response linear history analyses for the case of an existing multistory, reinforced
concrete (R/C) building. The variability of the structural response induced by the conventional and the
proposed procedure is then comparatively assessed. The number of earthquake motions required to
obtain stable response estimates is also investigated.
3. Multi-criterion process for selecting and scaling of earthquake motions
Based on preliminary selection criteria, including the earthquake magnitude, M, the source-to-site
distance, Rs, the soil conditions at the recording site and the peak ground acceleration, PGA, the eligible
earthquake records are retrieved by the PEER-NGA Database (Chiou et al. 2008) and they are used to
form alternative suites of motions that satisfy either the code-imposed or the used-defined requirements
2 In this manuscript, “average” is used in lieu of “arithmetic mean”.
6
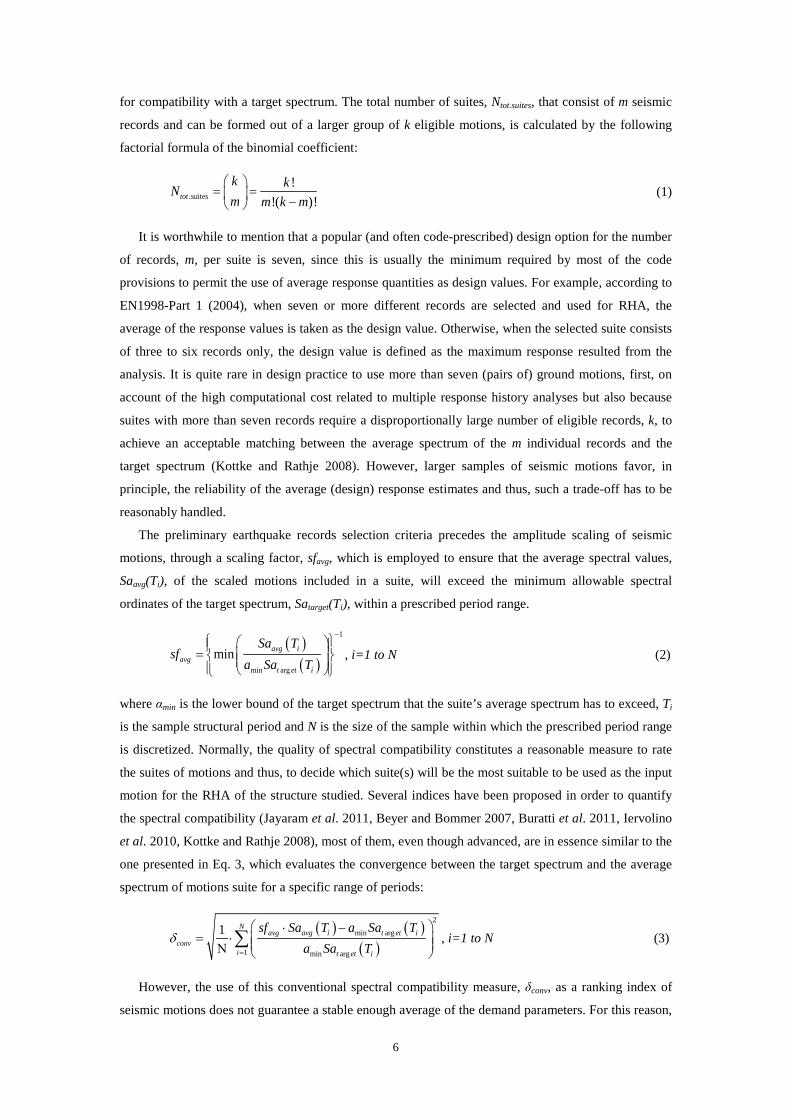
for compatibility with a target spectrum. The total number of suites, Ntot.suites, that consist of m seismic
records and can be formed out of a larger group of k eligible motions, is calculated by the following
factorial formula of the binomial coefficient:
.suites!
!( )!tot
k kNm m k m
= = − (1)
It is worthwhile to mention that a popular (and often code-prescribed) design option for the number
of records, m, per suite is seven, since this is usually the minimum required by most of the code
provisions to permit the use of average response quantities as design values. For example, according to
EN1998-Part 1 (2004), when seven or more different records are selected and used for RHA, the
average of the response values is taken as the design value. Otherwise, when the selected suite consists
of three to six records only, the design value is defined as the maximum response resulted from the
analysis. It is quite rare in design practice to use more than seven (pairs of) ground motions, first, on
account of the high computational cost related to multiple response history analyses but also because
suites with more than seven records require a disproportionally large number of eligible records, k, to
achieve an acceptable matching between the average spectrum of the m individual records and the
target spectrum (Kottke and Rathje 2008). However, larger samples of seismic motions favor, in
principle, the reliability of the average (design) response estimates and thus, such a trade-off has to be
reasonably handled.
The preliminary earthquake records selection criteria precedes the amplitude scaling of seismic
motions, through a scaling factor, sfavg, which is employed to ensure that the average spectral values,
Saavg(Ti), of the scaled motions included in a suite, will exceed the minimum allowable spectral
ordinates of the target spectrum, Satarget(Ti), within a prescribed period range.
( )( )
1
min arg
min avg iavg
t et i
Sa Tsf
a Sa T
− =
, i=1 to N (2)
where αmin is the lower bound of the target spectrum that the suite’s average spectrum has to exceed, Ti
is the sample structural period and N is the size of the sample within which the prescribed period range
is discretized. Normally, the quality of spectral compatibility constitutes a reasonable measure to rate
the suites of motions and thus, to decide which suite(s) will be the most suitable to be used as the input
motion for the RHA of the structure studied. Several indices have been proposed in order to quantify
the spectral compatibility (Jayaram et al. 2011, Beyer and Bommer 2007, Buratti et al. 2011, Iervolino
et al. 2010, Kottke and Rathje 2008), most of them, even though advanced, are in essence similar to the
one presented in Eq. 3, which evaluates the convergence between the target spectrum and the average
spectrum of motions suite for a specific range of periods:
( ) ( )( )
2
min arg
1 min arg
1 Navg avg i t et i
convi t et i
sf Sa T a Sa Ta Sa T
δ=
⋅ −= ⋅ N
∑ , i=1 to N (3)
However, the use of this conventional spectral compatibility measure, δconv, as a ranking index of
seismic motions does not guarantee a stable enough average of the demand parameters. For this reason,
7
the current study introduces a dual ranking measure for ground motion selection that leads in more
stable structural response results. This index, δspectral variability – spectral compatibility (hereafter denoted as δsv-sc)
is composed by two secondary indices that consider: (a) the intra-suite variability of motions (i.e.
variability among the spectral ordinates of a motions suite), quantified through the ranking index,
δspectral variability (hereafter denoted as δsv), and (b) the quality of the compatibility between target and
ground motions average spectrum respectively, quantified through the δspectral compatibility ranking index
(hereafter denoted as δsc). Next, the steps to calculate the dual ranking index, δsv-sc, are thoroughly
described.
Step 1 - Upper bound for the period range used for spectral matching
Most of the code-based procedures for selection and scaling of earthquake records, prescribe a
period range, within which compatibility between the target spectrum and the average spectrum of the
selected suite of motions is enforced. The upper bound of this period range is associated with the
elongation that periods experience due to the nonlinear performance induced during the earthquake
strong ground shaking. The adoption, though, of a quite large upper bound forces spectral matching in
the long period range, where it’s harder to obtain a large number eligible records but most importantly,
it is unlikely that a low-to-moderate ductility structure will ever respond. Indeed, especially in case of
EN1998-Part 1 (2004), the imposed upper bound, i.e., 2T1, (T1 being the fundamental period), is
deemed rather extensive for several structural configurations. For example, research has shown that
R/C buildings, designed to modern seismic codes, were statistically found to experience significantly
milder first-mode period lengthening, i.e., 1.2T1 up to 1.5T1, compared to the code-prescribed 2T1, even
for twice the design earthquake (Katsanos et al. 2014). Moreover, spectral matching within such an
long period range (up to 2T1) substantially increases the spectral ordinates of the selected records in
other, more critical periods of vibration (close or lower than T1), thus leading to overconservative
design (Sextos et al. 2011). The latter can be partially waived by using individual factors to scale each
of the strong motions included already into the records’ suites that would be also related to lower intra-
suite spectral variability (Kottke and Rathje 2008). However, such a scaling approach would
excessively increase the population of the possible suites affecting, at the same time, adversely the
efficiency of the entire process for selecting and scaling of strong motions unless a sophisticated,
optimization-based method is followed.
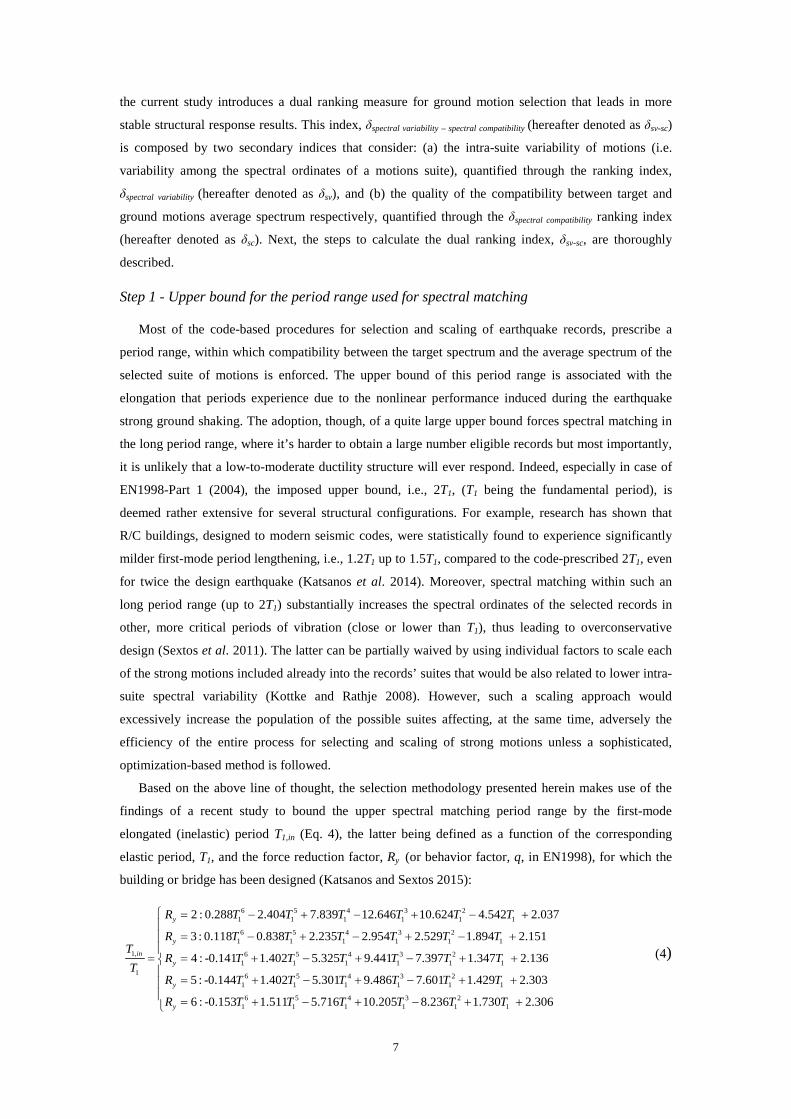
Based on the above line of thought, the selection methodology presented herein makes use of the
findings of a recent study to bound the upper spectral matching period range by the first-mode
elongated (inelastic) period T1,in (Eq. 4), the latter being defined as a function of the corresponding
elastic period, T1, and the force reduction factor, Ry (or behavior factor, q, in EN1998), for which the
building or bridge has been designed (Katsanos and Sextos 2015):
6 5 4 3 21 1 1 1 1 1
6 5 4 3 21 1 1 1 1 1
1, 6 5 4 3 21 1 1 1 1 1
1
2 : 0.288 2.404 7.839 12.646 10.624 4.542 2.037
3 : 0.118 0.838 2.235 2.954 2.529 1.894 2.151
4 : -0.141 1.402 5.325 9.441 7.397 1.347 2.136
y
y
iny
R T T T T T T
R T T T T T TT
R T T T T T TT
= − + − + − +
= − + − + − +
= = + − + − + +6 5 4 3 2
1 1 1 1 1 1
6 5 4 3 21 1 1 1 1 1
5 : -0.144 1.402 5.301 9.486 7.601 1.429 2.303
6 : -0.153 1.511 5.716 10.205 8.236 1.730 2.306y
y
R T T T T T T
R T T T T T T
= + − + − + + = + − + − + +
(4)
8
It should be noted that additional results from both experimental and numerical studies accounting
for varying structural systems made of different materials are expected to further advance the
calculation of first-mode elongated period on the basis of simplified analytical expressions.
Step 2 - Lower bound for the period range used for spectral matching
Similarly to the step described above, the lower bound for the period range of spectral matching is
also adjusted so that spectral matching is imposed to low periods only in case where the participation of
higher modes of vibration is significant for structural response. More precisely, the lower bound of
0.2T1, which is imposed by most of the current seismic codes irrespectively of the dynamic
characteristics of the structure studied, is replaced herein by the vibration period of the n-th mode
(called hereafter Tn,80), for which the cumulative modal mass participation ratios are higher than 80%
for both main horizontal directions:
,1
80%n
i xi=Γ ≥∑ (5a)
,1
80%n
i yi=Γ ≥∑ (5b)
where n
i,xi=1Γ∑ and
n
i ,yi 1Γ
=∑ are the cumulative modal mass participation ratios calculated for the first n
modes and the two main horizontal directions (i.e., x and y) of the structure studied. Based on the
definition described above, the quality of the spectral compatibility is evaluated in the (shorter) period
range T:[Tn,80,T1,in], where the structure is expected to respond during the seismic excitation,
deliberately neglecting unnecessarily low and excessively high vibration periods, which are ultimately
irrelevant to the structure. It is notable that the redefined period range, T:[Tn,80,T1,in] (resulting from
Steps 1-2), is employed for suites of motions that have been already identified to comply with the basis
of spectral matching requirements related either to a code or a user-defined framework respectively. In
other words, the existing code provisions for earthquake records selection and scaling are by no means
violated. What is affected is the relative ranking of the (otherwise code-compliant) suites of motions.
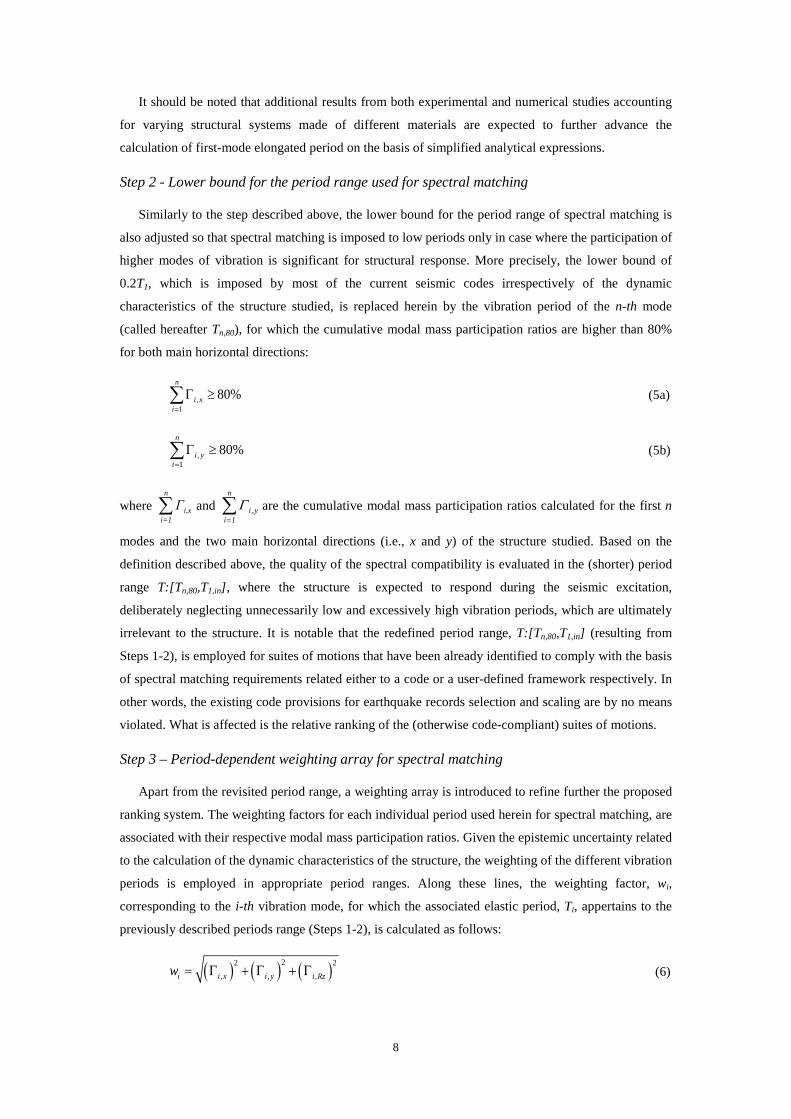
Step 3 – Period-dependent weighting array for spectral matching
Apart from the revisited period range, a weighting array is introduced to refine further the proposed
ranking system. The weighting factors for each individual period used herein for spectral matching, are
associated with their respective modal mass participation ratios. Given the epistemic uncertainty related
to the calculation of the dynamic characteristics of the structure, the weighting of the different vibration
periods is employed in appropriate period ranges. Along these lines, the weighting factor, wi,
corresponding to the i-th vibration mode, for which the associated elastic period, Ti, appertains to the
previously described periods range (Steps 1-2), is calculated as follows:
( ) ( ) ( )22 2, , ,i i x i y i Rzw = Γ + Γ + Γ (6)
9
where Γi is the i-th mode mass participation ratio corresponding to the translational degrees of freedom
along the main horizontal directions of the structure (i.e., ux and uy related to the horizontal x-x and y-y
directions) and the rotational degree of freedom around the vertical direction of the structure (RZ
around the z-z direction) respectively. As a result, the proposed rating system for the motions suites
promotes ground motions, for which the quality of spectral matching is higher within period ranges that
are most likely to be important for the overall seismic response of the structure.
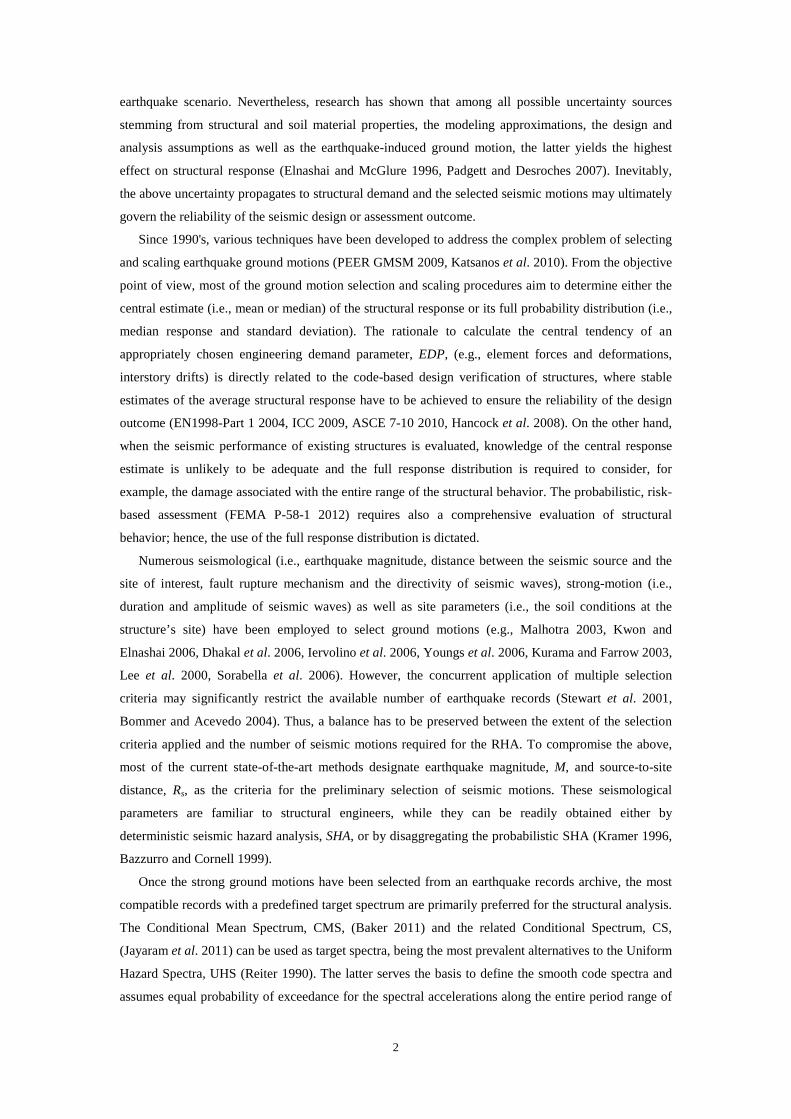
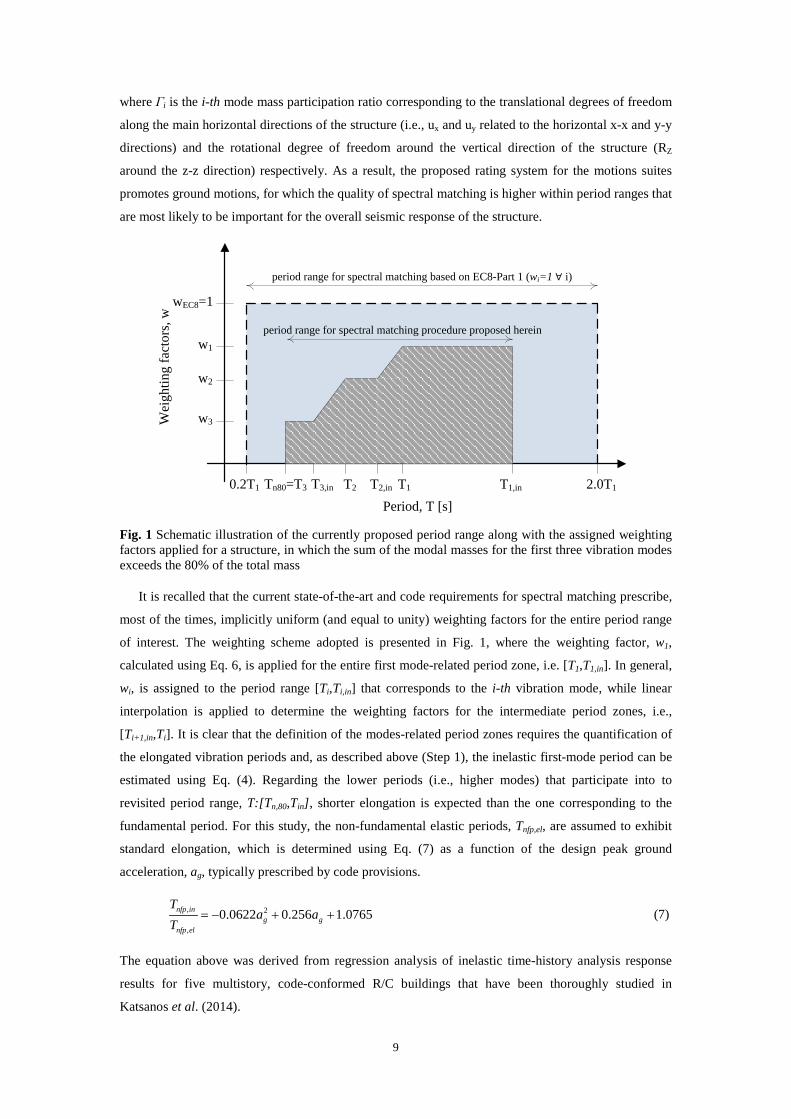
0.2T1 T1 2.0T1
w3
w2
w1
wEC8=1
Period, T [s]T1,inT2,inT2T3,in
period range for spectral matching based on EC8-Part 1 (wi=1 ∀ i)
period range for spectral matching procedure proposed herein
Wei
ghtin
g fa
ctor
s, w
Tn80=T3
Fig. 1 Schematic illustration of the currently proposed period range along with the assigned weighting factors applied for a structure, in which the sum of the modal masses for the first three vibration modes exceeds the 80% of the total mass
It is recalled that the current state-of-the-art and code requirements for spectral matching prescribe,
most of the times, implicitly uniform (and equal to unity) weighting factors for the entire period range
of interest. The weighting scheme adopted is presented in Fig. 1, where the weighting factor, w1,
calculated using Eq. 6, is applied for the entire first mode-related period zone, i.e. [T1,T1,in]. In general,
wi, is assigned to the period range [Ti,Ti,in] that corresponds to the i-th vibration mode, while linear
interpolation is applied to determine the weighting factors for the intermediate period zones, i.e.,
[Ti+1,in,Ti]. It is clear that the definition of the modes-related period zones requires the quantification of
the elongated vibration periods and, as described above (Step 1), the inelastic first-mode period can be
estimated using Eq. (4). Regarding the lower periods (i.e., higher modes) that participate into to
revisited period range, T:[Tn,80,Tin], shorter elongation is expected than the one corresponding to the
fundamental period. For this study, the non-fundamental elastic periods, Tnfp,el, are assumed to exhibit
standard elongation, which is determined using Eq. (7) as a function of the design peak ground
acceleration, ag, typically prescribed by code provisions.
, 2
,
0.0622 0.256 1.0765nfp ing g
nfp el
Ta a
T= − + + (7)
The equation above was derived from regression analysis of inelastic time-history analysis response
results for five multistory, code-conformed R/C buildings that have been thoroughly studied in
Katsanos et al. (2014).
10
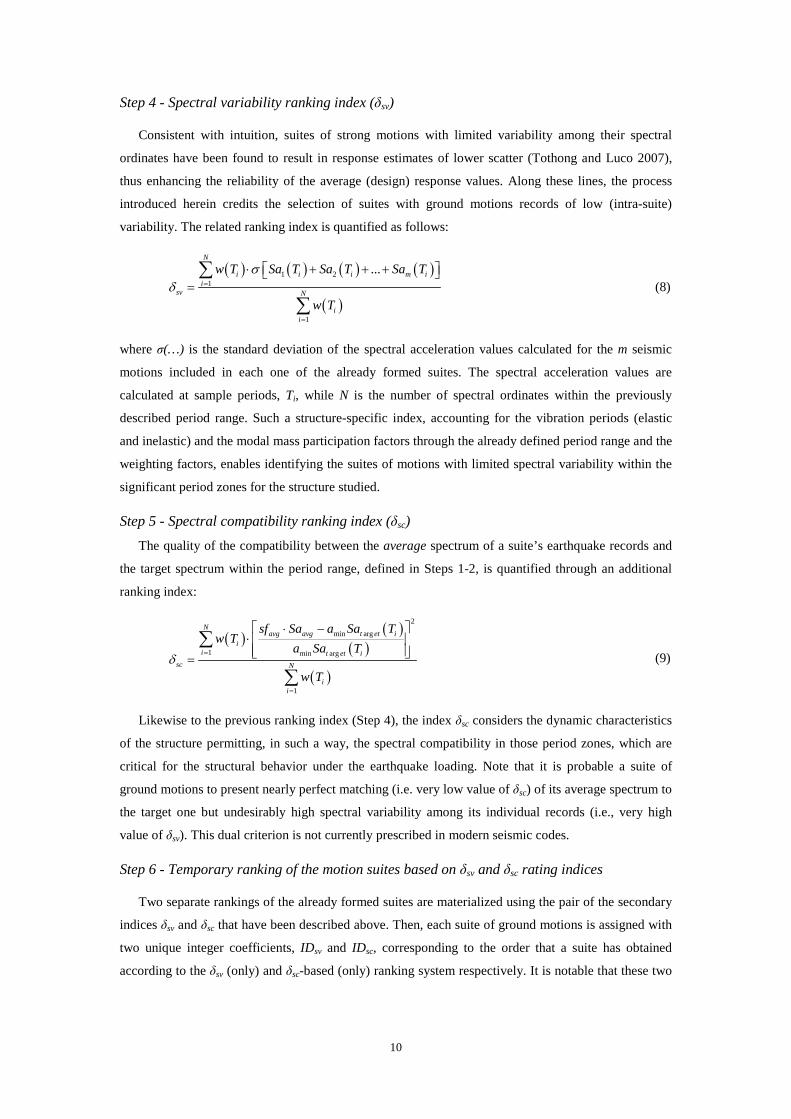
Step 4 - Spectral variability ranking index (δsv)
Consistent with intuition, suites of strong motions with limited variability among their spectral
ordinates have been found to result in response estimates of lower scatter (Tothong and Luco 2007),
thus enhancing the reliability of the average (design) response values. Along these lines, the process
introduced herein credits the selection of suites with ground motions records of low (intra-suite)
variability. The related ranking index is quantified as follows:
( ) ( ) ( ) ( )
( )
1 21
1
...N
i i i m ii
sv N
ii
w T Sa T Sa T Sa T
w T
sδ =
=
⋅ + + + =∑
∑ (8)
where σ(…) is the standard deviation of the spectral acceleration values calculated for the m seismic
motions included in each one of the already formed suites. The spectral acceleration values are
calculated at sample periods, Ti, while N is the number of spectral ordinates within the previously
described period range. Such a structure-specific index, accounting for the vibration periods (elastic
and inelastic) and the modal mass participation factors through the already defined period range and the
weighting factors, enables identifying the suites of motions with limited spectral variability within the
significant period zones for the structure studied.
Step 5 - Spectral compatibility ranking index (δsc) The quality of the compatibility between the average spectrum of a suite’s earthquake records and
the target spectrum within the period range, defined in Steps 1-2, is quantified through an additional
ranking index:
( ) ( )( )
( )
2
min arg
1 min arg
1
Navg avg t et i
ii t et i
sc N
ii
sf Sa a Sa Tw T
a Sa T
w Tδ
=
=
⋅ −⋅ =
∑
∑ (9)
Likewise to the previous ranking index (Step 4), the index δsc considers the dynamic characteristics
of the structure permitting, in such a way, the spectral compatibility in those period zones, which are
critical for the structural behavior under the earthquake loading. Note that it is probable a suite of
ground motions to present nearly perfect matching (i.e. very low value of δsc) of its average spectrum to
the target one but undesirably high spectral variability among its individual records (i.e., very high
value of δsv). This dual criterion is not currently prescribed in modern seismic codes.
Step 6 - Temporary ranking of the motion suites based on δsv and δsc rating indices
Two separate rankings of the already formed suites are materialized using the pair of the secondary
indices δsv and δsc that have been described above. Then, each suite of ground motions is assigned with
two unique integer coefficients, IDsv and IDsc, corresponding to the order that a suite has obtained
according to the δsv (only) and δsc-based (only) ranking system respectively. It is notable that these two
11
different ranking approaches are temporary and utilized only for the final ranking of the proposed
decision support process.
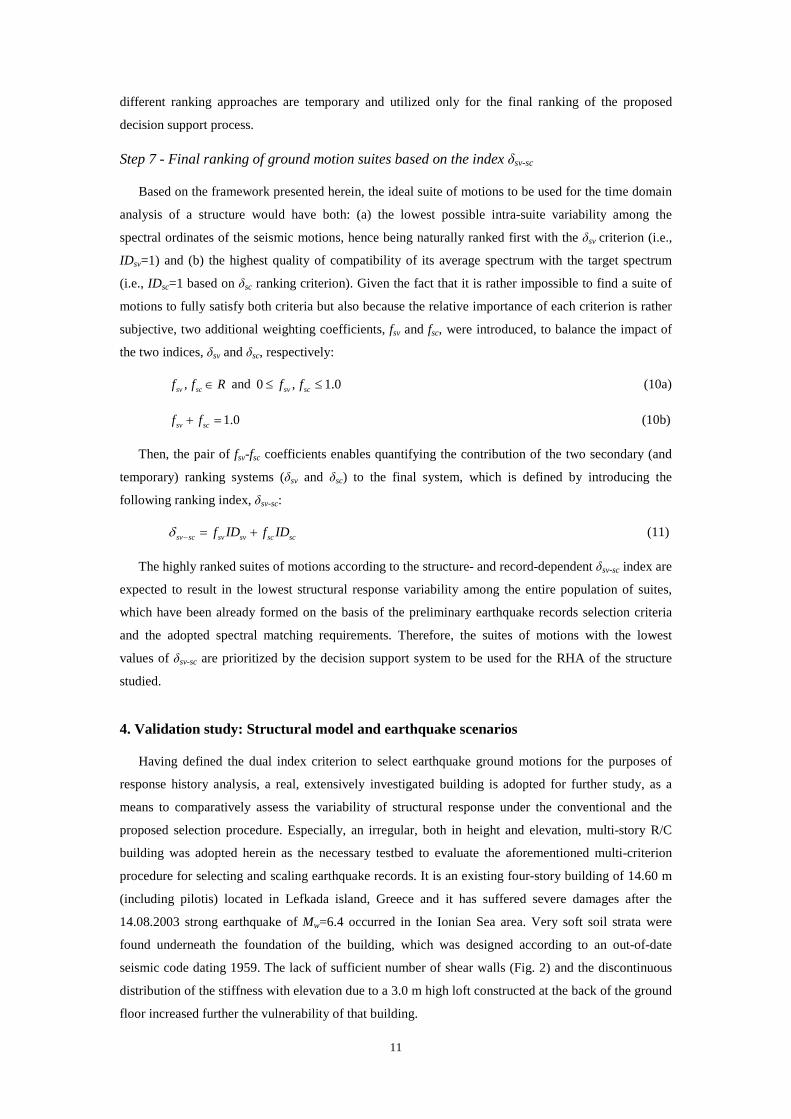
Step 7 - Final ranking of ground motion suites based on the index δsv-sc
Based on the framework presented herein, the ideal suite of motions to be used for the time domain
analysis of a structure would have both: (a) the lowest possible intra-suite variability among the
spectral ordinates of the seismic motions, hence being naturally ranked first with the δsv criterion (i.e.,
IDsv=1) and (b) the highest quality of compatibility of its average spectrum with the target spectrum
(i.e., IDsc=1 based on δsc ranking criterion). Given the fact that it is rather impossible to find a suite of
motions to fully satisfy both criteria but also because the relative importance of each criterion is rather
subjective, two additional weighting coefficients, fsv and fsc, were introduced, to balance the impact of
the two indices, δsv and δsc, respectively:
,sv scf f R∈ and 0 , 1.0sv scf f≤ ≤ (10a)
1.0sv scf f+ = (10b)
Then, the pair of fsv-fsc coefficients enables quantifying the contribution of the two secondary (and
temporary) ranking systems (δsv and δsc) to the final system, which is defined by introducing the
following ranking index, δsv-sc:
sv sc sv sv sc scf ID f IDδ − = + (11)
The highly ranked suites of motions according to the structure- and record-dependent δsv-sc index are
expected to result in the lowest structural response variability among the entire population of suites,
which have been already formed on the basis of the preliminary earthquake records selection criteria
and the adopted spectral matching requirements. Therefore, the suites of motions with the lowest
values of δsv-sc are prioritized by the decision support system to be used for the RHA of the structure
studied.
4. Validation study: Structural model and earthquake scenarios
Having defined the dual index criterion to select earthquake ground motions for the purposes of
response history analysis, a real, extensively investigated building is adopted for further study, as a
means to comparatively assess the variability of structural response under the conventional and the
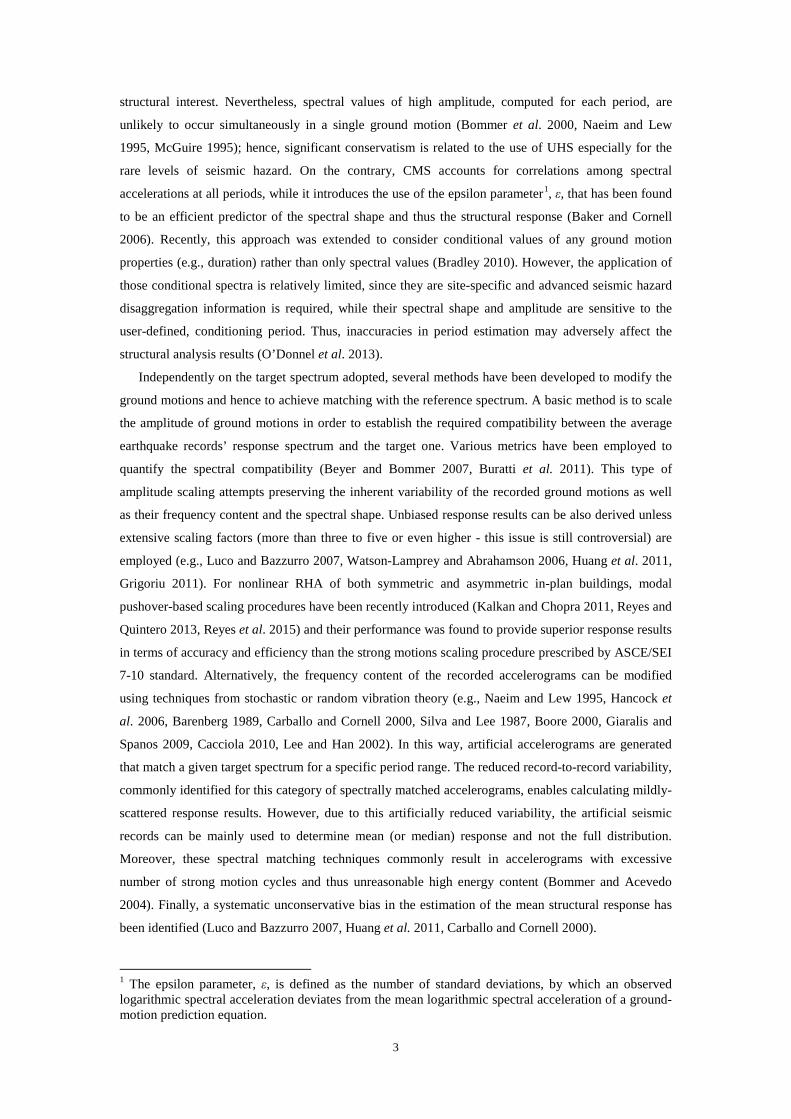
proposed selection procedure. Especially, an irregular, both in height and elevation, multi-story R/C
building was adopted herein as the necessary testbed to evaluate the aforementioned multi-criterion
procedure for selecting and scaling earthquake records. It is an existing four-story building of 14.60 m
(including pilotis) located in Lefkada island, Greece and it has suffered severe damages after the
14.08.2003 strong earthquake of Mw=6.4 occurred in the Ionian Sea area. Very soft soil strata were
found underneath the foundation of the building, which was designed according to an out-of-date
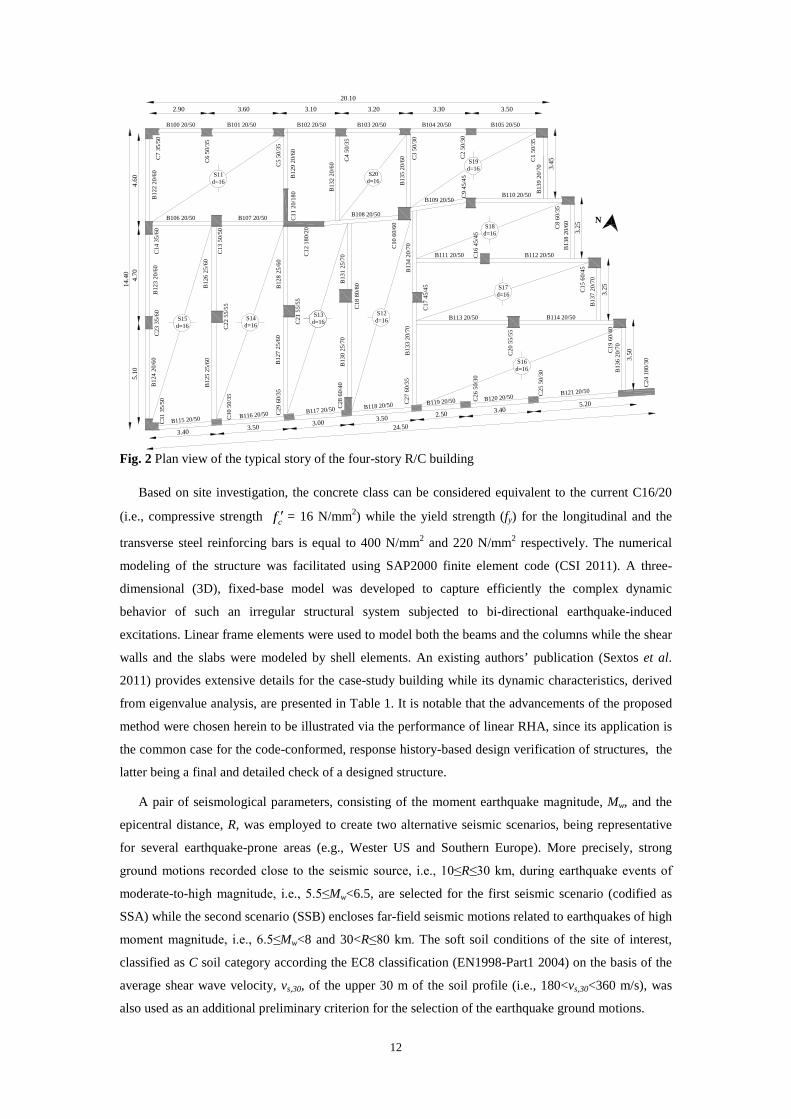
seismic code dating 1959. The lack of sufficient number of shear walls (Fig. 2) and the discontinuous
distribution of the stiffness with elevation due to a 3.0 m high loft constructed at the back of the ground
floor increased further the vulnerability of that building.
12
B12
4 20
/60
B12
5 25
/60
B12
6 2 5
/60
B12
7 25
/60
B12
8 25
/60
B13
0 25
/70
B13
1 25
/70
B13
2 20
/60
B12
9 20
/60
B100 20/50
C15
60/
45
C16
45/
45
C20
55/
55
C8
60/3
5
C9
45/4
5
C17
45/
45
C24
180
/30
C26
50/
30
C27
60/
35
C10
60/
60
C1
50/3
5
C4
50/3
5
C12
180
/20
C11
20/
180
C28
60/
40
C31
35/
50
C22
55/
55
C21
55/
55
C18
80/
80
C23
35/
60C
14 3
5/60
C13
50/
50
C29
60/
35
C30
50/
35
C2
50/3
0
C3
50/3
0
C5
50/3
5
C6
50/3
5
C7
35/5
0B
123
20/6
0B
122
20/6
0
S12d=16
S13d=16 S14
d=16 S15d=16
S11d=16
S16d=16
S17d=16
S18d=16
S19d=16
S20d=16 B
135
20/6
0B
133
20/7
0B
134
20/7
0 B13
8 20
/60
B13
9 20
/70
C19
60/
40
B13
7 20
/70
B13
6 20
/70
C25
50/
30
N
B101 20/50 B102 20/50 B103 20/50 B104 20/50 B105 20/50
B106 20/50 B107 20/50 B108 20/50
B109 20/50B110 20/50
B111 20/50 B112 20/50
B113 20/50 B114 20/50
B115 20/50 B116 20/50 B117 20/50 B118 20/50 B119 20/50 B120 20/50 B121 20/50
3.30 3.5020.10
3.40 3.50 3.00 3.50 2.50 3.405.20
24.50
5.10
4.70
4.60
14.4
0
3.50
3.25
3.25
3.45
2.90 3.60 3.10 3.20
Fig. 2 Plan view of the typical story of the four-story R/C building
Based on site investigation, the concrete class can be considered equivalent to the current C16/20
(i.e., compressive strength cf ′ = 16 N/mm2) while the yield strength (fy) for the longitudinal and the
transverse steel reinforcing bars is equal to 400 N/mm2 and 220 N/mm2 respectively. The numerical
modeling of the structure was facilitated using SAP2000 finite element code (CSI 2011). A three-
dimensional (3D), fixed-base model was developed to capture efficiently the complex dynamic
behavior of such an irregular structural system subjected to bi-directional earthquake-induced
excitations. Linear frame elements were used to model both the beams and the columns while the shear
walls and the slabs were modeled by shell elements. An existing authors’ publication (Sextos et al.
2011) provides extensive details for the case-study building while its dynamic characteristics, derived
from eigenvalue analysis, are presented in Table 1. It is notable that the advancements of the proposed
method were chosen herein to be illustrated via the performance of linear RHA, since its application is
the common case for the code-conformed, response history-based design verification of structures, the
latter being a final and detailed check of a designed structure.
A pair of seismological parameters, consisting of the moment earthquake magnitude, Mw, and the
epicentral distance, R, was employed to create two alternative seismic scenarios, being representative
for several earthquake-prone areas (e.g., Wester US and Southern Europe). More precisely, strong
ground motions recorded close to the seismic source, i.e., 10≤R≤30 km, during earthquake events of
moderate-to-high magnitude, i.e., 5.5≤Mw<6.5, are selected for the first seismic scenario (codified as
SSA) while the second scenario (SSB) encloses far-field seismic motions related to earthquakes of high
moment magnitude, i.e., 6.5≤Mw<8 and 30<R≤80 km. The soft soil conditions of the site of interest,
classified as C soil category according the EC8 classification (EN1998-Part1 2004) on the basis of the
average shear wave velocity, vs,30, of the upper 30 m of the soil profile (i.e., 180<vs,30<360 m/s), was
also used as an additional preliminary criterion for the selection of the earthquake ground motions.
13
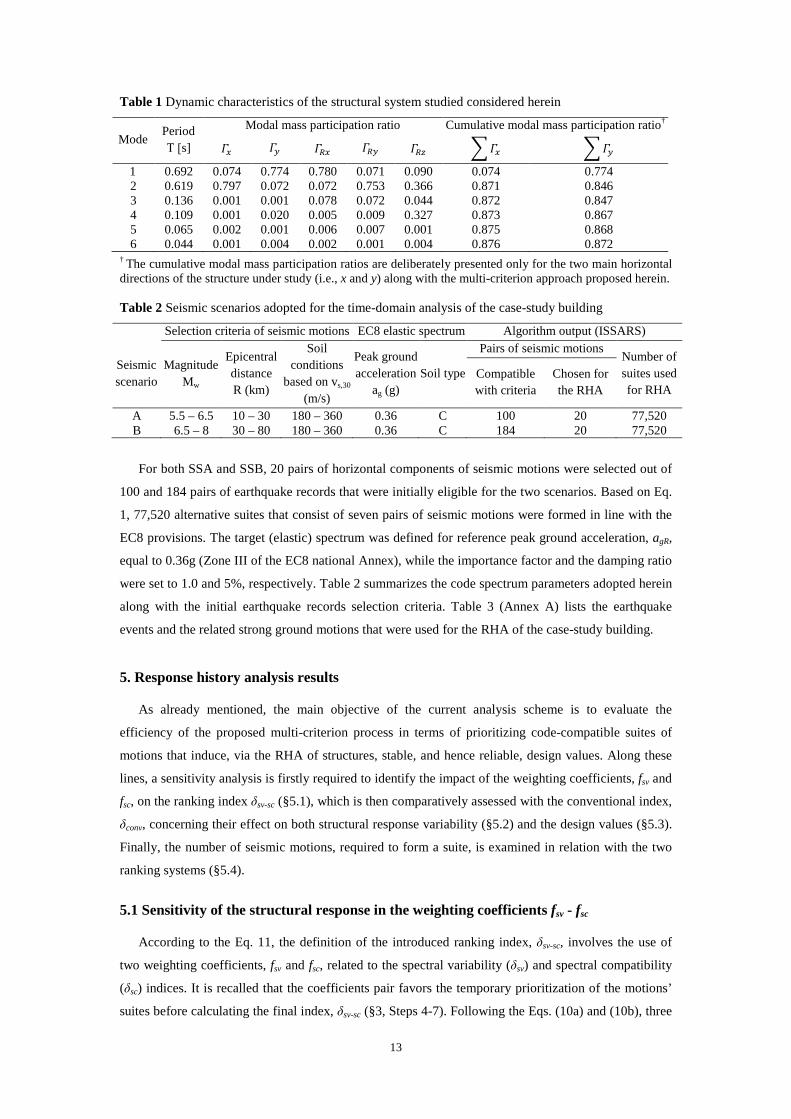
Table 1 Dynamic characteristics of the structural system studied considered herein
Mode Period Τ [s]
Modal mass participation ratio Cumulative modal mass participation ratio†
𝛤𝛤𝑥𝑥 𝛤𝛤𝑦𝑦 𝛤𝛤𝑅𝑅𝑥𝑥 𝛤𝛤𝑅𝑅𝑦𝑦 𝛤𝛤𝑅𝑅𝑅𝑅 �𝛤𝛤𝑥𝑥 �𝛤𝛤𝑦𝑦
1 0.692 0.074 0.774 0.780 0.071 0.090 0.074 0.774 2 0.619 0.797 0.072 0.072 0.753 0.366 0.871 0.846 3 0.136 0.001 0.001 0.078 0.072 0.044 0.872 0.847 4 0.109 0.001 0.020 0.005 0.009 0.327 0.873 0.867 5 0.065 0.002 0.001 0.006 0.007 0.001 0.875 0.868 6 0.044 0.001 0.004 0.002 0.001 0.004 0.876 0.872
† The cumulative modal mass participation ratios are deliberately presented only for the two main horizontal
directions of the structure under study (i.e., x and y) along with the multi-criterion approach proposed herein. Table 2 Seismic scenarios adopted for the time-domain analysis of the case-study building
Selection criteria of seismic motions EC8 elastic spectrum Algorithm output (ISSARS)
Seismic scenario
Magnitude Mw
Epicentral distance R (km)
Soil conditions
based on vs,30 (m/s)
Peak ground acceleration
ag (g) Soil type
Pairs of seismic motions Number of suites used for RHA
Compatible with criteria
Chosen for the RHA
A 5.5 – 6.5 10 – 30 180 – 360 0.36 C 100 20 77,520 B 6.5 – 8 30 – 80 180 – 360 0.36 C 184 20 77,520
For both SSA and SSB, 20 pairs of horizontal components of seismic motions were selected out of
100 and 184 pairs of earthquake records that were initially eligible for the two scenarios. Based on Eq.
1, 77,520 alternative suites that consist of seven pairs of seismic motions were formed in line with the
EC8 provisions. The target (elastic) spectrum was defined for reference peak ground acceleration, agR,
equal to 0.36g (Zone III of the EC8 national Annex), while the importance factor and the damping ratio
were set to 1.0 and 5%, respectively. Table 2 summarizes the code spectrum parameters adopted herein
along with the initial earthquake records selection criteria. Table 3 (Annex A) lists the earthquake
events and the related strong ground motions that were used for the RHA of the case-study building.
5. Response history analysis results
As already mentioned, the main objective of the current analysis scheme is to evaluate the
efficiency of the proposed multi-criterion process in terms of prioritizing code-compatible suites of
motions that induce, via the RHA of structures, stable, and hence reliable, design values. Along these
lines, a sensitivity analysis is firstly required to identify the impact of the weighting coefficients, fsv and
fsc, on the ranking index δsv-sc (§5.1), which is then comparatively assessed with the conventional index,
δconv, concerning their effect on both structural response variability (§5.2) and the design values (§5.3).
Finally, the number of seismic motions, required to form a suite, is examined in relation with the two
ranking systems (§5.4).
5.1 Sensitivity of the structural response in the weighting coefficients fsv - fsc
According to the Eq. 11, the definition of the introduced ranking index, δsv-sc, involves the use of
two weighting coefficients, fsv and fsc, related to the spectral variability (δsv) and spectral compatibility
(δsc) indices. It is recalled that the coefficients pair favors the temporary prioritization of the motions’
suites before calculating the final index, δsv-sc (§3, Steps 4-7). Following the Eqs. (10a) and (10b), three
14
main cases are detected regarding the values that can be assigned to the fsv-fsc coefficients: (a) fsv<fsc :
suites of high quality in terms of the compatibility with the target spectrum are prioritized by the final
ranking system, (b) fsv>fsc : the dominant criterion for ranking suites is the low intra-suite variability
among the spectral acceleration values, and (c) fsv=fsc : both the secondary ranking criteria (i.e. δsv and
δsc temporary indices) are evenly contributing to the final δsv-sc index. To visualize the impact of the fsv-
fsc coefficients on the final ranking system and the prioritized suites of motions, two characteristic cases
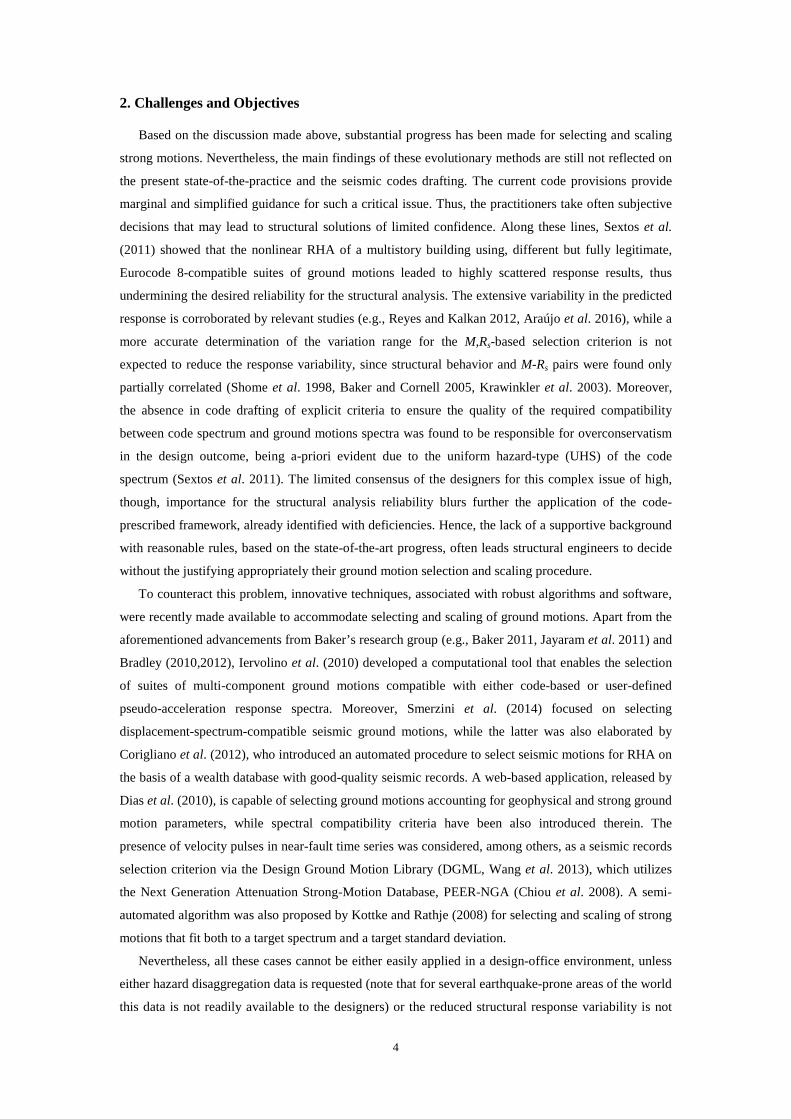
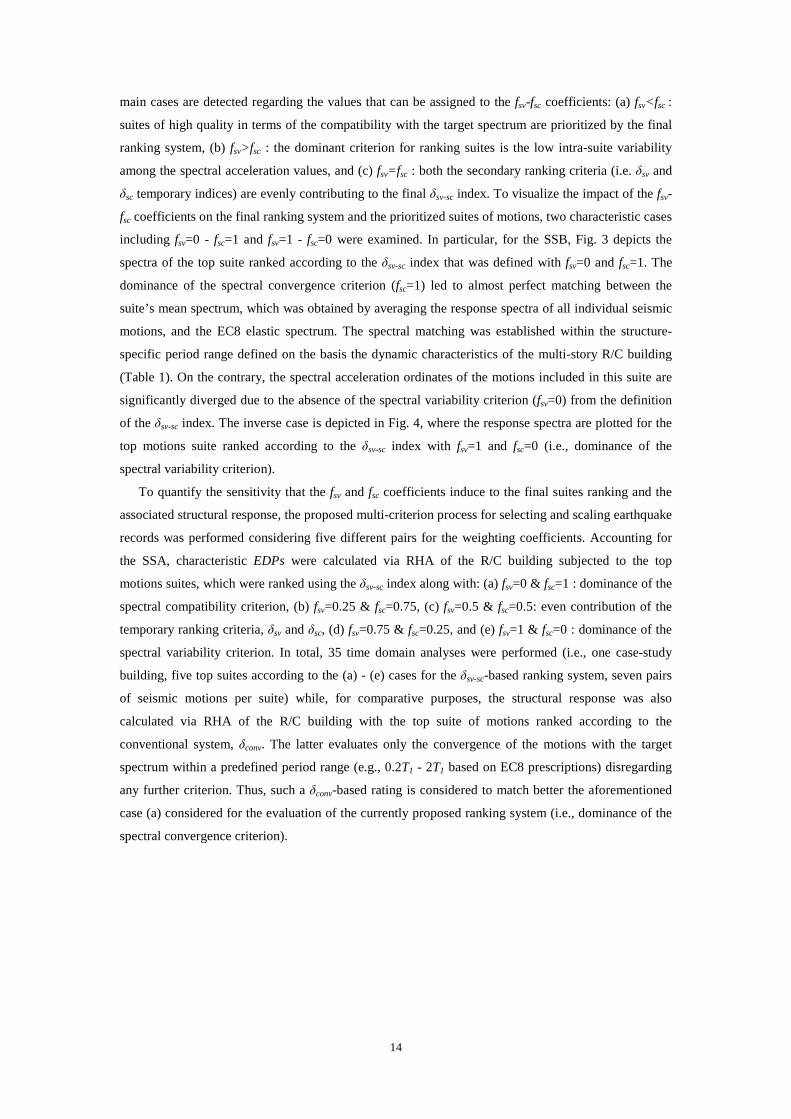
including fsv=0 - fsc=1 and fsv=1 - fsc=0 were examined. In particular, for the SSB, Fig. 3 depicts the
spectra of the top suite ranked according to the δsv-sc index that was defined with fsv=0 and fsc=1. The
dominance of the spectral convergence criterion (fsc=1) led to almost perfect matching between the
suite’s mean spectrum, which was obtained by averaging the response spectra of all individual seismic
motions, and the EC8 elastic spectrum. The spectral matching was established within the structure-
specific period range defined on the basis the dynamic characteristics of the multi-story R/C building
(Table 1). On the contrary, the spectral acceleration ordinates of the motions included in this suite are
significantly diverged due to the absence of the spectral variability criterion (fsv=0) from the definition
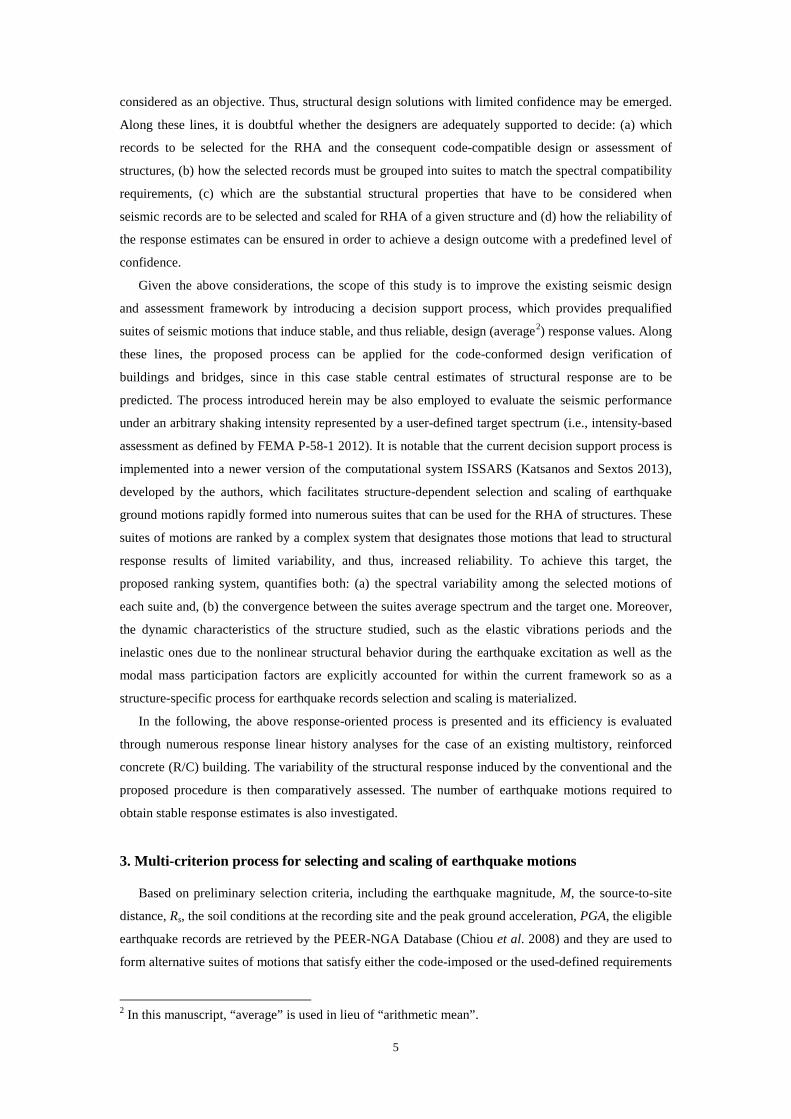
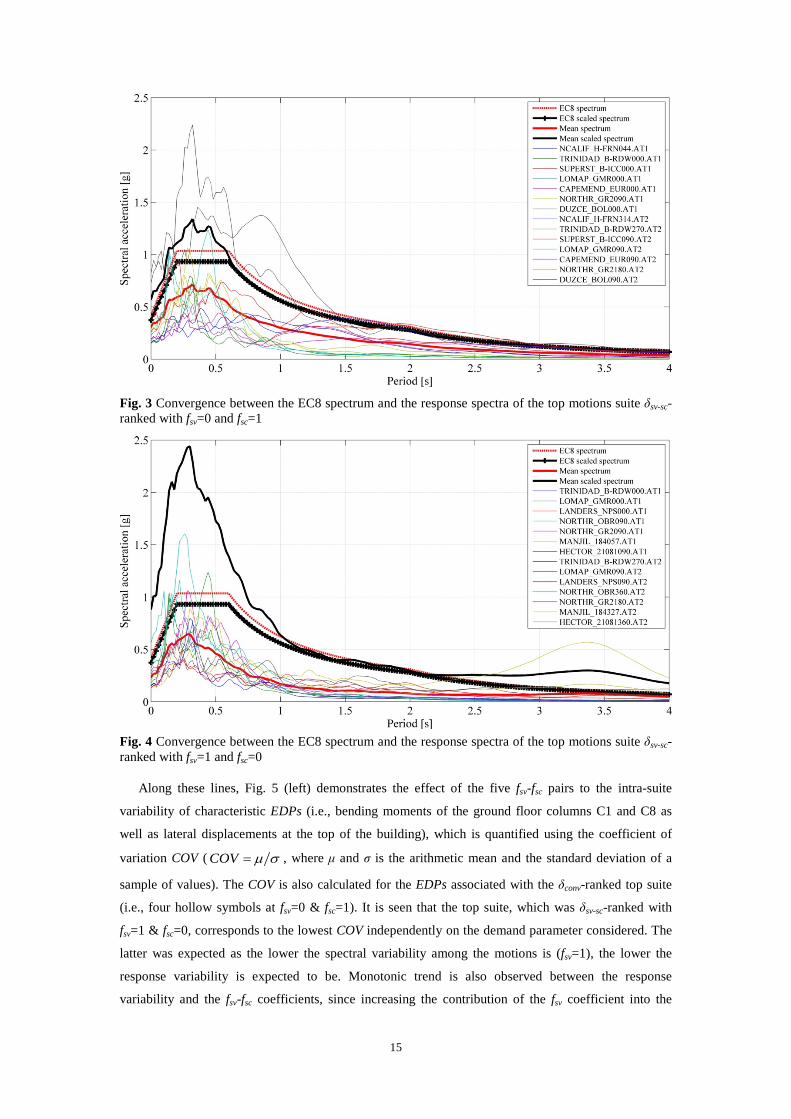
of the δsv-sc index. The inverse case is depicted in Fig. 4, where the response spectra are plotted for the
top motions suite ranked according to the δsv-sc index with fsv=1 and fsc=0 (i.e., dominance of the
spectral variability criterion).
To quantify the sensitivity that the fsv and fsc coefficients induce to the final suites ranking and the
associated structural response, the proposed multi-criterion process for selecting and scaling earthquake
records was performed considering five different pairs for the weighting coefficients. Accounting for
the SSA, characteristic EDPs were calculated via RHA of the R/C building subjected to the top
motions suites, which were ranked using the δsv-sc index along with: (a) fsv=0 & fsc=1 : dominance of the
spectral compatibility criterion, (b) fsv=0.25 & fsc=0.75, (c) fsv=0.5 & fsc=0.5: even contribution of the
temporary ranking criteria, δsv and δsc, (d) fsv=0.75 & fsc=0.25, and (e) fsv=1 & fsc=0 : dominance of the
spectral variability criterion. In total, 35 time domain analyses were performed (i.e., one case-study
building, five top suites according to the (a) - (e) cases for the δsv-sc-based ranking system, seven pairs
of seismic motions per suite) while, for comparative purposes, the structural response was also
calculated via RHA of the R/C building with the top suite of motions ranked according to the
conventional system, δconv. The latter evaluates only the convergence of the motions with the target
spectrum within a predefined period range (e.g., 0.2T1 - 2T1 based on EC8 prescriptions) disregarding
any further criterion. Thus, such a δconv-based rating is considered to match better the aforementioned
case (a) considered for the evaluation of the currently proposed ranking system (i.e., dominance of the
spectral convergence criterion).
15
Fig. 3 Convergence between the EC8 spectrum and the response spectra of the top motions suite δsv-sc-ranked with fsv=0 and fsc=1
Fig. 4 Convergence between the EC8 spectrum and the response spectra of the top motions suite δsv-sc-ranked with fsv=1 and fsc=0
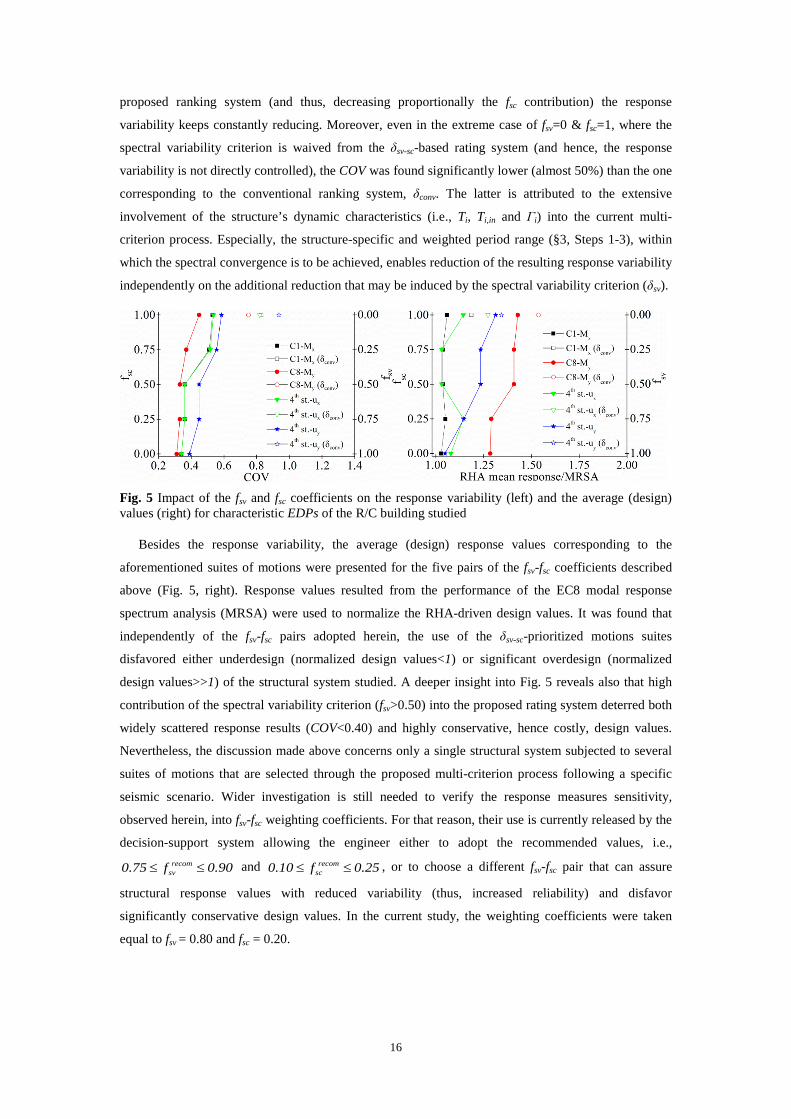
Along these lines, Fig. 5 (left) demonstrates the effect of the five fsv-fsc pairs to the intra-suite
variability of characteristic EDPs (i.e., bending moments of the ground floor columns C1 and C8 as
well as lateral displacements at the top of the building), which is quantified using the coefficient of
variation COV ( COV µ s= , where μ and σ is the arithmetic mean and the standard deviation of a
sample of values). The COV is also calculated for the EDPs associated with the δconv-ranked top suite
(i.e., four hollow symbols at fsv=0 & fsc=1). It is seen that the top suite, which was δsv-sc-ranked with
fsv=1 & fsc=0, corresponds to the lowest COV independently on the demand parameter considered. The
latter was expected as the lower the spectral variability among the motions is (fsv=1), the lower the
response variability is expected to be. Monotonic trend is also observed between the response
variability and the fsv-fsc coefficients, since increasing the contribution of the fsv coefficient into the
16
proposed ranking system (and thus, decreasing proportionally the fsc contribution) the response
variability keeps constantly reducing. Moreover, even in the extreme case of fsv=0 & fsc=1, where the
spectral variability criterion is waived from the δsv-sc-based rating system (and hence, the response
variability is not directly controlled), the COV was found significantly lower (almost 50%) than the one
corresponding to the conventional ranking system, δconv. The latter is attributed to the extensive
involvement of the structure’s dynamic characteristics (i.e., Ti, Ti,in and Γi) into the current multi-
criterion process. Especially, the structure-specific and weighted period range (§3, Steps 1-3), within
which the spectral convergence is to be achieved, enables reduction of the resulting response variability
independently on the additional reduction that may be induced by the spectral variability criterion (δsv).
Fig. 5 Impact of the fsv and fsc coefficients on the response variability (left) and the average (design) values (right) for characteristic EDPs of the R/C building studied
Besides the response variability, the average (design) response values corresponding to the
aforementioned suites of motions were presented for the five pairs of the fsv-fsc coefficients described
above (Fig. 5, right). Response values resulted from the performance of the EC8 modal response
spectrum analysis (MRSA) were used to normalize the RHA-driven design values. It was found that
independently of the fsv-fsc pairs adopted herein, the use of the δsv-sc-prioritized motions suites
disfavored either underdesign (normalized design values<1) or significant overdesign (normalized
design values>>1) of the structural system studied. A deeper insight into Fig. 5 reveals also that high
contribution of the spectral variability criterion (fsv>0.50) into the proposed rating system deterred both
widely scattered response results (COV<0.40) and highly conservative, hence costly, design values.
Nevertheless, the discussion made above concerns only a single structural system subjected to several
suites of motions that are selected through the proposed multi-criterion process following a specific
seismic scenario. Wider investigation is still needed to verify the response measures sensitivity,
observed herein, into fsv-fsc weighting coefficients. For that reason, their use is currently released by the
decision-support system allowing the engineer either to adopt the recommended values, i.e., recom
sv0.75 f 0.90≤ ≤ and recomsc0.10 f 0.25≤ ≤ , or to choose a different fsv-fsc pair that can assure
structural response values with reduced variability (thus, increased reliability) and disfavor
significantly conservative design values. In the current study, the weighting coefficients were taken
equal to fsv = 0.80 and fsc = 0.20.
17
5.2 Effect of the ranking systems (δsv-sc and δconv) on the response variability
As described above (§ 4), two seismic scenarios, SSA and SSB, were considered and 77,520 EC8-
compatible suites of motions were formed for each scenario via the use of the ISSARS algorithm
(Katsanos and Sextos 2013). Both the conventional rating index (δconv) and the one proposed herein (δsv-
sc) were employed to rank these motions suites. The top 20 suites were used for the linear RHA of the
multi-story building and the intra-suite variability for an extensive set of EDPs (i.e., bending moments
of several ground floor columns and lateral displacements at each story level) was quantified via the
COV. To summarize, 560 bi-directional linear time domain analyses were performed (i.e., one case-
study building, two seismic scenarios, two rating indices, 20 suites of motions per rating system, seven
pairs of seismic motions per suite) and appropriate functions of the SAP200 Application Programming
Interface (API) (CSI 2011) were utilized to hasten the calculation of the demand parameters and their
intra-suite variability. It should be also noted that the relevance of varying strong motions rotation
angle for the RHA results, already highlighted elsewhere both for symmetric and asymmetric structures
(Reyes and Kalkan 2015, Kalkan and Reyes 2015, Athanatopoulou 2005), was not considered herein.
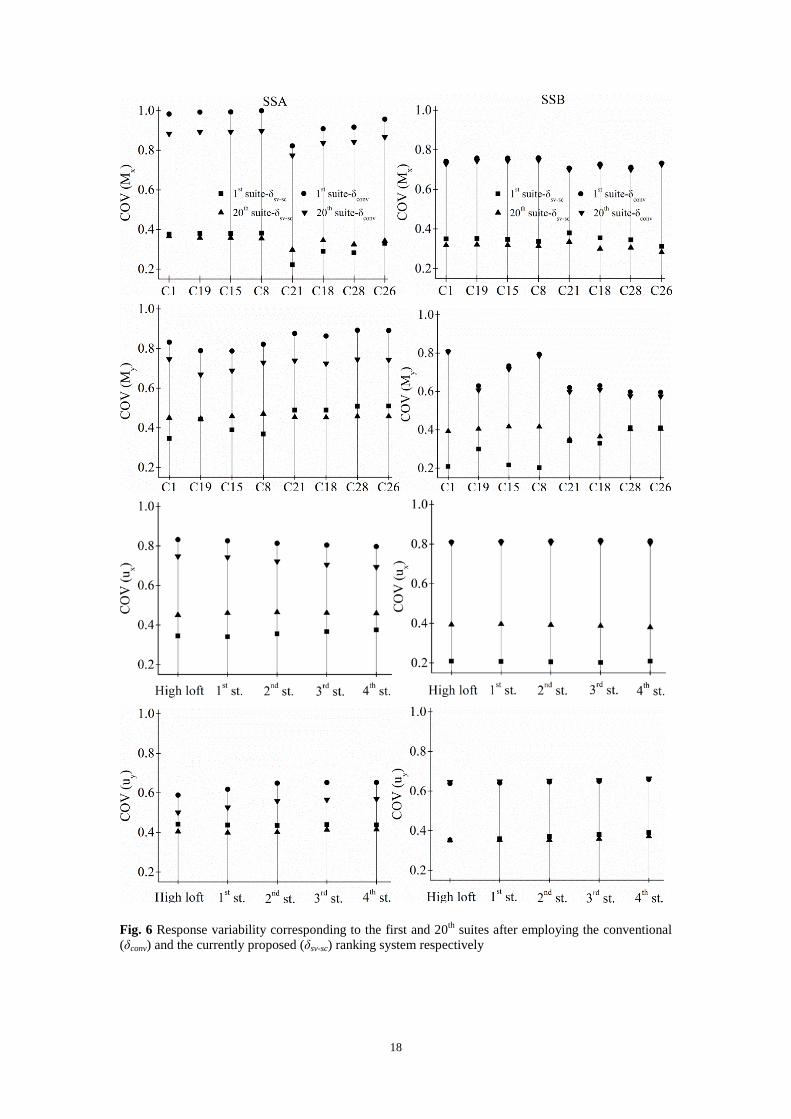
Figure 6 plots the variability (COV values) for the chosen EDPs that were calculated via the RHA
of the case-study building when subjected to the first and the 20th suites according to both the δconv and
δsv-sc ranking indices. Irrespectively of the seismic scenario and the EDP considered, a consistent trend
was revealed regarding the substantially lower variability induced by the two δsv-sc-ranked suites than
the corresponding δconv-ranked suites. Accounting for the entire set of the EDPs considered herein and
the pair of seismic scenarios, the first and 20th δsv-sc-ranked suites led, on average, to COV of 0.35 and
0.38 respectively, being almost the half of the average COV values that correspond to the first and 20th
δconv-ranked suites (0.76 and 0.72). It is also highlighted the excessive response intra-suite variability,
i.e., the COV is close to unity for some response parameters, driven by the conventional rating system.
The latter is corroborated elsewhere (Sextos et al. 2011). Moreover, the lowest COV is associated, most
of the times, with the top δsv-sc-ranked suite, while there are few cases that both the first and the 20th δsv-
sc-ranked suites led to quite similar intra-suite variability. Hence, the proposed multi-criterion process
may efficiently prioritize the motions suites that induce response results with minimum variability.
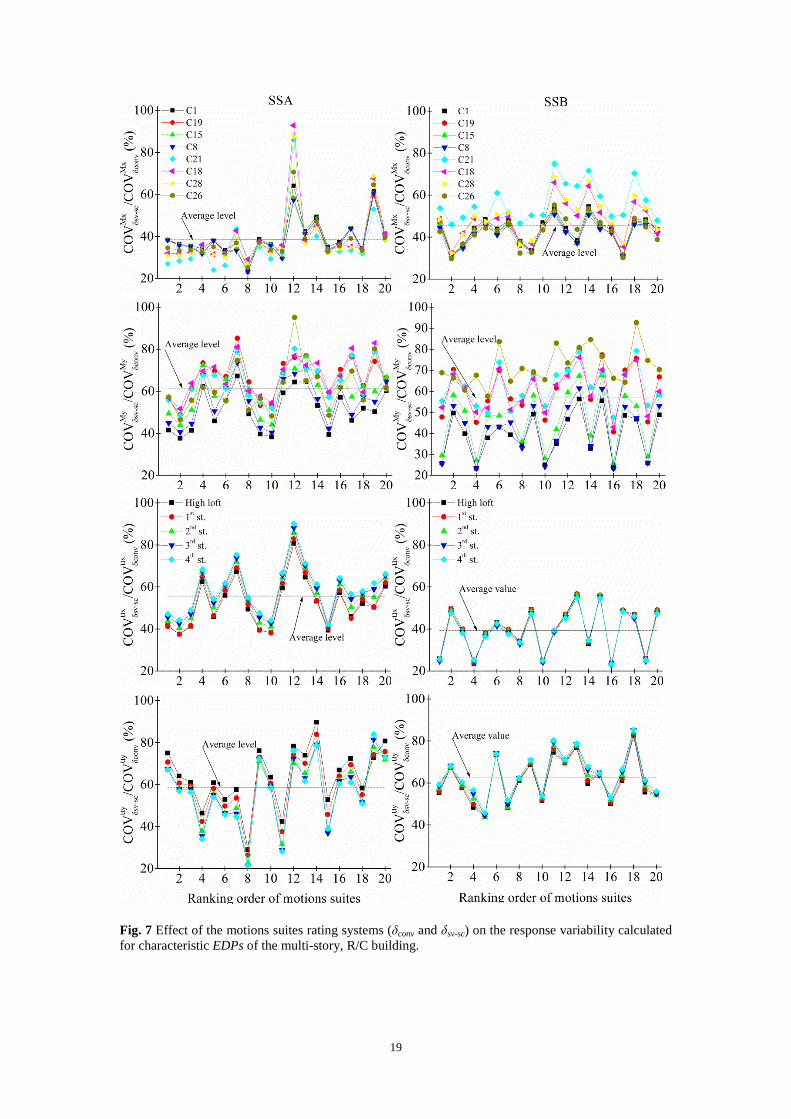
The higher efficiency of the δsv-sc-based ranking system compared with the conventional one in
terms of reducing the response variability was further evaluated through the calculation of the
variability ratios, mod
EDPCOVδ /sv sc
EDPCOVδ −, for the top 20 motions suites ranked using both the ranking
indices. For instance, the variability of the third story lateral displacement induced by the 10th δconv-
ranked suite (out of the 77,520 for the SSA) was divided with the COV value, being related to the 10th
suite of motions according to the δsv-sc-based ranking system. Along these lines, Fig. 7 plots such
mod
EDPCOVδ /sv sc
EDPCOVδ − ratios, which highlight the significantly lower response variability that the δsv-sc-
ranked top 20 suites induced (instead of the δconvv-ranked top 20 suites) when they were employed as
the required input for the seismic analysis of the multi-story R/C building. The latter was found to be
valid independently on the seismic scenario and the EDPs adopted, while the average δsv-sc-driven
decrease (1-mod
EDPCOVδ /sv sc
EDPCOVδ −) in the response variability was almost 50% for both the seismic
scenarios (i.e., 46.25 % and 48.80 % for the SSA and SSB respectively).
18
Fig. 6 Response variability corresponding to the first and 20th suites after employing the conventional (δconv) and the currently proposed (δsv-sc) ranking system respectively
19
Fig. 7 Effect of the motions suites rating systems (δconv and δsv-sc) on the response variability calculated for characteristic EDPs of the multi-story, R/C building.
20
5.3 Effect of the ranking systems (δsv-sc and δconv) on the reliability of the design values
The already achieved reduction in the intra-suite response variability using suites, which are
prioritized via the proposed multi-criterion process and the related δsv-sc index, is expected to increase
the design values reliability, quantified herein by the standard error, SE, of the estimated average
response, sx . As a matter of fact, based on Eq. 12, the SE value is proportional to the response
variability calculated for a specific EDP after the RHA of the structural model using a selected suite of
motions.
(CL,df)sSE tn
= (12)
where s is the standard deviation of the sample of the response values and n is the sample size (in this
case the sample size n coincides with m, which has been already defined as the number of motions
pairs that are included into the suites). The t-factor depends on the confidence level, CL, typically
assigned to predict the central response estimate, and df represents the degrees of freedom for the two-
sided Student’s t probability distribution function (Benjamin and Cornell 1970).
From a practical point of view, assuming a suite of motions with seven records, the t-factor is equal
to 1.943 for df =6 - CL=90% and hence, the SE value, which can be defined as percentage of the
estimated average base moment with s=0.30, is equal to 22%. The interpretation of such a result reveals
that if one were to form several response samples of common size drawn from the same population,
90% of the times the true, though unknown, average (design) response will be included within the
0.22 sx± ⋅ confidence interval. Thus, calculating quite narrow confidence intervals for the central
estimates of the EDPs lead to increased reliability for the design values. It is also interesting to see that
the central tendency of the log-normally distributed EDPs, being already a mature consideration, is
more rational to be represented by the geometric mean rather than the arithmetic mean (Benjamin and
Cornell 1970). However, the consequence of using one of the aforementioned moments is not
significant when a consistent definition of the central tendency is made for both the seismic records
scaling (through the spectral matching procedure) and the structural response measuring (Hancock et
al. 2008). Moreover, the arithmetic mean has been extensively specified by codes drafting (e.g.,
Eurocode 8, ASCE/SEI-7) to be used for the central response (design) values if, at least, seven seismic
motions are considered for the time domain analysis. Thus, the engineers are more familiar to the
arithmetic mean for the response parameters, which is also adopted in the current to study.
Along these lines, the SE values for the estimated average EDPs were calculated considering the
pair of seismic scenarios and the associated top 20 suites ranked according to the δconv and δsv-sc indices.
A reliability criterion was also formulated by setting a target threshold (lower bound) for the standard
error, SEt=30%, of the estimated average response measures, while the confidence level was taken
equal to 90%. Next, each suite of motions investigated herein was considered to fulfil the reliability
criterion once the related SE was found to be lower than the target threshold, SEt. It is notable that
FEMA P-58-1 (2012) as well as recent studies (Huang et al. 2011, Reyes and Kalkan 2012) prescribe
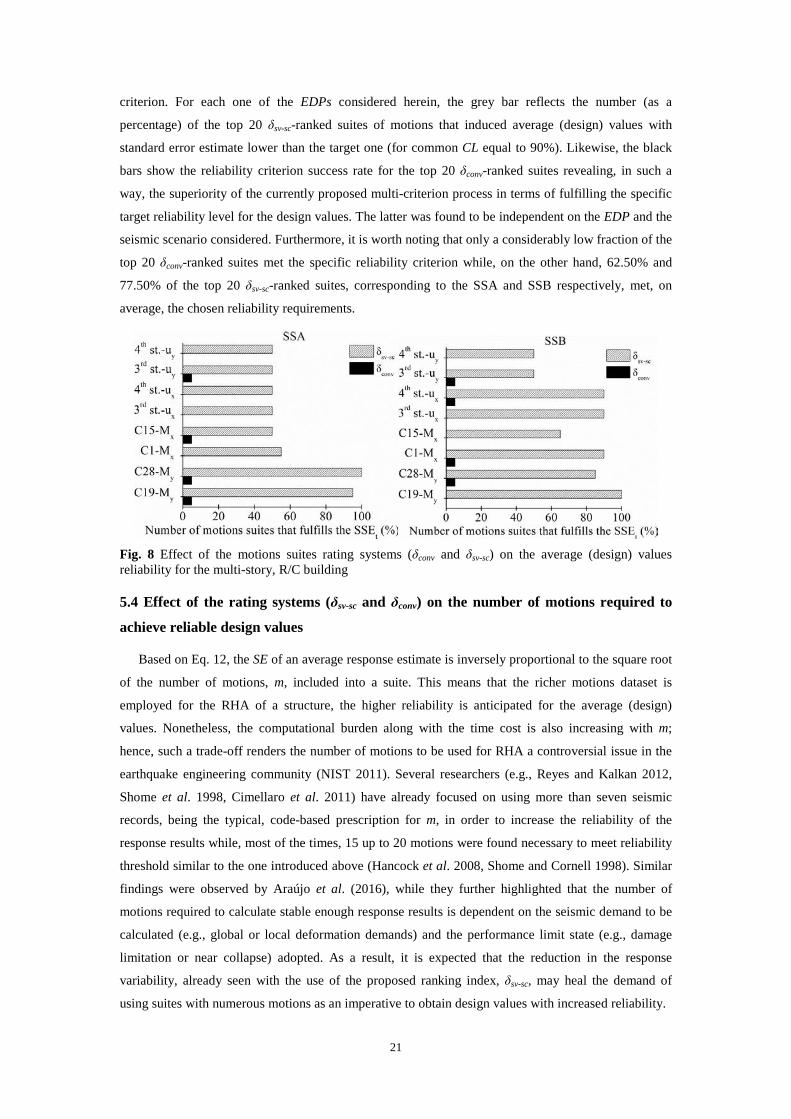
similar confidence level, CL, and SEt to be adopted for the average (design) values. Figure 8 visualizes
the outcome of such a comparative assessment performed on the basis of the aforementioned reliability
21
criterion. For each one of the EDPs considered herein, the grey bar reflects the number (as a
percentage) of the top 20 δsv-sc-ranked suites of motions that induced average (design) values with
standard error estimate lower than the target one (for common CL equal to 90%). Likewise, the black
bars show the reliability criterion success rate for the top 20 δconv-ranked suites revealing, in such a
way, the superiority of the currently proposed multi-criterion process in terms of fulfilling the specific
target reliability level for the design values. The latter was found to be independent on the EDP and the
seismic scenario considered. Furthermore, it is worth noting that only a considerably low fraction of the
top 20 δconv-ranked suites met the specific reliability criterion while, on the other hand, 62.50% and
77.50% of the top 20 δsv-sc-ranked suites, corresponding to the SSA and SSB respectively, met, on
average, the chosen reliability requirements.
Fig. 8 Effect of the motions suites rating systems (δconv and δsv-sc) on the average (design) values reliability for the multi-story, R/C building
5.4 Effect of the rating systems (δsv-sc and δconv) on the number of motions required to
achieve reliable design values
Based on Eq. 12, the SE of an average response estimate is inversely proportional to the square root
of the number of motions, m, included into a suite. This means that the richer motions dataset is
employed for the RHA of a structure, the higher reliability is anticipated for the average (design)
values. Nonetheless, the computational burden along with the time cost is also increasing with m;
hence, such a trade-off renders the number of motions to be used for RHA a controversial issue in the
earthquake engineering community (NIST 2011). Several researchers (e.g., Reyes and Kalkan 2012,
Shome et al. 1998, Cimellaro et al. 2011) have already focused on using more than seven seismic
records, being the typical, code-based prescription for m, in order to increase the reliability of the
response results while, most of the times, 15 up to 20 motions were found necessary to meet reliability
threshold similar to the one introduced above (Hancock et al. 2008, Shome and Cornell 1998). Similar
findings were observed by Araújo et al. (2016), while they further highlighted that the number of
motions required to calculate stable enough response results is dependent on the seismic demand to be
calculated (e.g., global or local deformation demands) and the performance limit state (e.g., damage
limitation or near collapse) adopted. As a result, it is expected that the reduction in the response
variability, already seen with the use of the proposed ranking index, δsv-sc, may heal the demand of
using suites with numerous motions as an imperative to obtain design values with increased reliability.
22
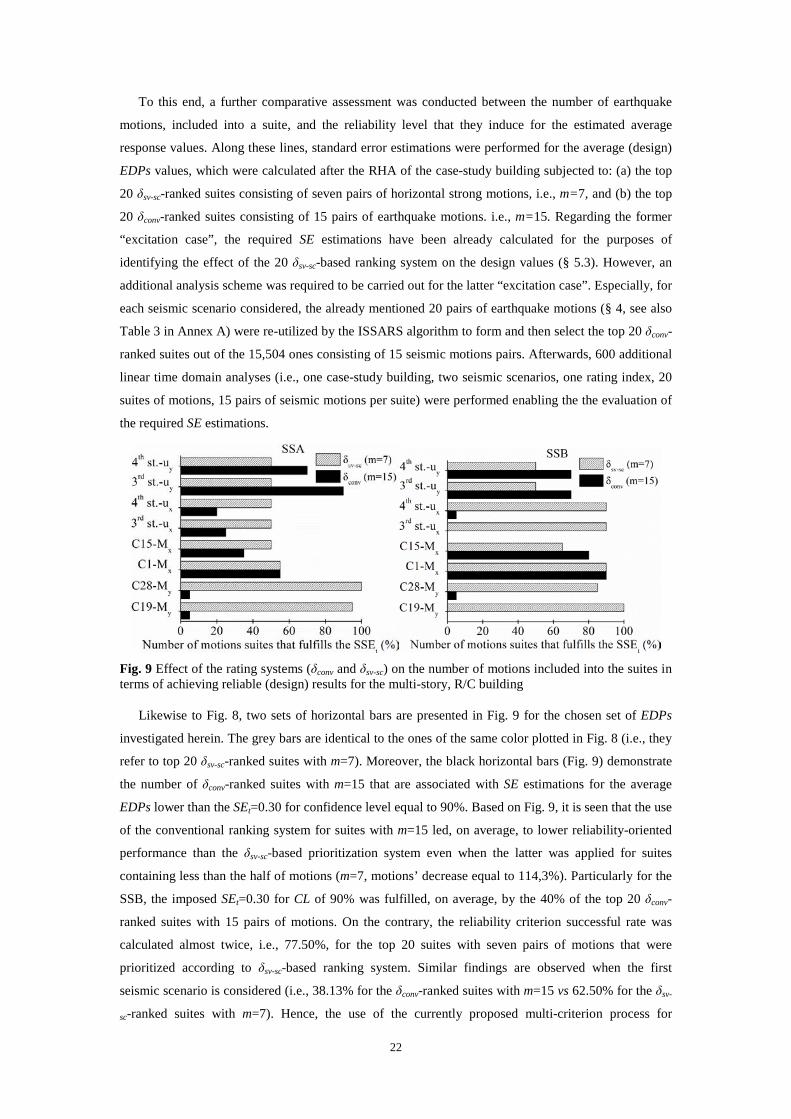
To this end, a further comparative assessment was conducted between the number of earthquake
motions, included into a suite, and the reliability level that they induce for the estimated average
response values. Along these lines, standard error estimations were performed for the average (design)
EDPs values, which were calculated after the RHA of the case-study building subjected to: (a) the top
20 δsv-sc-ranked suites consisting of seven pairs of horizontal strong motions, i.e., m=7, and (b) the top
20 δconv-ranked suites consisting of 15 pairs of earthquake motions. i.e., m=15. Regarding the former
“excitation case”, the required SE estimations have been already calculated for the purposes of
identifying the effect of the 20 δsv-sc-based ranking system on the design values (§ 5.3). However, an
additional analysis scheme was required to be carried out for the latter “excitation case”. Especially, for
each seismic scenario considered, the already mentioned 20 pairs of earthquake motions (§ 4, see also
Table 3 in Annex A) were re-utilized by the ISSARS algorithm to form and then select the top 20 δconv-
ranked suites out of the 15,504 ones consisting of 15 seismic motions pairs. Afterwards, 600 additional
linear time domain analyses (i.e., one case-study building, two seismic scenarios, one rating index, 20
suites of motions, 15 pairs of seismic motions per suite) were performed enabling the the evaluation of
the required SE estimations.
Fig. 9 Effect of the rating systems (δconv and δsv-sc) on the number of motions included into the suites in terms of achieving reliable (design) results for the multi-story, R/C building
Likewise to Fig. 8, two sets of horizontal bars are presented in Fig. 9 for the chosen set of EDPs
investigated herein. The grey bars are identical to the ones of the same color plotted in Fig. 8 (i.e., they
refer to top 20 δsv-sc-ranked suites with m=7). Moreover, the black horizontal bars (Fig. 9) demonstrate
the number of δconv-ranked suites with m=15 that are associated with SE estimations for the average
EDPs lower than the SEt=0.30 for confidence level equal to 90%. Based on Fig. 9, it is seen that the use
of the conventional ranking system for suites with m=15 led, on average, to lower reliability-oriented
performance than the δsv-sc-based prioritization system even when the latter was applied for suites
containing less than the half of motions (m=7, motions’ decrease equal to 114,3%). Particularly for the
SSB, the imposed SEt=0.30 for CL of 90% was fulfilled, on average, by the 40% of the top 20 δconv-
ranked suites with 15 pairs of motions. On the contrary, the reliability criterion successful rate was
calculated almost twice, i.e., 77.50%, for the top 20 suites with seven pairs of motions that were
prioritized according to δsv-sc-based ranking system. Similar findings are observed when the first
seismic scenario is considered (i.e., 38.13% for the δconv-ranked suites with m=15 vs 62.50% for the δsv-
sc-ranked suites with m=7). Hence, the use of the currently proposed multi-criterion process for
23
selecting earthquake motions can lead, via the RHA of structures, to reliable design values releasing, at
the same time, the time and computational costly requirement of employing an increased number of
motions per suite formed.
6. Conclusions
A decision support system is presented herein in order to facilitate the intricate task of selecting and
scaling earthquake ground motions as required for the time domain seismic analysis. Earthquake
ground motions suites are provided that fully conform to the current normative framework while, at the
same time, induce, via the RHA of structural models, response parameters with highly reduced intra-
suite variability. The latter is prerequisite to achieve increased reliability levels for the average (design)
response estimates, normally predicted during the code-prescribed design verification of structural
systems. The process described herein, which may also be used to evaluate the seismic performance of
structures under a target spectrum, incorporates a multi-criterion framework considering: (a) the
spectral variability among the selected motions of the suites, (b) the compliance between the suites
average spectrum and the target one and, (c) the dynamic characteristics (elastic - inelastic vibrations
periods, modal mass participation factors) of the structure studied. A novel, dual ranking index (δsv-sc)
is introduced to materialize the aforementioned criteria by prioritizing suites of motions that have been
implicitly prequalified to induce design values of increased reliability. The efficiency of the proposed
ranking index, δsv-sc, was quantified through its comparative assessment with the conventional index,
δconv, which is widely used by existing frameworks related to earthquake motions selecting and scaling
procedures. It is noted that the proposed method is quite generic, since it can be essentially applied for
any target spectrum prescribed either from codes or derived by site-specific seismic hazard analysis,
while it is applicable for any structure as long as its dynamic characteristics are known in advance.
The main conclusions from this comparison scheme, based on RHA response results of a multi-
story, R/C building, are briefly summarized below:
(a) Significantly lower (almost 50%) intra-suite response variability was calculated when the case-
study building was subjected to the top δsv-sc-ranked motions suites instead of using the ones
prioritized by the conventional index.
(b) The latter was observed independently on the seismic scenarios and the EDPs adopted in the
analysis increasing, in such a way, the efficiency and validity of the currently proposed process.
Wider analysis scheme is, though, required to verify the findings mentioned above for different
structural configurations.
(c) Over than 62% (on average) of the top δsv-sc-ranked suites fulfilled the reliability criterion imposed
herein that was marginally met by the highly prioritized suites using the conventional approach.
(d) Even in case of using suites with 15 pairs of earthquake motions, the conventional approach
performed significantly worse in reliability terms than the proposed multi-criterion process, which
was used to prioritize suites consisting of seven pairs of earthquake records. Hence, the reliability-
driven, though burdensome, requirement for richer suites of motions may be released applying the
current approach for selecting and scaling seismic motions.
24
It should be, finally, mentioned that the efficiency of the proposed method to credit motions suites
that induce stable enough response results should be further investigated for nonlinear RHA, since in
this case, the spectral variability control for the motions suites along with their convergence with the
target spectrum cannot de facto lead to inelastic response results with limited variability. Indeed, more
strong ground motion and structural-based proxies than the spectral shape are necessary to control
efficiently the nonlinear response and hence, the relevant variability.
ACKNOWLEDGEMENTS
Financial support was provided to the first author by the People Programme (Marie Curie Actions) of
the European Union's Seventh Framework Programme (FP7/2007-2013) under REA grant agreement
n° 609405 (COFUNDPostdocDTU).
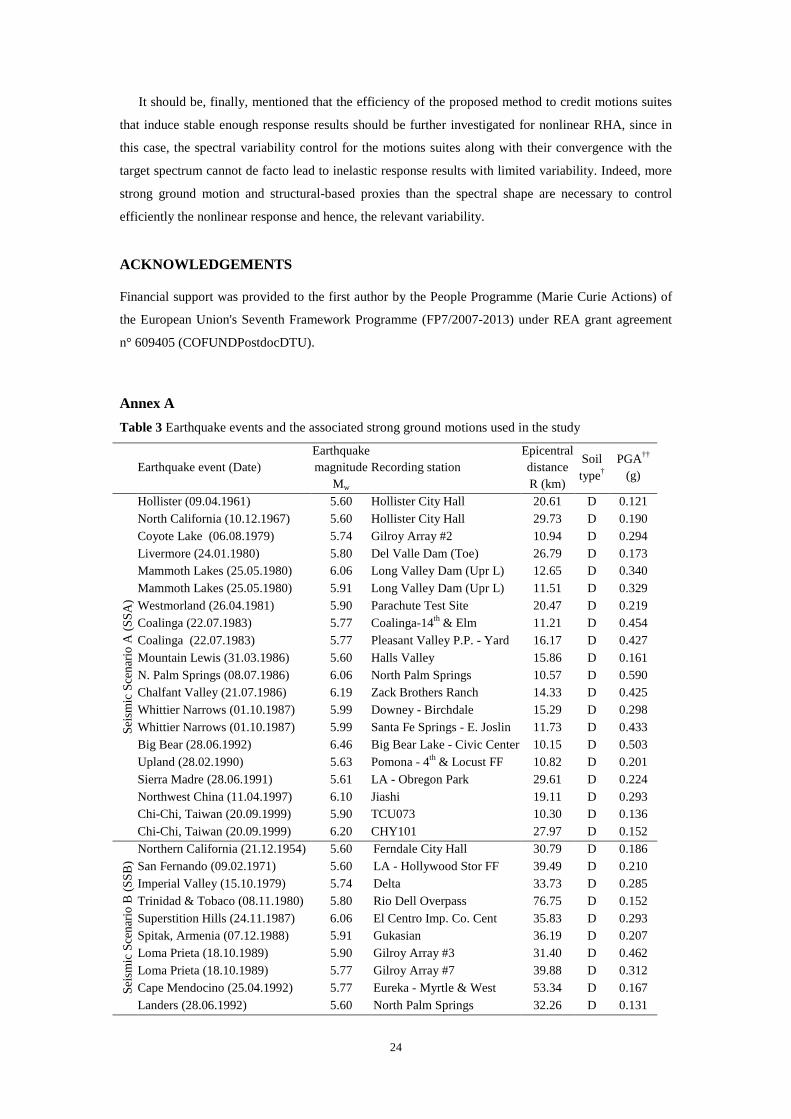
Annex A Table 3 Earthquake events and the associated strong ground motions used in the study
Earthquake event (Date)
Earthquake magnitude
Mw Recording station
Epicentral distance R (km)
Soil type†
PGA†† (g)
Seis
mic
Sce
nario
A (S
SA)
Hollister (09.04.1961) 5.60 Hollister City Hall 20.61 D 0.121 North California (10.12.1967) 5.60 Hollister City Hall 29.73 D 0.190 Coyote Lake (06.08.1979) 5.74 Gilroy Array #2 10.94 D 0.294 Livermore (24.01.1980) 5.80 Del Valle Dam (Toe) 26.79 D 0.173 Mammoth Lakes (25.05.1980) 6.06 Long Valley Dam (Upr L) 12.65 D 0.340 Mammoth Lakes (25.05.1980) 5.91 Long Valley Dam (Upr L) 11.51 D 0.329 Westmorland (26.04.1981) 5.90 Parachute Test Site 20.47 D 0.219 Coalinga (22.07.1983) 5.77 Coalinga-14th & Elm 11.21 D 0.454 Coalinga (22.07.1983) 5.77 Pleasant Valley P.P. - Yard 16.17 D 0.427 Mountain Lewis (31.03.1986) 5.60 Halls Valley 15.86 D 0.161 N. Palm Springs (08.07.1986) 6.06 North Palm Springs 10.57 D 0.590 Chalfant Valley (21.07.1986) 6.19 Zack Brothers Ranch 14.33 D 0.425 Whittier Narrows (01.10.1987) 5.99 Downey - Birchdale 15.29 D 0.298 Whittier Narrows (01.10.1987) 5.99 Santa Fe Springs - E. Joslin 11.73 D 0.433 Big Bear (28.06.1992) 6.46 Big Bear Lake - Civic Center 10.15 D 0.503 Upland (28.02.1990) 5.63 Pomona - 4th & Locust FF 10.82 D 0.201 Sierra Madre (28.06.1991) 5.61 LA - Obregon Park 29.61 D 0.224 Northwest China (11.04.1997) 6.10 Jiashi 19.11 D 0.293 Chi-Chi, Taiwan (20.09.1999) 5.90 TCU073 10.30 D 0.136 Chi-Chi, Taiwan (20.09.1999) 6.20 CHY101 27.97 D 0.152
Seis
mic
Sce
nario
B (S
SB)
Northern California (21.12.1954) 5.60 Ferndale City Hall 30.79 D 0.186 San Fernando (09.02.1971) 5.60 LA - Hollywood Stor FF 39.49 D 0.210 Imperial Valley (15.10.1979) 5.74 Delta 33.73 D 0.285 Trinidad & Tobaco (08.11.1980) 5.80 Rio Dell Overpass 76.75 D 0.152 Superstition Hills (24.11.1987) 6.06 El Centro Imp. Co. Cent 35.83 D 0.293 Spitak, Armenia (07.12.1988) 5.91 Gukasian 36.19 D 0.207 Loma Prieta (18.10.1989) 5.90 Gilroy Array #3 31.40 D 0.462 Loma Prieta (18.10.1989) 5.77 Gilroy Array #7 39.88 D 0.312 Cape Mendocino (25.04.1992) 5.77 Eureka - Myrtle & West 53.34 D 0.167 Landers (28.06.1992) 5.60 North Palm Springs 32.26 D 0.131
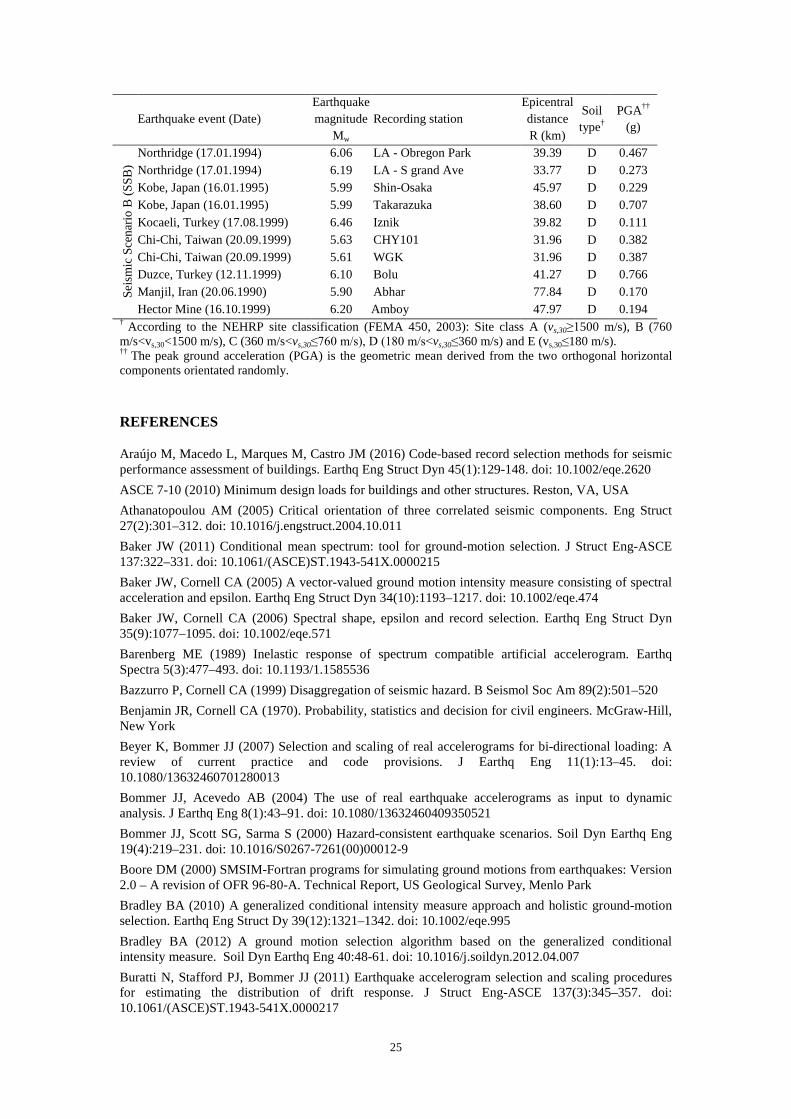
25
Earthquake event (Date)
Earthquake magnitude
Mw Recording station
Epicentral distance R (km)
Soil type†
PGA†† (g)
Seis
mic
Sce
nario
B (S
SB)
Northridge (17.01.1994) 6.06 LA - Obregon Park 39.39 D 0.467 Northridge (17.01.1994) 6.19 LA - S grand Ave 33.77 D 0.273 Kobe, Japan (16.01.1995) 5.99 Shin-Osaka 45.97 D 0.229 Kobe, Japan (16.01.1995) 5.99 Takarazuka 38.60 D 0.707 Kocaeli, Turkey (17.08.1999) 6.46 Iznik 39.82 D 0.111 Chi-Chi, Taiwan (20.09.1999) 5.63 CHY101 31.96 D 0.382 Chi-Chi, Taiwan (20.09.1999) 5.61 WGK 31.96 D 0.387 Duzce, Turkey (12.11.1999) 6.10 Bolu 41.27 D 0.766 Manjil, Iran (20.06.1990) 5.90 Abhar 77.84 D 0.170 Hector Mine (16.10.1999) 6.20 Amboy 47.97 D 0.194
† According to the NEHRP site classification (FEMA 450, 2003): Site class A (vs,30≥1500 m/s), B (760 m/s<vs,30<1500 m/s), C (360 m/s<vs,30≤760 m/s), D (180 m/s<vs,30≤360 m/s) and E (vs,30≤180 m/s). †† The peak ground acceleration (PGA) is the geometric mean derived from the two orthogonal horizontal components orientated randomly.
REFERENCES
Araújo M, Macedo L, Marques M, Castro JM (2016) Code-based record selection methods for seismic performance assessment of buildings. Earthq Eng Struct Dyn 45(1):129-148. doi: 10.1002/eqe.2620 ASCE 7-10 (2010) Minimum design loads for buildings and other structures. Reston, VA, USA Athanatopoulou AM (2005) Critical orientation of three correlated seismic components. Eng Struct 27(2):301–312. doi: 10.1016/j.engstruct.2004.10.011 Baker JW (2011) Conditional mean spectrum: tool for ground-motion selection. J Struct Eng-ASCE 137:322–331. doi: 10.1061/(ASCE)ST.1943-541X.0000215 Baker JW, Cornell CA (2005) A vector-valued ground motion intensity measure consisting of spectral acceleration and epsilon. Earthq Eng Struct Dyn 34(10):1193–1217. doi: 10.1002/eqe.474 Baker JW, Cornell CA (2006) Spectral shape, epsilon and record selection. Earthq Eng Struct Dyn 35(9):1077–1095. doi: 10.1002/eqe.571 Barenberg ME (1989) Inelastic response of spectrum compatible artificial accelerogram. Earthq Spectra 5(3):477–493. doi: 10.1193/1.1585536 Bazzurro P, Cornell CA (1999) Disaggregation of seismic hazard. B Seismol Soc Am 89(2):501–520 Benjamin JR, Cornell CA (1970). Probability, statistics and decision for civil engineers. McGraw-Hill, New York Beyer K, Bommer JJ (2007) Selection and scaling of real accelerograms for bi-directional loading: A review of current practice and code provisions. J Earthq Eng 11(1):13–45. doi: 10.1080/13632460701280013 Bommer JJ, Acevedo AB (2004) The use of real earthquake accelerograms as input to dynamic analysis. J Earthq Eng 8(1):43–91. doi: 10.1080/13632460409350521 Bommer JJ, Scott SG, Sarma S (2000) Hazard-consistent earthquake scenarios. Soil Dyn Earthq Eng 19(4):219–231. doi: 10.1016/S0267-7261(00)00012-9 Boore DM (2000) SMSIM-Fortran programs for simulating ground motions from earthquakes: Version 2.0 – A revision of OFR 96-80-A. Technical Report, US Geological Survey, Menlo Park Bradley BA (2010) A generalized conditional intensity measure approach and holistic ground-motion selection. Earthq Eng Struct Dy 39(12):1321–1342. doi: 10.1002/eqe.995 Bradley BA (2012) A ground motion selection algorithm based on the generalized conditional intensity measure. Soil Dyn Earthq Eng 40:48-61. doi: 10.1016/j.soildyn.2012.04.007 Buratti N, Stafford PJ, Bommer JJ (2011) Earthquake accelerogram selection and scaling procedures for estimating the distribution of drift response. J Struct Eng-ASCE 137(3):345–357. doi: 10.1061/(ASCE)ST.1943-541X.0000217
26
Cacciola P (2010) A stochastic approach for generating spectrum compatible fully nonstationary earthquakes. Comput Struct 88(15-16):889–901. doi: 10.1016/j.compstruc.2010.04.009 Carballo E, Cornell CA (2000) Probabilistic seismic demand analysis: spectrum matching and design. Report No.41, Reliability of Marine Structures Program, Stanford University Chiou B, Darragh R, Gregor N, Silva W (2008) NGA Project strong-motion database. Earthq Spectra 24(1):23–44. doi: 10.1193/1.2894831 Cimellaro GP, Reinhorn AM, Ambrisi AD, De Stefano M (2011) Fragility analysis and seismic record selection. J Struct Eng-ASCE 137(3):379–390. doi: 10.1061/(ASCE)ST.1943-541X.0000115 Corigliano M, Lai CG, Rota M, Strobbia CL (2012) ASCONA: Automated selection of compatible natural accelerograms. Earthq Spectra 28(3):965–987. doi: 10.1193/1.4000072 CSI [Computers & Structures Inc.] (2011) SAP2000—Version 15.0.1: linear and non linear static and dynamic analysis and design of three-dimensional structures. CSI, Berkeley Dhakal RP, Mander JB, Mashiko N (2006) Identification of critical ground motions for seismic performance assessment of structures. Earthq Eng Struct Dyn 35(8):989–1008. doi: 10.1002/eqe.568 Dias J, Castro JM, Romao X, Goncalves M, Lopes JC (2010) SelEQ: a web-based application for the selection of earthquake ground motions for structural analysis. In: Proceedigns, 14th European Conference on Earthquake Engineering, Ohrid, Skopje Elnashai AS, McGlure DC (1996) Effect of modelling assumptions and input motion characteristics on seismic design parameters of rc bridge piers. Earthq Eng Struct Dyn 25:435–463. doi: 10.1002/(SICI)1096-9845(199605)25:5<435::AID-EQE562>3.0.CO;2-P EN1998 (2004) Eurocode 8: Design of structures for earthquake resistance. Part 1: general rules, seismic actions and rules for buildings. CEN, Brussels FEMA 450 (2003) NEHRP Recommended provisions for seismic regulations for new buildings and other structures – Part 1: Provisions. Building Seismic Safety Council for the Federal Emergency Management Agency, Washington, DC. FEMA P-58-1 (2012) Seismic performance assessment of buildings: Volume 1 - Methodology. Applied Technology Council, Redwood City Giaralis A, Spanos PD (2009) Wavelet-based response spectrum compatible synthesis of accelerograms - Eurocode application (EC8). Soil Dyn Earthq Eng 29:219–235. doi: 10.1016/j.soildyn.2007.12.002 Grigoriu M (2011) To scale or not to scale seismic ground-acceleration records. J Eng Mech-ASCE 137(4):284–293. doi: 10.1061/(ASCE)EM.1943-7889.0000226 Hancock J, Bommer JJ, Stafford P (2008) Numbers of scaled and matched accelerograms required for inelastic dynamic analyses. Earthq Eng Struct Dyn 37(14):1585–607. doi: 10.1002/eqe.827 Hancock J, Watson-Lamprey J, Abrahamson NA, Bommer JJ, Markatis A, McCoyh E, Mendis R (2006) An improved method of matching response spectra of recorded earthquake ground motion using wavelets. J Earthq Eng 10(1):67–89. doi: 10.1080/13632460609350629 Huang Y-N, Whittaker AS, Luco N, Hamburger RO (2011) Scaling earthquake ground motions for performance-based assessment of buildings. J Struct Eng-ASCE 137(3):311–321. doi: 10.1061/(ASCE)ST.1943-541X.0000155 Iervolino I, Galasso C, Cosenza E (2010) REXEL: computer aided record selection for code-based seismic structural analysis. B Earthq Eng 8(2):339–362. doi: 10.1007/s10518-009-9146-1 Iervolino I, Manfredi G, Cosenza E (2006) Ground motion duration effects on nonlinear seismic response. Earthq Eng Struct Dyn 35(1):21–38. doi: 10.1002/eqe.529 International Code Council [ICC] (2009) International Building Code, USA Jayaram N, Lin T, Baker JW (2011) A computationally efficient ground-motion selection algorithm for matching a target response spectrum mean and variance. Earthq Spectra 27(3):797–815. doi: 10.1193/1.3608002 Kalkan E, Chopra AK (2011) Modal-pushover-based ground-motion scaling procedure. J Struct Eng-ASCE 137(3):298–310. doi: 10.1061/(ASCE)ST.1943-541X.0000308 Kalkan E, Reyes JC (2015) Significance of rotating ground motions on behavior of symmetric- and asymmetric-plan structures: Part II. multi-story structures. Earthq Spectra 31(3):1613-1628. doi: 10.1193/072012EQS242M
27
Katsanos EI, Sextos AG, Manolis GD (2010) Selection of earthquake ground motion records: A state-of-the-art review from a structural engineering perspective. Soil Dyn Earthq Eng 30(4):157–169. doi: 10.1016/j.soildyn.2009.10.005 Katsanos EI, Sextos AG (2013) An integrated software environment for structure-specific earthquake ground motion selection. Adv Eng Softw 58: 70-85. doi: 10.1016/j.advengsoft.2013.01.003 Katsanos EI, Sextos AG (2015) Inelastic spectra to predict period elongation of structures under earthquake loading. Earthq Eng Struct Dyn 44(11): 1765-1782. doi: 10.1002/eqe.2554 Katsanos EI, Sextos AG, Elnashai AS (2014) Prediction of inelastic response periods of buildings based on intensity measures and analytical model parameters. Eng Struct 71:161–177. doi: 10.1016/j.engstruct.2014.04.007 Kottke A, Rathje E (2008) A semi-automated procedure for selecting and scaling recorded earthquake motions for dynamic analysis. Earthq Spectra 24(4):911–932. doi: 10.1193/1.2985772 Kramer SL (1996) Geotechnical earthquake engineering. Prentice Hall, Upper Saddle River, New Jersey Krawinkler H, Medina R, Alavi B (2003) Seismic drift and ductility demands and their dependence on ground motions. Eng Struct 25(5):637–653. doi: 10.1016/S0141-0296(02)00174-8 Kurama YC, Farrow KT (2003) Ground motion scaling methods for different site conditions and structure characteristics. Earthq Eng Struct Dyn 32(15):2425–2450. doi: 10.1002/eqe.335 Kwon O, Elnashai AS (2006) The effect of material and ground motion uncertainty on the seismic vulnerability curves of RC structure. Eng Struct 28(2):289–303. doi: 10.1016/j.engstruct.2005.07.010 Lee SC, Han SW (2002) Neural-network-based models for generating artificial earthquakes and response spectra. Comput Struct 80(20-21):1627–1638. doi: 10.1016/S0045-7949(02)00112-8 Lee LIH, Lee HHO, Han SW (2000) Method of selection design earthquake ground motions for tall buildings. Struct Des Tall Buil 9(3):201–213. doi: 10.1002/1099-1794(200006)9:3<201::AID-TAL136>3.0.CO;2-Z Luco N, Bazzurro P (2007) Does amplitude scaling of ground motion records result in biased nonlinear structural drift responses? Earthq Eng Struct Dyn 36(13):1813–1835. doi: 10.1002/eqe.695 Malhotra PK (2003) Strong-motion records for site-specific analysis. Earthq Spectra 19(3):557–578. doi: 10.1193/1.1598439 McGuire RK (1995) Probabilistic seismic hazard analysis and design earthquakes: closing the loop. B Seismol Soc Am 85(5):1275–1284 Naeim F, Lew M (1995) On the use of design spectrum compatible time histories. Earthq Spectra 11(1):111–127. doi: 10.1193/1.1585805 National Institute of Standards and Technology (2011) Selecting and scaling earthquake ground motions for performing response-histroy analyses. Report GCR 11-917-15 O’Donnell AP, Kurama YC, Kalkan E, Taflanidis AA, Beltsar OA (2013) Ground motion scaling methods for linear-elastic structures : an integrated experimental and analytical investigation. Earthq Eng Struct Dyn 42(9):1281–1300. doi: 10.1002/eqe.2272 Padgett JE, Desroches R (2007) Sensitivity of seismic response and fragility to parameter uncertainty. J Struct Eng-ASCE 133(12):1710–1718. doi: 10.1061/(ASCE)0733-9445(2007)133:12(1710) PEER GMSM Working Group (2009) Evaluation of ground motion selection and modification methods: Predicting median interstory drift response of buildings. Technical Report, PEER Center, University of California, Berkeley Reiter L (1990) Earthquake hazard analysis: issues and insights. Columbia University Press, New York Reyes JC, Kalkan E (2012) How many records should be used in an ASCE/SEI-7 ground motion scaling procedure? Earthq Spectra 28(3):1223–1242. doi: 10.1193/1.4000066 Reyes JC, Kalkan E (2015) Significance of rotating ground motions on behavior of symmetric- and asymmetric-plan structures: Part I. Single-story structures. Earthq Spectra 31(3):1591-1612. doi: 10.1193/072012EQS241M Reyes JC, Riaño AC, Kalkan E, Aragno CA (2015) Extending modal pushover-based scaling procedure for nonlinear response history analysis of multi-story unsymmetric-plan buildings. Eng Struct 88:125–137. doi: 10.1016/j.engstruct.2015.01.041
28
Reyes JC, Quintero O (2013) Modal pushover-based scaling of earthquake records for nonlinear analysis of single-story unsymmetric-plan buildings. Earthq Eng Struct Dyn 43(7):1005–21. doi: 10.1002/eqe.2384 Sextos AG, Katsanos EI, Manolis GD (2011) EC8-based earthquake record selection procedure evaluation: Validation study based on observed damage of an irregular R/C building. Soil Dyn Earthq Eng 31(4):583–597. doi: 10.1016/j.soildyn.2010.10.009 Shome N, Cornell CA (1998) Normalized and scaling acceleregrams for nonlinear structural analysis. In: Proceedings, 6th US National Conference on Earthquake Engineering, Seattle Shome N, Cornell CA, Bazzurro P, Carballo EJ (1998) Earthquakes, records and nonlinear responses. Earthq Spectra 14(3):469–500. doi: 10.1193/1.1586011 Silva W, Lee K (1987) WES RASCAL code for synthesizing earthquake ground motions. Report 24, Department of the Army, US Army Corps of Engineers, Washington DC Smerzini C, Galasso C, Iervolino I, Paoluccia R (2014) Ground motion record selection based on broadband spectral compatibility. Earthq Spectra 30(4):1427-1448. doi: 10.1193/052312EQS197M Sorabella S, Baise LG, Hines EM (2006) Ground motion suite selection for Boston, Massachusetts. In: Proceedigns, 8th US National Conference on Earthquake Engineering, San Francisco Stewart JP, Chiou SJ, Bray JD, Graves RE, Somerville PG, Abrahamson NA (2001) Ground motion evaluation procedures for performance-based design. Technical Report, PEER Center, University of California, Berkeley Tothong P, Luco N (2007) Probabilistic seismic demand analysis using advanced ground motion intensity measures. Earthq Eng Struct Dyn 36(13):1837–1860. doi: 10.1002/eqe.696 Youngs RR, Power MS, Chin C-C (2006) Design ground motion library. In: Proceedigns, 8th US National Conference on Earthquake Engineering, San Francisco, CA, USA Wang G, Youngs R, Power M, Li Z (2013) Design Ground Motion Library: An interactive tool for selecting earthquake ground motions. Earthq Spectra 31(2):617-635. doi: 10.1193/090612EQS283M Watson-Lamprey J, Abrahamson NA (2006) Selection of ground motion time series and limits on scaling. Soil Dyn Earthq Eng 26(5):477–482. doi: 10.1016/j.soildyn.2005.07.001