Structure of nitrifying biofilms in a high-rate trickling filter designed for potable water...
13
This article appeared in a journal published by Elsevier. The attached copy is furnished to the author for internal non-commercial research and education use, including for instruction at the authors institution and sharing with colleagues. Other uses, including reproduction and distribution, or selling or licensing copies, or posting to personal, institutional or third party websites are prohibited. In most cases authors are permitted to post their version of the article (e.g. in Word or Tex form) to their personal website or institutional repository. Authors requiring further information regarding Elsevier’s archiving and manuscript policies are encouraged to visit: http://www.elsevier.com/copyright
-
Upload
independent -
Category
Documents
-
view
1 -
download
0
Transcript of Structure of nitrifying biofilms in a high-rate trickling filter designed for potable water...
This article appeared in a journal published by Elsevier. The attachedcopy is furnished to the author for internal non-commercial researchand education use, including for instruction at the authors institution
and sharing with colleagues.
Other uses, including reproduction and distribution, or selling orlicensing copies, or posting to personal, institutional or third party
websites are prohibited.
In most cases authors are permitted to post their version of thearticle (e.g. in Word or Tex form) to their personal website orinstitutional repository. Authors requiring further information
regarding Elsevier’s archiving and manuscript policies areencouraged to visit:
http://www.elsevier.com/copyright
Author's personal copy
Structure of nitrifying biofilms in a high-rate trickling filterdesigned for potable water pre-treatment
Ben van den Akker a,*, Mike Holmes b, Peter Pearce c, Nancy J. Cromar a,Howard J. Fallowfield a
aHealth and Environment Group, School of the Environment, Flinders University, Bedford Park, South Australia 5042, AustraliabUnited Water International, 180 Greenhill Road, Parkside, South Australia 5063, AustraliacThames Water Research and Development, Reading Sewage Treatment Works, Island Road, Reading RG2 0RP, UK
a r t i c l e i n f o
Article history:
Received 15 December 2010
Received in revised form
2 March 2011
Accepted 11 April 2011
Available online 15 April 2011
Keywords:
Nitrification
Trickling filter
FISH
Scanning electron microscopy
Organic carbon
Biological water treatment
Carbohydrate
Protein
Heterotrophs
Ammonia
Multi-species biofilm
a b s t r a c t
This study examined the composition and structure of nitrifying biofilms sampled from
a high-rate nitrifying trickling filter which was designed to pre-treat raw surface water for
potable supply. The filter was operated under a range of feed water ammonia and organic
carbon concentrations that mimicked the raw water quality of poorly protected catch-
ments. The biofilm structure was examined using a combination of fluorescence in situ
hybridisation and scanning electron microscopy. Biopolymers (carbohydrate and protein)
were also measured. When the filter was operated under low organic loads, nitrifiers were
abundant, representing the majority of microorganisms present. Uniquely, the study
identified not only Nitrospira but also the less common Nitrobacter. Small increases in
organic carbon promoted the rapid growth of filamentous heterotrophs, as well as the
production of large amounts of polysaccharide. Stratification of nitrifiers and heterotrophs,
and high polysaccharide were observed at all filter bed depths, which coincided with the
impediment of nitrification throughout most of the filter bed. Observations presented here
specifically linked biofilm structure with filter functionality, physically validating previous
empirical modelling hypotheses regarding competitive interactions between autotrophic
and heterotrophic bacteria in biofilms.
ª 2011 Elsevier Ltd. All rights reserved.
1. Introduction
Uncontrolled variability in the concentration of ammonia in
feed waters during potable water treatment presents both
difficult and expensive challenges for maintaining effective
process control of chlorine disinfection. The conventional
approach to managing the level of influent ammonia in this
situation is pre-chlorination. This process, however, has
a number of recognized disadvantages, some of which
include: high chlorine dose requirements under high influent
ammonia loads; difficult process control where feed water
ammonia concentrations are unstable; the production of
harmful disinfection by-products; formation of chlorine-
related tastes and odours; and high process costs associated
with high chlorine demand.
Due to the deterioration of raw water quality worldwide
and increased demands for human consumption, water
treatment processes need to be improved to make the water
* Corresponding author. Present address: Water Research Centre, School of Civil and Environmental Engineering, The University of NewSouth Wales, Sydney 2052, Australia.
E-mail address: [email protected] (B. van den Akker).
Avai lab le a t www.sc iencedi rec t .com
journa l homepage : www.e lsev ie r . com/ loca te /wat res
wat e r r e s e a r c h 4 5 ( 2 0 1 1 ) 3 4 8 9e3 4 9 8
0043-1354/$ e see front matter ª 2011 Elsevier Ltd. All rights reserved.doi:10.1016/j.watres.2011.04.017
Author's personal copy
safe and aesthetically pleasing, without the use of large
chlorine doses. This view was recognized in the 1980’s when
the U.S. Environmental Protection Agency took action to
regulate chlorination by-products (Sayre, 1988; Rittmann and
Huck, 1989). Early review papers by Rittmann and colleagues
in the 1980’s found biological treatment to be a cost-effective
and necessary solution to remove biodegradable contami-
nants such as ammonia, so that the formation of disinfection
by-product can be minimized (Rittmann and Snoeyink, 1984;
Rittmann and Huck, 1989). Although biological treatment of
public water supplies is not widespread practice throughout
the world, it has been relatively common in Europe since the
1970’s, mainly due to poorer surface water quality (Rittmann
and Huck, 1989).
There are a variety of approaches to biologically treat
drinking water which include: slow sand filtration, bank
filtration, biologically active granular activated carbon,
submerged aerated filters, unsubmerged filters, and fluidized
beds (Rittmann and Huck, 1989; Ahmad, 2005). Nitrifying
trickling filters (NTFs), which are conventionally used for
wastewater treatment, are another form of biological treat-
ment that have been successfully applied for ammonia
removal as well as the removal of manganese and iron from
ground and surface waters (e.g. Tekerlekopoulou and
Vayenas, 2007, 2008, van den Akker et al., 2008; De Vet et al.,
2009; Tekerlekopoulou et al., 2010). Interest in NTFs is likely
due to the well-established advantages of these systems such
as simple design and operation, low capital and operating cost
and a low requirement for energy and maintenance inputs.
Todate,most of our current understandingofNTFshas come
from research on wastewater applications, which are largely
based on one dimensional monitoring and manipulation of
traditional bulk physicalechemical parameters; with limited
scope for characterising filter microbiology. A key observation
from these traditional macroscale studies is that ammonia
removal (nitrification) is increasingly suppressedwith increased
organic carbon loading (see Boller and Gujer, 1986; Parker and
Richards, 1986; Pearce and Williams, 1999; Pearce and
Edwards, 2010). This suppression of nitrification has been
attributed to a response by faster growing heterotrophic micro-
organisms to increasedorganic carbonsubstrate availability and
subsequent out-competition of slower growing, autotrophic
nitrifiers. The presence of a rapidly respiring heterotrophic bio-
film layer in between the nitrifying populations and the
oxygenated bulk liquid film restricts or prevents the diffusion of
dissolved oxygen (DO) to the underlying nitrifiers, resulting in
lower rates of ammonia oxidation. Satoh et al. (2000) and Zhang
et al. (1994) have demonstrated this heterotrophic overgrowth of
nitrifying biofilms at the laboratory-scale by exposing coupon-
attached biofilms to varying C/N substrate ratios. Without
complementary researchat the full-scalehowever, it canonlybe
assumed that this pattern reflects the functional biofilm
processes of larger-scale percolating or flooded filters.
The impact of oxygen transfer as a key mechanism influ-
encing NTF performance has been described by Pearce and
colleagues with respect to increasing irrigation velocity driving
increased oxygen transfer for satisfying the metabolic require-
ments of both heterotrophs and autotrophs (Pearce and
Williams, 1999; Pearce and Edwards, 2010). The authors devel-
opedmodels for predicting effluent ammonia concentrations in
wastewater NTFsdboth stone and plastic mediadwith respect
to five day biological oxygen demand (BOD5), ammonia and
hydraulic loading (Pearce and Williams, 1999; Pearce and
Edwards, 2010). However, since these models were empirically-
based, heterotropheautotroph competition was only proposed
as one potential factor affecting nitrification performance in the
presence of organic carbon substrates; with this hypothesis
remaining un-validated.
In order to better design and optimise nitrification processes,
it is necessary to first identify the key organisms involved in this
microbial-driven processes and then to understand the func-
tional relationships between the microbiology and the process
performance.Understandingmicrobial functions and thenusing
this information in an appliedmanner should be fundamental to
NTFoperations,yet this is rarely thecase inpractice.Todate,very
few studies have characterised the microbiology of wastewater
NTFs (e.g. Persson et al., 2002; Biesterfeld et al., 2003; Lydmark
et al., 2006; Datta et al., 2011). Moreover, even fewer studies
have characterized and contrasted the physicalechemical
performance andmicrobiology of high-rate, potable water NTFs
e particularly under low ammonia and organic carbon substrate
conditions that are commonly encountered in poorly protected
catchments throughout the world.
Theaimof this studywas to characterise themicrobiological
performance of a potablewater NTF operating under a range of
controlled ammonia and soluble BOD5 (sBOD5) concentrations
mimicking the raw water quality of polluted drinking water
sources. This study is unique in the context of NTF research
through its application of a multidimensional investigative
approach. Firstly, nitrification performance was characterized
by measuring traditional bulk physicalechemical indicators
within the influent, effluent and depth-wise filtrate samples
collected throughout NTF bed. Secondly, the microbiology of
biofilm samples collected from within the filter matrix was
characterized and used to link observed changes in biofilm
structure with more traditional bulk chemical performance
parameters. Biofilm samples were characterized through
a number of means. The mass of biofilm protein and carbohy-
drate were closely monitored in order to provide insights into
changes in biopolymer production in response to variations in
organic carbon loading. Direct analytical tools (fluorescence in
situ hybridisation (FISH) and scanning electron microscopy
(SEM)) were also applied to probe the spatial distribution of
ammonia oxidizing bacteria (AOB), nitrite oxidizing bacteria
(NOB) andheterotrophswithin theNTF biofilm. The abundance
of heterotrophs was also monitored using the more traditional
heterotrophic plate count (HPC) method. Finally, NTF perfor-
mance data from this study was also compared with the
performance predicted by the Pearce and Edwards (2010)
empirical design model derived from wastewater applications
under high BOD5 and ammonia loadings in order to assess the
applicability of this design model to potable water NTFs.
2. Materials and methods
2.1. Pilot-plant description
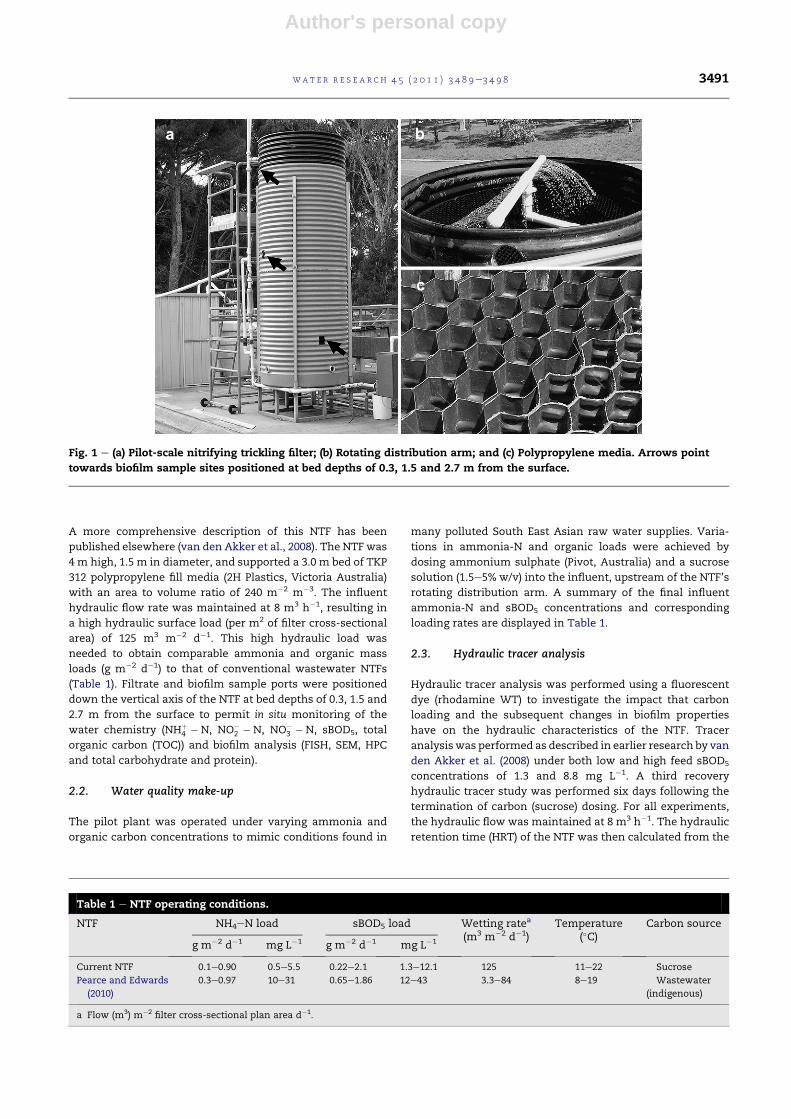
A high flow rate, pilot-scale NTF was constructed at Hope
Valley WTP in South Australia (34�5005400S 138�4101200E) (Fig. 1).
wat e r r e s e a r c h 4 5 ( 2 0 1 1 ) 3 4 8 9e3 4 9 83490
Author's personal copy
A more comprehensive description of this NTF has been
published elsewhere (van den Akker et al., 2008). The NTF was
4 m high, 1.5 m in diameter, and supported a 3.0 m bed of TKP
312 polypropylene fill media (2H Plastics, Victoria Australia)
with an area to volume ratio of 240 m�2 m�3. The influent
hydraulic flow rate was maintained at 8 m3 h�1, resulting in
a high hydraulic surface load (per m2 of filter cross-sectional
area) of 125 m3 m�2 d�1. This high hydraulic load was
needed to obtain comparable ammonia and organic mass
loads (g m�2 d�1) to that of conventional wastewater NTFs
(Table 1). Filtrate and biofilm sample ports were positioned
down the vertical axis of the NTF at bed depths of 0.3, 1.5 and
2.7 m from the surface to permit in situ monitoring of the
water chemistry (NHþ4 �N, NO�
2 �N, NO�3 �N, sBOD5, total
organic carbon (TOC)) and biofilm analysis (FISH, SEM, HPC
and total carbohydrate and protein).
2.2. Water quality make-up
The pilot plant was operated under varying ammonia and
organic carbon concentrations to mimic conditions found in
many polluted South East Asian raw water supplies. Varia-
tions in ammonia-N and organic loads were achieved by
dosing ammonium sulphate (Pivot, Australia) and a sucrose
solution (1.5e5% w/v) into the influent, upstream of the NTF’s
rotating distribution arm. A summary of the final influent
ammonia-N and sBOD5 concentrations and corresponding
loading rates are displayed in Table 1.
2.3. Hydraulic tracer analysis
Hydraulic tracer analysis was performed using a fluorescent
dye (rhodamine WT) to investigate the impact that carbon
loading and the subsequent changes in biofilm properties
have on the hydraulic characteristics of the NTF. Tracer
analysiswas performed as described in earlier research by van
den Akker et al. (2008) under both low and high feed sBOD5
concentrations of 1.3 and 8.8 mg L�1. A third recovery
hydraulic tracer study was performed six days following the
termination of carbon (sucrose) dosing. For all experiments,
the hydraulic flow was maintained at 8 m3 h�1. The hydraulic
retention time (HRT) of the NTF was then calculated from the
Fig. 1 e (a) Pilot-scale nitrifying trickling filter; (b) Rotating distribution arm; and (c) Polypropylene media. Arrows point
towards biofilm sample sites positioned at bed depths of 0.3, 1.5 and 2.7 m from the surface.
Table 1 e NTF operating conditions.
NTF NH4eN load sBOD5 load Wetting ratea
(m3 m�2 d�1)Temperature
(�C)Carbon source
g m�2 d�1 mg L�1 g m�2 d�1 mg L�1
Current NTF 0.1e0.90 0.5e5.5 0.22e2.1 1.3e12.1 125 11e22 Sucrose
Pearce and Edwards
(2010)
0.3e0.97 10e31 0.65e1.86 12e43 3.3e84 8e19 Wastewater
(indigenous)
a Flow (m3) m�2 filter cross-sectional plan area d�1.
wat e r r e s e a r c h 4 5 ( 2 0 1 1 ) 3 4 8 9e3 4 9 8 3491
Author's personal copy
recorded tracer timeeconcentration data as described by
Levenspiel (1999).
2.4. Water sampling and chemical analysis
Influent, effluent and depth profile grab sampling (0.5 L) was
performed, on average two to three times per week, with
samples taken at 10:00 am (�2 h). Influent samples were taken
from directly underneath the NTF’s rotating distribution arm.
Filtrate grab samples were taken down the vertical axis of the
NTF bed by inserting a 2.5 cm diameter polypropylene
collection trough horizontally through the each of the biofilm
sample ports. Depth profile samples were collected sequen-
tially from bottom to top within a short 5 min period. Samples
were stored on ice during transport, andwere analysed within
3 h of collection for: ammoniacal-N; nitrite-N; nitrate-N; TOC
and sBOD5 using procedures described previously by van den
Akker et al. (2008). Influent and effluent DO was measured
online using a dissolved oxygen sensor (Danfoss Evita Oxy
Sensor).
2.5. Scanning electron microscopy and fluorescence insitu hybridisation
SEM and FISH were conducted once steady-state nitrification
performance was attained under the respective operating
conditions using the methods described by van den Akker
et al. (2008). For FISH, we used widely published oligonucle-
otide probes specific for Beta-proteobacterial AOB (Nso1225,
50-CGC CAT TGT ATT ACG TGT GA-30), Nitrobacter. (Nit3, 50-CCT GTG CTC CAT GCT CCG-30; Comp NIT3, 50-CCT GTG CTC
CAG GCT CCG-30), Nitrospira (Ntspa662, 50-GGA ATT CCG CGC
TCC TCT-30; Comp Ntspa662 50-GGA ATT CCG CTC TCC TCT-
30) and members of the domain Bacteria (Eub338, 50-GCT GCC
TCC CGT AGG AGT-30). Probes were synthesised and fluo-
rescently labelled with Cy3 at the 50-end by Geneworks
Australia. NON Eub338 (50-GCT GCC TCC CGT AGG AGT-30)was used as a negative control in all FISH experiments. Probe
hybridisation and wash stringencies were obtained from
ProbeBase: http://www.microbialecology.de/probebase/ (Loy
et al., 2003). A stringent wash step followed which involved
counterstaining slides with 2 mg mL�1 of 40, 6-diamidino-2-
phenylindole (DAPI) in accordance with Abell and Bowman
(2005).
2.6. Total protein and carbohydrate
2.6.1. Biofilm sampling and extractionThe distribution of biomass throughout the NTF was charac-
terised by quantifying total protein and carbohydrate per cm2
of media surface area. Media surface samples (1 cm2) were
taken with cotton swabs from each of the three biofilm
samples sites in triplicate, and transported back to the labo-
ratory in 1 mL of distilled water. Biomass was extracted from
the cotton swabs by sonication (10min, 700W, 35 kHz; Cooper
VisionModel 895, Irvine, CA, USA) followed by vigorous vortex
mixing for 2 min. Samples were centrifuged (Phoenix Orbital,
Model 100) at 5000 rpm for 10 min, and the supernatant was
decanted. The extracted biomass pellet was quantified for
total carbohydrate and protein.
2.6.2. AnalysisThe total protein content of the extracted biomass pellet was
determined using the Bradford method (Bradford, 1976).
Extracted biomass was resuspended in 0.1mL of 0.2 M sodium
hydroxide (total volume 0.1 mL) and incubated at room
temperature for 1 h for cell lysis. Bradford protein reagent
(100 mg L�1 coomassie brilliant blue G-250, 5% v/v ethanol,
10% v/v phosphoric acid; 5 mL) was added to the samples and
vortexed. Absorption at 595 nm was measured after 20 min
(Shimadzu, model UV-1700 spectrophotometer) and protein
quantified using bovine serum albumin as standard. The total
carbohydrate content of the extracted biomass pellet was
determined using the phenol reaction method (Hanson and
Phillips, 1981). Extracted biomass was resuspended in 1.0 mL
of distilled water. 1.0 mL of phenol reagent (5.0 g of reagent
grade phenol, 100 mL of distilled water) was added to the
samples and vortexed. Samples were then digested in 5 mL of
reagent grade concentrated sulphuric acid, vortexed and
incubated at room temperature for 15 min. Absorption at
488 nm was measured (HACH, model 2000 spectrophotom-
eter) and total carbohydrate quantified using glucose as
standard. Results are presented as total mass of carbohydrate
or protein per cm2 of filter media surface area.
2.7. Heterotrophic plate count
Heterotrophic bacteria were enumerated from each of the
three biofilms samples sites using the APHA (1992) spread
plate method 9215A. NTF media surface samples (1 cm2) were
taken with sterile cotton swabs in triplicate, and transported
back to the laboratory in 1.0 mL of sterile peptone dilution
water (0.1% peptone, Oxoid Ltd) for immediate analysis.
Aqueous suspension of biomass were extracted from the
swabs by vortex mixing for 5 min, and serially diluted to 10�2
and 10�3 in sterile peptone water. 100 ml aliquots of the two
dilutions water plated in triplicate on R2A agar plates and
incubated aerobically at 30 �C for 48 h. Results were
enumerated by visually counting individual colonies and are
reported in colony forming units (CFU) per cm2 of media
surface area.
2.8. Evaluation of the Pearce and Edwards (2010)nitrification model
This study evaluated the nitrificationmodel develop by Pearce
and Edwards (2010), which is used for the design and opera-
tion of cross-flow plastic media NTFs (Equation (1)). This
model predicts effluent ammonia-N concentrations in
response to hydraulic loading, temperature, ammonia-N and
BOD5 loading. The goal was to determine whether this model
can be applied to the current potable water NTF, which
operated under influent ammonia concentrations some 10-
fold lower and hydraulic loads that were 2e30 times greater
than the wastewater NTFs studied by Pearce and Edwards (see
Table 1). The Pearce and Edwards model was derived from
operational data arising from a number of filter configura-
tions. One of which was not dissimilar to the pilot plant used
in this study, being a 4.5 m deep filter, which operated with
high recirculation rates giving rise to the higher wetting rates
and lower ammonia-N and BOD5 concentrations.
wat e r r e s e a r c h 4 5 ( 2 0 1 1 ) 3 4 8 9e3 4 9 83492
Author's personal copy
NH4eNEffluent ¼ 20:81� BOD5 load1:03 �NH4eN load1:52 � Iv�0:36
� T�0:12
(1)
Where:
BOD5 load ¼ g BOD5 m�2 media surface area per day
NH4eN load ¼ g NH4eN m�2 media surface area per day
Iv ¼ media irrigation rate specific to media surface area as
L m�2 media surface area per day
T ¼ Filter effluent temperature (�C)
3. Results and discussion
3.1. Effects of organic carbon on NTF performance
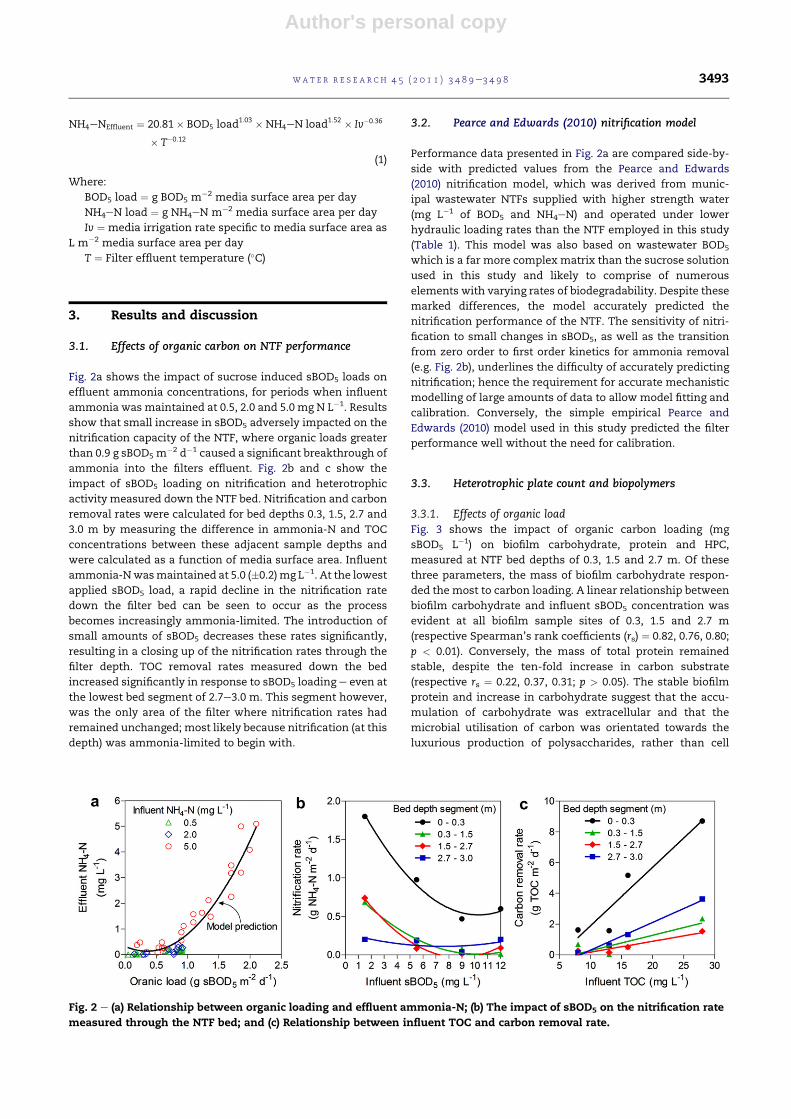
Fig. 2a shows the impact of sucrose induced sBOD5 loads on
effluent ammonia concentrations, for periods when influent
ammonia was maintained at 0.5, 2.0 and 5.0 mg N L�1. Results
show that small increase in sBOD5 adversely impacted on the
nitrification capacity of the NTF, where organic loads greater
than 0.9 g sBOD5 m�2 d�1 caused a significant breakthrough of
ammonia into the filters effluent. Fig. 2b and c show the
impact of sBOD5 loading on nitrification and heterotrophic
activity measured down the NTF bed. Nitrification and carbon
removal rates were calculated for bed depths 0.3, 1.5, 2.7 and
3.0 m by measuring the difference in ammonia-N and TOC
concentrations between these adjacent sample depths and
were calculated as a function of media surface area. Influent
ammonia-Nwasmaintained at 5.0 (�0.2)mg L�1. At the lowest
applied sBOD5 load, a rapid decline in the nitrification rate
down the filter bed can be seen to occur as the process
becomes increasingly ammonia-limited. The introduction of
small amounts of sBOD5 decreases these rates significantly,
resulting in a closing up of the nitrification rates through the
filter depth. TOC removal rates measured down the bed
increased significantly in response to sBOD5 loading e even at
the lowest bed segment of 2.7e3.0 m. This segment however,
was the only area of the filter where nitrification rates had
remained unchanged; most likely because nitrification (at this
depth) was ammonia-limited to begin with.
3.2. Pearce and Edwards (2010) nitrification model
Performance data presented in Fig. 2a are compared side-by-
side with predicted values from the Pearce and Edwards
(2010) nitrification model, which was derived from munic-
ipal wastewater NTFs supplied with higher strength water
(mg L�1 of BOD5 and NH4eN) and operated under lower
hydraulic loading rates than the NTF employed in this study
(Table 1). This model was also based on wastewater BOD5
which is a far more complex matrix than the sucrose solution
used in this study and likely to comprise of numerous
elements with varying rates of biodegradability. Despite these
marked differences, the model accurately predicted the
nitrification performance of the NTF. The sensitivity of nitri-
fication to small changes in sBOD5, as well as the transition
from zero order to first order kinetics for ammonia removal
(e.g. Fig. 2b), underlines the difficulty of accurately predicting
nitrification; hence the requirement for accurate mechanistic
modelling of large amounts of data to allow model fitting and
calibration. Conversely, the simple empirical Pearce and
Edwards (2010) model used in this study predicted the filter
performance well without the need for calibration.
3.3. Heterotrophic plate count and biopolymers
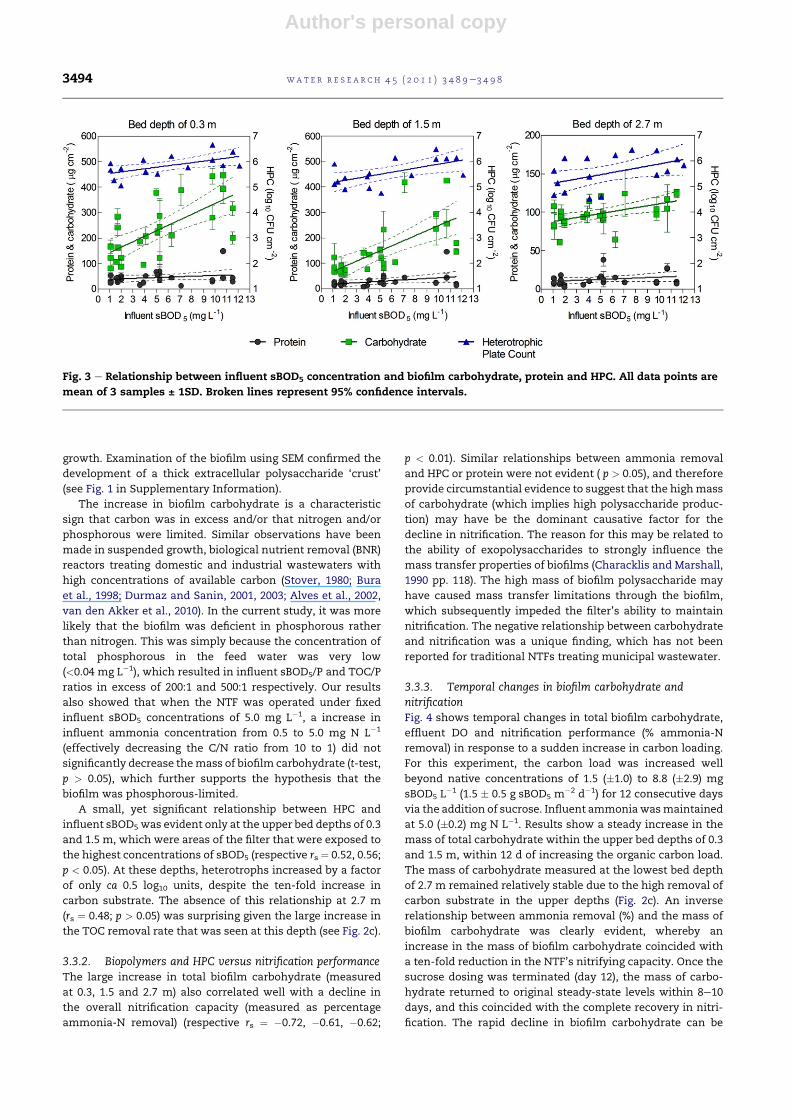
3.3.1. Effects of organic loadFig. 3 shows the impact of organic carbon loading (mg
sBOD5 L�1) on biofilm carbohydrate, protein and HPC,
measured at NTF bed depths of 0.3, 1.5 and 2.7 m. Of these
three parameters, the mass of biofilm carbohydrate respon-
ded the most to carbon loading. A linear relationship between
biofilm carbohydrate and influent sBOD5 concentration was
evident at all biofilm sample sites of 0.3, 1.5 and 2.7 m
(respective Spearman’s rank coefficients (rs) ¼ 0.82, 0.76, 0.80;
p < 0.01). Conversely, the mass of total protein remained
stable, despite the ten-fold increase in carbon substrate
(respective rs ¼ 0.22, 0.37, 0.31; p > 0.05). The stable biofilm
protein and increase in carbohydrate suggest that the accu-
mulation of carbohydrate was extracellular and that the
microbial utilisation of carbon was orientated towards the
luxurious production of polysaccharides, rather than cell
Fig. 2 e (a) Relationship between organic loading and effluent ammonia-N; (b) The impact of sBOD5 on the nitrification rate
measured through the NTF bed; and (c) Relationship between influent TOC and carbon removal rate.
wat e r r e s e a r c h 4 5 ( 2 0 1 1 ) 3 4 8 9e3 4 9 8 3493
Author's personal copy
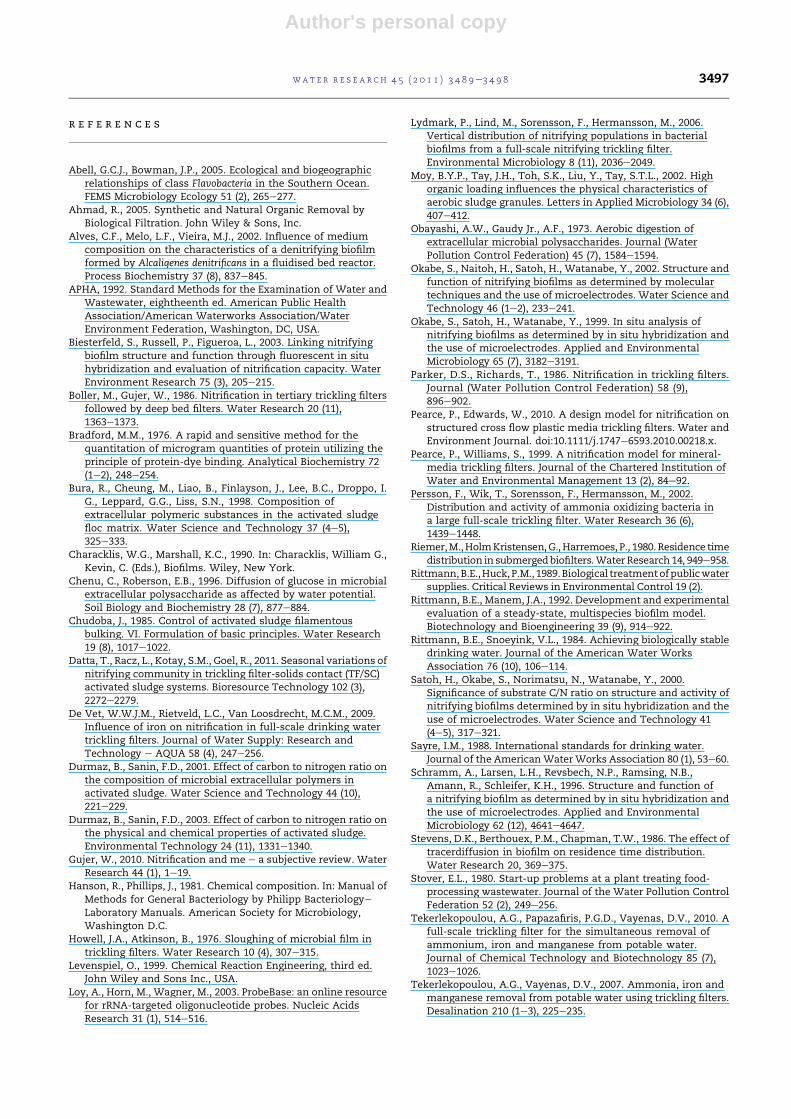
growth. Examination of the biofilm using SEM confirmed the
development of a thick extracellular polysaccharide ‘crust’
(see Fig. 1 in Supplementary Information).
The increase in biofilm carbohydrate is a characteristic
sign that carbon was in excess and/or that nitrogen and/or
phosphorous were limited. Similar observations have been
made in suspended growth, biological nutrient removal (BNR)
reactors treating domestic and industrial wastewaters with
high concentrations of available carbon (Stover, 1980; Bura
et al., 1998; Durmaz and Sanin, 2001, 2003; Alves et al., 2002,
van den Akker et al., 2010). In the current study, it was more
likely that the biofilm was deficient in phosphorous rather
than nitrogen. This was simply because the concentration of
total phosphorous in the feed water was very low
(<0.04 mg L�1), which resulted in influent sBOD5/P and TOC/P
ratios in excess of 200:1 and 500:1 respectively. Our results
also showed that when the NTF was operated under fixed
influent sBOD5 concentrations of 5.0 mg L�1, a increase in
influent ammonia concentration from 0.5 to 5.0 mg N L�1
(effectively decreasing the C/N ratio from 10 to 1) did not
significantly decrease themass of biofilm carbohydrate (t-test,
p > 0.05), which further supports the hypothesis that the
biofilm was phosphorous-limited.
A small, yet significant relationship between HPC and
influent sBOD5 was evident only at the upper bed depths of 0.3
and 1.5 m, which were areas of the filter that were exposed to
the highest concentrations of sBOD5 (respective rs ¼ 0.52, 0.56;
p < 0.05). At these depths, heterotrophs increased by a factor
of only ca 0.5 log10 units, despite the ten-fold increase in
carbon substrate. The absence of this relationship at 2.7 m
(rs ¼ 0.48; p > 0.05) was surprising given the large increase in
the TOC removal rate that was seen at this depth (see Fig. 2c).
3.3.2. Biopolymers and HPC versus nitrification performanceThe large increase in total biofilm carbohydrate (measured
at 0.3, 1.5 and 2.7 m) also correlated well with a decline in
the overall nitrification capacity (measured as percentage
ammonia-N removal) (respective rs ¼ �0.72, �0.61, �0.62;
p < 0.01). Similar relationships between ammonia removal
and HPC or protein were not evident ( p > 0.05), and therefore
provide circumstantial evidence to suggest that the highmass
of carbohydrate (which implies high polysaccharide produc-
tion) may have be the dominant causative factor for the
decline in nitrification. The reason for this may be related to
the ability of exopolysaccharides to strongly influence the
mass transfer properties of biofilms (Characklis and Marshall,
1990 pp. 118). The high mass of biofilm polysaccharide may
have caused mass transfer limitations through the biofilm,
which subsequently impeded the filter’s ability to maintain
nitrification. The negative relationship between carbohydrate
and nitrification was a unique finding, which has not been
reported for traditional NTFs treating municipal wastewater.
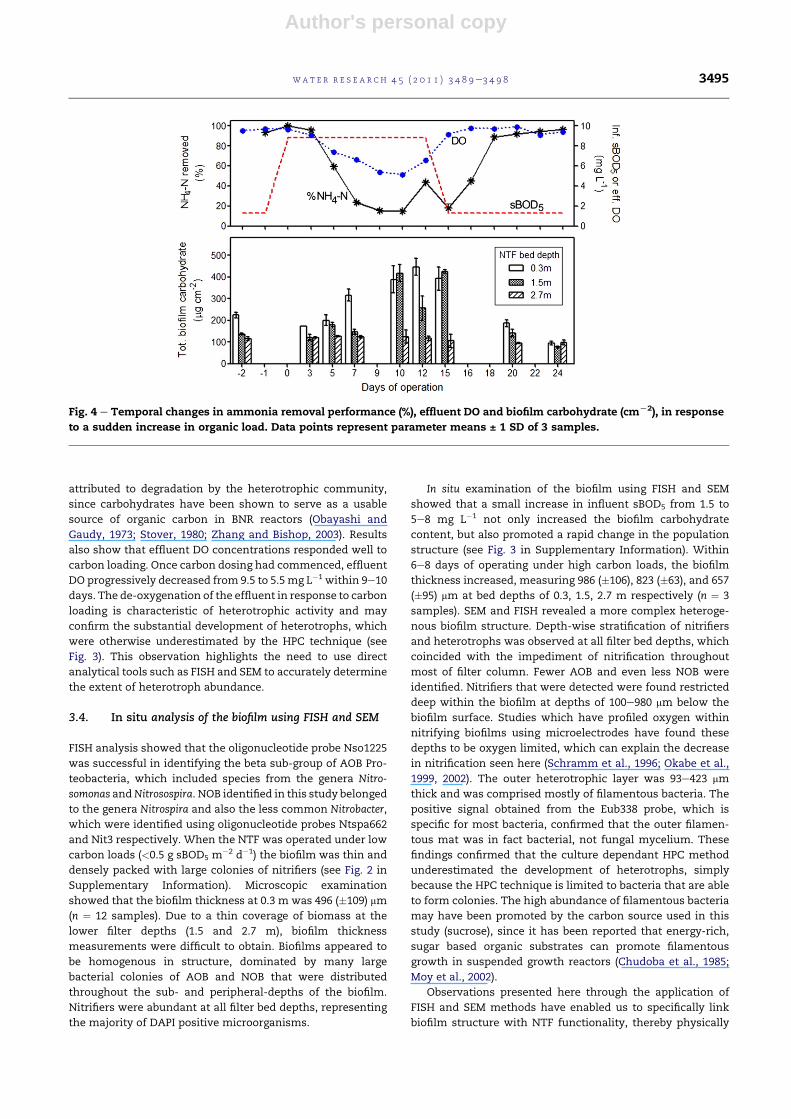
3.3.3. Temporal changes in biofilm carbohydrate andnitrificationFig. 4 shows temporal changes in total biofilm carbohydrate,
effluent DO and nitrification performance (% ammonia-N
removal) in response to a sudden increase in carbon loading.
For this experiment, the carbon load was increased well
beyond native concentrations of 1.5 (�1.0) to 8.8 (�2.9) mg
sBOD5 L�1 (1.5 � 0.5 g sBOD5 m
�2 d�1) for 12 consecutive days
via the addition of sucrose. Influent ammoniawasmaintained
at 5.0 (�0.2) mg N L�1. Results show a steady increase in the
mass of total carbohydrate within the upper bed depths of 0.3
and 1.5 m, within 12 d of increasing the organic carbon load.
The mass of carbohydrate measured at the lowest bed depth
of 2.7 m remained relatively stable due to the high removal of
carbon substrate in the upper depths (Fig. 2c). An inverse
relationship between ammonia removal (%) and the mass of
biofilm carbohydrate was clearly evident, whereby an
increase in the mass of biofilm carbohydrate coincided with
a ten-fold reduction in the NTF’s nitrifying capacity. Once the
sucrose dosing was terminated (day 12), the mass of carbo-
hydrate returned to original steady-state levels within 8e10
days, and this coincided with the complete recovery in nitri-
fication. The rapid decline in biofilm carbohydrate can be
Fig. 3 e Relationship between influent sBOD5 concentration and biofilm carbohydrate, protein and HPC. All data points are
mean of 3 samples ± 1SD. Broken lines represent 95% confidence intervals.
wat e r r e s e a r c h 4 5 ( 2 0 1 1 ) 3 4 8 9e3 4 9 83494
Author's personal copy
attributed to degradation by the heterotrophic community,
since carbohydrates have been shown to serve as a usable
source of organic carbon in BNR reactors (Obayashi and
Gaudy, 1973; Stover, 1980; Zhang and Bishop, 2003). Results
also show that effluent DO concentrations responded well to
carbon loading. Once carbon dosing had commenced, effluent
DO progressively decreased from 9.5 to 5.5mg L�1 within 9e10
days. The de-oxygenation of the effluent in response to carbon
loading is characteristic of heterotrophic activity and may
confirm the substantial development of heterotrophs, which
were otherwise underestimated by the HPC technique (see
Fig. 3). This observation highlights the need to use direct
analytical tools such as FISH and SEM to accurately determine
the extent of heterotroph abundance.
3.4. In situ analysis of the biofilm using FISH and SEM
FISH analysis showed that the oligonucleotide probe Nso1225
was successful in identifying the beta sub-group of AOB Pro-
teobacteria, which included species from the genera Nitro-
somonas andNitrosospira. NOB identified in this study belonged
to the genera Nitrospira and also the less common Nitrobacter,
which were identified using oligonucleotide probes Ntspa662
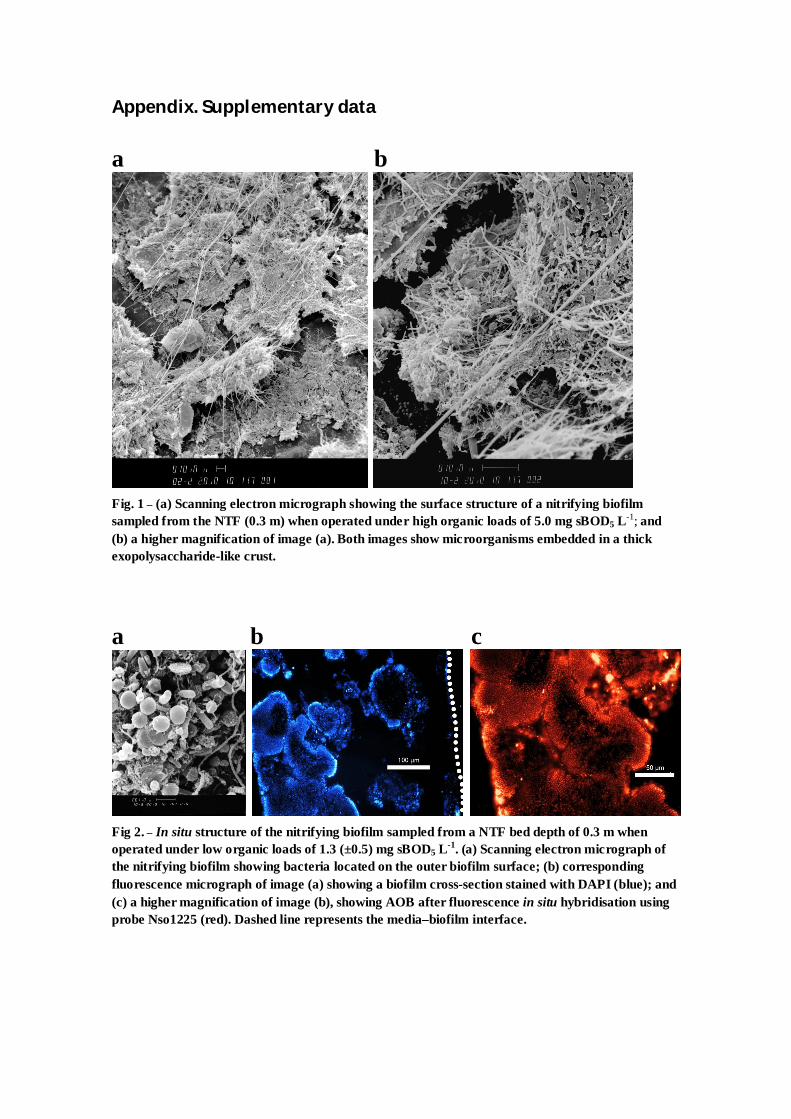
and Nit3 respectively. When the NTF was operated under low
carbon loads (<0.5 g sBOD5 m�2 d�1) the biofilm was thin and
densely packed with large colonies of nitrifiers (see Fig. 2 in
Supplementary Information). Microscopic examination
showed that the biofilm thickness at 0.3 m was 496 (�109) mm
(n ¼ 12 samples). Due to a thin coverage of biomass at the
lower filter depths (1.5 and 2.7 m), biofilm thickness
measurements were difficult to obtain. Biofilms appeared to
be homogenous in structure, dominated by many large
bacterial colonies of AOB and NOB that were distributed
throughout the sub- and peripheral-depths of the biofilm.
Nitrifiers were abundant at all filter bed depths, representing
the majority of DAPI positive microorganisms.
In situ examination of the biofilm using FISH and SEM
showed that a small increase in influent sBOD5 from 1.5 to
5e8 mg L�1 not only increased the biofilm carbohydrate
content, but also promoted a rapid change in the population
structure (see Fig. 3 in Supplementary Information). Within
6e8 days of operating under high carbon loads, the biofilm
thickness increased, measuring 986 (�106), 823 (�63), and 657
(�95) mm at bed depths of 0.3, 1.5, 2.7 m respectively (n ¼ 3
samples). SEM and FISH revealed a more complex heteroge-
nous biofilm structure. Depth-wise stratification of nitrifiers
and heterotrophs was observed at all filter bed depths, which
coincided with the impediment of nitrification throughout
most of filter column. Fewer AOB and even less NOB were
identified. Nitrifiers that were detected were found restricted
deep within the biofilm at depths of 100e980 mm below the
biofilm surface. Studies which have profiled oxygen within
nitrifying biofilms using microelectrodes have found these
depths to be oxygen limited, which can explain the decrease
in nitrification seen here (Schramm et al., 1996; Okabe et al.,
1999, 2002). The outer heterotrophic layer was 93e423 mm
thick and was comprised mostly of filamentous bacteria. The
positive signal obtained from the Eub338 probe, which is
specific for most bacteria, confirmed that the outer filamen-
tous mat was in fact bacterial, not fungal mycelium. These
findings confirmed that the culture dependant HPC method
underestimated the development of heterotrophs, simply
because the HPC technique is limited to bacteria that are able
to form colonies. The high abundance of filamentous bacteria
may have been promoted by the carbon source used in this
study (sucrose), since it has been reported that energy-rich,
sugar based organic substrates can promote filamentous
growth in suspended growth reactors (Chudoba et al., 1985;
Moy et al., 2002).
Observations presented here through the application of
FISH and SEM methods have enabled us to specifically link
biofilm structure with NTF functionality, thereby physically
Fig. 4 e Temporal changes in ammonia removal performance (%), effluent DO and biofilm carbohydrate (cmL2), in response
to a sudden increase in organic load. Data points represent parameter means ± 1 SD of 3 samples.
wat e r r e s e a r c h 4 5 ( 2 0 1 1 ) 3 4 8 9e3 4 9 8 3495
Author's personal copy
verifying what has previously been inferred from many
years of empirical modelling efforts on NTFs (e.g. Parker
and Richards, 1986; Pearce and Williams, 1999; Pearce
and Edwards, 2010) and less comprehensive experiments.
Furthermore, two decades of mathematical modelling work
aimed at understanding microbial competition in mixed
population biofilms has provided a theoretical basis for the
phenomena we have demonstrated here (e.g. Wanner and
Gujer, 1986; Rittmann and Manem, 1992; Gujer, 2010). Hence,
this work effectively bridges the gap between the outcomes of
empirically-based research and the observations inferred
from macroscale physiochemical studies.
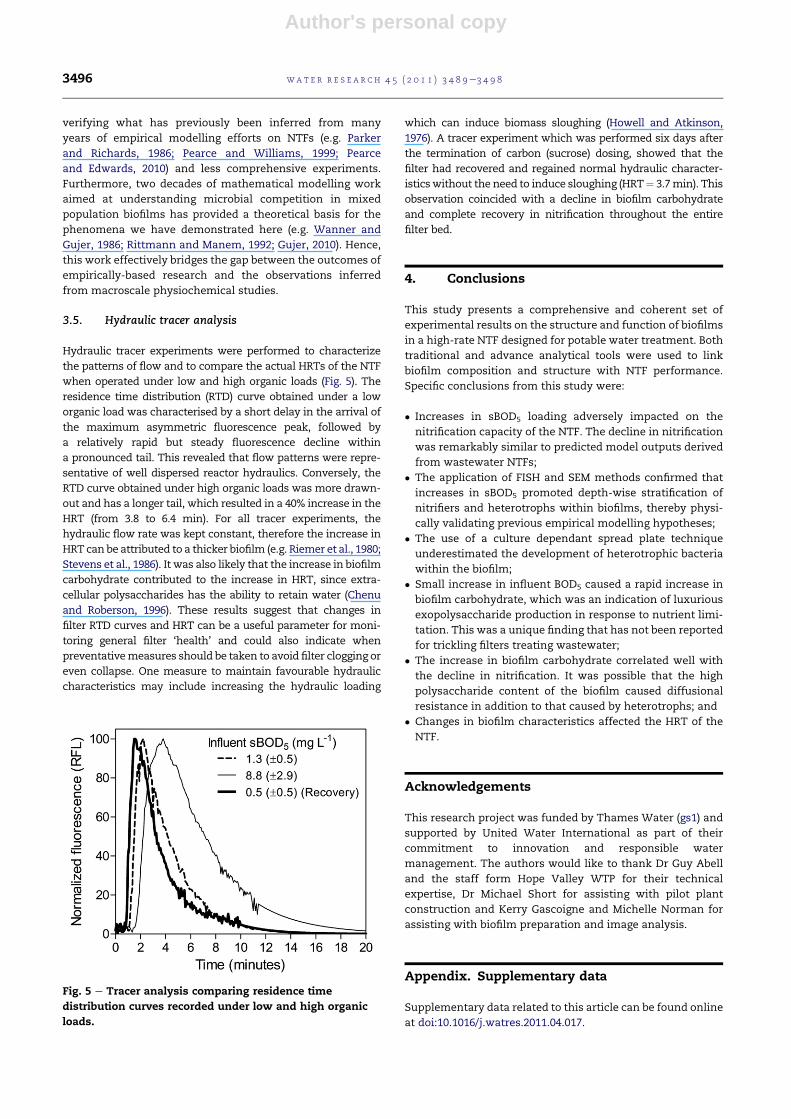
3.5. Hydraulic tracer analysis
Hydraulic tracer experiments were performed to characterize
the patterns of flow and to compare the actual HRTs of the NTF
when operated under low and high organic loads (Fig. 5). The
residence time distribution (RTD) curve obtained under a low
organic load was characterised by a short delay in the arrival of
the maximum asymmetric fluorescence peak, followed by
a relatively rapid but steady fluorescence decline within
a pronounced tail. This revealed that flow patterns were repre-
sentative of well dispersed reactor hydraulics. Conversely, the
RTD curve obtained under high organic loads was more drawn-
out and has a longer tail, which resulted in a 40% increase in the
HRT (from 3.8 to 6.4 min). For all tracer experiments, the
hydraulic flow rate was kept constant, therefore the increase in
HRT can be attributed to a thicker biofilm (e.g. Riemer et al., 1980;
Stevens et al., 1986). It was also likely that the increase in biofilm
carbohydrate contributed to the increase in HRT, since extra-
cellular polysaccharides has the ability to retain water (Chenu
and Roberson, 1996). These results suggest that changes in
filter RTD curves and HRT can be a useful parameter for moni-
toring general filter ‘health’ and could also indicate when
preventativemeasures should be taken to avoid filter clogging or
even collapse. One measure to maintain favourable hydraulic
characteristics may include increasing the hydraulic loading
which can induce biomass sloughing (Howell and Atkinson,
1976). A tracer experiment which was performed six days after
the termination of carbon (sucrose) dosing, showed that the
filter had recovered and regained normal hydraulic character-
isticswithout the need to induce sloughing (HRT¼ 3.7min). This
observation coincided with a decline in biofilm carbohydrate
and complete recovery in nitrification throughout the entire
filter bed.
4. Conclusions
This study presents a comprehensive and coherent set of
experimental results on the structure and function of biofilms
in a high-rate NTF designed for potable water treatment. Both
traditional and advance analytical tools were used to link
biofilm composition and structure with NTF performance.
Specific conclusions from this study were:
� Increases in sBOD5 loading adversely impacted on the
nitrification capacity of the NTF. The decline in nitrification
was remarkably similar to predicted model outputs derived
from wastewater NTFs;
� The application of FISH and SEM methods confirmed that
increases in sBOD5 promoted depth-wise stratification of
nitrifiers and heterotrophs within biofilms, thereby physi-
cally validating previous empirical modelling hypotheses;
� The use of a culture dependant spread plate technique
underestimated the development of heterotrophic bacteria
within the biofilm;
� Small increase in influent BOD5 caused a rapid increase in
biofilm carbohydrate, which was an indication of luxurious
exopolysaccharide production in response to nutrient limi-
tation. This was a unique finding that has not been reported
for trickling filters treating wastewater;
� The increase in biofilm carbohydrate correlated well with
the decline in nitrification. It was possible that the high
polysaccharide content of the biofilm caused diffusional
resistance in addition to that caused by heterotrophs; and
� Changes in biofilm characteristics affected the HRT of the
NTF.
Acknowledgements
This research project was funded by Thames Water (gs1) and
supported by United Water International as part of their
commitment to innovation and responsible water
management. The authors would like to thank Dr Guy Abell
and the staff form Hope Valley WTP for their technical
expertise, Dr Michael Short for assisting with pilot plant
construction and Kerry Gascoigne and Michelle Norman for
assisting with biofilm preparation and image analysis.
Appendix. Supplementary data
Supplementary data related to this article can be found online
at doi:10.1016/j.watres.2011.04.017.
Fig. 5 e Tracer analysis comparing residence time
distribution curves recorded under low and high organic
loads.
wat e r r e s e a r c h 4 5 ( 2 0 1 1 ) 3 4 8 9e3 4 9 83496
Author's personal copy
r e f e r e n c e s
Abell, G.C.J., Bowman, J.P., 2005. Ecological and biogeographicrelationships of class Flavobacteria in the Southern Ocean.FEMS Microbiology Ecology 51 (2), 265e277.
Ahmad, R., 2005. Synthetic and Natural Organic Removal byBiological Filtration. John Wiley & Sons, Inc.
Alves, C.F., Melo, L.F., Vieira, M.J., 2002. Influence of mediumcomposition on the characteristics of a denitrifying biofilmformed by Alcaligenes denitrificans in a fluidised bed reactor.Process Biochemistry 37 (8), 837e845.
APHA, 1992. Standard Methods for the Examination of Water andWastewater, eightheenth ed. American Public HealthAssociation/American Waterworks Association/WaterEnvironment Federation, Washington, DC, USA.
Biesterfeld, S., Russell, P., Figueroa, L., 2003. Linking nitrifyingbiofilm structure and function through fluorescent in situhybridization and evaluation of nitrification capacity. WaterEnvironment Research 75 (3), 205e215.
Boller, M., Gujer, W., 1986. Nitrification in tertiary trickling filtersfollowed by deep bed filters. Water Research 20 (11),1363e1373.
Bradford, M.M., 1976. A rapid and sensitive method for thequantitation of microgram quantities of protein utilizing theprinciple of protein-dye binding. Analytical Biochemistry 72(1e2), 248e254.
Bura, R., Cheung, M., Liao, B., Finlayson, J., Lee, B.C., Droppo, I.G., Leppard, G.G., Liss, S.N., 1998. Composition ofextracellular polymeric substances in the activated sludgefloc matrix. Water Science and Technology 37 (4e5),325e333.
Characklis, W.G., Marshall, K.C., 1990. In: Characklis, William G.,Kevin, C. (Eds.), Biofilms. Wiley, New York.
Chenu, C., Roberson, E.B., 1996. Diffusion of glucose in microbialextracellular polysaccharide as affected by water potential.Soil Biology and Biochemistry 28 (7), 877e884.
Chudoba, J., 1985. Control of activated sludge filamentousbulking. VI. Formulation of basic principles. Water Research19 (8), 1017e1022.
Datta, T., Racz, L., Kotay, S.M., Goel, R., 2011. Seasonal variations ofnitrifying community in trickling filter-solids contact (TF/SC)activated sludge systems. Bioresource Technology 102 (3),2272e2279.
De Vet, W.W.J.M., Rietveld, L.C., Van Loosdrecht, M.C.M., 2009.Influence of iron on nitrification in full-scale drinking watertrickling filters. Journal of Water Supply: Research andTechnology e AQUA 58 (4), 247e256.
Durmaz, B., Sanin, F.D., 2001. Effect of carbon to nitrogen ratio onthe composition of microbial extracellular polymers inactivated sludge. Water Science and Technology 44 (10),221e229.
Durmaz, B., Sanin, F.D., 2003. Effect of carbon to nitrogen ratio onthe physical and chemical properties of activated sludge.Environmental Technology 24 (11), 1331e1340.
Gujer, W., 2010. Nitrification and me e a subjective review. WaterResearch 44 (1), 1e19.
Hanson, R., Phillips, J., 1981. Chemical composition. In: Manual ofMethods for General Bacteriology by Philipp BacteriologyeLaboratory Manuals. American Society for Microbiology,Washington D.C.
Howell, J.A., Atkinson, B., 1976. Sloughing of microbial film intrickling filters. Water Research 10 (4), 307e315.
Levenspiel, O., 1999. Chemical Reaction Engineering, third ed.John Wiley and Sons Inc., USA.
Loy, A., Horn, M., Wagner, M., 2003. ProbeBase: an online resourcefor rRNA-targeted oligonucleotide probes. Nucleic AcidsResearch 31 (1), 514e516.
Lydmark, P., Lind, M., Sorensson, F., Hermansson, M., 2006.Vertical distribution of nitrifying populations in bacterialbiofilms from a full-scale nitrifying trickling filter.Environmental Microbiology 8 (11), 2036e2049.
Moy, B.Y.P., Tay, J.H., Toh, S.K., Liu, Y., Tay, S.T.L., 2002. Highorganic loading influences the physical characteristics ofaerobic sludge granules. Letters in Applied Microbiology 34 (6),407e412.
Obayashi, A.W., Gaudy Jr., A.F., 1973. Aerobic digestion ofextracellular microbial polysaccharides. Journal (WaterPollution Control Federation) 45 (7), 1584e1594.
Okabe, S., Naitoh, H., Satoh, H., Watanabe, Y., 2002. Structure andfunction of nitrifying biofilms as determined by moleculartechniques and the use of microelectrodes. Water Science andTechnology 46 (1e2), 233e241.
Okabe, S., Satoh, H., Watanabe, Y., 1999. In situ analysis ofnitrifying biofilms as determined by in situ hybridization andthe use of microelectrodes. Applied and EnvironmentalMicrobiology 65 (7), 3182e3191.
Parker, D.S., Richards, T., 1986. Nitrification in trickling filters.Journal (Water Pollution Control Federation) 58 (9),896e902.
Pearce, P., Edwards, W., 2010. A design model for nitrification onstructured cross flow plastic media trickling filters. Water andEnvironment Journal. doi:10.1111/j.1747e6593.2010.00218.x.
Pearce, P., Williams, S., 1999. A nitrification model for mineral-media trickling filters. Journal of the Chartered Institution ofWater and Environmental Management 13 (2), 84e92.
Persson, F., Wik, T., Sorensson, F., Hermansson, M., 2002.Distribution and activity of ammonia oxidizing bacteria ina large full-scale trickling filter. Water Research 36 (6),1439e1448.
Riemer,M.,HolmKristensen,G.,Harremoes, P., 1980.Residence timedistribution in submergedbiofilters.Water Research 14, 949e958.
Rittmann,B.E.,Huck,P.M., 1989.Biological treatmentofpublicwatersupplies. Critical Reviews in Environmental Control 19 (2).
Rittmann, B.E., Manem, J.A., 1992. Development and experimentalevaluation of a steady-state, multispecies biofilm model.Biotechnology and Bioengineering 39 (9), 914e922.
Rittmann, B.E., Snoeyink, V.L., 1984. Achieving biologically stabledrinking water. Journal of the American Water WorksAssociation 76 (10), 106e114.
Satoh, H., Okabe, S., Norimatsu, N., Watanabe, Y., 2000.Significance of substrate C/N ratio on structure and activity ofnitrifying biofilms determined by in situ hybridization and theuse of microelectrodes. Water Science and Technology 41(4e5), 317e321.
Sayre, I.M., 1988. International standards for drinking water.Journal of the AmericanWaterWorks Association 80 (1), 53e60.
Schramm, A., Larsen, L.H., Revsbech, N.P., Ramsing, N.B.,Amann, R., Schleifer, K.H., 1996. Structure and function ofa nitrifying biofilm as determined by in situ hybridization andthe use of microelectrodes. Applied and EnvironmentalMicrobiology 62 (12), 4641e4647.
Stevens, D.K., Berthouex, P.M., Chapman, T.W., 1986. The effect oftracerdiffusion in biofilm on residence time distribution.Water Research 20, 369e375.
Stover, E.L., 1980. Start-up problems at a plant treating food-processing wastewater. Journal of the Water Pollution ControlFederation 52 (2), 249e256.
Tekerlekopoulou, A.G., Papazafiris, P.G.D., Vayenas, D.V., 2010. Afull-scale trickling filter for the simultaneous removal ofammonium, iron and manganese from potable water.Journal of Chemical Technology and Biotechnology 85 (7),1023e1026.
Tekerlekopoulou, A.G., Vayenas, D.V., 2007. Ammonia, iron andmanganese removal from potable water using trickling filters.Desalination 210 (1e3), 225e235.
wat e r r e s e a r c h 4 5 ( 2 0 1 1 ) 3 4 8 9e3 4 9 8 3497

Author's personal copy
Tekerlekopoulou, A.G., Vayenas, D.V., 2008. Simultaneousbiological removal of ammonia, iron and manganese frompotable water using a trickling filter. Biochemical EngineeringJournal 39 (1), 215e220.
van den Akker, B., Beard, H., Kaeding, U., Giglio, S., Short, M.D.,2010. Exploring the relationship between viscous bulking andammonia-oxidiser abundance in activated sludge:a comparison of conventional and IFAS systems. WaterResearch 44 (9), 2919e2929.
van den Akker, B., Holmes, M., Cromar, N., Fallowfield, H., 2008.Application of high rate nitrifying trickling filters for potablewater treatment. Water Research 42 (17), 4514e4524.
Wanner, O., Gujer, W., 1986. Multispecies biofilm model.Biotechnology and Bioengineering 28 (3), 314e328.
Zhang, T.C., Fu, Y.C., Bishop, P.L., 1994. Competition in biofilms.Water Science and Technology 29 (10e11), 263e270.
Zhang, X., Bishop, P.L., 2003. Biodegradability of biofilmextracellular polymeric substances. Chemosphere 50 (1), 63e69.
wat e r r e s e a r c h 4 5 ( 2 0 1 1 ) 3 4 8 9e3 4 9 83498
Appendix. Supplementary data a b
Fig. 1 – (a) Scanning electron micrograph showing the surface structure of a nitrifying biofilm sampled from the NTF (0.3 m) when operated under high organic loads of 5.0 mg sBOD5 L-1; and (b) a higher magnification of image (a). Both images show microorganisms embedded in a thick exopolysaccharide-like crust.
a b c
Fig 2. – In situ structure of the nitrifying biofilm sampled from a NTF bed depth of 0.3 m when operated under low organic loads of 1.3 (±0.5) mg sBOD5 L-1. (a) Scanning electron micrograph of the nitrifying biofilm showing bacteria located on the outer biofilm surface; (b) corresponding fluorescence micrograph of image (a) showing a biofilm cross-section stained with DAPI (blue); and (c) a higher magnification of image (b), showing AOB after fluorescence in situ hybridisation using probe Nso1225 (red). Dashed line represents the media–biofilm interface.
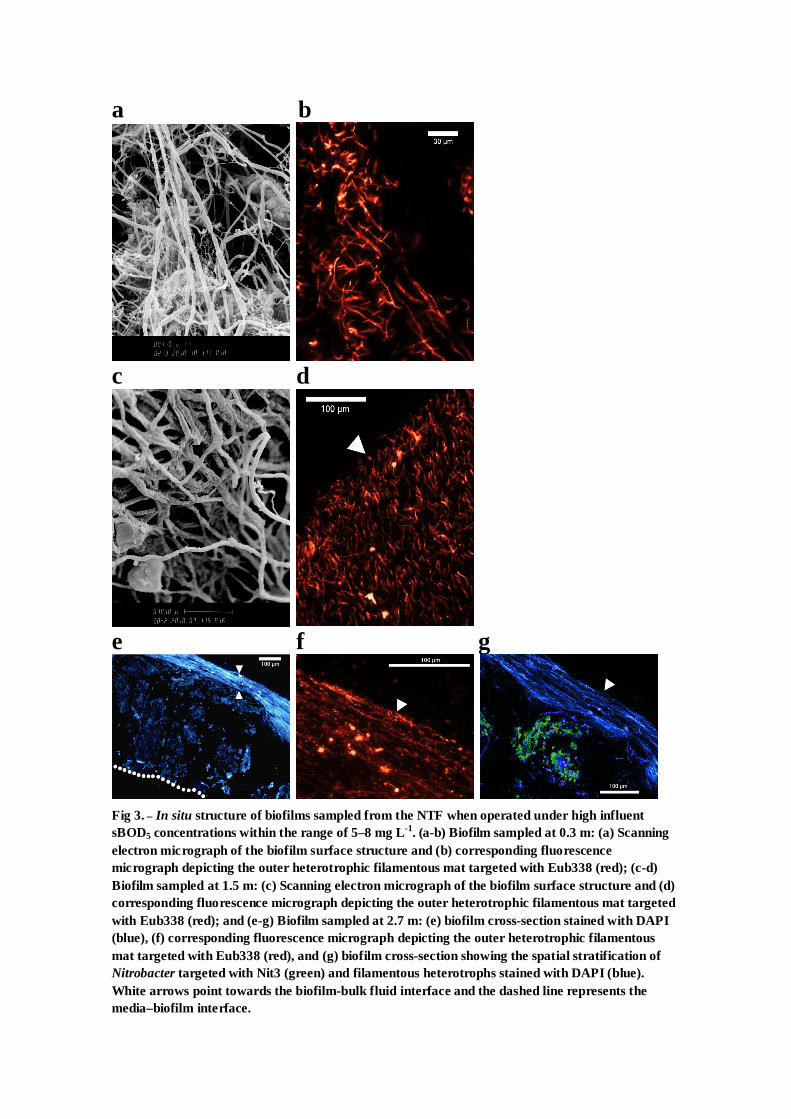
a b
c d
e f g
Fig 3. – In situ structure of biofilms sampled from the NTF when operated under high influent sBOD5 concentrations within the range of 5–8 mg L-1. (a-b) Biofilm sampled at 0.3 m: (a) Scanning electron micrograph of the biofilm surface structure and (b) corresponding fluorescence micrograph depicting the outer heterotrophic filamentous mat targeted with Eub338 (red); (c-d) Biofilm sampled at 1.5 m: (c) Scanning electron micrograph of the biofilm surface structure and (d) corresponding fluorescence micrograph depicting the outer heterotrophic filamentous mat targeted with Eub338 (red); and (e-g) Biofilm sampled at 2.7 m: (e) biofilm cross-section stained with DAPI (blue), (f) corresponding fluorescence micrograph depicting the outer heterotrophic filamentous mat targeted with Eub338 (red), and (g) biofilm cross-section showing the spatial stratification of Nitrobacter targeted with Nit3 (green) and filamentous heterotrophs stained with DAPI (blue). White arrows point towards the biofilm-bulk fluid interface and the dashed line represents the media–biofilm interface.