Hydrogenotrophic denitrification of potable water
18
Journal of Hazardous Materials 180 (2010) 20–37 Contents lists available at ScienceDirect Journal of Hazardous Materials journal homepage: www.elsevier.com/locate/jhazmat Review Hydrogenotrophic denitrification of potable water: A review K.A. Karanasios a , I.A. Vasiliadou a , S. Pavlou b,c , D.V. Vayenas a,∗ a Department of Environmental and Natural Resources Management, University of Ioannina, Seferi 2, 30100 Agrinio, Greece b Department of Chemical Engineering, University of Patras, 26504 Patras, Greece c Institute of Chemical Engineering and High Temperature Chemical Processes, 26504, Patras, Greece article info Article history: Received 6 March 2010 Received in revised form 19 April 2010 Accepted 20 April 2010 Available online 28 April 2010 Keywords: Hydrogenotrophic denitrification Potable water Hydrogen delivery Modeling Reactor type abstract Several approaches of hydrogenotrophic denitrification of potable water as well as technical data and mathematical models that were developed for the process are reviewed. Most of the applications that were tested for hydrogenotrophic process achieved great efficiency, high denitrification rates, and oper- ational simplicity. Moreover, this paper reviews the variety of reactor configurations that have been used for hydrogen gas generation and efficient hydrogen delivery. Microbial communities and species that participate in the denitrification process are also reported. The variation of nitrate concentration, pH, temperature, alkalinity, carbon and microbial acclimation was found to affect the denitrification rates. The main results regarding research progress on hydrogenotrophic denitrification are evaluated. Finally, the commonly used models and simulation approaches are discussed. © 2010 Elsevier B.V. All rights reserved. Contents 1. Introduction .......................................................................................................................................... 21 2. Nitrate in water resources ........................................................................................................................... 22 2.1. Sources of nitrates ............................................................................................................................ 22 2.2. Harmful effects of nitrates ................................................................................................................... 22 3. Nitrate removal methods ............................................................................................................................ 22 3.1. Physicochemical methods .................................................................................................................... 22 3.2. Biological denitrification ..................................................................................................................... 22 3.3. Autotrophic vs. heterotrophic denitrification ................................................................................................ 23 4. Hydrogenotrophic denitrification ................................................................................................................... 23 4.1. Microbiology .................................................................................................................................. 23 4.2. Stoichiometry ................................................................................................................................. 23 4.3. Factors controlling denitrification ........................................................................................................... 24 4.3.1. Nitrate concentration ............................................................................................................... 24 4.3.2. pH ................................................................................................................................... 24 4.3.3. Temperature ........................................................................................................................ 25 4.3.4. Hardness – alkalinity ............................................................................................................... 25 4.3.5. Oxidation–reduction potential ..................................................................................................... 25 4.4. Hydrogen concentration ..................................................................................................................... 25 4.5. Carbon source ................................................................................................................................ 25 5. Trialed reactor technologies ......................................................................................................................... 26 5.1. Fixed-bed reactors ............................................................................................................................ 26 5.2. Fluidized-bed reactors ........................................................................................................................ 27 5.3. Membrane biofilm reactors .................................................................................................................. 27 5.4. Bio-electrochemical denitrification .......................................................................................................... 30 5.5. Effluent water quality ........................................................................................................................ 30 ∗ Corresponding author. Tel.: +30 26410 74117; fax: +30 26410 74176. E-mail address: [email protected] (D.V. Vayenas). 0304-3894/$ – see front matter © 2010 Elsevier B.V. All rights reserved. doi:10.1016/j.jhazmat.2010.04.090
-
Upload
independent -
Category
Documents
-
view
5 -
download
0
Transcript of Hydrogenotrophic denitrification of potable water

R
H
Ka
b
c
a
ARRAA
KHPHMR
C
0d
Journal of Hazardous Materials 180 (2010) 20–37
Contents lists available at ScienceDirect
Journal of Hazardous Materials
journa l homepage: www.e lsev ier .com/ locate / jhazmat
eview
ydrogenotrophic denitrification of potable water: A review
.A. Karanasiosa, I.A. Vasiliadoua, S. Pavloub,c, D.V. Vayenasa,∗
Department of Environmental and Natural Resources Management, University of Ioannina, Seferi 2, 30100 Agrinio, GreeceDepartment of Chemical Engineering, University of Patras, 26504 Patras, GreeceInstitute of Chemical Engineering and High Temperature Chemical Processes, 26504, Patras, Greece
r t i c l e i n f o
rticle history:eceived 6 March 2010eceived in revised form 19 April 2010ccepted 20 April 2010
a b s t r a c t
Several approaches of hydrogenotrophic denitrification of potable water as well as technical data andmathematical models that were developed for the process are reviewed. Most of the applications thatwere tested for hydrogenotrophic process achieved great efficiency, high denitrification rates, and oper-ational simplicity. Moreover, this paper reviews the variety of reactor configurations that have been used
vailable online 28 April 2010
eywords:ydrogenotrophic denitrificationotable waterydrogen delivery
for hydrogen gas generation and efficient hydrogen delivery. Microbial communities and species thatparticipate in the denitrification process are also reported. The variation of nitrate concentration, pH,temperature, alkalinity, carbon and microbial acclimation was found to affect the denitrification rates.The main results regarding research progress on hydrogenotrophic denitrification are evaluated. Finally,the commonly used models and simulation approaches are discussed.
odelingeactor type
© 2010 Elsevier B.V. All rights reserved.
ontents
1. Introduction . . . . . . . . . . . . . . . . . . . . . . . . . . . . . . . . . . . . . . . . . . . . . . . . . . . . . . . . . . . . . . . . . . . . . . . . . . . . . . . . . . . . . . . . . . . . . . . . . . . . . . . . . . . . . . . . . . . . . . . . . . . . . . . . . . . . . . . . . . 212. Nitrate in water resources . . . . . . . . . . . . . . . . . . . . . . . . . . . . . . . . . . . . . . . . . . . . . . . . . . . . . . . . . . . . . . . . . . . . . . . . . . . . . . . . . . . . . . . . . . . . . . . . . . . . . . . . . . . . . . . . . . . . . . . . . . . 22
2.1. Sources of nitrates . . . . . . . . . . . . . . . . . . . . . . . . . . . . . . . . . . . . . . . . . . . . . . . . . . . . . . . . . . . . . . . . . . . . . . . . . . . . . . . . . . . . . . . . . . . . . . . . . . . . . . . . . . . . . . . . . . . . . . . . . . . . 222.2. Harmful effects of nitrates . . . . . . . . . . . . . . . . . . . . . . . . . . . . . . . . . . . . . . . . . . . . . . . . . . . . . . . . . . . . . . . . . . . . . . . . . . . . . . . . . . . . . . . . . . . . . . . . . . . . . . . . . . . . . . . . . . . 22
3. Nitrate removal methods . . . . . . . . . . . . . . . . . . . . . . . . . . . . . . . . . . . . . . . . . . . . . . . . . . . . . . . . . . . . . . . . . . . . . . . . . . . . . . . . . . . . . . . . . . . . . . . . . . . . . . . . . . . . . . . . . . . . . . . . . . . . 223.1. Physicochemical methods . . . . . . . . . . . . . . . . . . . . . . . . . . . . . . . . . . . . . . . . . . . . . . . . . . . . . . . . . . . . . . . . . . . . . . . . . . . . . . . . . . . . . . . . . . . . . . . . . . . . . . . . . . . . . . . . . . . . 223.2. Biological denitrification . . . . . . . . . . . . . . . . . . . . . . . . . . . . . . . . . . . . . . . . . . . . . . . . . . . . . . . . . . . . . . . . . . . . . . . . . . . . . . . . . . . . . . . . . . . . . . . . . . . . . . . . . . . . . . . . . . . . . 223.3. Autotrophic vs. heterotrophic denitrification . . . . . . . . . . . . . . . . . . . . . . . . . . . . . . . . . . . . . . . . . . . . . . . . . . . . . . . . . . . . . . . . . . . . . . . . . . . . . . . . . . . . . . . . . . . . . . . . 23
4. Hydrogenotrophic denitrification . . . . . . . . . . . . . . . . . . . . . . . . . . . . . . . . . . . . . . . . . . . . . . . . . . . . . . . . . . . . . . . . . . . . . . . . . . . . . . . . . . . . . . . . . . . . . . . . . . . . . . . . . . . . . . . . . . . 234.1. Microbiology. . . . . . . . . . . . . . . . . . . . . . . . . . . . . . . . . . . . . . . . . . . . . . . . . . . . . . . . . . . . . . . . . . . . . . . . . . . . . . . . . . . . . . . . . . . . . . . . . . . . . . . . . . . . . . . . . . . . . . . . . . . . . . . . . . 234.2. Stoichiometry. . . . . . . . . . . . . . . . . . . . . . . . . . . . . . . . . . . . . . . . . . . . . . . . . . . . . . . . . . . . . . . . . . . . . . . . . . . . . . . . . . . . . . . . . . . . . . . . . . . . . . . . . . . . . . . . . . . . . . . . . . . . . . . . . 234.3. Factors controlling denitrification . . . . . . . . . . . . . . . . . . . . . . . . . . . . . . . . . . . . . . . . . . . . . . . . . . . . . . . . . . . . . . . . . . . . . . . . . . . . . . . . . . . . . . . . . . . . . . . . . . . . . . . . . . . 24
4.3.1. Nitrate concentration . . . . . . . . . . . . . . . . . . . . . . . . . . . . . . . . . . . . . . . . . . . . . . . . . . . . . . . . . . . . . . . . . . . . . . . . . . . . . . . . . . . . . . . . . . . . . . . . . . . . . . . . . . . . . . . 244.3.2. pH . . . . . . . . . . . . . . . . . . . . . . . . . . . . . . . . . . . . . . . . . . . . . . . . . . . . . . . . . . . . . . . . . . . . . . . . . . . . . . . . . . . . . . . . . . . . . . . . . . . . . . . . . . . . . . . . . . . . . . . . . . . . . . . . . . . 244.3.3. Temperature . . . . . . . . . . . . . . . . . . . . . . . . . . . . . . . . . . . . . . . . . . . . . . . . . . . . . . . . . . . . . . . . . . . . . . . . . . . . . . . . . . . . . . . . . . . . . . . . . . . . . . . . . . . . . . . . . . . . . . . . 254.3.4. Hardness – alkalinity . . . . . . . . . . . . . . . . . . . . . . . . . . . . . . . . . . . . . . . . . . . . . . . . . . . . . . . . . . . . . . . . . . . . . . . . . . . . . . . . . . . . . . . . . . . . . . . . . . . . . . . . . . . . . . . 254.3.5. Oxidation–reduction potential . . . . . . . . . . . . . . . . . . . . . . . . . . . . . . . . . . . . . . . . . . . . . . . . . . . . . . . . . . . . . . . . . . . . . . . . . . . . . . . . . . . . . . . . . . . . . . . . . . . . . 25
4.4. Hydrogen concentration . . . . . . . . . . . . . . . . . . . . . . . . . . . . . . . . . . . . . . . . . . . . . . . . . . . . . . . . . . . . . . . . . . . . . . . . . . . . . . . . . . . . . . . . . . . . . . . . . . . . . . . . . . . . . . . . . . . . . 254.5. Carbon source . . . . . . . . . . . . . . . . . . . . . . . . . . . . . . . . . . . . . . . . . . . . . . . . . . . . . . . . . . . . . . . . . . . . . . . . . . . . . . . . . . . . . . . . . . . . . . . . . . . . . . . . . . . . . . . . . . . . . . . . . . . . . . . . 25
5. Trialed reactor technologies . . . . . . . . . . . . . . . . . . . . . . . . . . . . . . . . . . . . . . . . . . . . . . . . . . . . . . . . . . . . . . . . . . . . . . . . . . . . . . . . . . . . . . . . . . . . . . . . . . . . . . . . . . . . . . . . . . . . . . . . . 265.1. Fixed-bed reactors . . . . . . . . . . . . . . . . . . . . . . . . . . . . . . . . . . . . . . . . . . . . . . . . . . . . . . . . . . . . . . . . . . . . . . . . . . . . . . . . . . . . . . . . . . . . . . . . . . . . . . . . . . . . . . . . . . . . . . . . . . . . 26
5.2. Fluidized-bed reactors. . . . . . . . . . . . . . . . . . . . . . . . . . . . . . . . . . . . . . . . . . . . . .5.3. Membrane biofilm reactors . . . . . . . . . . . . . . . . . . . . . . . . . . . . . . . . . . . . . . . . .5.4. Bio-electrochemical denitrification . . . . . . . . . . . . . . . . . . . . . . . . . . . . . . . .5.5. Effluent water quality . . . . . . . . . . . . . . . . . . . . . . . . . . . . . . . . . . . . . . . . . . . . . .∗ Corresponding author. Tel.: +30 26410 74117; fax: +30 26410 74176.E-mail address: [email protected] (D.V. Vayenas).
304-3894/$ – see front matter © 2010 Elsevier B.V. All rights reserved.oi:10.1016/j.jhazmat.2010.04.090
. . . . . . . . . . . . . . . . . . . . . . . . . . . . . . . . . . . . . . . . . . . . . . . . . . . . . . . . . . . . . . . . . . . . . . . . . . 27. . . . . . . . . . . . . . . . . . . . . . . . . . . . . . . . . . . . . . . . . . . . . . . . . . . . . . . . . . . . . . . . . . . . . . . . . 27
. . . . . . . . . . . . . . . . . . . . . . . . . . . . . . . . . . . . . . . . . . . . . . . . . . . . . . . . . . . . . . . . . . . . . . . . . . 30
. . . . . . . . . . . . . . . . . . . . . . . . . . . . . . . . . . . . . . . . . . . . . . . . . . . . . . . . . . . . . . . . . . . . . . . . . . 30

K.A. Karanasios et al. / Journal of Hazardous Materials 180 (2010) 20–37 21
5.6. Industrial scale applications . . . . . . . . . . . . . . . . . . . . . . . . . . . . . . . . . . . . . . . . . . . . . . . . . . . . . . . . . . . . . . . . . . . . . . . . . . . . . . . . . . . . . . . . . . . . . . . . . . . . . . . . . . . . . . . . . . 306. Denitrification kinetic models . . . . . . . . . . . . . . . . . . . . . . . . . . . . . . . . . . . . . . . . . . . . . . . . . . . . . . . . . . . . . . . . . . . . . . . . . . . . . . . . . . . . . . . . . . . . . . . . . . . . . . . . . . . . . . . . . . . . . . . 327. Conclusions . . . . . . . . . . . . . . . . . . . . . . . . . . . . . . . . . . . . . . . . . . . . . . . . . . . . . . . . . . . . . . . . . . . . . . . . . . . . . . . . . . . . . . . . . . . . . . . . . . . . . . . . . . . . . . . . . . . . . . . . . . . . . . . . . . . . . . . . . . 34
. . . . . . . . . . . . . . . . . . . . . . . . . . . . . . . . . . . . . . . . . . . . . . . . . . . . . . . . . . . . . . . . . . . . . . . . . . . . . . . 35
1
gthfscv
noIuAab
hatoatcbpue
p[el
apttamiw
halcImmtHhmt
f
Nomenclature
ac specific area of the cathode (cm2/l)CHNO3 nitric acid concentration (mg/l)CNO3 nitrate nitrogen concentration (mg/l)CNO2 nitrite nitrogen concentration (mg/l)CH2 hydrogen concentration (mg/l)CCO2 carbon dioxide concentration (mg/l)CNO3
−f molar concentration of nitrate (mol/l)CNO2
−f molar concentration of nitrite (mol/l)
D diffusion coefficient (cm2/h)FNO3 switching function formulated: the observation that
growth on nitrite occurs only at low NO3 concentra-tions (mg/l)
F Faraday’s constant (C/mg)JNO3
− reduction nitrate rate (mg/cm2 h)
JNO2-P production rate of nitrite (mg/cm2 h)
JNO2-R reduction rate of nitrite (mg/cm2 h)
k maximum specific denitrification rate (mg/gVSS d)kd decay rate constant (1/h)kd1 constant in growth rate expression (mg NO2
−–N/mgNO3
−–N)kd2 constant in growth rate expression (mg NO3
−–N/mgNO2
−–N)KH2I hydrogen saturation constant for nitrate (mg/l)KH2II hydrogen saturation constant for nitrite (mg/l)Ki nitrate inhibition constant (mg N/l)Km nitrite inhibition constant (mg N/l)KNH2 hydrogen saturation constant for nitrite (mg/l)KNCO2 carbon dioxide saturation constant for nitrite (mg/l)kNO3 specific NO3 reduction rate (g N/gVSS d)kNO2 specific NO2 reduction rate (g N/gVSS d)KNO3 saturation constant for nitrate (mg N/l)KNO2 saturation constant for nitrite (mg N/l)KSH2 hydrogen saturation constant for nitrate (mg/l)KSCO2 carbon dioxide saturation constant for nitrate (mg/l)mNO3 specific maintenance rate (mg
NO3−–N/h mg biomass)
mNO2 specific maintenance rate (mgNO2
−–N/h mg biomass)n stoichiometric ratio of hydrogen utilization to
nitrate utilization (mg/mg)p potential (V)R universal gas constant (J/K/mg)rI nitrate reaction rate (mg N/l h)rII nitrite reaction rate (mg N/l h)RNO3 biological nitrate utilization rate (mg/l d)RH2 biological hydrogen utilization rate (mg/l d)T absolute temperature (K)umI maximum nitrate rate constant (mg N/l h)umII maximum nitrite rate constant (mg N/l h)VSS Volatile suspended solids concentration (mg/l)X cell mass concentration (mg/l)
References . . . . . . . . . . . . . . . . . . . . . . . . . . . . . . . . . . . . . . . . . . . . . . . . . . . . . . . . . . . .
. Introduction
Worldwide an increase of nitrate concentrations observed inroundwater, as a result of the use of fertilizers, and the indus-rial wastewater, raises concerns due to the severe impacts onuman health [1]. Research is carried out towards nitrate removal
rom water resources, whereas the most promising approach beingtudied is biological denitrification. Biological denitrification isonsidered to be the most economical strategy among other con-entional techniques like physicochemical.
Denitrification is the respiratory process in which bacteria useitrates or nitrites as terminal electron acceptors, while reductionf nitrates from contaminated water to nitrogen gas can occur [2].n heterotrophic denitrification, organic carbon compounds can besed by denitrifiers as a source of biosynthetic carbon and electrons.utotrophic denitrifiers utilize reduced inorganic compounds, suchs sulfur, iron and hydrogen as electron sources and inorganic car-on for biosynthesis [3].
There is a considerable ongoing effort focused onydrogenotrophic denitrification of drinking water, since it ispromising clean method with high efficiency. The main advan-
age of denitrification by hydrogen oxidation bacteria is the usef hydrogen gas as electron donor, which is harmless to humansnd the inorganic carbon sources for substrate of bacteria whichhereby removes any problems that are caused by residual organicarbon [4]. In addition, the growth rate of autotrophic denitrifyingacteria ensures low biomass build-up and limited operatingroblems. Thus, hydrogenotrophic bacteria have been successfullysed for drinking water nitrate elimination to acceptable levelsither in pure [4–7] or in mixed-cultures [8–15].
Hydrogenotrophic denitrification has been studied using sus-ended growth [16,17], fixed-bed [10,15,18] and fluidized-bed4,8] reactors. Such experimental investigations suggest that greatfficiencies with high denitrification rates can be established forong operating periods.
Operating conditions like the feed nitrate concentration [19,20]nd the volumetric flow rate [21,22] appear to affect the processerformance. Moreover, in an attempt to elucidate the factors con-rolling denitrification specified experiments have been conductedo assess the influence of hydrogen concentration [4,23], nutrientvailability [6], pH [24,25], temperature [8,16] and microbial accli-ation [26]. The variation of the oxidation–reduction potential and
ts effect on the denitrifying activity has been evaluated [14,27], asell.
An improved understanding of the factors controlling efficientydrogen delivery is also important in the design of the in situpplication of hydrogenotrophic denitrification, considering theow solubility of hydrogen gas and its possible accumulation in alosed head space, thus creating an explosive environment [28].n such cases, investigators focus their attention on gas-permeable
embranes [29,30] as microporous membranes [28], hollow-fiberembranes [5,14] and silicon tubes [31,32] in which gas mass
ransfer is successfully achieved and almost complete utilization of2 is possible. Finally, bio-electrochemical reactors (BER) in which
ydrogen gas is produced by electrolysis of water has been experi-entally investigated in an effort to minimize the cost of supplyinghe electron donor and the H2 gas waste in the effluent [12,33–35].Although, considerable effort has been made to improve designs
or the efficient and economical removal of nitrate from water
Xe effluent cell mass concentration (mg/l)

22 K.A. Karanasios et al. / Journal of Hazard
yNO3 growth yield coefficient on nitrate (mg biomass/mgNO3
−–N)yNO2 growth yield coefficient on nitrite (mg biomass/mg
NO2−–N)
z biofilm thikness (cm)Z charge number of ionic constituent (−)
Greek letters� hydraulic retention time (h)�
(CNO3
)specific growth rate on nitrate (1/h)
�(
CNO2
)specific growth rate on nitrite (1/h)
�max NO3 maximum specific growth rate on nitrate (1/h)
bt[nbmaso
hiaweemd
2
cwp1rP
2
wwlpea
rtpmfr
d
the use of microbial cultures biological denitrification is considered
�max NO2 maximum specific growth rate on nitrite (1/h)� biofilm porosity
y hydrogenotrophic denitrification [10,13,36–38], only few ofhe reported studies in the literature, use biological kinetic data15–17,39,40] to facilitate the design and operation of biologicalitrogen removal plants. Thus, the kinetics of this process has noteen systematically investigated. Nevertheless, appropriate kineticodels have been developed for the dynamic characteristics of pure
nd mixed-cultures, such as zero order kinetic models [16], first orecond order reactions [40], double Monod forms [8,39] and modelsf substitutable substrates [15,17].
The purpose of this paper is to critically review theydrogenotrophic denitrification applications for nitrate elim-
nation from polluted water. We summarized the traditionalpproaches and recent developments. The factors and mechanismshich influence the nitrate removal, the denitrification rate and the
fficiency of the hydrogen-oxidizing populations are also reportedxtensively. The main equations and principles considered inathematical models applied for describing the hydrogenotrophic
enitrification process are presented.
. Nitrate in water resources
Nitrate contamination of drinking water resources is a majoroncern, as it constitutes a threat to human health [2]. The potableater standard for nitrate recommended by the Council of Euro-ean Communities [41] and the World Health Organization [42] is1.3 mg NO3
−–N/l, while for nitrite is 0.03 and 0.91 mg NO2−–N/l,
espectively. The standard set by the United States Environmentalrotection Agency [43] is the 10 mg NO3
−–N/l and 1 mg NO2−–N/l.
.1. Sources of nitrates
The increasingly growing of agricultural activities all over theorld, make the use of fertilizers the main nitrate source of pollutedater [34] and as a result about 22% of groundwater in agricultural
and in Europe contains nitrate concentrations above the maximumermitted level [44]. Discharge from septic tanks and leaking sew-rs, atmospheric deposition and the spreading of sewage sludgend manure to land can all contribute, as well [45].
Contaminated land, such as abandoned industrial sites, areesponsible for a significant amount of nitrogen in groundwa-er [45]. Nitrogen compounds are used extensively in industrialrocesses, like plastic treatment, household cleaning and phar-
aceutical industry [46]. Industrial wastewaters from explosives,ertilizer [47], cellophane, and metals finishing industries [48] areeported to contain more than 1000 mg NO3
−–N/l [2,48].The emission of nitrogen to the atmosphere can be in its oxi-
ized or reduced forms. These forms can be later carried in storm
ous Materials 180 (2010) 20–37
water and deposited resulting to groundwater pollution, howeverthis nitrogen concentration is low and its contribution is negligible[45].
2.2. Harmful effects of nitrates
Nitrite nitrogen (NO2−–N) is known to be toxic for aquatic life
[49], like for fish, benthic fauna, plants, and bacterioplankton [50].A nitrate compound is not considered by itself a threat for animalsor humans; however it can be converted to nitrite in the gastroin-testinal tract. The nitrite reacts with the hemoglobin in blood andthus oxygen transfer to cells is inhibited. This phenomenon is calledmethaemoglobinemia or the blue baby syndrome [51].
In addition, receiving water containing high NO3−–N concen-
trations should be avoided since it is reported to increase theprobability of non-Hodgkin’s lymphoma and gastric cancer [52].Also, scientific evidence shows that nitrate and nitrite are likelyto cause mutagenesis and teratogenesis, miscarriage in pregnantwomen, coronary cardiac diseases, cancer of the ovaries and growthof hypertrophy of the thyroid [53].
3. Nitrate removal methods
Several treatment processes including biological denitrification,ion exchange, chemical denitrification, reverse osmosis, electro-dialysis and catalytic denitrification can remove nitrates fromwater with varying degrees of efficiency, cost and simplicity.
3.1. Physicochemical methods
Among the physical–chemical technologies considered forNO3
−–N removal are ion exchange [54], reverse osmosis [55], catal-ysis [56] and electro-dialysis [57]. However, use of these processesis limited due to high capital and energy costs and the subsequentdisposal problem of large volumes of waste brine [51]. The main dis-advantages of the ion exchange procedure are the charging of thetreatment water with chloride ions [58] and the additional operat-ing cost caused from the disposal requirements. An electrodialysissystem requires a supply of pressurized water, a membrane stackand a direct-current power source [59]. Catalytic denitrificationin some cases produces ammonia and nitrite in the treated waterand as a result an additional treatment is needed [60]. Generally,the pretreatment requirement, the production of soluble materi-als, suspended and colloidal particles and other contaminants, thegeneration of concentrated wastes, as well as the pH variations andchloride exposure, limit their applicability [59].
3.2. Biological denitrification
Biological denitrification is an alternative technology, which iscarried out by facultative bacteria that can use NO3
− as a ter-minal electron acceptor for respiration under anoxic conditions.Reduction of NO3
− to nitrogen gas proceeds in a four-step pro-cess: microorganisms reduce NO3
− to NO2−, nitric (NO), nitrous
oxide (N2O), and finally to nitrogen gas (N2). In the right envi-ronment, specific microorganisms have the ability to adjust theirmetabolism in order to catalyze the above stages and as a result toreduce nitrates. In contrast to physicochemical methods, biologi-cal denitrification offers a treatment of nitrates without a need ofpost-treatment or production of by-products. Furthermore, due to
a cost-effective and friendly to the environment method for nitrateremoval. On the other hand, it seems to be a slower process withlower denitrification rates compared to physicochemical methods[2,58].

Hazard
3
aieotawtrt[
sbhf
ssca
1
8
scooa
bnne
1
1
rt
sitcseed
oepitab[
K.A. Karanasios et al. / Journal of
.3. Autotrophic vs. heterotrophic denitrification
There are two types of biological denitrification, the autotrophicnd the heterotrophic denitrification. Heterotrophic denitrifications a process that uses various carbon compounds as energy andlectron sources such as, ethanol [61], methanol [62], acetate [63],r insoluble carbon source like wheat straw [64]. The main advan-ages of heterotrophic denitrification are the high denitrifying ratesnd treatment capacity [65]. Biological denitrification of drinkingater with heterotrophic microorganisms has been widely inves-
igated, due to its efficiency and high performance. However, theesidual carbon sources from this process and the potential of bac-erial contamination of treated water are the main disadvantages66].
In autotrophic denitrification bacteria use hydrogen, iron orulfur compounds as energy source and carbon dioxide or bicar-onate as carbon source. The groups of autotrophic denitrifiers are:ydrogen oxidation bacteria, reduced sulfur oxidation bacteria and
errous oxidation bacteria [66,67].In sulfur-autotrophic denitrification, several sulfur compounds
uch as sulfide, elemental sulfide, thiosulfate, tetrathionate andulfite are used as electron donors by microorganisms [68]. Stoi-hiometric equations of denitrification with sulfide and thiosulfates electron donors are [66]:
4NO3− + 5FeS2 + 4H+ → 7N2 + 10SO4
2− + 5Fe2+ + 2H2O (1)
NO3− + 5S2O3
2− + H2O → 4N2 + 10SO42− + 4H+ (2)
Autotrophic denitrification with elemental sulfur has beentudied extensively [69–71] and its high denitrification efficiencyompares well with that of heterotrophic denitrification. On thether hand, the low solubility of sulfur compounds, the productionf sulfates [72] and the use of limestone for pH adjustment limit itspplicability [70,71,73].
Denitrification with iron can take place under abiotic, biotic oroth conditions. The biotic process by Fe2+ is known to reduceitrate to nitrite autotrophically in reduced iron environments; theitrite produced can then be reduced abiotically [3]. Stoichiometricquations of denitrification with iron as electron donor are [74]:
0Fe2+ + 2NO3− + 14H2O → N2 + 10FeOOH + 18H+ (3)
5Fe2+ + NO3− + 13H2O → N2 + 5FeOOH + 28H+ (4)
The main disadvantages are the small amount of oxygenequired for microbial growth [74], the long start up period andhe post-treatment necessity due to the formation of ammonium.
Autotrophic denitrification with hydrogen appears to have highelectivity for nitrate removal and the lack of a harmful by-product,n contrast to the use of sulfur, makes hydrogen a promising elec-ron donor [4]. H2 is an excellent autotrophic choice because of itslean nature and low biomass yield, as well as that it does not per-ist in the treated water and no further steps are required to removeither excess substrate or its derivatives [37]. In contrast to otherlectron donors hydrogen is less expensive per electron-equivalentelivered for contaminant reduction [37,75].
To conclude, advantages of hydrogenotrophic denitrificationver heterotrophic denitrification include: (1) lower cell yield, (2)limination of carryover of added organic electron donor to theroduct water, (3) the relatively low solubility of H2, which makes
t easy to remove from the product water by air stripping and (4)he fact that there is no need for post-treatment. The main dis-dvantage of this procedure is that an explosive atmosphere cane created within the treatment plant by the residuals hydrogen31,37].
ous Materials 180 (2010) 20–37 23
4. Hydrogenotrophic denitrification
4.1. Microbiology
Denitrifiers, which belong to a biochemically and taxonomicallydiverse group of facultative anaerobic bacteria [76], gain energy forsynthesis and maintenance due to the transfer of electrons fromdonor to acceptor [66]. There have been a variety of studies charac-terizing the microbial ecology in hydrogenotrophic denitrificationsystems, where bacterial populations were isolated from mixed-cultures used by hydrogenotrophic denitrifying systems.
Most of the organisms reported as hydrogen-oxidizing den-itrifiers belong to bacterial genera and specifically to the classof Proteobacteria. Thus, Paracoccus denitrificans that belongs to ˛subclass of Proteobacteria is one of the most intensively studieddenitrifying microorganisms [11,77–79]. Populations of Proteobac-teria [80,81] and especially of ˇ-Proteobacteria [28,81], such asThauera sp. and Hydrogenophaga sp. [1] and Rhodocyclus andHydrogenophaga [82] were isolated from mixed microbial commu-nities of hydrogenotrophic reactors. Bacterial communities withinhydrogenotrophic denitrifying biofilms that belonged to the classesof Flavobacteria [81] and Sphingobacteria [80] have also beenreported.
More specifically, bacteria belonging to the genera Pseudomonas[11,40], e.g. Pseudomonas stutzeri [79], were observed in manyreactors where hydrogen gas was used to stimulate denitrifica-tion. Bacteria belonging to the genera Acinetobacter [11,83] havealso been reported as dominating members in hydrogen-oxidizingmicrobial cultures. Members of Acinetobacter sp. cluster have alsobeen shown to be able to partially reduce nitrate to nitrite underanoxic conditions although under high concentration of nitrites,their nitrate reductase would also be able to catalyze the reductionof nitrites [84]. Other species like Aeromonas sp. and Shewanellaputrefaciens [11], Ochrobactrum anthropi and Paracoccus panthotro-phus [79] and Acidovorax sp. strain Ic3 and Paracoccus sp. strainIc1 [83] were reported to be denitrifying bacteria isolated from aH2-dependent denitrification reactors.
Although, the above bacteria species have been isolated fromreactors where hydrogenotrophic denitrification was carried outwith mixed-cultures, pure cultures have also been successfullyused. Chang et al. [4] used Alcaligenes eutrophus to evaluate denitri-fication in a fluidized-bed reactor. Lee and Rittmann [5] inoculateda denitrifying system for biofilm development with Ralstoniaeutropha (formerly classified as Alcaligenes eutrophus), which isknown to denitrify using hydrogen as electron donor. Alcaligeneseutrophus was also selected for hydrogenotrophic denitrificationby Ho et al. [6]. Tiemeyer et al. [85] dealt with the identification ofthe growth kinetics of Ralstonia eutropha under hydrogenotrophicconditions. Finally, the ability of a purple non-sulfur photosyntheticbacterium Rhodocyclus sp. to remove nitrate autotrophically whengrown in a fixed-film bioreactor was tested by Smith et al. [7].
To conclude, it was observed that the above investigations onhydrogenotrophic denitrification have involved a limited bacteriaspecies, due to the fact that a hydrogenotrophic denitrifying envi-ronment is highly selective. In order to perform, organisms musthave the capacity to utilize nitrate as nitrogen source, grow withinorganic carbon under anaerobic conditions, utilize H2 as electrondonor and use nitrate as terminal electron acceptor.
4.2. Stoichiometry
During denitrification, nitrate is reduced to gaseous nitrogen inaccordance with the following general equation [86]:
2NO3− + 10e− + 12H+ → N2 + 6H2O (5)

24 K.A. Karanasios et al. / Journal of Hazardous Materials 180 (2010) 20–37
Table 1Stoichiometric equations of hydrogenotrophic denitrification with various carbon substrates.
Stoichiometric reaction Reference
NO3− + 3.00H2 + 0.22CO2 + H+ → 0.48N2 + 3.35H2O + 0.04C5H7O2NP0.2 [89]− +
g
N
N
N
N
2
e0o((tcb3nab
bSvasa
0
w
0wrbtnt[rCNocsp
NO3 + 2.82H2 + 0.139CO2 + H → 0.486N2 + 3.223H2O + 0.0278C5H7O2NNO3
− + 3.03H2 + H+ + 0.229H2CO3 → 0.477N2 + 3.6H2O + 0.0458C5H7O2N0.33NO3
− + H2 + 0.34H+ + 0.08CO2 → 0.16N2 + 1.11H2O + 0.015C5H7O2NNO3
− + 3.03H2 + H+ + 0.229CO2 → 0.477N2 + 3.37H2O + 0.0458C5H7O2N
The stoichiometry of the reactions of denitrification with hydro-en as the electron donor is given in [37,87]:
itrate reduction NO3− + H2 → NO2
− + H2O (6)
itrite reduction NO2− + H+ + 0.5H2 → NO(g) + H2O (7)
itric oxide reduction 2NO(g) + H2 → N2O(g) + H2O (8)
itrous oxide reduction N2O(g) + H2 → N2(g) + H2O (9)
Overall denitrification reaction from NO3 to N2
NO3− + 5H2 + 2H+ → N2(g) + 6H2O (10)
Here, each mole of NO3− reduced to N2 gas consumes one acid
quivalent (H+). Therefore, 1 mg of NO3−–N would theoretically use
.357 mg of hydrogen gas (Eq. (10)). The mass consumption ratiof hydrogen to nitrogen for nitrate reduction is 0.14 mg H2/mg NEq. (6)), while the ratio for nitrite reduction is 0.21 mg H2/mg NEqs. (7)–(9)). The equation shows that the pH will increase afterhe reaction, because 1 mole of H+ is used when 1 mole of NO2
− isonverted to nitrogen gas (Eq. (7)). The second reaction producesase (or alkalinity) at a ratio of 1 base equivalent per N equivalent, or.57 mg as CaCO3/mg N [24]. The release of alkalinity occurs whenitrite (NO2) is reduced to nitric oxide (NO) (Eq. (7)). Increasing thelkalinity can increase the pH in the system, which might affectacterial metabolism or cause precipitation of mineral deposits.
Under autotrophic growth conditions, carbon dioxide or bicar-onate are used as a carbon source for microbial cell synthesis.toichiometric equations of hydrogenotrophic denitrification witharious carbon sources that have been reported in the literaturere listed in Table 1. In addition, the stoichiometry for bacteria cellynthesis with nitrate as nitrogen source and inorganic carbon iss follows [26,88]:
.04NO3− + 0.18CO2 + 1.04H+ + e− → 0.04C5H7O2N + 0.39H2O
(11)
here electrons in the above reaction are supplied by hydrogen.Based on the equations in Table 1, the cell yield takes values of
.22 g cells/g NO3−–N [26] and 0.37 g cells/g NO3
−–N [24,28,37]hich are lower than the 0.60–0.90 g cells/g NO3
−–N typicallyeported for heterotrophic denitrification [13]. The equation giveny Ghafari et al. [26] (Table 1) shows that hydrogenotrophic deni-rification is carried out using 2.82 mol H2 and 0.14 mol CO2 per molitrate. Namely, according to the equations in Table 1 the hydrogenheoretical demand is reported to be from 0.40 mg H2/mg NO3
−–N26] to 0.43 mg H2/mg NO3
−–N [24,28,37]. Moreover, the processequires 0.44 mg CO2 per mg NO3
−–N (C:N = 0.12) [26] to 0.76 mgO2 per mg NO3
−–N (C:N = 0.21) [28] and 1.01 mg H2CO3 per mg
O3−–N (C:N = 0.20) [24]. Although, it is observed that low amountsf nutrients are required for the process, aiming to acclimatize andultivate denitrifiers, higher doses of carbon and electron donorhould be applied to provide abundance of supply and prevent anyossible deficiency.
[26][24][28][37]
4.3. Factors controlling denitrification
4.3.1. Nitrate concentrationThe effects of nitrate concentration on various
hydrogenotrophic systems have not been systematically investi-gated; however, it seems that the findings vary. Chang et al. [4]reported that the reactor performance at high nitrate concentra-tion was not inhibited, while the bacteria were able to handle thehigh nitrate nitrogen loadings. Park et al. [19] varied the initialnitrate concentration in a range from 20 to 492 mg NO3
−–N/l inorder to investigate the nitrate reduction rate. Their data showthat the nitrate removal rate increased as the initial nitrate load-ing increased, while nitrite accumulation was observed. Similarresults were observed by Park et al. [1] with the initial nitrateconcentration ranging from 20 to 150 mg NO3
−–N/l.Zhou et al. [20] observed that at initial nitrate concentra-
tions of the order of 10 mg NO3−–N/l, complete removal was
achieved, while at higher nitrate concentrations above 30 mgNO3
−–N/l an inhibition appeared to take place in the denitrifica-tion process. More intense nitrite accumulation and higher peakconcentration occurred by the presence of high initial nitrate con-centration. Moreover, Vasiliadou et al. [17] found that the rateof hydrogenotrophic denitrification was inhibited at high nitrateconcentrations (above 40 mg NO3
−–N/l), while the nitrite concen-tration remained at very low values.
4.3.2. pHThe hydrogenotrophic denitrification process is positively
related to pH, with an optimum value in the range of 7.6–8.6[16,24,25,90,91]. However, due to the different hydrogenotrophiccultures used and to the variability of operating conditions, manyresearchers [8,20,92] indicate that the optimum pH is about7.5–7.6, whereas denitrification is inhibited or nitrite accumulationis observed above this value.
An increase of the pH value above 8.6 can cause nitriteaccumulation and a significant decrease in the nitrate removalrate [8,24,93]. Moreover, low pH values like 7 [93] or below[25] can also inhibit the denitrification reaction. At pH below 7the decomposition of carbonate ions and carbon dioxide strip-ping, can strongly affect the hydrogenotrophic denitrificationprocess [16]. Hydrogenotrophic denitrification at pH as low as5.4 has been shown to be feasible, with carbon dioxide beinginjected to a fixed-film reactor [10], although low denitrifica-tion rates were observed. As a result pH adjustment or carbonsupplies were considered to be necessary during denitrificationprocess.
In order to avoid pH rise and to increase denitrification efficiencyphosphate buffers were used by many researchers [14,15,92,94].The pH in experiments reported by Lee and Rittmann [5,37] washeld nearly constant between 7.0 and 7.2 by a strong phosphatebuffer. Thus, the limited pH increase is attributed to the fact that
the biological reactors are well buffered [40].It must be noted that application of high phosphate bufferconcentration in a biofilm reactor can lead to a decrease in thedenitrification rate, due to the mineral precipitation which leads tochanges in biofilm density. On the other hand, introducing carbon

Hazard
dw
taHapstpJwd
4
3etiaapt
d[wtwp[ittaa
4
oht3Imods
(pfifbrhp
mdbom
K.A. Karanasios et al. / Journal of
ioxide and avoiding any additional chemical, allows pH controlithout the above risks [26,32,95].
Ho et al. [6] demonstrated that nitrate could be reduced effec-ively with no nitrite accumulation when carbon dioxide waspplied, while the pH of the bioreactor remained at about 7.owever, when bicarbonate was supplied to the biofilm, nitriteccumulated critically, since the formation of alkalinity raised theH of the bioreactor to 9.5. On the other hand, Ghafari et al. [26]howed that carbon dioxide gas manipulates the pH and drops ito the acidic range of 5.5–6, while bicarbonate as carbon sourcerovides a buffered environment which helps pH control. Finally,
ha and Bose [96] demonstrated a different method where pyriteas effective in controlling pH, with no detrimental effect on theenitrification process by consuming the hydroxide ions produced.
.3.3. TemperatureThe optimum temperature for denitrification is between 25 and
5 ◦C, while due to the bacteria capacity to survive in extremenvironmental conditions, denitrification processes can occur inhe range 2–50 ◦C [97]. Most of the temperature values appliedn studies on hydrogenotrophic denitrification varied between 10nd 30 ◦C. The lower temperatures were chosen based on theverage temperature of groundwater [10,16], while higher tem-eratures were used to allow the growth and good performance ofhe hydrogenotrophic cultures [15,28,98].
Experimental evidence suggests that temperature affects theenitrification process by affecting bacteria behavior. Kurt et al.8] demonstrated that reaction rates in a fluidized-bed reactorere doubled for every 10 ◦C increase in temperature (according
o Arrhenius rate law). A maximum for the denitrification rateas found at 42 ◦C, although denitrification was observed at tem-eratures below 10 ◦C. Another study reported by Rezania et al.16], showed that the denitrification rate increased as temperaturencreased from 12 to 25 ◦C. Finally, Zhou et al. [20] suggested thathe suitable temperature range was 30–35 ◦C, since increasing theemperature from 25 to 35 ◦C nitrate removal also increased, whilet 25 ◦C high nitrite accumulation was observed. A further increasebove 35 ◦C led to lower nitrate removal rates.
.3.4. Hardness – alkalinityHardness and alkalinity are known to have a negative impact
n denitrification process. Dries et al. [36] studied the effect ofardness on the denitrification process. They used fixed-bed reac-ors to treat different types of polluted water: ‘hard’ water with17.5–375 mg CaCO3/l and ‘soft’ water with 145–165 mg CaCO3/l.
t was observed that after a period of few weeks ‘hard’ water treat-ent stopped due to the precipitation of CaCO3 which created
perating problem such as clogging of pores. As a conclusion, theenitrification rate was inhibited by high concentration of CaCO3,ince no problem occurred with the ‘soft’ water treatment.
Using the stoichiometric equation of Lee and Rittmann [24]Table 1) it is realized that one equivalent of alkalinity is produceder mol of NO3
− which reduced to N2. Alkalinity added by denitri-cation can be removed through precipitation of CaCO3(s). Except
rom CaCO3(s) precipitation, biomass synthesis can also remove car-onate from solution, while precipitation plays the most importantole. The net change in alkalinity is negative for systems with aigh carbonate buffer and high pH, as the alkalinity removal byrecipitation is more prominent [24].
An increase in alkalinity can increase the pH of a system, which
ight affect bacterial metabolism or cause precipitation of mineraleposits. Production of alkalinity may have a greater impact in aiofilm than in a well-mixed liquid reactor, because precipitationf mineral solids during the denitrification process might limit theass transfer and decrease biomass activity [24,99,100].
ous Materials 180 (2010) 20–37 25
4.3.5. Oxidation–reduction potentialRezania et al. [16] reported that at oxidation–reduction poten-
tial or ORP below −250 mV, hydrogen can be consumed by severalbacteria such as methanogenic, sulfate-reducing, or homoace-togenic. In contrast, at higher ORP, namely, above −50 mV,under anoxic conditions, the activity of sulfate-reducing andmethanogens is limited by the presence of nitrate.
Islam and Suidan [101] using a bio-electrochemical reactornoticed that hydrogen and nitrate concentration affected the ORP.Sakakibara and Nakayama [27] observed a variation in ORP lev-els in a bio-electrochemical reactor in which at the cathode zonethe ORP dropped below −400 mV and at the anode zone increased.This was caused by the H2 and O2 formation creating highly reduc-ing and oxidizing zones at the cathode and anode, respectively.Mo et al. [14] observed that full denitrification was achieved whenthe oxidation–reduction potential (ORP) was stable between −230and −120 mV. They also observed that the ORP increased when thenitrate loading rates increased, resulting to incomplete denitrifica-tion with residual of nitrates in the reactor.
Sakakibara et al. [33] reported that the ORP decreased whenthe hydraulic retention time increased in a biofilm electrode reac-tor. Generally, when hydrogen concentration increases the ORPdecreases [101], while an increase of nitrate concentration leadsto an increase of ORP [19].
4.4. Hydrogen concentration
Chang et al. [4] reported that the critical limit for dissolvedhydrogen concentration appeared to be 0.2 mg/l. Incomplete deni-trification occurred when the dissolved hydrogen concentration fellbelow 0.2 mg/l, during which the nitrite concentration increased.Nitrite and nitrate reductases were inhibited at a hydrogen con-centration lower than 0.2 and 0.1 mg/l, respectively, as nitritereductase is more sensitive than nitrate reductase. Nevertheless,high liquid-phase hydrogen concentrations between 1.1 and 1.4 mgH2/l have been reported by many researchers [8,15,36]. Karana-sios et al. [23] reported that complete nitrate nitrogen removalwas achieved with hydrogen concentrations varying from 0.4 to0.8 mg/l.
Celmer et al. [95] studied the possibility of controlling the pro-cess rates, as well as biofilm parameters by supplying limitedamounts of electron donor (hydrogen) in a membrane biofilmreactor for autotrophic denitrification of wastewater. They demon-strated that limitation of the hydrogen availability inhibited notonly the removal rate but also growth of the biofilm. However,limiting the hydrogen supply proved to be efficient in controllingthe biofilm growth and consequently the performance of the fibermembrane biofilm.
Lee and Rittmann [37] reported that the most important factorin controlling denitrification efficiency is hydrogen pressure. Theynoted that 100% nitrate removal was achieved in a hollow-fibermembrane biofilm reactor when hydrogen pressure increased from0.45 to 0.56 atm. Rezania et al. [102] reported that dissolved hydro-gen concentration in a submerged membrane bioreactor rangedbetween 0.2 and 0.55 mg/l, while complete denitrification wasachieved even when low hydrogen concentrations (0.001 mg/l)were observed at the effluent. Haugen et al. [40] observed adecrease of hydrogen concentration from 0.1–0.2 to 0.0004 mg/lwhen biological activity increased, in a membrane reactor. Duringthis decrease nitrite accumulation occurred.
4.5. Carbon source
As mentioned above (Section 4.2) the theoretical carbondemand for complete hydrogenotrophic denitrification is 0.20 mgC (in the form of bicarbonate) (Table 1) [24] and 0.12–0.21 mg C (in
2 azard
tcew
Mtc(tnd
dsTfa
tcmcd[rcCaad
apot
5
fihtaRtsaa
bponhf
5
tspia
6 K.A. Karanasios et al. / Journal of H
he form of carbon dioxide gas) (Table 1) [26,28] per mg NO3−–N
onverted to nitrogen gas. These mass ratios are low enough how-ver higher ratios were used by researchers to ensure that carbonas not rate-limiting during the process of culture acclimation.
The bicarbonate–carbon to nitrate–nitrogen ratio used byansell and Schroeder [28] and Visvanathan et al. [22] in order
o enrich their hydrogen-oxidizing cultures was 2:1 to ensure thatarbon was not a limiting nutrient based on the stoichiometryC:N = 0.21). It must be noted that high ratio of C/N may leado nitrite accumulation or extra production of nitrous other thanitrogen gas [103]. In contrast, a low C/N ratio leads to incompleteenitrification [104,105].
Ghafari et al. [26] studied the acclimation of autohy-rogenotrophic denitrifying bacteria by using two inorganic carbonources (CO2 and bicarbonate) and hydrogen gas as electron donor.hey observed that bicarbonate as the only carbon source showed aaster adaptation, while the use of carbon dioxide resulted in longercclimation period.
Usually, after the cultivation of microorganisms, the investiga-ors try to find the optimum operating condition with regard toarbon supplies. Ghafari et al. [26] observed that bicarbonate isore appropriate for a faster growth and adaption, however, a
ombination of bicarbonate and carbon dioxide has the ability toevelop enough denitrification capacity. In addition, Ghafari et al.91] reported that the optimum bicarbonate concentration from aange 20 to 2000 mg/l was 1100 mg NaHCO3/l for an initial nitrateoncentration of 20 mg NO3
−–N/l, providing a mass ratio of 7.85 mg/mg NO3
−–N. However, experiments conducted by Karanasios etl. [23] showed that completed nitrate and nitrite removal waschieved with a mass ratio of only 0.504 mg C/mg NO3
−–N, whileissolved carbon dioxide concentration ranged from 0.6 to 1.1 g/l.
Ho et al. [6] varied the carbon dioxide concentration as hydrogennd carbon dioxide flowed together into a lumem side of a gas-ermeable silicone tube. The maximum rate of nitrogen removalccurred when the carbon dioxide ranged from 20% to 50% of theotal gas volume sparged in the reactor.
. Trialed reactor technologies
Due to the low biomass yield of hydrogenotrophic denitri-ers, most research conducted on hydrogenotrophic denitrificationas been with attached growth systems. Attached growth sys-ems, have lower space requirements and especially lower capitalnd operating costs compared to suspended biomass reactors.esearchers used this technology like fixed- and fluidized-bed reac-ors, membranes and biofilm electrode reactors providing a supporturface area for biofilm growth (high biomass concentration), thusllowing the possibility of maintaining bacteria at high hydraulicnd nitrate loadings.
A number of configurations and operating conditions haveeen tried by many researchers in an effort to achieve higherformances of hydrogenotrophic denitrification and reduceperating problems. Advantages and drawbacks of traditional andew technologies, as well as the concerns regarding the use ofydrogenotrophic denitrification are also analysed in detail in the
ollowing sections.
.1. Fixed-bed reactors
The support media is considered to be the main parameter for
he design of a packed-bed reactor. Characteristics of support mediauch as shape, size or material type have great influence on theerformance of the system. Size and shape determine the poros-ty and the specific surface area, respectively. The specific surfacerea concerns the available surface for bacteria growth and porosity
ous Materials 180 (2010) 20–37
determines biofilm thickness and pore clogging. As a result, reactorperformance and efficiency are mainly determined by the supportmedia.
Dries et al. [36] used a dual-column reactor, which was com-prised of a down flow fixed-bed for the first column and anupflow column for the second bed, to study the performance ofhydrogenotrophic denitrification. The H2 was supplied to the reac-tor by direct bubbling of H2 gas in the down flow column. Threetypes of polyurethane sponge matrixes were used as the biofilmcarrier. For water containing 15 mg NO3
−–N/l, removal rates of0.25 kg NO3
−–N/m3 d were reached at 21 ◦C. Gros et al. [10] con-structed a full-scale biological drinking water denitrification plantof nine reactors packed with polypropylene carrier. The nitrateremoval was 0.25 kg NO3
−–N/m3 d with initial nitrate nitrogen con-centration of 17 mg/l.
Park et al. [1] used glass beads as support media to treat differentinitial concentrations in the range of 20–150 mg NO3
−–N/l, whilethe highest nitrate removal rate achieved was 0.225 kg N/m3 d.A cheap and effective installation using silicic gravel as supportmedia was proposed by Vasiliadou et al. [15]. The size of the sup-port media was found to drastically affect denitrification efficiency.Using a triple-column reactor, high nitrate concentrations up to340 mg NO3
−–N/l were treated giving a denitrification rate of 6.2 kgN/m3 d. Grommen et al. [21] reported a low rate of 0.036 kg N/m3 dusing ceramic cylinders, while longer hydraulic retention time wasneeded to achieve complete denitrification.
Most of the studies reported here used the conventional methodfor hydrogen supply, namely, external tank for H2 gas absorp-tion and H2 sparged directly in the bioreactor. On the other hand,alternative methods for hydrogen diffusion have been proposed.Haugen et al. [40] in order to determine the technical feasibility ofin situ hydrogenotrophic denitrification developed a flow-throughreactor packed with aquarium rocks with H2 fed of silicone hollow-fiber membranes. Complete denitrification of 16.34 mg NO3
−–N/lwas achieved with a velocity of 0.3 m/d.
Lu et al. [106] used a tank in which hydrogen was diffusedvia gas-permeable membrane and water was hydrogenated. After-wards, the hydrogenated water was introduced in the fixed-bedreactor. Szekeres et al. [38,79] use an alternative mode. The hydro-gen was produced in an electrolysis cell and subsequently wasintroduced in a fixed-bed reactor. Hydrogen production, generatedfrom anoxic corrosion of metallic iron was tested by Sunger andBose [107]. The hydrogenated water from the hydrogen generationsystem was mixed with nitrate solution in the mixer bottle andintroduced in the fixed-bed reactor. Grommen et al. [21] generatedhydrogen gas with a two-compartment electrolytic cell containingtwo plain perforated nickel electrodes, while hydrogen was sup-plied through the top of the reactor. Vagheei et al. [108] producedin situ hydrogen and carbon dioxide by the electrolysis of methanol.Fixed-bed reactors were used in which gas entered from the bot-tom of the reactor. Finally, the performance of a triple packed-bedreactor with hydrogen produced from electrolysis of water andelectric power provided by a solar cell was investigated by Karana-sios et al. [23]. The use of inexpensive support media as well asthe use of systems for cheap hydrogen production can make thehydrogenotrophic denitrification economically viable for potablewater treatment.
Operating conditions and apparatus information of severalstudies in autohydrogenotrophic denitrification using fixed-bedreactors are listed in Table 2. The limitations associated with the useof fixed-bed attached growth systems are the difficulty in biofilm
control, the limited mass transfer and the decreasing biomass activ-ity due to thick biofilm formation [14]. Experimental data showedthat the use of the appropriate support media is of crucial impor-tance for hydrogenotrophic denitrification, since it determines theextent of biofilm development as well as pore clogging. In addition,
Hazard
tre
tdabpgNid[
5
pttrwbt
sttarNe
wpdwtflmsaa
fltsn[t
5
etr[trs
hbd
K.A. Karanasios et al. / Journal of
he operating conditions (nitrate nitrogen concentration, volumet-ic flow rate) combined with a well constructed configuration cannhance bioreactor performance.
A comparison between fixed-bed and suspended growth reac-ors shows clearly that attached growth systems achieve higherenitrification rates (Table 2). Specifically, Vasiliadou et al. [15]chieved the highest denitrification rate compared to other fixed-ed reactor processes (1.53–6.2 kg NO3
−–N/m3 d). However in arevious study [17] by using the same mixed culture in a suspendedrowth reactor, the denitrification rate was as low as 0.076 kgO3
−–N/m3 d. Other researchers using suspended growth reactorsn a sequencing batch mode (Table 2) have also reported very lowenitrification rates in contrast to fixed- and fluidized-bed reactors16,26,90,91].
.2. Fluidized-bed reactors
The use of a fluidized-bed reactor may solve the problems ofacked-bed reactors, such as clogging and channeling, which mayhreaten its stable operation of the reactor. However, althoughhere are several studies on hydrogenotrophic denitrificationeported in the literature, only few of them have been conductedith fluidized-bed reactors. Different materials, like spherical
eads or sand, in various sizes have been used to investigate deni-rification in this type of reactor (Table 2).
Kurt et al. [8] studied autotrophic denitrification in a cone-haped fluidized sand-bed reactor using a mixed culture. H2 wasransferred to the reactor using a bubbling-absorption tank inhe recycle line. Batch experiments in this study exhibited nitriteccumulation, but continuous experiments resulted in complete Nemoval. For complete denitrification of water containing 25 mgO3
−–N/l, a residence time of 4.5 h was required, while a nitratelimination rate of 0.13 kg NO3
−–N/m3 d was achieved.Another similar configuration was used by Chang et al. [4]
ho studied the immobilized bacteria species Alcaligenes eutro-hus, in a polyacrylamide and alginate copolymer to evaluateenitrification in continuous and batch mode. The maximum rateas 0.6–0.7 kg N/m3 d and nitrite accumulation was affected by
he phosphate concentration. Komori and Sakakibara [98] used auidized-bed reactor equipped with a solid-polymer-electrolyteembrane electrode (SPEME) for the efficient production and dis-
olution of hydrogen, using polyvinylalcohol (PVA) porous cubess a biofilm carrier. Denitrification rate up to 2.16 kg N/m3 d, waschieved.
Despite the fact that high denitrification rates are achieved inuidized-bed reactors (Table 2) in order to ensure fluidization ofhe bed the upflow velocities must be high resulting in a veryhort retention time. This may lead to insufficient nitrate elimi-ation [66]. For that reason recirculation of effluent is often used8] making the process performance more complicated and difficulto control [66].
.3. Membrane biofilm reactors
To date, a variety of reactor configurations have been used forfficient hydrogen delivery. Many of the reviewed systems havehe same H2 provision scheme (gas sparging) either in a sepa-ated hydrogen saturation tank [8,10,106] or directly to the reactor15,36]. The main limitation of hydrogen-driven denitrification ishe low solubility of hydrogen gas resulting in low-mass transferate and possible accumulation of hydrogen gas in a closed head
pace thus creating an explosive environment [28].Many researchers have demonstrated effectiveydrogenotrophic denitrification with gas-permeable mem-ranes, which were used to enhance the efficiency of hydrogenelivery and limit explosion risks through the bubble-less intro-
ous Materials 180 (2010) 20–37 27
duction of hydrogen [13,37]. The investigators focus their attentionon gas-permeable membranes because they can act as both thehydrogen diffuser and the biofilm carrier. Thus, membrane selec-tion is a critical factor for the performance of this technology.Gas-permeable membranes are mainly composite membrane (e.g.,sandwich structure) [5], polypropylene [13], polysulfone [92],platinum cured silastic [110] and silicone coated ferro-nickel slag[31]. Membrane biofilm reactors minimize the cost of supplyingelectron donor, because almost 100% utilization of H2 is pos-sible. Furthermore, the retention time is minimized due to thecounter-current diffusion which allows high fluxes of nitrate andH2.
The most common type of membrane which used is hollow-fiber membrane due to the fact that it has lower space requirementsthan other types of membranes and can achieve high performances.Several studies have been carried out with different materials ofhollow-fiber membranes (Table 3). Ergas and Reuss [13] operateda polypropylene hollow-fiber membrane bioreactor, to study theperformance of hydrogenotrophic denitrification of contaminateddrinking water. Denitrification rates of up to 2.49 g N/m2 d (0.77 kgNO3
−–N/m3 d) were achieved with an influent NO3− concentration
of 145 mg NO3−–N/l and a hydraulic residence time of 4.1 h. Lee and
Rittmann [5,37] used a polyethylene/polyurethane hollow-fibermembrane achieving removal rates of 1.27–2.07 and 0.63–1.6 gN/m2 d, respectively. Zhang et al. [82] reported a high rate of 1.5 gN/m2 d by using a polyvinyl chloride hollow-fiber membrane. Mo etal. [14] and Rezania et al. [93] used a different microporous hollow-fiber membrane (Celgard), and achieved high denitrification ratesof 2.87 and 14.2 g N/m2 d, respectively. Smith et al. [110] reported arate of 4.4 g N/m2 d by using a platinum cured silastic hollow-fibermembrane. Shin et al. [111] used a hollow-fiber membrane reactorwith multi-layered composite fiber and attained a removal rate ofup to 1.72 g N/m2 d.
Hollow-fiber membranes are typically employed as gas-permeable membranes, although silicon tubes have been tested aswell [6,31]. Hydrogen flows through the lumen and diffuses intothe bulk liquid through the membrane walls. Ho et al. [6] usedsuch a membrane of silicone achieving a high denitrification rateof 1.6–5.4 g N/m2 d. In another study reported by Sahu et al. [80]the membrane was gas-permeable microporous hydrophobic withits lumen side was coated with perfluoropolymer. A removal rateof 0.22–5.88 g N/m2 d was achieved (Table 3).
Membranes offer high specific surface area and nitrate removalefficiencies, but they have high cost, due to the operating cost andthe cost of membrane cleaning because of clogging. For instance,the precipitation of mineral solids during the denitrification pro-cess might have a long-term negative impact on the operation of ahollow-fiber membrane bioreactor, which increases its operatingcost [24]. The operating cost of membranes is a major problem asa consequence of the energy consumption for the operation, whilethe cost for replacement of the membranes due to the fouling rep-resents another cost of the process. The cleaning of membranescan be done in two ways: physical and chemical, with the chemicalcleaning having the additional cost from the use of chemicals.
In addition, there is a dependency of hydrogen diffusion andbiofilm growth in a permeable performance of membrane. The twoprocesses interact with each other, leading to poor stability of thedenitrification system and difficulty of biomass control. As a result,the transfer of hydrogen to the bulk liquid is impeded decreasingthe zone of influence around the membranes [112].
In an effort to enhance the performance of the denitrification
process in a fiber membrane biofilm reactor Celmer et al. [95]applied limited amounts of hydrogen in order to control the param-eter named biofilm. They observed that biofilm density was a moreimportant factor for the process operation than the biofilm thick-ness. In another study Celmer et al. [113] tried to estimate the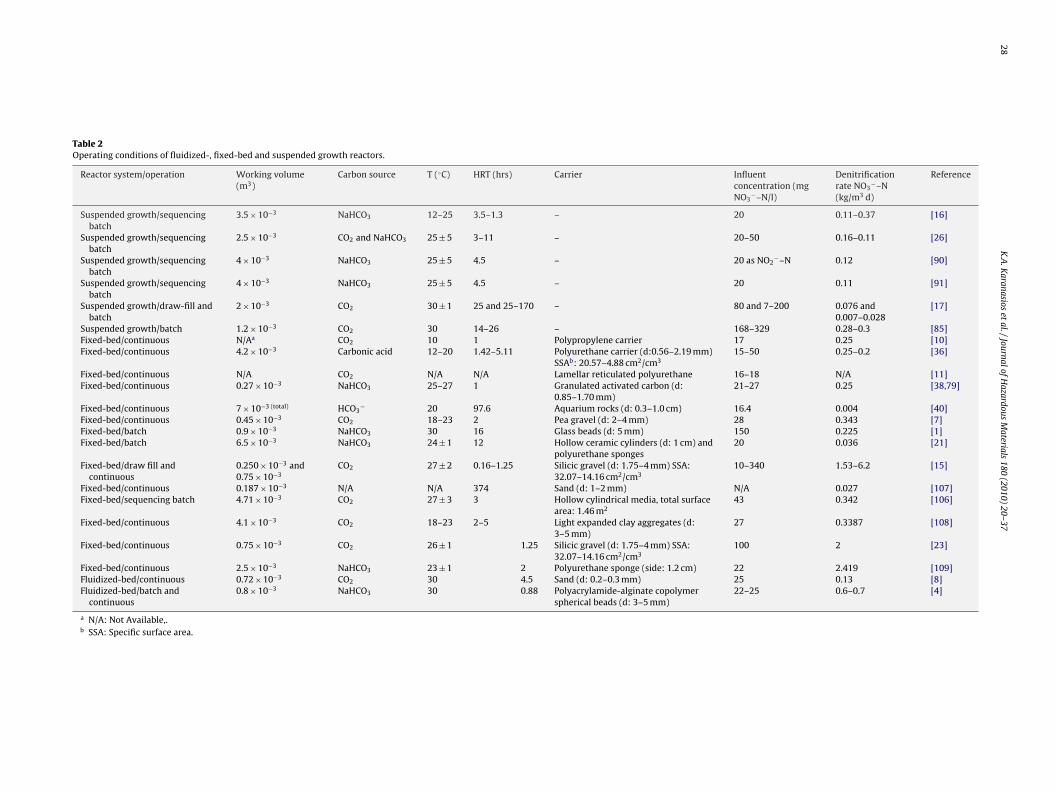
28K
.A.K
aranasioset
al./JournalofHazardous
Materials
180 (2010) 20–37
Table 2Operating conditions of fluidized-, fixed-bed and suspended growth reactors.
Reactor system/operation Working volume(m3)
Carbon source T (◦C) HRT (hrs) Carrier Influentconcentration (mgNO3
−–N/l)
Denitrificationrate NO3
−–N(kg/m3 d)
Reference
Suspended growth/sequencingbatch
3.5 × 10⁻³ NaHCO3 12–25 3.5–1.3 – 20 0.11–0.37 [16]
Suspended growth/sequencingbatch
2.5 × 10⁻³ CO2 and NaHCO3 25 ± 5 3–11 – 20–50 0.16–0.11 [26]
Suspended growth/sequencingbatch
4 × 10⁻³ NaHCO3 25 ± 5 4.5 – 20 as NO2−–N 0.12 [90]
Suspended growth/sequencingbatch
4 × 10⁻³ NaHCO3 25 ± 5 4.5 – 20 0.11 [91]
Suspended growth/draw-fill andbatch
2 × 10⁻³ CO2 30 ± 1 25 and 25–170 – 80 and 7–200 0.076 and0.007–0.028
[17]
Suspended growth/batch 1.2 × 10⁻³ CO2 30 14–26 – 168–329 0.28–0.3 [85]Fixed-bed/continuous N/Aa CO2 10 1 Polypropylene carrier 17 0.25 [10]Fixed-bed/continuous 4.2 × 10⁻³ Carbonic acid 12–20 1.42–5.11 Polyurethane carrier (d:0.56–2.19 mm)
SSAb: 20.57–4.88 cm2/cm315–50 0.25–0.2 [36]
Fixed-bed/continuous N/A CO2 N/A N/A Lamellar reticulated polyurethane 16–18 N/A [11]Fixed-bed/continuous 0.27 × 10⁻³ NaHCO3 25–27 1 Granulated activated carbon (d:
0.85–1.70 mm)21–27 0.25 [38,79]
Fixed-bed/continuous 7 × 10⁻³ (total) HCO3− 20 97.6 Aquarium rocks (d: 0.3–1.0 cm) 16.4 0.004 [40]
Fixed-bed/continuous 0.45 × 10⁻³ CO2 18–23 2 Pea gravel (d: 2–4 mm) 28 0.343 [7]Fixed-bed/batch 0.9 × 10⁻³ NaHCO3 30 16 Glass beads (d: 5 mm) 150 0.225 [1]Fixed-bed/batch 6.5 × 10⁻³ NaHCO3 24 ± 1 12 Hollow ceramic cylinders (d: 1 cm) and
polyurethane sponges20 0.036 [21]
Fixed-bed/draw fill andcontinuous
0.250 × 10⁻³ and0.75 × 10−3
CO2 27 ± 2 0.16–1.25 Silicic gravel (d: 1.75–4 mm) SSA:32.07–14.16 cm2/cm3
10–340 1.53–6.2 [15]
Fixed-bed/continuous 0.187 × 10⁻³ N/A N/A 374 Sand (d: 1–2 mm) N/A 0.027 [107]Fixed-bed/sequencing batch 4.71 × 10⁻³ CO2 27 ± 3 3 Hollow cylindrical media, total surface
area: 1.46 m243 0.342 [106]
Fixed-bed/continuous 4.1 × 10⁻³ CO2 18–23 2–5 Light expanded clay aggregates (d:3–5 mm)
27 0.3387 [108]
Fixed-bed/continuous 0.75 × 10⁻³ CO2 26 ± 1 1.25 Silicic gravel (d: 1.75–4 mm) SSA:32.07–14.16 cm2/cm3
100 2 [23]
Fixed-bed/continuous 2.5 × 10⁻³ NaHCO3 23 ± 1 2 Polyurethane sponge (side: 1.2 cm) 22 2.419 [109]Fluidized-bed/continuous 0.72 × 10⁻³ CO2 30 4.5 Sand (d: 0.2–0.3 mm) 25 0.13 [8]Fluidized-bed/batch and
continuous0.8 × 10−3 NaHCO3 30 0.88 Polyacrylamide-alginate copolymer
spherical beads (d: 3–5 mm)22–25 0.6–0.7 [4]
a N/A: Not Available,.b SSA: Specific surface area.

K.A
.Karanasios
etal./JournalofH
azardousM
aterials180 (2010) 20–37
29
Table 3Operating conditions and denitrification rates of Membrane biofilm reactors.
Process Type/material Working volume(m3)
Carbon source Surfacearea (cm2)
HRT (h) Pore size(�m)
Gas flow Influentconcentration(mg NO3
−–N/l)
Denitrificationrate (kg N/m3 d)
Denitrificationrate (g N/m2 d)
Ref.
Continuous Hollow-fiber/polyethylene andpolyurethane
0.42 × 10⁻³ NaHCO3 750 0.7 N/A 0.31–0.42 (H2:atm) 10–12.5 0.228–0.37 1.27–2.07 [5]
Continuous Tube/silicone 1.5 × 10⁻³ CO2 588.75 8.33 N/A 20 ml H2/min0–20 ml CO2/min
120 0.063–0.211 1.6–5.4 [6]
Batch Hollow-fiber/polypropylene pottedin polysulfone fittings
1.2 × 10⁻³ CO2 3700 4.1 0.05 28 (H2:kPa) 145 0.77 2.49 [13]
Continuous Hollow-fiber/polyethylene andpolyurethane
0.42 × 10⁻³ NaHCO3 750 0.7 N/A 0.2–0.45 (H2:atm) 5–15 0.23–0.505 0.63–1.6 [37]
Continuous Membrane/polytetrafluoroethylene 0.02 × 10⁻³ HCO3− N/A N/A 0.02 N/A 20–40 N/A 2.7–5.3 [28]
Continuous Hollow-fiber/Celgard® X30–240microporous and ZeeWeed®-1
7 × 10⁻³ NaHCO3 55.6 9–12 0.04 N/A 12–72 0.024–0.192 1.76–2.87 [14]
Sequencing batch Hollow-fiber/Celgard® andZeeWeed®-1
8.1 × 10⁻³ NaHCO3 56 and470
9–12 48–81.6 0.04 0.28–0.55 (H2:atm) 330 0.56–0.046 8.2–14.2 [93]
Continuous Hollow-fiber/polysulfone 0.075 × 10⁻³ NaHCO3 1300 6 N/A N/A 50–150 0.83–2.48 0.48–1.43 [92]Continuousa Hollow-fiber/ZeeWeed®-1 5.6 × 10⁻³ N/Aa 940 3 0.04 120 (H2:psi) 33 0.14 8.34 [102]Continuous Membrane/matrix of poly
(dimethylsiloxane, silicone)0.35 × 10⁻³ CO2 163 SSA:
47 m2/m37.78–14.6 N/A 20–50 (H2:kPa) 50
(CO2:kPa)100 0.164–0.306 3.53–6.58 [31]
Continuousa Membrane 3 × 10⁻³ CO2 N/A 4–5 N/A 18 ml H2/min1.5 ml CO2/min
15–25 N/A 0.50–0.59 [95]
Continuous Hollow-fiber/platinum curedsilastic
2.2 × 10⁻³ KHCO3 582 24.48 N/A 0.60 (H2:psi) 10–30 0.12 4.4 [110]
Continuous Hollow-fiber/Zeeweed-1 (by ZenovEnv. Inc.)
5.6 × 10⁻³ NaHCO3 940 3 0.04 120 (H2:psi) 25 0.11 6.55 [114]
Continuousa Membrane/polypropylene fibers 3 × 10⁻³ N/Aa N/A 4 N/A 10 ml H2/min 20 N/A 0.93–1.20 [113]Continuous Hollow-fiber/polyethylene 6.5 × 10⁻³ NaHCO3 8143 6–10 N/A N/A 50 0.118–0.22 0.95–1.72 [111]Continuousb Hollow-fiber/polyethelene 1.25 × 10⁻³ NaHCO3/CO2 4200 2–9 0.1 0.4–0.5 (H2:bar) 50 0.104–0.380 0.309–1.13 [22]Continuous Hollow-fiber/polyvinyl chloride 0.045 × 10⁻³ NaHCO3 124 0.625 0.01 0.04 (H2:MPa) 10 0.414 1.50 [82]Continuous Hollow-fiber/non porous 1.6 × 10⁻³ N/A 1140 7–18 N/A 2.5 (H2:psi) 30 0.0434–0.0598 0.61–0.84 [94]Continuous Tubular
membrane/perfluoropolymercoating
0.07 × 10⁻³ NaHCO3/CO2 2800 1.5–6.7 N/A 10 ml H2/min 40–50 0.88–23.52 0.22–5.88 [80]
a Wastewater treatment plant effluent.b Aquaculture wastewater.

3 azard
iewEit
5
ttatp
0
2
2
gwdtn
Kudtanc[
nHduh[1p
tha
taemlwptfdr
lpsb
0 K.A. Karanasios et al. / Journal of H
mpact of shearing stress by nitrogen sparging and different lev-ls of reactor mixing, on the biofilm structure. Biofilm thicknessas reduced by increasing levels of mixing and shearing stress.
xperimental data accordingly indicated that denitrification ratemproved when biofilm density increased as a result of increase inhe shearing force and decrease in biofilm thickness.
.4. Bio-electrochemical denitrification
Researchers have recently proposed a bio-electrochemical reac-or (BER) in which autotrophic denitrification is stimulated withhe passing of electric current. Biofilm electrode reactors consist ofcouple of electrodes [12], in which denitrifying bacteria are cul-
ured on the cathode surface. In a BER, the following reactions takelace:
.5O2 + 2e− + H2O → 2OH− (12)
H2O + 2e− → H2 + 2OH− (13)
.5C + 5H2O → 2.5CO2 + 10H+ + 10e− (14)
After dissolved oxygen is completely utilized (Eq. (12)), hydro-en gas is produced on the surface of the cathode by electrolysis ofater (Eq. (13)) and autotrophic denitrifying microorganisms areirectly immobilized on this electrode. The process is highly selec-ive for the reduction of nitrate to nitrogen gas with simultaneouseutralization by carbon dioxide (Eq. (14)) at the anode [34,35].
Such a reactor configuration which proposed by Sakakibara anduroda [12], addresses effective hydrogen delivery and has beensed by many researchers (Table 4) [19,27,35,101,115]. Although,ifferent electrode materials have been reported in the literature,hey did not report to affect denitrification efficiency. Thus, annode electrode can be composed of amorphous carbon [116], tita-ium coated with platinum [35] or modified ˇ-PbO2 [20], whileathode electrodes can consist of carbon [101,117], graphite felt19] and stainless pipe [33].
Islam and Suidan’s [101] long-term study showed a stableitrate removal rate at 0.8 g NO3
−–N/m2 d of electrode surface.owever, the liquid retention time (10–13 h) was high, mainlyue to low specific surface area (42 m2/m3). Wang and Qu [73]sing a BER with an electrode reaction area of 321 cm2, achieved aigher denitrification rate (0.381 kg NO3
−–N/m3 d) than Park et al.81] (0.077–1.68 kg NO3
−–N/m3 d) who used a surface area of only05 cm2, indicating that this is an important factor which affect theerformance of the process.
The advantage of this process is the easy operation and main-enance; however, the denitrification rates are low. Thus, longerydraulic retention time (HRT = 10 h to several days) is needed tochieve complete denitrification [12,101,117–119].
Sakakibara and Nakayama [27] proposed a multi-electrode sys-em which showed great potential, since the HRT was reduced tobout 2 h. This superior performance was attributed to the largeffective surface area and the formation of a low ORP zone in theulti-cathode region. However, the denitrification rate was still
ower than that those in cases of external feeding of hydrogen gas,here H2 was dissolved in a pressurized hydrogen saturator or sup-lied directly in the biofilm reactor (Table 2). It must be noted that,he main drawback of biofilm electrode reactors is the gradual scaleormation on the surface of the cathode, suppressing hydrogen pro-uction, which causes a dramatic decrease in the denitrificationate [115].
Another concern regarding the use of BERs is that excess biomasseaves the process, and calls for an additional treatment. Since sus-ended solids escape from a BER, it is necessary to incorporate aolid/liquid separator into the process. A multi-cathode BER com-ined with microfiltration (MF) was proposed by Prosnansky et
ous Materials 180 (2010) 20–37
al. [35]. The multi-cathode electrodes were composed of multiple-granular activated carbons (GACs). Since some suspended solidswere escaping from the BER, a MF membrane with plate modulesand a pore size of 0.2 �m was placed after the BER. Microfiltra-tion was chosen by Prosnansky et al. [35] for this goal becauseof production of high-quality water and simple operation. Exper-imental results demonstrated that it was possible to operate themulti-cathode BER with high denitrification rates and HRT as lowas 20 min. The denitrification rate was enhanced compared withprevious studies of the BER.
The bio-electrochemical reactor might be a solution to theproblem of high cost of the hydrogen supplies needed duringthe hydrogenotrophic denitrification. However, the low nitrateremoval rates, the longer hydraulic retention times and the escap-ing biomass as main disadvantages, limit its applicability.
5.5. Effluent water quality
Waters’ quality at the effluent of a denitrifying reactor is animportant factor for effective denitrification. More specifically, theconcentration of organic carbon plays a significant role in the den-itrification process and in the quality of the treated water. Anincrease of the total organic carbon (TOC) across the length ofthe reactor is expected due to the production of soluble micro-bial products by the microbial reactions [22,122]. Lee and Rittmann[5] observed an increase of dissolved organic carbon (DOC) from1.4 mg/l in the influent to 2.3 mg/l in the effluent of the bioreac-tor. An increase of 1.7 mg DOC/l due to the detachment of biomassfrom biofilm, was reported by Zhang et al. [82]. Ergas and Reuss [13]reported that TOC increased by 20–25 mg/l from the influent to theeffluent of the reactor due to the sloughing of biomass. Haugen et al.[40] observed a small increase of the TOC about 0.5 mg/l. This low-effluent TOC resulted from biomass transport through the materialwhich served as biomass carrier and filter. Schnobrich et al. [32]also noticed that the aquifer material seems to be quite effective inTOC removal from the water.
Mo et al. [14] suggest that an additional treatment step isrequired, as the DOC in the effluent was about 8 mg/l. The sameobservation was made by Rezania et al. [102] in a system ofwastewater treatment. The produced water met all drinking waterguidelines [123], e.g. total coliforms, except for color and organiccarbon (17 mg COD/l). To reduce the organic carbon and color of theeffluent, post-treatment is required. Experimental data of Rezaniaet al. [114] showed that the TOC was similar to that of the feed water(6 mg/l), however no volatile suspended solids were observed inthe effluent. When nitrate-contaminated water contains low lev-els of organic carbon, low-effluent DOC can be expected. Generally,color, DOC and suspended solids can be reduced by post-treatmenttechnologies as granular activated carbon [102], microfiltrationmembranes [35] or by the own support material itself of the biore-actor [32,40].
5.6. Industrial scale applications
In an effort to make the hydrogenotrophic denitrificationeconomically viable and effective for potable water treatmentexperimental experience was applied, in order to design and oper-ate industrial scale applications. However field studies are verylimited due to the difficulties of the possibility of an explosive envi-ronment by accumulation of hydrogen and the high cost of thehydrogen supplies needed.
Ginocchio [124] in Switzerland used hydrogen as electrondonor for in situ denitrification in which contaminated waterwas withdrawn from the aquifer, add hydrogen, carbon diox-ide and phosphate to it and then was reinjected back into theaquifer. Gros et al. [10] demonstrated the performance of the

K.A
.Karanasios
etal./JournalofH
azardousM
aterials180 (2010) 20–37
31
Table 4Operating conditions and denitrification rates of biofilm electrode reactors (BER).
Process Material Working volume(m3)
Carbon source Temp (◦C) HRT (h) Electrode surfacearea (cm2)
Electriccurrent (mA)
Influent concentration(mg NO3
−–N/l)Denitrification rate(kg N/m3 d)
Denitrification rate(g N/m2 d)
Ref.
Batch Cathode: carbon 2.4 × 10⁻³ CO2 25–30 N/A Cathode: 520 0–40 10 0.1968 0.38 [12]Continuous Anode: carbon cathode:
stainless0.205 × 10−3 CO2 25 9 Anode: 160
cathode: 2512.5 15 0.038 N/A [33]
Batch N/A 2.4 × 10⁻³ CO2 25–30 N/A Cathode: 520 5–40 140–420 N/A 0.28–1.93 [39]Continuous Anode amorphous carbon
cathode: stainless0.205 × 10−3 CO2 25 10–50 Cathode: 251 1–10 20–24 0.01–0.045
0.048max
N/A [116]
Continuous Anode amorphous carboncathode: stainless
0.205 × 10⁻³ CO2 20–30 10 Cathode: 251 5 20 0.06 2.39 [117]
Continuous Anode and cathode: carbon N/A NaHCO3 N/A 10–13 Cathode: 42(m2/m3)
20 20 0.035 0.8 [101]
Continuous 2 anodes: Pt metal coated 8cathodes: metal
36 × 10−3 NaHCO3 25 ± 3 2–6 Cathode: 1096 80–960 13.8–20.8 0.12 N/A [27]
Continuous Anode amorphous carboncathode: stainless
0.2 × 10⁻³ CO2 N/A 10 Anode: 160cathode: 251
0–10 24 0.0576 0.470 [34]
Continuous Anode: titanium coatedwith platinum cathode:five electrodes withgranular activated carbon
0.6 × 10⁻³ CO2 N/A 0.33 Anode: 150cathode: 750
300 15 0.393 3.15 [35]
Continuous Anode: carbon cathode:stainless steal
0.52 × 10⁻³ CO2 30 1.9–5 Cathode: 321 3–16 30 0.381 0.43 [73]
Batch Anode dimensionallystable cathode: graphitefelt
1 × 10⁻³ NaHCO3 30 N/A Cathode: 105 200 20–492 0.077–1.68 1.7 [19,81]
Continuous Anode: modified �-PbO2
cathode: activated carbonfiber
N/A CO2 25–40 2.4–6 Cathode: 500 15 10–50 N/A 2.22 [20]
Continuous Anode: stainless steelmesh cathode: granularpalm shell activated carbon
0.8 × 10⁻³ NaHCO3/CO2 N/A 6–36 N/A 0–20 20 0.013–0.08 N/A [120]
Batcha Anode: ploutinizedtitanium rod cathode:ploutinized titanium rod
3 × 10⁻³ CO2 24 ± 1 48 N/A 10–80 27–44.15 N/A N/A [121]
a Significance of ‘Aquaculture wastewater’.
3 azard
fipmuwl(afiDfwn
liiNdTrt
6
etgdoehtdo
kkasvAtteo
sgsiiMtehse
eTsop
2 K.A. Karanasios et al. / Journal of H
rst commercial-scale biological drinking water denitrificationlant utilizing hydrogen at Rasseln near Monchengladbach, Ger-any. Named the Denitropur process, this plant consisted of nine
pflow, fixed-bed denitrification reactors in a series and packedith Mellapack, which is a mixing element (made of polypropy-
ene) with a three-dimensional corrugated structure. The raw watergroundwater) was saturated with hydrogen under overpressurend enriched with phosphate and carbon dioxide. After denitri-cation, the water was aerated and filtered on a two-layer filter.isinfection was ensured by means of UV radiation. The 50 m3/h
acility eliminated nitrate from 17 to less than 1 mg NO3−–N/l
ithin a residence time of water in the reactors of about 1 h. Theitrate removal rate was 0.250 kg NO3
−–N/m3 d.Recently, Chaplin et al. [30] developed a technology to stimu-
ate autotrophic denitrification using gas-permeable membranesn order to supply hydrogen in groundwater. The study took placen Becker, Minnesota where there were high levels of NO3
− (23 mg/l). Membranes installed in groundwater wells were successful inelivering H2 to the groundwater over the 2-year operating period.hey observed that the depth of groundwater (13.7 m) causedeoxygenation of water during recirculation and as a result thisechnology is not suitable for use at deep sites.
. Denitrification kinetic models
Mathematical models of hydrogenotrophic denitrification gen-rally consider denitrification as a two-step process occurring byhe consecutive reduction of nitrates to nitrites and then to nitrogenas. The most commonly used approach to describe the behaviorenitrifying bacteria in the presence of nitrate is the dependencef the bacterial activity on nitrate/nitrite with a Monod typexpression. Mathematical models used in the literature to describeydrogenotrophic denitrification are listed in Table 5. According tohese models types, nitrate and nitrite reduction rates are depen-ent on their concentrations, on biomass concentration, as well asn dissolved hydrogen concentration.
Specifically, Kurt et al. [8] studied autotrophic denitrificationinetics considering denitrification as a two-step process. Theinetics was expressed in a double Monod form and NO3, NO2,nd H2 were assumed to be the limiting substrates (Table 5). Ateady-state mathematical model for an electrochemically acti-ated denitrifying biofilm was developed by Sakakibara et al. [39].double Monod mathematical model was used, as well, to describe
he rates of nitrate and hydrogen utilization with kinetic parame-ers taken from the literature. Park et al. [19] used a Monod typexpression to describe the dependence of the nitrate reduction raten nitrate concentration.
As shown in Table 5 Tiemeyer et al. [85] used Monod expres-ions with nitrite inhibition and switching function for bacteriarowth on nitrite. The specific growth rate was assumed to be theum of the specific growth rates with nitrate and nitrite as limit-ng substrates. It was assumed that increasing nitrite concentrationnhibits the total growth rate. Visvanathan et al. [22] also used a
onod equation to describe nitrate and biomass effluent varia-ion of a membrane denitrification system. Finally, a double Monodxpression was employed by Lu et al. [106] to describe the two-stepydrogenotrophic denitrification process, and the saturation con-tants of nitrate, nitrite and hydrogen were determined by batchxperiments.
The kinetics of the hydrogenotrophic denitrification process was
xtensively studied in batch experiments by Vasiliadou et al. [17].he growth kinetics could be very well described by using expres-ions for double nutrient limitation (nitrate, nitrite). Thus, a modelf substitutable substrates with inhibition from nitrate was pro-osed as listed in Table 5. Nitrate inhibition was modeled by anous Materials 180 (2010) 20–37
Andrews-type expression. In a subsequent study, the growth kinet-ics of pure cultures of hydrogen-oxidizing denitrifying bacteriaused by Vasiliadou et al. [83] included nitrite inhibition expres-sions and consumption of nitrates and nitrites for cell maintenancerequirements in the form of maintenance rates (Table 5).
The kinetics of hydrogen-oxidizing denitrifying bacteria hasbeen also examined [77,78]. Haring and Conrad [77] determinedthe kinetics of H2 oxidation of a denitrifying species. Pseudo-first-order rate constants were determined from the logarithmicdecrease of H2. The kinetics for hydrogen uptake during deni-trification was determined by Smith et al. [78] for nine isolatedhydrogen-oxidizing denitrifiers. Experimental data indicate thatconsumption of hydrogen followed Monod kinetics rather than afirst-order transfer of hydrogen. Finally, Tiemeyer et al. [85] pre-sented a kinetic study on autohydrogenotrophic growth of Ralstoniaeutropha.
Values of several kinetic parameters that are reported in the lit-erature are listed in Table 6. The maximum specific growth ratesfor nitrate and nitrite that are listed in Table 6 vary between0.0023 [22] to 0.155 [83] (1/h) and 0.00813 [85] to 0.917 [15](1/h), respectively. The difference in the parameter values betweendifferent studies is due to the different conditions and differenthydrogenotrophic culture used. Although, high values of satura-tion constants have been reported, [17,19,23], very low valuesappeared as well. Saturation constants of 0.18 and 0.16 mg N/lwere reported for nitrate and nitrite, respectively [8]. The valuesof nitrate saturation constants determined by Visvanathan et al.[22] and Lu et al. [106] were 0.0001 and 2.09 mg N/l, respectively.In another study, the reported hydrogen saturation constant rangedfrom 0.0009 to 0.0066 mg H2/l [78]. With such low saturation con-stants, many researchers assumed that the kinetics of nitrate andnitrite reduction are independent of nitrate, nitrite, and hydrogenconcentrations. For example, Rezania et al. [16] considered a zeroorder kinetic model to describe the hydrogenotrophic denitrifi-cation based on the assumption that the saturation constants ofnitrate, nitrite, and hydrogen are so low that their influences ondenitrification could be neglected.
A zero order type kinetic model was also proposed for NO3−
and NO2− reduction by Lu and Gu [25]. Haugen et al. [40] per-
formed kinetic experiments in batch mixed-cultures from soil. Theyestimated pseudo-first- and second-order rate constants for NO3and NO2 reduction and concluded that these constants were dras-tically affected by the number of microorganisms present in thesoil-derived enrichment culture. Ghafari et al. [91] developed a zeroorder kinetic model, where kinetic constants were estimated fordifferent hydrogen supplies.
In contrast to traditional approaches for description of the den-itrification process, some simplified or empirical expressions havebeen proposed. A kinetic expression that takes into account thesequential reduction of nitrate and inhibition of the N2O reductionstep by toxic pesticide was developed by Feleke and Sakakibara [34]and used to evaluate the process performance of a BER. A simpli-fied mathematical model with nitrate molecular diffusion througha microporous membrane into the denitrifying culture was pro-posed by Mansell and Schroeder [28]. A second order polynomialmodel was generated by Ghafari et al. [120] in order to obtain thesufficient electric current and hydraulic retention time in a BER. Thesame model was used in a subsequent study [90] to describe nitritereduction rates in relation to pH values and sodium bicarbonatedosage.
It must be noted that certain approaches may have inherent
weaknesses that should be addressed. As shown in Table 5 many ofthe models proposed for hydrogenotrophic denitrification did notinclude biomass concentration, because it was assumed biomassconcentration to be constant during the process of nitrate or nitriteelimination. As a result, the influence of biomass growth and activ-
K.A
.Karanasios
etal./JournalofH
azardousM
aterials180 (2010) 20–37
33
Table 5Kinetic models for hydrogenotrophic denitrification for nitrate and nitrite elimination.
Model type Mathematical model Reactor Reference
Nitrate reduction Nitrite reduction
Zero orderdCNO3
dt = −kNO3 · XdCNO2
dt = (kNO3 − kNO2 ) · X Suspended growth [16,91]
MonoddCNO3
dt = − umI ·CNO3CNO3
+KNO3BER [19]
Monod dXdt =
(�max NO3
·CNO3KNO3
+CNO3
)· X − kd · X − 1
�· Xe Membrane [22]
Double Monod rI = umI ·CNO3·CH2
(CNO3+KNO3
)·(CH2+KH2I)
rII = umI ·CNO3·CH2
(CNO3+KNO3
)·(CH2+KH2I)
− umII ·CNO2·CH2
(CNO2+KNO2
)·(CH2+KH2II)
Fluidized-bed,suspended growthwith hollow cylindricalmedia
[8,106]
Double MonodZNO3
−FDNO3RT
ddz
· (CNO3dpdz
) + DNO3 · d2CNO3dz2 + DHNO3 · d2CHNO3
dz2 − RNO3 = 0 BER [39]
RNO3 = 1n · RH2 = k·X·CNO3
·CH2(CNO3
+KNO3)·(CH2
+KH2I)
Monod with switchingfunction for nitrite growth
dCNO3dt = − 1
yNO3· �max NO3
·CNO3·X
KNO3+CNO3
dCNO2dt = 1
yNO3· �max NO3
·CNO3·X
KNO3+CNO3
− 1yNO2
· �max NO2·CNO2
·XKNO2
+CNO2· FNO3
FNO3+CNO3
Suspended growth [85]
Substitutable substrates withnitrate inhibition
dCNO3dt
= − 1yNO3
· �max NO3·CNO3
·X
KNO3+CNO3
+kd2 ·CNO2+
CNO3Ki
2
dCNO2dt =1
yNO3· �max NO3
·CNO3·X
KNO3+CNO3
+kd2 ·CNO2+
CNO3Ki
2 − 1yNO2
· �max NO2·CNO2
·XKNO2
+CNO2+kd1 ·CNO3
Suspended growth [17]
Substitutable substrates withnitrate inhibition
−DNO3 · � · ∂2CNO3∂z2 + � · ∂CNO3
∂t+ 1
yNO3· �(CNO3 ) · X = 0 −DNO2 · � · ∂2CNO2
∂z2 + � · ∂CNO2∂t
+ 1yNO2
· �(CNO2 ) · X − 1yNO3
·�(CNO3 ) · X = 0
Fixed-bed [15]
�(
CNO3
)= �max NO3
·CNO3
KNO3+CNO3
+kd2 ·CNO2+
CNO3Ki
2 �(
CNO2
)= �max NO2
·CNO2KNO2
+CNO2+kd1 ·CNO3
Substitutable substrates withnitrate inhibition and DoubleMonod
−DNO3 · � · ∂2CNO3∂z2 + � · ∂CNO3
∂t+ 1
yNO3· �(CNO3 ) · X = 0 −DNO2 · � · ∂2CNO2
∂z2 + � · ∂CNO2∂t
+ 1yNO2
· �(CNO2 ) · X − 1yNO3
·�(CNO3 ) · X = 0
Fixed-bed [23]
�(CNO3 ) = �max NO3·CNO3
KNO3+CNO3
+kd2 ·CNO2+
CNO3Ki
2 · CH2KSH2
+CH2· CCO2
KSCO2+CCO2
�(CNO2 ) = �max NO2·CNO2
KNO2+CNO2
+kd1 ·CNO3· CH2
KNH2+CH2
· CCO2KNCO2
+CCO2
Substitutable substrates withnitrate and nitrite inhibition
dCNO3dt
= − 1yNO3
· �max NO3·CNO3
·X
KNO3+CNO3
+kd2 ·CNO2+
CNO3Ki
2 − mNO3·CNO3
·X
KNO3+CNO3
+kd2 ·CNO2+
CNO3Ki
2
dCNO2dt = 1
yNO3· �max NO3
·CNO3·X
KNO3+CNO3
+kd2 ·CNO2+
CNO3Ki
2 − 1yNO2
·
�max NO2·CNO2
·X
KNO2+CNO2
+kd1 ·CNO3+
CNO2Km
2 − mNO2·CNO2
·X
KNO2+CNO2
+kd1 ·CNO3+
CNO2Km
2
Suspended growth [83]
Completely mixed flow reactormodel
CNO3− f −CNO3
�− ac · JNO3
− = 0CNO2
− f −CNO2−
�+ ac · JNO2P − ac · JNO2R = 0 BER [34]

34 K.A. Karanasios et al. / Journal of Hazard
Tab
le6
Val
ues
and
un
its
for
satu
rati
onco
nst
ants
,max
imu
msp
ecifi
cgr
owth
rate
s,gr
owth
yiel
dco
effi
cien
tsan
dze
roor
der
kin
etic
con
stan
tsfo
rth
em
odel
su
sed
inh
ydro
gen
otro
ph
icd
enit
rifi
cati
onsi
mu
lati
on.
KN
O3
mg
N/l
KN
O2
mg
N/l
KH
2I
mg
H2/l
u mI
mg
N/l
hu m
IIm
gN
/lh
�m
axN
O3
1/h
�m
axN
O2
1/h
y NO
3m
gbi
omas
s/m
gNO
3−
–Ny N
O2
mg
biom
ass/
mgN
O2
−–N
k NO
3g
N/g
VSS
dk N
O2
gN
/gV
SSd
Ref
eren
ce
0.21
–0.7
40.
25–1
.70
[16]
0.03
7–0.
051a
0.01
3a[4
0]0.
33–0
.60
0.37
–0.4
5[2
5]0.
623–
0.71
00.
707–
0.83
6[9
1]0.
0009
–0.0
066
[78]
28.6
34.
790.
0485
0.55
0.42
070.
084
[17]
0.5–
8.82
0.77
8–28
.45
0.08
76–0
.155
0.45
5–0.
868
0.71
9–1.
077
0.00
47–1
.467
[83]
37.8
42.9
80.
0212
0.00
813
2.05
51.
497
[85]
2.09
1.55
0.05
911
.06
and
14.1
23.
07an
d4.
86[1
06]
0.18
0.16
<0.0
02[8
]31
7.39
434.
78[1
9]0.
0001
0.00
230.
345
[22]
9.1
39.1
0.01
150.
917
0.13
20.
0080
6[1
5]8.
338
.425
.30.
152
0.83
40.
128
1.06
×10
−3[2
3]
aFi
rst-
ord
erd
egra
dat
ion
coef
fici
ent
(1/h
).
ous Materials 180 (2010) 20–37
ity on the rates of nitrate and nitrite reduction was not considered[8,19,106] and this could lead to significantly erroneous predic-tions. On the other hand, some growth kinetics were described byusing expressions dependent only on constant biomass concentra-tion with no influence from nutrients concentration [16].
Another limitation of the majority of modeling approaches ofattached growth processes is that the equations for the nutrientconcentrations in biofilm reactors do not include nitrate and nitritediffusion from the bulk liquid to the biofilm. For example, Kurt etal. [8] made the assumption that biofilm diffusion effects do notinfluence the kinetics of all substrates. However, the steady-statemathematical model which was developed by Sakakibara et al.[39] expressed the flux of species in an electrochemically-activatedbiofilm under the electric field by diffusion terms. The values ofnitrate, hydrogen and carbon dioxide diffusion coefficients werereported to be 0.0683, 0.2104 and 0.0691 (cm2/h), respectively.Lee and Rittmann [37] developed a model with mass balances fornitrate and nitrite in the biofilm and an expression for hydrogentransfer rate from the hollow-fiber membrane into the biofilm. Also,Vasiliadou et al. [15] by using specific growth expressions based onthose proposed by Vasiliadou et al. [17] represented nitrate andnitrite diffusion, from the bulk liquid to the biofilm, with diffu-sion terms in the mass balance-equations. Thus, the nitrate andnitrite were assumed to be consumed only inside the biofilm. Theyalso showed that for the simulation of the denitrification processin a fixed-bed biofilm reactor the computed values of the kineticparameters were different from those of a suspended growth sys-tem [17], due to the changes in the bacterial activity during fixation(Table 6). Finally, a mathematical model was developed by Karana-sios et al. [23] using diffusion and growth kinetic expressions forfour-nutrient limitation (nitrate, nitrite, hydrogen and carbon diox-ide) with inhibition by nitrate. Hydrogen and carbon dioxide wereconsidered as complementary nutrients together with nitrate ornitrite, while their influence was modelled by Monod expressions.
In conclusion, a mathematical model must be reliable and sim-ple, so that it can be easily used for the design of the appropriatereactor configurations for the hydrogenotrophic denitrification ofpotable water. Mathematical models must be able to predict con-centration variations of the basic nutrients, as nitrate, nitrite,hydrogen and carbon source, as well as the biomass growth. Finally,for the satisfactory description of the hydrogenotrophic denitri-fication process, reduction rates of nitrate and nitrite should bedependent on their concentrations as well as the concentration ofbiomass and dissolved hydrogen and carbon concentration.
7. Conclusions
Several methods of treatment have been applied in the pastand results showed that biological denitrification is more beneficialthan physicochemical methods. Hydrogenotrophic denitrificationappears to have advantages in regard to the use of other electrondonors in autotrophic and heterotrophic denitrification.
In this survey were examined in detail the factors that affect thehydrogenotrophic denitrification process. The main conclusionsare:
• The effect of fed NO3−–N concentration varies. Nitrate con-
centrations up to 492 mg NO3−–N/l were reported to increase
denitrification rate. In contrast, other researchers found that den-
itrification was inhibited for nitrate concentrations above 30 mgNO3−–N/l.• The optimum pH for hydrogenotrophic denitrification ranges
from 7.6 to 8.6. The pH rise can lead to nitrite accumulation andto decrease of the nitrate removal rate.

Hazard
•
•
•
wthns
adSwedaa
tniirath
ehiafi
R
K.A. Karanasios et al. / Journal of
The most suitable temperature range is 25–35 ◦C, however highervalues as 42 ◦C were reported as well.Alkalinity introduced by denitrification and water hardnessaffected bacterial metabolism, caused precipitation of mineraldeposits and created operating problem.Carbon and hydrogen concentrations were generally reported tobe higher than the theoretical demands.
Furthermore, trialed reactor technologies for denitrificationere presented. The analysis of the critical points of each configura-
ion showed that fixed-bed and membrane biofilm reactors achieveigh performances. Nevertheless, each one of the developed tech-ologies can be used in relation to the characteristics of the waterupplied for treatment and the economics of the process.
Based on the studies, a number of different mathematicalpproaches have been proposed to model the hydrogenotrophicenitrification process in suspended or attached growth reactors.everal of these modeling approaches have inherent weaknesseshich are often overlooked by their users. However, some math-
matical models that were developed and applied were able toescribe all the main processes in a hydrogenotrophic denitrifyingpplication, such as the consumption of nitrates, nitrites, carbonnd hydrogen and biomass build-up.
Even though significant progress has been made so far inhe study of hydrogenotrophic denitrification, further research iseeded. An area that requires further study in view of cost min-
mization and high efficiency is the appropriate reactor design,ncluding the selection of the best material for attached growtheactors, i.e., the one with the highest specific surface area, and theppropriate gas diffusion into the bioreactor, which will overcomehe limitation of low solubility and the danger of explosion fromydrogen.
In addition, hydrogen production appears to be a significantconomical factor for the viability of denitrification. Producingydrogen with energy provided from renewable energy resources
s a technology of the future and several in situ methods could bepplied to reduce the cost and make the hydrogenotrophic denitri-cation economically viable for potable water treatment.
eferences
[1] H.I. Park, Y.J. Choi, D. Pak, Autohydrogenotrophic denitrifying microbial com-munity in a glass beads biofilm reactor, Biotechnol. Lett. 27 (2005) 949–953.
[2] S. Ghafari, M. Hasan, M.K. Aroua, Bio–electrochemical removal of nitrate fromwater and wastewater – a review, Bioresour. Technol. 99 (2008) 3965–3974.
[3] S.F. Korom, Natural denitrification in the saturated zone: a review, WaterResour. Res. 28 (1992) 1657–1668.
[4] C.C. Chang, S.K. Tseng, H.K. Huang, Hydrogenotrophic denitrification withimmobilized Alcalogenes eutrophus for drinking water treatment, Bioresour.Technol. 69 (1999) 53–58.
[5] K.C. Lee, B.E. Rittmann, A novel hollow-fiber membrane biofilm reactor forautohydrogenotrophic denitrification of drinking water, Water Sci. Technol.41 (2000) 219–226.
[6] C.M. Ho, S.K. Tseng, Y.J. Chang, Autotrophic denitrification via a novelmembrane-attached biofilm reactor, Lett. Appl. Microbiol. 33 (2001)201–205.
[7] R.L. Smith, S.P. Buckwalter, D.A. Repert, D.N. Miller, Small-scale, hydrogen oxi-dizing denitrifying bioreactor for treatment of nitrate-contaminated drinkingwater, Water Res. 39 (2005) 2014–2023.
[8] M. Kurt, J. Dunn, J.R. Bourne, Biological denitrification of drinking water usingautotrophic organisms with H2 in a fluidized-bed biofilm reactor, Biotechnol.Bioeng. 29 (1987) 493–501.
[9] R.L. Smith, J.H. Duff, Denitrification in a sand and gravel aquifer, Appl. Environ.Microbiol. 54 (1988) 1071–1078.
[10] H. Gros, G. Schnoor, P. Rutten, Biological denitrification process withhydrogen-oxidizing bacteria for drinking water treatment, Water Supply 6
(1988) 193–198.[11] J. Liessens, J. Vanbrabant, P. De Vos, K. Kersters, W. Verstraete, Mixed culturehydrogenotrophic nitrate reduction in drinking water, Microb. Ecol. 24 (1992)271–290.
[12] Y. Sakakibara, M. Kuroda, Electric prompting and control of denitrification,Biotechnol. Bioeng. 42 (1993) 535–537.
ous Materials 180 (2010) 20–37 35
[13] S.J. Ergas, A.F. Reuss, Hydrogenotrophic denitrification of drinking water usinga hollow fibre membrane bioreactor, J. Water Supply: Res. Technol. Aqua. 50(2001) 161–171.
[14] H. Mo, J.A. Oleszkiewicz, N. Cicek, B. Rezania, Incorporating membrane gasdiffusion into a membrane bioreactor for hydrogenotrophic denitrification ofgroundwater, Water Sci. Technol. 51 (2005) 357–364.
[15] I.A. Vasiliadou, K.A. Karanasios, S. Pavlou, D.V. Vayenas, Experimental andmodelling study of drinking water hydrogenotrophic denitrification inpacked-bed reactors, J. Hazard. Mater. 165 (2009) 812–824.
[16] B. Rezania, N. Cicek, J.A. Oleszkiewicz, Kinetics of hydrogen-dependent deni-trification under varying pH and temperature conditions, Biotechnol. Bioeng.92 (2005) 900–906.
[17] I.A. Vasiliadou, S. Pavlou, D.V. Vayenas, A kinetic study of hydrogenotrophicdenitrification, Process Biochem. 41 (2006) 1401–1408.
[18] H. Gross, K. Treutler, Biological denitrification process with hydrogen-oxidizing bacteria for drinking water treatment, Aqua Lond. 5 (1986)288–290.
[19] H.I. Park, D.K. Kim, Y. Choi, D. Pak, Nitrate reduction using an electrode asdirect electron donor in a biofilm-electrode reactor, Process Biochem. 40(2005) 3383–3388.
[20] M. Zhou, W. Fu, H. Gu, L. Lei, Nitrate removal from groundwater by a novelthree-dimensional electrode biofilm reactor, Electrochim. Acta 52 (2007)6052–6059.
[21] R. Grommen, M. Verhaege, W. Verstraete, Removal of nitrate in aquaria bymeans of electrochemically generated hydrogen gas as electron donor forbiological denitrification, Aquat. Eng. 34 (2006) 33–39.
[22] C. Visvanathan, N.Q. Hung, V. Jegatheesan, Hydrogenotrophic denitrificationof synthetic aquaculture wastewater using membrane bioreactor, ProcessBiochem. 43 (2008) 673–682.
[23] K.A. Karanasios, M.K. Michailidis, I.A. Vasiliadou, S. Pavlou, D.V. Vayenas,Potable water hydrogenotrophic denitrification in packed-bed bioreactorscoupled with a solar-electrolysis hydrogen production system, Desalinat.Water Treat. (2010), in press.
[24] K.C. Lee, B.E. Rittmann, Effects of pH and precipitation on autohy-drogenotrophic denitrification using the hollow-fiber membrane-biofilmreactor, Water Res. 37 (2003) 1551–1556.
[25] C.X. Lu, P. Gu, Hydrogenotrophic denitrification for the removal of nitrate indrinking water, Huanjing Kexue/Environ. Sci. 29 (2008) 671–676.
[26] S. Ghafari, M. Hasan, M.K. Aroua, Effect of carbon dioxide and bicarbonateas inorganic carbon sources on growth and adaptation of hydrogenotrophicdenitrifying bacteria, J. Hazard. Mater. 162 (2009) 1507–1513.
[27] Y. Sakakibara, T. Nakayama, A novel multi-electrode system for electrolyticand biological water treatments: electric charge transfer and applicationto electric charge transfer and application to denitrification, Water Res. 35(2001) 768–778.
[28] B.O. Mansell, E.D. Schroeder, Hydrogenotrophic denitrification in a microp-orous membrane bioreactor, Water Res. 36 (2002) 4683–4690.
[29] E.J. McAdam, S.J. Judd, A review of membrane bioreactor potential for nitrateremoval from drinking water, Desalination 196 (2006) 135–148.
[30] B.P. Chaplin, M.R. Schnobrich, M.A. Widdowson, M.J. Semmens, P.J. Novak,Stimulating in situ hydrogenotrophic denitrification with membrane-delivered hydrogen under passive and pumped groundwater conditions, J.Environ. Eng. 135 (2009) 666–676.
[31] A. Terada, S. Kaku, S. Matsumoto, S. Tsuneda, Rapid autohydrogenotrophicdenitrification by a membrane biofilm reactor equipped with a fibroussupport around a gas-permeable membrane, Biochem. Eng. J. 31 (2006)84–91.
[32] M.R. Schnobrich, B.P. Chaplin, M.J. Semmens, P.J. Novak, Stimulatinghydrogenotrophic denitrification in simulated groundwater containinghigh dissolved oxygen and nitrate concentrations, Water Res. 41 (2007)1869–1876.
[33] Y. Sakakibara, K. Araki, T. Tanaka, T. Watanabe, M. Kuroda, Denitrificationand neutralization with an electrochemical and biological reactor, Water Sci.Technol. 30 (1994) 151–155.
[34] Z. Feleke, Y. Sakakibara, A bio-electrochemical reactor coupled with adsor-ber for the removal of nitrate and inhibitory pesticide, Water Res. 36 (2002)3092–3102.
[35] M. Prosnansky, Y. Sakakibara, M. Kuroda, High-rate denitrification and SSrejection by biofilmelectrode reactor (BER) combined with microfiltration,Water Res. 36 (2002) 4801–4810.
[36] D. Dries, J. Liessens, W. Verstraete, P. Stevens, P. de Vos, J. de Ley, Nitrateremoval from drinking water by means of hydrogenotrophic denitrifiers inpolyurethane carrier reactor, Water Suppl. 6 (1988) 181–192.
[37] K.C. Lee, B.E. Rittmann, Applying a novel autohydrogenotrophic hollow-fibermembrane biofilm reactor for denitrification of drinking water, Water Res.36 (2002) 2040–2052.
[38] S. Szekeres, I. Kiss, T.T. Bejerano, M.I.M. Soares, Hydrogen-dependent deni-trification in a two-reactor bio-electrochemical system, Water Res. 35 (2001)715–719.
[39] Y. Sakakibara, R.V. Flora, T. Suidan, M. Kuroda, Modeling of electrochemically
activated denitrifying biofilm, Water Res. 28 (1994) 1077–1086.[40] K.S. Haugen, M.J. Semmens, P.J. Novak, A novel in situ technology for the treat-ment of nitrate contaminated groundwater, Water Res. 36 (2002) 3497–3506.
[41] European Council Directive, Directive no. 98/83/EC on the quality of waterintented for human consumption, Adopted by the Council on 3 November(1998).

3 azard
6 K.A. Karanasios et al. / Journal of H[42] WHO, Nitrates and Nitrites in Drinking-Water. Rolling Revision of the WHOGuidelines for Drinking-Water Quality. Draft for Review and Comments,World Health Organization, Geneva, 2004.
[43] Environmental Protection Agency, Quality Criteria for Water, EnvironmentalProtection Agency, Washington, DC, (1976).
[44] Communication from the Commission to the Council, the European Parlia-ment, the Economic and Social Committee and the Committee of the RegionsDirections towards sustainable agriculture (1999/C 173/02).
[45] F.T. Wakida, D.N. Lerner, Non-agricultural sources of groundwater nitrate: areview and case study, Water Res. 39 (2005) 3–16.
[46] Potash Corporation of Saskatchewan, Nitrogen Products, Website, 2002,http://www.potashcorp.com/nitrogen.htm.
[47] T. Watanabe, H. Motoyama, M. Kuroda, Denitrification and neutralizationtreatment by direct feeding of an acidic wastewater containing copper ionand high-strength nitrate to a bio-electrochemical reactor process, Water Res.35 (2001) 4102–4110.
[48] C. Glass, J. Silverstein, Denitrification of high-nitrate, high-salinity wastewa-ter, Water Res. 33 (1999) 223–229.
[49] J.W. Arthur, C.W. West, K.N. Allen, S.F. Hedtke, Seasonal toxicity of ammoniato five fish and nine invertebrate species, Bull. Environ. Contam. Toxicol. 38(1987) 324–331.
[50] D. De Beer, A. Schramm, C.M. Santegoeds, M. Kühl, A nitrite microsensorfor profiling environmental biofilms, Appl. Environ. Microbiol. 63 (1997)973–977.
[51] M. Shrimali, K.P. Singh, New methods of nitrate removal from water, Environ.Pollut. 112 (2001) 351–359.
[52] M.F. Dahab, Y.W. Lee, I. Bogardi, A rule-based fuzzy-set approach to riskanalysis of nitrate-contaminated groundwater, Water Sci. Technol. 30 (1994)45–52.
[53] J. Camargo, A. Alonso, Ecological and toxicological effects of inorganic nitrogenpollution in aquatic ecosystems: a global assessment, Environ. Int. 32 (2006)831–849.
[54] B.U. Bae, Y.H. Jung, W.W. Han, H.S. Shin, Improved brine recycling duringnitrate removal using ion exchange, Water Res. 36 (2002) 3330–3340.
[55] J.J. Schoeman, A. Steyn, Nitrate removal with reverse osmosis in a rural areain South Africa, Desalination 155 (2003) 15–26.
[56] A. Pintar, B. Jurka, I. Musevic, Palladium-copper and palladium-tin catalystsin the liquid phase nitrate hydrogenation in a batch-recycled reactor, Appl.Catal. B: Environ. 52 (2004) 49–60.
[57] J.W. Peel, K.J. Reddy, B.P. Sullivan, J.M. Bowen, Electrocatalytic reduction ofnitrate in water, Water Res. 37 (2003) 2512–2519.
[58] K.M. Hiscock, J.W. Lloyd, D.N. Lerner, Review of natural and artificial denitri-fication of groundwater, Water Res. 25 (1991) 1099–1111.
[59] A. Kapoor, T. Viraraghavan, Nitrate removal from drinking water – review, J.Environ. Eng. 123 (1997) 371–380.
[60] C. Della Rocca, V. Belgiorno, S. Meric, Heterotrophic/autotrophic denitrifica-tion (HAD) of drinking water: prospective use for permeable reactive barrier,Desalination 210 (2007) 194–204.
[61] S. Aslan, Combined removal of pesticides and nitrates in drinking watersusing biodenitrification and sand filter system, Process Biochem. 40 (2005)417–424.
[62] E. Wasik, J. Bohdziewicz, M. Blaszczyk, Removal of nitrates from ground waterby a hybrid process of biological denitrification and microfiltration, ProcessBiochem. 37 (2001) 57–64.
[63] J.J. Her, J.S. Huang, Influence of carbon source and C/N ratio on nitrate/nitritedenitrification and carbon breakthrough, Bioresour. Technol. 54 (1995)45–51.
[64] S. Aslan, A. Turkman, Combined biological removal of nitrate and pesti-cides using wheat straw as substrates, Process Biochem. 40 (2005) 935–943.
[65] H. Liu, W. Jiang, D. Wan, J. Qu, Study of a combined heterotrophic and sul-fur autotrophic denitrification technology for removal of nitrate in water, J.Hazard. Mater. 169 (2009) 23–28.
[66] V. Mateju, S. Cizinska, J. Krejci, T. Janoch, Biological water denitrification – areview, Enzyme Microb. Technol. 14 (1992) 170–183.
[67] U. Rott, B. Lamberth, Subterranean denitrification for the treatment of drink-ing water, Water Supply 10 (1992) 111–120.
[68] J.Y. Park, Y.J. Yoo, Biological nitrate removal in industrial wastewater treat-ment: which electron donor we can choose, Appl. Microbiol. Biotechnol. 82(2009) 415–429.
[69] A. Koenig, L.H. Liu, Kinetic model of autotrophic denitrification in sulphurpacked-bed reactors, Water Res. 35 (2001) 1969–1978.
[70] L.H. Liu, A. Koenig, Use of limestone for pH control in autotrophic denitrifica-tion: batch experiments, Process Biochem. 37 (2002) 885–893.
[71] H.S. Moon, K.H. Ahn, S. Lee, K. Nam, J.Y. Kim, Use of autotrophic sulphur oxi-dizers to remove nitrate from bank filtrate in a permeable reactive barriersystem, Environ. Pollut. 129 (2004) 499–507.
[72] M.I.M. Soares, Biological denitrification of groundwater, Water Air Soil Pollut.123 (2000) 183–193.
[73] H. Wang, J. Qu, Combined bioelectrochemical and sulfur autotrophic denitri-
fication for drinking water treatment, Water Res. 37 (2003) 3767–3775.[74] M.O. Rivett, S.R. Buss, P. Morgan, J.W.N. Smith, C.D. Bemment, Nitrate attenua-tion in groundwater: a review of biogeochemical controlling processes, WaterRes. 42 (2008) 4215–4232.
[75] B.E. Rittmann, R. Nerenberg, K.C. Lee, I. Najm, T.E. Gillogly, G.E. Lehman,S.S. Adham, The hydrogen-based hollow-fiber membrane biofilm reactor
ous Materials 180 (2010) 20–37
(HFMBfR) for reducing oxidized contaminants, Water Sci. Technol.: WaterSupply 4 (2004) 127–133.
[76] R. Knowles, Denitrification, Microbiol. Rev. 46 (1982) 43–70.[77] V. Haring, R. Conrad, Kinetics of H2 oxidation in respiring and denitrifying
Paracoccus denitrificans, FEMS Microbiol. Lett. 78 (1991) 259–264.[78] R.L. Smith, M.L. Ceazan, M.H. Brooks, Autotrophic, hydrogen-oxidizing,
denitrifying bacteria in groundwater, potential agents for bioremedia-tion of nitrate contamination, Appl. Environ. Microbiol. 60 (1994) 1949–1955.
[79] S. Szekeres, I. Kiss, M. Kalman, M.I.M. Soares, Microbial populationin a hydrogen-dependent denitrification reactor, Water Res. 36 (2002)4088–4094.
[80] A.K. Sahu, T. Conneely, K. Nusslein, S.J. Ergas, Hydrogenotrophic denitrifi-cation and perchlorate reduction in ion exchange brines using membranebiofilm reactors, Biotechnol. Bioeng. 104 (2009) 483–491.
[81] H.I. Park, J.S. Kim, D.K. Kim, Y.J. Choi, D. Pak, Nitrate-reducing bacterial com-munity in a biofilm-electrode reactor, Enzyme Microb. Technol. 39 (2006)453–458.
[82] Y. Zhang, F. Zhong, S. Xia, X. Wang, J. Li, Autohydrogenotrophic denitrificationof drinking water using a polyvinyl chloride hollow fiber membrane biofilmreactor, J. Hazard. Mater. 170 (2009) 203–209.
[83] I.A. Vasiliadou, S. Siozios, I.T. Papadas, K. Bourtzis, S. Pavlou, D.V. Vayenas,Kinetics of pure cultures of hydrogen-oxidizing denitrifying bacteria andmodeling of the interactions among them in mixed cultures, Biotechnol. Bio-eng. 95 (2006) 513–525.
[84] M.C. Arquiaga, L.W. Center, Microbiology of high-sodium-nitrate wastewatertreatment, Environ. Pollut. 31 (1993) 1–6.
[85] A. Tiemeyer, H. Link, D. Weuster-Botz, Kinetic studies on autohy-drogenotrophic growth of Ralstonia eutropha with nitrate as terminalelectron acceptor, Appl. Microbiol. Biotechnol. 76 (2007) 75–81.
[86] A. Mariotti, Denitrification in groundwaters, principles and methods for itsidentification: a review, J. Hydrol. 88 (1986) 1–23.
[87] W.G. Zumft, The denitrifying prokaryotes, in: A. Balows, H.G. Truper, M.Dworkin, W. Harder, K.H. Schleife (Eds.), The Prokaryotes. A handbook onthe biology of Bacteria: Ecophysiology Isolation Identification Applications,Springer–Verlag, New York, 1992, pp. 554–582.
[88] L. Metcalf, H. Eddy, Wastewater Engineering Treatment and Reuse, fourth ed.,McGraw-Hill, Singapore, 2004.
[89] P.L. McCarty, Stoichiometry of biological reactions, in: Proceedings of theInternational Conference Towards a Unified Concept of Biological WasteTreatment Design, Atlanta, GA, October 6, 1972.
[90] S. Ghafari, M. Hasan, M.K. Aroua, Improvement of autohydrogenotrophicnitrite reduction rate through optimization of pH and bicarbonate dose ina batch experiments, J. Biosci. Bioeng. 107 (2009) 275–280.
[91] S. Ghafari, M. Hasan, M.K. Aroua, A kinetic study of autohydrogenotrophicdenitrification at the optimum pH and sodium bicarbonate dose, Bioresour.Technol. 101 (2010) 2236–2242.
[92] J.H. Shin, B.I. Sang, Y.C. Chung, Y.K. Choung, The removal of nitrogen using anautotrophic hybrid hollow-fiber membrane biofilm reactor, Desalination 183(2005) 447–454.
[93] B. Rezania, J.A. Oleszkiewicz, N. Cicek, H. Mo, Hydrogen dependent denitrifi-cation in an alternating anoxic–aerobic SBR membrane bioreactor, Water Sci.Technol. 51 (2005) 403–409.
[94] J.H. Hwang, N. Cicek, J.A. Oleszkiewicz, Inorganic precipitation duringautotrophic denitrification under various operating conditions, Environ.Technol. 30 (2009) 1475–1485.
[95] D. Celmer, J. Oleszkiewicz, N. Cicek, H. Husain, Hydrogen limitation – amethod for controlling the performance of membrane biofilm reactor forautotrophic denitrification of wastewater, Water Sci. Technol. 54 (2006) 165–172.
[96] D. Jha, P. Bose, Use of pyrite for pH control during hydrogenotrophic denitri-fication using metallic iron as the ultimate electron donor, Chemosphere 61(2005) 1020–1031.
[97] N.C. Brady, R.R. Weil, The Nature and Properties of Soils, 13th ed., PrenticeHall, New Jersey, 2002.
[98] M. Komori, Y. Sakakibara, High-rate hydrogenotrophic denitrification ina fluidized-bed biofilm reactor using solid-polymer-electrolyte membraneelectrode (SPEME), Water Sci. Technol. 58 (2008) 1441–1446.
[99] E. Arvin, G.H. Kristensen, Effect of denitrification on the pH in biofilms, WaterSci. Technol. 14 (1982) 833–848.
[100] J.R.V. Flora, M.T. Suidan, P. Biswas, G.D. Sayles, Modeling substrate transportinto biofilms: role of multiple ions and pH effects, J. Environ. Eng. 119 (1993)908–930.
[101] S. Islam, M.T. Suidan, Electrolytic denitrification: long term performance andeffect of current intensity, Water Res. 32 (1998) 528–536.
[102] B. Rezania, J.A. Oleszkiewicz, N. Cicek, Hydrogen-driven denitrification ofwastewater in an anaerobic submerged membrane bioreactor: Potential forwater reuse, Water Sci. Technol. 54 (2006) 207–214.
[103] Y.C. Chiu, M.S. Chung, Determination of optimal COD/nitrate ratio for biolog-ical denitrification, Int. Biodeterior. Biodegrad. 51 (2003) 43–49.
[104] Y.S. Kim, K. Nakano, T.J. Lee, S. Kanchanatawee, M. Matsumura, On-site nitrateremoval of groundwater by an immobilized psychrophilic denitrifier usingsoluble starch as a carbon source, J. Biosci. Bioeng. 93 (2002) 303–308.
[105] R.R. Nair, P.B. Dhamole, S.S. Lele, S.F. D’Souza, Biological denitrification of highstrength nitrate waste using preadapted denitrifying sludge, Chemosphere 67(2007) 1612–1617.

Hazard
K.A. Karanasios et al. / Journal of[106] C. Lu, P. GU, P. He, G. Zhang, C. Song, Characteristics of hydrogenotrophic den-itrification in a combined system of gas-permeable membrane and a biofilmreactor, J. Hazard. Mater. 168 (2009) 1581–1589.
[107] N. Sunger, P. Bose, Autotrophic denitrification using hydrogen generated frommetallic iron corrosion, Bioresour. Technol. 100 (2009) 4077–4082.
[108] R. Vangheei, H. Ganjidoust, A.A. Azimi, B. Ayati, Nitrate removal fromdrinking water in a packed-bed bioreactor coupled by a methanol-basedelectrochemical gas generator, Environ. Prog. Sustain. Energy (2009),doi:10.1002/ep.10404.
[109] J.W. Lee, K.H. Lee, K.Y. Park, S.K. Maeng, Hydrogenotrophic denitrification ina packed bed reactor: effects of hydrogen to water flow rate ratio, Bioresour.Technol. 101 (2010) 3940–3946.
[110] D.P. Smith, T. Rector, K. Reid-Black, M. Hummerick, R. Strayer, M. Birmele,M.S. Roberts, J.L. Garland, Redox control bioreactor: a unique biological waterprocessor, Biotechnol. Bioeng. 99 (2007) 830–845.
[111] J.H. Shin, B.I. Sang, Y.C. Chung, Y.K. Choung, A novel CSTR-type of hollow fibermembrane biofilm reactor for consecutive nitrification and denitrification,Desalination 221 (2008) 526–533.
[112] D.K. Roggy, P.J. Novak, R.M. Hozalski, L.W. Clapp, M.J. Semmens, Membranegas transfer for groundwater remediation: chemical and biological fouling,Environ. Eng. Sci. 19 (2002) 563–574.
[113] D. Celmer, J.A. Oleszkiewicz, N. Cicek, Impact of shear force on the biofilm
structure and performance of a membrane biofilm reactor for tertiaryhydrogen-driven denitrification of municipal wastewater, Water Res. 42(2008) 3057–3065.[114] B. Rezania, J.A. Oleszkiewicz, N. Cicek, Hydrogen-dependent denitrification ofwater in an anaerobic submerged membrane bioreactor coupled with a novelhydrogen delivery system, Water Res. 41 (2007) 1074–1080.
ous Materials 180 (2010) 20–37 37
[115] I. Kiss, S. Szekeres, T.T. Bejerano, M.I.M. Soares, Hydrogen-dependent denitri-fication: preliminary assessment of two bio-electrochemical systems, WaterSci. Technol. 42 (2000) 373–379.
[116] Y. Sakakibara, K. Araki, T. Watanabe, M. Kuroda, The denitrification and neu-tralization performance of an electrochemically activated biofilm reactorused to treat nitrate-contaminated groundwater, Water Res. 36 (1997) 61–68.
[117] Z. Feleke, K. Araki, Y. Sakakibara, T. Watanabe, M. Kuroda, Selective reductionof nitrate to nitrogen gas in a biofilm-electrode reactor, Water Res. 32 (1998)2728–2734.
[118] R.V. Flora, M.T. Suidan, S. Islam, P. Biswas, Y. Sakakibara, Numerical modellingof a biofilm-electrode reactor used for enhanced denitrification, in: Proceed-ings of the Second International Specialized Conference on Biofilm Reactors,1993, pp. 613–620.
[119] Y. Sakakibara, T. Tanaka, K. Ihara, T. Watanabe, M. Kuroda, An in-situ denitrifi-cation of nitrate-contaminated groundwater using electrodes, Proc. Environ.Eng. Res. 32 (1995) 407–415.
[120] S. Ghafari, M. Hasan, M.K. Aroua, Nitrate remediation in a novel upflow bio-electrochemical reactor (UBER) using palm shell activated carbon as cathodematerial, Electrochim. Acta 54 (2009) 4164–4171.
[121] J. Virkutyte, V. Jegatheesan, Electro-fenton, hydrogenotrophic and Fe2+ ionsmediated TOC and nitrate removal from aquaculture system: different exper-imental strategies, Bioresour. Technol. 100 (2009) 2189–2197.
[122] B.E. Rittmann, J.M. Regan, D.A. Stahl, Nitrification as a source of soluble organicsubstrate in biological treatment, Water Sci. Technol. 30 (1994) 1–8.
[123] United States Environmental Protection Agency (USEPA), Guidelines forWater Reuse, EPA/625/R-04/108, Washington DC, USA, (2004).
[124] J. Ginocchio, Process and apparatus for the denitrification of groundwater,European Patent Appl., EP 86863 Al, Aug. 31 (1983).