Electron cryomicroscopy and bioinformatics suggest protein fold models for rice dwarf virus
Upload
independentCategory
view
2download
0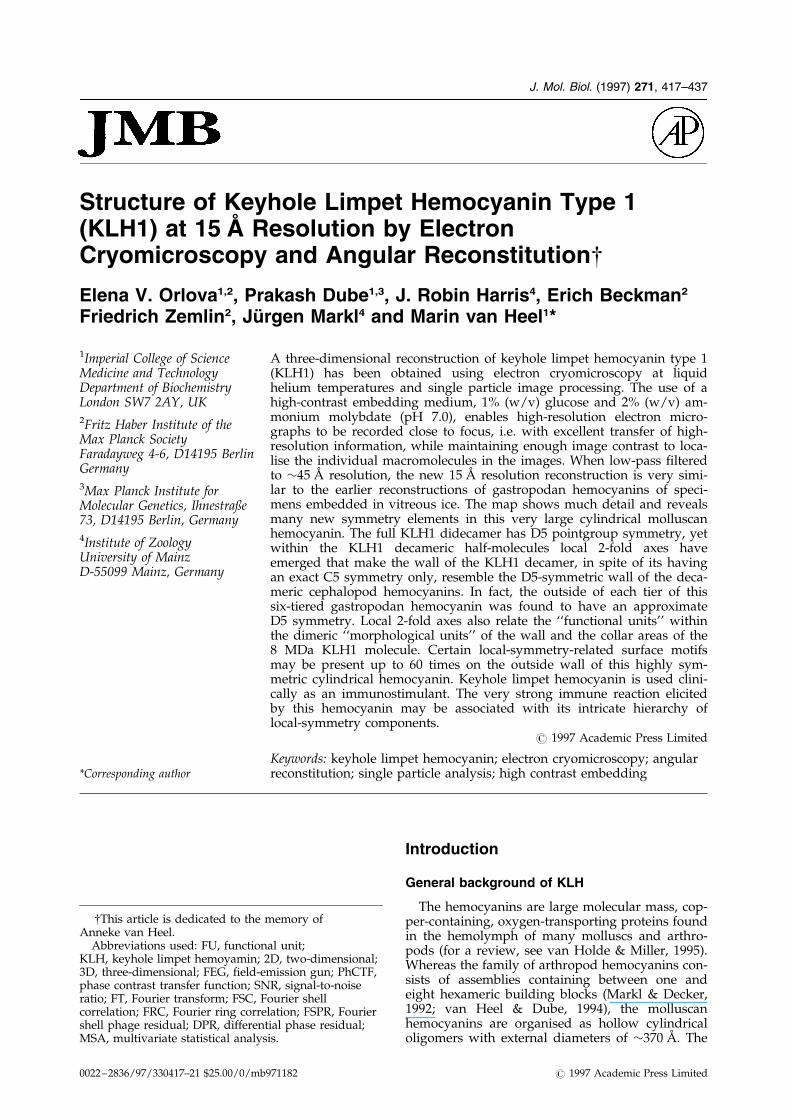
Structure of Keyhole Limpet Hemocyanin Type 1(KLH1) at 15 AÊ Resolution by ElectronCryomicroscopy and Angular Reconstitution{
Elena V. Orlova1,2, Prakash Dube1,3, J. Robin Harris4, Erich Beckman2
Friedrich Zemlin2, JuÈ rgen Markl4 and Marin van Heel1*
1Imperial College of ScienceMedicine and TechnologyDepartment of BiochemistryLondon SW7 2AY, UK2Fritz Haber Institute of theMax Planck SocietyFaradayweg 4-6, D14195 BerlinGermany3Max Planck Institute forMolecular Genetics, Ihnestraûe73, D14195 Berlin, Germany4Institute of ZoologyUniversity of MainzD-55099 Mainz, Germany
A three-dimensional reconstruction of keyhole limpet hemocyanin type 1(KLH1) has been obtained using electron cryomicroscopy at liquidhelium temperatures and single particle image processing. The use of ahigh-contrast embedding medium, 1% (w/v) glucose and 2% (w/v) am-monium molybdate (pH 7.0), enables high-resolution electron micro-graphs to be recorded close to focus, i.e. with excellent transfer of high-resolution information, while maintaining enough image contrast to loca-lise the individual macromolecules in the images. When low-pass ®lteredto �45 AÊ resolution, the new 15 AÊ resolution reconstruction is very simi-lar to the earlier reconstructions of gastropodan hemocyanins of speci-mens embedded in vitreous ice. The map shows much detail and revealsmany new symmetry elements in this very large cylindrical molluscanhemocyanin. The full KLH1 didecamer has D5 pointgroup symmetry, yetwithin the KLH1 decameric half-molecules local 2-fold axes haveemerged that make the wall of the KLH1 decamer, in spite of its havingan exact C5 symmetry only, resemble the D5-symmetric wall of the deca-meric cephalopod hemocyanins. In fact, the outside of each tier of thissix-tiered gastropodan hemocyanin was found to have an approximateD5 symmetry. Local 2-fold axes also relate the ``functional units'' withinthe dimeric ``morphological units'' of the wall and the collar areas of the8 MDa KLH1 molecule. Certain local-symmetry-related surface motifsmay be present up to 60 times on the outside wall of this highly sym-metric cylindrical hemocyanin. Keyhole limpet hemocyanin is used clini-cally as an immunostimulant. The very strong immune reaction elicitedby this hemocyanin may be associated with its intricate hierarchy oflocal-symmetry components.
# 1997 Academic Press Limited
Keywords: keyhole limpet hemocyanin; electron cryomicroscopy; angularreconstitution; single particle analysis; high contrast embedding*Corresponding author
Introduction
General background of KLH
The hemocyanins are large molecular mass, cop-per-containing, oxygen-transporting proteins foundin the hemolymph of many molluscs and arthro-pods (for a review, see van Holde & Miller, 1995).Whereas the family of arthropod hemocyanins con-sists of assemblies containing between one andeight hexameric building blocks (Markl & Decker,1992; van Heel & Dube, 1994), the molluscanhemocyanins are organised as hollow cylindricaloligomers with external diameters of �370 AÊ . The
{This article is dedicated to the memory ofAnneke van Heel.
Abbreviations used: FU, functional unit;KLH, keyhole limpet hemoyamin; 2D, two-dimensional;3D, three-dimensional; FEG, ®eld-emission gun; PhCTF,phase contrast transfer function; SNR, signal-to-noiseratio; FT, Fourier transform; FSC, Fourier shellcorrelation; FRC, Fourier ring correlation; FSPR, Fouriershell phage residual; DPR, differential phase residual;MSA, multivariate statistical analysis.
J. Mol. Biol. (1997) 271, 417±437
0022±2836/97/330417±21 $25.00/0/mb971182 # 1997 Academic Press Limited

polypeptide chain has a mass of 350 to 450 kDaand consists of a string of seven or eight functionalsubstructures, sometimes termed functional do-mains. We prefer the term functional unit (FU),since the word domain possesses a more speci®cmeaning when applied to the crystal structure of aprotein. The hemocyanins of the cephalopod mol-luscs contain ten such polypeptide chains, alwaysforming a single decameric cylinder of height�200 AÊ (mass 3.5 to 4 MDa), whereas gastropodmolluscs contain hemocyanins built from two (ormore) decamers. The ``didecamer'', a cylinder witha total height of �400 AÊ and a mass of 7.5 to 8MDa, is often the predominant hemocyanin species(e.g. KLH1), although longer multidecamers aresometimes encountered (e.g. KLH2). The hemocya-nin from the giant keyhole limpet Megathura crenu-lata that we study here has undergone extensiveinvestigation as a potent immunostimulant inmammals, including man. KLH is used, or is beinginvestigated, as an immunotherapeutic agent (oftenas hapten carrier) for the treatment of certain can-cers including melanoma (Helling et al., 1994),breast cancer (Longenecker et al., 1993), ovariancancer (Yacyshyn et al., 1995), bladder cancer(Wishahi et al., 1995); KLH is used as a diagnostictool for bilharziosis and as a hapten carrier for anAIDS vaccine (Naylor et al., 1991).
Molluscan hemocyanin biochemistry
Molluscan hemocyanin chains generally haveseven or eight functional units (i.e. oxygen-bindingunits), depending on the species (van Holde &Miller, 1995). The functional units are named athrough g for the seven-FU species or a through hfor the eight-FU species. The eight-FU gastropodanhemocyanins have an extra FU at the C-terminalside of the chain when compared with the cephalo-pod seven-FU subunits, such as that of Octopus do-¯eini. Cephalopod hemocyanin subunits with eightfunctional units, such as from Sepia of®cinalis, havean extra functional unit at the N-terminal side ofthe chain and their FU nomenclature is thus frame-shifted over a full functional unit with respect tothe seven-FU cephalopod or the eight-FU gastro-pod hemocyanin polypeptides.
Molluscan hemocyanin structure
The structure of the large molecular mass mol-luscan hemocyanins has been studied by trans-mission electron microscopy since the introductionof the negative staining technique (van Bruggenet al., 1960; Fernandez-MoraÂn et al., 1966). Thebasic oligomeric molluscan hemocyanin assembly,including KLH, is a cylindrical three-tiered deca-mer (Mellema & Klug, 1972; Siezen & vanBruggen, 1974; Miller et al., 1990; Harris et al., 1992;Lamy et al., 1993; Lambert et al., 1994). The three-tiered decamer in a cephalopod is thought to havea D5 (also known as 52) pointgroup symmetry (cf.Lambert et al., 1994), the most likely pointgroup
symmetry for a homodecamer. In the case of gas-tropod hemocyanins, the top and bottom of the cy-lindrical homodecamer are not identical: thepointgroup symmetry of the decamer is thus C5rather than D5. The gastropod hemocyanin deca-mers form a stable dimer, the didecamer, of mass�8 MDa with a D5 pointgroup symmetry(Mellema & Klug, 1972). At each end of the cylind-rical didecamer a ``collar'' region has been de®nedwithin the inner wall of the outer tiers of the struc-ture.
KLH biochemistry
It was recently shown that the giant keyhole lim-pet M. crenulata contains two types of hemocyanin:an eight-FU KLH1 and a seven-FU KLH2 molecule(Markl et al., 1991; Gebauer et al., 1994; SoÈhngenet al., 1995), which can be separated biochemically(Harris et al., 1995a; Swerdlow et al., 1996). Struc-tural studies can now be pursued using puri®edKLH1 rather than using a mixture of the two typesof hemocyanin (Harris et al., 1992, 1993, 1997;Dube et al., 1995a). Biochemical and immunologicalstudies on KLH1 and KLH2 (Markl et al., 1991;Gebauer et al., 1994; SoÈhngen et al., 1995, 1997)have provided insights into the functional unit or-ganisation of the polypeptides. The polypeptideshave a molecular mass of �400 kDa for KLH1 and�350 kDa for KLH2, with a C-terminal h FU miss-ing in KLH2. The data obtained correlate well withthe immunomicroscopical studies on KLH2 usingmonoclonal antibodies of de®ned functional unitspeci®city (Harris et al., 1993). The collar of theKLH1 didecamer structure is thought to containthe C-terminal FUs (g and/or h) of the chains. Inthe case of Helix pomatia hemocyanin, the collar canbe removed by limited trypsinolysis, leaving multi-FU fragments that spontaneously form hollowcylindrical tubes (van Breemen et al., 1975, 1979) ofdiameter similar to that of the didecamers.
Recent 3D reconstructions ofmolluscan hemocyanins
Recently, efforts have been made to producethree-dimensional (3D) reconstructions from un-stained molluscan hemocyanin molecules em-bedded in vitreous ice (Lambert et al., 1994,1995a,b; Dube et al., 1995a). At the 43 to 45 AÊ levelof resolution obtained in these 3D reconstructionsone can recognise the overall structural organis-ation of the hemocyanin and its main structuralcomponents: the wall, the collar and the arc. Theinternal arc structure is attached to the central tierof the decamers, but from these reconstructions(Lambert et al., 1995 a,b; Dube et al., 1995a) it is notyet clear whether, or to what extent, the arc andcollar structures are directly connected in gastropo-dan hemocyanins. The reconstructions by Lambertet al., (1995a,b) were primarily calculated using therandom conical tilt (RCT) technique, also known asthe SECReT technique, developed by Radermacher
418 15 AÊ Structure of KLH1
et al. (1988). This technique, however, has some in-herent limitations that make it dif®cult to achievehigh-resolution levels (van Heel et al., 1992b;Schatz et al., 1995).
Structure by angular reconstitution
The angular reconstitution approach (van Heel,1987b; van Heel et al., 1992b) has recently beenbrought to the stage of almost-routine, applicableto individual macromolecules with arbitrarypointgroup symmetry (C4, Serysheva et al., 1995,Orlova et al., 1996a; D5, Dube et al., 1995a; D6,Schatz et al., 1995; C13, Tavares et al., 1995; vanHeel et al., 1996). The extremes are the entirelyasymmetric 70 S Escherichia coli ribosome (Starket al., 1995, 1997), on the one hand, and viruseswith icosahedral symmetry (unpublished results)on the other. With the angular reconstitution ap-proach, thousands of molecular images from par-ticles randomly oriented in an embedding matrixare sorted and classi®ed into ``characteristic views''(van Heel & StoÈ f¯er-Meilicke, 1985) by multi-refer-ence alignment techniques and multivariate statisti-cal classi®cation. The characteristic views are classaverages into which a number of similar molecularimages are averaged in order to reduce the noiseinherent in low-dose electron micrographs. Onecan then assign Euler angle orientations to the indi-vidual characteristic views and calculate a 3D re-construction. A ®rst 3D reconstruction of thekeyhole limpet hemocyanin embedded in vitreousice was recently presented (Dube et al., 1995a) butthe samples contained a mixture of KLH1 andKLH2 (although probably considerably moreKLH1 than KLH2). Moreover, the sample yieldedonly a small number of useable molecular images(only �125 ``side'' views were processed), thus lim-iting the attainable resolution. The purpose of thecurrent study is to improve the resolution of theKLH reconstruction, using only the puri®ed KLH1hemolymph component.
High-contrast embedding media
The ®rst electron images of unstained hemocya-nins (Stanley & Anderson, 1942; images repro-duced by van Bruggen, 1986) revealed theaverage diameter of the assemblies. It was onlywith the introduction of the negative stain tech-nique (Brenner & Horne, 1959; van Bruggen et al.,1960; Fernandez-MoraÂn et al., 1966) that individ-ual macromolecules could be visualised in theelectron microscope with some structural detail.In its ®rst decennium, then, the improvements ofthe specimen preparation techniques were aimedat improved visualisation of small details in themacromolecules. For the conventional uranyl acet-ate negative stain technique, optimising the con-ditions for direct visual interpretation of theimages appears to have stimulated some un-favourable habits in specimen preparation: (a) theenhancement of strong preferential attachment of
the protein on the carbon support ®lm producesrecognisable views but may deform the structure;(b) partial-depth, one-sided staining produces®ner recognisable details in the molecular imagesthan does a complete embedding into a matrix;and (c) partial dissociation of the macromoleculesby the low pH stain and the strong interactionsat carbon-®lm interface further enhance ``®ne de-tails'' in the structure. The properties of negativestaining techniques have been investigated byseveral workers (Kellenberger et al., 1982; Cejkaet al., 1991, 1992; Bremer et al., 1992; Harris &Horne, 1994).
With the advent of image processing and 3D re-constructions in electron microscopy (Crowtheret al., 1970a; DeRosier & Moore, 1970; Mellema &Klug, 1972) the structural preservation of the speci-men has become a more important issue. In orderto be able to apply a 3D reconstruction algorithm,which invariably relies on some form of the centralsection theorem (Bracewell, 1956, 1960; DeRosier &Klug, 1968), it was important to have the moleculesfully and homogeneously surrounded by the em-bedding material. The introduction of glucose em-bedding (Unwin & Henderson 1975; Henderson &Unwin, 1975) and the vitreous-ice embedding tech-nique (Dubochet et al., 1988), led to impressive 3Dresults. These homogeneous embedding mediaproved superior to the conventional negative stain-ing techniques. Other carbohydrates such as treha-lose (Jap & Walian, 1990) and tannin (Akey &Edelstein, 1983; KuÈ hlbrandt & Wang, 1991) werealso used successfully to image biological struc-tures at high levels of resolution.
Nevertheless, the negative staining techniquehas advantages in terms of ease of specimenpreparation with respect to the vitreous-ice em-bedding techniques, so it has continued to beused extensively, even if just for checkingwhether a sample is good enough for the vitr-eous-ice approach (Bremer et al., 1992). High-con-trast embedding media have also been promotedas homogeneous environments for preserving 3Dstructures (Stoops et al., 1992; Ris & Allen, 1975;Malecki & Ris, 1993). It has been our philosophyfor some years now (Dube et al., 1995b; Boettcheret al., 1996; Harris et al., 1995b, 1997), that ahigh-contrast embedding medium facilitates thedata processing as long as it does not interferewith the macromolecular structure and does in-deed envelop the molecules completely (in ``deepstain''). The idea is that the high contrast be-tween protein and medium helps in ®nding theparticle and is instrumental in attaining a goodinter-particle alignment. The relatively high con-trast between protein and surrounding, however,should preferably not contribute to the internalcontrast within the particle. The internal densityvariations within the protein are expected to bemainly caused by, for example, the secondarystructure of the protein. Such high-resolution in-formation remains accessible only by averagingover a suf®ciently large number of individual
15 AÊ Structure of KLH1 419

molecular images. A preliminary 3D reconstruc-tion of the Lumbricus terrestris giant hemoglobinstructure embedded in glucose/ammonium mol-ybdate was calculated at the 15 AÊ resolution level(Dube et al., 1995b). We here apply these ideasfor the ®rst time to elucidate the 3D structure ofa molluscan hemocyanin, KLH1. A preliminaryreport on this work has been presented (Orlovaet al., 1996b).
Results
Specimen preparation and microscopy
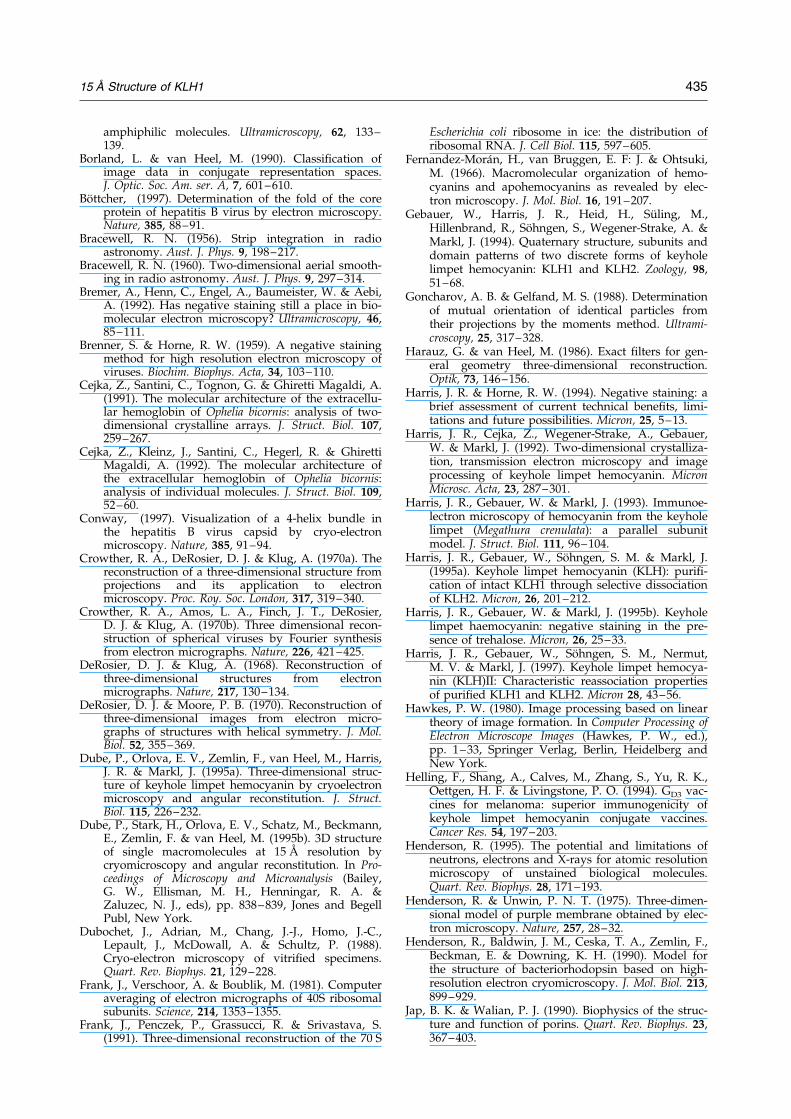
KLH1 was puri®ed from total KLH obtainedfrom the hemolymph of freshly imported keyholelimpets, as described in Material and Methods. Thesamples were mixed with the glucose/ammoniummolybdate solution and then applied to a carbonsupport ®lm. The grids were imaged in theSOPHIE (Zemlin et al., 1996) liquid-helium cryomi-croscope equipped with a highly coherent Schottky®eld-emission gun (FEG). The very low specimentemperature provides the highest possible cryopro-tection factor (Zemlin et al., 1996), and the highlycoherent beam from the FEG guarantees a maxi-mum transfer of the high-frequency information tothe photographic plate. Part of a representativemicrograph is shown in Figure 1. Note that themolecules are totally embedded in an evenlyspread layer of glucose-negative stain. In this prep-aration most of the cylindrical molecules werefound to be oriented on their sides, indicating arelatively strong interaction between molecule andthe grid surface. The relatively high contrast of theglucose/ammonium molybdate embedding med-ium allows us to readily de®ne the particles inimages such as this (Figure 1), in which the ®rstzero of the phase contrast transfer function(PhCTF) of the electron microscope lies between 6and 8 AÊ . In contrast, in images of molecules em-bedded in vitreous ice (Dube et al., 1995a) the par-
ticles are no longer visible when the micrographsare taken so close to focus. The glucose-stainmicrographs were digitised using an EMiL linearCCD densitometer (Image Science SoftwareGmbH), and 4200 molecular images were selectedfor processing with the IMAGIC image processingsystem (van Heel et al., 1996) on standard worksta-tion computers running the UNIX and Open-VMSoperating systems.
Figure 1. Part of a typical electron micrograph of puri-®ed KLH1 didecamers in a relatively high-contrastembedding medium consisting of 1% glucose in combi-nation with 2% ammonium molybdate. In this electronmicroscopical specimen, the rectangular sideviews of themolecule predominate (protein is black; the contrast isreversed compared to a conventional print of the micro-graph). The cylindrical KLH1 molecule has a diameterof �370 AÊ and a height of �400 AÊ . The high-contrastembedding medium allows the micrographs to be takenclose to focus without visually losing the particles. Theimages were taken on the SOPHIE electron cryomicro-scope at liquid helium temperatures. The ®rst zero ofthe phase contrast transfer function (PhCTF) of the elec-tron microscope was at �7 AÊ in all micrographs, and4186 molecular images were collected for processing.The scale bar represents 1000 AÊ .
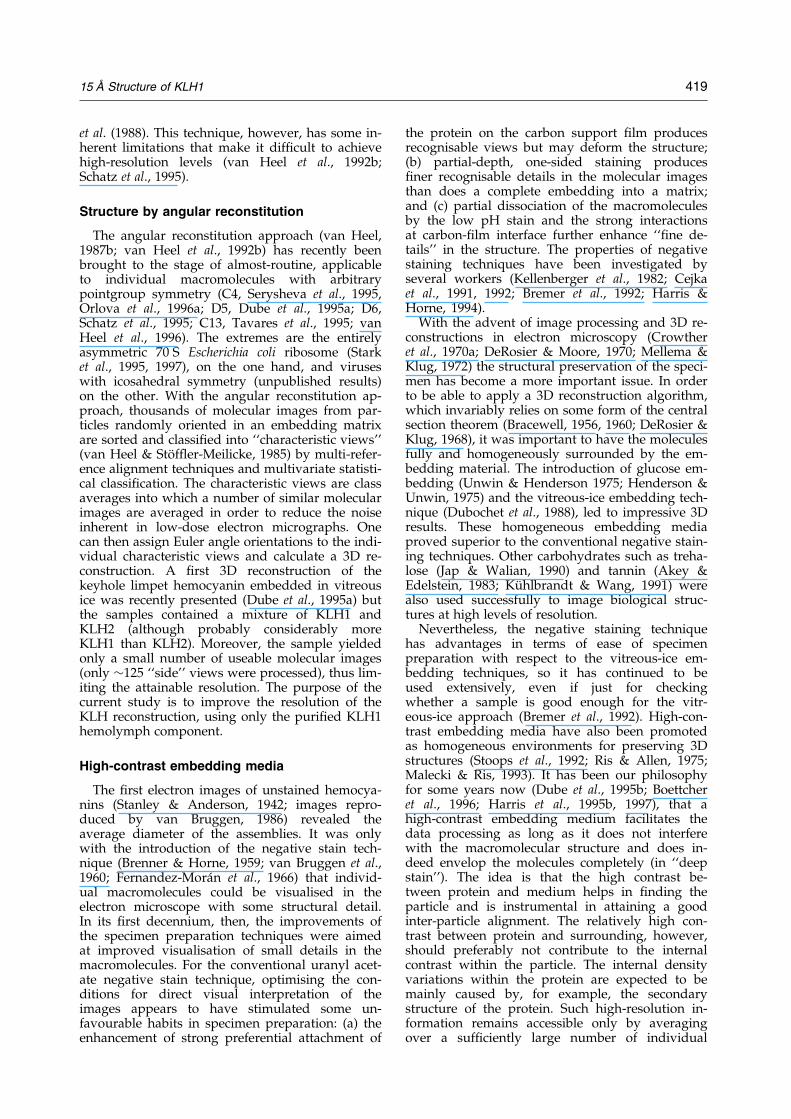
Figure 2. A summary of the 3Danalysis of the KLH1 didecamers.a, Top row, examples of originalmolecular images; these images aremembers of the respective classaverages shown in the next row(protein is white). b, Row 2, charac-teristic sideviews (class averages)of the KLH1 didecamer obtainedby multi-reference alignment andclassi®cation. About 160 character-istic views were used for 3D recon-struction. c, Row 3, 3D structure ofthe KLH1 didecamers reprojectedin the Euler angle directions foundfor the class averages in row 2. Thereliability of the 3D reconstruction
can be directly assessed by comparing of the images in rows 2 and 3. d, Row 4, surface representations of the 3Dreconstruction in viewing directions identical with the Euler directions assigned to the corresponding class averagesshown in row 2.
420 15 AÊ Structure of KLH1
The 3D image processing
The molecular images were processed bymulti-reference alignments techniques (van Heel& StoÈ f¯er-Meilicke, 1985) and multivariate statisti-cal classi®cation (van Heel, 1989) in order to ®ndthe characteristic molecular views in the sample.The molecular images (Figure 2a) are averagedinto these characteristic views or class averages(Figure 2b) to suppress the high noise levels in-herent in low-dose electron microscopy. The as-signment of Euler angle orientations to themolecular images by the angular reconstitutionapproach is greatly facilitated by the availabilityof the high signal-to-noise ratio (SNR) classaverages. Once these Euler orientations are avail-able, 3D reconstructions may be calculated andsubsequently re®ned iteratively, as described inMaterials and Methods. One way of monitoringthe convergence and consistency of the re®ne-ment steps is to computationally compare the re-projected (Figure 2c) 3D reconstruction (Figure 2d)in the Euler directions assigned to the classaverages with the corresponding class averages(Figure 2b). All 3D reconstructions presented hereare rendered using a threshold value leading to avolume of suf®cient size to enclose �100% of theexpected molecular mass (7.9 MDa). Before ela-borating on the high-resolution details of the new3D reconstruction, we compare it to earlier low-resolution results.
Validation of the deep-staining technique:comparison with vitreous-ice data
All recently presented 3D structures of mollus-can hemocyanins have been of vitreous-ice em-bedded specimens at a resolution level of �45(Dube et al., 1995a; Lambert et al., 1995a,b). To vali-date our high-contrast embedding medium withrespect to the established vitreous-ice medium, we®rst compare the new 3D results, low-pass ®lteredto �45 AÊ resolution (Figure 3a), with the earlier®ndings. The excessive smoothing of the recon-struction at this lower resolution removes ®ne de-tails on the protein surface but, for example, boththe collar and the arc domains compare well withthe previously reported data.
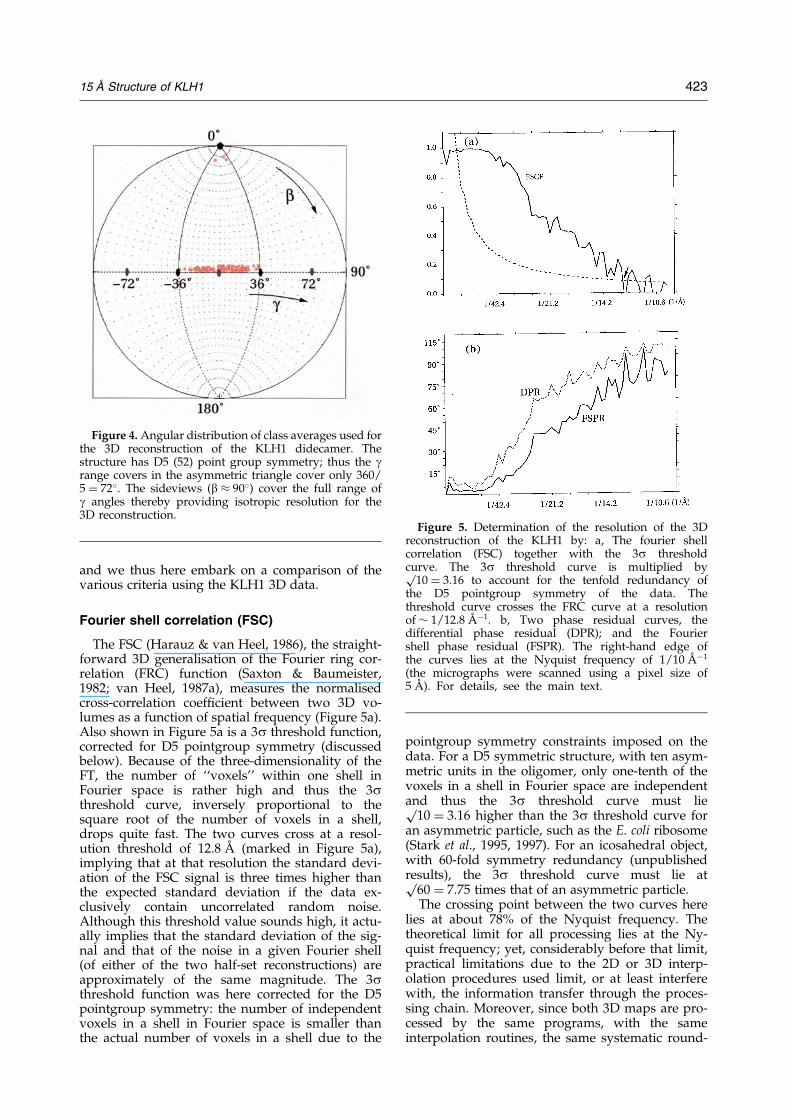
Euler angle distribution
In Figure 4 the angular distribution (b,g) of theclass averages used for calculating the 3D data isshown within the asymmetric triangle of the D5pointgroup symmetry. For the D5 pointgroup, theasymmetric triangle extends from the North pole(b � 0�) to the equator (b � 90�) where it covers anangular range of 72� (ÿ36� 4 g4 36�). Within thisasymmetric triangle, the projections in directions gand ÿg are mirror versions of each other that cor-respond (through all the applicable symmetry re-lations) to opposite projection directions on theunit sphere, and thus cover the same 3D infor-
mation. In consequence, the sideview band aroundb �90� has a twice higher sampling by projectiondirections than is suggested by this plot. Althoughthere is a preponderance of sideviews (b �90� cor-responds to sideviews), the homogeneous distri-bution of the g angles assigned to these sideviewsmeans that the class averages, together, represent afull tomographic ``tilt series'' of projections cover-ing the full information space (Figure 4).
The number of projection directions exceeds thetheoretical minimum number n required forachieving resolution fÿ1 of �15 AÊ within a D5 sym-metric structure with a size D of �400 AÊ . Thatnumber is given by the formula (free afterCrowther et al., 1970b; and after van Heel &Harauz, 1986):
nNSYM � pD=2fÿ1
Herein NSYM is the symmetrical redundancy; for aD5 symmetric structure, NSYM � 10. A symmetricmolecule thus clearly needs fewer projections inorder for the same resolution to be achieved. Inour case, with NSYM � 10, D � 400 AÊ , the numberof different projections needed is thus only �4 toreach a spatial frequency resolution of fÿ1 �15 AÊ .The formulas given by Crowther et al. (1970b) andby van Heel & Harauz (1986) are identical, apartfrom constant coef®cients. The formula given byCrowther et al. (1970b) applies for pure tomo-graphic tilt-series reconstruction, whereas the latterwas derived for general reconstruction geometries.The reconstruction geometry here is largely a to-mographic one because of the preponderance ofsideviews used for the reconstruction. The aboveresolution criteria are based exclusively on thecompleteness of the sampling in Fourier space: thepredicted resolutions obviously can be reachedonly if the projection images used for the recon-struction indeed contain that high-resolution infor-mation and are free from noise. Of course, muchmore realistic than such a theoretical resolutionlimit is a direct measurement of the reproducibleresolution achieved within a given 3D reconstruc-tion experiment.
Criteria of reproducible resolution
We have calculated two independent reconstruc-tions from the ®nal set of class averages (Figure 2b)by splitting that set into two halves and then usingthese to generate two different 3D maps. Both 3Dreconstructions are then Fourier transformed andthe comparison between the two 3D Fourier trans-forms (FTs) is performed using three different cri-teria, all of which compare the information in thetwo FTs over corresponding concentric shells(Figure 5). Since we are here discussing the resol-ution achievable with high-contrast embeddingmedia, we must carefully de®ne what is meant byresolution. The issue of 3D resolution criteria, how-ever, has been a controversial one (see Discussion)
15 AÊ Structure of KLH1 421

Figure 3. Stereo-pair surface representations of the KLH1 didecamer. a, The 3D reconstruction low-pass ®ltered to45 AÊ resolution for comparison with earlier vitreous-ice 3D reconstructions of KLH (Dube et al., 1995a) and other gas-tropodan didecamers (Lambert et al., 1995a,b). b, A phase contrast transfer function (PhCTF)-corrected version of thehigh-resolution reconstruction as described in the text. Because the ®rst zero of the PhCTF (�7 AÊ ) is beyond the resol-ution limit of the reconstruction (�15 AÊ ), the effect of the correction is only that of somewhat enhancing the low-fre-quency components with respect to the high-frequency image components (®ne details). c, The 15 AÊ KLH1reconstruction at a threshold level corresponding to an enclosed protein mass of 7.9 MDa.
and we thus here embark on a comparison of thevarious criteria using the KLH1 3D data.
Fourier shell correlation (FSC)
The FSC (Harauz & van Heel, 1986), the straight-forward 3D generalisation of the Fourier ring cor-relation (FRC) function (Saxton & Baumeister,1982; van Heel, 1987a), measures the normalisedcross-correlation coef®cient between two 3D vo-lumes as a function of spatial frequency (Figure 5a).Also shown in Figure 5a is a 3s threshold function,corrected for D5 pointgroup symmetry (discussedbelow). Because of the three-dimensionality of theFT, the number of ``voxels'' within one shell inFourier space is rather high and thus the 3sthreshold curve, inversely proportional to thesquare root of the number of voxels in a shell,drops quite fast. The two curves cross at a resol-ution threshold of 12.8 AÊ (marked in Figure 5a),implying that at that resolution the standard devi-ation of the FSC signal is three times higher thanthe expected standard deviation if the data ex-clusively contain uncorrelated random noise.Although this threshold value sounds high, it actu-ally implies that the standard deviation of the sig-nal and that of the noise in a given Fourier shell(of either of the two half-set reconstructions) areapproximately of the same magnitude. The 3sthreshold function was here corrected for the D5pointgroup symmetry: the number of independentvoxels in a shell in Fourier space is smaller thanthe actual number of voxels in a shell due to the
pointgroup symmetry constraints imposed on thedata. For a D5 symmetric structure, with ten asym-metric units in the oligomer, only one-tenth of thevoxels in a shell in Fourier space are independentand thus the 3s threshold curve must liep
10 � 3.16 higher than the 3s threshold curve foran asymmetric particle, such as the E. coli ribosome(Stark et al., 1995, 1997). For an icosahedral object,with 60-fold symmetry redundancy (unpublishedresults), the 3s threshold curve must lie atp
60 � 7.75 times that of an asymmetric particle.The crossing point between the two curves here
lies at about 78% of the Nyquist frequency. Thetheoretical limit for all processing lies at the Ny-quist frequency; yet, considerably before that limit,practical limitations due to the 2D or 3D interp-olation procedures used limit, or at least interferewith, the information transfer through the proces-sing chain. Moreover, since both 3D maps are pro-cessed by the same programs, with the sameinterpolation routines, the same systematic round-
Figure 4. Angular distribution of class averages used forthe 3D reconstruction of the KLH1 didecamer. Thestructure has D5 (52) point group symmetry; thus the grange covers in the asymmetric triangle cover only 360/5 � 72�. The sideviews (b � 90�) cover the full range ofg angles thereby providing isotropic resolution for the3D reconstruction.
Figure 5. Determination of the resolution of the 3Dreconstruction of the KLH1 by: a, The fourier shellcorrelation (FSC) together with the 3s thresholdcurve. The 3s threshold curve is multiplied byp
10 � 3.16 to account for the tenfold redundancy ofthe D5 pointgroup symmetry of the data. Thethreshold curve crosses the FRC curve at a resolutionof � 1/12.8 AÊ ÿ1. b, Two phase residual curves, thedifferential phase residual (DPR); and the Fouriershell phase residual (FSPR). The right-hand edge ofthe curves lies at the Nyquist frequency of 1/10 AÊ ÿ1
(the micrographs were scanned using a pixel size of5 AÊ ). For details, see the main text.
15 AÊ Structure of KLH1 423

off errors may be introduced in both reconstruc-tions, which the FSC program may see as common``information''. It is thus good practice not to inter-pret resolution curves at this high end of the resol-ution range. The sampling of the data at asampling interval of 5 AÊ , in our experience, effec-tively limits the attainable resolution to �15 AÊ
rather than to the theoretical Nyquist limit of 10 AÊ .This practical sampling resolution limit has beenreached in our experiment and we thus considerthe resolution attained here �15 AÊ , rather than the12.8 AÊ indicated by the FSC criterion.
Phase residuals
The two-dimensional DPR (Frank et al., 1981)and its 3D generalisation (Penczek et al., 1994) arede®ned using the sum of the Fourier space ampli-tudes to weight the phase differences between thetwo signals in Fourier space. Using a sum ratherthan a multiplication between corresponding am-plitudes means that, for example, the DPR changeswhen one image or 3D volume is multiplied by aconstant, which operation does not change the in-formation content of the data (van Heel, 1987a). Acorrected phase residual was proposed in the formof the Fourier ring phase residual (van Heel,1987a), which can straightforwardly be generalisedto its 3D equivalent, the Fourier shell phaseresidual (FSPR). The behaviour of the FSPR(Figure 5b) is quite similar, albeit complementary,to that of the FSC. Moreover, this phase residualhas a 90� limit when the two signals are not corre-lated, intuitively correct for ``orthogonal'' signals,in contrast to the DPR, which has a 104� limit foruncorrelated signals (van Heel, 1987a).
The 15 AÊ map
The new (�15 AÊ ) reconstruction represents oneof the highest resolution reconstructions of singleparticles achieved to date and allows a more de-tailed interpretation than the earlier molluscan he-mocyanin (�45 AÊ ) 3D reconstructions. Because ofthe three-dimensionality of the data, this differencein resolution implies � (45/15)3 or 27 times more3D information in the new KLH1 reconstruction.The reconstruction residuals (Schatz et al., 1995)under D5 symmetry constraints for the KLH1 he-mocyanin were very low; whereas when the datawere analysed assuming D10 pointgroup sym-metry, high error residuals resulted. Thus D5 is thecorrect pointgroup symmetry for the KLH1 dideca-mer (Figure 3). Among the structural details re-vealed are the classical cylindrical wall (Figures 3,and 6a) and collar (Figures 6b, 7a and 8) alreadyde®ned by Mellema & Klug (1972). The cap seenby Mellema & Klug (1972) had been shown to be athreshold level artifact a long time ago (Siezen &van Bruggen, 1974) using Mellema & Klug's datadirectly, and is indeed missing from our map. Ourhigh-resolution map clearly elucidates substruc-tures within the non-wall mass: the collar region is
seen as a set of densities within the outer tiers ofthe didecamer and the arc (Figures 6b, 7b and 8) asdensities within the central tier of the decamerichalf-molecule.
The wall of the KLH1 didecamer
The details of the wall structure are shown inFigures 3b and c and 6a. The whole didecamericstructure has D5 (52) symmetry, as is indicated inFigure 6a, where the viewing direction is perpen-dicular to the 5-fold axis of the structure. Note thatthe wall consists of elongated ``morphologicalunits'' (Mellema & Klug, 1972), of which there areten per tier, or two within the 72� range of theasymmetric triangle. According to its mass, eachmorphological unit corresponds to a functional-unit doublet. The 2-fold axes of the D5 pointgroupsymmetry are located between the centres of twocorresponding morphological units of the two dec-amers, as can be seen in Figure 6a (indicated byred ovals).
The KLH1 decamer has local D5 symmetry
Among the important new features revealed is alocal 2-fold axis within the decameric half of theKLH1 molecule, which dyad axis intersects thecentral tier of the decamer (Figure 6a: local dyadaxis marked in green). The existence of this sym-metry axis is best illustrated by a comparison ofstructural details of the inner (tiers #3 and #30,Figure 6) and outer tiers (tiers #1 and #10) of thedecamer on the outside of the cylinder wall. Evenvery small details in these two tiers are reproducedprecisely, although the two tiers have no imposedsymmetry relation within the D5 symmetry of thefull KLH1 didecamer. The local dyad axes withinthe decamer intersect the central tier between mor-phological units. The similarities associated withthese local dyads can best be appreciated in thestereo pair of Figure 3c. Not only the decamer as awhole but, obviously, also the central tier of thedecamer are rendered to an approximate D5 sym-metry by these newly found local dyad axes.
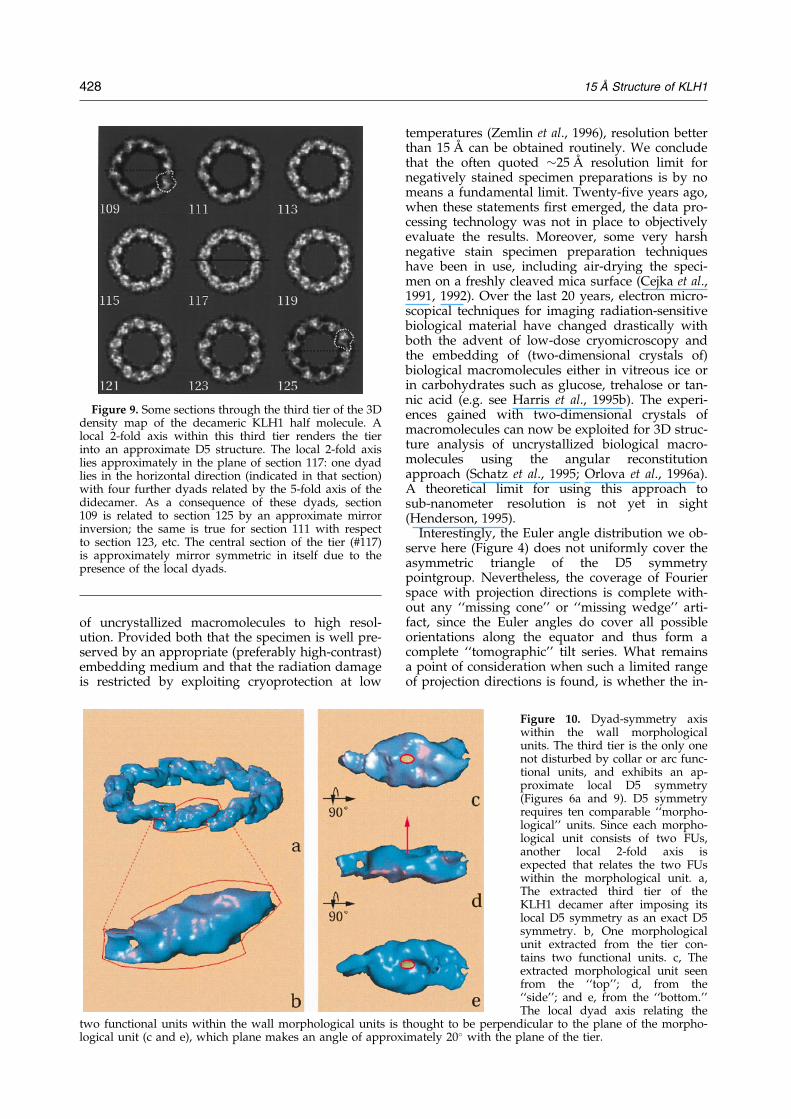
The third tier of the decamer has localD5 symmetry
The central tier (#2) and the collar tier (#1) of thegastropodan decamer contain internal material thatdoes not adhere to the approximate D5 symmetryof the decamer (Figures 6b, 7a and b and 8). Theonly tier not affected by additional material is thethird tier of the decamer. Closer inspection of somesections of the third tier (Figure 9) directly revealsa further symmetry relation: section #117 exhibitsan approximate mirror symmetry, whereas the sec-tions below it (e.g. #109) and the ones above it (e.g.#125) are related by mirror inversion. A Fourierring correlation (results not shown) between sec-tion #109 and the mirror version of section #125showed signi®cant cross-resolution to �25 AÊ . (A
424 15 AÊ Structure of KLH1
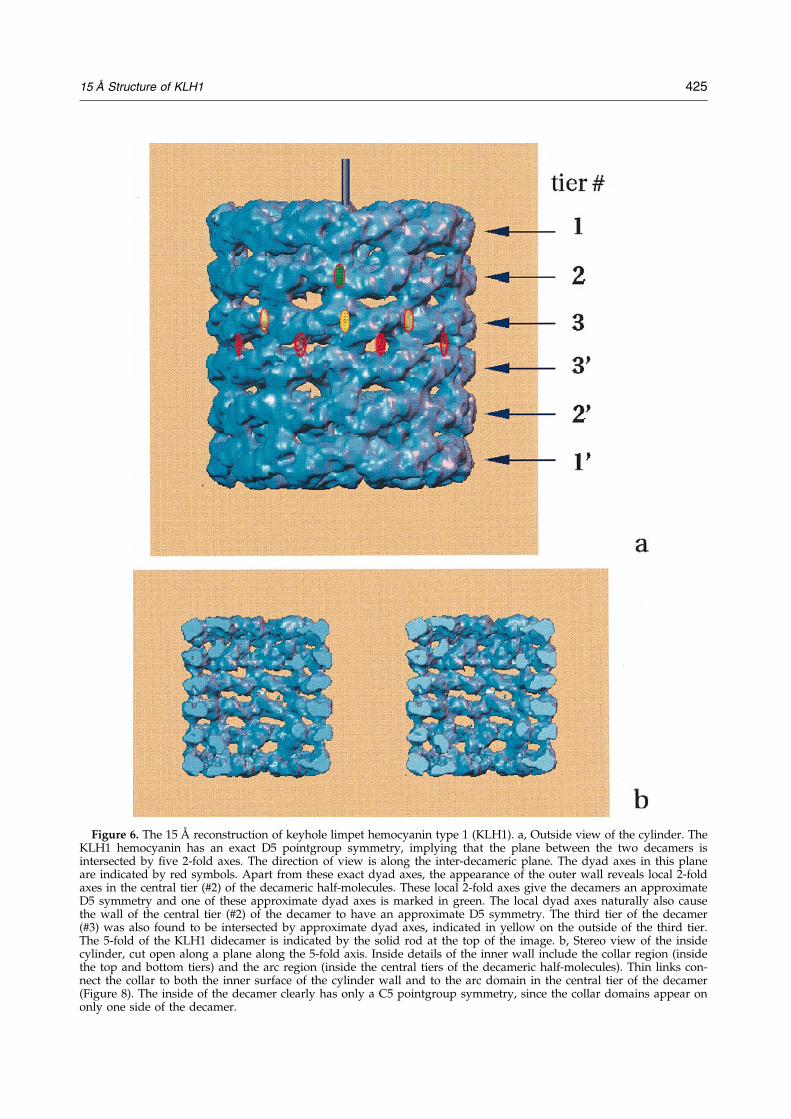
Figure 6. The 15 AÊ reconstruction of keyhole limpet hemocyanin type 1 (KLH1). a, Outside view of the cylinder. TheKLH1 hemocyanin has an exact D5 pointgroup symmetry, implying that the plane between the two decamers isintersected by ®ve 2-fold axes. The direction of view is along the inter-decameric plane. The dyad axes in this planeare indicated by red symbols. Apart from these exact dyad axes, the appearance of the outer wall reveals local 2-foldaxes in the central tier (#2) of the decameric half-molecules. These local 2-fold axes give the decamers an approximateD5 symmetry and one of these approximate dyad axes is marked in green. The local dyad axes naturally also causethe wall of the central tier (#2) of the decamer to have an approximate D5 symmetry. The third tier of the decamer(#3) was also found to be intersected by approximate dyad axes, indicated in yellow on the outside of the third tier.The 5-fold of the KLH1 didecamer is indicated by the solid rod at the top of the image. b, Stereo view of the insidecylinder, cut open along a plane along the 5-fold axis. Inside details of the inner wall include the collar region (insidethe top and bottom tiers) and the arc region (inside the central tiers of the decameric half-molecules). Thin links con-nect the collar to both the inner surface of the cylinder wall and to the arc domain in the central tier of the decamer(Figure 8). The inside of the decamer clearly has only a C5 pointgroup symmetry, since the collar domains appear ononly one side of the decamer.
15 AÊ Structure of KLH1 425

local symmetry need not fully reach the 15 AÊ levelachieved in the reconstruction.) Thus, section #117contains dyad axes in the plane of that section, i.e.dyad axes perpendicular to the 5-fold axis. One ofthese local dyad axes is marked in section #117.Consequently, the third tier, in itself, also exhibitsa local D5 symmetry like the symmetry we havejust found for the wall part of the second tier.Since the third and ®rst tiers of the decamer arealready related by the local dyad axes intersectingthe second tier, resulting in the approximate D5symmetry of the decamer that was described in theprevious paragraph, the outer walls of all threetiers of the decameric half-molecule apparently ex-hibit an approximate D5 symmetry.
The arc
The internal arc densities at the level of the cen-tral tier of the decamer are resolved as pronounceddoublets (Figures 6b, 7b and 8a and b). We choose
to call the constituent densities of each arc doubletarc functional unit x and arc functional unit y,whereby arc-FU x is that closer to the centre of thedidecamer (the lower left yellow functional unit inFigure 8a and b) and arc-FU y is that closer to thecollar region of the hemocyanin (the top right yel-low functional unit in Figure 8a and b). These arc-FUs are both connected to the central tier, althoughthe connection to arc-FU x appears somewhatmore pronounced than the connection to arc-FU yin this 3D reconstruction (marked by red arrows inFigure 8a). Arc-FU y is connected to the collar do-main by two thin links (marked by red arrows inFigure 8b), whereas from the arc-functional-unit xno direct connection to the collar is discernible.
The collar
The ®ve collar elements of each decamer are par-ticularly clear in the end-on view (Figure 7a).These ®ve elongated collar morphological units are
Figure 7. Stereo views of the KLH1 decamer along the 5-fold axis. a, The decameric half-molecule seen from the out-side providing a clear view of the collar morphological units. Each morphological unit consists of two functionalunits (FUs), which are related by an approximate dyad axis running through the middle of each unit (marked by ared dot in one of the morphological units), approximately parallel with the 5-fold axis but actually making an angleof some 5 to 10� with that axis. b, When looking at the collar from the inside of the didecamer (here cut open at theinter-decamer plane), the view of the collar area is obstructed by the ten arc functional units organised in pairs. Thetwo functional units of the arc are roughly related by a local 2-fold axis. It is our interpretation that this local dyadaxis is disturbed when the two corresponding polypeptide chains proceed onward to form the collar region of thishemocyanin (shown in detail in Figure 8).
426 15 AÊ Structure of KLH1

connected to each other, to the inside of the outerwall of the ®rst tier, and to one arc density (arc-functional-unit y) within the second tier by thinbridges (Figure 8b). Each of the ®ve collar elementsconsists of two FUs, and are comparable in sizewith the arc doublet. There is an apparent localdyad symmetry relating two collar FUs within thecollar element (marked by a red dot in Figure 7a).The main connection between the dimeric collar el-ements and the inside of the ®rst tier is formed bya triangular mass that is wedged between two col-lar morphological units and a morphological unitof the ®rst tier (Figure 7a). This triangular mass ap-pears to be part of the morphological unit of thewall rather than of the collar elements.
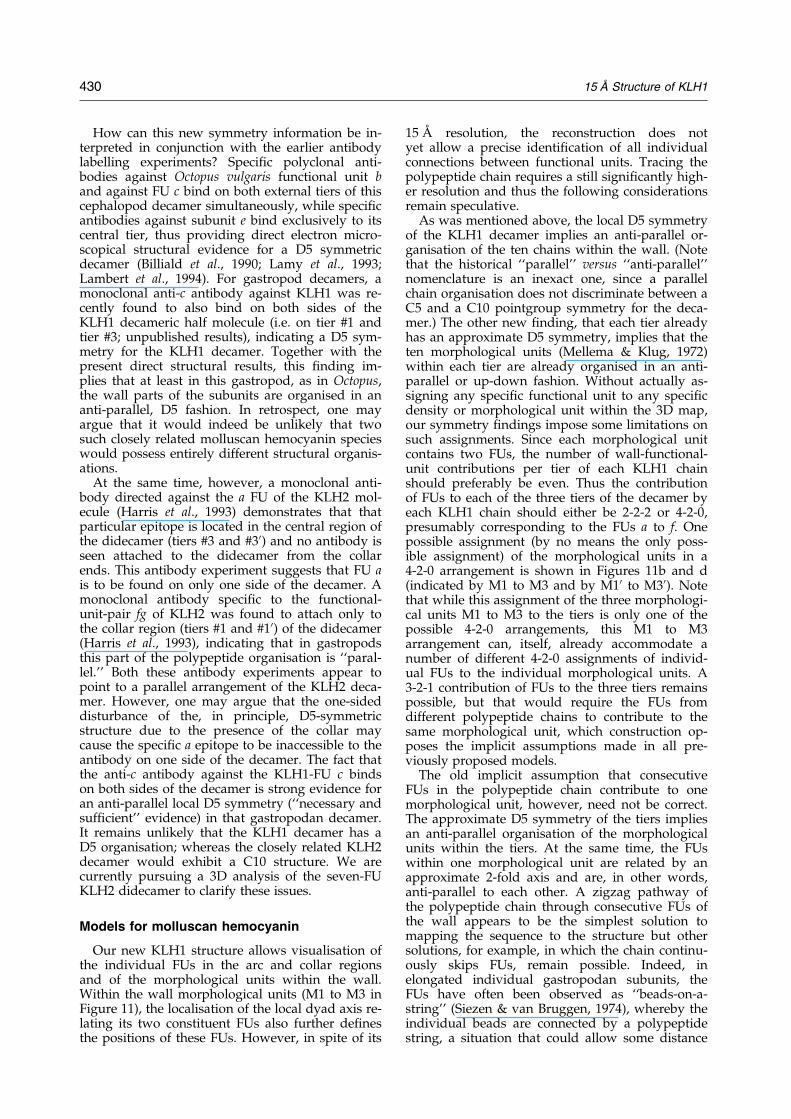
The morphological unit: dimerization offunctional units
It has long been suggested that the morphologi-cal units of the wall consist of two structurallyequivalent functional units related by a local 2-foldaxis (Mellema & Klug, 1972). Such a dyad axiswithin the morphological unit would be a sym-metry element that is not part of the local dyadsymmetry we found for each of the tiers of the
KLH1 decamer structure (yellow ovals inFigure 6a). Rather, such a dyad axis would be yetanother local symmetry element within the localD5 symmetry of its tier environment. The ``local-local'' dyad symmetry axis that we are now focus-ing on must intersect the morphological unit butneed not lie in the plane of the tier or be parallelwith the 5-fold axis. In order to localise such adyad axis, we extracted the third tier density fromthe 3D KLH1 reconstruction to analyse it separatefrom its environment (Figure 10). We analysed thattier both with its existing C5 symmetry (results notshown), and with an imposed exact D5 symmetry(Figure 7). We believe this local dyad axis to beperpendicular to the plane of the dimer (Figure 10cand e), comparable to the orientation of the localdyads of the collar morphological units (Figure 7a).Note, however, that the dimer makes an angle of�20� with respect to the plane of the tier.
Discussion
Single particle analysis and resolution limits
It is evident from this study that single particleanalysis has the potential to elucidate 3D structures
Figure 8. Stereo pairs of the arc functional-unit dimer (yellow) in relation to the corresponding collar morphologicalunit (green). a, The arc functional units are connected to the functional units of the second tier (blue) of the decamerby two thin bridges, marked by red arrows. b, Two thin bridges (two red arrows) connect the arc morphological unitto the corresponding morphological unit of the collar (green).
15 AÊ Structure of KLH1 427
of uncrystallized macromolecules to high resol-ution. Provided both that the specimen is well pre-served by an appropriate (preferably high-contrast)embedding medium and that the radiation damageis restricted by exploiting cryoprotection at low
temperatures (Zemlin et al., 1996), resolution betterthan 15 AÊ can be obtained routinely. We concludethat the often quoted �25 AÊ resolution limit fornegatively stained specimen preparations is by nomeans a fundamental limit. Twenty-®ve years ago,when these statements ®rst emerged, the data pro-cessing technology was not in place to objectivelyevaluate the results. Moreover, some very harshnegative stain specimen preparation techniqueshave been in use, including air-drying the speci-men on a freshly cleaved mica surface (Cejka et al.,1991, 1992). Over the last 20 years, electron micro-scopical techniques for imaging radiation-sensitivebiological material have changed drastically withboth the advent of low-dose cryomicroscopy andthe embedding of (two-dimensional crystals of)biological macromolecules either in vitreous ice orin carbohydrates such as glucose, trehalose or tan-nic acid (e.g. see Harris et al., 1995b). The experi-ences gained with two-dimensional crystals ofmacromolecules can now be exploited for 3D struc-ture analysis of uncrystallized biological macro-molecules using the angular reconstitutionapproach (Schatz et al., 1995; Orlova et al., 1996a).A theoretical limit for using this approach tosub-nanometer resolution is not yet in sight(Henderson, 1995).
Interestingly, the Euler angle distribution we ob-serve here (Figure 4) does not uniformly cover theasymmetric triangle of the D5 symmetrypointgroup. Nevertheless, the coverage of Fourierspace with projection directions is complete with-out any ``missing cone'' or ``missing wedge'' arti-fact, since the Euler angles do cover all possibleorientations along the equator and thus form acomplete ``tomographic'' tilt series. What remainsa point of consideration when such a limited rangeof projection directions is found, is whether the in-
Figure 9. Some sections through the third tier of the 3Ddensity map of the decameric KLH1 half molecule. Alocal 2-fold axis within this third tier renders the tierinto an approximate D5 structure. The local 2-fold axislies approximately in the plane of section 117: one dyadlies in the horizontal direction (indicated in that section)with four further dyads related by the 5-fold axis of thedidecamer. As a consequence of these dyads, section109 is related to section 125 by an approximate mirrorinversion; the same is true for section 111 with respectto section 123, etc. The central section of the tier (#117)is approximately mirror symmetric in itself due to thepresence of the local dyads.
Figure 10. Dyad-symmetry axiswithin the wall morphologicalunits. The third tier is the only onenot disturbed by collar or arc func-tional units, and exhibits an ap-proximate local D5 symmetry(Figures 6a and 9). D5 symmetryrequires ten comparable ``morpho-logical'' units. Since each morpho-logical unit consists of two FUs,another local 2-fold axis isexpected that relates the two FUswithin the morphological unit. a,The extracted third tier of theKLH1 decamer after imposing itslocal D5 symmetry as an exact D5symmetry. b, One morphologicalunit extracted from the tier con-tains two functional units. c, Theextracted morphological unit seenfrom the ``top''; d, from the``side''; and e, from the ``bottom.''The local dyad axis relating the
two functional units within the wall morphological units is thought to be perpendicular to the plane of the morpho-logical unit (c and e), which plane makes an angle of approximately 20� with the plane of the tier.
428 15 AÊ Structure of KLH1

teractions between sample and support ®lm/em-bedding medium which leads to preferred orien-tations deforms or damages the molecules. In thecase of the gastropodan hemocyanins, it was regu-larly observed that, in conventional negative stainpreparations, the width of the rectangular side-views was considerably larger than the diameter ofthe round topviews of the cylinder, indicating sub-stantial ¯attening artifacts (cf. Mellema & Klug,1972). In spite of the preferred orientation in ourdata, however, such ¯attening was not observeddirectly. An indication, however, that such objectdeformation may be causing problems at higherresolution is the behaviour of the FSC curve(Figure 5a), which drops continuously, startingalready at the relatively low resolution of �30 AÊ .Thus, it may be possible that small deformationswill lead to resolution limits when attempting toreach higher resolution levels by a ®ner samplingof the data. Intrinsic deformations will limit thestructural uniformity of the molecules in the dataset and thus may lead to limitations similar tothose found with empty ribosomes (Stark et al.,1995), which had a much higher level of internal¯exibility than actively translating ribosomes in thepre or the post-translocational state (Stark et al.,1997).
Phase-residual 3D resolution criteria
Phase residuals have a long history both in X-ray crystallography and in electron microscopy(DeRosier & Moore, 1970; Unwin & Klug, 1974).The ®rst phase residual to be used in the context ofstrict single particle averaging, the differentialphase residual (DPR, Frank et al., 1981), is basedon a comparison of two independent data setsover rings in 2D Fourier space. However, the par-ticular de®nition of a phase residual used by Franket al. (1981) included sums of Fourier amplitudes,which makes it not very suitable as an objectiveand reproducible resolution criterion (van Heel,1987a): multiplication of one of the 2D or 3D sig-nals by a constant may change the value obtainedfor the DPR at each spatial frequency even thoughsuch multiplication cannot in¯uence the infor-mation within an image. One can thus actuallyeven exploit this methodological ¯aw to minimisethe DPR at each spatial frequency by simply tryinga whole range of multiplicative factors.
In spite of the early criticism, the use of the DPRhas been strongly advocated by the group ofFrank, invariably claiming that the DPR is moreconservative than the FRC. Whereas conservativere¯ects the numerical values normally obtainedwith the criterion, the criticism was aimed at thereproducibility and objectivity with which such va-lues correlate to the quality of the results. A conser-vative criterion can nevertheless be of poor quality,since the quality of the criterion and whether ornot it is conservative are two independent issues.In the ®rst use of the DPR as a 3D resolution cri-terion (Frank et al., 1991) only two horizontal cen-
tral sections (2D!) of the two 3D Fourier transformswere compared. (Essentially equivalent to the DPRbetween the top projections of the two 3D recon-structions.) In RCT reconstructions, however, thehorizontal central section does not overlap withthose regions in Fourier space that are not sampledin the RCT experiment (missing cone). As a conse-quence, the areas of missing information do notenter into the equation and the resolution obtainedis thus overestimated.
This ®rst 3D DPR approach was later replacedby the straightforward 3D generalisation of theoriginal DPR (Penczek et al., 1994). In the latterwork, the resolution achieved in the ®rst 3D work(Frank et al., 1991) was re-estimated to have beenonly 55.5 AÊ rather than the original 40 AÊ . Our cur-rent experiments con®rm that the FRPR/FSPR``corrected'' phase residuals (van Heel, 1987a) be-have well and are complementary in behaviour tothe FRC/FSC (Figure 5a and b). However, wemust repeat here (from van Heel, 1987a) that evenwell-de®ned phase residuals like the FSPR havethe disadvantage that ®xed threshold criteria(``45�'' or ``60�'') are less sophisticated than the 3scurve type of criteria used in conjunction with the(2D) FRC or the (3D) FSC. Fixed phase residualthresholds should be replaced by a signi®cancethreshold curve that also depends on the numberof pixels/voxels in any particular Fourier-spacering (2D) or shell (3D). Such rigorous signi®cancethreshold calculation is still lacking (van Heel,1987a), which fact has serious consequences. Forexample, we have here introduced the concept of a3s threshold curve for the FSC that is multipliedby the square-root of the number of asymmetricunits for the given pointgroup symmetry. Such cor-rections are equally necessary to account for thesymmetry redundancies when using phase residualresolution criteria. We currently, however, cannottranslate this concept to the realm of phase re-siduals because the signi®cance threshold problemhas not yet been systematically investigated.
Symmetries within gastropod andcephalopod hemocyanins
In our new reconstruction of KLH1, we have ob-tained a higher resolution level than is normallyreached with single particle 3D analysis. More im-portant than the explicit resolution value, however,is what new structural information on the mollus-can hemocyanins is revealed. A most signi®cantnew observation in the latest reconstruction is thelocal 2-fold axis identi®ed within this gastropodhemocyanin decamer, which dyad axis makes theC5 pointgroup symmetry of the decameric halfmolecule, at least locally, resemble a D5 structure,such as has been suggested for cephalopodan deca-meric hemocyanins (Lambert et al., 1994). The exist-ence of this dyad axis (Figure 6a; green oval)refutes earlier models of the gastropodan decamerin which the amino acid chains in the wall run par-allel with each other.
15 AÊ Structure of KLH1 429
How can this new symmetry information be in-terpreted in conjunction with the earlier antibodylabelling experiments? Speci®c polyclonal anti-bodies against Octopus vulgaris functional unit band against FU c bind on both external tiers of thiscephalopod decamer simultaneously, while speci®cantibodies against subunit e bind exclusively to itscentral tier, thus providing direct electron micro-scopical structural evidence for a D5 symmetricdecamer (Billiald et al., 1990; Lamy et al., 1993;Lambert et al., 1994). For gastropod decamers, amonoclonal anti-c antibody against KLH1 was re-cently found to also bind on both sides of theKLH1 decameric half molecule (i.e. on tier #1 andtier #3; unpublished results), indicating a D5 sym-metry for the KLH1 decamer. Together with thepresent direct structural results, this ®nding im-plies that at least in this gastropod, as in Octopus,the wall parts of the subunits are organised in ananti-parallel, D5 fashion. In retrospect, one mayargue that it would indeed be unlikely that twosuch closely related molluscan hemocyanin specieswould possess entirely different structural organis-ations.
At the same time, however, a monoclonal anti-body directed against the a FU of the KLH2 mol-ecule (Harris et al., 1993) demonstrates that thatparticular epitope is located in the central region ofthe didecamer (tiers #3 and #30) and no antibody isseen attached to the didecamer from the collarends. This antibody experiment suggests that FU ais to be found on only one side of the decamer. Amonoclonal antibody speci®c to the functional-unit-pair fg of KLH2 was found to attach only tothe collar region (tiers #1 and #10) of the didecamer(Harris et al., 1993), indicating that in gastropodsthis part of the polypeptide organisation is ``paral-lel.'' Both these antibody experiments appear topoint to a parallel arrangement of the KLH2 deca-mer. However, one may argue that the one-sideddisturbance of the, in principle, D5-symmetricstructure due to the presence of the collar maycause the speci®c a epitope to be inaccessible to theantibody on one side of the decamer. The fact thatthe anti-c antibody against the KLH1-FU c bindson both sides of the decamer is strong evidence foran anti-parallel local D5 symmetry (``necessary andsuf®cient'' evidence) in that gastropodan decamer.It remains unlikely that the KLH1 decamer has aD5 organisation; whereas the closely related KLH2decamer would exhibit a C10 structure. We arecurrently pursuing a 3D analysis of the seven-FUKLH2 didecamer to clarify these issues.
Models for molluscan hemocyanin
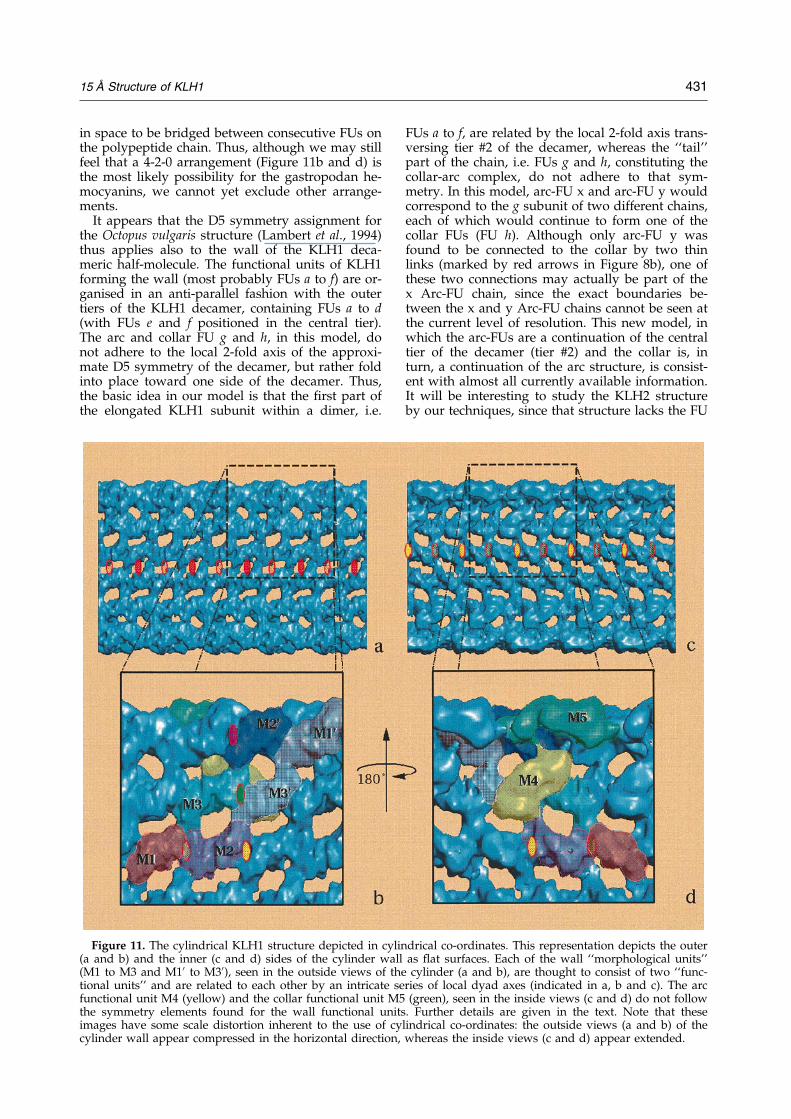
Our new KLH1 structure allows visualisation ofthe individual FUs in the arc and collar regionsand of the morphological units within the wall.Within the wall morphological units (M1 to M3 inFigure 11), the localisation of the local dyad axis re-lating its two constituent FUs also further de®nesthe positions of these FUs. However, in spite of its
15 AÊ resolution, the reconstruction does notyet allow a precise identi®cation of all individualconnections between functional units. Tracing thepolypeptide chain requires a still signi®cantly high-er resolution and thus the following considerationsremain speculative.
As was mentioned above, the local D5 symmetryof the KLH1 decamer implies an anti-parallel or-ganisation of the ten chains within the wall. (Notethat the historical ``parallel'' versus ``anti-parallel''nomenclature is an inexact one, since a parallelchain organisation does not discriminate between aC5 and a C10 pointgroup symmetry for the deca-mer.) The other new ®nding, that each tier alreadyhas an approximate D5 symmetry, implies that theten morphological units (Mellema & Klug, 1972)within each tier are already organised in an anti-parallel or up-down fashion. Without actually as-signing any speci®c functional unit to any speci®cdensity or morphological unit within the 3D map,our symmetry ®ndings impose some limitations onsuch assignments. Since each morphological unitcontains two FUs, the number of wall-functional-unit contributions per tier of each KLH1 chainshould preferably be even. Thus the contributionof FUs to each of the three tiers of the decamer byeach KLH1 chain should either be 2-2-2 or 4-2-0,presumably corresponding to the FUs a to f. Onepossible assignment (by no means the only poss-ible assignment) of the morphological units in a4-2-0 arrangement is shown in Figures 11b and d(indicated by M1 to M3 and by M10 to M30). Notethat while this assignment of the three morphologi-cal units M1 to M3 to the tiers is only one of thepossible 4-2-0 arrangements, this M1 to M3arrangement can, itself, already accommodate anumber of different 4-2-0 assignments of individ-ual FUs to the individual morphological units. A3-2-1 contribution of FUs to the three tiers remainspossible, but that would require the FUs fromdifferent polypeptide chains to contribute to thesame morphological unit, which construction op-poses the implicit assumptions made in all pre-viously proposed models.
The old implicit assumption that consecutiveFUs in the polypeptide chain contribute to onemorphological unit, however, need not be correct.The approximate D5 symmetry of the tiers impliesan anti-parallel organisation of the morphologicalunits within the tiers. At the same time, the FUswithin one morphological unit are related by anapproximate 2-fold axis and are, in other words,anti-parallel to each other. A zigzag pathway ofthe polypeptide chain through consecutive FUs ofthe wall appears to be the simplest solution tomapping the sequence to the structure but othersolutions, for example, in which the chain continu-ously skips FUs, remain possible. Indeed, inelongated individual gastropodan subunits, theFUs have often been observed as ``beads-on-a-string'' (Siezen & van Bruggen, 1974), whereby theindividual beads are connected by a polypeptidestring, a situation that could allow some distance
430 15 AÊ Structure of KLH1
in space to be bridged between consecutive FUs onthe polypeptide chain. Thus, although we may stillfeel that a 4-2-0 arrangement (Figure 11b and d) isthe most likely possibility for the gastropodan he-mocyanins, we cannot yet exclude other arrange-ments.
It appears that the D5 symmetry assignment forthe Octopus vulgaris structure (Lambert et al., 1994)thus applies also to the wall of the KLH1 deca-meric half-molecule. The functional units of KLH1forming the wall (most probably FUs a to f) are or-ganised in an anti-parallel fashion with the outertiers of the KLH1 decamer, containing FUs a to d(with FUs e and f positioned in the central tier).The arc and collar FU g and h, in this model, donot adhere to the local 2-fold axis of the approxi-mate D5 symmetry of the decamer, but rather foldinto place toward one side of the decamer. Thus,the basic idea in our model is that the ®rst part ofthe elongated KLH1 subunit within a dimer, i.e.
FUs a to f, are related by the local 2-fold axis trans-versing tier #2 of the decamer, whereas the ``tail''part of the chain, i.e. FUs g and h, constituting thecollar-arc complex, do not adhere to that sym-metry. In this model, arc-FU x and arc-FU y wouldcorrespond to the g subunit of two different chains,each of which would continue to form one of thecollar FUs (FU h). Although only arc-FU y wasfound to be connected to the collar by two thinlinks (marked by red arrows in Figure 8b), one ofthese two connections may actually be part of thex Arc-FU chain, since the exact boundaries be-tween the x and y Arc-FU chains cannot be seen atthe current level of resolution. This new model, inwhich the arc-FUs are a continuation of the centraltier of the decamer (tier #2) and the collar is, inturn, a continuation of the arc structure, is consist-ent with almost all currently available information.It will be interesting to study the KLH2 structureby our techniques, since that structure lacks the FU
Figure 11. The cylindrical KLH1 structure depicted in cylindrical co-ordinates. This representation depicts the outer(a and b) and the inner (c and d) sides of the cylinder wall as ¯at surfaces. Each of the wall ``morphological units''(M1 to M3 and M10 to M30), seen in the outside views of the cylinder (a and b), are thought to consist of two ``func-tional units'' and are related to each other by an intricate series of local dyad axes (indicated in a, b and c). The arcfunctional unit M4 (yellow) and the collar functional unit M5 (green), seen in the inside views (c and d) do not followthe symmetry elements found for the wall functional units. Further details are given in the text. Note that theseimages have some scale distortion inherent to the use of cylindrical co-ordinates: the outside views (a and b) of thecylinder wall appear compressed in the horizontal direction, whereas the inside views (c and d) appear extended.
15 AÊ Structure of KLH1 431
h and may thus help substantiate the arc and collarfunctional-unit assignments.
The idea that the collar domains are connectedto the central tier (#2) rather than to the end tier ofthe decamer (#1) was expressed more than 20years ago, based on the interpretation of negativelystained images of the dimeric dissociation productsof H. pomatia (Siezen & van Bruggen, 1974). How-ever, in van Bruggen's later models, the collar FUsare attached to the FUs in the outer tier (#1) of thecylindrical wall (van Bruggen, 1986). In our current3D map, the connections between the collar andthe wall FUs are relatively small. The connectionsbetween the arc FUs and the collar are also small.Our model requires (at least) two connections be-tween the arc morphological unit and the corre-sponding collar morphological unit and we indeed®nd two such connections (Figure 7). However,both connections seem to emerge from the same yarc FU, rather than from both FUs separately.Higher-resolution 3D maps will be required toachieve a more precise understanding of this re-gion of the structure.
Interestingly, Mellema & Klug (1972), in theirlandmark study of the 3D structures of the gastro-podan hemocyanins of Busycon canaliculatum andHelix pomatia, 25 years ago, discussed the possi-bility of further local 2-fold axes in the wall struc-ture relating the two domains within themorphological unit, even though these domainswere not revealed in their 30-50 AÊ resolution re-sults. Mellema & Klug (1972) suggested a structureclose to a D10 structure, with additional dyad axesin the plane between the decamers. Such an ap-proximate D10 structure would, however, point toa parallel organisation of the chains in each deca-mer, i.e. a polar organisation within the dimersforming the decamer walls, as proposed for KLH2(Harris et al., 1993) from antibody linkage studies.These suggestions are in opposition to the pre-sently proposed model. At the same time, how-ever, Mellema & Klug (1972) discussed thepossibility of the cylinder wall of the decamer con-sisting of non-polar dimers, which suggestion isconsistent with our proposed D5 model but notwith the D10 structure that they proposed.
A point of substantial importance is that theKLH1 didecamer is found to be an amazingly sym-metrical structure with each wall tier having an ap-proximate D5 pointgroup symmetry. This ®ndingimplies that, within each tier, ten local-symmetry-equivalent positions can be found. Since the gastro-podan hemocyanin is composed of six such tiers,the outer wall of the didecamer has 60 local-sym-metry-equivalent positions, a value that is sur-passed only by the exact 60-fold symmetry oficosahedral viruses (or the even higher number ofquasi-equivalent positions in complex icosahedralcapsids). The true symmetry of the gastropodan di-decamer wall is only D5, so that each surface motifis, in principle, presented ``only'' ten times; how-ever, other FUs are, at the same time, presenting 50further structurally equivalent surface motifs at
local-symmetry-related positions (Figure 11). Thisintricate interaction between exact and quasi-sym-metry presentation of epitopes may be instrumen-tal in eliciting the strong reactions on thevertebrate immune system characteristic of KLHand KLH-conjugated antigen.
Conclusions
The didecameric hemocyanin of the keyhole lim-pet (M. crenulata) KLH1 is a hierarchically organ-ised structure containing 20 identical polypeptidechains, each consisting of eight functional units(FUs). The overall pointgroup symmetry of the as-sembly is D5, implying that one didecameric KLH1consists of ten dimeric asymmetric units. In spiteof these subunit dimers being in principle asym-metric, their two identical constituent polypeptidesare partially related by a local 2-fold axis withinthe decameric KLH1 half-molecules. The decamerichalf-molecule of KLH1 is thus found locally to ex-hibit largely the same D5 symmetry found pre-viously in the cephalopod species O. vulgaris. Thecollar region of the KLH1 decameric half-mol-ecules, in contrast, is present only on one side ofthe decamer and thus does not obey that local2-fold symmetry. Most of the published structuralinterpretations of gastropodan hemocyanins, in-cluding our own KLH2 interpretation, are not com-patible with our new structural information onKLH1. In particular, interpretations in which theten polypeptide chains run in parallel along thecylinder wall of the gastropodan decameric half-molecule are incompatible with the local approxi-mate D5 symmetry for the KLH1 decamer. This ap-proximate D5 symmetry may be a generic propertyof gastropodan hemocyanins. Apart from the ap-proximate dyad axes of the D5 symmetry of thedecamer, further local dyad axes within each tieralready cause each tier to have an approximate D5symmetry . Moreover, a probable dyad symmetryaxis relating the two functional units forming themorphological unit, postulated by Mellema & Klug(1972), has been located. The knowledge derivedfrom cryomicroscopical studies, in particular in sy-nergetic combination with the upcoming atomicresolution structure of a domain of Octopus hemo-cyanin by X-ray crystallography (M. Cuff et al.,personal communication), will undoubtedly con-tinue to add signi®cantly to our understanding ofmolluscan hemocyanin structure. Our KLH1 dataset was sampled at a lower resolution than actuallyrequired for the close-to-focus imaging conditionsused, in order to keep the computational logisticsrequirements within reasonable limits (Schatz et al.,1995). As a consequence, we can claim only a resol-ution of �15 AÊ rather than the 12.8 AÊ indicated bythe FSC criterion (corrected for use with a D5 sym-metric structure). Nevertheless, this value indicatesthat a higher resolution 3D reconstruction may bereached by simply using a ®ner sampling gridand by improving the computer infrastructure. It
432 15 AÊ Structure of KLH1
is obvious from our results that electron cryomicro-scopy in combination with the angular reconstitu-tion approach is reaching resolutions in the 10 to15 AÊ range. We have recently succeeded in obtain-ing 10 AÊ resolution in a 3D reconstruction of thehaemagglutinin trimer of the ¯u virus embeddedin a vitri®ed stain solution (unpublished results).The high-contrast embedding media we exper-iment with may play an important role in routinelyreaching sub-nanometer resolution results on un-crystallized material.
After our paper was submitted, two back-to-back papers appeared (BoÈ ttcher et al., 1997;Conway et al., 1997) in which resolutions of 7.4 AÊ
and 9.1 AÊ were reached (respectively) on icosahe-dral assemblies of hepatitis B virus core proteinembedded in vitreous ice. The 60-fold symmetryredundancy of icosahedral structures facilitatestheir 3D analysis when compared to the analysis ofthe asymmetrical bacterial ribosome or even to the10-fold symmetric KLH1 assemblies we study here.Nevertheless, these elegant publications under-write the feasibility of single particle analysis atsub-nanometer resolutions.
Materials and Methods
Purification of KLH1
Hemocyanin was obtained from hemolymph that wastaken directly from the giant keyhole limpet M crenulatafreshly imported from the Californian coast (courtesy ofthe Biosyn Company, Fellbach, Germany), as described(Harris et al., 1992; Gebauer et al., 1994). Within this totalhemocyanin the ratio of KLH1 to KLH2 is approximately1:1, but the hemolymph is gradually depleted of KLH1when the animal is kept in captivity for a period ofmonths. From the cell-free hemolymph the hemocyaninwas pelleted at 60,000 g for four hours at 4�C and resus-pended in a small volume of Tris-saline stabilising buffer(50 mM Tris, 150 mM NaCl, 5 mM MgCl2, 5 mM CaCl2,pH 7.4). The solubilized hemocyanin was then dialysedovernight at 4�C against an ammonium molybdate/polyethylene glycol (PEG) solution at pH 5.7 (1% am-monium molybdate, 0.02% (w/v) PEG, Mr 1000). Thistreatment caused complete dissociation of KLH2 and en-abled intact KLH1 to be puri®ed by gel-®ltration chro-matography through a Biogel A-15m column (Bio-RadLaboratories) in the continued presence of the am-monium molybdateÿPEG solution at pH 5.7 (Harriset al., 1995a). The eluted KLH1 didecamer-containingfractions were then pooled, the hemocyanin again pel-leted by centrifugation at 60,000 g for four hours at 4�C,and the pellet resuspended in a small volume of stabilis-ing buffer at a concentration of ca 10 mg/ml.
Specimen preparation
Specimens for electron microscopy were prepared onbrie¯y glow-discharge treated carbon support ®lms.Equal quantities of sample (ca 1 mg/ml) and 2% am-monium molybdate, 1% (w/v) glucose (pH 7.0) solutionwere mixed and then applied to the carbon ®lms. Theadvantage of this pre-mixing procedure is that it reducesthe adsorption forces induced on the protein by the car-bon support ®lm and allows an isotropically stained
population of molecules to be obtained within the ®lm ofdried, amorphous stain-glucose embedding medium.
Electron microscopy
Transmission electron microscopy was performedusing a modi®ed Philips model CM20 FEG, withinwhich the commercial objective lens had been replacedby a liquid helium-cooled superconducting objective lens(Zemlin et al., 1996; Lefranc et al., 1982). This electronmicroscope provides the combined advantages of coher-ent illumination of the ®eld emission gun and minimalradiation damage due to the �4 K specimen tempera-ture. Suitable homogeneously embedded regions of thespecimen were selected and imaged at a magni®cation of60,000� with an accelerating voltage of 120 kV and a de-focus of 1200 to 1500 AÊ , implying that the ®rst zero ofthe contrast transfer function is at �6 to 8 AÊ . All effortswere taken to minimise the electron exposure of theareas imaged (Henderson et al., 1990). The total electrondose used during searching and imaging was in therange of 14 to 24 eÿ/ AÊ 2. The quality of the micrographsto be used for processing was veri®ed by optical diffrac-tion.
Image processing
The selected micrographs were digitised using a line-ar-CCD densitometer (EMiL, courtesy of Image ScienceGmbH, Berlin), with a sampling size of 5 AÊ at the speci-men level. All image processing was performed in thecontext of the IMAGIC-5 software system (van Heel &Keegstra, 1981; van Heel et al., 1996) on DEC-Alphaworkstations operating under the OPEN-VMS and theUNIX operating systems. From the digitised micro-graphs, 4200 molecular images of the KLH1 didecamerwere extracted interactively. The majority of the molecu-lar images were rectangular sideviews with only �3%circular topviews. All molecular images were band-pass®ltered (spatial frequencies below 1/300 AÊ and over1/4 AÊ were suppressed) and subsequently normalisedby our standard procedures (van Heel & StoÈ f¯er-Meilicke, 1985). The sideview images were aligned inboth a translation and rotational sense with respect to acentred total sum of the rectangular views from an ear-lier alignment iteration. Subsequently, multivariate stat-istical analysis (MSA) and classi®cation methods wereapplied to obtain the different sideview orientations pre-sent in the image data set. MSA eigenvector-eigenvaluedata compression (van Heel & Frank, 1981; Borland &van Heel, 1990) and automatic classi®cation methods(van Heel, 1984, 1989) were used to ®nd the differentrotational orientations within the topview images. Theresulting class averages were subsequently used formulti-reference alignment of the images (van Heel &StoÈ f¯er-Meilicke, 1985).
The angular reconstitution technique (van Heel, 1987b;Goncharow & Gelfand, 1988; van Heel et al., 1992a,b;Radermacher, 1994; Serysheva et al., 1995) was used todetermine the relative Euler angle orientation of the classaverages of the KLH1 molecular images obtained fromthe image processing. This reconstruction technique andits application to determine the 3D structure of biologicalmacromolecules has recently been described in detail(Serysheva et al., 1995; Schatz et al., 1995). Using the ®vebest class averages, an initial 3D reconstruction was ob-tained using the ``exact ®lter back projection'' algorithm(Harauz & van Heel, 1986; Radermacher, 1988). This ®rst
15 AÊ Structure of KLH1 433
3D reconstruction was then reprojected into 54 Euler di-rections to generate 2D projection images uniformly cov-ering the asymmetrical triangle of the D5 pointgroupsymmetry (this asymmetric triangle covers a one-tenthsegment of the unit sphere: from the north pole to theequator and spanning 72� at the equator). These 2D pro-jections represent all possible views of the KLH1 dideca-mer and were used as a set of reference images to re®nethe multi-reference alignment of the original molecularimages (Orlova & van Heel, 1994; Schatz et al., 1995;Serysheva et al., 1995). Subsequently, MSA data com-pression and classi®cation procedures were appliedagain to generate new class averages from which a re-®ned 3D structure was reconstructed. This whole pro-cedure was iterated until no further improvement in the3D reconstruction was observed. For the ®nal 3D recon-struction, 162 class averages (three topviews and 159sideviews) were used.
For comparing the new 3D map to the earlier low-res-olution reconstructions, a low-pass ®ltering was appliedto the new map by multiplication of its 3D-FT by aGaussian function. This ®lter function effectively sup-presses all frequency components higher than �45 AÊ suf-®ciently to, upon a reverse 3D FT, generate a map(Figure 3a) that is comparable to the earlier reconstruc-tions.
Resolution
The resolution in the reconstructions was assessed bycomparing two 3D volumes, each calculated from one-half of all class averages used to produce the ®nal 3Dmap (Figure 8). Each of these sets was used to generatetwo separate 3D reconstructions. All comparisons be-tween these two maps were performed in 3D Fourierspace ( van Heel, 1991) by correlating the data containedin two corresponding shells (Harauz & van Heel, 1986)of the 3D FTs of the two 3D maps.
Contrast transfer function (CTF) correction
All good micrographs selected for processing by opti-cal diffraction have approximately the same defocus;thus all class averages used for 3D reconstruction are af-fected by this same PhCTF. In consequence, the entire3D reconstruction will have been modi®ed by a 3D ver-sion of the PhCTF curve. We have corrected the PhCTFby multiplying the 3D data in 3D Fourier space (vanHeel, 1991; Stark et al., 1997) by the inverse of the actualPhCTF, modi®ed to avoid ampli®cation of noise in theenvironment of the zero crossings (Hawkes, 1980). The3D ®lter function we used is:
Filter�f� � 1ÿ exp�ÿfPhCTF�f�=Sigmag2�PhCTF�f�
The expression in the numerator is a reversed Gausscurve with a user-de®ned half-width (Sigma) that sup-presses the contributions of those areas in 3D Fourierspace where the absolute value of the PhCTF is small.The values of Sigma used can range from �0.02 to �0.2,depending on the noise levels in the reconstruction. Thecorrection of the PhCTF is an absolute necessity if at thechosen defocus there are zero crossings within the resol-ution range, causing contrast reversals in the data. Here,however, the in¯uence of the correction is merely to en-hance the low frequencies in the 3D map. The resultingsurface renderings of the 3D map thus look somewhatsmoother after PhCTF correction (Figure 3b) than before
(Figure 3c). For a number of practical reasons the high-frequency components in high-resolution micrographsare severely suppressed with respect to their expectedvalue (Henderson, 1995). The somewhat enhanced rep-resentation of the high-frequency components in the un-corrected 3D maps (Figure 3c) thus compensates in partfor their suppression during the data collection.
3D visualisation
The simplest form of displaying the 3D reconstructionis as a sequence of 2D density sections through the 3Dvolume (Figure 9). This form of display, which also hasthe advantage of depicting the real data, is good for un-derstanding connections and certain forms of symmetry(Figure 9). To really convey the three-dimensionality ofthe structure, we use either simple stereo pairs or con-tinuous stereo sequences ( van Heel et al., 1996), whichallows a complete 3D impression from a range of direc-tions. For such 3D rendering, the choice of the thresholdlevel is important. Whereas the sections convey the real3D data, the surface representations emulate the appear-ance of the outside of the structure and the thresholdvalue de®nes what we consider the inside/outsideboundary. The threshold level used here is chosen basedon a mass for the didecamer of 7.9 MDa, assuming aspeci®c density of 0.83 Da/ AÊ
Ê. Note, however, that an
error in the calibration of the microscopical magni®-cation by, for example, 5% may lead to an error of 16%in the volume estimate (1.05
Ê � 1.16). Moreover, as wasmentioned above, the PhCTF correction has some in¯u-ence on the appearance of the molecular surface. The®nal graphical rendering presented here was performedusing the SGI Explorer visualisation software on a Sili-con Graphics Indigo-2 workstation.
Acknowledgements
This study was supported in part by the DFG (grantsMa 843/4-2 and He 2162/1-1). Keyhole limpets werekindly provided by the Biosyn Company, Fellbach,Germany. The KLH1 sample was puri®ed by DrWolfgang Gebauer. We are grateful to Dr Michael Schatzand Ralf Schmidt of Image Science Software GmbH forassistance with the IMAGIC software system. Carol Tan-sey edited the manuscript. EVO was supported in partby an EC grant to F.Z. (contract no. SC1-CT91-0734),which EC grant also funded the construction of theSOPHIE microscope.
References
Akey, C. W. & Edelstein, C. J. (1983). Equivalence of theprojected structure of thin catalase crystals pre-served for electron microscopy by negative stain,glucose, or embedding in the presence of tannicacid. J. Mol. Biol. 163, 575±612.
Billiald, P., Lamy, J., Wichertjes, T., van Bruggen, E. F. J.,Loncke, P., Gielens, C. & PreÂaux, G. (1990). Immu-noelectron microscopy of the hemocyanins of Octo-pus do¯eini and Octopus vulgaris. In InvertebrateDioxygen Carriers (PreÂaux, G. & Lontie, R., eds),pp. 343±346, Leuven University Press, Louvain.
Boettcher, C., Stark, H. & van Heel, M. (1996). Stackedbilayer helices: a new structural organization of
434 15 AÊ Structure of KLH1
amphiphilic molecules. Ultramicroscopy, 62, 133±139.
Borland, L. & van Heel, M. (1990). Classi®cation ofimage data in conjugate representation spaces.J. Optic. Soc. Am. ser. A, 7, 601±610.
BoÈ ttcher, (1997). Determination of the fold of the coreprotein of hepatitis B virus by electron microscopy.Nature, 385, 88±91.
Bracewell, R. N. (1956). Strip integration in radioastronomy. Aust. J. Phys. 9, 198±217.
Bracewell, R. N. (1960). Two-dimensional aerial smooth-ing in radio astronomy. Aust. J. Phys. 9, 297±314.
Bremer, A., Henn, C., Engel, A., Baumeister, W. & Aebi,A. (1992). Has negative staining still a place in bio-molecular electron microscopy?. Ultramicroscopy, 46,85±111.
Brenner, S. & Horne, R. W. (1959). A negative stainingmethod for high resolution electron microscopy ofviruses. Biochim. Biophys. Acta, 34, 103±110.
Cejka, Z., Santini, C., Tognon, G. & Ghiretti Magaldi, A.(1991). The molecular architecture of the extracellu-lar hemoglobin of Ophelia bicornis: analysis of two-dimensional crystalline arrays. J. Struct. Biol. 107,259±267.
Cejka, Z., Kleinz, J., Santini, C., Hegerl, R. & GhirettiMagaldi, A. (1992). The molecular architecture ofthe extracellular hemoglobin of Ophelia bicornis:analysis of individual molecules. J. Struct. Biol. 109,52±60.
Conway, (1997). Visualization of a 4-helix bundle inthe hepatitis B virus capsid by cryo-electronmicroscopy. Nature, 385, 91±94.
Crowther, R. A., DeRosier, D. J. & Klug, A. (1970a). Thereconstruction of a three-dimensional structure fromprojections and its application to electronmicroscopy. Proc. Roy. Soc. London, 317, 319±340.
Crowther, R. A., Amos, L. A., Finch, J. T., DeRosier,D. J. & Klug, A. (1970b). Three dimensional recon-struction of spherical viruses by Fourier synthesisfrom electron micrographs. Nature, 226, 421±425.
DeRosier, D. J. & Klug, A. (1968). Reconstruction ofthree-dimensional structures from electronmicrographs. Nature, 217, 130±134.
DeRosier, D. J. & Moore, P. B. (1970). Reconstruction ofthree-dimensional images from electron micro-graphs of structures with helical symmetry. J. Mol.Biol. 52, 355±369.
Dube, P., Orlova, E. V., Zemlin, F., van Heel, M., Harris,J. R. & Markl, J. (1995a). Three-dimensional struc-ture of keyhole limpet hemocyanin by cryoelectronmicroscopy and angular reconstitution. J. Struct.Biol. 115, 226±232.
Dube, P., Stark, H., Orlova, E. V., Schatz, M., Beckmann,E., Zemlin, F. & van Heel, M. (1995b). 3D structureof single macromolecules at 15 AÊ resolution bycryomicroscopy and angular reconstitution. In Pro-ceedings of Microscopy and Microanalysis (Bailey,G. W., Ellisman, M. H., Henningar, R. A. &Zaluzec, N. J., eds), pp. 838±839, Jones and BegellPubl, New York.
Dubochet, J., Adrian, M., Chang, J.-J., Homo, J.-C.,Lepault, J., McDowall, A. & Schultz, P. (1988).Cryo-electron microscopy of vitri®ed specimens.Quart. Rev. Biophys. 21, 129±228.
Frank, J., Verschoor, A. & Boublik, M. (1981). Computeraveraging of electron micrographs of 40S ribosomalsubunits. Science, 214, 1353±1355.
Frank, J., Penczek, P., Grassucci, R. & Srivastava, S.(1991). Three-dimensional reconstruction of the 70 S
Escherichia coli ribosome in ice: the distribution ofribosomal RNA. J. Cell Biol. 115, 597±605.
Fernandez-MoraÂn, H., van Bruggen, E. F: J. & Ohtsuki,M. (1966). Macromolecular organization of hemo-cyanins and apohemocyanins as revealed by elec-tron microscopy. J. Mol. Biol. 16, 191±207.
Gebauer, W., Harris, J. R., Heid, H., SuÈ ling, M.,Hillenbrand, R., SoÈhngen, S., Wegener-Strake, A. &Markl, J. (1994). Quaternary structure, subunits anddomain patterns of two discrete forms of keyholelimpet hemocyanin: KLH1 and KLH2. Zoology, 98,51±68.
Goncharov, A. B. & Gelfand, M. S. (1988). Determinationof mutual orientation of identical particles fromtheir projections by the moments method. Ultrami-croscopy, 25, 317±328.
Harauz, G. & van Heel, M. (1986). Exact ®lters for gen-eral geometry three-dimensional reconstruction.Optik, 73, 146±156.
Harris, J. R. & Horne, R. W. (1994). Negative staining: abrief assessment of current technical bene®ts, limi-tations and future possibilities. Micron, 25, 5±13.
Harris, J. R., Cejka, Z., Wegener-Strake, A., Gebauer,W. & Markl, J. (1992). Two-dimensional crystalliza-tion, transmission electron microscopy and imageprocessing of keyhole limpet hemocyanin. MicronMicrosc. Acta, 23, 287±301.
Harris, J. R., Gebauer, W. & Markl, J. (1993). Immunoe-lectron microscopy of hemocyanin from the keyholelimpet (Megathura crenulata): a parallel subunitmodel. J. Struct. Biol. 111, 96±104.
Harris, J. R., Gebauer, W., SoÈhngen, S. M. & Markl, J.(1995a). Keyhole limpet hemocyanin (KLH): puri®-cation of intact KLH1 through selective dissociationof KLH2. Micron, 26, 201±212.
Harris, J. R., Gebauer, W. & Markl, J. (1995b). Keyholelimpet haemocyanin: negative staining in the pre-sence of trehalose. Micron, 26, 25±33.
Harris, J. R., Gebauer, W., SoÈhngen, S. M., Nermut,M. V. & Markl, J. (1997). Keyhole limpet hemocya-nin (KLH)II: Characteristic reassociation propertiesof puri®ed KLH1 and KLH2. Micron 28, 43±56.
Hawkes, P. W. (1980). Image processing based on lineartheory of image formation. In Computer Processing ofElectron Microscope Images (Hawkes, P. W., ed.),pp. 1±33, Springer Verlag, Berlin, Heidelberg andNew York.
Helling, F., Shang, A., Calves, M., Zhang, S., Yu, R. K.,Oettgen, H. F. & Livingstone, P. O. (1994). GD3 vac-cines for melanoma: superior immunogenicity ofkeyhole limpet hemocyanin conjugate vaccines.Cancer Res. 54, 197±203.
Henderson, R. (1995). The potential and limitations ofneutrons, electrons and X-rays for atomic resolutionmicroscopy of unstained biological molecules.Quart. Rev. Biophys. 28, 171±193.
Henderson, R. & Unwin, P. N. T. (1975). Three-dimen-sional model of purple membrane obtained by elec-tron microscopy. Nature, 257, 28±32.
Henderson, R., Baldwin, J. M., Ceska, T. A., Zemlin, F.,Beckman, E. & Downing, K. H. (1990). Model forthe structure of bacteriorhodopsin based on high-resolution electron cryomicroscopy. J. Mol. Biol. 213,899±929.
Jap, B. K. & Walian, P. J. (1990). Biophysics of the struc-ture and function of porins. Quart. Rev. Biophys. 23,367±403.
15 AÊ Structure of KLH1 435
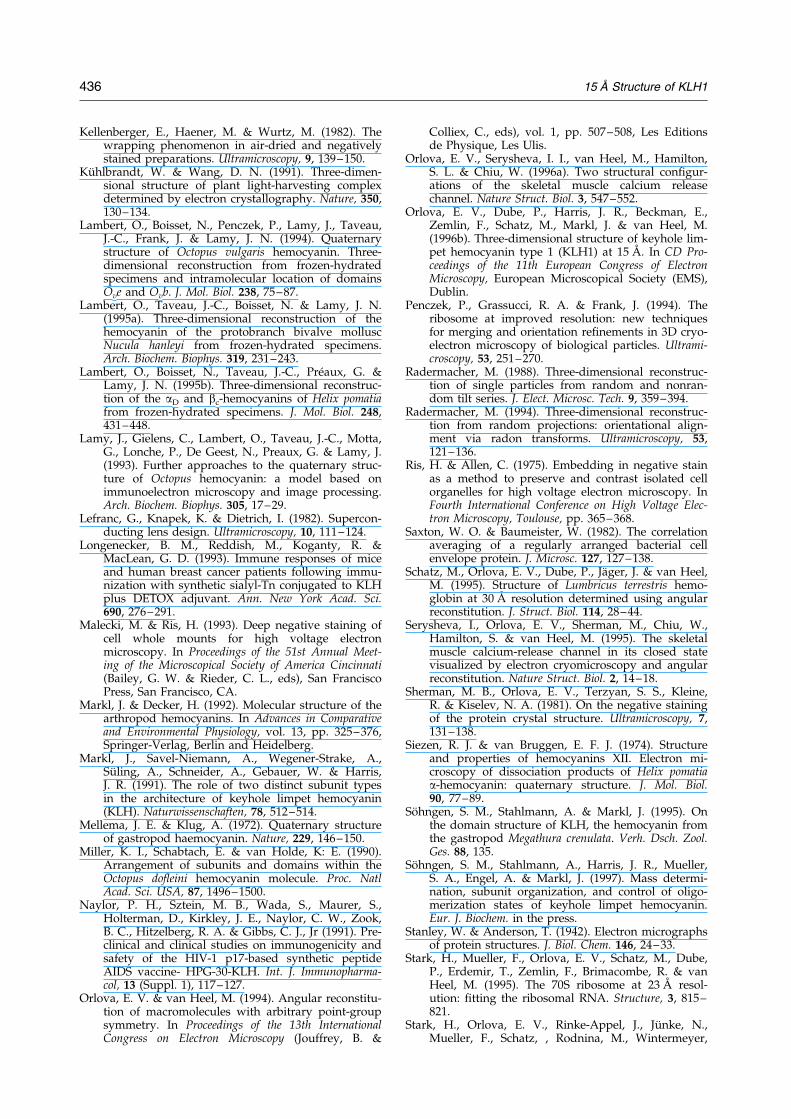
Kellenberger, E., Haener, M. & Wurtz, M. (1982). Thewrapping phenomenon in air-dried and negativelystained preparations. Ultramicroscopy, 9, 139±150.
KuÈ hlbrandt, W. & Wang, D. N. (1991). Three-dimen-sional structure of plant light-harvesting complexdetermined by electron crystallography. Nature, 350,130±134.
Lambert, O., Boisset, N., Penczek, P., Lamy, J., Taveau,J.-C., Frank, J. & Lamy, J. N. (1994). Quaternarystructure of Octopus vulgaris hemocyanin. Three-dimensional reconstruction from frozen-hydratedspecimens and intramolecular location of domainsOve and Ovb. J. Mol. Biol. 238, 75±87.
Lambert, O., Taveau, J.-C., Boisset, N. & Lamy, J. N.(1995a). Three-dimensional reconstruction of thehemocyanin of the protobranch bivalve molluscNucula hanleyi from frozen-hydrated specimens.Arch. Biochem. Biophys. 319, 231±243.
Lambert, O., Boisset, N., Taveau, J.-C., PreÂaux, G. &Lamy, J. N. (1995b). Three-dimensional reconstruc-tion of the aD and bc-hemocyanins of Helix pomatiafrom frozen-hydrated specimens. J. Mol. Biol. 248,431±448.
Lamy, J., Gielens, C., Lambert, O., Taveau, J.-C., Motta,G., Lonche, P., De Geest, N., Preaux, G. & Lamy, J.(1993). Further approaches to the quaternary struc-ture of Octopus hemocyanin: a model based onimmunoelectron microscopy and image processing.Arch. Biochem. Biophys. 305, 17±29.
Lefranc, G., Knapek, K. & Dietrich, I. (1982). Supercon-ducting lens design. Ultramicroscopy, 10, 111±124.
Longenecker, B. M., Reddish, M., Koganty, R. &MacLean, G. D. (1993). Immune responses of miceand human breast cancer patients following immu-nization with synthetic sialyl-Tn conjugated to KLHplus DETOX adjuvant. Ann. New York Acad. Sci.690, 276±291.
Malecki, M. & Ris, H. (1993). Deep negative staining ofcell whole mounts for high voltage electronmicroscopy. In Proceedings of the 51st Annual Meet-ing of the Microscopical Society of America Cincinnati(Bailey, G. W. & Rieder, C. L., eds), San FranciscoPress, San Francisco, CA.
Markl, J. & Decker, H. (1992). Molecular structure of thearthropod hemocyanins. In Advances in Comparativeand Environmental Physiology, vol. 13, pp. 325±376,Springer-Verlag, Berlin and Heidelberg.
Markl, J., Savel-Niemann, A., Wegener-Strake, A.,SuÈ ling, A., Schneider, A., Gebauer, W. & Harris,J. R. (1991). The role of two distinct subunit typesin the architecture of keyhole limpet hemocyanin(KLH). Naturwissenschaften, 78, 512±514.
Mellema, J. E. & Klug, A. (1972). Quaternary structureof gastropod haemocyanin. Nature, 229, 146±150.
Miller, K. I., Schabtach, E. & van Holde, K: E. (1990).Arrangement of subunits and domains within theOctopus do¯eini hemocyanin molecule. Proc. NatlAcad. Sci. USA, 87, 1496±1500.
Naylor, P. H., Sztein, M. B., Wada, S., Maurer, S.,Holterman, D., Kirkley, J. E., Naylor, C. W., Zook,B. C., Hitzelberg, R. A. & Gibbs, C. J., Jr (1991). Pre-clinical and clinical studies on immunogenicity andsafety of the HIV-1 p17-based synthetic peptideAIDS vaccine- HPG-30-KLH. Int. J. Immunopharma-col, 13 (Suppl. 1), 117±127.
Orlova, E. V. & van Heel, M. (1994). Angular reconstitu-tion of macromolecules with arbitrary point-groupsymmetry. In Proceedings of the 13th InternationalCongress on Electron Microscopy (Jouffrey, B. &
Colliex, C., eds), vol. 1, pp. 507±508, Les Editionsde Physique, Les Ulis.
Orlova, E. V., Serysheva, I. I., van Heel, M., Hamilton,S. L. & Chiu, W. (1996a). Two structural con®gur-ations of the skeletal muscle calcium releasechannel. Nature Struct. Biol. 3, 547±552.
Orlova, E. V., Dube, P., Harris, J. R., Beckman, E.,Zemlin, F., Schatz, M., Markl, J. & van Heel, M.(1996b). Three-dimensional structure of keyhole lim-pet hemocyanin type 1 (KLH1) at 15 AÊ . In CD Pro-ceedings of the 11th European Congress of ElectronMicroscopy, European Microscopical Society (EMS),Dublin.
Penczek, P., Grassucci, R. A. & Frank, J. (1994). Theribosome at improved resolution: new techniquesfor merging and orientation re®nements in 3D cryo-electron microscopy of biological particles. Ultrami-croscopy, 53, 251±270.
Radermacher, M. (1988). Three-dimensional reconstruc-tion of single particles from random and nonran-dom tilt series. J. Elect. Microsc. Tech. 9, 359±394.
Radermacher, M. (1994). Three-dimensional reconstruc-tion from random projections: orientational align-ment via radon transforms. Ultramicroscopy, 53,121±136.
Ris, H. & Allen, C. (1975). Embedding in negative stainas a method to preserve and contrast isolated cellorganelles for high voltage electron microscopy. InFourth International Conference on High Voltage Elec-tron Microscopy, Toulouse, pp. 365±368.
Saxton, W. O. & Baumeister, W. (1982). The correlationaveraging of a regularly arranged bacterial cellenvelope protein. J. Microsc. 127, 127±138.
Schatz, M., Orlova, E. V., Dube, P., JaÈger, J. & van Heel,M. (1995). Structure of Lumbricus terrestris hemo-globin at 30 AÊ resolution determined using angularreconstitution. J. Struct. Biol. 114, 28±44.
Serysheva, I., Orlova, E. V., Sherman, M., Chiu, W.,Hamilton, S. & van Heel, M. (1995). The skeletalmuscle calcium-release channel in its closed statevisualized by electron cryomicroscopy and angularreconstitution. Nature Struct. Biol. 2, 14±18.
Sherman, M. B., Orlova, E. V., Terzyan, S. S., Kleine,R. & Kiselev, N. A. (1981). On the negative stainingof the protein crystal structure. Ultramicroscopy, 7,131±138.
Siezen, R. J. & van Bruggen, E. F. J. (1974). Structureand properties of hemocyanins XII. Electron mi-croscopy of dissociation products of Helix pomatiaa-hemocyanin: quaternary structure. J. Mol. Biol.90, 77±89.
SoÈhngen, S. M., Stahlmann, A. & Markl, J. (1995). Onthe domain structure of KLH, the hemocyanin fromthe gastropod Megathura crenulata. Verh. Dsch. Zool.Ges. 88, 135.
SoÈhngen, S. M., Stahlmann, A., Harris, J. R., Mueller,S. A., Engel, A. & Markl, J. (1997). Mass determi-nation, subunit organization, and control of oligo-merization states of keyhole limpet hemocyanin.Eur. J. Biochem. in the press.
Stanley, W. & Anderson, T. (1942). Electron micrographsof protein structures. J. Biol. Chem. 146, 24±33.
Stark, H., Mueller, F., Orlova, E. V., Schatz, M., Dube,P., Erdemir, T., Zemlin, F., Brimacombe, R. & vanHeel, M. (1995). The 70S ribosome at 23 AÊ resol-ution: ®tting the ribosomal RNA. Structure, 3, 815±821.
Stark, H., Orlova, E. V., Rinke-Appel, J., JuÈ nke, N.,Mueller, F., Schatz, , Rodnina, M., Wintermeyer,
436 15 AÊ Structure of KLH1
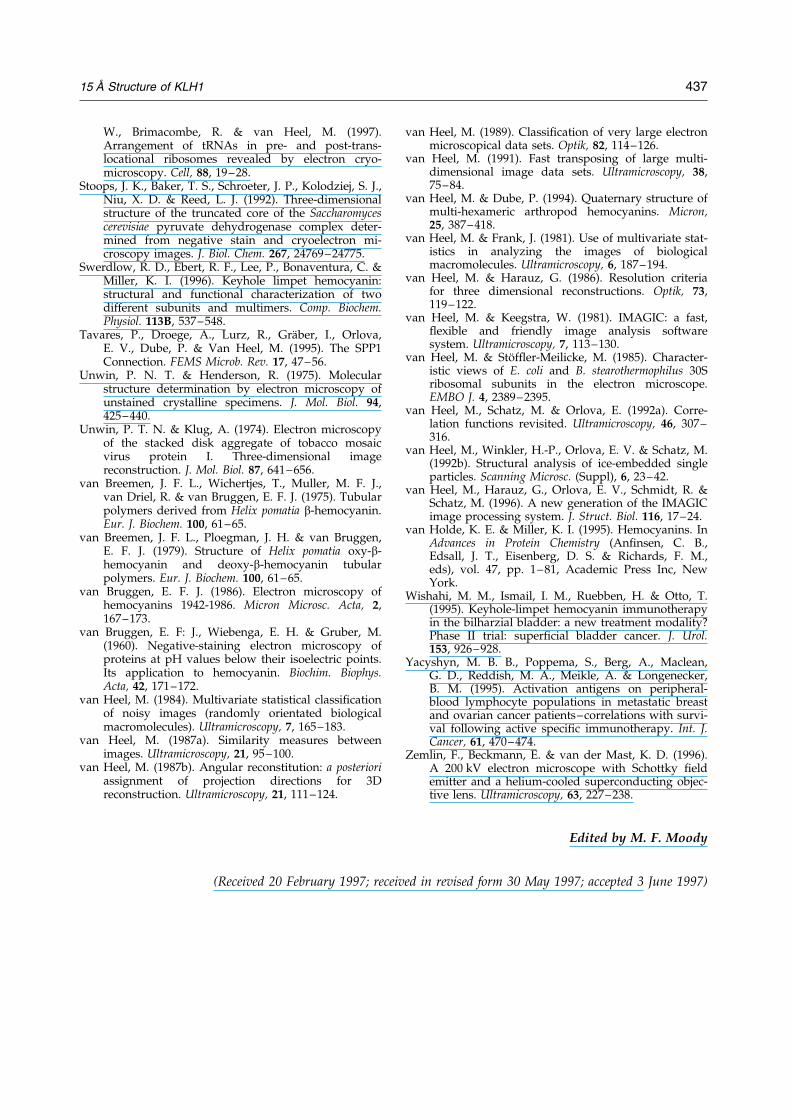
W., Brimacombe, R. & van Heel, M. (1997).Arrangement of tRNAs in pre- and post-trans-locational ribosomes revealed by electron cryo-microscopy. Cell, 88, 19±28.
Stoops, J. K., Baker, T. S., Schroeter, J. P., Kolodziej, S. J.,Niu, X. D. & Reed, L. J. (1992). Three-dimensionalstructure of the truncated core of the Saccharomycescerevisiae pyruvate dehydrogenase complex deter-mined from negative stain and cryoelectron mi-croscopy images. J. Biol. Chem. 267, 24769±24775.
Swerdlow, R. D., Ebert, R. F., Lee, P., Bonaventura, C. &Miller, K. I. (1996). Keyhole limpet hemocyanin:structural and functional characterization of twodifferent subunits and multimers. Comp. Biochem.Physiol. 113B, 537±548.
Tavares, P., Droege, A., Lurz, R., GraÈber, I., Orlova,E. V., Dube, P. & Van Heel, M. (1995). The SPP1Connection. FEMS Microb. Rev. 17, 47±56.
Unwin, P. N. T. & Henderson, R. (1975). Molecularstructure determination by electron microscopy ofunstained crystalline specimens. J. Mol. Biol. 94,425±440.
Unwin, P. T. N. & Klug, A. (1974). Electron microscopyof the stacked disk aggregate of tobacco mosaicvirus protein I. Three-dimensional imagereconstruction. J. Mol. Biol. 87, 641±656.
van Breemen, J. F. L., Wichertjes, T., Muller, M. F. J.,van Driel, R. & van Bruggen, E. F. J. (1975). Tubularpolymers derived from Helix pomatia b-hemocyanin.Eur. J. Biochem. 100, 61±65.
van Breemen, J. F. L., Ploegman, J. H. & van Bruggen,E. F. J. (1979). Structure of Helix pomatia oxy-b-hemocyanin and deoxy-b-hemocyanin tubularpolymers. Eur. J. Biochem. 100, 61±65.
van Bruggen, E. F. J. (1986). Electron microscopy ofhemocyanins 1942-1986. Micron Microsc. Acta, 2,167±173.
van Bruggen, E. F: J., Wiebenga, E. H. & Gruber, M.(1960). Negative-staining electron microscopy ofproteins at pH values below their isoelectric points.Its application to hemocyanin. Biochim. Biophys.Acta, 42, 171±172.
van Heel, M. (1984). Multivariate statistical classi®cationof noisy images (randomly orientated biologicalmacromolecules). Ultramicroscopy, 7, 165±183.
van Heel, M. (1987a). Similarity measures betweenimages. Ultramicroscopy, 21, 95±100.
van Heel, M. (1987b). Angular reconstitution: a posterioriassignment of projection directions for 3Dreconstruction. Ultramicroscopy, 21, 111±124.
van Heel, M. (1989). Classi®cation of very large electronmicroscopical data sets. Optik, 82, 114±126.
van Heel, M. (1991). Fast transposing of large multi-dimensional image data sets. Ultramicroscopy, 38,75±84.
van Heel, M. & Dube, P. (1994). Quaternary structure ofmulti-hexameric arthropod hemocyanins. Micron,25, 387±418.
van Heel, M. & Frank, J. (1981). Use of multivariate stat-istics in analyzing the images of biologicalmacromolecules. Ultramicroscopy, 6, 187±194.
van Heel, M. & Harauz, G. (1986). Resolution criteriafor three dimensional reconstructions. Optik, 73,119±122.
van Heel, M. & Keegstra, W. (1981). IMAGIC: a fast,¯exible and friendly image analysis softwaresystem. Ultramicroscopy, 7, 113±130.
van Heel, M. & StoÈ f¯er-Meilicke, M. (1985). Character-istic views of E. coli and B. stearothermophilus 30Sribosomal subunits in the electron microscope.EMBO J. 4, 2389±2395.
van Heel, M., Schatz, M. & Orlova, E. (1992a). Corre-lation functions revisited. Ultramicroscopy, 46, 307±316.
van Heel, M., Winkler, H.-P., Orlova, E. V. & Schatz, M.(1992b). Structural analysis of ice-embedded singleparticles. Scanning Microsc. (Suppl), 6, 23±42.
van Heel, M., Harauz, G., Orlova, E. V., Schmidt, R. &Schatz, M. (1996). A new generation of the IMAGICimage processing system. J. Struct. Biol. 116, 17±24.
van Holde, K. E. & Miller, K. I. (1995). Hemocyanins. InAdvances in Protein Chemistry (An®nsen, C. B.,Edsall, J. T., Eisenberg, D. S. & Richards, F. M.,eds), vol. 47, pp. 1±81, Academic Press Inc, NewYork.
Wishahi, M. M., Ismail, I. M., Ruebben, H. & Otto, T.(1995). Keyhole-limpet hemocyanin immunotherapyin the bilharzial bladder: a new treatment modality?Phase II trial: super®cial bladder cancer. J. Urol.153, 926±928.
Yacyshyn, M. B. B., Poppema, S., Berg, A., Maclean,G. D., Reddish, M. A., Meikle, A. & Longenecker,B. M. (1995). Activation antigens on peripheral-blood lymphocyte populations in metastatic breastand ovarian cancer patients±correlations with survi-val following active speci®c immunotherapy. Int. J.Cancer, 61, 470±474.
Zemlin, F., Beckmann, E. & van der Mast, K. D. (1996).A 200 kV electron microscope with Schottky ®eldemitter and a helium-cooled superconducting objec-tive lens. Ultramicroscopy, 63, 227±238.
Edited by M. F. Moody
(Received 20 February 1997; received in revised form 30 May 1997; accepted 3 June 1997)
15 AÊ Structure of KLH1 437
Copyright © 2022 FDOKUMEN