Deep phylogeographic divergence among populations of limpet Siphonaria lessoni on the east and west...
13
1 23 Marine Biology International Journal on Life in Oceans and Coastal Waters ISSN 0025-3162 Mar Biol DOI 10.1007/s00227-014-2607-3 Deep phylogeographic divergence among populations of limpet Siphonaria lessoni on the east and west coasts of South America J. D. Nuñez, P. J. Fernández Iriarte, E. H. Ocampo, C. Iudica & M. Cledón
Transcript of Deep phylogeographic divergence among populations of limpet Siphonaria lessoni on the east and west...
1 23
Marine BiologyInternational Journal on Life in Oceansand Coastal Waters ISSN 0025-3162 Mar BiolDOI 10.1007/s00227-014-2607-3
Deep phylogeographic divergence amongpopulations of limpet Siphonaria lessoni onthe east and west coasts of South America
J. D. Nuñez, P. J. Fernández Iriarte,E. H. Ocampo, C. Iudica & M. Cledón

1 23
Your article is protected by copyright and
all rights are held exclusively by Springer-
Verlag Berlin Heidelberg. This e-offprint is
for personal use only and shall not be self-
archived in electronic repositories. If you wish
to self-archive your article, please use the
accepted manuscript version for posting on
your own website. You may further deposit
the accepted manuscript version in any
repository, provided it is only made publicly
available 12 months after official publication
or later and provided acknowledgement is
given to the original source of publication
and a link is inserted to the published article
on Springer's website. The link must be
accompanied by the following text: "The final
publication is available at link.springer.com”.
1 3
Mar BiolDOI 10.1007/s00227-014-2607-3
ORIGINAL PAPER
Deep phylogeographic divergence among populations of limpet Siphonaria lessoni on the east and west coasts of South America
J. D. Nuñez · P. J. Fernández Iriarte · E. H. Ocampo · C. Iudica · M. Cledón
Received: 5 March 2014 / Accepted: 29 December 2014 © Springer-Verlag Berlin Heidelberg 2015
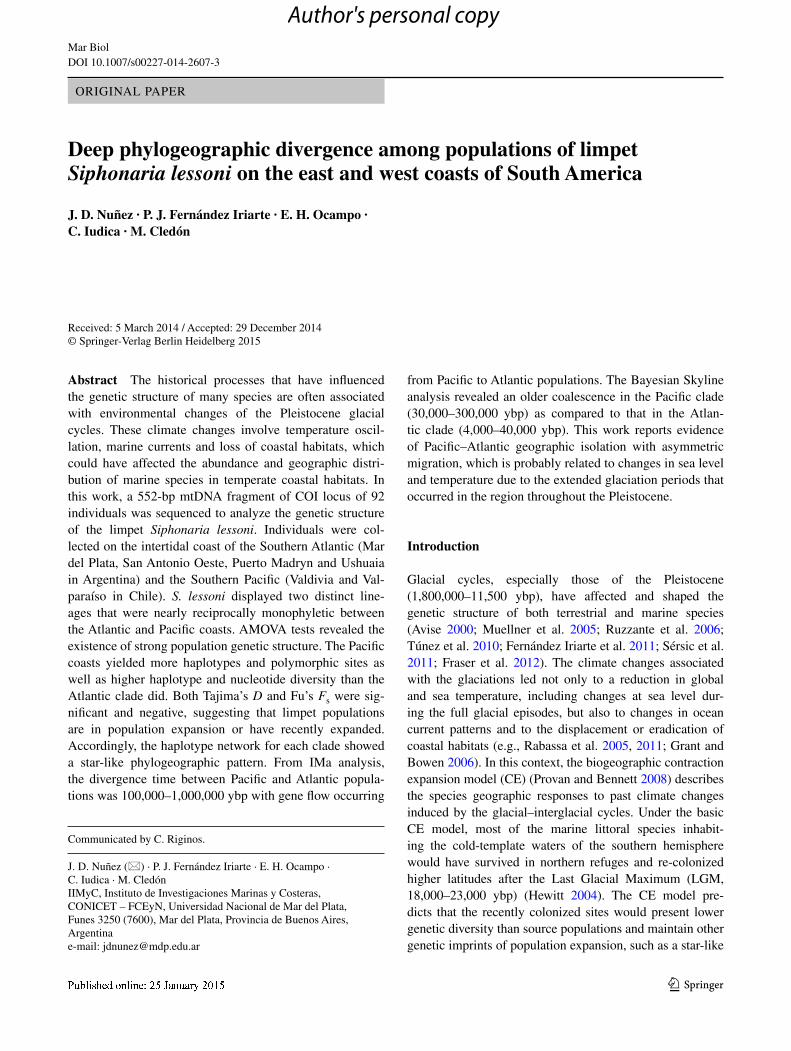
from Pacific to Atlantic populations. The Bayesian Skyline analysis revealed an older coalescence in the Pacific clade (30,000–300,000 ybp) as compared to that in the Atlan-tic clade (4,000–40,000 ybp). This work reports evidence of Pacific–Atlantic geographic isolation with asymmetric migration, which is probably related to changes in sea level and temperature due to the extended glaciation periods that occurred in the region throughout the Pleistocene.
Introduction
Glacial cycles, especially those of the Pleistocene (1,800,000–11,500 ybp), have affected and shaped the genetic structure of both terrestrial and marine species (Avise 2000; Muellner et al. 2005; Ruzzante et al. 2006; Túnez et al. 2010; Fernández Iriarte et al. 2011; Sérsic et al. 2011; Fraser et al. 2012). The climate changes associated with the glaciations led not only to a reduction in global and sea temperature, including changes at sea level dur-ing the full glacial episodes, but also to changes in ocean current patterns and to the displacement or eradication of coastal habitats (e.g., Rabassa et al. 2005, 2011; Grant and Bowen 2006). In this context, the biogeographic contraction expansion model (CE) (Provan and Bennett 2008) describes the species geographic responses to past climate changes induced by the glacial–interglacial cycles. Under the basic CE model, most of the marine littoral species inhabit-ing the cold-template waters of the southern hemisphere would have survived in northern refuges and re-colonized higher latitudes after the Last Glacial Maximum (LGM, 18,000–23,000 ybp) (Hewitt 2004). The CE model pre-dicts that the recently colonized sites would present lower genetic diversity than source populations and maintain other genetic imprints of population expansion, such as a star-like
Abstract The historical processes that have influenced the genetic structure of many species are often associated with environmental changes of the Pleistocene glacial cycles. These climate changes involve temperature oscil-lation, marine currents and loss of coastal habitats, which could have affected the abundance and geographic distri-bution of marine species in temperate coastal habitats. In this work, a 552-bp mtDNA fragment of COI locus of 92 individuals was sequenced to analyze the genetic structure of the limpet Siphonaria lessoni. Individuals were col-lected on the intertidal coast of the Southern Atlantic (Mar del Plata, San Antonio Oeste, Puerto Madryn and Ushuaia in Argentina) and the Southern Pacific (Valdivia and Val-paraíso in Chile). S. lessoni displayed two distinct line-ages that were nearly reciprocally monophyletic between the Atlantic and Pacific coasts. AMOVA tests revealed the existence of strong population genetic structure. The Pacific coasts yielded more haplotypes and polymorphic sites as well as higher haplotype and nucleotide diversity than the Atlantic clade did. Both Tajima’s D and Fu’s Fs were sig-nificant and negative, suggesting that limpet populations are in population expansion or have recently expanded. Accordingly, the haplotype network for each clade showed a star-like phylogeographic pattern. From IMa analysis, the divergence time between Pacific and Atlantic popula-tions was 100,000–1,000,000 ybp with gene flow occurring
Communicated by C. Riginos.
J. D. Nuñez (*) · P. J. Fernández Iriarte · E. H. Ocampo · C. Iudica · M. Cledón IIMyC, Instituto de Investigaciones Marinas y Costeras, CONICET – FCEyN, Universidad Nacional de Mar del Plata, Funes 3250 (7600), Mar del Plata, Provincia de Buenos Aires, Argentinae-mail: [email protected]
Author's personal copy
Mar Biol
1 3
haplotype network, negative Tajima’s D and Fu Fs indices, lower R2 index and an unimodal mismatch distribution, among others (e.g., Hewitt 2000, 2001, 2004; Hewitt and Ibrahim 2001; Emerson and Hewitt 2005). In the marine environment, coastal species reveal different responses to past climate change than offshore species. While coastal-benthic species provide strong evidence of recent (i.e., LGM) climate changes (e.g., Wares and Cunningham 2001; Marko et al. 2010; González-Wevar et al., 2013), offshore-pelagic species show patterns of genetic differentiation and divergence consistent with long-term regional persistence (Janko et al. 2007; Fernández Iriarte et al. 2011). These contrasting biogeographic histories could reflect fundamen-tal differences in the way in which glaciations impacted on coastal and offshore scenarios (e.g., Wares and Cunningham 2001; Janko et al. 2007; Marko et al. 2010). Aside from the historical climate changes, other factors may promote dif-ferent levels of phylogeographic structure and differentia-tion in marine species. Indeed, the interconnection among populations could be influenced by the ontogeny of marine organisms (e.g., Palumbi 2003; Riginos et al. 2011; Fraser et al. 2012). For instance, species with planktonic phase could increase their dispersion ability and connectivity, dis-playing, in some cases, a weaker population structure than that of species with direct development (e.g., Palumbi 1994; Thorrold et al. 2002; Kinlan and Gaines 2003; Wares 2002; Marko et al. 2010).
The austral edge of South America underwent strong climatic fluctuations during the Pleistocene glaciations (Rabassa et al. 2011). Thus, the biogeographic regions of Peru, Central Chile and Magellan in the Pacific Ocean (Fig. 1) are defined by contrasting the geologic and climate history (Harrison 2004) that could be reflected in the phy-logeographic structure of littoral species. In this sense, the barnacle Notochthamalus scabrosus (Zakas et al. 2009), the alga Macrocystis pyrifera (Macaya and Zuccarello 2010) and the sleeper limpet Crepipatella dilatata (Brante et al. 2012) displayed a break at 30°S between the Central and Peruvian regions, while the kelp Durvillaea antarctica presented a phylogeographic break between the Central and Magellan regions at 44°S (Fraser et al. 2009, 2010). In contrast, the barnacle Jehlius cirratus (Zakas et al. 2009), the gastropods Concholepas concholepas (Cárde-nas et al. 2009) and the fish Eleginops maclovinus (Cebal-los et al. 2012) did not show genetic structure linked to biogeographic coastal regions of southern South America. A recent comparison of the limpet Nacella magellanica with the Pacific and Atlantic Patagonia (Magellan region) indicates that this species did not suffer a phylogeographic break (probably due to the long duration of its larval phase). In spite of that, N. magellanica is in postglacial expansion on the Atlantic and Pacific shores (de Aranzamendi et al. 2011; González-Wevar et al. 2012).
Siphonaria lessoni (Blainville 1824) is a pulmonate limpet (Pulmonata, Siphonariidae) that inhabits inter-tidal crevices and tide pools on rocky shores (Penchasza-deh 2004). Many of the ecological and life history traits of this species turn it into an interesting study system to address questions of historical events driving the current geographic distribution of species living in the littoral of South America. To begin with, S. lessoni features a wide distribution range from the Peruvian coast (Alamo and Val-divieso 1997) to Cabo de Hornos (Dell 1971) in the Pacific Ocean and from Islas Malvinas (Falkland Islands) and the Patagonian coast (Castellanos et al. 1993) to Santa Cata-rina, Brazil (Penchaszadeh et al. 2007), which allows to analyze demographic and population responses to climate changes in an extended geographic range. Secondly, plank-tonic larval duration of S. lessoni is about 7 days (Olivier and Penchaszadeh 1968), which affords the opportunity to explore whether persistence of larvae in the water col-umn influences the historic connectivity and gene flow among populations. Thirdly, despite fossil records indicat-ing that S. lessoni is present in the southwestern Atlantic from the Holocene (5,000–8,000 ybp), records from the Pleistocene (125,000 ybp) account for their presence in the coast of Golfo Nuevo, Argentina (42–44°S, Fig. 1) (Agu-irre et al. 2008, 2009). This finding suggests that the Golfo Nuevo could have functioned as a refuge to littoral spe-cies during the Pleistocene glaciations, a hypothesis that can be tested for S. lessoni by conducting phylogeographic analyses. Fourthly, palaeoenvironmental and geographic evidence suggests that part of the molluscan fauna of the Argentinean Patagonia radiated from the southeastern Pacific (see Aguirre et al. 2008). Therefore, S. lessoni could be used to determine whether Chilean populations are, in fact, the “ancestral populations” that originated the Atlantic populations.
This study aimed to analyze the genetic structure and demographic history of S. lessoni in the southwestern Atlantic and southeastern Pacific, using the mitochondrial marker cytochrome oxidase I (COI). The major hypotheses formulated were: (1) glacial expansion isolated, at some point during the Pleistocene, the Pacific and Atlantic popu-lations. On the basis of this hypothesis, a strong phylogeo-graphic structure should be found between the Pacific and Atlantic populations with a divergence time between these two populations in the Pleistocene, (2) Pacific populations have acted as a colonization source for Atlantic populations on at least one occasion, if this hypothesis held true, Pacific populations would be expected to reveal more genetic diversity than Atlantic populations do; also, we would be expected similar diversity between Pacific and ancestral populations. Finally, we would be expected that migration of Pacific individuals into to Atlantic would be greater than the opposite.
Author's personal copy

Mar Biol
1 3
Materials and methods
Sample collection
Individuals from S. lessoni were collected from rocky areas of the middle intertidal zone in Mar del Plata (MDP; 38°S 57°W), San Antonio Oeste (SAO; 40°S 64° W), Puerto Madryn (MAD; 42°S, 65°W) and Ushuaia (USH; 54°S, 68°W) on the Argentinean coast, and from Valdivia (VLD; 39°S, 73°W) and Valparaíso (VLP; 30°S, 71°W) on the Chilean coast. These sites comprise the following biogeo-graphic provinces: Argentinean province (MDP + SAO), Magellan province (MAD + USH) and Central Chile prov-ince (VLD + VLP) (Fig. 1). At each site, 20 individuals
were removed from the upper intertidal and stored in 70 % ethanol until further processing.
DNA extraction, PCR amplification and sequencing
DNA was extracted from small muscle pieces using the Chelex 100 (Biorad) method sensu Walsh et al. (1991). A fragment of the mitochondrial gene COI was ampli-fied using the universal primers LCO1490 and HCO2198 (Folmer et al. 1994). Reactions were performed in 30 μl final volume, containing 3 μl of 10× buffer, 2 μl MgCl2 (25 mM), 2.5 μl DNTPs (2.5 mM), 3 μl of each primer (2 mM), 0.08 units/ml of Taq polymerase and 3 μl of DNA template. PCR cycling was performed starting with dena-turation for 1 min at 96 °C, followed by 40 cycles of 30 s at 94 °C, 1 min at 50 °C and 1 min at 72 °C, with a final extension of 14 min at 72 °C. Successful PCR reactions were confirmed in a 2 % agarose gel and purified with kits. PCR products were sequenced in Macrogen Inc. (Korea). The sequences were aligned, corrected and edited with PROSEQ (Filatov 2002). Sequences were deposited in GenBank under the access numbers XXX to XXX.
Genetic diversity indexes and population genetic structure
For each sampled population, haplotype (h) and nucleo-tide (π) diversities were estimated using DNAsp v5 (Lib-rado and Rozas 2009). An analysis of molecular variance (AMOVA) was performed using Arlequin, with 10,000 permutations to test significance (Excoffier et al. 2005). To infer the spatial genetic structure of S. lessoni, the pairwise values of PhiST were calculated. A nested AMOVA was also conducted by placing biogeographic samples (CHI, MAG and ARG) in different groups.
The genealogical relationships between sequences were inferred by the haplotype network obtained using “median-joining” with Network 4.6 software (http://www.fluxus-engineering.com). The substitution model of the COI frag-ment was estimated with the jModelTest 0.1.1 software (Posada 2008).
An intraspecific phylogeny was constructed with S. lat-eralis as the outgroup with the neighbor-joining tree using software MEGA 5 (Tamura et al. 2011). The evolutionary distance was calculated with the Maximum Composite Likelihood method, and node support was evaluated with 1,000 bootstrap replicates (Felsenstein 1985).
Demographic analysis
The history of demographic changes was assessed by cal-culating the Tajima’s D test (Tajima 1989) and Fu’s Fs test (Fu 1997), using DnaSP. Tajima’s and Fu’s neutral-ity tests are currently used to verify whether a population
Fig. 1 Map of sampling scheme for S. lessoni along almost all its distribution range. Dashed lines indicate the different biogeographic provinces: Argentina (MDP + SAO); Magellan (MAD + USH); Cen-tral Chile (VLD + VLP). MDP, Mar del Plata; SAO, San Antonio Oeste; MAD, Puerto Madryn; USH, Ushuaia; VLP, Valparaíso; VLD, Valdivia; GN, Golfo Nuevo; EM, Estrecho de Magallanes. The diffuse line over the Andes mountain range shows the Patagonian ice sheet in the Last Glacial Maximum (LGM) from McCulloch et al. (2000). The dotted line in the ocean shows the sea level at the LGM according to Rabassa et al. (2005)
Author's personal copy
Mar Biol
1 3
is in a neutral mutation/drift equilibrium (Ramos-Onsins and Rozas 2002). Negative and significant values of these parameters are indicative of population expansion and/or negative selection. The demographic history of S. les-soni was also studied with “mismatch” distributions (dif-ferences in distributions between haplotype pairs) (Rogers and Harpending 1992). This method discriminates between stability and sudden population expansion. The observed mismatch distributions were compared to those expected at each site, using a model of sudden population expansion. Any deviation from the model was evaluated with the R2 (Ramos-Onsins and Rozas 2002) calculated in DNAsp. After large expansion, populations should present unimodal mismatch distributions with low R2, while stable ones with high R2. The significance of each index (Fs, D and R2) was tested with 10,000 simulations based on the coalescent pro-cess in DNAsp.
The isolation with the migration model implemented in the Bayesian-based IMa program (Hey and Nielsen 2007) was used to assess gene flow between Atlantic (USH + MAD + SAO + MDP) and Pacific populations (VLD + VLP). To fit the IM model to the data, a Bayes-ian coalescent method that integrates all possible genealo-gies with a Markov chain Monte Carlo approach was used. Three independent runs performed in “MCMC mode” with different random seed numbers were conducted with a burn-in period of 50,000 steps and running for 500,000 steps. To ensure that there are no obvious trends, the run of the program should be long enough for chains to con-verge and the effective sample size (ESS) value among the parameters should be greater than 50 (see Hey and Nielsen 2007). So we ran the program multiple times (with a differ-ent random number seed) and corroborated that the results were similar and with ESS greater than 50.
Runs were monitored by using estimates of the effec-tive sample size based on the measured autocorrelation of parameter values over the course of the run.
Genealogies saved during the runs were analyzed in a “Load Trees mode” (L-mode) to determine whether the full model fit the data better than models that excluded the parameters. To convert scaled model parameter estimates into demographic parameters (including effective popula-tion size Ne and divergence time T), we assumed a gen-eration time of 1 year and specified a COI mutation rate of 1–10 % per million years (Myr) (see below). Values of demographic parameters reported are the means from three runs (±SD) and means of 95 % confidence limits.
Past changes in the effective population size (Ne) of S. lessoni were characterized by generating COI Bayesian skyline plots (BSPs) with BEAST v1.4.8 (Drummond et al. 2005; Drummond and Rambaut 2007). These analyses were run under the HKY + I + G model selected by jMod-elTest using the Akaike information criterion. The analysis
was performed with three runs of 10,000,000 generations each, in which trees and parameters were sampled every 1,000 generations.
To estimate population divergence times, the COI sub-stitution rate of 1 % per million years was used, previously applied to S. concinna, S. nigerrima and S. capensis, which is a mean of divergence between gastropod species (Teske et al. 2011). This substitution rate was corrected based on theoretical studies that suggest that the substitution rate within lineages is 10 times higher than that between line-ages (Ho et al. 2005, 2007, 2011) and recently used in lim-pets (de Aranzamendi et al. 2011; González-Wevar et al. 2011, 2012, 2013). In view of this, substitution rates of 1 and 10 % were run for both lineages, and the mean coales-cence times from three runs of BEAST were corrected and plotted.
Results
Genetic diversity indexes and population genetic analysis
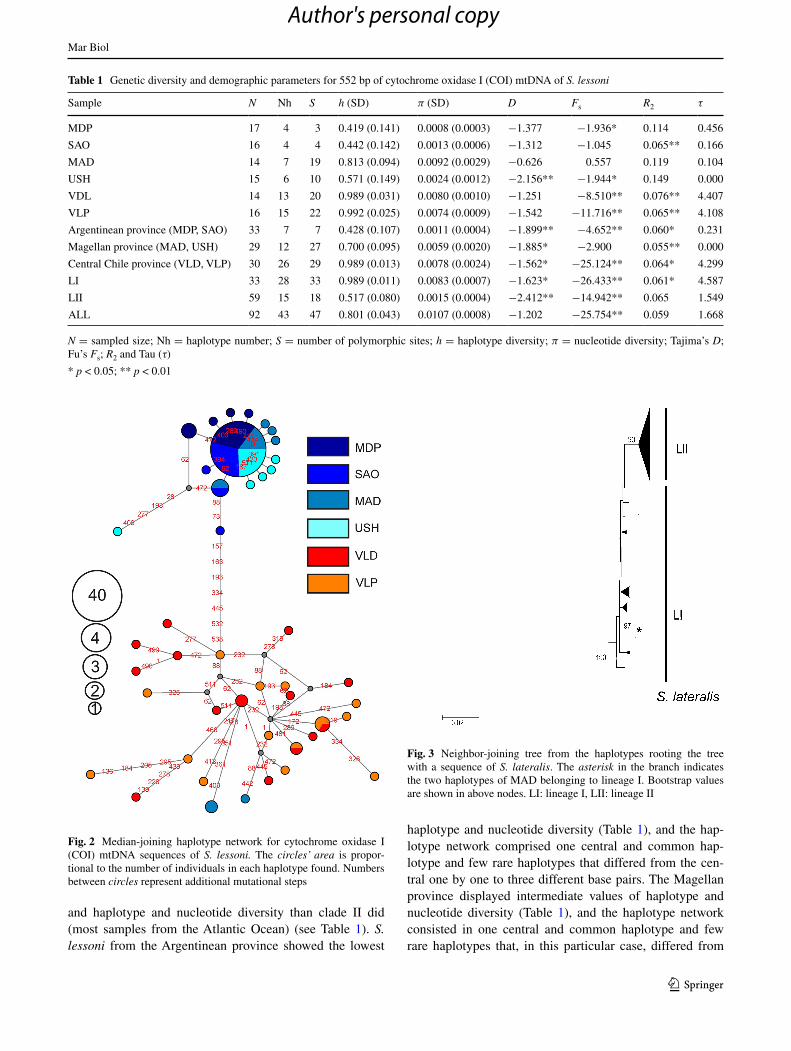
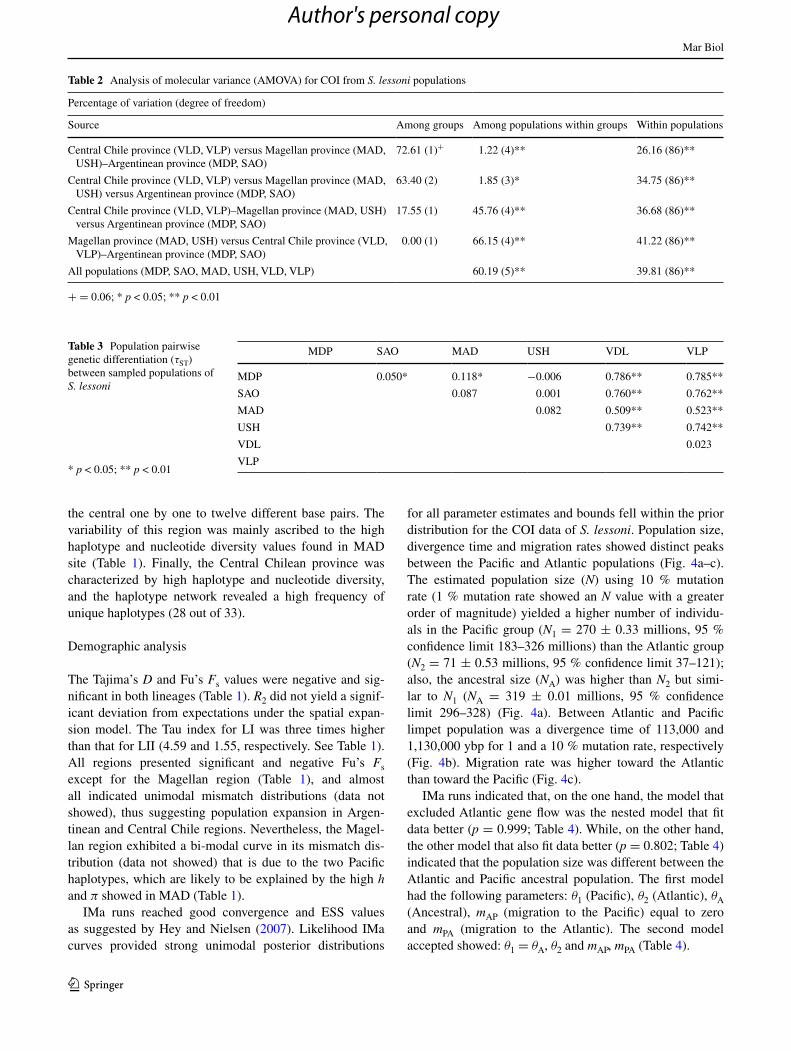
Sixty-one substitutions (42 transitions and 6 transversions) and 47 polymorphic sites in 92 samples of 520 bp of S. lessoni COI sequences obtained from Argentina and Chile defined 43 mitochondrial haplotypes. The mean number of pairwise differences was 5.899 (±2.843). Overall nucleo-tide diversity was 0.0107 (ranging from 0.0008 to 0.0074), and haplotype diversity was 0.801 (ranging from 0.419 in MDP to 0.992 in VLP) (Table 1). S. lessoni haplotypes belonged to two lineages, one comprising the Central Chil-ean province samples (LI) and the other including almost all the Magellan and Argentinean province samples (LII) with high bootstrap (Fig. 2). The Chilean and Magellan–Argentinean bioregions did not share haplotypes, and only in MAD did they present two haplotypes closely related to LI and five haplotypes assigned to LII (Figs. 2, 3). The AMOVA tests revealed the existence of strong population genetic structure between biogeographic provinces. Thus, CHI versus MAG–ARG Argentinean province group-ings explained most of the genetic variations (Table 2). The other geographic levels explained lesser variation and were not significant among groups (Table 2). Also, the τST between pair of sites indicated that the Central Chilean samples (VLD and VLP) were similar (yielded lower πST) and largely divergent from the Magellan (MAD and USH) and Argentinean (MDP and SAO) provinces. Likewise, within these regions, MDP was moderately divergent from SAO and MAD (Table 3).
The COI haplotype network for S. lessoni showed that the LI and LII lineages are connected by seven mutational steps (Fig. 3). LI, mostly samples from the Pacific Ocean, yielded a higher number of haplotypes, polymorphic sites,
Author's personal copy
Mar Biol
1 3
and haplotype and nucleotide diversity than clade II did (most samples from the Atlantic Ocean) (see Table 1). S. lessoni from the Argentinean province showed the lowest
haplotype and nucleotide diversity (Table 1), and the hap-lotype network comprised one central and common hap-lotype and few rare haplotypes that differed from the cen-tral one by one to three different base pairs. The Magellan province displayed intermediate values of haplotype and nucleotide diversity (Table 1), and the haplotype network consisted in one central and common haplotype and few rare haplotypes that, in this particular case, differed from
Table 1 Genetic diversity and demographic parameters for 552 bp of cytochrome oxidase I (COI) mtDNA of S. lessoni
N = sampled size; Nh = haplotype number; S = number of polymorphic sites; h = haplotype diversity; π = nucleotide diversity; Tajima’s D; Fu’s Fs; R2 and Tau (τ)
* p < 0.05; ** p < 0.01
Sample N Nh S h (SD) π (SD) D Fs R2 τ
MDP 17 4 3 0.419 (0.141) 0.0008 (0.0003) −1.377 −1.936* 0.114 0.456
SAO 16 4 4 0.442 (0.142) 0.0013 (0.0006) −1.312 −1.045 0.065** 0.166
MAD 14 7 19 0.813 (0.094) 0.0092 (0.0029) −0.626 0.557 0.119 0.104
USH 15 6 10 0.571 (0.149) 0.0024 (0.0012) −2.156** −1.944* 0.149 0.000
VDL 14 13 20 0.989 (0.031) 0.0080 (0.0010) −1.251 −8.510** 0.076** 4.407
VLP 16 15 22 0.992 (0.025) 0.0074 (0.0009) −1.542 −11.716** 0.065** 4.108
Argentinean province (MDP, SAO) 33 7 7 0.428 (0.107) 0.0011 (0.0004) −1.899** −4.652** 0.060* 0.231
Magellan province (MAD, USH) 29 12 27 0.700 (0.095) 0.0059 (0.0020) −1.885* −2.900 0.055** 0.000
Central Chile province (VLD, VLP) 30 26 29 0.989 (0.013) 0.0078 (0.0024) −1.562* −25.124** 0.064* 4.299
LI 33 28 33 0.989 (0.011) 0.0083 (0.0007) −1.623* −26.433** 0.061* 4.587
LII 59 15 18 0.517 (0.080) 0.0015 (0.0004) −2.412** −14.942** 0.065 1.549
ALL 92 43 47 0.801 (0.043) 0.0107 (0.0008) −1.202 −25.754** 0.059 1.668
Fig. 2 Median-joining haplotype network for cytochrome oxidase I (COI) mtDNA sequences of S. lessoni. The circles’ area is propor-tional to the number of individuals in each haplotype found. Numbers between circles represent additional mutational steps
Fig. 3 Neighbor-joining tree from the haplotypes rooting the tree with a sequence of S. lateralis. The asterisk in the branch indicates the two haplotypes of MAD belonging to lineage I. Bootstrap values are shown in above nodes. LI: lineage I, LII: lineage II
Author's personal copy
Mar Biol
1 3
the central one by one to twelve different base pairs. The variability of this region was mainly ascribed to the high haplotype and nucleotide diversity values found in MAD site (Table 1). Finally, the Central Chilean province was characterized by high haplotype and nucleotide diversity, and the haplotype network revealed a high frequency of unique haplotypes (28 out of 33).
Demographic analysis
The Tajima’s D and Fu’s Fs values were negative and sig-nificant in both lineages (Table 1). R2 did not yield a signif-icant deviation from expectations under the spatial expan-sion model. The Tau index for LI was three times higher than that for LII (4.59 and 1.55, respectively. See Table 1). All regions presented significant and negative Fu’s Fs except for the Magellan region (Table 1), and almost all indicated unimodal mismatch distributions (data not showed), thus suggesting population expansion in Argen-tinean and Central Chile regions. Nevertheless, the Magel-lan region exhibited a bi-modal curve in its mismatch dis-tribution (data not showed) that is due to the two Pacific haplotypes, which are likely to be explained by the high h and π showed in MAD (Table 1).
IMa runs reached good convergence and ESS values as suggested by Hey and Nielsen (2007). Likelihood IMa curves provided strong unimodal posterior distributions
for all parameter estimates and bounds fell within the prior distribution for the COI data of S. lessoni. Population size, divergence time and migration rates showed distinct peaks between the Pacific and Atlantic populations (Fig. 4a–c). The estimated population size (N) using 10 % mutation rate (1 % mutation rate showed an N value with a greater order of magnitude) yielded a higher number of individu-als in the Pacific group (N1 = 270 ± 0.33 millions, 95 % confidence limit 183–326 millions) than the Atlantic group (N2 = 71 ± 0.53 millions, 95 % confidence limit 37–121); also, the ancestral size (NA) was higher than N2 but simi-lar to N1 (NA = 319 ± 0.01 millions, 95 % confidence limit 296–328) (Fig. 4a). Between Atlantic and Pacific limpet population was a divergence time of 113,000 and 1,130,000 ybp for 1 and a 10 % mutation rate, respectively (Fig. 4b). Migration rate was higher toward the Atlantic than toward the Pacific (Fig. 4c).
IMa runs indicated that, on the one hand, the model that excluded Atlantic gene flow was the nested model that fit data better (p = 0.999; Table 4). While, on the other hand, the other model that also fit data better (p = 0.802; Table 4) indicated that the population size was different between the Atlantic and Pacific ancestral population. The first model had the following parameters: θ1 (Pacific), θ2 (Atlantic), θA (Ancestral), mAP (migration to the Pacific) equal to zero and mPA (migration to the Atlantic). The second model accepted showed: θ1 = θA, θ2 and mAP, mPA (Table 4).
Table 2 Analysis of molecular variance (AMOVA) for COI from S. lessoni populations
+ = 0.06; * p < 0.05; ** p < 0.01
Percentage of variation (degree of freedom)
Source Among groups Among populations within groups Within populations
Central Chile province (VLD, VLP) versus Magellan province (MAD, USH)–Argentinean province (MDP, SAO)
72.61 (1)+ 1.22 (4)** 26.16 (86)**
Central Chile province (VLD, VLP) versus Magellan province (MAD, USH) versus Argentinean province (MDP, SAO)
63.40 (2) 1.85 (3)* 34.75 (86)**
Central Chile province (VLD, VLP)–Magellan province (MAD, USH) versus Argentinean province (MDP, SAO)
17.55 (1) 45.76 (4)** 36.68 (86)**
Magellan province (MAD, USH) versus Central Chile province (VLD, VLP)–Argentinean province (MDP, SAO)
0.00 (1) 66.15 (4)** 41.22 (86)**
All populations (MDP, SAO, MAD, USH, VLD, VLP) 60.19 (5)** 39.81 (86)**
Table 3 Population pairwise genetic differentiation (τST) between sampled populations of S. lessoni
* p < 0.05; ** p < 0.01
MDP SAO MAD USH VDL VLP
MDP 0.050* 0.118* −0.006 0.786** 0.785**
SAO 0.087 0.001 0.760** 0.762**
MAD 0.082 0.509** 0.523**
USH 0.739** 0.742**
VDL 0.023
VLP
Author's personal copy

Mar Biol
1 3
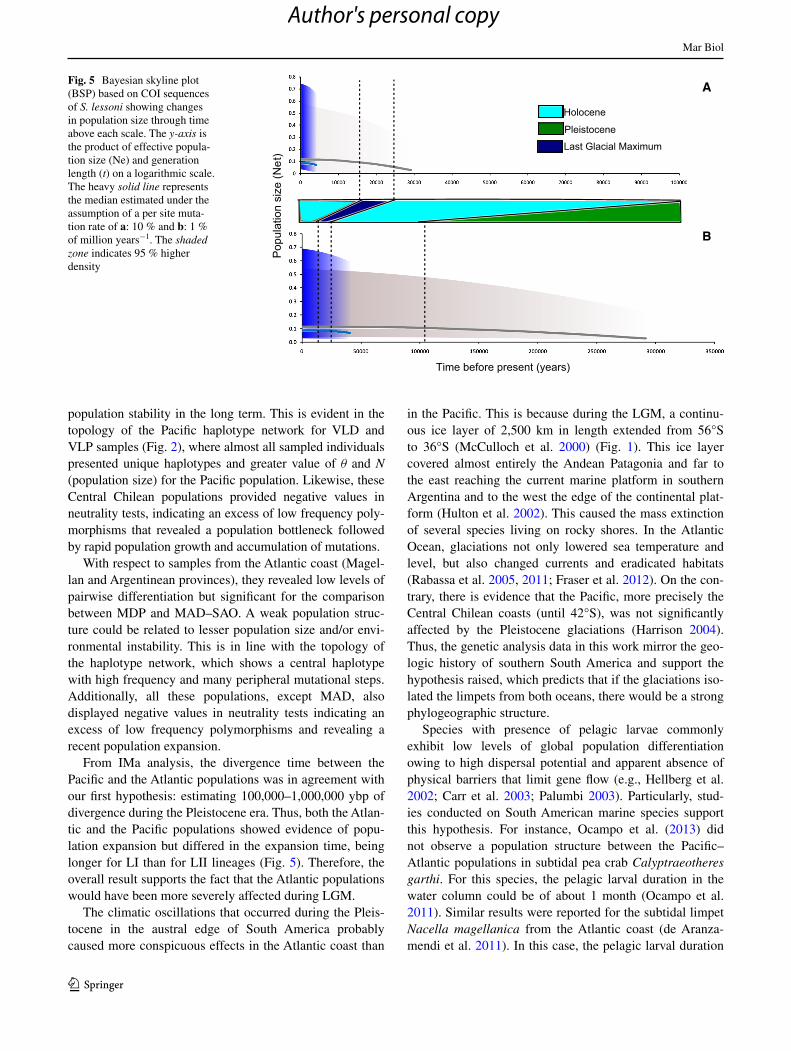
Both analyses of population divergence times using 1 and 10 % of million years−1 (see “Materials and meth-ods”) revealed an older coalescence time for the S. les-soni in LI: 300,000 and 30,000 ybp, respectively, when a significant decline in population size occurred (Fig. 5).
On the contrary, the haplotypes in LII coalesced nearly 40,000 and 4,000 ybp, respectively (Fig. 5). Overall, BSP and mismatch results suggested that LII probably started to expand as the total ice melt after the LGM period (18,000–23,000 ybp).
Discussion
A high degree of population genetic structure was observed in S. lessoni along its distribution range. Two distinct mito-chondrial lineages that were nearly reciprocally monophy-letic between the Pacific and the Atlantic coasts could be identified in S. lessoni: LI included the populations from the Pacific (Central Chilean province: VLP and VLD) and some individuals from MAD; and LII, in turn, comprised the Atlantic population analyzed (Magellan and Argen-tinean provinces, USH–MAD and SAO–MDP, respec-tively). High levels of differentiation were revealed by high τST values between the Pacific and the Atlantic populations. Also, data indicated that the Pacific populations could be considered as an ancestral population due to the higher number of haplotypes, polymorphic sites, as well as hap-lotype and nucleotide diversity as compared to the Atlantic populations. In this sense, the best model in IMa showed a similar θ value between the Pacific and ancestral samples, both different from the Atlantic limpet population. Thus, the second hypothesis predicting that the limpets from the Pacific (source population) would present more genetic diversity than those from the south Atlantic could not be rejected.
Within the Pacific population, the absence of a bio-geographic structure (τST not different from 0) could be attributed to a recent population expansion rather than to
Fig. 4 Likelihood plots from IMa analyses based on data from the COI of S. lessoni. The marginal posterior probability distributions for model parameters were scaled by the neutral mutation rate: a Effective population sizes of Atlantic and Pacific groups (N1 and N2, respectively) and population sizes of ancestral populations (NA); b divergence time, black circle is 10 % of mutation rate and gray circle is 1 %. c Migration rates, mAP migration to the Pacific, mPA migration to the Atlantic
Table 4 Model selection in IMa based on COI sequence data of S. lessoni
The models with highest probability of explanation are in bold
2LLR = log-likelihood ratio statistic, d.f. = degrees of freedom for each model. p values for 2LLR statistics were calculated using the x2 calculator available at http://www.stat.tamu.edu/~west/applets/chisqdemo.html. θ1 (Pacific), θ2 (Atlantic), θA (Ancestral), m1 (migra-tion to the Pacific) and m2 (migration to the Atlantic). Only the mod-els with probabilities higher than 0.01 are shown
Model d.f. 2LLR p value
θ1, θ2, θA, m1 = m2 1 3.599 0.058
θ1, θ2, θA, m1 = 0, m2 1 −0.002 0.999
θ1, θ2, θA, m1, m2 = 0 1 5.062 0.024
θ1, θ2, θA, m1 = 0, m2 = 0 2 5.059 0.080
θ1 = θA, θ2, m1, m2 1 0.063 0.802
θ1 = θA, θ2, m1 = m2 2 3.598 0.165
θ1 = θA, θ2, m1 = 0, m2 = 0 3 5.059 0.167
Author's personal copy
Mar Biol
1 3
population stability in the long term. This is evident in the topology of the Pacific haplotype network for VLD and VLP samples (Fig. 2), where almost all sampled individuals presented unique haplotypes and greater value of θ and N (population size) for the Pacific population. Likewise, these Central Chilean populations provided negative values in neutrality tests, indicating an excess of low frequency poly-morphisms that revealed a population bottleneck followed by rapid population growth and accumulation of mutations.
With respect to samples from the Atlantic coast (Magel-lan and Argentinean provinces), they revealed low levels of pairwise differentiation but significant for the comparison between MDP and MAD–SAO. A weak population struc-ture could be related to lesser population size and/or envi-ronmental instability. This is in line with the topology of the haplotype network, which shows a central haplotype with high frequency and many peripheral mutational steps. Additionally, all these populations, except MAD, also displayed negative values in neutrality tests indicating an excess of low frequency polymorphisms and revealing a recent population expansion.
From IMa analysis, the divergence time between the Pacific and the Atlantic populations was in agreement with our first hypothesis: estimating 100,000–1,000,000 ybp of divergence during the Pleistocene era. Thus, both the Atlan-tic and the Pacific populations showed evidence of popu-lation expansion but differed in the expansion time, being longer for LI than for LII lineages (Fig. 5). Therefore, the overall result supports the fact that the Atlantic populations would have been more severely affected during LGM.
The climatic oscillations that occurred during the Pleis-tocene in the austral edge of South America probably caused more conspicuous effects in the Atlantic coast than
in the Pacific. This is because during the LGM, a continu-ous ice layer of 2,500 km in length extended from 56°S to 36°S (McCulloch et al. 2000) (Fig. 1). This ice layer covered almost entirely the Andean Patagonia and far to the east reaching the current marine platform in southern Argentina and to the west the edge of the continental plat-form (Hulton et al. 2002). This caused the mass extinction of several species living on rocky shores. In the Atlantic Ocean, glaciations not only lowered sea temperature and level, but also changed currents and eradicated habitats (Rabassa et al. 2005, 2011; Fraser et al. 2012). On the con-trary, there is evidence that the Pacific, more precisely the Central Chilean coasts (until 42°S), was not significantly affected by the Pleistocene glaciations (Harrison 2004). Thus, the genetic analysis data in this work mirror the geo-logic history of southern South America and support the hypothesis raised, which predicts that if the glaciations iso-lated the limpets from both oceans, there would be a strong phylogeographic structure.
Species with presence of pelagic larvae commonly exhibit low levels of global population differentiation owing to high dispersal potential and apparent absence of physical barriers that limit gene flow (e.g., Hellberg et al. 2002; Carr et al. 2003; Palumbi 2003). Particularly, stud-ies conducted on South American marine species support this hypothesis. For instance, Ocampo et al. (2013) did not observe a population structure between the Pacific–Atlantic populations in subtidal pea crab Calyptraeotheres garthi. For this species, the pelagic larval duration in the water column could be of about 1 month (Ocampo et al. 2011). Similar results were reported for the subtidal limpet Nacella magellanica from the Atlantic coast (de Aranza-mendi et al. 2011). In this case, the pelagic larval duration
Fig. 5 Bayesian skyline plot (BSP) based on COI sequences of S. lessoni showing changes in population size through time above each scale. The y-axis is the product of effective popula-tion size (Ne) and generation length (t) on a logarithmic scale. The heavy solid line represents the median estimated under the assumption of a per site muta-tion rate of a: 10 % and b: 1 % of million years−1. The shaded zone indicates 95 % higher density
A
B
Pleistocene
Last Glacial Maximum
Holocene
Time before present (years)
)t eN( ezis noitalupo
P
Author's personal copy
Mar Biol
1 3
in the water column was also of about 1 month (de Aran-zamendi et al. 2011). However, many recent studies have pointed out that the larval dispersal potential of marine spe-cies (pelagic larvae or direct development) from intertidal rocky sites is not the unique predictor of population con-nectivity level (e.g., Marko et al. 2010), and many authors postulate that other factors, such as oceanographic condi-tions (e.g., salinity or temperature), discontinuous distribu-tion of suitable substrata and organism biology, could play a key role in migration regulation among populations (e.g., Riginos and Nachman 2001; Severance and Karl 2006; Becker et al. 2007; Sherman et al. 2008). Thus, while S. lessoni has a short planktonic larval phase, which probably contributed to the isolation, it is also worth noticing that the distribution of suitable substrata during the LGM, which was greater in the Pacific basin than in the Atlantic basin, probably contributed the most to establishing the phylogeo-graphic pattern.
MAD (Puerto Madryn) in Golfo Nuevo in the Magel-lan province exhibited a higher genetic diversity index than other sites did since it was the only site that showed LI and LII lineages in sympatry. Two explanations are possible: (1) individuals from LI haplotypes migrate from the Pacific to MAD by gene flow or (2) incomplete lineage sorting fol-lowing colonization. IMa analysis supported the first expla-nation by accepting a model of isolation that is in agree-ment with some “recent” migration to the Atlantic rather than to the Pacific. Migration between the Pacific and the Atlantic is unidirectional only when Madryn is considered in the IMA analysis. When MAD is not contemplated, the accepted models (data not shown) do not clearly establish a migration pattern. Since USH did not show individual LI haplotypes, the migration between the Pacific and the Atlantic population could have been along the Estrecho de Magallanes (EM) in northern Tierra del Fuego (Fig. 1). This possibility should be further explored in future works.
Finally, the results should be taken with caution for hav-ing been obtained with a single mitochondrial marker. In this sense, the inclusion of nuclear markers would contribute to a greater understanding of the complex demographic history of this beautiful species of rocky shores from South America.
Conclusions
This work reports unequivocal evidence of Pacific–Atlantic geographic isolation of a coastal species, which is probably related to the changes in the sea level and temperature after the glaciation periods that affected the region throughout the Pleistocene. The geographic range of S. lessoni was mostly affected by the LGM in the Magellan and Argen-tinean biogeographic provinces whose coasts had probably less rocky sites for limpet settlement.
Acknowledgements This work was supported by the following grants: PIP 2504 (2009–2011) and PIP 798 (2012–2014) (CONICET) 15/E534 and 15/E627 (UNMdP) awarded to P.F.I. Additional support for J.D.N. and E.H.O. was provided by a PhD scholarship funded by CONICET. Authors wish explicitly to thank reviewers’ and edi-tor’ comments for having largely improved this article. They are also grateful to M.P. Oteiza for the manuscript revision and helpful advice. Authors would also like to thank D. Sabadin, P. Lertora, N. Chiaradia, C. Matula and M.R Garcia-Huidobro Moreno for assistance during field work. The present results are part of the PhD thesis of J.D.N., P.F.I. and M.C., who are members of the Scientific Researcher Pro-gram of CONICET (Argentina).
References
Aguirre ML, Hlebzsebitch J, Dellatorre F (2008) Late Cenozoic Invertebrate Paleontology, with emphasis on Mollusks. In: Rabassa, J. (ed), The Late Cenozoic of Patagonia and Tierra del Fuego. Chapter 14. Developments in Quaternary Sciences, 11, Elsevier, Amsterdam, p 285–325
Aguirre ML, Richiano S, Álvarez MF, Eastoe C (2009) Malacofauna Cuaternaria del litoral norte de Santa Cruz (Patagonia, Argen-tina). Geobios 42:411–434
Alamo V, Valdivieso V (1997) Lista sistemática de moluscos marinos del Perú. Segunda edición, revisada y actualizada, Instituto del Mar del Perú, Callao
Avise JC (2000) Phylogeography: the history and formation of spe-cies. Harvard University, Cambridge
Becker BJ, Levin LA, Fodrie FJ, McMillan PA (2007) Complex lar-val connectivity patterns among marine invertebrate populations. Proc Natl Acad Sci USA 104:3267–3272
Brante A, Fernández M, Viard F (2012) Phylogeography and bioge-ography concordance in the marine gastropod Crepipatella dila-tata (Calyptraeidae) along the southeastern Pacific coast. J Hered 103:630–637
Cárdenas L, Castilla JC, Viard F (2009) A phylogeographical analy-sis across three biogeographical provinces of the south-eastern Pacific: the case of the marine gastropod Concholepas con-cholepas. J Biogeogr 36:969–981
Carr MH, Neigel JE, Estes JA, Andelman S, Warner RR, Largier JL (2003) Comparing marine and terrestrial ecosystems: impli-cations for the design of coastal marine reserves. Ecol Appl 13:S90–S107
Castellanos ZJA, Landoni NA, Dadon JR (1993) Opistobranchia excepto Nudibranchida, y Pulmonata. Catálogo descriptivo de la malacofauna marina magallánica. 12. Comisión de Investiga-ciones Científicas Provincia de Buenos Aires, La Plata
Ceballos SG, Lessa EP, Victorio MF, Fernández DA (2012) Phyloge-ography of the sub-Antarctic notothenioid fish Eleginops maclo-vinus: evidence of population expansion. Mar Biol 159:499–505
de Aranzamendi MC, Bastida R, Gardenal CN (2011) Different evo-lutionary histories in two sympatric limpets of the genus Nacella (Patellogastropoda) in the south-western Atlantic coast. Mar Biol 158:2405–2418
Dell RK (1971) The marine mollusca of the Royal Society Expedition to Southern Chile, 1958–59. Records of the Dominion Museum 7: 155–233
Drummond AJ, Rambaut A (2007) BEAST: Bayesian evolutionary analysis by sampling trees. BMC Evol Biol 7:214
Drummond AJ, Rambaut A, Shapiro B, Pybus OG (2005) Bayesian coalescent inference of past population dynamics from molecular sequences. Mol Biol Evol 22:1185–1192
Emerson BC, Hewitt GM (2005) Phylogeography. Curr Biol 15:367–371
Author's personal copy
Mar Biol
1 3
Excoffier L, Laval G, Schneider S (2005) ARLEQUIN ver. 3.0. An integrated software package for population genetics data analysis. Evol Bioinform Online 1:47–50
Felsenstein J (1985) Confidence limits on phylogenies: an approach using the bootstrap. Evolution 39:783–791
Fernández Iriarte P, Alonso MP, Sabadin D, Arauz PA, Iudica C (2011) Phylogeography of weakfish Cynoscion guatucupa (Per-ciformes: Sciaenidae) from the southwestern Atlantic. Sci Mar 75:701–706
Filatov DA (2002) ProSeq: a software for preparation and evolu-tionary analysis of DNA sequence data sets. Mol Ecol Notes 2:621–624
Folmer O, Black M, Hoeh W, Lutz R, Vrijenhoek R (1994) DNA primers for amplification of mitochondrial cytochrome C oxidase subunit I from diverse metazoan invertebrates. Mol Mar Biol Bio-tech 3:294–299
Fraser CI, Nikula R, Spencer HG, Waters JM (2009) Kelp genes reveal effects of subantarctic sea ice during the last glacial maxi-mum. Proc Natl Acad Sci USA 106:3249–3253
Fraser CI, Thiel M, Spencer H, Waters J (2010) Contemporary habitat discontinuity and historic glacial ice drive genetic divergence in Chilean kelp. BMC Evol Biol 10:203
Fraser CI, Nikula R, Ruzzante DE, Waters JW (2012) Poleward bound: biological impacts of Southern Hemisphere glaciation. Trends Ecol Evol 27:462–471
Fu YX (1997) Statistical tests of neutrality of mutations against popu-lation growth, hitchhiking and background selection. Genetics 147:915–925
González-Wevar CA, Nakano T, Cañete JI, Poulin E (2011) Concerted genetic, morphological and ecological diversification in Nacella limpets in the Magellanic province. Mol Ecol 20:1936–1951
González-Wevar CA, Hüne M, Cañete JI, Mansilla A, Nakano T, Poulin E (2012) Towards a model of postglacial biogeography in shallow marine species along the Patagonian province: lessons from the limpet Nacella magellanica (Gmelin, 1791). BMC Evol Biol 12:139
González-Wevar CA, Saucède T, Morley SA, Chown SL, Poulin E (2013) Extinction and recolonization of maritime Antarctica in the limpet Nacella concinna (Strebel, 1908) during the last gla-cial cycle: toward a model of Quaternary biogeography in shal-low Antarctic invertebrates. Mol Ecol 22:5221–5236
Grant WS, Bowen BW (2006) Living in a tilted world: climate change and geography limit speciation in Old World anchovies (Engrau-lis; Engraulidae). Biol J Linn Soc 88:673–689
Harrison S (2004) The Pleistocene glaciations of Chile. In: Ehlers J, Gibbard PL (eds) Quaternary glaciations: extent and chronology, vol 3. Elsevier, Boston
Hellberg ME, Burton RS, Neigel JE, Palumbi SR (2002) Genetic assessment of connectivity among marine populations. Bull Mar Sci 70:273–290
Hewitt GM (2000) The genetic legacy of the Quaternary ice ages. Nature 405:907–913
Hewitt GM (2001) Speciation, hybrid zones, and phylogeography: seeing genes in space and time. Mol Ecol 10:537–549
Hewitt GM (2004) Genetic consequences of climatic oscillations in the Quaternary. Philos Trans Biol Sci 359:183–195
Hewitt GM, Ibrahim KM (2001) Inferring glacial refugia and historical migrations with molecular phylogenies. In: Silvertown J, Antonovics J (eds) Integrating ecology and evolution in a spatial context. BES symposium volume. Blackwell Press, Oxford, pp 271–294
Hey J, Nielsen R (2007) Integration within the Felsenstein equation for improved Markov chain Monte Carlo methods in population genetics. Proc Natl Acad Sci USA 104:2785–2790
Ho SYW, Phillips MJ, Cooper A, Drummond AJ (2005) Time depend-ency of molecular rate estimated and systematic overestimation of recent divergence times. Mol Biol Evol 22:1561–1568
Ho SYW, Shapiro B, Phillips MJ, Cooper A, Drummond AJ (2007) Evidence for time dependency of molecular rate estimates. Syst Biol 56:517–522
Ho SYW, Lanfear R, Bromham L, Phillips MJ, Soubrier J, Rodrigo AG, Cooper (2011) Time-dependent rates of molecular evolution. Mol Ecol 20:3087–3101
Hulton NRJ, Purves RS, McCulloch RD, Sugden DE, Bentley MJ (2002) The last glacial maximum and deglaciation in southern South America. Quat Sci Rev 21:233–241
Janko K, Lecointre G, DeVries A, Couloux A, Cruaud C, Marshall C (2007) Did glacial advances during the Pleistocene influence dif-ferently the demographic histories of benthic and pelagic Antarc-tic shelf fishes? Inferences from intraspecific mitochondrial and nuclear DNA sequence diversity. BMC Evol Biol 7:220
Kinlan BP, Gaines SD (2003) Propagule dispersal in marine and terrestrial environments: a community perspective. Ecology 84:2007–2020
Librado P, Rozas J (2009) DNAsp v. 5: a software for comprehensive analysis of DNA polymorphism data. Bioinformatics 25:1451–1452
Macaya EC, Zuccarello GC (2010) Genetic structure of the giant kelp Macrocystis pyrifera along the southeastern Pacific. Mar Ecol Prog Ser 420:103–112
Marko PB, Hoffman JM, Emme SA, McGovern TM, Keever CC, Cox LN (2010) The ‘Expansion–Contraction’ model of Pleisto-cene biogeography: rocky shores suffer a sea change? Mol Ecol 19:146–169
McCulloch RD, Bentley MJ, Purves RS, Hulton NRJ, Sugden DE, Clapperton CM (2000) Climatic inferences from glacial and pal-aeoecological evidence at the last glacial termination, southern South America. J Quat Sci 15:409–417
Muellner A, Tremetsberger K, Stuessy T, Baeza C (2005) Pleistocene refugia and recolonization routes in the southern Andes: insights from Hypochaeris palustris (Asteraceae, Lactuceae). Mol Ecol 14:203–212
Ocampo EH, Nuñez JD, Lizarralde MS, Cledón M (2011) Larval development of Calyptraeotheres garthi (Fenucci, 1975) (Brach-yura, Pinnotheridae) described from laboratory reared material, with notes of larval character use on Pinnotheridae systematic. Helgol Mar Res 65:347–359
Ocampo EH, Robles R, Terossi M, Nuñez JD, Cledón M, Man-telatto FL (2013) Phylogeny, phylogeography, and systemat-ics of the American pea crab genus Calyptraeotheres Campos, 1990, inferred from molecular markers. Zool J Linn Soc Lond 169:27–42
Olivier SR, Penchaszadeh PE (1968) Observaciones sobre la ecología y biología de Siphonaria (Pachysiphonaria) lessoni (Blainivlle, 1824) (Gastropoda, Siphonariidae) en el litoral rocoso de Mar del Plata (Buenos Aires). Cah Biol Mar 9:469–491
Palumbi SR (1994) Genetic divergence, reproductive isolation, and marine speciation. Annu Rev Ecol Syst 25:547–572
Palumbi SR (2003) Population genetics, demographic connectivity, and the design of marine reserves. Ecol Appl 13:146–158
Penchaszadeh P, Pastorino G, Brögger M (2007) Moluscos gasterópo-dos y bivalvos: Siphonaria lessoni. En: Boltovskoy D (ed). Atlas de sensibilidad ambiental de la costa y el Mar Argentino
Posada D (2008) jModelTest: phylogenetic model averaging. Mol Biol Evol 25:1253–1256
Provan J, Bennett KD (2008) Phylogeographic insights into cryptic glacial refugia. Trends Ecol Evol 23:564–571
Rabassa J, Coronato AM, Salemme M (2005) Chronology of the Late Cenozoic Patagonian glaciations and their correlation with biostratigraphic units of the Pampean region (Argentina). J S Am Earth Sci 20:81–103
Rabassa J, Coronato A, Martínez O (2011) Late Cenozoic glaciations in Patagonia and Tierra del Fuego: an updated review. Biol J Linn Soc 103:316–335
Author's personal copy
Mar Biol
1 3
Ramos-Onsins SE, Rozas J (2002) Statistical properties of new neutral-ity tests against population growth. Mol Biol Evol 19:2092–2100
Riginos C, Douglas KE, Jin Y, Shanahan DF, Treml EA (2011) Effects of geography and life history traits on genetic differentiation in benthic marine fishes. Ecography 34:566–575
Rogers AR, Harpending H (1992) Population growth makes waves in the distribution of pairwise genetic differences. Mol Biol Evol 9:552–569
Ruzzante D, Walde S, Cussac V, Dalebout M, Seibert J, Ortubay S, Habit E (2006) Phylogeography of the Percichthyidae (Pisces) in Patagonia: roles of orogeny, glaciations, and volcanism. Mol Ecol 15:2949–2968
Sérsic AN, Cosacov A, Cocucc IAA, Johnson LA, Pozner R, Avila LJ, Sites JW Jr, Morando M (2011) Emerging phylogeographical patterns of plants and terrestrial vertebrates from Patagonia. Biol J Linn Soc 103:475–494
Severance EG, Karl SA (2006) Contrasting population genetic struc-tures of sympatric, mass-spawning Caribbean corals. Mar Biol 150:57–68
Sherman CDH, Hunt A, Ayre DJ (2008) Is life history a barrier to dis-persal? Contrasting patterns of genetic differentiation along an oceanographically complex coast. Biol J Linn Soc 95:106–116
Tajima F (1989) The effect of change in population size on DNA pol-ymorphism. Genetics 123:597–601
Tamura K, Peterson D, Peterson N, Stecher G, Nei M, Kumar S (2011) MEGA5: molecular evolutionary genetics analysis using
maximum likelihood, evolutionary distance, and maximum parsi-mony methods. Mol Biol Evol 28:2731–2739
Teske PR, Papadopoulos I, Mmonwa KL, Matumba TG, McQuaid CD, Barker NP, Beheregaray LB (2011) Climate-driven genetic divergence of limpets with different life histories across a south-east African marine biogeographic disjunction: different pro-cesses, same outcome. Mol Ecol 20:5025–5041
Thorrold SR, Jones GP, Hellberg ME, Burton RS, Swearer SE, Neigel JE, Morgan SG, Warner RR (2002) Quantifying larval retention and connectivity in marine populations with artificial and natural markers. Bull Mar Sci 70:291–308
Túnez JI, Cappozzo HL, Nardelli M, Cassini MH (2010) Population genetic structure and historical population dynamics of the South American sea lion, Otaria flavescens, in north-central Patagonia. Genetica 138:831–841
Walsh PS, Metzger DA, Higuchi R (1991) Chelex 100 as a medium for simple extraction of DNA for PCR-based typing from foren-sic material. Biotechniques 10:506–513
Wares JP (2002) Community genetics in the Northwestern Atlantic intertidal. Mol Ecol 11:1131–1144
Wares JP, Cunningham CW (2001) Phylogeography and historical ecology of the North Atlantic intertidal. Evolution 55:2455–2469
Zakas C, Binford J, Navarrete SA, Wares JP (2009) Restricted gene flow in Chilean barnacles reflects an oceanographic and biogeo-graphic transition zone. Mar Ecol Prog Ser 394:165–177
Author's personal copy