Three-Dimensional Structure of TspO by Electron Cryomicroscopy of Helical Crystals

Cell, Vol. 88, 19–28, January 10, 1997, Copyright 1997 by Cell Press
Arrangement of tRNAsin Pre- and Posttranslocational RibosomesRevealed by Electron Cryomicroscopy
Holger Stark,* Elena V. Orlova,*§ Jutta Rinke-Appel,† 1987). This method has already been successfully ap-plied to the 70S ribosome from Escherichia coli (FrankNicole Junke,† Florian Mueller,† Marina Rodnina,‡
Wolfgang Wintermeyer,‡ Richard Brimacombe,† et al., 1995; Stark et al., 1995) as well as to a numberof other biological macromolecular systems (e.g.,and Marin van Heel,*§
*Fritz-Haber-Institut der Max-Planck-Gesellschaft Schatz et. al., 1995; Serysheva et al., 1995). The tech-nique exploits the random orientations of the individualFaradayweg 4-6
D-14195 Berlin particles within the embedding matrix (vitreous ice) andthus allows three-dimensional (3-D) reconstructions toGermany
†Max-Planck-Institut fur Molekulare Genetik be computed from the electron micrographs withouthaving to resort to the use of instrumental tilting, withIhnestraße 73
D-14195 Berlin all its attendant disadvantages (cf. van Heel et al., 1992).In the case of the ribosome, the reconstructions ob-Germany
‡Institut fur Molekularbiologie tained have currently reached a level of resolution whereit should be possible both to discern conformationalUniversitat Witten/Herdecke
D-58453 Witten changes occurring at the different stages of protein bio-Germany synthesis and to visualize directly some of the functional§ Imperial College of Science, Medicine and Technology ligands, such as tRNA.Department of Biochemistry Changes of the ribosomal morphology in differentLondon SW7 2AY functional states have already been reported, usingUnited Kingdom electron microscopical techniques (Ofverstedt et al.,
1994). In that paper, “starved” ribosomes were com-pared with those from exponentially growing cells, andit was shown that the separation between the subunitsSummaryincreased by about 30 A upon starvation. Although thestudy was made at relatively low resolution and theThe three-dimensional structure of the translating 70Sfunctional states investigated do not by any means nec-E. coli ribosome is presented in its two main conforma-essarily correspond to the pre- and posttranslocationaltions: the pretranslocational and the posttransloca-modes, the results nonetheless give an idea of the typetional states. Using electron cryomicroscopy and an-of gross morphological change that might be expectedgular reconstitution, structures at 20 A resolution wereat different stages of the protein biosynthetic cycle.obtained, which, when compared with our earlier re-Most of the reconstructions of E. coli ribosomes haveconstruction of “empty” ribosomes, showed densitiesbeen made with vacant 70S particles (Frank et al., 1995;corresponding to tRNA molecules—at the P and EStark et al., 1995), and the positions of the tRNA mole-sites for posttranslocational ribosomes and at the Acules in these reconstructions were inferred from bio-and P sites for pretranslocational ribosomes. Thechemical information, such as cross-linking or foot-P-site tRNA lies directly above the bridge connecting
the two ribosomal subunits, with the A-site tRNA fitted printing data relating to the ribosomal proteins andsnugly against it at an angle of z508, toward the L7/ rRNA. Recently, Agrawal et al. (1996) presented a recon-L12 side of the ribosome. The E-site tRNA appears to struction of ribosomes containing tRNA, which we willlie between the side lobe of the 30S subunit and the return to in the Discussion section.L1 protuberance. Here we present 3-D reconstructions derived from
E. coli ribosome preparations in two distinct functionalstates. In each of these reconstructions the associatedIntroductiontRNA molecules can be directly visualized. For the suc-cess of this approach, it is essential that the ribosomalThe translating ribosome exists in at least two function-samples are as homogeneous as possible, and the ex-ally distinguishable states. In the first of these—the pre-perimental conditions were chosen accordingly. In thetranslocational state—the ribosome carries a deacyl-first preparation, disomes from a polysome populationated tRNA at the P site and a peptidyl tRNA at the Awere treated with EF-G in order to drive them into thesite. Immediately after translocation, the peptidyl tRNAposttranslocational state, with tRNAs at the P and Eis at the P site, and the deacylated tRNA (previously atsites (we call this structure “disome-PE”). The secondthe P site) lies in the E site. This represents the firstpreparation consisted of 70S monoribosomes carryingposttranslocational state, which afterward loses thefMet-Phe-tRNAPhe at the A site and tRNA Met
f at the P sitetRNA from the E site. A new round of the elongation(Rodnina and Wintermeyer, 1995), in the pretransloca-cycle then begins with reoccupation of the A site by antional state (“monosome-AP”). Both of the reconstruc-aminoacyl tRNA.tions showed an overall morphology very similar to thatOne of the most powerful current methods for study-of vacant ribosomes (Stark et al., 1995), with the resulting the structure of complex particles such as the ribo-that the additional density corresponding to the boundsome is the technique of electron cryomicroscopy (Chiu,tRNA molecules could be assigned to the appropriate1986; Dubochet et al., 1988) combined with single parti-
cle processing and angular reconstitution (cf. van Heel, tRNA sites.

Cell20
are shown in Figure 2. It is clear that for our imagingconditions the CTF-corrected structure (Figure 2B) doesnot differ from the uncorrected one (Figure 2A) withregard to the pattern of large bridges and channelswithin the ribosomal subunits (cf. Yonath and Berko-vitch-Yellin, 1993), and the observed changes (arrowedin Figure 2) are minimal. Indeed, some of the smallerdetails such as the bridges and intersubunit connectionsare more clearly delineated at the chosen threshold level(containing z2.5 MDa) without the CTF correction. Ac-cordingly, the figures in the following sections are dis-played without CTF-correction.
The Disome-PE 3-D ReconstructionThe reconstruction from the posttranslocational dis-ome-PE preparation, although calculated at a slightlybetter resolution (21 A), shows a high degree of similarityto the earlier reconstructions of vacant 70S ribosomes(Frank et al., 1995; Stark et al., 1995), and three viewsof the disome-PE reconstruction, indicating the variousFigure 1. Sucrose Density Gradient Profile of E. coli Polysomesmorphological features, are illustrated in Figure 3. TheThe disome-PE peak used for electron microscopy is indicated. Seeappearance of the 50S subunit in the disome-PE is veryExperimental Procedures for details.similar to the 50S subunit of vacant 70S ribosomes. TheL7/L12 stalk was again seen to be folded inward inResultsthe new map, thus further supporting the idea that theclassical extended stalk (e.g., Oakes et al., 1986; StofflerThe Posttranslocational Ribosome Carryingand Stoffler-Meilicke, 1986) may be an artifact of theP- and E-Site tRNAs (Disome-PE)negative-staining specimen preparation technique. It isPolysomes were extracted from E. coli cells harvestedalso noteworthy that the protrusion extending from theduring exponential growth and were separated by su-50S subunit toward the 30Ssubunit that lies between thecrose density gradient centrifugation; a typical gradientcentral protuberance and the L7/L12 stalk, and which weprofile is illustrated in Figure 1. The disome fraction ofnow name the “A-site finger,” is present in both 3-Dthe polysomes is the most suitable for electron micros-reconstructions.copy, since in this fraction the overlap of neighboring
However, some significant differences do exist inribosomes in the micrographs is minimized. At the sameother parts of the map. In particular, the “toe” in thetime, the disomes are the smallest assemblies certainfoot region of the 30S subunit (cf. Frank et al., 1995;to consist of actively translating ribosomes. It is knownStark et al., 1995) has now evolved into a pronouncedthat the majority of ribosomes in the polysome fractioncylindrical rod of density with clear boundaries and aare in the posttranslocational state (Remme et al., 1989),diameter of z20 A, and the “hook” at the back of theand in order to drive the remainder of the ribosomeshead of the 30Ssubunit ismuch more pronounced. Moreinto this state, the disome fraction (Figure 1) was firstconnections between the 30S and 50S subunits in thepelleted and then treated with EF-G in the presence ofdisome-PE have appeared (Figure 3), and they make aGTP, as described in Experimental Procedures.more stable impression than the corresponding featuresElectron cryomicroscopy, followed by digitization ofin the vacant ribosome reconstruction, since they dothe micrographs and three-dimensional reconstruction,not change significantly during successive iterations ofwas performed within the contextof the IMAGIC-5 imagethe refinement procedures (Schatz et al., 1995). Theprocessing system (van Heel et al., 1996) and followedbridge connecting the 50S central protuberance and thethe procedures used in our earlier reconstruction of the30S head in the translating ribosome was not visible invacant 70S ribosome (Stark et al., 1995). Additionally,the earlier reconstructions of the vacant ribosome (Starkwe examined the effect of applying a contrast transferet al., 1995). Another new feature in both the posttranslo-function (CTF) correction (see Experimental Procedures)cational (shown here) and the pretranslocational ribo-to both the new and the previous reconstructions (Starksomes is a second bill-like protrusion emerging fromet al., 1995). When low resolution zero crossings arethe side of the head of the 30S subunit. The higherpresent within the data, such CTF corrections are anresolution in the map can in part be attributed to aabsolute neccessity (Frank et al., 1995; Agrawal et al.,greater homogeneity of the EF-G treated disome prepa-1996). Our micrographs, however, were recorded rela-ration, as compared to vacant ribosomes, which aretively close to focus, and both data sets were analyzedmore likely to represent a mixture of conformations.to resolutions below the first zero of the CTF (z1/18 A).Also, the extended connections between the disome-Thus, no contrast reversals needed to be accounted for;PE subunits possibly create a mechanically stablenevertheless, explicit correction of the CTF does havestructure.a slight influence on the appearance of the reconstruc-
tions. This influence is largely cosmetic and has theThe Monosome-AP 3-D Reconstructioneffect of somewhat enhancing the low spatial frequen-70S ribosomes were programmed with tRNA Met
f at the Pcies. Reconstructions of 70S ribosomes from the dis-ome-PE fraction, with and without the CTF correction, site and fMet-Phe-tRNAPhe at the A site in the presence
Structure of the Translating Ribosome21
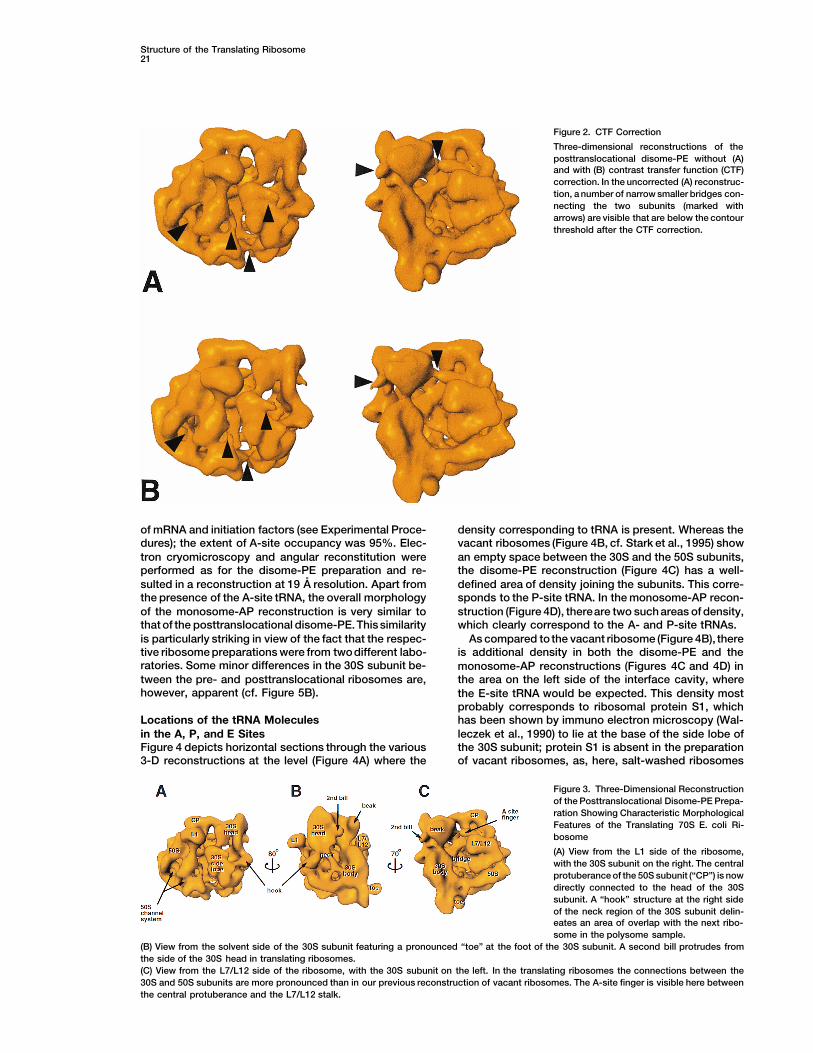
Figure 2. CTF Correction
Three-dimensional reconstructions of theposttranslocational disome-PE without (A)and with (B) contrast transfer function (CTF)correction. In the uncorrected (A) reconstruc-tion, a number of narrow smaller bridges con-necting the two subunits (marked witharrows) are visible that are below the contourthreshold after the CTF correction.
of mRNA and initiation factors (see Experimental Proce- density corresponding to tRNA is present. Whereas thevacant ribosomes (Figure 4B, cf. Stark et al., 1995) showdures); the extent of A-site occupancy was 95%. Elec-
tron cryomicroscopy and angular reconstitution were an empty space between the 30S and the 50S subunits,the disome-PE reconstruction (Figure 4C) has a well-performed as for the disome-PE preparation and re-
sulted in a reconstruction at 19 A resolution. Apart from defined area of density joining the subunits. This corre-sponds to the P-site tRNA. In the monosome-AP recon-the presence of the A-site tRNA, the overall morphology
of the monosome-AP reconstruction is very similar to struction (Figure 4D), thereare two such areas of density,which clearly correspond to the A- and P-site tRNAs.that of the posttranslocational disome-PE. This similarity
is particularly striking in view of the fact that the respec- As compared to the vacant ribosome (Figure 4B), theretive ribosome preparations were from twodifferent labo- is additional density in both the disome-PE and theratories. Some minor differences in the 30S subunit be- monosome-AP reconstructions (Figures 4C and 4D) intween the pre- and posttranslocational ribosomes are, the area on the left side of the interface cavity, wherehowever, apparent (cf. Figure 5B). the E-site tRNA would be expected. This density most
probably corresponds to ribosomal protein S1, whichhas been shown by immuno electron microscopy (Wal-Locations of the tRNA Molecules
in the A, P, and E Sites leczek et al., 1990) to lie at the base of the side lobe ofthe 30S subunit; protein S1 is absent in the preparationFigure 4 depicts horizontal sections through the various
3-D reconstructions at the level (Figure 4A) where the of vacant ribosomes, as, here, salt-washed ribosomes
Figure 3. Three-Dimensional Reconstructionof the Posttranslocational Disome-PE Prepa-ration Showing Characteristic MorphologicalFeatures of the Translating 70S E. coli Ri-bosome
(A) View from the L1 side of the ribosome,with the 30S subunit on the right. The centralprotuberance of the 50S subunit (“CP”) is nowdirectly connected to the head of the 30Ssubunit. A “hook” structure at the right sideof the neck region of the 30S subunit delin-eates an area of overlap with the next ribo-some in the polysome sample.
(B) View from the solvent side of the 30S subunit featuring a pronounced “toe” at the foot of the 30S subunit. A second bill protrudes fromthe side of the 30S head in translating ribosomes.(C) View from the L7/L12 side of the ribosome, with the 30S subunit on the left. In the translating ribosomes the connections between the30S and 50S subunits are more pronounced than in our previous reconstruction of vacant ribosomes. The A-site finger is visible here betweenthe central protuberance and the L7/L12 stalk.

Cell22
Figure 4. Sections through the RibosomeReconstructions, Showing the Relative Posi-tions of the tRNA Molecules (A, P, or E)
(A) The disome-PE reconstruction indicatingthe plane taken for the sections.(B) Section through the vacant ribosome.(C) Section taken through the disome-PE re-construction. The arrow indicates the extradensity corresponding to the E-site tRNA (seetext).(D) Section through the monosome-AP re-construction.
were used (Stark et al., 1995). However, comparison of the monosome-AP should give a density-difference mapcorresponding to the A-site tRNA (cf. Figures 4C andFigures 4C and 4D shows that in the disome-PE recon-
struction this area of density is prolonged toward the 4D), and this clearly is visible in Figure 5A. Correspond-ingly, subtraction of the monosome-AP density fromperiphery of the structure (as indicated by the arrow in
Figure 4C). For the reasons discussed in the following, that of the disome-PE should show the E-site tRNA(Figure 5B). Here, the situation is by no means as clear-we interpret this extra density in the disome-PE recon-
struction as being the E-site tRNA. cut as that in Figure 5A, but there is a concentration ofextra density in the E-site region, as indicated by theTo investigate the additional density due to the tRNA
molecules more closely, density difference maps were arrows. We interpret the density indicated by the arrowswith solid lines as being directly due to the E-site tRNA,prepared between the various reconstructions. Exam-
ples of these are shown in Figure 5, which compares whereas the extra density underneath (marked by thearrow with a broken line) is most likely due to a confor-the disome-PE and monosome-AP structures. Since a
P-site tRNA molecule is present in both reconstructions, mational difference in the ribosome between the tworespective reconstructions; thus, this lower blue areaa subtraction of the disome-PE density from that of
Figure 5. Difference Maps
Three-dimensional density difference mapsbetween the disome-PE and monosome-APreconstructions (cf. Figures 4C and 4D, re-spectively).(A) The disome-PE reconstruction, with thedensity difference obtained by subtractingthe disome-PE from the monosome-AP re-construction superimposed upon it in blue.The main blue area (arrow) corresponds tothe A-site tRNA. The view is from the L7/L12side of the ribosome (cf. Figure 3C).(B) The monosome-AP reconstruction, withthe density difference obtained by sub-tracting the monosome-AP from the disome-PE reconstruction superimposed in blue. Thearrows with solid lines denote density that weinterpret as being directly associated with the
E-site tRNA; that with a broken line indicates a probable conformational change in the E-site area (see text for further explanation). The viewis from the L1 side of the ribosome (cf. Figure 3A).

Structure of the Translating Ribosome23
Figure 6. Locations of the tRNA Molecules in the Reconstructions
(A) The P-site tRNA. The figure is a stereo view of the reconstruction of the posttranslocational disome-PE preparation, viewed from the L7/L12 side of the ribosome (cf. Figure 3C). The 70S disome-PE is shown as a semitransparent envelope, superimposed on a nontransparentsilhouette in red of the 30S subunit from a reconstruction of vacant 70S ribosomes (Stark et al., 1995). Areas of darker red occur where the30S contour protrudes through the semitransparent 70S contour. Due to the transparent rendering, the hue of the 50S subunit depends onhow many “layers” of the envelope are visible at any position; areas within just a few layers take on a progressively more golden appearance.The atomic structure of the P-site tRNA is added in green; here also the color of the tRNA structure changes in those areas lying behind thesemitransparent 70S contour.(B) The E-site tRNA. The figure is again a stereo view of the disome-PE preparation, this time viewed from the L1 side of the ribosome (cf.Figure 3A), and the atomic structure of the E-site tRNA is added in white.(C) The A-site tRNA. Here the reconstruction is of the 70S monosome-AP carrying A- and P-site tRNAs, and the stereo view is from the L7/L12 side of the ribosome (cf. Figure 3C). The atomic structure of the A-site tRNA is added in pale blue. For this figure, and for Figure 7, thereader is recommended to use a proper stereo viewer.
in Figure 5B represents ribosomal disome-PE density, in this area reveals a shape that could be correlatedwith the anticodon stem-loop of a tRNA molecule. Wewhich lies higher up in the monosome-AP reconstruc-
tion, and, consequently, partially masks the E-site tRNA therefore interpret this as indeed being the E-site tRNA,although other factors, such as an only partial occu-density in the difference map (Figure 5B). In the 3-D
disome-PE reconstruction (Figure 6B), the extra density pancy of the E site, or the possible existence of two

Cell24
states for E-site-bound tRNA (Robertson and Win- Figure 6C. As with the E-site tRNA (Figure 6B), densitycorresponding to the whole anticodon arm is directlytermeyer, 1987), are likely to play a role here.
An apparently obvious control to gain more informa- visible, but here this density is directed toward the de-coding area in the neck of the 30S subunit. Once again,tion concerning the E-site region would be to make a
3-D reconstruction from non-salt-washed ribosomes, the acceptor arm of the atomic structure of the tRNA isdirected toward the peptidyl transferase region in thesuch as the 70S peak from the polysome preparation
(Figure 1), or from the tight-couple 70S ribosomes used 50S subunit, although the density in the reconstruction(Figure 6C) seems to suggest a less pronouncedfor preparing the monosome-AP particles (see Experi-
mental Procedures). In a 3-D reconstruction made from L-shape of the tRNA molecule. Further work will be nec-essary to determine whether the A-site tRNA structurethe latter ribosomes, the density corresponding to the
A- and P-site tRNAs was, as expected, absent, and is indeed distorted in this manner. The A-site tRNA liesdirectly under the A-site finger (Figure 3), which is likelyadditional density could be observed in the E-site region
similar to that in Figure 4D (data not shown). However, to correspond to helix 38 of the 23S RNA; cross-linksbetween the elbow region of the A-site tRNA and helixthe reproducible resolution of this reconstruction was
considerably lower than that of the disome-PE or of the 38 have recently been described (Rinke-Appel et al.,1995). The position of the P-site tRNA in the monosome-monosome-AP reconstructions, suggesting substantial
sample heterogeneity. Thus, it appears that it is the AP reconstruction (Figure 4D) is essentially identical tothat found in the disome-PE reconstruction. This is illus-binding of the tRNA itself which drives the particles into
a homogenous configuration and that, as stressed in trated in Figure 7, which compares the pre- and post-translocational states and shows close-up views of thethe Introduction, homogeneity is the prerequisite for ob-
taining a high resolution structure in this approach. In two tRNA molecules in each case.In the pretranslocational state, it is difficult to displaythe case of the vacant ribosomes, we have so far found
that only those that have been washed with 0.5 M NH4Cl the A- and the P-site tRNAs simultaneously, as one orthe other is inevitably obscured by parts of the ribosomal(as in Stark et al., 1995) give good reconstructions.
The 3-D locations of the tRNA molecules within the subunits. Accordingly, in Figure 7A the transparency ofthe 70S contour is enhanced so that both tRNA mole-disome-PE and monosome-AP reconstructions are illus-
trated in Figure 6. Here, the 30S subunit is shown as an cules can be seen behind the A-site finger density. Thetwo tRNAs (P site, green; A site, pale blue) lie closeopaque red object, taken from the reconstruction of
the vacant 70S ribosomes (Stark et al., 1995). The 70S together (cf. Figure 4D), with an angle of z508 betweenthe plane of the molecules. This arrangement is consis-ribosome from the disome-PE reconstruction is super-
imposed upon this 30S image as a semitransparent sil- tent with the one suggested by fluorescence resonanceenergy transfer results reported previously (Paulsen ethouette. The tRNA molecules are depicted as atomic
models (Kim et al., 1974; Robertus et al., 1974); they al., 1983) and is very similar to that proposed by Smithand Yarus (1989). In the view of the posttranslocationalwere fitted to the electron microscopic contour using
the program ERNA-3D (Mueller et al., 1995). Figure 6A state (Figure 7B), some distance separating the antico-don loops of the P- and E-site tRNA molecules (greenshows the position of the P-site tRNA. Here, a “knob”
of extra density in the disome-PE silhouette can be seen and white, respectively) is apparent. The measured dis-tance between these two tRNA positions, as depictedjust above the intersubunit bridge, which corresponds
to the central fold of the P-site tRNA molecule. In the in Figure 7B, is 54 A, which is somewhat larger thanthe value found from fluorescence resonance energyoriginal horizontal sections of the 3-D reconstruction
(Figure 4C), there is a thin line of density corresponding transfer measurements (34 68 A, Paulsen and Win-termeyer, 1986).to the acceptor arm of the tRNA. This density is directed
toward the peptidyl transferase area of the 50S subunitand enables us to define the orientation of the tRNA
Discussionmolecule as shown. This same density (Figure 4C) hasthe concomitant effect of directing the anticodon arm
It is generally accepted that the tRNA molecules areof the tRNA into the decoding area in the neck regionlocated in the ribosome with their anticodon loops di-of the 30S subunit. In Figure 6A, the lack of densityrected toward the 30S subunit and their CCA ends di-corresponding to the anticodon and acceptor arms ofrected toward the 50S subunit. Furthermore, the A-sitethe tRNA—at the chosen threshold level—may reflecttRNA is expected to lie on the L7/L12 side of the ribo-some flexibility in the tRNA orientation at the P site,some, with the P site in the middle and the E site closewhich results in these tRNA features partiallybeing aver-to the L1 protuberance (Wower et al., 1989; Noller et al.,aged out in the reconstruction. The location of the E-site1990; Lim et al., 1992). These criteria provide the basistRNA is shown in Figure 6B. Here, the density corre-for our allocation of the density to the three tRNA bindingsponding to the anticodon arm region can be seen di-sites in the 3-D reconstructions that we have describedrectly (cf. Figure 4C), as can the central fold; this enableshere. By comparing the disome-PE and monosome-APthe tRNA molecule to be oriented as shown. The E-sitereconstructions bothwith each otherand with the recon-tRNA thus appears to lie behind the L1 protuberance ofstruction of vacant ribosomes (Stark et al., 1995), densitythe 50S subunit and above the side lobe of the 30Swas observed that corresponded to the P and E sites,subunit. As with the P site, the acceptor arm is directedand to the A- and P-site tRNAs, respectively. It wouldtoward the peptidyl transferase area.be premature at this stage—where the resolution is atThe location of the A-site tRNA molecule in the mono-
some-AP reconstruction (cf. Figure 4D) is illustrated in a level of z20 A—to try to make more sophisticated site

Structure of the Translating Ribosome25
Figure 7. Comparison of the Pre- and Posttranslocational States
For details, see the legend to Figure 6 and the main text.(A) The pretranslocational state, stereo view from the L7/L12 side of the ribosome (cf. Figure 3C), with A- and P-site tRNAs (pale blue andgreen, respectively).(B) The posttranslocational state, stereo view from the L1 side of the ribosome (cf. Figure 3A), with P- and E-site tRNAs (green and white,respectively). In both cases the ribosome is tilted slightly so that the view is in toward the decoding center from “above.”
allocations, such as to “A/P” and “P/E” hybrid states Rinke-Appel et al., 1995), however, presented us withthe problem that the overall patterns of cross-linking(cf. Moazed and Noller, 1989a).
In our disome-PE reconstruction, the P-site tRNA is could not be explained in terms of a single configurationof the 70S ribosome. In particular, the P-site-boundpositioned with the plane of the molecule approximately
vertical (see Figure 6A). Consequently, the anticodon tRNA showed site-specific cross-linking patterns similarto those of the E-site tRNA, both in helix 23 of the 16Sloop points into the region of the neck of the 30S subunit
(Figure 7B),where the decoding site isgenerally believed RNA and in the L1 binding region of the 23S RNA. Al-though, as just discussed, these cross-links agree wellto be located (e.g., Gornicki et al., 1984). Correspond-
ingly, the E-site tRNA is located with its elbow close to with the position of the E-site tRNA in the disome-PEreconstruction (Figure 6B), they are clearly not compati-the L1 protuberance of the 50S subunit (Figure 6B).
This is in good agreement with tRNA footprinting data ble with the corresponding position of the P-site tRNA(Figure 6A). A solution to this dilemmahas been provided(Moazed and Noller, 1989b) that indicate contacts of the
E-site tRNA to the L1 binding region of the 23S RNA, by a reconstruction of 70S ribosomes programmed withtRNA Met
f , which shows that the L1 protuberance and theas well as with results of site-directed cross-linking ex-periments, suggesting that the elbow of the E-site tRNA 30S side lobe are effectively in contact with the P-site
tRNA when only the P site is occupied. This reconstruc-is close to the L1 RNA-binding region (Rinke-Appel etal., 1995). The anticodon arm of the E-site tRNA lies tion will be described elsewhere.
The reconstruction of the pretranslocational 70Sabove the side lobeof the 30S subunits, which is again ingood agreement with similar site-directed cross-linking monosome-AP carrying tRNAs in both the A and the P
sites (Figures 4D and 6C) shows a configuration similardata from the E-site tRNA to the 39 terminus (Wower etal., 1993) and to helix 23 of the 16S RNA (Doring et al., to that of the posttranslocational disome-PE (Figures
6A and 6B). Thus the transition from the pre- to the1994; Rinke-Appel et al., 1995). Current model-buildingstudies locate helix 23 unequivocally in the side lobe of posttranslocational state is apparently not accompa-
nied by any gross morphological change of the 70Sthe 30S subunit (Brimacombe, 1995; Stark et al., 1995).These same cross-linking data (Doring et al., 1994; structure. Moreover, the relatively small angle (z508)

Cell26
that we observe between the A-and the P-site tRNAs Understanding the Ribosome at High ResolutionThe 3-D resolutions achievable with the angular re-(Figures 4D and 7A) agrees well with a number of bio-constitution approach have already reached resolutionchemical findings. Fluorescence energy transfer datalevels of 10–15 A for other macromolecular systemsindicate a short distance between the elbow regions of(submitted for publication), and no direct theoretical res-the two molecules (Johnson et al., 1982; Paulsen etolution limits for the single particle approach are yet inal., 1983), and the site-directed mutagenesis results ofsight (Henderson, 1995). Cryomicroscopic 3-D recon-Smith and Yarus (1989) can only be explained in termsstructions of the ribosome in different functional states,of a small angle between theP- and A-site tRNAs. Cross-and at increasing levels of resolution, will clearly belinks from the elbow regions of A- and P-site-boundhelpful in understanding its in vivo functioning. Now thattRNA to 16S and 23S RNA (Rinke-Appel et al., 1995)the tRNA molecules can be directly visualized in thealso suggest an arrangement in which the two elbowstranslating ribosome, the role of the tRNA-related bio-of the tRNAs lie close together, in the “S” configurationchemical data (tRNA cross-linking [Prince et al., 1982;(Lim et al., 1992). This arrangement is in agreement withDoring et al., 1994; Rinke-Appel et al., 1995] and foot-the models discussed by Wower et al. (1989) and Nollerprinting data [Moazed and Noller, 1990]) has becomeet al. (1990). In the posttranslocational state, the loca-doubly important in the rRNA model-building program.tions of the P- and E-site tRNAs (Figure 7B) are suchWe are currently incorporating the ribosomal RNA mole-that the translocation from the P to the E site also repre-cules into our 20 A 3-D reconstructions. For this pur-sents a relatively small rotation, combined with a lateralpose, the rRNA must be folded in such a way as totranslation toward the L1 protuberance, again in accor-satisfy both the biochemical constraints (cross-links,dance with the model proposed by Noller et al. (1990).footprints) and the constraints imposed by the 3-D mapsIt should be noted, however, that the distance between(cf. Brimacombe, 1995; Stark et al., 1995).the anticodon loops of the P- and E-site tRNAs (54 A)
is too large to allow simultaneous codon–anticodon in-teraction at both the P and E sites (cf. Rheinberger and Experimental ProceduresNierhaus, 1986), as shown before, biochemically (Kirillovet al., 1983; Lill and Wintermeyer, 1987). Preparation of Disomes-PE in the Posttranslocational State
Polysomes were prepared from E. coli MRE 600 cells by a methodWhile this manuscript was in preparation, an articleessentially the same as that of Sirdeshmukh et al. (1985). Afterappeared by Agrawal et al. (1996) describing a recon-growing to an absorbance of 0.4–0.5 at 560 nm, the cell culturestruction made from E. coli ribosomes programmed with(without chloramphenicol) was quickly chilled over crushed ice and
poly(U) and saturating amounts of tRNAPhe.Although this harvested by centrifugation at 2500 3 g for 5 min. The cell pelletprocedure results in a relatively homogeneous popula- was suspended in 20 mM HEPES-KOH (pH 7.9), 6 mM MgCl2, 100
mM NaCl, and 16% sucrose (1 ml buffer per 100 ml of cell culture).tion containing three tRNA molecules per ribosomeTo 1 ml of cell suspension was added 15 ml of lysozyme (50 mg/(Rheinberger et al., 1981), itdoes not represent a physio-ml), and after incubating on ice for 2 min. the mixture was frozenlogical situation, since the translating ribosome doesat 2808, then thawed and centrifuged at 10,000 rpm for 15 min at
not contain more than two molecules of tRNA at any 48 to remove cell debris. The clear supernatant was applied to aone time (Gnirke et al., 1989). This is probably the reason 10%–40% sucrose gradient in 20 mM HEPES-KOH (pH 7.5), 6 mMwhy the positions of the tRNA molecules inferred by MgCl2, 150 mM NH4Cl and 4 mM 2-mercaptoethanol, andcentrifuged
at 13,000 rpm for 19 hr at 48. Gradient fractions containing disomesAgrawal et al. (1996; Brookhaven Protein Data Bank(cf. Figure 1) were pooled, and the disomes pelleted by centrifuga-tracking number T7700) do not agree with the resultstion at 36,000 rpm for 4 hr at 48. The pellet was resuspended in the
presented here. Agrawal et al. (1996) place the P-site sucrose gradient buffer, with 10% sucrose, to a concentration oftRNA in a “horizontal” position, rather than in a “vertical” z400 pmol/ml. Aliquots containing z10 pmol of ribosomes wereposition as in Figure 6A, which forces the anticodon treated with an equimolar amount of EF-G for 10 min at 378, in the
presence of 0.1 mM GTP. The activity of the EF-G preparation wasloop (and hence the decoding site) into an implausibletested using radioactive substrates, as described by Dontsova etlocation on the side of the 30S subunit facing the L7/al. (1992).L12 protuberance (cf. Figure 3). The orientation they
propose for the E-site tRNA represents a rotation of 1458Preparation of 70S Monosomes Carrying tRNAfrom the corresponding P-site position, with the resultat the A and P Sitesthat the CCA end of the E-site molecule is directedEighty picomoles of 70S tight-couple ribosomes were incubated at
out into the solvent behind the L1 protuberance. This 378 for 1 hr with 4-fold excess of mRNA (“m022”, Calogero et al.,location is difficult to reconcile with the established fact 1988) and a 2-fold excess of fMet-tRNA Met
f in 80 ml of buffer consistingthat the 39-terminal adenosine of the tRNA is essential of 1 mM GTP, 50 mM Tris-HCl (pH 7.5), 70 mM NH4Cl, 30 mM KCl,
and 7 mM MgCl2. Initiation factors were included at final concentra-for E-site binding (Lill et al., 1988). The location proposedtions of 7 mM (IF-1) and 2.25 mM (IF-2, IF-3). To prepare a ternaryby Agrawal et al. (1996) for the A-site tRNA also impliescomplex containing Phe-tRNAPhe, a mixture containing 0.5 mM EF-a large rotation (1608) from the P site, again in conflictTu and EF-Ts, 3 mM phosphoenol pyruvate, 0.1 mg/ml pyruvate
with previous data that, as discussed above, suggest kinase, 1 mM GTP, 50 mM Tris-HCl (pH 7.5), 70 mM NH4Cl, 30 mMthat only a small angle exists between the P- and A-site KCl and 7 mM MgCl2 was preincubated for 15 min at 378, then 160
pmoles of 14C-Phe-tRNAPhe (Rodnina and Wintermeyer, 1995) wasmolecules. More serious than the large angle as suchadded to give a total volume of 80 ml. Incubation was continued for 3is the fact that the 1608 rotation they propose for themin at 208, after which the mixture was combined with the ribosomaltranslocation from the A to the P site is topologicallyinitiation complex, incubated for a further 1 min at 378, and stored
impossible, as it requires the anticodon stem of the on ice. Aliquots were assayed by nitrocellulose filtration and peptidetranslocating tRNA to cut through the backbone of the analysis (Rodnina and Wintermeyer, 1995), and showed 95% A-site
occupancy with fMet-Phe-tRNAPhe.mRNA.

Structure of the Translating Ribosome27
Electron Microscopy Boettcher for assistance with the Philips CM12 cryomicroscope,and Tarik Erdemir for a number of data conversions. The work wasSpecimen preparation was performed similarly to our earlier work
on vacant 70S ribosomes (Stark et al., 1995); a Philips CM12 electron supported in part by grants from the Deutsche Forschungsge-meinschaft (Grants HE 2162/1-1, BR 632/3-2, and WI 626/11-1). HSmicroscope (used at 100 kV) in combination with a Gatan cryo-
holder and transfer system were used for cryomicroscopy. The vitri- was financed in part by an award to Dr. Richard Henderson of theMRC Laboratory for Molecular Biology, Cambridge, Unitedfied (Chiu, 1986; Dubochet et al., 1988) samples of the E. coli ribo-
some in different functional states were imaged at 21748C, at a Kingdom.defocus value of 0.9 mm where the first zero of the Contrast TransferFunction (CTF) lies at z1/18 A. The CM12 cryomicroscope was Received April 29, 1996; revised October 22, 1996.equipped with a Tietz Video Systems’ fast FFT processor for optimiz-ing the electron microscopic imaging conditions. References
Image Processing Agrawal, R.K., Penczek, P., Grassucci, R.A., Li, Y., Leith, A., Nier-The micrographs were digitized using the “EMiL” linear-CCD densi- haus, K.H., and Frank, J. (1996). Direct visualization of A-, P- andtometer (Image Science GmbH, Berlin), with a sampling size corre- E-site transfer RNAs inthe E. coli ribosome. Science 271, 1000–1002.sponding to 5.0 A at the specimen level. All image processing was
Brimacombe, R. (1995). The structure of ribosomal RNA: a three-performed in the context of the IMAGIC-5 software system (vandimensional jigsaw puzzle. Eur. J. Biochem. 230, 365–383.Heel et al., 1996) on DEC-Alpha workstations using the OPEN-VMSCalogero, R.A., Pon, C.L., Canonaco, M.A., and Gualerzi, C.L. (1988).or UNIX operating systems. From the digitized micrographs, severalSelection of the mRNA translation initiation region by E. coli ribo-thousand molecular imagesof the different ribosomes samples weresomes. Proc. Natl. Acad. Sci. USA 85, 6427–6431.extracted interactively (2750 “P1E” posttranslocational disomes-
PE, 3275 “A1P” pretranslocational monosomes-AP). Some of the Chiu, W. (1986). Electron microscopy of frozen, hydrated biologicalreconstructions were calculated de novo, as was our reconstruction specimens. Annu. Rev. Biophys. Chem. 15, 237–257.of the vacant 70S ribosomes; others were calculated using only the
Dontsova, G., Dokudovskaya, S., Kopylov, A., Bogdanov, A., Rinke-refinement procedures (Schatz et al., 1995; Serysheva et al., 1995)
Appel, J., Junke, N., and Brimacombe, R. (1992). Three widely-sepa-with reprojections of earlier 70S 3-D reconstructions as references
rated positions in the 16S RNA lie in or close to the ribosomalfor multi-reference alignments and/or as anchor sets for assigning
decoding region; a site-directed cross-linking study with mRNAana-Euler angle orientations to class averages.
logues. EMBO J. 11, 3105–3116.For de novo analyses, the images were first aligned using the
Doring, T., Mitchell, P., Osswald, M., Bochkariov, D., and Brima-reference free alignment-by-classification procedure (Dube et al.,combe, R. (1994). The decoding region of 16S RNA; a cross-linking1993), which includes Multivariate Statistical Analysis (MSA) eigen-study of the ribosomal A, P and E sites using tRNA derivatized atvector-eigenvalue data compression (van Heel and Frank, 1981) andposition 32 in the anticodon loop. EMBO J. 13, 2677–2685.hierarchical ascendant automatic classification (van Heel, 1989).
The resulting class averages were then used for multireference Dube, P., Tavares, P., Lurz, R., and van Heel, M. (1993). The portalalignment of the images (van Heel and Stoffler-Meilicke, 1985). For protein of bacteriophage SPP1: a DNA pump with 13-fold symmetry.“refinement only” analyses the starting point of the procedures was EMBO J. 12, 1303–1309.at this multireference alignment level. Once a preliminary 3-D recon- Dubochet, J., Adrian, M., Chang, J.J., Homo, J.C., Lepault, J., Mc-struction of the ribosome in one of its functional states is available, Dowall, A.W., and Schultz, P. (1988). Cryo-electron microscopy offurther iterative refinements lead to improved alignments, improved vitrified specimens. Quart. Rev. Biophys. 21, 129–228.classifications and Euler angle assignments, and finally to refined
Frank, J., Zhu, J., Penczek, P., Li, Y., Srivastava, S., Verschoor, A.,3-D reconstructions of each of the states (Schatz et al., 1995). TheRadermacher, M., Grassucci, R., Lata, R.K., and Agrawal, R.K.resolution measurements in this paper were all performed using the(1995). A model of protein synthesis based on cryo-electron micros-3-sigma Fourier Shell Correlation criterion (Harauz and van Heel,copy of the E. coli ribosome. Nature 376, 441–444.1986) between two independent 3-D reconstructions. All fitting of
the atomic tRNA models to the 3-D reconstructions was performed Gnirke, A., Geigenmuller, U., Rheinberger, H.J., and Nierhaus, K.H.using the program ERNA-3D (Mueller et al., 1995). (1989). The allosteric three-site model for the ribosomal elongation
cycle. J. Biol. Chem. 264, 7291–7301.CTF Correction Gornicki, P., Nurse, K., Hellmann, W., Boublik, M., and Ofengand, J.All good micrographs made from one sample and selected for pro- (1984). High resolution localization of the tRNA anticodon interactioncessing by optical diffraction are within a narrow defocus range and site on the E. coli 30S ribosomal subunit. J. Biol. Chem. 259, 10493–without astigmatism. Since all images then have the same defocus, 10498.all class averages used for 3-D reconstruction will be affected by
Harauz, G., and van Heel, M. (1986). Exact filters for general geome-this same specific CTF and thus the entire 3-D reconstruction willtry three-dimensional reconstruction. Optik 73, 146–156.have been modified as if filtered by a single 3-D CTF. Instead ofHawkes, P.W. (1980). Image processing based on linear theory ofcorrecting the individual 2-D micrographs or the 2-D class averages,image formation. In Computer Processing of Electron Microscopewe have chosen to correct the CTF by multiplying the 3-D data inImages, P.W. Hawkes, ed. (Heidelberg, New York: Springer Verlag),3-D Fourier space by the inverse of the actual CTF, modified topp. 1–33.avoid amplifying noise in the environment of the zero crossings (cf.
Hawkes, 1980). The micrographs were recorded relatively close to Henderson, R. (1995). The potential and limitations of neutrons,focus with the first zero of the CTF at z1/20 A and z 1/18 A (Stark electrons and X-rays for atomic resolution microscopy of unstainedet al., 1995; and this work, respectively). The 3-D maps of the ribo- biological molecules. Quart. Rev. Biophys. 28, 171–193.somes (Figures 3–7) were thresholded at 2.5 MDa. To make the 50S
Johnson, A.E., Adkins, H.J., Matthews, E.A., and Cantor, C.R. (1982).channel system (Stark et al., 1995) virtually disappear (Frank et al., Distance moved by transfer RNA during translocation from the A1995; Moore, 1995), our CTF-corrected reconstruction must be site to the P site on the ribosome. J. Mol. Biol. 156, 113–140.thresholded at an enclosed volume corresponding to a mass in
Kim, S.H., Suddath, F.L., Quigley, G.J., McPherson, A., Sussman,excess of 4.0 MDa.J.L., Wang, A.H.J., Seeman, N.C., and Rich, A. (1974). Three dimen-sional tertiarystructure of yeast phenylalanine transfer RNA. ScienceAcknowledgments185, 435–440.
Kirillov, S.V., Makarov, E.M., andSemenkov, Y.P. (1983). QuantitativeWe thank Prof. Thomas Trautner for support of our work. We aregrateful to Dr. Michael Schatz and Ralf Schmidt of Image Science study of the interaction of deacylated tRNAPhe with Escherichia coli
ribosomes: role of 50S subunits in formation of the E site. FEBSSoftware GmbH for help with the IMAGIC software system and forthe use of the “EMiL” densitometer. We acknowledge Dr. Christoph Lett. 157, 91–94.

Cell28
Lill, R., andWintermeyer, W. (1987). Destabilization of codon- antico- Rodnina, M.V., and Wintermeyer, W. (1995). GTP consumption ofelongation factor Tu during translation of heteropolymeric mRNAs.don interaction in the ribosomal exit site. J. Mol. Biol. 193, 137–148.Proc. Natl. Acad. Sci. USA 92, 1945–1949.Lill, R., Lepier, A., Schwagele, F., Sprinzl, M., Vogt, H., and Win-
termeyer, W. (1988). Specific recognition of the 39-terminal adeno- Schatz, M., Orlova, E.V., Dube, P., Jager, J. and van Heel, M. (1995).Structure of Lumbricus terrestris hemoglobin at 30 A resolutionsine of tRNAPhe in exit site of E. coli ribosomes. J. Mol. Biol. 203,
699–705. determined using angular reconstitution. J. Struct. Biol. 114, 28–44.
Serysheva, I.I., Orlova, E.V., Chiu, W., Sherman, M.B., Hamilton,Lim, V., Venclovas, C., Spirin, A., Brimacombe, R., Mitchell, P., andMueller, F. (1992). How are tRNAs and mRNA arranged in the ribo- S.L., and van Heel, M. (1995). Electron cryomicroscopy and angular
reconstitution to visualize the skeletalmuscle calcium-release chan-some? An attempt to correlate the stereochemistry of the tRNA-mRNA interaction with constraints imposed by the ribosomal topog- nel. Nature Struct. Biol. 2, 18–24.raphy. Nucleic Acids Res. 20, 2627–2637. Sirdeshmukh, R., Krych, M., and Schlessinger, D. (1985). E. coli 23S
RNA truncated at its 59 terminus. Nucleic Acids Res. 13, 1185–1192.Moazed, D., and Noller, H.F. (1989a). Intermediate states in themovement of transfer RNA in the ribosome. Nature 342, 142–148. Smith, D., and Yarus, M. (1989). tRNA-tRNA interactions within cellu-
lar ribosomes. Proc. Natl. Acad. Sci. USA 86, 4397–4401.Moazed, D., and Noller, H.F. (1989b). Interaction of tRNA with 23SrRNA in the ribosomal A, P and E sites. Cell 57, 585–597. Stark, H., Mueller, F., Orlova, E.V., Schatz, M., Dube, P., Erdemir,
T., Zemlin, F., Brimacombe, R., and van Heel, M. (1995). The 70SMoazed, D., and Noller, H.F. (1990). Binding of tRNA to the ribosomalA and P sites protects two distinct sets of nucleotides in 16S rRNA. ribosome at 23A resolution: fitting the ribosomal RNA. Structure 3,
815–821.J. Mol. Biol. 211, 135–145.
Moore, P.B. (1995). Ribosomes seen through a glass less darkly. Stoffler, G., and Stoffler-Meilicke, M. (1986). Immuno electron mi-croscopy on E. coli ribosomes. In Structure, Function and GeneticsStructure 3, 851–852.of Ribosomes, B. Hardesty and G. Kramer, eds. (New York: Springer-Mueller, F., Doring, T., Erdemir, T., Greuer, B., Junke, N., Osswald,Verlag), pp. 28–46.M., Rinke-Appel, J., Stade, K., Thamm, S., and Brimacombe, R.
(1995). Getting closer to an understanding of the three-dimensional van Heel, M. (1987). Angular reconstitution: a posteriori assignmentof projection directions for 3-D reconstruction. Ultramicroscopy 21,structure of ribosomal RNA. Biochem. Cell Biol. 73, 767–773.111–124.Noller, H.F., Moazed, D., Stern,S., Powers,T., Allen, P.N., Robertson,
J.M., Weiser, B., and Triman, K. (1990). Structure of rRNA and its van Heel, M. (1989). Classification of very large electron microscopi-cal image data sets. Optik 82, 114–126.functional interactions in translation. In The Ribosome; Structure,
Function and Evolution, W.E. Hill, A. Dahlberg, R.A. Garrett, P.B. van Heel, M., and Frank, J. (1981). Use of multivariate statistics inMoore, D.Schlessinger, and J.R. Warner, eds. (Washington, DC: analysing the images of biological macromolecules. Ultramicros-ASM Press), pp. 73–92. copy 6, 187–194.Oakes, M., Henderson, E., Scheinman, A., Clark, M., and Lake, J.A. van Heel, M., and Stoffler-Meilicke, M. (1985). Characteristic views(1986). Ribosome structure, function, and evolution: mapping ribo- of E. coli and B. stearothermophilus 30S ribosomal subunits in thesomal RNA, proteins, and functional sites in three dimensions. In electron microscope. EMBO J. 4, 2389–2395.Structure, Function and Genetics of Ribosomes, B. Hardesty and van Heel, M., Winkler, H., Orlova, E.V., and Schatz, M. (1992). Struc-G. Kramer, eds. (New York: Springer-Verlag), pp. 47–67. tural analysis of ice-embedded single particles. Scanning Micros-Ofverstedt, L.G., Zhang, K., Tapio, S., Skoglund, U., and Isaksson, copy (Suppl.)6, 23–42.L.A. (1994). Starvation in vivo for aminoacyl-tRNA increases the van Heel, M., Harauz, G., Orlova, E.V., Schmidt, R., and Schatz, M.spatial separation between the two ribosomal subunits. Cell 79, (1996). A new generation of the IMAGIC image processing system.629–638. J. Struct. Biol. 116, 17–24.Paulsen, H., and Wintermeyer, W. (1986). tRNA topography during Walleczek, J.,Albrecht-Ehrlich, R.,Stoffler, G., andStoffler-Meilicke,translocation: steady-state and kinetic fluorescence energy-transfer M. (1990). Three-dimensional localization of the NH2-and carboxyl-studies. Biochemistry 25, 2749–2756. terminal domain of protein S1 on the surface of the 30S subunitPaulsen, H., Robertson, H.J., and Wintermeyer, W. (1983). Topologi- from E. coli. J. Biol. Chem. 265, 11338–11344.cal arrangement of two transfer RNAs on the ribosome. Fluores- Wower, J., Hixson, S.S., and Zimmermann, R.A. (1989). Labeling thecence energy transfer measurements between A and P site- bound peptidyl transferase center of the E. coli ribosomes with photoreac-tRNAPhe. J. Mol. Biol. 167, 411–426. tive tRNAPhe derivatives containing azidoadenosine at the 39-endPrince, J.B., Taylor, B.H., Thurlow, D.L., Ofengand, J., and Zimmer- of the acceptor arm; a new model of the tRNA-ribosome complex.mann, R.A. (1982). Covalent crosslinking of tRNAVal to 16S RNA at Proc. Natl. Acad. Sci. USA 86, 5232–5236.the ribosomal P site: identification of crosslinked residues. Proc. Wower, J., Scheffer, P., Sylvers, L.A., Wintermeyer, W., and Zimmer-Natl. Acad. Sci. USA 79, 5450–5454. mann, R.A. (1993). Topography of the E site on the E. coli ribosome.Remme, J., Margus, T., Villems, R., and Nierhaus, K.H. (1989). The EMBO J. 12, 617–623.third ribosomal tRNA-binding site, the E site, is occupied in native Yonath, A., and Berkovitch-Yellin, Z. (1993.) Hollows, voids, gapspolysomes. Eur. J. Biochem. 183, 281–284. and tunnels in the ribosome. Curr. Opin. Struct. Biol. 3, 175–181.Rheinberger, H.J., and Nierhaus, K.H. (1986). Adjacent codon-anti-codon interaction of both tRNAs present at the ribosomal A and Por P and E sites. FEBS Lett 204, 97–99.
Rheinberger, H.J., Sternbach, H., and Nierhaus, K.H. (1981). ThreetRNA binding sites on E. coli ribosomes. Proc. Natl. Acad. Sci. USA78, 5310–5314.
Rinke-Appel, J., Junke, N., Osswald, M., and Brimacombe, R. (1995).The ribosomal environment of tRNA: cross-links to rRNA from posi-tions 8 and 20:1 in the central fold of tRNA located at the A, P or Esite. RNA 1, 1018–1028.
Robertson, J.M., and Wintermeyer, W. (1987). Mechanism of ribo-somal translocation; tRNA binds transiently to an exit site beforeleaving the ribosome during translocation. J. Mol. Biol. 196, 525–540.
Robertus, J.D., Ladner, J.E., Finch, J.T., Rhodes, D., Brown, R.S.,Clark, B.F.C., and Klug, A. (1974). Structure of yeast phenylalaninetRNA at 3A resolution. Nature 250, 546–551.
Copyright © 2022 FDOKUMEN