Structural, spectroscopic and crystal field analyses of Ni 2+ and Co 2+ doped Zn 2 SiO 4 powders
12
1 23 Applied Physics A Materials Science & Processing ISSN 0947-8396 Volume 104 Number 1 Appl. Phys. A (2011) 104:483-492 DOI 10.1007/ s00339-011-6291-6 Structural, spectroscopic and crystal field analyses of Ni 2+ and Co 2+ doped Zn 2 SiO 4 powders Radenka M. Krsmanovi#, Željka Anti#, Miodrag Mitri#, Miroslav D. Drami#anin & Mikhail G. Brik
Transcript of Structural, spectroscopic and crystal field analyses of Ni 2+ and Co 2+ doped Zn 2 SiO 4 powders

1 23
Applied Physics AMaterials Science & Processing ISSN 0947-8396Volume 104Number 1 Appl. Phys. A (2011)104:483-492DOI 10.1007/s00339-011-6291-6
Structural, spectroscopic and crystal fieldanalyses of Ni2+ and Co2+ doped Zn2SiO4
powders
Radenka M. Krsmanovi#, Željka Anti#,Miodrag Mitri#, Miroslav D. Drami#anin& Mikhail G. Brik

1 23
Your article is protected by copyright and
all rights are held exclusively by Springer-
Verlag. This e-offprint is for personal use only
and shall not be self-archived in electronic
repositories. If you wish to self-archive your
work, please use the accepted author’s
version for posting to your own website or
your institution’s repository. You may further
deposit the accepted author’s version on a
funder’s repository at a funder’s request,
provided it is not made publicly available until
12 months after publication.

Appl Phys A (2011) 104:483–492DOI 10.1007/s00339-011-6291-6
Structural, spectroscopic and crystal field analyses of Ni2+and Co2+ doped Zn2SiO4 powders
Radenka M. Krsmanovic · Željka Antic ·Miodrag Mitric · Miroslav D. Dramicanin ·Mikhail G. Brik
Received: 28 October 2010 / Accepted: 10 January 2011 / Published online: 27 January 2011© Springer-Verlag 2011
Abstract In this paper we presented structural and spectro-scopic study of zinc silicate powder samples doped withdivalent nickel and cobalt ions. Results of the Rietveldstructural refinement, combined with optical spectroscopicstudy and theoretical crystal field calculations, are presentedand discussed. X-ray diffraction studies were performed toestablish reliable structure of the doped samples; in thisway the interionic distances and chemical bond angles inZn2SiO4:Co2+ and Zn2SiO4:Ni2+ were calculated and arereported for the first time. The room temperature reflectionspectra of the prepared samples were measured in a spec-tral region from 4000 to 50000 cm−1. The exchange chargemodel of crystal field has been applied to analyze the exper-imental spectra and assign all observed details in the spec-tra to the corresponding electronic transitions between theCo2+ and Ni2+ crystal field energy levels. The only inputinformation for the model calculation was the experimen-tally obtained structural data, which were used for the cal-culations of the crystal field parameters with subsequent di-agonalization of the crystal field Hamiltonian for both ions.Agreement between the calculated and experimentally de-tected energy levels of impurity ions was good. On the basisof the crystallographic and crystal field studies it was es-tablished that there exists a systematic trend of preferential
R.M. Krsmanovic (�) · Ž. Antic · M. Mitric · M.D. DramicaninVinca Institute of Nuclear Sciences, University of Belgrade, P.O.Box 522, Belgrade 11001, Serbiae-mail: [email protected]: +381-11-3408607
M.G. BrikInstitute of Physics, University of Tartu, Riia 142, Tartu 51014,Estoniae-mail: [email protected]: +372-738-3033
occupation of one out of two possible crystallographic sites(namely, Zn2) for both impurity ions.
1 Introduction
From the practical point of view zinc silicate (willemite,Zn2SiO4) is known as an important host for both rare earthsand transition metals that provide luminescence in blue(Ce3+), green (Tb3+, Mn2+) and red (Eu3+, Sm3+) spectralregions [1–7]. This compound has been extensively used as aphosphor for cathode ray tubes [8] and electroluminescencedevices [9, 10], and as a crystalline phase in glass ceramics[11], glazes and pigments [12, 13]. When doped with Ni2+and Co2+ ions Zn2SiO4 adopts intense blue coloration [7]that finds use as a valuable ceramic pigment [14–16]. Fromthe fundamental research point of view zinc silicate is an in-teresting host, since it provides tetrahedral coordination onlyfor rare earth and transition metal ions impurities. Generallyspeaking, tetrahedral coordination is not so abundant, espe-cially for divalent nickel ions, and Zn2SiO4 offers a uniqueopportunity to study crystal field (CF) in this configuration.
In this paper we aimed to analyze optical properties ofdivalent nickel and cobalt ions incorporated into zinc sil-icate host. It is important to emphasize that, taking intoaccount that Zn2SiO4 is mostly used in powder form, allperformed experiments and calculations were done for thepowder samples. It should be also noted that although thepolarized absorption spectra of divalent cobalt and nickelions in Zn2SiO4 single crystals were published and ana-lyzed previously [17, 18], we found that analysis of ourpowder reflection spectra leads to slightly different positionsand splittings of impurity ions’ energy levels. Having no-ticed that, we performed detailed CF analysis of our pow-der samples. To make sure that the lattice relaxation (un-
Author's personal copy
484 R.M. Krsmanovic et al.
avoidable when incorporating impurity ions into a host lat-tice) is properly taken into account, we started from a thor-ough crystallographic study of the doped samples, which re-sulted in getting the refined structure of both Zn2SiO4:Ni2+and Zn2SiO4:Co2+ powders. The obtained data of structuralanalysis were taken as an initial input for detailed and sys-tematic CF calculations. Comparative analysis of the calcu-lated energy levels and experimental optical reflection spec-tra allowed for evaluating CF splitting of the 3d states ofNi2+ and Co2+ in Zn2SiO4 samples and recovering cer-tain trends in behavior of both impurities. In particular, itis found that from the two available Zn positions (Zn1 andZn2) that both impurities tend to occupy the Zn2 sites.
The presented results confirm firmly the validity of sucha combined application of the refined structural analysis ofthe doped materials and CF studies of their optical spectra.
The paper is organized as follows: first we give results ofthe crystal structure analysis and then proceed with descrip-tion of the reflection spectra and results of the CF calcula-tions. Discussion of the CF analysis links together the ex-perimental and theoretical parts of this paper, which is thenconcluded with a short summary of the main obtained re-sults.
2 Experimental part
2.1 Powder preparation
The samples of zinc silicate doped with divalent cobalt andnickel ions (3 at.%) are prepared according to the procedure
presented in earlier reports [7, 19]. We do not give here anyfurther details, but refer a reader to the above-cited papers.
2.2 Characterization
X-ray diffraction measurements were performed on thePhilips PW 1050 instrument, using Cu Kα1,2 radiation (Nifiltered) in a 2θ range from 10° to 120°, counting for 12seconds in 0.02° steps. The obtained XRD data are used forthe structure refinement based on the Rietveld full profilerefinement method [20] employing the KOLARIET com-puter software [21]. Diffuse spectral reflectance measure-ments were done in the full spectral range (200–2500 nm),on the Perkin Elmer Lambda 9 Uv/VIS/NIR spectrometerequipped with reflectance accessory and referenced withSpectralon, with scan speed 240 nm/min and 4 nm slit. Allmeasurements were carried out at room temperature.
3 Experimental results and discussion
3.1 Crystal structure analysis for Ni2+ and Co2+ dopedZn2SiO4 powders
Under ordinary conditions Zn2SiO4(willemite) crystallizesin the rhombohedral space group R3 (No. 148), in theBe2SiO4 (phenakite) structural type, where all ions occupygeneral crystallographic positions 18f [x, y, z] (hexagonalaxis set) with local symmetry C1 [22–24], and in accordancewith stoichiometry, zinc ions will occupy two, silicon ions
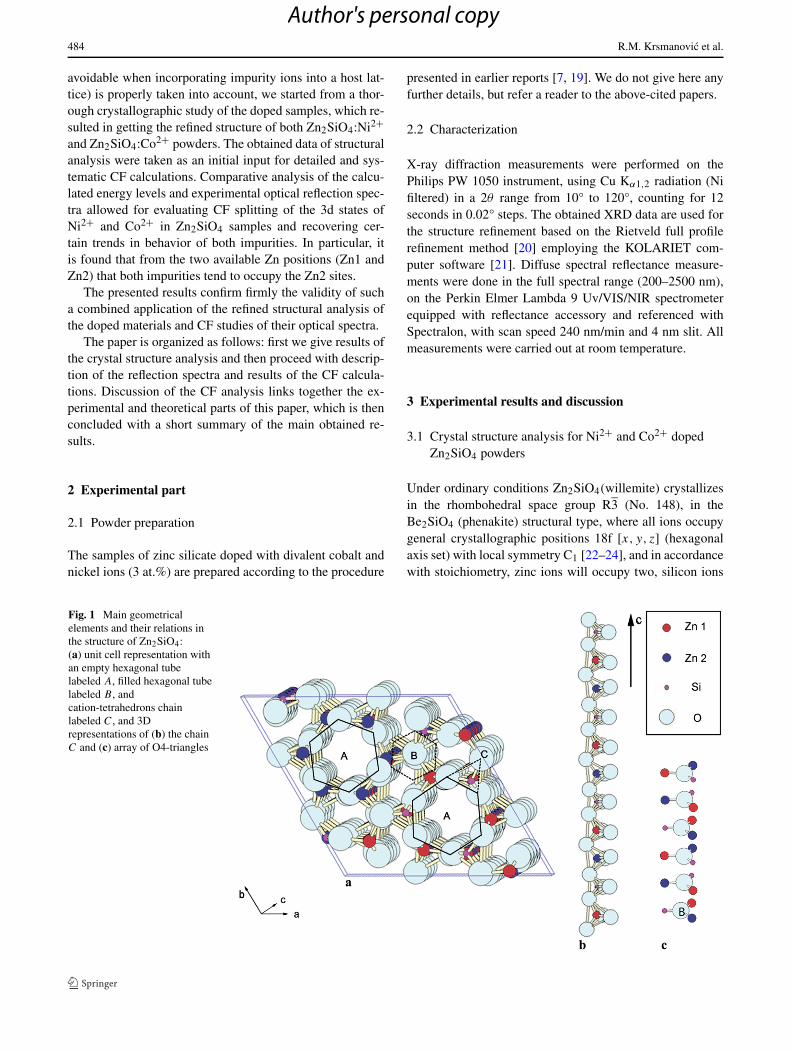
Fig. 1 Main geometricalelements and their relations inthe structure of Zn2SiO4:(a) unit cell representation withan empty hexagonal tubelabeled A, filled hexagonal tubelabeled B , andcation-tetrahedrons chainlabeled C, and 3Drepresentations of (b) the chainC and (c) array of O4-triangles
Author's personal copy

Structural, spectroscopic and crystal field analyses of Ni2+ and Co2+ doped Zn2SiO4 powders 485
Fig. 2 Tetrahedralsurroundings of (a) Zn1 and(b) Zn2 atoms in the Zn2SiO4structure. Presented interatomicdistances are based on theRietveld refinement forZn2SiO4:Ni2+ sample
Fig. 3 The schemes of: (a) 6-element ring of tetrahedrons—main con-stituting element of tubes A and B from Fig. 1 and (b) their intercon-nection throughout three Si tetrahedrons
one and oxygen ions four different 18f crystallographic po-sitions in a unit cell. A schematic representation of the unitcell content is depicted in Fig. 1. In both crystallographicpositions zinc ions are tetrahedrally coordinated with fouroxygen ions: Zn1 is surrounded with two O2 oxygen atoms,one O3 and one O4, while Zn2 has two O1, one O3 and oneO4 atoms as the nearest neighbors (see Fig. 2 and Table 1with fractional coordinates). The silicon ions are also tetra-hedrally coordinated with oxygen ions in somewhat smallertetrahedra. All oxygen ions have cationic triangular coordi-nation with one silicon ion, and both Zn1 and Zn2 ions. It isuseful to note their arrangement: the triangle plane for oxy-gen O4 is perpendicular to the z-axis (see Fig. 1c), while theplane containing the O1, O2 and O3 atoms is parallel to thez-axis (see Fig. 1b).
As geometrical base of the willemite structure we canadopt an infinitely long hexagonal tube, not filled and madeup of six tetrahedral chains (labeled A in Fig. 1). The 3-fold rotatory-inversion axis goes through the center of thistube. Every tube of this kind is surrounded with six similar,but filled tubes (labeled B in Fig. 1); the 31 and 32 three-fold screw axes are passing through their centers, alterna-tively. Both tube types have their walls arranged as zigzag,six-element rings, containing only Zn1 or Zn2 tetrahedrons,as shown in Fig. 3a. These rings alternate regularly and arebonded together with three Si tetrahedrons (Fig. 3b). Thewalls for both tubes are made up of oxygen atoms only: O1,
O2 and O3, while the central part of filled tube is an arrayof the O4 oxygen atoms laying almost on 31 and 32 screwaxes and having very close coordinates to the (1/3,1/3, z)
set. The O4 atoms are situated approximately at the cen-ters of the Zn1, Zn2 and Si triangles (see Fig. 1c), whichare arranged along the z-axis according to the left and righthand rule. Looking along the positive direction of the z-axisof the filled tube, apexes of one triangle appear in the fol-lowing order: Zn1, Zn2, and Si.
Detailed structural analysis is done by the full profile Ri-etveld refinement method in space group R3 with hexagonalaxis (R3:H). The starting parameters for the initial crystalstructural model of Zn2SiO4 are taken from the reportedcrystallographic data [25, 26]. The refined structural para-meters are presented in Table 1 and illustrated in Fig. 4.
The Rietveld refinement results provided precise crystalstructural parameters for Ni2+ and Co2+ in Zn2SiO4 pow-der samples, and enable us to determine the preferential siteoccupancy of Ni2+ and Co2+ impurity ions. Due to simi-lar ionic radius and the same valence these ions can occupyonly positions of Zn2+ cations distributed over two crystal-lographically different sites (Zn1 and Zn2).
During the refinements Ni2+(Co2+) ions were allowedto occupy both Zn2+ crystallographic sites (Zn1 and Zn2).The obtained refined values showed, within an error, thatNi2+(Co2+) ions occupy only Zn2 sites, and the refine-ments proceeded with fixed so-obtained values. These oc-cupations are additionally justified by the comparison ofthe average dimensions of the two Zn2 and Zn1 tetrahe-dra (〈Zn–O〉 is 1.934 Å and 1.954 Å, respectively), con-sidering that smaller Ni2+(Co2+) ions will preferable oc-cupy smaller Zn2 tetrahedron.The microstrain values arerelatively high that is in accordance with the presence ofthe 3d-metal ions and the soft-chemistry synthesis methodused for the samples’ preparation. The overall B factors havesomewhat smaller value than expected, most probably dueto the pronounced X-rays absorption, characteristic for 3dmetals. Based on the fractional coordinates and unit cell pa-rameters, whose refined values are given in Table 1, we cal-culated the most important distances and angles for ionic
Author's personal copy
486 R.M. Krsmanovic et al.
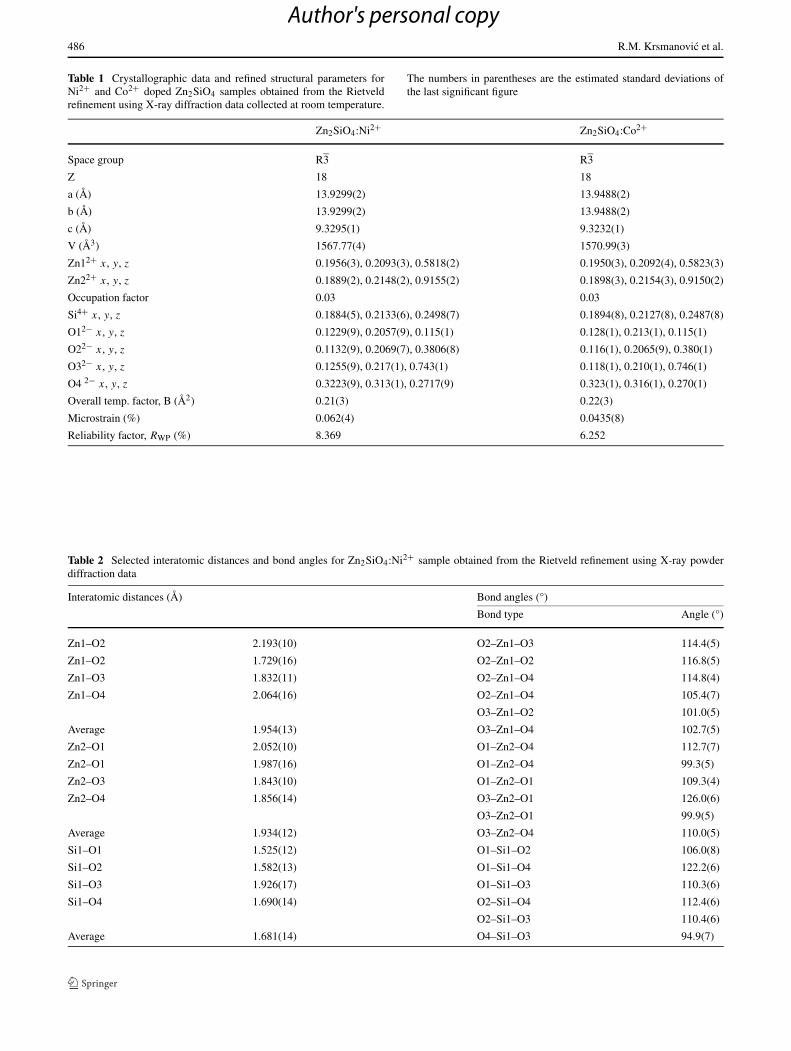
Table 1 Crystallographic data and refined structural parameters forNi2+ and Co2+ doped Zn2SiO4 samples obtained from the Rietveldrefinement using X-ray diffraction data collected at room temperature.
The numbers in parentheses are the estimated standard deviations ofthe last significant figure
Zn2SiO4:Ni2+ Zn2SiO4:Co2+
Space group R3 R3
Z 18 18
a (Å) 13.9299(2) 13.9488(2)
b (Å) 13.9299(2) 13.9488(2)
c (Å) 9.3295(1) 9.3232(1)
V (Å3) 1567.77(4) 1570.99(3)
Zn12+ x, y, z 0.1956(3), 0.2093(3), 0.5818(2) 0.1950(3), 0.2092(4), 0.5823(3)
Zn22+ x, y, z 0.1889(2), 0.2148(2), 0.9155(2) 0.1898(3), 0.2154(3), 0.9150(2)
Occupation factor 0.03 0.03
Si4+ x, y, z 0.1884(5), 0.2133(6), 0.2498(7) 0.1894(8), 0.2127(8), 0.2487(8)
O12− x, y, z 0.1229(9), 0.2057(9), 0.115(1) 0.128(1), 0.213(1), 0.115(1)
O22− x, y, z 0.1132(9), 0.2069(7), 0.3806(8) 0.116(1), 0.2065(9), 0.380(1)
O32− x, y, z 0.1255(9), 0.217(1), 0.743(1) 0.118(1), 0.210(1), 0.746(1)
O4 2− x, y, z 0.3223(9), 0.313(1), 0.2717(9) 0.323(1), 0.316(1), 0.270(1)
Overall temp. factor, B (Å2) 0.21(3) 0.22(3)
Microstrain (%) 0.062(4) 0.0435(8)
Reliability factor, RWP (%) 8.369 6.252
Table 2 Selected interatomic distances and bond angles for Zn2SiO4:Ni2+ sample obtained from the Rietveld refinement using X-ray powderdiffraction data
Interatomic distances (Å) Bond angles (°)
Bond type Angle (°)
Zn1–O2 2.193(10) O2–Zn1–O3 114.4(5)
Zn1–O2 1.729(16) O2–Zn1–O2 116.8(5)
Zn1–O3 1.832(11) O2–Zn1–O4 114.8(4)
Zn1–O4 2.064(16) O2–Zn1–O4 105.4(7)
O3–Zn1–O2 101.0(5)
Average 1.954(13) O3–Zn1–O4 102.7(5)
Zn2–O1 2.052(10) O1–Zn2–O4 112.7(7)
Zn2–O1 1.987(16) O1–Zn2–O4 99.3(5)
Zn2–O3 1.843(10) O1–Zn2–O1 109.3(4)
Zn2–O4 1.856(14) O3–Zn2–O1 126.0(6)
O3–Zn2–O1 99.9(5)
Average 1.934(12) O3–Zn2–O4 110.0(5)
Si1–O1 1.525(12) O1–Si1–O2 106.0(8)
Si1–O2 1.582(13) O1–Si1–O4 122.2(6)
Si1–O3 1.926(17) O1–Si1–O3 110.3(6)
Si1–O4 1.690(14) O2–Si1–O4 112.4(6)
O2–Si1–O3 110.4(6)
Average 1.681(14) O4–Si1–O3 94.9(7)
Author's personal copy

Structural, spectroscopic and crystal field analyses of Ni2+ and Co2+ doped Zn2SiO4 powders 487
Table 3 Selected interatomic distances and bond angles for Zn2SiO4:Co2+ sample obtained from the Rietveld refinement using X-ray powderdiffraction data
Interatomic distances (Å) Bond angles (°)
Bond type Angle (°)
Zn1–O2 2.176(10) O2–Zn1–O3 114.9(5)
Zn1–O2 1.775(14) O2–Zn1–O2 115.9(5)
Zn1–O3 1.865(11) O2–Zn1–O4 113.9(4)
Zn1–O4 2.024(14) O2–Zn1–O4 105.3(6)
O3–Zn1–O2 99.4(5)
Average 1.960(12) O3–Zn1–O4 106.0(5)
Zn2–O1 2.046(10) O1–Zn2–O1 111.7(4)
Zn2–O1 2.019(14) O1–Zn2–O4 97.9(4)
Zn2–O3 1.849(10) O1–Zn2–O4 109.2(6)
Zn2–O4 1.867(13) O3–Zn2–O1 124.2(5)
O3–Zn2–O1 99.9(4)
Average 1.945(12) O3–Zn2–O4 113.9(5)
Si1–O1 1.516(13) O1–Si1–O2 106.7(9)
Si1–O2 1.571(14) O1–Si1–O4 118.1(7)
Si1–O3 1.848(17) O1–Si1–O3 112.0(7)
Si1–O4 1.704(15) O2–Si1–O4 111.2(7)
O2–Si1–O3 108.8(7)
Average 1.660(15) O4–Si1–O3 99.8(8)
bonds and determined corresponding coordination polyhe-drons. Tables 2 and 3 present the selected atomic distancesand bond angles for Ni2+ and Co2+ doped samples, respec-tively, while the geometry of zinc coordination tetrahedronsis illustrated in Fig. 2. According to the bond lengths valueswe can conclude that the Zn2 tetrahedra are less deformedthan the Zn1 ones. This fact as well as the smaller ionic ra-dius in tetrahedron environment of the Co2+(0.58 Å) andNi2+(0.55 Å) dopants than Zn2+(0.60 Å) ions [27], couldbe the main reason for the observed preferential occupancyof Zn2 sites.
3.2 Diffuse reflectance spectroscopy for Ni2+ and Co2+doped Zn2SiO4 powders
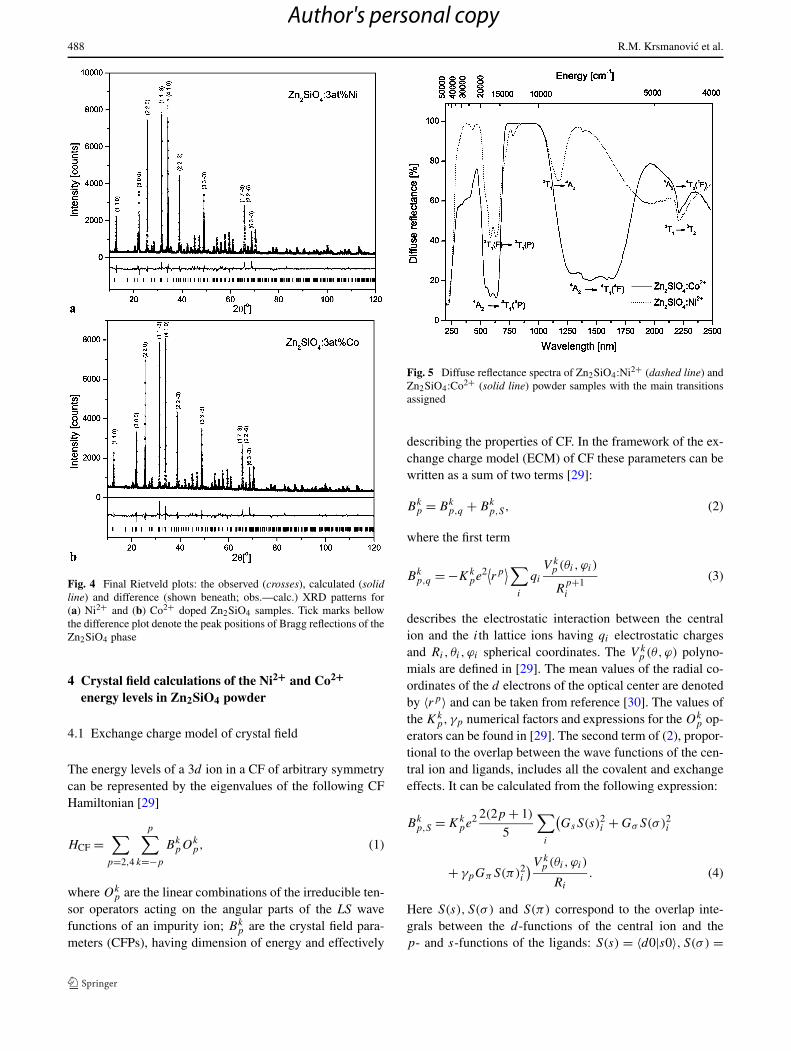
The diffuse reflectance spectra of studied samples, measuredin the spectral region between 4000 and 50000 cm−1, arepresented in Fig. 5. In this spectral range Ni2+(3d8 configu-ration) and Co2+(3d7 configuration) ions in tetrahedral co-ordination have three spin-allowed absorption bands. Two ofthem fall into the infrared region (IR), while one is presentin the visible spectral region [28].
In the experimental reflectance spectrum of Zn2SiO4:Ni2+one IR and one near IR (NIR) band, peaked at about4850 cm−1 and 8500 cm−1, are assigned to the 3T1 → 3T2
and 3T1 → 3A2 transitions, respectively (Fig. 5). The band
system in the visible spectral range, the strongest and themost complex one, is centered at about 17000 cm−1 andcomposed of several components, where the most promi-nent corresponds to the 3T1(F) → 3T1(P) spin-allowed d–dtransition. A shoulder at about 18700 cm-l corresponds tothe transitions to the components of the 3T1(
3P) state, whilea very weak band at about 12800 cm−1, can be assignedto the spin-forbidden transitions 3T1 → 1T2(D), 1E(D). Theweakest band, observed at around 23000 cm−1, is associatedwith the 3T1 → 1T1(
1G) transition. The center positions ofall the absorption bands are reported in Table 5, togetherwith the results of the CF calculations (which will be de-scribed below).
In the Zn2SiO4:Co2+ spectrum three absorption bandsin the NIR and visible region are clearly distinguished(Fig. 5). The first absorption band centered at around 4500cm−1 is assigned to the 4A2 → 4T2(
4F) transition. Thesecond absorption band 4A2 → 4T1(
4F) is more intense,with well pronounced bands, centered at around 6250, 7000and 7700 cm−1. Like in the sample containing nickel, thestrongest absorption occurs in the visible part of the spec-trum. This broad band, corresponding to 4A2 → 4T1(
4P)and centered at around 17100 cm−1, has three overlappingcomponents positioned at 15773, 17123 and 18315 cm−1.The spectral positions of all the absorption bands for thecobalt doped sample are included into Table 6 and comparedwith the calculated values.
Author's personal copy
488 R.M. Krsmanovic et al.
Fig. 4 Final Rietveld plots: the observed (crosses), calculated (solidline) and difference (shown beneath; obs.—calc.) XRD patterns for(a) Ni2+ and (b) Co2+ doped Zn2SiO4 samples. Tick marks bellowthe difference plot denote the peak positions of Bragg reflections of theZn2SiO4 phase
4 Crystal field calculations of the Ni2+ and Co2+energy levels in Zn2SiO4 powder
4.1 Exchange charge model of crystal field
The energy levels of a 3d ion in a CF of arbitrary symmetrycan be represented by the eigenvalues of the following CFHamiltonian [29]
HCF =∑
p=2,4
p∑
k=−p
BkpOk
p, (1)
where Okp are the linear combinations of the irreducible ten-
sor operators acting on the angular parts of the LS wavefunctions of an impurity ion; Bk
p are the crystal field para-meters (CFPs), having dimension of energy and effectively
Fig. 5 Diffuse reflectance spectra of Zn2SiO4:Ni2+ (dashed line) andZn2SiO4:Co2+ (solid line) powder samples with the main transitionsassigned
describing the properties of CF. In the framework of the ex-change charge model (ECM) of CF these parameters can bewritten as a sum of two terms [29]:
Bkp = Bk
p,q + Bkp,S, (2)
where the first term
Bkp,q = −Kk
pe2⟨rp⟩∑
i
qi
V kp (θi, ϕi)
Rp+1i
(3)
describes the electrostatic interaction between the centralion and the ith lattice ions having qi electrostatic chargesand Ri, θi, ϕi spherical coordinates. The V k
p (θ,ϕ) polyno-mials are defined in [29]. The mean values of the radial co-ordinates of the d electrons of the optical center are denotedby 〈rp〉 and can be taken from reference [30]. The values ofthe Kk
p,γp numerical factors and expressions for the Okp op-
erators can be found in [29]. The second term of (2), propor-tional to the overlap between the wave functions of the cen-tral ion and ligands, includes all the covalent and exchangeeffects. It can be calculated from the following expression:
Bkp,S = Kk
pe2 2(2p + 1)
5
∑
i
(GsS(s)2
i + Gσ S(σ)2i
+ γpGπS(π)2i
)V kp (θi, ϕi)
Ri
. (4)
Here S(s), S(σ ) and S(π) correspond to the overlap inte-grals between the d-functions of the central ion and thep- and s-functions of the ligands: S(s) = 〈d0|s0〉, S(σ ) =
Author's personal copy
Structural, spectroscopic and crystal field analyses of Ni2+ and Co2+ doped Zn2SiO4 powders 489
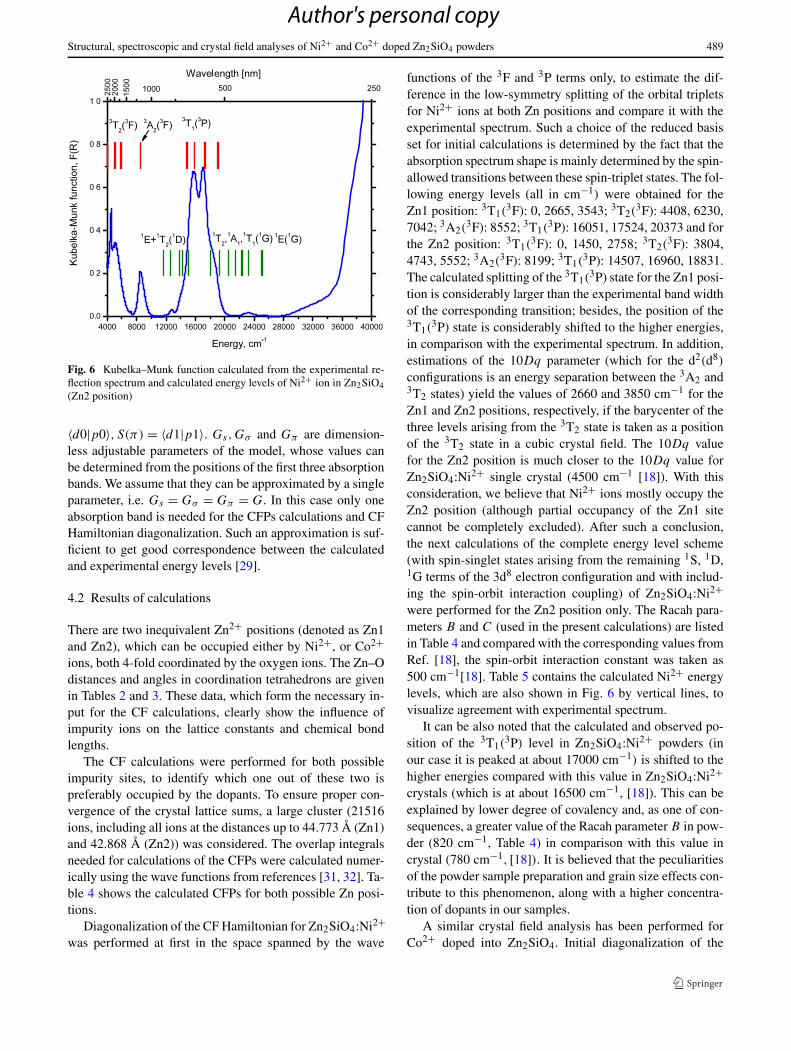
Fig. 6 Kubelka–Munk function calculated from the experimental re-flection spectrum and calculated energy levels of Ni2+ ion in Zn2SiO4(Zn2 position)
〈d0|p0〉, S(π) = 〈d1|p1〉. Gs,Gσ and Gπ are dimension-less adjustable parameters of the model, whose values canbe determined from the positions of the first three absorptionbands. We assume that they can be approximated by a singleparameter, i.e. Gs = Gσ = Gπ = G. In this case only oneabsorption band is needed for the CFPs calculations and CFHamiltonian diagonalization. Such an approximation is suf-ficient to get good correspondence between the calculatedand experimental energy levels [29].
4.2 Results of calculations
There are two inequivalent Zn2+ positions (denoted as Zn1and Zn2), which can be occupied either by Ni2+, or Co2+ions, both 4-fold coordinated by the oxygen ions. The Zn–Odistances and angles in coordination tetrahedrons are givenin Tables 2 and 3. These data, which form the necessary in-put for the CF calculations, clearly show the influence ofimpurity ions on the lattice constants and chemical bondlengths.
The CF calculations were performed for both possibleimpurity sites, to identify which one out of these two ispreferably occupied by the dopants. To ensure proper con-vergence of the crystal lattice sums, a large cluster (21516ions, including all ions at the distances up to 44.773 Å (Zn1)and 42.868 Å (Zn2)) was considered. The overlap integralsneeded for calculations of the CFPs were calculated numer-ically using the wave functions from references [31, 32]. Ta-ble 4 shows the calculated CFPs for both possible Zn posi-tions.
Diagonalization of the CF Hamiltonian for Zn2SiO4:Ni2+was performed at first in the space spanned by the wave
functions of the 3F and 3P terms only, to estimate the dif-ference in the low-symmetry splitting of the orbital tripletsfor Ni2+ ions at both Zn positions and compare it with theexperimental spectrum. Such a choice of the reduced basisset for initial calculations is determined by the fact that theabsorption spectrum shape is mainly determined by the spin-allowed transitions between these spin-triplet states. The fol-lowing energy levels (all in cm−1) were obtained for theZn1 position: 3T1(
3F): 0, 2665, 3543; 3T2(3F): 4408, 6230,
7042; 3A2(3F): 8552; 3T1(
3P): 16051, 17524, 20373 and forthe Zn2 position: 3T1(
3F): 0, 1450, 2758; 3T2(3F): 3804,
4743, 5552; 3A2(3F): 8199; 3T1(
3P): 14507, 16960, 18831.The calculated splitting of the 3T1(
3P) state for the Zn1 posi-tion is considerably larger than the experimental band widthof the corresponding transition; besides, the position of the3T1(
3P) state is considerably shifted to the higher energies,in comparison with the experimental spectrum. In addition,estimations of the 10Dq parameter (which for the d2(d8)
configurations is an energy separation between the 3A2 and3T2 states) yield the values of 2660 and 3850 cm−1 for theZn1 and Zn2 positions, respectively, if the barycenter of thethree levels arising from the 3T2 state is taken as a positionof the 3T2 state in a cubic crystal field. The 10Dq valuefor the Zn2 position is much closer to the 10Dq value forZn2SiO4:Ni2+ single crystal (4500 cm−1 [18]). With thisconsideration, we believe that Ni2+ ions mostly occupy theZn2 position (although partial occupancy of the Zn1 sitecannot be completely excluded). After such a conclusion,the next calculations of the complete energy level scheme(with spin-singlet states arising from the remaining 1S, 1D,1G terms of the 3d8 electron configuration and with includ-ing the spin-orbit interaction coupling) of Zn2SiO4:Ni2+were performed for the Zn2 position only. The Racah para-meters B and C (used in the present calculations) are listedin Table 4 and compared with the corresponding values fromRef. [18], the spin-orbit interaction constant was taken as500 cm−1[18]. Table 5 contains the calculated Ni2+ energylevels, which are also shown in Fig. 6 by vertical lines, tovisualize agreement with experimental spectrum.
It can be also noted that the calculated and observed po-sition of the 3T1(
3P) level in Zn2SiO4:Ni2+ powders (inour case it is peaked at about 17000 cm−1) is shifted to thehigher energies compared with this value in Zn2SiO4:Ni2+crystals (which is at about 16500 cm−1, [18]). This can beexplained by lower degree of covalency and, as one of con-sequences, a greater value of the Racah parameter B in pow-der (820 cm−1, Table 4) in comparison with this value incrystal (780 cm−1, [18]). It is believed that the peculiaritiesof the powder sample preparation and grain size effects con-tribute to this phenomenon, along with a higher concentra-tion of dopants in our samples.
A similar crystal field analysis has been performed forCo2+ doped into Zn2SiO4. Initial diagonalization of the
Author's personal copy

490 R.M. Krsmanovic et al.
Table 4 Crystal field parameters (in cm−1) in Stevens normalization for both considered systems
Zn2SiO4:Ni2+ Zn2SiO4:Co2+
Zn1 Zn2 Zn1 Zn2
B−22 4196.9 81.5 4357.2 1816.6
B−12 3484.1 −7409.4 5057.5 −1414.5
B02 −906.9 −1203.8 −1418.5 −1665.7
B12 7162.7 5519.3 7100.4 −10087.8
B22 −2922.6 2339.3 −1850.6 −2010.3
B−44 −3646.4 5058.0 −3367.1 −5121.9
B−34 −1964.8 2333.3 −1678.7 2792.9
B−24 −2455.5 2595.7 −1972.9 −4154.7
B−14 −4118.5 1075.9 −3614.9 571.2
B04 −74.1 367.2 −64.1 367.3
B14 336.5 −1628.6 407.2 1987.2
B24 −1834.6 −2579.2 −1738.3 −1091.3
B34 −14844.9 −2069.1 −13693.6 −1955.7
B44 1550.3 1993.0 1733.2 3510.1
G (ECMparameter)
2.20 1.95 2.85 3.25
B 820 (780 [18]) 790 (740 [17])
C 3520 (3630 [18]) 3500 (3330 [17])
10Dq2660 3850 2120 3760
(4500 [18]) (4500 [18]) (4000 [17]) (4000 [17])
Table 5 Calculated and observed energy levels (in cm−1) of Ni2+ in Zn2SiO4 (Zn2 position)
Energy levels (Td groupnotation and “parent” LSterm)
Calculated Experimental
3T1(3F) 0, 70, 84, 1522, 1553, 1719, 2910, 2942, 3011
3T2(3F) 3913, 3987, 4043, 4963, 5046, 5142, 5782, 5793, 5877 4490, 5180
3A2(3F) 8511, 8534, 8550 8510
1E + 1T2(1E) 11612, 12568, 13851, 14239, 15101 12800
3T1(3P) 14779, 14938, 15839, 17226, 17257, 17338, 18955, 19113, 19133 15848, 17123, 18727
1T2(1G) + 1A1(
1G) 18119, 19341, 20463, 21436
1T1(1G) 22257, 22463, 23290 ∼ 23000
1E (1G) 24987, 251301E (1S) 47761
CF Hamiltonian for Co2+ with CFPs from Table 4 in thespace spanned by the wave functions of the 4F and 4P termsonly yielded the following energy level schemes (in cm−1)
for both available Zn positions: 4A2(4F)—0; 4T2(
4F)—763, 2029, 3580; 4T1(
4F)—4061, 5169, 7823; 4T1(4P)—
12559, 16955, 18020 for the Zn1 position and 4A2(4F)—0;
4T2(4F)—2915, 3498, 4860; 4T1(
4F)—6212, 7394, 8268;4T1(
4P)—15614, 17052, 20371 for the Zn2 position. Likein the previous case of Zn2SiO4:Ni2+, this reduced basis set
consisting of the spin-quartet states only was used to per-form an initial analysis of the absorption spectrum and de-cide which Zn position is occupied by the Co2+ ions. Theoverall splitting of the orbital triplets is considerably greaterfor the Zn1 position, which can be explained by larger de-viations of the [CoO4]6− complex from the ideal tetrahe-dron in this case. An analogous estimation of the 10Dq pa-rameter (which for the d3(d7) configurations is an energyseparation between the 4A2 and 4T2 states) gives the values
Author's personal copy
Structural, spectroscopic and crystal field analyses of Ni2+ and Co2+ doped Zn2SiO4 powders 491
Table 6 Calculated and observed energy levels (in cm−1) of Co2+ in Zn2SiO4(Zn2 position). Each level remains doubly degenerated
Energy levels (Td groupnotation and “parent” LSterm)
Calculated Experimental
4A2(4F) 0, 37
4T2(4F) 2954, 3014, 3500, 3598, 4904, 5028 ∼ 4000
4T1(4F) 6290, 6354, 7388, 7569, 8471, 8567 6250, 7000, 7700
2E + 2T2(2G) 13192, 14479, 15233, 16091, 17041
4T1(4P) 15593, 15564, 15897, 17104, 20371, 20470 15773, 17123, 18315
Very dense group ofspin-doublet statesstrongly mixed witheach other; assignmentambiguous
17164, 17926, 18401, 18686, 19448,19731, 20798, 21182, 21632, 22655,22898, 23128, 23440, 23969, 24313,24615, 25225, 25831, 26142, 26690,26995, 28127, 28700, . . .
From 24000 (weakabsorption) and above
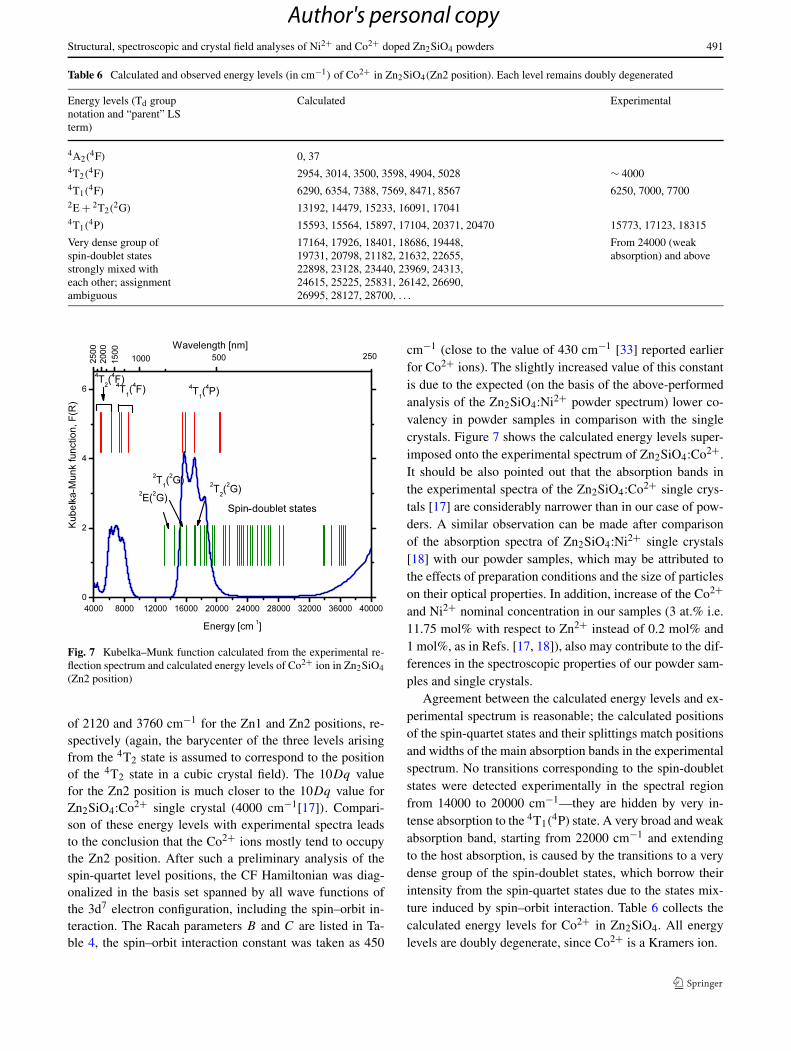
Fig. 7 Kubelka–Munk function calculated from the experimental re-flection spectrum and calculated energy levels of Co2+ ion in Zn2SiO4(Zn2 position)
of 2120 and 3760 cm−1 for the Zn1 and Zn2 positions, re-spectively (again, the barycenter of the three levels arisingfrom the 4T2 state is assumed to correspond to the positionof the 4T2 state in a cubic crystal field). The 10Dq valuefor the Zn2 position is much closer to the 10Dq value forZn2SiO4:Co2+ single crystal (4000 cm−1[17]). Compari-son of these energy levels with experimental spectra leadsto the conclusion that the Co2+ ions mostly tend to occupythe Zn2 position. After such a preliminary analysis of thespin-quartet level positions, the CF Hamiltonian was diag-onalized in the basis set spanned by all wave functions ofthe 3d7 electron configuration, including the spin–orbit in-teraction. The Racah parameters B and C are listed in Ta-ble 4, the spin–orbit interaction constant was taken as 450
cm−1 (close to the value of 430 cm−1 [33] reported earlierfor Co2+ ions). The slightly increased value of this constantis due to the expected (on the basis of the above-performedanalysis of the Zn2SiO4:Ni2+ powder spectrum) lower co-valency in powder samples in comparison with the singlecrystals. Figure 7 shows the calculated energy levels super-imposed onto the experimental spectrum of Zn2SiO4:Co2+.It should be also pointed out that the absorption bands inthe experimental spectra of the Zn2SiO4:Co2+ single crys-tals [17] are considerably narrower than in our case of pow-ders. A similar observation can be made after comparisonof the absorption spectra of Zn2SiO4:Ni2+ single crystals[18] with our powder samples, which may be attributed tothe effects of preparation conditions and the size of particleson their optical properties. In addition, increase of the Co2+and Ni2+ nominal concentration in our samples (3 at.% i.e.11.75 mol% with respect to Zn2+ instead of 0.2 mol% and1 mol%, as in Refs. [17, 18]), also may contribute to the dif-ferences in the spectroscopic properties of our powder sam-ples and single crystals.
Agreement between the calculated energy levels and ex-perimental spectrum is reasonable; the calculated positionsof the spin-quartet states and their splittings match positionsand widths of the main absorption bands in the experimentalspectrum. No transitions corresponding to the spin-doubletstates were detected experimentally in the spectral regionfrom 14000 to 20000 cm−1—they are hidden by very in-tense absorption to the 4T1(
4P) state. A very broad and weakabsorption band, starting from 22000 cm−1 and extendingto the host absorption, is caused by the transitions to a verydense group of the spin-doublet states, which borrow theirintensity from the spin-quartet states due to the states mix-ture induced by spin–orbit interaction. Table 6 collects thecalculated energy levels for Co2+ in Zn2SiO4. All energylevels are doubly degenerate, since Co2+ is a Kramers ion.
Author's personal copy
492 R.M. Krsmanovic et al.
5 Conclusions
In the present work we report on preparation and detailedstructural, spectroscopic and CF studies of Zn2SiO4 pow-ders doped with Ni2+ and Co2+ ions. For the sake of con-sistency of the performed CF analysis, the structure of theprepared samples was analyzed using the X-ray diffractiontechnique and the Rietveld refinement method. The refinedstructural data were used as an input for the CF calcula-tions performed in the framework of the exchange chargemodel of crystal field. It is essential that no apriori as-sumption regarding the symmetry of the impurity ion’s sitewas made, and all calculations of the crystal field para-meters were performed for actual refined crystal structuredata. The energy levels of both impurity ions were calcu-lated and compared with experimental absorption spectra;good agreement between the theoretical and experimentalresults was demonstrated. By two independent methods—X-ray diffraction supported by the Rietveld analysis, and CFcalculations—it was shown that both impurity ions tend tooccupy the Zn2 position. From the experimental reflectancespectra and CF analysis it was also concluded that the co-valent effects in the powder samples are somewhat weakerthan in the bulk crystals. The presented combination of thestructural, spectroscopic and CF analyses provides detailedinformation about the studied samples and can be readilyapplied to other similar systems as well.
Acknowledgements M.G. Brik acknowledges financial supportfrom Estonian Science Foundation (grants nos. 7456, JD69, 6999 and6660). Authors from the Vinca Institute acknowledge the financial sup-port of the Ministry of Science of the Republic of Serbia (Project142066). R. Krsmanovic also gratefully acknowledges the NATO fi-nancial support (grant reference number CBP.EAP.RIG.983373).
References
1. M. Takesue, H. Hayashi, R.L. Smith, Prog. Cryst. Growth Charact.55, 98 (2009)
2. H.X. Zhang, S. Buddhudu, C.H. Kam, Y. Zhou, Y.L. Lam, K.S.Wong, B.S. Ooi, S.L. Ng, W.X. Que, Mater. Chem. Phys. 68, 31(2001)
3. J. Lin, D.U. Sänger, M. Mennig, K. Bärner, Thin Solid Films 360,39 (2000)
4. Q.Y. Zhang, K. Pita, C.H. Kam, J. Phys. Chem. Solids 64, 333(2003)
5. R. Krsmanovic, Ž. Antic, M. Marinovic-Cincovic, M.D.Dramicanin, J. Optoelectron. Adv. Mater. 1, 37 (2009)
6. R. Krsmanovic, Ž. Antic, I. Zekovic, M.D. Dramicanin, J. AlloysCompd. 480, 494 (2009)
7. S.R. Lukic, D.M. Petrovic, Lj. Ðacanin, M. Marinovic-Cincovic,Ž. Antic, R. Krsmanovic, M.D. Dramicanin, J. Optoelectron. Adv.Mater. 10, 2748 (2008)
8. Y. Kotera, J. Jpn. Soc. Color. Mater. 58, 80 (1985)9. X. Ouyang, A.H. Kitai, T. Xiao, J. Appl. Phys. 79, 3229 (1996)
10. J. Lin, D.U. Sänger, M. Menning, K. Bärner, Mater. Sci. Eng. B,Solid-State Mater. Adv. Technol. 64, 73 (1999)
11. Z. Strand, Glass Science and Technology (Elsevier, Amsterdam,1986)
12. J. Alarcon, P. Escribano, R.M.A. Marin, Br. Ceram., Trans. J. 84,170 (1985)
13. E. Rosello, A. Borrio, M. Guillem, M. Cormen, Br. Ceram., Trans.J. 84, 175 (1985)
14. A. Forés, M. Llusar, J.A. Badenes, J. Calbo, M.A. Tena, G. Mon-rós, Green Chem. 2, 93 (2000)
15. M. Llusar, A. Forés, J.A. Badenes, J. Calbo, M.A. Tena, G. Mon-rós, J. Eur. Ceram. Soc. 21, 1121 (2001)
16. G.T. Chandrappa, S. Ghosh, K.C. Patil, J. Mater. Synth. Process.7, 273 (1999)
17. T.C. Brunold, H.U. Güdel, E. Cavalli, Chem. Phys. Lett. 252, 112(1996)
18. T.C. Brunold, H.U. Güdel, E. Cavalli, Chem. Phys. Lett. 268, 413(1997)
19. S.R. Lukic, D.M. Petrovic, M.D. Dramicanin, M. Mitric, Lj.Ðacanin, Scr. Mater. 58, 655 (2008)
20. H.M. Rietveld, J. Appl. Crystallogr. 2, 65 (1969)21. R.W. Cheary, A. Coelho, J. Appl. Crystallogr. 25, 109 (1992)22. K.H. Klaska, J.C. Eck, D. Pohl, Acta Crystallogr. B 34, 3324
(1978)23. T.S. Ahmadi, M. Haase, H. Weller, Mater. Res. Bull. 35, 1869
(2000)24. Q.H. Li, S. Komarneni, R. Roy, J. Mater. Sci. 30, 2358 (1995)25. M.A. Simonov, P.A. Sandomirskii, Y.K. Egorov-Tismenko, N.V.
Belov, Dokl. Akad. Nauk SSSR 237, 581 (1977)26. P. Hartmann, Zentralblatt fuer Mineralogie T. I. Z. Kristallogr.
187, 139 (1989)27. R.D. Shannon, Acta Crystallogr. A 32, 751 (1976)28. G. Blasse, B.C. Grabmaier, Luminescent Materials (Springer,
Berlin, 1994)29. B.Z. Malkin, in Spectroscopy of Solids Containing Rare-Earth
Ions, ed. by A.A. Kaplyanskii, B.M. Macfarlane (Elsevier, Am-sterdam, 1987), pp. 33–50
30. A.G. Abragam, B. Bleaney, Electron Paramagnetic Resonance ofTransition Ions (Clarendon, Oxford, 1970)
31. E. Clementi, C. Roetti, At. Data Nucl. Data Tables 14, 177 (1974)32. M.V. Eremin, in Spectroscopy of Laser Crystals, ed. by A.A.
Kaplyanskii (Nauka, Leningrad, 1989), p. 39 (in Russian)33. P. Koidl, Phys. Rev. B 15, 2493 (1977)
Author's personal copy


![Diffusion of 18 elements implanted into thermally grown SiO[sub 2]](https://static.fdokumen.com/doc/165x107/6335afedcd4bf2402c0b3112/diffusion-of-18-elements-implanted-into-thermally-grown-siosub-2.jpg)


![Resonant Raman effect enhanced by surface plasmon excitation of CdSe nanocrystals embedded in thin SiO[sub 2] films](https://static.fdokumen.com/doc/165x107/634518516cfb3d40640985a1/resonant-raman-effect-enhanced-by-surface-plasmon-excitation-of-cdse-nanocrystals.jpg)