Irreversible nanogel formation in surfactant solutions by microporous flow
Upload
independentCategory
view
5download
0
This article appeared in a journal published by Elsevier. The attachedcopy is furnished to the author for internal non-commercial researchand education use, including for instruction at the authors institution
and sharing with colleagues.
Other uses, including reproduction and distribution, or selling orlicensing copies, or posting to personal, institutional or third party
websites are prohibited.
In most cases authors are permitted to post their version of thearticle (e.g. in Word or Tex form) to their personal website orinstitutional repository. Authors requiring further information
regarding Elsevier’s archiving and manuscript policies areencouraged to visit:
http://www.elsevier.com/copyright

Author's personal copy
Structural originations of irreversible capacity loss from highly lithiatedcopper oxides
Corey T. Love a,n, Wojtek Dmowski b, Michelle D. Johannes a, Karen E. Swider-Lyons a
a U.S. Naval Research Laboratory, Washington, DC 20375-5342, USAb University of Tennessee, 1512 Middle Drive, Knoxville, TN 37996, USA
a r t i c l e i n f o
Article history:
Received 5 April 2011
Received in revised form
1 July 2011
Accepted 6 July 2011Available online 19 July 2011
Keywords:
Lithium-ion battery
Cathode
Li2CuO2
Capacity loss
Pair-distribution function
a b s t r a c t
We use electrochemistry, high-energy X-ray diffraction (XRD) with pair-distribution function analysis
(PDF), and density functional theory (DFT) to study the instabilities of Li2CuO2 at varying state of
charge. Rietveld refinement of XRD patterns revealed phase evolution from pure Li2CuO2 body-centered
orthorhombic (Immm) space group to multiphase compositions after cycling. The PDF showed CuO4
square chains with varying packing during electrochemical cycling. Peaks in the G(r) at the Cu–O
distance for delithiated, LiCuO2, showed CuO4 square chains with reduced ionic radius for Cu in the 3þ
state. At full depth of discharge to 1.5 V, CuO was observed in fractions greater than the initial impurity
level which strongly affects the reversibility of the lithiation reactions contributing to capacity loss. DFT
calculations showed electron removal from Cu and O during delithiation of Li2CuO2.
Published by Elsevier Inc.
1. Introduction
Charge storage in secondary lithium-ion battery (LIB) cathodematerials is a critical technology to the development of high-energy power sources for electric and hybrid vehicles; howeverthere are relatively few practical materials. The range of commer-cially viable cathode compositions for LIBs must be broadened tomarket cost-competitive electric drive vehicles. To meet futureperformance requirements, cathodes must have high lithiumcapacity over thousands of charge and discharge cycles whilebeing safe, inexpensive, and environmentally benign with theability to be recycled. Lithiated copper oxides offer many envir-onmental and cost-savings benefits over cobalt-based chemis-tries. Copper is an abundant relatively inexpensive transitionmetal with lower toxicity than cobalt and nickel [1]; howeverthe over-lithiated copper oxides, Li2CuO2 and Li3Cu2O4, arelimited by poor capacity retention after a high initial charge cycle[1–4]. High initial charge capacity of Li2CuO2 is based upon anorthorhombic body-centered, Immm, structure which providesa large number of lithium sites [5]. Li2CuO2 can theoreticallyde-intercalate up to 2.0 Liþ per unit formula, which far exceedsthe practical limit of lithium ions intercalated per unit formula bycommercial battery materials, 0.5 Liþ for LiCoO2 and 1.0 Liþ forLiFePO4. Poor capacity retention during the lithium extraction
reaction limits the application of Li2CuO2 as active cathodematerials, however Li2CuO2 has been successfully explored as asacrificial additive to allow stable anode solid electrolyte interface(SEI) formation during an initial cycle at high states of charge [4].
While theoretical evaluation of Li2CuO2 indicates a high Liþ
capacity, its practical evaluation shows that the high specificcapacity is only achieved upon the initial charge [6,7]. Severalauthors have commented on structural distortions associatedwith the lithiation and de-lithiation of Li2CuO2 [2–4]. The loss ofcapacity has been attributed to both structural transformationsand chemical side reactions where the larger orthorhombicstructure collapses into a denser-packed layered structure duringdelithiation [6]. First principles computational efforts were notable to identify a suitable 4-fold coordination transition metal(Cu, Pt, Fe) to stabilize iso-structural Li2NiO2 in the Immm
structure upon delithiation [6]. Experimental work by Imanishiet al. showed the reversibility and capacity of Li2CuO2 is improvedwhen nickel is substituted for copper, making a Li2CuO2–Li2NiO2
solid solution [5]. Calculation results indicated that the Immm
structure might be stabilized by Al and Ga and other transitionmetal dopants, however an improvement could not be realizedexperimentally [7].
Lithium removal from copper oxide electrodes upon chargingproceeds with irreversible decomposition according to [2,4]
Li2CuO2-LiCuO2þLiþþe� (1)
2LiCuO2-2Liþþ2e�þ2CuOþO2 (2)
Contents lists available at ScienceDirect
journal homepage: www.elsevier.com/locate/jssc
Journal of Solid State Chemistry
0022-4596/$ - see front matter Published by Elsevier Inc.
doi:10.1016/j.jssc.2011.07.007
n Corresponding author. Fax: þ1 202 404 8119.
E-mail address: [email protected] (C.T. Love).
Journal of Solid State Chemistry 184 (2011) 2412–2419
Author's personal copy
The decomposition reaction scheme to produce CuO and oxygenis not complete, possibly by the formation of CuO on the surfaceof the particles [8]. Prakash et al. has reported that a two-stepelectrochemical oxidation process is involved in the removal of1.0 Liþ from Li2CuO2 [3] creating Li1.5CuO2 (C2/m) and LiCuO2
(C2/m) phases. The Li2CuO22Li1.5CuO2 transition had high initialcapacity with poor capacity retention while the Li1.5CuO22
LiCuO2 transition had lower initial capacity with good retention.Clearly the structural transformations associated with theLi1.5CuO22Li2�zCuO2 transition are highly detrimental to elec-trochemical reversibility in this system [3], whereas LiCuO22
Li1.5CuO2 transformation was found to be highly reversible. Thestructural stability in the highly lithiated copper oxide system isnot fully understood, such as the lack of the reversibility of theImmm structure, the packing of the CuO4 square chains, electronloss from oxygen bands in trivalent copper oxide compounds,high oxidation state of copper, and even the existence of adisplacement type reactions.
The fundamental understanding of the instabilities in highcapacity Li2CuO2 is critical to enabling the design and discovery offuture materials. We study the instabilities of LixCuO2 at differentstates of charge, as obtained by electrochemical delithiation andlithiation during typical battery charging-discharging to formu-late a broader understanding of the ties between structuraltransformation and capacity loss. The resulting LixCuO2 materialsare probed with high-energy X-ray diffraction (XRD) and analyzedusing the pair-distribution function (PDF) and Rietveld refine-ment, to resolve the phase composition, and local and medium-range structure from 0.1 to 1.5 nm of the materials’ various statesof charge (lithiation). This approach provides information aboutthe distribution of interatomic Cu–Cu, Cu–O and O–O distances,and reflects the local changes occurring during charging anddischarging. The Li2CuO2 Immm structure is modeled with densityfunctional theory (DFT) to gain fundamental understanding ofthe chemistry of this material, and provide insight into materialstability.
2. Materials and methods
2.1. Materials preparation
Li2CuO2 was prepared by solid-state synthesis. Stoichiometricamounts of LiOH �H2O (Alfa Aesar, 98%) and CuO (Alfa Aesar, 97%)were ground individually. Once ground, the powders were mixedtogether, pressed into pellets and calcined in static air at 800 1Cfor 15 h. A 3% mass excess of LiOH �H2O was added to account forlithium loss at high temperature. The resulting pellets wereground in mortar and pestle in air and stored in an argon-filledglove box.
2.2. Electrode fabrication and electrochemical testing
Aluminum current collector foils were etched in 1M KOH,rinsed with DI H2O, and wiped clean with acetone [9]. A slurryof the active material, Li2CuO2, was prepared consisting of:83% Li2CuO2, 4% KS-6 graphite, 2% Super P Li-grade carbon, and4% polyvinylidene fluoride. The PVDF binder was a 5% by weightsolution in 1-methyl-2-pyrrolidone (NMP). After thorough mixing,the slurry was applied to the Al-foils and dried at 120 1C undervacuum for at least 12 h. The mass of active material was main-tained between 30 and 40 mg Li2CuO2 over a 1 in2 surface area.Negative electrodes were assembled from copper foils etched in1 M HNO3, rinsed with DI H2O, and wiped clean with acetone. Theelectrodes were introduced into an Ar-filled glove box. A thin layerof lithium metal was rolled onto the copper foil surface in the glove
box. The positive and negative electrodes were assembled into a‘‘pouch’’ cell construction with a Celgards porous polypropylenemembrane. A small amount of 1 M LiPF6 in 1:1 (v:v) ethylenecarbonate/diethyl carbonate solvent electrolyte was wet onto thesurface of both electrodes before packaging in a tri-foil pouch.
The batteries were charged and discharged using a Maccor2300 battery tester over a voltage range of 1.5–4.2 V against thelithium metal anode at a C/25 rate (�9.8 mA) constant current.Batteries were taken off the charging or discharging cycles atthe voltages given in Table 1. The positive electrode mixtureLixCuO2þelectrode additive (Super P, K-6 graphite, PVDF) wasthen rinsed with diethyl carbonate to remove residual LiPF6
electrolyte salt and scraped off of the aluminum current collectorand dried under vacuum. The cathode mixtures were then heat-sealed in silica tubes before removal from the glove box for ex-situ high-energy XRD analysis.
2.3. Materials characterization
High-energy X-ray diffraction patterns were collected for thecycled LixCuO2 materials at various states of charge (SOC) accord-ing to Table 1. Multiple cells were prepared and reproducibilitywas confirmed. Diffraction patterns were collected for as-pre-pared Li2CuO2 and cycled LixCuO2 materials. Additional baselinemeasurements were performed on the electrode additives (SuperP, K-6 graphite, PVDF) and an empty silica tube. The measure-ments were done at the 11-ID-C and 6-ID-C beamlines at theAdvanced Photon Source (APS) with incident X-ray energy of115 and 100 keV. The experiment was performed with the imageplate detector (MAR-345) placed �30 cm behind the sample. Thissetup allows the pair-distribution function analysis and Rietveldrefinement to be carried out at the same time. In addition, severalsamples were measured with the detector �100 cm behind thesample to carry out high resolution Rietveld. The main advantageof a 2D detector is its ability to cover a large portion of Q-space,thus increasing statistics and decreasing exposure time. Typicallywe accumulated about 6–8 exposures for each data set. The 2Ddetector pattern was integrated over the 3601 azimuth angle toobtain the intensity as a function of the magnitude of thescattering vector Q. The detector calibration was done usingCeO2 and Si NIST powder standards. FIT2D program [10] wasused to correct data for detector geometrical errors due to smallangular misalignments, obliqueness, X-ray beam polarization,dark current and incident monitor counts, and for 2D imagegeneration and file format conversion. The silica tube back-grounds were determined separately and subtracted during dataanalysis.
Table 1Voltage and cycling parameters for electrochemically delithiated Li2CuO2.
Sample Cut-off voltage Current(mA)
Cycles#
Capacity(mA h/g)
Notes
Charge Discharge
A NA NA NA NA NA As-prepared
electrode
B 4.0 – 9.8 1 229 Charge only
C 4.2 – 9.8 1 255 Charge only
D 4.2 2.0 9.8 1 – 1 full cycle
E 4.2 1.5 9.8 1 – 1 full cycle
F 4.2 1.5 9.8 1þ – Ending on
4.2 V charge
G 4.2 1.5 49.0 10 – 10 full cycles
H 4.2 1.5 49.0 10þ – Ending on
4.2 V charge
I 3.3 – 9.8 1 100 Abbreviated
charge
C.T. Love et al. / Journal of Solid State Chemistry 184 (2011) 2412–2419 2413
Author's personal copy
Azimuthally integrated intensities were processed using thepdfgetX2 [11] package to obtain the structure function and thereduced pair-distribution function, G(r). G(r) is obtained fromthe direct Fourier transformation of the total scattering functionincluding Bragg peak and diffuse scattering intensities, as pre-viously described [12] and given in Eq. (3), where scatteringvector Q¼4p sin y/l, and y is the scattering angle and l denoteswavelength of the probe
GðrÞ ¼2
p
Z 10
Q ½SðQ Þ�1�sin ðQrÞ dQ ð3Þ
The diffraction data were analyzed using GSAS [13,14] to verifyphysical phases and crystallographic structures. The PDF datawere fitted to the structures in the real space using pdfgui
software [15].
2.4. Density functional theory
Density functional calculations were done using the Vienna AbInitio Simulation (VASP) [16] program within the ProjectorAugmented Wave PAW formulation [17], using the GeneralizedGradient Approximation (GGA) [18] to the exchange correlationpotential. Both the lattice parameters and internal coordinateswere simultaneously and fully relaxed in the Immm and C2/mstructures. Our results were within 1.8% of the experimentallydetermined structural parameters [5]. To investigate electronwithdrawal during charging, the number of electrons in Li2CuO2
was decreased by one and a uniform positive background(jellium) was added in order to maintain charge neutrality.
3. Results
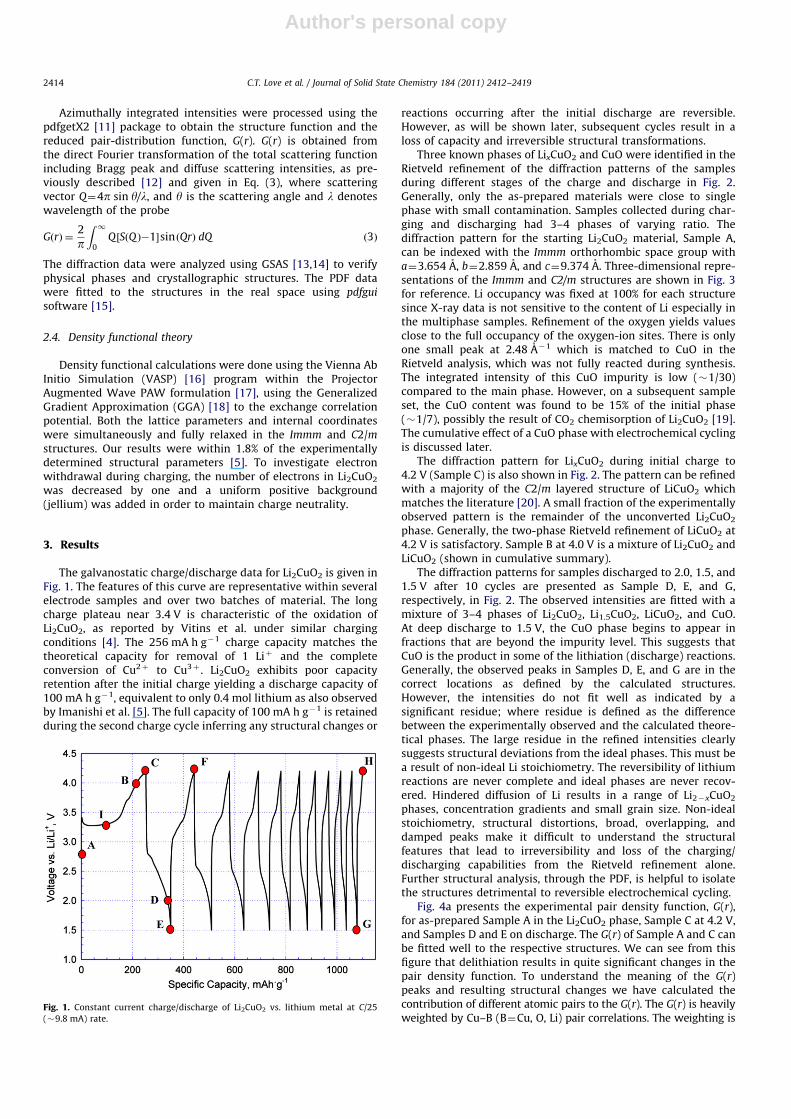
The galvanostatic charge/discharge data for Li2CuO2 is given inFig. 1. The features of this curve are representative within severalelectrode samples and over two batches of material. The longcharge plateau near 3.4 V is characteristic of the oxidation ofLi2CuO2, as reported by Vitins et al. under similar chargingconditions [4]. The 256 mA h g�1 charge capacity matches thetheoretical capacity for removal of 1 Liþ and the completeconversion of Cu2þ to Cu3þ . Li2CuO2 exhibits poor capacityretention after the initial charge yielding a discharge capacity of100 mA h g�1, equivalent to only 0.4 mol lithium as also observedby Imanishi et al. [5]. The full capacity of 100 mA h g�1 is retainedduring the second charge cycle inferring any structural changes or
reactions occurring after the initial discharge are reversible.However, as will be shown later, subsequent cycles result in aloss of capacity and irreversible structural transformations.
Three known phases of LixCuO2 and CuO were identified in theRietveld refinement of the diffraction patterns of the samplesduring different stages of the charge and discharge in Fig. 2.Generally, only the as-prepared materials were close to singlephase with small contamination. Samples collected during char-ging and discharging had 3–4 phases of varying ratio. Thediffraction pattern for the starting Li2CuO2 material, Sample A,can be indexed with the Immm orthorhombic space group witha¼3.654 A, b¼2.859 A, and c¼9.374 A. Three-dimensional repre-sentations of the Immm and C2/m structures are shown in Fig. 3for reference. Li occupancy was fixed at 100% for each structuresince X-ray data is not sensitive to the content of Li especially inthe multiphase samples. Refinement of the oxygen yields valuesclose to the full occupancy of the oxygen-ion sites. There is onlyone small peak at 2.48 A�1 which is matched to CuO in theRietveld analysis, which was not fully reacted during synthesis.The integrated intensity of this CuO impurity is low (�1/30)compared to the main phase. However, on a subsequent sampleset, the CuO content was found to be 15% of the initial phase(�1/7), possibly the result of CO2 chemisorption of Li2CuO2 [19].The cumulative effect of a CuO phase with electrochemical cyclingis discussed later.
The diffraction pattern for LixCuO2 during initial charge to4.2 V (Sample C) is also shown in Fig. 2. The pattern can be refinedwith a majority of the C2/m layered structure of LiCuO2 whichmatches the literature [20]. A small fraction of the experimentallyobserved pattern is the remainder of the unconverted Li2CuO2
phase. Generally, the two-phase Rietveld refinement of LiCuO2 at4.2 V is satisfactory. Sample B at 4.0 V is a mixture of Li2CuO2 andLiCuO2 (shown in cumulative summary).
The diffraction patterns for samples discharged to 2.0, 1.5, and1.5 V after 10 cycles are presented as Sample D, E, and G,respectively, in Fig. 2. The observed intensities are fitted with amixture of 3–4 phases of Li2CuO2, Li1.5CuO2, LiCuO2, and CuO.At deep discharge to 1.5 V, the CuO phase begins to appear infractions that are beyond the impurity level. This suggests thatCuO is the product in some of the lithiation (discharge) reactions.Generally, the observed peaks in Samples D, E, and G are in thecorrect locations as defined by the calculated structures.However, the intensities do not fit well as indicated by asignificant residue; where residue is defined as the differencebetween the experimentally observed and the calculated theore-tical phases. The large residue in the refined intensities clearlysuggests structural deviations from the ideal phases. This must bea result of non-ideal Li stoichiometry. The reversibility of lithiumreactions are never complete and ideal phases are never recov-ered. Hindered diffusion of Li results in a range of Li2�xCuO2
phases, concentration gradients and small grain size. Non-idealstoichiometry, structural distortions, broad, overlapping, anddamped peaks make it difficult to understand the structuralfeatures that lead to irreversibility and loss of the charging/discharging capabilities from the Rietveld refinement alone.Further structural analysis, through the PDF, is helpful to isolatethe structures detrimental to reversible electrochemical cycling.
Fig. 4a presents the experimental pair density function, G(r),for as-prepared Sample A in the Li2CuO2 phase, Sample C at 4.2 V,and Samples D and E on discharge. The G(r) of Sample A and C canbe fitted well to the respective structures. We can see from thisfigure that delithiation results in quite significant changes in thepair density function. To understand the meaning of the G(r)peaks and resulting structural changes we have calculated thecontribution of different atomic pairs to the G(r). The G(r) is heavilyweighted by Cu–B (B¼Cu, O, Li) pair correlations. The weighting is
Fig. 1. Constant current charge/discharge of Li2CuO2 vs. lithium metal at C/25
(�9.8 mA) rate.
C.T. Love et al. / Journal of Solid State Chemistry 184 (2011) 2412–24192414

Author's personal copy
Fig. 2. X-ray diffraction patterns for Li2CuO2 Sample A, as-prepared; Sample C, first charge cycle to 4.2 V; Sample D, first discharge cycle to 2.0 V; Sample E first discharge
cycle to 1.5 V; Sample G, 10th discharge cycle to 1.5 V. Each plot includes the Rietveld fit. The data are plotted as a function of the scattering vector Q (Q¼2p/d, where d is
an inter-planar spacing).
Fig. 3. Three-dimensional representations of (a) Immm structure and (b) the C2/m structure. Copper atoms are represented by red spheres and oxygen green spheres.
Lithium atoms have been removed for clarity. (For interpretation of the references to color in this figure legend, the reader is referred to the web version of this article.)
C.T. Love et al. / Journal of Solid State Chemistry 184 (2011) 2412–2419 2415

Author's personal copy
proportional to cicjZiZj (c and Z are atomic concentration and atomicnumber for element i, j) with Cu having a much larger Z than theother elements. Fig. 5a and b shows the contributions from Cu–Cu,
Cu–O, and Cu–Li pairs to the G(r) calculated for the ideal structurefor easy identification of the composition and distance of the mainpeaks in the G(r). The G(r) for Sample A (blue line in Fig. 4a) shows afirst major peak at 1.94 A. This peak corresponds to the Cu–Obonding in the CuO4 square chains. The observed distance isconsistent with the typical ionic radius of the Cu2þ in the squarecoordination as estimated by Shannon [21]. The peak at 2.86 Arepresents the Cu–Cu nearest distance. The left and right shouldersof this peak correspond to Cu–Li pairs. The right shoulder is morevisible due to the higher number of Li atoms at this distance. TheG(r) pattern is dominated by strong peaks due to Cu–Cu pairs at3.77, 4.67, and 5.22 A.
The G(r) after charging to 4.2 V (Sample C) is show in red inFig. 4a. The fit to G(r) (not shown) confirms the phase transforma-tion from the Immm structure to the C2/m structure of LiCuO2 aspreviously discussed in the Rietveld refinement (Fig. 2c). Theoverall fit of the PDF is in good agreement with the monoclinicstructure. The calculated contributions from different atomicpairs are shown in Fig. 5b. The first peak at 1.87 A in the G(r)indicates the Cu–O distance where the same CuO4 square chaincoordination exists but with a reduction in the ionic radius ofcopper. The decrease in ionic radius reflects a higher oxidationstate of copper upon delithiation as the ionic radius of Cu3þ issmaller than Cu2þ . The next 2 peaks at 2.75 and 3.14 A are theresult of overlapping Cu–Cu, Cu–O, and Cu–Li pairs. However, the
Fig. 4. (a) Atomic pair-distribution function (PDF) illustrating the phase transforma-
tions within the initial charge and discharge cycle of Li2CuO2 from as-prepared
(Sample A); charged to 4.2 V (Sample C); discharged to 2.0 V (Sample D); and fully
discharged to 1.5 V (Sample E). (b) The existence of the distorted LiCuO2 phase after
complete discharge to 1.5 V (Sample E), and the propagation to a more severely
distorted LiCuO2 phase after 10 discharge cycles to 1.5 V (Sample G). The G(r) for the
nearly ideal C2/m LiCuO2 phase with slight CuO impurity (Sample C) is given for
reference. (c) The incomplete structural transition between as-prepared (Sample A)
Immm Li2CuO2 and fully discharged to 1.5 V (Sample E) with the calculated G(r) for the
ideal Immm phase given for reference. (For interpretation of the references to color in
this figure legend, the reader is referred to the web version of this article.)
Fig. 5. (a) The partial atomic PDFs for Li2CuO2 calculated from the ideal Immm
structure and (b) the partial atomic PDFs for LiCuO2 calculated from the ideal C2/m
structure. (For interpretation of the references to color in this figure legend, the
reader is referred to the web version of this article.)
C.T. Love et al. / Journal of Solid State Chemistry 184 (2011) 2412–24192416
Author's personal copy
Cu–Cu pairs contribute most of the weight because of their higher Z.The next 3 peaks observed in the experimental G(r) are mostly dueto Cu–O distances whereas the large peak at 5.05 A is again due toCu–Cu pairs. It is observed from Fig. 5a and b that upon charging(delithiation) there is a significant change in the peaks weightedstrongly by Cu–Cu pairs. This is a consequence of denser packing ofthe CuO4 square chains in the C2/m structure and overall increase inthe physical density.
The PDF data for samples that are discharged to 2.0 and 1.5 V(Samples D and E) are shown in Fig. 4a with black and green lines.Lithiating the structure should initiate the transition from C2/mback to the original Immm structure of the Li2CuO2. However, it isclear from the PDF data in Fig. 4c the transition is nevercompleted. The as-prepared Li2CuO2 (Sample A) is in goodagreement with the ideal calculated phase of G(r) consideringthat Sample A contains electrode diluents such as carbon andpolymer binder. The sample discharged to 1.5 V (Sample E) ismore disordered with smaller G(r) amplitudes where the shoulderat 3.2 A is too strong and the peak at 4.2 A is missing completely.A shift in the first peak towards 1.938 A As well as higher orderpeaks are shifted towards smaller r indicate mixed oxidationstates of Cu. This was already observed in the Rietveld refinement,which indicated appearance of other phases like Li1.5CuO2 andCuO in addition to the Li2CuO2. The Li1.5CuO2 phase is observednear 4.0 V on discharge and is structurally in-between theLi2CuO2 (Immm) and LiCuO2 (C2/m) phases where the packing ofthe CuO4 square chains is higher in the Li1.5CuO2 than in theLi2CuO2 phase. Clearly from the electrochemical data in Fig. 1,discharge to 2.0 V does not fully re-intercalate lithium and leadsto the loss of capacity. Surprisingly, further depth of discharge to1.5 V is not useful for re-intercalation either. Instead of completelithiation to Li2CuO2, discharging to 1.5 V actually reduces thelikelihood of achieving the fully lithiated Li2CuO2 phase. The G(r)of the 1.5 V discharged sample is shown in Fig. 5a (green line). Weexpect the peaks in the G(r) at 5.2 or 4.6 A would be closer to theLi2CuO2 phase (blue line) than Sample D, discharged to 2.0 V(black line); however, this is not observed here. The peaks arelower in intensity and slightly shifted compared to the Li2CuO2
as-prepared material. Similarly, the opposite changes areobserved in the 3 A range. This may be related to the formationof CuO as detected by Rietveld. Further evidence of unusualstructural changes at deep discharges are shown in Fig. 4b.The G(r) of the Sample G, which has been discharged 10 times
to 1.5 V (black line), is shown together with Samples E and C.Unexpectedly, multiple discharge cycles drive the local structurecloser to the PDF characteristic of LiCuO2. The formation of CuOshould be accompanied by oxygen release. PDF results showthe highly ordered loose packing of the CuO4 square chains inthe Immm structure are never recovered after discharge. TheCu–Cu peaks in the G(r) of the discharged samples are lower inmagnitude (therefore broader) and shifted in position indicatingnon-homogeneous distribution of the square chains. To achievethe fully discharged state the structure has to expand to accom-modate lithium. However, re-intercalation of lithium is partiallyblocked by the structural changes. The Cu atoms maintain thesquare coordination however; it is the changes in the packingof the chains that is responsible for reduced Li intercalation.After multiple discharge cycles to 1.5 V no further reduction ofCuO to Cu2O is observed. The electrochemical reduction to Cuþhas been observed previously by Debart et al. within the 1.6–1.3 Vrange [22].
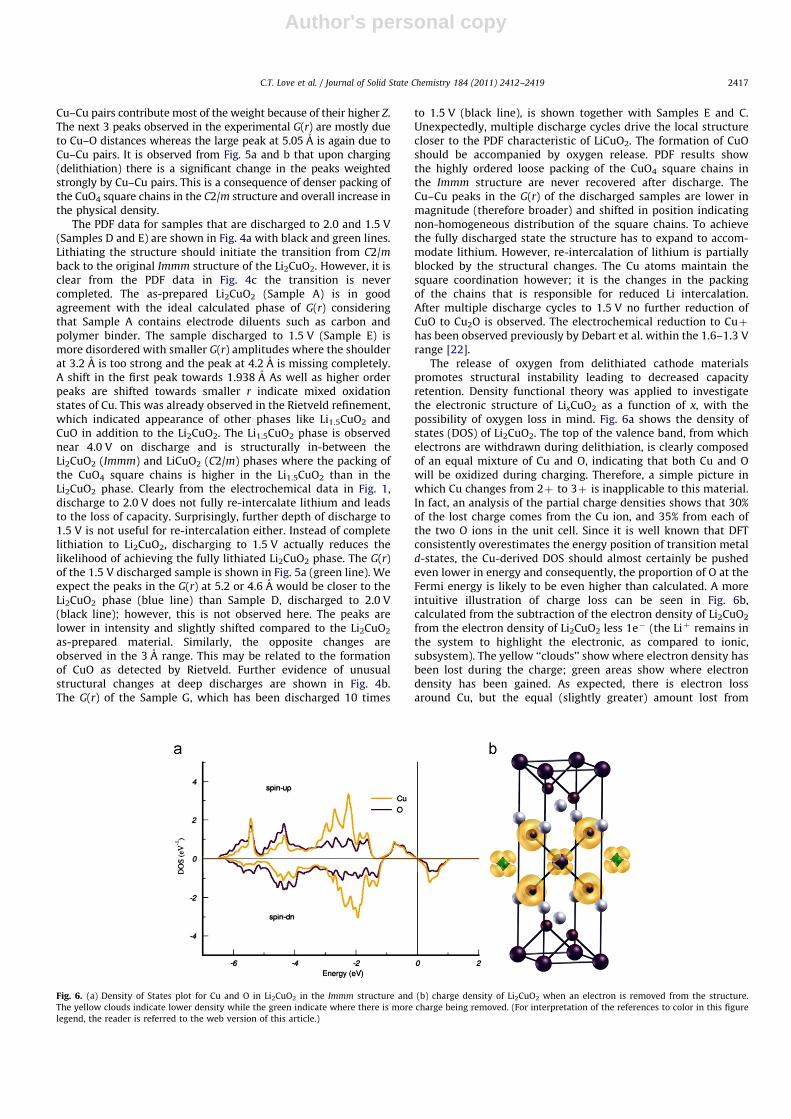
The release of oxygen from delithiated cathode materialspromotes structural instability leading to decreased capacityretention. Density functional theory was applied to investigatethe electronic structure of LixCuO2 as a function of x, with thepossibility of oxygen loss in mind. Fig. 6a shows the density ofstates (DOS) of Li2CuO2. The top of the valence band, from whichelectrons are withdrawn during delithiation, is clearly composedof an equal mixture of Cu and O, indicating that both Cu and Owill be oxidized during charging. Therefore, a simple picture inwhich Cu changes from 2þ to 3þ is inapplicable to this material.In fact, an analysis of the partial charge densities shows that 30%of the lost charge comes from the Cu ion, and 35% from each ofthe two O ions in the unit cell. Since it is well known that DFTconsistently overestimates the energy position of transition metald-states, the Cu-derived DOS should almost certainly be pushedeven lower in energy and consequently, the proportion of O at theFermi energy is likely to be even higher than calculated. A moreintuitive illustration of charge loss can be seen in Fig. 6b,calculated from the subtraction of the electron density of Li2CuO2
from the electron density of Li2CuO2 less 1e� (the Liþ remains inthe system to highlight the electronic, as compared to ionic,subsystem). The yellow ‘‘clouds’’ show where electron density hasbeen lost during the charge; green areas show where electrondensity has been gained. As expected, there is electron lossaround Cu, but the equal (slightly greater) amount lost from
Fig. 6. (a) Density of States plot for Cu and O in Li2CuO2 in the Immm structure and (b) charge density of Li2CuO2 when an electron is removed from the structure.
The yellow clouds indicate lower density while the green indicate where there is more charge being removed. (For interpretation of the references to color in this figure
legend, the reader is referred to the web version of this article.)
C.T. Love et al. / Journal of Solid State Chemistry 184 (2011) 2412–2419 2417
Author's personal copy
O sites is also clear. This charge removal shifts the oxygen ionaway from its preferred 2-valence, making it susceptible torelease from the structure as gas or to transformation to morestable compounds such as CuO. Calculations also show thatLixCuO2 is most stable in the Immm structure at x¼2, but thatC2/m is the lowest energy state at x¼1. As PDF data show, part ofthe material does return to the lower energy Immm symmetryupon re-lithiation, but with significant local disorder. Calculationsindicate that this may be partially attributable to permanentoxygen loss incurred during the charging part of the cycle.
4. Discussion
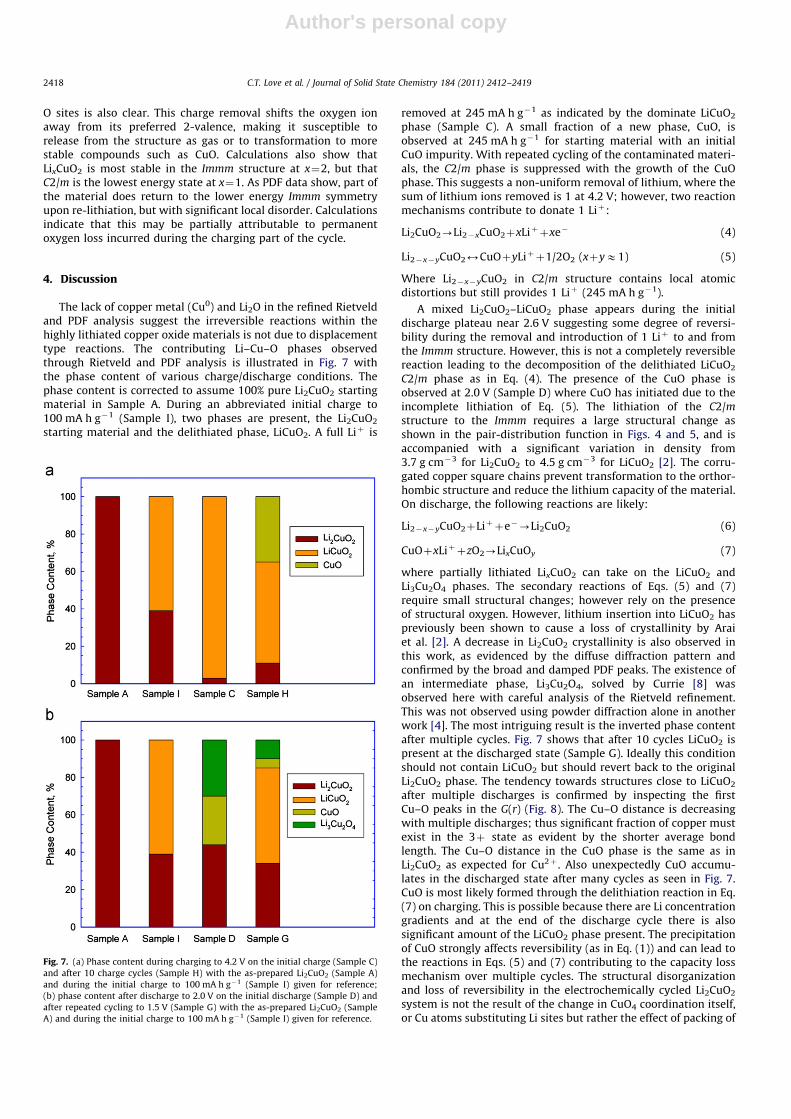
The lack of copper metal (Cu0) and Li2O in the refined Rietveldand PDF analysis suggest the irreversible reactions within thehighly lithiated copper oxide materials is not due to displacementtype reactions. The contributing Li–Cu–O phases observedthrough Rietveld and PDF analysis is illustrated in Fig. 7 withthe phase content of various charge/discharge conditions. Thephase content is corrected to assume 100% pure Li2CuO2 startingmaterial in Sample A. During an abbreviated initial charge to100 mA h g�1 (Sample I), two phases are present, the Li2CuO2
starting material and the delithiated phase, LiCuO2. A full Liþ is
removed at 245 mA h g�1 as indicated by the dominate LiCuO2
phase (Sample C). A small fraction of a new phase, CuO, isobserved at 245 mA h g�1 for starting material with an initialCuO impurity. With repeated cycling of the contaminated materi-als, the C2/m phase is suppressed with the growth of the CuOphase. This suggests a non-uniform removal of lithium, where thesum of lithium ions removed is 1 at 4.2 V; however, two reactionmechanisms contribute to donate 1 Liþ:
Li2CuO2-Li2�xCuO2þxLiþþxe� (4)
Li2�x�yCuO22CuOþyLiþþ1/2O2 (xþyE1) (5)
Where Li2�x�yCuO2 in C2/m structure contains local atomicdistortions but still provides 1 Liþ (245 mA h g�1).
A mixed Li2CuO2–LiCuO2 phase appears during the initialdischarge plateau near 2.6 V suggesting some degree of reversi-bility during the removal and introduction of 1 Liþ to and fromthe Immm structure. However, this is not a completely reversiblereaction leading to the decomposition of the delithiated LiCuO2
C2/m phase as in Eq. (4). The presence of the CuO phase isobserved at 2.0 V (Sample D) where CuO has initiated due to theincomplete lithiation of Eq. (5). The lithiation of the C2/mstructure to the Immm requires a large structural change asshown in the pair-distribution function in Figs. 4 and 5, and isaccompanied with a significant variation in density from3.7 g cm�3 for Li2CuO2 to 4.5 g cm�3 for LiCuO2 [2]. The corru-gated copper square chains prevent transformation to the orthor-hombic structure and reduce the lithium capacity of the material.On discharge, the following reactions are likely:
Li2�x�yCuO2þLiþþe�-Li2CuO2 (6)
CuOþxLiþþzO2-LixCuOy (7)
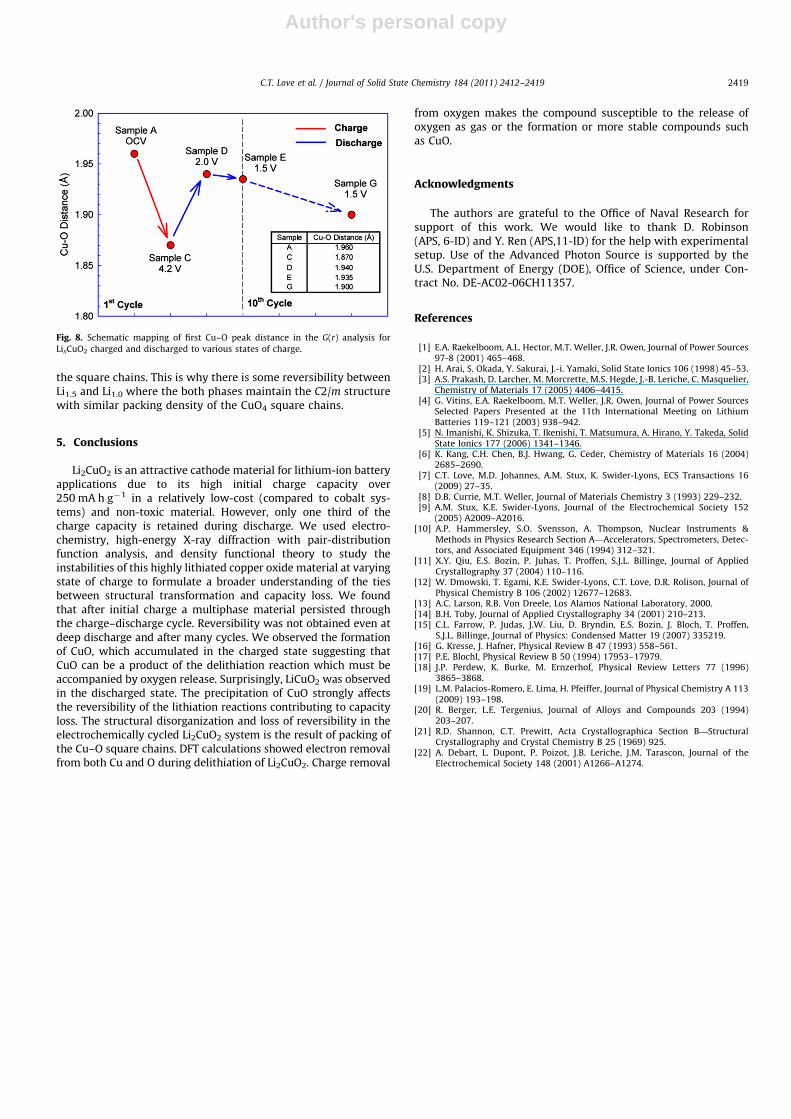
where partially lithiated LixCuO2 can take on the LiCuO2 andLi3Cu2O4 phases. The secondary reactions of Eqs. (5) and (7)require small structural changes; however rely on the presenceof structural oxygen. However, lithium insertion into LiCuO2 haspreviously been shown to cause a loss of crystallinity by Araiet al. [2]. A decrease in Li2CuO2 crystallinity is also observed inthis work, as evidenced by the diffuse diffraction pattern andconfirmed by the broad and damped PDF peaks. The existence ofan intermediate phase, Li3Cu2O4, solved by Currie [8] wasobserved here with careful analysis of the Rietveld refinement.This was not observed using powder diffraction alone in anotherwork [4]. The most intriguing result is the inverted phase contentafter multiple cycles. Fig. 7 shows that after 10 cycles LiCuO2 ispresent at the discharged state (Sample G). Ideally this conditionshould not contain LiCuO2 but should revert back to the originalLi2CuO2 phase. The tendency towards structures close to LiCuO2
after multiple discharges is confirmed by inspecting the firstCu–O peaks in the G(r) (Fig. 8). The Cu–O distance is decreasingwith multiple discharges; thus significant fraction of copper mustexist in the 3þ state as evident by the shorter average bondlength. The Cu–O distance in the CuO phase is the same as inLi2CuO2 as expected for Cu2þ . Also unexpectedly CuO accumu-lates in the discharged state after many cycles as seen in Fig. 7.CuO is most likely formed through the delithiation reaction in Eq.(7) on charging. This is possible because there are Li concentrationgradients and at the end of the discharge cycle there is alsosignificant amount of the LiCuO2 phase present. The precipitationof CuO strongly affects reversibility (as in Eq. (1)) and can lead tothe reactions in Eqs. (5) and (7) contributing to the capacity lossmechanism over multiple cycles. The structural disorganizationand loss of reversibility in the electrochemically cycled Li2CuO2
system is not the result of the change in CuO4 coordination itself,or Cu atoms substituting Li sites but rather the effect of packing of
Fig. 7. (a) Phase content during charging to 4.2 V on the initial charge (Sample C)
and after 10 charge cycles (Sample H) with the as-prepared Li2CuO2 (Sample A)
and during the initial charge to 100 mA h g�1 (Sample I) given for reference;
(b) phase content after discharge to 2.0 V on the initial discharge (Sample D) and
after repeated cycling to 1.5 V (Sample G) with the as-prepared Li2CuO2 (Sample
A) and during the initial charge to 100 mA h g�1 (Sample I) given for reference.
C.T. Love et al. / Journal of Solid State Chemistry 184 (2011) 2412–24192418
Author's personal copy
the square chains. This is why there is some reversibility betweenLi1.5 and Li1.0 where the both phases maintain the C2/m structurewith similar packing density of the CuO4 square chains.
5. Conclusions
Li2CuO2 is an attractive cathode material for lithium-ion batteryapplications due to its high initial charge capacity over250 mA h g�1 in a relatively low-cost (compared to cobalt sys-tems) and non-toxic material. However, only one third of thecharge capacity is retained during discharge. We used electro-chemistry, high-energy X-ray diffraction with pair-distributionfunction analysis, and density functional theory to study theinstabilities of this highly lithiated copper oxide material at varyingstate of charge to formulate a broader understanding of the tiesbetween structural transformation and capacity loss. We foundthat after initial charge a multiphase material persisted throughthe charge–discharge cycle. Reversibility was not obtained even atdeep discharge and after many cycles. We observed the formationof CuO, which accumulated in the charged state suggesting thatCuO can be a product of the delithiation reaction which must beaccompanied by oxygen release. Surprisingly, LiCuO2 was observedin the discharged state. The precipitation of CuO strongly affectsthe reversibility of the lithiation reactions contributing to capacityloss. The structural disorganization and loss of reversibility in theelectrochemically cycled Li2CuO2 system is the result of packing ofthe Cu–O square chains. DFT calculations showed electron removalfrom both Cu and O during delithiation of Li2CuO2. Charge removal
from oxygen makes the compound susceptible to the release ofoxygen as gas or the formation or more stable compounds suchas CuO.
Acknowledgments
The authors are grateful to the Office of Naval Research forsupport of this work. We would like to thank D. Robinson(APS, 6-ID) and Y. Ren (APS,11-ID) for the help with experimentalsetup. Use of the Advanced Photon Source is supported by theU.S. Department of Energy (DOE), Office of Science, under Con-tract No. DE-AC02-06CH11357.
References
[1] E.A. Raekelboom, A.L. Hector, M.T. Weller, J.R. Owen, Journal of Power Sources97-8 (2001) 465–468.
[2] H. Arai, S. Okada, Y. Sakurai, J.-i. Yamaki, Solid State Ionics 106 (1998) 45–53.[3] A.S. Prakash, D. Larcher, M. Morcrette, M.S. Hegde, J.-B. Leriche, C. Masquelier,
Chemistry of Materials 17 (2005) 4406–4415.[4] G. Vitins, E.A. Raekelboom, M.T. Weller, J.R. Owen, Journal of Power Sources
Selected Papers Presented at the 11th International Meeting on LithiumBatteries 119–121 (2003) 938–942.
[5] N. Imanishi, K. Shizuka, T. Ikenishi, T. Matsumura, A. Hirano, Y. Takeda, SolidState Ionics 177 (2006) 1341–1346.
[6] K. Kang, C.H. Chen, B.J. Hwang, G. Ceder, Chemistry of Materials 16 (2004)2685–2690.
[7] C.T. Love, M.D. Johannes, A.M. Stux, K. Swider-Lyons, ECS Transactions 16(2009) 27–35.
[8] D.B. Currie, M.T. Weller, Journal of Materials Chemistry 3 (1993) 229–232.[9] A.M. Stux, K.E. Swider-Lyons, Journal of the Electrochemical Society 152
(2005) A2009–A2016.[10] A.P. Hammersley, S.O. Svensson, A. Thompson, Nuclear Instruments &
Methods in Physics Research Section A—Accelerators, Spectrometers, Detec-tors, and Associated Equipment 346 (1994) 312–321.
[11] X.Y. Qiu, E.S. Bozin, P. Juhas, T. Proffen, S.J.L. Billinge, Journal of AppliedCrystallography 37 (2004) 110–116.
[12] W. Dmowski, T. Egami, K.E. Swider-Lyons, C.T. Love, D.R. Rolison, Journal ofPhysical Chemistry B 106 (2002) 12677–12683.
[13] A.C. Larson, R.B. Von Dreele, Los Alamos National Laboratory, 2000.[14] B.H. Toby, Journal of Applied Crystallography 34 (2001) 210–213.[15] C.L. Farrow, P. Judas, J.W. Liu, D. Bryndin, E.S. Bozin, J. Bloch, T. Proffen,
S.J.L. Billinge, Journal of Physics: Condensed Matter 19 (2007) 335219.[16] G. Kresse, J. Hafner, Physical Review B 47 (1993) 558–561.[17] P.E. Blochl, Physical Review B 50 (1994) 17953–17979.[18] J.P. Perdew, K. Burke, M. Ernzerhof, Physical Review Letters 77 (1996)
3865–3868.[19] L.M. Palacios-Romero, E. Lima, H. Pfeiffer, Journal of Physical Chemistry A 113
(2009) 193–198.[20] R. Berger, L.E. Tergenius, Journal of Alloys and Compounds 203 (1994)
203–207.[21] R.D. Shannon, C.T. Prewitt, Acta Crystallographica Section B—Structural
Crystallography and Crystal Chemistry B 25 (1969) 925.[22] A. Debart, L. Dupont, P. Poizot, J.B. Leriche, J.M. Tarascon, Journal of the
Electrochemical Society 148 (2001) A1266–A1274.
Fig. 8. Schematic mapping of first Cu–O peak distance in the G(r) analysis for
LixCuO2 charged and discharged to various states of charge.
C.T. Love et al. / Journal of Solid State Chemistry 184 (2011) 2412–2419 2419
Copyright © 2022 FDOKUMEN