Apical oxygens and correlation strength in electron-and hole-doped copper oxides
24
Apical oxygens and correlation strength in electron and hole doped copper oxides C´ edric Weber, 1 Kristjan Haule, 1 and Gabriel Kotliar 1 1 Department of Physics, Rutgers University, Piscataway, NJ 08854, USA We use the Local Density Approximation in combination with the Dynamical Mean Field Theory to carry out a comparative investigation of a typical electron doped and a typical hole doped copper oxide, NCCO and LSCO respectively. The parent compounds of both materials are strongly correlated electron systems in the vicinity of the metal to charge transfer insulator transition. In NCCO the magnetic long range order is essential to open a charge transfer gap, while Mott physics is responsible for the gap in LSCO. We highlights the role of the apical oxygens in determining the strength of the correlations and obtaining overall good agreement between theory and several experimentally determined quantities. Results for optical conductivity, polarized X-ray absorption and angle resolved photoemission are presented and compared with experiments. INTRODUCTION Since their discovery, the electronic structure of the high temperature superconductors has been a subject of intensive theoretical attention as well as controversy, a situation that continues even today. A landmark ques- tion to understand these materials is how their physical properties follow from their electronic structure and to which extent simplified descriptions in the form of model Hamiltonians describe their basic physical properties in the normal state. It is generally accepted that the physics of the copper oxide based high temperature superconductor families is captured by the copper-oxygen layers and the relevant degrees of freedom are the copper d x 2 -y 2 orbitals and the oxygen p x and p y orbitals [1, 2]. Numerous studies have demonstrated that this model captures qualitatively the physics of the copper oxide planes. However, there have been several proposals that the p ±z oxygen orbitals and the d 3z2-r2 copper orbital play an important role in the onset of orbital current order [3] or for the existence of superconductivity [4, 5]. Seeking a simpler low energy description, several stud- ies [6, 7] have shown that the Hubbard model describes some qualitative properties of the copper oxygen layers. However, the precise energy range over which the de- scription is valid and the quality of this description for different physical observables, is still a subject of active research. A related question is hence how to map the copper oxide layers onto the various effective Hamiltonians and what is the effective strength of the Coulomb correlations in these systems. There are various approaches tack- ling this issue, ranging from ab-initio methods to model Hamiltonian studies. The theoretical studies usually consist of a two stage process: In the first step ab-initio approaches use an ap- proximate technique, such as constrained DFT in the LDA or GGA approximation, or quantum chemical meth- ods, to derive the parameters and the form of the effective Hamiltonian [8–10]. In the second step, model Hamilto- nian based approaches compute various observables in the framework of a given model Hamiltonian and given approximation technique. The parameters entering the model Hamiltonians are determined by comparing the results side by side with experiment. Numerous research efforts notwithstanding, even the basic question of the strength of the correlations in the copper oxide materials and the origin of the insulating gap in their parent compound has not been fully eluci- dated. There are two opposing physical pictures describ- ing the origin of the insulating gap in these materials. In the so called Slater picture, the insulating behavior is understood as the result of a doubling of the unit cell caused by antiferromagnetic long range order. In the so called Mott picture, the insulating behavior is the result of the local blocking of the electron propagation due to the strong Coulomb repulsion. In the latter picture, the insulating behavior originates from the localization of the electron and is not tied to any specific form of magnetic long range order. Hence antiferromangetic long range or- der arises as a secondary instability. In the presence of magnetic long range order, the unit cell is doubled and the two pictures, Slater and Mott, are continuously con- nected: No physical observable can provide a sharp dis- tinction between the two, both magnetic order and block- ing contribute to the insulating behavior. Mean field the- ory treatments allow to study the paramagnetic state as an underlying normal state mean field solution, which can supports a sharp transition between a paramagnetic metal and a paramagnetic insulator. This solution is not realized when other more stable mean field solutions sup- porting long range order exist, but within a mean field framework, it can still be used to draw a sharp distinc- tion between Slater insulators and Mott insulators, by investigating if the ordered state is derived from a metal- lic or an insulting paramagnetic solution. The pioneer- ing work of Zaanen Sawatzky Allen [11] and their sharp (so called ZSA) boundary between charge transfer metals and charge transfer insulators can be viewed in this light. A simple argument can be formulated for the Hub- bard model to estimate the strength of the correlation of cuprates. Within a one band Hubbard description, arXiv:1005.3100v1 [cond-mat.str-el] 18 May 2010
-
Upload
independent -
Category
Documents
-
view
1 -
download
0
Transcript of Apical oxygens and correlation strength in electron-and hole-doped copper oxides

Apical oxygens and correlation strength in electron and hole doped copper oxides
Cedric Weber,1 Kristjan Haule,1 and Gabriel Kotliar1
1Department of Physics, Rutgers University, Piscataway, NJ 08854, USA
We use the Local Density Approximation in combination with the Dynamical Mean Field Theoryto carry out a comparative investigation of a typical electron doped and a typical hole dopedcopper oxide, NCCO and LSCO respectively. The parent compounds of both materials are stronglycorrelated electron systems in the vicinity of the metal to charge transfer insulator transition. InNCCO the magnetic long range order is essential to open a charge transfer gap, while Mott physicsis responsible for the gap in LSCO. We highlights the role of the apical oxygens in determiningthe strength of the correlations and obtaining overall good agreement between theory and severalexperimentally determined quantities. Results for optical conductivity, polarized X-ray absorptionand angle resolved photoemission are presented and compared with experiments.
INTRODUCTION
Since their discovery, the electronic structure of thehigh temperature superconductors has been a subject ofintensive theoretical attention as well as controversy, asituation that continues even today. A landmark ques-tion to understand these materials is how their physicalproperties follow from their electronic structure and towhich extent simplified descriptions in the form of modelHamiltonians describe their basic physical properties inthe normal state.
It is generally accepted that the physics of the copperoxide based high temperature superconductor families iscaptured by the copper-oxygen layers and the relevantdegrees of freedom are the copper dx2−y2 orbitals andthe oxygen px and py orbitals [1, 2]. Numerous studieshave demonstrated that this model captures qualitativelythe physics of the copper oxide planes. However, therehave been several proposals that the p±z oxygen orbitalsand the d3z2−r2 copper orbital play an important role inthe onset of orbital current order [3] or for the existenceof superconductivity [4, 5].
Seeking a simpler low energy description, several stud-ies [6, 7] have shown that the Hubbard model describessome qualitative properties of the copper oxygen layers.However, the precise energy range over which the de-scription is valid and the quality of this description fordifferent physical observables, is still a subject of activeresearch.
A related question is hence how to map the copperoxide layers onto the various effective Hamiltonians andwhat is the effective strength of the Coulomb correlationsin these systems. There are various approaches tack-ling this issue, ranging from ab-initio methods to modelHamiltonian studies.
The theoretical studies usually consist of a two stageprocess: In the first step ab-initio approaches use an ap-proximate technique, such as constrained DFT in theLDA or GGA approximation, or quantum chemical meth-ods, to derive the parameters and the form of the effectiveHamiltonian [8–10]. In the second step, model Hamilto-
nian based approaches compute various observables inthe framework of a given model Hamiltonian and givenapproximation technique. The parameters entering themodel Hamiltonians are determined by comparing theresults side by side with experiment.
Numerous research efforts notwithstanding, even thebasic question of the strength of the correlations in thecopper oxide materials and the origin of the insulatinggap in their parent compound has not been fully eluci-dated. There are two opposing physical pictures describ-ing the origin of the insulating gap in these materials.In the so called Slater picture, the insulating behavioris understood as the result of a doubling of the unit cellcaused by antiferromagnetic long range order. In the socalled Mott picture, the insulating behavior is the resultof the local blocking of the electron propagation due tothe strong Coulomb repulsion. In the latter picture, theinsulating behavior originates from the localization of theelectron and is not tied to any specific form of magneticlong range order. Hence antiferromangetic long range or-der arises as a secondary instability. In the presence ofmagnetic long range order, the unit cell is doubled andthe two pictures, Slater and Mott, are continuously con-nected: No physical observable can provide a sharp dis-tinction between the two, both magnetic order and block-ing contribute to the insulating behavior. Mean field the-ory treatments allow to study the paramagnetic state asan underlying normal state mean field solution, whichcan supports a sharp transition between a paramagneticmetal and a paramagnetic insulator. This solution is notrealized when other more stable mean field solutions sup-porting long range order exist, but within a mean fieldframework, it can still be used to draw a sharp distinc-tion between Slater insulators and Mott insulators, byinvestigating if the ordered state is derived from a metal-lic or an insulting paramagnetic solution. The pioneer-ing work of Zaanen Sawatzky Allen [11] and their sharp(so called ZSA) boundary between charge transfer metalsand charge transfer insulators can be viewed in this light.
A simple argument can be formulated for the Hub-bard model to estimate the strength of the correlationof cuprates. Within a one band Hubbard description,
arX
iv:1
005.
3100
v1 [
cond
-mat
.str
-el]
18
May
201
0

2
parametrized by a bandwidth W ≈ 8t and a Coulombrepulsion U, the insulating gap of the paramagnetic in-sulator is U −W and the super-exchange is J = 4t2/U .For cuprates, the gap is around ≈ 2eV and J ≈ 0.1eV,and therefore it is found that the repulsion is of the orderU/W ≈ 1.5, which is above but not far from the Mottboundary U ≈W , and hence the cuprates are in a regimeof intermediate correlation strength. Conclusions on theplacement of cuprates in a regime of intermediate cor-relation strength were also reached by numerical studies(for a review see for example Ref. [12]).
The strength of the correlations was also studied inthe three band theory. In particular, large N slave bo-son mean field theory of a three band model (with nooxygen-oxygen transfer integrals) [13] of the copper ox-ides obtained a sharp transition between the metal andthe charge transfer insulator in the paramagnetic phase.This metal-to-charge-transfer-insulator transition paral-lels the Brinkman Rice transition in the Hubbard model.It was found that there is indeed a correspondence be-tween the two critical Coulomb repulsions of the Hubbardmodel Uc1 (the minimal Coulomb repulsion that supportsthe paramagnetic insulator) and Uc2 (the minimal repul-sion that does not support a paramagnetic metal) withthe two critical charge transfer energies ∆c1 and ∆c2,where the paramagnetic insulating state and the para-magnetic metallic state are destroyed, respectively. Thecritical value of the charge transfer energy in the threeband theory (∆c2) plays the role of the critical U (Uc2)of the Hubbard model [13]. Although a strong particle-hole asymmetry is expected in the three band theories,since doped electrons reside mainly on copper sites whiledoped holes reside mainly on the oxygen sites, it wasshown that the resulting quasiparticle band structure wassurprisingly particle-hole symmetric. Indeed, it is due tothe strong copper-oxygen hybridization which results inthe formation of Zhang-Rice singlets and to the quasi-particles that involves copper spin and oxygen charge.
Other more realistic treatments of the three band de-scription of the copper oxides were carried out within theslave boson framework. Some include the oxygen dis-persion [14] [15], additional copper and oxygen orbitals[16], short range magnetic correlations [17, 18], the near-est neighbor Coulomb interactions [19] or the electronphonon coupling [20]. Within slave boson mean field the-ory of the three band model, the parent compound of holedoped cuprates LSCO was located close but above (i.e.on the insulating side of) the metal to charge transferinsulator transition boundary [21].
The development of Dynamical Mean Field Theory[22] and their extensions [23–25] opened new avenues toadvance our qualitative understanding of the electronicstructure of the cuprates and its quantitative description.DMFT goes beyond slave bosons theories: This methodtreats both coherent and incoherent features on the samefooting, whereas slave bosons theories are not able to
capture the coherent character of the physical solution.DMFT successfully describes the Mott transition of theHubbard model and gives a deeper understanding of theBrinkman Rice transition [22, 26]. Single site DMFTcalculations can also be extended to more precise clustercalculations. In particular, cluster corrections in DMFTallow to assess the validity of the single site calculations.
The question of the strength of the correlations wasalso addressed by DMFT studies of multi-band modelHamiltonians for the copper oxides planes [27, 27, 28].The phase diagram, with respect to the charge transferenergy and the Coulomb repulsion of the copper orbitalswas studied. The boundary between the metallic and thecharge-transfer-insulator solutions was located, as well asthe crossover line between the charge-transfer-insulatorand the Mott insulator. A full phase diagram of a cop-per oxide model, and a very complete analogy with theDMFT studies of the Mott transition in the Hubbardmodel was also performed recently [29].
Combination of DMFT with electronic structure meth-ods, such as LDA, allow to combine the ab-initio andthe model Hamiltonian viewpoint in the LDA+DMFTframework. The LDA+DMFT method [23] allow in par-ticular to determine the strength of correlations for spe-cific materials, like NCCO and LSCO, and there are stillseveral important issues unresolved regarding how thispicture is connected to the cuprates: a) How should thedifferent materials be placed in the qualitative ZSA phasediagram. Should the parent compounds of the copper ox-ide materials be thought as Slater or Mott/charge trans-fer Insulators, b) What significant differences are therein the different level of description, mainly what are thedifferences between the one band and three band the-ory, c) What is the quality of the description of the vari-ous experimental observables, for the different low energymodels involving a different number of bands, and finallyd) Can one obtain a consistent picture of the spectro-scopies of hole and electron doped cuprates using a firstprinciples method.
In regards to point a), the issue is still under debate.Using the analysis of model Hamiltonians, Refs [29, 30]classify the parent compounds of electron and hole dopedcompounds as Slater insulators in the metallic side ofthe ZSA phase diagrams. Previous LDA+DMFT studiesclassified LSCO [31] as a Mott insulator (or more pre-cisely as a charge transfer insulator), and NCCO [32] wasidentified as Slater insulator. On the other hand, the firstprinciples study of [33] found NCCO’s parent compoundto be Mott insulator. Finally, the phenomenological anal-ysis of experimental data in Ref [34] concludes that theanalysis of the optical data requires comparable strengthof interactions in hole and electron doped cuprates.
In regards to point b) the energy range over whichthe spectral functions of the three band model are repro-duced by the one band model is also subject of contro-versy. For example, Refs. [29, 30] assert that the three
3
band model and a one band model of the copper oxidesare quantitatively equivalent up to a scale of 4eV, while asimilar analysis by A. Macridin et al. concludes that therange of validity of the Hubbard model is much smaller,and is of the order of 0.5 eV [35]. An additional contro-versy, regarding the differences between the one band andthe three band theory, is connected to the values of theinsulting gap in the paramagnetic insulator. In particu-lar, in a one band theory near Uc2, the gap of the para-magnetic solution is substantially smaller then the gapof the antiferromagnetic solution for the same parame-ters [30, 36, 37]. This is not the case in the three bandmodel where antiferromagnetism increases the value ofthe paramagnetic insulating gap by less than 15% [31].The latter statement is controversial with respect to Ref[29], which argued that the one band model and the threeband model are similar in their physics up to energies aslarge as twice the gap.
Regarding point c), many authors used the theoreticalresults obtained with the Hubbard model to fit exper-iments. For instance Ref. [38] considered a treatmentof the Hubbard model with variational cluster pertur-bation theory (VCPT). It could match experiments butit required a sensible dependence of the Hubbard U onthe level of doping. On the other hand, an approximatediagrammatic treatment of the one band model [39] indi-cates that the experimental optical spectra and the dis-persion [40, 41] can be reproduced without a doping de-pendent U.
Note that a three band LDA+DMFT study was ableto describe the experimental data of NCCO without hav-ing to invoke doping dependent parameters [32]. More-over, using the same technique, a successful descriptionof both the integrated optical weights and the magnitudeof the optical conductivity below the charge transfer gapfor LSCO and NCCO was obtained [31]. This approachhowever does not give the correct magnitude of the opti-cal conductivity of LSCO for energies of the order of thecharge transfer gap, suggesting that additional orbitalsmight play an important role in LSCO.
In this paper we reconsider these issues building onour earlier work of Refs [31] and [32]. We use an ab-initio approach, e.g. the Local Density Approxima-tion combined with the Dynamical Mean Field Theory(LDA+DMFT) [23] to study the electronic structure ofNCCO and LSCO. The comparative study of two typicalcuprate compounds LSCO and NCCO allow us to placefirm bounds ascertaining the importance of correlationsin the cuprates. The good agreement between theoryand experiments, achieved using single site LDA+DMFTwithin a multiband framework, for two different com-pounds, is a significant results and illustrates the powerof this new first principles approach to correlated materi-als. Our results contrast with a recent phenomenologicalanalysis of optical data, of electron and doped cuprates:They concluded that for a one band theory, vertex correc-
tions beyond single site DMFT were required to obtaina reasonable fit to experiments [34].
In this work, we include also the apical oxygens andan additional copper orbital (d3z2−r2 ), which were notincluded in our previous study of LSCO [31]. This ex-tends the quantitative agreement between theory andexperiments to a broader energy range. It sheds lighton why the three band model description of NCCO [32]agrees with experiments up to larger energy scales thanfor LSCO [31]. NCCO, in the T’ structure, lacks api-cal oxygens and is therefore well described by the threeband model up to a much higher energy scale, justifyingthe excellent agreement between theory and experimentfound in Ref [32].
We confirm that for integration cutoffs smaller thanhalf the gap of the parent compound, the additional api-cal oxygen degrees of freedom do not affect the integratedoptical weights in LSCO. This validates the analysis car-ried out in Ref [31] to extract the strength of correlationsin these materials, which was based on analysis up to anenergy scale of half the charge transfer gap, i.e. 1 eV. Theapical oxygens however substantially affects the shape ofthe optical conductivity and it strongly modifies the op-tical conductivity of LSCO around 2 eV. While the holeoccupancy of the pz orbital is small, it has a clear effect onthe optical conductivity of the hole doped cuprates. Weshow here that within the first principles LDA+DMFTframework, extensions of the model to include furtherorbitals or longer range correlations (using cluster exten-sion) consistently improves precision of the calculationand improves agreement with experiments.
The organization of our paper is the following. In sec-tion 1 we describe the phase diagram of NCCO and LSCOwithin single site and two site cluster DMFT, and high-light the role of magnetic order and singlet correlationsin these materials. In section 2 we present the evolutionof the angle resolved photoemission spectra (ARPES) ofthese materials, stressing the various features of the the-ory that require a description beyond static mean fieldtheory and its comparison with the experiments. Detailsregarding the formula used in section 2 to compare thespectral weight with experiments are given in AppendixA. Section 3 focuses on the optics and how the evolutionof the optical properties with doping and temperaturein NCCO and LSCO can be understood as the result ofplacing the two compound on two different sides of theZSA boundary, once the band structure of both materialsis taken into account. The inclusion of the apical oxy-gens in the theoretical modeling is important to obtaincorrect results for various physical quantities, includingthe shape of the optical conductivity and the integratedoptical spectral weights with a cutoff of the order of thecharge transfer gap. We also discuss the connection of theoptical conductivity with various features in the ARPESspectra, and compute the occupation of the different or-bitals which are relevant to the XAS spectra. There is

4
one parameter, the double counting correction, whose de-termination in the LDA+DMFT approach is not unique.We thus examined in the last section the dependence ofour results on this parameter and used this dependenceto estimate the proximity of both NCCO and LSCO tothe ZSA boundary. The tight binding parametrizationobtained makes contact with model Hamiltonian studiesand is reported in Appendix B. We conclude with someoutlook for further work.
FORMALISM
LDA+DMFT uses first principles density functionaltheory methods to extract the hopping parameters ofthe model, which is subsequently solved using DMFTand its extensions. The LDA calculation was carriedout with the PWSCF package [42], which employs aplane-wave basis set and ultrasoft pseudopotentials [43].Downfolding to a three band model, containing cop-per dx2−y2 and two oxygen pσ orbitals was performedby the maximally localized Wannier functions (MLWF)method [44, 45]. The downfolded LDA band structure ofNd2CuO4 (NCCO) and La2CuO4 (LSCO) (see AppendixB) results in the following three band Hamiltonian:
Ht =∑
ijσ,(α,β)∈(px,py,dx2−y2)
tαβij c†iασcjβσ
+ εp∑
iσα∈(px,py)
niασ +(εd − Edc
)∑iσ
nidσ (1)
where i and j label the CuO2 unit cells of the lattice,and tαβij are the hopping matrix elements. εd and εp arethe on-site energies of the d and p orbitals, respectively.Finally, we note that the charge transfer energy εd − εpplays the same role as U in the single band Hubbardmodel, as seen for example in slave bosons mean-fieldstudies [21].
To this Hamiltonian, we add the onsite Coulomb re-pulsion U on the dx2−y2 orbital
HU = Ud∑i
nid↑nid↓ (2)
where the value of Ud = 8eV . The LDA+DMFT method,accounts for the correlations which are included in bothLDA and DMFT by a double counting correction to thed-orbital energy, Edc = Ud(nd − 0.5), which amounts toa shift of the relative positions of the d and p orbitals.Here we take nd to be the occupancy of the correlatedorbital in the parent compound, which gives the doublecounting corrections Edc = 4.8eV (3.12eV ) for NCCO(LSCO).
The LDA downfolded parameters are shown in table I,which we find to be close to those extracted by other firstprinciples methods. An extended 6-band model, that
TABLE I: LDA band calculations gives us different set ofparameters for LSCO ,NCCO and PCCO compounds. The fstates of the Nd and Pr atoms have been treated as core statesand are not treated as valence state. Long-range hopping (notshown) are also considered within the calculations. The am-plitude of the nearest neighbors hoppings (tpp,tdp), the LDAon-site energies (ε0p,ε
0d) and the on-site repulsion Ud are shown
in this table in eV. In electron notations the bonding orbitalsenter the Hamiltonian with a negative transfer integral sign,and the anti-bonding orbitals with a positive sign.
Compound ε0d − ε0p [eV] Ud [eV] tdp [eV] tpp [eV]
NCCO (This work) 1.61 8 1.16 0.54
PCCO (This work) 1.65 8 1.17 0.54
LSCO (This work) 2.76 8 1.41 0.66
NCCO (Ref. [46]) 1.42 10 1.18 0.69
LSCO (Ref. [46]) 0.918 10 1.357 0.841
LSCO (Ref. [9]) 3.5 7.9 1.5 0.6
LSCO (Ref. [10]) 3.6 10.5 1.3 0.65
considers the d3z2−r2, pz and p−z orbitals, was also con-sidered for LSCO. The 6-band Hamiltonian is:
Hapical =∑
ijσ,(α,β)∈(px,py,p±z,dx2−y2,d3z2−r2)
tαβij c†iασcjβσ+
∑iσ,α∈(px,py,p±z)
εαniασ+∑
iσ,α∈(dx2−y2,d3z2−r2)
(εα − Edc
)niασ+
Ud
∑i,α∈(dx2−y2,d3z2−r2)
niα↑niα↓ +∑i
nidx2−y2 nid3z2−r2
(3)
The hopping parameters tij were obtained bydownfolding the LDA band structure to six or-bitals (dx2−y2,d3z2−r2,px,y,pz,−z). The doublecounting for the 6-band model is defined asEdc = Ud
(ndx2−y2 + nd3z2−r2 − 0.5
). The same on-
site repulsion Ud was considered for the dx2−y2 andd3z2−r2 orbitals.
We solve these models using Dynamical Mean FieldTheory (DMFT), in which the Green’s function is givenby: [83].
Gk(iωn) = (iωn + µ−Hk −Σ(iωn))−1, (4)
where Hk is the Fourier transform of the Ht in Eq. (1)and Eq. (3). Σ is the self-energy matrix being nonzeroonly in the d orbital. The self energy in Eq. (4) is ob-tained by solving an Anderson impurity model subjectto the DMFT self-consistency condition:
(iω − Eimp −Σ(iω)−∆(iω)) = P
(1
Nk
∑k∈BZ
Gk(iω)
)−1
,
(5)

5
where the sum runs over the first Brillouin Zone (BZ),and P is projecting the averaged green function onto theimpurity cluster subspace.
In this work we use the continuous time quantumMonte Carlo impurity solver algorithm [47, 48]. Realfrequency resolved quantities were obtained by analyticcontinuation of the observables obtained in matsubarafrequencies. We have crossed checked the analytic con-tinuation of the observables obtained on the matsub-ara axis using several other numerical solvers: the ex-act diagonalization solver (ED) [22], the density matrixrenormalization group solver (DMRG) [49], and the NCAsolver (Non-crossing diagram approximation). CTQMCand ED/DMRG/NCA are complementary tools, workingrespectively on the matsubara and real axis.
Magnetism was considered within the single siteDMFT by solving two independent impurity problems,while in the case of the 2-site cluster DMFT (c-DMFT),the 2-site magnetic unitcell is mapped to a 2-impuritycluster. Cluster DMFT improves single site DMFT byadding the non-local self energy, not present in the sin-gle site DMFT. The 6-band calculation maps the 2-correlated orbitals dx2−y2 and d3z2−r2 to an impuritycontaining two different orbitals.
Finally, model Hamiltonian (1) and (2) were studiedpreviously (for examples see Refs. [27] and [50]). WhenUd is large, there is a metal to charge transfer insulatortransition at integer filling, as a function of the chargetransfer energy εd − εp. However the electron dopedcuprates fall in a regime where the phases with magneticlong range order occupy a large fraction of phase spaceand this regime was not investigated previously.
PHASE DIAGRAM OF LSCO AND NCCO
In this section we discuss the phase diagram of NCCOand LSCO, and in particular their magnetic properties.We compare the various treatments of the short-rangeand long-range correlations. In particular, we considerthe ordered state within the single site DMFT and withinthe 2-site cluster DMFT.
In Fig. 1a we show the magnetic moments of NCCOobtained within a three-band description (left panel ofFig. 1). Single site DMFT data of NCCO (blue cir-cles, left panel) are in remarkable agreement with exper-imental data for all dopings [51], though LDA+DMFTslightly overestimates the range of stabilization of theNeel state: in experiment, the magnetic order of NCCOvanishes at doping δ ≈ 0.15, while in our calculations wefind a slightly larger critical doping of δ ≈ 0.2. We alsoshow data for the cluster cellular DMFT (LDA+cDMFT)(grey diamonds). For NCCO, the c-DMFT and the sin-gle site DMFT data are almost identical. This is a verystrong test that the magnetic correlations of NCCO arewell captured by single site DMFT. In the case of LSCO
(right panel of Fig. 1), we found significant difference inthe region of stability of the magnetic state between thesingle site and cluster DMFT (δ < 10%), hence the dy-namical short range correlations - absent in single siteapproach - are very important for LSCO in the under-doped regime, as reported in [18]. For LSCO, we alsoconsidered the 6-band theory (the 6-band calculationsinclude the description of the p±z and d3z2−r2 orbitals),which does not change magnetic moment of the threeband theory. Experimental values for LSCO [52] are alsoshown and compare qualitatively to our data.
We also carried out the Hartree Fock calculation, andwe found that in this static approach the magnetizationvanishes only at unrealistic large doping δ ≈ 50% forboth NCCO and LSCO (dashed line in Fig. 1a), whichpoints towards the important role of dynamic correla-tions at finite electron and hole doping. Indeed, in theHartree-Fock calculations, the picture is fairly simple:The magnetic state is stabilized due to an optimization ofthe Coulomb energy at the expense of the kinetic energy(the staggered magnetic order avoids double occupation)and in this picture there is no strong difference betweenLSCO and NCCO, as shown in Fig. 1a) The same mecha-nism is responsible for slight overestimation of the criticaldoping within DMFT.
When comparing to experiments, it is important tokeep in mind that two dimensional compounds are notable to sustain infinite-range magnetic order at a finitetemperature (Mermin-Wagner theorem [53]). Therefore,the Neel temperature within DMFT should be inter-preted as the temperature below which the magnetic cor-relations become long but remain finite. This tempera-ture can be much higher then the actual Neel tempera-ture of the material, which is controlled by the magneticexchange between the two dimensional copper oxide lay-ers; and vanishes for a well separated copper oxide planes.In Fig. 1b we show the temperature dependence of themagnetic moment for the 3-band calculations of LSCOand NCCO. The extracted mean-field Neel temperatureis about 1500K for NCCO and 1000K for LSCO, whichis much higher than the experiment Neel temperature.Finally, we emphasize that the magnetic moment of theparent compound of LSCO m = 0.42 is larger than theone of NCCO m = 0.35, which might suggests that LSCOis more correlated than NCCO. The strength of the cor-relations can also be quantized by calculating the quasi-particle renormalization amplitude Z (see Fig. 2). First,we consider the paramagnetic solutions of both NCCO(white circles on the left side) and LSCO (blue circles onthe right side). We find that the quasi-particle weight isgoing to zero in the parent compound of LSCO: This is asignature that LSCO is a charge transfer insulator. ForNCCO, we find that it is going to a finite value at zerodoping, which is the signature that NCCO is a paramag-netic metal.
At finite doping, we find that the quasi-particle weight

6
of the paramagnetic state is much larger in NCCO thanin LSCO. This is a signature that NCCO is more metallicand less correlated than LSCO.
We now turn to the calculations for the ordered stateof both LSCO (red circles on the left) and NCCO (reddiamonds on the right). Here the average quasi-particleweight in the ordered state was obtained by the follow-
ing formula: Z =∑i
ρi(εF )/∑i
ρi(εF )Zi
. The motivations
comes from the formula for the specific heat of the mag-netic system given by γi ∝ ρi
Ziwith i = A,B.
The quasi-particle weight in the ordered state ofNCCO is larger than the one for LSCO, which showsthat the ordered state of NCCO is also less correlatedthan LSCO, and hence the character of the paramagneticstate of the parent compounds (paramagnetic metal ver-sus paramagnetic insulator) has direct consequences forthe magnetic solutions.
We find that the mechanism to open a gap at integerfilling is totally different for hole and electron doped com-pounds, and our results place NCCO and LSCO to dif-ferent regions of the ZSA phase diagram. For hole dopedcompound NCCO, the quasi-particles are scattered in-creasingly and get a very short lifetime when approachingthe insulator (charge transfer insulator). In the electrondoped compound NCCO, the system minimizes its freeenergy by doubling the unit-cell which opens a Slater gap(Slater insulator).
Finally, we note that the presence of magnetism isconcomitant with an entropy loss , which results in anincrease of the quasi-particle weight. The direct conse-quence is that the specific heat γ of the ordered state islower than the specific heat of the paramagnet (inset ofFig. 2).
0 500 1000 1500 2000 2500T [K]
0
0.2
0.4
Sz
NCCO CTQMCLSCO CTQMC
DMFT/ED 3bandDMFT/CTQMC 3band
DMFT/ED 6band
c-DMFT/ED 3bandHartree-Fock 3band
a)
b)
LSCOTNeel
NCCOTNeel
Sz
FIG. 1: (Colors online) a) We show the theoretical mean-value of the staggered magnetization Sz = 1
2(n↑ − n↓) ob-
tained for LSCO and NCCO by both single site DMFT(LDA+DMFT) and cluster cellular DMFT (LDA+cDMFT)of the 3-band theory, and DMFT of the 6-band theory. Ex-perimental values M(δ)/M0 (M0 = M(δ = 0)) for NCCO[51] and LSCO [52] are also shown, and for comparison withDMFT, we assume M0 = MDMFT (δ = 0), where MDMFT
is the magnetic moment at 0 doping obtained by single siteDMFT. The general trend compare well to our data, and forNCCO we obtain a qualitative agreement for the critical dop-ing. For LSCO we find that the magnetization vanish at largedoping within the single site DMFT approximation, but whenthe possibility of local singlet is allowed (cDMFT) the rangeof stabilization of the long-range order is much reduced. Notethat the theoretical magnetic moment was obtained at con-stant temperature T = 89K, and experimentally at 2K forLSCO and 8K for NCCO. b) Magnetization versus temper-ature in the parent compounds of NCCO and LSCO obtainedby single site DMFT for the three band theory. The extractedmean-field Neel temperature is about 1500K for NCCO and1000K for LSCO.

7
DMFT PM/LSCO
DMFT PM/NCCODMFT AF/NCCOc-DMFT AF/NCCO
c-DMFT AF/LSCO
Meta-stablePM
FIG. 2: (Colors online) We show the quasi-particle weightZ for the 3-band description of LSCO and NCCO. The quasiparticle weight of the paramagnet (PM) is finite at integerfilling for NCCO, which is a signature that the paramagneticstate of NCCO is a metal. In the ordered state of NCCO(AF), the quasi-particle weight is estimated by the specific
heat of the A and B magnetic sublattices γi ∝ ρi(εF )Zi
and
i = A,B, and the total quasi-particle weight Z is given by
Z =∑i
ρi(εF )/∑i
ρi(εF )Zi
. The specific heat γ of the AF and
PM states of NCCO are shown in the inset.

8
PHOTOEMISSION AND FERMI SURFACE OFNCCO
The basic quantity describing the electronic structureof the material is the electronic spectral function:
Aα(k, ω) = − (ImG(k, ω)α,α)
π(6)
Where α is the orbital index, and k is running throughthe unfolded Brillouin zone. The total spectral weight isA(k, ω) =
∑αAα(k, ω). Experiments like Angle-Resolved
Photo-Emission Spectroscopy (ARPES) are able to probethe k-dependent spectral functions, and can therefore becompared side-by-side with theoretical calculations [84].In this section we investigate the agreement between thetheoretical spectra and ARPES measurements.
In Fig. 3a,c,e we show the spectral functions resolvedin momentum space. In Fig. 3b,d,f we show the inte-grated spectral functions, that show the energy locationsof the main spectral features.
In the parent compound (Fig. 3a-b), we find two dis-persive peaks separated by the charge transfer gap ofabout 1.2eV , as expected in NCCO [54].
The spectral feature below the Fermi level (Fig. 3b) isan admixture of oxygens and copper orbitals , commonlyknown as the Zhang-Rice singlet (ZR). It is worth notingthat our results show that the oxygens orbitals carry nomagnetic moment. The oxygen sites average the magne-tization on its both copper neighbors.
When the Slater gap opens, there is a spectral weighttransfer from the upper Hubbard band to the Zhang-Ricesinglet and the lower Hubbard band (located at −10eV,not shown), such that minority spectral weight is concen-trated in the upper Hubbard band (UHB), and the ma-jority spectral weight is mostly present in the lower Hub-bard band (LHB) and in the Zhang-Rice singlet (ZR).
The top of the lower band occurs at (π/2, π/2), whilethe bottom of upper band appears at M = (π, 0), there-fore the gap is indirect (see yellow arrow in panel a).Those two bands can also be obtained in the simplerHartree Fock approximation, though the size of the gapis overestimated in a static mean-field.
At 10% electron doping (Fig. 3c-d), NCCO is still mag-netic, and therefore the Zhang-Rice singlet and the upperHubbard band are well separated. Those two featuresare also observed by the simpler Hartree Fock approxi-mation. What is clearly not visible in static mean-field, isthe presence of a very sharp and narrow band slightly be-low and above the Fermi level (Fig. 3c), that correspondsto the quasi-particle peak (QP) in the integrated spectra(Fig. 3d). It is worth noting that the optical transitionsoccur at this doping within these narrow bands, from thenarrow band below the Fermi level to the narrow bandabove the Fermi level, as depicted in Fig. 3c by the ver-tical arrow. In the ordered state of NCCO we observe in
FIG. 3: (Colors online) Frequency dependent spectral weightA(k,w) obtained by LDA+DMFT of NCCO at a) integer-filling, c) 10% and e) 20% electron doping for NCCO. A(k,w)was obtained along the usual path Γ − M − K − Γ in theBrillouin zone (see inset of d). The solid lines are the rigidLDA bands. The partial density of states of the d and p or-bitals are shown in b),d),f). The density of states is showingthe upper Hubbard band (UHB), the Zhang rice singlet (ZR)and the quasi-particle peak (QP) for the doped compounds.a) At integer-filling, we find for NCCO that the indirect gapis ≈ 1.2eV, between (π, 0) and (π/2, π/2), as shown by thediagonal arrow, and the direct gap is about 1.5eV, as indi-cated by the vertical arrow. d) At 10% doping we observea splitting of the quasi-particle peak due to magnetism. Thesplitting of the quasi-particle peak is associated with the mag-netic pseudo-gap at (π/2, π/2) in panel (c). The horizontalarrows pointing from c) to d) are guide to the eyes. The opti-cal transitions at 10% doping occur around (π, 0) within thequasi-particle band, as indicated by the vertical arrow. e)At 20% doping, magnetism is destroyed and the pseudo-gapat (π/2, π/2) is closed. The quasi-particle peak in panel (f)is clearly related to the spectral weight close to the Fermisurface at (π, 0), as indicated by the horizontal arrow.

9
the ordered phase a splitting of the quasi-particle peak(Fig. 3d) into two structures. The first corresponds tothe narrow band bellow the Fermi level, and its mainweight is at M = (π, 0), as indicated by the lower hor-izontal arrow. The peak slightly above the Fermi levelis due to the spectral weight at k = (π/2, π/2) (see up-per horizontal arrow), and is related to the pseudo-gaparound k = (π/2, π/2).
Upon larger doping 20% (Fig. 3e-f), magnetism disap-pears and the pseudo-gap at k = (π/2, π/2) closes. Thepeak slightly above the Fermi level, that was present at10% doping, now disappears.
We now turn to Fig. 4a-d, where we show the spec-tral functions resolved in momentum space at fixed en-ergies Ef , Ef − 0.05eV, Ef − 0.1eV and Ef − 0.15eV,at finite doping 10%. At this doping NCCO is mag-netic. The magnetic Fermi surface in panel (a) has asquare-like shape structure centered around M = (π, 0).At lower energy, in panel d, we observe the presenceof an arc centered around k = (π/2, π/2). This comesprimarily from the pseudo-gap around momentum pointk = (π/2, π/2), which is a signature of the magnetic longrange order (the Fermi surface of the ordered state isgapped at k = (π/2, π/2). The Fermi surface of theordered state moves towards the usual Fermi arc shapewhen the system becomes metallic and the pseudogap atk = (π/2, π/2) is closed in the paramagnet.
Some aspects of the doped electronic structure can beunderstood in terms of the Hartree Fock rigid band pic-ture, for example the holes appear first upon doping atthe M = (π, 0) point, but the renormalization of thebands, and the multiple peak structure in energy for agiven momentum point (see Fig. 4e), are not captured instatic mean-field.
In Fig. 4e we show the energy dependence of the spec-tral function at a fixed k point (shown in the inset ofthe figure). The peak close to the Fermi energy is con-nected to the square-like Fermi surface of panel (a) andis hence connected to magnetism. The peak at lower en-ergy −0.2eV, is related to the arc shape of panel d andhas paramagnetic character. The peak positions are ina very good agreement with recent angle resolved photo-emission measurements of Ref. [55] also shown in Fig. 4e.
In Fig. 5a-c we compare side by side experimental data(middle panels) [56] and DMFT calculations (upper pan-els). The agreement is quantitative showing that ourapproach captures the low energy physics of NCCO. Thepseudo-gap at (π/2, π/2) is also observed in experiments[55] (Fig. 5d, middle panel) in the ordered phase, andcompares well to our theoretical calculations (Fig. 5d,upper panel). In Fig. 5e we show the spectral weightalong the diagonal cut of the Brillouin zone. We observethe presence of a sharp kink in the dispersion (waterfall)that was also recently reported in experiments [57].
In Fig. 6 we show the doping evolution of the Fermisurface obtained by theoretical calculations (lower pan-
FIG. 4: (Colors online) Fermi surface maps obtained byDMFT calculations in the ordered state at 10% doping, a)at the Fermi energy and b)-d) at lower energies ranging from-0.05eV to -0.15eV. The Fermi surface map at the Fermi levelis shaped by the presence of magnetism, whereas the arc inthe energy map at energy -0.15eV is also present in the para-magnetic calculations. e) comparison of A(ω) for a fixed kpoint k = (3π/4, π/4) (shown in the inset) obtained theoreti-cally (lower curve) and experimentally from Ref. [55] (uppercurve). The peak at -0.03eV is due to magnetism, and thepeak at lower energy -0.2eV is associated to the arcs seen ind).
els). We find that upon doping, the Fermi surface movesfrom the square-like magnetic Fermi-surface towards theFermi arcs of the paramagnetic Fermi surface (panels d-g). This is explained by the closing of the pseudo-gap atk = (π/2, π/2). The agreement with experiments (panelsa-c) [58] is very satisfactory.

10
DMFT EXP.
FIG. 5: (Colors online) Side by side comparison of A(k, ω),along the path as depicted in the inset, obtained theoreti-cally (upper row) and experimentally (lower row), a)-c) at15% electron doping from Ref. [56], and d) at 13% dopingfrom Ref. [55]. e) Comparison between DMFT (left side) andexperiments of Ref. [57] (right side), along the nodal cut ofthe Brillouin Zone at 17% electron doping. The agreementbetween DMFT and experiments is remarkable. The verticaldashed lines are guide to the eyes to illustrate the presence ofa sharp kink in the dispersion (waterfall).
PHOTOEMISSION OF LSCO
In this section we focus on the spectral functions ofLSCO. In particular, we focus on the 6-band theory,which includes d3z2−r2 and p±z orbitals, which are ex-pected to play a role in LSCO, due to the presence ofapical oxygens. Note that the apical oxygens are absentin NCCO.
In Fig. 7a we show the momentum resolved spectralfunction of LSCO obtained by DMFT. We observe a di-rect gap ≈ 1.8eV, which is larger than the gap in NCCO,showing that LSCO is more correlated than NCCO. The
x=0.04 x=0.10
x=0.15
d) e)
f ) x=0.18 g)
a) b) c)
FIG. 6: (Colors online) Side by side comparison of the Fermisurface obtained experimentally (reproduced from Ref. [58])and obtained by single site DMFT calculations for NCCO inthe ordered state. a) Experimental results for doping 4%, b)for 10% electron doping and c) 15% electron doping. The re-sults are compared to DMFT calculations for similar dopingsd)-g). The Fermi surface at low doping (a) is centered aroundM = (π, 0), and is moving towards the Fermi arc shape (g)when magnetism is destroyed.
partial density of states (Fig. 7b) shows two dispersivefeatures, the upper Hubbard band (UHB) and a the bandbelow the Fermi level, the Zhang-Rice singlet (ZR). Thelatter is an admixture of oxygen and copper characters.The Zhang-Rice singlet is more incoherent in LSCO thanin NCCO (see Fig. 3a).
Fig. 7b is a blow up of Fig. 7c, that displays the in-tegrated spectrum on a larger energy scale. The lowerHubbard band (LHB) is separated from the upper Hub-bard band (UHB) by an energy scale of the order of Ud.It is worth noting that the p±z and d3z2−r2 orbitals havea strong weight between −4eV and −1eV, and the in-plane oxygens are located at −5eV. Hence, the additionalorbitals p±z and d3z2−r2 hybridize with the Zhang-Ricesinglet, and change the theoretical description of LSCOfor energies larger than 1eV.
In Fig. 8a and 8c we focus on the momentum resolvedspectral functions of doped LSCO. Figures 8b and 8dare the corresponding integrated spectral functions. At10% doping (Fig. 8b), the Zhang-Rice singlet has an in-coherent contribution (ZR) and a coherent part - thequasi-particle peak (QP). The coherent part (QP) is the

11
00.5
a)
LSCO 0%
dup
ddn
dz
pz
px
GAP
-10 -5 0
[eV]
0
1
b)
c) dup
ddn
dz
pz
px
ZR
GA
P
LHB
LSCO 0%
ZR
FIG. 7: (Colors online) a) Frequency dependent spectralweight A(k,w) obtained by LDA+DMFT of a 6-band modeldescription of the parent compound of LSCO. b) Partial den-sity of states of the dx2−y2 , d3z2−r2 , p(x,y) and p±z orbitals.We observe a direct gap of 1.8eV in LSCO. Notice that thespectral weight is very incoherent close to the Fermi energyin the lower band. c) Partial density of states on a larger en-ergy scales. The lower Hubbard band (LHB) is located at avery low energy −10eV, and the upper Hubbard band (UHB)is also shown. The d3z2−r2 and p±z orbitals have a strongweight between −4eV and −1eV.
narrow band below the Fermi level in Fig. 8a. The ver-tical arrows in Fig. 8a and 8c highlight the location ofthe direct transitions from occupied states to unoccupiedstates. These transitions are important for the opticalconductivity (which we discuss in the next section).
For comparison, we also show the theoretical descrip-tion of LSCO without the apical oxygens in Fig. 8e-f.The main difference between the 3-band and the 6-banddescriptions, is that the incoherent part of ZR is narrowerin the 3-band theory. The vertical transitions, markedwith vertical arrows in Fig. 8c,e, highlight large contri-butions to the optical conductivity, and one can see thatthe optical transitions occur at different energies in thetwo models.
Fig. 8g is the momentum resolved spectral function
around a nodal cut of the Brillouin zone. We observe thepresence of a very sharp kink in the dispersion (water-fall), in agreement with experimental data of Ref. [59]reproduced in Fig. 8h.
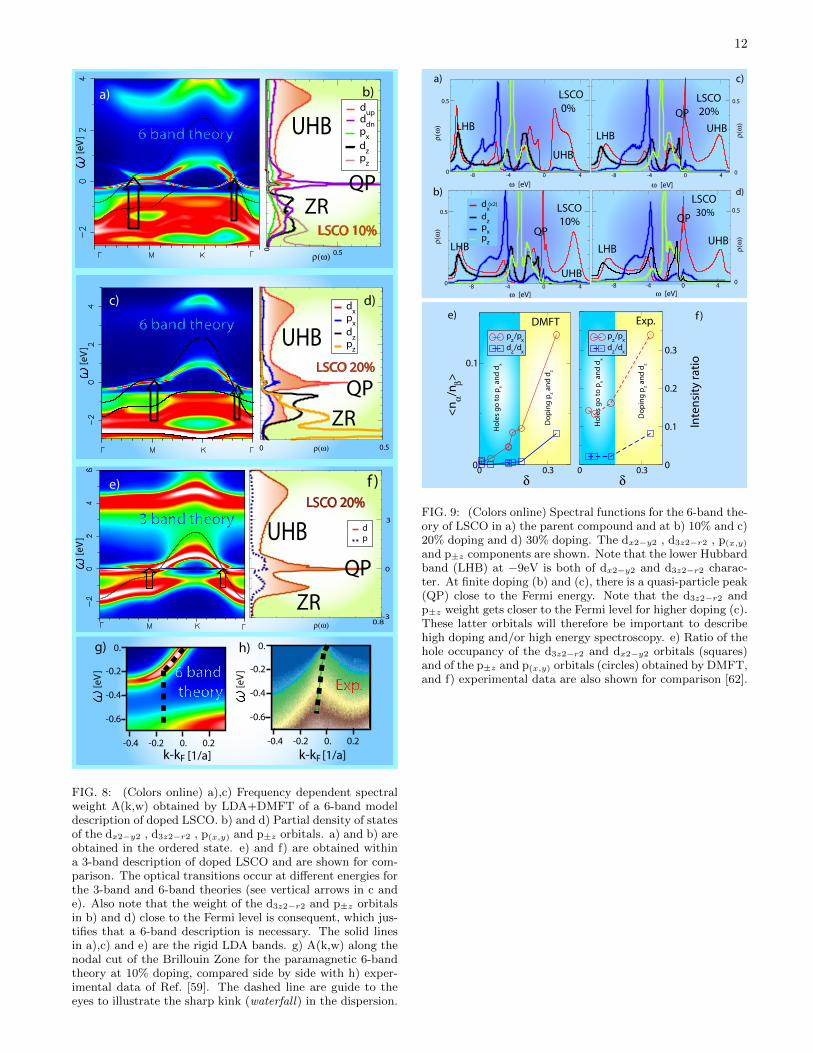
Fig. 9a-d displays the orbital resolved spectral func-tions, obtained within a 6-band theory, for various dop-ings on a wide energy scale. Upon doping (Fig. 9b-d) weobserve the presence of the quasi-particle peak, and theupper Hubbard band (UHB) smears out. Additionally, inthe doped compound the d3z2−r2 and p±z orbitals havea larger weight close to the Fermi level.
Fig. 9e show the relative occupation (in hole notation)of the d3z2−r2 and p±z orbitals upon doping. Our resultsare in agreement with Ref. [60] and we find that evenafter inclusion of the apical oxygens, there is no satu-ration of the occupancy observed around doping 0.2 inthe x-ray absorption spectroscopy (XAS) experiments ofRef. [61]. We notice however that LDA+DMFT doescapture the evolution of the ratio of the occupancies ofapical and planar oxygens: For doping δ < 20%, theholes go mainly to the dx2−y2 and p(x,y) orbitals, and forlarger doping δ > 20%, the holes start to fill the d3z2−r2and p±z . In Fig. 9f we report the experimental data ofRef. [62] for side-by-side comparison with DMFT calcu-lations. Our calculations reproduce the rapid increase ofthe occupancy of pz around doping 0.2.
We note that modeling XAS more accurately may re-quire downfolding the LDA bands over a much largerenergy range to include more orbitals, or the inclusion ofthe doping dependence modifications of the apical oxy-gen distance to the copper oxide layer pointed out in Ref[63]. A more accurate modeling of the XAS, includingthe core hole potential, as it was done for the core levelphotoemission in Ref [64], might also be necessary.
12
FIG. 8: (Colors online) a),c) Frequency dependent spectralweight A(k,w) obtained by LDA+DMFT of a 6-band modeldescription of doped LSCO. b) and d) Partial density of statesof the dx2−y2 , d3z2−r2 , p(x,y) and p±z orbitals. a) and b) areobtained in the ordered state. e) and f) are obtained withina 3-band description of doped LSCO and are shown for com-parison. The optical transitions occur at different energies forthe 3-band and 6-band theories (see vertical arrows in c ande). Also note that the weight of the d3z2−r2 and p±z orbitalsin b) and d) close to the Fermi level is consequent, which jus-tifies that a 6-band description is necessary. The solid linesin a),c) and e) are the rigid LDA bands. g) A(k,w) along thenodal cut of the Brillouin Zone for the paramagnetic 6-bandtheory at 10% doping, compared side by side with h) exper-imental data of Ref. [59]. The dashed line are guide to theeyes to illustrate the sharp kink (waterfall) in the dispersion.
FIG. 9: (Colors online) Spectral functions for the 6-band the-ory of LSCO in a) the parent compound and at b) 10% and c)20% doping and d) 30% doping. The dx2−y2 , d3z2−r2 , p(x,y)
and p±z components are shown. Note that the lower Hubbardband (LHB) at −9eV is both of dx2−y2 and d3z2−r2 charac-ter. At finite doping (b) and (c), there is a quasi-particle peak(QP) close to the Fermi energy. Note that the d3z2−r2 andp±z weight gets closer to the Fermi level for higher doping (c).These latter orbitals will therefore be important to describehigh doping and/or high energy spectroscopy. e) Ratio of thehole occupancy of the d3z2−r2 and dx2−y2 orbitals (squares)and of the p±z and p(x,y) orbitals (circles) obtained by DMFT,and f) experimental data are also shown for comparison [62].

13
OPTICAL PROPERTIES OF LSCO AND NCCO
We now turn to the optical conductivity. It was previ-ously computed for the 3-band model of LSCO [31] andwe now generalize the results for the 6-band descriptionof LSCO and we also compute it for NCCO (see Fig. 10).
The optical conductivity in LDA+DMFT is given by:
σ′(ω) =1
Nk
∑σk
πe2
~c
∫dxf(x− ω)− f(x)
ω
× Tr(ρkσ(x− ω)vkρkσ(x)vk
)(7)
Where c is the interlayer distance, and the density matrixρ is defined by
ρkσ(x) =1
2πi
(G†kσ(x)−Gkσ(x)
)(8)
The bare vertex for a multiple orbital problem vα,βk =dHα,βk
dkx+ i(qαx − qβx
)Hα,βk is obtained following the steps
of Ref [65]. The Peierl phase i(qαx − qβx
)Hα,βk plays an
important role in particular for the ordered state (as dis-cussed in Ref [65], if this phase is not considered theoptical conductivity depends on any artificial folding ofthe Brillouin zone).
In Fig. 10a we show the theoretical optical conduc-tivity of NCCO at integer filling (red curve) and at 10percent doping (blue curve). The undoped compoundhas a sharp onset at an energy of the order of 1.5 eVwhich we interpret as the direct gap (slightly larger thanthe charge transfer gap in Fig. 3b.
Doping introduces several new features (blue line inFig. 10a). The 1.5eV optical peak disappears and theweight is transferred to lower energy in the form of aDrude peak and a mid infrared peak at ω ≈ 0.2eV . Theoptical conductivity also displays a peak in the magneticsolution at a much lower frequency ω ≈ 0.035eV (see leftinset of Fig. 10a).
Below 0.5 eV, vertical transitions are among the quasi-particle bands of the magnetic DMFT band structure.This involves a continuum of k points, but it is likely tobe controlled by saddle points in the reciprocal space.One saddle is at M = (π, 0) and transitions close to thatpoint, indicated by a vertical arrow in Fig. 3c, give riseto the peak in the optical conductivity at 0.2 eV. Tran-sitions close to the midpoint between K = (π, π) andΓ = (0, 0), give rise to the small peak at 0.035 eV in theoptical conductivity. Both peaks are characteristics ofthe quasi-particle band structure in the magnetic state ofNCCO, and these features are not present in the absenceof magnetic order, as shown in Fig. 11a. The absence ofthe peak at 0.035eV and 0.2eV in the optical conductiv-ity is explained by the absence of vertical transition inthe k dependent spectral weight A(k, ω) (see Fig. 11b),which are present in the ordered state and highlighted bythe vertical arrow of Fig. 3c.
The quasi-particle peak in the ordered state is splitinto two narrow bands, one above and one below theFermi level (see Fig. 3d), while the splitting is absentin the paramagnetic state (see Fig. 11c). This is due tothe absence of the pseudo-gap around (π/2, π/2) in theparamagnetic state (see Fig. 11b). As a consequence,the paramagnetic Drude peak is featureless, while in theordered state we observe several low energy peaks in theoptical conductivity (at 0.035 eV and 0.2 eV).
The agreement between DMFT and experimental data[66, 67] (dashed line of Fig. 10a) is qualitative and ourtheory connects the peak in the experimental optical con-ductivity at 0.4 eV with magnetism, in agreement withRef. [68]. Additionally our study allow us to connectthis peak with the spectral weight below the Fermi en-ergy at the M = (π, 0) point, which is present in boththe paramagnetic and the ordered state.
We note finally that the peak in the optical conductiv-ity at smaller energy 0.035eV is observed at this energyin experiments (see Fig. 2 of Ref. [69]), which is onlypresent within the ordered state and disappears at highertemperature in the paramagnet, which suggest that thisfeature is not connected to phonons. Our calculation con-nects this peak to the presence of magnetism and to thepseudo-gap around (π/2, π/2) (see Fig. 3c).
We now turn to the description of the optical conduc-tivity of LSCO. In Fig. 10b we show the optical con-ductivity of the 6-band description of LSCO in the par-ent compound (red curve), at 4% (black curve) and 16%doping (blue curve). For comparison we also show ex-perimental data of Ref. [70] at 0% doping (dotted line),6% (short dashed) and 20% (long dashed). Note thatthere is a quantitative agreement between the theory andexperiments for frequencies smaller ω < 2eV. At largerfrequencies ω > 2eV, the optical conductivity in experi-ments is larger than the theoretical one, which is due tooptical transition from additional orbitals that are notpresent within our calculations, and which contributesat high energies.
For comparison, we now also consider the three bandtheory of LSCO. In Fig. 10c we show the optical conduc-tivity of the magnetic state of the parent compound (redcurve) and of the doped LSCO at 20% doping (yellowcurve). We also show the experimental data of Ref. [70]at 0% doping (dotted line) and 20% doping (dashed line).The vertical arrow emphasizes the disagreement betweentheory and experiments. The strong differences betweenthe 3-band and 6-band calculations for the optical con-ductivity of the parent compound is related to the strongweight of the p±z and d3z2−r2 orbitals below the Fermilevel, which are mainly occupied and contribute signifi-cantly to the optical conductivity. This weight is obvi-ously absent in the three band theory. Note also thatat finite doping there is a peak at 0.8eV in the opti-cal conductivity of the 3-band theory, which is absent inexperimental data. This peak is related to the optical

14
transitions shown in Fig. 8e by the vertical arrows. Thisartifact of the 3-band calculations is cured by introducingthe d3z2−r2 and p±z orbitals.
To quantify the rate of the redistribution of opticalspectral weight, we computed the effective electron num-ber per Cu atom defined by
NΛeff =
2meV
~πe2
∫ Λ
0
σ′(ω)dω, (9)
where me is the free electron mass, and V is the cell vol-ume containing one formula unit. Neff is proportionalto the number of electrons involved in the optical excita-tions up to the cutoff Λ.
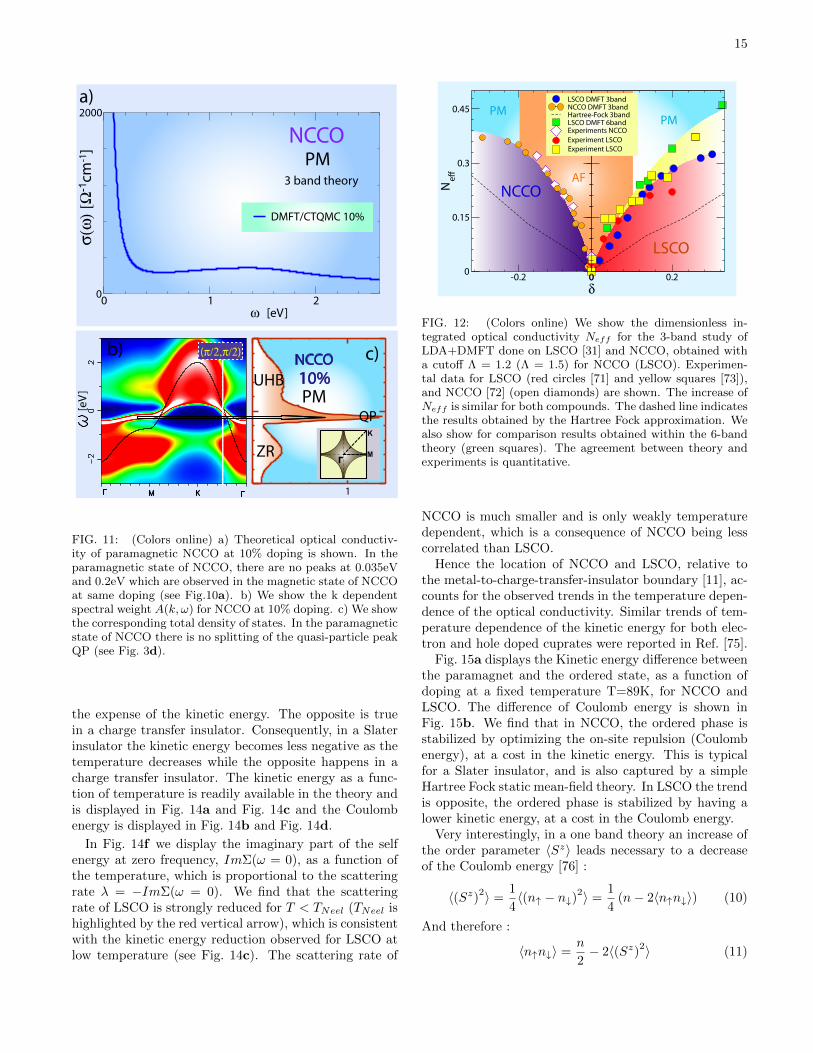
Our results for Neff are displayed in Fig. 12 and com-pared to experimental data taken from Ref. [71], [72] and[73]. Notice a favorable agreement between the theoryand experiment, for which the use of the realistic elec-tronic structure is essential. Moreover, we also show inFig. 12 the static mean-field results. We emphasize thatthe static mean field is not able to reproduce qualitativelythe experimental trend. This highlights the importanceof the dynamical fluctuations not taken into account inHartree Fock. The trend of Neff is qualitatively simi-lar for both LSCO and NCCO, and therefore does notshow that LSCO and NCCO are qualitatively different:the former being a Mott and the latter being a Slaterinsulator.
We also compute the temperature dependence of Nefffor NCCO and LSCO at a fixed density. In Fig. 13a weshow the theoretical results for NCCO. We plot in thesame figure the temperature dependence of Neff (leftscale) and the temperature dependence of the magneticmoment (right scale). We find that Neff is reaching amaximum value when the magnetization is suppressedby thermal fluctuations at ≈ 400K. There is actually avariation of Neff inside the ordered phase, that can beexplained by the destruction of the magnetic pseudo-gap.Once the magnetization is quenched by the temperature,heating the system further reduces Neff . The qualita-tive agreement with experimental data extracted fromRef. [72] is very encouraging.
The temperature dependence of Neff for LSCO isshown in Fig. 13b. We emphasize that the temperaturedependence of Neff shows an opposite trend for LSCO.When doping the parent compound, there is a decreaseof Neff in LSCO, whereas there is an increase of Neff inNCCO. Therefore the temperature dependence of Neffclearly shows a distinct behavior for a Slater and a Mottinsulator. Note that the same general trend of the tem-perature dependence of Neff is observed in experimentsfor LSCO, but for a larger doping than the one consid-ered here (optical data for 13% doping in Fig. 6 of Ref.[74]).
The trend of Neff can be understood in a simple pic-ture. In a Slater picture, the onset of antiferromagnetismreduces the Coulomb correlations (double occupancy) at
FIG. 10: (Colors online) a) Theoretical optical conductiv-ity of NCCO in Ω−1cm−1 at integer-filling (red line). Wefind that NCCO has an optical gap of about 1.5eV, which islarger than the direct gap ≈ 1.2eV. We also show data fordoped NCCO (blue line). Note that for doping smaller than20%, we observe a small peak at a small energy ≈ 0.035eV(see the inset). We also observe a second peak at larger energyscale ≈ 0.2eV , which corresponds to optical transitions withinthe Zhang-Rice singlet (see Fig. 3c). For comparison we alsoshow the infrared optics of Refs [66, 67] (dashed black line).b) Optical conductivity of the 6-band theory of LSCO for theparent compound (red line) and doped LSCO. For compar-ison we also show experimental data of Ref. [70] (short andlong dashed lines). c) Optical conductivity of the 3-band the-ory of LSCO in the parent compound (red line) and dopedLSCO (yellow line), and experimental data of Ref. [70] (shortand long dashed lines). The vertical arrow in panel (c) em-phasizes the disagreement between theory and experiments.Note also that at finite doping there is a peak at 0.8eV inthe optical conductivity of the 3-band theory, which is absentfrom experimental data. This peak is related to the opticaltransitions shown in Fig. 8e (see the vertical arrows). Allcalculations were done in the ordered state.
15
0 1 20
2000
PM
a)
PM
b)
1
c)
FIG. 11: (Colors online) a) Theoretical optical conductiv-ity of paramagnetic NCCO at 10% doping is shown. In theparamagnetic state of NCCO, there are no peaks at 0.035eVand 0.2eV which are observed in the magnetic state of NCCOat same doping (see Fig.10a). b) We show the k dependentspectral weight A(k, ω) for NCCO at 10% doping. c) We showthe corresponding total density of states. In the paramagneticstate of NCCO there is no splitting of the quasi-particle peakQP (see Fig. 3d).
the expense of the kinetic energy. The opposite is truein a charge transfer insulator. Consequently, in a Slaterinsulator the kinetic energy becomes less negative as thetemperature decreases while the opposite happens in acharge transfer insulator. The kinetic energy as a func-tion of temperature is readily available in the theory andis displayed in Fig. 14a and Fig. 14c and the Coulombenergy is displayed in Fig. 14b and Fig. 14d.
In Fig. 14f we display the imaginary part of the selfenergy at zero frequency, ImΣ(ω = 0), as a function ofthe temperature, which is proportional to the scatteringrate λ = −ImΣ(ω = 0). We find that the scatteringrate of LSCO is strongly reduced for T < TNeel (TNeel ishighlighted by the red vertical arrow), which is consistentwith the kinetic energy reduction observed for LSCO atlow temperature (see Fig. 14c). The scattering rate of
FIG. 12: (Colors online) We show the dimensionless in-tegrated optical conductivity Neff for the 3-band study ofLDA+DMFT done on LSCO [31] and NCCO, obtained witha cutoff Λ = 1.2 (Λ = 1.5) for NCCO (LSCO). Experimen-tal data for LSCO (red circles [71] and yellow squares [73]),and NCCO [72] (open diamonds) are shown. The increase ofNeff is similar for both compounds. The dashed line indicatesthe results obtained by the Hartree Fock approximation. Wealso show for comparison results obtained within the 6-bandtheory (green squares). The agreement between theory andexperiments is quantitative.
NCCO is much smaller and is only weakly temperaturedependent, which is a consequence of NCCO being lesscorrelated than LSCO.
Hence the location of NCCO and LSCO, relative tothe metal-to-charge-transfer-insulator boundary [11], ac-counts for the observed trends in the temperature depen-dence of the optical conductivity. Similar trends of tem-perature dependence of the kinetic energy for both elec-tron and hole doped cuprates were reported in Ref. [75].
Fig. 15a displays the Kinetic energy difference betweenthe paramagnet and the ordered state, as a function ofdoping at a fixed temperature T=89K, for NCCO andLSCO. The difference of Coulomb energy is shown inFig. 15b. We find that in NCCO, the ordered phase isstabilized by optimizing the on-site repulsion (Coulombenergy), at a cost in the kinetic energy. This is typicalfor a Slater insulator, and is also captured by a simpleHartree Fock static mean-field theory. In LSCO the trendis opposite, the ordered phase is stabilized by having alower kinetic energy, at a cost in the Coulomb energy.
Very interestingly, in a one band theory an increase ofthe order parameter 〈Sz〉 leads necessary to a decreaseof the Coulomb energy [76] :
〈(Sz)2〉 =1
4〈(n↑ − n↓)2〉 =
1
4(n− 2〈n↑n↓〉) (10)
And therefore :
〈n↑n↓〉 =n
2− 2〈(Sz)2〉 (11)

16
0
0.3
Sz
0 500 1000 1500 2000 2500
T [K]
-1
0
Nef
f/N
effm
ax
Sz
Neff
0
0.2
Sz
0 500 1000 1500 2000 2500T [K]
0
1N
eff/
Nef
fmax
AF
AF
PM
PM
NNCCCCOO
LSCO
a)
b)
Sz
Neff
Neff
DMFT/CTQMCExperiments
FIG. 13: (Colors online) a) 3-band theoretical normalizedvariation of Neff , ∆Neff = Neff (T ) − Neff (T = 89K),at 10% electron doping for NCCO (red circles, left scale).Neff is reaching a maximum value when the magnetization(orange squares, right scale) is destroyed by the thermal fluc-tuations. The decrease of Neff at low temperature can beexplained by the opening of a pseudo-gap in the orderedphase. The data were obtained by single site DMFT cal-culations in the ordered phase. The dashed line correspondsto experiments (see Fig. 7c of Ref [72]), where they measuredNeff (Λ = 0.03eV ) (contribution due to the Drude peak) andNeff (Λ = 0.3eV )−Neff (Λ = 0.2eV ) (contribution due to thepseudogap). The dashed line corresponds to the sum of thesetwo contributions. b) 3-band single site DMFT of the orderedphase of LSCO is shown for 5% doping. Note that the trendof Neff is opposite between LSCO AND NCCO, which is asignature that NCCO is a Slater insulator and LSCO a Mottinsulator.
In the ordered phase there is hence an increase of (Sz)2
and a decrease of 〈n↑n↓〉 for a fixed density n or dopingδ.
In a 3-band theory this is not the case, since the den-sity n in formula (11) is not the total density but thedensity of the d orbital nd. The latter quantity is notfixed at a given doping, and is hence increased when the
36.5
37
AFPM
AFPM
AFPM
AFPM
f )
LSCOTNeel
NCCOTNeel
FIG. 14: (Colors online) 3-band theoretical temperature de-pendence of the a) Kinetic energy Ht (equation 1) and b)Coulomb enery HU (equation 2) of NCCO at 10% doping,and c) Kinetic and d) Coulomb energy of LSCO at 5% dop-ing. The red area highlights the temperature region wherethe solution is magnetic (AF), and the solution is paramag-netic (PM) in the blue area. a)-b) are showing that there isa kinetic energy optimization when LSCO becomes an anti-ferromagnet, which is proper to the Mott insulator, and c)-d)show that NCCO is a typical Slater insulator, which opti-mizes the Coulomb (local onsite repulsion) energy when itbecomes an antiferromagnet, at the expense of a worse Ki-netic energy. This is consistent with the theoretical Neffshown in Fig. 13. f) We show the imaginary part of the selfenergy at zero frequency ImΣ(ω = 0) in function of the tem-perature. The scattering rate of LSCO λ = −ImΣ(ω = 0)(red lines) is strongly reduced for T < TNeel (TNeel is high-lighted by the red vertical arrow), which is consistent withthe kinetic energy reduction observed for LSCO at low tem-perature (Fig. 14c). NCCO (blue lines) is showing a smallscattering rate weakly dependent on the temperature, whichis consistent with NCCO being more metallic than LSCO. Allcalculations were obtained by CTQMC in the ordered state.

17
a)
b)
FIG. 15: (Colors online) 3-band theoretical energy differ-ences between the antiferromagnetic and the paramagneticphases. We show the doping dependence of the a) Kinetic en-ergy Ht (equation 1) and b) Coulomb energy HU (equation 2)of NCCO and LSCO at fixed temperature T=89K. There is akinetic energy optimization when LSCO becomes an antifer-romagnet, which is proper to the Mott insulator, and NCCOis a typical Slater insulator, which optimizes the Coulomb(local onsite repulsion) energy when it becomes an antifer-romagnet, at the expense of a worse Kinetic energy. This isconsistent with the temperature dependence of the theoreticalNeff shown in Fig. 13 and with the temperature dependenceof the Kinetic and Coulomb energies 14. All calculations wereobtained by CTQMC.
magnetization is increased. For the parent compound ofLSCO, we found that magnetic correlations lead to anincrease of nd of 1.4%, and to an increase of the doubleoccupancy nd↑nd↓ of 6%. Hence our results highlight asignificant difference between the single band and 3-bandtheoretical description of LSCO and NCCO.
STRENGTH OF CORRELATIONS IN LSCO ANDNCCO
We finally extended the 3-band calculations to othervalues of εd− εp, in order to study the dependence of ourresults on the charge transfer energy εd − εp. We em-phasize that the charge transfer energy plays the role ofan effective repulsion U in the one band model language,and hence controls the strength of the correlations in a3-band theory. For instance, it was shown in the seminalZSA paper [11] that if the Coulomb repulsion of the dorbital is larger than the charger transfer energy εd − εp,the size of the gap in the paramagnet is independent ofthe Coulomb repulsion, and the strength of correlationsis set by the charge transfer energy.
In order to study the strength of the correlations, wecomputed the jump in the chemical potential δµ for in-finitesimal doping of the parent compound. This quan-tity gives an estimation for the gap in the spectral func-tions of the parent compound, which is around 1.2 eVand 1.8 eV in NCCO and LSCO respectively. We presentthe data for both the ordered state and the paramagneticstate of LSCO and NCCO in Figs. 16a) and 17a), respec-tively. The jump of chemical potential in the paramagnetgives an estimation of the critical charge transfer energy∆c2, which is the maximum charge transfer energy thatallows the metallic solution. However at ∆c2 the orderedsolution has a substantial gap, which is closely related toδµ in the ordered state. We find that δµ in the orderedstate of NCCO is around 1.2 eV and 1.8 eV in LSCO.Hence, we conclude that NCCO (16.a) is slightly belowthe charge-transfer-insulator-to-metal transition ∆c2. In-deed, below ∆c2, the magnetic long-range correlations arenecessary to open a gap, and slightly above ∆c2 the para-magnetic gap is much smaller than the slater gap inducedby the nesting, as shown in Fig. 16a.
The two solutions of the DMFT equations for NCCOare shown in panels 16b,c. The first one is non-magneticand metallic, and describes a material in the absenceof long range order. The second is insulating and an-tiferromagnetically ordered, with a charge transfer gapof 1.2eV. Since the non-magnetic solution is metallic, themagnetic long range order is responsible for the insulat-ing nature of NCCO (Slater insulator).
We find that LSCO (Fig. 17a) is above ∆c2, as reportedin a recent study [31]. Indeed, the parent compound ofLSCO is only weakly affected by the presence of mag-netic order, the size of the gap is only slightly increasedwhen magnetic order is present. The DMFT equationsfor LSCO have two solutions, shown in panels 17b,c. Thefirst one is paramagnetic and the second is antiferromag-netically ordered, with a charge transfer gap of 1.8eV.Since the paramagnetic solution is insulating, the mag-netic long range order is not responsible for the insulatingnature of LSCO (Mott insulator).
In Fig. 18a-c, we show the density of states of the 3-

18
FIG. 16: (Colors online) a) We show the jump in the chem-ical potential δµ in the ordered state of NCCO (blue circles)for other values of the charge transfer energy εd − εp. Theresults are obtained for the 3-band single site DMFT. Forcomparison, we also show the jump in the chemical potentialof the paramagnet (red squares). There is a quantum criti-cal point ∆c2 for the paramagnetic state, with respect to thecharge transfer energy, corresponding to the metal to chargetransfer insulator transition. The physical value obtained byLDA+DMFT for εd − εp places NCCO below the boundary.b) Density of states of the paramagnetic state of NCCO. Thequasi-particle peak close to the Fermi energy (QP) is a signa-ture that NCCO is paramagnetic metal. c) Density of statesof the ordered state of NCCO.
FIG. 17: (Colors online) a) We show the jump in the chemi-cal potential δµ in the ordered state of LSCO (blue circles) forother values of charge transfer energy εd− εp. The results areobtained for the 3-band single site DMFT. For comparison,we also show the jump in the chemical potential of the para-magnet (red squares). There is a quantum critical point ∆c2
for the paramagnetic state, with respect to the charge transferenergy, corresponding to the metal to charge transfer insula-tor transition. The physical value obtained by LDA+DMFTfor εd − εp place LSCO above the boundary. b) Density ofstates of the paramagnetic state of LSCO, which shows thepresence of a gap. This is a signature that LSCO is a Mottinsulator c) Density of states of the ordered state of LSCO.The gap in the density of states is of similar size for the para-magnetic insulator and the ordered state as shown in detailsin Fig. 18.

19
Ch
arg
e g
apC
har
ge
gap
Ch
arg
e g
apC
har
ge
gap
d)
FIG. 18: (Colors online) Density of states of the 3-band de-scription of the parent compound of LSCO in the paramag-netic (dashed line) and ordered state (red area) obtained withdifferent solvers : a) exact diagonalization (ED), b) CTQMCand c) density matrix renormalization group (DMRG). Alldata show that LSCO is a paramagnetic insulator, and thatthe size of the gap obtained by the density of states is sim-ilar for both the paramagnet and the ordered state (within≈ 10%). d) We show the variation of the doping δ with re-spect to the chemical potential µ for both the ordered state(SDW) and the paramagnetic state (PM) obtained by exactdiagonalization (ED) and CTQMC. There is a jump in thechemical potential δµ (plateau at δ = 0) of similar size forall data. This shows that the magnetic correlations do notstrongly affect the insulating properties of LSCO.
band description of the parent compound of LSCO usingvarious numerical tools. In panel a we show the densityof states obtained by ED for the paramagnet and the or-dered states. In panel b we show the density of statesobtained by CTQMC and in panel c the density of statesobtained by a recent DMRG solver [49]. We concludethat the gap in the ordered state of LSCO is of similarsize than the gap obtained in the paramagnet, indepen-dently of the numerical solver used to solve the DMFTequations. In Fig. 18d we show the doping as a functionof the chemical potential, and it displays a plateau re-lated to the charge gap at integer filling. The agreementbetween the different solvers gives us confidence in theseresults.
The asymmetry between both NCCO and LSCO, beingbelow and above the charge-transfer-insulator-to-metaltransition ∆c2, is a simple explanation for the strik-ing asymmetry in their phase diagram. For LSCO, themagnetic correlations are destroyed rapidly upon doping,while in the NCCO they survive up to high doping, asshown in Fig. 1a.
In this section, we emphasized that the physical originof the asymmetry between LSCO and NCCO lies notonly in the different values of the oxygen-oxygen overlap,which controls the curvature of the Fermi surface, aneffect that is captured in model Hamiltonian studies, butalso in the different values of the charge transfer gap inthe two structures. The latter has an electrostatic origin,the electron doped material lacks the negatively chargedapical oxygen, which increase the electrostatic potentialat the copper site.
For comparison, we now also discuss results of the oneband Hubbard model. In Fig. 19 we show the gap in thedensity of states for the paramagnetic insulator and forthe antiferromagnetic insulator. In the one band modelexists a critical point Uc2 which separates the paramag-netic metal at small U/t from the paramagnetic insulatorat large U/t (squares). The magnetic solution is alwaysinsulating (circles). Using typical values for the hoppingparameter t [77](t = 0.42eV for NCCO and t = 0.43eVfor LSCO), and typical values for the gap ∆ in the or-dered state for LSCO and NCCO (∆ = 1.2eV for NCCOand ∆ = 1.8eV for LSCO) we can locate the compoundsin the one-band model phase diagram. Both LSCO andNCCO are below Uc2 in this picture, in agreement withRef [30]. There is therefore a strong difference in thephysical conclusions obtained by the one-band calcula-tions and the LDA+DMFT.
CONCLUSION
In conclusion, we carried out a comparative study ofNCCO and LSCO using a realistic LDA+DMFT ap-proach. The LDA+DMFT studies achieved overall goodagreement with optical conductivity and ARPES studies

20
T=0.01tMetal
Insulator
FIG. 19: (Colors online) We show calculations done on theone band Hubbard model for various Coulomb repulsion Uand transfer integral t ratios. In the one band theory there isalso a quantum critical point Uc2 that is the minimal repulsiondriving an paramagnet to an insulator. Locating the com-pounds LSCO and NCCO by fitting the gap ∆ (∆ = 1.2eVand t = 0.42eV [77] for NCCO and ∆ = 1.8eV and t = 0.43eVfor LSCO), we place both LSCO and NCCO below Uc2 in theone band picture. It is worth noting that for large enoughU/t the size of the paramagnetic gap is close to the gap inthe ordered state. Results were obtained by using single siteDMFT with exact diagonalization. For comparison we showtheoretical calculations of Ref. [37], done for the paramagnet(long dashed line) and the ordered state (short dotted line),and the theoretical calculations of Ref. [36] in the param-agnetic state (white circle) and in the ordered state (blackcircle).
in a broad range of dopings and a wide range of energyscales up to energies of the order of the charge transferenergy.
In particular, for NCCO we found that static mean-field theory is not sufficient to describe many qualitativefeatures due to the presence of multiple peaks in the elec-tronic spectra. The description of these features requiremore sophisticated methods and studies along those lineswere carried out for NCCO in Refs [39, 78]. We demon-strated that LDA+DMFT successfully describes these ef-
fects in NCCO.While single site DMFT is already a good methodology
to describe the phase diagram of NCCO, cluster correc-tions are important in the underdoped region of LSCO.This indicates the importance of singlet formation or thepossible importance of other ordered states in this region.However, our LDA+DMFT gave a remarkable agreementwith experiments for the optical conductivity, for dopingsmaller than 20% and energy scale ω < 2eV, when thed3z2−r2 and p±z are considered. For larger doping andhigher frequencies, additional bands must should consid-ered for a proper description of the photoemission spec-tra.
Moreover, in agreement with Ref [60] we found thateven after inclusion of the apical oxygens, single siteDMFT does not capture the saturation of the occupancyobserved around doping 0.2 in the x-ray absorption spec-troscopy (XAS) experiments of Ref. [61]. We noticehowever that LDA+DMFT does capture the evolutionof the ratio of the occupancies of apical and planar oxy-gens, including a rapid increase of the occupancy of pzaround doping 0.2. We note that modeling XAS more ac-curately may require: i) Taking into account additionalLDA bands and more orbitals, ii) To include the dopingdependence of the apical oxygen position pointed out inRef [63], iii) Non-local correlations beyond DMFT mightbe relevant as suggested in Refs [60, 79–81], iv) To in-clude the core hole potential, as it was done for the corelevel photoemission in Ref [64], might also be necessary.
We achieved a successful description of many nor-mal state physical properties (optical conductivity,ARPES, stability of magnetism) of these two archety-pal cuprates. The overall quantitative agreement be-tween LDA+DMFT and experiments, for both LSCOand NCCO gives us increased confidence in LDA+DMFTas an approach to strongly correlated materials.
We emphasize that it did not require the introductionof ad hoc parameters, such as a doping dependent in-teraction strength. The sensitivity of the results on thechoice of the charge transfer energy, which essentially de-termines the strength of the correlations, was explored.We emphasize that the charge transfer energy for NCCOand LSCO is obtained from ab initio calculations, andfor the values obtained by first principle calculations weobtained good agreement with experiments.
It is remarkable to obtain good quantitative agree-ment between theory and experiment, on energy scalesof the order the charge transfer energy. For example,our methodology gives a good agreement with experi-ments for the integrated spectral weight of the opticalconductivity with a cutoff above the charge transfer gapin LSCO. For this quantitative agreement it is essentialto use a multiband model including the apical oxygen or-bitals. The fact that these are absent in NCCO accountsfor the good agreement with the magnitude of the opti-cal conductivity obtained for this material in our earlier

21
publication [32].Moreover, our methodology applied to two different
materials captures not only their similarities, as for ex-ample the doping dependence of the integrated spectralweight, but also their differences, as the doping depen-dence of the magnetic moment. These differences stemsfrom their different electronic structure and is well cap-tured by LDA+DMFT. Differences between the electronand hole doped cuprates have been noticed by many au-thors. They were interpreted as arising from both thebare hopping integrals in the one band model Hamil-tonian and the Coulomb interaction U in the Hubbardmodel.
However, LDA+DMFT and multi-band theories arealso able to capture a more fundamental difference re-sulting from the different strength of the correlations inthese two materials, which is driven by the charge trans-fer energy. Using our methodology, we determined therelative strength of the correlations of LSCO and NCCO.LSCO was found to be on the insulating side of the ZSAphase boundary confirming the preliminary conclusionsof reference [31], but in disagreement with Ref [30] whichclassifies all the parent compound of the copper oxides asSlater insulators. The electron doped compound NCCOwas found to be on the metallic side of the ZSA phaseboundary [32] in agreement with ref [30], but in disagree-ment with Ref [46]. Indeed, the lack of apical oxygensin NCCO reduces the charge transfer energy relative toLSCO, placing these two materials on two different sidesof the ZSA phase boundary.
This work is complementary to our earlier work [32],placing the copper oxides in a region of intermediate cor-relation strength. For materials in this region of parame-ters, we found that the location of the material relative tothe ZSA boundary has important physical consequences.For example the evolutions of the optical properties withdoping and temperature in NCCO and LSCO are differ-ent, in agreement with the earlier work of Ref [82]. Ourresults allowed to shed some light on the differences ob-served in LSCO and NCCO, and these differences areattributed to the location of LSCO and NCCO on thetwo different sides of the ZSA boundary.
This has direct consequences on physical observablesat finite doping. For instance, antiferromagnetism in theSlater limit is accompanied by an increase in the expec-tation value of the kinetic energy (with a concomitant re-duction in the double occupation) while in the Mott limitthe insulating state has an optimization of the kineticenergy which is a manifestation of the increase of the ex-pectation value of the superexchange interaction. Theseis a transparent interpretation of the different trends inthe evolution of the optical spectroscopy in NCCO andLSCO materials.
Our method captures both the similarities and themany essential differences between the two compounds,which can be traced to their structure and atomic con-
stituents, and in particular to the absence of apical oxy-gens in the T’ structure of NCCO. However, there are stillavenues to improve the single site DMFT description ofcopper oxide materials, by including the effects of thenearest neighbor Coulomb interaction between copperand oxygen and among the oxygens beyond the Hartreeapproximation, and inclusion of frequency dependentscreening. Many local or frequency integrated quantitiesare already well described by single site DMFT, but inthe region of hole doping where the discrepancy betweensingle site DMFT and cluster DMFT is noticeable, thelatter should be used to refine the description of low en-ergy physical properties.
An important direction, to be pursued is the study ofother ordered states, that exist as stable or metastable so-lutions of the realistic single site or cluster LDA+DMFTequations. Exploration of this landscape of DMFT solu-tions, is a challenging project, and is worthwhile to pur-sue in conjunction with studies of the superconductingphase. These problems are currently under investigation.
ACKNOWLEDGEMENT
We thank A.M. Tremblay, D. Basov, D. G. Hawthorn,G. A. Sawatzky for discussions and sharing their insightsand experimental data. Numerous discussions with A.Georges, A. Amaricci, J. C. Domenge and A. Millis aregratefully acknowledged. Adriano Amaricci shared hisdensity matrix renormalization group code and Jean-Christophe Dommenge shared his exact diagonalizationcode. K.H was supported by Grant NSF NFS DMR-0746395 and Alfred P. Sloan fellowship. G.K. was sup-ported by NSF DMR-0906943, and C.W. was supportedby the Swiss National Foundation for Science (SNFS).
APPENDIX A
In this appendix, we discuss how the spectral weightobtained in the ordered state, Aα(K, ω) is mapped to theunfolded Brillouin zone for comparison with experiments.
For the calculations done in the ordered state,(Aα(K, ω))ij is obtained in the folded Brillouin Zone,and therefore is now labeled by two additional indicesi, j, that are running indices over the paramagnetic unit-cell block of the extended unitcell.
The corresponding spectral weight can be obtained inthe unfolded Brillouin zone by the relation:
A(k, ω)α =
Ncell∑i,j=1
eik(Ri−Rj) (Aα(K, ω))ij
(12)
Where Ncell is the number of paramagnetic unitcell con-tained in the extended ordered state unitcell, and Ri,j isthe position of the block within the extended unitcell.

22
The relation between k (unfolded Brillouin zone, para-magnetic state) and K (folded Brillouin zone, orderedstate) is given by:
k = (KxA1 +KyB1) g1 + (KxA2 +KyB2) g2
With the following definitions. K = KxG1 + KyG2,where G1,2 are the reciprocal basis vector of the orderedstate, a = A1E1 + B1E2 and b = A2E1 + B2E2, wherea,b are the direct space basis vector of the paramagneticunitcell, and E1,2 are the direct space basis vector of theextended state unitcell (ordered state).
APPENDIX B
In this section we show the realistic set of tight bind-ing parameters obtained by downfolding the LDA bandstructure (see Table II and III).
[1] V. J. Emery, Phys. Rev. Lett. 58, 2794 (1987).[2] C. M. Varma, S. Schmitt-Rink, and E. Abrahams, Solid
State Commun. 62, 681 (1987).[3] C. Weber et al., Phys. Rev. Lett. 102, 017005 (2009).[4] Carmine Lubritto et al. J. Phys.: Condens. Matter 8
11053 (1996).[5] W. Weber Z. Phys. B 70, 323 (1988).[6] F. C. Zhang and T. M. Rice, Phys. Rev. B 37, 3759
(1988).[7] F. C. Zhang and T. M. Rice, Phys. Rev. B 37, 3759
(1988).[8] Feiner et al., Phys. Rev. B 53, 8751 (1996).[9] A. K. MacMahan et al., Phys. Rev. B 42, 6268 (1990).
[10] Mark S. Hybertsen et al., Phys. Rev. B 41, 11068 (1990).[11] J. Zaanen, G.A. Sawatzky and J.W. Allen, Phys. Rev.
Lett. 55, 418 (1985)[12] Does the Hubbard Model Have the Right Stuff?, in
Perspectives in Many-Particle Physics, ed. by R.A.Broglia, J.R. Schrieffer, and P.F. Bortignon, North-Holland (1994), pp. 95-125.
[13] G. Kotliar, P. A. Lee, and N. Read, Physica C 153, 538-542 (1988).
[14] M. Grilli, G. Kotliar and A. Millis, Phys. Rev. B. 42,329-341 (1990).
[15] Ju H. Kim, K. Levin, and A. Auerbach, Phys. Rev. B39, 11633 (1989).
[16] L. F. Feiner, M. Grilli and C. Di Castro, Phys. Rev. B45, 10647 (1992).
[17] Caprara and Grilli, Phys. Rev. B 49, 6971 (1994).[18] J. Schmalian et al., Solid State Commun. 86, 119 (1993).[19] R. Raimondi, C. Castellani, M. Grilli, Yunkyu Bang and
G. Kotliar, Phys. Rev. B 47, 3331 (1992).[20] M. Grilli and C. Castellani, Phys. Rev. B 50, 16880
(1994).[21] G. Kotliar, Int. J. of Mod. Phys. B. 5, 341 (1991).[22] A. Georges et al., Rev. Mod. Phys., 68, 0034 (1996)[23] G. Kotliar et al., Rev. Mod. Phys. 78, 865 (2006).[24] Th. Maier, M. Jarrell, Th.Pruschke, M.H. Hettler, Re-
view Modern Physics 77, 1027 (2005).
TABLE II: 3-band model Hamiltonian parameters obtainedby LDA downfolding for LSCO. The vector connecting thetwo different unit-cells is shown, and the two orbitals con-nected by the hopping as well.
orbitals vector amplitude orbitals vector amplitude
dx-dx (-2,0 ) -0.01 dx-py (-2,0 ) -0.01
py-py (-2,0 ) 0.010 dx-dx (-1,-1) 0.030
dx-px (-1,-1) -0.03 dx-py (-1,-1) 0.030
px-px (-1,-1) 0.030 py-py (-1,-1) 0.030
dx-dx (-1,0 ) 0.030 dx-px (-1,0 ) 0.030
dx-py (-1,0 ) -1.40 px-dx (-1,0 ) 0.030
px-px (-1,0 ) -0.03 px-py (-1,0 ) 0.660
py-dx (-1,0 ) 0.010 py-py (-1,0 ) 0.030
dx-dx (-1,1 ) 0.030 dx-py (-1,1 ) 0.030
px-dx (-1,1 ) -0.03 px-px (-1,1 ) 0.030
px-py (-1,1 ) -0.66 py-py (-1,1 ) 0.030
dx-dx (0 ,-2) -0.01 dx-px (0 ,-2) 0.010
px-px (0 ,-2) 0.010 py-py (0 ,-2) -0.01
dx-dx (0 ,-1) 0.030 dx-px (0 ,-1) 1.400
dx-py (0 ,-1) -0.03 px-dx (0 ,-1) -0.01
px-px (0 ,-1) 0.030 py-dx (0 ,-1) -0.03
py-px (0 ,-1) 0.660 py-py (0 ,-1) -0.03
dx-dx (0 ,0 ) 10.87 dx-px (0 ,0 ) -1.40
dx-py (0 ,0 ) 1.400 px-dx (0 ,0 ) -1.40
px-px (0 ,0 ) 8.110 px-py (0 ,0 ) -0.66
py-dx (0 ,0 ) 1.400 py-px (0 ,0 ) -0.66
py-py (0 ,0 ) 8.110 dx-dx (0 ,1 ) 0.030
dx-px (0 ,1 ) -0.01 dx-py (0 ,1 ) -0.03
px-dx (0 ,1 ) 1.400 px-px (0 ,1 ) 0.030
px-py (0 ,1 ) 0.660 py-dx (0 ,1 ) -0.03
py-py (0 ,1 ) -0.03 dx-dx (0 ,2 ) -0.01
px-dx (0 ,2 ) 0.010 px-px (0 ,2 ) 0.010
py-py (0 ,2 ) -0.01 dx-dx (1 ,-1) 0.030
dx-px (1 ,-1) -0.03 px-px (1 ,-1) 0.030
py-dx (1 ,-1) 0.030 py-px (1 ,-1) -0.66
py-py (1 ,-1) 0.030 dx-dx (1 ,0 ) 0.030
dx-px (1 ,0 ) 0.030 dx-py (1 ,0 ) 0.010
px-dx (1 ,0 ) 0.030 px-px (1 ,0 ) -0.03
py-dx (1 ,0 ) -1.40 py-px (1 ,0 ) 0.660
py-py (1 ,0 ) 0.030 dx-dx (1 ,1 ) 0.030
px-dx (1 ,1 ) -0.03 px-px (1 ,1 ) 0.030
py-dx (1 ,1 ) 0.030 py-py (1 ,1 ) 0.030
dx-dx (2 ,0 ) -0.01 py-dx (2 ,0 ) -0.01
py-py (2 ,0 ) 0.010 py-py (2 ,2 ) 0.000
[25] P. Sahebsara and D. Senechal, Phys. Rev. Lett. 97,257004 (2006).
[26] G. Kotliar, Eur. Phys. J. B 11, 27 (1999).[27] A. Georges, G. Kotliar and. W. Krauth, Z. Phys. B 92,
313 (1993).[28] P. Lombardo, J. Schmalian, M. Avignon, and K.H. Ben-
nemann, Phys. Rev. B 54, 5317 (1996).
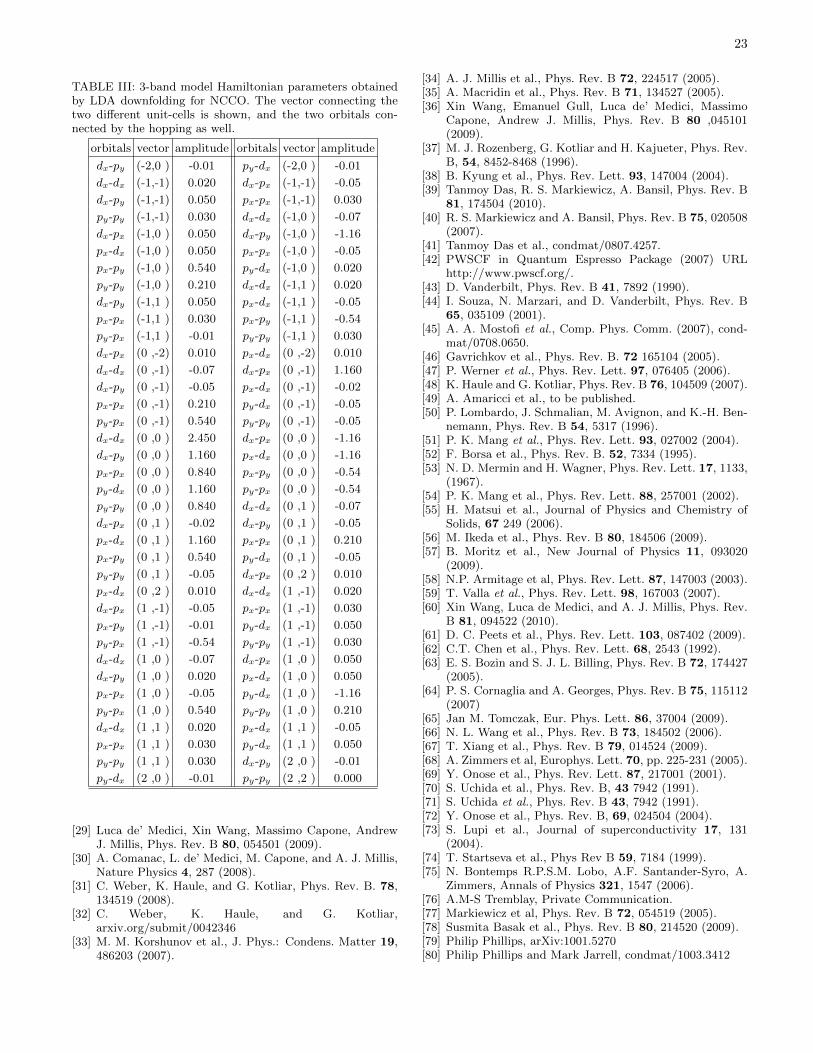
23
TABLE III: 3-band model Hamiltonian parameters obtainedby LDA downfolding for NCCO. The vector connecting thetwo different unit-cells is shown, and the two orbitals con-nected by the hopping as well.
orbitals vector amplitude orbitals vector amplitude
dx-py (-2,0 ) -0.01 py-dx (-2,0 ) -0.01
dx-dx (-1,-1) 0.020 dx-px (-1,-1) -0.05
dx-py (-1,-1) 0.050 px-px (-1,-1) 0.030
py-py (-1,-1) 0.030 dx-dx (-1,0 ) -0.07
dx-px (-1,0 ) 0.050 dx-py (-1,0 ) -1.16
px-dx (-1,0 ) 0.050 px-px (-1,0 ) -0.05
px-py (-1,0 ) 0.540 py-dx (-1,0 ) 0.020
py-py (-1,0 ) 0.210 dx-dx (-1,1 ) 0.020
dx-py (-1,1 ) 0.050 px-dx (-1,1 ) -0.05
px-px (-1,1 ) 0.030 px-py (-1,1 ) -0.54
py-px (-1,1 ) -0.01 py-py (-1,1 ) 0.030
dx-px (0 ,-2) 0.010 px-dx (0 ,-2) 0.010
dx-dx (0 ,-1) -0.07 dx-px (0 ,-1) 1.160
dx-py (0 ,-1) -0.05 px-dx (0 ,-1) -0.02
px-px (0 ,-1) 0.210 py-dx (0 ,-1) -0.05
py-px (0 ,-1) 0.540 py-py (0 ,-1) -0.05
dx-dx (0 ,0 ) 2.450 dx-px (0 ,0 ) -1.16
dx-py (0 ,0 ) 1.160 px-dx (0 ,0 ) -1.16
px-px (0 ,0 ) 0.840 px-py (0 ,0 ) -0.54
py-dx (0 ,0 ) 1.160 py-px (0 ,0 ) -0.54
py-py (0 ,0 ) 0.840 dx-dx (0 ,1 ) -0.07
dx-px (0 ,1 ) -0.02 dx-py (0 ,1 ) -0.05
px-dx (0 ,1 ) 1.160 px-px (0 ,1 ) 0.210
px-py (0 ,1 ) 0.540 py-dx (0 ,1 ) -0.05
py-py (0 ,1 ) -0.05 dx-px (0 ,2 ) 0.010
px-dx (0 ,2 ) 0.010 dx-dx (1 ,-1) 0.020
dx-px (1 ,-1) -0.05 px-px (1 ,-1) 0.030
px-py (1 ,-1) -0.01 py-dx (1 ,-1) 0.050
py-px (1 ,-1) -0.54 py-py (1 ,-1) 0.030
dx-dx (1 ,0 ) -0.07 dx-px (1 ,0 ) 0.050
dx-py (1 ,0 ) 0.020 px-dx (1 ,0 ) 0.050
px-px (1 ,0 ) -0.05 py-dx (1 ,0 ) -1.16
py-px (1 ,0 ) 0.540 py-py (1 ,0 ) 0.210
dx-dx (1 ,1 ) 0.020 px-dx (1 ,1 ) -0.05
px-px (1 ,1 ) 0.030 py-dx (1 ,1 ) 0.050
py-py (1 ,1 ) 0.030 dx-py (2 ,0 ) -0.01
py-dx (2 ,0 ) -0.01 py-py (2 ,2 ) 0.000
[29] Luca de’ Medici, Xin Wang, Massimo Capone, AndrewJ. Millis, Phys. Rev. B 80, 054501 (2009).
[30] A. Comanac, L. de’ Medici, M. Capone, and A. J. Millis,Nature Physics 4, 287 (2008).
[31] C. Weber, K. Haule, and G. Kotliar, Phys. Rev. B. 78,134519 (2008).
[32] C. Weber, K. Haule, and G. Kotliar,arxiv.org/submit/0042346
[33] M. M. Korshunov et al., J. Phys.: Condens. Matter 19,486203 (2007).
[34] A. J. Millis et al., Phys. Rev. B 72, 224517 (2005).[35] A. Macridin et al., Phys. Rev. B 71, 134527 (2005).[36] Xin Wang, Emanuel Gull, Luca de’ Medici, Massimo
Capone, Andrew J. Millis, Phys. Rev. B 80 ,045101(2009).
[37] M. J. Rozenberg, G. Kotliar and H. Kajueter, Phys. Rev.B, 54, 8452-8468 (1996).
[38] B. Kyung et al., Phys. Rev. Lett. 93, 147004 (2004).[39] Tanmoy Das, R. S. Markiewicz, A. Bansil, Phys. Rev. B
81, 174504 (2010).[40] R. S. Markiewicz and A. Bansil, Phys. Rev. B 75, 020508
(2007).[41] Tanmoy Das et al., condmat/0807.4257.[42] PWSCF in Quantum Espresso Package (2007) URL
http://www.pwscf.org/.[43] D. Vanderbilt, Phys. Rev. B 41, 7892 (1990).[44] I. Souza, N. Marzari, and D. Vanderbilt, Phys. Rev. B
65, 035109 (2001).[45] A. A. Mostofi et al., Comp. Phys. Comm. (2007), cond-
mat/0708.0650.[46] Gavrichkov et al., Phys. Rev. B. 72 165104 (2005).[47] P. Werner et al., Phys. Rev. Lett. 97, 076405 (2006).[48] K. Haule and G. Kotliar, Phys. Rev. B 76, 104509 (2007).[49] A. Amaricci et al., to be published.[50] P. Lombardo, J. Schmalian, M. Avignon, and K.-H. Ben-
nemann, Phys. Rev. B 54, 5317 (1996).[51] P. K. Mang et al., Phys. Rev. Lett. 93, 027002 (2004).[52] F. Borsa et al., Phys. Rev. B. 52, 7334 (1995).[53] N. D. Mermin and H. Wagner, Phys. Rev. Lett. 17, 1133,
(1967).[54] P. K. Mang et al., Phys. Rev. Lett. 88, 257001 (2002).[55] H. Matsui et al., Journal of Physics and Chemistry of
Solids, 67 249 (2006).[56] M. Ikeda et al., Phys. Rev. B 80, 184506 (2009).[57] B. Moritz et al., New Journal of Physics 11, 093020
(2009).[58] N.P. Armitage et al, Phys. Rev. Lett. 87, 147003 (2003).[59] T. Valla et al., Phys. Rev. Lett. 98, 167003 (2007).[60] Xin Wang, Luca de Medici, and A. J. Millis, Phys. Rev.
B 81, 094522 (2010).[61] D. C. Peets et al., Phys. Rev. Lett. 103, 087402 (2009).[62] C.T. Chen et al., Phys. Rev. Lett. 68, 2543 (1992).[63] E. S. Bozin and S. J. L. Billing, Phys. Rev. B 72, 174427
(2005).[64] P. S. Cornaglia and A. Georges, Phys. Rev. B 75, 115112
(2007)[65] Jan M. Tomczak, Eur. Phys. Lett. 86, 37004 (2009).[66] N. L. Wang et al., Phys. Rev. B 73, 184502 (2006).[67] T. Xiang et al., Phys. Rev. B 79, 014524 (2009).[68] A. Zimmers et al, Europhys. Lett. 70, pp. 225-231 (2005).[69] Y. Onose et al., Phys. Rev. Lett. 87, 217001 (2001).[70] S. Uchida et al., Phys. Rev. B, 43 7942 (1991).[71] S. Uchida et al., Phys. Rev. B 43, 7942 (1991).[72] Y. Onose et al., Phys. Rev. B, 69, 024504 (2004).[73] S. Lupi et al., Journal of superconductivity 17, 131
(2004).[74] T. Startseva et al., Phys Rev B 59, 7184 (1999).[75] N. Bontemps R.P.S.M. Lobo, A.F. Santander-Syro, A.
Zimmers, Annals of Physics 321, 1547 (2006).[76] A.M-S Tremblay, Private Communication.[77] Markiewicz et al, Phys. Rev. B 72, 054519 (2005).[78] Susmita Basak et al., Phys. Rev. B 80, 214520 (2009).[79] Philip Phillips, arXiv:1001.5270[80] Philip Phillips and Mark Jarrell, condmat/1003.3412

24
[81] Philip Phillips, Ting-Pong Choy, Robert G. Leigh, cond-mat/0905.4637.
[82] N. Bontemps, R.P.S.M. Lobo, A.F. Santander-Syro, A.Zimmers, Annals of Physics, 321 1547-1558 (2006).
[83] All calculations have been carried out at temperature
T = 89K when not specified.[84] For better comparison with experiments, we mapped the
ordered state calculations Aα(K, ω) to the paramagneticBrillouin zone, see Appendix A.