Structural MRI in Huntington's disease and recommendations for its potential use in clinical trials
11
Click here to load reader
Transcript of Structural MRI in Huntington's disease and recommendations for its potential use in clinical trials
R
Su
NFa
b
c
d
a
ARRA
KHNVCB
C
0h
Neuroscience and Biobehavioral Reviews 37 (2013) 480–490
Contents lists available at SciVerse ScienceDirect
Neuroscience and Biobehavioral Reviews
journa l h o me pa g e: www.elsev ier .com/ locate /neubiorev
eview
tructural MRI in Huntington’s disease and recommendations for its potentialse in clinical trials
ellie Georgiou-Karistianisa,1, Rachael Scahill b,1, Sarah J. Tabrizib,erdinando Squitieri c, Elizabeth Aylwardd,∗
School of Psychology and Psychiatry, Monash University, Clayton, Victoria 3800, AustraliaDepartment of Neurodegenerative Disease, University College London Institute of Neurology, London, United KingdomCentre for Neurogenetics and Rare Diseases, IRCCS Neuromed, Pozzilli, ItalySeattle Children’s Research Institute, Seattle, WA, United States
r t i c l e i n f o
rticle history:eceived 4 September 2012eceived in revised form 2 January 2013ccepted 22 January 2013
eywords:untington’s diseaseeuroimaging
a b s t r a c t
Huntington’s disease (HD) results in progressive impairment of motor and cognitive function and neu-ropsychiatric disturbance. There are no disease-modifying treatments available, but HD research isentering a critical phase where promising disease-specific therapies are on the horizon. Thus, a pressingneed exists for biomarkers capable of monitoring progression and ultimately determining drug effi-cacy. Neuroimaging provides a powerful tool for assessing disease progression. However, in order tobe accepted as biomarkers for clinical trials, imaging measures must be reproducible, robust to scannerdifferences, sensitive to disease-related change and demonstrate a relationship to clinically meaningful
olumetric analyseslinical trialsiomarkers
measures. We provide a review of the current structural imaging literature in HD and highlight incon-sistencies between studies. We make recommendations for the standardisation of reporting for futurestudies, such as appropriate cohort characterisation and documentation of methodologies to facilitatecomparisons and inform trial design. We also argue for an intensified effort to consider issues highlightedhere so that we have the best chance of assessing the efficacy of the therapeutic benefit in forestallingthis devastating disease.
© 2013 Published by Elsevier Ltd.
ontents
1. Introduction . . . . . . . . . . . . . . . . . . . . . . . . . . . . . . . . . . . . . . . . . . . . . . . . . . . . . . . . . . . . . . . . . . . . . . . . . . . . . . . . . . . . . . . . . . . . . . . . . . . . . . . . . . . . . . . . . . . . . . . . . . . . . . . . . . . . . . . . . 4812. Challenges in current published neuroimaging studies . . . . . . . . . . . . . . . . . . . . . . . . . . . . . . . . . . . . . . . . . . . . . . . . . . . . . . . . . . . . . . . . . . . . . . . . . . . . . . . . . . . . . . . . . . . . 4813. Neuroimaging of the basal ganglia . . . . . . . . . . . . . . . . . . . . . . . . . . . . . . . . . . . . . . . . . . . . . . . . . . . . . . . . . . . . . . . . . . . . . . . . . . . . . . . . . . . . . . . . . . . . . . . . . . . . . . . . . . . . . . . . . . 481
3.1. Summary. . . . . . . . . . . . . . . . . . . . . . . . . . . . . . . . . . . . . . . . . . . . . . . . . . . . . . . . . . . . . . . . . . . . . . . . . . . . . . . . . . . . . . . . . . . . . . . . . . . . . . . . . . . . . . . . . . . . . . . . . . . . . . . . . . . . . 4844. Neuroimaging of whole brain, CSF and cortex . . . . . . . . . . . . . . . . . . . . . . . . . . . . . . . . . . . . . . . . . . . . . . . . . . . . . . . . . . . . . . . . . . . . . . . . . . . . . . . . . . . . . . . . . . . . . . . . . . . . . . 484
4.1. Summary. . . . . . . . . . . . . . . . . . . . . . . . . . . . . . . . . . . . . . . . . . . . . . . . . . . . . . . . . . . . . . . . . . . . . . . . . . . . . . . . . . . . . . . . . . . . . . . . . . . . . . . . . . . . . . . . . . . . . . . . . . . . . . . . . . . . . 4855. Neuroimaging of white matter . . . . . . . . . . . . . . . . . . . . . . . . . . . . . . . . . . . . . . . . . . . . . . . . . . . . . . . . . . . . . . . . . . . . . . . . . . . . . . . . . . . . . . . . . . . . . . . . . . . . . . . . . . . . . . . . . . . . . . 485
5.1. Summary. . . . . . . . . . . . . . . . . . . . . . . . . . . . . . . . . . . . . . . . . . . . . . . . . . . . . . . . . . . . . . . . . . . . . . . . . . . . . . . . . . . . . . . . . . . . . . . . . . . . . . . . . . . . . . . . . . . . . . . . . . . . . . . . . . . . . 4856. Neuroimaging of other brain structures . . . . . . . . . . . . . . . . . . . . . . . . . . . . . . . . . . . . . . . . . . . . . . . . . . . . . . . . . . . . . . . . . . . . . . . . . . . . . . . . . . . . . . . . . . . . . . . . . . . . . . . . . . . . 485
6.1. Cingulate . . . . . . . . . . . . . . . . . . . . . . . . . . . . . . . . . . . . . . . . . . . . . . . . . . . . . . . . . . . . . . . . . . . . . . . . . . . . . . . . . . . . . . . . . . . . . . . . . . . . . . . . . . . . . . . . . . . . . . . . . . . . . . . . . . . . . 4856.2. Thalamus. . . . . . . . . . . . . . . . . . . . . . . . . . . . . . . . . . . . . . . . . . . . . . . . . . . . . . . . . . . . . . . . . . . . . . . . . . . . . . . . . . . . . . . . . . . . . . . . . . . . . . . . . . . . . . . . . . . . . . . . . . . . . . . . . . . . . 4856.3. Hippocampus . . . . . . . . . . . . . . . . . . . . . . . . . . . . . . . . . . . . . . . . . . . . . . . . . . . . . . . . . . . . . . . . . . . . . . . . . . . . . . . . . . . . . . . . . . . . . . . . . . . . . . . . . . . . . . . . . . . . . . . . . . . . . . . . 4856.4. Amygdala . . . . . . . . . . . . . . . . . . . . . . . . . . . . . . . . . . . . . . . . . . . . . . . . . . . . . . . . . . . . . . . . . . . . . . . . . . . . . . . . . . . . . . . . . . . . . . . . . . . . . . . . . . . . . . . . . . . . . . . . . . . . . . . . . . . . 4866.5. Summary. . . . . . . . . . . . . . . . . . . . . . . . . . . . . . . . . . . . . . . . . . . . . . . . . . . . . . . . . . . . . . . . . . . . . . . . . . . . . . . . . . . . . . . . . . . . . . . . . . . . . . . . . . . . . . . . . . . . . . . . . . . . . . . . . . . . . 486
7. Recommendations for neuroimaging studies . . . . . . . . . . . . . . . . . . . . . . . . . . . . . .7.1. Clinical cohort . . . . . . . . . . . . . . . . . . . . . . . . . . . . . . . . . . . . . . . . . . . . . . . . . . . . . .
7.2. Image acquisition . . . . . . . . . . . . . . . . . . . . . . . . . . . . . . . . . . . . . . . . . . . . . . . . . . .
∗ Corresponding author. Tel.: +1 206 884 1065; fax: +1 206 884 1210.E-mail address: [email protected] (E. Aylward).
1 Equal first authors.
149-7634/$ – see front matter © 2013 Published by Elsevier Ltd.ttp://dx.doi.org/10.1016/j.neubiorev.2013.01.022
. . . . . . . . . . . . . . . . . . . . . . . . . . . . . . . . . . . . . . . . . . . . . . . . . . . . . . . . . . . . . . . . . . . . . . . . . 486. . . . . . . . . . . . . . . . . . . . . . . . . . . . . . . . . . . . . . . . . . . . . . . . . . . . . . . . . . . . . . . . . . . . . . . . . 486
. . . . . . . . . . . . . . . . . . . . . . . . . . . . . . . . . . . . . . . . . . . . . . . . . . . . . . . . . . . . . . . . . . . . . . . . . 486
N. Georgiou-Karistianis et al. / Neuroscience and Biobehavioral Reviews 37 (2013) 480–490 481
7.3. Image analysis methodologies . . . . . . . . . . . . . . . . . . . . . . . . . . . . . . . . . . . . . . . . . . . . . . . . . . . . . . . . . . . . . . . . . . . . . . . . . . . . . . . . . . . . . . . . . . . . . . . . . . . . . . . . . . . . . . 4877.4. Statistical analysis . . . . . . . . . . . . . . . . . . . . . . . . . . . . . . . . . . . . . . . . . . . . . . . . . . . . . . . . . . . . . . . . . . . . . . . . . . . . . . . . . . . . . . . . . . . . . . . . . . . . . . . . . . . . . . . . . . . . . . . . . . . 487
8. Future studies . . . . . . . . . . . . . . . . . . . . . . . . . . . . . . . . . . . . . . . . . . . . . . . . . . . . . . . . . . . . . . . . . . . . . . . . . . . . . . . . . . . . . . . . . . . . . . . . . . . . . . . . . . . . . . . . . . . . . . . . . . . . . . . . . . . . . . . 4889. Conclusions . . . . . . . . . . . . . . . . . . . . . . . . . . . . . . . . . . . . . . . . . . . . . . . . . . . . . . . . . . . . . . . . . . . . . . . . . . . . . . . . . . . . . . . . . . . . . . . . . . . . . . . . . . . . . . . . . . . . . . . . . . . . . . . . . . . . . . . . . . 488
. . . . . .
1
ioaIgvacHiTcmciscomac(lpsc
ipasp(tratKrdctepdit
2
oahi
References . . . . . . . . . . . . . . . . . . . . . . . . . . . . . . . . . . . . . . . . . . . . . . . . . . . . . . . . . . . .
. Introduction
Huntington’s disease (HD) is an autosomal-dominantly inher-ted neurological condition resulting in progressive deteriorationf motor, cognitive and neuropsychiatric function. HD typicallyffects individuals in mid-life, having a 15–20 year disease course.ndividuals at risk of developing HD are able to undergo predictiveenetic testing and these ‘premanifest’ individuals have providedaluable insights into the natural history of this disease. HD has
devastating effect on patients and their families and there areurrently no disease-modifying therapies licensed for treatment.owever, HD research is entering a critical phase where promis-
ng novel disease-specific therapies are on the horizon (Ross andabrizi, 2011). There is, therefore, a pressing need for biomarkersapable of monitoring disease progression and ultimately deter-ining drug efficacy in clinical trials. To date, the most widely used
linical assessment in HD is the Unified Huntington’s Disease Rat-ng Scale (UHDRS) (Huntington Study Group, 1996). However, thiscale tends to have high inter-rater variability, is subject to floor andeiling effects and is relatively insensitive in the premanifest stagesf the disease. Recently there has been great interest in developingore objective, quantitative measures that might track progression
cross the disease spectrum including motor, cognitive, neuropsy-hiatric and imaging assessments (Weir et al., 2011). PREDICT-HDPaulsen et al., 2008) and TRACK-HD (Tabrizi et al., 2009) are twoarge multi-site studies that have sought to validate such tools inreparation for clinical trials, and both studies report strong effectizes for imaging measures even in the very earliest premanifestohorts (Aylward et al., 2011; Tabrizi et al., 2012).
In order for imaging measures to be accepted as biomarkers, its important to establish robust methodologies that track diseaserogression in a clinically meaningful way and are reproduciblecross multiple sites with different scanner manufacturers and fieldtrengths. There is a wide range of imaging modalities availableroviding information on macrostructural changes such as atrophye.g., structural MRI), microstructural processes such as demyelina-ion (e.g., diffusion weighted imaging), metabolic deficits (magneticesonance spectroscopy) and functional changes (PET and task-nd resting-state functional MRI). Studies are ongoing to establishhe relative merits of these approaches (for review see Georgiou-aristianis, 2009). However, at present, structural brain imagingemains the most widely applied technique and has the greatestocumentation of robust multi-site disease-related longitudinalhanges from up to 15 years prior to symptom onset througho established disease (Aylward et al., 2011; Georgiou-Karistianist al., 2013; Tabrizi et al., 2011). Although there are a number ofublished diffusion and functional imaging studies showing earlyisease-related dysfunction, we are yet to investigate the sensitiv-
ty of such measures in large scale longitudinal studies, so we limithis review to the existing structural imaging literature.
. Challenges in current published neuroimaging studies
There have been great advances in neuroimaging techniques
ver the last decade, and although reproducible group differencescross multiple sites and studies (e.g., TRACK-HD and PREDICT-HD)ave been demonstrated robustly, there remain a number of signif-cant challenges when comparing cross-sectional and longitudinal
. . . . . . . . . . . . . . . . . . . . . . . . . . . . . . . . . . . . . . . . . . . . . . . . . . . . . . . . . . . . . . . . . . . . . . . . . 488
findings across the published literature. Two main areas relateto the reporting of sample and neuroimaging characteristics (bothacquisition and image processing). The reported sample character-istics vary significantly across the literature, with very few studiesincluding more than 20 premanifest (pre-HD) or symptomatic HD(symp-HD) individuals. Despite this, significant findings have beenreported with small sample sizes. Moreover, clinical assessmentand reporting of such information is also highly variable (e.g., cal-culations of years to onset, disease burden scores, UHDRS scores,trinucleotide (“CAG”) repeat length, stages of symp-HD, meanage of sample). Challenges with published neuroimaging studiesinclude differences in scanner strength (e.g., 1.5 T vs. 3 T), scannertype (e.g., Siemens, GE and Phillips), image quality and acqui-sitions, variability in pre-processing/processing methods (e.g.,automated vs. manual), regions of interest (ROI) adopted, types ofstatistical analyses, quality control procedures, and presentationof data in publications. Moreover, when calculating effect sizes forspecific ROIs (e.g., caudate), standard information is required tocompare effect sizes across studies; there are a number of differentformulae for calculating effect sizes, making direct head to headcomparisons difficult. Such challenges highlight the need for astandard set of published guidelines as we move closer towardsidentifying sensitive and reliable biomarkers for clinical trials.
3. Neuroimaging of the basal ganglia
The most consistently investigated and reported neuropatho-logical characteristic of HD is a significantly progressive volumetricreduction of the striatum, the main input nucleus of the basal gan-glia (see Hersh et al., 2004; Vonsattel et al., 1985). These findingshave been confirmed and expanded in MRI studies, especially fromPREDICT-HD (Paulsen et al., 2008, 2010), TRACK-HD (Tabrizi et al.,2009, 2012), and IMAGE-HD (Georgiou-Karistianis et al., 2013). Vol-ume reduction in basal ganglia, particularly in the striatum, hasbeen well documented in pre-HD (Aylward et al., 1994, 1996, 2000,2004; Campodonico et al., 1998; Georgiou-Karistianis et al., 2013;Harris et al., 1999; Jurgens et al., 2008; Majid et al., 2011b; Paulsenet al., 2010; Sanchez-Castaneda et al., 2012; Tabrizi et al., 2009;Thieben et al., 2002) and symp-HD (Aylward et al., 2000, 1997;Georgiou-Karistianis et al., 2013; Ginestroni et al., 2010; Harriset al., 1992; Henley et al., 2009; Peinemann et al., 2005; Rosas et al.,2001; Ruocco et al., 2006; Sanchez-Castaneda et al., 2012; Tabriziet al., 2009; Vandenberghe et al., 2009). Cross-sectional PREDICT-HD data (Paulsen et al., 2010) suggest that striatal volume, whilstsmaller than that of gene-negative controls, remains fairly staticuntil about 15–20 years from estimated onset of diagnosable symp-toms, after which time atrophy is clearly observable and linearlyprogressive. Individuals at the time of diagnosis or shortly there-after have volumes equivalent to 43–67% of normal volume forputamen, 52–70% for caudate, 59–60% for nucleus accumbens, and59–62% for globus pallidus (Aylward et al., 2004; Van Den Bogaardet al., 2011).
Cross-sectional studies suggest that putamen volume reductionis somewhat greater than caudate volume reduction in pre-HD
(Majid et al., 2011b; Paulsen et al., 2010; Tabrizi et al., 2009) andearly-stage symp-HD (Harris et al., 1992; Rosas et al., 2003). Volumereductions in basal ganglia regions outside of the striatum (globuspallidus and nucleus accumbens) are generally found in symp-HD
4 e and
(B2Bsi
lnsid2cigc1epod(sf5HMtfHmristfsbmcsptb
tleatiaBsictstp
tgrh
82 N. Georgiou-Karistianis et al. / Neuroscienc
Ginestroni et al., 2010; Sanchez-Castaneda et al., 2012; Van Denogaard et al., 2011) and in some pre-HD studies (Jurgens et al.,008; Majid et al., 2011b; Sanchez-Castaneda et al., 2012; Van Denogaard et al., 2011) but not all (Harris et al., 1999). Most reportsuggest that basal ganglia structures outside of the striatum are notnvolved as early as caudate and putamen.
As would be predicted from the cross-sectional findings, largeongitudinal studies (PREDICT-HD and TRACK-HD) have shown sig-ificantly faster rates of decline in striatal volume in pre-HD andymp-HD individuals, compared with age-matched controls, evenn those individuals who are far from estimated clinical onset ofiagnosable symptoms (Aylward et al., 2011; Tabrizi et al., 2012,011). Results from PREDICT-HD (Aylward et al., 2011) show thataudate volume changed more quickly (2.4–4.1% per year, depend-ng on proximity to onset) than putamen (1.3–2.9% per year) orlobus pallidus (1.1–4.0% per year) in pre-HD. Annual rates ofhange vary across other smaller studies of pre-HD, ranging from.5% to 4.3% for caudate and from .95 to 3.1% for putamen (Aylwardt al., 2004; Majid et al., 2011b), with between-study differencesrobably attributable to differences in measurement methodol-gy. Significantly faster rates of longitudinal change have also beenemonstrated for symp-HD individuals, compared with controlsTabrizi et al., 2012, 2011; Vandenberghe et al., 2009). In a smallample of individuals with symp-HD, Vandenberghe et al. (2009)ound annual rates of change of 3.5% per year in putamen and.7% per year in caudate, in agreement with other studies of symp-D (Aylward et al., 1997) and pre-HD (Aylward et al., 2011, 2004;ajid et al., 2011b) that showed faster rate of atrophy in caudate
han putamen. This finding is, however, opposite to the findingrom TRACK-HD, where rates of change in both pre-HD and symp-D were greater in putamen than in caudate. However, differentethodologies were employed for the delineation of these two
egions which may account for discrepancies with previous find-ngs (when images were reanalysed using the same method for bothtructures, results indicated faster atrophy in the putamen thanhe caudate for pre-HD group, but faster atrophy in the caudateor early HD; Scahill, personal communication). Table 1 presents aummary of studies that have calculated sample sizes that woulde necessary for clinical trials using MRI volumetrics as outcomeeasures. Of the two studies that calculated sample sizes for both
audate and putamen volumes in pre-HD, one (Majid et al., 2011b)uggests that putamen volume would require much smaller sam-le sizes, whilst the other (Aylward et al., 2011) suggests that thewo regions would require similar sample sizes, with total striatumeing a more robust measure of change.
Examination of pre-HD individuals who subsequently went ono fulfil clinical criteria for a diagnosis of HD has shown that base-ine striatal volume (Aylward et al., 2012) and atrophy rates (Tabrizit al., 2012) are predictors of conversion. Putamen volume was
slightly stronger predictor of conversion to symptomatic statushan caudate volume (Aylward et al., 2012), although rate of changen caudate is somewhat stronger than rate of change in putamen as
measure of disease progression in pre-HD (Tabrizi et al., 2012).ecause these two studies did not use the same method to identifyubjects who were approaching onset of diagnosable symptoms,t is not possible to determine whether baseline volume or rate ofhange is a better measure for selecting subjects who may be closeo onset. These findings suggest, however, that measurement oftriatal volume may be helpful in selecting individuals for clinicalrials where delay of onset of diagnosable motor symptoms is therimary outcome measure.
Results from longitudinal studies are not consistent regarding
he question of whether rate of change increases with disease pro-ression. Previous studies suggest that once atrophy begins, theate remains fairly constant (Aylward et al., 2011). In TRACK-HD,owever, Tabrizi et al. (2011) showed step-wise increased ratesBiobehavioral Reviews 37 (2013) 480–490
of change from pre-HD through earlier and later stages of func-tional impairment, and highly significant correlations between rateof change and disease burden scores for caudate and putamen(Tabrizi et al., 2012, 2011), after controlling for age. In symp-HD,there was no significant correlation between amount of longitudi-nal change and measures of symptom severity or disease duration(Aylward et al., 1997). Hobbs et al. (2010a) also reported that cau-date atrophy rates in longitudinal analysis of data from small groupsof pre-HD and early stage symp-HD individuals were linear. Dif-ferences in methods for assessing longitudinal change (e.g., usingabsolute change vs. percentage change), as well as inclusion of ageas a covariate, may explain differences in findings regarding rateof change with disease progression. Conclusive evidence regardingthe issue of the stability of rate of change with disease progressionwill be important for understanding the impact of including indi-viduals with a wide range of disease progression in a single clinicaltrial. Increasing rates of atrophy with disease progression, if veri-fied, would suggest that limiting samples to a fairly narrow rangeof disease progression would result in more efficient clinical trials.Regardless, it is clear that clinical trials should not include indi-viduals who are greater than 15 years from estimated diagnosis,as rates of change in this subsample are reduced in comparison toindividuals who are further along in the disease process.
Several studies have examined the influence of CAG repeatlength on caudate volume and/or rate of loss. Since CAG repeatlength is known to have a strong influence on age at onset, it isimportant to include age effects in statistical models to ensure thatdifferences can be attributable to CAG alone. This is particularlyimportant in cross-sectional studies where differences in cross-sectional volume between different CAG repeat lengths may only bereflecting a difference in age and therefore disease staging. Henleyet al. (2009) report correlations between cross-sectional caudatevolume and CAG repeat length, after controlling for age. This effectwas less pronounced in the putamen. PREDICT-HD data demon-strate significant correlations between CAG repeat length and rateof change for caudate and total striatum, with a trend for puta-men (Aylward et al., 2011), corroborating results from other smallerlongitudinal studies (Aylward et al., 1997; Ruocco et al., 2008).
In addition to showing case-control differences and signifi-cant change over time, it is important for potential biomarkersto demonstrate correlations with other measures of disease pro-gression. In pre-HD, cross-sectional studies have shown strongcorrelations between striatal volumes and measures of proxim-ity to diagnosable motor impairment (Aylward et al., 1996; Majidet al., 2011b; Paulsen et al., 2008, 2010). In both pre-HD (VanOostrom et al., 2005) and symp-HD (Henley et al., 2009), signifi-cant correlations have been found between striatal volumes andmeasures of “disease burden” (either calculated from CAG and age,or performed as a correlation between structure volumes and CAG,whilst correcting for age). Two studies found a significant corre-lation between disease duration and caudate volume (Ginestroniet al., 2010; Hobbs et al., 2010a), but others did not (Peinemannet al., 2005; Ruocco et al., 2006); this discordance may reflect thevariability in determining disease duration accurately.
In pre-HD individuals, significant associations have been foundbetween measures of motor impairment and putamen (Aylwardet al., 1994, submitted for publication; Campodonico et al., 1998;Van Den Bogaard et al., 2011), caudate (Aylward et al., 1994,submitted for publication; Van Den Bogaard et al., 2011), total stri-atum (Paulsen et al., 2010), globus pallidus (Aylward et al., 1994,submitted for publication; Jurgens et al., 2008; Majid et al., 2011b;Van Den Bogaard et al., 2011), and nucleus accumbens (Aylward
et al., submitted for publication; Van Den Bogaard et al., 2011).In symp-HD, significant correlations were found between UHDRStotal motor score and volume of putamen (Ruocco et al., 2006; VanDen Bogaard et al., 2011), caudate (Ruocco et al., 2008), nucleus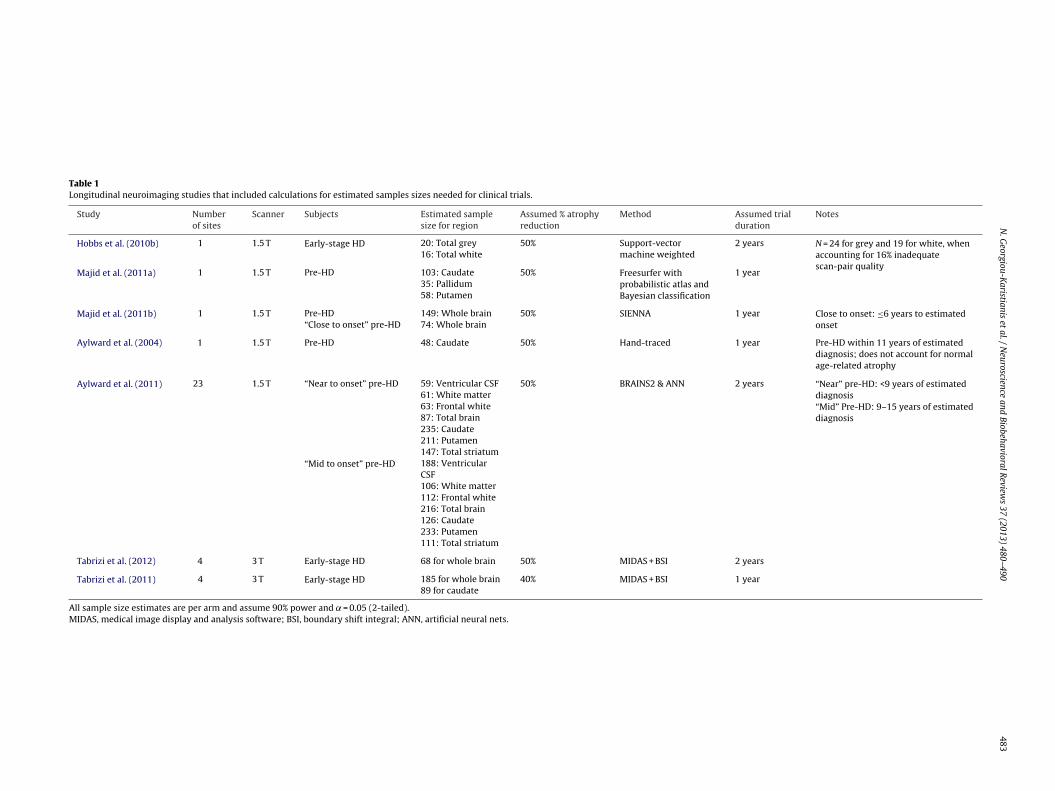
N.
Georgiou-K
aristianis et
al. /
Neuroscience
and Biobehavioral
Review
s 37
(2013) 480–490
483
Table 1Longitudinal neuroimaging studies that included calculations for estimated samples sizes needed for clinical trials.
Study Numberof sites
Scanner Subjects Estimated samplesize for region
Assumed % atrophyreduction
Method Assumed trialduration
Notes
Hobbs et al. (2010b) 1 1.5 T Early-stage HD 20: Total grey 50% Support-vectormachine weighted
2 years N = 24 for grey and 19 for white, whenaccounting for 16% inadequatescan-pair quality
16: Total white
Majid et al. (2011a) 1 1.5 T Pre-HD 103: Caudate 50% Freesurfer withprobabilistic atlas andBayesian classification
1 year35: Pallidum58: Putamen
Majid et al. (2011b) 1 1.5 T Pre-HD 149: Whole brain 50% SIENNA 1 year Close to onset: ≤6 years to estimatedonset“Close to onset” pre-HD 74: Whole brain
Aylward et al. (2004) 1 1.5 T Pre-HD 48: Caudate 50% Hand-traced 1 year Pre-HD within 11 years of estimateddiagnosis; does not account for normalage-related atrophy
Aylward et al. (2011) 23 1.5 T “Near to onset” pre-HD 59: Ventricular CSF 50% BRAINS2 & ANN 2 years “Near” pre-HD: <9 years of estimateddiagnosis61: White matter
63: Frontal white “Mid” Pre-HD: 9–15 years of estimateddiagnosis87: Total brain
235: Caudate211: Putamen147: Total striatum
“Mid to onset” pre-HD 188: VentricularCSF106: White matter112: Frontal white216: Total brain126: Caudate233: Putamen111: Total striatum
Tabrizi et al. (2012) 4 3 T Early-stage HD 68 for whole brain 50% MIDAS + BSI 2 years
Tabrizi et al. (2011) 4 3 T Early-stage HD 185 for whole brain 40% MIDAS + BSI 1 year89 for caudate
All sample size estimates are per arm and assume 90% power and ˛ = 0.05 (2-tailed).MIDAS, medical image display and analysis software; BSI, boundary shift integral; ANN, artificial neural nets.
4 e and
a(abfa
biPeeesareehswrwimassuvwtncm
poBlfrme2mmmas(t(pna
3
atss1p
84 N. Georgiou-Karistianis et al. / Neuroscienc
ccumbens (Van Den Bogaard et al., 2011), and globus pallidusVan Den Bogaard et al., 2011). In a combined sample of pre-HDnd symp-HD, Scahill et al. (2013) found significant correlationsetween striatal volumes and specific motor measures (tongueorce, metronome tapping precision, antisaccade error rate), evenfter controlling for disease burden.
In pre-HD, significant correlations have also been demonstratedetween striatal volume measures and cognitive measures, includ-
ng measures of cognitive flexibility (Campodonico et al., 1998;aulsen et al., 2010), psychomotor speed and attention (Aylwardt al., submitted for publication; Campodonico et al., 1998; Jurgenst al., 2008; Paulsen et al., 2010) and verbal recall memory (Aylwardt al., submitted for publication; Campodonico et al., 1998). Inymp-HD, correlations have been found between caudate volumesnd measures of psychomotor speed (Ginestroni et al., 2010), factecall accuracy and source memory (Brandt et al., 1995), verbal flu-ncy (Ginestroni et al., 2010), and executive function (Peinemannt al., 2005). As part of IMAGE-HD, Georgiou-Karistianis et al. (2013)ave shown that a quadradic discriminatory analysis demon-trated highly accurate discrimination of pre-HD from controlshen both volumetric and diffusion data sets from basal ganglia
egions were used. The highest discriminative accuracy howeveras achieved in a multi-modality approach and when includ-
ng all available measures: motor and neurocognitive scores andulti-modal MRI measures from the basal ganglia, accumbens
nd thalamus. Aylward et al. (submitted for publication) foundome evidence supporting earlier findings that putamen volume islightly more strongly correlated than caudate volume with meas-res of motor impairment; caudate, putamen and globus pallidusolumes were all highly correlated with various cognitive tasks,ith no evidence that one structure was particularly more involved
han the others in cognitive function. To date, however, there areo studies that have examined correlations between longitudinalhange in MRI volumetric measures and longitudinal change ineasures of disease progression.Measures of caudate, nucleus accumbens, putamen, and globus
allidus volume have been found to correlate with measuresf functional capacity in symp-HD (Rosas et al., 2003; Van Denogaard et al., 2011), but not pre-HD, where there is relatively
ittle variability in functional capacity (Aylward et al., submittedor publication; Van Den Bogaard et al., 2011). Generally no cor-elations have been found between basal ganglia volumes andeasures of psychiatric impairment in either pre-HD (Aylward
t al., submitted for publication; Jurgens et al., 2008; Paulsen et al.,010) or symp-HD (Jurgens et al., 2008; Scahill et al., 2013). Thisay be the result of floor effects on measures of psychiatric impair-ent (especially in pre-HD) and a small range of values in theseeasures, leading to insufficient power to detect correlations. In
ddition, subjects’ use of psychotropic medication may treat theymptoms we aim to detect and even affect MRI volume measuresScahill et al., 2013). This may be especially true for neurolep-ic medications that are known to increase basal ganglia volumeBrandt and Bonelli, 2008). Measures that are designed to assesssychiatric impairments specifically associated with HD may beecessary in order to document associations with measures of braintrophy.
.1. Summary
The bulk of neuroimaging studies in HD demonstrate that stri-tal volume measurements possess characteristics that qualifyhem as potential biomarkers in clinical trials in both pre-HD and
ymp-HD. These measures can discriminate cases from controls,how significant longitudinal change (commencing approximately5 years before estimated onset of diagnosable motor impairment),redict meaningful clinical outcomes, and correlate strongly withBiobehavioral Reviews 37 (2013) 480–490
measures of cognitive and motor (but not psychiatric) impairment.Effect sizes suggest that striatal measures provide sample sizeswhich are feasible for large-scale clinical trials.
4. Neuroimaging of whole brain, CSF and cortex
Whilst early involvement of the striatum is well-documented(Aylward et al., 2004; Ciarmiello et al., 2006; Harris et al., 1999),recently evidence has emerged suggesting there is also widespreadcortical involvement in the HD degenerative process. Both cross-sectional and longitudinal global measures such as whole-brainatrophy (Aylward et al., 1998, 2011; Henley et al., 2009; Paulsenet al., 2010; Rosas et al., 2003; Tabrizi et al., 2012; Wild et al.,2010), grey matter loss (Ruocco et al., 2008; Tabrizi et al., 2012)and CSF expansion (Hobbs et al., 2010a; Paulsen et al., 2010; Tabriziet al., 2012) have proved sensitive to disease-related changes inearly HD, yet the sensitivity of these measures in the pre-HD stagesis less well established. Cross-sectional whole-brain and grey-matter volume reductions have been reported in pre-HD cohorts(Paulsen et al., 2010; Tabrizi et al., 2009; Thieben et al., 2002). Somelongitudinal studies failed to show pre-HD differences in rate ofwhole-brain atrophy (Henley et al., 2009; Wild et al., 2010) or corti-cal grey matter atrophy (Aylward et al., 2011) whilst several studiesreport significantly elevated rates of whole-brain and grey-matteratrophy in pre-HD individuals (Majid et al., 2011b; Tabrizi et al.,2012); discrepancies between these studies are likely to be dueto differences in sample size and time to onset between pre-HDcohorts.
Other techniques seek to measure the thickness of the cortex,and Freesurfer has shown reduced cross-sectional cortical thick-ness in both early symp-HD (Rosas et al., 2002; Tabrizi et al., 2009)and pre-HD cohorts (Nopoulos et al., 2010; Rosas et al., 2005;Tabrizi et al., 2009). In addition to thinning of the sulci, Nopou-los et al. also reported enlargement of the gyral crowns in pre-HDindividuals, suggesting possible neurodevelopmental abnormality(Nopoulos et al., 2007). However, automated techniques such asFreesurfer may introduce systematic errors in some regions of thecortex (Hobbs et al., 2011), and validation of this finding is required.To date there has only been one report of longitudinal change incortical thickness, which showed differences in rates of thinningdependent on age of onset (Rosas et al., 2011). However, this waslimited to a small sample at a single site and did not include con-trol rates. Further validation of this methodology for longitudinalanalysis is required.
Cross-sectional measures of cortical volume correlate with var-ious measures of disease state and severity including diseaseburden (Paulsen et al., 2010; Tabrizi et al., 2009) and UHDRS score(Ruocco et al., 2006). Correlations have been found between cor-tical thinning in specific regions and measures of cognitive andmotor function in both pre-HD and symp-HD (Bechtel et al., 2010;Peinemann et al., 2005; Rosas et al., 2005). However, ROI meth-ods that assess larger areas of cortical volume find no correlationswith measures of cognition or motor function in pre-HD (Aylwardet al., submitted for publication). No association has been observedbetween cortical volumes and measures of psychiatric impairmentin pre-HD (Aylward et al., submitted for publication) or in a com-bined sample of pre-HD and symp-HD (Scahill et al., 2013). Globalmeasures appear to have predictive power in determining whichpre-HD individuals are likely to subsequently go on to fulfil clin-ical criteria for HD, with whole-brain and grey matter sensitiveto disease progression in those close to symptom onset (Tabrizi
et al., 2012). Variations in patterns of cortical thinning have alsobeen linked to specific phenotypes in HD and it is possible thatthese measures may be useful in understanding the considerableheterogeneity in clinical presentation (Rosas et al., 2011, 2008).
e and
4
rgoatwhfats
5
Wgapee22eWpc2
s2gfw(ts2r
ct2WfcsR((PoiiIfs
5
H
N. Georgiou-Karistianis et al. / Neuroscienc
.1. Summary
There is growing evidence that HD pathology affects manyegions outside the striatum. Global measures of whole-brain andrey-matter atrophy are sensitive even in the premanifest stagesf the disease. Likewise, cortical thickness appears to be reducedcross the spectrum of disease, but longitudinal change using thisechnique requires validation. Cortical loss appears to correlateith disease severity and may help our understanding of clinicaleterogeneity. Nevertheless, effect sizes remain smaller than those
or the striatal regions (Paulsen et al., 2010; Tabrizi et al., 2012). It islso possible that such measures may prove useful in assessment ofherapies targeting non-striatal regions or aiming to reduce specificymptoms such as bradykinesia.
. Neuroimaging of white matter
Recently, there has been accumulating evidence to suggest thatM degeneration may be an important feature in the HD neurode-
enerative process. Whilst some studies have failed to detect WMtrophy in early HD (Bohanna et al., 2011; Sritharan et al., 2010) orre-HD individuals (Rosas et al., 2006), there is now considerablevidence that WM atrophy is evident in both early HD (Aylwardt al., 1998; Beglinger et al., 2005; Halliday et al., 1998; Rosas et al.,003; Tabrizi et al., 2009) and pre-HD individuals (Aylward et al.,011; Ciarmiello et al., 2006; Paulsen et al., 2006, 2010; Tabrizit al., 2009; Thieben et al., 2002). Some studies have reportedM atrophy in specific WM structures (e.g., subregions of the cor-
us callosum) although one study found no differences in corpusallosum thickness in pre-HD compared with controls (Rosas et al.,010).
Longitudinal studies have provided further evidence of the sen-itivity of white matter measures across pre-HD (Aylward et al.,011; Ruocco et al., 2008; Tabrizi et al., 2011) and early symp-HDroups (Hobbs et al., 2010b; Tabrizi et al., 2011). Tabrizi et al. (2011)ound most prominent changes in WM around the striatum andithin the corpus callosum and posterior WM-tract; Aylward et al.
2011), using grosser measures of WM, found greatest change inhe frontal lobe. WM volume reductions were not observed in twomaller longitudinal studies of pre-HD individuals (Hobbs et al.,010b; Kipps et al., 2005), suggesting larger samples are perhapsequired to detect WM differences in this cohort.
WM atrophy has been shown to have an association with age-orrected CAG repeat length (Jech et al., 2007) and estimatedime to disease onset (Paulsen et al., 2010; Rizk-Jackson et al.,011). Numerous studies have also shown correlations betweenM degeneration and clinical measures including UHDRS total
unctional capacity (Della Nave et al., 2010; Rosas et al., 2011),horea scores (Halliday et al., 1998), motor function (Aylward et al.,ubmitted for publication; Jech et al., 2007; Paulsen et al., 2010;osas et al., 2006; Scahill et al., 2013), oculomotor impairmentKlöppel et al., 2008; Scahill et al., 2013) and cognitive functionAylward et al., submitted for publication; Beglinger et al., 2005;aulsen et al., 2010; Scahill et al., 2013). No association has beenbserved between regional white matter volume and psychiatricmpairment in pre-HD (Aylward et al., submitted for publication) orn a combined sample of pre-HD and symp-HD (Scahill et al., 2013).n addition, WM atrophy has been shown to have value in identi-ying pre-HD individuals who will subsequently develop clinicalymptoms (Aylward et al., 2012; Tabrizi et al., 2012).
.1. Summary
A large body of literature reports WM changes in both pre-D and symp-HD. The large longitudinal studies (PREDICT-HD and
Biobehavioral Reviews 37 (2013) 480–490 485
TRACK-HD) have demonstrated that WM atrophy can be detectedduring the premanifest period, can be reliably tracked longitudi-nally over 12 and 24 month periods, and correlates with clinicalcharacteristics, making it a strong candidate as an outcome mea-sure for future clinical trials. WM around the striatum, in the corpuscallosum, and in frontal lobe may be the most sensitive to longitu-dinal change. Effect size estimates vary, depending on disease stageand specific ROI, but they are comparable to those of striatal vol-umes and may provide complementary information on therapeuticeffects since they reflect connections with the striatal regions.
6. Neuroimaging of other brain structures
6.1. Cingulate
Pathological studies report cell loss in the cingulate (Thu et al.,2010), yet structural studies have produced conflicting results.Cross-sectional Freesurfer analysis has suggested increased thick-ness in the anterior cingulate in early HD (Nopoulos et al., 2010;Rosas et al., 2008), but both cross-sectional (Henley et al., 2009;Hobbs et al., 2011; Politis et al., 2011) and longitudinal (Ruoccoet al., 2008) studies have demonstrated volume reduction in similarcohorts. Cingulate atrophy appears to be a less sensitive measurein pre-HD (Hobbs et al., 2011; Politis et al., 2011). Cingulate vol-ume, corrected for age, gender, and intracranial volume, correlateswith CAG length (Henley et al., 2009), emotional processing, visualworking memory and depression (Hobbs et al., 2011), suggesting aclose association between volume reduction and increased disease-related functional impairment.
6.2. Thalamus
Neuropathological studies have highlighted cell loss in the thal-amus, with volume reductions estimated at approximately 28% byend stage disease (Vonsattel and DiFiglia, 1998). As with the cingu-late, there have been conflicting reports in the literature regardingstructural loss, likely due to methodological differences. An earlystudy using an ROI approach suggested relative sparing of thethalamus, even showing non-significantly larger volumes in earlysymp-HD than in controls (Rosas et al., 2003). However, subsequentstudies employing voxel-based morphometry (VBM; Douaud et al.,2006; Gavazzi et al., 2007; Muhlau et al., 2007; Wolf et al., 2009)and FSL’s FIRST (http://www.fmrib.ox.ac.uk/fsl/) segmentation tool(Van Den Bogaard et al., 2011) support the suggestion that there issignificant atrophy in symp-HD individuals, and there is even evi-dence of very early premanifest atrophy (Paulsen et al., 2006; VanDen Bogaard et al., 2011). Longitudinal change has similarly beenshown in early symp-HD (Hobbs et al., 2010b) and pre-HD indi-viduals (Aylward et al., 2011; Majid et al., 2011b). However, effectsizes were small compared with other subcortical structures. Rateof atrophy in the thalamus appears to be inversely related to CAGlength (Hobbs et al., 2010b), and thalamic volume has shown asso-ciations with UHDRS (Ruocco et al., 2007), total motor score (VanDen Bogaard et al., 2011) and cognition (Kassubek et al., 2005).
6.3. Hippocampus
The hippocampus is known to be affected by other neurodegen-erative pathologies such as Alzheimer’s disease, but has generallybeen thought to be relatively preserved in HD. Nevertheless, volu-metric MRI studies have demonstrated atrophy in early symp-HD
(Van Den Bogaard et al., 2011) with volume reduction estimates ofapproximately 9% (Rosas et al., 2003). Cross-sectional differenceshave been identified prior to symptom onset (Van Den Bogaardet al., 2011), although a more recent study failed to replicate these
4 e and
pgb(ta2
6
ss2bFccrnde
6
tbldaisHpbwtr2efhsu
7
tttemMceadtbi
od
86 N. Georgiou-Karistianis et al. / Neuroscienc
remanifest volumetric differences and did not find significant lon-itudinal change (Majid et al., 2011b). Hippocampal volume haseen shown to correlate with clinical scores such as the total UHDRSJech et al., 2007) as well as subscores, the total motor score andotal functional capacity scale (Van Den Bogaard et al., 2011). Inddition, associations with impaired emotion recognition (Ille et al.,011) and olfaction (Scahill et al., 2013) have been reported.
.4. Amygdala
Amygdala volume reduction of approximately 24% in earlyymp-HD has been reported (Rosas et al., 2003), and both cross-ectional (Douaud et al., 2006; Majid et al., 2011b; Thieben et al.,002) and longitudinal (Majid et al., 2011b) group differences haveeen found in pre-HD individuals. However, a recent study usingIRST failed to find volume loss in early symp-HD using a largeohort (Van Den Bogaard et al., 2011). Despite the expected asso-iation with emotion processing, two VBM studies failed to show aelationship between volumetric loss and impaired emotion recog-ition (Henley et al., 2008; Scahill et al., 2013), although anotheremonstrated a correlation with recognition of happiness (Kippst al., 2007).
.5. Summary
There is clearly a greater discrepancy in the reporting of struc-ural damage to these other brain regions than is the case with theasal ganglia structures. Some of these structures are also particu-
arly problematic to segment reliably due to difficulty in boundaryefinition (e.g., in the thalamus) or large inter-individual vari-bility in morphology (e.g., the cingulate). In addition to greaternherent morphological variation, neuropathological studies alsouggest greater inter-individual variability in the distribution ofD pathology within these structures compared with, for exam-le, the striatum (Vonsattel and DiFiglia, 1998). Whilst atrophy haseen demonstrated in most of these structures in symp-HD, theyould appear to be less sensitive than the basal ganglia in detec-
ing premanifest change. There are few longitudinal studies of theseegions (Aylward et al., 2011; Hobbs et al., 2010b; Majid et al.,011b; Ruocco et al., 2008) and a relatively poor understandingxists of the clinical correlates of these volumetric changes. Furtherollow-up data are required, but the methodological challenges andeterogeneity in atrophy patterns, coupled with the relative insen-itivity of these regions to premanifest change, currently limit theirtility as biomarkers for clinical trials.
. Recommendations for neuroimaging studies
From our review of neuroimaging studies in HD, we concludehat there are sufficient data to justify consideration of struc-ural MRI metrics as potential outcome measures in future clinicalrials in both pre-HD and symp-HD. Reproducible group differ-nces (cases vs. controls) have been found in many structural MRIeasures, even in individuals who are far from onset. StructuralRI measures that show the most robust longitudinal change (in
omparison with age-matched controls) from our review of the lit-rature include basal ganglia (particularly caudate) and WM, andre more robust in individuals who are within a decade of estimatediagnosis, as compared to those who are farther from onset. Longi-udinal studies have been used to estimate sample sizes that woulde necessary for clinical trials using such measures, as summarised
n Table 1.Despite the increasing acknowledgement of the potential role
f neuroimaging in future clinical trials in HD, there are still clearlyiscrepancies between studies, limiting somewhat our ability to
Biobehavioral Reviews 37 (2013) 480–490
make conclusive recommendations for trial design. Table 1 illus-trates the wide range of sample size estimates published to date,even when the same region is considered. The following are someof the issues to be considered when designing an imaging studyand we provide recommendations for information to be included inpublications to reduce bias and ensure appropriate interpretationwithin the context of the existing literature:
7.1. Clinical cohort
The discrepancies between previous imaging studies may, inpart, be due to differences in the clinical characteristics of the studycohort. For example, several studies fail to report group differencesin pre-HD cohorts where others have. Clearly, if sample sizes aresmall, or the pre-HD group is far from estimated time to onset, it willbe more challenging to detect disease effects. It is also importantto consider other factors which may confound results, particularlyif making comparisons across different gene-positive groups. Dif-ferences in age, CAG repeat length, motor score, etc. are all likelyto exert an effect on imaging measures, so need to be matched oradjusted for in the study design.
It is possible that a study may limit its focus to a narrow clin-ical group (e.g., those with a high CAG repeat number, or withina defined disease burden range or disease duration). There isconflicting evidence in the literature as to whether rate of changevaries depending on CAG repeat length or disease stage; but if cer-tain individuals do have faster rates of atrophy, it is possible thatclinical trials could be conducted with smaller samples or shorterduration if the sample was to be restricted to this subpopulation.However, it is important to keep in mind that restricting the sampleto such cohorts may require more sites and may slow recruitmentefforts. In addition, high-CAG cohorts are usually younger withmore rapidly progressive disease, and individuals may thereforebe difficult to retain in clinical trials. It is also important to pro-vide details on the number of subjects initially recruited, as wellas those included in the final analysis, ideally with reasons fornon-inclusion. There may be a bias in the sample population (e.g.,individuals approaching disease onset may be more likely to dropout of studies). Whilst subject attrition is unavoidable, it is usefulto document so that readers can take an informed view on howrepresentative the study population is.
Recommendation for inclusion in all publications:
• detailed subject demographics including age, gender, CAG repeatlength, estimated time to disease onset in the case of pre-HD sub-jects and appropriate measures of disease severity such as motorscore,
• number of subjects recruited, and• study dropout with reasons if available.
7.2. Image acquisition
Researchers will need to consider the most appropriate imagingmodality to answer the specific questions they are interested in. Asdescribed above, in terms of validated biomarkers, structural imag-ing remains the most widely accepted modality. However, othermodalities may provide more information about microstructuralchange (e.g., DTI) neuronal health (e.g., MRS), or compensatorynetworks (e.g., fMRI), which may be more appropriate for certainapplications.
It is also important to optimise image acquisition for themethodology which is to be employed. Choice of scanner manu-
facturer, field strength and acquisition parameter will all influenceimage quality. Sample size estimates presented in Table 1 suggestthat single-site studies have larger case-control effect sizes for lon-gitudinal change than multi-site studies, but this limitation may
e and
nElisd
tvbtatweat
•••••
•
7
tqabbebtpilaimrtaFoebRlittiVonttTcre
N. Georgiou-Karistianis et al. / Neuroscienc
ot be practical for studies requiring large numbers of subjects.nsuring consistency of acquisition across multiple sites is a chal-enge and a thorough investigation of scanner effects is required. Its also important to ensure that there is a balance of groups acrosscanner sites and that there is no systematic bias introduced byifferent study groups being scanned on different scanners.
Obviously, longitudinal consistency in scanner type and acquisi-ion, especially within the same individual, is important in reducingariability. Research is still needed to determine the optimal num-er of time points, optimal interscan interval, whether sensitivityo change is increased by increasing the number of time points,nd the optimal method for combining measures from multipleime points (Frost et al., 2008). Software upgrades are inevitablehen MRI studies are conducted over long time intervals; how-
ver, efforts to assess consistency in scan acquisition across sitesnd over time, including the use of phantoms and repeat scans onhe same individuals, are advisable.
Recommendation for inclusion in all publications:
number of sites and scanner manufacturer,field strength,image acquisition parameters,scan interval,details of any changes to scanner hardware, software or imageacquisition parameters over the study time course, andnumber of scans excluded due to poor quality.
.3. Image analysis methodologies
Selection of appropriate image analysis methodology is essen-ial in generating robust, reliable results. This will depend on theuestion being answered (e.g., different regions may be appropri-te for different disease stages) and also the images which haveeen acquired. Methodologies for structural imaging can broadlye divided into whole-brain or ROI approaches; ROI analysis canither be automated, using templates of specific brain regions, ore done with manual tracing. Manual tracing of ROIs has the advan-age of allowing an expert to determine where the boundaries of aarticular region lie. However, this requires considerable training,
s extremely time-consuming and is subject to operator error andapses in consistency of measurement over time. Robust protocolsre required to define boundaries, and high degrees of inter- andntra-rater reliability must be achieved. Realistically, automated
ethods will be necessary and optimal for analysis of large samplesequired for clinical trials. These techniques use features withinhe scan to guide software to delineate structures without oper-tor input. Automated whole-brain analysis methods (e.g., VBM,reesurfer cortical thickness measures) allow investigation with-ut a priori decisions about which regions to examine (see Klöppelt al., 2009, for a description of some of the most common whole-rain methods). Automated methods, whether for assessment ofOIs or whole brain, clearly reduce workload and can be applied to
arge numbers of scans in a relatively short time. However, theres a need for such techniques to be rigorously validated to ensurehey do not introduce systematic errors (e.g., increased segmenta-ion errors in atrophic brains). For specific ROIs, validation shouldnvolve comparison with measures performed by hand-tracing.alidation is more difficult for whole-brain methods, such as VBMr Freesurfer measures of cortical thickness. Whilst these tech-iques have conventionally been used to provide information onhe regional distribution of atrophy using statistical maps, quan-ifiable metrics will be required for clinical trial outcomes (e.g.,
abrizi et al., 2012). These metrics must conform to the sameriteria that have been imposed on ROI studies (e.g., test-retesteliability, case-control differences, significant longitudinal change,tc.). Some automated techniques (e.g., BRAINS and its more recentBiobehavioral Reviews 37 (2013) 480–490 487
versions; Magnotta et al., 2002) can use carefully defined manualdelineations to train the computer, improving subsequent auto-mated segmentations of new scans.
There may be many different options within a software package(e.g., constraints within registration techniques, levels of smooth-ing, etc.) and these can introduce another source of bias (Henleyet al., 2010). There should be sound rationale for selecting param-eters, and these should be articulated in research publications.Irrespective of whether segmentations are generated manually orautomatically, quality control of all regions should routinely beperformed, including individual inspection of all segmentations bytrained raters.
Recommendation for inclusion in all publications:
• for ROI methods: details of segmentation protocol and structureboundaries,
• for automated techniques: software and version number, plat-form used, details of co-registration methods, use and details ofstandardised atlases,
• for automated whole-brain methods (e.g., VBM, Freesurfer): useof modulated vs. unmodulated data; size of smoothing kernel,and ̨ level (see Henley et al., 2010),
• documentation of validation studies, with validity data providedfor the specific population of subjects under study,
• documentation of inter- and intra-rater reproducibility for thespecific population of subjects under study, and
• details of quality control procedures and number of scansexcluded due to segmentation failure.
7.4. Statistical analysis
In addition to variations in image acquisition and methodology,statistical analysis also clearly has a critical influence on the resultsproduced. Factors known to influence brain volume, such as ageand sex, should always be taken into account in statistical models.For cross-sectional comparisons a measure of head size (e.g., totalintracranial volume) should also be included as a covariate. Somelongitudinal studies have also controlled for intracranial volume(Hobbs et al., 2010a; Squitieri et al., 2009; Vandenberghe et al.,2009), yet this covariate is often omitted, presumably because itshould remain constant between baseline and follow-up. Some ofthe longitudinal studies listed in Table 1 controlled for sex (Aylwardet al., 2011; Hobbs et al., 2010b; Tabrizi et al., 2011), age (Aylwardet al., 2011; Hobbs et al., 2010b; Tabrizi et al., 2011), and studysite (Aylward et al., 2011; Tabrizi et al., 2011), whilst other stud-ies used no covariates (Aylward et al., 2004; Majid et al., 2011a,b).Of course, interscan interval is a necessary covariate if exact timebetween scans varies across subjects. Controlling for either CAGrepeat length or disease burden would only be reasonable in sam-ples where these variables correlate with rate of change (which hasnot been consistently demonstrated).
Although assessing longitudinal change would appear to be afairly straight-forward calculation, previous studies have employeddifferent formulae and different denominators. Some of the longi-tudinal studies listed in Table 1, for example, used percent volumechange [(volume change/baseline volume)] (Majid et al., 2011a,b;Tabrizi et al., 2012, 2011) whilst others used absolute volumechange (Aylward et al., 2011, 2004).
Statistical methods for comparing cases and controls haveincluded t-tests or nonparametric tests on absolute or percentvolume change, repeated measures ANOVA (with or without
covariates), linear mixed models, and generalised estimating equa-tions, as well as voxel-based methods. Justification can be made forall of these approaches, but additional investigation into the effectsof these approaches on the assessment of change would be useful.
4 e and
sHatwrb
••••
8
iraifat
•
•
•
•
tdMtsi2iDifH
9
eiocmdiOed
88 N. Georgiou-Karistianis et al. / Neuroscienc
There are also a number of different methods for calculatingample sizes for clinical trials. It is assumed that treatments forD will reduce disease-related atrophy, but not normal age-relatedtrophy. Age effects should, therefore, be taken into account, as ishe case with most of the studies in Table 1; omitting this factorill most likely lead to an underestimate of the number of subjects
equired for clinical trials. Projected dropout of subjects should alsoe considered when making sample size calculations.
Recommendation for inclusion in all publications:
type of statistical model employed,all covariates included,formula for calculating rate of change, andfactors included in sample size calculations.
. Future studies
Although several large-scale MRI studies have been conductedn pre-HD and symp-HD, there are still several questions thatemain to be answered. Some of these questions may be bestddressed though analyses that combine data from multiple stud-es, which will be facilitated by the availability of MRI data from,or example, in the USA federally mandated repositories of datacquired through NIH-funded studies. Specific questions that needo be addressed include:
What method of image analysis is most suitable for obtainingmeasures for clinical trials? This will involve assessment of valid-ity, reliability, cost-effectiveness, and effect sizes derived fromthese different methods.Which regional measure (or combination of measures) shows thestrongest effect size for longitudinal change at various stages ofdisease progression?What method of assessing longitudinal change results in thestrongest effect size for cases vs. controls?What covariates should be included in longitudinal studies toyield the strongest effect sizes for cases vs. controls?
In addition to answering these questions that are directly relatedo structural MRI methodology, it will be important to continueevelopment and validation of other neuroimaging (e.g., fMRI, DTI,RS, and PET) and non-neuroimaging measures that are sensi-
ive to disease progression, as demonstrated through longitudinaltudies. Whilst structural MRI demonstrates significant atrophyn time periods of 12 and 24 months in pre-HD (Tabrizi et al.,011, 2012), few clinical measures have been found to show signif-
cant longitudinal change across these relatively short durations.evelopment of more sensitive measures of clinical progression,
ncluding cognitive, motor, psychiatric, and functional measures,acilitate validation of treatment effectiveness, especially in pre-D.
. Conclusions
Here we provide a detailed review of the structural imaging lit-rature to date in HD, highlight discrepancies between studies, anddentify possible explanations for these inconsistencies. We rec-mmend that future neuroimaging publications provide detailedharacterisation of cohorts, together with clear documentation ofethodologies to facilitate comparisons and inform clinical trial
esign. We argue for an intensified effort to overcome various
ssues still outstanding as we move closer towards clinical trials.nly in this way will we have the best chance of assessing thefficacy of the therapeutic benefit in forestalling this devastatingisease.Biobehavioral Reviews 37 (2013) 480–490
References
Aylward, E.H., Anderson, N.B., Bylsma, F.W., Wagster, M.V., Barta, P.E., Sherr, M.,Feeney, J., Davis, A., Rosenblatt, A., Pearlson, G.D., Ross, C.A., 1998. Frontal lobevolume in patients with Huntington’s disease. Neurology 50, 252–258.
Aylward, E.H., Brandt, J., Codori, A.M., Mangus, R.S., Barta, P.E., Harris, G.J., 1994.Reduced basal ganglia volume associated with the gene for Huntington’s diseasein asymptomatic at-risk persons. Neurology 44, 823–828.
Aylward, E.H., Codori, A.M., Barta, P.E., Pearlson, G.D., Harris, G.J., Brandt, J., 1996.Basal ganglia volume and proximity to onset in preclinical Huntington’s disease.Archives of Neurology 53, 1293–1296.
Aylward, E.H., Codori, A.M., Rosenblatt, A., Sherr, M., Brandt, J., Stine, O.C., Barta,P.E., Pearlson, G.D., Ross, C.A., 2000. Rate of caudate atrophy in presymptomaticand symptomatic stages of Huntington’s disease. Movement Disorders 15,552–560.
Aylward, E.H., Li, Q., Stine, O.C., Ranen, N., Sherr, M., Barta, P.E., Bylsma, F.W., Pearlson,G.D., Ross, C.A., 1997. Longitudinal change in basal ganglia volume in patientswith Huntington’s disease. Neurology 48, 394–399.
Aylward, E.H., Liu, D., Nopoulos, P.C., Ross, C.A., Pierson, R.K., Mills, J.A., Long, J.D.,Paulsen, J.S., 2012. Striatal volume contributes to the prediction of onset ofHuntington disease in incident cases. Biological Psychiatry 71, 822–828.
Aylward, E.H., Nopoulos, P.C., Ross, C.A., Langbehn, D.R., Pierson, R.K., Mills, J.A., John-son, H.J., Magnotta, V.A., Juhl, A.R., Paulsen, J.S., 2011. Longitudinal change inregional brain volumes in prodromal Huntington disease. Journal of Neurology,Neurosurgery and Psychiatry 82, 405–410.
Aylward, E.H., Sparks, B.F., Field, K.M., Yallapragada, V., Shpritz, B.D., Rosenblatt,A., Brandt, J., Gourley, L.M., Liang, K., Zhou, H., Margolis, R.L., Ross, C.A., 2004.Onset and rate of striatal atrophy in preclinical Huntington disease. Neurology63, 66–72.
Aylward, E. Structural imaging in preclinical HD. Abstracts of the 39th Annual INSMeeting, Journal of the International Neuropsychological Society, 17 supple-ment S1, March 2011, p. 63.
Bechtel, N., Scahill, R.I., Rosas, H.D., Acharya, T., Van Den Bogaard, S.J.A., Jauffret,C., Say, M.J., Sturrock, A., Johnson, H., Onorato, C.E., Salat, D.H., Durr, A., Leavitt,B.R., Roos, R.A.C., Landwehrmeyer, G.B., Langbehn, D.R., Stout, J.C., Tabrizi, S.J.,Reilmann, R., 2010. Tapping linked to function and structure in premanifest andsymptomatic Huntington disease. Neurology 75, 2150–2160.
Beglinger, L.J., Nopoulos, P.C., Jorge, R.E., Langbehn, D.R., Mikos, A.E., Moser, D.J.,Duff, K., Robinson, R.G., Paulsen, J.S., 2005. White matter volume and cognitivedysfunction in early Huntington’s disease. Cognitive and Behavioral Neurology18, 102–107.
Bohanna, I., Georgiou-Karistianis, N., Sritharan, A., Asadi, H., Johnston, L., Churchyard,A., Egan, G., 2011. Diffusion tensor imaging in Huntington’s disease reveals dis-tinct patterns of white matter degeneration associated with motor and cognitivedeficits. Brain Imaging and Behavior 5, 171–180.
Brandt, G.N., Bonelli, R.M., 2008. Structural neuroimaging of the basal ganglia inschizophrenic patients: a review. Wiener Medizinische Wochenschrift 158,84–90.
Brandt, J., Bylsma, F.W., Aylward, E.H., Rothlind, J., Gow, C.A., 1995. Impaired sourcememory in Huntington’s disease and its relation to basal ganglia atrophy. Journalof Clinical and Experimental Neuropsychology 17, 868–877.
Campodonico, J.R., Aylward, E., Codori, A.M., Young, C., Krafft, L., Magdalinski, M.,Ranen, N., Slavney, P.R., Brandt, J., 1998. When does Huntington’s disease begin?Journal of the International Neuropsychological Society 4, 467–473.
Ciarmiello, A., Cannella, M., Lastoria, S., Simonelli, M., Frati, L., Rubinsztein, D.C.,Squitieri, F., 2006. Brain white-matter volume loss and glucose hypometabolismprecede the clinical symptoms of Huntington’s disease. Journal of NuclearMedicine 47, 215–222.
Della Nave, R., Ginestroni, A., Tessa, C., Giannelli, M., Piacentini, S., Filippi, M., Mas-calchi, M., 2010. Regional distribution and clinical correlates of white matterstructural damage in Huntington disease: a tract-based spatial statistics study.American Journal of Neuroradiology 31, 1675–1681.
Douaud, G., Gaura, V., Ribeiro, M.J., Lethimonnier, F., Maroy, R., Verny, C.,Krystkowiak, P., Damier, P., Bachoud-Levi, A.C., Hantraye, P., Remy, P., 2006. Dis-tribution of grey matter atrophy in Huntington’s disease patients: a combinedROI-based and voxel-based morphometric study. NeuroImage 32, 1562–1575.
Frost, C., Kenward, M.G., Fox, N.C., 2008. Optimizing the design of clinical trials wherethe outcome is a rate. Can estimating a baseline rate in a run-in period increaseefficiency? Statistics in Medicine 27, 3717–3731.
Gavazzi, C., Nave, R.D., Petralli, R., Rocca, M.A., Guerrini, L., Tessa, C., Diciotti, S., Fil-ippi, M., Piacentini, S., Mascalchi, M., 2007. Combining functional and structuralbrain magnetic resonance imaging in Huntington disease. Journal of ComputerAssisted Tomography 31, 574–580.
Georgiou-Karistianis, N., 2009. A peek inside the Huntington’s brain: will functionalimaging take us one step closer in solving the puzzle? Experimental Neurology220, 5–8.
Georgiou-Karistianis, N., Gray, M.A., Domínguez, D.J.F., Dymowski, A.R., Bohanna, I.,Johnston, L.A., Churchyard, A., Chua, P., Stout, J.C., Egan, G.F., 2013. Automateddifferentiation of pre-diagnosis Huntington’s disease from healthy control indi-viduals based on quadratic discriminant analysis of the basal ganglia: theIMAGE-HD study. Neurobiology of Disease 51, 82–92.
Ginestroni, A., Battaglini, M., Diciotti, S., Della Nave, R., Mazzoni, L.N., Tessa, C.,Giannelli, M., Piacentini, S., De Stefano, N., Mascalchi, M., 2010. Magnetizationtransfer MR imaging demonstrates degeneration of the subcortical and corti-cal gray matter in Huntington disease. American Journal of Neuroradiology 31,1807–1812.
e and
H
H
H
H
H
H
H
H
H
H
H
I
J
J
K
K
K
K
K
M
M
M
M
N
N
N. Georgiou-Karistianis et al. / Neuroscienc
alliday, G.M., McRitchie, D.A., Macdonald, V., Double, K.L., Trent, R.J., McCusker, E.,1998. Regional specificity of brain atrophy in Huntington’s disease. ExperimentalNeurology 154, 663–672.
arris, G.J., Codori, A.M., Lewis, R.F., Schmidt, E., Bedi, A., Brandt, J., 1999. Reducedbasal ganglia blood flow and volume in pre-symptomatic, gene-tested personsat-risk for Huntington’s disease. Brain 122, 1667–1678.
arris, G.J., Pearlson, G.D., Peyser, C.E., Aylward, E.H., Roberts, J., Barta, P.E., Chase,G.A., Folstein, S.E., 1992. Putamen volume reduction on magnetic resonanceimaging exceeds caudate changes in mild Huntington’s disease. Annals of Neu-rology 31, 69–75.
enley, S.M., Wild, E.J., Hobbs, N.Z., Warren, J.D., Frost, C., Scahill, R.I., Ridgway,G.R., MacManus, D.G., Barker, R.A., Fox, N.C., Tabrizi, S.J., 2008. Defective emo-tion recognition in early HD is neuropsychologically and anatomically generic.Neuropsychologia 46, 2152–2160.
enley, S.M.D., Ridgway, G.R., Scahill, R.I., Klöppel, S., Tabrizi, S.J., Fox, N.C., Kassubek,J., 2010. Pitfalls in the use of voxel-based morphometry as a biomarker: examplesfrom Huntington disease. American Journal of Neuroradiology 31, 711–719.
enley, S.M.D., Wild, E.J., Hobbs, N.Z., Scahill, R.I., Ridgway, G.R., MacManus, D.G.,Barker, R.A., Fox, N.C., Tabrizi, S.J., 2009. Relationship between CAG repeat lengthand brain volume in premanifest and early Huntington’s disease. Journal ofNeurology 256, 203–212.
ersh, S., Rosas, H.D., Ferrante, R.J., 2004. Neuropathology and Pathophysiology ofHuntington’s Disease. McGraw-Hill, New York.
obbs, N.Z., Barnes, J., Frost, C., Henley, S.M.D., Wild, E.J., Macdonald, K., Barker,R.A., Scahill, R.I., Fox, N.C., Tabrizi, S.J., 2010a. Onset and progression of patho-logic atrophy in Huntington disease: a longitudinal MR imaging study. AmericanJournal of Neuroradiology 31, 1036–1041.
obbs, N.Z., Henley, S.M., Ridgway, G.R., Wild, E.J., Barker, R.A., Scahill, R.I., Barnes, J.,Fox, N.C., Tabrizi, S.J., 2010b. The progression of regional atrophy in premanifestand early Huntington’s disease: a longitudinal voxel-based morphometry study.Journal of Neurology, Neurosurgery and Psychiatry 81, 756–763.
obbs, N.Z., Pedrick, A.V., Say, M.J., Frost, C., Dar Santos, R., Coleman, A., Sturrock, A.,Craufurd, D., Stout, J.C., Leavitt, B.R., Barnes, J., Tabrizi, S.J., Scahill, R.I., 2011.The structural involvement of the cingulate cortex in premanifest and earlyHuntington’s disease. Movement Disorders 26, 1684–1690.
untington Study Group, 1996. Unified huntington’s disease rating scale: reliabilityand consistency. Movement Disorders 11, 136–142.
lle, R., Holl, A.K., Kapfhammer, H.P., Reisinger, K., Schafer, A., Schienle, A., 2011. Emo-tion recognition and experience in Huntington’s disease: is there a differentialimpairment? Psychiatry Research 188, 377–382.
ech, R., Klempir, J., Vymazal, J., Zidovska, J., Klempirova, O., Ruzicka, E., Roth, J., 2007.Variation of selective gray and white matter atrophy in Huntington’s disease.Movement Disorders 22, 1783–1789.
urgens, C.K., Van De Wiel, L., Van Es, A.C.G.M., Grimbergen, Y.M., Witjes-Ané,M.N.W., Van Der Grond, J., Middelkoop, H.A.M., Roos, R.A.C., 2008. Basal gan-glia volume and clinical correlates in ‘preclinical’ Huntington’s disease. Journalof Neurology 255, 1785–1791.
assubek, J., Juengling, F.D., Ecker, D., Landwehrmeyer, G.B., 2005. Thalamic atrophyin Huntington’s disease co-varies with cognitive performance: a morphometricMRI analysis. Cerebral Cortex 15, 846–853.
ipps, C.M., Duggins, A.J., Mahant, N., Gomes, L., Ashburner, J., McCusker, E.A., 2005.Progression of structural neuropathology in preclinical Huntington’s disease:a tensor based morphometry study. Journal of Neurology, Neurosurgery andPsychiatry 76, 650–655.
ipps, C.M., Duggins, A.J., McCusker, E.A., Calder, A.J., 2007. Disgust and happinessrecognition correlate with anteroventral insula and amygdala volume respec-tively in preclinical Huntington’s disease. Journal of Cognitive Neuroscience 19,1206–1217.
löppel, S., Chu, C., Tan, G.C., Draganski, B., Johnson, H., Paulsen, J.S., Kienzle, W.,Tabrizi, S.J., Ashburner, J., Frackowiak, R.S.J., 2009. Automatic detection of pre-clinical neurodegeneration: presymptomatic Huntington disease. Neurology 72,426–431.
löppel, S., Draganski, B., Golding, C.V., Chu, C., Nagy, Z., Cook, P.A., Hicks, S.L., Ken-nard, C., Alexander, D.C., Parker, G.J.M., Tabrizi, S.J., Frackowiak, R.S.J., 2008.White matter connections reflect changes in voluntary-guided saccades in pre-symptomatic Huntington’s disease. Brain 131, 196–204.
agnotta, V.A., Harris, G., Andreasen, N.C., O’Leary, D.S., Yuh, W.T.C., Heckel, D.,2002. Structural MR image processing using the BRAINS2 toolbox. ComputerizedMedical Imaging and Graphics 26, 251–264.
ajid, D.A., Stoffers, D., Sheldon, S., Hamza, S., Thompson, W.K., Goldstein, J., Corey-Bloom, J., Aron, A.R., 2011a. Automated structural imaging analysis detectspremanifest Huntington’s disease neurodegeneration within 1 year. MovementDisorders 26, 1481–1488.
ajid, D.S., Aron, A.R., Thompson, W., Sheldon, S., Hamza, S., Stoffers, D., Holland,D., Goldstein, J., Corey-Bloom, J., Dale, A.M., 2011b. Basal ganglia atrophy inprodromal Huntington’s disease is detectable over one year using automatedsegmentation. Movement Disorders 26, 2544–2551.
uhlau, M., Weindl, A., Wohlschlager, A.M., Gaser, C., Stadtler, M., Valet, M., Zim-mer, C., Kassubek, J., Peinemann, A., 2007. Voxel-based morphometry indicatesrelative preservation of the limbic prefrontal cortex in early Huntington disease.Journal of Neural Transplantation 114, 367–372.
opoulos, P., Magnotta, V.A., Mikos, A., Paulson, H., Andreasen, N.C., Paulsen, J.S.,2007. Morphology of the cerebral cortex in preclinical Huntington’s disease.American Journal of Psychiatry 164, 1428–1434.
opoulos, P.C., Aylward, E.H., Ross, C.A., Johnson, H.J., Magnotta, V.A., Juhl,A.R., Pierson, R.K., Mills, J., Langbehn, D.R., Paulsen, J.S., 2010. Cerebral
Biobehavioral Reviews 37 (2013) 480–490 489
cortex structure in prodromal Huntington disease. Neurobiology of Disease 40,544–554.
Paulsen, J.S., Langbehn, D.R., Stout, J.C., Aylward, E., Ross, C.A., Nance, M., Guttman, M.,Johnson, S., MacDonald, M., Beglinger, L.J., Duff, K., Kayson, E., Biglan, K., Shoul-son, I., Oakes, D., Hayden, M., 2008. Detection of Huntington’s disease decadesbefore diagnosis: the predict-HD study. Journal of Neurology, Neurosurgery andPsychiatry 79, 874–880.
Paulsen, J.S., Magnotta, V.A., Mikos, A.E., Paulson, H.L., Penziner, E., Andreasen, N.C.,Nopoulos, P.C., 2006. Brain structure in preclinical Huntington’s disease. Biolog-ical Psychiatry 59, 57–63.
Paulsen, J.S., Nopoulos, P.C., Aylward, E., Ross, C.A., Johnson, H., Magnotta, V.A., Juhl,A., Pierson, R.K., Mills, J., Langbehn, D., Nance, M., 2010. Striatal and white mat-ter predictors of estimated diagnosis for Huntington disease. Brain ResearchBulletin 82, 201–207.
Peinemann, A., Schuller, S., Pohl, C., Jahn, T., Weindl, A., Kassubek, J., 2005. Executivedysfunction in early stages of Huntington’s disease is associated with striatal andinsular atrophy: a neuropsychological and voxel-based morphometric study.Journal of the Neurological Sciences 239, 11–19.
Politis, M., Pavese, N., Tai, Y.F., Kiferle, L., Mason, S.L., Brooks, D.J., Tabrizi, S.J., Barker,R.A., Piccini, P., 2011. Microglial activation in regions related to cognitive func-tion predicts disease onset in Huntington’s disease: a multimodal imaging study.Human Brain Mapping 32, 258–270.
Rizk-Jackson, A., Stoffers, D., Sheldon, S., Kuperman, J., Dale, A., Goldstein, J., Corey-Bloom, J., Poldrack, R.A., Aron, A.R., 2011. Evaluating imaging biomarkers forneurodegeneration in pre-symptomatic Huntington’s disease using machinelearning techniques. NeuroImage 56, 788–796.
Rosas, H.D., Goodman, J., Chen, Y.I., Jenkins, B.G., Kennedy, D.N., Makris, N., Patti,M., Seidman, L.J., Beal, M.F., Koroshetz, W.J., 2001. Striatal volume loss in HD asmeasured by MRI and the influence of CAG repeat. Neurology 57, 1025–1028.
Rosas, H.D., Hevelone, N.D., Zaleta, A.K., Greve, D.N., Salat, D.H., Fischl, B., 2005.Regional cortical thinning in preclinical Huntington disease and its relationshipto cognition. Neurology 65, 745–747.
Rosas, H.D., Koroshetz, W.J., Chen, Y.I., Skeuse, C., Vangel, M., Cudkowicz, M.E.,Caplan, K., Marek, K., Seidman, L.J., Makris, N., Jenkins, B.G., Goldstein, J.M., 2003.Evidence for more widespread cerebral pathology in early HD: an MRI-basedmorphometric analysis. Neurology 60, 1615–1620.
Rosas, H.D., Lee, S.Y., Bender, A.C., Zaleta, A.K., Vangel, M., Yu, P., Fischl, B., Pappu,V., Onorato, C., Cha, J.H., Salat, D.H., Hersch, S.M., 2010. Altered white mattermicrostructure in the corpus callosum in Huntington’s disease: implications forcortical “disconnection”. NeuroImage 49, 2995–3004.
Rosas, H.D., Liu, A.K., Hersch, S., Glessner, M., Ferrante, R.J., Salat, D.H., van der Kouwe,A., Jenkins, B.G., Dale, A.M., Fischl, B., 2002. Regional and progressive thinningof the cortical ribbon in Huntington’s disease. Neurology 58, 695–701.
Rosas, H.D., Reuter, M., Doros, G., Lee, S.Y., Triggs, T., Malarick, K., Fischl, B., Salat, D.H.,Hersch, S.M., 2011. A tale of two factors: what determines the rate of progressionin Huntington’s disease? A longitudinal MRI study. Movement Disorders 26,1691–1697.
Rosas, H.D., Salat, D.H., Lee, S.Y., Zaleta, A.K., Pappu, V., Fischl, B., Greve, D., Hevelone,N., Hersch, S.M., 2008. Cerebral cortex and the clinical expression of Huntington’sdisease: complexity and heterogeneity. Brain 131, 1057–1068.
Rosas, H.D., Tuch, D.S., Hevelone, N.D., Zaleta, A.K., Vangel, M., Hersch, S.M., Salat,D.H., 2006. Diffusion tensor imaging in presymptomatic and early Hunting-ton’s disease: selective white matter pathology and its relationship to clinicalmeasures. Movement Disorders 21, 1317–1325.
Ross, C.A., Tabrizi, S.J., 2011. Huntington’s disease: from molecular pathogenesis toclinical treatment. Lancet Neurology 10, 83–98.
Ruocco, H.H., Bonilha, L., Li, L.M., Lopes-Cendes, I., Cendes, F., 2008. Longitudinalanalysis of regional grey matter loss in Huntington disease: effects of the lengthof the expanded CAG repeat. Journal of Neurology, Neurosurgery and Psychiatry79, 130–135.
Ruocco, H.H., Lopes-Cendes, I., Li, L.M., Cendes, F., 2007. Evidence of thalamic dys-function in Huntington disease by proton magnetic resonance spectroscopy.Movement Disorders 22, 2052–2056.
Ruocco, H.H., Lopes-Cendes, I., Li, L.M., Santos-Silva, M., Cendes, F., 2006. Striatal andextrastriatal atrophy in Huntington’s disease and its relationship with lengthof the CAG repeat. Brazilian Journal of Medical and Biological Research 39,1129–1136.
Sanchez-Castaneda, C., Cherubini, A., Elifani, F., Peran, P., Orobello, S., Capelli,G., Sabatini, U., Squitieri, F., 2012. Seeking huntington disease biomarkersby multimodal, cross-sectional basal ganglia imaging. Human Brain Mapping,http://dx.doi.org/10.1002/hbm.22019.
Scahill, R.I., Hobbs, N.Z., Say, M.J., Bechtel, N., Henley, S.M., Hyare, H., Langbehn, D.R.,Jones, R., Leavitt, B.R., Roos, R.A., Durr, A., Johnson, H., Lehéricy, S., Craufurd,D., Kennard, C., Hicks, S.L., Stout, J.C., Reilmann, R., Tabrizi, S.J., 2013. Clinicalimpairment in premanifest and early Huntington’s disease is associated withregionally specific atrophy. Human Brain Mapping 34, 519–529.
Squitieri, F., Cannella, M., Simonelli, M., Sassone, J., Martino, T., Venditti, E.,Ciammola, A., Colonnese, C., Frati, L., Ciarmiello, A., 2009. Distinct brain volumechanges correlating with clinical stage, disease progression rate, mutation size,and age at onset prediction as early biomarkers of brain atrophy in Huntington’sdisease. CNS Neuroscience & Therapeutics 15, 1–11.
Sritharan, A., Egan, G.F., Johnston, L., Horne, M., Bradshaw, J.L., Bohanna, I., Asadi,H., Cunnington, R., Churchyard, A.J., Chua, P., Farrow, M., Georgiou-Karistianis,N., 2010. A longitudinal diffusion tensor imaging study in symptomaticHuntington’s disease. Journal of Neurology, Neurosurgery and Psychiatry 81,257–262.
4 e and
T
T
T
T
T
V
90 N. Georgiou-Karistianis et al. / Neuroscienc
abrizi, S.J., Langbehn, D.R., Leavitt, B.R., Roos, R.A., Durr, A., Craufurd, D., Kennard, C.,Hicks, S.L., Fox, N.C., Scahill, R.I., Borowsky, B., Tobin, A.J., Rosas, H.D., Johnson,H., Reilmann, R., Landwehrmeyer, B., Stout, J.C., 2009. Biological and clinicalmanifestations of huntington’s disease in the longitudinal TRACK-HD study:cross-sectional analysis of baseline data. Lancet Neurology 8, 791–801.
abrizi, S.J., Reilmann, R., Roos, R.A., Durr, A., Leavitt, B., Owen, G., Jones, R., Johnson,H., Craufurd, D., Hicks, S.L., Kennard, C., Landwehrmeyer, B., Stout, J.C., Borowsky,B., Scahill, R.I., Frost, C., Langbehn, D.R., 2012. Potential endpoints for clinicaltrials in premanifest and early Huntington’s disease in the TRACK-HD study:analysis of 24 month observational data. Lancet Neurology 11, 42–53.
abrizi, S.J., Scahill, R.I., Durr, A., Roos, R.A., Leavitt, B.R., Jones, R., Landwehrmeyer,G.B., Fox, N.C., Johnson, H., Hicks, S.L., Kennard, C., Craufurd, D., Frost, C., Lang-behn, D.R., Reilmann, R., Stout, J.C., 2011. Biological and clinical changes inpremanifest and early stage Huntington’s disease in the TRACK-HD study: the12-month longitudinal analysis. Lancet Neurology 10, 31–42.
hieben, M.J., Duggins, A.J., Good, C.D., Gomes, L., Mahant, N., Richards, F., McCusker,E., Frackowiak, R.S.J., 2002. The distribution of structural neuropathology in pre-clinical Huntington’s disease. Brain 125, 1815–1828.
hu, D.C., Oorschot, D.E., Tippett, L.J., Nana, A.L., Hogg, V.M., Synek, B.J., Luthi-Carter,R., Waldvogel, H.J., Faull, R.L., 2010. Cell loss in the motor and cingulate cortexcorrelates with symptomatology in Huntington’s disease. Brain 133, 1094–1110.
an Den Bogaard, S.J.A., Dumas, E.M., Acharya, T.P., Johnson, H., Langbehn, D.R.,Scahill, R.I., Tabrizi, S.J., Van Buchem, M.A., Van Der Grond, J., Roos, R.A.C., 2011.
Biobehavioral Reviews 37 (2013) 480–490
Early atrophy of pallidum and accumbens nucleus in Huntington’s disease. Jour-nal of Neurology 258, 412–420.
Van Oostrom, J.C.H., Maguire, R.P., Verschuuren-Bemelmans, C.C., Veenma-Van DerDuin, L., Pruim, J., Roos, R.A.C., Leenders, K.L., 2005. Striatal dopamine D2 recep-tors, metabolism, and volume in preclinical Huntington disease. Neurology 65,941–943.
Vandenberghe, W., Demaerel, P., Dom, R., Maes, F., 2009. Diffusion-weighted versusvolumetric imaging of the striatum in early symptomatic Huntington disease.Journal of Neurology 256, 109–114.
Vonsattel, J.P., DiFiglia, M., 1998. Huntington disease. Journal of Neuropathology andExperimental Neurology 57, 369–384.
Vonsattel, J.P., Myers, R.H., Stevens, T.J., Ferrante, R.J., Bird, E.D., Richardson Jr., E.P.,1985. Neuropathological classification of huntington’s disease. Journal of Neu-ropathology and Experimental Neurology 44, 559–577.
Weir, D.W., Sturrock, A., Leavitt, B.R., 2011. Development of biomarkers for Hunt-ington’s disease. Lancet Neurology 10, 573–590.
Wild, E.J., Henley, S.M., Hobbs, N.Z., Frost, C., MacManus, D.G., Barker, R.A.,Fox, N.C., Tabrizi, S.J., 2010. Rate and acceleration of whole-brain atro-
phy in premanifest and early Huntington’s disease. Movement Disorders 25,888–895.Wolf, R.C., Vasic, N., Carlos, S.-L., Ecker, D., Landwehrmeyer, G.B., 2009. Corticaldysfunction in patients with Huntington’s disease during working memory per-formance. Human Brain Mapping 30, 327–339.