Structural Determinants of Drug Partitioning in n -Hexadecane/Water System
45
Subscriber access provided by Otterbein University Journal of Chemical Information and Modeling is published by the American Chemical Society. 1155 Sixteenth Street N.W., Washington, DC 20036 Published by American Chemical Society. Copyright © American Chemical Society. However, no copyright claim is made to original U.S. Government works, or works produced by employees of any Commonwealth realm Crown government in the course of their duties. Article Structural Determinants of Drug Partitioning in n-Hexadecane/Water System Senthil Natesan, Zhanbin Wang, Viera Lukacova, Ming Peng, Rajesh Subramaniam, Sandra Lynch, and Stefan Balaz J. Chem. Inf. Model., Just Accepted Manuscript • DOI: 10.1021/ci400112k • Publication Date (Web): 05 May 2013 Downloaded from http://pubs.acs.org on May 16, 2013 Just Accepted “Just Accepted” manuscripts have been peer-reviewed and accepted for publication. They are posted online prior to technical editing, formatting for publication and author proofing. The American Chemical Society provides “Just Accepted” as a free service to the research community to expedite the dissemination of scientific material as soon as possible after acceptance. “Just Accepted” manuscripts appear in full in PDF format accompanied by an HTML abstract. “Just Accepted” manuscripts have been fully peer reviewed, but should not be considered the official version of record. They are accessible to all readers and citable by the Digital Object Identifier (DOI®). “Just Accepted” is an optional service offered to authors. Therefore, the “Just Accepted” Web site may not include all articles that will be published in the journal. After a manuscript is technically edited and formatted, it will be removed from the “Just Accepted” Web site and published as an ASAP article. Note that technical editing may introduce minor changes to the manuscript text and/or graphics which could affect content, and all legal disclaimers and ethical guidelines that apply to the journal pertain. ACS cannot be held responsible for errors or consequences arising from the use of information contained in these “Just Accepted” manuscripts.
-
Upload
independent -
Category
Documents
-
view
1 -
download
0
Transcript of Structural Determinants of Drug Partitioning in n -Hexadecane/Water System

Subscriber access provided by Otterbein University
Journal of Chemical Information and Modeling is published by the American ChemicalSociety. 1155 Sixteenth Street N.W., Washington, DC 20036Published by American Chemical Society. Copyright © American Chemical Society.However, no copyright claim is made to original U.S. Government works, or worksproduced by employees of any Commonwealth realm Crown government in the courseof their duties.
Article
Structural Determinants of Drug Partitioning in n-Hexadecane/Water SystemSenthil Natesan, Zhanbin Wang, Viera Lukacova, Ming Peng,
Rajesh Subramaniam, Sandra Lynch, and Stefan BalazJ. Chem. Inf. Model., Just Accepted Manuscript • DOI: 10.1021/ci400112k • Publication Date (Web): 05 May 2013
Downloaded from http://pubs.acs.org on May 16, 2013
Just Accepted
“Just Accepted” manuscripts have been peer-reviewed and accepted for publication. They are postedonline prior to technical editing, formatting for publication and author proofing. The American ChemicalSociety provides “Just Accepted” as a free service to the research community to expedite thedissemination of scientific material as soon as possible after acceptance. “Just Accepted” manuscriptsappear in full in PDF format accompanied by an HTML abstract. “Just Accepted” manuscripts have beenfully peer reviewed, but should not be considered the official version of record. They are accessible to allreaders and citable by the Digital Object Identifier (DOI®). “Just Accepted” is an optional service offeredto authors. Therefore, the “Just Accepted” Web site may not include all articles that will be publishedin the journal. After a manuscript is technically edited and formatted, it will be removed from the “JustAccepted” Web site and published as an ASAP article. Note that technical editing may introduce minorchanges to the manuscript text and/or graphics which could affect content, and all legal disclaimersand ethical guidelines that apply to the journal pertain. ACS cannot be held responsible for errorsor consequences arising from the use of information contained in these “Just Accepted” manuscripts.

Structural Determinants of Drug Partitioning in n-Hexadecane/Water System
Senthil Natesan,a Zhanbin Wang,
a Viera Lukacova,
b Ming Peng,
a Rajesh Subramaniam,
a Sandra
Lynch,a and Stefan Balaz
a,*
a Department of Pharmaceutical Sciences, Albany College of Pharmacy and Health Sciences,
Vermont Campus, Colchester, VT, United States
bSimulations-Plus, Inc., Lancaster, CA. United States
Corresponding author: [email protected], +1-802-735-2615
Page 1 of 44
ACS Paragon Plus Environment
Journal of Chemical Information and Modeling
123456789101112131415161718192021222324252627282930313233343536373839404142434445464748495051525354555657585960

ABSTRACT
Surrogate phases have been widely used as correlates for modeling transport and partitioning of
drugs in biological systems, taking advantage of chemical similarity between the surrogate and
the phospholipid bilayer as the elementary unit of biological phases, which is responsible for
most of transport and partitioning. Solvation in strata of the phospholipid bilayer is an important
drug characteristics because it affects the rates of absorption and distribution, as well as the
interactions with the membrane proteins having the binding sites located inside the bilayer. The
bilayer core can be emulated by n-hexadecane (C16), and the headgroup stratum is often
considered a hydrophilic phase because of the high water content. Therefore, we tested the
hypothesis that the C16/water partition coefficients (P) can predict the bilayer locations of drugs
and other small molecules better than other surrogate systems. Altogether 514 PC16/W values for
nonionizable (458) and completely ionized (56) compounds were collected from the literature or
measured, when necessary. With the intent to create a fragment-based prediction system, the
PC16/W values were factorized into the fragment solvation parameters (f) and correction factors
based on the ClogP fragmentation scheme. A script for the PC16/W prediction using the ClogP
output is provided. To further expand the prediction system and reveal solvation differences,
the fC16/W values were correlated with their more widely available counterparts for the 1-
octanol/water system (O/W) using solvatochromic parameters. The analysis for 50 compounds
with known bilayer location shows that the available and predicted PC16/W and PO/W values alone
or the PC16/O values representing their ratio do not satisfactorily predict the preference for drug
accumulation in bilayer strata. These observations indicate that the headgroups stratum, albeit
well hydrated, does not have solvation characteristics similar to water and is also poorly
described by the O/W partition characteristics.
Page 2 of 44
ACS Paragon Plus Environment
Journal of Chemical Information and Modeling
123456789101112131415161718192021222324252627282930313233343536373839404142434445464748495051525354555657585960

INTRODUCTION
The use of surrogate phases in drug-related research is based on the linear relationship1
between the logarithms of the partition coefficients in two two-phase systems, consisting of
similar phases, with the slope and intercept obtained from a correlation with experimental data
and determined by the phases and experimental conditions. Similarity in this context means the
ability of the molecules of the two phases to form similar interactions with the drug molecules.
The surrogate systems are not used with the aim to obtain an exact magnitude of a solvation-
related biological property. Rather, they are meant to provide a correlate – a parameter that can
be used to calculate the biological characteristics via the Collander equation.
The most widely used surrogate phase is wet 1-octanol,2 which mimics phospholipid bilayer
in biological membranes. At room temperature and normal pressure, wet 1-octanol contains 2.5
mol/L of water,3 which represents molar fraction
4 of 0.26 and volume fraction
5 of about 0.04.
An analysis of X-ray diffraction patterns showed that 1-octanol molecules form fluctuating
inverted micellar aggregates, with water present around the arrangements of hydroxyl groups,
whereby the alkyl chains point out in almost extended conformations.6 There is some
controversy about the shape of the hydroxy group aggregates and their interaction with water.
The X-ray6 and
1H NMR data
7 point to nearly spheric arrangements of the hydroxyls. Molecular
dynamics simulations8 result in linear networked chains of H-bonded hydroxyls, which look like
remnants of those seen by X-ray9 at 150 K. Spectroscopic data indicate that water in saturated 1-
octanol does not disturb the H-bonding of 1-octanol molecules present in neat 1-octanol and
forms pockets maintaining a similar structure as bulk water in the proximity of hydroxyls.4 The
biphasic microstructure of wet 1-octanol allows partitioning of the nonpolar compounds into the
alkyl chain regions and interactions of H-bonding solutes with water and hydroxyl groups, as
Page 3 of 44
ACS Paragon Plus Environment
Journal of Chemical Information and Modeling
123456789101112131415161718192021222324252627282930313233343536373839404142434445464748495051525354555657585960

indicated by 1H NMR data
7 and molecular dynamics simulations.
10 In this way, wet 1-octanol
imitates, to some extent, overall partitioning of drugs between phospholipid bilayers and
surrounding water.
Rather than the overall partitioning, separate drug affinities for the headgroup and core strata
of the bilayer are required for quantitative understanding of several key processes in drug action.
They include transbilayer permeation and bilayer accumulation,11
as well as drug interactions
with membrane-bound proteins, including efflux pumps,12
cytochromes P450,13
as well as
cyclooxygenases14
and possibly other therapeutically important targets, which have the (entry to)
drug binding sites located inside the bilayer.
The solvation properties of the bilayer core can be, thanks to similar densities and
composition,15
emulated by n-hexadecane (C16)16
or other alkane/alkene, such as 2,4,4-
trimethylpentane,17
n-hexane,18
n-heptane,19
isooctane,20
n-decane,21
n-dodecane,22
1-hexadecene, 1,9-decadiene,21
or loosely defined alkane mixtures.23
The partition coefficients
of compounds in different alkane/water systems have quite similar magnitudes.
The differences (∆logP) between the partition coefficients in the 1-octanol/water system and
in the cyclohexane/water,24
alkane/water,25
isooctane/water,20
dodecane/water or C16/water22
systems were used as correlates for transport through the blood/brain barrier. The fraction
absorbed in human was shown to depend on the ∆logP values for the alkane/water system.26
These studies indicate the usefulness of the alkane/water systems in describing drug distribution.
We focus on a different aspect of the distribution problem: the prediction of bilayer location of
drugs.
Taking into account that, depending on the area per phospholipid, temperature and pressure,
there are 6-16 molecules of water per a headgroup27-29 in phosphatidylcholine bilayer and
Page 4 of 44
ACS Paragon Plus Environment
Journal of Chemical Information and Modeling
123456789101112131415161718192021222324252627282930313233343536373839404142434445464748495051525354555657585960

neglecting the hydration interactions decreasing the available water concentration, several
computational studies30-34 treated the headgroups as an aqueous phase. If this assumption holds,
the C16/water partition coefficient should be a good predictor of the bilayer location. We
wanted to test this hypothesis.
As a headgroup surrogate, water-immiscible solvents with the molecules containing some
phospholipid fragments – isopropyl myristate,35
propylene glycol dipelargonate,36
and n-butyl
acetate37
– were used in combination with water. The values of these partition coefficients can
be used to divide those of the respective alkane/water partition coefficients to reveal the H-
bonding properties of the compounds, as it was done with 1-octanol.38
These surrogate phases differ in composition from phospholipid headgroups: they lack the
phosphate and other charged groups, and some contain additional H-bond donors, which are not
found in the headgroups. None of the mentioned surrogate phases can, therefore, fully emulate
all drug interactions with the headgroups. A straightforward solution to this problem is the use
of properly hydrated diacetyl phosphatidylcholine (DAcPC) – the diacetylated headgroup of the
prevalent mammal phospholipid - as a surrogate phase for the headgroup region, as we
suggested.39
Hydrated DAcPC contains similar amounts of water as the headgroup region of
fluid phospholipid bilayer, is only slightly viscous, and immiscible with n-hexadecane (C16) or
other alkanes. The C16/DAcPC partition coefficients are, in combination with the C16/W
partition coefficients, a good predictor of bilayer location of drugs.39
Other solvents, which bear no obvious structural resemblance to the headgroups or the core
components (e.g., chloroform, benzene,40
and ether41
), were tested as two-phase systems with
water as correlates of biological disposition. Ethylene glycol was used in a two-phase system
with n-heptane to model transport of peptides across epithelial cell monolayers.42
A different
Page 5 of 44
ACS Paragon Plus Environment
Journal of Chemical Information and Modeling
123456789101112131415161718192021222324252627282930313233343536373839404142434445464748495051525354555657585960
group of water-immiscible solvents imitates the structures of triglycerides rather than those of
phospholipids. They include loosely defined oils of plant or animal origin and triolein.43
Vegetable oil was used to imitate solvation properties of fat and phospholipids represented by a
mixture of 30% lipids and 70% water.44-46
The C16/water (C16/W) partition coefficients, or alkane/water partition coefficients in
general, represent an important component of any surrogate system aiming at the understanding
of drug affinities for headgroups and cores. As compared with widely used methods for
estimation of the 1-octanol /water (O/W) partition coefficients from drug structure,47
published
methods for the C16/W partition coefficients21;26;48-50
are less available. With the present study,
we want to expand the tool set for numerous ClogP users by generating the ClogP parameters51
for the C16/W partitioning using a carefully selected set of measured and published C16/W
partition coefficients. To focus on a well-defined system and increase the precision of the
estimates, we refrained from the indiscriminate use of the partition coefficients measured with
loosely defined alkane mixtures and those for partially ionized compounds. The calibrated
C16/W fragment system will facilitate the analysis of solvation differences between the wet C16
and O phases. The predicted values of the C16/W partition coefficient will be tested for the
ability to predict bilayer location of the compounds, for which this information is available.
Page 6 of 44
ACS Paragon Plus Environment
Journal of Chemical Information and Modeling
123456789101112131415161718192021222324252627282930313233343536373839404142434445464748495051525354555657585960

MATERIALS AND METHODS
Materials
The compounds were purchased from Sigma-Aldrich and n-hexadecane (99%) was
purchased from Alfa Aesar. Water was purified by Thermo Barnstead Nanopure®
Ultrapure
Water Systems.
Measurement of Partition Coefficients
The C16/W partition coefficients of 25compounds (Table 1) were measured by the shake-
flask method. The used C16 and water phases mutually saturated through overnight contact in
the incubator at 25 °C with the constant shaking rate of 25 rpm. The compound was usually
dissolved in the C16 phase, and 1 mL of the solution was carefully layered on an appropriate
volume (1 – 100 mL) of the aqueous phase in an appropriate glass container. The C16/W
volume ratio was estimated in preliminary experiments, so that the final drug concentration in
the C16 phase would reach 5-95% of the initial concentration. For each partitioning experiment,
five samples along with five corresponding controls were placed in the incubator at 25 °C
shaking at 25 rpm. The samples were withdrawn at appropriate intervals ranging from 0 to 48
hrs. At each sampling time, the drug concentrations in both C16 and water phases, where
feasible, were determined by UV/Vis spectroscopy. For all measured compounds, the
equilibrium was reached or was approaching within the timescale of the experiment. Two-
compartment kinetic models were used to ensure that the equilibrium conditions were estimated
Page 7 of 44
ACS Paragon Plus Environment
Journal of Chemical Information and Modeling
123456789101112131415161718192021222324252627282930313233343536373839404142434445464748495051525354555657585960

as closely as feasible. The time course of the concentration c in the C16 phase can be described
as
( ) ( ) 1 2
W 16C16
C16 2 W 1 16
1 16 2 W
0C
Al Alt
V V
C
C
cc t l V e l V
l V l V
− +
= +
+
(1)
Here l1 and l2 are the rate parameters of transport from water to C16 and backwards,
respectively; V is the volume of the phase indicated in the subscript, A is the surface area of the
interface, and t is time. The corresponding aqueous concentration can be described as
( ) ( ) 1 2
W 1616 2 C16
W
1 C16 2 W
01 C
Al Alt
V VCc l Vc t e
l V l V
− +
= −
+
(2)
The rate parameters and their errors were determined by the fit of eqs 1 and 2 to experimental
data.52
The partition coefficient was calculated as P=l1/l2, with the error given by
( ) ( )2 2
1 1 2 2/ /P P l l l lδ δ δ= + (3)
Here, δl1 and δl2 are the errors of the transport rate parameters l1 and l2, respectively.
Used Data
The C16/W partition coefficients for 460 compounds were collected from literature.18;38;53-67
To
expand the pool, 353 alkane/water (A/W) partition alkane/water coefficients were also
Page 8 of 44
ACS Paragon Plus Environment
Journal of Chemical Information and Modeling
123456789101112131415161718192021222324252627282930313233343536373839404142434445464748495051525354555657585960

collected18;38;53-61;64;65
and used to predict the C16/W partition coefficients for additional 208
compounds. All used data are listed in Table S1 in Supporting Information.
Linear Regression Analyses
The correlation equation 5 (shown later) was used, with the fragments generated by the ClogP
program.68
The linear regression analyses52;69
were performed in a step-wise manner, starting
with the compounds composed of only C and H atoms initially and gradually adding compounds
with less frequently occurring fragments, to check for additivity of the fragment solvation
characteristics and stability of the system.
Script for Using ClogP Output to Predict the C16/W Partition Coefficients
A Perl executable is available through a link on our laboratory web site
(http://www.acphs.edu/Academics/Profiles/DepartmentOfPharmaceuticalSciences/BalazLab/Res
earch_Overview.aspx). The script can be run on any operating system with no additional
software requirements. A library file with the fragments and correction factors values provided
along with the executable should be present in the same directory. The primary input for the
program is the detailed output from ClogP program. Additional information is contained in the
accompanying text file. After successful execution of the script, a detailed text output with
predicted logPC16/W values of given compounds is produced.
Page 9 of 44
ACS Paragon Plus Environment
Journal of Chemical Information and Modeling
123456789101112131415161718192021222324252627282930313233343536373839404142434445464748495051525354555657585960

RESULTS AND DISCUSSION
Measured n-Hexadecane/Water Partition Data
Partitioning of 25compounds in the C16/W system was monitored experimentally at 25 °C,
to expand the data set of published values for the estimation of fragment solvation parameters
and correction factors and include some of the more rare fragments. The kinetics of the process
was monitored to ensure that the equilibrium partitioning was attained. The results are
summarized in Table 1.
For the partition coefficients, which are measured under identical conditions for all
compounds, in the same vessel and using identical stirring rates, the transport rate parameters l1
and l2 for transport from the aqueous phase to the nonpolar phase and backwards, respectively,
depend on the partition coefficient P:70
1 2 and 1 1
Pl l
P P
α αβ β
= =+ +
(4)
The optimized parameters α and β are constant for the given hydrodynamics of the two phase
systems. The fits to experimental data are usually excellent, explaining more than 95% of the
variance in the data.70
They hold for compounds of different structures, for ionizable molecules
and ion pairs,71
and even when measured at different pH values if the distribution coefficients are
used.63
For these reasons, eqs 4 are frequently used in simulations of drug transport in a series of
aqueous and nonpolar phases.72
In our experiments, different volumes of the phases were used
that could not be accommodated in identical vessels. Different hydrodynamics affects the
Page 10 of 44
ACS Paragon Plus Environment
Journal of Chemical Information and Modeling
123456789101112131415161718192021222324252627282930313233343536373839404142434445464748495051525354555657585960

transport rates because it determines the thickness of the unstirred diffusion layers at the
interface. Therefore, our data (Table 1) do not conform to eqs 4, although the trends are similar.
Table 1. Measured n-Hexadecane/Water Partition Coefficients and Transport Rate Parameters
Compound CAS Number P l1 (cm/h) l2 (cm/h)
1,2-dimethoxybenzene 91-16-7 (2.723±1.352) ×101 1.171±0.535 (4.301±0.840)×10
-2
1-phenyl-1-propanol 93-54-9 3.153±0.630 (3.864±0.154)×10-1
(1.226±0.240)×10-1
2-allylphenol a
1745-81-9 7.119±3.070
(2.286±0.857)×10-1
(3.211±0.685)×10-2
2-phenylacetamide 103-84-4 (5.861±2.227)×10-2
(1.624±0.359)×10-2
(2.771±0.857)×10-1
2-phenylphenol a 90-43-7 (3.536±1.329)×10
1 (3.699±0.935)×10
-1 (1.046±0.291)×10
-2
3-bromoaniline 591-19-5 (1.107±0.106)×101 (6.304±0.471)×10
-1 (5.693±0.339)×10
-2
4-bromobenzophenone 90-90-4 (2.891±0.684)×102 (1.054±0.026)×10
1 (3.646±0.858)×10
-2
4-bromophenol 106-41-2 (9.700±3.925)×10-1
(2.054±0.524)×10-1
(2.118±0.665)×10-1
4-chloro-2-nitrotoluene 89-59-8 (8.660±3.938)×102 (2.168±0.605)×10
2 (2.504±0.899)×10
-1
4-chloro-3-methylphenol 59-50-7 1.651±0.701 (1.491±0.611)×10-1
(9.029±1.001)×10-2
4-chlorobenzophenone 134-85-0 (7.315±2.674)×102 (1.102±0.216)×10
2 (1.507±0.465)×10
-1
4-nitroaniline 100-01-6 (1.890±0.656)×10-1
(1.192±0.406)×10-1
(6.295±0.407)×10-1
9-anthracenemethanol a 1468-95-7 (2.211±0.554)×10
2 1.565±0.236 (7.080±1.416)×10
-3
acetanilide 103-84-4 (2.580±0.857)×10-1
(1.315±0.434)×10-1
(5.104±0.179)×10-1
aniline 62-53-3 (7.860±1.639)×10-1
(1.502±0.286)×10-1
(1.912±0.162)×10-1
benzocaine a 94-09-7 1.560±0.666 (1.163±0.488)×10
-1 (7.455±0.577)×10
-2
caffeine 58-08-2 (2.376±0.576)×10-1
(5.485±0.851)×10-2
(2.309±0.430)×10-1
ethylnicotinate 614-18-6 3.583±0.983 (5.074±1.031)×10-1
(1.416±0.261)×10-1
formanilide 103-70-8 2.900±0.955)×10-1
(1.532±0.501)×10-1
(5.283±0.213)×10-1
indole 120-72-9 5.660±0.633 (6.291±0.522)×10-1
(1.111±0.083)×10-1
nifedipine 21829-25-4 4.827±2.241 (7.229±2.679)×10-1
(1.498±0.418)×10-1
nitrobenzene 98-95-3 (2.942±0.756)×101 1.162±0.218 (3.950±0.694)×10
-2
N-methylbenzamide 613-93-4 (6.450±1.180)×10-1
(4.982±0.860)×10-1
(7.724±0.467)×10-1
pyridine 110-86-1 (3.560±1.562)×10-1
(9.512±0.343)×10-2
(2.672±0.669)×10-1
quinoline 91-22-5 (1.056±0.360)×101 (3.766±0.198)×10
-1 (3.566±1.200)×10
-2
a this value supersedes the published value
62
Page 11 of 44
ACS Paragon Plus Environment
Journal of Chemical Information and Modeling
123456789101112131415161718192021222324252627282930313233343536373839404142434445464748495051525354555657585960

Used Data
Altogether 460 values of the C16/W partition coefficient were collected from literature.
Alkane/water (A/W) partition coefficients are often pooled together for the correlations with the
biological characteristics because the differences in their magnitudes are small. To further
narrow the scatter, the C16/W partition coefficients were re-scaled from reliable A/W values.
The fit for the C16/W partition coefficients as the dependent variable, with both variables
logarithmized, is characterized by the slope of 1.006, the intercept of -0.063, and the following
statistical indices: the number of points, n = 145, the squared correlation coefficient, r2=0.992,
and the standard deviation, SD =0.158 (p <0.0001). This correlation was used to predict the
C16/W partition coefficient for additional 208 compounds. With our 25 measured values, the
total number of used compounds was 693. All data are included in Table S1 in Supporting
Information.
All used logPC16/W values are plotted against the logPO/W values in Figure 1. For most
compounds, the PC16/W values are lower than the PO/W values, reflecting the fact that, in the latter
system, H-bonds can be formed in both phases. Some small molecules (carbon oxide, dimethyl
sulfoxide, hydrogen, nitrogen, and nitrous oxide, plotted as crosses in Figure 1) exhibit higher
affinity for n-hexadecane than for 1-octanol. However, this trend is not observed for carbon
dioxide, oxygen, and water.
Could the high water content in wet 1-octanol result in a limit on the minimum PO/W values
for compounds that can be fully hydrated in the water present in wet 1-octanol? The water-OH
clusters of wet 1-octanol contain ~30 or 40 oxygen atoms.8;10
The opinions about the shape of
these clusters differ: spectroscopic evidence points to water aggregates of close-to-spherical
shape7 where the H-bonds between water molecules are preferred to those with the OH-groups of
Page 12 of 44
ACS Paragon Plus Environment
Journal of Chemical Information and Modeling
123456789101112131415161718192021222324252627282930313233343536373839404142434445464748495051525354555657585960

1-octanol,4 while molecular dynamics simulations
8 indicate that water molecules are spread
along the chains of H-bonded OH-groups forming a prolate ellipsoid shape of the aggregate. The
former situation would lead to a better accommodation of most dissolved molecules of
hydrophilic compounds. If all 4% vol. of water in saturated 1-octanol would participate in
hydration of compounds, the concentration of the compound in the microheterogeneous 1-
octanol phase could be estimated as 0.04×cW + 0.96×cN (N indicating nonpolar regions formed
by alkyl chains of 1-octanol). For very hydrophilic compounds, cN would approach zero
resulting in the minimum PO/W ~ 0.04. The line in Figure 1 is described by logarithmized
equation PC16/W=(PO/W-0.04)/0.96, which corresponds to this hypothesis. Many PO/W values have
been reported that are lower than the limit of 0.04, especially for charged molecules. Obviously,
the limit PO/W value would only hold for smaller molecules, which could be fully hydrated in the
water-OH clusters of the 1-octanol phase. In addition, the measurement of extreme P values is
difficult and prone to artifacts. While special methods have been developed for the measurement
of the high logP values,73
no such developments can be found for the low logP values.
Fragment Solvation Parameters and Correction Factors
The ClogP fragmentation scheme51
was chosen because of its sound physicochemical basis.
The scheme uses isolating carbons to define fragments of interacting atoms, which are treated as
separate units. Although this idea could not be applied rigorously for statistical reasons and
aromatic carbons had to be added to the category of isolating carbons, the approach still allows a
meaningful analysis of structural determinants of solvation and their comparison between
different systems. The original O/W ClogP fragment solvation characteristics were optimized in
Page 13 of 44
ACS Paragon Plus Environment
Journal of Chemical Information and Modeling
123456789101112131415161718192021222324252627282930313233343536373839404142434445464748495051525354555657585960

a ‘constructionist’ sense, starting with the simplest molecules and gradually adding more
complex molecules.
-2 0 2 4 6 8 10-6
-4
-2
0
2
4
6
8
logP (n-hexadecane/water)
logP (1-octanol/water)
Figure 1. The plot of n-hexadecane/water and 1-octanol/water partition coefficients for 693
studied compounds: neutral compounds (full points), fully or partially ionizable molecules (open
points), and small molecules such as gases and water (crosses). The straight portion of the line is
close to the identity line. The curvature indicates the hypothetical limitation of the PO/W value
for hydrophilic compounds by the high water content of 1-octanol. See text for more details.
Page 14 of 44
ACS Paragon Plus Environment
Journal of Chemical Information and Modeling
123456789101112131415161718192021222324252627282930313233343536373839404142434445464748495051525354555657585960
Ionization complicates evaluation of the partition experiments because of the presence of
several molecular species, which have different solvation energies in the used phases. To reduce
the multiplicity of species, 41 ionizable compounds with the pKa values between 5 and 9 (Table
S1 in Supplementary information) were excluded from the data set. The values for 56 ionizable
compounds with the pKa values outside this interval, which are practically completely ionized for
pH ~ 7, were used in the analyses.
The resulting 652 compounds were subjected to the fragmentation by the ClogP program.
Unfortunately, 126 compounds contained fragments or correction factors, which did not reach, in
all studied compounds, the count of 3 that was set as a minimum for inclusion into the analyses.
Altogether 526 published (360), re-scaled (147), and measured (19) values of the C16/W
partition coefficients (Table S1 in Supporting Information) were correlated with structure using
the ClogP approach:51
C16/W i i j j
i j
log P a f b F= +∑ ∑ (5)
where f are fragment solvation parameters for fragments occurring with frequency a in the given
molecule and F are the correction factors having frequencies b.
In the ClogP system, some of the factors are treated in a complex way, utilizing fragment-
specific parameters, different from f, which could not be completely calibrated using our limited
data set. We had to simply collapse to a single value several factors, which are represented in the
ClogP system by multiple values: Hydrogen Bonding (HB), Interacting Fragments (InterFrag),
Ether in Five-Member Ring (O5R), Pair Proximity (Proximity), and Y-fragment (Yfragment).
Page 15 of 44
ACS Paragon Plus Environment
Journal of Chemical Information and Modeling
123456789101112131415161718192021222324252627282930313233343536373839404142434445464748495051525354555657585960
The shortage of data made us to take a simplified binning approach to Potential Interaction
within Ring (PIWR), and Normal Ortho (Northo) and Proximity (NOprox) factors.
The PIWR factor describes the interaction between two substituents on an aromatic ring,
which leads to a decrease in hydration of these substituents, and consequently to positive PIWR
values spanning almost one log unit (0.076 to 0.954) in the ClogP outputs for our data set,
depending upon the substituent groups. The substituent interaction can be considered
bidirectional. Each substituent was assigned a σ value as an inducer, and a ρ value as a
responder, which are specific for the ClogP system.74
Higher σ (for electron withdrawing
groups, e.g., NO2 and CN) and ρ values (for electron donating groups, e.g., OH and NH2) result
in a higher PIWR correction factor. These characteristics are associated with overall hydration
of fragments and exhibit similar trends as the fragment solvation parameters, f. Our data set
would not allow a reasonable optimization of the σ and ρ values, so we decided to use three
different magnitudes of the PIWR correction factor. The PIWR1 has the lowest value and is
applied to the interaction of the fragments with the ClogP fragment values, f, lower than 0.15.
The intermediate PIWR2 describes the interaction of the fragments with 0.15 ≤ f ≤ 0.5, which
represent a combination of a strong inducer and weak responder or vice versa. The highest
PIWR3 value is attributed to the presence of strong H-bond accepting inducers and strong
responders with H-bond donating ability, which is generally associated with f > 0.5.
The ortho interaction modifies formation of the hydration shell around two interacting
fragments from the extent that is represented by the sum of the hydration shells of separated
fragments. The ClogP system uses specific parameters for each fragment involved in an ortho
interaction. The size of our data set does not allow the optimization of all involved parameters.
Therefore, we optimized three different NOrtho correction factors according to the following
Page 16 of 44
ACS Paragon Plus Environment
Journal of Chemical Information and Modeling
123456789101112131415161718192021222324252627282930313233343536373839404142434445464748495051525354555657585960

classification. The NOrtho1 is used if one of the interacting group is isolated aromatic or
aliphatic carbon (ClogP fragment values f > -0.12). The NOrtho2 is applied if both interacting
groups are halogens, essentially based on the values of -0.25 ≤ f ≤ -0.12. The NOrtho3
correction factor is used for all other fragments (f < -0.25).
The step-wise regression analyses (Table S2 in Supporting Information) showed that the
correlations were stable and the contributions of individual solvation parameters (f) and
correction factors (F) can be treated as additive. To keep the values of optimized coefficient as
precise as possible, 12 compounds with the predicted logPC16/W values differing by more than 1
unit from the experimental values were excluded as outliers (Table S1 in Supporting
Information) because of possible experimental errors or problems with our approximate
treatment of some correction factors. For the final correlation, the statistical indices were n =
514, r2 = 0.987, and SD = 0.240. The optimized f and F values are summarized in Tables 2 and
3, respectively, along with their standard error and the counts in which they occur in the data set.
The ClogP counterparts are listed for comparison.
Almost all fragment solvation parameters, f, in the C16/W and O/W systems (Table 2) have
the same sign and only differ in the magnitudes. The only exceptions are the aliphatic chlorine
substituent (ClA, 6) and the oxygen in an aromatic ring (Oxgenaa, 19). The ClA parameter is of
a small magnitude, and takes a positive value in the O/W system, while being negative in the
C16/W systems. The Oxgenaa parameters have larger absolute values and have the signs
changed in the opposite direction. A similar fragment, the ether oxygen flanked by two aromates
(Oaa, 17), has a positive value in both systems, probably because of efficient conjugation of the
oxygen electron pairs with the π-electrons of the aromates.
Page 17 of 44
ACS Paragon Plus Environment
Journal of Chemical Information and Modeling
123456789101112131415161718192021222324252627282930313233343536373839404142434445464748495051525354555657585960

A similar situation is seen among the correction factors (Table 3), where the exceptions are
the NOrtho1 (65) and XBenzyl (75) factors. The NOrtho1 factor is positive in the C16/W
system, although equivalent factors are slightly negative in the ClogP system (not shown). This
factor describes the ortho interaction of two aliphatic or aromatic carbons, which diminishes
hydrophobic/dispersion hydration shell when the substituents are in the ortho contact, as
compared with the shell for the carbons in independent positions. Therefore, a negative value
would be expected for the NOrtho1 effect. Apparently, there are additional influences at play
because the fitted positive NOrtho1 value of 0.147±0.058 is quite conclusive: the error is about
40% and the factor is encountered in 24 compounds. The XBenzyl factor is used in 4
compounds and is also positive in the C16/W system while it takes several slightly negative
values in the O/W system.
Page 18 of 44
ACS Paragon Plus Environment
Journal of Chemical Information and Modeling
123456789101112131415161718192021222324252627282930313233343536373839404142434445464748495051525354555657585960
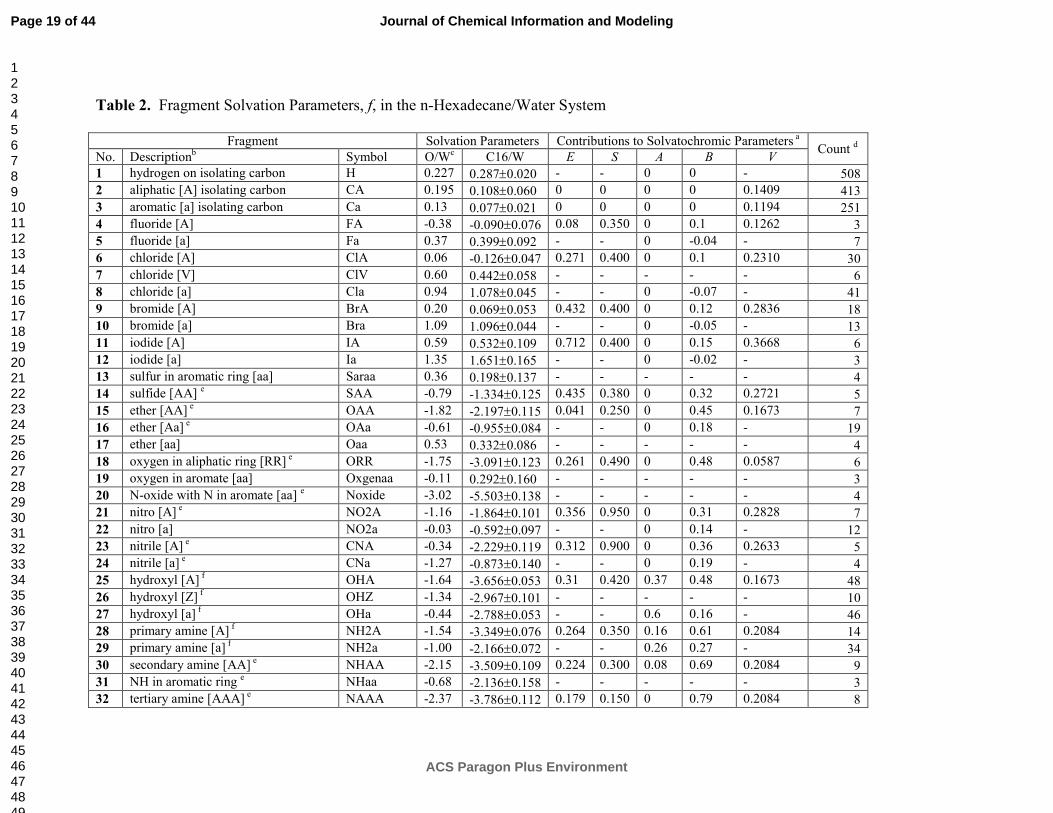
Table 2. Fragment Solvation Parameters, f, in the n-Hexadecane/Water System
Fragment Solvation Parameters Contributions to Solvatochromic Parameters
a
Count d
No. Descriptionb
Symbol O/Wc
C16/W E S A B V
1 hydrogen on isolating carbon H 0.227 0.287±0.020 - - 0 0 - 508
2 aliphatic [A] isolating carbon CA 0.195 0.108±0.060 0 0 0 0 0.1409 413
3 aromatic [a] isolating carbon Ca 0.13 0.077±0.021 0 0 0 0 0.1194 251
4 fluoride [A] FA -0.38 -0.090±0.076 0.08 0.350 0 0.1 0.1262 3
5 fluoride [a] Fa 0.37 0.399±0.092 - - 0 -0.04 - 7
6 chloride [A] ClA 0.06 -0.126±0.047 0.271 0.400 0 0.1 0.2310 30
7 chloride [V] ClV 0.60 0.442±0.058 - - - - - 6
8 chloride [a] Cla 0.94 1.078±0.045 - - 0 -0.07 - 41
9 bromide [A] BrA 0.20 0.069±0.053 0.432 0.400 0 0.12 0.2836 18
10 bromide [a] Bra 1.09 1.096±0.044 - - 0 -0.05 - 13
11 iodide [A] IA 0.59 0.532±0.109 0.712 0.400 0 0.15 0.3668 6
12 iodide [a] Ia 1.35 1.651±0.165 - - 0 -0.02 - 3
13 sulfur in aromatic ring [aa] Saraa 0.36 0.198±0.137 - - - - - 4
14 sulfide [AA] e
SAA -0.79 -1.334±0.125 0.435 0.380 0 0.32 0.2721 5
15 ether [AA] e OAA -1.82 -2.197±0.115 0.041 0.250 0 0.45 0.1673 7
16 ether [Aa] e OAa -0.61 -0.955±0.084 - - 0 0.18 - 19
17 ether [aa] Oaa 0.53 0.332±0.086 - - - - - 4
18 oxygen in aliphatic ring [RR] e ORR -1.75 -3.091±0.123 0.261 0.490 0 0.48 0.0587 6
19 oxygen in aromate [aa] Oxgenaa -0.11 0.292±0.160 - - - - - 3
20 N-oxide with N in aromate [aa] e
Noxide -3.02 -5.503±0.138 - - - - - 4
21 nitro [A] e NO2A -1.16 -1.864±0.101 0.356 0.950 0 0.31 0.2828 7
22 nitro [a] NO2a -0.03 -0.592±0.097 - - 0 0.14 - 12
23 nitrile [A] e CNA -0.34 -2.229±0.119 0.312 0.900 0 0.36 0.2633 5
24 nitrile [a] e CNa -1.27 -0.873±0.140 - - 0 0.19 - 4
25 hydroxyl [A] f OHA -1.64 -3.656±0.053 0.31 0.420 0.37 0.48 0.1673 48
26 hydroxyl [Z] f OHZ -1.34 -2.967±0.101 - - - - - 10
27 hydroxyl [a] f OHa -0.44 -2.788±0.053 - - 0.6 0.16 - 46
28 primary amine [A] f NH2A -1.54 -3.349±0.076 0.264 0.350 0.16 0.61 0.2084 14
29 primary amine [a] f NH2a -1.00 -2.166±0.072 - - 0.26 0.27 - 34
30 secondary amine [AA] e NHAA -2.15 -3.509±0.109 0.224 0.300 0.08 0.69 0.2084 9
31 NH in aromatic ring e NHaa -0.68 -2.136±0.158 - - - - - 3
32 tertiary amine [AAA] e NAAA -2.37 -3.786±0.112 0.179 0.150 0 0.79 0.2084 8
Page 19 of 44
ACS Paragon Plus Environment
Journal of Chemical Information and Modeling
123456789101112131415161718192021222324252627282930313233343536373839404142434445464748495051525354555657585960

33 nitrogen in aliphatic ring [RR] e
NARR -2.20 -3.830±0.178 0.342 0.460 0.13 0.68 0.0998 3
34 nitrogen in aromatic ring [aa] e Naraa -1.14 -1.611±0.077 - - - - - 21
35 trifluoromethyl [A] or [a] CF3Aa 0.24 0.310±0.126 -0.3 0.100 0 -0.03 0.3023 5
36 carbonyl [AA] e COAA -1.84 -2.857±0.073 0.204 0.660 0 0.51 0.2652 24
37 carbonyl [RW] e
CORW -1.50 -3.866±0.251 - - - - - 7
38 carbonyl [Aa] e COAa -1.09 -1.774±0.097 - - 0 0.37 - 11
39 carbonyl [aa] e
COaa -0.53 -1.562±0.178 - - - - - 3
40 aldehyde [A] e ALA -1.1 -2.144±0.084 0.222 0.650 0 0.45 0.2652 11
41 aldehyde [a] e ALa -0.42 -1.052±0.103 - - 0 0.25 - 9
42 ester [AA] e EsAA -0.56 -2.298±0.068 0.197 0.580 0 0.45 0.3239 21
43 ester [Aa] e EsAa -1.45 -1.299±0.105 - - 0 0.32 - 17
44 formyl ester [A] e EsFA -1.14 -1.585±0.108 0.238 0.660 0 0.38 0.3239 6
45 phosphate ester [AAA] e
EsPAAA -2.29 -4.710±0.449 0.226 1.000 0 1.06 0.5480 4
46 amide [A] f AmideA -1.99 -5.531±0.133 0.48 1.300 0.55 0.68 0.3650 4
47 carboxyl [A] f COOHA -1.07 -4.161±0.088 0.297 0.650 0.6 0.45 0.3239 11
48 carboxyl [Z] f COOHZ -1.03 -3.697±0.134 - - 0.6 0.47 - 5
49 carboxyl [a] f COOHa -0.03 -2.228±0.120 - - 0.59 0.26 - 6
50 carbamate [Aa] f CBMTAa -1.46 -3.378±0.123 - - 0.36 0.41 - 5
51 carbamate with N in ring [RRa] e CBMTRRa -1.80 -3.928±0.166 - - - - - 3
a fragment contributions to excess molar refraction E, dipolarity/polarizability S, overall H-bond acidity A, overall H-bond basicity B,
and volume V estimed as described in the text; b
attached to A – aliphatic, a – aromatic, V – vinyl, Z – benzyl structure or inside the
ring(s) RR – aliphatic, RW – aliphatic with a conjugated double bond; c
1-octanol/water fragment values are shown for comparison; d
the number of compounds in which the given fragment is encountered; e H-bond acceptors;
f H-bond donors and acceptors (see text for
classification criteria).
Page 20 of 44
ACS Paragon Plus Environment
Journal of Chemical Information and Modeling
123456789101112131415161718192021222324252627282930313233343536373839404142434445464748495051525354555657585960

Table 3. Correction Factors, F, in the n-Hexadecane/Water System
No. Description Symbol
Parameter Estimates with
Standard Error Countb
O/Wa
C16/W
52 alicyclic Alicyclic -0.09 -0.033±0.031 45
53 benzyl bond to simple aromatics BB -0.15 -0.177 ±0.041 93
54 double bond Bond2 -0.03 -0.039±0.074 28
55 triple bond Bond3 -0.45 -0.595±0.136 6
56 non-halogen, polar group branch BranchP -0.22 -0.089±0.046 51
57 chain Chain -0.12 -0.057±0.030 329
58 chain and cluster branch ChBr -0.13 -0.125±0.025 80
59 extended aromatic iso-carbon FAC 0.10 0.149±0.039 52
60 interacting F and non-F fragments FnonF 0.28 0.246±0.055 9
61 proximity -fragments YCY FragYCY 1.12 to 1.46 2.165±0.120 6
62 pair - H bond HB 0.07 to 1.00 1.323±0.119 6
63 interacting fragments (halogens) InterFrag 0.3,0.53, 0.7 0.485±0.044 22
64 net bond counts (fragbranch) NetBond -0.28 -0.187±0.101 4
65 ortho substitution 1 NOrtho1
MV c
0.147±0.058 24
66 ortho substitution 2 NOrtho2 -0.476±0.058 18
67 ortho substitution 3 NOrtho3 -0.270±0.073 8
68 ether in a 5-membered ring O5R 0.13, 0.57 0.414±0.186 3
69 phenyl-fragment pair PCCY 0.15 0.244±0.103 10
70 potential interaction within ring 1 PIWR1
MV c
0.092±0.072 16
71 potential interaction within ring 2 PIWR2 0.114±0.060 37
72 potential interaction within ring 3 PIWR3 0.370±0.119 16
73 pair –proximity Proximity 0.28 to 0.907 1.207±0.088 11
74 11-hydroxy non-dienyl steroid Steroid 1.16 1.912±0.200 3
75 extra benzyl (class Ortho) XBenzyl -0.40 to -0.05 0.333±0.146 4
76 Y-fragment Yfragment 0.4, 0.9, 1.3 0.607±0.119 7 athe 1-octanol/water values are shown for comparison;
bthe number of compounds in which the
given fragment is encountered; c multiple values – discussed in the text
Page 21 of 44
ACS Paragon Plus Environment
Journal of Chemical Information and Modeling
123456789101112131415161718192021222324252627282930313233343536373839404142434445464748495051525354555657585960

To reveal quantitative contributions of solute properties to the differences between the
C16/W and O/W (ClogP) fragment solvation parameters, their values can be correlated using the
solvatochromic equation 53
as
C16/W ClogPf f e E s S a A b B v V const= + × + × + × + × + × + (6)
where E is the excess molar refraction, S is dipolarity/polarizability, A is overall H-bond acidity,
B is the overall H-bond basicity, and V is the characteristic volume. These properties can be
used to describe the C16/W and O/W fragment sets separately. Therefore, the property terms in
eq 6 represent the difference between the two fragment sets. Solvatochromic properties have
been defined for intact molecules, so they need to be estimated for fragments. Fragment
contributions to solvatochromic properties of molecules have been analyzed75
but some of the
published values were not consistent with the expected properties of fragments. Therefore, we
decided to estimate the solvatochormic properties for fragments attached to alkyls using the
experimental values of suitable alkyl derivatives. Excess molar refraction (E) and characteristic
volume (V) are additive properties, so we used their experimental values for methyl and ethyl
derivatives, or those of 5- and 6-membered aliphatic rings for ring fragments, to extrapolate to
the values for the fragments. For dipolarity/polarizability (S), H-bond acidity (A) and H-bond
basicity (B), the values in alkyl series level off at ethyls in the vast majority of cases, so the
experimental values of ethyl derivatives were used directly as the estimates of these properties.
The estimated solvatochromic contributions of fragments attached to alkyls are summarized in
Table 2. The A and B values for alkyl-attached fragments were identical with the published H-
bond structural constants,76
so these values for fragments attached to aromates are also listed in
Table 2.
Page 22 of 44
ACS Paragon Plus Environment
Journal of Chemical Information and Modeling
123456789101112131415161718192021222324252627282930313233343536373839404142434445464748495051525354555657585960

Linear regression analysis of the data in Table 2 using eq 6 showed that the e, v, and const
terms have the errors larger than the values themselves and do not contribute to the correlation.
When these values were set to zero, the remaining values were optimized as follows:
s = -0.487±0.245, a = -3.196±0.465, and b = -1.660±0.287. The statistical indices were n=24,
r2 = 0.962, and SD = 0.131. If only the dominant H-bonding terms are considered, the fragments
attached to aromates can also be included. The correlation is then characterized by the optimized
coefficients values a = -3.434±0.479 and b = -2.112±0.187, and the statistical indices n = 40, r2 =
0.955, and SD=0.148. The optimized coefficient values are in good agreement with the values
obtained for the difference logPO/W – logPC16/W (i.e., the terms have the opposite signs to those in
eq 6) for 288 molecules:53
s = 0.522, a = 3.877 and b = 1.591, with low magnitudes of
coefficients e and const. This study also found that the volume term was important (v = -0.407),
in contrast to our correlation, where this term has the largest error. Instead, the s term was
significant in our correlation. The S and V contributions have the highest cross-correlation in our
data (r2 = 0.590), all other r
2 values are below 0.288.
The C16/W and O/W fragment solvation parameters were compared in Figure 2, taking into
account their H-bonding ability, which is the main cause of the difference in solvation in these
two systems.38
To classify the H-bonding ability of individual fragments, H-bond structural
constants A and B were used76
(Table 2). For robust characterization, the thresholds for H-bond
acidity and basicity were set at 0.16. Under these conditions, some weak H-bond acceptors, such
as aliphatic and aromatic halogens (4-12, Table 2), thiophene sulfur (13), and trifluoromethyl
substituent (35), were classified as having no H-bonding ability. To expand the H-bonding
classification, some extrapolations were used for the fragments with missing H-bond structural
constants. The basicity constant (B) of ether oxygen fell sharply almost to our limit (0.16), when
Page 23 of 44
ACS Paragon Plus Environment
Journal of Chemical Information and Modeling
123456789101112131415161718192021222324252627282930313233343536373839404142434445464748495051525354555657585960

one of the two attached alkyls (15) was replaced by an aromate (16). Consequently, the oxygens
flanked by two aromatic systems (17) and inside an aromatic ring (19) but not in an aliphatic ring
(18) were considered as having no H-bond acceptor ability. N-oxide (20) was considered as H-
bond acceptor because the B value for the aromatic nitro group (22) was only slightly below the
limit of 0.16. The benzyl hydroxyl (OHZ, 26) was classified as H-bond donor and acceptor
because the A and B values of both aliphatic (OHA, 25) and aromatic (OHa, 27) hydroxyls were
above the limit of 0.16. The NH group in aromatic ring (NHaa, 31), as well as the nitrogens in
the aliphatic (NARR, 33) and aromatic (Naraa, 34) rings were considered as H-bond acceptors
because the aliphatic secondary (NHAA, 30) and tertiary (NAAA, 32) amines have high H-bond
basicities. A modest decrease in the H-bond basicity upon substitution of one of the two alkyls
flanking a carbonyl (COAA, 36) by an aromate (COAa, 38) led to the classification of all
carbonyls (including CORW, 37, and COaa, 39) as H-bond acceptors. Finally, the carbamate
with the N in an aliphatic ring connected to aromate (CBMTRRa, 51) was considered H-bond
acceptor because the carbamate connected to an aromatic and an aliphatic residue (CBMTAa,
50) is an H-bond donor and acceptor of intermediate strength, and 51 contains no hydrogen.
Using this classification, the ClogP and C16/W fragment parameters were plotted in Figure
2. Weak or missing H-bonding ability (fragments 1-13, 17, 19, 22, and 35 in Table 2) is
associated with positive or only slightly negative fragment values, which have similar
magnitudes in both C16/W and O/W systems (black points in Figure 2 positioned close to the
identity line). More extensive H-bonding leads, in the vast majority of cases (except 24 and 43),
to more negative fragment values in both systems but the decrease is more pronounced for the
C16/W system than for the O/W system. The differences are larger for H-bond donors/acceptors
(25-29, 46-50) than for H-bond acceptors (14-16, 18, 20, 21, 23, 24, 30-34, 36-45, and 51).
Page 24 of 44
ACS Paragon Plus Environment
Journal of Chemical Information and Modeling
123456789101112131415161718192021222324252627282930313233343536373839404142434445464748495051525354555657585960

-4 -2 0 2-6
-4
-2
0
2
123
4
5
6
7
8
9
10
11
12
131719
22
35
14
15
16
18
20
21
23
24
30
31
3233
34
36
37
3839
40
41
42
4344
45
5125
2627
28
29
46
47
48
49
50
C16/W fragment parameters
ClogP fragment parameters
Figure 2. Comparison of 1-hexadecane/water and 1-octanol/water (ClogP) fragment
solvation parameters. The fragment numbers correspond to those in Table 2. The H-bond
acceptors are shown in red and H-bond donors/acceptors are shown in green. The identity line is
shown.
The fragment solvation parameter values are closely associated with the character of the two
systems. Wet 1-octanol contains a significant amount of water located in the proximity of
hydroxy groups. The biphasic structure gives the wet 1-octanol phase the ability to interact with
H-bonding fragments in the water-hydroxyl aggregates, while nonpolar fragments are
accommodated in the alkyl regions. Therefore, the addition of an H-bonding fragment to a
Page 25 of 44
ACS Paragon Plus Environment
Journal of Chemical Information and Modeling
123456789101112131415161718192021222324252627282930313233343536373839404142434445464748495051525354555657585960

solute molecule will increase the solute concentration in both 1-octanol and aqueous phases, the
latter usually to a larger extent. The result is an overall decrease of the O/W partition coefficient.
The decrease in the magnitude of the C16/W partition coefficient is much larger because the
concentration of the solute in the n-hexadecane phase will decrease, as opposed to its increase in
the aqueous phase.
Prediction of Bilayer Location
The biphasic nature of the wet 1-octanol imitates, to some extent, the biphasic structure of a
phospholipid bilayer. For this reason the O/W partition coefficients emulate, to some extent, the
bilayer/water partition coefficients according to the Collander equation,1 especially for
uncharged solutes. As a consequence, the O/W partition coefficients are often the parameters of
choice for the description of overall bilayer/water equilibria. For quantitative models of several
key steps in drug pharmacokinetics, however, the drug concentrations in headgroup and core
strata, and at the interface between them are of interest. These processes include the transbilayer
transport,11
and drug effects on membrane proteins such as P-glycoprotein,12
cytochrome P450,13
and several receptors, which have the drug-binding sites located inside the bilayer.
The headgroups are well hydrated27-29 and were regarded as aqueous phases in several
computational studies.30-34 Then the C16/W partition coefficients, which are expected to provide
the information about the drug affinity for the hydrophobic core of the bilayer, could be the only
determinant of drug preference for individual bilayer strata. Can they be used to estimate the
prevalent drug location in the biphasic bilayer? To answer this question, 50 compounds with
experimentally confirmed bilayer location in either headgroup stratum or in the core,72
for which
Page 26 of 44
ACS Paragon Plus Environment
Journal of Chemical Information and Modeling
123456789101112131415161718192021222324252627282930313233343536373839404142434445464748495051525354555657585960

the C16/W partition coefficient were available or could be predicted using the solvation
parameters (Table 2) and corrections factors (Table 3) obtained in this study were summarized in
Tables 4-6, along with the O/W partition coefficients. Five lipophilic compounds (β-carotene,
canthaxanthin, lutein, squalene, and zeaxanthin), although known to accumulate in the core,72
were not listed because their predicted logP values were too high to be considered reliable. At
least one but mostly both logPC16/W and logPO/W were larger than 9, and the uncertainties would
affect the estimates of the C16/O (i.e., PC16/W/PO/W) partition coefficients. The PC16/O values
characterize H-bonding ability of the compounds and provided good descriptions of
transmembrane transport for some compounds.25
A good predictor of bilayer location would clearly separate the cephalophiles locating in the
headgroups (Table 4) from the core-bound lipophiles (Table 6), ideally with some gap for
compounds, which have a more balanced headgroup-core distribution. Amphiphiles interacting
with the headgroup/core interface are collected in Table 5. The locations are plotted against the
C16/W, O/W, and C16/O partition coefficients in Figure 3.
Page 27 of 44
ACS Paragon Plus Environment
Journal of Chemical Information and Modeling
123456789101112131415161718192021222324252627282930313233343536373839404142434445464748495051525354555657585960

Table 4. Partition Coefficients of Cephalophiles Locating in Headgroup Stratum72
No. Compound logP
C16/Wa
O/Wb
C16/Oc
1 1-chloro-1,2,2-trifluorocyclobutane 3.726a
2.290b
1.436
2 1H-indene 2.842a 2.920
-0.078
3 1H-indole-3-butanoic acid -1.721a 1.810
b -3.531
4 2-[4-N(CH3)2-phenyl]-3-OH-flavone 3.494a
3.230b
0.264
5 3-methylindole 0.810
2.170b
-1.360
6 9H-carbazole 2.209a 3.060
b -0.851
7 9-hydroxymethylanthracene 2.340
3.040
-0.700
8 benzylalcohol -0.430
1.100
-1.530
9 ephedrine -0.840
0.930
-1.770
10 ethanol -2.190
-0.310
-1.880
11 halothane 2.100
2.300
-0.200
12 indole 0.750
1.670b
-0.920
13 isofluorane 1.650
2.060 -0.410
14 methanol -2.770
-0.770 -2.000
15 N-methylcarbazole 4.789a 3.990 0.799
16 N-methylindole 3.609a 2.640 0.969
17 propanol -1.530
0.250 -1.780
18 pyridine -0.450 0.650 -1.100 a predicted using the fragments and factors in Tables 2 and 3, 95% confidence intervals for the
predicted values are shown in Supporting Information Table S3, the remaining values are
measured and listed in Table S1 in Supporting Information; bClogP predictions, the remaining
values are listed in the ClogP database; ccalculated as logPC16/W-logPO/W
Page 28 of 44
ACS Paragon Plus Environment
Journal of Chemical Information and Modeling
123456789101112131415161718192021222324252627282930313233343536373839404142434445464748495051525354555657585960

Table 5. Partition Coefficients of Amphiphiles Locating at the Interface72
No. Compound logP
C16/Wa
O/Wb
C16/Oc
19 11-(9-carbazole)-undecanoic acid 5.912a
7.330b
-1.418
20 1-butanol -0.811a
0.880 -1.631
21 1-heptanol 1.065a
2.720 -1.655
22 1-hexanol 0.440a
2.030 -1.590
23 1-octanol 1.690a
3.000 -1.310
24 1-pentanol -0.185a
1.560 -1.745
25 4-(6-phenyl-1,3,5-hexatrien-1-yl)-benzenepropanoic acid 2.698a
5.400b
-2.702
26 4-tert-octylphenol 3.495a
5.160b
-1.665
27 9-anthracene-acetic acid 1.190a
3.760b
-2.570
28 9-anthracene-ethanamine 2.231a
3.780b
-1.549
29 ∆8-tetrahydrocannabinol 5.271a
7.410 -2.139
30 bisphenol A -0.902 3.320 -4.222
31 ibuprofen 1.950
3.500 -1.550
32 propranolol 1.300
2.980 -1.680
33 totarol 6.336a
7.260b
-0.924 a predicted using the fragments and factors in Tables 2 and 3, 95% confidence intervals for the
predicted values are shown in Supporting Information Table S3, the remaining values are
measured and listed in Table S1 in Supporting Information; bClogP predictions, the remaining
values are listed in the ClogP database; ccalculated as logPC16/W-logPO/W
Page 29 of 44
ACS Paragon Plus Environment
Journal of Chemical Information and Modeling
123456789101112131415161718192021222324252627282930313233343536373839404142434445464748495051525354555657585960

Table 6. Partition Coefficients of Lipophiles Locating in the Core72
No. Compound a logP
C16/Wa
O/Wb
C16/Oc
34 1,2-dichlorohexafluorocyclobutane 4.198a
4.090b
0.108
35 1,4-dimethylbenzene 3.250 3.150 0.100
36 1,6-diphenyl-1,3,5-hexatriene 5.828a
5.640b
0.188
37 1-methyl-4-(6-phenyl-1,3,5-hexatrien-1-yl)-benzene 6.333a
6.140b
0.193
38 4-bromo-2,6-t-butyl-phenol 5.257a
6.090b
-0.833
39 4-methyl-2,6-t-butyl-phenol 4.840a
5.100 -0.260
40 9-ethylanthracene 5.680a
5.520b
0.160
41 9-methylanthracene 5.055a
5.070 -0.015
42 amiodarone 5.981a
7.200b
-1.219
43 benzene 2.150 2.130 0.050
44 benzocaine 0.190 1.860 -1.670
45 ethylbenzene 3.200 3.150 0.050
46 methoxy-∆8-tetrahydrocannabinol 8.087a
8.060 0.027
47 n-decane 7.010 5.980b
1.030
48 n-hexane 4.490 3.900 0.590
49 n-propylbenzene 3.840 3.720 0.120
50 toluene 2.760 2.730 0.030 a β-carotene, canthaxanthin, lutein, methoxy-∆8-tetrahydrocannabinol, squalene, and zeaxanthin
were not used because of unreliable logP predictions; b partition coefficients predicted using the
fragments and factors in Tables 2 and 3, 95% confidence intervals for the predicted values are
shown in Supporting Information Table S3, the remaining values are measured and listed in
Table S1 in Supporting Information; bClogP predictions, the remaining values are listed in the
ClogP database; ccalculated as logPC16/W-logPO/W
Page 30 of 44
ACS Paragon Plus Environment
Journal of Chemical Information and Modeling
123456789101112131415161718192021222324252627282930313233343536373839404142434445464748495051525354555657585960

Figure 3. Bilayer location for compounds partitioning primarily in headgroups (blue,
numbers in Table 4), at the interface (red, numbers in Table 5), and in the core (green, numbers
in Table 6) vs. the partition coefficients P in the shown two-phase systems: n-hexadecane/water
(top panel), 1-octanol/water (middle panel), and n-hexadecane/1-octanol (PC16/W/PO/W, bottom
panel).
The C16/W partition coefficients are larger than 1 for all lipophiles but also for many
cephalophiles and amphiphiles (Figure 3, the top panel). For the O/W partition coefficients, the
overlaps are large for all three types of bilayer location (the middle panel). All amphiphiles have
the O/W and C16/O partition coefficients above 6.6 and below 0.12, respectively, in accord with
the need for H-bonding in the headgroups. No efficient separation of cephalophiles and
-4 -2 0 2 4 6 8
123 45 678910 1112 1314 151617 18
19202122232425 2627 282930 3132 33
3435363738 39404142 4344 4546 47484950
1 23 45 678910 11121314 15161718
1920 2122 2324 25262728 29303132 33
3435 36 3738394041 424344 45 4647484950
123 45 678910 1112 1314 151617 18
1920 2122 2324 25 2627 28 2930 3132 33
3435 36 373839 4041 424344 45 4647484950
C16/O
headgroups
interface
core
log P
O/Wheadgroups
interface
core
C16/W
headgroups
interface
core
Page 31 of 44
ACS Paragon Plus Environment
Journal of Chemical Information and Modeling
123456789101112131415161718192021222324252627282930313233343536373839404142434445464748495051525354555657585960

lipophiles was observed even for the C16/O partition coefficient (Figure 3, the bottom plot).
There is no gap between lipophiles and other compounds. In fact, in the interval -0.3 ≤
logPC16/O ≤ 0.3, compounds belonging to the two groups are freely mixing. In addition, there
are several clearly wrong predictions: the cephalophiles 1-chloro-1,2,2-trifluoro-cyclobutane
(compound 1 in Table 4), N-methylcarbazole (15), N-methylindole (16) have positive logPC16/O
values > 0.7, and lipophiles 4-bromo-2,6-t-butyl-phenol (compound 38 in Table 6), amiodarone
(42) and benzocaine (44) exhibit negative logPC16/O values lower than -0.8.
None of the examined partition coefficients provides a clear clue for location of a compound
in the bilayer. This goal can be achieved using the C16/DAcPC partition coefficients,39
in
combination with the PC16/W values. The presented ClogP fragment solvation parameters (Table
2) and correction factors (Table 3) for the C16/W system make this task easier.
CONCLUSIONS
The study presents a consistent parametrization of the structure-based prediction system
based on the ClogP fragmentation for partitioning in the C16/W system at 25 °C, using 514
published, extrapolated (from the A/W system), and measured values. Altogether, 51 fragment
solvation parameters and 25 correction factors are provided, albeit with some approximations in
the latter group. The errors of individual parameters were characterized, allowing for calculation
of the error for structure-based estimates. The differences between the C16/W and O/W
fragment solvation parameters were correlated with solvatochromic properties
dipolarity/polarizability (S), and H-bond acidity (A) and basicity (B). The primary factor
responsible for the differences is H-bonding, explaining 95% of variance. The correlations with
solvatochromic parameters allow estimation of the unknown C16/W fragment solvation
Page 32 of 44
ACS Paragon Plus Environment
Journal of Chemical Information and Modeling
123456789101112131415161718192021222324252627282930313233343536373839404142434445464748495051525354555657585960

parameters using their ClogP counterparts. The measured and estimated C16/W partition
coefficients of 50 compounds were compared with their experimentally determined bilayer
location. The C16/W partition coefficients and their O/W counterparts alone or as ratios (PC16/O)
do not provide satisfactory prediction of preferred location of a drug in the bilayer regions. This
observations indicate that (1) the headgroup stratum cannot be treated as an aqueous phase and
(2) the PC16/O partition coefficients which describe H-bonding do not describe the interaction of
drugs with the phospholipid headgroups.
ACKNOWLEDGMENT
This work was supported in part by the NIH NIGMS grant R01 GM80508.
REFERENCES
1. Collander R. Lipoid solubility. Acta Physiol. Scand. 1947, 13, 363-381.
2. Hansch, C.; Maloney, P. P.; Fujita T.; Muir, R. M. Correlation of biological activity of
phenoxyacetic acids with Hammett substituent constants and partition coefficients. Nature
1962, 194, 178-180.
3. Dallas, A. J.; Carr, P. W. A thermodynamic and solvatochromic investigation of the effect
of water on the phase-transfer properties of octan-1-ol. J. Chem. Soc. Perk. T. 2 1992,
2155-2161.
4. Sassi, P.; Paolantoni, M.; Cataliotti, R. S.; Palombo, F.; Morresi, A. Water/alcohol
mixtures: A spectroscopic study of the water-saturated 1-octanol solution. J. Phys. Chem. B
2004, 108, 19557-19565.
5. Margolis, S. A.; Levenson, M. Certification by the Karl Fischer method of the water
content in SRM 2890, water saturated 1-octanol, and the analysis of associated
interlaboratory bias in the measurement process. Fresen. J. Anal. Chem. 2000, 367, 1-7.
Page 33 of 44
ACS Paragon Plus Environment
Journal of Chemical Information and Modeling
123456789101112131415161718192021222324252627282930313233343536373839404142434445464748495051525354555657585960
6. Franks, N. P.; Abraham, M. H.; Lieb, W. R. Molecular organization of liquid n-octanol: An
X-ray diffraction analysis. J. Pharm. Sci. 1993, 82, 466-470.
7. Hu, K.; Zhou, Y.; Shen, J.; Ji, Z.; Cheng, G. Microheterogeneous structure of 1-octanol in
neat and water-saturated state. J. Phys. Chem. B 2007, 111, 10160-10165.
8. MacCallum, J. L.; Tieleman, D. P. Structures of neat and hydrated 1-octanol from
computer simulations. J. Am. Chem. Soc. 2002, 124, 15085-15093.
9. Shallard-Brown, H. A.; Watkin, D. J.; Cowley, A. R. n-Octanol. Acta Crystallogr. E 2005,
61, 213-214.
10. DeBolt, S. E.; Kollman, P. A. Investigation of structure, dynamics, and solvation in 1-
octanol and its water-saturated solution: Molecular dynamics and free-energy perturbation
studies. J. Am. Chem. Soc. 1995, 117, 5316-5340.
11. Balaz S. Lipophilicity in trans-bilayer transport and subcellular pharmacokinetics.
Perspect. Drug Discov. Design 2000, 19, 157-177.
12. Seelig, A.; Gatlik-Landwojtowicz, E. Inhibitors of multidrug efflux transporters: Their
membrane and protein interactions. Mini-Rev. Med. Chem. 2005, 5, 135-151.
13. Cojocaru, V.; Balali-Mood, K.; Sansom, M. S. P.; Wade, R. C. Structure and dynamics of
the membrane-bound cytochrome P450 2C9. PLoS Comput. Biol. 2011,7, e1002152.
14. Luong, C.; Miller, A.; Barnett, J.; Chow, J.; Ramesha, C.; Browner, M. F. Flexibility of the
NSAID binding site in the structure of human cyclooxygenase-2. Nat. Struct. Biol. 1996; 3,
927-933.
15. Marrink, S. J.; Berendsen, H. J. C. Simulation of water transport through a lipid membrane.
J. Phys. Chem. 1994, 98, 4155-4168.
16. Scheuplein, R. J.; Blank, I. H.; Brauner, G. J.; MacFarlane D. J. Percutaneous absorption of
steroids. J. Invest. Dermatol. 1969, 52, 63-70.
17. Riebesehl, W.; Tomlinson, E.; Gruenbauer, H. J. M. Thermodynamics of solute transfer
between alkanes and water. J. Phys. Chem. 1984, 88, 4775-4779.
18. Schulte, J.; Durr, J.; Ritter, S.; Hauthal, W. H.; Quitzsch, K.; Maurer, G. Partition
coefficients for environmentally important, multifunctional organic compounds in hexane +
water. J. Chem. Eng. Data 1998, 43, 69-73.
19. Runyan, A.; Perrin, J. H.; Vilallonga, F. A. Interfacial tensions and partition coefficients in
water/heptane systems containing 2,6-diisopropylphenol, n-alkylphenols and cycloalkanols.
J. Pharm. Pharmacol. 1988, 40, 203-204.
Page 34 of 44
ACS Paragon Plus Environment
Journal of Chemical Information and Modeling
123456789101112131415161718192021222324252627282930313233343536373839404142434445464748495051525354555657585960
20. Chikhale, E. G.; Ng, K. Y.; Burton, P. S.; Borchardt, R. T. Hydrogen bonding potential as a
determinant of the in vitro and in situ blood-brain barrier permeability of peptides. Pharm
Res. 1994, 11, 412-419.
21. Xiang, T. X.; Anderson B. D. The relationship between permeant size and permeability in
lipid bilayer membranes. J. Membrane Biol. 1994, 140, 111-122.
22. Abraham, M. H.; Acree, W. E., Jr.; Leo, A. J.; Hoekman, D.; Cavanaugh, J. E. Water-
solvent partition coefficients and ∆Log P values as predictors for blood-brain distribution;
application of the Akaike information criterion. J. Pharm. Sci. 2010, 99, 2492-2501.
23. Hafkenscheid, T. L.; Tomlinson, E. Correlations between alkane/water and 1-octanol/water
distribution coefficients and isocratic reversed-phase liquid chromatographic capacity
factors of acids, bases and neutrals. Int. J. Pharmaceutics 1983, 16, 225-239.
24. Young, R. C.; Mitchell, R. C.; Brown, T. H.; Ganellin, C. R.; Griffiths, R.; Jones, M.;
Rana, K. K.; Saundners, D. D.; Smith, I. R.; Sore, N. E.; and Wilks, T. J. Development of a
new physicochemical model for brain penetration and its application to the design of
centrally acting H2 receptor histamine antagonists. J. Med. Chem. 1988, 31, 656-671.
25. van de Waterbeemd, H.; Kansy, M. Hydrogen-bonding capacity and brain penetration.
Chimia 1992, 46, 299-303.
26. Caron, G.; Ermondi, G. Calculating virtual log P in the alkane/water system (log PN
alk) and
its derived parameters ∆log PN
oct-alk and log DpH
alk. J. Med. Chem. 2005, 48, 3269-3279.
27. Barry, J. A.; Gawrisch, K. Direct NMR evidence for ethanol binding to the lipid-water
interface of phospholipid bilayers. Biochemistry 1994, 33, 8082-8088.
28. Balgavy, P.; Dubnickova, M.; Kucerka, N.; Kiselev, M. A.; Yaradaikin, S. P.; Uhrikova, D.
Bilayer thickness and lipid interface area in unilamellar extruded 1,2-
diacylphosphatidylcholine liposomes: a small-angle neutron scattering study. Biochim.
Biophys. Acta 2001, 1512, 40-52.
29. Hristova, K.; White, S. H. Determination of the hydrocarbon core structure of fluid
dioleoylphosphocholine (DOPC) bilayers by x-ray diffraction using specific bromination of
the double-bonds: effect of hydration. Biophys. J. 1998, 74, 2419-2433.
30. Eisenberg, D.; Weiss, R. M.; Terwilliger, T. C. The helical hydrophobic moment: a
measure of the amphiphilicity of a helix. Nature 1982, 299, 371-374.
31. Brasseur, R.; Vandenbosch, C.; van den Bossche, H.; Ruysschaert, J.-M. Mode of inserion
of miconazole ketonazole and deacylated ketoconazole in lipid layers. A conformational
analysis. Biochem. Pharmacol. 1983, 32, 2175-2180.
32. Fischer, H.; Kansy, M.; Bur, D. CAFCA: A novel tool for the calculation of amphiphilic
properties of charged drug molecules. Chimia 2000, 54, 640-645.
Page 35 of 44
ACS Paragon Plus Environment
Journal of Chemical Information and Modeling
123456789101112131415161718192021222324252627282930313233343536373839404142434445464748495051525354555657585960

33. Kessel, A.; Musafia, B.; Ben-Tal, N. Continuum solvent model studies of the interactions
of an anticonvulsant drug with a lipid bilayer. Biophys. J. 2001, 80, 2536-2545.
34. Oren, I.; Fleishman, S. J.; Kessel, A.; Ben Tal, N. Free diffusion of steroid hormones across
biomembranes: A simplex search with implicit solvent model calculations. Biophys. J.
2004, 87, 768-779.
35. Tanaka, M.; Fukuda, H.; Nagai, T. Permeation of drug through a model membrane
consisting of millipore filter with oil. Chem. Pharm. Bull. 1978, 26, 9-13.
36. Leahy, D. E.; Taylor, P. J.; Wait, A. R. Model solvent systems for QSAR. 1. Propylene
glycol dipelargonate (PGDP). A new standard solvent for use in partition coefficient
determination. Quant. Struct.-Act. Relat. 1989, 8, 17-31.
37. el-Tayar, N.; Tsai, R. S.; Testa, B.; Carrupt, P. A.; Hansch, C.; Leo, A. Percutaneous
penetration of drugs: A quantitative structure-permeability relationship study. J. Pharm.
Sci. 1991, 80, 744-749.
38. Seiler, P. Interconversion of lipophilicities from hydrocarbon/water systems into the
octanol/water system. Eur. J. Med. Chem. 1974, 9, 473-479.
39. Lukacova, V.; Peng, M.; Tandlich, R.; Hinderliter, A.; Balaz, S. Partitioning of organic
compounds in phases imitating the headgroup and core regions of phospholipid bilayers.
Langmuir 2006, 22, 1869-1874.
40. Kakemi, K.; Sezaki, H.; Muranishi, S.; Tsujimura, Y. Absorption and excretion of drugs.
XL. Enhancement of the rectal absorption of pharmaceutical amines with lauryl sulfate and
saccharinate anions. Chem. Pharm. Bull. 1969, 17, 1641-1650.
41. Weilgung, F. The local stimulating effect of calcium salts in relation to their chemical
constitution. Arch. Exp. Pathol. Pharmakol. 1932, 167, 71-72.
42. Burton, P. S.; Conradi, R. A.; Hilgers, A. R.; Ho, N. F. H.; Maggiora, L. L. The
relationship between peptide structure and transport across epithelial cell monolayers. J.
Control. Release 1992, 19, 87-97.
43. Niimi, A. J. Solubility of organic chemicals in octanol, triolein and cod liver oil and
relationships between solubility and partition coefficients. Water Res. 1991, 25, 1515-1521.
44. Poulin, P.; Krishnan, K. A biologically-based algorithm for predicting human tissue:blood
partition coefficients of organic chemicals. Human Exp.Ttoxicol. 1995, 14, 273-280.
45. Poulin, P.; Krishnan, K. Molecular structure-based prediction of the partition coefficients
of organic chemicals for physiological pharmacokinetic models. Toxicol. Meth. 1996, 6,
117-137.
Page 36 of 44
ACS Paragon Plus Environment
Journal of Chemical Information and Modeling
123456789101112131415161718192021222324252627282930313233343536373839404142434445464748495051525354555657585960

46. Poulin, P.; Theil, F. P. A priori prediction of tissue : plasma partition coefficients of drugs
to facilitate the use of physiologically-based pharmacokinetic models in drug discovery. J.
Pharm. Sci. 2000, 89, 16-35.
47. Mannhold, R.; van de Waterbeemd, H. Substructure and whole molecule approaches for
calculating log P. J. Comp. Aid. Mol. Des. 2001, 15, 337-354.
48. Zerara, M.; Brickmann, J.; Kretschmer, R.; Exner, T. E. Parameterization of an empirical
model for the prediction of n-octanol, alkane and cyclohexane/water as well as brain/blood
partition coefficients. J. Comput. -Aided Mol. Des. 2009, 23, 105-111.
49. Abraham, M. H.; Acree, W. E. Linear free-energy relationships for water/hexadec-1-ene
and water/deca-1,9-diene partitions, and for permeation through lipid bilayers; comparison
of permeation systems. New J. Chem. 2012, 36, 1798-1806.
50. Nitsche, J. M.; Kasting, G. B. A correlation for 1,9-decadiene/water partition coefficients.
J. Pharm. Sci. 2013, 102, 136-144.
51. Leo, A.; Jow, P. Y.; Silipo, C.; Hansch, C. Calculation of hydrophobic constant (log P)
from π and f constants. J. Med. Chem. 1975, 18, 865-868.
52. Origin 7.0. Origin Lab, Northampton, MA, 2002.
53. Abraham, M. H.; Chadha, H. S.; Whiting, G. S.; Mitchell, R. C. Hydrogen bonding. 32. An
analysis of water-octanol and water-alkane partitioning and the delta log P parameter of
Seiler. J. Pharm. Sci. 1994, 83, 1085-1100.
54. Avdeef, A. pH-metric log P. Part 1. Difference plots for determining ion-pair octanol-water
partition coefficients of multiprotic substances. Quant. Struct.-Act. Rel. 1992, 11, 510-517.
55. Box, K.; Comer, J.; Huque, F. Correlations between PAMPA permeability and log P. In
Pharmacokinetic Profiling in Drug Research. Wiley-VCH Verlag, 2006, p. 243-257.
56. Caron, G.; Carrupt, P. A.; Testa, B.; Ermondi, G.; Gasco, A. Insight into the lipophilicity of
the aromatic N-oxide moiety. Pharm. Res. 1996, 13, 1186-1190.
57. Caron, G.; Gaillard, P.; Carrupt, P. A.; Testa, B. Lipophilicity behavior of model and
medicinal compounds containing a sulfide, sulfoxide, or sulfone moiety. Helv. Chim. Acta
1997, 80, 449-462.
58. el Tayar, N.; Tsai, R. S.; Testa, B.; Carrupt, P. A.; Leo, A. Partitioning of solutes in
different solvent systems. The contribution of hydrogen-bonding capacity and polarity. J.
Pharm. Sci. 1991, 80, 590-598.
59. Gobas, F. A. P. C.; Lahittete, J. M.; Garofalo, G.; Shiu, W. Y.; Mackay, D. A novel method
for measuring membrane-water partition coefficients of hydrophobic organic chemicals:
comparison with 1-octanol-water partitioning, J. Pharm. Sci. 1988, 77, 265-272.
Page 37 of 44
ACS Paragon Plus Environment
Journal of Chemical Information and Modeling
123456789101112131415161718192021222324252627282930313233343536373839404142434445464748495051525354555657585960

60. Hansch, C.; Leo, A. Substituent Constants for Correlation Analysis in Chemistry and
Biology. New York: Wiley; 1979.
61. Leahy, D. E.; Morris, J. J.; Taylor, P. J.; Wait, A. R. Model solvent systems for QSAR .2.
Fragment values ('f-values') for the 'critical quartet'. J. Chem. Soc. Perk. T. 2 1992, 723-
731.
62. Lukacova, V.; Peng, M.; Fanucci, G.; Tandlich, R.; Hinderliter, A.; Maity, B.; Mannivanan,
E.; Cook, G. R.; Balaz, S. Drug-membrane interactions studied in phospholipid monolayers
adsorbed on nonporous alkylated microspheres. J. Biomol. Screen. 2007, 12, 186-202.
63. Pagliara, A.; Testa, B.; Carrupt, P. A.; Jolliet, P.; Morin, C.; Morin, D.; Urien, S.;
Tillement, J. P.; Rihoux, J. P. Molecular properties and pharmacokinetic behavior of
cetirizine, a zwitterionic H1-receptor antagonist. J. Med. Chem. 1998, 41, 853-863.
64. Ter Laak, A. M.; Tsai, R. S.; Donne-Op den Kelder, G. M.; Carrupt, P. A.; Testa, B.;
Timmerman, H. Lipophilicity and hydrogen-bonding capacity of H1-antihistaminic agents
in relation to their central sedative side-effects. Eur. J. Pharm. Sci. 1994, 2, 373-384.
65. ClogP version 3.51. Daylight Chemical Information Systems, Irvine, CA, 1991.
66. Toulmin, A.; Wood J. M.; Kenny P. W. Toward prediction of alkane/water partition
coefficients. J. Med. Chem. 2008, 51, 3720-3730.
67. Wohnsland, F.; Faller, B. High-throughput permeability pH profile and high-throughput
alkane/water log P with artificial membranes. J. Med. Chem. 2001, 44, 923-930.
68. Bio-Loom for Windows version 1.5. BioByte Corp., Claremont, CA, 2006.
69. SAS Enterprise Guide version 4.3. SAS Institute Inc., Cary, NC, 2010.
70. Kubinyi, H. Drug partitioning: relationships between forward and reverse rate constants
and partition coefficient. J. Pharm. Sci. 1978, 67, 262-263.
71. van de Waterbeemd, H.; van Bakel, H.; Jansen, A. Transport in quantitative structure-
activity relationships VI: Relationship between transport rate constants and partition
coefficients. J. Pharm. Sci. 1981, 70, 1081-1082.
72. Balaz, S. Modeling kinetics of subcellular disposition of chemicals. Chem. Rev. 2009, 109,
1793-1899.
73. de Bruijn, J.; Busser, F.; Seinen, W.; Hermens, J. Determination of octanol/water partition
coefficients for hydrophobic organic chemicals with the "slow-stirring" method. Environ.
Toxicol. Chem. 1989, 8, 499-512.
74. Leo, A. The octanol-water partition coefficient of aromatic solutes: The effect of electronic
interactions, alkyl chains, hydrogen bonds, and ortho-substitution. J. Chem. Soc. Perk. T. 2
1983, 825-838.
Page 38 of 44
ACS Paragon Plus Environment
Journal of Chemical Information and Modeling
123456789101112131415161718192021222324252627282930313233343536373839404142434445464748495051525354555657585960

75. Platts, J. A.; Butina, D.; Abraham, M. H.; Hersey, A. Estimation of molecular linear free
energy relation descriptors using a group contribution approach. J. Chem. Inf. Comp. Sci.
1999, 39, 835-845.
76. Abraham, M. H.; Platts, J. A. Hydrogen bond structural group constants. J. Org. Chem.
2001, 66, 3484-3491.
Page 39 of 44
ACS Paragon Plus Environment
Journal of Chemical Information and Modeling
123456789101112131415161718192021222324252627282930313233343536373839404142434445464748495051525354555657585960

ToC Graphics
-4 -2 0 2-6
-4
-2
0
2
n-hexadecane/water
1-octanol/water
solvation characteristics
for fragments based on
the ClogP scheme:
no H-bonding
H-bond acceptors
H-bond donors/acceptors
Page 40 of 44
ACS Paragon Plus Environment
Journal of Chemical Information and Modeling
123456789101112131415161718192021222324252627282930313233343536373839404142434445464748495051525354555657585960

The plot of n-hexadecane/water and 1-octanol/water partition coefficients for 693 studied compounds: neutral compounds (full points), fully or partially ionizable molecules (open points), and small molecules
such as gases and water (crosses). The straight portion of the line is close to the identity line. The
curvature indicates the limitation of the PO/W value for hydrophilic compounds by the high water content of 1-octanol. See text for more details.
207x159mm (300 x 300 DPI)
Page 41 of 44
ACS Paragon Plus Environment
Journal of Chemical Information and Modeling
123456789101112131415161718192021222324252627282930313233343536373839404142434445464748495051525354555657585960
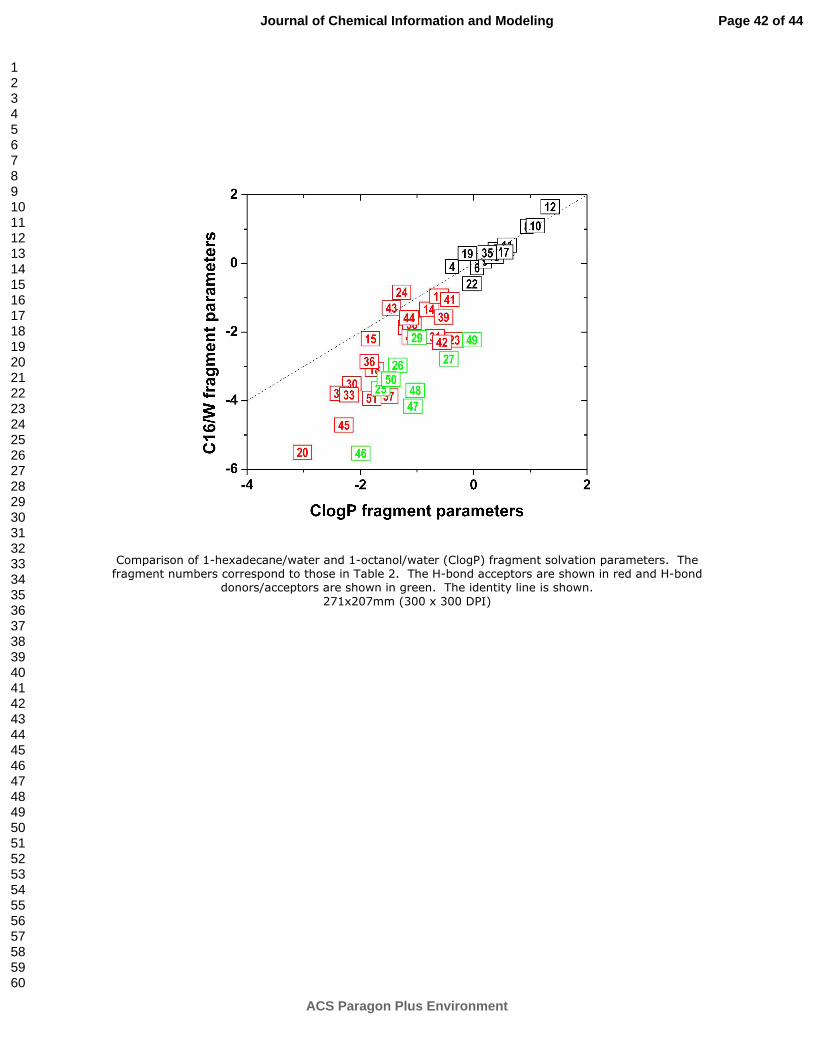
Comparison of 1-hexadecane/water and 1-octanol/water (ClogP) fragment solvation parameters. The fragment numbers correspond to those in Table 2. The H-bond acceptors are shown in red and H-bond
donors/acceptors are shown in green. The identity line is shown.
271x207mm (300 x 300 DPI)
Page 42 of 44
ACS Paragon Plus Environment
Journal of Chemical Information and Modeling
123456789101112131415161718192021222324252627282930313233343536373839404142434445464748495051525354555657585960

Bilayer location for compounds partitioning primarily in headgroups (blue, numbers in Table 4), at the interface (red, numbers in Table 5), and in the core (green, numbers in Table 6) vs. the partition coefficients P in the shown two-phase systems: n-hexadecane/water (top panel), 1-octanol/water (middle panel), and n-
hexadecane/1-octanol (PC16/W/PO/W, bottom panel). 270x207mm (300 x 300 DPI)
Page 43 of 44
ACS Paragon Plus Environment
Journal of Chemical Information and Modeling
123456789101112131415161718192021222324252627282930313233343536373839404142434445464748495051525354555657585960

271x207mm (300 x 300 DPI)
Page 44 of 44
ACS Paragon Plus Environment
Journal of Chemical Information and Modeling
123456789101112131415161718192021222324252627282930313233343536373839404142434445464748495051525354555657585960