Structural changes in the European Airline industry - BI Open
137
Daniel Nordvik Betten BI Norwegian Business School Master Thesis Structural changes in the European Airline industry Hand-in date: 31.08.2016 Campus: BI Oslo Examination code and name: GRA1903 Master Thesis Programme: Master of Science in Business with major in Strategy ”This thesis is a part of the MSc programme at BI Norwegian Business School. The school takes no responsibility for the methods used, results found and conclusions drawn.”
-
Upload
khangminh22 -
Category
Documents
-
view
4 -
download
0
Transcript of Structural changes in the European Airline industry - BI Open
Daniel Nordvik Betten
BI Norwegian Business School Master Thesis
Structural changes in the
European Airline industry
Hand-in date: 31.08.2016
Campus: BI Oslo
Examination code and name:
GRA1903 Master Thesis
Programme: Master of Science in Business with major in Strategy
”This thesis is a part of the MSc programme at BI Norwegian Business School. The school takes no responsibility for the methods used, results found and
conclusions drawn.”
bib94003
Typewritten Text
Tom Van Aylward

ii
Table of Content
1 Introduction...........................................................................................................1
2 ResearchIssues....................................................................................................12.1 Researchstatement.................................................................................................22.2 Researchquestion...................................................................................................22.3 Researchobjectives.................................................................................................22.4 Thesisjustification..................................................................................................3
3 Literaturereview.................................................................................................53.1 Introduction...............................................................................................................53.2 Definition....................................................................................................................53.3 Formationofstrategicgroups...........................................................................123.4 Researchonstrategicgroups.............................................................................153.5 Barriers.....................................................................................................................183.6 Contributions..........................................................................................................213.7 Fiveforcesmodel...................................................................................................233.7.1 Threatofnewentrants................................................................................................243.7.2 Bargainingpowerofcustomers..............................................................................243.7.3 Threatofsubstituteproductsorservices...........................................................253.7.4 Bargainingpowerofsuppliers.................................................................................253.7.5 Rivalryamongexistingcompetitors......................................................................263.7.6 Otherfactors:...................................................................................................................27
3.8 ConnectionsbetweenstrategicgroupsandPorter´sfiveforces............27
4 Methodology........................................................................................................314.1 ResearchDesign.....................................................................................................314.2 Qualityassuranceofresearchdesign.............................................................334.3 Limitations...............................................................................................................34
5 TheAirlineIndustry..........................................................................................365.1 Evolutionoftheindustry.....................................................................................375.1.2 Consolidation...................................................................................................................405.1.3 Marketconcentration..................................................................................................415.1.3 Mergers&acquisitions................................................................................................42
5.2 Actors.........................................................................................................................445.2.1 Airlines...............................................................................................................................445.2.2 Potentialentrants..........................................................................................................48

iii
5.2.3 Substitutes........................................................................................................................485.2.4 Customers.........................................................................................................................495.2.5 Suppliers............................................................................................................................50
5.3 Performanceintheindustry..............................................................................525.3.1 Keyperformanceindicators......................................................................................525.3.2 Margins...............................................................................................................................56
6 Analysis.................................................................................................................576.1 Industryanalysis....................................................................................................576.1.1 Threatofnewentrants................................................................................................576.1.2 Threatofsubstitutes:...................................................................................................606.1.3 Bargainingpowerofcustomers..............................................................................626.1.4 Bargainingpowerofsuppliers:...............................................................................656.1.5 Intensityofrivalry.........................................................................................................69
6.2 Strategicgroupanalysis.......................................................................................726.2.1 Barrierstoentryinthestrategicgroups.............................................................736.2.2 Threatofsubstitutestothestrategicgroups.....................................................816.2.3 Bargainingpowerofsuppliersandrelationtothestrategicgroups.......836.2.4 Bargainingpowerofcustomersandstrategicgroups...................................856.2.5 Intensityofrivalry.........................................................................................................86
7 Conclusion(summarize).................................................................................897.1 Forecast.....................................................................................................................90
8 Exhibits..................................................................................................................93Exhibit1:SummaryEurope...........................................................................................93Exhibit2:InternationalEUroutesandpassengers...............................................94Exhibit3:OperationalmarginsforselectedEuropeanairlines.......................95Exhibit4:Narrowbodyfleetordersby2015...........................................................96Exhibit5:Widebodyfleetsandordersby2015.....................................................96Exhibit6:CostperAverageSeatKilometre.............................................................98
9 Bibliography........................................................................................................99
10Appendix…………………………………………………….……………………..……..109

iv
Tables Table 1: Net Margins by Region 2013-2014, source: CAPA ................................ 55Table 2: Comparison of flying vs train. Source: authors ....................................... 82
Figures Figure 1: Five forces model ................................................................................... 23Figure 2: Hub-and-spoke model ............................................................................ 37
Figure 3: EU air transport passengers 1992-2014 ................................................. 38Figure 4: International Intra-EU and Extra EU routes 1992-2015 ........................ 39Figure 5: EU route distribution 2015 ..................................................................... 40Figure 6: Airline EBIT margin vs. market concentration by region 2015 ............. 42
Figure 7: LCC market share of total seats 2003-2014 ........................................... 47Figure 8: Narrowbody fleet and orders by 2015 .................................................... 53Figure 9: ROIC and WACC by region and strategic group 2004-2011 ................ 54Figure 10: ROIC and WACC of actors in the airline industry value chain .......... 65
Figure 11: Brent crude oil and jet fuel prices 2006-2016 ...................................... 66Figure 12: EBIT margin, location .......................................................................... 69Figure 13: Jet fuel and crude oil price ................................................................... 71Figure 14: Fleet size .............................................................................................. 74
Figure 15: CASK of selected airlines, 2006-2015 ................................................. 75Figure 16: Passengers carried and Load factor ...................................................... 76Figure 17: Brand preference .................................................................................. 80Figure 18: Perceptual drivers ................................................................................. 80
Figure 19: Passengers carried between capitals ..................................................... 81

v
Acknowledgements Working with this thesis has been both challenging and rewarding, and we would
therefore like to express our gratitude towards those who have supported us
during the whole process. A special thanks goes to T. Bihn Phan who has been
our master thesis supervisor. His expert guidance and understanding has made it
possible for us to work on a topic of interest. We would also like to thank our
family, friends, and fellow students for making this process easier for us, it would
not have been possible without you.
27.08.16
Daniel Betten and Tom Van Aylward
vi
Executive Summary
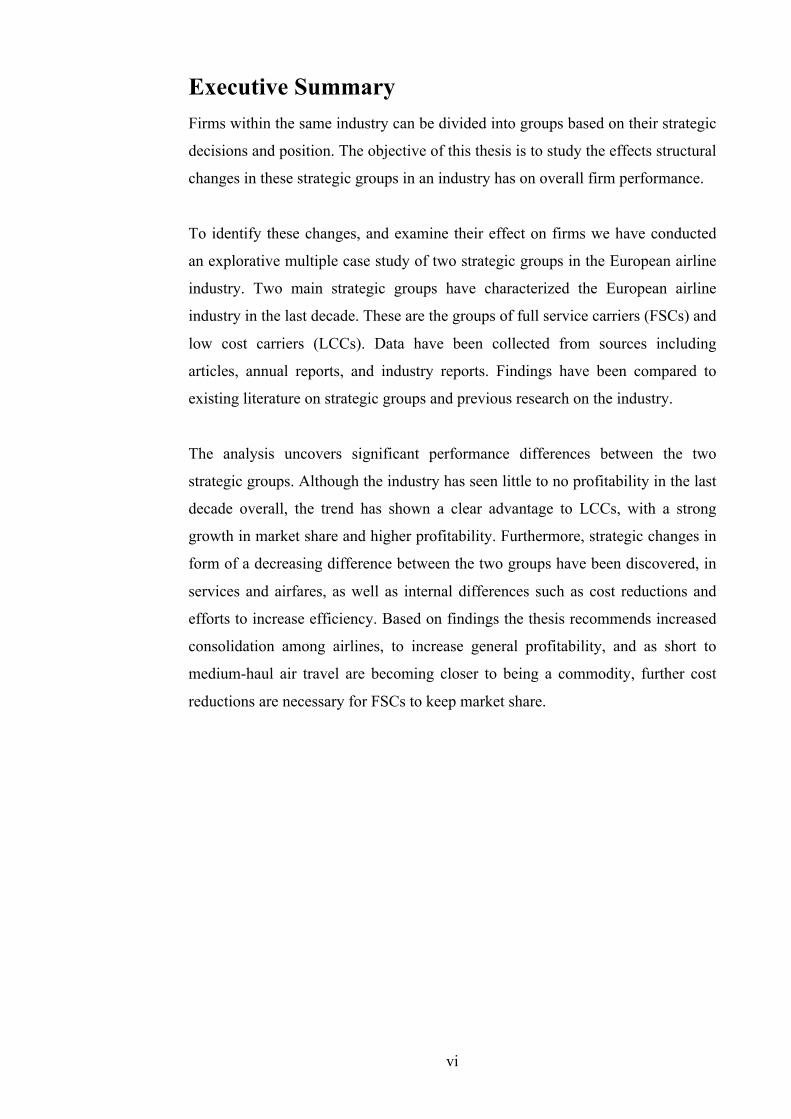
Firms within the same industry can be divided into groups based on their strategic
decisions and position. The objective of this thesis is to study the effects structural
changes in these strategic groups in an industry has on overall firm performance.
To identify these changes, and examine their effect on firms we have conducted
an explorative multiple case study of two strategic groups in the European airline
industry. Two main strategic groups have characterized the European airline
industry in the last decade. These are the groups of full service carriers (FSCs) and
low cost carriers (LCCs). Data have been collected from sources including
articles, annual reports, and industry reports. Findings have been compared to
existing literature on strategic groups and previous research on the industry.
The analysis uncovers significant performance differences between the two
strategic groups. Although the industry has seen little to no profitability in the last
decade overall, the trend has shown a clear advantage to LCCs, with a strong
growth in market share and higher profitability. Furthermore, strategic changes in
form of a decreasing difference between the two groups have been discovered, in
services and airfares, as well as internal differences such as cost reductions and
efforts to increase efficiency. Based on findings the thesis recommends increased
consolidation among airlines, to increase general profitability, and as short to
medium-haul air travel are becoming closer to being a commodity, further cost
reductions are necessary for FSCs to keep market share.

1
1 Introduction Since the 1990s, the European airline industry has been subject to significant
structural change, which has increasingly affected the behaviour and performance
of firms. The industry has historically been highly regulated. However, with the
liberalization of the air transport market in the 90s and the creation of The
European Single Market in 2001, it have triggered the creation of new airlines.
These changes gradually resulted in a new major business model for the
traditional full service carriers (FSCs): The low cost model. Utilizing the
deregulation and operating with a cost leadership strategy (Porter 1980). The new
business model offer lower fares and point-to-point flying, creating a whole new
market of price sensitive travellers. This is today known as low-cost carriers
(LCCs).
2 Research Issues The fierce competition has resulted in poor performance among European airlines
in the last decade, and FSCs in particular. The shift from being market leaders to
being outperformed by more efficient competitors has shifted the power balance
in the European airline industry, and the low cost carriers (LCCs) now dominates
over 40% of the capacity. As a result, FSCs are focusing on lowering unit cost to
strengthen their competitiveness, while LCCs are adding more features and
services to their product to capture more demanding passengers like the profitable
business market. The difference between these two strategic groups then, seem to
become smaller, and the previous clear lines are becoming blurry. This thesis will
analyse the drivers behind this structural change. By looking at performance
indicators for firms operating in the two strategic groups and discussing the
differences and changes we aim to predict how this trend will continue in the
coming 10-15 years.
Additionally, new entrants from Arabian Peninsula have also presented
themselves as a viable threat for the European FSCs, utilizing their location and
taking an increasing part of the long-haul market between Asia, Europe and the
US. The low profits among European FSCs have led to some consolidation,

2
driven by the economies of scale associated with the industry. Actors have been
forced to take drastic measures to survive, and in the last five years, Europe has
lost 73 scheduled airlines (Grant 2015). However, there has been no major M&As
in the same period, while regions such as the US have experienced several large
mergers, resulting in a significantly higher market concentration. The US airlines
have also enjoyed higher profits in the same period.
2.1 Research statement Based on the discussion assessment above, this thesis will concentrate on
examining and explaining how and why the European airline industry has become
as we see it today. We will aim to present how and why the European airline
industry structure has changed in recent years, and how these structural changes
have and will continue to affect the industry.
2.2 Research question Based on the issues discussed above, we have formulated the following research
question:
How do structural changes in the airline industry affect the dynamics of strategic
groups?
2.3 Research objectives To answer this question, we have identified five steps referred to as research
objectives. These steps are listed below:
• Develop and gain a thorough understanding of the airline industry in
general with special focus on Europe.
• Review earlier research on strategic groups in the airline industry.
• Identify the most appropriate method of categorizing European airlines in
various strategic groups and identify these groups.
• Analyse the changes in strategic group structure over the determined
period, and identify the drivers for this change.
• Find how these structural changes have and will continue to affect
performance in the industry.

3
To be able to answer the research question, we first need to develop a
comprehensive understanding of the industry, the dynamics of the industry and
the actors operating within this industry. This includes reviewing literature on the
industry, reports from airlines to get the key figures and reports from third parties
such as industry organizations and consulting companies to get an insight to
industry trends and focus areas. To understand the more informal trends and
development and relevant news articles will also be included.
Continuing, a more focused literature review on the strategic groups in the
airline industry will be conducted. This will help us identify the most frequently
used methods of categorizing firms in strategic groups. This is important given
that it could be conducted through different methods depending on the purpose of
analysis, and that the definition of strategic groups varies. In this section, we aim
to find the method of categorizing firms in strategic groups that best serves our
research question.
After establishing a deep understanding of the airline industry and
strategic groups in the industry, we will analyse the changes in strategic group
structure. This will be done within the given boundaries set, to best give a
foundation to answer the research question.
2.4 Thesis justification The increased globalization can be attributed to new technologies and enhanced
goods and services, like the air transportation market in Europe. The liberalization
has been crucial for the increased welfare and global connectivity, both
nationwide and for the European development. In regards of the aforementioned,
the paper will add value in three ways.
Firstly, we will examine with a comprehensive case analysis of the
European airline industry. There have been some research connecting strategic
groups and the airline industry with Kling and Smith (1995), Peteraf (1993),
Smith et al. (1997), Boyd (2004) and more. However, these contributions have
either been too theoretically or used the airline industry as a mean and not as an
end. It has therefore been less focus on the European airline industry. We will add
value by connecting strategic groups and the European airline industry, and
examine snapshots with the five forces model of the industry the last 15 years. By
the theoretical anchoring the thesis in strategic groups and the five forces model it
4
will give a better understanding of the European airline industry, and its evolution
and trends. This will further allow us to analyse the key drivers of these changes
and developments, and put it in context of the European airline industry today.
Secondly, building on the aforementioned and with case analysis it will
further provide value in terms of examining the trends and suggest possible
solutions to the challenges that lies ahead. We believe that this type of analysis is
useful as it offers an objective and neutral understanding of the airline industry.
Lastly, the remainder of this paper will discuss and analyse the research
questions. This will be done in accordance and in relevance of the literature
review as well as the application of the research method. The main body of the
literature review consists of strategic groups as well as Porter´s five competitive
forces. The research methodology discusses the methodology itself and supports
the discussion around the research questions. This section also provides
limitations and implications as well as a future outlook of the European airline
industry.

5
3 Literature review
3.1 Introduction In this part of the thesis we will examine the relevant theory concerning strategic
groups. The first paragraphs will discuss and define the term “strategic groups” in
regards to the traditional definition and the stream of perceptual strategic groups.
We will then move over to the creation of strategic groups and their interaction
and positioning relative to other strategic groups. Thereafter we will discuss the
different methodologies conducted in order to identify strategic groups. Lastly, we
will give a comment of why strategic groups are important. This literature review
and presentation of the theoretical framework is crucial in order for the reader to
understand the structure of the two strategic groups and how it is applied in the
thesis. The two strategic groups analysed in our thesis are the strategic groups of
European low-cost carriers (LCCs) and European full services carriers (FSCs)
3.2 Definition There are several definitions of strategic groups, but little unification of which the
right one is. Our definition of strategic group is based on Hunt (1972) and Porter
(1980) who defines strategic groups as “businesses who follows the same or
similar strategy can be grouped together in finer grouping”. This definition
emerged from Hunt´s and Porter´s research. Hunt identified that firms in the white
goods industry adopted different strategies in order to achieve their goals,
demonstrating that strategic groups were based on their strategic behaviour (Hunt
1972). As Hunt focused upon the homogeneity of operations within similar
businesses and strategic differences between competitors, Newman (1978) on the
other hand examined the activities done by firms outside of the industry, as well
as identifying the relationship between industries. Newman (1978) argue that
firms who are running the same type of business, as a function of their business
strategy belongs to the same strategic groups, while others who have different
principal business in the same industry belongs to another group (McGee and
Thomas 1984). Michael Porter (1980, 129) follows a similar pattern like Hunt
(1972). Porter believes that an industry can be viewed as a constitution of clusters
of firms with similar strategies (Porter 1979b). Porter (1980, 129) defines a

6
strategic group as firms who follows the same or similar strategies in terms of pre-
specified strategic dimensions, in which he argues: “An industry could have only
one strategic group if all the firms followed essentially the same strategy”. The
perspective of strategic groups can be applied the automotive industry, where
Ferrari and Lamborghini are in the same strategic group as they have apply
roughly the same business strategy – making super cars. On the contrary, Toyota
and Volkswagen belongs to the same strategic group as they aim to produce
reasonably priced cars for the majority of the market.
Context and background of strategic groups
Strategic group has its roots from the field of Industrial Organization (IO). The
main theories of IO argue that market structure has an impact on firm
performance, hence the return and profit of the firms (Mason 1939; Barney and
Ouchi 1986). These structures include the likes of product differentiation, entry
and exit barrier, market concentration, economies of scale and similar (Caves and
Porter 1977; Bain 1956, 1954). Their assumption is that all firms in the industry
seek to maximize their profit and have the same market structure constraint.
(Fiegenbaum, McGee and Thomas 1988). Moreover, Porter (1979b) in his earlier
research suggested that all firms are the same in all relevant economic dimensions
except of their size neglecting the firm´s conduct.
However, in recent time the focus has been pulled towards a firm´s
conduct and their strategic choices, and how these affect the firm performance.
This is known as the “Behaviourist” paradigm (Fiegenbaum, McGee and Thomas
1988). This created a stronger link between the traditional industrial organization
concepts and the discipline of strategic management (Porter 1981). The result has
been increased focus on firms´ conduct and how it interacts with the market
structure.
With the conduct and strategic choices within an industry having become
more prominent, it also became crucial to define the boundaries of the industry.
Two criteria have emerged to define these boundaries, namely the market criterion
and the technological criterion. Caves (1967) defines the market criterion as to
those products within an industry that are perceived as similar or close substitutes.
The technology criterion as described by Andrews (1951) emphasizes the
similarity in the production processes (McGee and Thomas 1984; Thomas and

7
Venkatraman 1988). Although, these two criteria contributes, they still do not
specify where an industry begins and where it ends, as many large firms produces
a wide range of products/services in a number of different industries (McGee and
Thomas 1986). As a consequence of the ambiguity in regards of the industry
boundaries, the introduction of finer grouping took place, which were based on
the criteria they are observed upon. This is now generally known as strategic
groups (McGee and Thomas 1986; Thomas and Venkatraman 1988; Fiegenbaum,
McGee and Thomas 1988; Porter 1980).
Porter´s foundation of strategic groups
The previous paragraph has discussed different definitions of strategic groups in
the light of firms business strategy and managers mental models and perception,
being the key determinants. In this paragraph we will examine more thoroughly
Porter´s ideas and concepts of strategic groups.
In Porter´s (1979b) earlier research he suggested that the market interdependence,
strategic distance among strategic groups, and the size and number distribution are
the major determinants of defining strategic groups. This can also be traced back
to Porter´s doctoral dissertation (1973) in which he classified strategic groups
based on firms size in the consumer goods industry. He divided these strategic
groups in two categories, namely industry leaders and industry followers. Porter
(1979b) argued composition/configuration of strategic groups would be different
from a strategic group to another. However, the leader group should include the
strategic groups that are defined by potential strategies of economies of scale,
vertical integration, captive distribution, service facilities, large sales force, broad
product line and so on. On the other hand, the follower group, is most likely to
involve strategic groups with firms who follow narrow-line or specialist
strategies, domestic strategies and similar. Overall, this dichotomy of leader and
follower group explains some of the variance among strategic groups according to
Porter (1979b).
In his later research Porter suggested that firms in a group, not only have
the same or similar business strategy, but also resembles each other in terms of
market share and tend to be affected by the same external forces (Porter 1980,
130). An example that can be traced to Porter´s 3 generic strategies. Porter (1980,

8
149-152) proposes that these strategies are essential in order to outcompete the
competitors in the strategic group. These 3 generic strategies emphasizes cost
leadership strategy – lowest cost, differentiation strategy – unique product/service,
and focus strategy – focus on a particular segment (product/service/market)
(Porter 1980, 35-39). Roughly, a firm applying one of these three strategies can be
grouped together with other firms applying the same strategy.
Porter further argue that firms who fail to develop a strategy in one of these
directions, will become what he terms “stuck in the middle” and is likely to have
low profitability. This also applies to the strategic group itself as it suggest that
the composition of strategic groups will affect both firm performance and the
overall industry performance (Fiegenbaum, McGee and Thomas 1988). Moreover,
interdependency is highly influential. A higher interdependency will intensify
competition and will mirror the various asset structures of the competitors
(Fiegenbaum, McGee and Thomas 1988). This would therefore suggest that
strategic groups´ composition and profit in the industry were related (Hergert
1983; Porter 1979b). Furthermore, a large pool of strategic groups in the industry
or many firms in the same strategic group with equal size indicates a higher
degree of rivalry or higher probability of tacit collusion between them. Contrary,
unequal size distribution of the strategic groups as well as fewer strategic groups
will benefit the larger strategic groups as tacit collusion is not expected
(Fiegenbaum, McGee and Thomas 1988). Generally, many competitors in the
same strategic group or many strategic groups, or a combination of both, would
normally lead to high degree of competition and squeezed profit.
However, this only applies if the strategic group is in close distance from each
other. Obviously, firms in the same strategic group is close as they have the same
or similar business strategy, it is not the necessary the case with the strategic
groups itself. Examining on a group-level it is believed if the distance or position
between strategic groups is large, tacit collusion will be more difficult and
competition between strategic groups will be lower. Ken, Wally and Young
(1997) find evidence of strategic groups and the relevance of distance in their
study of the US airline industry with the strategic groups of high-end strategic
group, namely the entrenched-dominant group and the niche-seeker group. They

9
find that there is no within-group rivalry among the niche-seekers and
insignificant rivalry in the group high-end flyers. While, in the entrenched-
dominant they find evidence of high competitive activity. In other words, they
have faced a trade-off what to do and most important, what not to do and may find
themselves stuck in the middle (Porter 1985, 17-18; 1996).
Although, if there are several firms within the same strategic group of equal size
the notion of high competition within the group still remains. Therefore, on a
group-level relative distance among other groups may imply advantages or
disadvantages in the overall market.
The Cognitive approach
The cognitive approach, perception and mental models are heavily linked to
creation of strategic groups. This sub-paragraph will further investigate the
implications perception and mental models have on strategic groups. The
cognitive approach to strategic groups refers to managers and key stakeholders
defining strategic groups on the basis of how they see the world. The general
notion of the cognitive approach is that perception is reality and a thorough
understanding of the strategic decision processes may ease the method of separate
strategic groups (Leask and Parker 2006). This aligns with Reger and Huff (1993)
who suggest that the managerial perception of the characteristics of their
competitors will affect the strategic decision making. In addition, it is therefore
assumed that managers construct mental market models that are built on their
perception of their competitors (Leask and Parker 2006). Overall, strategic groups
through the cognitive approach are not exclusively based upon similar business
models, but rather the market characteristics and features.
In regards of the mental models and perception it is suggested that realized
strategy is based on decision makers or managers´ cognitive and institutional
constructions (Leask and Parker 2006). This suggest that firms’ business
strategies are based on managers’ perception and mental models, hence managers
to a large degree decides which strategic group they will compete in. Porac,
Thomas and Baden-Fuller (1989) terms this as primary competitive groups.
Primary competitive groups reassembles strategic groups in many ways, however

10
there are key characteristics that separates them according to Porac, Thomas and
Baden-Fuller (1989). Firstly, primary groups are grounded on psychological
reality, while strategic groups are analytical abstractions. Secondly, primary
groups are constituted of both technological and market distinctions, as decision
makers believe these two aspects are intertwined and extricable. Thirdly, primary
groups are psychological and sociological entities in contrast to strategic groups
that are exclusively economic entities. Lastly, a primary group develops through
the reciprocal representation of cognitive and material conditions. With this
approach in mind, strategic groups constitute two views (Leask and Parker 2006).
Firstly, perception decides the actions in order to compete in the
market/environment. This refers to the fact that managers´ perception decides
generic strategies or industry copies. Secondly, managers decide the set of
transactions that connects the firm with its environment, through their perception
in terms of the firm´s identity, competitors, customers, and similar. Leask and
Parker (2006) further proposes that for strategic grouping based on managers´
perception it means that external events are interpreted the same or similar ways.
As a result, future decisions are grounded on these interpretations. With these
characteristics it is believed that primary groups not only serve as a peer, but also
as an extension.
Perception and mental models
Heavily linked to the cognitive approach to strategic groups are managers and key
stakeholders’ perception of who to include in the strategic groups. Reger and Huff
(1993) argue that strategic groups are a part of strategists´ and executives´
perception in terms of how they organize and structure the cognitive competitive
environment. Other cognitive researchers assume that strategic groups are formed
through each managers´ perception, which becomes a collective process of shared
constructions. This practically means that managers and key stakeholders together
creates a common consensus of what strategic groups are in the industry and
which firms that are a part of the strategic group (Berger and Luckmann 1966;
Spencer, Peyrefitte and Churchman 2003). One important aspect is therefore, as
Leask and Parker (2006) emphasize, the cognitive research as it argue that
management define the competition, implying that competitors are not given but
rather mental entities. Porac, Thomas and Baden-Fuller (1989) further presents

11
that mental models of managers and executives establish the perception of the
competitive environment and its organizations, which further suggest a finer
grouping. Subsequently, with these beliefs established the competitive
environment, managerial perception and actions will be influenced (Spencer,
Peyrefitte and Churchman 2003).
In summary, the cognitive researchers have grounded their theory on the
logical assumptions that the industry participants must acknowledge the strategic
groups, which then influence the conduct of firms and hence their behaviour
(Peteraf and Shanley 1997; Spencer, Peyrefitte and Churchman 2003). This
cognitive research perspective gives a further insight of the underlying drivers of
the observed strategic change and provides the concept of strategic group an
additional dimension of deeper understanding (McNamara, Luce and Thompson
2002).
Unit of analysis
The general unit of analysis in regards of strategic groups have either been on the
firm level or group level. Fiegenbaum, McGee and Thomas (1988) argue that
there are 2 dimensions or levels of investigations,
The firm level: This can further be narrowed down to strategies in regards
of products, markets or similar customers i.e. Porter´s three generic strategies.
Moreover, most studies investigate either the link between strategy and
performance for different strategic groups or specify current strategic groups.
Nonetheless, it is highlighted that these studies can also attribute to the
understanding of the strategic behaviour of firms. For instance, once the strategic
groups are identified, and firms make sense of their competitors’ strategic
behaviour, they will most likely also follow similar strategies over time as they
have similar assumption about the future (Porter 1980, 49). In summary, firms of
the strategic groups will most likely follow similar strategies over time.
The group level: as firms in a strategic group will have similar strategic
behaviour over time, so will the composition of strategic group. Additionally,
future positions will emerge as the industry evolves. This refers to an increase of
the total size of an industry and it will make it more attractive and more feasible
for aggressive firms to enter and promote new strategic groups (Porter 1980, 136).

12
On the other hand, Porter (1980, 136) suggest an industry decline may also lead to
fewer strategic groups in the industry.
Overall, firms’ strategy and behaviour decides their membership of which
strategic group they are part of, but also decides the group´s position.
3.3 Formation of strategic groups
The paper has so far examined the different streams of definitions of strategic
group, with emphasize on Michael Porter´s definition of strategic group namely
businesses with the same strategy can be grouped together. This would naturally
suggest that strategic groups are formed automatically once two or more firms are
identified with the same business strategy. This is concretized by Fiegenbaum,
McGee and Thomas (1988) who argue that a crucial assumption of strategic
groups is that firms within an industry behave differently, as a uniform behaviour
would lead to all firms being grouped in the same strategic group, ceteris paribus.
By combining Porter´s definition of strategic groups, as a function of similar
business strategy, and Fiegenbaum, McGee and Thomas (1988) framework of the
creation of strategic groups provide explanations;
Firstly, Fiegenbaum, McGee and Thomas (1988) suggest different firms
have different goals, in which they refer to maximization of profit (Stigler 1964),
maximization of revenue (Baumol 1959), maximization in growth (Morris 1964;
Williamson 1966), utility maximization of management (Williamson 1963).
Secondly, “all roads lead to Rome”. This famous quote refers to the fact
that different strategies can lead to the same goal. This is empirically justified in
Hergert´s paper (1983). He finds, through his own developed mathematical model,
that member firms will maximize the same goals although through different
strategies. The implications of his findings suggest different strategies of member
firms may lead to the same or similar goals.
Thirdly, a crucial notion is that all firms have different assumptions of the
potential future, in which affect their behaviour and therefore also their business
strategy (Fiegenbaum, McGee and Thomas 1988).
Fourthly, firms will position themselves differently according to when
they enter a new industry. This is obviously due to firms having different skills
and resources, as an incumbent firm will have more experience than a new

13
entrant. Time and timing are key determinants. Some strategies may be more
likely to succeed than others depending on the timing of entry.
Lastly, any environmental change in the society, in industry, or similar
will affect different firms in different ways ways. Fiegenbaum, McGee and
Thomas (1988) suggest that formation of strategic group is dependent on the
definition of strategy used or realization – strategy as intentions or intended
strategy (Mintzberg 1978). In general, studies have used the realization definition,
in which strategic groups are defined by ex-post archival financial statement
information (Fiegenbaum, McGee and Thomas 1988). Overall, strategic groups
are formed differently due to their different business strategies and assumptions,
though their goal may be the same. Depending on scholars they all have different
views of the creation and formation of strategic groups, but following the same
reasoning as Porter the creation will be based on firmss business strategy.
Importance of position of the strategic groups
A key determinant of profitability of strategic groups, are their position within the
industry. As we will see in the analysis different strategic groups have better
performance than others. Fiegenbaum, McGee and Thomas (1988) argue in favour
of three scenarios how distance between strategic groups shapes the industry and
how it influences the performance.
Firstly, as some firms apply strategies that are better positioned to the
market condition than its competitors, it may lead to better performance. This
implies firms membership to a strategic group will have the chance to achieve a
profit over the average in the industry (Fiegenbaum, McGee and Thomas 1988).
This would therefore suggest that firms in other strategic groups will try to move
over to the superior group. However, they may be hindered by mobility barriers.
We will discuss these barriers extensively in later sections.
Secondly, when other strategic groups in the same industry compete head
to head it will affect the profit in the industry. Contrary, strategic groups not
competing head-to-head may yield higher profits, though it may depend on the
internal rivalry within the strategic group. Consequently, on group-level, the entire
group may try to move closer to the superior group as it yields higher profits
compared to the other groups in the industry. Additionally, as groups naturally
will try to improve their position, suggesting that their competitors will react

14
dynamically and the overall profit in the groups and industry will decrease
(Fiegenbaum, McGee and Thomas 1988).
Thirdly, as firms will try to enter the group with higher profit they may be
hindered by the so-called the mobility barriers, which bounds the entry into the
group by hindering imitation (Caves and Porter 1977; Porter 1980, 133; Dranove,
Peteraf and Shanley 1998). Mobility barriers are therefore believed to be a higher
barrier which will increase the exploitation of profit opportunities (Fiegenbaum,
McGee and Thomas 1988). The existence and development of these barriers may
also blossom of what Lippman and Rumelt (1981) explains in Fiegenbaum,
McGee and Thomas (1988) as uncertain imitability. They apply the concept in the
context of when a firm tries to imitate a strategy of others who are members of a
superior strategic group; it may not be feasible as there is uncertainty in the
process of implementing the strategy in practice.
Furthermore, examining the dynamic nature inside the strategic group
Porter proposed, like Fiegenbaum, McGee and Thomas (1988); Fiegenbaum and
Thomas (1995), the position inside the strategic group have an influence on the
performance of the firm. This effect is embedded in the similarity of strategy as it
may be of comparable scale, the same scale differences may appear as a
disadvantage for smaller firms, as they are subject of economies of scale.
Additionally, it is argued that a firm´s ability to implement a strategy will affect
its performance as better management will drive the probability of superior
performance (Fiegenbaum, McGee and Thomas 1988).
Overall, all of the above shows the essence in Porter´s fundamentals of
strategic group in which he structures the theory in order to explain interfirm
differences in performance. As has been highlighted there are 4 cornerstones: (1)
the positioning of the firm will affect the membership of strategic group and
therefore also the performance; (2) composition of strategic group influences the
firm performance; (3) the strategic group´s position relative to other strategic
groups on the same industry level may have performance implications and they
may try to move into new positions and; (4) location within the strategic group
affect the firm performance.

15
The value of applying strategic groups
The value of an analysis of strategic groups is to identify differences in strategies
between rivals and explain the persistent variance in their performance (Day
1984). Furthermore, Aaker (2008) argue the analysis of strategic groups is an
exercise of identifying the key determinants of a firm´s strategy in order to be able
to concisely group firms together. The aim of this grouping is to provide insight
and a better understanding of the competitive behaviour and environment
(Olusoga, Mokwa and Noble 1995). Hatten and Hatten (1987) follows a similar
reasoning and suggest strategic groups are highly useful in 3 different settings; (1)
groups are used to hold information characterising the individual firm as the info
usually are lost in studies with aggregated and averaged data; (2) allows a more
comprehensive investigation of several firms; (3) summarizing the information of
group analysis can be used to highlight key dimensions into high relief. Porter
further argues the implications of strategic groups resides in the
performance/profit in two different ways (Porter 1979b). Firstly, through
analysing the entry barriers of moving into a strategic group. Secondly, the
number of strategic groups affects the rivalry between incumbent firms, broadly
defined. Strategic group is also strongly influenced by the five forces model
according to Porter (1980, 136-141) as these factors determines the difficulty of
adopting the strategy in order to be part of the respective strategic group (Porter
1979b).
In general, the strategic group analysis brings value as it provides an
explanation why similar firms, based on their business strategy, have superior
performance to other firms in the same industry.
3.4 Research on strategic groups Due to the different definition of strategic groups, there has not been a uniform
methodology of how to conduct research. Without a common guideline or
paradigm of how to conduct the analysis several different types of research have
emerged analysing strategic groups at different levels and units to examine.
(Thomas and Venkatraman 1988). It is therefore essential to obtain an overview of
how and of what researchers have previously examined in their strategic group
analysis.

16
Oster (1982), in stark contrast to many other researchers on the field,
focused on firms conduct as the differentiation variable of groups. She believed
the advertisement strategies differed (measured in advertising to sales ratio) would
be the key differentiator of membership of a strategic group. She ranked firms
above or below the industry average and if the firm was at top or bottom of
industry distribution of the respective year (McGee and Thomas 1984; Oster
1982). This was used to examine the changes in the group with the indicator of
differences in the advertising to sales ratio of the firm over time. The result
showed if firms advertising strategy was stable over time it would preserve the
structure of the whole group. If this measurement was fluctuating, firms would no
longer be a part of that particular strategic group, but rather create a new one. This
aligns with the idea of advertising being an entry barrier and mobility barrier
within the consumer goods industries (Oster 1982; McGee and Thomas 1984).
Other researchers in theories of finance, have used the capital asset pricing
model as their methodology in order to identify groups (Ryans and Wittink 1985).
Ryans and Wittink (1985) examines the airline industry arguing that if airlines are
grouped together, their stock prices will also tend to move together. Their
assumption is that airlines are usually one-industry firms and being an incumbent
in the industry over a long time period would not affect the security prices. The
study shows that regional and intra-state airlines did not have any clustering
pattern, while trunk airlines were grouped together.
Furthermore, Primeaux (1983) studied the petroleum industry. He argued
that investment behaviour, measured in net capital expenditures, would be an
important variable in addition to the identification of the life cycle stage of an
industry. He connects the concept of life cycles and strategic groups, showing that
some industries can be assessed as a function of the industry life cycle (McGee
and Thomas 1984). In summary, Primeaux argue that difference in investment
behaviour among strategic groups is due to leader/following firms, which in this
case are the younger firms (Porter 1973, 1979b; Primeaux 1983).
Overall, these other contributions in the stream of strategic groups have
recognized that differences between firms as it may be an intended outcome of
firms’ decisions over time. In other words, strategic choice is related to the
groupings of strategic groups (McGee and Thomas 1984). In addition, the
challenge of researcher’s ad-hoc definition of strategic groups is also a concern.
17
Notable people in this field like Hunt used product lines, Newman vertical
integration, Porter with market size, Ryans and Wittink used financial strategy,
investment behaviour from Primeaux and so on. In other words, there is no
unification of the methodologies of research on strategic group analysis.
Key take-aways of strategic groups
As a result of these different definitions, methods and scope of the respective
researchers, Thomas and Venkatraman (1988) identified key take-aways in the
concept of strategic groups.
Firstly, no industry is homogeneous. One common pattern between earlier
studies are that the research first tried to develop a common ground based on the
chosen industry given that it is heterogeneous. In addition, strategic groups are
identified based on a set of characteristics. Thomas and Venkatraman (1988)
believe that the general approach have been to study a specific industry, identified
a set of dimensions and then used data-reduction techniques in order to group
them. They believe this finding and its application is a rather weak interpretation
of strategic group in theory and in practice.
Secondly, is the acceptance of pre-specified boundaries of the industry.
Thomas and Venkatraman (1988) refer to the general acceptance of the definition
of an industry through the terms of Standard Industrial Classification (SIC). This
acceptance is a common trend in the research of strategic group. However, SIC is
just a classification scheme in terms of products and it is discussed whether this is
appropriate to use in the identification of industries boundaries (Reger and Huff
1993). It is therefore suggested to incorporate concepts of market and industry in
order to get a more comprehensive definition (Thomas and Venkatraman 1988).
Thirdly, there is no consistent pattern in group characteristics. As have
been examined so far, researchers have based their strategic groups on different
variables (e.g. Porter with size, Ryans and Wittink with stock prices and so on). In
addition, it is argued that if the research and study were anchored around a
common operationalized strategy like Porter´s (1980) generic strategies, it would
have been possible to see a common pattern.
Lastly, is the lack of clarity in the description of groups. It is argued that
no empirical research incorporates the three main characterizations of groups; (1)
groups include firms; (2) firms within a group are similar to each other, in contrast

18
to firms outside of the group and; (3) firm behaviour will be affected similarly to
external forces. As a consequence, Thomas and Venkatraman (1988) debate
whether or not groups only reflect statistical homogeneity and nothing more.
Overall, we have in the literature review of strategic groups seen different
streams and frameworks of how to analyse strategic groups. We will continue
using Porter´s definition of strategic groups being firms applying the same or
similar business strategies.
3.5 Barriers Barriers and especially mobility barriers were briefly mentioned in the previous
chapter. Strategic groups and barriers have in the latter years been heavily
interlinked, however, due to the importance of the concept we decided to define
these two concepts separately. We will now investigate further in this field with
discussion on how it can be applied, before we move over to the Porter´s five
forces model.
The theories of Industrial Organization (IO) have influenced strategic
groups and especially barriers. This includes the entry barriers and mobility
barriers. The definition of the term “entry barriers”, is based up the mainstream
arguments that any factor or determinant that hinders a firm to enter the market. In
addition, it is worth remarking that the scope of analysis is set at an industry-level
(OECD 2007). Joe Bain (1956), one of the most prominent figures in the concept
of entry barriers, defines it as an advantage an incumbent firm have in the industry
which allows them to earn profits over time and over any potential entrant
(McAfee, Mialon and Williams 2004; New Your University 2006). Nobel Prize
laureate George Stigler, on the other hand, defines it as the cost of producing a
product/service by pursuant firm, and not an incumbent firm (Stigler 1968;
McAfee, Mialon and Williams 2004).
Moreover, with the paper of Caves and Porter (1977) they further extended
the concept of entry barriers into another layer, called mobility barriers. They
believe the theory of barriers of entry is limited due to the movement of firms
from zero output to positive output (Caves and Porter 1977). Instead, Caves and
Porter (1977) proposes that the strategic position by an entrant is dependent of
difficulty of the entry. Mobility barriers are therefore functioning as restraints in
the firm´s strategic positioning within an industry, and impedes some firms

19
gaining a stable profit over time (Porter 1979b). This also provides an explanation
of why some firms within an industry have better performance than others in the
same industry, as well as providing a foundation for a firm´s positioning within an
industry (Porter 1980). Nonetheless, Porter acknowledges that mobility barriers
are only a potential determinant of performance at group level, as he admits
performance is also a function of firm-specific factors (Cool and Dierickx 1993).
It is therefore argued that mobility barriers not only hinder new entrants, they also
affect firms competing in the same industry. As a result, this is resolved around
different asset configurations in which firms may want to reposition or improve
their existing strategic position (Fiegenbaum, McGee and Thomas 1988).
Several researchers have successfully connected mobility barriers with
strategic groups. For instance, Caves and Porter (1977) suggest to a large extent
with evidence from others, that groups within an industry exist (Hunt 1972;
Newman 1978; Porter 1979b). They believe that firms within a group resembles
each other and recognizes their interdependence, suggesting that the boundaries of
a group may hinder, although not prevent, the development of oligopolistic
consensus and industries with more complex structures would therefore show
better performance, ceteris paribus (Caves and Porter 1977). Instead of becoming
a common protective shield for the entire industry, it becomes specific for each
and every group. Additionally, the mobility barriers also function as a barrier to
entry into any of the groups within the industry for the new potential entrants.
This notion further underpins strategic groups as a key concept as it provides
means of the existence of sustained performance between groups (Porter 1980,
132-135; Leask and Parker 2006). Initially, the concept of mobility barriers by
Caves and Porter (1977) suggests that firms act in concert in order to build high
entry barriers to protect the group´s profits (Leask and Parker 2006). However, it
is suggested that this common behaviour was due to similarities in strategies of
firms in the same strategic group and therefore pursued similar strategies (Leask
and Parker 2006). As a result, McGee and Thomas (1986) argue that firms
monitor the behaviour of similar organizations in the same competitive
environment in order to exploit any strategic options. Additionally, firms examine
the strategies of other competitive groups, but focus initially on their own group
as a reference point (Fiegenbaum and Thomas 1995). Furthermore, Leask and
Parker (2006) sheds light upon the variables one should use in order to define

20
strategic groups which are also influenced by the mobility barriers. This implies
that these relevant mobility barriers also hinder and prevent free movement of
firms between groups (Leask and Parker 2006). Possibly, these variables may be
of relevance, found in Porter´s generic strategies or Miles and Snow typologies,
like firm´s manufacturing process, R&D process and invention of patent creating
mobility barriers (Porter 1980, 35; Miles et al. 1978; Leask and Parker 2006).
Nevertheless, with the application of mobility barriers in the definition of strategic
groups, a crucial step of the process is to identify key strategic decisions, and
these decisions influences the creation of a sustainable market positions within a
respective market.
It is also worth noting that for instance Mascarenhas and Aaker´s (1989)
definition of strategic groups rests upon the concept of strategic barriers. They
define strategic groups as a group of businesses that is separated from other
groups by entry and exit barriers and of course mobility barriers. In addition, they
borrow the definition of mobility barriers from McGee and Thomas (1986) who
suggest that mobility barriers discourage any measure of moving from group to
another, due to its extensive cost, time and uncertainty (Mascarenhas and Aaker
1989). Similar suggestions from researchers with another theoretical foundation,
like Rumelt, suggest that mobility barriers both define strategic groups and also
underpins the strategic activities conducted by the group members (Foss 1997,
141).
McGee and Thomas (1986) argue in favour of the classification of groups
(without using the term “strategic group”) by their mobility barriers. This is also
heavily related to Porter´s 3 generic sources, though McGee and Thomas uses
mobility barriers as the mean. The sources of mobility barriers are divided into 3
general categories: market-related strategies, the supply characteristics in the
industry, and owner – and management-specific features of an individual firm. (1)
the market related strategies includes product line, scope, geographical coverage,
market segments, technology embedded in the product and similar; (2) the supply
characterizations embraces factors like economies of scale, range of assets to be
invested in the “supply” capability, technological capability and similar; (3) the
management specific features can be traced to the firm´s organizational
production function where their skills and organization structure is employed
efficiently.

21
In summary, there are several definitions and applications of mobility
barriers. However, one common pattern in mobility barriers are their connections
with strategic groups as the mobility barriers act as barriers that any firm need to
overcome in order to enter the strategic group, both from outside the industry and
within.
3.6 Contributions As we have discussed strategic groups are defined as “businesses that follows the
same or similar strategy can be grouped together in finer grouping”. This
definition will in the later sections be used in the analysis, with low-cost carriers
and full-services carriers. The main contributions of strategic groups can be
attributed to the two definitions described above, namely the business strategy
definition and managers’ mental models of firms and groups. This will be the
foundation of the two strategic groups that we will discussion later in the thesis,
namely, full-service carriers and low-cost carriers. By combining and applying
these definitions together we can identify strategic groups through companies’
public press releases and annual reports, as they will characterize themselves in
regards of either being a low-cost carrier or full-service carrier in Europe. The
application of strategic groups will give an explanation of how similar type of
business strategies provides better performance than other.
Moreover, Peteraf (1993) suggest that strategic groups is a useful analytical
tool and deepens the understanding of the competitive forces in the industry, like
the airline industry, as well as extending the insight of the oligopolistic
interaction. McGee and Thomas (1984) further argues that strategic groups
contribute in an enhanced understanding of the structure-conduct-performance
paradigm (SCP). Additionally, they propose that strategic groups help identifying
a firm´s competitive position as well as highlighting the strengths and weaknesses
in terms of their competitive advantage.
(Porter 1979b) suggest that the concept of strategic groups contribute to a
systematically integration of a firm's resources and differences in an industry. This
further extends their results in a theory of profit determination, through a firm´s
strategic choices (Porter 1979b). By the aforementioned, Porter believes it solves
the disagreement whether strategic groups just in fact a properly defined industry
or not. Porter (1981) further proposes that the strategic groups and mobility

22
barriers contribute in the analysis of a film’s strengths and weaknesses.
Additionally, strategic group/mobility barriers build the foundation of industry
evolution, where firms seek to improve their strategic position through different
investment and strategies (Porter 1981).
The definitions and insights gathered in the previous part will be extensively
used in the analysis. However, before we move on to the analysis of the European
airline industry, we will discuss the tool that creates the context of the industry
and will help us give a more comprehensive insight.
23
3.7 Five forces model
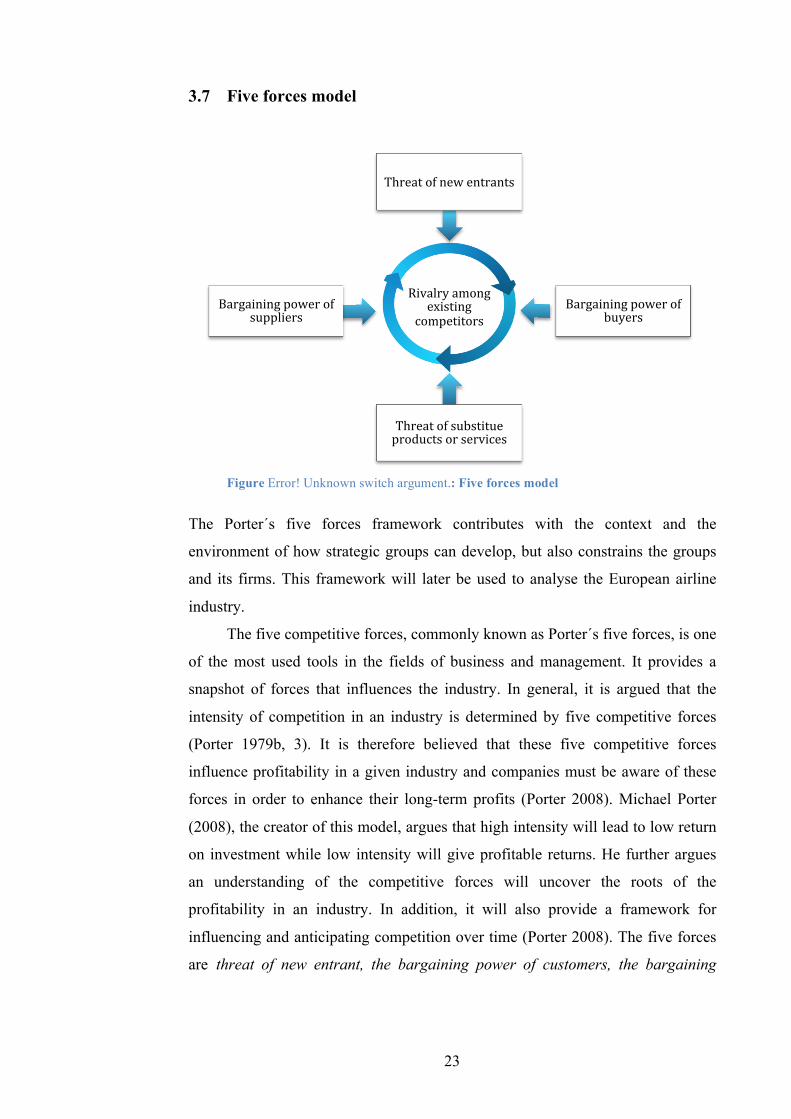
The Porter´s five forces framework contributes with the context and the
environment of how strategic groups can develop, but also constrains the groups
and its firms. This framework will later be used to analyse the European airline
industry.
The five competitive forces, commonly known as Porter´s five forces, is one
of the most used tools in the fields of business and management. It provides a
snapshot of forces that influences the industry. In general, it is argued that the
intensity of competition in an industry is determined by five competitive forces
(Porter 1979b, 3). It is therefore believed that these five competitive forces
influence profitability in a given industry and companies must be aware of these
forces in order to enhance their long-term profits (Porter 2008). Michael Porter
(2008), the creator of this model, argues that high intensity will lead to low return
on investment while low intensity will give profitable returns. He further argues
an understanding of the competitive forces will uncover the roots of the
profitability in an industry. In addition, it will also provide a framework for
influencing and anticipating competition over time (Porter 2008). The five forces
are threat of new entrant, the bargaining power of customers, the bargaining
Figure Error! Unknown switch argument.: Five forces model
Rivalryamongexisting
competitors
Threatofnewentrants
Bargainingpowerofbuyers
Threatofsubstitueproductsorservices
Bargainingpowerofsuppliers

24
power of suppliers, the threat of substitutes and rivalry among existing
competitors.
3.7.1 Threat of new entrants
This factor refers to new entrants in the industry, which may be perceived as
threats for the incumbent firms. New entrants may possess significant resources,
new technology and capacity among other factors, which they try to leverage for a
market share. Furthermore, the threat is dependent on the so-called barriers to
entry, which refers to any hindrance that may affect the entry, and the reaction of
incumbent firms (OECD 2007; Caves and Porter 1977). If the entry barriers are
high or the newcomer expect fierce retaliation from incumbent competitors, the
threat of entry will be low. Porter (1980, 7; 2008) describes in detail seven major
determinants of barriers to entry:
(1) Product differentiation which refers to brand identification and
customer loyalties and similar.
(2) Capital requirements refers to the large amount of resources needed to
enter the industry.
(3) Economies of scale refers to the hindrance of potential entrants due to
the need to enter in a large scale.
(4) Switching costs refers to the costs of switching from one supplier’s
product to another’s.
(5) Access to distribution channel may be a barrier, as you need a secure
distribution channel to achieve profits.
(6) Incumbency advantages independent of size and scale refer to the
technology or knowledge that is not replicable.
(7) Government policy refers to their power and control of regulations,
subsidies, licensing and limitations of materials and similar.
In general, Porter (1979a) suggest that entry barriers should be analysed relative to
the capabilities of the potential entrants.
3.7.2 Bargaining power of customers
Bargaining power of customers refers to customer’s power to pressure for price
reductions, especially when they have negotiating leverage to actors in the

25
industry, and can play competitors against each other (Porter 1979a). The
bargaining power of a group is often characterized by:
(1) The volume or concentration of the customer’s purchase.
(2) The products that are bought by the customers are undifferentiated or
standardized.
(3) Low switching costs.
(4) The buyer has full information.
(5) The purchase of the product only represents a small amount of the
buyer´s costs or purchases.
Porter (1980, 26) suggests that these sources can be attributed to consumers as
well as commercial and industrial buyers, with some adjustments of the frame of
reference.
3.7.3 Threat of substitute products or services
A substitute product or service delivers the same or similar function and
functionality. Porter (1979a) believes that in every industry some sort of substitute
will always exist, although it may be overlooked, as it may appear different from
the industry’s product. The substitute product or service would hinder and sets a
ceiling on the prices. Furthermore, if the industry does not increase the distance
from the substitute through marketing, product performance or other similar
means, the profitability will suffer. Porter (1979a) argues that the threat of
substitute will be high if:
(1) It offers an attractive product-performance trade-off in comparison of the
incumbent product in the industry.
(2) The switching cost to the competing substitute is low.
In general, major technological changes and innovations in seemingly unrelated
businesses and industries may proceed to have a major impact on the profitability.
3.7.4 Bargaining power of suppliers
This competitive force refers to the bargaining power suppliers can exercise as
they can threaten to raise or reduce quality and quantity of their goods and
services (Porter 1980, 27). This would therefore enable powerful suppliers to

26
squeeze profit out of an industry, capturing the majority of the value. Porter
(1979a) suggests that a supplier is powerful if:
(1) There is high concentration among suppliers and the market is
dominated by a few actors.
(2) The product or service of the supplier is crucial for the buyer’s
business.
(3) The overall industry is not an important customer for the supplier.
(4) The suppliers are not threatened by any other substitute products.
(5) The products or services the supplier is offering are differentiated or
have a high switching cost for the buyer.
These conditions have a strong influence on the bargaining power and are not only
subject for change, but in most cases out of control for the customer or the buyer.
Although, the buyer may try to improve their bargaining power towards the
supplier through improvement or change of strategy i.e. backward integration
(Porter 1980, 28).
3.7.5 Rivalry among existing competitors
Any rivalry among the existing competitors can take form through price war,
advertising wars, increased customer services and similar. For instance, a price
war will shake and unstable the industry, and deprive the profits. On the other
hand, an advertising war can for instance enhance the level of product
differentiation and increase demand for the better of the industry (Porter 1980,
17). Porter (1980, 17) suggests that rivalry occurs as one or several of the
competitors feel pressure or experience an opportunity to enhance their position.
High rivalry will obviously limit the profitability of the industry and the degree of
limitation depends on two factors. First, the intensity of the competition and
secondly, the basis on which they compete (Porter 1979a). Porter (1980, 17;
1979a) suggest that the rivalry among the competitors is greatest if:
(1) Many competitors or if they are of equal size.
(2) Exit barriers are high making it hard for firms with specialized assets to
exit.
(3) Fixed costs are high and marginal costs are low creating an intense
pressure among competitors as they try to undercut each other on price.

27
(4) The product is perishable, forcing competitors to cut prices as the product
still has some value.
In addition, Porter (1980) suggest that these factors can and will change, and is
commonly influenced by the life-stage of the industry. When the industry
matures, it will experience decline in growth rates, resulting in intense rivalry and
declining profits. Some firms will be forced to exit. Other changes in the rivalry
are, not surprisingly, acquisitions and technological innovation, which will further
raise the volatility in the industry.
3.7.6 Other factors:
Porter originally brought the influence of government and government policy in
under threat of entry. However, we have put much more emphasize on this factor
as it is crucial in the airline industry, the importance in the context of airlines will
be explained in detail in later sections.
In many industries, especially in an industry like aviation were government
have had a huge influence over both directly and indirectly, government may act
as a buyer and supplier. Porter (1979a) suggests for instance that the government’s
role in many situations is determined by the political factors rather than
economical. In addition, government regulations and concessions would also set
limits of their behaviour as buyers and suppliers (Porter 1980, 29). Furthermore,
governments also influence the position of an industry with their regulations,
subsidies and other means. For example, the European airline industry was
dominated by the so-called full service carriers, also known as flag-carriers, with
high government ownership making it immensely hard for private competitors and
in some situations illegal to compete. Governments also influence the rivalry
through their impact on industry growth, cost structure regulations and so on. In
general, governments operate at different and multiple levels with many policies,
where each of them will affect the structure in the industry in different ways
(Porter 1979a).
3.8 Connections between strategic groups and Porter´s five forces Porter´s five forces is an excellent tool for snapshots of the respective industry,
but is somewhat neglected in the application of analysing strategic groups. In this
28
section we will connect the strategic groups and Porter´s five forces, in order to
create a comprehensive tool for further analysis in the thesis.
Relation between strategic groups and threat of new entry
The key determinant is the barriers that hinders new competitors to enter the
industry and into strategic groups. With the aforementioned discussion around
entry barriers and mobility barriers in previous sections, mobility barriers apply to
the strategic groups. Following the same reasoning as Caves and Porter (1977)
and Porter (1979b), it is argued that firms decides which strategic group, due to
their strategy, to compete in rather than deciding which industry to compete in. An
example is domestic vs international flights, as the barriers to enter the strategic
group who operates international flights is higher than the competing
domestically, the potential competitor will choose directly which strategic group
(i.e. strategy) that they want to compete in.
Relation between strategic groups and bargaining power
Porter (1979b) argues that the same mechanisms relates to both bargaining power
of customers and bargaining power of suppliers. There are mainly two reasons.
Firstly, the strategies of the companies in the respective strategic groups may yield
different degrees of vulnerability to common customers and suppliers. Secondly,
companies may interact with different customers and suppliers with
correspondingly different levels of bargaining power. An example is Ryanair and
Scandinavian Airlines (SAS). Both are operating in the same industry, but
arguably in different strategic groups. Ryanair may have better bargaining power
in terms of their supplier of aircrafts, Boing, as they have a bigger fleet and will
use this as a leverage to achieve a discount. SAS, on the other hand, have better
bargaining power vis-à-vis their business customers due to their route network
and Eurobonus-programme. Overall, the extent of the relative bargaining power,
customer or supplier, depends on the industry.
Relation between strategic groups and the threat of substitutes
This relation refers to substitute products that are essentially the same, but focuses
on different parts of the product line, serving different needs, different level of
quality, and so on (Porter 1979b). It is argued that these differences make

29
companies less vulnerable to substitutes even though they are in the same strategic
group. An example is the loyalty-programmes and in the airline industry, where
airlines try to differentiate themselves and lock-in their customers in an otherwise
fairly uniform industry.
Relation between strategic groups and rivalry among existing competitors
The existence of several strategic groups within an industry as well as the number
of competitors within the strategic group, have implications for the overall rivalry.
Porter (1979b) points out that the presence of several strategic groups will
increase the competition as it implies greater asymmetry and diversity. It is argued
that different strategies and external factors will determine their preferences about
quality, price, time horizon, risk and so on. This will therefore complicate the
process of understanding each other’s actions and will thus increase the likelihood
of rivalry. Furthermore, there are four factors presented by Porter (1979b) that
heavily affect the interaction of the competition for customers (1) strategic
distance among groups; (2) number of strategic groups and their size; (3) product
differentiation and; (4) the extent to which their customers overlap – market
interdependence among groups. These four factors interrelate and affect the
rivalry among companies in the strategic groups.
The strategic distance refers to the divergence of key variables such as
price, quality, cost position and similar. The bigger the distance, the more
dynamic and hostile competition will occur within the strategic group, given other
things equal.
In terms of the number of strategic groups and their size, Porter (1979b,
139) argue that numerous and equal size of the strategic group will lead to
increased rivalry. This is due to the diversity and the higher probability that one
group will try to attack another group through price-cutting or similar.
The third key factor is the degree of product differentiation by the groups’
strategies. If two groups seemingly offer the same product with little
differentiation perceived by the customer, the rivalry would be much higher than
if the groups have distinct differentiations in their offer.
The last key factor is the degree to which groups compete for the same
customers. When there is high interdependence between groups, it is believed that

30
the competition within the industry is fierce. On the contrary, groups with low
interdependence will clearly affect each other’s businesses at a much lesser extent.
Overall, the Porter´s five forces can at a certain degree be applied to strategic
groups. As have been discussed, some forces are more relevant than others and
may affect the specific groups differently. Nonetheless, it is less useful when it is
applied for the purpose of analysing the dynamics in the industry over time.
Hence, it does not capture the implications of entry into a new industry at different
points in time.

31
4 Methodology The method of research should act a s a guideline of our research process and
strategy (Eisenhardt 1989; Yin 2003). In order to conduct our research in an
appropriate manner, we have followed the guidelines of Yin (2003).
Furthermore, the thesis will present how and why the strategic groups exists
in the European airline industry, including explanation building with pattern-
matching (Tellis 1997). This is due to the analysis of the case is developed by
building an explanation of the case and this thesis is therefore going to be
explanatory case study.
In the following sections, we will discuss the research design of the paper,
how we will collect data and how we will apply it, quality assurance of the data,
and lastly the limitations the paper faces.
4.1 Research Design In our thesis we will apply the case study methodology due to the nature of the
European airline industry and the strategic groups. According to Yin (2011, 4-5)
there are 3 settings in which the application of case studies are relevant and
applicable. First and foremost, this thesis is explanatory paper as the research
question are grounded with “how” and “why” issues. Second, as the thesis is
focused on analysing the drivers of changes in the European airline industry, it
favours data collection from natural settings like annual report and industry report
(Yin 2011, 5). Lastly, Yin (2011) recommends case studies when conducting
evaluations. As the thesis will at the end evaluate the industry, this would
therefore further support the application of the case study approach.
Furthermore, Yin (2003) also presents four additional key determinants
whether to apply a case study or not: (1) the focus is embedded by the nature of
“why” questions; (2) the behaviour and results are fixed in the study; (3) the
contextual conditions are important for the phenomenon in our study; (4) the
boundaries is not clear between the context and phenomenon. As has been
discussed, these 4 additional determinants are all supporting the use of case study.
The unit of analysis will naturally be the strategic groups in the European
airline industry, LCCs and FSCs respectively. While the context around these
units will evidently be the European airline industry and therefore analysis of

32
strategic groups in the European airline industry. This is arguably a single case
study with embedded units as explained by Tellis (1997) and (Yin 1994), as it
covers both the different strategic groups. This is further reinforced by the fact
that these strategic groups operate in the same environment and industry, which
imply if structural factors will affect one strategic group it will also affect other
strategic groups.
Secondary data and collection
A trademark in the case analysis study is the application of multiple sources
which enhances the credibility of the data (Baxter and Jack 2008). The use of
different sources of data will facilitate a holistic understanding of our topic. Also,
each piece of data will be converged in the analysis process and will act as one
piece of a larger puzzle, in which each and every puzzle will contribute to a
further understanding of the analysis.
The sources of information will therefore be examined and collected from
secondary data, mainly from 3 sources: (1) annual reports; (2) industry reports
and; (3) academic literature. The benefits of using secondary data in a case study
like this thesis is, as mention, the opportunity to use both qualitative and
quantitative data. In addition, the benefits can also be addressed to the savings in
cost of time by using existing data sources. Secondary data is also advantageous
as it is usually open for public scrutiny and easy to trace the source (Saunders,
Lewis and Thornhill 2012). In the application of the airline industry and its
secondary data, as Yin (1994) points out, these sources of data are embedded in
their stability, unobtrusiveness, exactness, broad coverage, preciseness and
quantitative.
The dangers with the secondary data as explained by Baxter and Jack
(2008) is, among others, the overwhelming amount of data in the airline industry
that needs attention and analysis. Yin (1994) suggest weaknesses of this type of
data sources are the biased selectivity, reporting bias and retrievability. Also,
finding the right and relevant data is also a threat as different organizations and
institutions use diverse methods to collect and analyse their data. This further
refers to the fact that secondary data is most likely not intended for the purpose of
the thesis. Furthermore, if locating the relevant datasets, it may not give access or
very costly to external researchers as they are classified reports or company data

33
(Yin 1994). Additionally, the secondary data is collected through documentary
analysis in which all the data is collected manually. This is naturally due to the
restrictions of getting first-hand access to relevant actors and lack of established
contacts in the respective European airlines. We believe, and even though our
thesis is grounded on secondary data, this data collection will not lead to any
severe limitations or biases as the industry data available is comprehensive.
Data analysis
There is a huge amount of data available for the European airline industry,
however in the context of strategic groups there are rather less. As we described
earlier similar, but quantitative, studies have been done in the American airline
industry. We have yet to find any ground-breaking studies in this topic and in the
area of strategy and European airline industry. The analysis is therefore a
fundamental part of this thesis.
In order to determine, through secondary data sources, whether an airline
belongs to the respective strategic group, we consolidated and cross checked with
several of the airline associations like Association of European Airlines, The
European Low Fares Airline Association and similar. Once establishing a
common ground for the strategic groups we will apply the 5 forces model
analysing the strategic groups and the European airline industry, through the
variables as described in the research question.
4.2 Quality assurance of research design In order to ensure that the quality of the thesis is excellent we have incorporated
and followed the guidelines by Yin (2003).
The first quality measurement is constructing validity by using multiple data
sourcing, ensuring convergent lines of inquiry. This is also highly relevant in the
data collection. The second measurement can be addressed to the internal validity
as we look at the factors driving the changes and consolidations in the European
airline industry, locating the relevant inferences are highly time-consuming and
difficult. We would therefore compare and discuss in the light of the two strategic
groups and conduct explanation-building to reveal the causal links. In terms of the
external validity both Tellis (1997) and Yin (2003) discusses the difficulty of it in
a single case study, as the generalizability and the connection to theoretical

34
relationship would be somewhat weak. It is therefore suggested that
transferability, hence inviting readers to make connections between own
experience and study (Colorado State University 2016). Nonetheless, as the
European airline industry is highly delicate and the intention is one of
particularisation, it becomes less relevant (Willis 2014). This further becomes
emphasized in the last quality check, namely the reliability. This refers to doing
the same case study with identical objectives and procedures would lead to the
same findings and conclusions.
Overall, these are quality checks that we must keep in mind throughout the
thesis, which will determine the quality of the research design, hence the quality
of the paper.
4.3 Limitations This paper, as most academic studies, is prone to certain limitations. The authors
have made certain methodological trade-offs in regards to research design, data
collection and analysis, hence the conclusions drawn. By being aware of these
limitations and trade-offs and discussing them openly, we believe we can present
a valuable report nonetheless.
Firstly, as the data used in this study is collected only from secondary
sources, there are certain limitations associated with the data collection and
content. The first challenge is regarding the reliability of the data collected from
airlines. Different accounting practices between airlines can pose a challenge
when comparing financial figures and KPIs. Although this is not a quantitative
study, we have based segments of our analysis on accounting figures from a
number of airlines. Figures have been collected mainly from annual reports, and
accounting practises and regulations might vary between countries. It can be
differences in how operational costs are calculated, how firms segment their
markets etc., and whether to publish figures per tax year, starting in April, or per
fiscal year. Also, different currencies had to be transferred, which poses a
potential error. By consistently using average annual currency rates we believe
this will not affect the analysis. Our analysis stretches over a time of M&As, and
several of the airlines studied are airline groups with separate airline subsidiaries.
This poses an issue, as segmented figures for each subsidiary were not always

35
available, and subsidiaries operating in different strategic groups should in some
cases be analysed separately.
Secondly, collecting industry data from multiple secondary sources poses
the threat of degrading the reliability, as indicators can be calculated in different
ways. The industry figures used in the analysis have been collected mainly from
annual reports and industry analysis and reports from various industry
organisations. These reports include industry indicators that are based on several
figures not always published in the reports. This represents a possible error as
these indicators can be defined in different ways. Most data collected however,
had clearly defined indicators, and were collected from respected industry
organizations.
In addition, the secondary data may also cause measurement bias in terms
of both intentional or deliberate distortion of data, as well as changes in the way
data were collected (Saunders, Lewis and Thornhill 2012, 322,329). By being
aware of these issues and taking measures to keep consistency, we believe this
does not affect the conclusion.
Lastly, changes in the external environment have affected the dynamics in
the industry substantially during the relatively short time of research, which will
affect the external validity of the results. When we started collecting data, the
2015 results were not available. During the study, these results have become
increasingly available, showing a significant change in overall profitability and
growth. These changes are to a large degree effects of external factors in the
economy, most notable is the drop in oil price, reducing the jet fuel price and
hence the cost structure of airlines.

36
5 The Airline Industry This chapter is meant to give an overview of the airline industry and its
competitive environment. Starting with our focus and scope, before explaining the
history, recent developments and trends, and drivers for change and growth.
The global airline industry can be divided into civil and military aviation.
Civil aviation includes all non-military aviation, both private and commercial. In
this paper we focus on the commercial airline industry, more specifically the
commercial passenger airline industry in Europe. This industry has clear
competitive dynamics, and has to a large degree been used by researchers to
demonstrate analytical frameworks (Porter 2008). In this section we will give an
insight into the airline industry and its specific features.
In the first subchapter (5.1), we will describe the evolution of the industry,
focusing on the regulatory changes and their effects on operation and competition.
Here, the changes from traditional point-to-point routes to the hub-and-spoke
system will also be explained. As consolidation plays an important role, important
mergers and acquisitions (M&As) in the European airline industry will be
discussed and compared to other regions. We will also describe the market
concentration in the European and North American markets, as these are the two
markets best suited for comparison, given the similar regulatory development and
competitive environment. The second subchapter (5.2), includes a description of
the actors in the industry, being existing airlines, potential entrants, substitutes to
airlines, customers and suppliers. Airlines will be presented and divided in
strategic groups. The main attention will be given to the European airlines, with
comparisons to other regions. This will lay the groundwork for the analysis, where
the focus will be on the two main groups, namely full service carriers (FSCs) and
low-cost carriers (LCCs). In the third subchapter (5.3), we will discuss the
performance in the industry, starting with explaining relevant measurements used
for the airline industry. These are measurements of capacity, production,
profitability and efficiency.

37
5.1 Evolution of the industry Up until the early 1990s, European countries operated a state-owned national
airline, often referred to as a full service carrier (FSC). Although the European air
transport market did not experience the same deregulation as in the US, a slower
liberalization of the internal market resulted in changes during the 90s,
comparable to the deregulated US domestic market (Burghouwt, Leon and Wit
2015). After the deregulation of the US airline industry in 1978, hub-and-spoke
systems started emerging around a small number of central airports, or “hubs”
(Burghouwt and de Wit 2005). Europe had a different situation, in which
deregulation did not start until 1988, and governments were negotiating about
traffic rights across borders. The hubbing in Europe intensified during the 1990s,
and examples of this were KLM at Amsterdam, Lufthansa at Frankfurt and SAS at
Copenhagen. The number of hubs increased, and secondary hubs were
implemented by large airlines. Air France implemented hub-operations at both
Paris CDG and Lyon, Lufthansa developed a hub at Munich and British Airways
at both Heathrow and London Gatwick (Burghouwt, Leon and Wit 2015). Before Deregulation:
After Deregulation
Figure 2: Hub-and-spoke model. Source: Dept. of Global Studies & Geo 2006

38
A hub-and-spoke is a network where all traffic from smaller airports, or nodes,
moves along spokes connected to a central airport, or hub, in the centre. This
allows for fewer routes to connect all airports, which results in more frequent
flights to and from smaller airports while keeping load factor high (see Figure 2),
(Dept. of Global Studies & Geography 2006). Load factor is the percentage of
seats in a flight being used. The seat load factor is an important measurement for
airlines, given the high fixed cost of a flight compared to the marginal cost of an
extra passenger. The highest costs of a flight are fuel, labour, and aircraft, and an
extra passenger has little effect on those costs. The intense competition and low
airfares are making the gap between break-even load factor and actual load factor
smaller, two measurements frequently used when analysing airline operations.
The current trend is a move away from full service carriers (FSCs) and
towards low-cost carriers (LCCs) which have traditionally been the two main
business models in the airline industry, towards a hybrid model, both in terms of
cost structure, but also blurring the distinction between the two for customers
(KPMG 2013).
The European air transport market has near tripled doubled in the last 20
years, from 212 million passengers in 1996 to 608 million in 2015 (see Figure 3).
Seen in the figure is the stagnation of passenger growth in two periods. Firstly, we
0
100
200
300
400
500
600
700
1992 1994 1996 1998 2000 2002 2004 2006 2008 2010 2012 2014
Millions
Passengers
Figure 3: EU air transport passengers 1992-2014. Source: World Databank 2016

39
see a decrease in global air travel passengers after the 2001 terrorist attack.
Secondly, the growth stagnated after the 2008 financial crisis, although the
industry seems to have caught up with the lost demand by 2010.
Liberalization in the early 1990s has also sparked the number of intra-EU
and extra-EU international routes. Intra-EU routes has increased from 874 in 1992
to 3522 in 2015, an average growth rate of 6,2% p.a. Extra-EU routes grew from
988 to 2621 in the same period, representing an annual compounded growth rate
of 4,3% p.a. (European Commission 2015).
The growth of domestic routes of member EU states are not shown in the graph,
but has been comparatively flat, increasing from 818 to 939 in the same period,
and declining from 2010 to 2015. The increase of international routes were
accompanied by increased competition in the period, and the number of intra- and
extra-EU routes served by more than two airlines increased 540% and 300%
respectively (European Commission 2015).
As shown in Figure 5, 44% of total passenger transport is across borders
within the EU-28, ahead of extra-EU transport (38%) and domestic transport
(18%). Shorter routes, especially in central Europe, are competing against a
growing high-speed rail, which is a quicker alternative where travel time by train
is less than 2,5 hours. The most frequently countries travelled between by air are
0
500
1000
1500
2000
2500
3000
3500
4000
1992 1994 1996 1998 2000 2002 2004 2006 2008 2010 2012 2014
NumberofinternationalEUroutes
Int.Intra-EU Extra-EU
Figure 4: International Intra-EU and Extra EU routes 1992-2015. Source: eur-lex.europa.eu
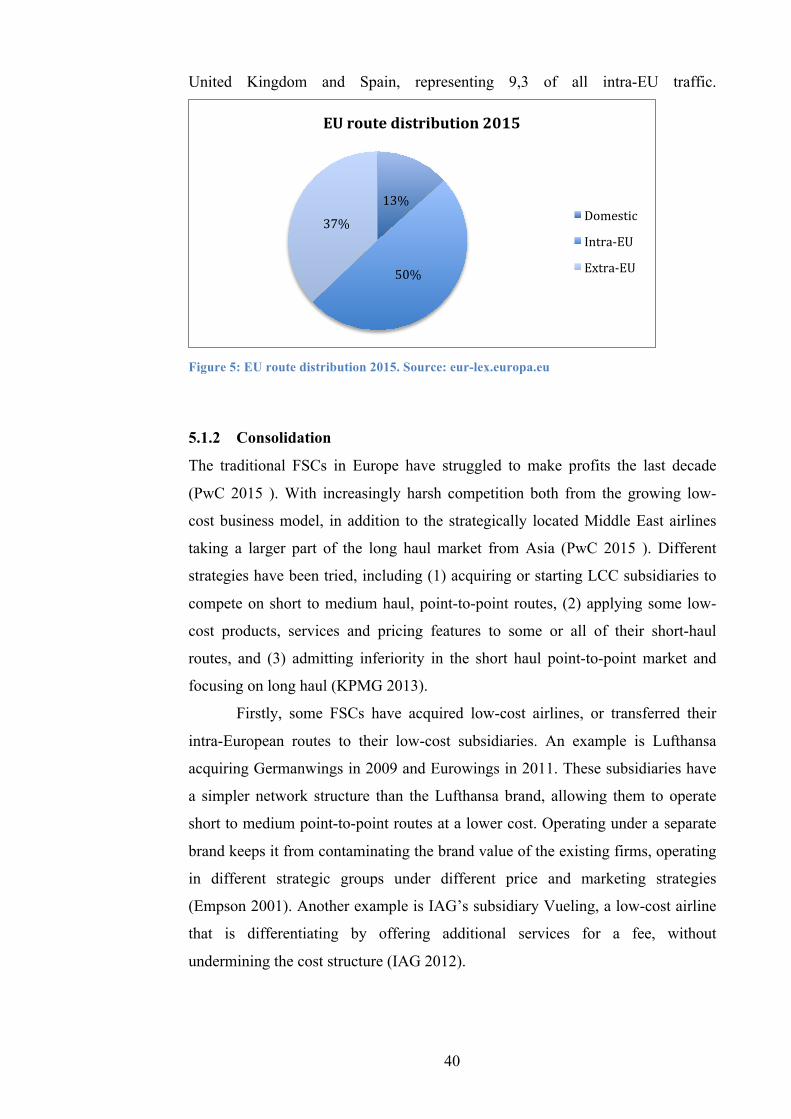
40
United Kingdom and Spain, representing 9,3 of all intra-EU traffic.
Figure 5: EU route distribution 2015. Source: eur-lex.europa.eu
5.1.2 Consolidation
The traditional FSCs in Europe have struggled to make profits the last decade
(PwC 2015 ). With increasingly harsh competition both from the growing low-
cost business model, in addition to the strategically located Middle East airlines
taking a larger part of the long haul market from Asia (PwC 2015 ). Different
strategies have been tried, including (1) acquiring or starting LCC subsidiaries to
compete on short to medium haul, point-to-point routes, (2) applying some low-
cost products, services and pricing features to some or all of their short-haul
routes, and (3) admitting inferiority in the short haul point-to-point market and
focusing on long haul (KPMG 2013).
Firstly, some FSCs have acquired low-cost airlines, or transferred their
intra-European routes to their low-cost subsidiaries. An example is Lufthansa
acquiring Germanwings in 2009 and Eurowings in 2011. These subsidiaries have
a simpler network structure than the Lufthansa brand, allowing them to operate
short to medium point-to-point routes at a lower cost. Operating under a separate
brand keeps it from contaminating the brand value of the existing firms, operating
in different strategic groups under different price and marketing strategies
(Empson 2001). Another example is IAG’s subsidiary Vueling, a low-cost airline
that is differentiating by offering additional services for a fee, without
undermining the cost structure (IAG 2012).
13%
50%
37%
EUroutedistribution2015
Domestic
Intra-EU
Extra-EU

41
Secondly, Tan (2015) finds that FSC incumbents lower their air-fare in
response to entry by a LCC in his study of the U.S. airline industry. Other
implementations to increase revenue can be offering complementary services like
on flight sales, credit cards, and charging extra for certain services.
Thirdly, a focus strategy (Porter 1980) has also been used, as FSCs
experience that they cannot match the cost level of the new entrants, and directs
their efforts towards the more profitable long haul market. But as the low-cost
competitors grow and search for new routes in an industry with extremely low
margins, profitable routes are popular, and LCCs are looking towards the long-
haul market as well. Norwegian Air Shuttle has opened new routes to Bangkok
and several destinations in the US, and plans to open more long haul routes in the
next years, through their long-haul subsidiary Norwegian Long Haul (Shuttle
2016).
As FSCs lowers their cost, and LCCs adds services, both the cost gap and
the differences in operations becomes smaller (KPMG 2013). However, there are
still differences, and we can still separate the two business models into two
strategic groups. If we examine the financial performance of the two groups over
the last years, the differences become clear. There are of course exceptions, but
the overall trend tends to favour the low-cost model. From 2004 to 2011 European
network carriers generated an average return on invested capital (ROIC) of 3,6%.
Over the same time European LCCs generated 7,6%. Compared to the weighted
average cost of capital (WACC) over the same period, of 7,5% and 8,3%
respectively, the investor value losses are high, especially for network carriers.
5.1.3 Market concentration
In a report from June 2014, the International Air Transport Association (2014)
found that the factor best explaining the European airline industry’s low margins
when measuring against other regions were the low market concentration, using
the Herfindahl-Hirschman Index (HHI). HHI is a commonly accepted measure of
market concentration and is measured by squaring the market share percentage of
each firm operating in the market, and then summing the numbers (Rhoades
1993). The agencies generally consider markets in which the HHI is between
1,500 and 2,500 points to be moderately concentrated (U.S. Department of Justice
2015). The European airline industry measure less than 500 on the HHI index in

42
June 2014, while the U.S. measures around 1300 (IATA 2014). When compared
to other regions, this gives an upward sliding curve, suggesting that more
consolidation could increase profitability (See Figure 6).
Figure 6: Airline EBIT margin vs. market concentration by region 2015 (Source: IATA 2015)
The development from 2010 to 2014 has been more consolidation in the US due
to large mergers, something we have not seen in Europe in the same period.
5.1.3 Mergers & acquisitions
Europe
The three largest European airline groups are a result of several mergers and
acquisitions in the last decades. Lufthansa Group is the result of Lufthansa
acquiring Swiss International Air Lines in 2005 (Lufthansa Group 2006) and
Germanwings and Austrian Airlines in 2009 (Lufthansa Group 2010). In 2013
Lufthansa transferred point-to-point short haul flights from both Lufthansa and
Eurowings to the Germanwings brand, and added around 50 aircrafts to
Germanwings’ fleet (Lufthansa Group 2014). This strategy was taken on to
increase competitiveness against low-cost competitors on short haul routes.
Starting in 2015, Lufthansa are integrating Germanwings to Eurowings, keeping
the Eurowings name.
AfricaEurope
AsiaPaciWic
MiddleEast
LatinAmerica
NorthAmerica
0
1
2
3
4
5
6
7
8
9
0 200 400 600 800 1000 1200 1400
EBITmargin2015
MarketConcentration(HHI)
AirlineEBITmarginvs.marketconsentrationbyregion2015

43
Air France-KLM is the result of the merger between Air France and KLM
Royal Dutch Airlines in 2004. This was announced via Air France’s international
public offering for KLM shares on the Paris Euronext, Amsterdam markets and
New York Stock Exchange. This operation resulted in a privatization of Air
France (Air France-KLM 2016). The two operate as separate airlines, benefitting
from interconnected networks and other scale advantages like integrated
marketing and sales teams.
International Airlines Group was formed by the merger between British
Airways and Iberia in 2011, and is also the parent company of Aer Lingus and
Vueling. The airlines still operate under separate brands, and aim to play its full
role in future industry consolidation (IAG 2016).
Due to the nature of the analysis we will analyse consolidation through
shifts in market concentration, airlines will mainly be defined by ownership.
Subsidiaries and parent companies will be considered as one entity, also airlines
operating under separate brands. These are the major M&As seen in the European
airline industry, and although researchers and experts argue for further
consolidation in Europe (IATA 2015c), not much has happened in the past five
years.
Other markets
In the US, there has been a higher degree of consolidation, and the market
concentration is higher, as will be discussed in the next section. The largest
airlines in the US have conducted a large number of mergers and acquisition over
the years, and the market concentration has tightened. In this section we will
discuss the largest and most recent mergers in the region. When Delta Air Lines
merged with Northwest Airlines in 2008-2010 it became the world’s largest
carrier at the time, under the Delta name (Delta Air Lines 2008). Two years later,
in 2012, United Airlines merged with Continental Airlines, keeping the United
name, and took over as the world’s largest carrier. Just a year later, in 2013, the
merger process between American Airlines and US Airways was initialized, and
the merged airline kept American Airlines name.

44
5.2 Actors
5.2.1 Airlines
To fully understand the on-going changes in the airline industry, we have to
understand the different business models of competing airlines, which is the main
driver of change. After the deregulation in the European airline industry during
the 1990s we have identified three main strategic models. First, building on the
hub-and-spoke system we see the network carriers, offering a network of routes
based out of a larger hub airport. Second, the smaller regional airlines supplying
these hubs from thinner regional airports. Third, we see the low-cost model that
has grown substantially in the last decade, with an aim to offer lower fares as a
result of a lean low-cost business model. However, these clear definitions have in
recent years become increasingly overlapping. Full service carriers offer low fares
on some routes, and LCCs expand their services to differentiate against a growing
number of low-cost competitors.
The industry can be segmented in different ways, depending on the
purpose. For the purpose of our study we divide into different strategic groups by
business model and will focus on the two main strategic groups, FSCs and LCCs.
Full service carriers (FSCs)
FSCs, or network carriers, are airlines operating with a hub-and-spoke system,
with a larger hub-airport as a base of operations. Defined as FSCs operating
domestic, regional and intercontinental passenger services, often from a hub
located in the home territory and providing a network of air services across the
globe (Airport Council International 2015). This model became more feasible as
the number of airport grew, and flying point-to-point between smaller airports
became ineffective. By flying in and out of a larger airport, airlines could enjoy
higher load factor and customers could enjoy more frequent flights from small
airports. This will serve as one of two strategic groups in this analysis.
FSCs in Europe
Of the over 200 airlines in Europe, the three largest FSCs are Lufthansa Group,
Air France-KLM, and International Airlines Group, with 106, 77,5, and 77 mill
transported passengers in 2014, respectively. These three airline groups are results

45
of the consolidation in the industry, with several mergers both within and across
strategic groups.
FSCs in other regions
The world’s biggest FSCs can be found in North America, with Delta Air Lines
and United Airlines being the two largest measured in ASK. Delta reported
397,128 million ASK in 2015 (Statista 2016) and United reported 268,736 million
ASK in 2015. The largest growth in the segment we see in The Middle East, with
airlines like Emirates, Turkish Airlines, Qatar Airways and Etihad Airways, had a
12% annual growth in ASK and RPK in 2015 (IATA 2016a). The Middle Eastern
airlines have, in addition to having the highest growth, scored extremely well in
Skytrax’ list of the World’s best airlines several years going, and the four largest
are all in the top six in the 2015 rating, with Qatar Airways rated as number one
for the third time (Skytrax 2016).
Regional airlines
Regional airlines operate mostly feeder services from regional points to hub
airports. They tend to operate smaller regional jet or turbo propelled aircrafts with
less than 100 seats. We see relatively few regional airlines in Europe. This is
mostly a North American phenomenon, where the seven largest regional airlines
are located (Airport Council International 2015).
Low-cost carriers (LCCs)
After the deregulation, starting with the “Airline Deregulation Act” in the U.S.
1978 and in Europe in the 1990s, a new low-cost model started emerging. Not
being restricted by regulations on entry, capacity and price allowed for the new
business model to gain foothold in certain segments of the market. Pioneered by
Southwest Airlines in the U.S, which is still the world’s largest LCC, carrying 144
million passengers in 2015 (Southwest Airlines 2016) the business model has
been adopted all over the world.
As the demand for air travel grew, more point-to-point routes became
feasible. The model exploited the demand for point-to-point routes where the
FSCs suffered from higher costs due to the traditional network model. By
stripping the product of unnecessary supplements and focusing on low-cost travel

46
without connected flights, the new model was superior in terms of costs, being
able to offer lower fares on the carefully selected routes they served, creating a
new group of customers and stealing the more price sensitive customers from the
FSCs.
Deregulation was a necessary condition for this model to be viable, but
there were also other conditions that allowed the new entrants to gain such a quick
growth of market share. Francis et al. (2006) points to four other factors that
enabled the growth of the low-cost business model: (1) the entrepreneurial flair of
key individuals running the companies; (2) population growth and economic
wealth causes density in certain routes; (3) cheap and underutilized capacity at
secondary airports, and; (4) sales ease and price transparency caused by the
growth in the use of internet.
The strategy behind the low-cost model is to be able to offer lower prices
through keeping costs lower than the traditional airlines and competitors.
Common tactics practiced by LCCs are: only point-to-point services (no
connecting flights), high aircraft utilization, only internet booking, using
secondary airports, minimum cabin crew, lower wages, maximizing number of
seats per aircraft, no cargo carried, short turnaround times, a simple fare structure
and pricing strategy, charging for seat allocation, food and beverages (Williams
2001; Francis et al. 2006). Additionally, streamlining the activities in the value
chain is becoming increasingly important as LCCs are not only competing against
traditional network carriers, but an increasing number of competitors operating
under a low-cost business model, in an industry characterized by low margins.
The low-cost strategy also varies between companies, and airlines are constantly
searching for new ways to cut costs. One example is Ireland based Ryanair, who
suggested in 2010 to offer standing seats to passengers willing to stand. The
suggestion was scrapped due to safety regulations, but later, Chinese carrier
Spring Airlines and airline manufacturer Airbus has also researched the idea (Cha
2014). Low-cost carriers will serve as the second of two strategic groups.
Europe
The low-cost model was adopted in Europe where it has the highest penetration
rate of any region, reaching 40% in 2015 (IATA 2015c), as seen in Figure 7. The
largest LCC in Europe is Ryanair, with 101,4 million passengers transported in

47
2015, followed by easyJet and Norwegian, transporting 68,6 and 25,8 million
passengers respectively (easyJet 2015). Both Ryanair and easyJet have created
shareholder value in recent years, which is an unusual achievement in the
European airline industry. Ryanair presented net profits of 866.7m€ in 2015, a
66% increase from 2014. Norwegian has grown substantially in the last five years,
doubling number of passengers transported from 2010 to 2015, giving it the
highest growth rate of the top ten LCCs in the world (Norwegian Air Shuttle
2015).
The fierce competition and low margins in the industry have led many airlines to
default and bankruptcy. Of the 43 LCCs that commenced scheduled flight
operation within Europe between 1992 and 2012, only 10 remained operational in
July 2013 (Budd et al. 2014). This constitutes a 77% failure rate.
Other Regions
The penetration rate of LCCs in the US is low, representing 7,1% of total seats in
first quarter 2015, compared to 40,1% in Europe (IATA 2015c). The growth rate
is also lower, as well as the number of airlines falling under the category. Despite
this, the pioneer of low-cost air travel Texas-based Southwest Airlines, is still the
world’s largest LCC and the world’s third largest carrier by number of passengers
transporting 129,087 passengers in 2014. (IATA 2015b). There are other US
carriers following the same strategy, like SkyWest Airlines and JetBlue Airways.
0%5%10%15%20%25%30%35%40%45%
2003 2004 2005 2006 2007 2008 2009 2010 2011 2012 2013 2014
LCCmarketshareoftotalseats2003-2014
NorthAmerica Europe
Figure 7: LCC market share of total seats 2003-2014. Source: (IATA 2015c)

48
5.2.2 Potential entrants
New entrants to a market can come from existing airlines expanding to a new
market, or new companies being established. Regulatory changes and
liberalization have made it easier for airlines to expand operations to new markets.
One example of this is the Open Skies agreement between EU and US in 2008,
opening the market between the two regions allowing airlines to operate more
freely in other countries.
In the past 40 years, 1300 new airlines have been established globally
(IATA 2011), out of whom a large proportion has later seized operation from
bankruptcies and mergers.
5.2.3 Substitutes
Substitutes to air travel can be viewed from two different perspectives, depending
on the purpose. On the one hand, there are other modes of transportation, and on
the other hand there are substitutes to travel:
Other modes of transportation
If the sole purpose is to get from A to B, substitutes for air travel will be rail, car
and other public transportation, depending on distance and infrastructure. 9,2
billion passengers were transported by rail in the EU in 2014, of which less than
2% were international travel (Eurostat 2015).
The most significant substitute in Europe is high-speed railway, especially
for short haul flights. High-speed rail is generally defined as specifically built
high speed lines equipped for speeds generally equal to or greater than 250 km/h,
and specially upgraded high speed lines equipped for speeds of the order of 200
km/h (UIC 2016). The biggest countries in Europe for high-speed railway are
France, Spain, Germany and Italy.
Substitutes to travel
However, if the purpose is a business meeting with someone from another
continent, other forms of transportation may not be an option. The largest
substitute to air travel in this case is no other means of transportation, but rather
substitutes to travel. Most important are phone and videoconferencing (VC) (IBM
Global Business Services 2010).

49
5.2.4 Customers
Leisure and business travellers
The customers in the European airline industry, or in general, can roughly be
divided in either leisure travellers or business travellers. As the name suggest,
leisure travellers, are travelling with the purpose of leisure such as weekend trips,
vacation and visiting friends and family, and similar. These customers are
characterized by their highly price sensitive behaviour in addition to their
flexibility in regards of date and length of travel (Dresner 2006). Furthermore,
Brons et al. (2002) characterise leisure travellers as consumers who aim to
maximise the utility derived from air transportation. Other determinants
influencing the characterization are travel cost, price of other goods, income and
other socioeconomic factors.
Business travellers, on the other hand, are those who are regularly flying
as part of their work and these travellers wants high frequency and direct
connections to the main airports throughout Europe (Dresner 2006). Additionally,
these travellers get their tickets through their own corporate departments or travel
agencies. Larger corporations usually aim to purchase tickets for their employees
through the same airline or airline alliance, as it gives them benefits as miles or
loyalty points, access to lounge and access to same airline network or alliance.
Furthermore, a traditional perception of business travellers are their intensive use
of FSCs due to their superior ticket-flexibility, higher standard of service and
quality and consequently higher ticket prices (Martínez-Garcia, Ferrer-Rosell and
Coenders 2012).
Distribution and sale of tickets
The most common channels, who are also customers of the airline industry, are
direct sales through website, global distribution systems (GDS), aggregator
websites, and travel agencies (IATA 2011). Direct sales through websites have
over the last 10-15 years grown enormously as it to some degree reduces the cost
of issuing tickets and also bypasses the GDS. It has also broadened the services
for the customers with the likes of online check-in, seat selection, issue of ticket
and similar. Global distribution system (GDS) is a network that facilitates
transaction between the airlines with travel agencies, in which it pulls together the
fares on routes and its availability. These GDS´s also provides aggregator

50
websites with the same data, and in some cases were also owned by the same
GDS, who would sell tickets directly to the leisure and business travellers.
Aggregator websites, sometimes referred as travel website, is a website allowing
the potential customer to compare fares and tickets easily and across different
airlines. It therefore creates price transparency. Additionally, aggregator websites
also provide customers the opportunity to pick and choose their own packages
including flights and accommodations, thereby unbundling packages previously
offered by traditional travel and holiday agencies. Travel agencies have been the
traditional channel for airlines. However, due to the development of direct sales
through websites and aggregator websites, these channels have become redundant.
Though, corporate customers are still using travel agencies.
5.2.5 Suppliers
The suppliers in the commercial airline industry include all actors delivering
products or services to airlines. Traditionally, three groups of suppliers represent
the highest costs for airlines, namely fuel and oil, aircraft, and labour. Fuel and oil
represents approximately 29% of all costs, labour 20% and aircraft 16%
(McCartney 2012). The air transport supply chain also includes airports, airport
services, sales agents, computer reservation systems (CRS), catering, freight
forwarders and maintenance, repair and overhaul (MRO).
Fuel
Fuel and oil have in the last decade become the highest cost for airlines. Jet fuel is
a commodity, where price follows the price of crude oil, which since mid 2014
has been low due to overproduction. The volatility of the oil price has caused
airline to speculate through fuel hedging based on future price expectations. In
2000, jet fuel accounted for 15% of airline operating cost, compared to 32% in
2014 (IATA 2011, 2016a). The implications of this will be discussed in the
analysis. In 2015, airlines spent $180 billion on jet fuel, which represented 27,4%
of operating costs.

51
Aircraft
Globally, there are two major suppliers of medium to large body airframes,
namely Boeing and Airbus, with a near 50:50 market share of aircraft orders and
deliveries in 2013 (CAPA 2014). Boeing and Airbus delivered 762 and 635
commercial aircraft in 2015 respectively, with a backlog of 5789 and 6831
(Airbus 2016; The Boeing Company 2016a). This represents 7 to 8 years of
production for the two manufacturers. Approximately three quarters of the
commercial airframes produced by Boeing and Airbus are single aisle, narrow-
body frames for replacement or expansion, and the rest twin aisle, wide-body
frames meant for long haul. There are other aircraft suppliers on small to medium
aircraft, like Bombardier, ATR and Embraer, but at a small scale in comparison.
For a given airframe, customers can usually choose among engines from
different manufacturers. Among the biggest engine manufacturers operating
globally are CFM, GE, and Rolls Royce (AirInsight 2015). CFM has increased its
market share every year by taking most of the market for the new single aisle
frames from Boeing and Airbus, while other actors, like Pratt & Whitney has lost
market share focusing on older frames. GE and Rolls Royce are both focusing on
bigger engines.
Other actors supplying aircraft are commercial aircraft sales and leasing
(CASL) companies, marketing used commercial aircraft and equipment. New
entrants to the market often lack the financial resources to order new aircraft, and
can then lease used aircraft from lessors. The two biggest lessors are GECAS and
AerCap, leasing out 1608 and 1279 aircraft respectively, representing 35% of the
global CASL business by number of aircraft (Airfinance Journal 2015).
Labour
Labour represents the second highest cost for airlines. Total employment by
airlines reached 2,48 million in 2015, representing a cost of $140 billion (IATA
2016a) Ground crew, cabin crew and pilots are often employed in different
companies, with separate wage agreements and negotiations. Strong unions have
traditionally been associated with the industry. Ground handling services
including check-in and baggage handling have traditionally been handled in-
house, but are to a larger degree been outsourced in recent years to focus on core

52
activities (IATA 2011). Other labour costs include administration and marketing
and sales.
Airports
To use airports, airlines pay fees for gate usage and landing and take-off slots. As
the air transport market in Europe has liberalized during the last two decades,
airports have adapted, and 80% of European airports are now corporatized
businesses (ACI Europe 2016). The largest airports in Europe are London
Heathrow Airport, Paris Charles De Gaulle Airport and Frankfurt Airport,
working as global hubs where traffic is aggregated from smaller surrounding
airports to serve a global network.
5.3 Performance in the industry In the following section, we will discuss and present the general performance in
Europe, compare strategic groups and compare to other regions. The main
performance indicators are capacity, mostly used to display growth in capacity,
production, profitability, and efficiency.
5.3.1 Key performance indicators
Capacity
Available seat kilometres (ASK) is a basic measure of capacity. Capacity in
Europe has had a stable growth in the last decade, and grew by 3,9% from 2014 to
2015. Middle East had the highest growth of any region, with 12,1%, with
wealthy investors investing heavily in capacity (IATA 2016a).
The annual growth in air passenger demand has had a stable growth from
2005 to 2015, except from the influence of the financial crisis that reduced growth
from 8,8% in 2007 to 1,5% in 2008 to a decline of 1,4% in 2009 before it
stabilized again (Statista 2016). This shows how vulnerable the industry is to
global crisis, increasing the risk associated with investing in the industry.

53
Looking at the intra-Europe market, the LCCs are also the ones planning
the largest capacity expansion. Error! Reference source not found. shows the
orders of narrow-body aircraft at six selected airlines, and the percentage of orders
compared to current fleet (European Commission 2015). The chart shows that the
three LCCs have the highest orders compared to current fleet, with Norwegian Air
Shuttle leading with orders of more than two and a half times its current fleet.
Narrow-body is the aircraft type used for domestic, intra-EU and other medium-
haul routes. The FSCs also has large orders of wide-body aircraft for long-haul
(extra-EU) routes (see Exhibit 5: Widebody fleets and orders).
Production
Revenue passenger kilometres (RPK) is the basic measure of production, and
measures seat kilometres that have passengers, and creates revenue. The
production of freight is measured in revenue ton kilometre (RTK). Another
measure frequently used is the load factor, which measures production compared
to capacity, or what percentage of a flight’s seats that have paying customers in
them. The marginal cost of an additional passenger on a flight is relatively low
compared to the fixed costs, so airlines takes great measures to ensure the load
factor is as high as possible, using different techniques of price differentiation and
selecting routes carefully. The average passenger load factor has increased slowly
44%
11%
80%
28%69%
259%
0
100
200
300
400
500
600
700
LHGroup AF-KLM Ryanair IAG Easyjet NAS
Narrowbodyaleetandordersby2015
Orders
CurrentWleet
Figure 8: Narrowbody fleet and orders by 2015. Source: European Commission 2015

54
year-by-year, reaching 80% mid-year 2015, while the weight load factor for
freight was approximately 67%.
Profitability
Profitability can be measured in different ways, depending on the purpose of
analysis. From an investor perspective, a basic measure often used is the return on
invested capital (ROIC), which in this case shows the after-tax operating leases,
expressed as a percentage of invested capital (IATA 2013b). This measure can be
ideal for instance when analysing airlines’ ability to attract capital. Figure shows
the return on invested capital by region and business model in 2004-2011
compared to the weighted average cost of capital (WACC)1. With 7,6% compared
to 3,6%, the low-cost model has had an advantage over the full service model,
although both are below the cost of capital. North America, in comparison, has a
lower return. The North American market also has a lower penetration rate of
LCCs. In recent years, however, the profitability has improved to some degree
especially in North America, due to a higher degree of consolidation through the
large mergers mentioned in the previous section.
Another measure of profitability is the after tax profit margin, which
shows return on revenues. The table shows the net profit margins in different 1 Weighted average cost of capital (WACC) is the weighted sum of return lenders and equity holders expect when investing money in a company. Shown in the graph is the industry average for airlines in different regions.
2.9%3.6% 3.7%
7.7%
3.3%
7.6%6.9%
8.7%7.4%7.9% 7.7%
9.2%
0%1%2%3%4%5%6%7%8%9%10%
NorthAmerica Europe Asia-PaciWic LatinAmerica
ROICandWACCbyregionandstrategicgroup,2004-2011
ROICFSC
ROICLCC
WACC
Figure 9: ROIC and WACC by region and strategic group 2004-2011. Source: IATA 2013b Figure 9: ROIC and WACC by region and strategic group 2004-2011. Source: IATA 2013b

55
regions. Europe has improved, but still has among the lowest margins of 1,3%, far
less than the cost of capital, with only Africa below.
Table 1: Net Margins by Region 2013-2014, source: CAPA 2015
Efficiency
The airline industry and the tourism industry are interdependent in the sense that
tourism creates air travel demand, and at the same time, a single new airline route
can have a large effect on tourism in an area. Thus, an efficient airline industry
would be able to lower costs to attract more travellers to an area, boosting tourism
demand and image in an area (Morley 2003).
Compared to the US airlines, studies show that the European airlines have
a slight higher efficiency and productivity growth (Assaf and Josiassen 2012). The
most important reason for this gap is the high penetration rate of LCCs in the
European market, which is the highest of any region in the world, reaching 40%
of total seats in 2015, compared to just 7% in the US (IATA 2015c).
This is a result of the deregulations in the 1990s when many new players
entered, and the competition intensified. These efficient new competitors were
able to compete on price against the traditional network carriers on popular routes.
There are now over 200 airlines in Europe, and despite a growth in value creation
three times the growth in GDP, airlines have not created enough revenues to pay
investors for providing equity capital to the industry (IATA 2013b). The winners
are the consumers, due to the consequence of the intense competition and the
emergence of LCCs prices have dropped significantly. Also, as demand for air
travel increases more routes and higher frequency are established providing a
positive spiral effect for travellers.
Column 2013 2014F North America 3.3 4.3 Latin America 0.6 3.0 Middle East 1.9 2.6 Asia Pacific 1.1 1.6 Europe 0.2 1.3 Africa -0.8 0.8 Global 1.5 2.4

56
The industry in Europe has consolidated, although there are regulatory
constraints prohibiting further consolidation. Researchers suggest further
deregulation is needed to increase consolidation and bring profitability back to the
industry (IATA 2015c). Nevertheless, not everyone is destroying value; the ultra
LCC Ryanair is the most profitable airline in Europe at the time, with an operating
margin of 15,3% in 2015 (Ryanair 2016d). The US industry has consolidated to a
much larger degree. Over 53% of the European market is shared between the top
six airlines, whereas in the US 46% of the market is shared between two airlines
(World Finance 2015). There are several reasons why the consolidation in Europe
has not reached the same level as in the US, e.g. differences in language, culture,
political risks and government approach to the industry. Regulations are still
different between countries, making it difficult to operate freely across borders in
many cases. Another factor is the high level of state ownership in FSCs is
restricting consolidation across borders. A relevant example is SAS, where
Sweden, Denmark and Norway are the three biggest owners. SAS has been seen
as a possible target of acquisition for Lufthansa. However, these states have
different interests in regards of the hub- airports in the different countries, routes
and similar. Therefore, keeping control through their combined majority of shares
is important for the states, making consolidation through M&A difficult.
5.3.2 Margins
The European airline industry has generated solid growth over the recent years,
with a 6,8% growth in RPK from 2014 to 2015 (mid-year) and has the second
highest load factor of 66%, just behind Asia-Pacific which has the highest (IATA
2015a). However, the region also has the highest breakeven load factor of 63,3%
mid-year 2015 due to high regulatory costs and low yields caused by the highly
competitive open aviation area (IATA 2015a). The margin, although improving, is
2,8% which is significantly lower than the cost of capital (WACC) of around 7%.
In the following section of industry analysis, we aim to shed light on the reasons
for the low margins, globally and particularly in Europe.

57
6 Analysis
6.1 Industry analysis In this section we will examine and discuss the overall European airline industry.
This will be conducted through the framework of Porter´s five competitive forces
and it will provide the context of the industry.
6.1.1 Threat of new entrants
The threat of new entrants can come from two directions, either new airlines being
established, or existing airlines currently operating in a different market.
New established airlines
At first glance, the airline industry looks to have high barriers to entry (Porter
1979b) and is traditionally associated with high capital investments. However,
barriers to entry have never been very high compared to other capital-intensive
industries. Aircraft can be leased, and there is an abundance of pilots and
personnel available. Access to finance and aircraft is probably the most important
pre-requisite (CAPA 2016a).
In the past 40 years, around 1300 new airlines have been established
globally, an average of 30 each year (IATA 2011). Exact numbers are hard to
collate, however, the trend shows three events affecting entry and exit: (1) growth
of new entrants increased from the early 80s after deregulation in the US domestic
market (1978); (2) it further increased throughout the 90s coinciding with the
deregulation in Europe, and; (3) the number of new entrants globally peaked just
prior to the global financial crisis, and the number of exits peaked just after.
Despite low profitability in the industry and high mortality rate amongst entrants,
entry has continued to increase up until a peak of more than 120 entrants annually
from 2002 to 2004. The global financial crisis caused a drastic decrease in number
of entrants and an increase in number of failures, causing more exits than entries
each year from 2007 to 2012, something never experienced before in the industry
(CAPA 2016a).
Looking at the last developments in the last decade, FSCs have lost
significant ground to newer airlines. The main reason is the emerging low-cost
model, as building up an airline with a low-cost focus in every activity has an

58
advantage over traditional FSCs having built up a company when the industry was
more profitable, and focus was on high quality and service rather than on keeping
costs down. LCCs penetration rate in Europe has now passed 40%, compared to
20% 10 years ago, as shown in Figure 7 in chapter 0. (IATA 2015c). The barriers
for new airlines to enter the industry depend on a few main factors.
Financing
First, access to capital. If financing is cheap, the likelihood of new airlines
entering is higher. Traditionally, commercial bank loans, leasing and Export
Credit Agency (ECA) guaranteed financing have been the most common ways of
financing aircraft. ECAs of aircraft manufacturing countries offer guarantees and
assurance to cover losses on loans to support the industry, as they consider it
important to the national economy. This lowers the barriers to newer and smaller
airlines by making it easier to finance aircraft (PwC 2013). This also shifts the
trend from buying second hand aircraft from larger airlines, to being able to buy
new, more fuel-efficient aircraft. The airline industry has been characterized by
low profitability in the last decade. Despite of this, airlines have always managed
to find funding for their orders (PwC 2013), and aircraft backlogs have never been
higher (The Boeing Company 2016b; Airbus 2016).
Brand
Second, brand recognition for incumbent companies raises the barriers. This can
work in different ways, depending on a company’s marketing strategy. A brand
can be associated with low prices, like Ryanair or EasyJet, or superior quality, like
Turkish Airlines or Qatar. This brand recognition has been reduced in recent
years, as air travel has become more and more a commodity and airlines with a
differentiation strategy risk losing their competitive advantage due to this
commoditization. Also, even when customers recognise this differentiation,
actually paying a premium is not always preferred. In a survey by IBM Institute
for Business value analysis (2010) 57% of respondents perceived airlines to have
significant differences, while only 41% were willing to pay 10% more for their
favourite provider. Loyalty programs can also increase switching costs, however,
these are to an increasing extent tied to alliances instead of single airlines, making
switching cost between airlines within an alliance low. Also, the effect these

59
programs have on customer loyalty has also showed to be moderate (Dowling and
Uncles 1997). A recent study on the effects of loyalty programs in the airline
industry shows no direct effect on share of wallet for brand-loyal customers, but a
higher effect on price seeking customers prone to brand switching (Voorhees et al.
2015).
The emergence of new online global distribution systems (GDS) has also
lowered the advantage of brand recognition, lowering the barrier to entry.
Traditionally, tickets have been sold through travel agencies working for the
major airlines and the airlines’ own web pages. As GDS became more popular
such as Expedia, Bing and Google Flights, where customers can search for flights
across a number of airlines, the power of brand and control of distribution
channels decreased.
Global expansion of existing airlines
The biggest threat comes from existing airlines expanding to other markets. They
have the supply-side economies of scale associated with the industry, which
stabilizes around 50 aircraft (IATA 2011).
This has been the situation in Europe in recent years, where airlines from
the Middle East have been expanding from their relative small home markets and
taken an increasing part of the long-distance market from Asia. Middle Eastern
Airlines such as Emirates, Turkish Airlines, Qatar Airways and Etihad Airways
have rich investors, new fleets and score well in international quality rankings
(Skytrax 2016). Despite investing heavily in capacity, these airlines are among the
most profitable in the world, from a combination of government incentives, lower
wages and new fuel-efficient fleets. As seen in exhibit 5, wide-body fleet and
orders, the middle eastern airlines Emirates, Qatar, and Etihad has by far the
largest orders of wide-body aircraft, which will result in the newest and most fuel
efficient wide-body fleets for several years to come, and making them superior
competitors in the long-haul market. Emirates currently has the largest current
wide-body fleet of 238 aircraft (2015) and the largest order of 270 aircrafts.
Middle Eastern airlines experienced a 12% annual growth in 2015, a growth rate
that is expected to increase in 2016 (IATA 2016a). The region also has one of the
lowest breakeven load factors, making it overall profitable despite low yields.
Domestic market strength has been an advantage for European FSCs in the past.

60
However, deregulation and liberalization have allowed for expansion across
borders of LCCs such as Ryanair and easyJet, as well as allowing the strategically
positioned Middle Eastern airlines to build a global presence (A.T. Kearney
2013). Gulf carriers have increased weekly international seats from their
respective hubs to Europe by 11,7% year-over-year in December 2014
(Cederholm 2014).
In summary, it has never been easier to establish an airline in Europe due
to the ease of financing, and the legislation has become easier to deal with.
However, as the major airlines in Europe are getting bigger and expanding fast to
EMEA areas (Europe, Middle East and Africa) and US it becomes increasingly
hard to gain a market share. This comes in addition to the economies of scale that
increases up to a fleet of around 100 aircraft.
6.1.2 Threat of substitutes:
Substitutes analysed will be mainly limited to high-speed rail as another mode of
transportation, and video conferencing (VC) as a substitute to travel.
Other modes of transportation
High-speed train is the main form of rail that is under expansion in Europe and the
only alternative fast enough to have a significant impact on the air travel market in
Europe. In regions where high-speed train is available, as it is in large parts of
central Europe and UK, this substitution has had a significant impact on the
demand for short-haul air travel (IBM Global Business Services 2010), and the
presence of high speed rail contributes to lower domestic air passenger traffic
(Clewlow, Sussman and Balakrishnan 2014). Supported both by national
subsidies and the EU, Europe has added more than 6,000km of high-speed track
to the 1,000km in 1990, with thousands of kilometres under construction or
planned (The Economist 2015).
Firstly, in Central Europe, high-speed rail has a higher market share than
air travel on routes like Paris-Lyon and Madrid-Barcelona (The Economist 2015),
and on a global scale, high-speed trains holds a 80% modal split in relation to air
travel when travel time by train is less than 2,5 hours (UIC 2016). The growth in
medium- and long-haul air travel demand has been higher than the decrease in
short-haul demand, partially due to LCCs, making growth in total air travel

61
demand positive. Also, part of the high growth in high-speed rail is also replacing
traditional rail. Looking at the European rail industry as a whole, the average
annual growth rate in number of passengers is 2% (Eurostat 2015).
Secondly, as environmental concerns grow, transport and energy policy
will also affect the mode of inter-city travel. High speed rail is considered a lower
carbon alternative to air travel, especially for short-haul, domestic travel
(Clewlow, Sussman and Balakrishnan 2014). There are also studies supporting
this claim (Givoni 2007). The Committee on Climate Change (2009) suggested
high-speed rail and videoconferencing to be the two major substitutes to air travel
in their report on options to reach climate goals by 2050. The Committee found
that high-speed rail had the potential for significant modal shift by competing on
point-to-point travel time on journeys less than 800km.
Lastly, an issue increasing the threat of substitutes is the low customer
satisfaction scores of airlines. Airlines generally score low on customer
satisfaction rankings, despite major efforts to improve it. The increased security,
the difficulties of booking, risk of losing your luggage, and logistics to and from
the airport has stolen much of the time advantages of air travel, and has led
travellers to look for other alternatives (IBM Global Business Services 2010).
Substitutes to travel
Already in 2009, 60% of surveyed travellers worldwide had to cut travel cost in
favour of remote conferencing (Baker 2009). Businesses in many sectors have
stricter travel budgets than before, and are increasingly asking employees to fly in
economy class. When companies cut costs, travel budget is among the first things
they cut (Telegraph 2008). This makes airlines vulnerable to economic
fluctuations, giving high bargaining power to these substitutes.
However, research shows that although videoconferencing (VC) is
increasing, it will not replace business travel, but rather work as an addition.
Recent studies find that frequent travellers are the most positive of replacing
travel with VC, and that having dedicated VC rooms enhances it (Julsrud,
Hjorthol and Denstadli 2012; Denstadli et al. 2013).
High-speed trains are getting better and the network is becoming more
extensive, serving the same need to a large segment of customers. High-speed

62
trains are acting in many situations as a direct substitute to air transportation,
especially on inter-city routes like London to Paris.
6.1.3 Bargaining power of customers
The bargaining power of European airline customers is high. With a fragmented
European airline market with over 100 scheduled airlines it has given the
customer a better opportunity to find the best service to the lowest cost (Airport
Council International 2015; European Commission 2016). Moreover, channels of
purchase have become more concentrated as well as increased price transparency
of fares and routes, giving GDS and aggregator websites more market power
(IATA 2011; Steer Davies Gleave 2012). A majority of the end consumers have
become significantly price sensitive and have low switching costs, especially in
mature market where new consumers have driven the growth (IATA 2011).
Moreover, there is a general low willingness to pay for extra services unrelated to
flexibility (Martín, Román and Espino 2008; IATA 2011). Nonetheless, loyalty
programmes are still important, especially for business travellers.
Leisure customers
The bargaining power of leisure customers is almost exclusively determined by
the price and therefore the willingness to pay is low, hence lower bargaining
power. As an individual they show little bargaining power and are without
bargaining power to negotiate. Nonetheless, as a group they are able to put severe
price pressure on the European airlines. This is due to the nature of today´s fairly
homogeneous air transport service provided in Europe, and as the infamous CEO
of Ryanair, Michael O´Leary, once stated: “Air transport is just a glorified bus
operation” (O´Leary 2002). Within the European industry the service is becoming
highly similar across airlines, although some differences occur in each of the
strategic groups with LCCs and FSCs.
Furthermore, as the pricing structure is somewhat complex due to price
discrimination as consequence of flexibility, total bundle and time of purchase,
have given leisure customers the incentive to search for the best price (IATA
2011). This is also accelerated by the development of aggregator sites, such as
Expedia, Kayak, Skyscanner and similar, making it easy to find the lowest price,
indicating that prices are becoming transparent. In addition, leisure customers use

63
the flight as a mean and not as an end, to reach their destination. With that in mind
a fair amount of the budget of vacation is used to the travel itself, and customers
will therefore search for the lowest cost that maximizes their utility. This is further
emphasized by the non-transparent extra costs for added services such as baggage,
booking fees, priority boarding and similar between airline types, although not in
similar strategic group (i.e. Ryanair and EasyJet vs SAS and Lufthansa) (IATA
2011).
Lastly, the switching cost for leisure customers is low. Switching to
another airline is low, and loyalty programmes have little effect on those who
travel occasionally, unlike business travellers who frequently travel as part of their
work. Although, if the customer perceives the loyalty programme as value adding
giving extra services it will clearly have a direct impact on the chosen airline and
hence also the cost of the flight (Voorhees et al. 2015).
Business customers
The bargaining power of business travellers is lower than the leisure customers, as
their switching cost is higher. This is arguable due to operational coordination of
large airline networks or alliances, connecting airlines with their hub-and-spoke
systems. This is especially apparent with FSCs who have traditionally based their
business model on hub-and-spoke, in contrary to LCCs who have focused on a
point-to-point model. Also, loyalty programmes have a significant impact on
business travellers, as frequent flyer miles create an incentive to be a recurring
customer of the respective airline.
However, due to the development of airline routes in Europe and fuelled
by the instability of the European economy the last 7-8 years, business travellers
have become increasingly price sensitive. This has been supported by the
increasing priority of having control of direct costs related to travel expenses
(Amadeus 2015). Notwithstanding, the increased cost control reports shows that
business travel in Europe is on its rise again as a result of European corporations
plan to grow their businesses. In combination, the added value and the premium
comfort of flying in business class have gradually decreased and the barrier of
business travellers flying exclusively on business class has reduced in Europe.
This can mainly be attributed to the lower fares and better route network offered
by LCCs as well as the perception and willingness to travel on economy with

64
these carriers is more acceptable than previously. Additionally, recent initiatives
from easyJet and Ryanair show that they have changed their exclusive focus on
cost cutting and low prices, and are now also focusing at a larger degree on
customer service, adding to the argument that LCCs are aiming for the profitable
business market. The geographical distance within Europe also plays a role of
business travellers’ willingness to pay vs. comfort. Europe exclusively consist of
short to medium haul flights ranging from 45 minutes to a maximum of four hours
air time, and in combination of travellers’ perception, have also reduced the
necessity to have all types of extra added services like business fares (CWT
Solutions Group 2012; SAS 2016). In general, business travellers have today
more opportunities to shop-around as their demands have decreased. Hence,
higher bargaining power, but lower than the leisure customer.
As the airline network is becoming more extensive, customers have more
choices of whom to fly with. This is also fuelled by technology in regards of
travel sites making prices more transparent and customers are able to shop around
for the cheapest fares.

65
6.1.4 Bargaining power of suppliers:
Analysing the profitability of the suppliers compared to the airlines themselves,
we see that their business partners are, on average, all generating higher ROIC
(Figure 10: ROIC and WACC of actors in the airline industry value chain)(IATA
2013b). Travel agents, CRS and freight forwarders are enjoying the highest
returns, well above the cost of capital. However, these suppliers represent a
relatively small part of an airline’s total cost, so we will analyse suppliers
representing the highest costs for airlines, with emphasis on bargaining power.
Fuel
The highest variable cost for airlines has traditionally been fuel, although the low
oil price has resulted in a drastic change in the current cost structure. Jet fuel price
fluctuate highly depending on the crude oil price, as shown in the graph. The
correlation is highly linear as seen in Figure . The crude oil price has dropped
significantly, starting mid-year 2014, from around US $114 to US $48 per barrel
in 7 months.
7% 9% 11%6%
9%4%
20%
44%
15%
0%5%10%15%20%25%30%35%40%45%50%
ROIC WACC
Figure 10: ROIC and WACC of actors in the airline industry value chain. Source: IATA 2013b Figure 10: ROIC and WACC of actors in the airline industry value chain. Source: IATA 2013b

66
In January 2016 the price of crude oil was below $30, and market analysts are still
not agreeing on whether it has reached the bottom. This adds to the risk of the
industry, in writing time it is $40 (Dagens Næringsliv 2016). Successful fuel
hedging has traditionally had a moderating effect, but has had limited impact on
the overall cost structure. Long-term fuel hedging contracts from prior the price
drop is also a factor of high cost for some airlines (Flottau 2015). Recent reports
show that the fuel cost for airlines worldwide has been reduced from $226 billion
in 2014, to $180 billion in 2015, a drop from 32% to 27% of operating costs, and
is estimated to be reduced further this year (IATA 2016a). Airlines are continuing
to hedge fuel to reduce risk, although the volatile oil price situation makes the
profitability of fuel hedging uncertain. The oil crisis also has some negative
effects, especially in regions dependent on the oil industry, like the airports in the
Norwegian west coast, which are experiencing a decline in passenger numbers for
the first time since the financial crisis in 2008 (Nodeland 2015).
Aircraft
The high market concentration, and the fact that the two biggest aircraft suppliers
have full order books for the next 7 to 8 years makes bargaining power of aircraft
suppliers high. New aircraft are also 70% more fuel efficient than 40 years ago
and 20% more fuel efficient than 10 years ago, due to new technology and lighter
0
20
40
60
80
100
120
140
Brentcrudeoilandjetfuelprices
JetFuelSpotPriceFOB,US$perbarrel CrudeOilUS$perBarrel
Figure 11: Brent crude oil and jet fuel prices 2006-2016. Source: (IATA 2016b) Figure 11: Brent crude oil and jet fuel prices 2006-2016. Source: (IATA 2016b)

67
materials (IATA 2016c). As fuel has represented the highest cost for airlines in
the last decade, and given the low profit margins in the industry, airlines operating
a newer fleet hold a solid competitive advantage over those operating older fleets.
This has increased the cost of operating an older fleet, and is also a factor
contributing to both airframe and engine manufacturers high bargaining power.
The currently low fuel price has reduced this advantage to some degree, and even
extended the lifetime of some older fleets, as the importance of fuel efficiency has
been reduced (Flottau 2015). Also, if we look at Figure 10: ROIC and WACC of
actors in the airline industry value chain, we see that aircraft manufacturers had a
ROIC of 7% between 2004 and 2011, above airlines, but below their cost of
capital of between 9% and 11%. This suggests aircraft manufacturers have not
been able to fully utilise their advantage of their high bargaining power. This
could partly be accredited to the financial crisis, resulting in a reduction in new
orders and increase in cancellations. Adjusted for cancellations, Boeing received a
net total of 142 orders in 2009, compared to 1413 in 2007, a 90% reduction in two
years (The Boeing Company 2016b). Airbus experienced a similar downturn.
Another factor for this low ROIC is the fierce competition between Boeing and
Airbus. Switching costs are high for airlines, and they aim to use a streamlined
fleet consisting of similar aircraft especially within one size sector, to achieve
scale advantages on maintenance and flexibility between routes. Winning a large
order can secure future business for manufacturers, which makes them willing to
reduce prices close to break even.
Labour
Perhaps the most difficult supply factor is linked to the strong labour unions
associated with the industry. If only a small group of employees goes on strike, it
can paralyze the whole operation of the company, which gives employees
increased leverage. A recent example is Lufthansa´s flight crew strike September
2015, grounding over 113 000 passengers (Euronews 2015). The old FSCs can
have costly union agreements from the more profitable 1980s when there was less
competition and higher level of government ownership. There are often different
unions depending on type of staff like pilots, flight crew and ground crew. In
airport hubs, unions tend to be local monopolies, holding high bargaining power
due to the vulnerability of the hub-and-spoke system (IATA 2011).

68
There are large differences between wage levels in different regions,
which initially affect airlines’ competitiveness in a market that is becoming
increasingly globalized. One airline that aims to take advantage of these
differences is Norwegian Air International (NAI), a subsidiary of Norwegian Air
Shuttle (NAS) founded in 2014. The new airline, being referred to as a “flag of
convenience” airline, has acquired an Irish Air Operator’s Certificate (AOC) to
serve trans-Atlantic routes using aircrews hired through agencies in China to keep
costs down (Harvey and Turnbull 2014). With no plans of operating out of
Ireland, NAI’s Irish AOC is a way to both avoid Nordic labour rules and exploit
EU-US open skies agreement, since Norway is not part of the EU. NAI has met
resistance from labour unions and competitors from both sides of the Atlantic,
accusing the company of planning social dumping, in addition to the US
Department of Transportation (DOT), postponing a ruling in NAI’s foreign air
carrier permit application. At time of writing, DOT has issued a tentative decision
before the final hearing, being positive to NAI’s foreign air carrier permit
(Lorentzen 2016).
Airport
Airports grants access to a surrounding transportation network, and have often
little direct competition from surrounding airports or substitutes. Especially for
larger hub airports, this gives them high bargaining power over airlines. Where
the liberalization in the industry has resulted in fierce competition and lower
airfares among airlines, airports are not subject to the same threat of new entrants.
This can be seen through the high prices charged at large main airports in Europe,
where LCCs are forced to use smaller, secondary airports with cheaper gate usage
and take-off and landing fees. Airports in Europe have taken advantage of this
high market power, continuously increasing charges to airlines even throughout
the financial crisis (IATA 2013a).
Overall, airlines have become more locked-in with aircraft manufacturers,
as they want to have one type of aircraft on intra-Europe routes, in combination
with 7-8 years of backlog among suppliers increasing their bargaining power over
airlines. Moreover, airlines have reached its ceiling of scale economies and in
combination constraints by labour unions, airports, and other specialised
suppliers, making it harder for airlines to shop around for the lowest prices.

69
6.1.5 Intensity of rivalry
Intensity of rivalry in the European airline industry is characterized by a high
degree of competition. This can largely be attributed to the deregulations of the
European airline industry in the late 1980s and early 1990s, as the industry has
traditionally been characterized by tight regulation and little competition. As a
consequence of the deregulations coming into force there were 80% more flights
in 2014 compared to 1990 (European Aviaiton Safety Agency (EASA) 2016). The
high and intense competition in the European market is further emphasised
through the low EBIT margin in % of revenue, as it is greatly lower than its peer –
the North American market.
Furthermore, there are several key determinants defining the intensity of rivalry.
In this section we will examine the common characteristics, while in later sections
we will investigate the factors relevant for the various strategic groups.
Intense price competition among European carriers
After the deregulation, the European airline industry has started to compete head-
to-head in the competition of customers. This is a combination of both customers
becoming more price sensitive and too much overall capacity, i.e. too many
aircrafts in the market (Roland Berger 2015). The result is increased competition
among the companies competing exclusively on the intra-European market, hence
reduced financial performance.
4.9%3.1%
2.6%3.5%
5.5%
7.7% 8.2%
5.7%
3.0% 3.4%
6.8%
11.8%
14.3% 14.2%
2.4%0.8% 0.7%
2.0%2.9%
5.3%6.4%
0%2%4%6%8%10%12%14%16%
2010 2011 2012 2013 2014 2015F 2016F
EBITmargin,%revenue
Global NorthAmerica Europe
Figure 12: EBIT margin, location. Source: (IATA 2016a) Figure 12: EBIT margin, location. Source: (IATA 2016a)

70
Lack of differentiation is another implication of the features of rivalry. In
general, other industries have been able to differentiate their products and services
through branding and marketing, difference in quality, technical features and
similar. Previously, this differentiation existed to some degree, however, over
time European airlines competitive choices have led to disappearance of
differentiation. The core transportation services offered throughout the intra-
European airline market is not, to a large enough degree, differentiated across the
respective airlines, although some slight alterations are present depending on LCC
and FSC and their respective classes. Nonetheless, today´s flying within Europe
has become nothing more than a “glorified bus operation”, making the airlines to
a large degree compete solely on price (O´Leary 2002).
Overcapacity
Another determinant for overall intensity of price competition in the European
airline market is the excess capacity (Roland Berger 2015). This is based on
airlines sequential strategic moves. At its core, airlines first determine their total
capacity, hence their airline fleet, by ordering several years ahead as a
consequence of delivery lag. In this process, the airlines decide which features to
include on their aircrafts. In addition, airlines need to choose where to allocate
their capacity throughout different connections in Europe and this is decided six
months in advance (IATA 2011). Moreover, the pricing mechanism in the
industry is another factor that influence the competition in the industry. As the
prices for each connection is set through frequent adjustments and market
transparency, it is difficult to differentiate itself from its competitors. This is
further supported by the choices in regards of capacity as sustainable prices and
fares are determined by the earlier choices in sizes of the aircraft fleet (IATA
2011).
The overcapacity can also be related in the context of exiting and
downsizing. Exiting and downsizing are two key corrections as unhealthy firms
will do radical changes in order to survive. If not, they will exit the market.
However, in the European airline industry the capacity in regards of aircrafts stays
too long in the market. This is a consequence of the leverageable nature of the
aircraft, as it can easily be deployed in different markets. Subsequently, this
feature is also the reason why banks, aircraft suppliers and leasing companies
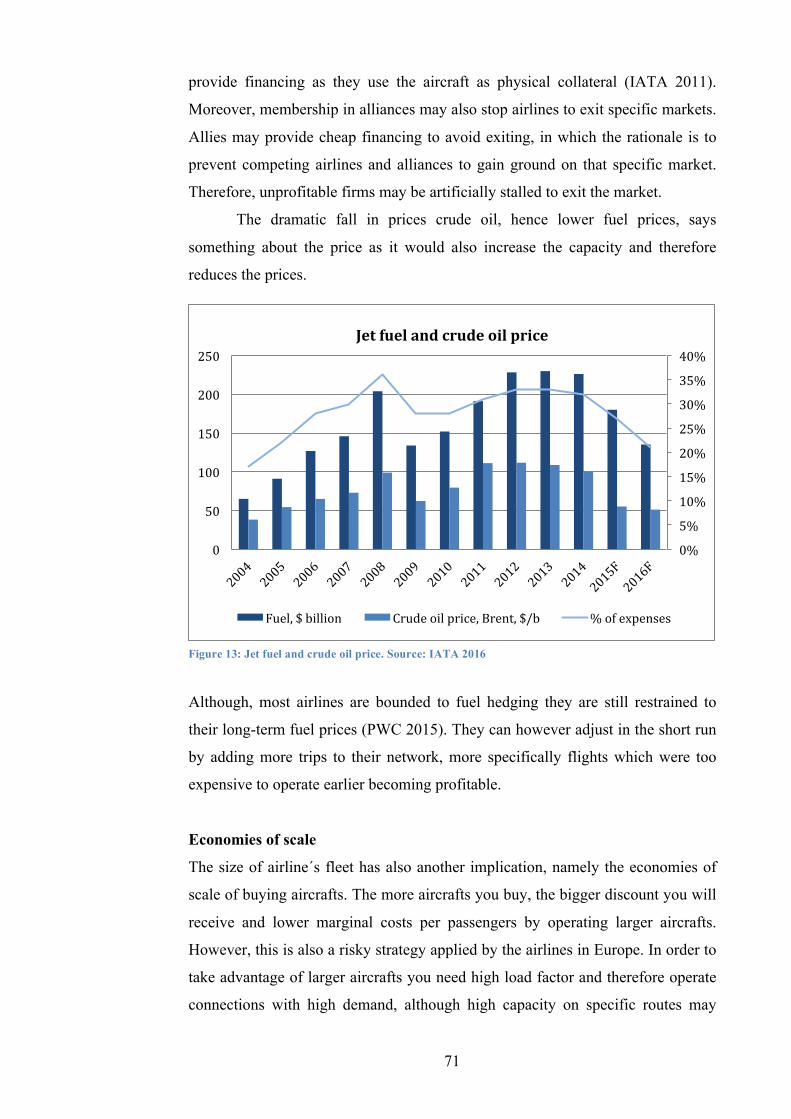
71
provide financing as they use the aircraft as physical collateral (IATA 2011).
Moreover, membership in alliances may also stop airlines to exit specific markets.
Allies may provide cheap financing to avoid exiting, in which the rationale is to
prevent competing airlines and alliances to gain ground on that specific market.
Therefore, unprofitable firms may be artificially stalled to exit the market.
The dramatic fall in prices crude oil, hence lower fuel prices, says
something about the price as it would also increase the capacity and therefore
reduces the prices.
Although, most airlines are bounded to fuel hedging they are still restrained to
their long-term fuel prices (PWC 2015). They can however adjust in the short run
by adding more trips to their network, more specifically flights which were too
expensive to operate earlier becoming profitable.
Economies of scale
The size of airline´s fleet has also another implication, namely the economies of
scale of buying aircrafts. The more aircrafts you buy, the bigger discount you will
receive and lower marginal costs per passengers by operating larger aircrafts.
However, this is also a risky strategy applied by the airlines in Europe. In order to
take advantage of larger aircrafts you need high load factor and therefore operate
connections with high demand, although high capacity on specific routes may
0%
5%
10%
15%
20%
25%
30%
35%
40%
0
50
100
150
200
250Jetfuelandcrudeoilprice
Fuel,$billion Crudeoilprice,Brent,$/b %ofexpenses
Figure 13: Jet fuel and crude oil price. Source: IATA 2016 Figure 13: Jet fuel and crude oil price. Source: IATA 2016

72
have a negative effect in periods of low demand. Hence, airlines are facing a
problem of trade-off, as of acquiring too much capacity in order to operate
connections which only covers the marginal cost and not the cost of capital
incurred (IATA 2011). Additionally, the consequences of prices being forced
down, to the marginal cost in order to fill the cost, will intensify the competition
as they will start a price-war.
The excess capacity and economies of scale can also be analysed in the
context of new entrants or expansion. For instance, easyJet made major
expansions in 2007 which first came into effect in 2008 (easyJet 2008). They
expanded their operations with 28.0% from 2007 to 2008 with a ASK of 55 687
million with a load factor of 81.4%. This is equivalent to a cost per ASK 5,1 cent.
British Airways had in the same period an increase 0.8% in their ASK, totalling
149 545 million and a load factor of 75.6% (British Airways 2011). Their cost on
the other hand were significantly higher than easyJet, more specifically 31%
higher, as British Airways cost per ASK were 6,6 cents. This has also been the
case with Norwegian and SAS. In both cases, smaller airlines have challenged the
mature and high-cost player, and instead of realizing their loss of market share
and capacity they, and other FSCs, have instead increased their capacity. As a
consequence, we have in the past years seen mergers, like British Airways and
Iberia in 2010, as a strategic move in order to compete with low-cost airlines
(Press Association 2010)
In summary, with the large number of European airlines the competition is
in general very high. This is also fueled by customers’ price sensitivity and
somewhat homogeneous services offered by the airlines.
6.2 Strategic group analysis In this section we will investigate in-depth the factors that differ between strategic
groups. This will be conducted and applied through the framework of five forces,
nonetheless we are applying the framework on each of the two strategic groups,
namely full services carriers (FSCs) and low cost carriers (LCCs). We will
therefore discuss how the competition differs between the two strategic groups in
relation to suppliers, customers, potential entrants, substitutes and the internal
rivalry among the competitors in each of the strategic groups. By applying this
framework with the concept of strategic groups we will get a deeper

73
understanding of the dynamics within and between strategic groups and in this
case between full-service carriers (FSC) and low-cost carriers (LCCs)
6.2.1 Barriers to entry in the strategic groups
As the European airline market has developed into more mature stages, the harder
it has become to enter any of the strategic groups, namely the groups of LCCs and
FSCs. Although the financing is cheap and access is easier, it still requires a
significant amount of resources to enter any of these strategic groups. Moreover,
factors preventing new firms to enter either of these two groups, are the brand
recognition as customers have clear preferences (Peterson 2010). Nonetheless,
historical statistics shows that over 1300 airlines have been established over the
last 40 years, in which few have managed to successfully entered the LCC or FSC
group, or the group domestic flying or other niches. The majority of new entrants
fell in between and simply did not get enough momentum to continue operations.
Norwegian Air Shuttle, of 2002, was one of the last significant entrant into the
LCC group. It is thus believed that recent entrants into the European market, now
searches for niches as they will avoid competing head-to-head to either of these
groups. This is further cemented by the founder of California Pacific Airlines Ted
Vallas: “If you have a niche, the rewards are great” (Mouawad 2012). Based on
the aforementioned, it is consequently more value-adding to examine the mobility
barriers of moving to and from LLCs strategic group and FSC strategic group.
In recent years a common behaviour among European FSCs, are airlines
moving into new strategic groups. A recent example is Lufthansa and its low-cost
subsidiaries of Germanwings and Eurowings, operating exclusively in the
strategic group of LCCs (Lufthansa Group 2015). The acquisition of Eurowings
and Germanwings in late 2005 is perceived as a response to the LCCs’ growth. By
acquiring a LC, it would make more strategically and financially sense, rather
than restructuring their entire main carrier in order to compete head-to-head with
the likes of EasyJet and Ryanair. Restructuring of an airline in order to cut cost is
a major mobility barrier of switching strategic group.

74
A key driver for restructuring is the age of the aircraft fleet. A common pattern is
LCCs relatively young fleet of aircraft, characterized by its efficient design, low
operating cost including low and efficient use of fuel, and low emissions
(European Aviaiton Safety Agency (EASA) 2016). This gives LLCs a clear cost
advantage. On the contrary FSCs like Lufthansa and British Airways have a rather
old and less efficient aircraft fleet across the board.
This is further underlined by LCCs efficient aircrafts by fleet consisting of
326 Boing 737-800 with a high density seating of 189 seats instead of 162 seats
and two-class seating configuration traditionally used by FSCs. This would mean
lower fuel burn and emissions per seat-kilometre flown (Ryanair 2015). In
combination with more seats and lower operational costs, LCCs typically also
achieve a higher load factor than FSCs. This further helps maintain their profit
advantage over FSCs.
Subsequently, this forces every European FSCs to become leaner and
more efficient. This coincides with research conducted on strategic groups,
arguing that when firms in a strategic group adopt strategies that are better
positioned to the market condition, they will receive returns higher than the
industry average, and as a consequence, other firms in other strategic groups will
move towards this strategic group (Fiegenbaum, McGee and Thomas 1988).
0
2
4
6
8
10
12
14
0
50
100
150
200
250
300
350
AverageWleetageFleetsize Fleetsizeandage
TotalWleet AverageageofWleet
Figure 14: Fleet size. Source: Authors analysis based on respective annual reports

75
This is a consequence of FSCs over decades have developed and built up complex
processes that are costlier than the streamlined processes of LCCs (PwC 2015 ).
For example, FSCs have sophisticated and complex models of how to place
orders, handle transfer of passengers, how to price connection, handle baggage
between two or more flights, whether to hold a flight for delayed passengers and
so on (PwC 2015 ). These systems, among others, are delicately designed and
have several layers of embedded complexity. The high cost structure of FSCs vs.
the fundamentally lower cost structure of LCCs represent mobility barriers
impeding entry to the respective group (Caves and Porter 1977).
In order to deal with the increase price pressure Lufthansa, for instance,
has kept food and beverages and checked-in luggage on some distances in Europe.
Moreover, they have increased the prices on these tickets while at the same time
introduced no-frills tickets on intra-Europe routes through Eurowings. In recent
years SAS have removed the perks of free food and beverages, while kept any
extra service at a bare minimum. Moreover, they have introduced several new
classes of fares, and now recently SAS Go Light with no extra services (SAS
2015). These measurements from the FSCs can be attributed to an unsustainable
cost per available kilometre (CASK). As FSCs differentiation techniques
becoming less value adding and passengers less willing to pay for theses extra
services, the CASK is becoming even more important (C.S 2013).
Figure 15: CASK of selected airlines, 2006-2015. Source: Authors analysis based on respective annual reports
0
0.02
0.04
0.06
0.08
0.1
0.12
0.14
0.16
2006 2007 2008 2009 2010 2011 2012 2013 2014 2015
CASKin€
LUFTHANSAGROUP
BRITISHAIRWAYS
AIRFRANCE-KLM
EASYJET
RYANAIR
NORWEGIAN
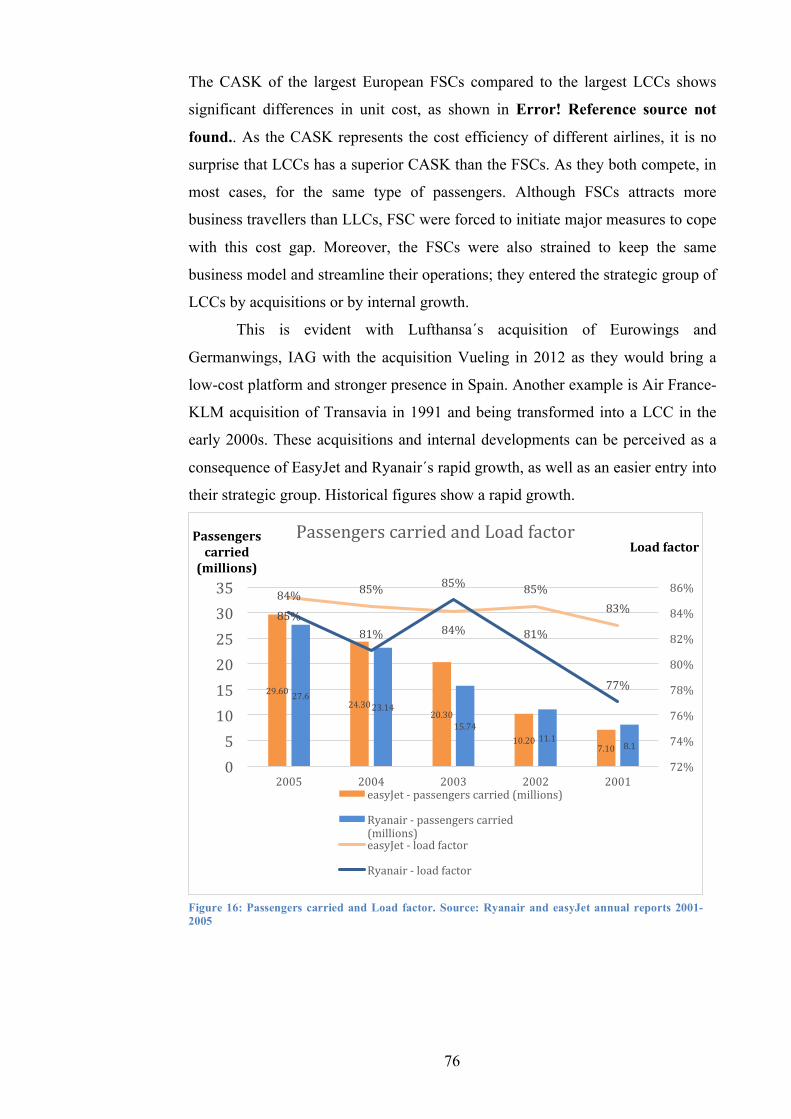
76
The CASK of the largest European FSCs compared to the largest LCCs shows
significant differences in unit cost, as shown in Error! Reference source not
found.. As the CASK represents the cost efficiency of different airlines, it is no
surprise that LCCs has a superior CASK than the FSCs. As they both compete, in
most cases, for the same type of passengers. Although FSCs attracts more
business travellers than LLCs, FSC were forced to initiate major measures to cope
with this cost gap. Moreover, the FSCs were also strained to keep the same
business model and streamline their operations; they entered the strategic group of
LCCs by acquisitions or by internal growth.
This is evident with Lufthansa´s acquisition of Eurowings and
Germanwings, IAG with the acquisition Vueling in 2012 as they would bring a
low-cost platform and stronger presence in Spain. Another example is Air France-
KLM acquisition of Transavia in 1991 and being transformed into a LCC in the
early 2000s. These acquisitions and internal developments can be perceived as a
consequence of EasyJet and Ryanair´s rapid growth, as well as an easier entry into
their strategic group. Historical figures show a rapid growth.
29.6024.30
20.30
10.207.10
27.623.14
15.7411.1
8.1
85%
85%
84%
85%83%
84%
81%
85%
81%
77%
72%
74%
76%
78%
80%
82%
84%
86%
05101520253035
2005 2004 2003 2002 2001
LoadfactorPassengerscarried(millions)
PassengerscarriedandLoadfactor
easyJet-passengerscarried(millions)
Ryanair-passengerscarried(millions)easyJet-loadfactor
Ryanair-loadfactor
Figure 16: Passengers carried and Load factor. Source: Ryanair and easyJet annual reports 2001-2005

77
Therefore, instead of restructuring their entire core operation they were forced to
enter the strategic group of LCCs with a new entity, separated from their flag
carrier. Meaning they could leverage their own resources, e.g. bargaining power
of aircrafts, airport slots, while at the same time streamline their processes.
In addition, for LCCs the physical centrality of airports may also impede
these carriers to move into the FSCs strategic group. As a major part of FSCs
business model is to fly to cities´ main airport, they differentiate themselves from
LCCs in this aspect. On the contrary, LCCs focus on the flying to airports on the
periphery of cities, as it will give the LCCs more bargaining power.
Brand recognition and perception
Brand recognition and preference are additional barriers impeding both LCCs and
FSCs to easily moving from one strategic group to another. As the European
airline industry has been dominated by 3 large FSCs and a couple of large LCCs
in the recent years, they have built up brands that are intangible assets for the
airlines. This is evidently hard to replicate for any potential entrants, either from
another strategic group or a new entrant.
easyJet and Ryanair have created a perception and communicated a brand
with a clear message: “We are a cheap airline, nothing else”. Historically, their
customer service has been infamously supported by their excess fees and extra
cost. Passengers that are forced to pay extra fees for overweight or overdue check-
in at the airport receive no sympathy by their fellow passengers or the flight crew.
This is the expectation and perception of flying with an ultra low-cost carrier.
Accompanied by a remainder of a very low price compared to FSCs, no one
should expect anything else than what they pay for. On the contrary, when FSCs
are adopting similar prices and services´ they are victim of public criticism and
scrutiny for their bad quality of services. Customers have clear preference of what
offers and services a LCC and a FSC should have.
With airlines streamlining their process and actions of becoming more
lean, the FSCs offer lower prices to serve the demand. For instance, customers at a
FSC like Lufthansa are now increasing their seat density from 168 to 180 in their
new fleet portfolio of Airbus A320neo, though reducing the leg-room hence lower
comfort (Kaminski-Morrow 2016). With the aforementioned slicing of several
services like checked luggage, food and beverages and similar, they are also

78
restructuring their inflight classes. FSCs often offer “Economy Plus” or “Premium
Economy” services offering similar services to those found in the old “Economy”
class. Although it sounds reasonable in theory, it does not take into account the
perception of the customers. As the perception of brands are mental pictures of
their expectation of the services´ airlines offers, and is basically the foundation of
which experiences and decisions are made upon, it becomes a negative experience
(Serusi 2016). Within the group of LCCs they all have a clear image and
communicated through a clear message of what to expect – “fly cheap from A to
B”. With this expectation in mind before boarding, they are mentally prepared for
any issue or trouble potentially lurking. Although in most cases the passengers do
not encounter these troubles. Basically, the low-cost airlines deliberately under-
promise and over-delivers and creates a positive brand experience.
On the other hand, FSCs are facing the opposite problem. Customers have
a mental image, through massive advertising like “flying in quality” and are
promoting a superior experience, giving passengers the perception that they will
fly in much more luxurious conditions compared to a LCC. Once on-board they
are negatively surprised as the airlines under-delivers on its brand promise (Serusi
2016). FSCs are therefore facing a crucial identity challenge. Firstly, they cannot
abandon their advertising and communication strategy of high quality service due
to their dependency on business travellers, frequent fliers and passengers
embedded in the loyalty programs. Secondly, they must also handle the increased
competition from LCCs with caution, and they are moving into new low-cost
long-haul operations and business classes with business fares and features. It is
therefore argued that FSCs must communicate a clear and honest message about
their brand and accept that they are not a LCCs. Additionally, removing features
of services is neither an optimal solution. However, the way FSCs in Europe have
dealt with this is through new subsidiaries - Vueling, Transavia and Eurowings –
and kept a clear distance from their parent company and at the same time initiated
cost cutting and streamlined process.
Overall, as passengers have a mental image of what LLCs and FSCs is, it
makes it hard to alter these mental images and expectations. It may therefore
indicate that LLCs may only enhance the image and perception positively by
adding more value-adding services. On the contrary, FSCs are taking a major risk
when they remove services and may change passengers perception negatively.

79
LCC response
While FSCs have faced the identity and brand crisis. LCCs have been, to a large
degree, loyal to their core competence and business model, although they have
now started to slightly reposition themselves in the market. The frontrunners of
the LLCs are easyJet and Ryanair and both have initiated a more customer centric
and relationship based approach. Ryanair has for instance launched “Always
Getting Better” plan. The initiative focused on improving every touchpoint for the
customer. This included better online check-in, mobile booking, smoother and
better boarding processes and friendlier on-board service (Edelman 2016).
Moreover, Ryanair also initiated more FSC features and services like allocated
seating and a second free carry-on bag. The negative experience of high excess
fees on printing boarding pass on-site and overweight of luggage have also been
removed or significantly reduced. Moreover, Ryanair has also moved closer to
what FSC offers of services in their intra-Europe routes with their new “Business
Plus” class. This includes free checked-in luggage, flexible ticket with unlimited
changes and priority seating (Edelman 2016). As a result of the introduction of
“Always Getting Better” Ryanair has seen an increase of passengers from 80 to
110 millions (CAPA 2016b). The load factor has also increased by 10%
representing 20 extra passengers on every Ryanair flight (Hobbs 2016). Overall,
the “Always Getting Better” programme has attracted millions of new customers
and improved the load factor, customer service and their offerings. Consequently,
they are now moving closer to the services and features of FSCs´ products on
inter-Europe routes. It is argued that Ryanair is in the phase of repositioning and
therefore also trying to change passengers´ perception.
easyJet has initiated similar measures as Ryanair. As of 2010 easyJet
initiated a repositioning from being a pure LCC competing head-to-head with
Ryanair among others. They changed their model to become a customer-centric
and affinity-driving brand, “Europe by easyJet” (Marketing Society 2014). This
was driven by focusing on emotional equity building advertising, rather than
advertising themselves as pure LCC. Their goal was to improve the perception of
the brand, which they also did.
As a part of their repositioning easyJet also introduced the Flexi fare
aiming to attract more business travellers, especially from their biggest domestic
rival British Airways. The Flexi fare resembles in many ways the FSCs business

80
fare on intra-European routes, with features like unlimited free date changes, 1
piece of checked-in luggage, fast-track security and similar. Moreover, as of 2010
business travellers only accounted for 5% of their passenger, however, with the
new initiative of Flexi fare easyJet has over 20% business travellers of their total
passenger.
Overall, easyJets initiative to move away from being a pure LCC has been
successful. They have benefited of their lean and low-cost structure, but are now
also appealing to a larger segment with emphasise on business travellers. This is
further supported by the change of brand preference among their customer, and is
changing customers perception positively.
In summary, barriers to enter into strategic groups are faced mainly by potential
entrants either entering the group of LCCs or FSCs. The key-take away is FSCs
are moving into similar business as LCCs with their subsidiaries, and at the same
time cutting costs in all aspects of their operations. The main barriers facing FSCs
include higher customer expectations and a fundamental difference in price
structure compared to LCCs.
On the other hand, LCCs are trying to establish themselves in the more
profitable market of long-haul services, as well as adding more options and
services to their main operations to take a larger part of the more demanding
customers, as well as business customers. LCCs are also facing issues related to
their reputation, but have managed to take an increasing part of the market, as
0%
20%
40%
60%
2011 2013
easyJetscampaignsareinspiringbookings
Alittlebitmorelikelytobook
Muchmorelikelytobook
0%
5%
10%
15%
20%
25%
2011 2013
BrandpreferanceFirstchoiceisrising
Brandpreferance
Figure 17: Brand preference. Source: easyJet 2014 Figure 18: Perceptual drivers. Source: easyJet 2014

81
discussed in earlier chapters.
6.2.2 Threat of substitutes to the strategic groups
Video conference is to some degree impeding actors in one strategic group to
move to another. Video conference may substitute any potential business meeting
as it serves the same purpose as of physical business meeting (Denstadli et al.
2013). As the majority still makes their business travel with FSCs it will make the
transition harder to the group of LCCs. Everyday business travellers may feel
going down 1 class of comfort on their travel as a discomfort, and may very well
prefer video conference instead of flying with a LCC. It is therefore suggested that
video conference for business travellers becomes more important in the future as
it will save the employees´ time and the employers resources.
High-speed trains taking over
Substitutability also refers to high-speed trains throughout Europe with likes of
0
500,000
1,000,000
1,500,000
2,000,000
2,500,000
2005 2006 2007 2008 2009 2010 2011 2012 2013 2014 2015
Passengers AirtrafWic-Europeancapitals
LondontoParis(variousairports) CharlesdeGaulletoAmsterdamSchipol
BrusseltoLondon
Figure 19: Passengers carried between capitals. Source: Eurostat 2015

82
Eurostar and Thalys. In 2015 3.4 million passengers flew from London to Paris,
Paris to Amsterdam or Paris to Brussels. With the new Eurostar high-speed train,
it may act as a substitutable on some routes, as the convenience is higher due to
less time spent at the airport and transportation to and from the city centre - as the
Eurostar brings you straight into the city centre. In the following examples are a
sample of high-speed rails with connection to European capitals versus flying,
with outbound departure 8th of June and inbound arrival 15th of June. It takes, in
travel time, in total 125 min from central station to the airport, flying from
London to Paris, and with train to the city centre. In comparison it takes 150 min
with Eurostar from London central station to Paris central station. However, time
used at the airport is not accounted for or any slack nor a potential time buffer.
Interestingly the price is lower with the high-speed train than the flight. The most
interesting result is the travel time, as the high-speed rails are fast and efficient, it
may serve as a substitute for business travellers. In some cases, the high-speed
train is also cheaper than the flight and might become the number service on
shorter distances like the ones in the table.
Air travel vs. High speed rail, 8-15 June 2015
Table 2: Comparison of flying vs train. Source: authors own analysis, based on Eurostar and Thalys 2016.
Although, this may just account for the fraction of the total passengers travelled
on the route, high-speed trains may be the future for travelling between the major
cities in Europe as the physical accessibility is more convenient. Additionally,
high speed train may also gain more traction as a consequence of the increased
emphasis on pollution and emissions hence more environmental taxes, and
subsequently making it more attractive to use high-speed train instead of flying.
The most prominent substitute, especially for FSCs and their business
travellers, are high-speed trains. They are priced similarly to FSC fares, but are in
8-15 June Flight Connection
(train)
Total
min. Price €
Eurostar
min.
Price
€
Thalys
min. Price €
London to
Paris 75 50 125 189 150 121 n.a n.a
Paris to
Amsterdam 75 55 130 106 n.a n.a 198 230
Brussel to
London 70 35 105 184 125 115 n.a n.a
83
many situations cheaper and more time efficient than flying. High-speed trains
may also act as a direct substitute for LCCs.
6.2.3 Bargaining power of suppliers and relation to the strategic groups
The bargaining power of suppliers applies in many ways the same to each of the
strategic groups. Although, there is some difference throughout the industry a
common characteristic among the LCCs are their use of secondary airports in
major cities. For instance, Ryanair flies to 5 of the 15 biggest airports in Europe,
while easyJet services 8 of 15 (Ryanair 2016b; easyJet 2016). By landing to
secondary and smaller airports LCC gains a bigger bargaining power towards the
airport, hence reduces their landing and take-off fees, security fees and parking
fees. Also, when practical, these airports contributes to less expensive facilities,
less convenient gates and use of outdoor boarding gates instead of the more
expensive alternatives (Ryanair 2016a). But most importantly, by having a large
share of the annual traffic of the airport LCCs are able to negotiate discounted
fees by promising and delivering a set amount of passenger traffic. This reduces
their overall operational cost while increasing their profit.
Furthermore, an issue arising today is the landing taxes and take-off taxes
issued by the governments throughout Europe (Ryanair 2016a). For instance,
Ryanair was affected by the Irish government´s introduction of an additional fee
of 10€ departing from Irish airports with routes longer than 300km. This tax is
also evident in the likes of Germany, Austria, Italy and UK, ranging from 8€ to
25€ (Ensor 2013; Ryanair 2016a). Although, this tax applies to all incumbent
airlines of the respective airport, it certainly does have large impact on LCCs total
fare ticket as the landing fee constitute a large part of the total amount. Moreover,
as the bargaining power of customers is exponential and even a small increase of
the already low-cost fares will have a negative impact. A similar tax, a seat
charge, is introduced in Norway and in combination with exponential bargaining
power have led to the cease of all operations at Rygge Airport, Norway,
commencing 1. November 2016 (Janiszewski and Lichtenstein 1999; Ekeseth and
Havnes 2016). As a part of the termination of the contract, Rygge Airport will be
forced to cease all operations entering into force 1. November 2016. This has led
to nationwide discussion whether to introduce this tax or not, as it will lead to
directly and indirectly 1000 job losses and cease of 1,6 million passengers.

84
Consequently, indicating the bargaining power of LCCs, and in this case Ryanair,
of their use of secondary and smaller airports close to major cities.
On the contrary, FSC are landing at the major airports in close proximity
to the corresponding city. An extra fee like the landing tax will, however, have
different effect as customers are more accustomed to higher prices compared to
LCCs. Although, it will hurt them financially they will not cease any operations as
it applies to all the airlines landing at the respective airports and countries with
extra fee.
Aircraft
The type of aircraft also has an impact of suppliers bargaining power. LCCs tend
to have one type of aircraft used throughout their entire fleet. Ryanair only uses
Boeing 737-800 for their operations, with a fleet of over 300 aircrafts (Ryanair
2016c). easyJet follows similar strategy and only operates aircrafts from the
Airbus A320 family, exclusively Airbus A320 and A320neo (easyJet 2015).
Norwegian Air Shuttle also operates just one type of aircraft for their short-haul
routes by operating over 100 Boing 737-800 aircrafts (Norwegian Air Shuttle
2016). The underlying reason of LCCs consistently use of one type of aircraft can
be attributed to the substitutability of the aircraft and maintenance. By having one
type of aircraft it can easily be taken out of operation, as part of maintenance, and
replaced by an identical aircraft with the same seat configurations and
specifications (Hough 2011). Moreover, it makes training of crew and pilots easier
as they only know how to service one type of flight. Educating pilots for different
types of aircraft is a costly fee for airlines. FSCs like Lufthansa, British Airways
and Air France-KLM, on the other hand, uses a mix of Airbus A320 family,
Boeing 737 family and Embraer 190 and 195. Although, this is part of their nature
of being a FSC as they fly regional, short-haul and long-haul they need aircrafts
that can be easily switched from one geographical market to another. Though, cost
in relation of training pilots and crew to the different aircrafts are a necessity.
Labour
Employee differences have perceptually been homogeneous throughout the
industry, in which cabin crews and pilots could easily switch from the likes of
easyJet to British Airways and vice versa. In the latter years’ low-cost airlines are

85
constructing working contracts with few social benefits and advantages compared
to the former ones (Bachman and Matlack 2015). Ryanair has several contractor
agreements leasing pilots and crews, avoiding taxes and social benefits, although
at the same time creating huge debate whether this is ethical right. Nonetheless,
through these kind of actions further boost the perception of being a LCC, making
it even harder for anyone to enter their strategic group.
Overall, suppliers still have high bargaining power towards both the group
of LCCs and FSCs. However, LCCs are trying to reduce their bargaining power
by initiating long-term contract and shop-around for the lowest labour costs. FSCs
are traditionally associated with stronger unions, decreasing their bargaining
power against pilots, air crew, ground crew and similar compared to LCCs.
6.2.4 Bargaining power of customers and strategic groups
The gross national income (GNI) in Europe has increased over the last 10 years.
Consumers have higher purchasing power than before suggesting more resources
to travelling. Nevertheless, flying has over time become a commodity in Europe
as passengers’ perception has also changed. As air travel itself was earlier a part
of the experience of the trip, especially, for leisure customers this has somewhat
changed and is now just a mean to get to their destination. Extra value added
services like priority boarding, meals and beverages have become less important,
and price, or the cost of the ticket, is the most valued attribute to the air travel
(Hugh Morris 2015). Moreover, the introduction of travel websites like
expedia.com and kayak.com has increased the transparency of prices making it
easier for customers to shop around after the best offer. The importance of travel
websites is further fuelled by the price sensitivity of customers making the intra-
European competition in many ways a matter of competition of the lowest cost.
This particularly applies for leisure customers, as they have to pay for the fare
themselves. In contrast, business travellers’ journey is paid by their company.
Traditionally, business travellers have exclusively flown with FSC due to
their network, comfort and loyalty programmes. However, as a consequence of
the economic crisis, the travel budget was one of the first budget posts that were
cut. This also changed the perception of companies´ willingness to pay for their
employees´ business travel and control of direct costs were their number one
priority (Amadeus 2015). Amadeus´ research show that 85% of the respondents´

86
priority was control of costs, while 76% said security was the most important
factor and 50% agreed upon that a complete overview of the expenses was the
most important factor. Not surprisingly, the comfort of the business traveller was
not a priority. This further suggests LCCs are becoming more relevant for
companies, as they operate with lower costs. With passengers leaning toward
flying with LCCs they have increased their market position tremendously and has
today over 40% market share of all intra-Europe flights (Azerad and Ibanez 2016).
This is an increase of 15% since 2006!
As customers have become more familiarised with digital tools like travel
websites increasing the price transparency as well as their bargaining power, FSC
have used loyalty programmes to incentivise customers to fly with them -
decreasing their bargaining power. However, in recent years LCCs such as
Ryanair, easyJet and Norwegian have launched their own loyalty programmes in
order to customise passengers’ experience and “lock them in”, making them have
one preferred airline. Thus, trying to decrease their ability to shop-around and
decrease their bargaining power.
Overall, bargaining power of customers has changed over the last decade.
Previously customers had the choice to either fly with LCCs or FSCs. As these
two strategic groups have moved closes to each other, the same type of customers
are now able to choose among them all giving them, more or less, the same type
of value.
In general business travellers have flown with FSC due to their connections,
while leisure travellers have used LCCs. This has roughly been the consensus.
However, with the change of perception among customers both for business and
leisure travellers they have started to shop-around for the lowest prices. It has
therefore pressured airlines to lower their prices, making the selection of routes
and airlines larger.
6.2.5 Intensity of rivalry
Previously, LCCs were mainly an alternative to the FSCs in Europe offering
lower fares and point-to-point flying. Over time the competition has changed as
customers are becoming more indifferent whether to fly with LCC or FSC. This is
further supported by carriers’ competition of business travellers. Before, the
differentiation of services and products between LCCs were existing, which was
87
also the main characteristic among FSCs – FSC had in-flight services. Actors in
the group of LCCs and FSCs offered distinct services, at least this was the
common perception of customers. LCCs competed mainly for leisure travellers
and in many aspects neglected the typical business traveller. With easyJet and
Ryanair as the most prominent actors in the LCC group they have occupied a
large market share exceeding 40% with a rather high profit margin compared to
FSCs (Azerad and Ibanez 2016). Fuelled by extensive growth in passengers´
demand, they have recently been witness to the successful entry of Norwegian Air
Shuttle.
Moreover, their large profit margin can be addressed to the low-cost per
ASK and lean processes. FSCs on the other hand have historically faced tougher
conditions. With premium prices on fairly equal services, FSCs have had trouble
of differentiate themselves throughout their strategic group. Additionally,
extensive operational costs and economic downturn have neither aided a healthy
and sustainable competition. The economic downturn had severe impact in the
European airline industry, especially for the FSCs. As a large portion throughout
the group of FSCs consist of business travellers, this type of passengers became
less in demand as a consequence of their travel budgets were sliced. Embedded in
high fixed costs, FSCs arguably were forced to cut costs in order to not go
bankrupt. Subsequently, as a result of the economic crisis, the customers became
more price sensitive in which over 56% believes price and the cost of the fare is
the most important factor when booking a flight (Hugh Morris 2015). FSC, on the
contrary, not only attracted leisure customers but also business travellers. Flying
has become more like a bus operation, this is not the case anymore and business
travellers are becoming more open to fly with LCCs (O´Leary 2002).
These factors have led to an extensive price competition in the following
years. We are still, today, witness to extensive cost cutting and restructuring with
the aim to become more efficient and make leaner processes.
Over time, as the two strategic groups have tended to move closer to each
other, further supported by customers’ perception, the rivalry has intensified. This
is due to, as explained earlier, the change of both LCCs and FSCs - in which
LCCs have strengthen their brand identification and FSCs have tried to strengthen
their cost position. LCCs and FSCs are today, to a large degree, in two

88
overlapping strategic groups in regards of the intra-European competition and its
customers.
In summary, the competition between LCCs and FSCs has intensified. LCCs
are adding more services, while FSCs are removing their services in which both
strategic groups are becoming similar. They are now, arguably, moving into the
same strategic group in the intra-European market.

89
7 Conclusion (summarize) In this thesis we have discussed and analysed the effects of structural changes in
strategic groups in the European Airline Industry. This has been done from the
perspective of strategic group theory and mobility barriers. The industry has been
analysed through Porter’s five forces framework. This chapter will summarize our
findings and conclusions in the same order as the analysis, as well as give a
prediction of how we think industry will develop in the coming years.
The full service carriers (FSCs) face the strongest threat of new entrants, mainly
from Middle Eastern carriers taking a larger part of long haul routes between Asia
and the US, as well as looking towards the intra-EU market. The threat of newly
established airlines is present but not significant.
High-speed rail is the most eminent substitute, but primarily for short-haul
routes up to 800km. With large expansion and increased speed through
government subsidies, high-speed rail has already taken a toll on direct routes
between larger cities in Central Europe. This threat is facing the low-cost carriers
(LCCs) the strongest.
As customers have an increasing number of options to choose from when
travelling in Europe, and air travel is getting increasingly common, prices are now
the main factor for leisure customers when buying tickets. This means, intra-
Europe air travel is to some degree becoming a commodity, meaning cost
becomes an increasingly important competitive advantage, favouring, again,
LCCs.
Suppliers such as aircraft manufacturers and airports are generally highly
concentrated with high bargaining power against airlines, where the increased
demand in recent years has led to a limited supply. Larger airlines that have
previously taken advantage of their size when negotiating with these suppliers
have lost some of their leverage. Labour unions are generally strong for both
FSCs and LCCs and fuel prices also have generally the same impact.
Internally in the industry, the leading strategic group has traditionally been
the FSC. There has however been a clear shift in the power balance between
groups, where the LCCs have had tremendous growth and are now dominating
more than 40% capacity in Europe, a number that is growing year-on-year, and

90
has doubled in ten years. In addition to having the highest passenger growth, this
strategic group is also capitalizing on its low cost and is experiencing higher profit
margins as a result. A strong focus among all airlines therefore on costs. This
poses a challenge for FSCs, as severe cost cuttings usually involve taking away
some goods and features from customers. From a customer perspective, the
expectation of a FSC is different than of a LCC, making removal of features or
goods even more difficult. LCCs however, having customers with lower
expectations in combination with a fundamental focus on cost throughout the
entire organization are adding services like business class tickets, while still
keeping the higher margins.
The advantage then, seems to lie on the low cost airlines, but does this mean
that there will be no place for traditional FSCs in the future? Not necessarily, the
low cost model does not allow for connected flights, at least not at this point, and
the hub-and-spoke system still plays an important role. Although the majority of
traffic goes between directly connected airports, the market for connecting flights
are still there, connecting smaller airports and connecting traffic for long-haul
routes. Connected flights are more costly in terms of more complex baggage
handling and dependence on several flights also makes it more vulnerable to
delays.
To summarize the differences between these two strategic groups are
decreasing and due to LCCs low cost structure and the commoditization of air
travel their market share will continue to increase.
7.1 Forecast Our findings are based on the analysis and how we believe the European airline
industry will look like in 10-15 years. We believe several changes in strategic
group structure will affect airlines and customers alike in the coming years.
Firstly, the differences have already become smaller, as discussed in
section 6.2.5 Intensity of rivalry. This is a necessary step in cost reduction for
FSCs struggling to make profits, but also a strategic step from fast growing LCCs
to take a larger part of the profitable business market. Based on these findings and
our analysis, we believe this trend will continue for several years, as both groups
are facing fierce competition both internally, between groups, from entrants from
other markets, from other modes of transportation, and from substitutes to travel.
91
Secondly, as discussed in section 6.1.5 Intensity of rivalry, Europe
has lost 73 scheduled airlines between 2011 and 2015. By mid 2015, there were
168 scheduled airlines in Europe, 19 in the UK alone (Grant 2015). Compared to
the fastest growing market in the world, China, there are only 29 scheduled
airlines. US, the region most comparable to Europe, also has a much higher
market concentration than Europe, and has enjoyed, although still low, higher
margins than Europe the last decade. We believe, based on our research, that the
number of airlines in Europe will continue to decline in the coming years. It is
simply not viable for such a high number of competitors and very low margins to
operate in a single European market. We may therefore also see more M&As as
the larger airline corporations want to expand in order to get better strategic hubs
or greater presence in areas where they do not operate yet. This prediction is based
on industry reports stating the need for more consolidation in the industry as well
as airline officials stating they want to grow beyond what is feasible organically,
and several attempts by larger airlines to acquire smaller ones. Moreover, FSCs
subsidiaries such as Eurowings will, among others, most likely service the
European market, while Lufthansa will operate outside of Europe. A consolidation
will be driven both by a combination of M&As and market exits.
Thirdly, another trend that will become more evident in the future is
companies offering more complementary services. easyJet is fully utilising their
connections with the “easy”-brand adding bundles and complementary services to
their airline service. Hertz, the car rental company, is having a close cooperation
with Ryanair and we have earlier been witness to SAS´ major stake in the hotel
chain Radisson which formed a tight collaboration. These kind of collaborations
will be further strengthen their relevance through the likes of loyalty programmes
and, now recently, collaborations with financial services like VISA and
MasterCard. Bundles and cooperation’s may also occur between LLCs and FSCs,
at least in the short term. As it is a time and resource-consuming process to gain
license to operate long-haul operations, especially transatlantic routes, LCCs like
Ryanair and easyJet may seek to partner with some of their competitors of FSC in
order to serve this market. Both Ryanair and easyJet are in talks with British
Airways in terms of operating as a feeder-airline on specific long-haul distance
e.g. Birmingham to Dublin on short-haul served by Ryanair and long-haul from
Dublin to New York with Aer Lingus/British Airways.

92
Fourthly, we believe that future Business travellers will be more
accustomed to flying with low cost carriers, but at the same time they will also
have time-efficiency and effectiveness as their number one priority (IATA 2011),
as discussed in 6.1.3 and 6.2.4 bargaining power of customers. Although, the
paying company will have costs and security as their number one priority (Tinnus
2015). Furthermore, efficiency and productivity are two key factors, which will
influence airports in Europe. Technological advances with abolishment of security
control, customs and immigration will make the travelling more efficient and cost
effective. These characteristics will also be key drivers for leisure passengers in
addition to time savings. As prices become equivalent and reach a threshold
throughout the intra-European market, European airlines are forced to put more
focus on their customer service and marketing. As discussed in the analysis,
recent initiatives from easyJet and Ryanair show increased focus on customer
service, supporting the argument that LCCs will to a larger degree aim for the
business market. It is furthermore believed that older travellers, the ones who are
accustomed to travelling, will seek transportation modes with greater comfort and
convenience.
Lastly, the European airline market becomes more consolidated and
Middle Eastern carriers will increase their presence in the intra-European airline
market. It is already evident of their presence in several of the major FSCs with
passive shareholder stakes. The likes of Etihad Airways, Emirates Airways and
Qatar Airways will be the most prominent ones. Their entry will cause major
havoc and may squeeze profits from other FSCs, making it even more
competitive. Based on our analysis of potential entrants in section 0, we will argue
that this would also launch major expansion from LCCs such as easyJet and
Ryanair, pressuring them voluntarily or involuntarily to diversify their operations.
This would most likely mean low cost long-haul operations to North America.

93
8 Exhibits
Exhibit 1: Summary Europe
World Europe Source
Passengers carried 3.5 billion (+6,5%) 879 million (+4,4%) ICAO for World Eurostat (EU27)
Airline Demand (RPK) 6608 billion (+6,7%) 5,80% IATA
Airline Capacity (ASK) 5,50% 3,90% IATA
Commercial Air Transport Airport Movements
55.5 million (+0.8%) 16.0 million (-1.5%) ACI
Cargo (Freight tonne kilometres) -1.5% -2.9% IATA
GDP growth +3.2% -0.3% IMF
Airline net post-tax profits (% revenues) 33,0 (4,6%) 6,9 (3,5%) IATA
Busiest Airport (Passengers)
Atlanta, U.S. (101,9 million)
Heathrow, UK (75,0 million) Business Insider
Commercial Jet Aircraft Fleet 26.842 6.808 Flightglobal

94
Exhibit 2: International EU routes and passengers Year International.
intra-EU routes
Extra-EU
routes
EU
passengers
(millions)
Global
passengers
(millions)
1992 874 988 212 1145
1993 940 1070 220 1142
1994 1020 1110 238 1233
1995 1100 1180 253 1303
1996 1240 1300 278 1391
1997 1270 1340 298 1455
1998 1300 1370 307 1467
1999 1400 1590 332 1562
2000 1550 1610 359 1674
2001 1560 1600 357 1655
2002 1650 1560 360 1627
2003 1760 1530 394 1665
2004 2000 1700 434 1889
2005 2180 1800 454 1970
2006 2300 1940 489 2073
2007 2670 2030 527 2209
2008 2860 2120 532 2208
2009 2900 2150 522 2250
2010 3130 2350 544 2628
2011 3140 2360 580 2787
2012 3270 2420 581 2894
2013 3270 2520 585 3051
2014 3360 2590 608 3214
2015 3522 2621
Source: (Eurostat 2016)

95
Exhibit 3: Operational margins for selected European airlines Airline 2015 2014
Ryanair 18,4% 13,1%
easyJet 14,7% 12,8%
WizzAir 13,6% 10,9%
Icelandair 11,9% 7,1%
British Airways 11,2% 8,3%
Turkish Airlines 10,2% 7,4%
Aegean 9,9% 11,7%
SAS 5,6% 0,4%
Lufthansa Group 5,2% 2,4%
Finnair 5,1% -3,6%
Air France-KLM 4,5% 0,7%
Norwegian 1,5% -7,2%
Source: Authors own analysis based on respective annual reports

96
Exhibit 4: Narrowbody fleet orders by 2015
Source: (European Commission 2015)

97
Exhibit 5: Widebody fleets and orders by 2015
Source: (European Commission 2015)

98
Exhibit 6: Cost per Average Seat Kilometre
Source: Authors own analysis based on respective annual reports

99
9 Bibliography A.T. Kearney. 2013. European Airlines - Meeting the headwinds head on. A.T.
Kearney inc. Aaker, David A. 2008. Strategic market management: John Wiley & Sons. ACI Europe. 2016. "Airport Economic, Finance and Ownership" Accessed April
14 2016. https://www.aci-europe.org/policy/position-papers.html?view=group&group=1&id=6.
Air France-KLM. 2016. "Air France-KLM history" Accessed March 16 2016. http://www.airfranceklm.com/en/group/history.
Airbus. 2016. "Airbus Commercial Results 2015". http://www.airbus.com/presscentre/pressreleases/press-release-detail/detail/a-positive-kick-off-for-airbus-in-2016/.
Airfinance Journal. 2015. The Leasing Top 50 2015. https://www.gecas.com/en/common/docs/Leasing_Top_50_2015.pdf.
AirInsight. 2015. "The Engine Game" Accessed April 14 2016. http://airinsight.com/2015/05/06/the-engine-game/.
Airport Council International. 2015. Annual Analyses of the EU Air Transport Market 2013. Edited by Matt McDonald. European Commission.
Amadeus. 2015. 2015 European business travel and expense analysis. Edited by Florian Tinnus: Amadeus IT Group. http://www.amadeus.com/web/binaries/1333095678090/blobheader=application/pdf&blobheadername1=Content-Disposition&blobheadervalue1=inline%3B+filename%3D2015-European-business-travel-and-expense-analysis.pdf.
Andrews, Philip Walter S. 1951. "Industrial analysis in economics." Oxford studies in the price mechanism: 139-172.
Assaf, A George and Alexander Josiassen. 2012. "European vs. US airlines: Performance comparison in a dynamic market." Tourism Management 33 (2): 317-326.
Azerad, Hugo and Eugenio Prieto Ibanez. 2016. Low-Cost Air Travel Enters the Next Stage: AT Kearney. https://www.atkearney.com/documents/10192/7849535/Low-Cost+Air+Travel+Enters+the+Next+Stage.pdf/82879799-c94b-410c-a219-7104df388c9a.
Bachman, Justin and Carol Matlack. 2015. "Budget Arilines Shop the World for Cheaper Pilots." Bloomberg. http://www.bloomberg.com/news/articles/2015-02-12/budget-airlines-shop-the-world-for-cheaper-pilots.
Bain, J.S. 1954. "Conditions of Entry and the Emergence of Monopoly." Monopoly and competition and their regulation 215.
———. 1956. Barriers to new competition: their character and consequences in manufacturing industries: Harvard University Press. http://books.google.no/books?id=8QJeAAAAIAAJ.
Baker, Michael B. 2009. "Rise In Remote Conferencing Prompts Marriott, Starwood." Business Travel News.
Barney, J.B. and W.G. Ouchi. 1986. Organizational economics: Jossey-Bass. https://books.google.no/books?id=jDq3AAAAIAAJ.
Baumol, William J. 1959. "Business behavior, value and growth." New York 32.

100
Baxter, Pamela and Susan Jack. 2008. "Qualitative case study methodology: Study design and implementation for novice researchers." The qualitative report 13 (4): 544-559.
Berger, Peter L. and Thomas Luckmann. 1966. The Social Construction of Reality: A Treatise its the Sociology of Knowledge.
Boyd, Jens L. 2004. "Intra-industry structure and performance: strategic groups and strategic blocks in the worldwide airline industry." European Management Review 1 (2): 132-144. doi: 10.1057/palgrave.emr.1500018.
British Airways. 2011. Annaul Report 2009/10. Edited by British Airways. Brons, Martijn, Eric Pels, Peter Nijkamp and Piet Rietveld. 2002. "Price
elasticities of demand for passenger air travel: a meta-analysis." Journal of Air Transport Management 8 (3): 165-175. doi: http://dx.doi.org/10.1016/S0969-6997(01)00050-3.
Budd, Lucy, Graham Francis, Ian Humphreys and Stephen Ison. 2014. "Grounded: Characterising the market exit of European low cost airlines." Journal of Air Transport Management 34: 78-85.
Burghouwt, Guillaume and Jaap de Wit. 2005. "Temporal configurations of European airline networks." Journal of Air Transport Management 11 (3): 185-198.
Burghouwt, Guillaume, Pablo Mendes De Leon and Jaap De Wit. 2015. "EU Air Transport Liberalisation Process, Impacts and Future Considerations." International Transport Forum 2015-4.
C.S. 2013. Legacy vs low-cost carriers: Spot the difference. In Gulliver - Business travel: The Economist.
CAPA. 2014. "Boeing, Airbus share honours in 2013 orders/deliveries race". http://centreforaviation.com/analysis/boeing-airbus-share-honours-in-2013-ordersdeliveries-race---but-its-not-about-winners-and-losers-147949.
———. 2016a. Airline new entrants still falling after the GFC. ———. 2016b. Ryanair's best margin since 2005 illustrates the success of
'Always Getting Better' programme . Edited by CAPA. http://centreforaviation.com/analysis/ryanairs-best-margin-
since-2005-illustrates-the-success-of-always-getting-better-programme-282810.
Caves, R. E. and M. E. Porter. 1977. "From Entry Barriers to Mobility Barriers: Conjectural Decisions and Contrived Deterrence to New Competition." The Quarterly Journal of Economics 91 (2): 241-261. doi: 10.2307/1885416.
Caves, Richard E. 1967. American industry: structure, conduct, performance. Cederholm, Teresa. 2014. "Assessing the key drivers of global airline industry
growth." Market Realist, Nov 3, 2014. http://marketrealist.com/analysis/stock-analysis/industrials/airlines/charts/?featured_post=124000&featured_chart=124033.
Cha, Frances. 2014. "Coming soon? Standing instead of sitting on planes." CNN. http://edition.cnn.com/2014/07/10/travel/standing-cabin-plane-study/.
Clewlow, Regina R, Joseph M Sussman and Hamsa Balakrishnan. 2014. "The impact of high-speed rail and low-cost carriers on European air passenger traffic." Transport Policy 33: 136-143.
Colorado State University. 2016. "Genaralizability and Transferability". Writing@CSU Writing Guide.

101
Cool, Karel and Ingemar Dierickx. 1993. "Rivalry, strategic groups and firm profitability." Strategic Management Journal 14 (1): 47-59. doi: 10.1002/smj.4250140106.
CWT Solutions Group. 2012. The Hidden Costs of Business Travel. Carlson Wagonlit Travel. http://www.cwt-solutions-group.com/export/sites/cwt/cwtsg/.content/files/CW-cwt-travel-stress-index-hidden-costs.pdf.
Dagens Næringsliv. 2016. "Brent 1. Posisjon." http://www.dn.no/finans/ - /energi. Day, George S. 1984. Strategic market planning: The pursuit of competitive
advantage: West Group. Delta Air Lines. 2008. "Delta and Northwest merge, creating premier global
airline" Accessed March 13 2016. http://news.delta.com/delta-and-northwest-merge-creating-premier-global-airline.
Denstadli, Jon Martin, Mattias Gripsrud, Randi Hjorthol and Tom Erik Julsrud. 2013. "Videoconferencing and business air travel: Do new technologies produce new interaction patterns?" Transportation Research Part C: Emerging Technologies 29: 1-13.
Dept. of Global Studies & Geography. 2006. "The geography of transport systems" Accessed March 12 2016. https://people.hofstra.edu/geotrans/eng/ch3en/conc3en/hubspokederegulation.html
Dowling, Grahame R and Mark Uncles. 1997. "Do customer loyalty programs really work?" MIT Sloan Management Review 38 (4): 71.
Dranove, David, Margaret Peteraf and Mark Shanley. 1998. "Do strategic groups exist? An economic framework for analysis." Strategic Management Journal 19 (11): 1029-1044.
Dresner, Martin. 2006. "Leisure versus business passengers: Similarities, differences, and implications." Journal of Air Transport Management 12 (1): 28-32. doi: http://dx.doi.org/10.1016/j.jairtraman.2005.09.006.
easyJet. 2008. Annual reports and accounts 2008. Edited by easyJet: easyJet. http://corporate.easyjet.com/~/media/Files/E/Easyjet-Plc-V2/pdf/investors/result-center-investor/easyJet_ar081.pdf.
———. 2015. Annual Report 2015. easyjet.com. ———. 2016. Route map. Edelman. 2016. Ryanair - Low cost flights changed everything. Edited by
Edelman. http://www.edelman.ie/work/ryanair/. Eisenhardt, Kathleen M. 1989. "Building theories from case study research."
Academy of management review 14 (4): 532-550. Ekeseth, Fredrick Chr. and Heljar Havnes. 2016. ""-Dette er en tragedie"."
Dagens Næringsliv. http://www.dn.no/nyheter/naringsliv/2016/06/01/1005/Luftfart/-dette-er-en-tragedie.
Empson, Laura. 2001. "Fear of exploitation and fear of contamination: Impediments to knowledge transfer in mergers between professional service firms." Human relations 54 (7): 839-862.
Ensor, Josie. 2013. "Ryanair to cut down flights from Stansted over landing fee row
." Telegraph. http://www.telegraph.co.uk/finance/newsbysector/transport/9904233/Ryanair-to-cut-down-flights-from-Stansted-over-landing-fee-row.html.

102
Euronews. 2015. "Strike grounds 100,000 passengers as Lufthansa cancels 900 flights" Accessed April 12 2016. http://www.euronews.com/2015/11/09/strike-grounds-100000-passengers-as-lufthansa-cancels-900-flights/.
European Aviaiton Safety Agency (EASA), the European Environment Agency (EEA) and EUROCONTROL. 2016. European Aviation Environmental Report 2016. Edited by European Commission. European Commission: European Commission.
European Commission. 2015. An Aviation Strategy for Europe. ———. 2016. "Air - Internal Market" Accessed 18.04 2016.
http://ec.europa.eu/transport/modes/air/internal_market/index_en.htm. Eurostat. 2015. "Evolution rail passenger transport 2013-2014 " Accessed April
19 2016. http://ec.europa.eu/eurostat/statistics-explained/index.php/File:Evolution_rail_passenger_transport_2013-2014_(1000_passengers).png.
———. 2016. "Air Transport Statistics". http://ec.europa.eu/eurostat/statistics-explained/index.php/Air_transport_statistics.
Fiegenbaum, Avi, John McGee and Howard Thomas. 1988. "Exploring the Linkage between Strategic Groups and Competitive Strategy." International Studies of Management & Organization 18 (1): 6-25.
Fiegenbaum, Avi and Howard Thomas. 1995. "Strategic groups as reference groups: Theory, modeling and empirical examination of industry and competitive strategy." Strategic Management Journal 16 (6): 461-476.
Flottau, Jens. 2015. "Drop In Oil Prices Means An Airline Profitability Boost Now, But...". Aviation Week. http://aviationweek.com/commercial-aviation/drop-oil-prices-means-airline-profitability-boost-now.
Foss, Nicolai J. 1997. Resources, firms, and strategies: a reader in the resource-based perspective: Oxford University Press on Demand.
Francis, Graham, Ian Humphreys, Stephen Ison and Michelle Aicken. 2006. "Where next for low cost airlines? A spatial and temporal comparative study." Journal of Transport Geography 14 (2): 83-94.
Givoni, Moshe. 2007. "Environmental benefits from mode substitution: comparison of the environmental impact from aircraft and high-speed train operations." International Journal of Sustainable Transportation 1 (4): 209-230.
Grant, John. 2015. There could be no European airlines in 25 years. Routes Europe Strategy Summit, Aberdeen.
Harvey, G and P Turnbull. 2014. "Evolution of the Labour Market in the Airline Industry due to the Development of the Low Fares Airlines (LFAs)." Brussels: European Transport Workers’ Federation.
Hatten, Kenneth J and Mary Louise Hatten. 1987. "Strategic groups, asymmetrical mobility barriers and contestability." Strategic Management Journal 8 (4): 329-342.
Hergert, Michael Lee. 1983. The incidence and implications of strategic grouping in US manufacturing industries: Harvard University.
Hobbs, Thomas. 2016. "Ryanair: ‘We want to be more like Amazon and Ikea than other airlines’". https://www.marketingweek.com/2016/04/15/ryanair-we-want-to-be-more-like-amazon-and-ikea-than-other-airlines/.
Hough, Andrew. 2011. "Boeing 737: the aircraft favoured by low-cost airlines across the globe." Telegraph.

103
http://www.telegraph.co.uk/travel/travelnews/8428464/Boeing-737-the-aircraft-favoured-by-low-cost-airlines-across-the-globe.html.
Hugh Morris. 2015. "Price more important than punctuality for flying Britons." Telegraph. http://www.telegraph.co.uk/travel/news/Price-more-important-than-punctuality-for-flying-Britons/.
Hunt, Michael S. 1972. Competition in the major home appliance industry: 1960-1970: na.
IAG. 2012. "Vueling to expand". IAG Accessed March 13 2016. http://www.vueling.com/en/we-are-vueling/press-room/press-releases/corporate/vueling-network-to-expand-to-100-destinations-from-barcelona-el-prat-airport-in-2013.
———. 2016. "IAG Profile" Accessed March 16 2016. http://www.iairgroup.com/phoenix.zhtml?c=240949&p=aboutoverview.
IATA. 2011. Vision 2050. https://www.iata.org/pressroom/facts_figures/Documents/vision-2050.pdf.
———. 2013a. Airport Competition. ———. 2013b. Profitability and the air transport value chain. IATA Economics
Briefing 10. ———. 2014. "Airline consolidation: could Europe follow North America's path
to improved margins?" CAPA - Centre for Aviation. ———. 2015a. "Economic Performance of the Airline Industry - Midyear report
2015." ———. 2015b. "Scheduled passengers carried" Accessed March 10 2016. ———. 2015c. "Who has the right model for European aviation?" Airline Leader
(28). ———. 2016a. Economic Performance of the Airline Insustry - 2015 End Year
Report. https://www.iata.org/whatwedo/Documents/economics/IATA-Economic-Performance-of-the-Industry-end-year-2015-report.pdf.
———. 2016b. "Jet Fuel Price Development". http://www.iata.org/publications/economics/fuel-monitor/Pages/price-development.aspx.
———. 2016c. "Operational Fuel Efficiency" Accessed March 13 2016. IBM Global Business Services. 2010. Airlines 2020: Substitution and
commoditization. Janiszewski, Chris and Donald R. Lichtenstein. 1999. "A Range Theory Account
of Price Perception." Journal of Consumer Research 25 (4): 353-368. doi: 10.1086/209544.
Julsrud, Tom Erik, Randi Hjorthol and Jon Martin Denstadli. 2012. "Business meetings: do new videoconferencing technologies change communication patterns?" Journal of Transport Geography 24: 396-403.
Kaminski-Morrow, David. 2016. "Lufthansa shows A320neo cabin layout changes". https://www.flightglobal.com/news/articles/picture-lufthansa-shows-a320neo-cabin-layout-change-422301/.
Ken, G. Smith Curtis M. Grimm, Stefan Wally and Greg Young. 1997. "RESEARCH NOTES AND COMMUNICATIONS STRATEGIC GROUPS AND RIVALROUS FIRM BEHAVIOR: TOWARDS A RECONCILIATION." Strategic Management Journal (1986-1998) 18 (2): 149.
Kling, James A and Ken A Smith. 1995. "Identifying strategic groups in the US airline industry: an application of the Porter model." Transportation Journal: 26-34.

104
KPMG. 2013. "Airline Disclosures Handbook." Leask, Graham and David Parker. 2006. "Strategic group theory: review,
examination and application in the UK pharmaceutical industry." Journal of Management Development 25 (4): 386-408. doi: doi:10.1108/02621710610655846.
Lippman, SA and RP Rumelt. 1981. Efficiency differentials under competition: a stochastic approach to industrial organization': working paper, Graduate School of Management, UCLA.
Lorentzen, Marius. 2016. "Norwegian får fåreløpig ja på USA-søknad." E24. Accessed April 16 2016. http://e24.no/boers-og-finans/norwegian-air-shuttle/norwegian-faar-foreloepig-ja-paa-usa-soeknad/23660339.
Lufthansa Group. 2006. Lufthansa Group Annual Report 2005. https://investor-relations.lufthansagroup.com/fileadmin/downloads/en/financial-reports/annual-reports/LH-AR-2005-e.pdf.
———. 2010. Lufthansa Group Annual Report 2009. https://investor-relations.lufthansagroup.com/fileadmin/downloads/en/financial-reports/annual-reports/LH-AR-2009-e.pdf.
———. 2014. Lufthansa Group Annual Report 2013. http://investor-relations.lufthansagroup.com/fileadmin/downloads/en/financial-reports/annual-reports/LH-AR-2013-e.pdf.
———. 2015. Lufthansa Group Annual Report 2015. Edited by Lufthansa Group. http://investor-relations.lufthansagroup.com/fileadmin/downloads/en/financial-reports/annual-reports/LH-AR-2015-e.pdf.
Marketing Society. 2014. Europe by easyJet. https://www.marketingsociety.com/sites/default/files/thelibrary/easyJet.pdf.
Martín, Juan Carlos, Concepción Román and Raquel Espino. 2008. "Willingness to Pay for Airline Service Quality." Transport Reviews 28 (2): 199-217. doi: 10.1080/01441640701577007.
Martínez-Garcia, Esther, Berta Ferrer-Rosell and Germà Coenders. 2012. "Profile of business and leisure travelers on low cost carriers in Europe." Journal of Air Transport Management 20: 12-14. doi: http://dx.doi.org/10.1016/j.jairtraman.2011.09.002.
Mascarenhas, Briance and David A. Aaker. 1989. "MOBILITY BARRIERS AND STRATEGIC GROUPS." Strategic Management Journal 10 (5): 475-485.
Mason, Edward S. 1939. "Price and Production Policies of Large-Scale Enterprise." The American Economic Review 29 (1): 61-74. doi: 10.2307/1806955.
McAfee, R. Preston, Hugo M. Mialon and Michael A. Williams. 2004. "What Is a Barrier to Entry?" The American Economic Review 94 (2): 461-465.
McCartney, Scott. 2012. "How airlines spend your airfare." The Wall Street Journal.
McGee, John and Howard Thomas. 1984. "Strategic groups: a useful linkage between industry structure and strategic management?" BEBR faculty working paper; no. 1100.
———. 1986. "Strategic groups: Theory, research and taxonomy." Strategic Management Journal 7 (2): 141-160.
McNamara, Gerry M, Rebecca A Luce and George H Thompson. 2002. "Examining the effect of complexity in strategic group knowledge

105
structures on firm performance." Strategic Management Journal 23 (2): 153-170.
Miles, Raymond E, Charles C Snow, Alan D Meyer and Henry J Coleman. 1978. "Organizational strategy, structure, and process." Academy of management review 3 (3): 546-562.
Mintzberg, Henry. 1978. "Patterns in strategy formation." Management science 24 (9): 934-948.
Morley, C. L. 2003. "Globalisation, airline alliances and tourism: A strategic perspective." Asia Pacific Journal of Tourism Research.
Morris, R. 1964. The Economic Theory of Managerial Capitalism. Edited by Palgrave Macmillan: Springer.
Mouawad, Jad. 2012. "The Challenge of Starting an Airline." NY Times. http://www.nytimes.com/2012/05/26/business/start-up-airlines-face-big-obstacles.html?_r=0.
New Your University. 2006. Barriers to Entry. edited by NYU Stern Business School.
Newman, Howard H. 1978. "Strategic Groups and the Structure-Performance Relationship." The Review of Economics and Statistics 60 (3): 417-427. doi: 10.2307/1924167.
Nodeland, Richard. 2015. "Flytrafikken faller for første gang siden 2010." Fædrelandsvennen. http://www.fvn.no/okonomi/Flytrafikken-faller-for-forste-gang-siden-2010-2951746.html.
Norwegian Air Shuttle. 2015. Norwegian Q2 2015 report. ———. 2016. Our aircraft. O´Leary, Michael. 2002. Full-Service Airlines Are "Basket Cases". In
BusinessWeek Online, edited by Amy Tsao. BusinessWeek Online: Bloomberg.
OECD. 2007. "Competition and Barriers to Entry." Policy Brief January 2007. Olusoga, S. Ade, Michael P. Mokwa and Charles H. Noble. 1995. "Strategic
groups, mobility barriers, and competitive advantage: An empirical investigation." Journal of Business Research 33 (2): 153-164. doi: http://dx.doi.org/10.1016/0148-2963(94)00065-M.
Oster, Sharon. 1982. "Intraindustry structure and the ease of strategic change." The Review of Economics and Statistics: 376-383.
Peteraf, Margaret A. 1993. "Intra�industry structure and the response toward rivals." Managerial and Decision Economics 14 (6): 519-528.
Peteraf, Margaret and Mark Shanley. 1997. "Getting to know you: A theory of strategic group identity." Strategic Management Journal 18 (s 1): 165-186.
Peterson, Steve. 2010. Airlines 2020: Substitution and commoditization. IBM Institute for Business Value. http://www-935.ibm.com/services/multimedia/uk_en_airlines_2020.pdf.
Porac, Joseph F., Howard Thomas and Charles Baden-Fuller. 1989. "Competitive Groups as Cognitive Communities: The Case of Scottish Knitwear Manufacturers." Journal of Management Studies 26 (4): 397-416. doi: 10.1111/j.1467-6486.1989.tb00736.x.
Porter, Michael E. 1973. "Consumer Behavior, Retailer Power, and Manufacturing Strategy in Consumer Goods Industries." Unpublished doctoral dissertation, Harvard University.
———. 1979a. The Five Forces That Shape Industry Competition. edited by The Five Forces That Shape Industry Competition. HBR.

106
———. 1979b. "The structure within industries and companies' performance." The review of economics and statistics: 214-227.
———. 1980. "Competitive strategy: Techniques for analyzing industries and competition." New York: 300.
———. 1981. "The contributions of industrial organization to strategic management." Academy of management review 6 (4): 609-620.
———. 1985. Competitive Advantage: Creating and Sustaining Superior Performance: Free Press. https://books.google.no/books?id=H9ReAijCK8cC.
———. 1996. "What is strategy?" Harvard Business Review. ———. 2008. "The five competitive forces that shape strategy." Press Association. 2010. "BA and Iberia agree £5bn merger." The Guardian.
https://www.theguardian.com/business/2010/nov/29/british-airways-iberia-agree-merger.
Primeaux, Walter. 1983. A Method for Determining Strategic Groups and Life Cycle Stages of an industry. University of Illinois: University of Illinois.
PwC. 2013. Aviation Finance. http://www.pwc.com. ———. 2015. Tailwinds: 2015 airline industry trends. Tailwinds.
http://www.pwc.com/us/en/industrial-products/publications/assets/pwc-tailwinds-rising-passenger-demand.pdf.
———. 2015 "2015 Aviation Trends". http://www.strategyand.pwc.com/perspectives/2015-aviation-trends.
Reger, Rhonda K and Anne Sigismund Huff. 1993. "Strategic groups: A cognitive perspective." Strategic Management Journal 14 (2): 103-123.
Rhoades, Stephen A. 1993. "Herfindahl-Hirschman index, the." Fed. Res. Bull. 79: 188.
Roland Berger. 2015. Aviation Rader 2015. Düsseldord/Paris: Roland Berger. http://www.rolandberger.com/media/pdf/Roland_Berger_Aviation_Radar_2015_20151002.pdf.
Ryanair. 2015. "Environmental Social Report FY2015." Investor relations. ———. 2016a. Annual report 2015. https://investor.ryanair.com/wp-
content/uploads/2015/07/Annual-Report-2015.pdf. ———. 2016b. Cheap flight destinations. ———. 2016c. Our fleet. ———. 2016d. Ryanair Annual Report 2015. http://investor.ryanair.com. Ryans, A. B. and D. R. Wittink. 1985. "Security returns as a basis for estimating
the competitive structure in an industry." Strategic Management Journal: 359-369.
SAS. 2015. SAS Go Light – for those who travel light. ———. 2016. SAS medium/short haul. edited by SAS: FlySAS. Saunders, Mark , Philip Lewis and Adrian Thornhill. 2012. Research methods for
business students, 6/e: Pearson Education India. Serusi, Marco. 2016. "Ryanair has a Great Brand. What is the Secret to its
Success?". http://simpliflying.com/2014/ryanair-branding-success-customer-perception/.
Shuttle, Norwegian Air. 2016. "Route Map" Accessed March 31 2016. http://www.virtualnorwegian.net/destinations/.
Skytrax. 2016. "The world's top 100 airlines in 2015". http://www.worldairlineawards.com/Awards/world_airline_rating.html.
Smith, Ken G., Curtis M. Grimm, Greg Young and Stefan Wally. 1997. "STRATEGIC GROUPS AND RIVALROUS FIRM BEHAVIOR:

107
TOWARDS A RECONCILIATION." Strategic Management Journal 18 (2): 149-157. doi: 10.1002/(SICI)1097-0266(199702)18:2<149::AID-SMJ854>3.0.CO;2-O.
Southwest Airlines. 2016. Forth Quarter Press Release 2015. Spencer, Barbara, Joseph Peyrefitte and Richard Churchman. 2003. "Consensus
and divergence in perceptions of cognitive strategic groups: Evidence from the health care industry." Strategic Organization 1 (2): 203-230.
Statista. 2016. "Annual growth in global air traffic passenger demand from 2005 to 2015" Accessed March 13 2016. http://www.statista.com/statistics/193533/growth-of-global-air-traffic-passenger-demand/.
Steer Davies Gleave. 2012. Price transparency provisions in Regulation 1008/2008 and other relevant EU legal texts: European Commission. http://ec.europa.eu/transport/modes/air/studies/doc/internal_market/final_report_price_transparency.pdf.
Stigler, George. 1968. "Barriers to Entry, Economies of Scale and Firm Size." In The Organization of Industry, George Stigler, 67-70.
Stigler, George J. 1964. "A Theory of Oligopoly." Journal of Political Economy 72 (1): 44-61.
Tan, Kerry M. 2015. "Incumbent Response to Entry by Low�Cost Carriers in the US Airline Industry." Southern Economic Journal.
Telegraph. 2008. "Financial crisis forces cuts in business travel." Telegraph. http://www.telegraph.co.uk/travel/travelnews/3235079/Financial-crisis-forces-cuts-in-business-travel.html.
Tellis, Winston M. 1997. "Application of a case study methodology." The qualitative report 3 (3): 1-19.
The Boeing Company. 2016a. Annual Report 2015. http://s2.q4cdn.com/661678649/files/doc_financials/annual/2015/2015-Annual-Report.pdf.
———. 2016b. "Orders and Deliveries". http://www.boeing.com/commercial/ - /orders-deliveries.
The Committee on Climate Change. 2009. "Meeting the UK Aviation target – options for reducing emissions to 2050."
The Economist. 2015. "High Speed Rail in Europe - Problems Down the Line" Accessed April 19 2016. http://www.economist.com/news/business/21638109-high-speed-networks-are-spreading-fast-face-rising-competition-problems-down-line.
Thomas, Howard and Niloufer Venkatraman. 1988. "Research On Strategic Groups: Progress And Prognosis [1]." Journal of Management Studies 25 (6): 537-555.
Tinnus, Florian. 2015. European business travel and expense analysis. Amadeus. http://www.amadeus.com/web/binaries/1333095678090/blobheader=application/pdf&blobheadername1=Content-Disposition&blobheadervalue1=inline%3B+filename%3D2015-European-business-travel-and-expense-analysis.pdf.
U.S. Department of Justice. 2015. "HERFINDAHL-HIRSCHMAN INDEX". U.S. Department of Justice. http://www.justice.gov/atr/herfindahl-hirschman-index.
UIC. 2016. "High Speed". International Union of Railways. http://www.uic.org/highspeed.

108
Voorhees, Clay M, Ryan C White, Michael McCall and Praneet Randhawa. 2015. "Fool’s Gold? Assessing the Impact of the Value of Airline Loyalty Programs on Brand Equity Perceptions and Share of Wallet." Cornell Hospitality Quarterly 56 (2): 202-212.
Williams, George. 2001. "Will Europe's charter carriers be replaced by “no-frills” scheduled airlines?" Journal of Air Transport Management 7 (5): 277-286.
Williamson, John. 1966. "Profit, growth and sales maximization." Economica: 1-16.
Williamson, Oliver E. 1963. "Managerial discretion and business behavior." The American Economic Review: 1032-1057.
Willis, Ben. 2014. "The Advantages and Limitations of Single Case Study Analysis".
World Finance. 2015. "Is European airline consolidation ready for takeoff?". Yin, Robert K.. 1994. Case study research. Design and methods. Edited by
Thousand Oaks: Sage. ———. 2003. Case study research: Design and methods: Sage. ———. 2011. Applications of case study research: Sage.

Preliminary Thesis Report GRA1952 15.01.2016
109
ID number: 0926454
0962082
The influence of industry structure on overall firm
performance in strategic groups? – A longitudinal
study of the European airline industry
Hand-in date:
15.01.2016
Campus:
BI Oslo
Examination code and name:
GRA1952 Preliminary Thesis Report
Programme:
Master of Science in Business and Economics – Major in Strategy
Supervisor
T. Bihn Phan

Preliminary Thesis Report GRA1952 15.01.2016
110
Content Executivesummary 111
1.0Introduction 112
2.0ResearchStatement 113
2.1ResearchQuestion 115
2.2Objectives 115
2.3ContributionofOurResearch 115
3.0IndustryOverview 116
4.0LiteratureReview 118
4.1IntroductiontoIndustrialOrganization 118
4.2BarrierstoEntry 119
4.3BarrierstoMobility 120
4.4StrategicGroups 120
4.5MergersandAcquisitions 123
5.0Methodology 124
5.1ResearchDesign 124
5.2StatisticalModels 125
5.3SecondaryData 125
5.4ResearchApproach 126
6.0Limitations 127
7.0ThesisProgression 127
References 128

Preliminary Thesis Report GRA1952 15.01.2016
111
Executive summary The purpose of the preliminary thesis report is mainly to give an introduction of
the topic as well as presenting what we aim to accomplish. The preliminary thesis
also includes a progression plan for the following stages of the thesis. The topic of
this thesis is the European airline industry and how its changes in structure
influences performance of firms. By changes in industry structure we refer to
mergers, acquisitions and membership changes in strategic alliances. By
performance we refer to economic performance of individual firms. The airline
industry has gone through large structural changes in this period due to
deregulations and liberalizations, resulting in the emergence and growth of low
cost carriers as well as a high level of consolidation in most regions. The industry
is a highly competitive industry categorized by low margins, which we believe
makes the correlation between industry structure and performance an interesting
and relevant topic. Our research question will be the following:
“How does changes in industry structure influence overall firm
performance in strategic groups? – A longitudinal study of the
European airline industry”
To best answer this question, we will apply theory from Industrial Organization
(IO), looking mainly at theory concerning industry structure, strategic groups,
barriers to entry/mobility and M&A literature. We will conduct a longitudinal
study with a quantitative approach, using secondary data from a period over 20
years. The data will be collected using various international databases.
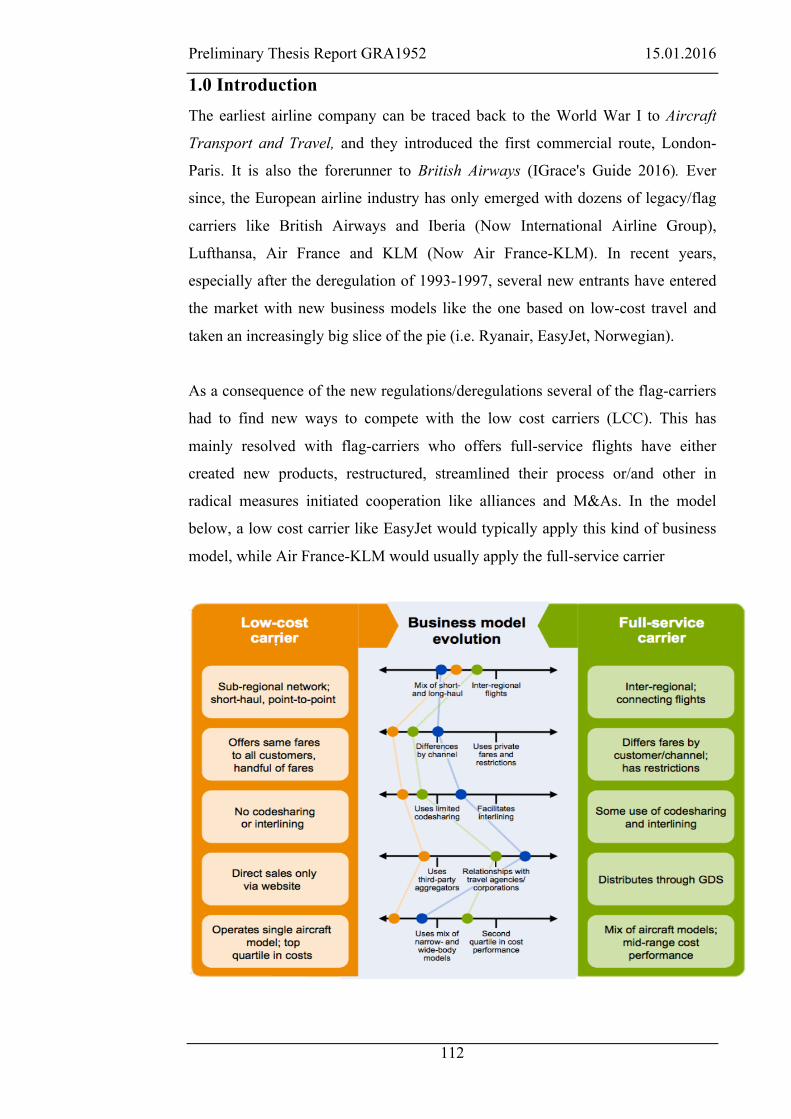
Preliminary Thesis Report GRA1952 15.01.2016
112
1.0 Introduction The earliest airline company can be traced back to the World War I to Aircraft
Transport and Travel, and they introduced the first commercial route, London-
Paris. It is also the forerunner to British Airways (IGrace's Guide 2016). Ever
since, the European airline industry has only emerged with dozens of legacy/flag
carriers like British Airways and Iberia (Now International Airline Group),
Lufthansa, Air France and KLM (Now Air France-KLM). In recent years,
especially after the deregulation of 1993-1997, several new entrants have entered
the market with new business models like the one based on low-cost travel and
taken an increasingly big slice of the pie (i.e. Ryanair, EasyJet, Norwegian).
As a consequence of the new regulations/deregulations several of the flag-carriers
had to find new ways to compete with the low cost carriers (LCC). This has
mainly resolved with flag-carriers who offers full-service flights have either
created new products, restructured, streamlined their process or/and other in
radical measures initiated cooperation like alliances and M&As. In the model
below, a low cost carrier like EasyJet would typically apply this kind of business
model, while Air France-KLM would usually apply the full-service carrier

Preliminary Thesis Report GRA1952 15.01.2016
113
These two business models have been the most widely recognized ones.
Reichmuth (2008) further explained additional business models known as Holiday
Carriers (Charter airlines – Ving, Apollo and similar), Regional Carriers
(Commuter airline which restrict their flights route to a limited area – HOP!, Brit
Air, Widerøe and similar), Freight Carriers (Transportation of cargo – Cargolux
and similar), Integrators (selling excess transportation capacity - TNT, DHL, and
similar). It is also worth noting that traditional full-service carriers like British
Airways, Lufthansa and Air France have diversified into cargo transportation and
from a top management perspective developed a hybrid business model
(Reichmuth 2008). With the aforementioned in mind, the consolidations and
changes (regulations) have affected the industry, may be perceived as two
competing interests. Consolidations have obviously given new conglomerates in
the airline industry more power making it harder for new and existing firms,
which are smaller, to enter the respective market. On the other hand, deregulations
have made it easier for airlines to enter different segment of the airline industry
market, making room for new business models hence new strategic groups. Earlier
research in this topic, industry structure in the airline industry, have mainly
focused on grouping airlines together based on their financial performance in
terms of stocks, ROA and ROE, managerial decisions or in the US Airline
industry (Ryans and Wittink 1985; Smith et al. 1991; Kling and Smith 1995; Kole
and Lehn 1999). Based on the above, we believe that there is a gap in the
literature which needs more attention and the link between strategic groups and its
changes through M&As in the European airline industry, must be further
investigated.
2.0 Research Statement The aim of this study is to examine the changes in the industry and the changes on
performance in European airlines and customer surplus, in terms of routes and
fares. The aviation industry is a highly competitive industry, with huge scale
advantages and large entry and exit barriers. It is therefore crucial to examine the
structure in the industry, in order to explore the performance of the strategic group
that they are members off. The study further wants to explore the underlying
reason of why some airline companies have moved from being full-service
carriers and into low-cost carriers, and to which degree the opposite occur. These

Preliminary Thesis Report GRA1952 15.01.2016
114
are some of the questions we want to elaborate on and see if they can be
answered.
As a basis for our framework we will apply Bain’s Structure-Conduct-
Performance paradigm (Bain 1968; Barney and Ouchi 1986) that will be
explained more thoroughly in the literary review.
Figure 1: SCD paradigm (Bain 1968)
Our hypothesis suggests that the characterization of the industry, or more
precisely specific section of the industry will affect firm’s decisions, which again
will affect their economic performance, in terms of profitability. The independent
variables studied will be related to the industry structure and the strategic groups
in which the various firms can be categorized as being a member of. By looking at
each merger, and comparing merging and non-merging firms we aim to get a
better understanding of the structural change, or consolidation in the industry.
Dependent variables are related to the firm’s strategic decisions influenced by the
merger, and the economic performance after the merger.
Independent variables:
• Changes in structure o M&A within the industry
Dependent variables:
• Conduct / Strategic decisions o quality, price, capacity, advertising and similar
• Performance o Annual economic result
Structure Conduct Performance
M&A
Quality
Price
Routes
Economic Performance

Preliminary Thesis Report GRA1952 15.01.2016
115
2.1 Research Question
This leads us to our main research question, which is the following:
“How does changes in industry structure influence overall firm
performance in strategic groups? – A longitudinal study of the European airline
industry”
2.2 Objectives
In order to answer the research-question several sub-questions must be processed
and answered. We have therefore outlined the intended process of study and
identified three measurements that we believe will fully answer our research
question. These steps can be referred to as the following:
Routes
• Compare the number of routes offered by a merged entity after a
merger/acquisition compared to the routes offered by the two separate
entities prior to the merger. Control for the average market increase or
decrease in routes offered.
Prices
• Compare changes in prices offered by a merged entity after a
merger/acquisition compared to the prices of the two separate entities
prior to the merger. Control for the average change in prices in the market.
Performance
• Examine the profitability of a merged entity in the 5-8 years after a
merger/acquisition compared to the profitability of the two separate
entities prior to the merger. Control for total market performance and
factors affecting firm performance not connected to the merger.
2.3 Contribution of Our Research
With this paper, we hope to contribute to a better understanding of IO and its
concept of strategic groups interaction in a complex industry like the European
airline industry. As aforementioned, through our research objective we will get a
better understanding of the interlinks of the strategic groups in the airline industry.

Preliminary Thesis Report GRA1952 15.01.2016
116
3.0 Industry Overview The aviation industry is a broad term, but it is mainly referred to as: air
passengers; air transport movements; and air cargo. The aviation industry has
throughout its history has had its main objective to transport people and goods, in
order to facilitate tourism, economic growth, international investment and
therefore also stimulate globalization. Aviation connects the world! In terms of
the airline industry, hence the air passengers, it has also helped governments,
especially in developing countries, to realise the benefits of tourism to their
national economics (Stanford 2016). Also, the segment of business passengers has
also increased significantly as businesses have become more international as trade
and business have become globalized. It is therefore a strong correlation between
the world economic growth and growth in the airline industry.
Since the 1980s the industry has faced several major trends, although airline
consolidation and establishment of low cost-carriers may have been the two most
important ones, along the regulations/deregulations of the airline industry in
Europe. This is a result mainly due to the market liberalisation of the intra-EU air
services that came into force in the period of 1993 to 1997, allowing airlines to
operate between any airport hub in the European Union (ELFAA 2004). The
aftermath of the liberalisation led for instance to Ryanair’s entry into to the low
cost segment, taking advantage of the new European regulatory environment.
Furthermore, EasyJet and more recently Norwegian Air Shuttle have also applied
similar business models successfully (Cool and Schendel 1987; Cool and
Schendel 1988). In addition, flag carriers and legacy carriers have had to change
their business model, enter into alliances or/and acquire or merge with other
airlines. In recent years we have been witness to European M&As between British
Airways and Iberia forming International Airlines Group, the Air France
acquisition of KLM creating Air France KLM and Lufthansa with their
acquisition of Austrian Airlines and Germanwings among others (Bonova, Koska
and Specker 2009; British Airways 2011). The European airline industry have
also been subject for several alliances whose purpose is to gather the synergies of
cost reduction, more lean travels, lounges, customer programmes etc. Today there
are 3 major alliances, Skyteam, Star Alliance and OneWorld creating alliances
throughout all continents, carrying 665m; 641m; and 513m passengers annually,
respectively (Skyteam 2016; Star Alliance 2015; Oneworld 2016).

Preliminary Thesis Report GRA1952 15.01.2016
117
As of 2013 it was reported by the Airports Council International (ACI) (2015) that
over 6.3 billion passengers passed through its 1989 member airports, a year-on-
year increase on 9.7% from 2012. Ranking the passenger throughput by
continents, it is distributed with the following: Africa – 165.5m; Asia Pacific –
2060.1m; Europe – 1730.21m; Latin America – 501.2m; Middle East – 278.5m;
and North America – 1570.m (Airport Council International 2015). As it is highly
acknowledging that the major economies are still recovering, the air travel grew in
2013, especially in the second part of 2013 as the air transportation regained its
traction.
Historically, based on data between 2000-2013 from ACI (2015), the North
American market was by far the biggest market with a market share of 42% while
Europe, Asia and the rest of the world commanded 29%, 19% and 10%
respectively. However, today the Asian market have taken a large share of the
total market share and has now a market share of 33% in 2013, with Europe and
USA trailing behind with 27% and 25% respectively.
The key driver for growth in the industry in terms of air cargo, passenger travel
and air traffic growth is namely the economical growth. This is further evident
with the correlation between market share from the Asia and the general economic
growth, and this is also similar with the other markets and its economical growth
(Airport Council International 2015). It can therefore justify the growth or decline
in the markets. Nevertheless, by placing this trend in a historical context it is
easily spotted that external events like September 11th 2011, the SARS epidemic,
the global economic crisis in 2008 and the “Arab Spring” have a huge impact on
the industry. Contextual factors also play a major role in the stimulation of growth
or decline in the industry, like airport congestion and capacity; stimulation from
low cost carriers; market maturity; regulations and policies; and as well as pricing
schemes and (Airport Council International 2015; Dron 2016). In the latter years
European competition policies have mainly been the most important factor of the
M&As and Alliances with Article 102 TFEU, which refers to avoiding cartels and
price competition (Commission 2016). It is therefore very compelling to further
investigate the strategic changes in the airline industry over the last 20 years in

Preliminary Thesis Report GRA1952 15.01.2016
118
order to examine if the M&As and Alliances have had an positive economic effect
on the respective airlines.
4.0 Literature Review 4.1 Introduction to Industrial Organization
The field of industrial organization (IO) can be traced within microeconomics,
along with Chamberlinian economics and Schumpeterian economics, all the way
back to Adam Smith´s conceptual work “The Wealth of Nations” (1776). The
initial theory of IO was defined by (Bain 1956, 1968) and Mason (1939) who
grounded the model of competition in which the market structure determined the
performance, hence the return of the firms (Barney and Ouchi 1986). Market
structure refers to specific and stable characteristics that influences a firm´s
conduct (Caves 1992). In addition of the concept of “barriers” were developed,
which serves as the key attribute to the industry structure (Bain 1968, 1956) and
(Mason 1939).
These characteristics of the “industry structure” includes barriers to entry and exit,
number and size of buyers and sellers, product differentiation and similar (Caves
and Porter 1977). A firm´s perception of barriers to entry, hence the top managers
perceptions, may also serve as a barrier to entry as it influence the strategic choice
of entering or not (Caves 1992). Bain and Mason´s contribution of the relation
between structural characteristics and industry, hence firm performance, have later
been dubbed as the structure, conduct and performance paradigm (SCP) (Bain
1968; Barney and Ouchi 1986). The reasoning behind the SCP-paradigm is that
industry structure determined the conduct in which the collective conduct
determined the industry performance:
• Structure: In the latter years Caves and Porter (1977) and Porter (1980)
have extended the concept of structure with the number and size of firms,
product differentiation as well as the overall elasticity of demand.
Therefore, with these characteristics present industries are
symptomatically created by firms with higher and better performance than
other firms in industries without these attributes (Porter 1981; Barney and
Ouchi 1986)
• Conduct: This refers to the key decision the firms take, such as quality,
price, capacity, advertising and similar (Porter 1981).

Preliminary Thesis Report GRA1952 15.01.2016
119
• Performance: This is broadly defined as the profitability, cost
minimization or/and innovativeness (Porter 1981).
Interestingly, IO was initially developed as a framework to aid the government
and policy makers to formulate economic policy, as they could determine which
industries that would have a performance higher and better than the socially and
competitive level (Hirshleifer 1984). With this understanding the industry and its
structure, the policy makers had to establish regulations/deregulations for the
industries in order to create socially optimal levels of competition (Barney and
Ouchi 1986). Although, the model was created with the best intention of
increasing the welfare and stimulate competition, it has been turned upside down
and strategy and finance theorists rather use this model to locate industries where
the investment has a higher return than normal (Porter 1980; Barney and Ouchi
1986).
IO and in particular the SCP-paradigm have also gained some critics. As
explained, the industry structure is the major determinant for firm performance,
and this therefore suggest a minimal influence on firm performance (Hoskisson
and Hitt 1990). Firms would instead of diversify excess resources rather lease
them. Consequently, Penrose (1959) has on the other hand suggested that limited
diversification, hence in the IO/Strategic group view, would yield economies of
scope and lower cost – more value/better firm performance. It is further argued
that these excess resources are used to additional specialization on particular
products and that the resources may not be used for other value creating activities
(Hoskisson and Hitt 1990).
4.2 Barriers to Entry
Narrowing in further, one of the key concepts of IOs as aforementioned is the
barriers to entry. Bain (1956) first defined “barriers to entry” as anything that
allows incumbent firms to earn supernormal profits without threat of entry. These
can be both barriers associated with the respective industry, like high capital
outputs, economies of scale and government regulations, and also barriers created
and managed by the incumbent firms operating in the industry to keep entrants
out, like vertical integration, advertisement, predatory pricing and customer
loyalty.

Preliminary Thesis Report GRA1952 15.01.2016
120
Although, the concept of industrial organization in strategic management is highly
respected and acknowledged it has received critics for its treatment of entry
barriers. For instance Geroski (1995) finds evidence that, the common notion of
barriers to entry due to price, is misunderstood and that incumbents do not usually
use price to block entry. As the framework of entry barriers are dependent on the
limit price theorem, it is a major flaw in the IO framework and therefore also the
barriers to entry (Caves and Porter 1977).
It is also argued that since firms in the same industry are operating under strategic
homogeneity, meaning that the products are similar but not perfect substitutes,
phenomenon like diversification would be limited (Hoskisson and Hitt 1990).
This due to the narrow leeway to act by the firms.
4.3 Barriers to Mobility
Entrants as defined by Bain (1956) were limited to firms going from zero output
to positive output. Caves and Porter (1977) suggested that also going/incumbent
firms experience certain barriers when moving to another group within an industry
or between industries. They introduced the term mobility barriers, including entry
barriers, exit barriers and barriers between groups. Going firms are likely to have
more resources than new entrants, giving them a financial advantage over firms
going from zero output. However, there are numerous factors to be considered
before entering a strategic group. Caves and Porter lists six elements to be
considered by an entrant when making the investment decision: (1) the rents
presently earned by the market's occupants; (2) the static or structural entry
barriers identified by Bain; (3) the incumbents' expected reactions to entry; (4)
other members of the queue of potential entrants, and their likely behaviour; (5)
any relevant resources already in the hands of the entrant; and (6) the irreversible
costs of gathering information and making the decision.
4.4 Strategic Groups
Within an industry certain firms will have more common characteristics than
others, often characteristics of strategy and resources (Hatten and Hatten 1987).
These can be categorized into strategic groups (Hunt 1972; Porter 1979).
Although no formal definition of “strategic groups” has been commonly accepted,
the term is used on a group of firms within the same industry making similar

Preliminary Thesis Report GRA1952 15.01.2016
121
decisions in key areas (Porter 1980, 129) or firms within the same industry
following the same strategy and with similar resources, hence same business
model (Hatten and Hatten 1987). In addition to the structural barriers (Bain 1956)
associated with the industry and industry segment he referrers to static barriers
created by the firms in the group to protect their interests against entrants. Porter
links structure within industry to firm performance. Since then a wide body of
research has been conducted on strategic groups, and research shows
controversies about whether strategic groups exist at all, and whether firm
performance depends upon strategic group membership (Barney and Hoskisson
1990). Also other studies have raised criticism against the lack of empirical
evidence. One perspective proposes that a strategic group exists if the
performance of a firm in the group is a function of group characteristics (Dranove,
Peteraf and Shanley 1998). So while firms with similar strategy and resources can
manage barriers as a managerial tool to protect their competitive position against
entrants, the identification of strategic groups can also be an analytical tool.
Porter identified three “generic” competitive strategies, namely cost leadership,
differentiation and focus, namely:
• Companies pursuing a Cost leadership strategy seek to outperform
competitors by producing goods or services at a lower cost, by offering in
some cases just the core product, to be able to out price competitors with a
higher cost structure. This may be associated with the aforementioned
limit price-theorem. In the airline industry we have seen the emergence of
a new group in the recent decade as a result of the deregulation and
liberalization of the industry. Starting with Southwest Airlines in the US,
several low cost carriers (LCCs) have popped up also in Europe and with a
rapid market share expansion this strategic group exceeded legacy carriers
for the first time in 2012 in terms of per cent of seats available (Coface
Group Economists in Paris 2014). Low cost carriers are airlines pursing a
cost leadership strategy, typically charging extra for most services.
• A differentiation strategy involves providing services that are perceived by
customers as being unique, and that they are willing to pay extra for. This
creates more loyal customers compared to a cost leadership strategy,
because their purchase decision is based on quality rather than price. In the
airline industry, this segment is best showing in the business and first class

Preliminary Thesis Report GRA1952 15.01.2016
122
segments, where legacy carriers are making large efforts to be perceived as
being the most luxurious airline. In recent years, Middle Eastern airlines
like Qatar Airways and Etihad has been dominating the election for the
world’s best airlines, due to a ruthless focus on quality and high service,
with government funding backing them up.
• Companies pursuing a focus strategy aim for a certain customer segment,
price segment or geographical segment, tailoring their products to their
special needs. This strategy can be both pursuing low cost or
differentiation, gaining competitive advantage by specialization. The main
difference is that while a cost or differentiation strategy targets the whole
industry, a focus strategy targets a particular segment. Ryanair is an
example of an airline focusing only on a low cost strategy, stripping all but
the core product.
Moreover, in combination of the term “strategic group” as they are coined with
this term by which they are observed, meaning that it is up to one’s perception of
what a strategic group is (McGee and Thomas 1986). Porter has for instance
suggested that the relative firm size may be used as proxy for its strategic group
membership, which has also gained support from Caves and Pugel (1980). It has
also been have argued that by focusing on 2 principal areas, like manufacturing
and marketing, it is possible to create a model that can be used in a cluster-
programme and determine a strategic group by its distance (Hatten and Hatten
1987; Hatten, Schendel and Cooper 1978). Oster (1982) used a similar strategy by
using one key element from the firm’s conduct, namely the product strategy.
Thereafter, he studied the persistent differences across firms of its advertising
strategy, and assign the respective firm in its membership group after if the sales
ratio (1) under or over the industry average and (2) if it was in the bottom or top
of the industry for the year that she examined. It is also worth noting that finance
scholars have used finance theory and capital asset pricing model (CAPM) in
order to develop a framework for strategic groups (Ryans and Wittink 1985).
They argue that if the stock prices of two or more firms tend to move towards
each other, they belong to the same strategic group.
However, this definition of strategic group has received some criticism by for
instant McGee and Thomas (1986). They believe that it is one-dimensional as
Porter concept is examined from the supply side. It is further argued that
Preliminary Thesis Report GRA1952 15.01.2016
123
generalizability of entry barriers into mobility barriers and it further encompasses
motives for the phenomenon of diversification (McGee and Thomas 1986).
Another implication is the entry of new firms into a given industry. Instead of
entry barriers, new firms will instead examine where the mobility barriers are the
lowest and move directly into the strategic group. This is done through a sequence
of initial moves in which the new entrant wants to minimize costs and risks
(McGee and Thomas 1986).
Another implications of Bainian theory of entry barriers that McGee and Thomas
(1986)suggest, is in fact the narrowness of the their in which Bain neglects
vertical integration, cross-entry and take-overs/M&As.
In conclusion of barriers and strategic groups, it suggests that that the group
model is a supply-side concept as it defines the structures within an industry while
in reality it is the conduct that is the core of this group concept (McGee and
Thomas 1986). The mobility barriers are perceived on the other hand to be
sources of isolation mechanisms which surrounds and protects the strategic
barriers (McGee and Thomas 1986).
4.5 Mergers and Acquisitions
The airline industry has a history of consolidation, both in form of M&As and
growing strategic alliances. From the commercial airline industry started in the
1930s and until the late 50s, the aviation industry has developed in technology,
size and cost to become a popular transport service. However, high regulative
barriers prevented potential competition, dampened incentives for efficient airline
operations, resulting in poor quality of service, high costs and fares, and a
worsened financial situation. This capital-intensive industry was characterized by
relatively low entry barriers compared to the high exit barriers, causing firms to
operate under low profitability or even deficit.
In the 70s a number of deregulation acts around the world were posed, with the
purpose to remove government control over fares, routes and market entry of new
airlines from commercial aviation. This lowered the barriers to entry, attracting a
high number of new players. Between 1978 and 86 more than 200 new airlines
were created, of which 160 were merged or closed in the same time. This

Preliminary Thesis Report GRA1952 15.01.2016
124
consolidation has resulted in price wars and a downward pressure on fares,
causing a slow decline in fares since. The service level, security and load factor
has increased. We have also seen a number of other effects, like the hub and spoke
system and the emergence of low cost carriers (LCCs), strategic alliances and
open skies agreements. Mergers are also considered to be a response of these
deregulations (Kumar 2012). As mentioned, there is a strong correlation between
the world economic growth and growth in the aviation industry. This correlation,
combined with the low margins in the industry, of 2-3% in good years, makes this
an industry that is highly sensitive to periods of decline in the global economy,
like recessions.
This high level of consolidation has continued, and due to the characteristics of
the industry, we still today see a number of large mergers both in Europe and
other continents. One of the strategic motives behind a merger is to gain market
power over a hub airport that could become a profit driver (Kumar 2012). A
strategic motive for a global M&As is to combine global routes with a domestic
route network to create a global hub and spoke system. This consolidation has
received some criticism, where the main hub airports are dominated by large
airlines controlling in-hub pricing through frequent flier programs etc. Few of the
newcomers still exist. Some research also argues that further consolidation in the
European market could trigger a reduction in available routes and raised prices,
reducing customer surplus(Coface Group Economists in Paris 2014), while the
European Commission is in favour of more liberalization as a basis for developing
international aviation relations
5.0 Methodology 5.1 Research Design
Qualitative research has in the recent years gained more traction in the field of
human science, as it can get behind the numbers and examine the causes (Bryman
and Bell 2011). Quantitative method, not surprisingly, emphasizes the
quantification of data in its analysis and collection. In addition, the quantitative
method further examines the relationship between research and theory through its
deductive approach (Ghauri and Grønhaug 2010; Bryman and Bell 2011).
We will therefore conduct a quantitative approach for our study. We believe that a
quantitative approach will be beneficial as we will examine the relation between
the variables in regards of the airline industry in Europe (Saunders, Lewis and

Preliminary Thesis Report GRA1952 15.01.2016
125
Thornhill 2012, 162). We will therefore identify the relevant actors, which are
major airlines who have been faced with strategic changes like M&As,
With these respective airlines in Europe in our sample, we will examine their
financial performance, hence its profit, costs, revenue and similar, in order to
examine the strategic changes on the firm performance through relevant variables.
In order to answer our research question, we will conduct a longitudinal research
on our quantitative approach, as this will give us the capacity to analyse the
strategic changes and development over a time period of 20 years. It will also give
us the advantage of somewhat control in which we can decide which variables to
be studied or not (Saunders, Lewis and Thornhill 2012, 190-191).
5.2 Statistical Models
The models that will be used are mainly based on those in multivariate statistics.
As we will conduct a quantitative analysis with the dataset gathered to test our
hypotheses. We will therefore build a regression model that fulfil the suggested
approach of Suhr (2006) and from there conduct a confirmatory factor analysis
(CFA). The CFA is a toll that will help us analyse the relationship between the
respective variables and their underlying latent construct as suggested by Suhr
(2006) in order to test our hypotheses. We will also use a structural equation
model in order to examine any unobserved construct (Bartholomew et al. 2008;
Ghauri and Grønhaug 2010) in order for the data and the results from the
respective models to be valid and reliable. This refers to whether you have
collected data and analysed it in a coherent manner so on another occasion it will
still be consistent (Saunders, Lewis and Thornhill 2012, 192). Validity, on the
other hand, discusses whether our research in truly measure what we intend to
measure. These are two key elements that we must keep in mind at all times
throughout our research.
5.3 Secondary Data
We will use secondary data conducted and published both from internal and
external sources, hence the airlines themselves or/and public data collected either
by authorities or industry association, in addition to databases like Zephyr and
Thomson One. Examples of this kind of data are revenue, profit, employees,

Preliminary Thesis Report GRA1952 15.01.2016
126
flights, passengers per year and similar. There are several benefits of using
secondary data sources especially in combination of a longitudinal study. First and
foremost, it is the cost of time in terms of analysing large datasets especially with
the aim to examine developments of wide time horizons. Also, permanence of
data will be open for public scrutiny meaning that it is easy to trace the source as
well as serendipitous discovery of unforeseen discoveries (Saunders, Lewis and
Thornhill 2012, 318)
On the other hand, the pitfalls and disadvantages of using secondary data are
mainly linked to the dataset, as it is most likely not intended for the purpose of our
need. In addition, as we have already experienced, some of the datasets that we
have located are very costly ($1400) and also hard to access. Last, but not least it
is crucial to be aware of the quality of the secondary research as well as the
complexity.
5.4 Research Approach
1. Get familiarized with the airline industry in Europe
a. Get a comprehensive overview over the European airline industry
2. Develop a framework of relevant actors
b. Establish a framework/guidelines of which airlines to include in
our study
3. Uncover any similarities in their business model and strategies
c. Examine each and every relevant airline and their business model
and strategy in order to group them. Coding and re-coding is
therefore essential at this stage.
4. Locate relevant data
d. Locate and gather appropriate data from both external and internal
secondary sources in the relevant time period.
5. Examine and build statistical model
e. Examine the relevant data that we have gathered and build a model
for the purpose of testing the respective hypothesis.
6. Test hypotheses
a. Test our hypotheses in the model
7. Examine the result
a. Examine the results from the model and draw conclusions

Preliminary Thesis Report GRA1952 15.01.2016
127
b. Draw conclusion of the result and present drawbacks and
limitations
6.0 Limitations One of the major limitations of this research and study is the generalizability.
How will our potential findings of strategic groups and M&As in the airline
industry be transferable to other industries, especially due to its complexity? As
for now we have very limited knowledge of the airline industry and its
complexity. There are dozens of major actors spanning from labour organizations
in both European and NON-European countries to manufacturers like Boing and
Airbus who all have competing interest. It is a very complex industry. In order to
deal with this complexity, we will focus on the key actors who fulfil our
guidelines of strategic group.
We are also aware of the potential variation and misconceptions we will get from
our results through the hypotheses, and any conclusions and findings must be
presented with caution.
Last but not least, a potential challenge is the validity and reliability of our data.
As described above, we will conduct analysis with secondary data. We will most
likely not find all the data from the same source, and we must therefore apply any
model on the data with caution. In addition, the secondary data may also cause
measurement bias in terms of both intentional or deliberate distortion of data, as
well as changes in the way data were collected (Saunders, Lewis and Thornhill
2012, 322,329).
7.0 Thesis Progression
January • Hand in the preliminary master thesis before 15th of
January
• Acquire a comprehensive overview of the players in the
European airline industry
• Locate the relevant datasets and databases
• Clarify the research question

Preliminary Thesis Report GRA1952 15.01.2016
128
February • Initiate the writing of theoretical framework
• Collect the secondary data
• Evaluation of the thesis process so far - end of February
March • Continue with the theoretical framework
• Start analysing the data
• Evaluation of the thesis process so far - end of March
April • Finalize the theoretical framework - start of April
• Finalize the analysis of the data and systemize our
findings
• Write thesis
• Evaluation of the thesis process so far - end of April
May • Discuss our findings
• Write thesis
• Finish draft
• Evaluation of the draft and the thesis process - end of May
June • Start of June: hand in 1st draft for revision
• End of June: Revision and corrections
• Evaluation of the final master thesis
July • July 1st hand in final thesis
• July may also be used for time extension for the thesis
August • August may also be used for time extension for the thesis
September • September 1st: final deadline of the submission of the
thesis.
References AirportCouncilInternational.2015.AnnualAnalysesoftheEUAirTransport
Market2013.EditedbyMattMcDonald.EuropeanCommission.Bain,J.S.1956.Barrierstonewcompetition:theircharacterandconsequencesin
manufacturingindustries:HarvardUniversityPress.http://books.google.no/books?id=8QJeAAAAIAAJ.
———.1968.IndustrialOrganization.2ed:NewYork:JohnWiley&Sons.
Preliminary Thesis Report GRA1952 15.01.2016
129
Barney,J.B.andW.G.Ouchi.1986.Organizationaleconomics:Jossey-Bass.https://books.google.no/books?id=jDq3AAAAIAAJ.
Barney,JayBandRobertEHoskisson.1990."Strategicgroups:Untestedassertionsandresearchproposals."Managerialanddecisioneconomics11(3):187-198.
Bartholomew,DavidJ,FionaSteele,JaneGalbraithandIriniMoustaki.2008.Analysisofmultivariatesocialsciencedata:CRCpress.
Bonova,Lucia,DagmaraKoskaandAxelSpecker.2009."ConsolidationoftheEUairlineindustry:HowtheCommissionkeptseatbeltsfastenedinthe2009airlinemergerwave."CompetitionPolicyNewsletter3.
BritishAirways.2011.AnnaulReport2009/10.EditedbyBritishAirways.Bryman,AandEBell.2011.BusinessResearchMethod.3rdred.Oxford:Oxford.Caves,R.E.andM.E.Porter.1977."FromEntryBarrierstoMobilityBarriers:
ConjecturalDecisionsandContrivedDeterrencetoNewCompetition."TheQuarterlyJournalofEconomics91(2):241-261.doi:10.2307/1885416.
Caves,Richard.1992."Industrialorganization,corporatestrategyandstructure."InReadingsinAccountingforManagementControl,editedbyCliveEmmanuel,DavidOtleyandKennethMerchant,335-370.SpringerUS.
Caves,RichardEandThomasAPugel.1980.Intraindustrydifferencesinconductandperformance:viablestrategiesinUSmanufacturingindustries.734:NewYorkUniversity,GraduateSchoolofBusinessAdministration,SalomonBrothersCenterfortheStudyofFinancialInstitutions.
CofaceGroupEconomistsinParis.2014."EuropeanAirlines:ForcedtoChange?"PanoramaSectors.
Commission,European.2016.Antitrust-Overview.EuropeanCommission.http://ec.europa.eu/competition/antitrust/overview_en.html.
Cool,KarelO.andDanSchendel.1987."StrategicGroupFormationandPerformance:TheCaseoftheU.S.PharmaceuticalIndustry,1963–1982."ManagementScience33(9):1102-1124.doi:doi:10.1287/mnsc.33.9.1102.
Cool,KarelandDanSchendel.1988."PerformanceDifferencesAmongStrategicGroupMembers."StrategicManagementJournal9(3):207-223.
Dranove,David,MargaretPeterafandMarkShanley.1998."Dostrategicgroupsexist?Aneconomicframeworkforanalysis."StrategicManagementJournal19(11):1029-1044.
Dron,Alon.2016.RyanairbalksatproposedNorwegianTax.http://atwonline.com/government-affairs/ryanair-balks-proposed-norwegian-tax.
ELFAA.2004.LiberalisationofEuropeanAirTransport:TheBenefitsofLowFaresAirlinestoConsumers,Airports,RegionsandtheEnvironment.http://www.elfaa.com/documents/ELFAABenefitsofLFAs2004.pdf.
Geroski,P.A.1995."Whatdoweknowaboutentry?"InternationalJournalofIndustrialOrganization13(4):421-440.doi:http://dx.doi.org/10.1016/0167-7187(95)00498-X.
Ghauri,P.N.andK.Grønhaug.2010.ResearchMethodsinBusinessStudies:FinancialTimesPrenticeHall.https://books.google.no/books?id=nDRGPgAACAAJ.
Preliminary Thesis Report GRA1952 15.01.2016
130
Hatten,KennethJandMaryLouiseHatten.1987."Strategicgroups,asymmetricalmobilitybarriersandcontestability."StrategicManagementJournal8(4):329-342.
Hatten,KennethJ,DanESchendelandArnoldCCooper.1978."AstrategicmodeloftheUSbrewingindustry:1952-1971."AcademyofManagementjournal21(4):592-610.
Hirshleifer,Jack.1984.Pricetheoryandapplications:PrenticeHall.Hoskisson,RobertEandMichaelAHitt.1990."Antecedentsandperformance
outcomesofdiversification:Areviewandcritiqueoftheoreticalperspectives."Journalofmanagement16(2):461-509.
Hunt,MichaelS.1972.Competitioninthemajorhomeapplianceindustry:1960-1970:na.
IGrace'sGuide.2016."AircraftTransportandTravel."Kling,JamesAandKenASmith.1995."IdentifyingstrategicgroupsintheUS
airlineindustry:anapplicationofthePortermodel."TransportationJournal:26-34.
Kole,StaceyR.andKennethM.Lehn.1999."Deregulationandtheadaptationofgovernancestructure:thecaseoftheU.S.airlineindustry."JournalofFinancialEconomics52(1):79-117.doi:http://dx.doi.org/10.1016/S0304-405X(99)00005-7.
Kumar,B.Rajesh.2012."MergersandAcquisitionsintheAirlineIndustry."InMegaMergersandAcquisitions,226-230.PalgraveMacmillanUK.
Mason,EdwardS.1939."PriceandProductionPoliciesofLarge-ScaleEnterprise."TheAmericanEconomicReview29(1):61-74.doi:10.2307/1806955.
McGee,JohnandHowardThomas.1986."Strategicgroups:Theory,researchandtaxonomy."StrategicManagementJournal7(2):141-160.
Oneworld.2016.Oneworldatagralnce.https://www.oneworld.com/news-information/oneworld-fact-sheets/oneworld-at-a-glance.
Oster,Sharon.1982."Intraindustrystructureandtheeaseofstrategicchange."TheReviewofEconomicsandStatistics:376-383.
Penrose,Edith.1959."Thetheoryofthegrowthofthefirm."TheTheoryoftheGrowthoftheFirm.
Porter,MichaelE.1979."Howcompetitiveforcesshapestrategy."———.1980."Competitivestrategy:Techniquesforanalyzingindustriesand
competition."NewYork:300.———.1981."Thecontributionsofindustrialorganizationtostrategic
management."Academyofmanagementreview6(4):609-620.Reichmuth,Johannes.2008.AnalyseoftheEuropeanAirTransportMarket-
AirlineBusinessModels.EditedbyPeterBersteretalHansjochenEhmer.EuropeanCommission.http://ec.europa.eu/transport/modes/air/doc/abm_report_2008.pdf.
Ryans,A.B.andD.R.Wittink.1985."Securityreturnsasabasisforestimatingthecompetitivestructureinanindustry."StrategicManagementJournal:359-369.
SabreAirlineSolutions.2011.TheEvolutionoftheAirlineBusinessModel.EditedbySabreAirlineSolutions.http://www.sabreairlinesolutions.com/images/uploads/Hybrid_Model_Brochure.pdf.

Preliminary Thesis Report GRA1952 15.01.2016
131
Saunders,Mark,PhilipLewisandAdrianThornhill.2012.Researchmethodsforbusinessstudents,6/e:PearsonEducationIndia.
Skyteam.2016.FactsandFigure.http://www.skyteam.com/en/About-us/Press/Facts-and-Figures/.
Smith,KenG.,CurtisM.Grimm,MartinJ.GannonandMing-JerChen.1991."ORGANIZATIONALINFORMATIONPROCESSING,COMPETITIVERESPONSES,ANDPERFORMANCEINTHEU.S.DOMESTICAIRLINEINDUSTRY."AcademyofManagementJournal34(1):60-85.doi:10.2307/256302.
Stanford.2016.TheAirlineIndustry.EditedbyStanfordUniversity.http://adg.stanford.edu/aa241/intro/airlineindustry.html.
StarAlliance.2015."AnnualReport2015."Suhr,Diana.2006."ExploratoryorConfirmatoryFactorAnalysis?".