The Airline Industry and the World Trade Center Disaster
25
Vincent Mak prepared this case under the supervision of Professor Michael J. Enright for class discussion. This case is not intended to show effective or ineffective handling of decision or business processes. This case is part of a project funded by a teaching development grant from the University Grants Committee (UGC) of Hong Kong. © 2002 by Centre for Asian Business Cases, The University of Hong Kong. No part of this publication may be reproduced or transmitted in any form or by any means - electronic, mechanical, photocopying, recording, or otherwise (including the Internet) - without the permission of The University of Hong Kong. Ref. 02/133C 22 February, 2002 1 The Airline Industry and the World Trade Center Disaster On the morning of September 11, 2001, four passenger airplanes flying on domestic routes in the United States were hijacked by people associated with the al Qaeda network led by dissident Saudi millionaire Osama bin Laden. After taking the controls, the hijackers flew two of the planes directly into the twin towers of New York's World Trade Center, destroying both buildings. A third plane was crashed into the Pentagon, the headquarters of the US Defense Department, near Washington D.C. The fourth crashed in western Pennsylvania after passengers attempted to overpower the hijackers. Much of the world reacted with shock and horror at the spectacle of two of the world's tallest buildings, buildings in which some 50,000 people were employed, crashing to the ground with thousands of businesspeople, building employees, tourists, and rescue workers trapped inside. The death toll, which reached approximately 3,000, was the highest by far for any terrorist incident, and was several hundred higher than the attack on the US naval base at Pearl Harbour, Hawaii, which precipitated the United States' entry into the Second World War. In addition to the human, political, and military impacts, the events of September 11 also would have far-ranging economic impacts. One of the industries most affected was the airline industry, an industry that already was suffering before the attacks. In addition to losing the crews, passengers, and aircraft directly involved in the attacks, the airlines would face other losses as well. Flights within and to the United States were immediately grounded. Services would be restored only gradually. Many potential passengers decided that they did not wish to risk flying at all and cancelled their trips. Airlines soon faced mounting security and insurance costs. Some airlines would close, some would see massive layoffs, and all were faced with substantially lower profits or higher losses. As the year 2002 began, managers throughout the airline industry wondered which effects would be permanent and which would be transitory. They also wondered how they and their airlines should deal with the fallout from the attacks and the other forces that already had been reshaping the airline industry. The Airline Industry The International Civil Aviation Organization (ICAO) estimated that the world's scheduled airlines recorded operating profits of US$10.8 billion and net profits of US$3.9 billion on revenues of US$329.1 billion in the year 2000. This was after recording operating profits of US$12.3 billion and net profits of US$8.5 billion on revenues of US$305.5 billion in 1999 [see Exhibit 1]. According to the International Air Transport Association (IATA), the international portion of the business accounted for US$155.4 billion in revenues (and US$6.2 HKU189 02/22/02
-
Upload
independent -
Category
Documents
-
view
3 -
download
0
Transcript of The Airline Industry and the World Trade Center Disaster
DoNotCopy
Vincent Mak prepared this case under the supervision of Professor Michael J. Enright for class discussion. Thiscase is not intended to show effective or ineffective handling of decision or business processes.
This case is part of a project funded by a teaching development grant from the University Grants Committee(UGC) of Hong Kong.
© 2002 by Centre for Asian Business Cases, The University of Hong Kong. No part of this publication may bereproduced or transmitted in any form or by any means - electronic, mechanical, photocopying, recording, orotherwise (including the Internet) - without the permission of The University of Hong Kong.
Ref. 02/133C 22 February, 2002
1
The Airline Industry and the World Trade Center Disaster
On the morning of September 11, 2001, four passenger airplanes flying on domestic routes inthe United States were hijacked by people associated with the al Qaeda network led bydissident Saudi millionaire Osama bin Laden. After taking the controls, the hijackers flewtwo of the planes directly into the twin towers of New York's World Trade Center, destroyingboth buildings. A third plane was crashed into the Pentagon, the headquarters of the USDefense Department, near Washington D.C. The fourth crashed in western Pennsylvaniaafter passengers attempted to overpower the hijackers. Much of the world reacted with shockand horror at the spectacle of two of the world's tallest buildings, buildings in which some50,000 people were employed, crashing to the ground with thousands of businesspeople,building employees, tourists, and rescue workers trapped inside. The death toll, whichreached approximately 3,000, was the highest by far for any terrorist incident, and was severalhundred higher than the attack on the US naval base at Pearl Harbour, Hawaii, whichprecipitated the United States' entry into the Second World War.
In addition to the human, political, and military impacts, the events of September 11 alsowould have far-ranging economic impacts. One of the industries most affected was the airlineindustry, an industry that already was suffering before the attacks. In addition to losing thecrews, passengers, and aircraft directly involved in the attacks, the airlines would face otherlosses as well. Flights within and to the United States were immediately grounded. Serviceswould be restored only gradually. Many potential passengers decided that they did not wishto risk flying at all and cancelled their trips. Airlines soon faced mounting security andinsurance costs. Some airlines would close, some would see massive layoffs, and all werefaced with substantially lower profits or higher losses. As the year 2002 began, managersthroughout the airline industry wondered which effects would be permanent and which wouldbe transitory. They also wondered how they and their airlines should deal with the falloutfrom the attacks and the other forces that already had been reshaping the airline industry.
The Airline Industry
The International Civil Aviation Organization (ICAO) estimated that the world's scheduledairlines recorded operating profits of US$10.8 billion and net profits of US$3.9 billion onrevenues of US$329.1 billion in the year 2000. This was after recording operating profits ofUS$12.3 billion and net profits of US$8.5 billion on revenues of US$305.5 billion in 1999[see Exhibit 1]. According to the International Air Transport Association (IATA), theinternational portion of the business accounted for US$155.4 billion in revenues (and US$6.2
HKU18902/22/02
DoNotCopy
02/133C The Airline Industry and the World Trade Center Disaster
2
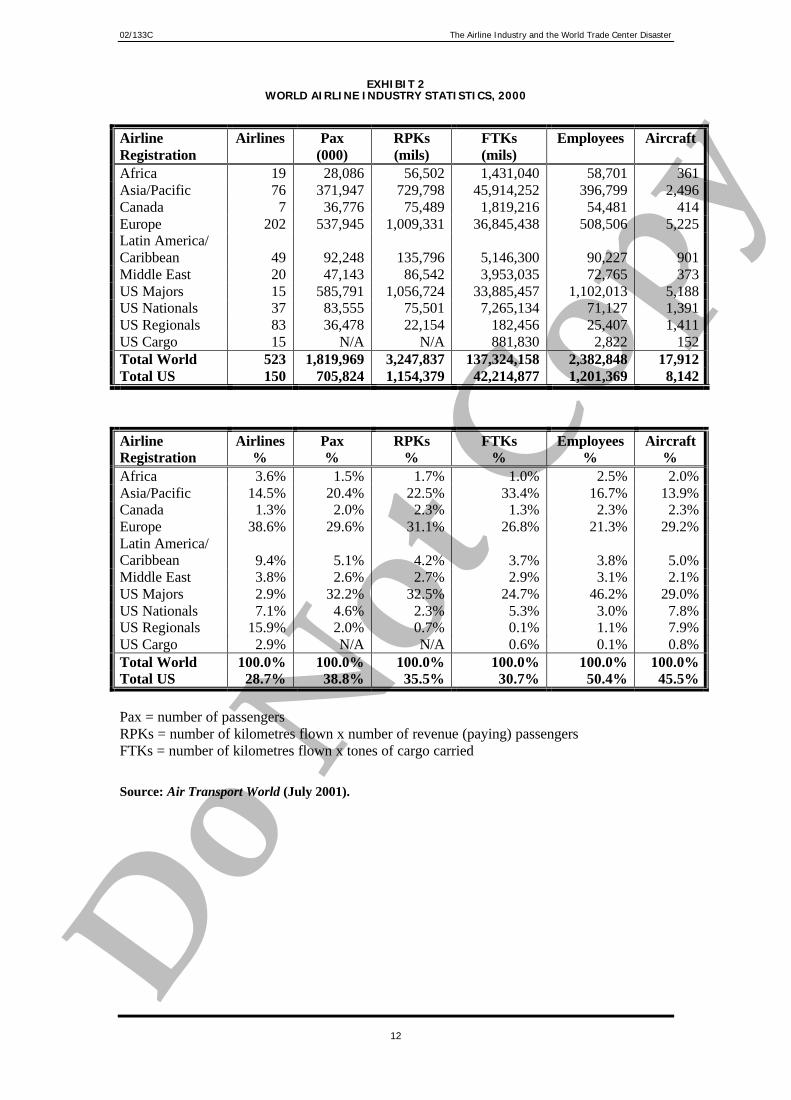
billion in operating profit) in 2000 and US$147.1 billion in revenues (and US$5.9 billion inoperating profit) in 1999. According to Air Transport World, a leading trade publication, in2000, the 523 airlines in operation around the world carried 1.8 billion passengers for 3.2trillion revenue passenger kilometres1 (RPKs) and carried cargo for 137 trillion freight tonnekilometres (FTKs), while employing nearly 2.4 million people and more than 17,900 aircraft[see Exhibit 2].
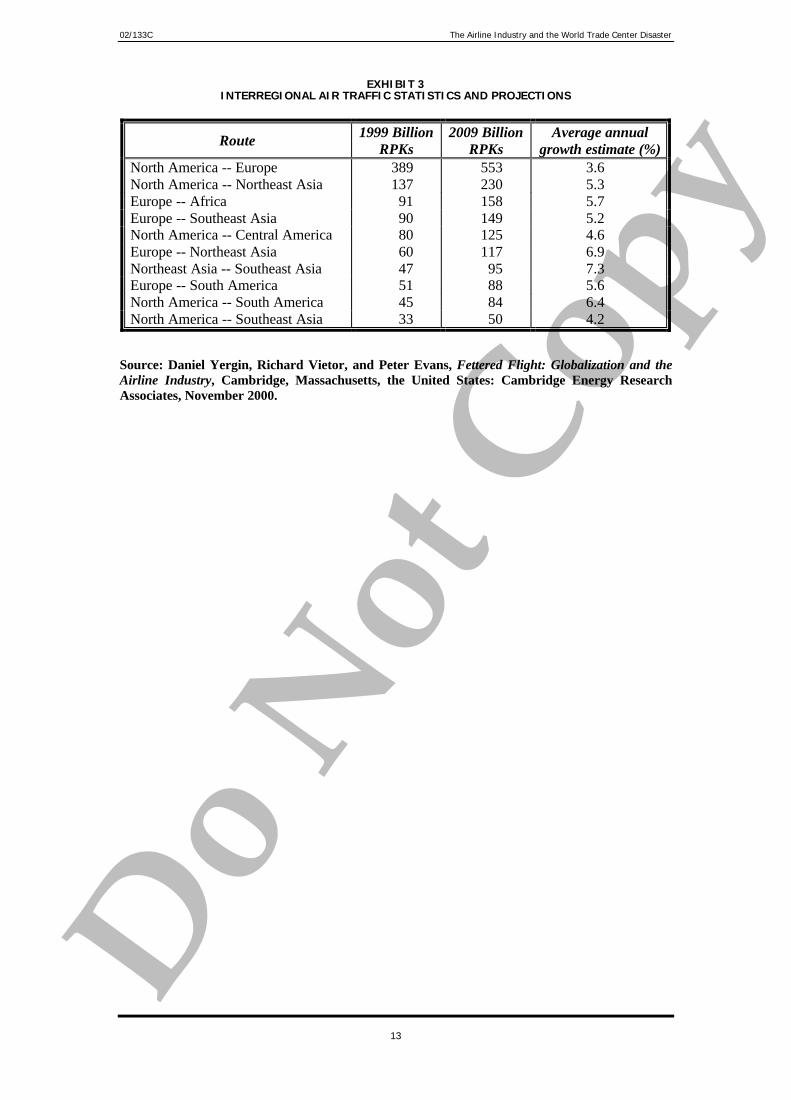
The United States was the largest single market for air transport services. United States-registered airlines accounted for 38.8 percent of all passengers, 35.5 percent of all RPKs, and30.7 percent of all FTKs in 2000. European-registered airlines accounted for 29.6 percent,31.1 percent and 26.8 percent respectively. Airlines registered in the Asia-Pacific accountedfor 20.4 percent, 22.5 percent, and 33.4 percent respectively [see Exhibit 2]. The busiestinterregional market was the North America-Europe market [see Exhibit 3], where volumehad increased by 50 percent between 1992 and 1998. The fastest-growing interregionalmarket was expected to be flights between Northeast Asia and Southeast Asia.
Although there were some airlines that were dedicated cargo carries, and freight wasbecoming increasingly important in the industry, the airline industry as a whole relied onpassenger transport for the bulk of its revenues. In 2000, for example, passenger revenuesequalled 72.2 percent of total revenues for US registered airlines, down from 76.8 percent in1990. Even so, by 2000, goods shipped by air accounted for over a third of the value of worldmerchandise trade.2
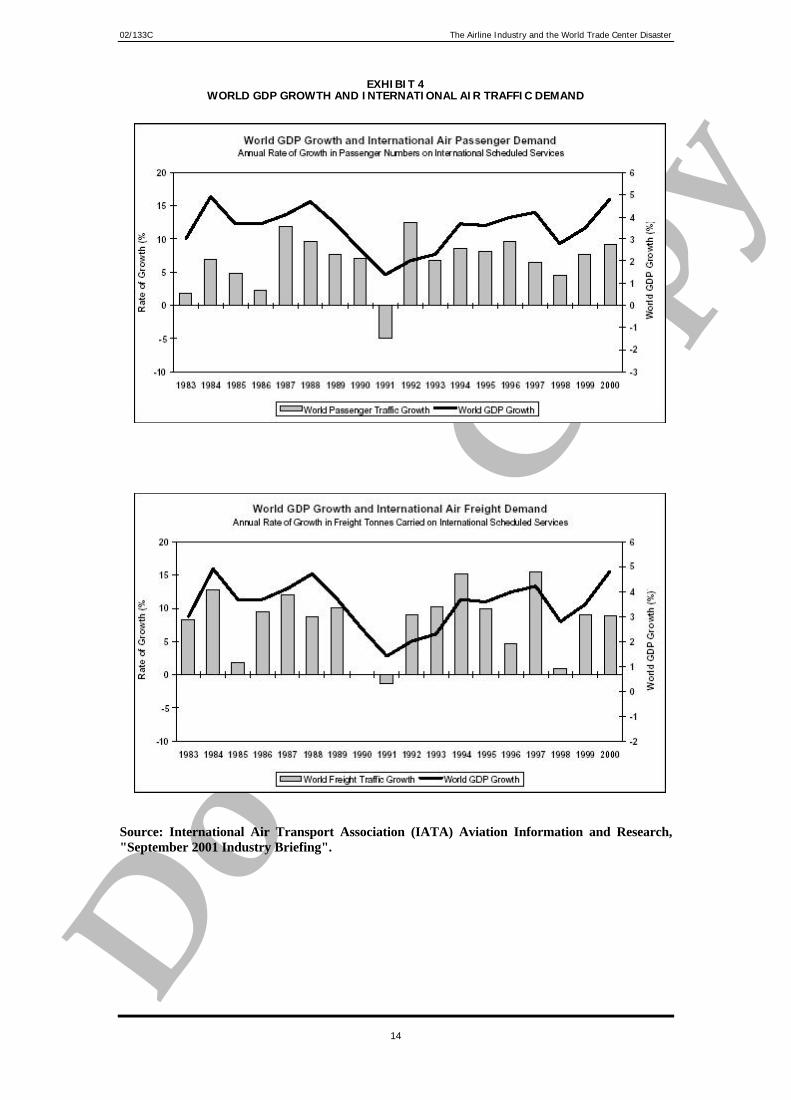
The revenues for the industry grew at a real rate of 4.7 percent in the 1980s and 2.3 percent inthe 1990s. Overall, growth in volume tended to track economic growth, especially forinternational flows [see Exhibit 4]. Demand growth tended to pick up in upturns and declinein downturns. The industry had suffered during the worldwide recession of the early 1980sbefore bouncing back in the late 1980s. During the Gulf War and the recession that followed,the global airline industry registered cumulative net losses of more than US$20 billion. Theindustry returned to profitability in the mid-1990s and registered record profits in 1997 and1999, despite the Asian Crisis, which hit business in Asia in 1997 and 1998, and despite thefact that airfares had been dropping in most markets in the late 1990s.3 However, industry-wide profits were sharply lower in 2000 as revenue increases could not offset higher costs.
Economics of the Airline Industry
Airline economics were relatively complicated. Airlines set fares to maximise revenues ontheir flights, so it often happened that, even for the same seats on the same flight, differentcustomers paid different fares because they bought their tickets through different channels atdifferent times and with different restrictions. A business traveller who needed a last-minuteflight and bought the ticket directly from the airline would pay much more than a budgettraveller buying the same ticket from a travel agent (which could be 70 percent off full price).Each airline had a "break-even load factor" at the price level set by the airline. This loadfactor, which was approximately 66 percent in the late 1990s,4 was the percentage of availableseats (or, more generally, available revenue passenger kilometres) that must be filled bypaying customers for the airline to cover its operating costs.5 Historically, the airline industry
1 RPKs = number of kilometres flown x number of revenue (paying) passengers. FTKs = number of kilometres flown x tones ofcargo carried.2 Daniel Yergin, Richard Vietor, and Peter Evans, Fettered Flight: Globalization and the Airline Industry, Cambridge,Massachusetts, the United States: Cambridge Energy Research Associates, November 2000.3 Daniel Yergin, Richard Vietor, and Peter Evans, November 2000.4 Air Transport Association (2001), "Chapter 4: Airline Economics", Airline Handbook, URL:http://www.airlines.org/public/publications/display1.asp?nid=964.5 Revenue passenger kilometres = Number of kilometres flown x number of tonnes of capacity available for the carriage ofrevenue load.
DoNotCopy
02/133C The Airline Industry and the World Trade Center Disaster
3
as a whole had operated very close to the break-even load factor and as a result generatedprofits or losses equal to a small percentage of sales.
Capital Costs
Airlines incurred significant capital costs.6 Sales required ticket offices, telephone lines andticketing systems. Training required expensive flight simulators and other equipment. Flightoperations required investments in aircraft, terminals, storage facilities, and maintenance andground equipment. Although some airlines contracted out for some services and even leasedairplanes, they still had to pay for the capital equipment one way or another.
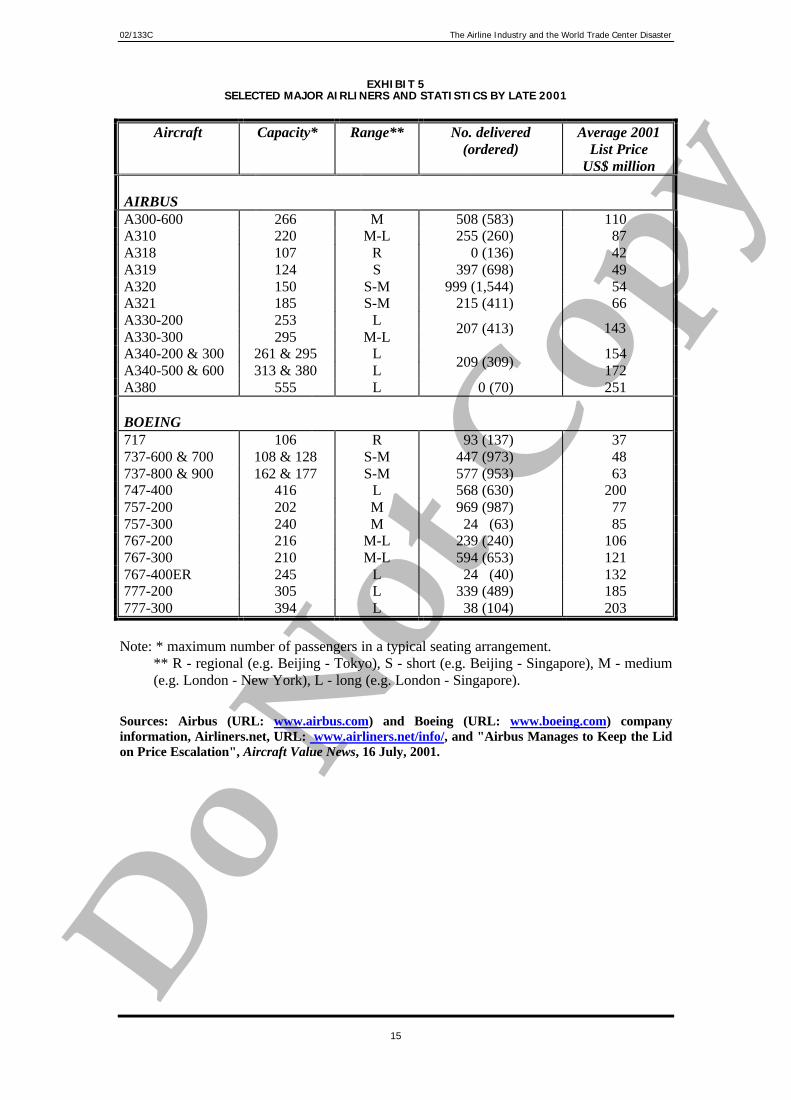
Aircraft were chosen for the length of the routes they were to fly and the number ofpassengers they were to carry. They were also chosen on the basis of price, operatingefficiency, and ease of training crew and maintaining the aircraft. In general, newer modelswere more efficient and cost less in fuel and personnel expense to operate than older models.However, planes were expensive, and an airline had to consider the financial, credit rating,and stock market (if the airline was listed) consequences before making a large order. In2001, the only two providers of larger commercial aircraft were US-based Boeing and Airbus,a European consortium financed in significant part by European governments. Exhibit 5 liststheir major products, as well as 2001 list prices. Actual prices were usually much lower thanthe list prices, and negotiations often started with a 15 to 20 percent discount.
Other Costs
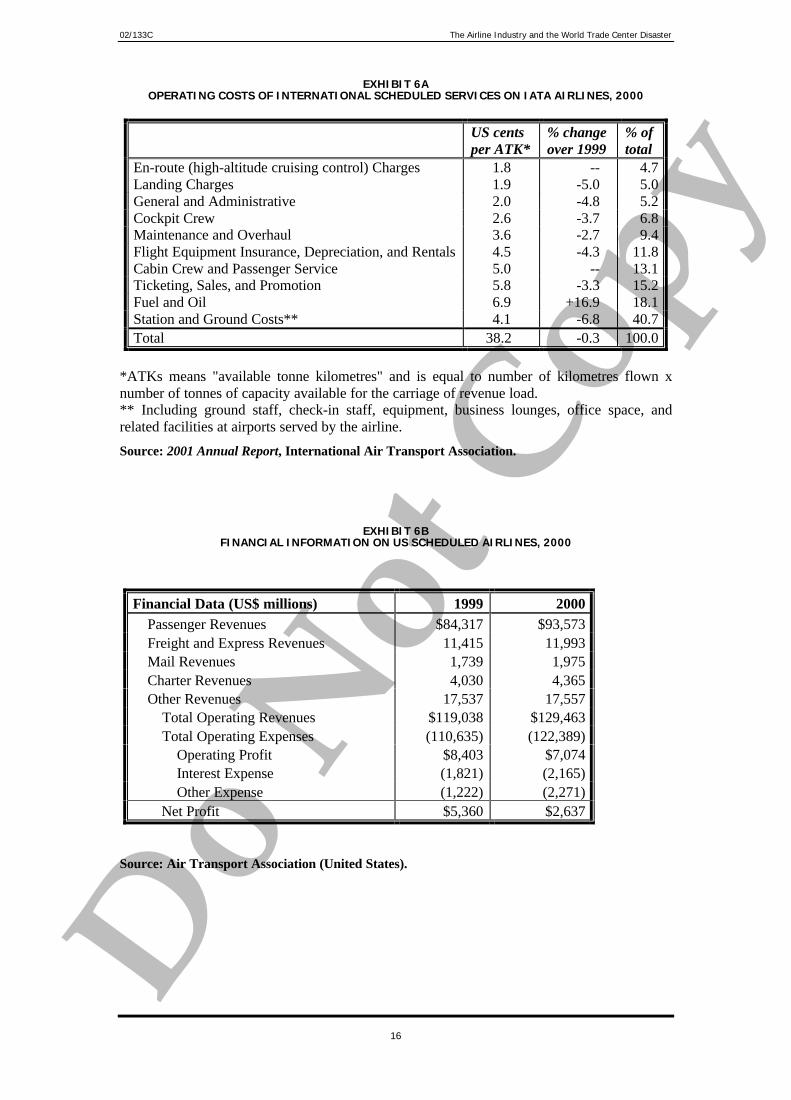
In general, operating costs could be broken down into direct and indirect items.7 The directoperating costs were dependent on the type of aircraft flown. They included cabin/flight crewsalaries and expenses, fuel, airport charges, en-route, maintenance, depreciation, aircraftrentals, and insurance. The indirect operating costs included station costs, handling,passenger services, sales/reservations, commission, advertising/promotion, general andadministration, and other items. Exhibit 6A lists the operating costs of international flights(labour cost being incorporated into several entries). Exhibit 6B lists financial information,including operating costs and other costs, for US airlines. Industry convention usuallyincluded depreciation of assets as part of operating costs.
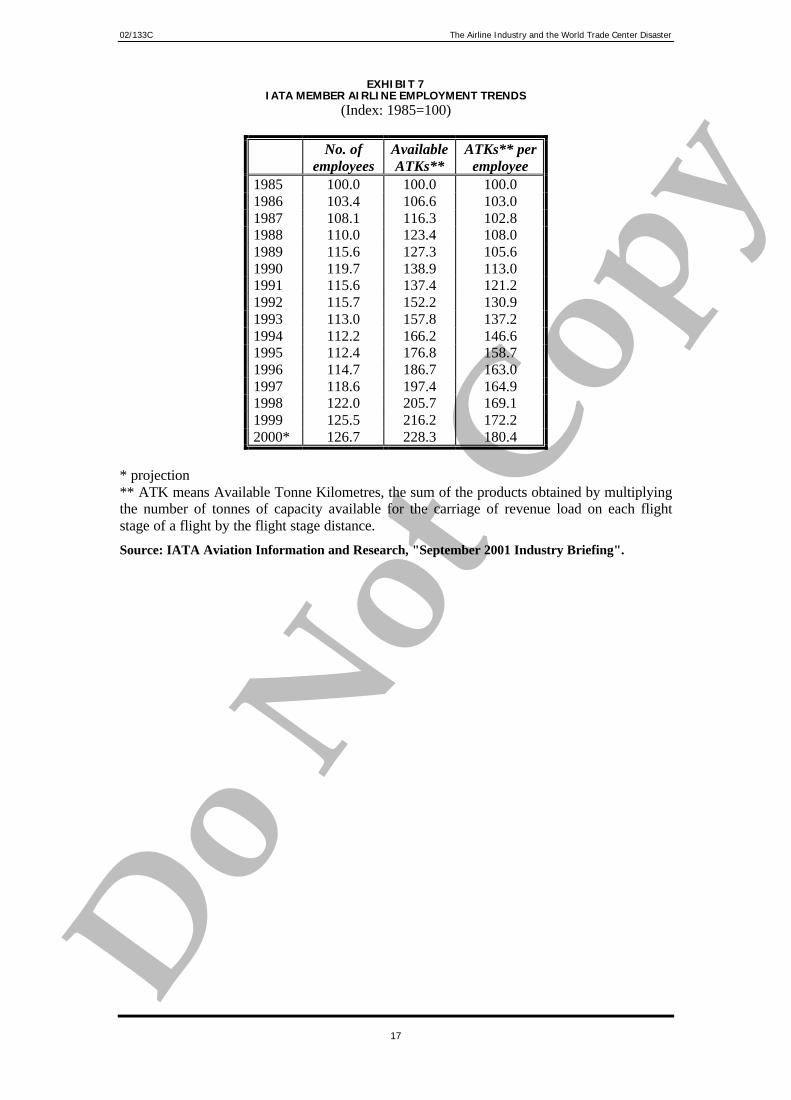
Personnel costs were a major cost component for airlines. Each major airline employednumerous pilots, flight attendants, mechanics, baggage handlers, reservation agents, gateagents, security personnel, cooks, cleaners, managers, accountants, lawyers, executives, etc.Exhibit 7 shows employment trends among IATA member airlines. Moreover, the industrywas highly unionised, making personnel costs and flexibility an important issue in theindustry. Personnel costs equalled more than one-third of revenue according to the UnitedStates' Air Transport Association.8 Another source stated that labour costs, including socialsecurity fund or pension contributions, accounted for 15 to 40 percent of the total costs ofmost airlines, and was usually the largest single cost item.9 Labour costs per employee for theairline industry were typically among the highest of all industries.
Fuel costs, the second-largest operating cost item, accounted for 20 percent of airlineoperating costs in 2000, up from the 12 to 15 percent figure of most of the 1990s, but muchlower than the 30 to 33 percent in the 1980s. By 2000, aircraft had reached fuel efficienciesof around 40 passenger miles per gallon, which was comparable with the most efficientautomobiles.10 Fuel prices, which had been relatively low and stable in the mid-1990sdropped to 30 cents per gallon in 1999, but rose to 80 cents per gallon in 2000 as the
6 Air Transport Association (2001).7 Rigas Doganis (2001), The Airline Business in the Twenty-first Century, London, U.K.: Routledge, p. 146.8 Air Transport Association (2001).9 Rigas Doganis (2001), p. 101.10 Air Transport Association (2001).
DoNotCopy
02/133C The Airline Industry and the World Trade Center Disaster
4
Organization of Petroleum Exporting Countries cut oil production, still low compared withthe oil crises in the 1970s and 1980s, when fuel prices reached almost two US dollars pergallon. 11
Ticketing and sales was another important operating cost item. By the late 1990s, mostpassenger tickets were bought through agents using airline-owned computer reservationsystems to keep track of schedules and fares. In particular, international airlines had to dealwith a worldwide agent network and the inconveniences of currency conversion and delayedcollection of revenues (airlines might only receive the ticket payments several months afterthe flight).12 Agents' commissions took up a sizeable portion of an airline's expenditure,though an increase in online bookings was causing this cost to decrease. 13
Airport charges included aircraft landing fees and passenger-related charges. Major airportsat traffic hubs charged high fees. Secondary airports with few scheduled flights chargedlower rates. In particular, discount airlines usually drove up demand whenever they entered amarket; so secondary airports were willing to negotiate lower fees with new discount airlinesin anticipation of increasing traffic. Landing charges were around four to five percent ofoperating costs for international flights and around 10 to 13 percent for short-haul flights.
Industry Developments
Among the major developments in the airline industry were deregulation and privatisation,more liberal air services agreements, and new airline business models. Before the late 1970s,many governments exerted tight control over the prices and routes of their airlines. Outsidethe United States, most airlines were state-owned; some were chronic money losers that reliedon state subsidies to survive. In 1978, the US Congress passed the Airline Deregulation Act,which relaxed restrictions on new entrants, allowed airlines to set their own fares (instead of agovernment agency), determine their own routes, and to merge. Fares fell and new routeswere opened. Many new airlines appeared in the United States in the 1980s, but then themarket consolidated into six major players and several smaller players. Competition pushedthe US domestic airlines towards low costs and low fares. Airlines tried different pricingstrategies, route structures, and technologies to compete. The majors created hub-and-spokestructures, concentrating traffic and transits at large hub airports from which routes branchedout to "spoke cities". The also tried to control landing and takeoff slots to limit competition.14
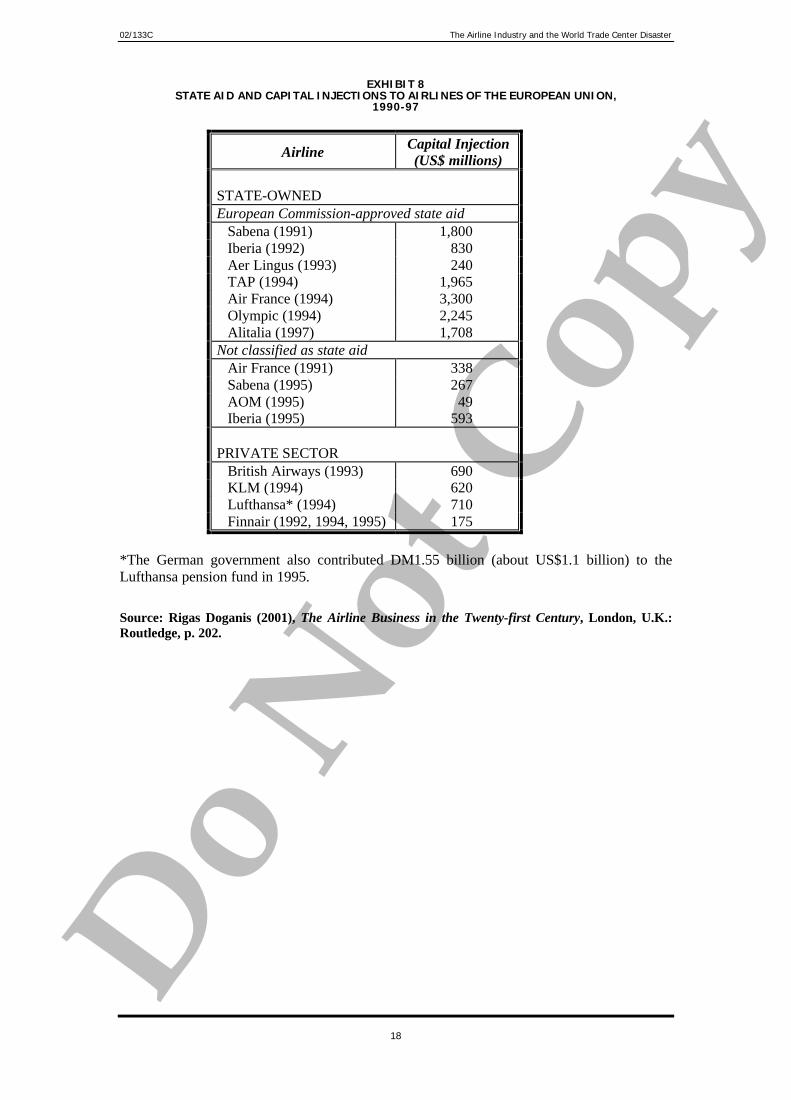
Deregulation in the United States inspired a trend toward privatisation of national flag carriersin the 1980s and 1990s. British Airways, once a poorly managed state-owned organisation,was restructured and then floated in 1987. JAL was privatised in 1987 and Japan's domesticfares were deregulated in 2000. The governments in many countries followed to variousdegrees, from fully divesting the national carrier to retaining a minority stake. Nevertheless,many national carriers were kept afloat by heavy government subsidies [see Exhibit 8].Between 1990 and 1997, for example, the European Union (EU) approved over US$12 billionin subsidies to loss-making airlines, though the subsidies had been decreasing and wereexpected to be phased out eventually. However, outside of the United States, Japan, andEurope, deregulation had been slow and many airlines were still state-owned. 15
International air services were regulated by a series of bilateral agreements among nations.As early as 1944, the United States had suggested an "open sky" of competition, but othernations objected out of concern for security, sovereign control, and possible US dominance ofthe market. In 2001 international aviation was still regulated by piecemeal bilateral
11 See Rigas Doganis (2001), pp. 6-8.12 Rigas Doganis (2001), p. 153.13 See Air Transport Association (2001).14 See Daniel Yergin, Richard Vietor, and Peter Evans, November 2000.15 See Daniel Yergin, Richard Vietor, and Peter Evans, November 2000.
DoNotCopy
02/133C The Airline Industry and the World Trade Center Disaster
5
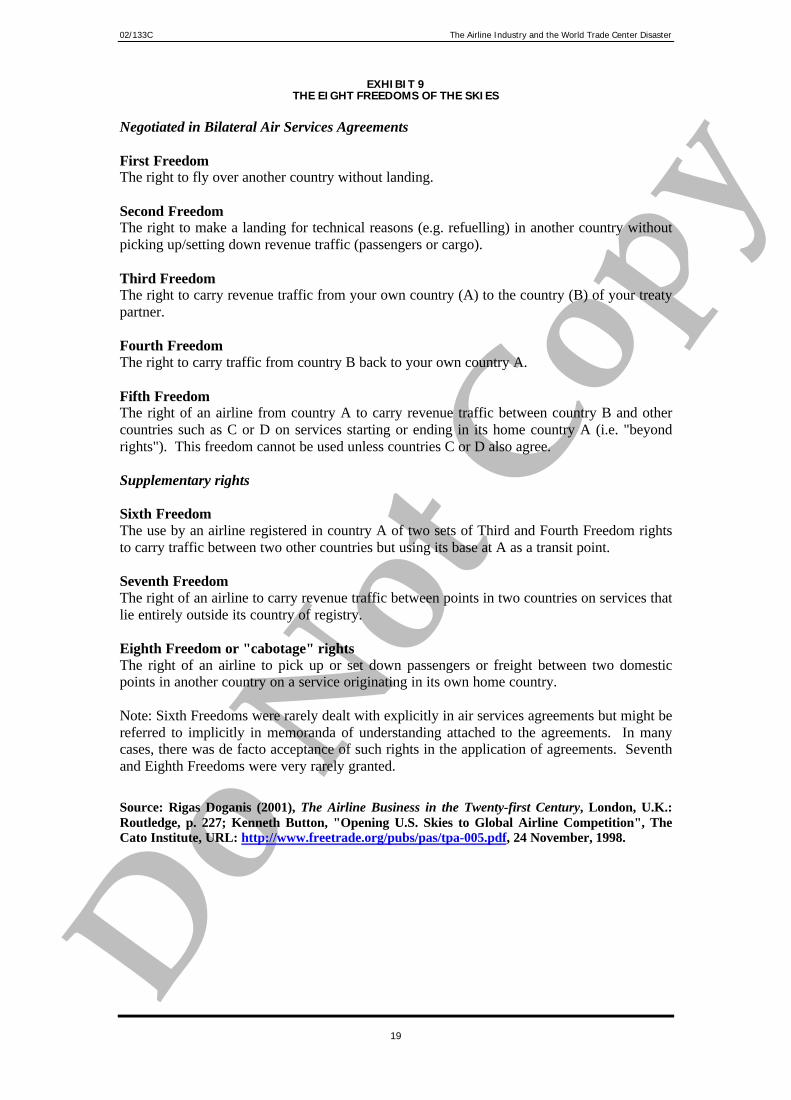
agreements. By 2001, there were eight recognised freedoms of the skies that served as a basisfor bilateral agreements [see Exhibit 9]. There were over 1,500 bilateral, highly detailed, andoften hotly contested individual agreements covering bilateral traffic rights by 2001. Mostbilateral agreements specified the routes that each airline involved would serve, limitedparticipating airlines to those owned and controlled by nationals of the designating state, andrequired both governments to approve tariffs. Agreements differed in the number of "FifthFreedom" rights they granted, whether capacity was split 50-50 or not, and whether revenueson a particular route were pooled by the airlines flying the route.
Since 1978, the United States had been signing freer "open market" agreements with someAsian and European states. In 1992, it called for "Open Skies" agreements with all Europeancountries willing to permit US carriers open access to their markets. The new agreementsincluded open entry on all routes, unrestricted capacity and frequency, flexibility in fare-setting, liberal charter and cargo agreements, open code-sharing opportunities, and operationof computer reservation systems on a non-discriminatory basis.16 However, they did notinclude allowing more foreign ownership and control of designated airlines, or grantingSeventh and Eighth Freedoms.17 By 2000, about 35 open skies agreements had been set upbetween the United States and Asian, South American, and European countries.
The EU states had also been opening up their markets to each other since the 1980s. By 2000,carriers of the 15 states were granted full traffic rights and the ability set fares within whatwas called the Common European Aviation Area.18 The effects of deregulation, privatisation,and open skies agreements put pressure on airlines that had relied upon government subsidiesand restrictions on competition. One result was a number of mergers between airlines in theEU in the 1990s, though these were still sometimes thwarted by national sentiment.
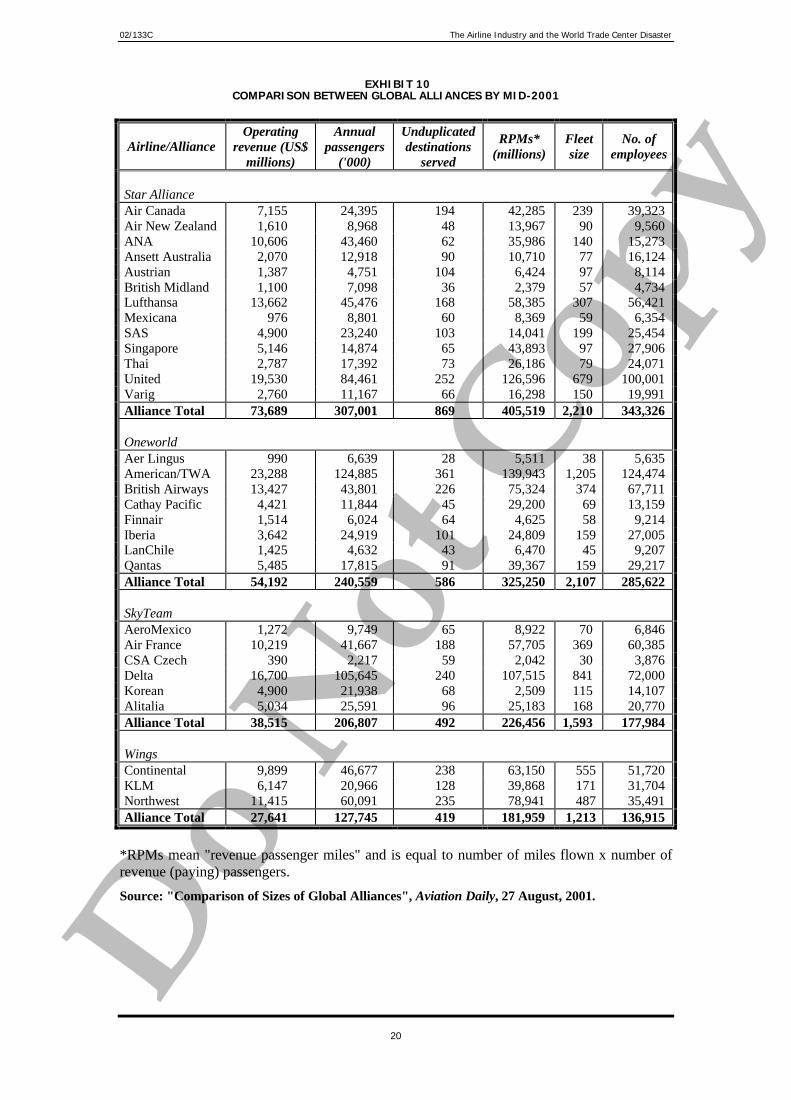
In order to provide more seamless international travel, airlines began to form alliances in the1980s. Airline Business recorded 502 separate inter-airline alliances in June 1998, whenalliance forming was at a peak.19 Some alliances involved loose arrangements such as co-operation in ticketing and baggage handling. Others could include flight code sharing, jointground service, joint marketing, and sharing aircraft. Exhibit 10 lists information about thefour major global alliances by 2000 -- Star Alliance, Oneworld, Wings, and SkyTeam.Exhibits 11, 12, and 13 profile major airline companies.
A number of new airline business models also had emerged. Most traditional airlines were setup to be self-sufficient, with their own engineering, in-flight catering, ground handling, cargo,reservations and ticketing, sales, and management information systems. In the 1990s,however, some airlines began to adopt a "virtual airline model". In 1995, for example, BritishAirways began to focus on its core activities of flight operations and outsource the rest.Others, such as Lufthansa, Swissair, and Singapore Airlines, adopted the "aviation businessmodel" or conglomerate model, putting non-core businesses into new companies that werefree to maximise profits by contracting business within and outside the conglomerate.
A more disruptive change was the development of discount airlines, which flew point-to-pointshort-haul trips with high frequency, good punctuality, and low fares.20 They did not providein-flight meals, used high-density seating arrangements in their planes, used secondaryairports with lower usage charges, and did away with selling tickets through agents as muchas possible. Successful discount airlines such as Southwest in the United States and Ryanair 16 A marketing practice in which two airlines share the same two-letter code used to identify carriers in the computer reservationsystems used by travel agents. From webpage: www.airlines.org/public/publications/display1.asp?nid=971 .17 Daniel Yergin, Richard Vietor, and Peter Evans, November 2000; Rigas Doganis (2001), p. 37.18 Rigas Doganis (2001), p. 11.19 Rigas Doganis (2001), p. 59.20 For example, a return fare from London to Barcelona by summer 2000 was between £100 and £130 for the discount airlinesGo and easyJet, but with British Airways it was £169 and already a special budget offer to compete with discount airlines.
DoNotCopy
02/133C The Airline Industry and the World Trade Center Disaster
6
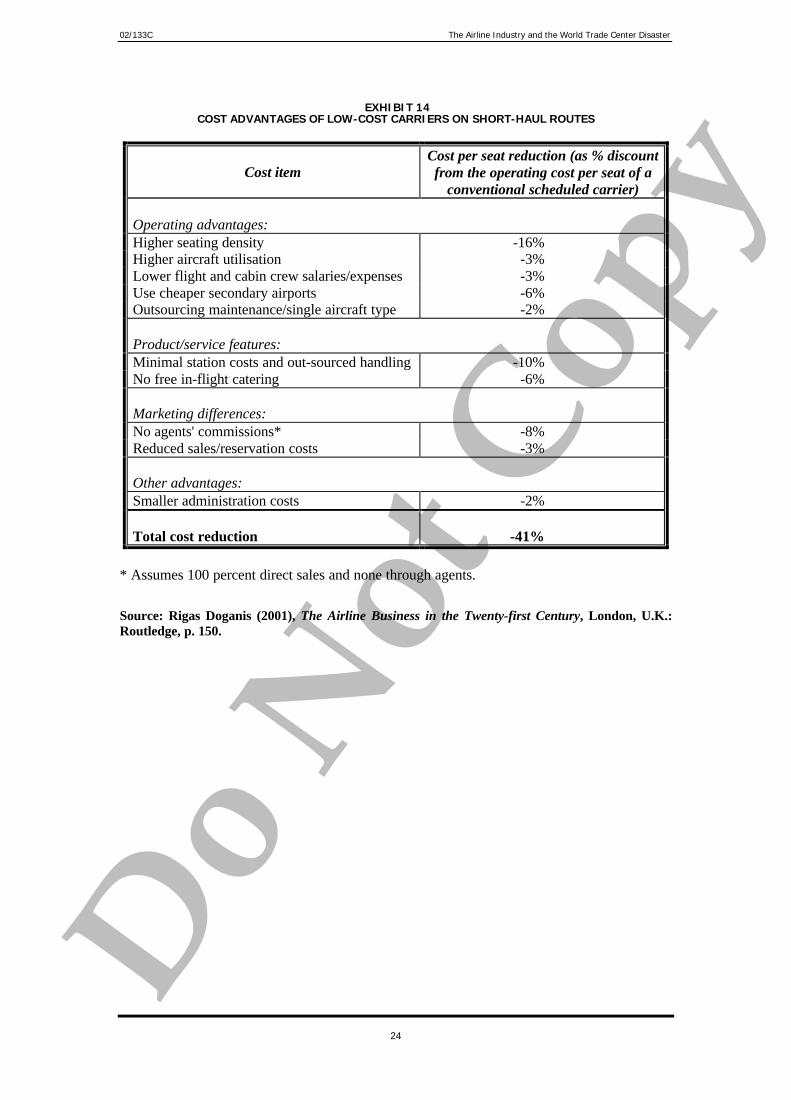
in Europe were generating very high profit margins. One expert stated that discount airlinescould cut 41 percent of the costs of a conventional airline operating in the same market [seeExhibit 14]. The difficulties that traditional airlines (such as Continental and BritishAirways) had in setting up discount airlines showed the difficulty of trying to manage bothtypes of operations.
The Airline Industry in 2001
By mid-2001, some analysts claimed that the world's commercial airline industry was"arguably facing its worst crisis in a decade".21 A global economic slowdown in 2001 meantboth businesses and individuals cut down on travel. In July 2001, the US aviation sectorreported the biggest monthly drop in revenues per airplane seat in more than 20 years. It wasestimated that the US airline industry would lose US$2.6 billion that year, as airfares keptgoing down with little change in passenger traffic from 2000.22 Outside of the United States,many national airlines required government subsidies to avoid bankruptcy. Pressure forconsolidation was particularly high in Europe, as the European Union had begun to encouragecompetition and discourage government handouts. At the time, Europe had about three dozenairlines, of which only three had a truly global presence. By comparison, the United Stateshad three-quarters of the population of European Union, but far fewer airlines.23
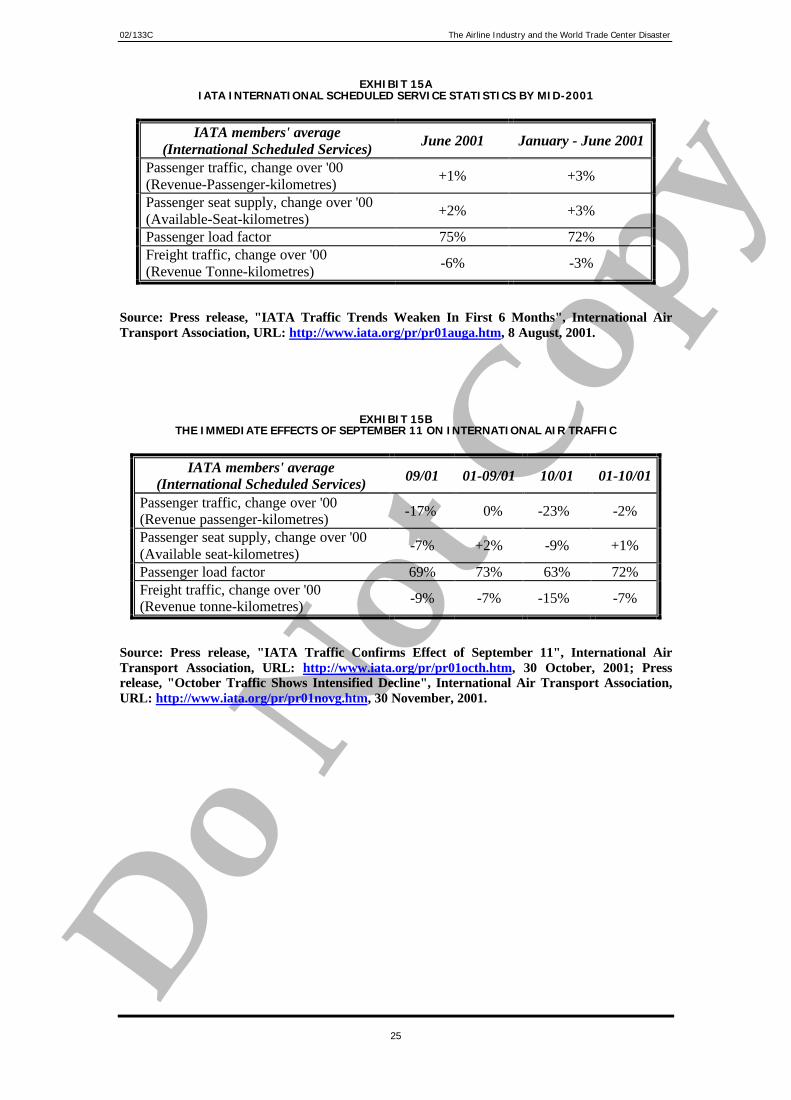
Within IATA members' international scheduled services, freight traffic decreased in the firsthalf of 2001 and passenger traffic increased only marginally [see Exhibit 15A]. The figuresled Pierre J. Jeanniot, IATA Director General & CEO, to issue this warning:24
Unless IATA Members are able to drastically curtail their capacity growthduring the next few months and further control their costs, all prospect ofprofitability for the year 2001 will quickly disappear.
While fuel prices were not at historic highs, they had doubled since 1998.25 Deregulation andliberalisation in Europe and North America fostered competition, drew new entrants, forcedsome players out of business or into mergers, and drove down prices. And yet staff costswere still increasing. Some major airlines, such as British Airways, were experiencing losses,and others, such as Swissair and Sabena, were facing grave financial difficulty.
The September 11 Incident and its Aftermath
In the morning of September 11, 2001, four US passenger planes -- two of American Airlinesand two of United Airlines -- were hijacked during transcontinental domestic flights. Two ofthem were crashed into the twin towers of New York's World Trade Center, leading to thecollapse of both skyscrapers. Another one hit the Pentagon, the headquarters of the USDepartment of Defense, near Washington D.C. The fourth hijacked plane crashed in westernPennsylvania after passengers attempted to take control back from the hijackers. The deathtoll from the unprecedented attacks was estimated at around 3,000.26 The alleged perpetrators,Middle Eastern members of the al Qaeda network of dissident Saudi Osama bin Laden, hadtaken flight lessons, got into the United States, boarded the planes with knives or similarweapons, taken control of the airplanes shortly after takeoff, and deliberately crashed theplanes.
21 Joseph Lo, South China Morning Post, 31 July, 2001.22 Stephanie Stoughton, "Already Facing a Bad Year, the Airlines Brace for Worse", Boston Globe, 13 September, 2001.23 Daniel Michaels, "European Airlines Commence Long-Awaited Restructuring -- Terrorist Attacks in U.S. Hasten theShakeout", Wall Street Journal, 28 September, 2001.24 Press release, International Air Transport Association, 8 August, 2001.25 Joseph Lo, South China Morning Post, 31 July, 2001.26 "The twin towers final death toll soon", Daily Post, 11 January, 2002.
DoNotCopy
02/133C The Airline Industry and the World Trade Center Disaster
7
The United States began to put together the intelligence and forces necessary to attack the alQaeda network of Osama bin Laden and the Taliban regime in Afghanistan that hadharboured bin Laden and several al Qaeda bases. After weeks of fighting, the Taliban wasremoved as the de facto regime in Afghanistan. However, several al Qaeda and Talibanmembers who had been in Afghanistan, including bin Laden and Mullah Mohammad Omar,the Taliban's leader, had not been apprehended. In addition, al Qaeda had cells around theworld committed to carrying on the battle against the United States and other Westerninterests. Subsequent raids resulted in arrests in the United States, United Kingdom,Malaysia, Singapore, and other nations. Analysts believed that the network was still verymuch alive and that the world should expect further terrorist attacks.
Airlines and airports were considered particularly likely targets for future attacks. Thehijackers had gotten past airport and airline security on September 11. In subsequent weeks,further security breeches resulted in the temporary closure of several airports. Further effortsto breech airport and airline security were made, including one instance in which a passengerwho was later linked to al Qaeda tried to ignite an advanced explosive material hidden in hisshoe while on a transatlantic flight.
Impact on US Airlines
In the immediate aftermath of the disaster, flights in the United States were grounded for twodays, during which the estimated loss for US airlines was US$330 million per day.27 Servicesonly gradually resumed afterwards. Safety concerns reduced demand for flights, especially toand within the United States. By the end of September, major US airlines were operating withan average of 20 percent fewer flights and a load factor of only 40 percent. According toIATA data, North American airlines' passenger and freight traffic fell more than 30 percent inSeptember 2001,28 and their passenger traffic fell 33 percent in October.29 In the face offalling demand airlines cut airfares. Average domestic and international airfares, which were14.6 percent lower and 13.8 percent lower in December 2001 than they were in December2000, were at levels not seen since December 1986. Passenger revenues in December 2001were 27 percent lower than in the same month in 2000.30 While some experts had estimatedthat the US airlines' loss would be comparable to the US$4.8 billion lost in 1992 following theGulf War, IATA's estimate for the 2001 loss in the US domestic aviation market alone wasalready US$5 billion.31,32
The most immediate concern was to enhance airport and airline security. National Guardtroops were called out to enhance airport security and security checks in several airports weregreatly intensified. Despite the substantial increase in time waiting for and at security checks,security experts believed that it would take a long time for airport security in the United Statesto be fully up to par. Security at US airports tended to be contracted out by the airports andairlines to private sector companies, many of which employed people with limited trainingand no law enforcement experience. Airlines paid for security services as part of their overallfees to the airports or directly for terminals that they themselves operated. It was assumedthat enhanced security would result in higher security charges for the airlines. More timespent on security checks at airports meant flight frequency would decrease, cargo deliverywould be slower, and so on, leading to a further decrease in airline revenue. Passengerswould put up with long security checks for a while, but this might reduce their desire to fly in
27 Tom Ramstack, "Senate Approves $15 Billion Airline Bailout in 96-1 Vote", The Washington Times, 22 September, 2001.28 "IATA Traffic Confirms Effect of September 11", International Air Transport Association, URL:http://www.iata.org/pr/pr01octh.htm, 30 October, 2001.29 Press release, International Air Transport Association, 30 September, 2001.30 Press release, "Airfares Remain Low in December", Air Transport Association, URL:http://www.airlines.org/public/news/display2.asp?nid=5034, 22 January, 2002.31 Barbara Nagy and Matthew Lubanko; Courant Staff Writers, "Airlines Brace for Steep Dive into Red", The Hartford Courant,14 September, 2001.32 "The Bailout", Asiaweek, 23 November, 2001.

DoNotCopy
02/133C The Airline Industry and the World Trade Center Disaster
8
the future. Enhancing security on airplanes also would be expensive. A pair of bulletproofcockpit doors could cost US$1.2 million, for example.
In addition to other concerns, airlines faced higher insurance charges. Underwriters used toprovide unlimited coverage to airlines for "unlikely" events such as a plane crashing into abuilding. After realising they would pay out billions of dollars for the events of September11, and not sure what the future held, insurers withdrew coverage for such catastrophes andreduced the cap on third-party liability coverage to US$50 million per aircraft, compared withUS$700 million previously. Banks and aircraft leasing companies then threatened to groundthe airlines unless they were covered.33 The airlines asked the US government to provide war-risk and terrorist insurance protection, which it agreed to do on a temporary basis. When theairlines renewed coverage at the end of 2001, the majors had to pay US$200 million inpremiums for less coverage than they had paid US$40 million for the year before.34
In late September, the US government decided to provide US$5 billion in cash and US$10billion in loan guarantees over nine months to the embattled US airline industry. In addition,an emergency fund of US$5 billion was released to various government agencies, part ofwhich was used to hire armed sky marshals for US commercial flights.35 Still, US airlines laidoff approximately 100,000 employees as a direct result of September 11. Midway Airlineswent out of business on September 12. United Airlines reduced its flights by 23 percent, laidoff 20,000 employees, and saw its chairman and CEO step down under union pressure.36
American Airlines announced a 20 percent reduction in flights and layoffs of at least 20,000employees.37 It suffered another blow when, in early November, an American Airlines jetcrashed in New York after hitting turbulence from another plane, killing all 260 passengers.Its fourth-quarter results showed a net loss of US$734 million.38 Only Southwest Airlines,among the major US carriers, maintained a full flight schedule and avoided layoffs. Its stockprice went up while that of others plunged, and its market value in late December was morethan those of American, United, and a number of other top players combined.39
Impact on Non-US Airlines
The immediate impact of the incident on the global airline industry was dramatic [see Exhibit15B]. According to IATA, during the first 10 months of 2001, total traffic (passengers plusfreight) on international services fell by more than four percent, while total capacity increasedby one percent.40 European and Far Eastern carriers experienced a 12 percent fall inpassenger traffic overall in September and a 20 to 25 percent fall in October. Carriers thathad a high US component in their services, such as Aer Lingus, British Airways, KLM, andVirgin Atlantic, fared worse.41 IATA estimated that the revenue losses and additional costsincurred by airlines as a result of the events of September 11 would reach US$10 billion.42
Many airlines cut down their routes, reduced schedules, cut their fleet size, delayed deliveryof new planes, cut salaries, and laid off employees. More than 10 European airlines had
33 Joseph B. Treaster, "Hard-Edged Insurance Chief is Taking on a New and Public Face", The New York Times, 31 October,2001.34 Joseph B. Treaster, "Another Blow to Airlines and Their Insurers", The New York Times, 13 November, 2001.35 Tom Ramstack, The Washington Times, 22 September, 2001.36 Hoover's Company Profile Database.37 Hoover's Company Profile Database.38 Press release, "AMR Reports Fourth-Quarter Loss of $734 Million Before Special Items", AMR Corp., URL:http://www.amrcorp.com/news/january02/16_fourq.htm, 16 January, 2002.39 Stephanie Stoughton, "Southwest Airlines Resumes Growth and Plans for Full-Year Profit", Boston Globe, 23 December,2001.40 Press release, "October Traffic Shows Intensified Decline", International Air Transport Association,http://www.iata.org/pr/pr01novg.htm, 30 November, 2001.41 Daniel Michaels, Wall Street Journal, 28 September, 2001.42 Press release, "Quarterly Report 3rd Quarter 2001", Deutsche Lufthansa, URL: http://www.lufthansa-financials.de/avcom/english/40_archiv/qb01/03/40cont_qb03_beri.html.

DoNotCopy
02/133C The Airline Industry and the World Trade Center Disaster
9
grounded planes, trimmed unprofitable routes, and shed staff after the incident.43 BritishAirways, for example, announced in late September that it would cancel 10 percent of flights,withdraw 20 aircraft from operation, and lay off 7,000 employees.44
Many governments, such as those of Hong Kong, Japan, Taiwan, and the European Union,provided temporary insurance coverage against war and terrorism to their airlines when noprivate insurer would do it. Yet the airlines needed to pay premiums to the government forthat. For example, Air France's annual insurance bill rose from US$1 million to US$81million after September 11; of that, US$29 million went to the French government.45 Theairlines were caught between trying to raise fares in order to pay rising insurance and securitycosts, while trying to attract customers back into the air. Some governments also gaveemergency financial assistance to airlines. The UK government, for example, was willing toprovide about US$58 million of financial assistance to compensate airlines for losses arisingdirectly from the September 11 attacks. The European Commission initially would notapprove of its member states' giving further aid to their airlines other than directcompensation for the four days when US airspace was closed to transatlantic flights.However, it later made exceptions for a number of carriers.
Many airlines reported drastically reduced profits in the third quarter of 2001. In Japan, thegovernment estimated that Japan Airlines and two other major carriers lost about US$90million in revenues during the two weeks following September 11. Even in China, where thedomestic market and aviation sector were relatively little affected (because the airlines hadonly a limited number of overseas routes), it was expected that airlines would lose US$41.6million in revenues in the four months after the attacks.46 The Association of EuropeanAirlines said that the impact of the September 11 attacks would cost its members aboutUS$2.3 billion in profits and US$3.3 billion in revenues by the end of 2001, and wouldendanger 40,000 jobs.47
Bucking the trend was Ryanair, which saw its revenue increase 29 percent and its profit rise39 percent in the six months ended 30 September 2001. It was forecast that the companywould earn about US$117 million in 2001, an increase of 25 percent from 2000.48 Thereasons behind Ryanair's continued success were twofold: first, it only flew within Europe;second, it was a discount airline with all the low-cost attractions. Ryanair had cut airfaresafter September 11 and also cut costs by handling all ticketing by phone or the Internet.
At the other extreme, Sabena and Swissair, plagued by financial problems before the incident,started bankruptcy proceedings shortly after the September 11 attacks. Swissair, onceconsidered one of the world's finest airlines, had made an ill-fated attempt to expand byinvesting in the chronically money-losing Sabena. Sabena's poor performance, and Swissair'sinvestment commitments, brought the latter down. In October 2001, Swissair sought courtprotection from creditors and agreed to sell its 70 percent stake in Crossair to two Swissbanks that were its creditors.49 It also cut 13 percent of its worldwide workforce. Eventually,Swissair managed to obtain US$2.6 billion from the Swiss government and private investorsto save the airline. Swissair would be taken over by the financially healthier Crossair to form
43 Daniel Michaels, Wall Street Journal, 28 September, 2001.44 Press release, "Series of Measures Announced", British Airways, URL: http://www.britishairways.com/cgi-bin/press/view_article.pl?year_n=2001&month_n=september&year=2001&month=09&day=20&index=0&reference=113/SD/01&title=Series%20of%20measures%20announced&mail=contact&image=none&position=none&caption=, 20 September, 2001.45 Heather Spinetta, "Airline Insurance 80 Times as Expensive", Independent on Sunday (London), 25 November, 2001.46 Mark O'Neill, "Red Ink $324 million Deep for Airlines", South China Morning Post, 23 October, 2001.47 Stephen Castle and Michael Harrison, "Aviation in Crisis: Brussels Rejects Big Bail-outs for Struggling Airlines", TheIndependent, 11 October, 2001.48 Daniel Michaels, "Companies: Ryanair Posts Strong Growth, Averting World Aviation Crisis", Wall Street Journal, 6November, 2001.49 Hoover's Company Profile Database.
DoNotCopy
02/133C The Airline Industry and the World Trade Center Disaster
10
a new, much smaller national airline (staff to be cut from 72,000 to 9,000) in early 2002.50
Sabena went bankrupt even after the European Commission made an exception in authorisingthe Belgian government to give it a US$112 million loan.51 Later, Delta Air Transport (DAT),a former regional subsidiary, resumed operation with financial backing from the Belgiangovernment and private investors, saving half of the Sabena Group's 12,000 staff fromredundancy. In January 2002, DAT was still trying to build itself into the new Belgiannational airline.
Flying Into the Future
The airline industry had been hit hard by the events of September 11. The industry wasalready suffering from the global economic slowdown. In the United States and Europe,airlines were braced for losses and layoffs even before September 11. The events ofSeptember 11 had an immediate impact through the grounding of flights, the decrease indemand, and the rise in insurance and security costs. While some of these, such as insuranceand security issues were certain to remain, it was not clear how demand would be affected inthe long run. In addition, the fear of further attacks still remained. The events alsoaccelerated the onset of a global economic downturn. Several economists believed that theevents of September 11 would tip the United States and several other major economies intorecession. This would have an added effect on the airline industry.
While the most direct impact of the events of September 11 was on US airlines, airlineselsewhere were in perhaps a more uncertain long run position. The consolidation that hadtaken place in the United States had not yet occurred in Europe. The bankruptcy of Sabenaand the stance of the European Commission on subsidies showed that European airlineswould not be offered unlimited help. The idea that unprofitable airlines would be restructuredor would cease to exist was gaining support among European authorities.
Many airlines had not yet found appropriate responses to the pressures resulting fromderegulation, privatisation, more liberal air service regimes, greater competition, and risingcosts. Now, in the aftermath of the events of September 11, they faced new andunprecedented challenges.
50 William Hall and Mark Odell, "Swiss push to see their flags flying again", Financial Times (London), 10 January, 2002.51 Steve Pain, Business Staff, "Sabena is grounded as company goes bust", Birmingham Post, 7 November, 2001.

DoNotCopy
02/133C The Airline Industry and the World Trade Center Disaster
11
EXHIBIT 1GLOBAL AIRLINE INDUSTRY FINANCIAL TRENDS
Operatingrevenues
(US$million)
Y-O-Ychange innominalrevenues
(%)
Operatingprofits (US$
million)
Net profits(US$
million)
Margin(%)
US CPI**(1982-
84=100)
1980 87,676 23.9 -635 -919 -1.0 NA1981 92,992 6.1 -692 -1,150 -1.2 90.91982 93,240 0.3 -160 -1,300 -1.4 96.51983 98,300 5.4 2,100 -700 -0.7 99.51984 105,400 7.2 5,100 2,000 1.9 103.91985 112,200 6.5 4,100 2,100 1.9 107.61986 124,600 11.1 4,600 1,500 1.2 109.61987 147,000 18.0 7,200 2,500 1.7 113.61988 166,200 13.1 10,200 5,000 3.0 118.31989 177,800 7.0 7,600 3,500 2.0 124.01990 199,500 12.2 -1,500 -4,500 -2.3 130.71991 205,500 3.0 -500 -3,500 -1.7 136.21992 217,800 6.0 -1,800 -7,900 -3.6 140.31993 226,000 3.8 1,200 -4,400 -1.9 144.51994 244,700 8.3 7,700 -200 -0.1 148.21995 267,000 9.1 13,500 4,500 1.7 152.41996 282,500 5.8 12,300 5,300 1.9 156.91997 297,000 3.0 16,300 8,550 2.9 160.51998 295,500 1.5 15,900 8,200 2.8 163.01999 305,500 3.4 12,300 8,500 2.8 166.62000* 329,100 7.6 11,000 4,700 1.2 172.2
* estimate** US consumer price index, 1982-84 average = 100
Source: International Civil Aviation Organization.
DoNotCopy
02/133C The Airline Industry and the World Trade Center Disaster
12
EXHIBIT 2WORLD AIRLINE INDUSTRY STATISTICS, 2000
AirlineRegistration
Airlines Pax(000)
RPKs(mils)
FTKs(mils)
Employees Aircraft
Africa 19 28,086 56,502 1,431,040 58,701 361Asia/Pacific 76 371,947 729,798 45,914,252 396,799 2,496Canada 7 36,776 75,489 1,819,216 54,481 414Europe 202 537,945 1,009,331 36,845,438 508,506 5,225Latin America/Caribbean 49 92,248 135,796 5,146,300 90,227 901Middle East 20 47,143 86,542 3,953,035 72,765 373US Majors 15 585,791 1,056,724 33,885,457 1,102,013 5,188US Nationals 37 83,555 75,501 7,265,134 71,127 1,391US Regionals 83 36,478 22,154 182,456 25,407 1,411US Cargo 15 N/A N/A 881,830 2,822 152Total World 523 1,819,969 3,247,837 137,324,158 2,382,848 17,912Total US 150 705,824 1,154,379 42,214,877 1,201,369 8,142
AirlineRegistration
Airlines%
Pax%
RPKs%
FTKs%
Employees%
Aircraft%
Africa 3.6% 1.5% 1.7% 1.0% 2.5% 2.0%Asia/Pacific 14.5% 20.4% 22.5% 33.4% 16.7% 13.9%Canada 1.3% 2.0% 2.3% 1.3% 2.3% 2.3%Europe 38.6% 29.6% 31.1% 26.8% 21.3% 29.2%Latin America/Caribbean 9.4% 5.1% 4.2% 3.7% 3.8% 5.0%Middle East 3.8% 2.6% 2.7% 2.9% 3.1% 2.1%US Majors 2.9% 32.2% 32.5% 24.7% 46.2% 29.0%US Nationals 7.1% 4.6% 2.3% 5.3% 3.0% 7.8%US Regionals 15.9% 2.0% 0.7% 0.1% 1.1% 7.9%US Cargo 2.9% N/A N/A 0.6% 0.1% 0.8%Total World 100.0% 100.0% 100.0% 100.0% 100.0% 100.0%Total US 28.7% 38.8% 35.5% 30.7% 50.4% 45.5%
Pax = number of passengersRPKs = number of kilometres flown x number of revenue (paying) passengersFTKs = number of kilometres flown x tones of cargo carried
Source: Air Transport World (July 2001).
DoNotCopy
02/133C The Airline Industry and the World Trade Center Disaster
13
EXHIBIT 3INTERREGIONAL AIR TRAFFIC STATISTICS AND PROJECTIONS
Route 1999 BillionRPKs
2009 BillionRPKs
Average annualgrowth estimate (%)
North America -- Europe 389 553 3.6North America -- Northeast Asia 137 230 5.3Europe -- Africa 91 158 5.7Europe -- Southeast Asia 90 149 5.2North America -- Central America 80 125 4.6Europe -- Northeast Asia 60 117 6.9Northeast Asia -- Southeast Asia 47 95 7.3Europe -- South America 51 88 5.6North America -- South America 45 84 6.4North America -- Southeast Asia 33 50 4.2
Source: Daniel Yergin, Richard Vietor, and Peter Evans, Fettered Flight: Globalization and theAirline Industry, Cambridge, Massachusetts, the United States: Cambridge Energy ResearchAssociates, November 2000.
DoNotCopy
02/133C The Airline Industry and the World Trade Center Disaster
14
EXHIBIT 4WORLD GDP GROWTH AND INTERNATIONAL AIR TRAFFIC DEMAND
Source: International Air Transport Association (IATA) Aviation Information and Research,"September 2001 Industry Briefing".
DoNotCopy
02/133C The Airline Industry and the World Trade Center Disaster
15
EXHIBIT 5SELECTED MAJOR AIRLINERS AND STATISTICS BY LATE 2001
Aircraft Capacity* Range** No. delivered(ordered)
Average 2001List Price
US$ million
AIRBUSA300-600 266 M 508 (583) 110A310 220 M-L 255 (260) 87A318 107 R 0 (136) 42A319 124 S 397 (698) 49A320 150 S-M 999 (1,544) 54A321 185 S-M 215 (411) 66A330-200 253 LA330-300 295 M-L
207 (413) 143
A340-200 & 300 261 & 295 L 154A340-500 & 600 313 & 380 L
209 (309)172
A380 555 L 0 (70) 251
BOEING717 106 R 93 (137) 37737-600 & 700 108 & 128 S-M 447 (973) 48737-800 & 900 162 & 177 S-M 577 (953) 63747-400 416 L 568 (630) 200757-200 202 M 969 (987) 77757-300 240 M 24 (63) 85767-200 216 M-L 239 (240) 106767-300 210 M-L 594 (653) 121767-400ER 245 L 24 (40) 132777-200 305 L 339 (489) 185777-300 394 L 38 (104) 203
Note: * maximum number of passengers in a typical seating arrangement.** R - regional (e.g. Beijing - Tokyo), S - short (e.g. Beijing - Singapore), M - medium(e.g. London - New York), L - long (e.g. London - Singapore).
Sources: Airbus (URL: www.airbus.com) and Boeing (URL: www.boeing.com) companyinformation, Airliners.net, URL: www.airliners.net/info/, and "Airbus Manages to Keep the Lidon Price Escalation", Aircraft Value News, 16 July, 2001.
DoNotCopy
02/133C The Airline Industry and the World Trade Center Disaster
16
EXHIBIT 6AOPERATING COSTS OF INTERNATIONAL SCHEDULED SERVICES ON IATA AIRLINES, 2000
US centsper ATK*
% changeover 1999
% oftotal
En-route (high-altitude cruising control) Charges 1.8 -- 4.7Landing Charges 1.9 -5.0 5.0General and Administrative 2.0 -4.8 5.2Cockpit Crew 2.6 -3.7 6.8Maintenance and Overhaul 3.6 -2.7 9.4Flight Equipment Insurance, Depreciation, and Rentals 4.5 -4.3 11.8Cabin Crew and Passenger Service 5.0 -- 13.1Ticketing, Sales, and Promotion 5.8 -3.3 15.2Fuel and Oil 6.9 +16.9 18.1Station and Ground Costs** 4.1 -6.8 40.7Total 38.2 -0.3 100.0
*ATKs means "available tonne kilometres" and is equal to number of kilometres flown xnumber of tonnes of capacity available for the carriage of revenue load.** Including ground staff, check-in staff, equipment, business lounges, office space, andrelated facilities at airports served by the airline.
Source: 2001 Annual Report, International Air Transport Association.
EXHIBIT 6BFINANCIAL INFORMATION ON US SCHEDULED AIRLINES, 2000
Financial Data (US$ millions) 1999 2000Passenger Revenues $84,317 $93,573Freight and Express Revenues 11,415 11,993Mail Revenues 1,739 1,975Charter Revenues 4,030 4,365Other Revenues 17,537 17,557
Total Operating Revenues $119,038 $129,463Total Operating Expenses (110,635) (122,389)
Operating Profit $8,403 $7,074Interest Expense (1,821) (2,165)Other Expense (1,222) (2,271)
Net Profit $5,360 $2,637
Source: Air Transport Association (United States).
DoNotCopy
02/133C The Airline Industry and the World Trade Center Disaster
17
EXHIBIT 7IATA MEMBER AIRLINE EMPLOYMENT TRENDS
(Index: 1985=100)
No. ofemployees
AvailableATKs**
ATKs** peremployee
1985 100.0 100.0 100.01986 103.4 106.6 103.01987 108.1 116.3 102.81988 110.0 123.4 108.01989 115.6 127.3 105.61990 119.7 138.9 113.01991 115.6 137.4 121.21992 115.7 152.2 130.91993 113.0 157.8 137.21994 112.2 166.2 146.61995 112.4 176.8 158.71996 114.7 186.7 163.01997 118.6 197.4 164.91998 122.0 205.7 169.11999 125.5 216.2 172.22000* 126.7 228.3 180.4
* projection** ATK means Available Tonne Kilometres, the sum of the products obtained by multiplyingthe number of tonnes of capacity available for the carriage of revenue load on each flightstage of a flight by the flight stage distance.
Source: IATA Aviation Information and Research, "September 2001 Industry Briefing".
DoNotCopy
02/133C The Airline Industry and the World Trade Center Disaster
18
EXHIBIT 8STATE AID AND CAPITAL INJECTIONS TO AIRLINES OF THE EUROPEAN UNION,
1990-97
Airline Capital Injection(US$ millions)
STATE-OWNEDEuropean Commission-approved state aid
Sabena (1991) 1,800Iberia (1992) 830Aer Lingus (1993) 240TAP (1994) 1,965Air France (1994) 3,300Olympic (1994) 2,245Alitalia (1997) 1,708
Not classified as state aidAir France (1991) 338Sabena (1995) 267AOM (1995) 49Iberia (1995) 593
PRIVATE SECTORBritish Airways (1993) 690KLM (1994) 620Lufthansa* (1994) 710Finnair (1992, 1994, 1995) 175
*The German government also contributed DM1.55 billion (about US$1.1 billion) to theLufthansa pension fund in 1995.
Source: Rigas Doganis (2001), The Airline Business in the Twenty-first Century, London, U.K.:Routledge, p. 202.
DoNotCopy
02/133C The Airline Industry and the World Trade Center Disaster
19
EXHIBIT 9THE EIGHT FREEDOMS OF THE SKIES
Negotiated in Bilateral Air Services Agreements
First FreedomThe right to fly over another country without landing.
Second FreedomThe right to make a landing for technical reasons (e.g. refuelling) in another country withoutpicking up/setting down revenue traffic (passengers or cargo).
Third FreedomThe right to carry revenue traffic from your own country (A) to the country (B) of your treatypartner.
Fourth FreedomThe right to carry traffic from country B back to your own country A.
Fifth FreedomThe right of an airline from country A to carry revenue traffic between country B and othercountries such as C or D on services starting or ending in its home country A (i.e. "beyondrights"). This freedom cannot be used unless countries C or D also agree.
Supplementary rights
Sixth FreedomThe use by an airline registered in country A of two sets of Third and Fourth Freedom rightsto carry traffic between two other countries but using its base at A as a transit point.
Seventh FreedomThe right of an airline to carry revenue traffic between points in two countries on services thatlie entirely outside its country of registry.
Eighth Freedom or "cabotage" rightsThe right of an airline to pick up or set down passengers or freight between two domesticpoints in another country on a service originating in its own home country.
Note: Sixth Freedoms were rarely dealt with explicitly in air services agreements but might bereferred to implicitly in memoranda of understanding attached to the agreements. In manycases, there was de facto acceptance of such rights in the application of agreements. Seventhand Eighth Freedoms were very rarely granted.
Source: Rigas Doganis (2001), The Airline Business in the Twenty-first Century, London, U.K.:Routledge, p. 227; Kenneth Button, "Opening U.S. Skies to Global Airline Competition", TheCato Institute, URL: http://www.freetrade.org/pubs/pas/tpa-005.pdf, 24 November, 1998.
DoNotCopy
02/133C The Airline Industry and the World Trade Center Disaster
20
EXHIBIT 10COMPARISON BETWEEN GLOBAL ALLIANCES BY MID-2001
Airline/AllianceOperating
revenue (US$millions)
Annualpassengers
('000)
Unduplicateddestinations
served
RPMs*(millions)
Fleetsize
No. ofemployees
Star AllianceAir Canada 7,155 24,395 194 42,285 239 39,323Air New Zealand 1,610 8,968 48 13,967 90 9,560ANA 10,606 43,460 62 35,986 140 15,273Ansett Australia 2,070 12,918 90 10,710 77 16,124Austrian 1,387 4,751 104 6,424 97 8,114British Midland 1,100 7,098 36 2,379 57 4,734Lufthansa 13,662 45,476 168 58,385 307 56,421Mexicana 976 8,801 60 8,369 59 6,354SAS 4,900 23,240 103 14,041 199 25,454Singapore 5,146 14,874 65 43,893 97 27,906Thai 2,787 17,392 73 26,186 79 24,071United 19,530 84,461 252 126,596 679 100,001Varig 2,760 11,167 66 16,298 150 19,991Alliance Total 73,689 307,001 869 405,519 2,210 343,326
OneworldAer Lingus 990 6,639 28 5,511 38 5,635American/TWA 23,288 124,885 361 139,943 1,205 124,474British Airways 13,427 43,801 226 75,324 374 67,711Cathay Pacific 4,421 11,844 45 29,200 69 13,159Finnair 1,514 6,024 64 4,625 58 9,214Iberia 3,642 24,919 101 24,809 159 27,005LanChile 1,425 4,632 43 6,470 45 9,207Qantas 5,485 17,815 91 39,367 159 29,217Alliance Total 54,192 240,559 586 325,250 2,107 285,622
SkyTeamAeroMexico 1,272 9,749 65 8,922 70 6,846Air France 10,219 41,667 188 57,705 369 60,385CSA Czech 390 2,217 59 2,042 30 3,876Delta 16,700 105,645 240 107,515 841 72,000Korean 4,900 21,938 68 2,509 115 14,107Alitalia 5,034 25,591 96 25,183 168 20,770Alliance Total 38,515 206,807 492 226,456 1,593 177,984
WingsContinental 9,899 46,677 238 63,150 555 51,720KLM 6,147 20,966 128 39,868 171 31,704Northwest 11,415 60,091 235 78,941 487 35,491Alliance Total 27,641 127,745 419 181,959 1,213 136,915
*RPMs mean "revenue passenger miles" and is equal to number of miles flown x number ofrevenue (paying) passengers.
Source: "Comparison of Sizes of Global Alliances", Aviation Daily, 27 August, 2001.

DoNotCopy
02/133C The Airline Industry and the World Trade Center Disaster
21
EXHIBIT 11TOP AIRLINES IN THE WORLD IN 1999
Ranking By revenue By no. ofpassengers
By no. ofemployees
By fleet size
1 United Delta UPS American2 American United FedEx FedEx3 Japan Airlines American United United4 Delta Southwest American Delta5 FedEx Northwest Delta Northwest6 British Airways US Airways Lufthansa US Airways7 Lufthansa Continental DHL Continental8 All Nippon All Nippon Air France Southwest9 Northwest Lufthansa British Airways British Airways10 Air France Air France Northwest Lufthansa
Source: Daniel Yergin, Richard Vietor, and Peter Evans, Fettered Flight: Globalization and theAirline Industry, Cambridge, Massachusetts, the United States: Cambridge Energy ResearchAssociates, November 2000.
EXHIBIT 12COMPARISON AMONG SELECTED AIRLINES IN EARLY 2001
AirlineHomemarket
Annualoperatingrevenue
(US$millions)
Annual netprofit (US$millions)
Profitmargin
Fleetsize
Annual no.of
passengers(millions)
No. ofemployees
American US 18,117.0 778.0 4.3% 702 90.3 99,186United US 19,331.0 52.0 0.3% 679 84.5 102,000Air France France 9,861.3 338.3 3.4% 242 42.4 59,190BA UK 14,245.0 -33.0 -- 338 48.0 65,157Lufthansa Germany 14,312.7 648.8 4.5% 376 47.0 69,523Sabena Belgium 2,297.5 -306.0 -- 90 11 11,294SwissAir Switzerland 10,070.1 -1,790.1 -- 163 9.8 71,905CathayPacific
Hong Kong 4,425.8 641.6 14.5% 65 11.8 14,300
JAL Japan 15,080.3 186.2 1.2% 175 39.0 18,535RyanAir Ireland 428.3 91.8 21.4% 35 7.0 1,467Southwest US 5,649.6 603.1 10.7% 360 63.7 29,274
Source: Hoover's Company Profile Database, company information.
DoNotCopy
02/133C The Airline Industry and the World Trade Center Disaster
22
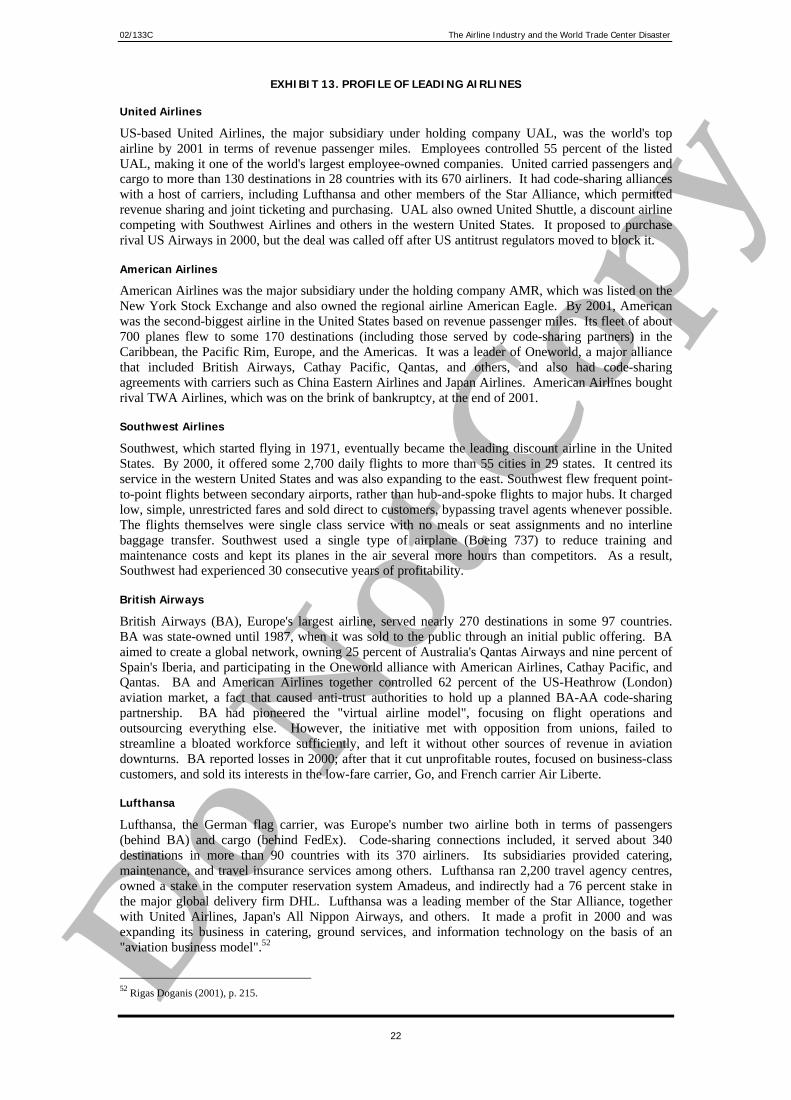
EXHIBIT 13. PROFILE OF LEADING AIRLINES
United Airlines
US-based United Airlines, the major subsidiary under holding company UAL, was the world's topairline by 2001 in terms of revenue passenger miles. Employees controlled 55 percent of the listedUAL, making it one of the world's largest employee-owned companies. United carried passengers andcargo to more than 130 destinations in 28 countries with its 670 airliners. It had code-sharing allianceswith a host of carriers, including Lufthansa and other members of the Star Alliance, which permittedrevenue sharing and joint ticketing and purchasing. UAL also owned United Shuttle, a discount airlinecompeting with Southwest Airlines and others in the western United States. It proposed to purchaserival US Airways in 2000, but the deal was called off after US antitrust regulators moved to block it.
American Airlines
American Airlines was the major subsidiary under the holding company AMR, which was listed on theNew York Stock Exchange and also owned the regional airline American Eagle. By 2001, Americanwas the second-biggest airline in the United States based on revenue passenger miles. Its fleet of about700 planes flew to some 170 destinations (including those served by code-sharing partners) in theCaribbean, the Pacific Rim, Europe, and the Americas. It was a leader of Oneworld, a major alliancethat included British Airways, Cathay Pacific, Qantas, and others, and also had code-sharingagreements with carriers such as China Eastern Airlines and Japan Airlines. American Airlines boughtrival TWA Airlines, which was on the brink of bankruptcy, at the end of 2001.
Southwest Airlines
Southwest, which started flying in 1971, eventually became the leading discount airline in the UnitedStates. By 2000, it offered some 2,700 daily flights to more than 55 cities in 29 states. It centred itsservice in the western United States and was also expanding to the east. Southwest flew frequent point-to-point flights between secondary airports, rather than hub-and-spoke flights to major hubs. It chargedlow, simple, unrestricted fares and sold direct to customers, bypassing travel agents whenever possible.The flights themselves were single class service with no meals or seat assignments and no interlinebaggage transfer. Southwest used a single type of airplane (Boeing 737) to reduce training andmaintenance costs and kept its planes in the air several more hours than competitors. As a result,Southwest had experienced 30 consecutive years of profitability.
British Airways
British Airways (BA), Europe's largest airline, served nearly 270 destinations in some 97 countries.BA was state-owned until 1987, when it was sold to the public through an initial public offering. BAaimed to create a global network, owning 25 percent of Australia's Qantas Airways and nine percent ofSpain's Iberia, and participating in the Oneworld alliance with American Airlines, Cathay Pacific, andQantas. BA and American Airlines together controlled 62 percent of the US-Heathrow (London)aviation market, a fact that caused anti-trust authorities to hold up a planned BA-AA code-sharingpartnership. BA had pioneered the "virtual airline model", focusing on flight operations andoutsourcing everything else. However, the initiative met with opposition from unions, failed tostreamline a bloated workforce sufficiently, and left it without other sources of revenue in aviationdownturns. BA reported losses in 2000; after that it cut unprofitable routes, focused on business-classcustomers, and sold its interests in the low-fare carrier, Go, and French carrier Air Liberte.
Lufthansa
Lufthansa, the German flag carrier, was Europe's number two airline both in terms of passengers(behind BA) and cargo (behind FedEx). Code-sharing connections included, it served about 340destinations in more than 90 countries with its 370 airliners. Its subsidiaries provided catering,maintenance, and travel insurance services among others. Lufthansa ran 2,200 travel agency centres,owned a stake in the computer reservation system Amadeus, and indirectly had a 76 percent stake inthe major global delivery firm DHL. Lufthansa was a leading member of the Star Alliance, togetherwith United Airlines, Japan's All Nippon Airways, and others. It made a profit in 2000 and wasexpanding its business in catering, ground services, and information technology on the basis of an"aviation business model".52
52 Rigas Doganis (2001), p. 215.

DoNotCopy
02/133C The Airline Industry and the World Trade Center Disaster
23
Air France
Air France, 56 percent owned by the French Government, was the third largest airline in Europe. Its240 planes flew to 200 destinations in more than 90 countries. To compete with the Star Alliance andOneworld, Air France formed SkyTeam with Korean Airline and a number of players. It owned a 23percent interest in the major global computer reservation system Amadeus, and had also bought stakesin European regional carriers. In 2001, Air France's fleet included a mixture of Boeings and Airbusesplus five Concorde supersonic and medium range airliners. An Air France Concorde jet crashedshortly after takeoff from Paris in 2000, killing all 109 people on board and four more on the ground.Air France and British Airways suspended all Concorde flights immediately, but they were resumed thefollowing year after extensive modifications to the plane's fuel tanks.
Ryanair
Ireland-based Ryanair started in the mid-1980s as a low-cost carrier flying mainly between the UnitedKingdom and Ireland. In 1990, it re-modelled its business after Southwest Airlines. Business grewrapidly afterwards. The company started service in continental Europe after the market was de-regulated. In 2000, Ryanair achieved a 21.4 percent profit margin. By 2001, the airline flew more thanseven million passengers a year to 55 destinations in the United Kingdom, Italy, France, Denmark,Germany, Norway, and Sweden, and was planning for expansion in Europe. Ryanair flew an all-Boeing 737 fleet, and the airline had 65 percent of its flights booked through the Internet. FounderTony Ryan and family owned 10 percent of Ryanair; CEO Michael O'Leary owned seven percent.
Japan Airlines
The number one airline in Asia, Japan Airlines (JAL) flew some 39 million passengers each year to 80destinations in 20 countries, mainly in the Asia/Pacific region, with its fleet of 175 planes. It alsoowned an international hotel chain, offered tour packages, hauled cargo, and provided maintenance andground support. Japan's chronic economic recession meant that JAL had been in the red for much of1990s. In 1998, JAL announced job cuts, restructured its routes, and launched low-cost carrier JALExpress. In 2000, deregulation of domestic fares sparked a price war, putting the airline in a moredifficult situation. JAL actually trailed its major rival, All Nippon Airways, in domestic business.JAL, which had been completely privatised in 1987, was not a member of any airline alliance, though ithad code-sharing agreements with 19 airlines including American Airlines and Air France. In 2001, ithad also agreed to merge with Japan Air Systems, Japan's third largest airline.
Cathay Pacific
Based in Hong Kong, Cathay Pacific Airways flew passengers to some 50 destinations in 28 countriesand delivered cargo to 16 destinations with its 65-strong fleet. Cathay was usually one of the world'smost profitable airlines and recorded a profit margin of 14.5 percent in 2000. It was a member of theOneworld alliance, which served 550 destinations worldwide, and had code-sharing agreements withJapan Airlines and Turkish Airlines. Its subsidiaries included flight catering and maintenance, amongothers. Cathay owned 75 percent of cargo carrier Air Hong Kong and 19 percent of Dragonair, aregional airline based in Hong Kong. Major shareholders included British-owned Swire Pacific (40percent) and CITIC Pacific, the Hong Kong arm of a company from the Chinese Mainland (22percent).
Source: Unless otherwise stated, this section is based on Hoover's Company Profile Database.
DoNotCopy
02/133C The Airline Industry and the World Trade Center Disaster
24
EXHIBIT 14COST ADVANTAGES OF LOW-COST CARRIERS ON SHORT-HAUL ROUTES
Cost itemCost per seat reduction (as % discountfrom the operating cost per seat of a
conventional scheduled carrier)
Operating advantages:Higher seating density -16%Higher aircraft utilisation -3%Lower flight and cabin crew salaries/expenses -3%Use cheaper secondary airports -6%Outsourcing maintenance/single aircraft type -2%
Product/service features:Minimal station costs and out-sourced handling -10%No free in-flight catering -6%
Marketing differences:No agents' commissions* -8%Reduced sales/reservation costs -3%
Other advantages:Smaller administration costs -2%
Total cost reduction -41%
* Assumes 100 percent direct sales and none through agents.
Source: Rigas Doganis (2001), The Airline Business in the Twenty-first Century, London, U.K.:Routledge, p. 150.
DoNotCopy
02/133C The Airline Industry and the World Trade Center Disaster
25
EXHIBIT 15AIATA INTERNATIONAL SCHEDULED SERVICE STATISTICS BY MID-2001
IATA members' average(International Scheduled Services)
June 2001 January - June 2001
Passenger traffic, change over '00(Revenue-Passenger-kilometres)
+1% +3%
Passenger seat supply, change over '00(Available-Seat-kilometres)
+2% +3%
Passenger load factor 75% 72%Freight traffic, change over '00(Revenue Tonne-kilometres)
-6% -3%
Source: Press release, "IATA Traffic Trends Weaken In First 6 Months", International AirTransport Association, URL: http://www.iata.org/pr/pr01auga.htm, 8 August, 2001.
EXHIBIT 15BTHE IMMEDIATE EFFECTS OF SEPTEMBER 11 ON INTERNATIONAL AIR TRAFFIC
IATA members' average(International Scheduled Services) 09/01 01-09/01 10/01 01-10/01
Passenger traffic, change over '00(Revenue passenger-kilometres)
-17% 0% -23% -2%
Passenger seat supply, change over '00(Available seat-kilometres)
-7% +2% -9% +1%
Passenger load factor 69% 73% 63% 72%Freight traffic, change over '00(Revenue tonne-kilometres)
-9% -7% -15% -7%
Source: Press release, "IATA Traffic Confirms Effect of September 11", International AirTransport Association, URL: http://www.iata.org/pr/pr01octh.htm, 30 October, 2001; Pressrelease, "October Traffic Shows Intensified Decline", International Air Transport Association,URL: http://www.iata.org/pr/pr01novg.htm, 30 November, 2001.