Structural basis of a unique interferon-β signaling axis mediated via the receptor IFNAR1
9
© 2013 Nature America, Inc. All rights reserved. NATURE IMMUNOLOGY ADVANCE ONLINE PUBLICATION ARTICLES The type I interferons are a family of cytokines that are critical to the innate immune response to infection, developing tumors and other inflammatory stimuli. They elicit a wide variety of responses, including antiviral and antibacterial activities, and can regulate the development and activation of virtually every effector cell of the innate and adaptive immune response 1–3 . In the clinic, type I inter- ferons are used to treat infections of hepatitis virus B and C, some hematological malignancies and, specifically in the case of IFN-β, multiple sclerosis 1 . In humans and mice, type I interferons are composed of 14 IFN-α subtypes and IFN-ω, IFN-ε, IFN-τ, IFN-κ and IFN-β. During an innate immune response, type I interferons are produced via stimulation of pattern-recognition receptors that sense viral and bacterial nucleic acids and endogenous ligands 2 . Stimulated pattern-recognition recep- tors activate diverse signal transduction pathways that in turn activate one or more members of the interferon regulatory factor (IRF) family of transcription factors that drive the production of type I interferons 3 . The sensing of pathogens mediated by pattern-recognition receptors results in the production of a subset of IFN-α subtypes and IFN-β. However, as the promoter of Ifnb has other elements in addition to IRF binding sites, including sites for NF-κB and AP-1, IFN-β can be produced in different circumstances compared to those that result in the production of IFN-α subtypes. For example, IFN-β is the only type I interferon induced by lipopolysaccharide (LPS) of Gram-negative bac- teria 4 , activating IRF3 and NF-κB via the TLR4 pathway. IFN-β is also selectively produced in response to signaling via the AP-1 pathway by macrophage colony-stimulating factor and by the cytokine RANKL, and therefore has a role in the development of myeloid cells and osteo- clasts, respectively 5,6 . This selective production of IFN-β implies a function of IFN-β that is different relative to other type I interferons. Despite the fact that IFN-α and IFN-β have as little as ~30% amino acid sequence identity, all subtypes of type I interferons characterized so far interact with, and signal through, a common receptor, IFNAR, which comprises high-affinity (IFNAR2) and low-affinity (IFNAR1) components. The current model for assembly of the interferon sig- naling complex is that interferon initially binds IFNAR2 with the subsequent recruitment of IFNAR1 to initiate signaling 7 . Engagement of this IFNAR2-interferon-IFNAR1 complex activates the canonical Jak-STAT signaling pathway resulting in transcriptional activation or repression of interferon-regulated genes that encode the effectors of the interferon response, such as antiviral proteins, regulators of cell proliferation and differentiation, and immunoregulatory proteins 8 . Recently solved crystal structures of human IFN-ω and a mutant form of human IFN-α2, bound to the extracellular domains (ECDs) of IFNAR2 and a truncated IFNAR1 have provided insight into the mechanism of ligand interaction by the IFNARs 9 . The two ternary complexes are nearly identical, with key conserved anchoring residues and some distinct ligand-specific interactions 9 . Although the IFN-α subtypes and IFN-β signal using the same IFNARs, they nevertheless exhibit functional differences 10 . Namely, IFN-β is more potent than IFN-α in inducing the apoptotic and anti- proliferative pathways required for control of tumor cell growth 11 . IFN-β alleviates the exacerbations of multiple sclerosis, whereas IFN-α does not. Apart from antiviral activities 12 , IFN-β is also important in 1 Centre for Innate Immunity and Infectious Diseases, Monash Institute of Medical Research, Monash University, Clayton, Victoria, Australia. 2 Australian Research Council Centre of Excellence in Structural and Functional Microbial Genomics, Monash University, Clayton, Victoria, Australia. 3 Department of Biochemistry and Molecular Biology, School of Biomedical Sciences, Monash University, Clayton, Victoria, Australia. 4 Institute of Infection and Immunity, Cardiff University, School of Medicine, Heath Park, Cardiff, UK. 5 These authors jointly directed this work. Correspondence should be addressed to P.J.H. ([email protected]) or J.R. ([email protected]). Received 14 February; accepted 19 June; published online 21 July 2013; doi:10.1038/ni.2667 Structural basis of a unique interferon- b signaling axis mediated via the receptor IFNAR1 Nicole A de Weerd 1,2 , Julian P Vivian 3 , Thao K Nguyen 1–3 , Niamh E Mangan 1 , Jodee A Gould 1,2 , Susie-Jane Braniff 1 , Leyla Zaker-Tabrizi 1 , Ka Yee Fung 1 , Samuel C Forster 1,2 , Travis Beddoe 3 , Hugh H Reid 3 , Jamie Rossjohn 2–5 & Paul J Hertzog 1,2,5 Type I interferons are important in regulating immune responses to pathogens and tumors. All interferons are considered to signal via the heterodimeric IFNAR1-IFNAR2 complex, yet some subtypes such as interferon-b (IFN-b) can exhibit distinct functional properties, although the molecular basis of this is unclear. Here we demonstrate IFN-b can uniquely and specifically ligate to IFNAR1 in an IFNAR2-independent manner, and we provide the structural basis of the IFNAR1–IFN- b interaction. The IFNAR1–IFN-b complex transduced signals that modulated expression of a distinct set of genes independently of Jak-STAT pathways. Lipopolysaccharide-induced sepsis was ameliorated in Ifnar1 −/− mice but not Ifnar2 −/− mice, suggesting that IFNAR1– IFN-b signaling is pathologically relevant. Thus, we provide a molecular basis for understanding specific functions of IFN- b.
-
Upload
independent -
Category
Documents
-
view
0 -
download
0
Transcript of Structural basis of a unique interferon-β signaling axis mediated via the receptor IFNAR1

©20
13 N
atu
re A
mer
ica,
Inc.
All
rig
hts
res
erve
d.
nature immunology aDVaNCE ONLINE PUBLICaTION �
A rt i c l e s
The type I interferons are a family of cytokines that are critical to the innate immune response to infection, developing tumors and other inflammatory stimuli. They elicit a wide variety of responses, including antiviral and antibacterial activities, and can regulate the development and activation of virtually every effector cell of the innate and adaptive immune response1–3. In the clinic, type I inter-ferons are used to treat infections of hepatitis virus B and C, some hematological malignancies and, specifically in the case of IFN-β, multiple sclerosis1.
In humans and mice, type I interferons are composed of 14 IFN-α subtypes and IFN-ω, IFN-ε, IFN-τ, IFN-κ and IFN-β. During an innate immune response, type I interferons are produced via stimulation of pattern-recognition receptors that sense viral and bacterial nucleic acids and endogenous ligands2. Stimulated pattern-recognition recep-tors activate diverse signal transduction pathways that in turn activate one or more members of the interferon regulatory factor (IRF) family of transcription factors that drive the production of type I interferons3. The sensing of pathogens mediated by pattern-recognition receptors results in the production of a subset of IFN-α subtypes and IFN-β. However, as the promoter of Ifnb has other elements in addition to IRF binding sites, including sites for NF-κB and AP-1, IFN-β can be produced in different circumstances compared to those that result in the production of IFN-α subtypes. For example, IFN-β is the only type I interferon induced by lipopolysaccharide (LPS) of Gram-negative bac-teria4, activating IRF3 and NF-κB via the TLR4 pathway. IFN-β is also selectively produced in response to signaling via the AP-1 pathway by macrophage colony-stimulating factor and by the cytokine RANKL,
and therefore has a role in the development of myeloid cells and osteo-clasts, respectively5,6. This selective production of IFN-β implies a function of IFN-β that is different relative to other type I interferons.
Despite the fact that IFN-α and IFN-β have as little as ~30% amino acid sequence identity, all subtypes of type I interferons characterized so far interact with, and signal through, a common receptor, IFNAR, which comprises high-affinity (IFNAR2) and low-affinity (IFNAR1) components. The current model for assembly of the interferon sig-naling complex is that interferon initially binds IFNAR2 with the subsequent recruitment of IFNAR1 to initiate signaling7. Engagement of this IFNAR2-interferon-IFNAR1 complex activates the canonical Jak-STAT signaling pathway resulting in transcriptional activation or repression of interferon-regulated genes that encode the effectors of the interferon response, such as antiviral proteins, regulators of cell proliferation and differentiation, and immunoregulatory proteins8. Recently solved crystal structures of human IFN-ω and a mutant form of human IFN-α2, bound to the extracellular domains (ECDs) of IFNAR2 and a truncated IFNAR1 have provided insight into the mechanism of ligand interaction by the IFNARs9. The two ternary complexes are nearly identical, with key conserved anchoring residues and some distinct ligand-specific interactions9.
Although the IFN-α subtypes and IFN-β signal using the same IFNARs, they nevertheless exhibit functional differences10. Namely, IFN-β is more potent than IFN-α in inducing the apoptotic and anti-proliferative pathways required for control of tumor cell growth11. IFN-β alleviates the exacerbations of multiple sclerosis, whereas IFN-α does not. Apart from antiviral activities12, IFN-β is also important in
1Centre for Innate Immunity and Infectious Diseases, Monash Institute of Medical Research, Monash University, Clayton, Victoria, Australia. 2Australian Research Council Centre of Excellence in Structural and Functional Microbial Genomics, Monash University, Clayton, Victoria, Australia. 3Department of Biochemistry and Molecular Biology, School of Biomedical Sciences, Monash University, Clayton, Victoria, Australia. 4Institute of Infection and Immunity, Cardiff University, School of Medicine, Heath Park, Cardiff, UK. 5These authors jointly directed this work. Correspondence should be addressed to P.J.H. ([email protected]) or J.R. ([email protected]).
Received 14 February; accepted 19 June; published online 21 July 2013; doi:10.1038/ni.2667
Structural basis of a unique interferon-b signaling axis mediated via the receptor IFNAR1Nicole A de Weerd1,2, Julian P Vivian3, Thao K Nguyen1–3, Niamh E Mangan1, Jodee A Gould1,2, Susie-Jane Braniff1, Leyla Zaker-Tabrizi1, Ka Yee Fung1, Samuel C Forster1,2, Travis Beddoe3, Hugh H Reid3, Jamie Rossjohn2–5 & Paul J Hertzog1,2,5
Type I interferons are important in regulating immune responses to pathogens and tumors. All interferons are considered to signal via the heterodimeric IFNAR1-IFNAR2 complex, yet some subtypes such as interferon-b (IFN-b) can exhibit distinct functional properties, although the molecular basis of this is unclear. Here we demonstrate IFN-b can uniquely and specifically ligate to IFNAR1 in an IFNAR2-independent manner, and we provide the structural basis of the IFNAR1–IFN-b interaction. The IFNAR1–IFN-b complex transduced signals that modulated expression of a distinct set of genes independently of Jak-STAT pathways. Lipopolysaccharide-induced sepsis was ameliorated in Ifnar1−/− mice but not Ifnar2−/− mice, suggesting that IFNAR1–IFN-b signaling is pathologically relevant. Thus, we provide a molecular basis for understanding specific functions of IFN-b.

©20
13 N
atu
re A
mer
ica,
Inc.
All
rig
hts
res
erve
d.
� aDVaNCE ONLINE PUBLICaTION nature immunology
A rt i c l e s
the development of B cells, myelopoiesis and LPS-inducible production of tumor necrosis factor11. Although the roles of IFN-β in the patho-genesis of LPS toxicity13, myelopoiesis14 and osteoclastogenesis15 are at least in part due to the selective production of IFN-β in these circumstances, it has also been speculated that different biological outcomes between IFN-α and IFN-β result from the relative affinities of the ligands for the two IFNARs and the resulting stability of ter-nary IFNAR2-interferon-IFNAR1 signaling complex16,17. However, a specific structural and mechanistic basis for selective actions of IFN-β has been lacking.
Here we characterize how IFN-β can bind to IFNAR1 independently of IFNAR2. We demonstrate a high-affinity IFNAR1–IFN-β com-plex and provide a structural basis for this specific interaction. This IFNAR1–IFN-β axis leads to transduction of specific, unconventional intracellular signals, and using a mouse model of LPS-induced sep-tic shock, we observed the pathological relevance of IFNAR1–IFN-β signaling to contribute to toxicity in vivo.
RESULTSIFN-b forms a stable complex with IFNAR1To characterize the nature of the interaction of type I interferons with their cognate receptor, we compared the interaction of recom-binant mouse IFN-β and IFN-α with ECDs of each of the IFNAR components. As expected, both IFNs formed a complex with the well-characterized high-affinity receptor component, IFNAR2 ECD (Supplementary Fig. 1a). However, IFNAR1 ECD formed a stable complex with IFN-β, as demonstrated by the presence of a discrete band in a native gel electrophoresis analysis, whereas IFN-α did not (Fig. 1a,b). Using surface plasmon resonance (SPR), we determined the affinity of the IFNAR1 ECD–IFN-β interaction to have a dissocia-tion constant (KD) of 269 ± 30 nM (Fig. 1c), almost 100-fold greater affinity than the IFNAR1 ECD–IFN-α interaction (KD of 22 ± 5 µM; Supplementary Fig. 1b), similar to that reported in the literature for human interferon–IFNAR1 ECD interactions17, and consistent with the inability of IFN-α to form a high-affinity complex with IFNAR1 ECD (Fig. 1a,b and Supplementary Fig. 1b). Thus we focused our attention on characterization of the structure and signaling capacity of the IFNAR1 ECD–IFN-β complex, which was of sufficiently high affin-ity and stability to be purified together by gel-filtration chromatogra-phy (Supplementary Fig. 1c), thus facilitating subsequent analyses.
Overview of the IFNAR1–IFN-b complexTo characterize the interaction between IFN-β and IFNAR1 ECD (here referred to as IFNAR1), we crystallized the IFNAR1–IFN-β
complex and solved the structure to a resolution of 2.9 Å with Rfactor and Rfree values of 24.3% and 28.7%, respectively (Supplementary Table 1). The asymmetric unit contained one heterodimeric complex, comprising IFN-β, the six helices of which are named A, B, C, CD, D and E, and all four fibronectin type III domains of the extracellular domain of IFNAR1, named subdomains 1–4 (SD1–SD4; Fig. 2a,b). Previously determined crystal structures of IFNAR1, either alone or in complex with IFNAR2 bound to either IFN-ω or a mutated form of IFN-α2, comprised three membrane-distal domains of IFNAR1 only (SD1–SD3)9. We determined the binding of IFN-β to be centered on the B helix of the cytokine, with IFNAR1 SD1–SD3 positioned approximately planar to each other, binding to the face of IFN-β opposite the predicted IFNAR2 binding interface, wrapping around the cytokine exposing helices B, C, CD and D (Fig. 2c) to the receptor, similar to the reported receptor binding of IFN-ω and mutant IFN-α2. SD4 of IFNAR1 was transposed 26 Å from the plane of the first three
a
c
b
Native
SDSSize(kDa)
50
A100
IFN
-β b
indi
ng (
% o
f max
)
B
25
IFN-α
IFN-α
+ IF
NAR1 ECD
IFN-β
+ IF
NAR1 ECD
IFN-β
IFNAR1
ECD
80
60
40
20
010 100 1,000
KD = 269 ± 30 nM
IFNAR1 (nM)10,000
Figure 1 Interaction of IFNAR1 with IFN-β. (a) Native PAGE (10%, v/v) analysis of IFN-α, IFN-β, IFNAR1 ECD (indicated at ‘B’) and combinations of IFN-α with IFNAR1 ECD and IFN-β with IFNAR1 ECD. The complex formed between IFN-β and IFNAR1 ECD is indicated (‘A’). (b) Reducing SDS-PAGE (12%, v/v) of samples comparable to those in a. (c) Binding of IFN-β to indicated concentrations of IFNAR1 ECD measured by SPR analysis, analyzed as in ref. 36. Data are representative of three experiments (a,b) or are from three experiments (c; mean ± s.e.m.).
aSD1
SD1
SD1
IFN-β
IFN-β
IFN-β
b c
D D
D
CD CD
CD
BB
B
E
90°
E
E
C
C
C
AA
A
SD2
SD2
SD2
SD3
SD3
SD3
SD4
SD4
SD4
Figure 2 Structure of the IFNAR1–IFN-β complex. (a) Orthogonal views of the IFNAR1–IFN-β complex with IFNAR1 SD1 in yellow, SD2 in green, SD3 in blue and SD4 in magenta. Helices of IFN-β (orange; labeled A–E) are also indicated. (b,c) Footprints mapped to surfaces of IFNAR1 (b) and IFN-β (c), with residues colored in each case according to the interacting IFNAR1 domain, as in a.

©20
13 N
atu
re A
mer
ica,
Inc.
All
rig
hts
res
erve
d.
nature immunology aDVaNCE ONLINE PUBLICaTION �
A rt i c l e s
domains and oriented 162° relative to SD3 (Fig. 2a) such that it formed a separate, albeit limited, binding interface at the N terminus of IFN-β. This was to our knowledge the first complete structure of IFNAR1 containing all four fibronectin type III domains.
The IFNAR1–IFN-b interfaceThe interaction between IFNAR1 and IFN-β buried a total surface area of 3,300 Å2: 18% of the IFN-β surface and 8% of the IFNAR1 surface were sequestered upon formation of the complex. At this interface, SD1, SD2 and SD3 of IFNAR1 contributed to approximately 27%, 36% and 33% of the buried surface area, respectively, whereas SD4 contributed only 5% of the buried surface area (Fig. 2b,c). The interface is predominantly hydrophobic, with 75% residues at the interface involved in van der Waals contacts. The interface includes 11 hydrogen bonds and one salt bridge, and exhibited very good shape complementarity, with a shape complementarity value of 0.75. The interaction interface on IFN-β involves residues from helices A, B, C, CD and D of the cytokine (Fig. 2b,c). SD1, SD2 and SD3 of IFNAR1 formed a contiguous binding interface, with SD1 binding to residues on helices CD and D, SD2 interacting with residues across helices B, C, CD and D, and SD3 binding to helices B and C (Fig. 2b,c).
The interface of SD1 of IFNAR1 with IFN-β was formed through predominantly hydrophobic contacts via a cluster of aromatic resi-dues, namely Tyr70 and Phe97 of IFNAR1 packed against the aliphatic side chain of Lys118 of IFN-β, and with Tyr98 of IFNAR1 intercalated between Met110 and Leu115 of IFN-β situated on helix CD and at the N terminus of helix D (Fig. 3a and Supplementary Table 2). SD1 of IFNAR1 also made contacts about the middle of helix D of IFN-β, predominantly centered on Trp122, making van der Waals contacts with Asp66, Thr67 and Asn68 of IFNAR1 (Fig. 3b).
The binding of SD2 of IFNAR1 overlapped with that of the SD1 about both the Lys118 and the Trp122 contact sites of IFN-β (Fig. 3a,b). Lys118 of IFN-β interacted with Leu183 of IFNAR1 and formed a salt bridge with Glu133 of IFNAR1 (Fig. 3a). Close to Trp122 of IFN-β, the extended loop between the β2 and β3 strands of SD2 of IFNAR1 formed contacts through Leu132 and Asn128 of IFNAR1 (Fig. 3b and Supplementary Table 2). The β2-β3 loop also formed extensive contacts over helix B of IFN-β, with IFNAR1 resi-dues 131–135 forming van der Waals contacts to the aliphatic side chains of Gln60 and Leu64 of IFN-β (Fig. 3c).
SD3 of IFNAR1 bound over the C terminus of helix B of IFN-β and the N terminus of helix C of IFN-β (Figs. 2 and 3c,d). Contacts to helix B were centered on Phe63 and Arg67 of IFN-β that form van der Waals interactions with Tyr240, Ser244 and Ser245 of IFNAR1 on the
extended loop between β3 and β4 strands of SD3 of IFNAR1 (Fig. 3c). The contacts to helix C were formed through residues on the β3-β4 loop of SD3 of IFNAR1 that extended orthogonally over helix C, form-ing a network of van der Waals contacts centered about Val81, Leu84 and His88 of IFN-β and with hydrogen bonds to Asp85 and His88 of IFN-β (Fig. 3d). Residues 274–277 of IFNAR1 on the loop spanning the β5 and β6 strands of SD3 of IFNAR1 also contributed to binding helix C of IFN-β (Fig. 3d). Tyr274 of IFNAR1 was intercalated at the N terminus of helix C between residues ranging from position 72 to position 82 of IFN-β with additional hydrogen bonds formed through a bidentate interaction between the carboxylate of Asp85 of IFN-β and backbone carbonyl and amide, and side chain hydroxyl groups of Thr277 of IFNAR1 (Fig. 3d and Supplementary Table 2). Accordingly, an extensive and complementary interface underpins the IFNAR1–IFN-β interaction.
Comparison with other interferon-IFNAR structuresWe compared the structure of the IFNAR1–IFN-β complex to the pre-viously determined structures of mutant human IFN-α2 and IFN-ω in complex with IFNAR2 and IFNAR1 (ref. 9). Structures of the IFN-α2 and IFN-ω complexes were very similar, with the same docking mode and angle9; this similarity allowed for a more robust interpretation of the low-resolution IFN-α2 structure (4.0 Å resolution) by comparison with the higher-resolution structure of the IFN-ω–containing com-plex (3.5 Å resolution). In the complex of IFNAR1 with IFN-β, the relative angles between SD1–SD3 of IFNAR1 resembled the arrange-ment previously observed in the IFNAR1 complex with IFN-α2 or IFN-ω. Similarly, IFNAR1 bound to the same face of IFN-β as to the IFN-α2 and IFN-ω cytokines. However, the docking angle and thus the relative contribution of specific residues to the interaction was different for IFN-β compared to these other type I interferons. As a result, IFNAR1 docked onto IFN-β at an angle of 16° relative to IFN-α2 and IFN-ω that brought specific residues in helices C, CD and D closer for interactions with IFNAR1 as described below.
Although the orientation of the helices in the IFN-β and IFN-α2 structures diverges, there are regions of sequence conservation at the center of the B, C and D helices where the structures overlay. These intersection points form a network of interactions spanning SD1, SD2 and SD3 of IFNAR1 and coincide with sequence and structural con-servation across IFNAR1 proteins and various interferons from differ-ent species (Supplementary Fig. 2a,b). The intersection point on the D helix of IFN-β, Lys118, is conserved as either a lysine or an arginine in other interferons (Supplementary Fig. 2b). The contacts made to Lys118 of IFN-β by the SD1 residues Tyr70 and Phe97 of IFNAR1 are
a b c d e
Figure 3 Contacts between IFNAR1 and IFN-β. (a) Contacts between IFNAR1 SD1 and SD2 around the IFN-β helix CD and N terminus of helix D. (b) Contacts between IFNAR1 SD1 and SD2 with Trp122 of IFN-β. (c) Contacts between IFNAR1 SD2 and SD3 with the IFN-β helices B and D. (d) Contacts between IFNAR1 SD3 and IFN-β helix C. (e) Contacts between the β2–β3 loop of IFNAR1 SD2 that bind over the point of structural and sequence conservation between helices B of the IFN-β and IFN-ω structures. IFNAR1 SD1 is in yellow, SD2 in green, SD3 in blue and SD4 in magenta; IFN-β helices A–E are in orange.

©20
13 N
atu
re A
mer
ica,
Inc.
All
rig
hts
res
erve
d.
� aDVaNCE ONLINE PUBLICaTION nature immunology
A rt i c l e s
conserved for the human receptor, as is the salt bridge to Glu133 (in human, Asp132) of IFNAR1 on the β2-β3 loop of the SD2 domain (Fig. 3e). The β2-β3 loop on SD2 of IFNAR1 also binds at the point of structural and sequence conservation between the B helices of the IFN-β, IFN-α2 and IFN-ω structures. Namely, there is conserva-tion of the hydrogen bond between Ser136 of IFNAR1 and Gln60 of IFN-β and the van der Waals interactions between Leu132 of IFNAR1 and Asn61 of IFN-β (Fig. 3e). Adjacent to these residues on the B helix is the highly conserved residue Phe63. Phe63 of IFN-β formed a hydrophobic cluster with the conserved aromatic residue Tyr240 of IFNAR1 on the β3-β4 loop of SD3 and with residues on the B helix as well as helix C, including the conserved His88 of IFN-β (Fig. 3e). The conservation of these interconnected binding sites, that span the width of the binding interface, suggests they form the common anchor points for interferon binding.
The differences in the docking angle and the binding affinities observed for IFNAR1 to IFN-α and for IFNAR1 to IFN-β are likely due to the rotation of IFNAR1, about the anchor points, enabling different parts of the receptor to interact with the cytokine. One such point is the CD helix, a section that is clearly resolved in structures of IFN-β but not in other IFN structures to date. Furthermore, the CD helix of IFN-β shifts 3.6 Å upon binding IFNAR1, which accounts for the major structural difference between structures of unbound18 and bound IFN-β, which are otherwise well conserved (r.m.s. deviation = 0.9 Å over all main-chain atoms). This orientation of the CD helix enables interaction with the β5-β6 loop of IFNAR1 SD2, contribut-ing 510 Å2 to the total buried surface at the interface. Similarly, a key point of divergence for IFNAR1 SD1 binding to IFN-β and IFN-α2 (or IFN-ω) occurs at the site of intercalation of Tyr98 of IFNAR1 between Leu115 and Met110 of IFN-β at the junction of CD and D helices (Fig. 3a). This interaction is sterically impermissible with IFNα2 or IFN-ω because of a 3.5 Å shift of the D helix. These differences at the binding interfaces of SD1 and SD2 of IFNAR1 amount to a buried sur-face area for SD1-SD2 binding to IFN-β totaling 2,140 Å2 compared with the equivalent binding to IFN-α2 burying 1,330 Å2 (1,530 Å2 for IFN-ω). Similarly, docking of IFNAR1 to IFN-β brings the β5-β6 loop of SD3 of IFNAR1 into closer proximity with helix C of IFN-β, enabling more extensive contacts at this interface. Specifically, SD3 of IFNAR1 buries 1,150 Å2 at the IFN-β interface compared with 820 Å2 at the IFN-α2 interface (860 Å2 for IFN-ω). Taken together, the total buried surface area of the IFNAR1–IFN-β complex amounting
to 3,300 Å2 is more substantial than that of the IFNAR1–IFN-α2 interface totaling 2,030 Å2 (2,200 Å2 for IFN-ω), and approaches the total surface area of the IFNAR1–IFN-α2–IFNAR2 interface area of 3,800 Å2 (4,080 Å2 for IFN-ω). Accordingly, this increased binding interface accounts for the approximately 100-fold increase in binding affinity of IFNAR1 to IFN-β compared with IFN-α.
IFNAR1–IFN-b signalingHaving demonstrated a nanomolar affinity interaction between IFNAR1 and IFN-β, and resolved the corresponding structure of this complex, we next determined whether this interaction trans-duced signals in the absence of IFNAR2. To this end, we used mice with a null mutation in the Ifnar2 gene, which were otherwise phe-notypically normal19. Because an early step in signal transduction after ligand binding is the internalization of the receptor, we first investigated whether IFNAR1 was internalized after binding IFN-β in Ifnar2−/− cells. Peritoneal exudate cells (PECs) from wild-type and Ifnar2−/− mice expressed similar amounts of IFNAR1 on their cell surface as determined by flow cytometry using a monoclonal anti-body to IFNAR1 (ref. 20) (Fig. 4a). After addition of IFN-β, ~50% of the receptors were removed from the surface of cells from Ifnar2−/− mice (P < 0.01), which was less than the 80% of receptors that were removed from the surface of wild-type cells. Thus, in the absence of IFNAR2, cell-surface IFNAR1 initiated the first step required for signal transduction in response to IFN-β.
We then examined another early step in conventional type I inter-feron signaling, namely the activation of the Jak-STAT pathway. We did not observe any activation of STAT1 in Ifnar2−/− cells upon stimulation with IFN-β (Supplementary Fig. 3a) similar to observations in Ifnar1−/− cells21. Furthermore, we did not observe measurable activation of STAT3 or STAT5 as determined by flow cytometry or immunoblotting of PECs (data not shown) from Ifnar1−/−, Ifnar2−/− or wild-type mice. Given the absence of the high-affinity receptor IFNAR2, which contains STAT docking sites22, it was unsur-prising that conventional signaling pathways were not activated via IFNAR1 alone.
As IFNAR1 did not activate conventional Jak-STAT signaling in response to IFN-β, we hypothesized that the internalized IFNAR1 would transduce unconventional signaling. Therefore, we next used genome-wide expression profiling to determine signaling as indicated by regulation of gene expression activated by IFN-β binding to
00 60 0 60
200
400
600
800
1,000
MF
I
a
**
**
Time (min)
WTIfnar2–/–
***
0
20
40
60
80
100
Pro
k2 m
RN
A (
rela
tive)
UT UTIFN-β IFN-β
*
0
2
4
6
8
10
Trem
l4 m
RN
A (
rela
tive) **
UT UTIFN-β IFN-β
***
0
1
2
3
4
5
Mm
p14
mR
NA
(re
lativ
e)
**
c WTIfnar2–/–
UT UTIFN-β IFN-β
6
4
2
0
–2
–1.7 0 5.2
b
IFN-βUT
Inte
nsity
(lo
g 2 sc
ale)
Figure 4 IFNAR1 signaling in response to IFN-β in Ifnar2−/− mice. (a) PECs from wild-type (WT) and Ifnar2−/− mice (at least 3 mice per genotype per treatment) were incubated ex vivo with IFN-β (1,000 IU/ml) for 60 min, then the abundance of surface IFNAR1 was measured by flow cytometry. Results are shown as mean fluorescence intensity (MFI; mean ± s.e.m.) above background staining (isotype control antibody). **P < 0.01 (Student’s t-test). (b) Changes in gene expression (normalized intensity values relative to untreated controls) in PECs extracted from untreated (UT) and in vivo IFN-β–treated (10,000 IU/mouse; 3 h) Ifnar2−/− mice. Gene expression intensity from triplicate untreated (UT) and triplicate IFN-β–treated mice were subjected to an unpaired t-test (P < 0.05); only data for genes that were statistically replicable are shown (2,955 genes). Genes upregulated by IFN-β treatment are shown in red; downregulated in blue. (c) Quantitative RT-PCR validation of Mmp14, Treml4 and Prok2 mRNA levels in PECs extracted from untreated (UT) WT and Ifnar2−/− mice or from mice 3 h after intraperitoneal administration of IFN-β (10,000 IU/mouse; 5 mice per genotype). Data are presented as mean ± s.e.m. of triplicate experiments. ***P < 0.001, **P < 0.01, *P < 0.05 (Student’s t-test).
©20
13 N
atu
re A
mer
ica,
Inc.
All
rig
hts
res
erve
d.
nature immunology aDVaNCE ONLINE PUBLICaTION �
A rt i c l e s
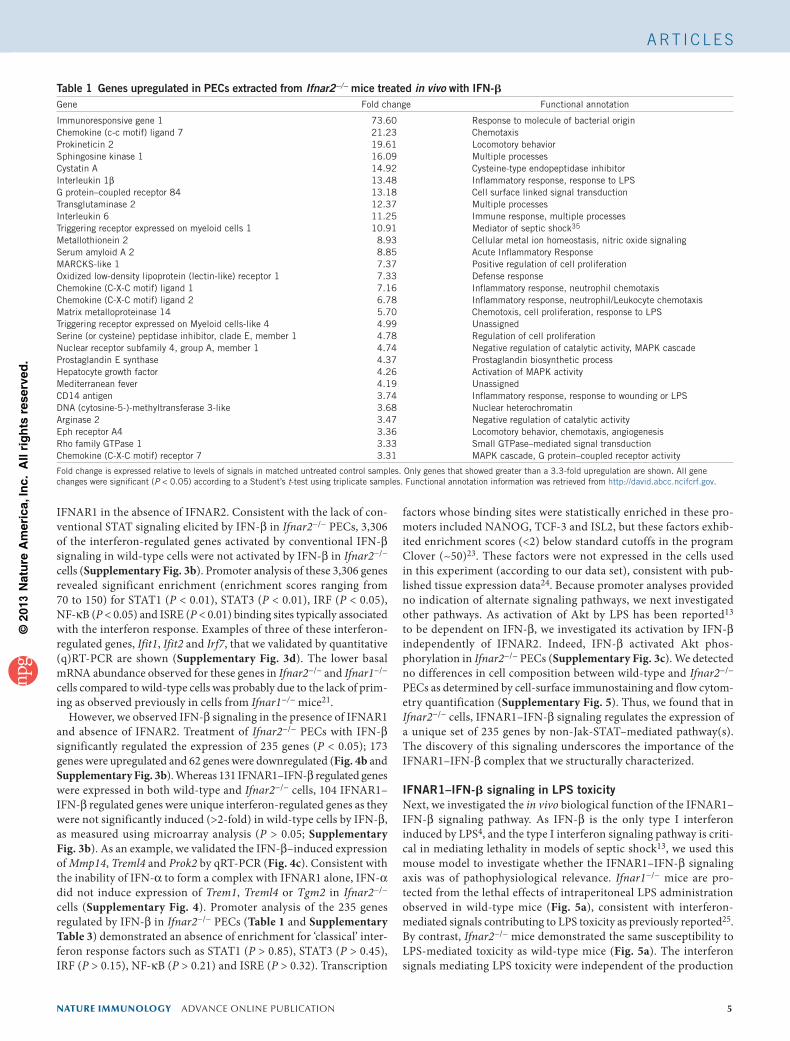
IFNAR1 in the absence of IFNAR2. Consistent with the lack of con-ventional STAT signaling elicited by IFN-β in Ifnar2−/− PECs, 3,306 of the interferon-regulated genes activated by conventional IFN-β signaling in wild-type cells were not activated by IFN-β in Ifnar2−/− cells (Supplementary Fig. 3b). Promoter analysis of these 3,306 genes revealed significant enrichment (enrichment scores ranging from 70 to 150) for STAT1 (P < 0.01), STAT3 (P < 0.01), IRF (P < 0.05), NF-κB (P < 0.05) and ISRE (P < 0.01) binding sites typically associated with the interferon response. Examples of three of these interferon-regulated genes, Ifit1, Ifit2 and Irf7, that we validated by quantitative (q)RT-PCR are shown (Supplementary Fig. 3d). The lower basal mRNA abundance observed for these genes in Ifnar2−/− and Ifnar1−/− cells compared to wild-type cells was probably due to the lack of prim-ing as observed previously in cells from Ifnar1−/− mice21.
However, we observed IFN-β signaling in the presence of IFNAR1 and absence of IFNAR2. Treatment of Ifnar2−/− PECs with IFN-β significantly regulated the expression of 235 genes (P < 0.05); 173 genes were upregulated and 62 genes were downregulated (Fig. 4b and Supplementary Fig. 3b). Whereas 131 IFNAR1–IFN-β regulated genes were expressed in both wild-type and Ifnar2−/− cells, 104 IFNAR1–IFN-β regulated genes were unique interferon-regulated genes as they were not significantly induced (>2-fold) in wild-type cells by IFN-β, as measured using microarray analysis (P > 0.05; Supplementary Fig. 3b). As an example, we validated the IFN-β–induced expression of Mmp14, Treml4 and Prok2 by qRT-PCR (Fig. 4c). Consistent with the inability of IFN-α to form a complex with IFNAR1 alone, IFN-α did not induce expression of Trem1, Treml4 or Tgm2 in Ifnar2−/− cells (Supplementary Fig. 4). Promoter analysis of the 235 genes regulated by IFN-β in Ifnar2−/− PECs (Table 1 and Supplementary Table 3) demonstrated an absence of enrichment for ‘classical’ inter-feron response factors such as STAT1 (P > 0.85), STAT3 (P > 0.45), IRF (P > 0.15), NF-κB (P > 0.21) and ISRE (P > 0.32). Transcription
factors whose binding sites were statistically enriched in these pro-moters included NANOG, TCF-3 and ISL2, but these factors exhib-ited enrichment scores (<2) below standard cutoffs in the program Clover (~50)23. These factors were not expressed in the cells used in this experiment (according to our data set), consistent with pub-lished tissue expression data24. Because promoter analyses provided no indication of alternate signaling pathways, we next investigated other pathways. As activation of Akt by LPS has been reported13 to be dependent on IFN-β, we investigated its activation by IFN-β independently of IFNAR2. Indeed, IFN-β activated Akt phos-phorylation in Ifnar2−/− PECs (Supplementary Fig. 3c). We detected no differences in cell composition between wild-type and Ifnar2−/− PECs as determined by cell-surface immunostaining and flow cytom-etry quantification (Supplementary Fig. 5). Thus, we found that in Ifnar2−/− cells, IFNAR1–IFN-β signaling regulates the expression of a unique set of 235 genes by non-Jak-STAT–mediated pathway(s). The discovery of this signaling underscores the importance of the IFNAR1–IFN-β complex that we structurally characterized.
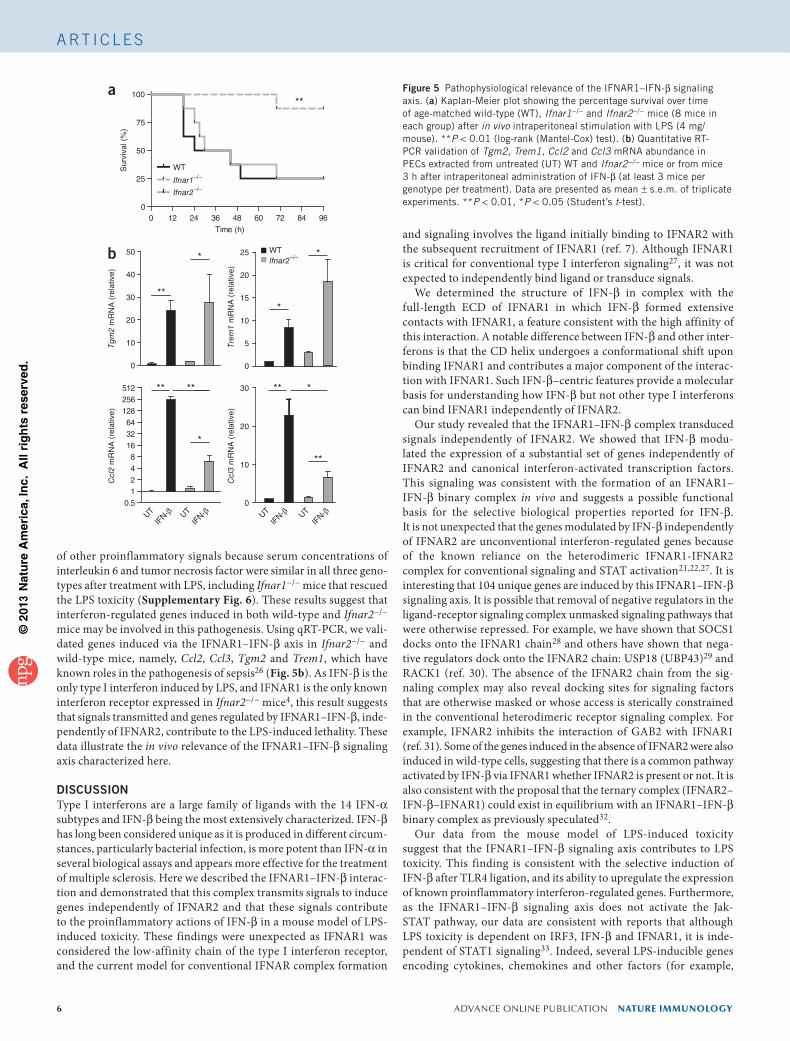
IFNAR1–IFN-b signaling in LPS toxicityNext, we investigated the in vivo biological function of the IFNAR1–IFN-β signaling pathway. As IFN-β is the only type I interferon induced by LPS4, and the type I interferon signaling pathway is criti-cal in mediating lethality in models of septic shock13, we used this mouse model to investigate whether the IFNAR1–IFN-β signaling axis was of pathophysiological relevance. Ifnar1−/− mice are pro-tected from the lethal effects of intraperitoneal LPS administration observed in wild-type mice (Fig. 5a), consistent with interferon-mediated signals contributing to LPS toxicity as previously reported25. By contrast, Ifnar2−/− mice demonstrated the same susceptibility to LPS-mediated toxicity as wild-type mice (Fig. 5a). The interferon signals mediating LPS toxicity were independent of the production
Table 1 Genes upregulated in PECs extracted from Ifnar2−/− mice treated in vivo with IFN-bGene Fold change Functional annotation
Immunoresponsive gene 1 73.60 Response to molecule of bacterial originChemokine (c-c motif) ligand 7 21.23 ChemotaxisProkineticin 2 19.61 Locomotory behaviorSphingosine kinase 1 16.09 Multiple processesCystatin A 14.92 Cysteine-type endopeptidase inhibitorInterleukin 1β 13.48 Inflammatory response, response to LPSG protein–coupled receptor 84 13.18 Cell surface linked signal transductionTransglutaminase 2 12.37 Multiple processesInterleukin 6 11.25 Immune response, multiple processesTriggering receptor expressed on myeloid cells 1 10.91 Mediator of septic shock35
Metallothionein 2 8.93 Cellular metal ion homeostasis, nitric oxide signalingSerum amyloid A 2 8.85 Acute Inflammatory ResponseMARCKS-like 1 7.37 Positive regulation of cell proliferationOxidized low-density lipoprotein (lectin-like) receptor 1 7.33 Defense responseChemokine (C-X-C motif) ligand 1 7.16 Inflammatory response, neutrophil chemotaxisChemokine (C-X-C motif) ligand 2 6.78 Inflammatory response, neutrophil/Leukocyte chemotaxisMatrix metalloproteinase 14 5.70 Chemotoxis, cell proliferation, response to LPSTriggering receptor expressed on Myeloid cells-like 4 4.99 UnassignedSerine (or cysteine) peptidase inhibitor, clade E, member 1 4.78 Regulation of cell proliferationNuclear receptor subfamily 4, group A, member 1 4.74 Negative regulation of catalytic activity, MAPK cascadeProstaglandin E synthase 4.37 Prostaglandin biosynthetic processHepatocyte growth factor 4.26 Activation of MAPK activityMediterranean fever 4.19 UnassignedCD14 antigen 3.74 Inflammatory response, response to wounding or LPSDNA (cytosine-5-)-methyltransferase 3-like 3.68 Nuclear heterochromatinArginase 2 3.47 Negative regulation of catalytic activityEph receptor A4 3.36 Locomotory behavior, chemotaxis, angiogenesisRho family GTPase 1 3.33 Small GTPase–mediated signal transductionChemokine (C-X-C motif) receptor 7 3.31 MAPK cascade, G protein–coupled receptor activity
Fold change is expressed relative to levels of signals in matched untreated control samples. Only genes that showed greater than a 3.3-fold upregulation are shown. All gene changes were significant (P < 0.05) according to a Student’s t-test using triplicate samples. Functional annotation information was retrieved from http://david.abcc.ncifcrf.gov.
©20
13 N
atu
re A
mer
ica,
Inc.
All
rig
hts
res
erve
d.
� aDVaNCE ONLINE PUBLICaTION nature immunology
A rt i c l e s
of other proinflammatory signals because serum concentrations of interleukin 6 and tumor necrosis factor were similar in all three geno-types after treatment with LPS, including Ifnar1−/− mice that rescued the LPS toxicity (Supplementary Fig. 6). These results suggest that interferon-regulated genes induced in both wild-type and Ifnar2−/− mice may be involved in this pathogenesis. Using qRT-PCR, we vali-dated genes induced via the IFNAR1–IFN-β axis in Ifnar2−/− and wild-type mice, namely, Ccl2, Ccl3, Tgm2 and Trem1, which have known roles in the pathogenesis of sepsis26 (Fig. 5b). As IFN-β is the only type I interferon induced by LPS, and IFNAR1 is the only known interferon receptor expressed in Ifnar2−/− mice4, this result suggests that signals transmitted and genes regulated by IFNAR1–IFN-β, inde-pendently of IFNAR2, contribute to the LPS-induced lethality. These data illustrate the in vivo relevance of the IFNAR1–IFN-β signaling axis characterized here.
DISCUSSIONType I interferons are a large family of ligands with the 14 IFN-α subtypes and IFN-β being the most extensively characterized. IFN-β has long been considered unique as it is produced in different circum-stances, particularly bacterial infection, is more potent than IFN-α in several biological assays and appears more effective for the treatment of multiple sclerosis. Here we described the IFNAR1–IFN-β interac-tion and demonstrated that this complex transmits signals to induce genes independently of IFNAR2 and that these signals contribute to the proinflammatory actions of IFN-β in a mouse model of LPS-induced toxicity. These findings were unexpected as IFNAR1 was considered the low-affinity chain of the type I interferon receptor, and the current model for conventional IFNAR complex formation
and signaling involves the ligand initially binding to IFNAR2 with the subsequent recruitment of IFNAR1 (ref. 7). Although IFNAR1 is critical for conventional type I interferon signaling27, it was not expected to independently bind ligand or transduce signals.
We determined the structure of IFN-β in complex with the full-length ECD of IFNAR1 in which IFN-β formed extensive contacts with IFNAR1, a feature consistent with the high affinity of this interaction. A notable difference between IFN-β and other inter-ferons is that the CD helix undergoes a conformational shift upon binding IFNAR1 and contributes a major component of the interac-tion with IFNAR1. Such IFN-β–centric features provide a molecular basis for understanding how IFN-β but not other type I interferons can bind IFNAR1 independently of IFNAR2.
Our study revealed that the IFNAR1–IFN-β complex transduced signals independently of IFNAR2. We showed that IFN-β modu-lated the expression of a substantial set of genes independently of IFNAR2 and canonical interferon-activated transcription factors. This signaling was consistent with the formation of an IFNAR1– IFN-β binary complex in vivo and suggests a possible functional basis for the selective biological properties reported for IFN-β. It is not unexpected that the genes modulated by IFN-β independently of IFNAR2 are unconventional interferon-regulated genes because of the known reliance on the heterodimeric IFNAR1-IFNAR2 complex for conventional signaling and STAT activation21,22,27. It is interesting that 104 unique genes are induced by this IFNAR1–IFN-β signaling axis. It is possible that removal of negative regulators in the ligand-receptor signaling complex unmasked signaling pathways that were otherwise repressed. For example, we have shown that SOCS1 docks onto the IFNAR1 chain28 and others have shown that nega-tive regulators dock onto the IFNAR2 chain: USP18 (UBP43)29 and RACK1 (ref. 30). The absence of the IFNAR2 chain from the sig-naling complex may also reveal docking sites for signaling factors that are otherwise masked or whose access is sterically constrained in the conventional heterodimeric receptor signaling complex. For example, IFNAR2 inhibits the interaction of GAB2 with IFNAR1 (ref. 31). Some of the genes induced in the absence of IFNAR2 were also induced in wild-type cells, suggesting that there is a common pathway activated by IFN-β via IFNAR1 whether IFNAR2 is present or not. It is also consistent with the proposal that the ternary complex (IFNAR2– IFN-β–IFNAR1) could exist in equilibrium with an IFNAR1–IFN-β binary complex as previously speculated32.
Our data from the mouse model of LPS-induced toxicity suggest that the IFNAR1–IFN-β signaling axis contributes to LPS toxicity. This finding is consistent with the selective induction of IFN-β after TLR4 ligation, and its ability to upregulate the expression of known proinflammatory interferon-regulated genes. Furthermore, as the IFNAR1–IFN-β signaling axis does not activate the Jak-STAT pathway, our data are consistent with reports that although LPS toxicity is dependent on IRF3, IFN-β and IFNAR1, it is inde-pendent of STAT1 signaling33. Indeed, several LPS-inducible genes encoding cytokines, chemokines and other factors (for example,
WT
Ifnar1–/–
Ifnar2–/–
0 12 24 36 48 60 72 84 960
25
50
75
100
Time (h)
Sur
viva
l (%
)
a**
0
10
20
30
Ccl
3 m
RN
A (
rela
tive)
0.51248
163264
128256512
Ccl
2 m
RN
A (
rela
tive)
0
10
20
30
40
50
Tgm
2 m
RN
A (
rela
tive)
b
0
5
10
15
20
25
Trem
1 m
RN
A (
rela
tive)
**
**
IFN-β
IFN-βUT UT
IFN-β
IFN-βUT UT
** **
*
*
**
* *
*
WTIfnar2–/–
Figure 5 Pathophysiological relevance of the IFNAR1–IFN-β signaling axis. (a) Kaplan-Meier plot showing the percentage survival over time of age-matched wild-type (WT), Ifnar1−/− and Ifnar2−/− mice (8 mice in each group) after in vivo intraperitoneal stimulation with LPS (4 mg/ mouse). **P < 0.01 (log-rank (Mantel-Cox) test). (b) Quantitative RT-PCR validation of Tgm2, Trem1, Ccl2 and Ccl3 mRNA abundance in PECs extracted from untreated (UT) WT and Ifnar2−/− mice or from mice 3 h after intraperitoneal administration of IFN-β (at least 3 mice per genotype per treatment). Data are presented as mean ± s.e.m. of triplicate experiments. **P < 0.01, *P < 0.05 (Student’s t-test).

©20
13 N
atu
re A
mer
ica,
Inc.
All
rig
hts
res
erve
d.
nature immunology aDVaNCE ONLINE PUBLICaTION �
A rt i c l e s
Tgm2 (ref. 34) and TREM1 (ref. 35)) known to contribute to the pathogenesis of septic shock26 are upregulated in the IFN-β signaling axis we identified in this study and may provide clues to the mechanism of action of the in vivo toxicity mediated by IFN-β in this disease model. Thus our studies indicate that the IFNAR1– IFN-β signaling axis characterized is of primary importance in LPS toxicity and regulates the expression of several candidate effector molecules previously implicated in this syndrome and other inflam-matory conditions.
METHODSMethods and any associated references are available in the online version of the paper.
Accession codes. Gene Expression Omnibus: GSE48827. Protein Data Bank: 3WCY.
Note: Any Supplementary Information and Source Data files are available in the online version of the paper.
ACKNoWLEdGMENTSWe thank R. Smith and R. Hartmann for helpful discussions and the staff at the MX1 and MX2 beamlines at the Australian synchrotron for assistance with data collection. The Endoglycosidase H clone was a gift from K.C. Garcia (Stanford University). This work is supported by funding from the National Health and Medical Research Council (NHMRC), The Australian Research Council (ARC), the Victorian Government’s Operational Infrastructure Support Program and the ARC Centre for Excellence in Structural and Functional Microbial Genomics. J.P.V. is supported by an ARC Discovery Early Career Researcher Award fellowship. N.E.M. is supported by an ARC fellowship and NHMRC. T.B. is supported by a Pfizer Australia Research Fellowship. P.J.H. is supported by an NHMRC Senior Principal Research fellowship, J.R. is supported by an NHMRC Australia Fellowship.
AUTHoR CoNTRIBUTIoNSN.A.d.W. carried out experiments, analyzed data, contributed to preparing the manuscript; J.P.V. solved the structure and contributed to writing the manuscript; T.K.N. and L.Z.-T. purified proteins; N.E.M. carried out in vivo mouse experiments and flow cytometry; S.-J.B. carried out in vivo LPS experiments; J.A.G. carried out microarray data and analysis; K.Y.F. carried out qRT-PCR; S.C.F. carried out microarray, promoter and transcription factor analysis; T.B. carried out SPR experiments and analysis; H.H.R. carried out protein expression and purification; and J.R. and P.J.H. led the investigation, devised the project, analyzed the data and wrote the manuscript together.
CoMPETING FINANCIAL INTERESTSThe authors declare competing financial interests: details are available in the online version of the paper.
reprints and permissions information is available online at http://www.nature.com/reprints/index.html.
1. Pestka, S. The interferons: 50 years after their discovery, there is much more to learn. J. Biol. Chem. 282, 20047–20051 (2007).
2. Medzhitov, R. Toll-like receptors and innate immunity. Nat. Rev. Immunol. 1, 135–145 (2001).
3. Barnes, B., Lubyova, B. & Pitha, P.M. On the role of IRF in host defense. J. Interferon Cytokine Res. 22, 59–71 (2002).
4. Gessani, S., Belardelli, F., Pecorelli, A., Puddu, P. & Baglioni, C. Bacterial lipopolysaccharide and gamma interferon induce transcription of beta interferon mRNA and interferon secretion in murine macrophages. J. Virol. 63, 2785–2789 (1989).
5. Hamilton, J.A., Whitty, G.A., Kola, I. & Hertzog, P.J. Endogenous IFN-alpha beta suppresses colony-stimulating factor (CSF)-1-stimulated macrophage DNA synthesis and mediates inhibitory effects of lipopolysaccharide and TNF-alpha. J. Immunol. 156, 2553–2557 (1996).
6. Takayanagi, H., Kim, S. & Taniguchi, T. Signaling crosstalk between RANKL and interferons in osteoclast differentiation. Arthritis Res. 4 (suppl. 3), S227–S232 (2002).
7. Lamken, P. et al. Functional cartography of the ectodomain of the type I interferon receptor subunit ifnar1. J. Mol. Biol. 350, 476–488 (2005).
8. Stark, G.R., Kerr, I.M., Williams, B.R., Silverman, R.H. & Schreiber, R.D. How cells respond to interferons. Annu. Rev. Biochem. 67, 227–264 (1998).
9. Thomas, C. et al. Structural linkage between ligand discrimination and receptor activation by type I interferons. Cell 146, 621–632 (2011).
10. Platanias, L.C., Uddin, S. & Colamonici, O.R. Tyrosine phosphorylation of the alpha and beta subunits of the type I interferon receptor. Interferon-beta selectively induces tyrosine phosphorylation of an alpha subunit-associated protein. J. Biol. Chem. 269, 17761–17764 (1994).
11. Deonarain, R. et al. Critical roles for IFN-beta in lymphoid development, myelopoiesis, and tumor development: links to tumor necrosis factor alpha. Proc. Natl. Acad. Sci. USA 100, 13453–13458 (2003).
12. Deonarain, R. et al. Impaired antiviral response and alpha/beta interferon induction in mice lacking beta interferon. J. Virol. 74, 3404–3409 (2000).
13. Thomas, K.E., Galligan, C.L., Newman, R.D., Fish, E.N. & Vogel, S.N. Contribution of interferon-beta to the murine macrophage response to the toll-like receptor 4 agonist, lipopolysaccharide. J. Biol. Chem. 281, 31119–31130 (2006).
14. Chawla-Sarkar, M., Leaman, D.W. & Borden, E.C. Preferential induction of apoptosis by interferon (IFN)-beta compared with IFN-alpha2: correlation with TRAIL/Apo2L induction in melanoma cell lines. Clin. Cancer Res. 7, 1821–1831 (2001).
15. Coelho, L.F., Magno de Freitas Almeida, G., Mennechet, F.J., Blangy, A. & Uze, G. Interferon-alpha and -beta differentially regulate osteoclastogenesis: role of differential induction of chemokine CXCL11 expression. Proc. Natl. Acad. Sci. USA 102, 11917–11922 (2005).
16. Kalie, E., Jaitin, D.A., Podoplelova, Y., Piehler, J. & Schreiber, G. The stability of the ternary interferon-receptor complex rather than the affinity to the individual subunits dictates differential biological activities. J. Biol. Chem. 283, 32925–32936 (2008).
17. Jaks, E., Gavutis, M., Uze, G., Martal, J. & Piehler, J. Differential receptor subunit affinities of type I interferons govern differential signal activation. J. Mol. Biol. 366, 525–539 (2007).
18. Senda, T., Saitoh, S. & Mitsui, Y. Refined crystal structure of recombinant murine interferon-beta at 2.15 A resolution. J. Mol. Biol. 253, 187–207 (1995).
19. Fenner, J.E. et al. Suppressor of cytokine signaling 1 regulates the immune response to infection by a unique inhibition of type I interferon activity. Nat. Immunol. 7, 33–39 (2006).
20. Sheehan, K.C. et al. Blocking monoclonal antibodies specific for mouse IFN-alpha/beta receptor subunit 1 (IFNAR-1) from mice immunized by in vivo hydrodynamic transfection. J. Interferon Cytokine Res. 26, 804–819 (2006).
21. Gough, D.J. et al. Functional crosstalk between type I and II interferon through the regulated expression of STAT1. PLoS Biol. 8, e1000361 (2010).
22. Zhao, W. et al. A conserved IFN-alpha receptor tyrosine motif directs the biological response to type I IFNs. J. Immunol. 180, 5483–5489 (2008).
23. Frith, M.C. et al. Detection of functional DNA motifs via statistical over-representation. Nucleic Acids Res. 32, 1372–1381 (2004).
24. Wu, C., Macleod, I. & Su, A.I. BioGPS and MyGene.info: organizing online, gene-centric information. Nucleic Acids Res. 41, D561–D565 (2013).
25. Mahieu, T. et al. The wild-derived inbred mouse strain SPRET/Ei is resistant to LPS and defective in IFN-beta production. Proc. Natl. Acad. Sci. USA 103, 2292–2297 (2006).
26. Cohen, J. The immunopathogenesis of sepsis. Nature 420, 885–891 (2002).27. Hwang, S.Y. et al. A null mutation in the gene encoding a type I interferon
receptor component eliminates antiproliferative and antiviral responses to interferons alpha and beta and alters macrophage responses. Proc. Natl. Acad. Sci. USA 92, 11284–11288 (1995).
28. Piganis, R.A. et al. Suppressor of cytokine signaling (SOCS)1 inhibits type I interferon (IFN) signaling via the IFNAR1 associated tyrosine kinase, Tyk2. J. Biol. Chem. 286, 33811–33818 (2011).
29. Malakhova, O.A. et al. UBP43 is a novel regulator of interferon signaling independent of its ISG15 isopeptidase activity. EMBO J. 25, 2358–2367 (2006).
30. Usacheva, A. et al. The WD motif-containing protein receptor for activated protein kinase C (RACK1) is required for recruitment and activation of signal transducer and activator of transcription 1 through the type I interferon receptor. J. Biol. Chem. 276, 22948–22953 (2001).
31. Baychelier, F. et al. Involvement of the Gab2 scaffolding adapter in type I interferon signalling. Cell. Signal. 19, 2080–2087 (2007).
32. Gavutis, M., Jaks, E., Lamken, P. & Piehler, J. Determination of the two-dimensional interaction rate constants of a cytokine receptor complex. Biophys. J. 90, 3345–3355 (2006).
33. Karaghiosoff, M. et al. Central role for type I interferons and Tyk2 in lipopolysaccharide-induced endotoxin shock. Nat. Immunol. 4, 471–477 (2003).
34. Falasca, L. et al. Transglutaminase type II is involved in the pathogenesis of endotoxic shock. J. Immunol. 180, 2616–2624 (2008).
35. Bouchon, A., Facchetti, F., Weigand, M.A. & Colonna, M. TREM-1 amplifies inflammation and is a crucial mediator of septic shock. Nature 410, 1103–1107 (2001).
36. Millen, S.H., Lewallen, D.M., Herr, A.B., Iyer, S.S. & Weiss, A.A. Identification and characterization of the carbohydrate ligands recognized by pertussis toxin via a glycan microarray and surface plasmon resonance. Biochemistry 49, 5954–5967 (2010).

©20
13 N
atu
re A
mer
ica,
Inc.
All
rig
hts
res
erve
d.
nature immunology doi:10.1038/ni.2667
ONLINE METHODSRecombinant protein production and purification. The ECD of IFNAR1 expressed during this study corresponds to residues 27–429 encoded by mouse Ifnar1 (GenBank AAA37890.1)37. IFN-β corresponds to residues 24–182 encoded by mouse Ifnb (RefSeq NP_034640.1). Endoglycosidase H (EndoH) corresponds to residues 54–268 encoded by Streptomyces spp. endoH (GenBank ENH74786.1). For insect cell culture expression, recombinant proteins were cloned into a modified version of pFastBac HTa vector (Invitrogen) contain-ing the gp67 signal sequence of the A. californica nuclear polyhedrosis virus followed by an N-terminal, enterokinase-cleavable, six-histidine tag. For expression using the Bac-to-Bac expression system (Invitrogen), recombinant bacmids were generated in the AcBac∆CC bacmid38 and virus produced after transfection of Spodoptera frugiperda (Sf9) insect cells. Proteins were expressed via baculovirus infection of suspension Trichoplusia ni (Hi5) insect cells and purified from the culture supernatant by dialysis into TBS (10 mM Tris-HCl, pH 8.0, and 150 mM NaCl) before affinity chromatography in TBS contain-ing 20 mM imidazole over a nickel-charged Sepharose 6 Fast Flow column (GE Healthcare). Proteins were eluted in TBS containing 150 mM imidazole. Size-exclusion chromatography was carried out in TBS over an S200 16/60 size exclusion column (GE Healthcare). For purification of the IFNAR1–IFN-β complex coexpressed in the presence of EndoH, the affinity-purified preparation was subjected to a second round of affinity purification over a Concanavalin A Sepharose (GE Healthcare) column in TBS before size- exclusion chromatography. The gene encoding mouse IFNAR2 ECD (C94S variant) was expressed by transient transfection in HEK293S cells, and IFNAR2 protein was purified from culture supernatants using methods previously described39. This protein is referred to as IFNAR2 throughout this study.
PAGE analysis of protein interactions. All native polyacrylamide gels were composed of 10% (w/v) polyacrylamide:bis-acrylamide and 0.375 M Tris-HCl, pH 8.8, and were run in native running buffer (25 mM Tris-HCl, pH 8.3, and 192 mM glycine) at 100 V for 2 h, before Coomassie staining. For analysis of all native interactions, proteins were combined at a 1:1 molar ratio before loading onto the gels.
Surface-plasmon resonance. All SPR experiments were conducted in triplicate at 25 °C on a Biacore 3000 instrument using a buffer of 10 mM 4-(2-hydroxyethyl)- 1-piperazineethanesulfonic acid (HEPES, pH 7.4), 500 mM NaCl and 0.005% (v/v) surfactant P20 supplied by the manufacturer. IFNAR1 ECD was immo-bilized onto a CM5 chip according to manufacturer’s instructions. Various concentrations of IFN-β or IFN-α (2.37–300 µM) were then injected at 50 µl/min over the chip. The final response of IFNAR1–IFN-β or IFNAR1– IFN-α complex formation was calculated by subtracting the response of the blank flow cell. Pseudo-equilibrium analysis data were analyzed using GraphPad Prism according to ref. 36. For inhibition studies, IFNAR1 ECD (280 nM) was incubated with various concentrations of IFN-β or IFN-α (50–500 nM) for 1 h at 22 °C before being passed over the immobilized IFNAR1 ECD at 5 µl/min for 1 min. After each injection, the surface was regenerated with two injections of 4 M MgCl2. The amount of IFNAR1 ECD bound at equilibrium was used to generate the inhibition curve (data points show mean ± s.e.m.) that was analyzed by nonlinear regression using GraphPad Prism software.
Protein crystallization, data collection and structure determination. Crystals of the IFNAR1–IFN-β complex were grown by the hanging-drop vapor diffusion method at 24 °C of IFNAR1–IFN-β (1 µl at 12 mg/ml), in 10 mM Tris-HCl, pH 8.0, and 150 mM NaCl was mixed with 1 µl of reser-voir solution comprising 12% (v/v) PEG 3350, 8% (v/v) tacsimate pH 6.0. Before data collection, the crystals were equilibrated in a solution consisting of the reservoir solution enriched with 30% (v/v) PEG 3350 and then flash-cooled in a liquid nitrogen stream at –173 °C. Native data to 2.9 Å resolution were collected on the Macromolecular Crystallography (MX2) beamline of the Australian Synchrotron. The data were integrated and scaled using the MOSFLM and SCALA programs from the CCP4 program suite40. Structural determination was achieved by a combination of molecular replacement and single-wavelength anomalous diffraction (SAD) phasing as implemented in PHENIX41. The position of the IFN-β cytokine was found by molecular replacement using PHASER42 with the crystal structure of IFN-β (Protein Data
Bank (PDB): 1WU3; ref. 18) used as the search model. The position of SD2 and SD3 of IFNAR1were similarly placed using PHASER with SD2 and SD3 of human IFNAR1 used as the search model (PDB: 3SE4; ref. 9). SD1 and SD4 of IFNAR1 were visualized in density modified electron density maps resulting from MR-SAD phasing using the partially determined molecular replacement model and SAD phases from a Ta6Br12 soaked crystal. Models of SD1 and SD4 of IFNAR1 were generated from the structure of SD2 of IFNAR1 using ROSETTA43 and then placed by a computational search of the electron density map as implemented in MOLREP44. The structure was refined with iterative rounds of manual building in COOT45 and refinement with BUSTER46; refine-ment statistics are summarized in Supplementary Table 1.
Mice, mouse experiments and in vivo reagents. All in vivo experiments were carried out on age-matched, female, mixed genetic background mice between 6 and 10 weeks of age19,27. Commercial IFN-β (Sigma-Aldrich) was administered via the intraperitoneal route at 10,000 IU/mouse and PECs extracted from mice of both genotypes after 3 h of treatment. Endotoxin-free, IFN-α was made in-house as previously reported47 and also administered at 10,000 IU/mouse with PECs extracted after 3 h of treatment. All LPS used in this study (K-235 E. coli from Sigma-Aldrich) was repurified as described48. Mice were administered 4 mg/mouse for the disease model experiment. Mouse PECs were extracted by flushing the peritoneal cavity with ice-cold, sterile PBS and were either lysed immedi-ately for RNA extraction (microarray and qRT-PCR analysis), protein extrac-tion (analysis of AKT activation by SDS-PAGE followed by immunoblotting; Supplementary Note) or cultured for 24 h before stimulation (flow cytometry). All animal experiments were compliant with guidelines set by the institutional ethics committee (Monash Medical Centre AEC-A, Monash University).
Extraction of RNA and microarray analysis. PECs were lysed and homog-enized before total RNA was purified and treated with DNase on columns according to the manufacturer’s instructions (Qiagen). RNA was labeled with cyanine-3 (Cy3) using the One-Color Low RNA Input Quick Amp Amplification Kit (Agilent), purified by RNeasy column purification (Qiagen) and fragmented using Agilent fragmentation and blocking reagents follow-ing the manufacturer’s instructions. On completion, the preparation was hybridized to Agilent Mouse GE v3 Microarrays for 17 h and washed fol-lowing the manufacturer’s instructions. Slides were scanned on Agilent DNA Microarray Scanner (G2505B) using one-color scan setting for ‘4x44K’ slides. The scanned images were analyzed with Feature Extraction Software 9.5.3.1 (Agilent) using default parameters to obtain background-subtracted and spatially detrended processed signal intensities. Features flagged in feature extraction as ‘feature non-uniform’ outliers were excluded. Data from fea-ture extraction were imported into GeneSpring GX11.5 (Agilent) for analysis. Data were tested for significant difference between interferon-treated ver-sus untreated groups using triplicate samples in each group, by performing a Student’s t-test with the P value (<0.05 deemed significant) computed using the asymptotic method. Probes were mapped and promoters extracted 1,500 bp upstream and 500 bp downstream relative to Ensembl 69–annotated tran-scription start sites49. Clover transcription factor enrichment analysis was performed as described previously50 using the Clover enrichment algorithm23 with Transfac Professional 2012 matrices and whole genome background sets. All data produced was MIAME-compliant.
Extraction of RNA and cDNA synthesis for quantitative RT-PCR. For vali-dation of gene expression by qRT-PCR, RNA was purified using an RNeasy kit (Qiagen) and treated with DNase (Promega). All cDNA was synthesized using Superscript III (Life Technologies) and random hexamers (Promega) following the manufacturer’s instructions. qRT-PCR was performed using either TaqMan or Sybr reagents (ABI). Relative expression was determined using the ∆∆Ct method51 with gene expression normalized to 18S rRNA abun-dance. All data are represented as fold induction relative to gene expression in wild-type untreated mice except where stated. All experiments were carried out in triplicate. The sequences of primers used for qRT-PCR are shown in Supplementary Table 4.
Flow cytometry. For all experiments to detect surface IFNAR1, nonspecific antibody interactions were blocked using anti-CD16/CD32 blocking antibody

©20
13 N
atu
re A
mer
ica,
Inc.
All
rig
hts
res
erve
d.
nature immunologydoi:10.1038/ni.2667
(1:125 dilution; clone p3; eBiosciences) before staining with the specific anti-bodies described below. For detection of surface IFNAR1 on PECs, cells from wild-type, Ifnar1−/− or Ifnar2−/− mice were treated with IFN-β (1,000 IU/ml) for 30 min or 120 min as specified. After cells were collected, they were blocked and stained with either biotinylated anti-IFNAR1 (1:1,000 dilution; MAR1 clone 5A3) or biotinylated isotype control (IgG1) antibody (1:1,000 dilution; Leinco) and a phycoerythrin (PE)-conjugated streptavidin-labeled secondary antibody (1:1,000 dilution; R&D systems) for detection. Phosphoflow cytom-etry was carried out as in ref. 52, using Alexa Fluor 647–conjugated mouse anti-STAT1 (1:10 dilution; pY701; clone 4a), anti-STAT3 (1:5 dilution; pY705; clone 4) or anti-STAT5 (1:5 dilution; Y694; clone 47) (Becton Dickinson). For determination of the immunophenotype of cellular infiltrates in the peritoneal cavity after treatment with IFN-β, PECs were resuspended in PBS with 2% (v/v) FCS and 0.5 mM EDTA and Fc receptors were blocked with anti-mouse CD16/CD32. Anti-F480 (1:500 dilution, clone CI:A3-1; FITC conjugated) was obtained from Serotec. All other cell-surface marker antibodies (anti-CD45, 1:200 dilution, clone 30-F11, APC-conjugated; anti-CD11b, 1:1,000 dilution, clone M1/70, APC-Cy7–conjugated; anti-GR1, 1:1,000 dilution, clone RB6-8C5, Pe-Cy7-conjugated; anti-Ly6G, 1:500 dilution, clone IA8, PE- conjugated; anti-B220, 1:4,000 dilution, clone RA3-6B2, FITC-conjugated; anti-CD11c, 1:200 dilution, clone HL3, PE-conjugated; anti-CD4, 1:2,000 dilution, clone RM4-5 Pacific Blue–conjugated; and anti-CD8, 1:200 dilu-tion, clone 53-6.7, APC-Cy7–conjugated) were obtained from BD Pharmingen. A total of 3 × 10⁴ CD45+ cells were analyzed per sample. A forward scatter gate was used to eliminate cell debris and gates were set using fluorophore minus one staining gates. All flow cytometry data were acquired using a FACSCanto flow cytometer (BD Immunocytometry Systems) and analyzed using Flow Jo software.
Statistics. All animal experiments used at least three mice per genotype per treatment except where stated. For all qRT-PCR and flow cytometry data, experiments were performed in triplicate on three biological samples. Where represented graphically, mean ± s.e.m. is shown. All groups of data points showed a normal distribution and were compared for statistical significance
using a Student’s t-test. All native PAGE protein-protein interactions and immunoblotting to determine AKT signaling were carried out on triplicate biological samples.
37. Uze, G., Lutfalla, G., Bandu, M.T., Proudhon, D. & Mogensen, K.E. Behavior of a cloned murine interferon alpha/beta receptor expressed in homospecific or heterospecific background. Proc. Natl. Acad. Sci. USA 89, 4774–4778 (1992).
38. Kaba, S.A., Salcedo, A.M., Wafula, P.O., Vlak, J.M. & van Oers, M.M. Development of a chitinase and v–cathepsin negative bacmid for improved integrity of secreted recombinant proteins. J. Virol. Methods 122, 113–118 (2004).
39. Vivian, J.P. et al. Killer cell immunoglobulin-like receptor 3DL1-mediated recognition of human leukocyte antigen B. Nature 479, 401–405 (2011).
40. Collaborative Computational Project, Number 4. The CCP4 suite: programs for protein crystallography. Acta Crystallogr. D Biol. Crystallogr. 50, 760–763 (1994).
41. Adams, P.D. et al. PHENIX: building new software for automated crystallographic structure determination. Acta Crystallogr. D Biol. Crystallogr. 58, 1948–1954 (2002).
42. McCoy, A.J. et al. Phaser crystallographic software. J. Appl. Cryst. 40, 658–674 (2007).
43. Raman, S. et al. Structure prediction for CASP8 with all-atom refinement using Rosetta. Proteins 77 (suppl. 9), 89–99 (2009).
44. Vagin, A. & Teplyakov, A. MOLREP: an automated program for molecular replacement. J. Appl. Cryst. 30, 1022–1025 (1997).
45. Emsley, P. & Cowtan, K. Coot: model-building tools for molecular graphics. Acta Crystallogr. D Biol. Crystallogr. 60, 2126–2132 (2004).
46. Blanc, E. et al. Refinement of severely incomplete structures with maximum likeli-hood in BUSTER-TNT. Acta Crystallogr. D Biol. Crystallogr. 60, 2210–2221 (2004).
47. Trajanovska, S., Owczarek, C.M., Stanton, P.G. & Hertzog, P.J. Generation and characterization of recombinant unmodified and phosphorylatable murine IFN-alpha1 in the methylotropic yeast Pichia pastoris. J. Interferon Cytokine Res. 23, 351–358 (2003).
48. Greenhill, C.J. et al. IL-6 trans-signaling modulates TLR4-dependent inflammatory responses via STAT3. J. Immunol. 186, 1199–1208 (2011).
49. Flicek, P. et al. Ensembl 2012. Nucleic Acids Res. 40, D84–D90 (2012).50. Bidwell, B.N. et al. Silencing of Irf7 pathways in breast cancer cells promotes bone
metastasis through immune escape. Nat. Med. 18, 1224–1231 (2012).51. Yuan, J.S., Reed, A., Chen, F. & Stewart, C.N. Jr. Statistical analysis of real-time
PCR data. BMC Bioinformatics 7, 85–96 (2006).52. van Boxel-Dezaire, A.H. et al. Major differences in the responses of primary human
leukocyte subsets to IFN-beta. J. Immunol. 185, 5888–5899 (2010).