Stratifying Type 2 Diabetes Cases by BMI Identifies Genetic Risk Variants in LAMA1 and Enrichment...
14
Stratifying Type 2 Diabetes Cases by BMI Identifies Genetic Risk Variants in LAMA1 and Enrichment for Risk Variants in Lean Compared to Obese Cases John R. B. Perry 1,2,3 , Benjamin F. Voight 4 , Loı¨c Yengo 5 , Najaf Amin 6 , Jose ´ e Dupuis 7,8 , Martha Ganser 9 , Harald Grallert 10 , Pau Navarro 11 , Man Li 12 , Lu Qi 13 , Valgerdur Steinthorsdottir 14 , Robert A. Scott 15 , Peter Almgren 16 , Dan E. Arking 17 , Yurii Aulchenko 6 , Beverley Balkau 18 , Rafn Benediktsson 19,20 , Richard N. Bergman 21 , Eric Boerwinkle 22 , Lori Bonnycastle 23 , Noe ¨l P. Burtt 4 , Harry Campbell 24 , Guillaume Charpentier 25 , Francis S. Collins 23 , Christian Gieger 26 , Todd Green 4 , Samy Hadjadj 27 , Andrew T. Hattersley 1 , Christian Herder 28 , Albert Hofman 6 , Andrew D. Johnson 8 , Anna Kottgen 12,29 , Peter Kraft 13 , Yann Labrune 5 , Claudia Langenberg 15 , Alisa K. Manning 30 , Karen L. Mohlke 31 , Andrew P. Morris 2 , Ben Oostra 32 , James Pankow 33 , Ann-Kristin Petersen 26 , Peter P. Pramstaller 34,35,36 , Inga Prokopenko 2,37 , Wolfgang Rathmann 38 , William Rayner 2 , Michael Roden 28,39 , Igor Rudan 40 , Denis Rybin 41 , Laura J. Scott 9 , Gunnar Sigurdsson 19,20 , Rob Sladek 42 , Gudmar Thorleifsson 14 , Unnur Thorsteinsdottir 14,43 , Jaakko Tuomilehto 44,45,46,47 , Andre G. Uitterlinden 48 , Sidonie Vivequin 5 , Michael N. Weedon 1 , Alan F. Wright 11 , MAGIC, DIAGRAM Consortium, GIANT Consortium, Frank B. Hu 13 , Thomas Illig 10,49 , Linda Kao 12 , James B. Meigs 50 , James F. Wilson 24 , Kari Stefansson 14,43 , Cornelia van Duijn 6 , David Altschuler 4 , Andrew D. Morris 51 , Michael Boehnke 9 , Mark I. McCarthy 2,37,52 , Philippe Froguel 5,53 , Colin N. A. Palmer 51 , Nicholas J. Wareham 15 , Leif Groop 16 , Timothy M. Frayling 1. *, Ste ´ phane Cauchi 5. * 1 Genetics of Complex Traits, Peninsula Medical School, University of Exeter, Exeter, United Kingdom, 2 Wellcome Trust Centre for Human Genetics, University of Oxford, Oxford, United Kingdom, 3 Department of Twin Research and Genetic Epidemiology, King’s College London, London, United Kingdom, 4 Broad Institute of Harvard and Massachusetts Institute of Technology, Cambridge, Massachusetts, United States of America, 5 CNRS UMR 8199, Genomics of Metabolic Diseases, Lille, France, 6 Department of Epidemiology, Erasmus MC, Rotterdam, The Netherlands, 7 Department of Biostatistics, Boston University School of Public Health, Boston, Massachusetts, United States of America, 8 National Heart, Lung, and Blood Institute’s Framingham Heart Study, Framingham, Massachusetts, United States of America, 9 Department of Biostatistics and Center for Statistical Genetics, University of Michigan, Ann Arbor, Michigan, United States of America, 10 Research Unit of Molecular Epidemiology, Helmholtz Zentrum Muenchen, Neuherberg, Germany, 11 MRC Human Genetics Unit, Medical Research Council Institute of Genetics and Molecular Medicine, University of Edinburgh, Edinburgh, United Kingdom, 12 Johns Hopkins Bloomberg School of Public Health and Epidemiology, Baltimore, Maryland, United States of America, 13 Departments of Nutrition and Epidemiology, Harvard School of Public Health, Boston, Massachusetts, United States of America, 14 deCODE Genetics, Reykjavik, Iceland, 15 MRC Epidemiology Unit, Medical Research Council, Cambridge, United Kingdom, 16 Diabetes and Endocrinology Research Unit, Department of Clinical Sciences, Lund University, Malmoe, Sweden, 17 McKusick-Nathans Institute of Genetic Medicine, Johns Hopkins University School of Medicine, Baltimore, Maryland, United States of America, 18 INSERM CESP U1018, Villejuif, France, 19 Landspitali University Hospital, Reykjavik, Iceland, 20 Icelandic Heart Association, Kopavogur, Iceland, 21 Diabetes and Obesity Research Institute, Cedars-Sinai Medical Center, Los Angeles, California, United States of America, 22 University of Texas Health Science Center at Houston, Human Genetics Center, Houston, Texas, United States of America, 23 National Human Genome Research Institute, National Institutes of Health, Bethesda, Maryland, United States of America, 24 Centre for Population Health Sciences, University of Edinburgh, Teviot Place, Edinburgh, United Kingdom, 25 Corbeil-Essonnes hospital, Department of Endocrinology-Diabetology, Corbeil-Essonnes, France, 26 Institute of Genetic Epidemiology, Helmholtz Zentrum Muenchen, Neuherberg, Germany, 27 CHU Poitiers, Department of Endocrinology-Diabetology, CIC INSERM 0801, INSERM U927, University of Medical and Pharmaceutical Sciences, Poitiers, France, 28 Institute for Clinical Diabetology, German Diabetes Center, Leibniz Center for Diabetes Research, Heinrich Heine University Du ¨ sseldorf, Du ¨ sseldorf, Germany, 29 Freiburg University Clinic, Renal Division, Freiburg, Germany, 30 Boston University School of Public Health, Boston, Massachusetts, United States of America, 31 Department of Genetics, University of North Carolina, Chapel Hill, North Carolina, United States of America, 32 Erasmus University Medical School, Rotterdam, The Netherlands, 33 School of Public Health, Division of Epidemiology and Community Health, University of Minnesota, Minneapolis, Minnesota, United States of America, 34 Center for Biomedicine, European Academy Bozen/Bolzano (EURAC), Bolzano, Italy (Affiliated Institute of the University of Lu ¨ beck, Lu ¨ beck, Germany), 35 Department of Neurology, General Central Hospital, Bolzano, Italy, 36 Department of Neurology, University of Lu ¨ beck, Lu ¨ beck, Germany, 37 Oxford Centre for Diabetes, Endocrinology, and Metabolism, University of Oxford, Oxford, United Kingdom, 38 Institute of Biometrics and Epidemiology, German Diabetes Center, Leibniz Center for Diabetes Research, Heinrich Heine University Du ¨ sseldorf, Du ¨ sseldorf, Germany, 39 Department of Metabolic Diseases, University Hospital Du ¨ sseldorf, Du ¨ sseldorf, Germany, 40 Centre for Population Health Sciences, University of Edinburgh, Edinburgh, United Kingdom, 41 Boston University Data Coordinating Center, Boston, Massachusetts, United States of America, 42 Department of Human Genetics, Faculty of Medicine, McGill University, Montreal, Canada, 43 Faculty of Medicine, University of Iceland, Reykjavı ´k, Iceland, 44 Diabetes Prevention Unit, National Institute for Health and Welfare, Helsinki, Finland, 45 South Ostrobothnia Central Hospital, Seina ¨ joki, Finland, 46 Red RECAVA Grupo RD06/0014/0015, Hospital Universitario La Paz, Madrid, Spain, 47 Centre for Vascular Prevention, Danube-University Krems, Krems, Austria, 48 Department of Internal Medicine, Erasmus MC, Rotterdam, The Netherlands, 49 Hannover Unified Biobank, Hannover Medical School, Hannover, Germany, 50 General Medicine Division, Massachusetts General Hospital and Department of Medicine, Harvard Medical School, Boston, Massachusetts, United States of America, 51 Biomedical Research Institute, Ninewells Hospital and Medical School, University of Dundee, Dundee, United Kingdom, 52 Oxford NIHR Biomedical Research Centre, Churchill Hospital, Oxford, United Kingdom, 53 Department of Genomics of Common Diseases, Hammersmith Hospital, Imperial College London, London, United Kingdom PLoS Genetics | www.plosgenetics.org 1 May 2012 | Volume 8 | Issue 5 | e1002741
Transcript of Stratifying Type 2 Diabetes Cases by BMI Identifies Genetic Risk Variants in LAMA1 and Enrichment...

Stratifying Type 2 Diabetes Cases by BMI IdentifiesGenetic Risk Variants in LAMA1 and Enrichment for RiskVariants in Lean Compared to Obese CasesJohn R. B. Perry1,2,3, Benjamin F. Voight4, Loıc Yengo5, Najaf Amin6, Josee Dupuis7,8, Martha Ganser9,
Harald Grallert10, Pau Navarro11, Man Li12, Lu Qi13, Valgerdur Steinthorsdottir14, Robert A. Scott15,
Peter Almgren16, Dan E. Arking17, Yurii Aulchenko6, Beverley Balkau18, Rafn Benediktsson19,20,
Richard N. Bergman21, Eric Boerwinkle22, Lori Bonnycastle23, Noel P. Burtt4, Harry Campbell24,
Guillaume Charpentier25, Francis S. Collins23, Christian Gieger26, Todd Green4, Samy Hadjadj27,
Andrew T. Hattersley1, Christian Herder28, Albert Hofman6, Andrew D. Johnson8, Anna Kottgen12,29,
Peter Kraft13, Yann Labrune5, Claudia Langenberg15, Alisa K. Manning30, Karen L. Mohlke31,
Andrew P. Morris2, Ben Oostra32, James Pankow33, Ann-Kristin Petersen26, Peter P. Pramstaller34,35,36,
Inga Prokopenko2,37, Wolfgang Rathmann38, William Rayner2, Michael Roden28,39, Igor Rudan40,
Denis Rybin41, Laura J. Scott9, Gunnar Sigurdsson19,20, Rob Sladek42, Gudmar Thorleifsson14,
Unnur Thorsteinsdottir14,43, Jaakko Tuomilehto44,45,46,47, Andre G. Uitterlinden48, Sidonie Vivequin5,
Michael N. Weedon1, Alan F. Wright11, MAGIC, DIAGRAM Consortium, GIANT Consortium, Frank B. Hu13,
Thomas Illig10,49, Linda Kao12, James B. Meigs50, James F. Wilson24, Kari Stefansson14,43, Cornelia van
Duijn6, David Altschuler4, Andrew D. Morris51, Michael Boehnke9, Mark I. McCarthy2,37,52,
Philippe Froguel5,53, Colin N. A. Palmer51, Nicholas J. Wareham15, Leif Groop16, Timothy M. Frayling1.*,
Stephane Cauchi5.*
1 Genetics of Complex Traits, Peninsula Medical School, University of Exeter, Exeter, United Kingdom, 2 Wellcome Trust Centre for Human Genetics, University of Oxford,
Oxford, United Kingdom, 3 Department of Twin Research and Genetic Epidemiology, King’s College London, London, United Kingdom, 4 Broad Institute of Harvard and
Massachusetts Institute of Technology, Cambridge, Massachusetts, United States of America, 5 CNRS UMR 8199, Genomics of Metabolic Diseases, Lille, France,
6 Department of Epidemiology, Erasmus MC, Rotterdam, The Netherlands, 7 Department of Biostatistics, Boston University School of Public Health, Boston, Massachusetts,
United States of America, 8 National Heart, Lung, and Blood Institute’s Framingham Heart Study, Framingham, Massachusetts, United States of America, 9 Department of
Biostatistics and Center for Statistical Genetics, University of Michigan, Ann Arbor, Michigan, United States of America, 10 Research Unit of Molecular Epidemiology,
Helmholtz Zentrum Muenchen, Neuherberg, Germany, 11 MRC Human Genetics Unit, Medical Research Council Institute of Genetics and Molecular Medicine, University of
Edinburgh, Edinburgh, United Kingdom, 12 Johns Hopkins Bloomberg School of Public Health and Epidemiology, Baltimore, Maryland, United States of America,
13 Departments of Nutrition and Epidemiology, Harvard School of Public Health, Boston, Massachusetts, United States of America, 14 deCODE Genetics, Reykjavik,
Iceland, 15 MRC Epidemiology Unit, Medical Research Council, Cambridge, United Kingdom, 16 Diabetes and Endocrinology Research Unit, Department of Clinical
Sciences, Lund University, Malmoe, Sweden, 17 McKusick-Nathans Institute of Genetic Medicine, Johns Hopkins University School of Medicine, Baltimore, Maryland, United
States of America, 18 INSERM CESP U1018, Villejuif, France, 19 Landspitali University Hospital, Reykjavik, Iceland, 20 Icelandic Heart Association, Kopavogur, Iceland,
21 Diabetes and Obesity Research Institute, Cedars-Sinai Medical Center, Los Angeles, California, United States of America, 22 University of Texas Health Science Center at
Houston, Human Genetics Center, Houston, Texas, United States of America, 23 National Human Genome Research Institute, National Institutes of Health, Bethesda,
Maryland, United States of America, 24 Centre for Population Health Sciences, University of Edinburgh, Teviot Place, Edinburgh, United Kingdom, 25 Corbeil-Essonnes
hospital, Department of Endocrinology-Diabetology, Corbeil-Essonnes, France, 26 Institute of Genetic Epidemiology, Helmholtz Zentrum Muenchen, Neuherberg,
Germany, 27 CHU Poitiers, Department of Endocrinology-Diabetology, CIC INSERM 0801, INSERM U927, University of Medical and Pharmaceutical Sciences, Poitiers,
France, 28 Institute for Clinical Diabetology, German Diabetes Center, Leibniz Center for Diabetes Research, Heinrich Heine University Dusseldorf, Dusseldorf, Germany,
29 Freiburg University Clinic, Renal Division, Freiburg, Germany, 30 Boston University School of Public Health, Boston, Massachusetts, United States of America,
31 Department of Genetics, University of North Carolina, Chapel Hill, North Carolina, United States of America, 32 Erasmus University Medical School, Rotterdam, The
Netherlands, 33 School of Public Health, Division of Epidemiology and Community Health, University of Minnesota, Minneapolis, Minnesota, United States of America,
34 Center for Biomedicine, European Academy Bozen/Bolzano (EURAC), Bolzano, Italy (Affiliated Institute of the University of Lubeck, Lubeck, Germany), 35 Department of
Neurology, General Central Hospital, Bolzano, Italy, 36 Department of Neurology, University of Lubeck, Lubeck, Germany, 37 Oxford Centre for Diabetes, Endocrinology,
and Metabolism, University of Oxford, Oxford, United Kingdom, 38 Institute of Biometrics and Epidemiology, German Diabetes Center, Leibniz Center for Diabetes
Research, Heinrich Heine University Dusseldorf, Dusseldorf, Germany, 39 Department of Metabolic Diseases, University Hospital Dusseldorf, Dusseldorf, Germany,
40 Centre for Population Health Sciences, University of Edinburgh, Edinburgh, United Kingdom, 41 Boston University Data Coordinating Center, Boston, Massachusetts,
United States of America, 42 Department of Human Genetics, Faculty of Medicine, McGill University, Montreal, Canada, 43 Faculty of Medicine, University of Iceland,
Reykjavık, Iceland, 44 Diabetes Prevention Unit, National Institute for Health and Welfare, Helsinki, Finland, 45 South Ostrobothnia Central Hospital, Seinajoki, Finland,
46 Red RECAVA Grupo RD06/0014/0015, Hospital Universitario La Paz, Madrid, Spain, 47 Centre for Vascular Prevention, Danube-University Krems, Krems, Austria,
48 Department of Internal Medicine, Erasmus MC, Rotterdam, The Netherlands, 49 Hannover Unified Biobank, Hannover Medical School, Hannover, Germany, 50 General
Medicine Division, Massachusetts General Hospital and Department of Medicine, Harvard Medical School, Boston, Massachusetts, United States of America, 51 Biomedical
Research Institute, Ninewells Hospital and Medical School, University of Dundee, Dundee, United Kingdom, 52 Oxford NIHR Biomedical Research Centre, Churchill
Hospital, Oxford, United Kingdom, 53 Department of Genomics of Common Diseases, Hammersmith Hospital, Imperial College London, London, United Kingdom
PLoS Genetics | www.plosgenetics.org 1 May 2012 | Volume 8 | Issue 5 | e1002741
Abstract
Common diseases such as type 2 diabetes are phenotypically heterogeneous. Obesity is a major risk factor for type 2 diabetes,but patients vary appreciably in body mass index. We hypothesized that the genetic predisposition to the disease may bedifferent in lean (BMI,25 Kg/m2) compared to obese cases (BMI$30 Kg/m2). We performed two case-control genome-widestudies using two accepted cut-offs for defining individuals as overweight or obese. We used 2,112 lean type 2 diabetes cases(BMI,25 kg/m2) or 4,123 obese cases (BMI$30 kg/m2), and 54,412 un-stratified controls. Replication was performed in 2,881lean cases or 8,702 obese cases, and 18,957 un-stratified controls. To assess the effects of known signals, we tested the individualand combined effects of SNPs representing 36 type 2 diabetes loci. After combining data from discovery and replication datasets,we identified two signals not previously reported in Europeans. A variant (rs8090011) in the LAMA1 gene was associated withtype 2 diabetes in lean cases (P = 8.461029, OR = 1.13 [95% CI 1.09–1.18]), and this association was stronger than that in obesecases (P = 0.04, OR = 1.03 [95% CI 1.00–1.06]). A variant in HMG20A—previously identified in South Asians but not Europeans—was associated with type 2 diabetes in obese cases (P = 1.361028, OR = 1.11 [95% CI 1.07–1.15]), although this association wasnot significantly stronger than that in lean cases (P = 0.02, OR = 1.09 [95% CI 1.02–1.17]). For 36 known type 2 diabetes loci, 29 hada larger odds ratio in the lean compared to obese (binomial P = 0.0002). In the lean analysis, we observed a weighted per-riskallele OR = 1.13 [95% CI 1.10–1.17], P = 3.2610214. This was larger than the same model fitted in the obese analysis where theOR = 1.06 [95% CI 1.05–1.08], P = 2.2610216. This study provides evidence that stratification of type 2 diabetes cases by BMI mayhelp identify additional risk variants and that lean cases may have a stronger genetic predisposition to type 2 diabetes.
Citation: Perry JRB, Voight BF, Yengo L, Amin N, Dupuis J, et al. (2012) Stratifying Type 2 Diabetes Cases by BMI Identifies Genetic Risk Variants in LAMA1 andEnrichment for Risk Variants in Lean Compared to Obese Cases. PLoS Genet 8(5): e1002741. doi:10.1371/journal.pgen.1002741
Editor: Greg Gibson, Georgia Institute of Technology, United States of America
Received February 13, 2012; Accepted April 14, 2012; Published May 31, 2012
Copyright: � 2012 Perry et al. This is an open-access article distributed under the terms of the Creative Commons Attribution License, which permitsunrestricted use, distribution, and reproduction in any medium, provided the original author and source are credited.
Funding: JRB Perry is supported by the Wellcome Trust as a Sir Henry Wellcome Postdoctoral Research Fellow (092447/Z/10/Z). This work was partially funded bygrants from the Wellcome Trust 083270/Z/07/Z and MRC G0601261. The Atherosclerosis Risk in Communities Study is carried out as a collaborative studysupported by National Heart, Lung, and Blood Institute contracts (HHSN268201100005C, HHSN268201100006C, HHSN268201100007C, HHSN268201100008C,HHSN268201100009C, HHSN268201100010C, HHSN268201100011C, and HHSN268201100012C), R01HL087641, R01HL59367, and R01HL086694; National HumanGenome Research Institute contract U01HG004402; National Institutes of Health contract HHSN268200625226C; and grants DK062370 and DK072193. ARIC:Infrastructure was partly supported by Grant Number UL1RR025005, a component of the National Institutes of Health and NIH Roadmap for Medical Research.Work at Lund University diabetes centre was funded by several grants from the Swedish Research Council (LG prject grant, Linne, Exodiab). Norfolk Diabetes Case-Control and ADDITION-Ely Studies: The work on Ely, ADDITION, and EPIC-Norfolk studies was funded by support from the Wellcome Trust and MRC. The NorfolkDiabetes study is funded by the MRC with support from NHS Research and Development and the Wellcome Trust. This research was conducted in part using dataand resources from the Framingham Heart Study of the National Heart, Lung, and Blood Institute of the National Institutes of Health and Boston University Schoolof Medicine. The analyses reflect intellectual input and resource development from the Framingham Heart Study investigators participating in the SNP HealthAssociation Resource (SHARe) project. This work was partially supported by the National Heart, Lung, and Blood Institute’s Framingham Heart Study (ContractNo. N01-HC-25195) and its contract with Affymetrix for genotyping services (Contract No. N02-HL-6-4278). A portion of this research utilized the Linux Cluster forGenetic Analysis (LinGA-II), funded by the Robert Dawson Evans Endowment of the Department of Medicine at Boston University School of Medicine and BostonMedical Center. Also supported by National Institute for Diabetes and Digestive and Kidney Diseases (NIDDK) R01 DK078616 to JB Meigs and J Dupuis, and NIDDKK24 DK080140 to JB Meigs. The research performed at deCODE Genetics was part funded through the European Community’s Seventh Framework Programme(FP7/2007-2013), ENGAGE project, grant agreement HEALTH-F4-2007- 201413. The DGDG study was supported by the French Government (Agence Nationale dela Recherche), the French Region of Nord Pas De Calais (Contrat de Projets Etat-Region), Programme Hospitalier de Recherche Clinique (French Ministry of Health),and the following charities: Association Francaise des Diabetiques, Programme National de Recherche sur le Diabete, Association de Langue Francaise pourl’Etude du Diabete et des Maladies Metaboliques, Association Diabete Risque Vasculaire (Paris, France), and Groupe d’Etude des Maladies Metaboliques etSystemiques. This study was also supported in part by a grant from the European Union (Integrated Project EuroDia LSHM-CT-2006-518153 in the FrameworkProgramme 6 [FP6] of the European Community). The D.E.S.I.R. study was supported by the Caisse Nationale d’Assurance Maladie des Travailleurs Salaries, Lilly,Novartis Pharma and Sanofi-Aventis, Institut National de la Sante et de la Recherche Medicale (INSERM) (Reseaux en Sante Publique, Interactions entre lesdeterminants de la sante, Cohortes Sante TGIR 2008), Association Diabete Risque Vasculaire, Federation Francaise de Cardiologie, Fondation de France,Association de Langue Francaise pour l’Etude du Diabete et des Maladies Metaboliques, Office National Interprofessionnel des Vins, Ardix Medical, BayerDiagnostics, Becton Dickinson, Cardionics, Merck Sante, Novo Nordisk, Pierre Fabre, Roche and Topcon. The D.E.S.I.R. Study Group: INSERM 1018: B Balkau, PDucimetiere, E Eschwege; INSERM U367: F Alhenc-Gelas; Centre Hospitalier Universitaire D’Angers: Y Gallois, A Girault; Bichat Hospital: F Fumeron, M Marre, RRoussel; CHU de Rennes: F Bonnet; CNRS UMR8199, Lille: P Froguel; Medical Examination Services: Alencon, Angers, Blois, Caen, Chartres, Chateauroux, Cholet, LeMans, Orleans and Tours; Research Institute for General Medicine: J Cogneau; General practitioners of the region; Cross-Regional Institute for Health: C Born, ECaces, M Cailleau, JG Moreau, F Rakotozafy, J Tichet, S. Vol. We are grateful to all patients for participation in the genetic study. We also thank MarianneDeweirder, Frederic Allegaert (UMR CNRS 8199, Genomic and Metabolic Disease, Lille, France) for their technical assistance and their precious management ofDNA samples. This work was partially funded by grants from the Wellcome Trust 083270/Z/07/Z and MRC G0601261. This work was presented as a poster at theAmerican Diabetes Association’s scientific sessions June 2011. The NHS/HPFS T2D GWA study (U01HG004399) is a component of a collaborative project thatincludes 13 other GWA studies funded as part of the Gene Environment-Association Studies (GENEVA) under the NIH Genes, Environment and Health Initiative(GEI) (U01HG004738, U01HG004422, U01HG004402, U01HG004729, U01HG004726, U01HG004735, U01HG004415, U01HG004436, U01HG004423, U01HG004728,RFAHG006033) with additional support from individual NIH (NIDCR:U01DE018993, U01DE018903; NIAAA: U10AA008401, NIDA: P01CA089392,R01DA013423; NCI:CA63464, CA54281, CA136792, Z01CP010200). EUROSPAN cohorts were supported by the European Union framework program 6 EUROSPAN project (contractno. LSHG-CT-2006-018947). The ERF study was supported by grants from the NWO, Erasmus MC and the Centre for Medical Systems Biology (CMSB). We aregrateful to all patients and their relatives, general practitioners and neurologists for their contributions and to P Veraart for her help in genealogy, JeannetteVergeer for the supervision of the laboratory work and P Snijders for his help in data collection. MICROS: The MICROS study is part of the genomic health careprogram ‘GenNova’ and was carried out in three villages of the Val Venosta on the populations of Stelvio, Vallelunga and Martello. In South Tyrol, the study wassupported by the Ministry of Health and Department of Educational Assistance, University and Research of the Autonomous Province of Bolzano and the SouthTyrolean Sparkasse Foundation. The VIS study in the Croatian island of Vis was supported through the grants from the Medical Research Council UK and Ministryof Science, Education and Sport of the Republic of Croatia (number 108-1080315-0302). The research within the KORA study was partially funded by the GermanCenter for Diabetes Research (DZD), the Helmholtz Zentrum Munchen, Neuherberg, Germany, and supported by grants from the German Federal Ministry ofEducation and Research the Federal Ministry of Health, the Ministry of Innovation, Science, Research, and Technology of the state North Rhine-Westphalia, theGerman National Genome Research Network (NGFN), and the Munich Center of Health Sciences (MC Health) as part of LMUinnovativ. The research of IProkopenko is funded in part through the European Community’s Seventh Framework Programme (FP7/2007-2013), ENGAGE project, grant agreement HEALTH-F4-2007- 201413. The funders had no role in study design, data collection and analysis, decision to publish, or preparation of the manuscript.
Stratifying T2D by BMI Identifies LAMA1 Risk Locus
PLoS Genetics | www.plosgenetics.org 2 May 2012 | Volume 8 | Issue 5 | e1002741
Competing Interests: The authors have declared that no competing interests exist.
* E-mail: [email protected] (TM Frayling); [email protected] (S Cauchi)
. These authors contributed equally to this work.
Introduction
Common diseases such as type 2 diabetes are highly phenotyp-
ically heterogeneous. Few studies have performed genome wide
association studies in subsets of patients defined by more stringent
phenotypic characteristics. It is possible that reducing the
heterogeneity of disease cases may increase power to detect
associations over and above the loss of power resulting from
reduced numbers. To address these questions we hypothesized
that the genetic predisposition to Type 2 diabetes may be different
in two strata of cases defined by well-accepted cut-offs for body
mass index, the strongest known risk factor for type 2 diabetes.
Genome-wide association (GWA) studies have identified ,50
independent loci robustly associated with type 2 diabetes
[1,2,3,4,5,6,7]. These studies have highlighted new candidate
pathways involved in the disease [8,9], identified overlap with
monogenic forms of the disease [1], and provided genetic links
with correlated phenotypes [10,11].
The GWA studies of type 2 diabetes have not so far provided
a greatly improved understanding of the clinical heterogeneity of
the disease. Type 2 diabetes cases vary appreciably in their
clinical characteristics, particularly age of diagnosis and body
mass index (BMI). There is also a group of patients who may
present with evidence of an autoimmune component to their
diabetes, but who are not insulin dependent [12]. In contrast,
the identification of the genetic component to monogenic forms
of diabetes has often explained the clinical heterogeneity ob-
served [13].
Previous studies have provided some evidence of genetic
heterogeneity between non-obese and obese type 2 diabetic cases
[14,15,16,17]. For example, the variant with the strongest effect
on type 2 diabetes risk, in TCF7L2, has a stronger effect in non-
obese cases (odds ratio = 1.53 [0.37–1.71] compared to obese
cases (OR = 1.21 [1.09–1.35]) [14]. The effect of FTO variation
on type 2 diabetes risk depends on how cases and controls are
ascertained by BMI status, but this was expected given FTO’s
known primary effect on BMI. In the most recent GWA studies of
type 2 diabetes [1], risk variants tended to have stronger effects in
non-obese compared to obese individuals – of 30 loci examined,
23 showed stronger associations in non-obese compared to obese
individuals.
We designed the present study in an attempt to understand
better the genetic heterogeneity of type 2 diabetes. Type 2
diabetes GWA studies tend to be enriched with cases with
stronger family histories and lower average BMIs compared to
community based studies. Nevertheless, there is a wide spectrum
of BMI amongst type 2 diabetes cases used in GWA studies, with
more cases being obese than lean. In this study we tested the
hypothesis that we would identify new genetic variants by limiting
the clinical heterogeneity of type 2 diabetes. By stratifying cases
by their BMI status and performing separate GWA studies for
each strata of BMI we identified two signals of association not
previously reported in the largest GWA studies in Europeans [1],
although one signal has been identified in a South Asian study
[7]. In addition we confirmed with additional data that the
majority of known type 2 diabetes genetic associations have
stronger effects in lean type 2 diabetic cases compared to obese
cases.
Methods
Descriptions of all cases are available in Table 1, and combined
with control details in Tables S1 and S2. Our study was designed
to limit the clinical heterogeneity of type 2 diabetes by
stratification on BMI, whilst also using the largest sample sizes
available:
Study design—choice of strataTo test the hypothesis that we would identify new variants
associated with type 2 diabetes in different BMI strata, we used the
following study design. We used two separate strata of type 2
diabetes cases defined by the two arbitrary, but well established,
cut-offs for classifying people as overweight or obese. The first
stratum consisted of non-overweight cases, here defined as ‘‘lean’’
(BMI,25 kg/m2). The second strata consisted of obese cases
(BMI$30 kg/m2). For each stratum we used all controls, not
selected on BMI to increase statistical power and provide a more
robust estimate of the population allele frequency. We did not
correct for BMI as BMI was not available in all controls. To check
whether or not associations were being driven primarily by effects
on BMI we assessed novel variants in an existing GWA studies of
BMI using 123,865 individuals from the GIANT consortium [18].
Finally, we performed sensitivity analyses, confirming our findings
by stratifying controls by BMI as well as cases.
Study design—choice of studiesWe chose to include the largest set of studies available. These
studies differed in the proportion of total cases defined as lean
(8.4–30.4%), the proportion of total cases defined as obese (21.2–
77.8%, plus one GWA study, DGDG, that only selected non-
obese cases). Some studies were specifically designed as case
control studies and some as case-cohort studies, and we note that
the extent of phenotyping performed to exclude autoimmune
processes was different across studies, ranging from not requiring
insulin treatment in the first year of diagnosis and GAD
autoantibody negative, to general practitioner diagnosis of type 2
diabetes.
Descriptions of the participating studies are available in the
most recent DIAGRAM manuscript [1], with summary statistics
also presented in Table 1 and in Tables S1 and S2. The two
discovery GWA study meta-analyses comprised 2112 lean type 2
diabetes cases or 4123 obese type 2 diabetes cases, compared
against up to 54,412 controls. For a subset of SNPs available on
the Metabochip (a custom Illumina iSelect SNP array that
included the SNPs identified by GWA studies for several diseases
and traits including type 2 diabetes loci) we included data from an
additional 263 lean type 2 diabetes cases, 1735 obese type 2
diabetes cases, and 3691 controls from the GoDARTs study [19].
GWA study methodologyWith the exception of the BMI-stratification of cases, the meta-
analyses, individual study quality control, and analytical methods
were the same as those recently reported [1]. A genomic control
inflation factor was calculated for each study for each analysis, and
their test statistics were adjusted accordingly. Inverse-variance
fixed effect meta-analyses were performed on imputed SNP
Stratifying T2D by BMI Identifies LAMA1 Risk Locus
PLoS Genetics | www.plosgenetics.org 3 May 2012 | Volume 8 | Issue 5 | e1002741

datasets, testing for an additive genetic effect. All single point effect
estimates are given with their [95% confidence intervals (CI)].
Only autosomal SNPs with imputation quality scores .0.5 and a
minor allele frequency .1% were included from each study. A
SNP was excluded from the meta-analysed dataset if it was present
in less than half of the studies. Given the use of two strata, we used
a p-value threshold of 2.561028 as the criterion for genome-wide
significance.
Follow-up studies—replication of novel associations inlean and obese GWA studies
An additional 4 studies, totalling 2881 lean cases, 8702 obese
cases, and 18957 controls were available for de novo genotyping of
SNPs (Table S2). For the DGDG replication, all polymorphisms
were genotyped using the KASPar system (KBiosciences). For
Malmo CC, ADDITION-Ely, and Norfolk Diabetes Case Control
Study (NDCCS), Taqman assay genotyping was performed. For
all four studies genotyping success rate was .95%, the genotyping
error rate was 0% based on re-genotyping of 384 individuals, and
all SNPs were in Hardy-Weinberg equilibrium (P.0.05). We re-
performed the inverse-variance weighted meta-analysis for the
replication SNPs using data from all the discovery and replication
datasets.
Association of variants with BMITo test whether or not type 2 diabetes associations could be
primarily driven by effects on BMI, we assessed the association of
novel SNPs with BMI using data from the GIANT consortium
consisting of 123,865 individuals.
Association of variants in case-only analysesThere are two possible reasons why a variant may be associated
with type 2 diabetes in a stratified sample compared to using all
data. First, the variant may have a genuinely larger effect in that
stratum compared to the overall sample. Second, chance will
influence which SNPs are most strongly associated in different
subsets of data. To distinguish between these two possibilities we
performed a case only analysis in which we tested whether variants
associated with lean or obese type 2 diabetes were also associated
with BMI within type 2 diabetes cases. We analysed BMI as a
quantitative trait in cases from the GWA studies and meta-
analysed the summary statistics. If a variant is genuinely associated
with type 2 diabetes with stronger effects in the lean stratum, for
example, we would expect the risk allele to be associated with
lower BMI within cases. This phenomenon was previously
reported for the variant in TCF7L2 [14].
Continuous glycaemic measuresSNP association statistics on glyacemic traits in healthy
individuals were provided by the Meta-Analyses of Glucose and
Insulin-related traits Consortium (MAGIC). Phenotypes available
were fasting insulin (N = 38,238, fasting glucose (N = 46,186), beta-
cell function (HOMA-B, N = 36,466), insulin resistance (HOMA-
IR, N = 37,037), HbA1C (N = 46,368) and 2 hour glucose
(N = 15,234) after an oral glucose challenge. All traits are naturally
log transformed, besides fasting glucose, 2 hour glucose and
HbA1c. The studies and methodology for these GWA study data
are described in their recent publications [2,20,21] and available
online at www.magicinvestigators.org. We also had access to data
from joint meta-analyses of SNP and SNPxBMI interaction on
fasting glucose (N = 58,074), insulin (N = 51,570), and 2-hr glucose
(N = 15,141), also provided by MAGIC (Manning et al, in press).
eQTL assessmentIdentified SNPs were searched against a collected database of
expression SNP (eQTL) results including a range of tissues
[22,23,24,25,26,27,28,29,30,31,32,33,34,35,36,37,38].
Testing the role of known SNPs in lean and obeseindividuals
In addition to identifying new loci, we tested the impact of BMI
stratification on SNPs previously identified as associated with type
2 diabetes. We calculated the individual SNP association statistics
using the lean and obese meta-analyses described above.
To assess the effects of combining information from all known
type 2 diabetes SNPs, we next used a single study, the GoDARTs
[19] study, independent from the discovery GWA studies. In
GoDARTs there were a total of 263 lean type 2 diabetes cases,
1735 obese type 2 diabetes cases, and 3691 controls. Known SNPs
(N = 36 on the metabochip) were defined as those reaching
genome-wide significance in studies using samples of European
descent (excluding FTO due to primary effect on BMI, and DUSP9
not present on the chip) [1,2,3]. We also combined the 36 SNPs
into a single allele count model. This analysis consisted of a logistic
regression model comparing the count of an individual’s type 2
diabetes risk alleles, against case-control status. Each risk allele
count was weighted by the point estimate effect size of that SNP
from the DIAGRAM meta-analysis [1]. We repeated this analysis
using stratified controls (BMI,25 kg/m2 versus lean cases and
BMI$30 kg/m2 versus obese cases) instead of all controls. Finally,
individuals were binned into quintiles based on their weighted
allele score and per-quintile odds ratios calculated.
Results
Genome-wide association in lean type 2 diabeticindividuals
Three independent association signals reached P,2.561028 in
the lean case genome wide meta-analysis (Table 2). Two
Author Summary
Individuals with Type 2 diabetes (T2D) can present withvariable clinical characteristics. It is well known that obesityis a major risk factor for type 2 diabetes, yet patients canvary considerably—there are many lean diabetes patientsand many overweight people without diabetes. Wehypothesized that the genetic predisposition to thedisease may be different in lean (BMI,25 Kg/m2) com-pared to obese cases (BMI$30 Kg/m2). Specifically, as leanT2D patients had lower risk than obese patients, they musthave been more genetically susceptible. Using geneticdata from multiple genome-wide association studies, wetested genetic markers across the genome in 2,112 leantype 2 diabetes cases (BMI,25 kg/m2), 4,123 obese cases(BMI$30 kg/m2), and 54,412 healthy controls. We con-firmed our results in an additional 2,881 lean cases, 8,702obese cases, and 18,957 healthy controls. Using these datawe found differences in genetic enrichment between leanand obese cases, supporting our original hypothesis. Wealso searched for genetic variants that may be risk factorsonly in lean or obese patients and found two novel generegions not previously reported in European individuals.These findings may influence future study design for type2 diabetes and provide further insight into the biology ofthe disease.
Stratifying T2D by BMI Identifies LAMA1 Risk Locus
PLoS Genetics | www.plosgenetics.org 4 May 2012 | Volume 8 | Issue 5 | e1002741

represented previously reported loci - TCF7L2 (OR = 1.58 [1.47–
1.68], P = 2610240) and CDKAL1 (OR = 1.26 [1.17–1.35],
P = 7610210). One novel locus reached genome-wide significance,
lead SNP positioned ,25 kb from the HLA-DQA2 gene (OR = 1.3
[1.19–1.42], P = 161028). Three further independent signals
reached P,561027, two of which were previously identified
(SNPs in or near ADCY5, OR = 1.25 [1.15–1.35] P = 661028, and
SLC30A8, OR = 1.23 [1.15–1.33] P = 461028) and one of which
was novel (SNPs in LAMA1, OR = 1.22 [1.12–1.30] P = 161027).
Rs numbers are given in Table 2.
Genome-wide association in obese type 2 diabeticindividuals
In the obese case genome wide meta-analysis, five signals reached
genome-wide significance (Table 2), all in or near known loci
TCF7L2, FTO, CDKAL1, HHEX, and IGF2BP2. A further three
signals reached P,561027; SNPs in or near the MC4R gene
(previously associated with BMI), and two other signals; in HMG20A
(previously reported in South Asians -OR = 1.14 [1.09–1.19]
P = 261027) and in ANKS1A (OR = 1.3 [1.18–1.43] P = 561027).
Follow-up of putative novel signalsWe sought to replicate the signals reaching P,561027 not
previously reported in Europeans. SNPs representing the LAMA1
(rs8090011), HLA-DQA2 (rs3916765), HMG20A (rs7178572), and
ANKS1A (rs16896390) signals were genotyped in up to 2,881 lean
cases, 8,702 obese cases and 18,957 control individuals. Combined
discovery and follow-up association statistics for these SNPs are
shown in Table 2. In the lean case analysis, the LAMA1 variant
was associated with type 2 diabetes (combined P = 8.461029,
OR = 1.13 [1.09–1.18], total lean cases N = 4,993, con-
trols = 70,515) compared to an OR = 1.03 [1.00–1.06] in the
obese case analysis (Figure 1 and Figure 2). In the obese case
analysis, the HMG20A signal was associated with type 2 diabetes
(combined P = 1.361028, OR = 1.11 [1.07–1.15], total obese
cases N = 8,583, controls = 62,063) compared to an OR = 1.09
[1.02–1.17], P = 0.015, in the lean analysis (Figure 3 and Figure 4).
In previously published studies including 8,130 cases not stratified
by BMI [1], the LAMA1 and HMG20A variants reached only
nominal levels of significance of P = 0.002 (OR = 1.07 [1.03–1.12])
and P = 0.003, OR = 1.07 [1.02–1.12] respectively (both in the
same directions as reported here).
Considering a random-effects model [39] for both LAMA1 and
HMG20A signals gave similar evidence for association (LAMA1
lean analysis: P = 5610210, obese analysis: P = 0.02; HMG20A
lean analysis: P = 0.04, obese analysis: P = 2.761028). Evidence for
association at the HLA-DQA2 and ANKS1A signals was reduced
when follow-up data were included.
Association of variants with BMIWe next attempted to understand further the associations
between SNPs in the LAMA1 and HMG20A loci and lean and
Table 1. Patient characteristics for discovery and replication type 2 diabetes case samples.
Lean Patients Obese Patients
Study N M/F Age Diag BMI mean SD N M/F Age Diag BMI mean SD
GWA studies discovery
DGI 225 106/119 59.47 (10.57) 22.93 (1.51) 303 143/160 56.49 (9.90) 33.10 (2.52)
WTCCC 257 160/97 n/a 23.00 (1.54) 1,011 533/478 n/a 35.63 (4.98)
FUSION 123 78/45 53.67 (9.73) 23.22 (1.61) 529 265/264 53.62 (8.72) 34.00 (3.37)
deCODE 214 117/97 54.60 (14.90) 23.20 (1.78) 625 346/279 54.10 (11.20) 34.69 (4.38)
KORA 36 21/15 57.48 (11.92) 23.47 (1.33) 219 115/104 56.77 (9.82) 34.64 (4.07)
DGDG 185 99/86 44.30 (9.13) 22.72 (1.81) - - - -
Rotterdam 301 144/157 n/a 22.87 (1.58) 247 62/185 n/a 33.05 (3.02)
Eurospan-MICROS - - - - 22 15/7 n/a 34.30 (3.65)
Eurospan-Orcades - - - - 21 14/7 n/a 35.25 (4.52)
Eurospan-ERF - - - - 25 14/11 n/a 34.98 (3.80)
Eurospan-Vis - - - - 38 25/13 n/a 32.83 (2.74)
FHS 93 47/46 58 23.07 331 181/150 56.00 36.27
ARIC 111 52/59 47.90 (12.00) 23.06 (1.50) 358 174/178 51.40 (9.35) 34.95 (4.27)
NHS 567 0/100 57.68 (13.37) 22.67 (1.67) 394 0/100 56.01 (10.10) 33.88 (3.77)
Total 2,112 54.14 (11.66) 23.02 (1.59) 4,123 54.91 (9.84) 34.43 (3.76)
Replication
GoDarts 263 151/112 56.83 (8.95) 22.97 (1.77) 1,735 950/785 54.8 (8.96) 35.94 (5.33)
DGDG 1,161 680/530 48.00 (10.02) 22.53 (1.51) 2,972 1,599/1,504 49.00 (11.12) 34.43 (4.36)
Malmo CC 477 291/186 59.2 (11.6) 22.9 (1.9) 1080 583/497 55.8 (10.8) 34.70 (4.30)
ADDITION-Ely 39 27/12 66.59 (5.20) 23.31 (1.57) 586 346/240 60.67 (7.65) 35.69 (4.78)
EPIC-NDCCS 941 544/397 63.35 (12.29) 22.96 (1.76) 2,329 1,208/1,121 58.01 (11.25) 35.04 (4.81)
Total 2,881 58.79 (9.61) 22.93 (1.7) 8,702 55.66 (9.96) 35.16 (4.72)
Eurospan represents a single cohort in the main text, however is split into its component studies in this table. There were too few lean cases in the Eurospan studies toinclude in meta-analysis. - = individuals not used. n/a = individuals used in analyses but data not available.doi:10.1371/journal.pgen.1002741.t001
Stratifying T2D by BMI Identifies LAMA1 Risk Locus
PLoS Genetics | www.plosgenetics.org 5 May 2012 | Volume 8 | Issue 5 | e1002741

Ta
ble
2.
Hig
he
st-r
anke
din
de
pe
nd
en
tsi
gn
als
inth
ele
anan
do
be
seca
seG
WA
stu
die
s.
Dis
cov
ery
Re
pli
cati
on
Co
mb
ine
d
Le
an
An
aly
sis
Le
an
Ob
ese
Le
an
SN
PN
rG
en
eR
isk
All
ele
RA
FO
RP
-Va
lue
NC
ase
/ctr
lO
RP
-Va
lue
NC
ase
/ctr
lO
RP
-va
lue
NP
-va
lue
OR
N
rs7
90
31
46
TCF7
L2t
0.2
91
.58
[1.4
7–
1.6
8]
2.0
0E2
40
23
75
/55
24
91
.26
[1.2
–1
.32
]4
.40
E22
15
85
8/5
81
03
n/a
n/a
n/a
n/a
n/a
n/a
rs7
76
60
70
CD
KA
L1a
0.2
71
.26
[1.1
7–
1.3
5]
7.3
0E2
10
21
12
/51
55
81
.21
[1.1
4–
1.2
8]
5.8
0E2
11
58
58
/58
10
3n
/an
/an
/an
/an
/an
/a
rs3
91
67
65
HLA
-DQ
A2
a0
.12
1.3
[1.1
9–
1.4
2]
1.2
0E2
08
23
75
/55
24
91
.07
[1.0
0–
1.1
5]
0.0
45
85
8/5
81
03
0.9
6[0
.81
–1.1
3]
0.6
21
16
1/3
96
01
.00
E20
61
.21
[1.1
2–
1.3
1]
35
36
/59
20
9
rs3
80
21
77
SLC
30A
8g
0.6
81
.23
[1.1
5–
1.3
3]
3.8
0E2
08
20
82
/50
87
91
.12
[1.0
6–
1.1
9]
5.0
3E2
05
58
58
/58
10
3n
/an
/an
/an
/an
/an
/a
rs1
17
08
06
7A
DC
Y5
a0
.78
1.2
5[1
.15
–1
.35
]5
.70
E2
08
23
75
/55
24
91
.07
[1.0
1–
1.1
4]
0.0
15
85
8/5
81
03
n/a
n/a
n/a
n/a
n/a
n/a
rs8
09
00
11
LAM
A1
g0
.38
1.2
2[1
.12
–1
.3]
1.0
0E2
07
21
12
/51
55
81
.02
[0.9
6–
1.0
8]
0.5
58
58
/58
10
31
.09
[1.0
3–1
.15
]0
.00
32
88
1/1
89
57
8.4
0E2
09
1.1
3[1
.09
–1
.18
]4
99
3/7
05
15
Ob
ese
An
aly
sis
Ob
ese
Le
an
Ob
ese
SN
PN
rG
en
eR
isk
All
ele
RA
FO
RP
-Va
lue
NC
ase
/ctr
lO
RP
-Va
lue
NC
ase
/ctr
lO
RP
-va
lue
NP
-va
lue
OR
N
rs7
90
31
46
TCF7
L2t
0.2
91
.26
[1.2
–1
.32
]4
.40
E2
21
58
58
/58
10
31
.58
[1.4
7–
1.6
8]
2.0
0E2
40
23
75
/55
24
9n
/an
/an
/an
/an
/an
/a
rs9
93
96
09
FTO
a0
.41
.25
[1.1
9–
1.3
]1
.10
E2
20
58
58
/58
10
30
.95
[0.8
9–
1.0
2]
0.1
62
37
5/5
52
49
n/a
n/a
n/a
n/a
n/a
n/a
rs7
76
60
70
CD
KA
L1a
0.2
71
.21
[1.1
4–
1.2
8]
5.8
0E2
11
41
23
/54
41
21
.26
[1.1
7–
1.3
5]
7.3
0E2
10
23
75
/55
24
9n
/an
/an
/an
/an
/an
/a
rs5
01
54
80
HH
EXc
0.5
71
.18
[1.1
1–
1.2
3]
1.9
0E2
09
41
23
/54
41
21
.17
[1.0
9–
1.2
5]
6.1
5E2
06
23
75
/55
24
9n
/an
/an
/an
/an
/an
/a
rs4
40
29
60
IG2B
P2
t0
.31
1.1
5[1
.1–
1.2
1]
2.5
0E2
09
58
58
/58
10
31
.16
[1.0
8–
1.2
4]
1.5
3E2
05
23
75
/55
24
9n
/an
/an
/an
/an
/an
/a
rs6
56
71
60
MC
4Rc
0.2
31
.15
[1.0
9–
1.2
]1
.80
E2
07
58
58
/58
10
31
.07
[0.9
9–
1.1
5]
0.0
72
37
5/5
52
49
n/a
n/a
n/a
n/a
n/a
n/a
rs7
17
85
72
HM
G20
Ag
0.7
1.1
4[1
.09
–1
.19
]2
.10
E2
07
58
58
/58
10
31
.09
[1.0
2–
1.1
6]
0.0
12
37
5/5
52
49
1.0
9[1
–1
.16
]0
.04
29
72
/3
96
01
.30
E20
81
.11
[1.0
7–
1.1
5]
85
83
/62
06
3
rs1
68
96
39
0A
NK
S1A
c0
.91
1.3
[1.1
8–
1.4
3]
4.7
0E2
07
41
23
/54
41
21
.14
[1.0
0–
1.2
9]
0.0
42
37
5/5
52
49
0.9
7[0
.89
–1
.06
]0
.55
47
07
/7
65
10
.00
21
.11
[1.0
4–
1.1
9]
85
83
/62
06
3
SNP
sm
app
ed
to‘+
’st
ran
d,
ge
no
me
bu
ild3
6.
Ind
ep
en
de
nce
bas
ed
on
hap
map
r2,
0.0
5.
Stu
dy
dir
ect
ion
ssh
ow
dir
ect
ion
alco
nsi
ste
ncy
of
eff
ect
size
est
imat
es
wit
hin
the
ind
ivid
ual
coh
ort
sm
eta
-an
alys
ed
.d
oi:1
0.1
37
1/j
ou
rnal
.pg
en
.10
02
74
1.t
00
2
Stratifying T2D by BMI Identifies LAMA1 Risk Locus
PLoS Genetics | www.plosgenetics.org 6 May 2012 | Volume 8 | Issue 5 | e1002741
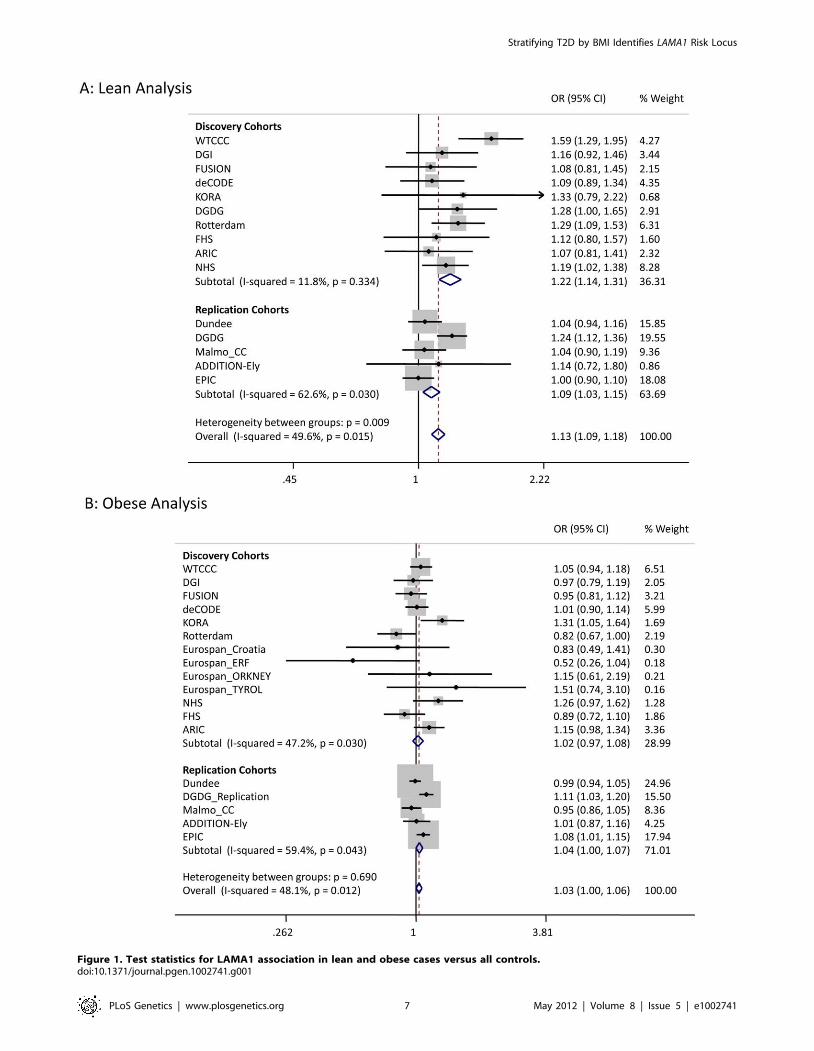
Figure 1. Test statistics for LAMA1 association in lean and obese cases versus all controls.doi:10.1371/journal.pgen.1002741.g001
Stratifying T2D by BMI Identifies LAMA1 Risk Locus
PLoS Genetics | www.plosgenetics.org 7 May 2012 | Volume 8 | Issue 5 | e1002741

obese type 2 diabetes cases respectively. Our study design, together
with the associations between the FTO and MC4R variants in the
obese strata, suggested that variants that primarily operate through
BMI could drive our newly identified associations. We therefore
assessed the two signals in the existing GWA studies of BMI
performed by the GIANT study and consisting of 123,865
individuals [18]. The LAMA1 SNP was not associated with BMI
(P = 0.19) whilst the type 2 diabetes risk allele at the HMG20A SNP
was nominally associated with increased BMI (P = 0.02).
Association of variants with BMI within cases onlyIf the associations at the LAMA1 and HMG20A loci are
genuinely stronger in one strata of diabetic cases compared to the
other, we should observe an association of those variants with BMI
within cases only. This phenomenon has previously been reported
for the variants in TCF7L2[14]. The LAMA1 type 2 diabetes risk
allele was associated with lower BMI within cases alone
(P = 261026 when analysing BMI as a quantitative trait in
26,366 cases), a result consistent with its association being stronger
in the lean case analysis. The HMG20A risk allele showed no
evidence of association (P.0.05).
Association of variants with continuous glycaemicmeasures
Next we used data from MAGIC to assess potential roles of
variants in normal glycaemia. The SNP representing the novel
LAMA1 association showed no association with fasting glucose
(P = 0.48, beta(se) = 0.0027(0.004) N = 46,186), fasting insulin
(P = 0.87, beta(se) = 0.0006(0.004) N = 38,238), HbA1C (P = 0.19,
beta(se) = 0.005(0.004) N = 46,368), 2-hour glucose response
(P = 0.43, beta(se) = 20.016(0.02), N = 15,234), or any of the
SNP6BMI-interaction models. However, LAMA1 isn’t unique
amongst type 2 diabetes loci in showing no effect on glycemic traits
in the MAGIC study.
The HMG20A diabetes risk allele was associated with higher
fasting glucose (P = 0.04, beta(se) = 0.008(0.004), N = 46,186),
higher HbA1C (P = 0.002, beta(se) = 0.01(0.004), N = 46,368)
and higher fasting glucose after accounting for BMI and
SNPxBMI interaction (P = 0.008, N = 58,074).
Association of variants with cis gene expression levelsIn an attempt to gain further insight into likely functional genes
in the LAMA1 and HMG20A loci, we tested the lead SNPs at for
association in a number of eQTL datasets. Tissues tested included
various blood, brain, liver and fat samples (see Methods). Only ‘cis’
associations were considered (eQTL effects on a transcript within
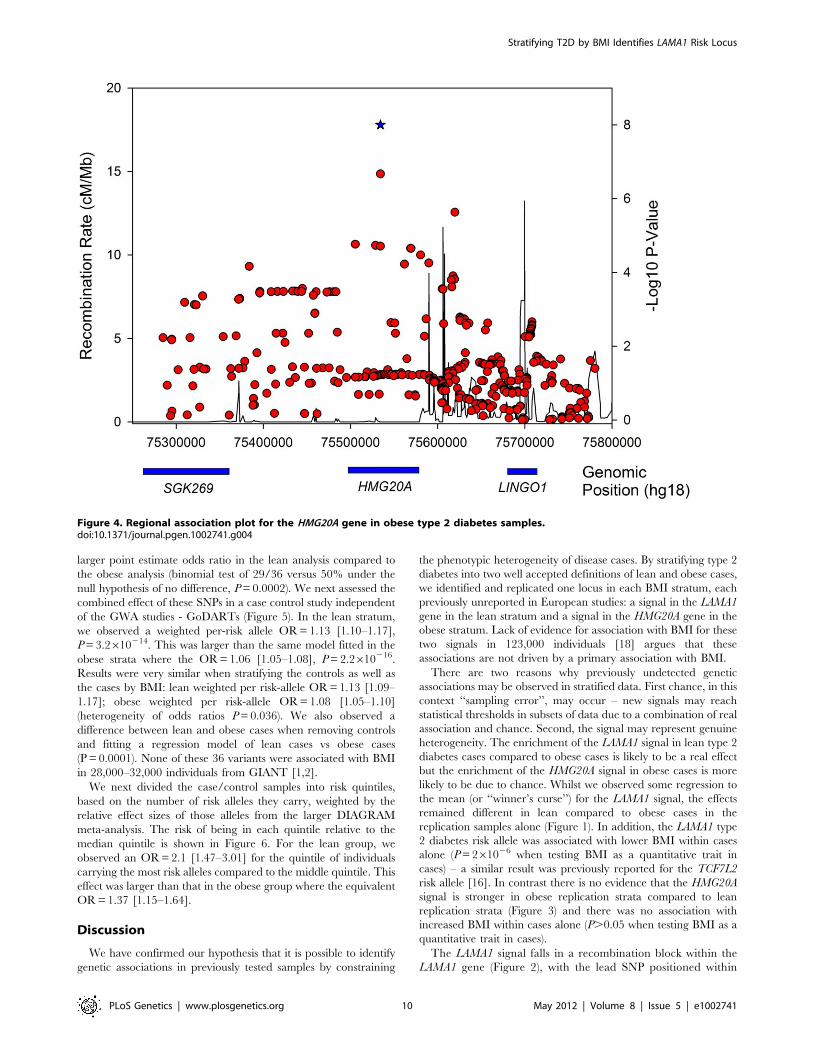
1 Mb of the signal SNPs). The rs7178572 SNP in the HMG20A region
was significantly associated with mRNA expression levels of HMG20A
in the liver (P = 461025), supported by two separate expression probes,
and was the strongest known regional SNP for both the liver eQTL
and type 2 diabetes. No other study-wide significant results were
observed (N = 14 tissues, 24 datasets/analyses).
Evidence that genetic variants associated with type 2diabetes have different effects between lean andobese cases
For each of 36 published type 2 diabetes loci (identified in
European studies and available on the metabochip) we compared
the effect sizes between the lean and obese GWA study meta-
analyses (Table 3). Among the 36 independent variants, 29 had a
Figure 2. Regional association plot for the LAMA1 gene in lean type 2 diabetes samples.doi:10.1371/journal.pgen.1002741.g002
Stratifying T2D by BMI Identifies LAMA1 Risk Locus
PLoS Genetics | www.plosgenetics.org 8 May 2012 | Volume 8 | Issue 5 | e1002741

Figure 3. Test statistics for HMG20A association in lean and obese cases versus all controls.doi:10.1371/journal.pgen.1002741.g003
Stratifying T2D by BMI Identifies LAMA1 Risk Locus
PLoS Genetics | www.plosgenetics.org 9 May 2012 | Volume 8 | Issue 5 | e1002741
larger point estimate odds ratio in the lean analysis compared to
the obese analysis (binomial test of 29/36 versus 50% under the
null hypothesis of no difference, P = 0.0002). We next assessed the
combined effect of these SNPs in a case control study independent
of the GWA studies - GoDARTs (Figure 5). In the lean stratum,
we observed a weighted per-risk allele OR = 1.13 [1.10–1.17],
P = 3.2610214. This was larger than the same model fitted in the
obese strata where the OR = 1.06 [1.05–1.08], P = 2.2610216.
Results were very similar when stratifying the controls as well as
the cases by BMI: lean weighted per risk-allele OR = 1.13 [1.09–
1.17]; obese weighted per risk-allele OR = 1.08 [1.05–1.10]
(heterogeneity of odds ratios P = 0.036). We also observed a
difference between lean and obese cases when removing controls
and fitting a regression model of lean cases vs obese cases
(P = 0.0001). None of these 36 variants were associated with BMI
in 28,000–32,000 individuals from GIANT [1,2].
We next divided the case/control samples into risk quintiles,
based on the number of risk alleles they carry, weighted by the
relative effect sizes of those alleles from the larger DIAGRAM
meta-analysis. The risk of being in each quintile relative to the
median quintile is shown in Figure 6. For the lean group, we
observed an OR = 2.1 [1.47–3.01] for the quintile of individuals
carrying the most risk alleles compared to the middle quintile. This
effect was larger than that in the obese group where the equivalent
OR = 1.37 [1.15–1.64].
Discussion
We have confirmed our hypothesis that it is possible to identify
genetic associations in previously tested samples by constraining
the phenotypic heterogeneity of disease cases. By stratifying type 2
diabetes into two well accepted definitions of lean and obese cases,
we identified and replicated one locus in each BMI stratum, each
previously unreported in European studies: a signal in the LAMA1
gene in the lean stratum and a signal in the HMG20A gene in the
obese stratum. Lack of evidence for association with BMI for these
two signals in 123,000 individuals [18] argues that these
associations are not driven by a primary association with BMI.
There are two reasons why previously undetected genetic
associations may be observed in stratified data. First chance, in this
context ‘‘sampling error’’, may occur – new signals may reach
statistical thresholds in subsets of data due to a combination of real
association and chance. Second, the signal may represent genuine
heterogeneity. The enrichment of the LAMA1 signal in lean type 2
diabetes cases compared to obese cases is likely to be a real effect
but the enrichment of the HMG20A signal in obese cases is more
likely to be due to chance. Whilst we observed some regression to
the mean (or ‘‘winner’s curse’’) for the LAMA1 signal, the effects
remained different in lean compared to obese cases in the
replication samples alone (Figure 1). In addition, the LAMA1 type
2 diabetes risk allele was associated with lower BMI within cases
alone (P = 261026 when testing BMI as a quantitative trait in
cases) – a similar result was previously reported for the TCF7L2
risk allele [16]. In contrast there is no evidence that the HMG20A
signal is stronger in obese replication strata compared to lean
replication strata (Figure 3) and there was no association with
increased BMI within cases alone (P.0.05 when testing BMI as a
quantitative trait in cases).
The LAMA1 signal falls in a recombination block within the
LAMA1 gene (Figure 2), with the lead SNP positioned within
Figure 4. Regional association plot for the HMG20A gene in obese type 2 diabetes samples.doi:10.1371/journal.pgen.1002741.g004
Stratifying T2D by BMI Identifies LAMA1 Risk Locus
PLoS Genetics | www.plosgenetics.org 10 May 2012 | Volume 8 | Issue 5 | e1002741

intron 61. Searching for correlated SNPs (r2.0.5) using 1000
Genomes Project data identified only additional intronic SNPs.
Previous cell biology studies support a role for LAMA1, encoding
laminin-1, in diabetes etiology - inhibition of LAMA1 expression
reduced glucose-stimulated secretion in INS1E cells [40].
Several studies observed the beneficial effects of laminin-1,
and extracellular matrix (highly enriched with laminin-1)
preparations on pancreatic islet development and function
[41,42,43,44,45,46]. Laminin-1 is expressed in intra-islet cap-
illaries [47] and a role for laminin receptor 1 was proposed in
angiogenesis [48].
The confidence in the HMG20A association is enhanced by
several lines of evidence from other studies. The HMG20A signal
was previously identified in a GWA study of South Asian
individuals [7] and was nominally associated with fasting glucose
(P = 0.04, N = 46,186) and HbA1C (P = 0.002, N = 46,368) in non-
diabetic individuals analysed by the MAGIC consortium. The
association with fasting glucose became stronger when adjusting
for BMI in an interaction model (P = 0.008).
We initially discovered a genome-wide significant signal near
the HLA-DQA2 locus, which subsequently failed to replicate
(rs3916765, P = 161026). This variant is not in the same gene or
Table 3. Association statistics for known European type 2 diabetes loci in the lean and obese GWA studies strata.
Lean T2D Cases N = 2112 vs all controls Obese T2D Cases N = 4123 vs all controls
SNPNearest orCandidate Gene Chr Risk Allele OR P-value OR P value
rs7903146 TCF7L2 10 T 1.58[1.47–1.68] 2.0E240 1.26[1.20–1.32] 4.40E221
rs11708067 ADCY5 3 A 1.25[1.15–1.35] 5.7E208 1.07[1.01–1.14] 0.01
rs10923931 NOTCH2 1 T 1.22[1.11–1.35] 0.00007 1.06[0.98–1.13] 0.14
rs13266634 SLC30A8 8 C 1.24[1.15–1.34] 5.1E208 1.12[1.06–1.19] 0.00005
rs2237892 KCNQ1 11 C 1.29[1.12–1.48] 0.0003 1.11[1.01–1.22] 0.02
rs10010131 WFS1 4 G 1.14[1.07–1.22] 0.00005 1.07[1.02–1.12] 0.004
rs10811661 CDKNA/2B 9 T 1.22[1.12–1.33] 0.000007 1.12[1.05–1.19] 0.0002
rs5215 KCNJ11 11 C 1.15[1.08–1.23] 0.00002 1.08[1.03–1.13] 0.0007
rs4457053 ZBED3 5 G 1.14[1.05–1.24] 0.002 1.06[1.00–1.12] 0.04
rs340874 PROX1 1 C 1.12[1.05–1.19] 0.0008 1.06[1.01–1.11] 0.02
rs7957197 HNF1A 12 T 1.07[0.99–1.16] 0.07 1.01[0.96–1.07] 0.69
rs243021 BCL11A 2 A 1.12[1.05–1.20] 0.0006 1.07[1.01–1.12] 0.01
rs896854 TP53INP1 8 T 1.02[0.96–1.09] 0.44 1.07[1.03–1.12] 0.002
rs757210 HNF1B 17 T 1.17[1.05–1.29] 0.003 1.09[1.02–1.17] 0.02
rs7578597 THADA 2 T 1.20[1.08–1.33] 0.0008 1.12[1.04–1.20] 0.004
rs1111875 HHEX 10 C 1.18[1.10–1.25] 5.3E207 1.13[1.08–1.18] 6.4E208
rs972283 KLF14 7 G 1.13[1.06–1.20] 0.0002 1.09[1.04–1.14] 0.0003
rs7593730 RBMS1/ITGB6 2 C 1.12[1.03–1.22] 0.005 1.07[1.00–1.14] 0.03
rs7754840 CDKAL1 6 C 1.19[1.11–1.27] 3.80E207 1.14[1.09–1.20] 2.0E208
rs4607103 ADAMTS9 3 C 1.03[0.95–1.11] 0.47 1.07[1.01–1.13] 0.01
rs1531343 HMGA2 12 C 1.13[1.01–1.27] 0.03 1.20[1.10–1.31] 0.00003
rs7961581 TSPAN8,LGR5 12 C 1.17[1.08–1.26] 0.00007 1.13[1.06–1.20] 0.00007
rs8042680 PRC1 15 A 1.07[1.00–1.14] 0.05 1.04[0.99–1.09] 0.10
rs11634397 ZFAND6 15 G 1.08[1.01–1.16] 0.03 1.05[1.00–1.10] 0.04
rs7578326 IRS1 2 A 1.10[1.03–1.18] 0.008 1.07[1.02–1.13] 0.006
rs1552224 CENTD2 11 A 1.05[0.96–1.14] 0.27 1.08[1.02–1.15] 0.01
rs1801282 PPARg 3 C 1.14[1.04–1.26] 0.008 1.11[1.04–1.18] 0.003
rs12779790 CAMK1D 10 G 1.12[1.03–1.22] 0.009 1.09[1.02–1.16] 0.008
rs864745 JAZF1 7 T 1.09[1.03–1.16] 0.006 1.08[1.03–1.12] 0.001
rs780094 GCKR 2 C 1.04[0.98–1.11] 0.19 1.03[0.98–1.08] 0.22
rs13292136 TLE4 9 C 1.15[1.00–1.31] 0.04 1.12[1.00–1.24] 0.04
rs231362 KCNQ1 11 G 1.09[1.02–1.17] 0.01 1.08[1.03–1.14] 0.003
rs4607517 GCK 7 A 1.03[0.94–1.12] 0.55 1.04[0.98–1.10] 0.20
rs1470579 IGF2BP2 3 C 1.15[1.07–1.23] 0.00009 1.16[1.10–1.23] 6.4E208
rs10830963 MTNR1B 11 G 1.11[1.03–1.20] 0.007 1.10[1.04–1.16] 0.0005
rs2191349 DGKB/TME195 7 T 1.03[0.97–1.10] 0.38 1.04[0.99–1.08] 0.13
KCNQ1 appears twice as it has two independent signals confirmed through conditional analysis.doi:10.1371/journal.pgen.1002741.t003
Stratifying T2D by BMI Identifies LAMA1 Risk Locus
PLoS Genetics | www.plosgenetics.org 11 May 2012 | Volume 8 | Issue 5 | e1002741
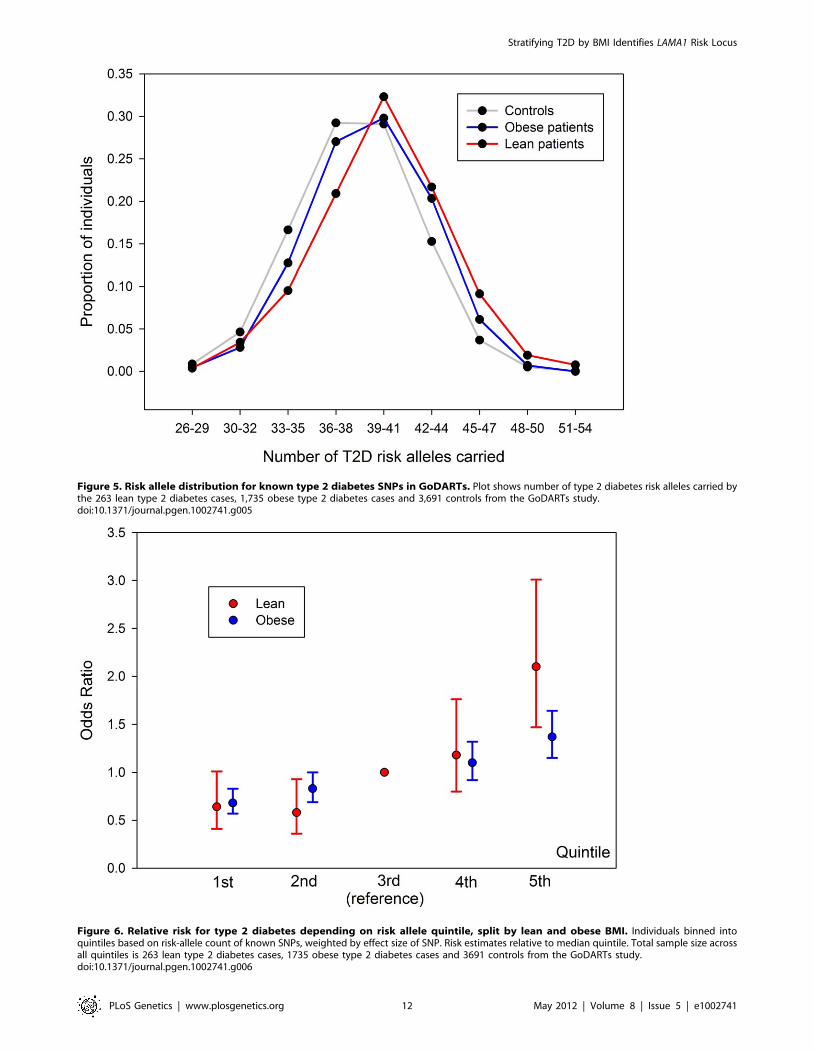
Figure 5. Risk allele distribution for known type 2 diabetes SNPs in GoDARTs. Plot shows number of type 2 diabetes risk alleles carried bythe 263 lean type 2 diabetes cases, 1,735 obese type 2 diabetes cases and 3,691 controls from the GoDARTs study.doi:10.1371/journal.pgen.1002741.g005
Figure 6. Relative risk for type 2 diabetes depending on risk allele quintile, split by lean and obese BMI. Individuals binned intoquintiles based on risk-allele count of known SNPs, weighted by effect size of SNP. Risk estimates relative to median quintile. Total sample size acrossall quintiles is 263 lean type 2 diabetes cases, 1735 obese type 2 diabetes cases and 3691 controls from the GoDARTs study.doi:10.1371/journal.pgen.1002741.g006
Stratifying T2D by BMI Identifies LAMA1 Risk Locus
PLoS Genetics | www.plosgenetics.org 12 May 2012 | Volume 8 | Issue 5 | e1002741

in linkage disequilibrium with previously reported associations
between HLA loci and type 2 diabetes [1,49]. Concerned with the
prospect of this association being due to auto-immune diabetes
case admixture, we assessed the association of the strongest known
type 1 diabetes signals in our lean meta-analysis. None of these
showed any significant evidence of association – including the lead
signals from the WTCCC type 1 diabetes study in the HLA region
(rs3129941, P = 0.08), or near the INS (rs3842748, P = 0.64) or
PTPN22 (rs2476601, P = 0.38) genes.
This study has provided the most robust evidence to date that
lean type 2 diabetic cases are likely to carry a disproportionately
high load of known type 2 diabetes risk alleles. More than 80%
(29/36) of type 2 diabetes variants established in Europeans had
stronger effects in lean compared to obese cases and the odds ratio
for the 20% of lean cases carrying the most risk alleles was more
than twice that of the 20% of obese cases carrying the most risk
alleles. The corollary of these findings is that obese cases on
average carry a disproportionately low load of confirmed type 2
diabetes risk variants, but their diabetes risk will likely be more
heavily influenced by their genetic and environmental predispo-
sition to gaining weight in adulthood.
Despite this enrichment of stronger effects in lean versus obese
cases, analyses focused only on lean cases is not a more powerful
study design compared to using all cases. For each of the known
loci tested, the power gained by increased effect sizes is easily offset
by the reduced power of having a case sample size of ,25%.
Nevertheless our data indicate that, given limited resources,
recruitment strategies that target leaner type 2 diabetes cases will
have more power than those that target a similar number of cases
but without enrichment for lower BMI.
There are several limitations to our study. First, the use of an
unstratified control group made testing the significance of
differences between lean and obese cases difficult in the context
of a genome wide meta-analysis. However, several lines of
evidence support our conclusions that lean individuals are
enriched for known type 2 diabetes genetic effects. This evidence
includes: the very large differences between the upper and lower
95% confidence intervals of the weighted per allele effects in lean
and obese, the consistency of the weighted per allele results when
stratifying controls as well as cases, and the 80/20 proportion of
SNPs showing stronger effects in lean compared to obese
individuals respectively. Second, after stratifying by BMI, we did
not use other criteria to reduce the clinical heterogeneity of type 2
diabetes. Of note, cases within the BMI strata differed appreciably
in their age at diagnosis and the degree to which autoimmune or
monogenic diabetes had been excluded. Instead, having stratified
by BMI, we opted to use the largest available sample sizes. It is
possible that a small number of monogenic or autoimmune forms
of diabetes amongst our cases could have reduced our power to
detect novel variants. Further studies may help refine how known
and novel diabetes signals operate in more clinically homogenous
settings. Finally, known type 2 diabetes signals are likely to account
for only a small fraction of all risk variants that exist in the genome
and any inferences we make are limited to the known signals.
In conclusion, we report associations with the LAMA1 and
HMG20A (not previously associated at genome-wide significance
in Europeans) gene regions with type 2 diabetes risk. We have
demonstrated that lean diabetic cases are enriched for known type
2 diabetes risk alleles compared to obese cases. This enrichment is
consistent with the observation that many of the variants with the
strongest effects on diabetes are associated with reduced beta cell
function [1]. At the opposite end of the spectrum, obese cases
presumably need fewer diabetes risk variants to push them towards
diabetes, as they are already under strain from the physiological
impact of obesity and insulin resistance. These data suggest a
disease model where type 2 diabetes cases lie across a continuous
distribution with regards to genetic/environmental risk, and beta-
cell dysfunction versus insulin resistance aetiologies.
Supporting Information
Table S1 Summary characteristics of discovery GWA studies
cohorts. Eurospan represents a single cohort in the main text,
however is split into its component studies in this table. n/a = not
applicable.
(DOC)
Table S2 Summary characteristics of replication cohorts.
(DOC)
Text S1 Full study acknowledgements.
(DOC)
Acknowledgments
Full study acknowledgments are available in Text S1.
Author Contributions
Wrote the paper: JRB Perry, TM Frayling, S Cauchi. Statistical analysis:
JRB Perry, BF Voight, L Yengo, N Amin, J Dupuis, M Ganser, H Grallert,
P Navarro, M Li, L Qi, V Steinthorsdottir, RA Scott, P Almgren.
Phenotyping/genotyping: DE Arking, Y Aulchenko, B Balkau, R
Benediktsson, RN Bergman, E Boerwinkle, L Bonnycastle, NP Burtt, H
Campbell, G Charpentier, FS Collins, C Gieger, T Green, S Hadjadj, AT
Hattersley, C Herder, A Hofman, AD Johnson, A Kottgen, P Kraft, Y
Labrune, C Langenberg, AK Manning, KL Mohlke, AP Morris, B Oostra,
J Pankow, A-K Petersen, PP Pramstaller, I Prokopenko, W Rathmann, W
Rayner, M Roden, I Rudan, D Rybin, LJ Scott, G Sigurdsson, R Sladek,
G Thorleifsson, U Thorsteinsdottir, J Tuomilehto, AG Uitterlinden, S
Vivequin, MN Weedon, AF Wright. Study design: FB Hu, T Illig, L Kao,
JB Meigs, JF Wilson, K Stefansson, C van Duijn, D Altschuler, AD Morris,
M Boehnke, MI McCarthy, P Froguel, CNA Palmer, NJ Wareham, L
Groop, TM Frayling, S Cauchi. Involved in statistical analysis: L Yengo.
Involved in the interpretation of results and editing of manuscript: all
authors.
References
1. Voight BF, Scott LJ, Steinthorsdottir V, Morris AP, Dina C, et al. (2010) Twelve
type 2 diabetes susceptibility loci identified through large-scale association
analysis. Nat Genet 42: 579–589.
2. Dupuis J, Langenberg C, Prokopenko I, Saxena R, Soranzo N, et al. (2010) New
genetic loci implicated in fasting glucose homeostasis and their impact on type 2
diabetes risk. Nat Genet 42: 105–116.
3. Qi L, Cornelis MC, Kraft P, Stanya KJ, Linda Kao WH, et al. (2010) Genetic
variants at 2q24 are associated with susceptibility to type 2 diabetes. Hum Mol
Genet 19: 2706–2715.
4. Tsai FJ, Yang CF, Chen CC, Chuang LM, Lu CH, et al. (2010) A genome-wide
association study identifies susceptibility variants for type 2 diabetes in Han
Chinese. PLoS Genet 6: e1000847. doi:10.1371/journal.pgen.1000847.
5. Yamauchi T, Hara K, Maeda S, Yasuda K, Takahashi A, et al. (2010) A genome-
wide association study in the Japanese population identifies susceptibility loci for
type 2 diabetes at UBE2E2 and C2CD4A-C2CD4B. Nat Genet 42: 864–868.
6. Shu XO, Long J, Cai Q, Qi L, Xiang YB, et al. (2010) Identification of new
genetic risk variants for type 2 diabetes. PLoS Genet 6: e1001127. doi:10.1371/
journal.pgen.1001127.
7. Kooner JS, Saleheen D, Sim X, Sehmi J, Zhang W, et al. (2011) Genome-wide
association study in individuals of South Asian ancestry identifies six new type 2
diabetes susceptibility loci. Nat Genet.
8. Lyssenko V, Nagorny CL, Erdos MR, Wierup N, Jonsson A, et al. (2009)
Common variant in MTNR1B associated with increased risk of type 2 diabetes
and impaired early insulin secretion. Nat Genet 41: 82–88.
Stratifying T2D by BMI Identifies LAMA1 Risk Locus
PLoS Genetics | www.plosgenetics.org 13 May 2012 | Volume 8 | Issue 5 | e1002741
9. Prokopenko I, Langenberg C, Florez JC, Saxena R, Soranzo N, et al.
(2009) Variants in MTNR1B influence fasting glucose levels. Nat Genet 41:77–81.
10. Freathy RM, Mook-Kanamori DO, Sovio U, Prokopenko I, Timpson NJ, et al.
(2010) Variants in ADCY5 and near CCNL1 are associated with fetal growthand birth weight. Nat Genet 42: 430–435.
11. Perry JR, Weedon MN, Langenberg C, Jackson AU, Lyssenko V, et al. (2010)Genetic evidence that raised sex hormone binding globulin (SHBG) levels
reduce the risk of type 2 diabetes. Hum Mol Genet 19: 535–544.
12. Tuomi T, Carlsson A, Li H, Isomaa B, Miettinen A, et al. (1999) Clinical andgenetic characteristics of type 2 diabetes with and without GAD antibodies.
Diabetes 48: 150–157.13. Pearson ER, Flechtner I, Njolstad PR, Malecki MT, Flanagan SE, et al. (2006)
Switching from insulin to oral sulfonylureas in patients with diabetes due toKir6.2 mutations. N Engl J Med 355: 467–477.
14. Timpson NJ, Lindgren CM, Weedon MN, Randall J, Ouwehand WH, et al.
(2009) Adiposity-related heterogeneity in patterns of type 2 diabetes suscepti-bility observed in genome-wide association data. Diabetes 58: 505–510.
15. Cauchi S, Nead KT, Choquet H, Horber F, Potoczna N, et al. (2008) Thegenetic susceptibility to type 2 diabetes may be modulated by obesity status:
implications for association studies. BMC Med Genet 9: 45.
16. Cauchi S, Choquet H, Gutierrez-Aguilar R, Capel F, Grau K, et al. (2008)Effects of TCF7L2 polymorphisms on obesity in European populations. Obesity
(Silver Spring) 16: 476–482.17. Guey LT, Kravic J, Melander O, Burtt NP, Laramie JM, et al. (2011) Power in
the phenotypic extremes: a simulation study of power in discovery andreplication of rare variants. Genet Epidemiol.
18. Speliotes EK, Willer CJ, Berndt SI, Monda KL, Thorleifsson G, et al. (2010)
Association analyses of 249,796 individuals reveal 18 new loci associated withbody mass index. Nat Genet 42: 937–948.
19. Zhou K, Bellenguez C, Spencer CC, Bennett AJ, Coleman RL, et al. (2011)Common variants near ATM are associated with glycemic response to
metformin in type 2 diabetes. Nat Genet 43: 117–120.
20. Soranzo N, Sanna S, Wheeler E, Gieger C, Radke D, et al. (2010) Commonvariants at 10 genomic loci influence hemoglobin A(C) levels via glycemic and
nonglycemic pathways. Diabetes 59: 3229–3239.21. Saxena R, Hivert MF, Langenberg C, Tanaka T, Pankow JS, et al. (2010)
Genetic variation in GIPR influences the glucose and insulin responses to an oralglucose challenge. Nat Genet 42: 142–148.
22. Goring HH, Curran JE, Johnson MP, Dyer TD, Charlesworth J, et al. (2007)
Discovery of expression QTLs using large-scale transcriptional profiling inhuman lymphocytes. Nat Genet 39: 1208–1216.
23. Idaghdour Y, Czika W, Shianna KV, Lee SH, Visscher PM, et al. (2010)Geographical genomics of human leukocyte gene expression variation in
southern Morocco. Nat Genet 42: 62–67.
24. Heap GA, Trynka G, Jansen RC, Bruinenberg M, Swertz MA, et al. (2009)Complex nature of SNP genotype effects on gene expression in primary human
leucocytes. BMC Med Genomics 2: 1.25. Dixon AL, Liang L, Moffatt MF, Chen W, Heath S, et al. (2007) A genome-wide
association study of global gene expression. Nat Genet 39: 1202–1207.26. Stranger BE, Nica AC, Forrest MS, Dimas A, Bird CP, et al. (2007) Population
genomics of human gene expression. Nat Genet 39: 1217–1224.
27. Kwan T, Benovoy D, Dias C, Gurd S, Provencher C, et al. (2008) Genome-wideanalysis of transcript isoform variation in humans. Nat Genet 40: 225–231.
28. Heinzen EL, Ge D, Cronin KD, Maia JM, Shianna KV, et al. (2008) Tissue-specific genetic control of splicing: implications for the study of complex traits.
PLoS Biol 6: e1. doi:10.1371/journal.pbio.1000001.
29. Zeller T, Wild P, Szymczak S, Rotival M, Schillert A, et al. (2010) Genetics andbeyond–the transcriptome of human monocytes and disease susceptibility. PLoS
ONE 5: e10693. doi:10.1371/journal.pone.0010693.
30. Emilsson V, Thorleifsson G, Zhang B, Leonardson AS, Zink F, et al. (2008)Genetics of gene expression and its effect on disease. Nature 452: 423–428.
31. Greenawalt DM, Dobrin R, Chudin E, Hatoum IJ, Suver C, et al. (2011) A
survey of the genetics of stomach, liver, and adipose gene expression from amorbidly obese cohort. Genome Res 21: 1008–1016.
32. Kompass KS, Witte JS (2011) Co-regulatory expression quantitative trait loci
mapping: method and application to endometrial cancer. BMC Med Genomics4: 6.
33. Webster JA, Gibbs JR, Clarke J, Ray M, Zhang W, et al. (2009) Genetic control
of human brain transcript expression in Alzheimer disease. Am J Hum Genet84: 445–458.
34. Schadt EE, Molony C, Chudin E, Hao K, Yang X, et al. (2008) Mapping the
genetic architecture of gene expression in human liver. PLoS Biol 6: e107.doi:10.1371/journal.pbio.0060107.
35. Innocenti F, Cooper GM, Stanaway IB, Gamazon ER, Smith JD, et al. (2011)
Identification, replication, and functional fine-mapping of expression quantita-tive trait loci in primary human liver tissue. PLoS Genet 7: e1002078.
doi:10.1371/journal.pgen.1002078.
36. Grundberg E, Kwan T, Ge B, Lam KC, Koka V, et al. (2009) Population
genomics in a disease targeted primary cell model. Genome Res 19: 1942–1952.
37. Ding J, Gudjonsson JE, Liang L, Stuart PE, Li Y, et al. (2010) Gene expressionin skin and lymphoblastoid cells: Refined statistical method reveals extensive
overlap in cis-eQTL signals. Am J Hum Genet 87: 779–789.
38. Dimas AS, Deutsch S, Stranger BE, Montgomery SB, Borel C, et al. (2009)Common regulatory variation impacts gene expression in a cell type-dependent
manner. Science 325: 1246–1250.
39. Han B, Eskin E (2011) Random-effects model aimed at discovering associationsin meta-analysis of genome-wide association studies. Am J Hum Genet 88:
586–598.
40. Antinozzi PA, Garcia-Diaz A, Hu C, Rothman JE (2006) Functional mapping ofdisease susceptibility loci using cell biology. Proc Natl Acad Sci U S A 103:
3698–3703.
41. Jiang FX, Harrison LC (2005) Convergence of bone morphogenetic protein andlaminin-1 signaling pathways promotes proliferation and colony formation by
fetal mouse pancreatic cells. Exp Cell Res 308: 114–122.
42. Vasir B, Aiello LP, Yoon KH, Quickel RR, Bonner-Weir S, et al. (1998)Hypoxia induces vascular endothelial growth factor gene and protein expression
in cultured rat islet cells. Diabetes 47: 1894–1903.
43. Bonner-Weir S, Taneja M, Weir GC, Tatarkiewicz K, Song KH, et al. (2000) Invitro cultivation of human islets from expanded ductal tissue. Proc Natl Acad
Sci U S A 97: 7999–8004.
44. Gao R, Ustinov J, Pulkkinen MA, Lundin K, Korsgren O, et al. (2003)
Characterization of endocrine progenitor cells and critical factors for their
differentiation in human adult pancreatic cell culture. Diabetes 52: 2007–2015.
45. Jiang FX, Georges-Labouesse E, Harrison LC (2001) Regulation of laminin 1-
induced pancreatic beta-cell differentiation by alpha6 integrin and alpha-
dystroglycan. Mol Med 7: 107–114.
46. Jiang FX, Cram DS, DeAizpurua HJ, Harrison LC (1999) Laminin-1 promotes
differentiation of fetal mouse pancreatic beta-cells. Diabetes 48: 722–730.
47. Geutskens SB, Homo-Delarche F, Pleau JM, Durant S, Drexhage HA, et al.(2004) Extracellular matrix distribution and islet morphology in the early
postnatal pancreas: anomalies in the non-obese diabetic mouse. Cell Tissue Res
318: 579–589.
48. Hu C, Oliver JA, Goldberg MR, Al-Awqati Q (2001) LRP: a new adhesion
molecule for endothelial and smooth muscle cells. Am J Physiol Renal Physiol
281: F739–750.
49. Williams RC, Muller YL, Hanson RL, Knowler WC, Mason CC, et al. (2011)
HLA-DRB1 reduces the risk of type 2 diabetes mellitus by increased insulin
secretion. Diabetologia 54: 1684–1692.
Stratifying T2D by BMI Identifies LAMA1 Risk Locus
PLoS Genetics | www.plosgenetics.org 14 May 2012 | Volume 8 | Issue 5 | e1002741


![CIVIL CASES] [FRESH (FOR ADMISSION) - CRIMINAL CASES]](https://static.fdokumen.com/doc/165x107/633739bdd63e7c790105b19d/civil-cases-fresh-for-admission-criminal-cases-1682892728.jpg)