
HCS: a new local search strategy for memetic multiobjective evolutionary algorithms
Memetic Comp. (2010) 2:183–199DOI 10.1007/s12293-010-0048-1
REGULAR RESEARCH PAPER
Stratified prototype selection based on a steady-state memeticalgorithm: a study of scalability
Joaquín Derrac · Salvador García · Francisco Herrera
Received: 22 September 2009 / Accepted: 9 July 2010 / Published online: 24 July 2010© Springer-Verlag 2010
Abstract Prototype selection (PS) is a suitable data reduc-tion process for refining the training set of a data mining algo-rithm. Performing PS processes over existing datasets cansometimes be an inefficient task, especially as the size of theproblem increases. However, in recent years some techniqueshave been developed to avoid the drawbacks that appeareddue to the lack of scalability of the classical PS approaches.One of these techniques is known as stratification. In thisstudy, we test the combination of stratification with a pre-viously published steady-state memetic algorithm for PS invarious problems, ranging from 50,000 to more than 1 millioninstances. We perform a comparison with some well-knownPS methods, and make a deep study of the effects of strati-fication in the behavior of the selected method, focused onits time complexity, accuracy and convergence capabilities.Furthermore, the trade-off between accuracy and efficiencyof the proposed combination is analyzed, concluding that itis a very suitable option to perform PS tasks when the sizeof the problem exceeds the capabilities of the classical PSmethods.
J. Derrac (B) · F. HerreraDepartment of Computer Science and Artificial Intelligence,CITIC-UGR (Research Center on Information andCommunications Technology), University of Granada,18071 Granada, Spaine-mail: [email protected]
F. Herrerae-mail: [email protected]
S. GarcíaDepartment of Computer Science,University of Jaén, 23071 Jaén, Spaine-mail: [email protected]
Keywords Data reduction · Memetic algorithm ·Stratification · Scaling up · Prototype selection ·Nearest neighbor rule
1 Introduction
In recent years, the size of the data which some data min-ing applications must manage has increased. Researchersin many fields such as biology, medicine and industry havedeveloped more efficient and accurate data acquisition meth-ods, which have allowed them to face greater and more dif-ficult problems than before. As a result, the amount of dataextracted to analyze those new challenges has grown to apoint at which many classical data mining methods cannotwork properly, or, at least, suffer several drawbacks in theirapplication.
Data reduction [53] is a data preprocessing task which canbe applied to ease the problem of dealing with large amountsof data. Its main objective is to reduce the original data byselecting the most representative information. In this way, itis possible to avoid excessive storage and time complexity,improving the results obtained by any data mining appli-cation, e.g., supervised classification. The best known datareduction processes are feature selection [42], feature gener-ation [25], attribute discretization [41], instance generation[8,46] and instance selection [40,43].
Prototype selection (PS) is an effective data reduction pro-cess developed to improve the performance of the nearestneighbor (NN) rule. As a subtype of instance selection pro-cedures, the objective of PS is to select the most promis-ing examples (prototypes) from the training set, in order toavoid the excessive storage and time complexity of a k-NNclassifier.
123
184 Memetic Comp. (2010) 2:183–199
One of the most well known methods in supervised clas-sification is the k-nearest neighbors classifier (k-NN) [13,51,55]. It is a non-parametric classifier which does not build amodel in its training phase. Instead, k-NN predicts the classof a new prototype by computing a similarity measure [14]between it and all prototypes from the training set. Thus, theeffectiveness of the classification process relies on the qual-ity of the training data. It is also important to note that itsmain drawback is its relative inefficiency as the size of theproblem grows, regarding both the number of examples inthe data set and the number of attributes which will be usedin the computation of its similarity functions (distances).
Evolutionary algorithms (EAs) [16] are general-purposesearch algorithms that use principles inspired by naturalgenetic populations to evolve solutions to problems. Theyhave been successfully employed in different data mining[1,20,23] problems. Given that the PS problem can be definedas a combinatorial problem, EAs have been used to solve itwith promising results [10], in a process named evolutionaryprototype selection (EPS).
The combination of EAs with local search (LS) is calledmemetic algorithm (MA) [48,50]. Formally, an MA is definedas an EA that includes one or more LS phase within itsevolutionary cycle [36]. MAs have been shown to be moreefficient (i.e., needing fewer evaluations to find optima) andmore effective (identifying higher quality solutions) than tra-ditional EAs for some problem domains. In the literature, wecan find a lot of applications of MAs to different problems;see [29] for an understanding of MA issues, and [4,18,30]for examples of MAs applied to different domain problems.
The increase in the size of the database is a staple prob-lem in PS (which is known as the scaling up problem). Thisproblem produces excessive storage requirements, increasestime complexity and affects generalization accuracy. Thesedrawbacks are also present in EPS because they result inan increment in chromosome size and time execution andalso involve a decrease in the convergence capabilities of theEA [19]. Traditional EPS approaches generally suffer fromexcessively slow convergence between solutions because oftheir failure to exploit local information. This often limitsthe practicality of EAs on many large-scale problems wherecomputational time is a crucial consideration.
Several strategies have been proposed to tackle the scalingup problem in various domains [52]. Some of them deal withthe data mining algorithms themselves. They try to scale upthe algorithms by proposing faster and lower resource con-sumption approaches [6,32,44]. Another interesting groupof techniques works directly with the data set. They splitthe data set into various parts to make the application of adata mining algorithm easier, employing after its executiona mechanism to join the solutions of each part in a globalsolution. Some of these approaches have appeared recentlyin the literature [11,26].
The interest of this paper is to analyze the scaling upof a previously proposed Steady-State Memetic Algorithmfor EPS (SSMA-PS) [22] when it is applied in conjunctionwith the stratification procedure [11], a successful techniquealready developed to employ PS in large sized problems.The existing synergy between these two approaches will helpSSMA-PS to tackle successfully greater problems, rangingfrom 50,000 to 1 million instances.
Several aspects of this combination will be covered: Theresulting runtime of the algorithm as the size of strata selectedvaries, the effects of the employment of stratification over thequality of the final selected subsets, and how the use of strat-ification affects the convergence capabilities of SSMA-PS.
An experimental study will be carried out to test the pro-posed combination. Their results will be compared with someclassical proposals for PS, by analyzing the results obtainedfor two disjointed objectives: Accuracy and efficiency. Acomplete analysis will be performed in order to highlightwhich method has a better performance when applied in com-bination with stratification.
The rest of the paper is organized as follows: Sect. 2 showsan introduction to the main topics of our study. Section 3 dis-cusses the usefulness of the application of the stratificationstrategy to SSMA-PS. Section 4 deals with the experimentalframework used. Section 5 presents the analysis of resultsand presents a discussion of several issues related to the useof stratification. Section 6 presents the conclusions arrivedat. Finally, a brief description of the classical PS methodsemployed is given in Appendix A.
2 Preliminaries: prototype selection, steady-statememetic algorithm, scaling up and stratification
This section discusses the main topics in the field in whichour contribution is based:
– In Sect. 2.1, we define PS and discuss the influence ofEAs on its development in recent years.
– In Sect. 2.2, we show the main features of SSMA-PS andits local search procedure.
– In Sect. 2.3, we describe the main issues of the scalingup problem.
– In Sect. 2.4, we detail the characteristics of the stratifica-tion procedure.
2.1 Prototype selection
PS methods are instance selection methods [43] developedto improve the performance of the NN rule. They try to iso-late the smallest set of instances which enable k-NN to pre-dict the class of a query instance with the same quality asthe initial data set. By minimizing the data set size, it ispossible to reduce the space complexity and decrease the
123
Memetic Comp. (2010) 2:183–199 185
computational cost of k-NN, improving their generalizationcapabilities through the elimination of noise.
The PS problem can be defined as follows: Let X be aprototype where X = (X1, X2, . . . , Xm, Xc), belonging toa class c given by Xc, and an m-dimensional space in whichXi is the value of the i th feature of the sample. Then, let usassume that there is a training set T R which consists of Ninstances and a test set T S composed of T instances. Let S ⊆T R be the subset of selected samples that resulted from theexecution of a PS algorithm, then we classify a new patternX from T S by the k-NN rule acting over S.
With respect to its objective, PS methods can be catego-rized in three classes: preservation methods, which aim toobtain a consistent subset from the training data, ignoringthe presence of noise; noise removal methods, which aim toremove noise both in the boundary points (instances near tothe decision boundaries) and in the inner points (instances farfrom the decision boundaries), and hybrid methods, whichperform both objectives simultaneously.
In the data mining field many approaches to PS have beendeveloped, ranging from classical approaches such as CNN[27] or ENN [59] to recent approaches such as SSMA-PS[22], HMNEI [47] or PSC [49]. A wide number of reviewsof PS methods can be found in the literature [8,34,35,60].
A high number of the newest proposals of PS methods arebased on EAs. The first appearance of the application of anEA to the PS problem can be found in [37], describing theapplication of a genetic algorithm (GA) to select a referenceset for the k-NN rule. It was improved later, in Ishibuchi andNakashima [33] and Kuncheva and Bezdek [38]. Althoughsome of the following proposals of EPS methods were basedon different strategies (e.g. [57], which employed an Estima-tion of Distribution Algorithm), the majority of them contin-ued to employ a GA as their search procedure. Ho et al. [31],where a GA design for obtaining an optimal NN classifierbased on orthogonal arrays is proposed, is the most repre-sentative example from this period.
Later, in [10], the behavior of four evolutionary models(generational GAs (GGAs), steady-state GAs (SSGAs), theCHC model [17] and Population Based Incremental Learn-ing (PBIL) [7]) was analyzed. They recommended employ-ing, as the fitness function, the average of the classificationrate obtained by using a 1-NN classifier and the reductionratio obtained by the current selected set of prototypes.
One of the newest approaches to EPS is SSMA-PS [22].It incorporates an ad hoc local search specifically designedto optimize the search with the aim of tackling the scal-ing up problem. Another recent proposal [24], is focused onenhancing the fitness function and the mutation and crossoveroperators when applied to PS problems.
The properties of EAs in PS are discussed in [10] wherethe authors differentiate between the selection based onheuristics (which appears in classic non-evolutionary PS
algorithms, for example CNN, IB3 or DROP described in[60]) and the selection developed by EPS algorithms. EPSpresents a strategy that combines inner and boundary points.It does not tend to select instances depending on their a prioriposition in the search space (inner class or limit ones). EPSselects the instances that increase the accuracy rates indepen-dently of their a priori position.
An interesting question to answer when employing anyEPS method (and indeed any PS method) is to determinethe k value employed in the k-NN classifier. In [60], theauthors suggest that the determination of k may depend onthe proposal of the PS algorithm. Setting k as greater than 1decreases the sensitivity of the algorithm to noise and tendsto smooth the decision boundaries. In some PS algorithms, avalue k > 1 may be convenient, when the interest lies in pro-tecting the classification task of noisy instances. Therefore,the authors state that it may be appropriate to find a value ofk to use during the reduction process, and then redeterminethe best value of k in the classification task.
For EPS methods, however, the value k = 1 is employedmost of the time, in order to achieve the greatest possiblesensitivity to noise during the reduction process. In this man-ner, an EPS algorithm could better detect the noisy instancesand the redundant ones in order to find a good subset ofinstances perfectly adapted to the NN rule. By consideringonly an instance during the evolutionary process, the reduc-tion-accuracy trade-off is more balanced and the efficiencyis improved.
2.2 Steady-state memetic algorithm model for prototypeselection problem
The SSMA-PS algorithm employs a Steady-State GA as itsglobal search procedure, which allows it to integrate globaland local searches more tightly than generational MAs. Thisinterweaving of the global and local search phases allowsthe two to influence each other, e.g., the SSGA chooses goodstarting points, and the LS provides an accurate representa-tion of that region of the domain.
The main characteristics of SSMA-PS are:
– Representation: Let us assume a data set denoted T Rwith N instances. The search space associated with theinstance selection of T R is constituted by all the sub-sets of T R. Therefore, the chromosomes should repre-sent subsets of T R. This is achieved by using a binaryrepresentation. A chromosome consists of N genes (onefor each instance in T R) with two possible states: 0 and1. If the gene is 1, then its associated instance is includedin the subset of T R represented by the chromosome. If itis 0, then this does not occur.
– Population Initialization: The chromosomes of the initialpopulation are initialized randomly.
123
186 Memetic Comp. (2010) 2:183–199
– Fitness Function: Let S be a subset of instances of T Rto evaluate and be coded by a chromosome. The fitnessfunction is defined considering clas_rat , the number ofinstances correctly classified using the 1-NN classifierand perc_red, the percentage of reduction achieved withregard to the original size of the training data. The evalu-ation of S is carried out by considering all the training setTR. For each object y in S, the NN is searched for amongthose in the set S\{y}.
Fitness(S) = wα · clas_rat + (1 − wα) · perc_red
(1)
The objective of the MA is to maximize the weighted sumof the two measures defined (wα is valued in the interval[0,1]). Note that the fitness function is the same as thatused by EPS models previously proposed [10].
– Parent Selection Mechanism: In order to select two par-ents for applying the evolutionary operators, binary tour-nament selection is employed.
– Genetic operators: SSMA-PS employs a one point cross-over operator and the classical mutation operator (change0 to 1 and vice versa)
– Replacement Strategy: SSMA-PS uses the standardreplacement strategy employed by the classical Steady-State genetic algorithms.
– Local Search: SSMA-PS includes a local search spe-cifically designed for PS tasks. From a given chromo-some, it considers neighborhood solutions by removingan instance from the current selected subset (i.e., chang-ing 1 to 0 in a gene). These changes are accepted ifthey improve the classification accuracy of the currentsolution. However, if premature convergence is detected,improvements in the fitness value (i.e. changes whichimprove perc_red but decrease clas_rat) are also accep-ted, in order to allow the algorithm to escape from localoptimum.
– Mechanism of Local Search Application: It is necessaryto control the operation of the LS over the total visitedsolutions. This is because the additional function eval-uations required for a total search can be very expen-sive and the MA in question could become a multi-restartLS and not take advantage of the qualities of the EAs.In order to avoid this drawback, SSMA-PS includes theAdaptive PL S Mechanism, which is an adaptive fitness-based method that is very simple but offers good resultsin [45]. Indeed, this scheme assigns an LS probabilityvalue to each chromosome generated by crossover andmutation,cnew:
PL S ={
1 if f (cnew) is better than f (Cworst )
0.0625 otherwise
(2)
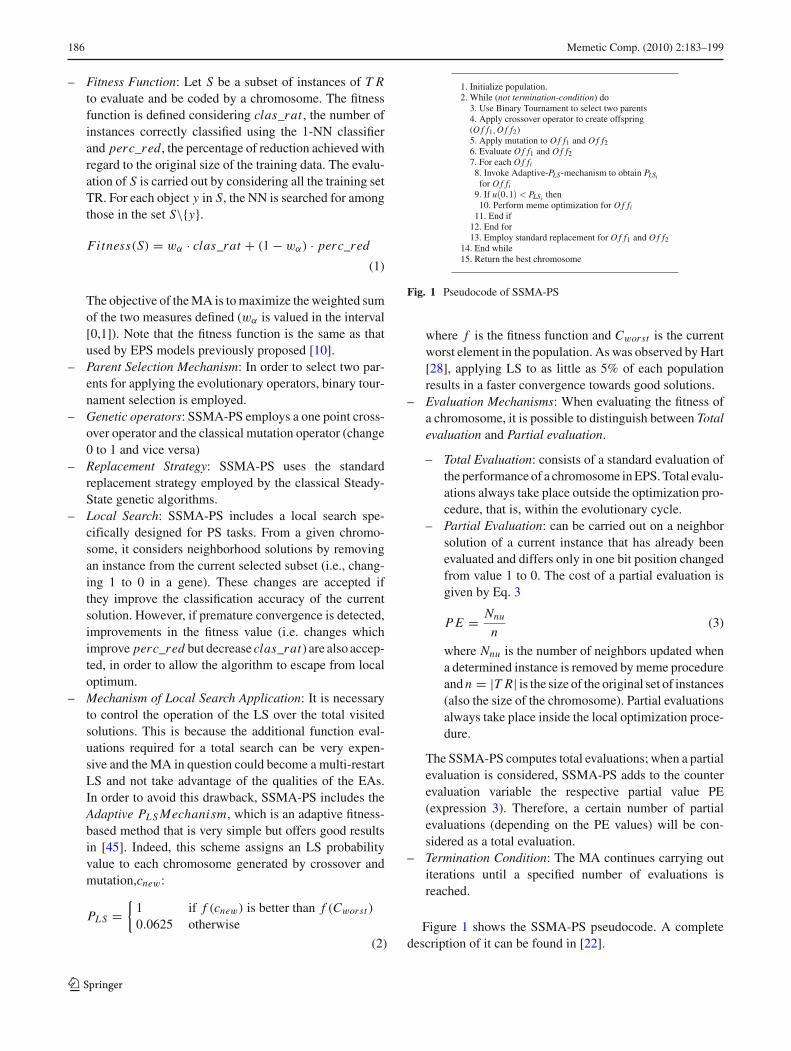
1. Initialize population.2. While (not termination-condition) do
3. Use Binary Tournament to select two parents4. Apply crossover operator to create offspring(O f f1 O f f2)5. Apply mutation to O f f1 and O f f26. Evaluate O f f1 and O f f27. For each O f fi
8. Invoke Adaptive-PLS-mechanism to obtain PLSifor O f fi
9. If u 0 1 PLSi then10. Perform meme optimization for O f fi
11. End if12. End for13. Employ standard replacement for O f f1 and O f f2
14. End while15. Return the best chromosome
Fig. 1 Pseudocode of SSMA-PS
where f is the fitness function and Cworst is the currentworst element in the population. As was observed by Hart[28], applying LS to as little as 5% of each populationresults in a faster convergence towards good solutions.
– Evaluation Mechanisms: When evaluating the fitness ofa chromosome, it is possible to distinguish between Totalevaluation and Partial evaluation.
– Total Evaluation: consists of a standard evaluation ofthe performance of a chromosome in EPS. Total evalu-ations always take place outside the optimization pro-cedure, that is, within the evolutionary cycle.
– Partial Evaluation: can be carried out on a neighborsolution of a current instance that has already beenevaluated and differs only in one bit position changedfrom value 1 to 0. The cost of a partial evaluation isgiven by Eq. 3
P E = Nnu
n(3)
where Nnu is the number of neighbors updated whena determined instance is removed by meme procedureand n = |T R| is the size of the original set of instances(also the size of the chromosome). Partial evaluationsalways take place inside the local optimization proce-dure.
The SSMA-PS computes total evaluations; when a partialevaluation is considered, SSMA-PS adds to the counterevaluation variable the respective partial value PE(expression 3). Therefore, a certain number of partialevaluations (depending on the PE values) will be con-sidered as a total evaluation.
– Termination Condition: The MA continues carrying outiterations until a specified number of evaluations isreached.
Figure 1 shows the SSMA-PS pseudocode. A completedescription of it can be found in [22].
123
Memetic Comp. (2010) 2:183–199 187
2.3 The scaling up problem
The scaling up problem appears when the number of train-ing samples increases beyond the capacity of the traditionaldata mining algorithms, harming their effectiveness and effi-ciency. Due to large size data sets, it produces excessivestorage requirements, increases time complexity and affectsgeneralization accuracy.
This problem is also present when applying PS methodsto large data sets. The NN rule presents several shortcom-ings discussed in [60], with the most well known being: thenecessity of storing all the training instances in order to carryout the classification task; and its high time consumption inclassification due to it having to search through all availableinstances to classify a new input vector.
Furthermore, these drawbacks are even more problematicwhen applying PS methods. The most important are:
Time complexity The efficiency of the majority of PS algo-rithms is at least, O(N 2), with N being the number ofinstances in the data set; moreover, it is not difficult to findclassical approaches with an efficiency order of O(N 3),or more (e.g. SNN [54]). The implication of this is that,although the methods could be very suitable when appliedto small data sets, their application would become impos-sible as the size of the problem increases (for instance,if the size of a data set increased ten times, the cost ofapplying SNN to it would increase by a thousand, whichmay become prohibitive).
Memory consumption The majority of the PS methodsneed to have the complete data set stored in their memoryin order to be carried out. If the size of the data set is toobig, the computer will be unable to execute the method or,at least, would need to use the hard disk to swap memory,which would have an adverse effect on efficiency due tothe increased amount of access to the hard disk.
Generalization PS methods are affected in their generaliza-tion capabilities due to the noise and over fitting effectintroduced by larger size data sets. Most of the classicalPS methods are developed to handle small and mediumsized data sets, and may not be suitable to find and deleteevery noisy or irrelevant instance in a greater data set.EPS methods must also face these drawbacks. In addi-tion, a new problem emerges when applying them to largedata sets:
Representation EPS methods are also affected by represen-tation, due to the increment in the size of their chro-mosomes. When the size of these chromosomes is toobig, the algorithms experience convergence difficulties,as well as costly computational time. This drawbackaffects both time consumption and the quality of the solu-tions obtained, thus the search process would be ineffec-tive in such large search spaces.
These drawbacks produce a considerable degradation inthe behavior of PS algorithms. However, an important con-sideration must be taken into account: Assuming that a PSmethod is able to handle a problem, the time elapsed duringits execution is not as important as the quality of the selectedsubset and the reduction rate achieved. In a similar way towhich a decision tree or a neural net are built, the PS processneed only be performed once; by contrast, the classificationprocess with the selected subset must be performed everytime a new example is required to be classified. Thus, a goodPS should offer a high quality subset of instances, simulta-neously achieving the best possible reduction rate. Thereby,a highly accurate and quick classification process could becarried out by the k-NN classifier.
2.4 Stratification for prototype selection
As we have stated, the scaling up problem has several draw-backs which can produce a considerable degradation in thebehavior of PS algorithms. To avoid this, in this study wewill employ the stratification strategy proposed in [11].
The stratification strategy splits the training data into dis-joint strata with equal class distribution. The initial data setD is divided into two sets, T R and T S, as usual (e.g. a tenthof the data for T S, and the rest for T R in 10-fold cross val-idation). Then, T R is divided into t disjoint sets D j , strataof equal size, D1, D2 . . . Dt , maintaining class distributionwithin each subset. In this manner, the subsets T R and T Scan be represented as follows:
T R =t⋃
j=1
D j (4)
T S = D\T R (5)
Then, a PS method should be applied to each D j , obtain-ing a selected subset DSj for each partition. The prototypeselected set is obtained joining every DSj obtained, and it iscalled stratified prototype subset selected (SPSS).
SPSS =t⋃
j=1
DSj (6)
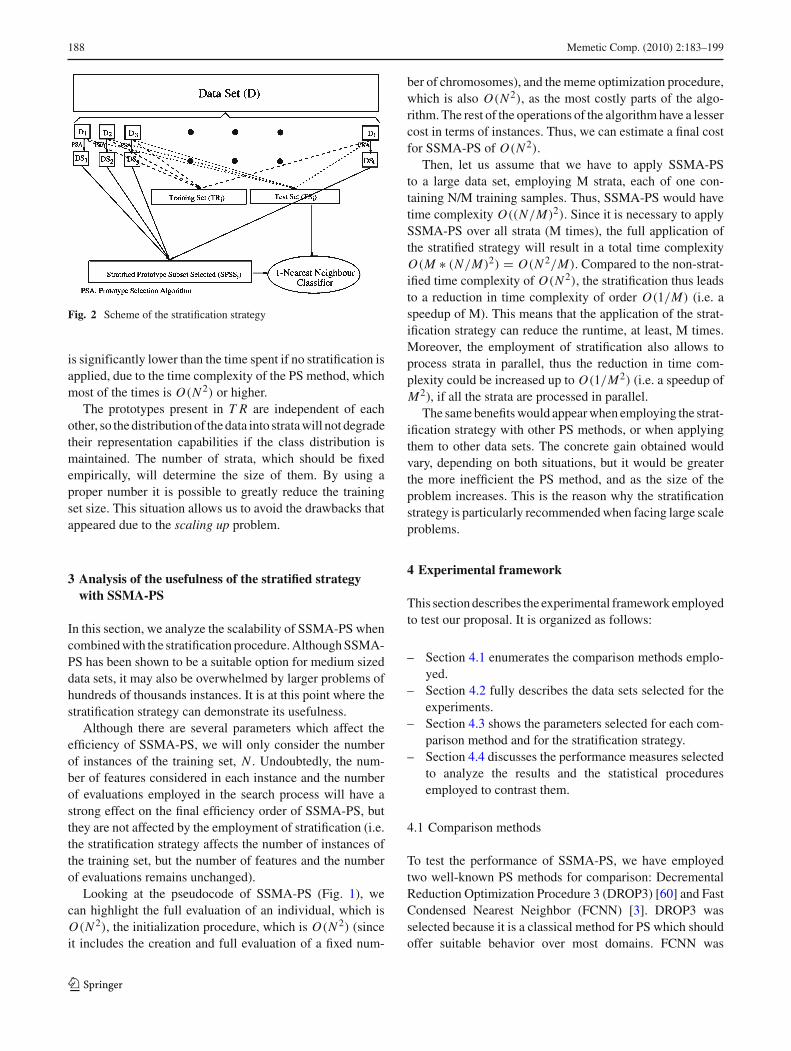
When the SPSS has been obtained, the k-NN classifier canbe applied to T S, employing SPSS as training data. Figure 2shows the basic steps of the process.
The employment of the stratification procedure does nothave a great cost in time. Usually, the process of splittingthe training data into strata, and joining them when the PSmethod has been applied, is not time-consuming, as it doesnot require any kind of additional processing. Thus, the timeneeded for the stratified execution is almost the same as thattaken in the execution of the PS method in each strata, which
123
188 Memetic Comp. (2010) 2:183–199
Fig. 2 Scheme of the stratification strategy
is significantly lower than the time spent if no stratification isapplied, due to the time complexity of the PS method, whichmost of the times is O(N 2) or higher.
The prototypes present in T R are independent of eachother, so the distribution of the data into strata will not degradetheir representation capabilities if the class distribution ismaintained. The number of strata, which should be fixedempirically, will determine the size of them. By using aproper number it is possible to greatly reduce the trainingset size. This situation allows us to avoid the drawbacks thatappeared due to the scaling up problem.
3 Analysis of the usefulness of the stratified strategywith SSMA-PS
In this section, we analyze the scalability of SSMA-PS whencombined with the stratification procedure. Although SSMA-PS has been shown to be a suitable option for medium sizeddata sets, it may also be overwhelmed by larger problems ofhundreds of thousands instances. It is at this point where thestratification strategy can demonstrate its usefulness.
Although there are several parameters which affect theefficiency of SSMA-PS, we will only consider the numberof instances of the training set, N . Undoubtedly, the num-ber of features considered in each instance and the numberof evaluations employed in the search process will have astrong effect on the final efficiency order of SSMA-PS, butthey are not affected by the employment of stratification (i.e.the stratification strategy affects the number of instances ofthe training set, but the number of features and the numberof evaluations remains unchanged).
Looking at the pseudocode of SSMA-PS (Fig. 1), wecan highlight the full evaluation of an individual, which isO(N 2), the initialization procedure, which is O(N 2) (sinceit includes the creation and full evaluation of a fixed num-
ber of chromosomes), and the meme optimization procedure,which is also O(N 2), as the most costly parts of the algo-rithm. The rest of the operations of the algorithm have a lessercost in terms of instances. Thus, we can estimate a final costfor SSMA-PS of O(N 2).
Then, let us assume that we have to apply SSMA-PSto a large data set, employing M strata, each of one con-taining N/M training samples. Thus, SSMA-PS would havetime complexity O((N/M)2). Since it is necessary to applySSMA-PS over all strata (M times), the full application ofthe stratified strategy will result in a total time complexityO(M ∗ (N/M)2) = O(N 2/M). Compared to the non-strat-ified time complexity of O(N 2), the stratification thus leadsto a reduction in time complexity of order O(1/M) (i.e. aspeedup of M). This means that the application of the strat-ification strategy can reduce the runtime, at least, M times.Moreover, the employment of stratification also allows toprocess strata in parallel, thus the reduction in time com-plexity could be increased up to O(1/M2) (i.e. a speedup ofM2), if all the strata are processed in parallel.
The same benefits would appear when employing the strat-ification strategy with other PS methods, or when applyingthem to other data sets. The concrete gain obtained wouldvary, depending on both situations, but it would be greaterthe more inefficient the PS method, and as the size of theproblem increases. This is the reason why the stratificationstrategy is particularly recommended when facing large scaleproblems.
4 Experimental framework
This section describes the experimental framework employedto test our proposal. It is organized as follows:
– Section 4.1 enumerates the comparison methods emplo-yed.
– Section 4.2 fully describes the data sets selected for theexperiments.
– Section 4.3 shows the parameters selected for each com-parison method and for the stratification strategy.
– Section 4.4 discusses the performance measures selectedto analyze the results and the statistical proceduresemployed to contrast them.
4.1 Comparison methods
To test the performance of SSMA-PS, we have employedtwo well-known PS methods for comparison: DecrementalReduction Optimization Procedure 3 (DROP3) [60] and FastCondensed Nearest Neighbor (FCNN) [3]. DROP3 wasselected because it is a classical method for PS which shouldoffer suitable behavior over most domains. FCNN was
123
Memetic Comp. (2010) 2:183–199 189
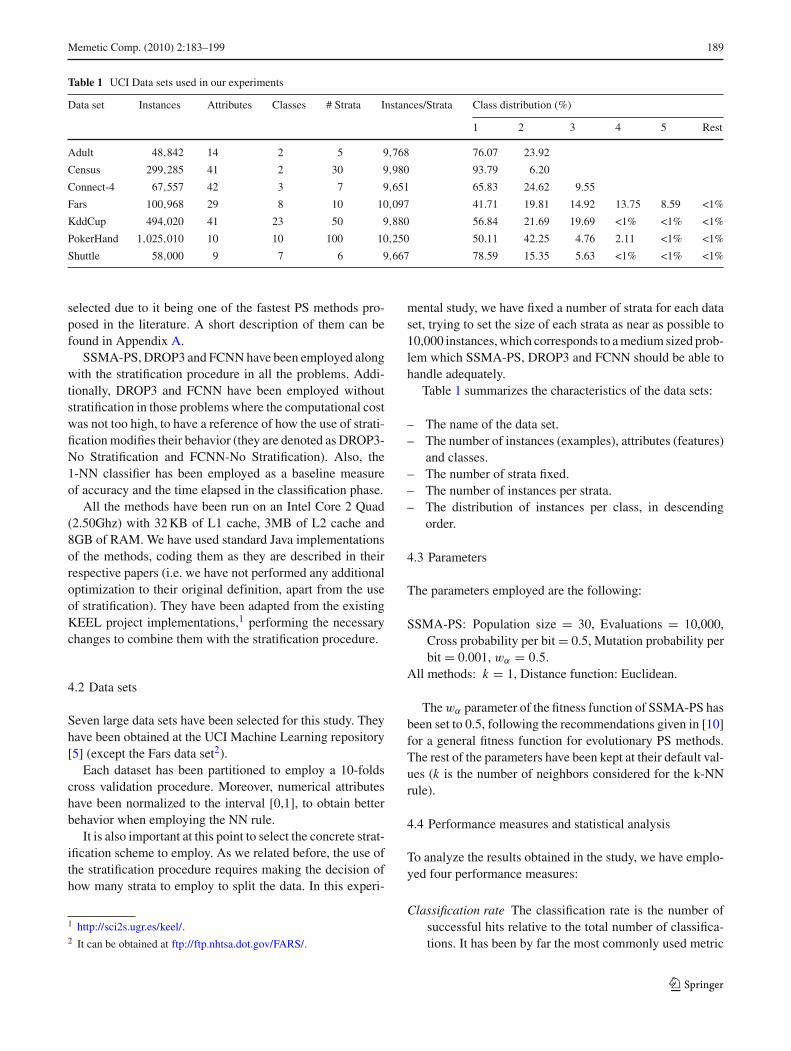
Table 1 UCI Data sets used in our experiments
Data set Instances Attributes Classes # Strata Instances/Strata Class distribution (%)
1 2 3 4 5 Rest
Adult 48,842 14 2 5 9,768 76.07 23.92
Census 299,285 41 2 30 9,980 93.79 6.20
Connect-4 67,557 42 3 7 9,651 65.83 24.62 9.55
Fars 100,968 29 8 10 10,097 41.71 19.81 14.92 13.75 8.59 <1%
KddCup 494,020 41 23 50 9,880 56.84 21.69 19.69 <1% <1% <1%
PokerHand 1,025,010 10 10 100 10,250 50.11 42.25 4.76 2.11 <1% <1%
Shuttle 58,000 9 7 6 9,667 78.59 15.35 5.63 <1% <1% <1%
selected due to it being one of the fastest PS methods pro-posed in the literature. A short description of them can befound in Appendix A.
SSMA-PS, DROP3 and FCNN have been employed alongwith the stratification procedure in all the problems. Addi-tionally, DROP3 and FCNN have been employed withoutstratification in those problems where the computational costwas not too high, to have a reference of how the use of strati-fication modifies their behavior (they are denoted as DROP3-No Stratification and FCNN-No Stratification). Also, the1-NN classifier has been employed as a baseline measureof accuracy and the time elapsed in the classification phase.
All the methods have been run on an Intel Core 2 Quad(2.50Ghz) with 32 KB of L1 cache, 3MB of L2 cache and8GB of RAM. We have used standard Java implementationsof the methods, coding them as they are described in theirrespective papers (i.e. we have not performed any additionaloptimization to their original definition, apart from the useof stratification). They have been adapted from the existingKEEL project implementations,1 performing the necessarychanges to combine them with the stratification procedure.
4.2 Data sets
Seven large data sets have been selected for this study. Theyhave been obtained at the UCI Machine Learning repository[5] (except the Fars data set2).
Each dataset has been partitioned to employ a 10-foldscross validation procedure. Moreover, numerical attributeshave been normalized to the interval [0,1], to obtain betterbehavior when employing the NN rule.
It is also important at this point to select the concrete strat-ification scheme to employ. As we related before, the use ofthe stratification procedure requires making the decision ofhow many strata to employ to split the data. In this experi-
1 http://sci2s.ugr.es/keel/.2 It can be obtained at ftp://ftp.nhtsa.dot.gov/FARS/.
mental study, we have fixed a number of strata for each dataset, trying to set the size of each strata as near as possible to10,000 instances, which corresponds to a medium sized prob-lem which SSMA-PS, DROP3 and FCNN should be able tohandle adequately.
Table 1 summarizes the characteristics of the data sets:
– The name of the data set.– The number of instances (examples), attributes (features)
and classes.– The number of strata fixed.– The number of instances per strata.– The distribution of instances per class, in descending
order.
4.3 Parameters
The parameters employed are the following:
SSMA-PS: Population size = 30, Evaluations = 10,000,Cross probability per bit = 0.5, Mutation probability perbit = 0.001, wα = 0.5.
All methods: k = 1, Distance function: Euclidean.
The wα parameter of the fitness function of SSMA-PS hasbeen set to 0.5, following the recommendations given in [10]for a general fitness function for evolutionary PS methods.The rest of the parameters have been kept at their default val-ues (k is the number of neighbors considered for the k-NNrule).
4.4 Performance measures and statistical analysis
To analyze the results obtained in the study, we have emplo-yed four performance measures:
Classification rate The classification rate is the number ofsuccessful hits relative to the total number of classifica-tions. It has been by far the most commonly used metric
123
190 Memetic Comp. (2010) 2:183–199
for assessing the performance of classifiers for years[2,61,39].
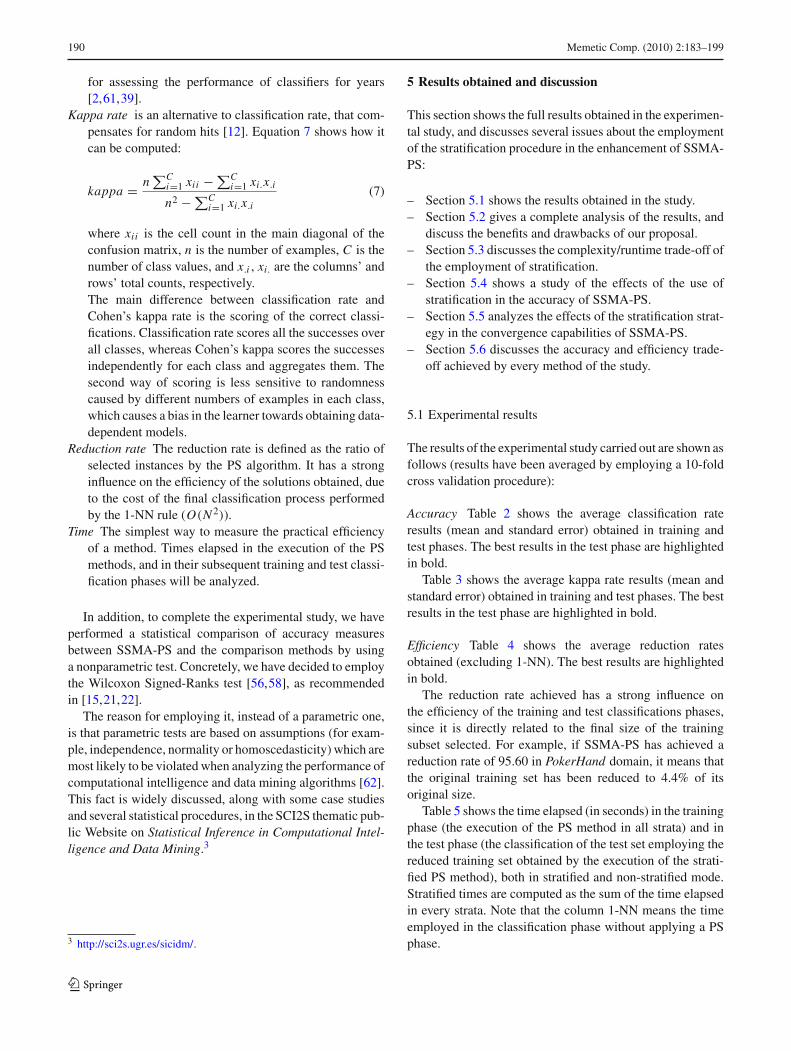
Kappa rate is an alternative to classification rate, that com-pensates for random hits [12]. Equation 7 shows how itcan be computed:
kappa = n∑C
i=1 xii − ∑Ci=1 xi.x.i
n2 − ∑Ci=1 xi.x.i
(7)
where xii is the cell count in the main diagonal of theconfusion matrix, n is the number of examples, C is thenumber of class values, and x.i , xi. are the columns’ androws’ total counts, respectively.The main difference between classification rate andCohen’s kappa rate is the scoring of the correct classi-fications. Classification rate scores all the successes overall classes, whereas Cohen’s kappa scores the successesindependently for each class and aggregates them. Thesecond way of scoring is less sensitive to randomnesscaused by different numbers of examples in each class,which causes a bias in the learner towards obtaining data-dependent models.
Reduction rate The reduction rate is defined as the ratio ofselected instances by the PS algorithm. It has a stronginfluence on the efficiency of the solutions obtained, dueto the cost of the final classification process performedby the 1-NN rule (O(N 2)).
Time The simplest way to measure the practical efficiencyof a method. Times elapsed in the execution of the PSmethods, and in their subsequent training and test classi-fication phases will be analyzed.
In addition, to complete the experimental study, we haveperformed a statistical comparison of accuracy measuresbetween SSMA-PS and the comparison methods by usinga nonparametric test. Concretely, we have decided to employthe Wilcoxon Signed-Ranks test [56,58], as recommendedin [15,21,22].
The reason for employing it, instead of a parametric one,is that parametric tests are based on assumptions (for exam-ple, independence, normality or homoscedasticity) which aremost likely to be violated when analyzing the performance ofcomputational intelligence and data mining algorithms [62].This fact is widely discussed, along with some case studiesand several statistical procedures, in the SCI2S thematic pub-lic Website on Statistical Inference in Computational Intel-ligence and Data Mining.3
3 http://sci2s.ugr.es/sicidm/.
5 Results obtained and discussion
This section shows the full results obtained in the experimen-tal study, and discusses several issues about the employmentof the stratification procedure in the enhancement of SSMA-PS:
– Section 5.1 shows the results obtained in the study.– Section 5.2 gives a complete analysis of the results, and
discuss the benefits and drawbacks of our proposal.– Section 5.3 discusses the complexity/runtime trade-off of
the employment of stratification.– Section 5.4 shows a study of the effects of the use of
stratification in the accuracy of SSMA-PS.– Section 5.5 analyzes the effects of the stratification strat-
egy in the convergence capabilities of SSMA-PS.– Section 5.6 discusses the accuracy and efficiency trade-
off achieved by every method of the study.
5.1 Experimental results
The results of the experimental study carried out are shown asfollows (results have been averaged by employing a 10-foldcross validation procedure):
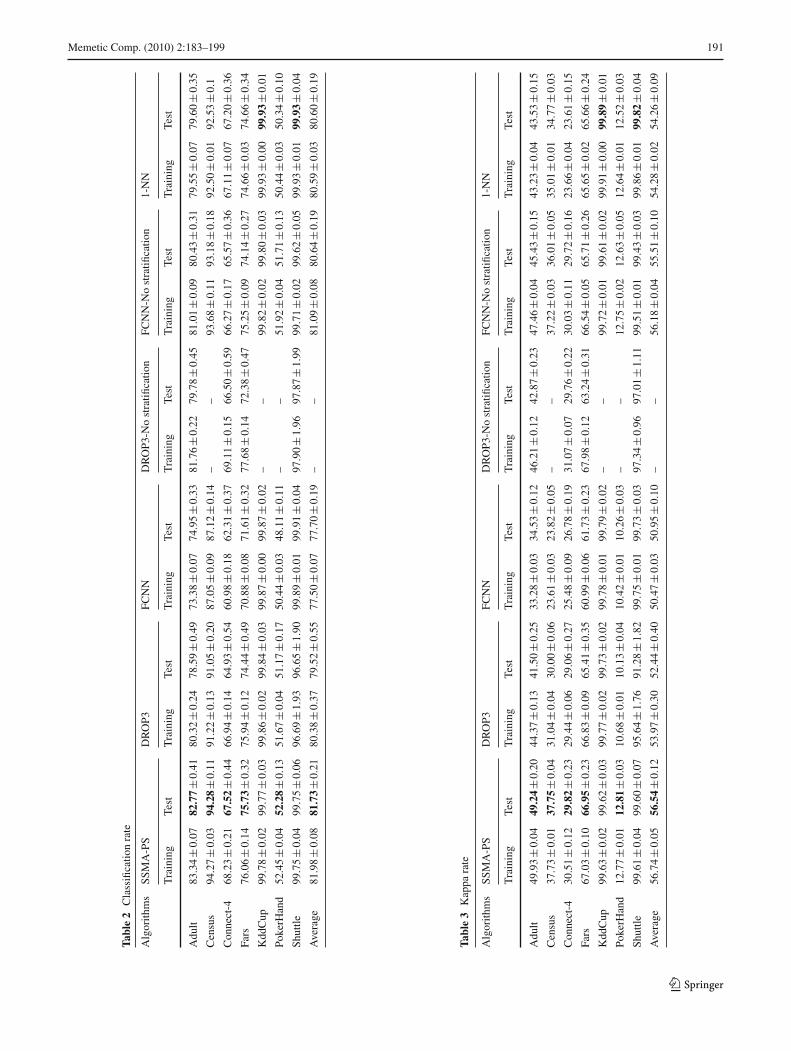
Accuracy Table 2 shows the average classification rateresults (mean and standard error) obtained in training andtest phases. The best results in the test phase are highlightedin bold.
Table 3 shows the average kappa rate results (mean andstandard error) obtained in training and test phases. The bestresults in the test phase are highlighted in bold.
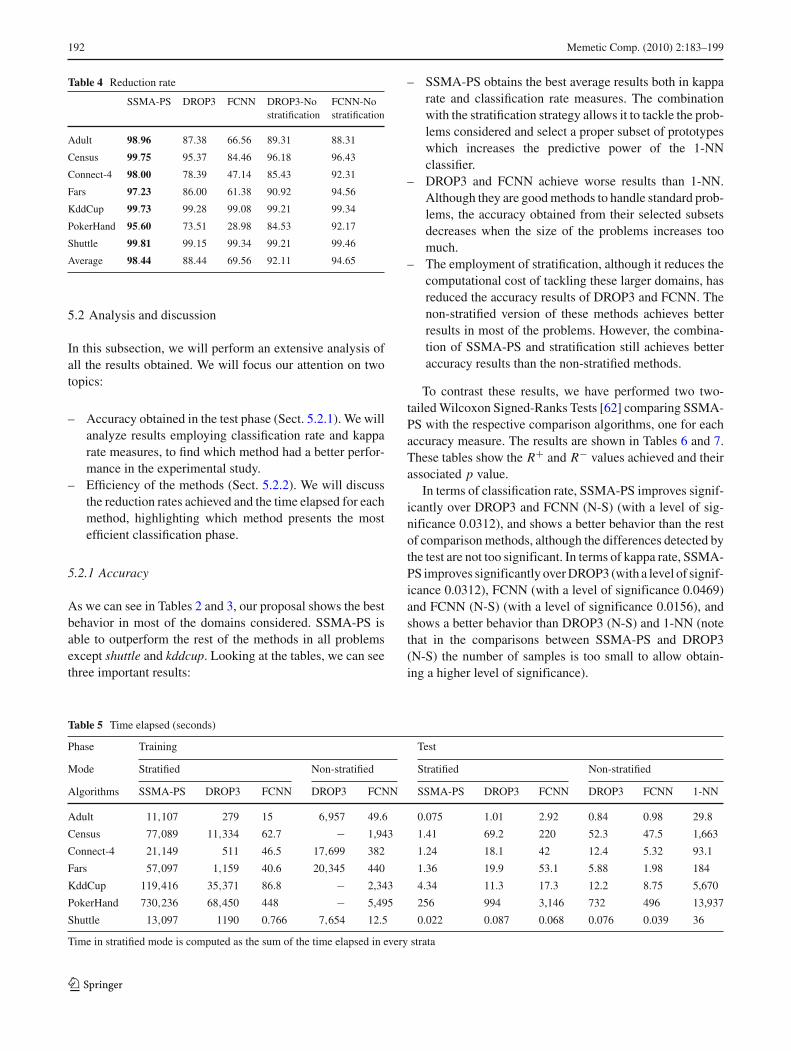
Efficiency Table 4 shows the average reduction ratesobtained (excluding 1-NN). The best results are highlightedin bold.
The reduction rate achieved has a strong influence onthe efficiency of the training and test classifications phases,since it is directly related to the final size of the trainingsubset selected. For example, if SSMA-PS has achieved areduction rate of 95.60 in PokerHand domain, it means thatthe original training set has been reduced to 4.4% of itsoriginal size.
Table 5 shows the time elapsed (in seconds) in the trainingphase (the execution of the PS method in all strata) and inthe test phase (the classification of the test set employing thereduced training set obtained by the execution of the strati-fied PS method), both in stratified and non-stratified mode.Stratified times are computed as the sum of the time elapsedin every strata. Note that the column 1-NN means the timeemployed in the classification phase without applying a PSphase.
123
Memetic Comp. (2010) 2:183–199 191
Tabl
e2
Cla
ssifi
catio
nra
te
Alg
orith
ms
SSM
A-P
SD
RO
P3FC
NN
DR
OP3
-No
stra
tifica
tion
FCN
N-N
ost
ratifi
catio
n1-
NN
Tra
inin
gTe
stT
rain
ing
Test
Tra
inin
gTe
stT
rain
ing
Test
Tra
inin
gTe
stT
rain
ing
Test
Adu
lt83
.34±0
.07
82.7
7±0
.41
80.3
2±0
.24
78.5
9±0
.49
73.3
8±0
.07
74.9
5±0
.33
81.7
6±0
.22
79.7
8±0
.45
81.0
1±0
.09
80.4
3±0
.31
79.5
5±0
.07
79.6
0±0
.35
Cen
sus
94.2
7±0
.03
94.2
8±0
.11
91.2
2±0
.13
91.0
5±0
.20
87.0
5±0
.09
87.1
2±0
.14
––
93.6
8±0
.11
93.1
8±0
.18
92.5
0±0
.01
92.5
3±0
.1
Con
nect
-468
.23±0
.21
67.5
2±0
.44
66.9
4±0
.14
64.9
3±0
.54
60.9
8±0
.18
62.3
1±0
.37
69.1
1±0
.15
66.5
0±0
.59
66.2
7±0
.17
65.5
7±0
.36
67.1
1±0
.07
67.2
0±0
.36
Fars
76.0
6±0
.14
75.7
3±0
.32
75.9
4±0
.12
74.4
4±0
.49
70.8
8±0
.08
71.6
1±0
.32
77.6
8±0
.14
72.3
8±0
.47
75.2
5±0
.09
74.1
4±0
.27
74.6
6±0
.03
74.6
6±0
.34
Kdd
Cup
99.7
8±0
.02
99.7
7±0
.03
99.8
6±0
.02
99.8
4±0
.03
99.8
7±0
.00
99.8
7±0
.02
––
99.8
2±0
.02
99.8
0±0
.03
99.9
3±0
.00
99.9
3±0
.01
Poke
rHan
d52
.45±0
.04
52.2
8±0
.13
51.6
7±0
.04
51.1
7±0
.17
50.4
4±0
.03
48.1
1±0
.11
––
51.9
2±0
.04
51.7
1±0
.13
50.4
4±0
.03
50.3
4±0
.10
Shut
tle99
.75±0
.04
99.7
5±0
.06
96.6
9±1
.93
96.6
5±1
.90
99.8
9±0
.01
99.9
1±0
.04
97.9
0±1
.96
97.8
7±1
.99
99.7
1±0
.02
99.6
2±0
.05
99.9
3±0
.01
99.9
3±0
.04
Ave
rage
81.9
8±0
.08
81.7
3±0
.21
80.3
8±0
.37
79.5
2±0
.55
77.5
0±0
.07
77.7
0±0
.19
––
81.0
9±0
.08
80.6
4±0
.19
80.5
9±0
.03
80.6
0±0
.19
Tabl
e3
Kap
para
te
Alg
orith
ms
SSM
A-P
SD
RO
P3FC
NN
DR
OP3
-No
stra
tifica
tion
FCN
N-N
ost
ratifi
catio
n1-
NN
Tra
inin
gTe
stT
rain
ing
Test
Tra
inin
gTe
stT
rain
ing
Test
Tra
inin
gTe
stT
rain
ing
Test
Adu
lt49
.93±0
.04
49.2
4±0
.20
44.3
7±0
.13
41.5
0±0
.25
33.2
8±0
.03
34.5
3±0
.12
46.2
1±0
.12
42.8
7±0
.23
47.4
6±0
.04
45.4
3±0
.15
43.2
3±0
.04
43.5
3±0
.15
Cen
sus
37.7
3±0
.01
37.7
5±0
.04
31.0
4±0
.04
30.0
0±0
.06
23.6
1±0
.03
23.8
2±0
.05
––
37.2
2±0
.03
36.0
1±0
.05
35.0
1±0
.01
34.7
7±0
.03
Con
nect
-430
.51±0
.12
29.8
2±0
.23
29.4
4±0
.06
29.0
6±0
.27
25.4
8±0
.09
26.7
8±0
.19
31.0
7±0
.07
29.7
6±0
.22
30.0
3±0
.11
29.7
2±0
.16
23.6
6±0
.04
23.6
1±0
.15
Fars
67.0
3±0
.10
66.9
5±0
.23
66.8
3±0
.09
65.4
1±0
.35
60.9
9±0
.06
61.7
3±0
.23
67.9
8±0
.12
63.2
4±0
.31
66.5
4±0
.05
65.7
1±0
.26
65.6
5±0
.02
65.6
6±0
.24
Kdd
Cup
99.6
3±0
.02
99.6
2±0
.03
99.7
7±0
.02
99.7
3±0
.02
99.7
8±0
.01
99.7
9±0
.02
––
99.7
2±0
.01
99.6
1±0
.02
99.9
1±0
.00
99.8
9±0
.01
Poke
rHan
d12
.77±0
.01
12.8
1±0
.03
10.6
8±0
.01
10.1
3±0
.04
10.4
2±0
.01
10.2
6±0
.03
––
12.7
5±0
.02
12.6
3±0
.05
12.6
4±0
.01
12.5
2±0
.03
Shut
tle99
.61±0
.04
99.6
0±0
.07
95.6
4±1
.76
91.2
8±1
.82
99.7
5±0
.01
99.7
3±0
.03
97.3
4±0
.96
97.0
1±1
.11
99.5
1±0
.01
99.4
3±0
.03
99.8
6±0
.01
99.8
2±0
.04
Ave
rage
56.7
4±0
.05
56.5
4±0
.12
53.9
7±0
.30
52.4
4±0
.40
50.4
7±0
.03
50.9
5±0
.10
––
56.1
8±0
.04
55.5
1±0
.10
54.2
8±0
.02
54.2
6±0
.09
123
192 Memetic Comp. (2010) 2:183–199
Table 4 Reduction rate
SSMA-PS DROP3 FCNN DROP3-No FCNN-Nostratification stratification
Adult 98.96 87.38 66.56 89.31 88.31
Census 99.75 95.37 84.46 96.18 96.43
Connect-4 98.00 78.39 47.14 85.43 92.31
Fars 97.23 86.00 61.38 90.92 94.56
KddCup 99.73 99.28 99.08 99.21 99.34
PokerHand 95.60 73.51 28.98 84.53 92.17
Shuttle 99.81 99.15 99.34 99.21 99.46
Average 98.44 88.44 69.56 92.11 94.65
5.2 Analysis and discussion
In this subsection, we will perform an extensive analysis ofall the results obtained. We will focus our attention on twotopics:
– Accuracy obtained in the test phase (Sect. 5.2.1). We willanalyze results employing classification rate and kapparate measures, to find which method had a better perfor-mance in the experimental study.
– Efficiency of the methods (Sect. 5.2.2). We will discussthe reduction rates achieved and the time elapsed for eachmethod, highlighting which method presents the mostefficient classification phase.
5.2.1 Accuracy
As we can see in Tables 2 and 3, our proposal shows the bestbehavior in most of the domains considered. SSMA-PS isable to outperform the rest of the methods in all problemsexcept shuttle and kddcup. Looking at the tables, we can seethree important results:
Table 5 Time elapsed (seconds)
Phase Training Test
Mode Stratified Non-stratified Stratified Non-stratified
Algorithms SSMA-PS DROP3 FCNN DROP3 FCNN SSMA-PS DROP3 FCNN DROP3 FCNN 1-NN
Adult 11,107 279 15 6,957 49.6 0.075 1.01 2.92 0.84 0.98 29.8
Census 77,089 11,334 62.7 − 1,943 1.41 69.2 220 52.3 47.5 1,663
Connect-4 21,149 511 46.5 17,699 382 1.24 18.1 42 12.4 5.32 93.1
Fars 57,097 1,159 40.6 20,345 440 1.36 19.9 53.1 5.88 1.98 184
KddCup 119,416 35,371 86.8 − 2,343 4.34 11.3 17.3 12.2 8.75 5,670
PokerHand 730,236 68,450 448 − 5,495 256 994 3,146 732 496 13,937
Shuttle 13,097 1190 0.766 7,654 12.5 0.022 0.087 0.068 0.076 0.039 36
Time in stratified mode is computed as the sum of the time elapsed in every strata
– SSMA-PS obtains the best average results both in kapparate and classification rate measures. The combinationwith the stratification strategy allows it to tackle the prob-lems considered and select a proper subset of prototypeswhich increases the predictive power of the 1-NNclassifier.
– DROP3 and FCNN achieve worse results than 1-NN.Although they are good methods to handle standard prob-lems, the accuracy obtained from their selected subsetsdecreases when the size of the problems increases toomuch.
– The employment of stratification, although it reduces thecomputational cost of tackling these larger domains, hasreduced the accuracy results of DROP3 and FCNN. Thenon-stratified version of these methods achieves betterresults in most of the problems. However, the combina-tion of SSMA-PS and stratification still achieves betteraccuracy results than the non-stratified methods.
To contrast these results, we have performed two two-tailed Wilcoxon Signed-Ranks Tests [62] comparing SSMA-PS with the respective comparison algorithms, one for eachaccuracy measure. The results are shown in Tables 6 and 7.These tables show the R+ and R− values achieved and theirassociated p value.
In terms of classification rate, SSMA-PS improves signif-icantly over DROP3 and FCNN (N-S) (with a level of sig-nificance 0.0312), and shows a better behavior than the restof comparison methods, although the differences detected bythe test are not too significant. In terms of kappa rate, SSMA-PS improves significantly over DROP3 (with a level of signif-icance 0.0312), FCNN (with a level of significance 0.0469)and FCNN (N-S) (with a level of significance 0.0156), andshows a better behavior than DROP3 (N-S) and 1-NN (notethat in the comparisons between SSMA-PS and DROP3(N-S) the number of samples is too small to allow obtain-ing a higher level of significance).
123
Memetic Comp. (2010) 2:183–199 193
Table 6 Wilcoxon test for classification rate
Methods R+ R− p value
SSMA-PS vs DROP3 27 1 0.0312
SSMA-PS vs FCNN 25 3 0.0781
SSMA-PS vs DROP3 (N-S) 15 0 0.0625
SSMA-PS vs FCNN (N-S) 27 1 0.0312
SSMA-PS vs 1-NN 25 3 0.0781
Table 7 Wilcoxon test for kappa rate
Methods R+ R− p value
SSMA-PS vs DROP3 27 1 0.0312
SSMA-PS vs FCNN 26 2 0.0469
SSMA-PS vs DROP3 (N-S) 15 0 0.0625
SSMA-PS vs FCNN (N-S) 28 0 0.0156
SSMA-PS vs 1-NN 25 3 0.0781
5.2.2 Efficiency
The first factor that affects the efficiency of the training andtest classification phases is the reduction rate achieved withthe execution of a PS method. The efficiency of these phaseswill be greatly increased with higher reduction rates.
As Table 4 shows, SSMA-PS achieves the best results inreduction in all domains. SSMA-PS is able to select the bestprototypes to simultaneously increase the objectives definedin its fitness function, without being influenced by localrestrictions related to the distribution of data.
From the time elapsed table (Table 5) some interestingconclusions can be drawn:
– In the training phase, FCNN has extremely low timeconsumption, and SSMA-PS consumes a high amountof time. Although this is the most severe drawback ofSSMA-PS, it is important to note that the PS phase onlyneeds to be executed once, in contrast to the test phase.Thus, having a high time cost here may not be a greatdrawback, as long as the PS method can be executed in areasonable time. In fact, the employment of stratificationallows SSMA-PS to successfully achieve this objective.
– In the test phase, the results are inverted: SSMA-PS is ableto greatly increase the speed of classification, in contrastto the rest of the methods. FCNN and DROP3 achieve bet-ter reduction rates when stratification is not employed, butthey are still less than the ones obtained by SSMA-PS.However, its speed increment is still considerable whencompared to the 1-NN itself, with no PS performed.
To further demonstrate the benefits of the achievement ofhigher reduction rates to speed up the test phase, we have
Table 8 Average number of instances classified per second in test phase
# Instances SSMA-PS DROP3 FCNN 1-NN
Adult 4,884 65,207 4,847 1,673 164
Census 29,928 21,240 433 136 18
Connect-4 6,756 5,441 373 161 73
Fars 10,097 7,432 507 190 55
KddCup 49,402 11,392 4,391 2,848 9
PokerHand 102,501 400 103 33 7
Shuttle 5,800 268,519 66,438 85,672 161
Average − 54,234 11,013 12,959 70
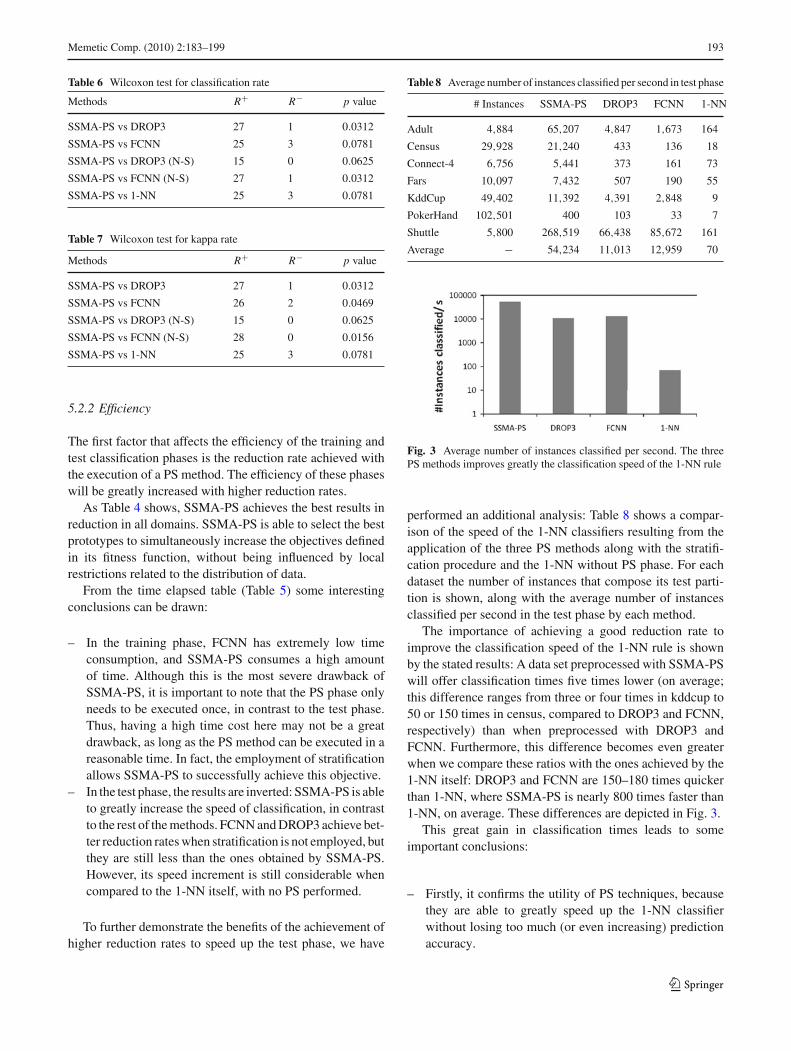
Fig. 3 Average number of instances classified per second. The threePS methods improves greatly the classification speed of the 1-NN rule
performed an additional analysis: Table 8 shows a compar-ison of the speed of the 1-NN classifiers resulting from theapplication of the three PS methods along with the stratifi-cation procedure and the 1-NN without PS phase. For eachdataset the number of instances that compose its test parti-tion is shown, along with the average number of instancesclassified per second in the test phase by each method.
The importance of achieving a good reduction rate toimprove the classification speed of the 1-NN rule is shownby the stated results: A data set preprocessed with SSMA-PSwill offer classification times five times lower (on average;this difference ranges from three or four times in kddcup to50 or 150 times in census, compared to DROP3 and FCNN,respectively) than when preprocessed with DROP3 andFCNN. Furthermore, this difference becomes even greaterwhen we compare these ratios with the ones achieved by the1-NN itself: DROP3 and FCNN are 150–180 times quickerthan 1-NN, where SSMA-PS is nearly 800 times faster than1-NN, on average. These differences are depicted in Fig. 3.
This great gain in classification times leads to someimportant conclusions:
– Firstly, it confirms the utility of PS techniques, becausethey are able to greatly speed up the 1-NN classifierwithout losing too much (or even increasing) predictionaccuracy.
123
194 Memetic Comp. (2010) 2:183–199
– And secondly, it states the superiority of SSMA-PS overthe rest of the PS method compared due to its greaterspeed up achievement.
As we explained before, it is more important to obtainbetter performance in classification phases than in the PSphase, due to the fact that they will be executed many timesin a real-life environment. Thus, the obtaining of a fasterclassifier would be a great improvement for most real-lifeapplications, especially those where the time consumptionin the classification phase is critical.
5.3 Analysis of the complexity/runtime trade-off accordingto the strata size
One interesting question that arises when using stratificationto improve the results of a PS method is to select a suit-able size of strata. Indeed, this selection will have a stronginfluence on the behavior of the algorithm, especially in theruntime of the method, as we discussed in Sect. 4. Therefore,it is interesting to analyze the runtime of SSMA-PS scales asthe complexity of the search space (i.e. the size of the strata)increases.
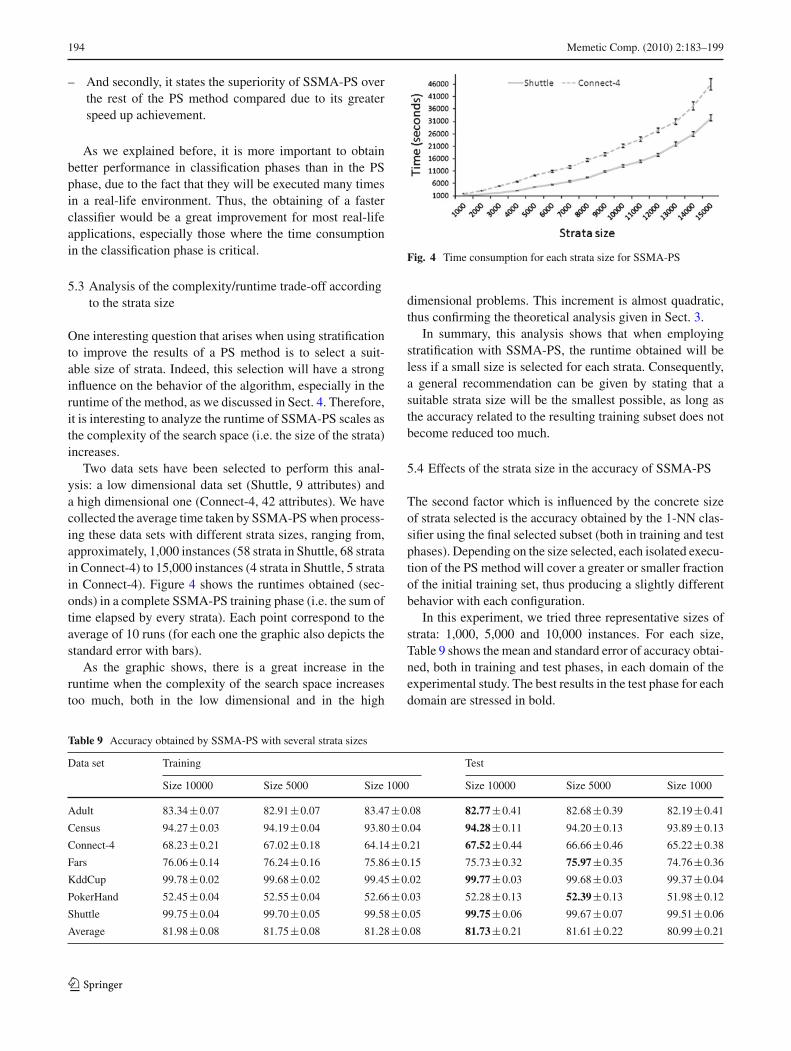
Two data sets have been selected to perform this anal-ysis: a low dimensional data set (Shuttle, 9 attributes) anda high dimensional one (Connect-4, 42 attributes). We havecollected the average time taken by SSMA-PS when process-ing these data sets with different strata sizes, ranging from,approximately, 1,000 instances (58 strata in Shuttle, 68 stratain Connect-4) to 15,000 instances (4 strata in Shuttle, 5 stratain Connect-4). Figure 4 shows the runtimes obtained (sec-onds) in a complete SSMA-PS training phase (i.e. the sum oftime elapsed by every strata). Each point correspond to theaverage of 10 runs (for each one the graphic also depicts thestandard error with bars).
As the graphic shows, there is a great increase in theruntime when the complexity of the search space increasestoo much, both in the low dimensional and in the high
Fig. 4 Time consumption for each strata size for SSMA-PS
dimensional problems. This increment is almost quadratic,thus confirming the theoretical analysis given in Sect. 3.
In summary, this analysis shows that when employingstratification with SSMA-PS, the runtime obtained will beless if a small size is selected for each strata. Consequently,a general recommendation can be given by stating that asuitable strata size will be the smallest possible, as long asthe accuracy related to the resulting training subset does notbecome reduced too much.
5.4 Effects of the strata size in the accuracy of SSMA-PS
The second factor which is influenced by the concrete sizeof strata selected is the accuracy obtained by the 1-NN clas-sifier using the final selected subset (both in training and testphases). Depending on the size selected, each isolated execu-tion of the PS method will cover a greater or smaller fractionof the initial training set, thus producing a slightly differentbehavior with each configuration.
In this experiment, we tried three representative sizes ofstrata: 1,000, 5,000 and 10,000 instances. For each size,Table 9 shows the mean and standard error of accuracy obtai-ned, both in training and test phases, in each domain of theexperimental study. The best results in the test phase for eachdomain are stressed in bold.
Table 9 Accuracy obtained by SSMA-PS with several strata sizes
Data set Training Test
Size 10000 Size 5000 Size 1000 Size 10000 Size 5000 Size 1000
Adult 83.34±0.07 82.91±0.07 83.47±0.08 82.77±0.41 82.68±0.39 82.19±0.41
Census 94.27±0.03 94.19±0.04 93.80±0.04 94.28±0.11 94.20±0.13 93.89±0.13
Connect-4 68.23±0.21 67.02±0.18 64.14±0.21 67.52±0.44 66.66±0.46 65.22±0.38
Fars 76.06±0.14 76.24±0.16 75.86±0.15 75.73±0.32 75.97±0.35 74.76±0.36
KddCup 99.78±0.02 99.68±0.02 99.45±0.02 99.77±0.03 99.68±0.03 99.37±0.04
PokerHand 52.45±0.04 52.55±0.04 52.66±0.03 52.28±0.13 52.39±0.13 51.98±0.12
Shuttle 99.75±0.04 99.70±0.05 99.58±0.05 99.75±0.06 99.67±0.07 99.51±0.06
Average 81.98±0.08 81.75±0.08 81.28±0.08 81.73±0.21 81.61±0.22 80.99±0.21
123
Memetic Comp. (2010) 2:183–199 195
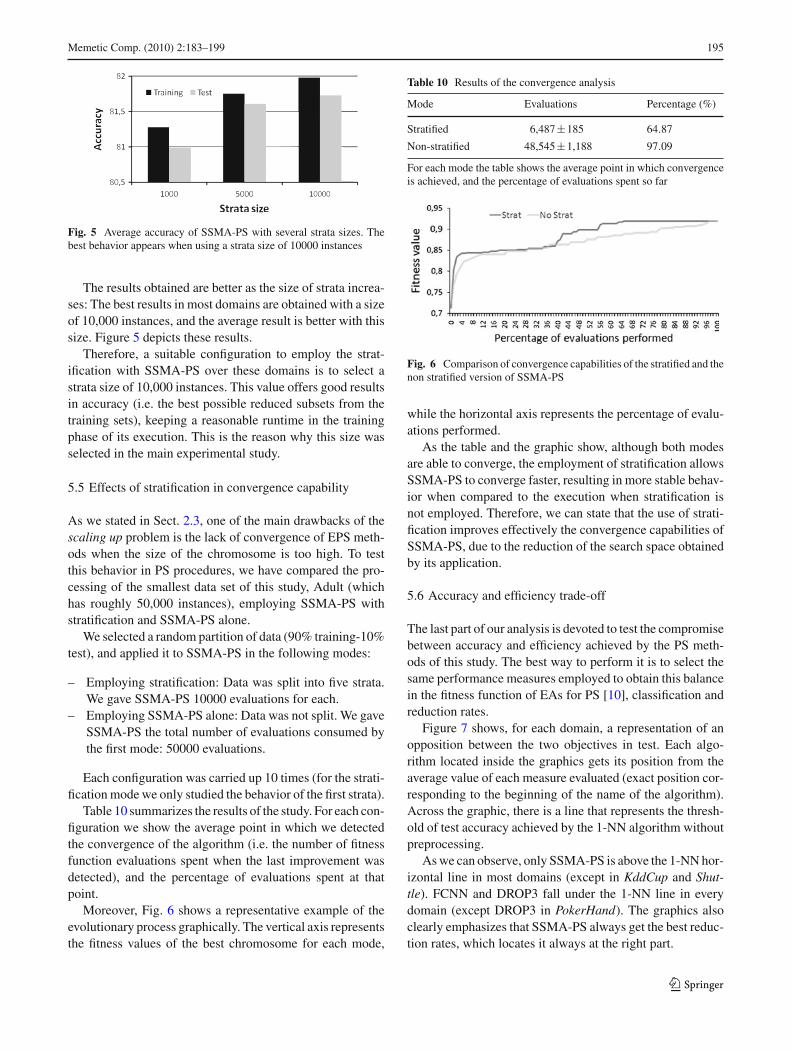
Fig. 5 Average accuracy of SSMA-PS with several strata sizes. Thebest behavior appears when using a strata size of 10000 instances
The results obtained are better as the size of strata increa-ses: The best results in most domains are obtained with a sizeof 10,000 instances, and the average result is better with thissize. Figure 5 depicts these results.
Therefore, a suitable configuration to employ the strat-ification with SSMA-PS over these domains is to select astrata size of 10,000 instances. This value offers good resultsin accuracy (i.e. the best possible reduced subsets from thetraining sets), keeping a reasonable runtime in the trainingphase of its execution. This is the reason why this size wasselected in the main experimental study.
5.5 Effects of stratification in convergence capability
As we stated in Sect. 2.3, one of the main drawbacks of thescaling up problem is the lack of convergence of EPS meth-ods when the size of the chromosome is too high. To testthis behavior in PS procedures, we have compared the pro-cessing of the smallest data set of this study, Adult (whichhas roughly 50,000 instances), employing SSMA-PS withstratification and SSMA-PS alone.
We selected a random partition of data (90% training-10%test), and applied it to SSMA-PS in the following modes:
– Employing stratification: Data was split into five strata.We gave SSMA-PS 10000 evaluations for each.
– Employing SSMA-PS alone: Data was not split. We gaveSSMA-PS the total number of evaluations consumed bythe first mode: 50000 evaluations.
Each configuration was carried up 10 times (for the strati-fication mode we only studied the behavior of the first strata).
Table 10 summarizes the results of the study. For each con-figuration we show the average point in which we detectedthe convergence of the algorithm (i.e. the number of fitnessfunction evaluations spent when the last improvement wasdetected), and the percentage of evaluations spent at thatpoint.
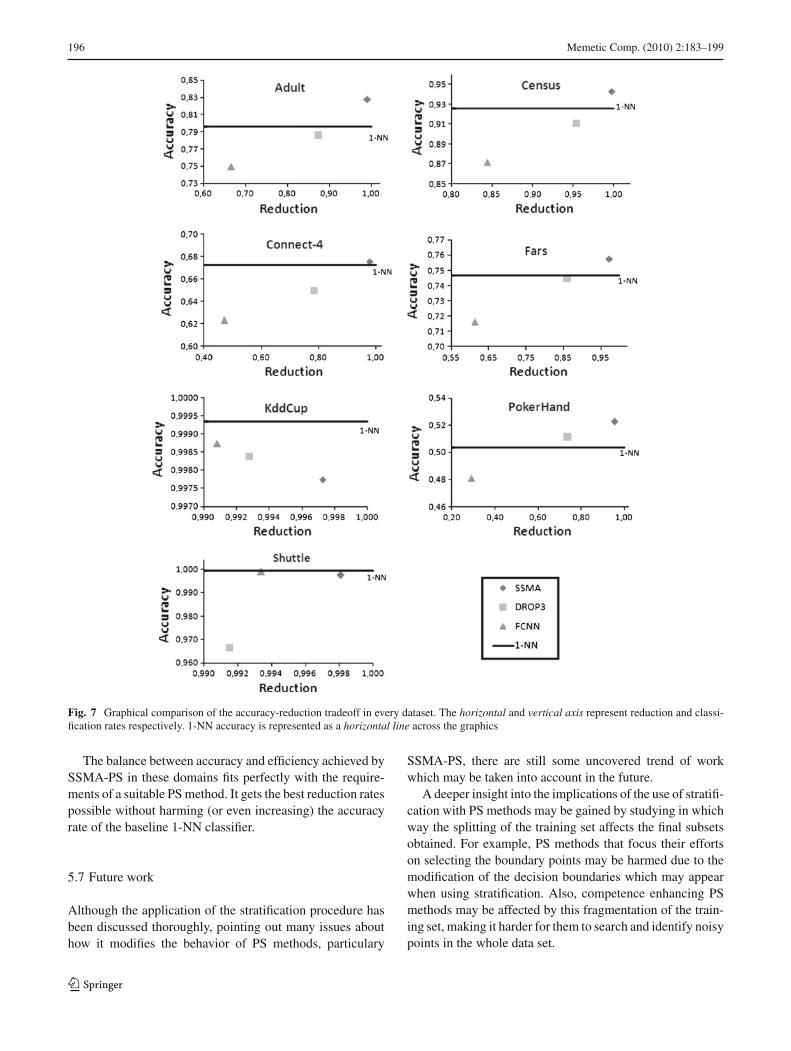
Moreover, Fig. 6 shows a representative example of theevolutionary process graphically. The vertical axis representsthe fitness values of the best chromosome for each mode,
Table 10 Results of the convergence analysis
Mode Evaluations Percentage (%)
Stratified 6,487±185 64.87
Non-stratified 48,545±1,188 97.09
For each mode the table shows the average point in which convergenceis achieved, and the percentage of evaluations spent so far
Fig. 6 Comparison of convergence capabilities of the stratified and thenon stratified version of SSMA-PS
while the horizontal axis represents the percentage of evalu-ations performed.
As the table and the graphic show, although both modesare able to converge, the employment of stratification allowsSSMA-PS to converge faster, resulting in more stable behav-ior when compared to the execution when stratification isnot employed. Therefore, we can state that the use of strati-fication improves effectively the convergence capabilities ofSSMA-PS, due to the reduction of the search space obtainedby its application.
5.6 Accuracy and efficiency trade-off
The last part of our analysis is devoted to test the compromisebetween accuracy and efficiency achieved by the PS meth-ods of this study. The best way to perform it is to select thesame performance measures employed to obtain this balancein the fitness function of EAs for PS [10], classification andreduction rates.
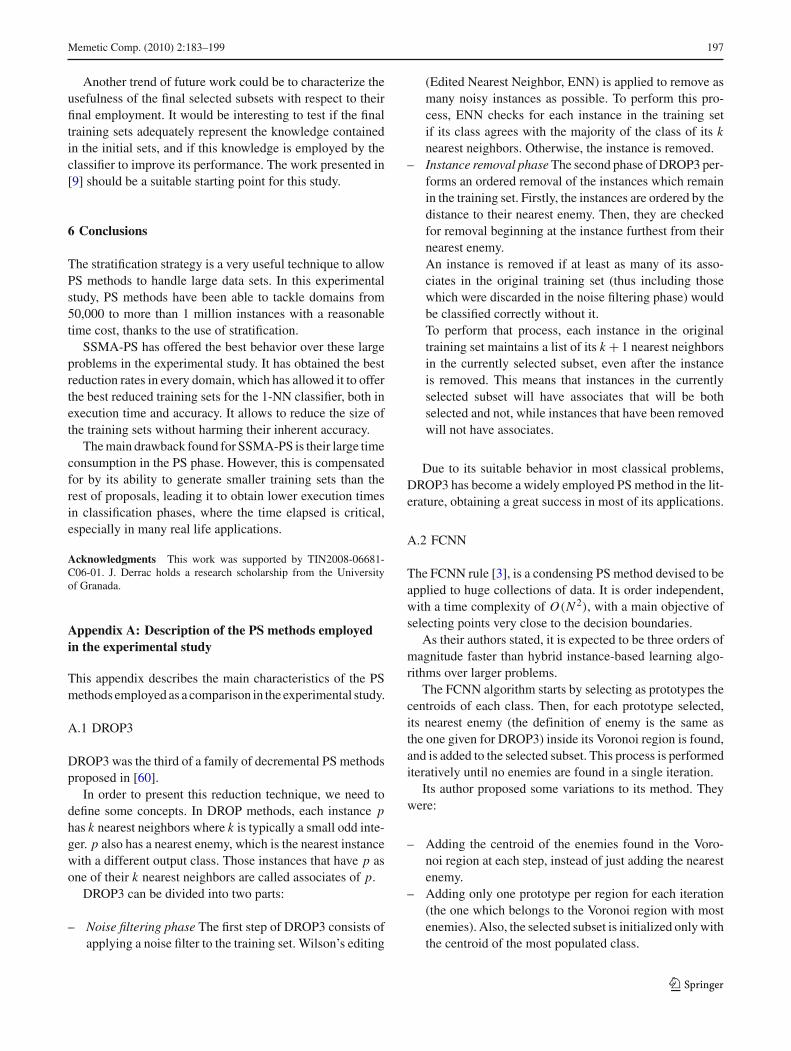
Figure 7 shows, for each domain, a representation of anopposition between the two objectives in test. Each algo-rithm located inside the graphics gets its position from theaverage value of each measure evaluated (exact position cor-responding to the beginning of the name of the algorithm).Across the graphic, there is a line that represents the thresh-old of test accuracy achieved by the 1-NN algorithm withoutpreprocessing.
As we can observe, only SSMA-PS is above the 1-NN hor-izontal line in most domains (except in KddCup and Shut-tle). FCNN and DROP3 fall under the 1-NN line in everydomain (except DROP3 in PokerHand). The graphics alsoclearly emphasizes that SSMA-PS always get the best reduc-tion rates, which locates it always at the right part.
123
196 Memetic Comp. (2010) 2:183–199
Fig. 7 Graphical comparison of the accuracy-reduction tradeoff in every dataset. The horizontal and vertical axis represent reduction and classi-fication rates respectively. 1-NN accuracy is represented as a horizontal line across the graphics
The balance between accuracy and efficiency achieved bySSMA-PS in these domains fits perfectly with the require-ments of a suitable PS method. It gets the best reduction ratespossible without harming (or even increasing) the accuracyrate of the baseline 1-NN classifier.
5.7 Future work
Although the application of the stratification procedure hasbeen discussed thoroughly, pointing out many issues abouthow it modifies the behavior of PS methods, particulary
SSMA-PS, there are still some uncovered trend of workwhich may be taken into account in the future.
A deeper insight into the implications of the use of stratifi-cation with PS methods may be gained by studying in whichway the splitting of the training set affects the final subsetsobtained. For example, PS methods that focus their effortson selecting the boundary points may be harmed due to themodification of the decision boundaries which may appearwhen using stratification. Also, competence enhancing PSmethods may be affected by this fragmentation of the train-ing set, making it harder for them to search and identify noisypoints in the whole data set.
123
Memetic Comp. (2010) 2:183–199 197
Another trend of future work could be to characterize theusefulness of the final selected subsets with respect to theirfinal employment. It would be interesting to test if the finaltraining sets adequately represent the knowledge containedin the initial sets, and if this knowledge is employed by theclassifier to improve its performance. The work presented in[9] should be a suitable starting point for this study.
6 Conclusions
The stratification strategy is a very useful technique to allowPS methods to handle large data sets. In this experimentalstudy, PS methods have been able to tackle domains from50,000 to more than 1 million instances with a reasonabletime cost, thanks to the use of stratification.
SSMA-PS has offered the best behavior over these largeproblems in the experimental study. It has obtained the bestreduction rates in every domain, which has allowed it to offerthe best reduced training sets for the 1-NN classifier, both inexecution time and accuracy. It allows to reduce the size ofthe training sets without harming their inherent accuracy.
The main drawback found for SSMA-PS is their large timeconsumption in the PS phase. However, this is compensatedfor by its ability to generate smaller training sets than therest of proposals, leading it to obtain lower execution timesin classification phases, where the time elapsed is critical,especially in many real life applications.
Acknowledgments This work was supported by TIN2008-06681-C06-01. J. Derrac holds a research scholarship from the Universityof Granada.
Appendix A: Description of the PS methods employedin the experimental study
This appendix describes the main characteristics of the PSmethods employed as a comparison in the experimental study.
A.1 DROP3
DROP3 was the third of a family of decremental PS methodsproposed in [60].
In order to present this reduction technique, we need todefine some concepts. In DROP methods, each instance phas k nearest neighbors where k is typically a small odd inte-ger. p also has a nearest enemy, which is the nearest instancewith a different output class. Those instances that have p asone of their k nearest neighbors are called associates of p.
DROP3 can be divided into two parts:
– Noise filtering phase The first step of DROP3 consists ofapplying a noise filter to the training set. Wilson’s editing
(Edited Nearest Neighbor, ENN) is applied to remove asmany noisy instances as possible. To perform this pro-cess, ENN checks for each instance in the training setif its class agrees with the majority of the class of its knearest neighbors. Otherwise, the instance is removed.
– Instance removal phase The second phase of DROP3 per-forms an ordered removal of the instances which remainin the training set. Firstly, the instances are ordered by thedistance to their nearest enemy. Then, they are checkedfor removal beginning at the instance furthest from theirnearest enemy.An instance is removed if at least as many of its asso-ciates in the original training set (thus including thosewhich were discarded in the noise filtering phase) wouldbe classified correctly without it.To perform that process, each instance in the originaltraining set maintains a list of its k + 1 nearest neighborsin the currently selected subset, even after the instanceis removed. This means that instances in the currentlyselected subset will have associates that will be bothselected and not, while instances that have been removedwill not have associates.
Due to its suitable behavior in most classical problems,DROP3 has become a widely employed PS method in the lit-erature, obtaining a great success in most of its applications.
A.2 FCNN
The FCNN rule [3], is a condensing PS method devised to beapplied to huge collections of data. It is order independent,with a time complexity of O(N 2), with a main objective ofselecting points very close to the decision boundaries.
As their authors stated, it is expected to be three orders ofmagnitude faster than hybrid instance-based learning algo-rithms over larger problems.
The FCNN algorithm starts by selecting as prototypes thecentroids of each class. Then, for each prototype selected,its nearest enemy (the definition of enemy is the same asthe one given for DROP3) inside its Voronoi region is found,and is added to the selected subset. This process is performediteratively until no enemies are found in a single iteration.
Its author proposed some variations to its method. Theywere:
– Adding the centroid of the enemies found in the Voro-noi region at each step, instead of just adding the nearestenemy.
– Adding only one prototype per region for each iteration(the one which belongs to the Voronoi region with mostenemies). Also, the selected subset is initialized only withthe centroid of the most populated class.
123
198 Memetic Comp. (2010) 2:183–199
– Adding only one prototype per region in each iteration(the centroid of the Voronoi region with most enemies).Also, the selected subset is initialized only with the cen-troid of the most populated class.
In their experimental study, the authors found some dif-ferences in the behavior of FCNN depending on the concretevariation employed. However, because no variation is shownto be the best, we have employed the basic version of FCNNin this paper.
References
1. Abraham A, Grosan C, Ramos V (eds) (2006) Swarm intelli-gence in data mining. Studies in computational intelligence, vol 34.Springer, New York
2. Alpaydin E (2004) Introduction to machine learning. The MITPress, New York
3. Angiulli F (2007) Fast nearest neighbor condensation for large datasets classification. IEEE Trans Knowl Data Eng 19(11):1450–1464
4. Aranha C, Iba H (2009) The memetic tree-based genetic algo-rithm and its application to portfolio optimization. Memetic Comp1(2):139–151
5. Asuncion A, Newman DJ (2007) UCI repository of machine learn-ing databases. http://www.ics.uci.edu/~mlearn/MLRepository.html
6. Bacardit J, Burke E, Krasnogor N (2009) Improving the scalabilityof rule-based evolutionary learning. Memetic Comp 1(1):55–67
7. Baluja S (1994) Population-based incremental learning: a methodfor integrating genetic search based function optimization and com-petitive learning. Tech Rep CMU-CS-94-163. Computer ScienceDepartment, Pittsburgh, PA
8. Bezdek J, Kuncheva L (2001) Nearest prototype classifier designs:an experimental study. Int J Intell Syst 16(12):1445–1473
9. Cano J, Lozano FHM (2007) Evolutionary stratified training setselection for extracting classification rules with trade-off precision-interpretability. Data Knowl Eng 60:90–100
10. Cano JR, Herrera F, Lozano M (2003) Using evolutionary algo-rithms as instance selection for data reduction in KDD: an experi-mental study. IEEE Trans Evol Comput 7(6):561–575
11. Cano JR, Herrera F, Lozano M (2005) Stratification for scaling upevolutionary prototype selection. Pattern Recognit Lett 26(7):953–963
12. Cohen J (1960) A coefficient of agreement for nominal scales.Educ Psychol Meas 20(1):37–46
13. Cover TM, Hart PE (1967) Nearest neighbor pattern classification.IEEE Trans Inf Theory 13(1):21–27
14. Cunningham P (2008) A taxonomy of similarity mechanisms forcase-based reasoning. IEEE Trans Knowl Data Eng 21(11):1532–1543
15. Demšar J (2006) Statistical comparisons of classifiers overmultiple data sets. J Mach Learn Res 7:1–30
16. Eiben AE, Smith JE (2003) Introduction to evolutionary comput-ing. Natural computing. Springer-Verlag, New York
17. Eshelman LJ (1991) The CHC adaptative search algorithm: howto have safe search when engaging in nontraditional geneticrecombination. In: Rawlins GJE (ed) Foundations of genetic algo-rithms. Morgan Kaufmann, San Mateo, pp 265–283
18. Fischer T, Bauer K, Merz P, Bauer K (2009) Solving the routingand wavelength assignment problem with a multilevel distributedmemetic algorithm. Memetic Comp 1(2):101–123
19. Forrest S, Mitchell M (1993) What makes a problem hard for agenetic algorithm? some anomalous results and their explanation.Mach Learn 13(2-3):285–319
20. Freitas AA (2002) Data mining and knowledge discovery with evo-lutionary algorithms. Springer-Verlag, New York
21. García S, Herrera F (2009) A study of statistical techniques andperformance measures for genetics-based machine learning: accu-racy and interpretability. Soft Comput 13(10):959–977
22. García S, Cano JR, Herrera F (2008) A memetic algorithm forevolutionary prototype selection: a scaling up approach. PatternRecognit 41(8):2693–2709
23. Ghosh A, Jain LC (eds) (2005) Evolutionary computation in datamining. Springer-Verlag, New York
24. Gil-Pita R, Yao X (2008) Evolving edited k-nearest neighbor clas-sifiers. Int J Neural Syst 18(6):459–467
25. Guyon I, Gunn S, Nikravesh M, Zadeh LA (eds) (2006) Featureextraction: foundations and applications. Springer, New York
26. de Haro-García A, García-Pedrajas N (2009) A divide-and-con-quer recursive approach for scaling up instance selection algo-rithms. Data Min Knowl Discov 18(3):392–418
27. Hart PE (1968) The condensed nearest neighbor rule. IEEE TransInf Theory 14(3):515–516
28. Hart WE (1994) Adaptive global optimization with local search.PhD thesis, University of California, San Diego
29. Hart WE, Krasnogor N, Smith JE (eds) (2005) Recent advancesin memetic algorithms. Springer-Verlag, New York
30. Hasan SMK, Sarker R, Essam D, Cornforth D (2009) Memeticalgorithms for solving job-shop scheduling problems. MemeticComp 1(1):69–83
31. Ho SY, Liu CC, Liu S (2002) Design of an optimal nearest neigh-bor classifier using an intelligent genetic algorithm. Pattern Rec-ognit Lett 23(13):1495–1503
32. Hore P, Hall LO, Goldgof DB (2009) A scalable framework forcluster ensembles. Pattern Recognit 42(5):676–688
33. Ishibuchi H, Nakashima T (1998) Evolution of reference sets innearest neighbor classification. In: Second Asia-Pacific conferenceon simulated evolution and learning on simulated evolution andlearning (SEAL’98). Lecture notes in computer science, vol 1585,pp 82–89
34. Jankowski N, Grochowski M (2004) Comparison of instancesselection algorithms I. Algorithms survey. In: Rutkowski L (ed)International conference on artificial intelligence and soft comput-ing (IAISC’04). LNAI, vol 3070, pp 598–603
35. Kim SW, Oommen BJ (2003) On using prototype reductionschemes to optimize dissimilarity-based classification. PatternAnal Appl 6(3):232–244
36. Krasnogor N, Smith J (2005) A tutorial for competent memeticalgorithms: model, taxonomy, and design issues. IEEE Trans EvolComput 9(5):474–488
37. Kuncheva LI (1995) Editing for the k-nearest neighbors rule by agenetic algorithm. Pattern Recognit Lett 16:809–814
38. Kuncheva LI, Bezdek JC (1998) Nearest prototype classification:clustering, genetic algorithms, or random search? IEEE Trans SystMan Cybernet C 28(1):160–164
39. Lim TS, Loh WY, Shih YS (2000) A comparison of predictionaccuracy, complexity, and training time of thirty-three old and newclassification algorithms. Mach Learn 40(3):203–228
40. Liu H, Motoda H (eds) (2001) Instance selection and constructionfor data mining. The Springer international series in engineeringand computer science. Springer, New York
41. Liu H, Motoda H (2002) On issues of instance selection. Data MinKnowl Discov 6(2):115–130
42. Liu H, Motoda H (eds) (2007) Computational methods of fea-ture selection. CRC Data mining and knowledge discovery series.Chapman & Hall, London
123
Memetic Comp. (2010) 2:183–199 199
43. Liu H, Hussain F, Tan CL, Dash M (2002) Discretization: anenabling technique. Data Min Knowl Discov 6(4):393–423
44. Liu Z, Elhanany I (2008) A fast and scalable recurrent neural net-work based on stochastic meta descent. IEEE Trans Neural Netw19(9):1652–1658
45. Lozano M, Herrera F, Krasnogor N, Molina D (2004) Real-codedmemetic algorithms with crossover hill-climbing. Evol Comput12(3):273–302
46. Lozano M, Sotoca JM, Sánchez JS, Pla F, Pekalska E, DuinRPW (2006) Experimental study on prototype optimisation algo-rithms for prototype-based classification in vector spaces. PatternRecognit 39(10):1827–1838
47. Marchiori E (2008) Hit miss networks with applications to instanceselection. J Mach Learn Res 9:997–1017
48. Moscato P (1989) On evolution, search, optimization, genetic algo-rithms and martial arts: towards memetic algorithms. Tech Rep C3P826, California Institute of Technology, Pasadena
49. Olvera-López JA, Carrasco-Ochoa JA, Martínez-Trinidad JF(2009) A new fast prototype selection method based on clustering.Pattern Anal Appl (in press). doi:10.1007/s10044-008-0142-x
50. Ong YS, Krasnogor N, Ishibuchi H (2007) Special issue onmemetic algorithms. IEEE Trans Syst Man Cybernet B 37(1):2–5
51. Papadopoulos AN, Manolopoulos Y (2004) Nearest neighborsearch: a database perspective. Springer-Verlag Telos, Santa Clara
52. Provost FJ, Kolluri V (1999) A survey of methods for scaling upinductive algorithms. Data Min Knowl Discov 3(2):131–169
53. Pyle D (1999) Data preparation for data mining. The MorganKaufmann series in data management systems. Morgan Kaufmann,San Fransisco
54. Ritter G, Woodruff H, Lowry S, Isenhour T (1975) An algorithmfor a selective nearest neighbor decision rule. IEEE Trans InfTheory 21(6):665–669
55. Shakhnarovich G, Darrell T, Indyk P (eds) (2006) Nearest-neigh-bor methods in learning and vision: theory and practice. The MITPress, New York
56. Sheskin DJ (2007) Handbook of parametric and nonparametric sta-tistical procedures, 4th edn. Chapman & Hall/CRC, London
57. Sierra B, Lazkano E, Inza I, Merino M, Larrañaga P, Quiroga J(2001) Prototype selection and feature subset selection by esti-mation of distribution algorithms. A case study in the survival ofcirrhotic patients treated with tips. In: Proceedings of the 8th con-ference on AI in medicine in Europe (AIME’01). Springer-Verlag,London, pp 20–29
58. Wilcoxon F (1945) Individual comparisons by ranking methods.Biom Bull 1(6):80–83
59. Wilson DL (1972) Asymptotic properties of nearest neighbor rulesusing edited data. IEEE Trans Syst Man Cybernet 2(3):408–421
60. Wilson DR, Martinez TR (2000) Reduction techniques forinstance-based learning algorithms. Mach Learn 38(3):257–286
61. Witten IH, Frank E (2005) Data mining: practical machine learningtools and techniques. Morgan Kaufmann series in data managementsystems, 2nd edn. Morgan Kaufmann, San Fransisco
62. Zar JH (2009) Biostatistical analysis, 5th edn. Prentice Hall, UpperSaddle River
123
Copyright © 2022 FDOKUMEN