Storage management solutions and performance tests at the INFN Tier1
11
This content has been downloaded from IOPscience. Please scroll down to see the full text. Download details: IP Address: 131.154.5.25 This content was downloaded on 01/08/2014 at 14:33 Please note that terms and conditions apply. Storage management solutions and performance tests at the INFN Tier-1 View the table of contents for this issue, or go to the journal homepage for more 2008 J. Phys.: Conf. Ser. 119 052003 (http://iopscience.iop.org/1742-6596/119/5/052003) Home Search Collections Journals About Contact us My IOPscience
Transcript of Storage management solutions and performance tests at the INFN Tier1
This content has been downloaded from IOPscience. Please scroll down to see the full text.
Download details:
IP Address: 131.154.5.25
This content was downloaded on 01/08/2014 at 14:33
Please note that terms and conditions apply.
Storage management solutions and performance tests at the INFN Tier-1
View the table of contents for this issue, or go to the journal homepage for more
2008 J. Phys.: Conf. Ser. 119 052003
(http://iopscience.iop.org/1742-6596/119/5/052003)
Home Search Collections Journals About Contact us My IOPscience
Storage management solutions and performance tests
at the INFN Tier-1
M. Bencivenni1, A. Carbone1, A. Chierici1, A. D’Apice1,D. De Girolamo1, L. dell’Agnello1,6, M. Donatelli1, G. Donvito2,A. Fella1, A. Forti1, F. Furano3, D. Galli4, A. Ghiselli1, A. Italiano1,E. Lanciotti5, G. Lo Re1, L. Magnoni1, U. Marconi3, B. Martelli1,M. Mazzucato1, P.P. Ricci1, F. Rosso1, D. Salomoni1, R. Santinelli5,V. Sapunenko1, V. Vagnoni3, R. Veraldi1, D. Vitlacil1, S. Zani1,R. Zappi1.1 INFN CNAF, Viale Berti Pichat 6/2, I-40126 Bologna, Italy.2 INFN Sezione di Bari, Via Amendola 173, I-70126 Bari, Italy.3 INFN Sezione di Padova, Via Marzolo 8, I-35131 Padova, Italy.4 INFN Sezione di Bologna, Via Irnerio 46, I-40126 Bologna, Italy.5 European Organization for Nuclear Research - CERN, CH-1211, Geneve, Switzerland.
Abstract. Performance, reliability and scalability in data access are key issues in the contextof HEP data processing and analysis applications. In this paper we present the results of a largescale performance measurement performed at the INFN-CNAF Tier-1, employing some storagesolutions presently available for HEP computing, namely CASTOR, GPFS, Scalla/Xrootd anddCache. The storage infrastructure was based on Fibre Channel systems organized in a StorageArea Network, providing 260 TB of total disk space, and 24 disk servers connected to thecomputing farm (280 worker nodes) via Gigabit LAN. We also describe the deployment of aStoRM SRM instance at CNAF, configured to manage a GPFS file system, presenting anddiscussing its performances.
1. IntroductionReliable high throughput data services for storage and file access are the heart of Grid computingand in particular for the High Energy Physics (HEP) community, facing the challenges of thenew scientific program starting at the Large Hadron Collider (LHC). In particular, the I/Oload and the large data size produced by the LHC experiments, amounting to some PB/year,together with the need to exchange data with CERN and with all the other computing centresaround the world at a steady rate of several Gb/s, pose very stringent requirements for all thedata centres involved.
Besides the data access, the data management is a also fundamental task requiring acoordinated effort, and is realized through common tools and protocols allowing to start, controland end the transfers between the different Storage Elements (SE) at the different sites. TheHEP Grid community has designed and implemented the Storage Resource Manager (SRM)interface [1], allowing for a fully transparent management and access to underlying storage
6 Corresponding author. email: [email protected].
International Conference on Computing in High Energy and Nuclear Physics (CHEP’07) IOP PublishingJournal of Physics: Conference Series 119 (2008) 052003 doi:10.1088/1742-6596/119/5/052003
c© 2008 IOP Publishing Ltd 1

resources, hiding the details to the user applications and to the Virtual Organization (VO)managers.
In the first part of this paper we will present the results of comparative performance testsof some data-access solutions nowadays available, namely the Cern Advanced Storage Manager(CASTOR) [2], the dCache system [3], the General Parallel File System (GPFS) [4] and theScalla/Xrootd system [5]. For the CNAF Tier-1 centre these tests aim to provide figures ofmerit for finalizing the technical choices of the storage systems, before the startup of the LHCoperation.
In the second part we will discuss the results of a series of tests performed on a StoRM SRMinstance at CNAF. StoRM [6] has been developed with the specific aim of providing access toparallel file systems like GPFS and Lustre [7], but also standard POSIX file systems, through aSRM interface.
2. The production storage infrastructure at the INFN-CNAF Tier-1CNAF storage installation presently comprises nearly 1 PB of raw-disk space, based on FibreChannel (FC) systems with 4 inter-connected switches forming a Storage Area Network. Thestorage space is currently partitioned among 3 distinct systems: Xrootd, required by the BaBarexperiment; CASTOR for all other experiments requiring data archiving on tape; GPFS forpure disk access. It is foreseen a huge expansion commencing 2008 to reach a size of about 3PB of raw-disk space, which will be further increased during the subsequent years.
In the framework of WLCG, CNAF, as a Tier-1 site, will have to provide three differentaccess types to the storage systems, so-called Storage Classes (SCs):
• Disk0-Tape1 (D0T1). The data are saved on tape and the disk copy is considered only as atemporary buffer (called staging area) managed by the system, i.e. data are automaticallydeleted from the staging area when the occupancy is higher than a configurable thresholdand the data have already been migrated to tape. The size of the staging area is normallyof the order of 20% of the tape space.
• Disk1-Tape1 (D1T1). The data are permanently saved both on tape and on disk. For thisSC, the sizes of disk space and tape space are by definition identical.
• Disk1-Tape0 (D1T0). In this case there is no guaranteed copy on tape and the managementof the disk space is delegated to the Virtual Organization (VO) itself, owning the data.
These SCs will be accessed through appropriate SRM instances. At present, the naturalcandidates at CNAF for the implementation of these SCs are CASTOR for D0T1 and D1T1and GPFS for D1T0.
3. Storage tests3.1. Test-bed layoutIn our setup, 24 disk-servers were actually integrated into a SAN via FC links, while thecommunication of the disk-servers with the computing nodes was via Gigabit LAN.
As disk-storage hardware we used 2 EMC CX3-80 SAN systems, with a total of 260 TB ofraw-disk space, assembled by aggregating nearly 520 500-GB SATA disks. Each EMC systemcomprised two storage controllers (with 4 GB of RAM each), connected to a Brocade 48000 FibreChannel fabric director provided with 8 links, for a total theoretical bandwidth of 32 Gb/s.
The 24 Dell SE1950 disk-servers were equipped with Xeon 1.66 GHz dual-core bi-processors,4 GB of RAM, dual-port Qlogic 246x Host Bus Adapter (HBA) and 1 Gigabit Ethernet link.As Operating System (OS) they run a Scientific Linux CERN (SLC) [8] version 4.4, with a2.6.9-42.0.8.EL.cernsmp kernel operating at 64 bits.
International Conference on Computing in High Energy and Nuclear Physics (CHEP’07) IOP PublishingJournal of Physics: Conference Series 119 (2008) 052003 doi:10.1088/1742-6596/119/5/052003
2
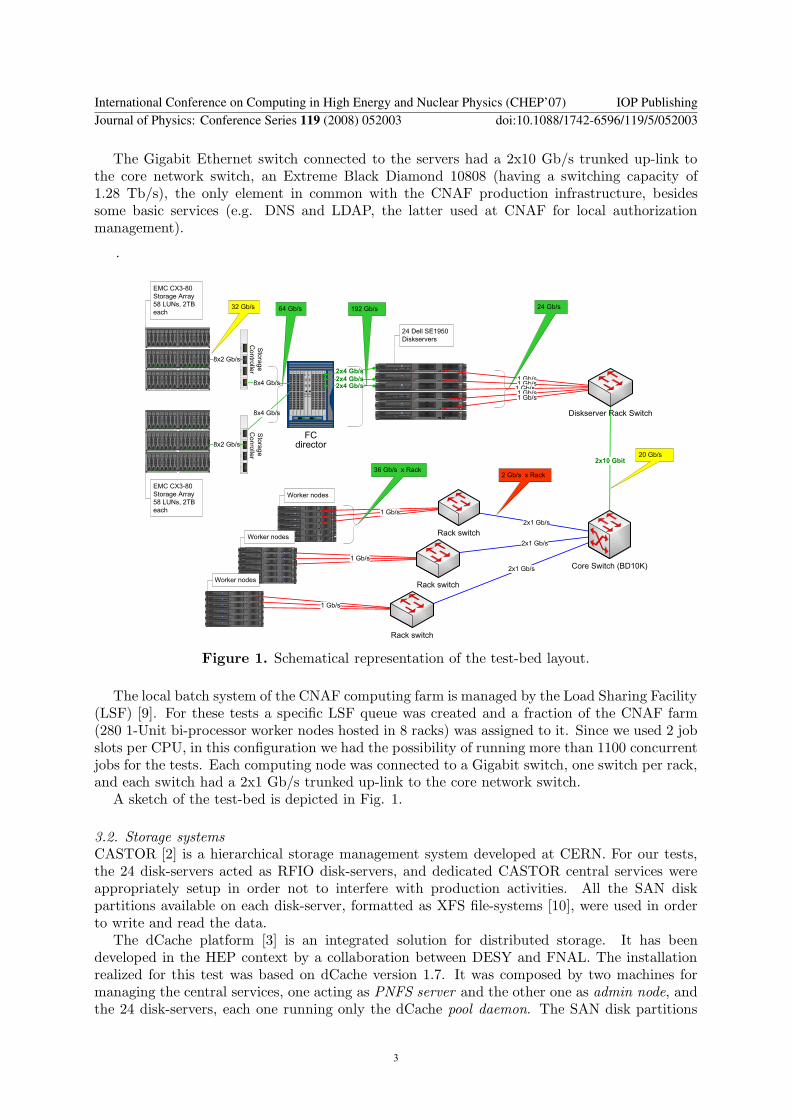
The Gigabit Ethernet switch connected to the servers had a 2x10 Gb/s trunked up-link tothe core network switch, an Extreme Black Diamond 10808 (having a switching capacity of1.28 Tb/s), the only element in common with the CNAF production infrastructure, besidessome basic services (e.g. DNS and LDAP, the latter used at CNAF for local authorizationmanagement).
Figure 1. Schematical representation of the test-bed layout.
The local batch system of the CNAF computing farm is managed by the Load Sharing Facility(LSF) [9]. For these tests a specific LSF queue was created and a fraction of the CNAF farm(280 1-Unit bi-processor worker nodes hosted in 8 racks) was assigned to it. Since we used 2 jobslots per CPU, in this configuration we had the possibility of running more than 1100 concurrentjobs for the tests. Each computing node was connected to a Gigabit switch, one switch per rack,and each switch had a 2x1 Gb/s trunked up-link to the core network switch.
A sketch of the test-bed is depicted in Fig. 1.
3.2. Storage systemsCASTOR [2] is a hierarchical storage management system developed at CERN. For our tests,the 24 disk-servers acted as RFIO disk-servers, and dedicated CASTOR central services wereappropriately setup in order not to interfere with production activities. All the SAN diskpartitions available on each disk-server, formatted as XFS file-systems [10], were used in orderto write and read the data.
The dCache platform [3] is an integrated solution for distributed storage. It has beendeveloped in the HEP context by a collaboration between DESY and FNAL. The installationrealized for this test was based on dCache version 1.7. It was composed by two machines formanaging the central services, one acting as PNFS server and the other one as admin node, andthe 24 disk-servers, each one running only the dCache pool daemon. The SAN disk partitions
International Conference on Computing in High Energy and Nuclear Physics (CHEP’07) IOP PublishingJournal of Physics: Conference Series 119 (2008) 052003 doi:10.1088/1742-6596/119/5/052003
3
available on each disk-server for dCache were formatted as XFS file-systems, analogously to thecase of CASTOR described above.
The Xrootd platform [5] is a data handling system developed as a collaboration betweenSLAC and INFN, with also some other contributors in the HEP software community. Xrootd isdesigned to provide fault tolerant location and access to files distributed throughout a cluster,by employing peer-to-peer-like mechanisms. The architecture provided for this test was based onthe Xrootd production version 20070321-1251p1, and comprised one admin node (also known asredirector) and one Xrootd server on each of the 24 disk-servers. Each Xrootd server employedthe SAN partitions available on each disk-server as disk back-end, all formatted with XFS.
GPFS is a general purpose distributed file-system developed by IBM [4]. It providesfile-system services to parallel and serial applications. GPFS allows parallel applications tosimultaneously access the same files in a concurrent way, ensuring the global coherence, fromany node which has the GPFS file-system locally mounted. GPFS is particularly appropriatein an environment where the aggregate I/O peak exceeds the capability of a single file-systemserver. Differently from the other solutions employed in our tests, from the point of view ofthe applications, the file-system is accessed by a standard POSIX interface, without the needof compiling the client code with ad-hoc libraries. In our tests we realized a GPFS cluster byusing all the 24 disk-servers, aggregating all the SAN partitions available on each disk-server inone global file-system. The GPFS version adopted was 3.1.0-10.
Another interesting product that we did not include in the tests described in this paper,but was already evaluated with great performance figures on a smaller test-bed at CNAF inthe past, is the parallel file-system Lustre [7]. Lustre is a scalable, robust and highly-availablecluster file-system, and - even if with a completely different architecture - shares with GPFS thepeculiarity of allowing standard POSIX access to the file-system from the computing clients. Itis a very interesting alternative to GPFS, and we plan to make further tests with Lustre in thefuture.
3.3. Sequential write/read sequences from the disk-serversThe first test consisted in measuring the local throughput by accessing the SAN devices of asingle EMC CX3-80 system directly from the 24 disk-servers. The devices were formatted withXFS. We performed sequential write and read operations realized by using the dd standard Linuxapplication with a block size of 1 MB and a file size of 12 GB, concurrently from an increasingnumber of disk-servers into all the 58 SAN devices, each one being a RAID-5 array of 2 TB. Thiskind of purely sequential measurements was useful to evaluate the maximum achievable datathroughput, under the reasonable assumption that more complicated access patterns would leadto a deterioration of the global performance of the system.
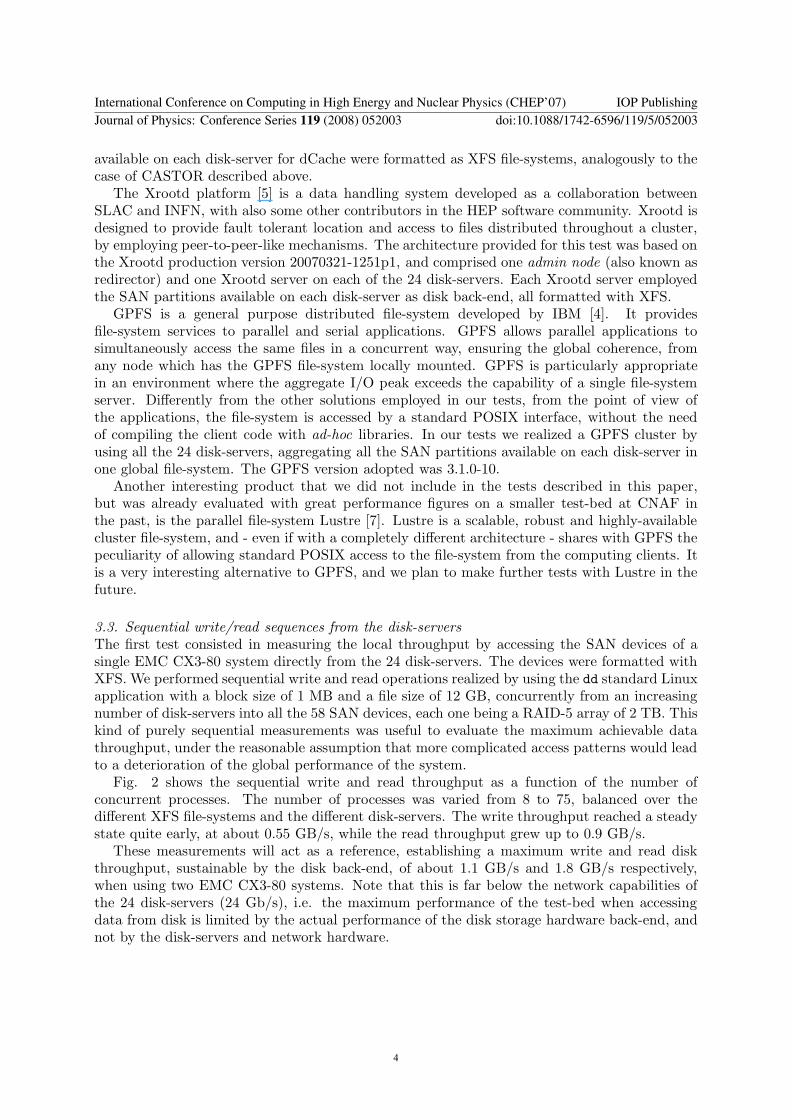
Fig. 2 shows the sequential write and read throughput as a function of the number ofconcurrent processes. The number of processes was varied from 8 to 75, balanced over thedifferent XFS file-systems and the different disk-servers. The write throughput reached a steadystate quite early, at about 0.55 GB/s, while the read throughput grew up to 0.9 GB/s.
These measurements will act as a reference, establishing a maximum write and read diskthroughput, sustainable by the disk back-end, of about 1.1 GB/s and 1.8 GB/s respectively,when using two EMC CX3-80 systems. Note that this is far below the network capabilities ofthe 24 disk-servers (24 Gb/s), i.e. the maximum performance of the test-bed when accessingdata from disk is limited by the actual performance of the disk storage hardware back-end, andnot by the disk-servers and network hardware.
International Conference on Computing in High Energy and Nuclear Physics (CHEP’07) IOP PublishingJournal of Physics: Conference Series 119 (2008) 052003 doi:10.1088/1742-6596/119/5/052003
4
0.2
0.3
0.4
0.5
0.6
0.7
0.8
0.9
1
1.1
1.2
0 10 20 30 40 50 60 70 80
GB/s
0 2
0 3
0 4
0 5
0 6
0 7
0 8
0 9
1
1 1
1 2
0 10 20 30 40 50 60 70 80
GB/s
Number of processes
WriteR eadWriteR ead
Figure 2. Local sequential I/O throughputfrom the disk-servers to one EMC CX3-80system, with variable number of processes.
0
0.2
0.4
0.6
0.8
1
1.2
1.4
1.6C A S T OR write
dC ac he write
Xrootd write
G P F S write
GB/s
0
0 2
0 4
0 6
0 8
1
1 2
1 4
1 6C A S T OR write
dC ac he write
Xrootd write
G P F S write
GB/s
0 900 2700 4500 6300 8100 s
Figure 3. Sequential write throughputversus time for 1000 dd running in parallelon the worker nodes.
0
0.2
0.4
0.6
0.8
1
1.2
1.4
1.6
1.8C A S T OR read
dC ache read
Xrootd read
G P F S read
GB/s
0
0 2
0 4
0 6
0 8
1
1 2
1 4
1 6
1 8C A S T OR read
dC ache read
Xrootd read
G P F S read
GB/s
0 600 1800 3000 4200 5400 6600 s
Figure 4. Sequential read throughput versustime for 1000 dd running in parallel on theworker nodes.
00.10.20.30.40.50.60.70.80.9
1
dC ac he
Xrootd
G P F S
GB/s
00 10 20 30 40 50 60 70 80 9
1
dC ac he
Xrootd
G P F S
GB/s
0 2400 4800 7200 9600 12000 14400 s
Figure 5. Read throughput during a realisticLHCb analysis consisting of 1000 runningsimultaneously on the worker nodes.
3.4. Sequential write/read sequences from the worker nodesSequential write and read measurements were also done by accessing the platforms from theworker nodes. The sequential writes and reads were performed by using dd7. Each file hada size of 5 GB, and 1000 different files were written concurrently in blocks of 64 kB by 1000processes running on all the worker nodes, ensuring a synchronous start of the writes at thebeginning. In an analogous way, the sequential read was successively performed in another test,by re-reading from 1000 processes the files previously written.
Fig. 3 shows the write throughput as a function of time for each of the 4 data-access platformswe have studied8. The analogous plots corresponding to the read throughput are shown in Fig. 4.
7 In order to use dd with non-POSIX systems, i.e. CASTOR, dCache and Xrootd, the application was recompiledby using the appropriate client libraries.8 The plot is obtained by measuring the network throughput, thus it includes also the overhead of the network
International Conference on Computing in High Energy and Nuclear Physics (CHEP’07) IOP PublishingJournal of Physics: Conference Series 119 (2008) 052003 doi:10.1088/1742-6596/119/5/052003
5

For the writes, the 3 platforms CASTOR, dCache and Xrootd behaved almost the same,while GPFS was about 30% faster than the other ones, touching a rate of 1.3 GB/s. For thereads instead, CASTOR, GPFS and dCache showed a similar performance, the highest onebeing GPFS at 1.6 GB/s, while Xrootd was a bit slower, with a main plateau at 1.2 GB/sand a secondary plateau at 0.8 GB/s. This was due to the delay mechanism embedded inXrootd, which can delay certain clients when it identifies a possible access congestion. For thisreason, such clients terminated later than the other ones belonging to the run, and hence therun duration became higher.
CASTOR showed a significant number of failures, which is evident in the read plot, where theintegral of the CASTOR curve is clearly smaller than the other ones (about 20%), i.e. the totalsize of successfully transferred data was smaller. Many problems of the current CASTOR releaseare already well known by the developers. For this reason, we decided to abandon CASTOR inthe studies that we will show next, waiting for a more stable CASTOR release in the forthcomingfuture.
3.5. Realistic LHCb analysisAs a final step, we also performed a realistic analysis using the analysis application of the LHCbexperiment, namely DaVinci [11]. The test consisted in running 1000 analysis jobs on all theworker nodes, each one accessing different input data files produced by the LHCb Monte Carlosimulation. Each analysis job read sequentially one event, performed a realistic algorithm9 toprocess it and then switched to the subsequent event repeating the procedure. Hence this testincluded a realistic data-access and analysis. The read throughput as a function of time is shownin Fig. 5.
4. StoRM testsThe Grid Storage Resource Manager (StoRM) [13] is an implementation for disk-based storage ofthe version 2.2 of the SRM interface especially designed to provide to work with high performanceparallel file systems like GPFS and Lustre, which out of the box do not come with a SRM service.It has been developed by a collaboration between INFN and the Abdus Salam ICTP institutein Trieste, the latter operating in the framework of the EGRID project.
4.1. Test-bed layoutOur setup was composed by 4 disk-servers integrated into the CNAF SAN via FC links, whilethe communication of the disk-servers with the computing farm was via Gigabit LAN. As disk-storage hardware we used part of one EMC CX3-80 SAN system for a total of 40 TB of raw-diskspace arranged in RAID-5 arrays. The disk arrays were aggregated on the 4 disk-servers byGPFS, version 3.1.0-10, i.e. the disk-servers actually acted as GPFS servers, serving a net 36TB GPFS file-system to the worker nodes.
The EMC system comprised two storage processors (with 4 GB of RAM each), connectedto a Brocade 48000 Fibre Channel fabric director. The 4 disk-servers were equipped with dualIntel Xeon 1.6 GHz processors, 4 GB of RAM, dual-port Qlogic 246x Host Bus Adapter (HBA)and 1 Gigabit Ethernet link. Hence the total theoretical bandwidth available was 4 Gb/s. Thedisk-servers also acted as GridFTP [14] front-ends, i.e. besides the GPFS services they run alsothe GridFTP daemon. As Operating System (OS) we used a Scientific Linux CERN (SLC) [8]version 4.4, with a 2.6.9-42.0.8.EL.cernsmp kernel operating at 64 bits.
protocols and of the data-access protocols. For this reason it might slightly exceed the total sustainable throughputof the disk back-end itself.9 The algorithm searched the occurrence of a Bd → π+π− decay inside the events [12].
International Conference on Computing in High Energy and Nuclear Physics (CHEP’07) IOP PublishingJournal of Physics: Conference Series 119 (2008) 052003 doi:10.1088/1742-6596/119/5/052003
6
The StoRM service was provided by three machines: two machines running the StoRM front-end, balanced by means of a dynamic DNS, and one machine running the StoRM back-end andthe MySQL database engine. The two front-end servers were equipped with dual AMD Opteron2.2 GHz processors, 4 GB of RAM and Gigabit NIC. The back-end machine was a dual IntelXeon 2.4 GHz, with 2 GB of RAM and Gigabit NIC.
4.2. Throughput testsA specific data transfer test has been performed to understand how StoRM reacts in heavy-duty operation conditions and to probe the limits of this particular instance. The core of thetest consisted of client scripts which used low level tools (globus-url-copy [15]) for transferringdata from LHCb dedicated disk pools at CERN (different source tURLs corresponding to realLHCb data produced by simulations) to always different destination files in StoRM. In this testwe had not the possibility to control possible bottlenecks introduced by the source disk-serversat CERN, since iregular activities by LHCb were potentially running in parallel on the samesources. At the destination side, for each incoming file, the script issued a srmPrepareToPutSRM command, a polling requesting the status to the SRM until the tURL was returned, then itperformed the data transfer and, once the transfer was complete, it issued a srmPutStatusDoneSRM request to StoRM. This means that the full transfer chain was de facto emulated at thedestination side and the usage of tURLs at the source could not alter the study of the behaviorof the destination, i.e. StoRM.
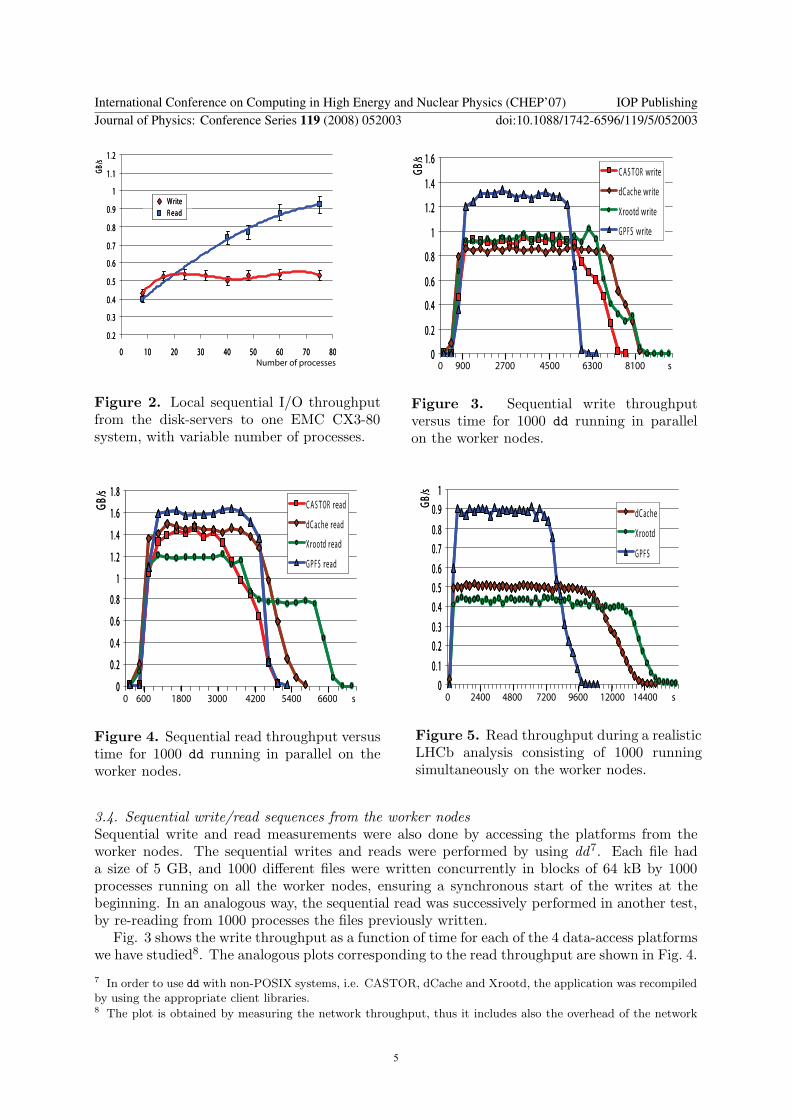
The preliminary part of the test was dedicated to look for the best combination of the numberof parallel streams for each data transfer and the number of concurrent data transfers, in orderto optimize the throughput. The maximum throughput was reached with 15 parallel streamsper transfer and 120 concurrent data transfers. The size of the files was O(100) MB. With thisconfiguration we run a 14 hours test observing a sustained rate slightly exceeding 350 MB/s forabout 8 hours, with a peak at 370 MB/s.
Figure 6. Aggregated network throughput measured during the data transfer test.
Fig. 6 shows the aggregated network throughput versus time during the test. The bandwidthstarted degrading after 6 hours because the workstation at CERN used to run the client scriptgot overloaded and the available memory was exhausted. In 14 hours about 17 TB of data weremoved from CERN to CNAF, interacting with the StoRM SRM interface about 400k times, withmore than 100k files transferred. The GPFS disk-servers began suffering this large traffic: nonnegligible I/O Wait CPU load was observed on the disk-servers during the tests (but in parallel toour tests some additional activities from other VOs were using the same disk back-end storage).
Since the GridFTP servers were running on the 4 GPFS disk-servers, each one provided witha Gigabit network interface, the total available network bandwidth was about 500 MB/s. The
International Conference on Computing in High Energy and Nuclear Physics (CHEP’07) IOP PublishingJournal of Physics: Conference Series 119 (2008) 052003 doi:10.1088/1742-6596/119/5/052003
7

Number of Parallel Requests100 200 300 400 500 600
Mea
n T
ime
per
Req
ues
t (s
)
10
20
30
40
50
Time per Request vs Parallel RequestsTime per Request vs Parallel Requests
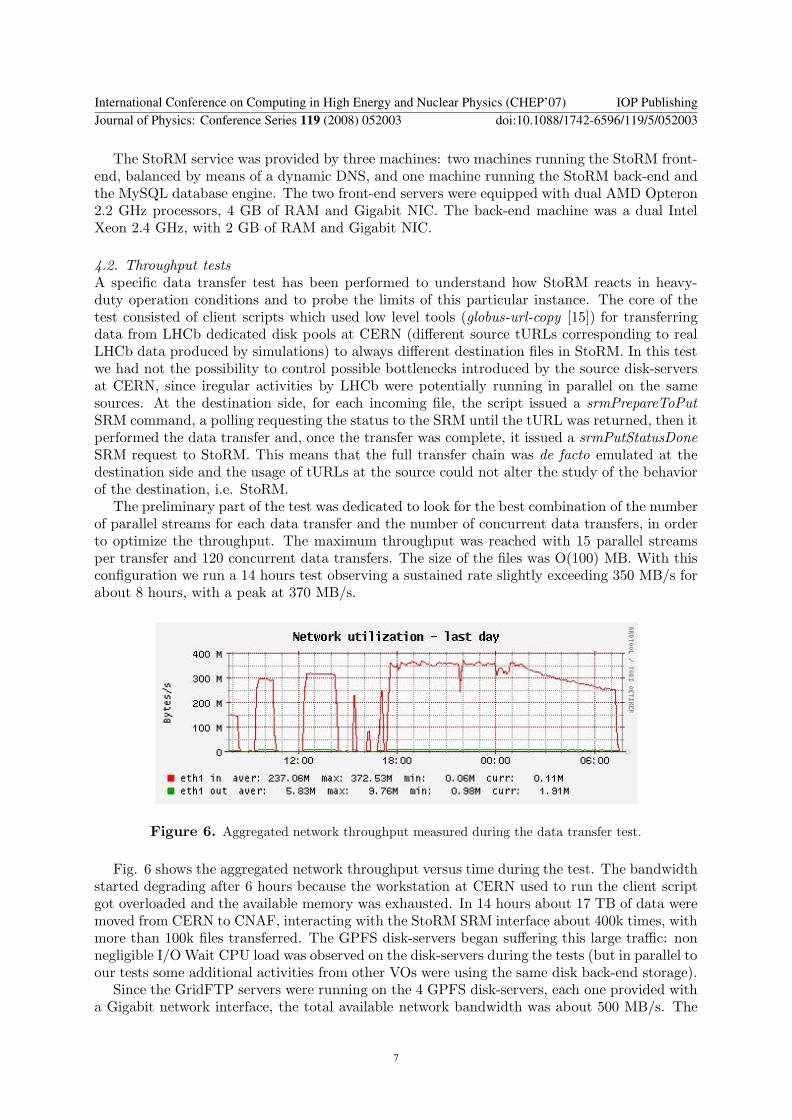
Figure 7. Mean time requiredto fulfill a srmPrepareToPut requestversus the number of parallel clientprocesses.
Number of Parallel Requests100 200 300 400 500 600
Fai
led
req
ues
ts (
%)
0
2
4
6
8
10
12
Failed Requests vs Number of Parallel RequestsFailed Requests vs Number of Parallel Requests
Figure 8. Percentage of failedrequests versus number of parallelclient processes.
link from CERN to CNAF was not at all a limiting factor, since it actually had a bandwidthof 10 Gb/s. In conclusion we have been able to consume about 70% of the theoretical networkbandwidth.
The observed percentage of failures has been very low, about 0.3% due to the file transfersthemselves (i.e. non-zero error code got from globus-url-copy), and 0.1% due to StoRM. Thefailures during the data transfers can have several possible explanations, e.g. problems due tohigh load on the source disk-servers or temporary network glitches. The few failures due StoRMwere basically due to timeouts and will be discussed in the following section.
4.3. Stress testsA series of stress tests without data transfers, i.e. only measuring the pure SRM performances,were also put in place to understand how the implementation of StoRM responds when criticalconditions are reached. These tests provided an evaluation of the performance of this StoRMimplementation and recipes for scaling up installations which would require larger performances.
It is worth noting that the results of these tests do not depend on the performance of theunderlying GPFS file system, hence all the latencies we will mention have to be addressedto the StoRM instance itself. The test turned into an invaluable opportunity for tuning andknowing the behavior of StoRM in a tight collaboration with its developers, and led to a seriesof optimizations, in particular to the introduction of several indices into the StoRM databasefor improving the response of the relevant SQL queries.
A first step targeted to find the limits of the system, by gradually increasing the load on theSRM endpoint and studying the response as a function of the number of concurrent processes.Each process issues a sequence of SRM requests to list the content of a directory (srmLs), toremove the files in it (srmRm), and then to allocate space for a new file (srmPrepareToPut). Theplot in Fig. 7 shows how the average time for retrieving a TURL from StoRM varies as functionof the number of concurrent processes. The average time was computed as the mean value ofall processes mean times and the error bars represent a systematic uncertainty computed byrepeating the test several times. Fig. 8 shows the percentage of failures due to StoRM, whichis negligible up to 500 concurrent requests, while it increases considerably from 600 parallelprocesses onward. This behavior suggests that the system can safely handle up to ∼ 500 parallelrequests, corresponding to a rate of SRM client commands of about 80 Hz10, whereas for ∼ 600parallel processes it effectively enters into a critical regime. This was basically due to the pretty
10 Each prepare to put sequence implies on average 6.5 client commands (1 srmPrepareToPut + 5.5 srmStatusPtP).Since on average a sequence needs 40s to be completed with 500 client processes (see Fig. 7), the rate can beroughly computed as (6.5 × 500 requests)/40s � 80Hz.
International Conference on Computing in High Energy and Nuclear Physics (CHEP’07) IOP PublishingJournal of Physics: Conference Series 119 (2008) 052003 doi:10.1088/1742-6596/119/5/052003
8
high load which was reached on the StoRM front-end service nodes, which could no longerprocess in due time the requests, resulting in hard timeouts with an error message from gSoap:”CGSI-gSoap: could not open connection! TCP connect failed in tcp connect()”. In fact, itindicates that the StoRM front-end, which is in charge of accepting and authenticating theincoming requests through the gSoap package, was not able within a given timeout to serve theSRM request due to the large load. Of course in such cases the client code could perform oneor more retries, thus reducing the effective rate of failures. The obvious solution to this kindof problems would be to scale up the system in order to cope with a rate of requests higherthan the expected use case. However, such a predictable failure condition should be taken intoaccount with an appropriate admission control queue in StoRM, in order to reject the requeststhat cannot be fulfilled under heavy load conditions. The StoRM developers are already workingto implement a configurable timeout by-passing the gSoap one, and to return an ordinary SRMmessage which states that the application rejected the request due to the high load.
In order to compare these results with a real use case, a rough estimation of the needs ofLHCb has been done on the basis of the LHCb Computing Model [16]. The expected rate ofcalls to the SRM interface in a Tier-1 site during the first year of LHCb data taking is estimatedto be of order of 1 Hz. This computation includes the data transfer from CERN to the Tier-1sduring data taking, the data exchange among the Tier-1s and from the Tier-2s as well as thedata analysis activities going on at the Tier-1. The results reported above prove that such aninstance of StoRM can comfortably cope with the needs of a HEP experiment like LHCb.
5. ConclusionsWe have evaluated various data-access platforms — namely CASTOR, dCache, GPFS andScalla/Xrootd. By using a large test-bed, composed of two EMC CX3-80 storage systemsproviding 260 TB of raw-disk space via a SAN, 24 Gigabit disk servers and about 280 workernodes, we have been able to achieve more than 1.5 GB/s of aggregated data throughput fromthe disk servers to the worker nodes. We have performed sequential accesses and a realistic LHCanalysis using 1000 processes running on the client computing nodes.
Even if some problems still exist for the various data-access platforms, the results of this workclearly demonstrate that the existing technologies can provide the figures of merit needed by thecomputing activities of the LHC experiments, roughly amounting to several GB/s of throughputper large data centre. In fact, by properly scaling up such a test-bed to more storage systemsand disk size by a factor 10, i.e. a few PB of disk-storage, it is clear that one can achieve quiteeasily order of 10 GB/s or more.
We have also performed a series of tests on a StoRM SRM instance configured to run onGPFS, aiming to measure the throughput of data transfers from CERN to CNAF and to studythe behavior of the system under high load. Our StoRM instance has been able to sustain forseveral hours an incoming throughput over the WAN of about 360 MB/s with a negligible rate offailed transfers. Furthermore, in a specific SRM stress test without data transfers, we measuredthat the StoRM instance was able to sustain a rate of SRM requests of about 80 Hz, beforestarting to reject them due to the too large load.
International Conference on Computing in High Energy and Nuclear Physics (CHEP’07) IOP PublishingJournal of Physics: Conference Series 119 (2008) 052003 doi:10.1088/1742-6596/119/5/052003
9
References[1] SRM Working Group web page, http://sdm.lbl.gov/srm-wg.[2] CASTOR web page, http://castor.web.cern.ch/castor.[3] dCache web page, http://www.dcache.org.[4] General Parallel File-System documentation, http://publib.boulder.ibm.com/infocenter/
clresctr/vxrx/topic/com.ibm.cluster.gpfs.doc/gpfsbooks.html.[5] A. Dorigo, P. Elmer, F. Furano, and A. Hanushevsky, Xrootd - A highly scalable architecture for data access,
WSEAS Transactions on Computers, Apr. 2005.[6] StoRM project home page, http://storm.forge.cnaf.infn.it.[7] Lustre web page, http://www.lustre.org.[8] Scientific Linux CERN web page, http://linux.web.cern.ch/linux.[9] Load Sharing Facility, Platform web page, http://www.platform.com.[10] XFS file-system web page, http://oss.sgi.com/projects/xfs.[11] LHCb DaVinci web page, http://cern.ch/LHCb-release-area/DOC/davinci.[12] A. Carbone et al., CERN-LHCb-2007-059, 2007.[13] E. Corso et al., StoRM: an SRM Implementation for LHC Analysis Farms, in Proceedings of CHEP2006,
Mumbai, India (2006).[14] GridFTP web page, http://www.globus.org/grid software/data/gridftp.php.[15] The globus-url-copy tool, http://www.globus.org/grid software/data/globus-url-copy.php.[16] LHCb Computing Model, CERN-LHCC-2004-36.
International Conference on Computing in High Energy and Nuclear Physics (CHEP’07) IOP PublishingJournal of Physics: Conference Series 119 (2008) 052003 doi:10.1088/1742-6596/119/5/052003
10