Dark ages and dark areas: global deforestation in the deep past
Upload
khangminh22Category
view
5download
0
Development of a Dark PMT
Francesco PandolfiINFN Rome
PTOLEMY MeetingLNGS, 27.11.2018

Francesco Pandolfi PTOLEMY Meeting, 27.11.18
Don’t Need to Introduce Dark Matter
❖ Anomalies in observed universe: rotation curves, galaxy clusters, supernovae
• Simplest explanation: existence of an unknown, dark state of matter
!2

Francesco Pandolfi PTOLEMY Meeting, 27.11.18
A Wind of Dark Matter from Cygnus
❖ If Dark Matter (DM) exists our solar system is flying through it
• Apparent ‘wind’ coming from direction of Cygnus constellation
!3
12
0 200 400 600 800
|v| [km/s]
0
1
2
3
4
5
103f(|v
|)[k
m/s
]�1
SDSS-Gaia DR2
Heliocentric |v||z| >2.5 kpcd� <4.0 kpc
Halo
Subs
Total
SHM
Figure 8. (Left) Posterior speed distribution for the halo (dashed red) and substructure (dotted blue) components. The solidblack line represents the total contribution. These results are based on fits to the SDSS-Gaia DR2 data within heliocentricdistances of d� < 4 kpc and |z| > 2.5 kpc. For comparison, we show the Standard Halo Model (dashed gray), defined in (6). Theempirical distribution does not include contributions from DM accreted from non-luminous satellites or di↵usely. (Right) The95% background-free C.L. limits on the DM-nucleon scattering cross section, ���n, for spin-independent interactions as afunction of DM mass, m�, assuming a xenon target with an exposure of 1 kton⇥year exposure and a 4.9 keVnr energy threshold.These limits are illustrative and do not account for experimental energy e�ciencies near threshold (Aprile et al. 2018).
The right panel of Fig. 8 shows the corresponding lim-its on the DM mass and DM-nucleon scattering crosssection, ���n, assuming the simplest spin-independentoperator. For this example, we assume a xenon tar-get, energy threshold of 4.9 keVnr, and exposure of1 kton⇥year. The 95% one-sided Poisson C.L. limit (3events) obtained using the velocity distribution inferredfrom SDSS-Gaia DR2 is shown in solid black, and com-pared to the SHM in dashed grey. The substructurecomponent drives the sensitivity at all masses, whilethe halo contribution is subdominant, but becomes moreimportant at lower masses. In both cases, the exclusionis significantly weakened for m� . 30 GeV relative tothat obtained using the SHM. For m� & 100 GeV, theblack and gray-dashed lines approach each other becausevmin ! 0 in (9).The overall e↵ect of the empirical velocity distribu-
tion on the scattering limit depends on the details of thenuclear target, experimental threshold, and DM mass—all parameters that feed into the minimum scatteringspeed defined in (7). A more model- and experiment-independent way of understanding these e↵ects is tostudy the dependence of the time-averaged inverse-speed, hg(vmin)i, as a function of the minimum speed, asthis term captures the dependence of the scattering rateon the DM velocities. The left panel of Fig. 9 plots thisquantity for the empirical speed distribution obtainedin this work (solid black) and the SHM (dashed gray).The scattering rate for the empirical distribution is re-duced relative to that for the SHM at vmin & 300 km/s;
it is enhanced for lower minimum speeds. The scatter-ing rate is completely suppressed for vmin & 550 km/s,whereas the SHM continues to contribute events abovethis point.To better understand the implications of these re-
sults, let us consider the concrete example of a 10 GeVDM particle interacting in several detectors. Such aDM particle needs a minimum speed of ⇠ 570 km/sto scatter a xenon nucleus at an energy of ⇠ 5 keVnr
in Xenon1T (Aprile et al. 2018). As seen from the leftpanel of Fig. 9, this is highly suppressed relative to theSHM expectation.6 In contrast, the DarkSide-50 low-mass analysis (Agnes et al. 2018) can detect argon re-coils down to 0.6 keVnr in energy. A 10 GeV DM particleonly needs speeds of ⇠ 130 km/s to create such a recoiland these speeds are well-supported by the empiricaldistribution.The empirical velocity distribution also impacts the
time-dependence of a signal. The DM scattering rateshould modulate annually due to the Earth’s motionaround the Sun (Drukier et al. 1986).The right panel of Fig. 9 compares the modulation
amplitude assuming the newly derived velocity distri-bution, as compared to the SHM. To obtain the ampli-tude, we transform the velocities from the Galactic tothe heliocentric frame, taking into account the Earth’stime-dependent velocity as defined in Lee et al. (2013).
6 In actuality, Xenon1T has non-zero e�ciency below⇠ 5 keVnr, which improves its sensitivity in this range.
Sun
Galactic Center
Cygnus
Francesco Pandolfi PTOLEMY Meeting, 27.11.18
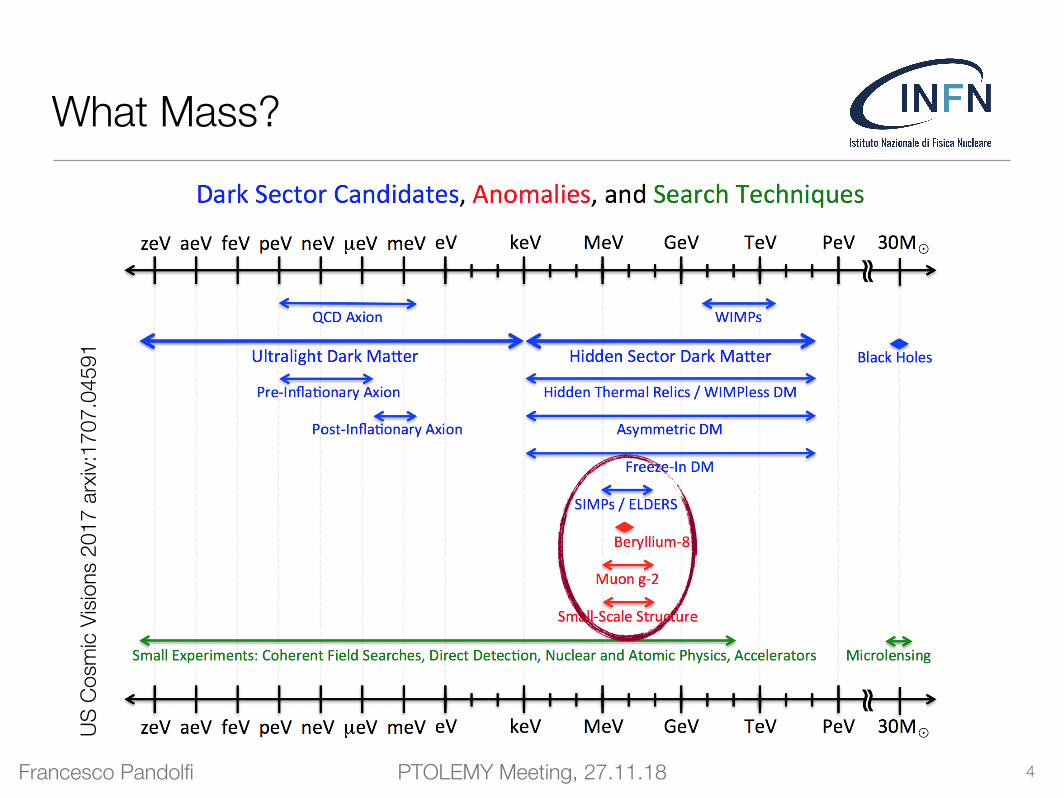
What Mass?
!4
6
Particle Dark MatterAnother way of looking at it
US Cosmic vision: New Ideas in Dark Matter 2017 – arXiv:1707.04591
Alfredo D. Ferella | The PTOLEMY-G3 experiment - IDM 2018 - July 23, 2018
US C
osm
ic Vi
sions
201
7 ar
xiv:1
707.
0459
1
Francesco Pandolfi PTOLEMY Meeting, 27.11.18
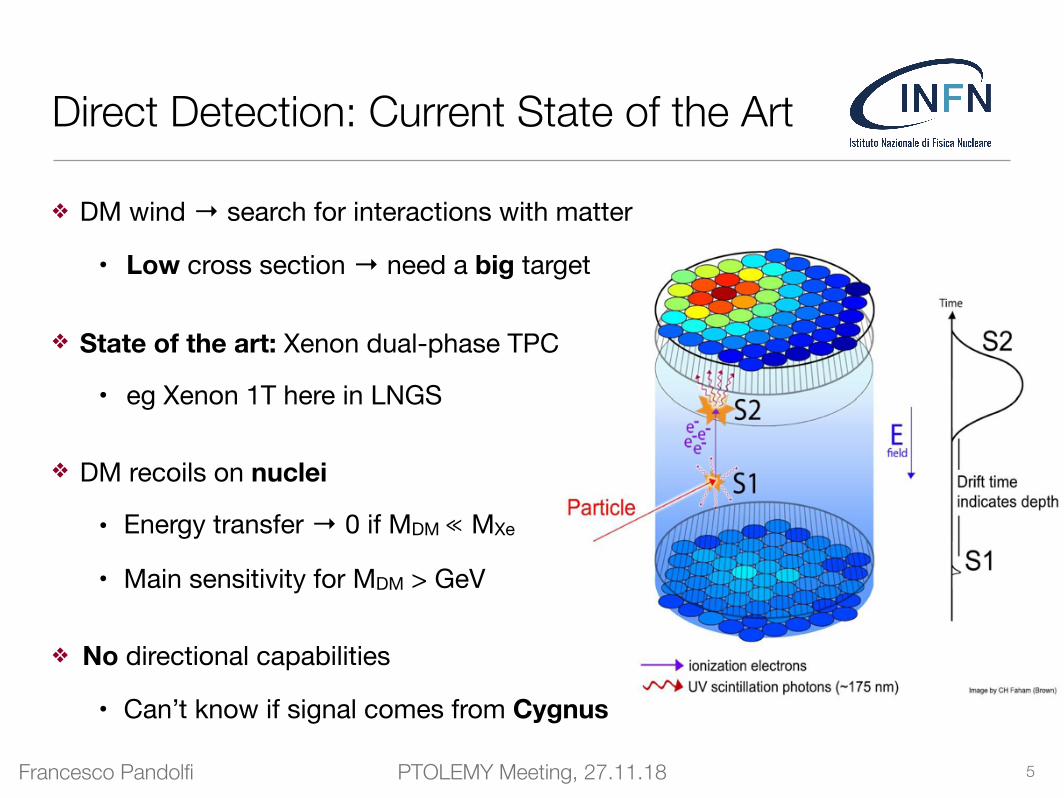
Direct Detection: Current State of the Art
❖ DM wind → search for interactions with matter
• Low cross section → need a big target
❖ State of the art: Xenon dual-phase TPC
• eg Xenon 1T here in LNGS
❖ DM recoils on nuclei
• Energy transfer → 0 if MDM ≪ MXe
• Main sensitivity for MDM > GeV
❖ No directional capabilities
• Can’t know if signal comes from Cygnus
!5

Francesco Pandolfi PTOLEMY Meeting, 27.11.18
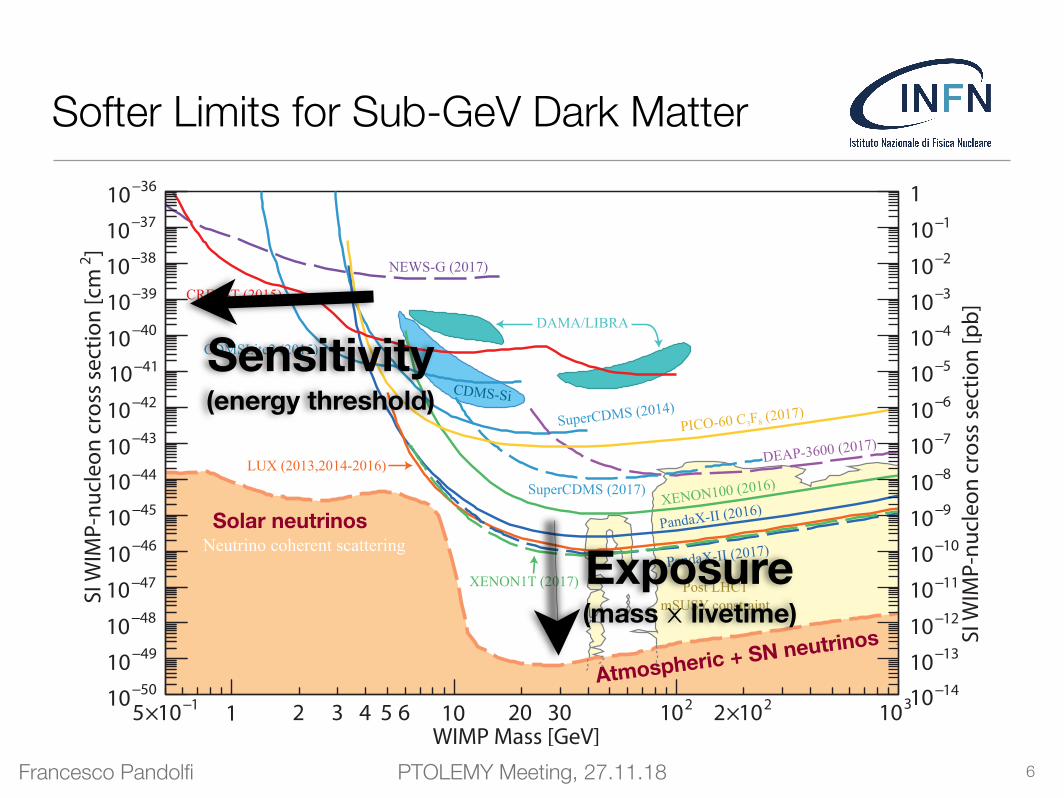
Softer Limits for Sub-GeV Dark Matter
!6
16 27. Dark matter
Figure 27.1: WIMP cross sections (normalized to a single nucleon) for spin-independent coupling versus mass. The DAMA/LIBRA [72], and CDMS-Sienclosed areas are regions of interest from possible signal events. References to theexperimental results are given in the text. For context, the black contour shows ascan of the parameter space of 4 typical SUSY models, CMSSM, NUHM1, NUHM2,pMSSM10 [73], which integrates constraints set by ATLAS Run 1.
Table 26.1 summarizes the best experimental performances in terms of the upper limiton cross sections for spin independent and spin dependent couplings, at the optimizedWIMP mass of each experiment. Also included are some new significant results (usingArgon for example).
In summary, the confused situation at low WIMP mass has largely been clearedup (with the notable exception of the DAMA claim). Liquid noble gas detectors haveachieved large progress in sensitivity to spin independent coupling WIMPs without seeingany hint of a signal. A lot of progress has also been achieved by the PICO experimentfor spin dependent couplings. Many new projects focus on the very low mass range of0.1-10 GeV. Sensitivities down to σχp of 10−13 pb, as needed to probe nearly all of theMSSM parameter space [39] at WIMP masses above 10 GeV and to saturate the limitof the irreducible neutrino-induced background [56], will be reached with Ar and/orXe detectors of multi-ton masses, assuming nearly perfect background discriminationcapabilities. For WIMP masses below 10 GeV, this cross section limit is set by the solarneutrinos, inducing an irreducible background at an equivalent cross section around 10−9
pb, which is accessible with less massive low threshold detectors [31].
December 1, 2017 09:36
Solar neutrinos
Atmospheric + SN neutrinos
Francesco Pandolfi PTOLEMY Meeting, 27.11.18
Softer Limits for Sub-GeV Dark Matter
!6
Solar neutrinos
Atmospheric + SN neutrinos
Exposure (mass ⨉ livetime)
Sensitivity (energy threshold)
Francesco Pandolfi PTOLEMY Meeting, 27.11.18
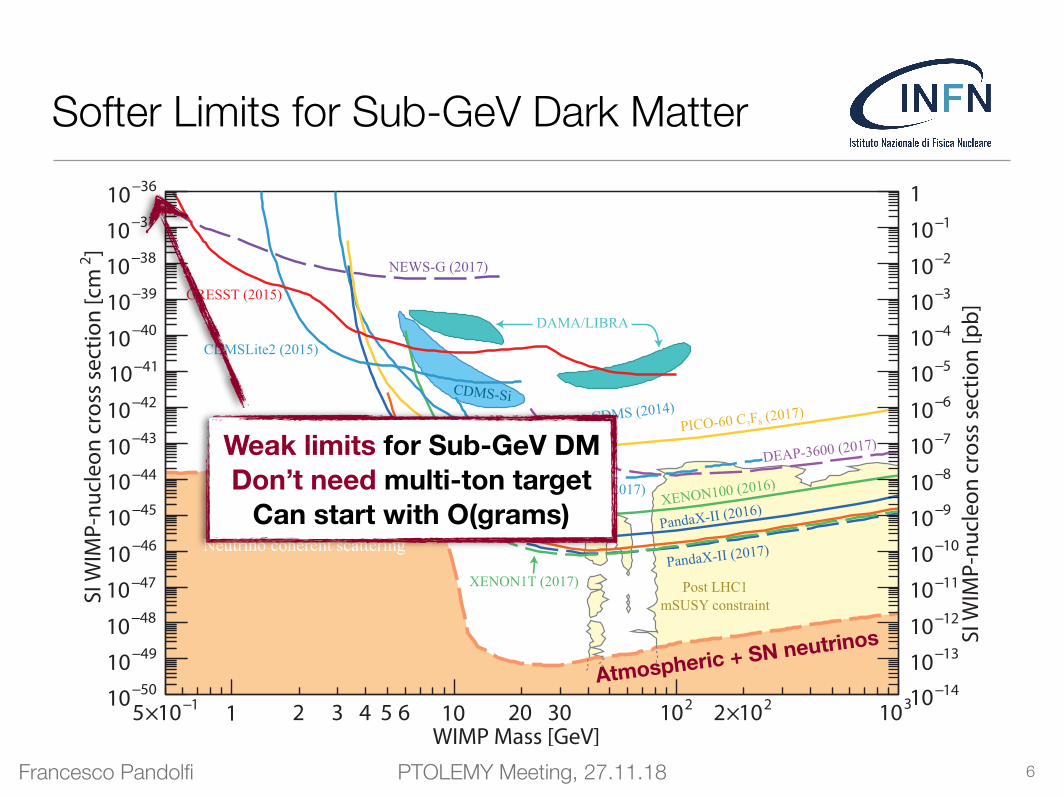
Softer Limits for Sub-GeV Dark Matter
!6
16 27. Dark matter
Figure 27.1: WIMP cross sections (normalized to a single nucleon) for spin-independent coupling versus mass. The DAMA/LIBRA [72], and CDMS-Sienclosed areas are regions of interest from possible signal events. References to theexperimental results are given in the text. For context, the black contour shows ascan of the parameter space of 4 typical SUSY models, CMSSM, NUHM1, NUHM2,pMSSM10 [73], which integrates constraints set by ATLAS Run 1.
Table 26.1 summarizes the best experimental performances in terms of the upper limiton cross sections for spin independent and spin dependent couplings, at the optimizedWIMP mass of each experiment. Also included are some new significant results (usingArgon for example).
In summary, the confused situation at low WIMP mass has largely been clearedup (with the notable exception of the DAMA claim). Liquid noble gas detectors haveachieved large progress in sensitivity to spin independent coupling WIMPs without seeingany hint of a signal. A lot of progress has also been achieved by the PICO experimentfor spin dependent couplings. Many new projects focus on the very low mass range of0.1-10 GeV. Sensitivities down to σχp of 10−13 pb, as needed to probe nearly all of theMSSM parameter space [39] at WIMP masses above 10 GeV and to saturate the limitof the irreducible neutrino-induced background [56], will be reached with Ar and/orXe detectors of multi-ton masses, assuming nearly perfect background discriminationcapabilities. For WIMP masses below 10 GeV, this cross section limit is set by the solarneutrinos, inducing an irreducible background at an equivalent cross section around 10−9
pb, which is accessible with less massive low threshold detectors [31].
December 1, 2017 09:36
Solar neutrinos
Atmospheric + SN neutrinos
Weak limits for Sub-GeV DM Don’t need multi-ton target
Can start with O(grams)

Francesco Pandolfi PTOLEMY Meeting, 27.11.18
Two Weapons for Sub-GeV DM Searches
❖ DM-electron scattering
• Sensitive to sub-GeV MDM
!7
❖ Directionality
• Can link a signal to Cygnus
• Sun never overlaps with Cygnus
• Insensitive to solar neutrino BG
e.g. C.J.G. O’Hare 1505.0806 • position of Sun never coincides with Cygnus
solar neutrinos
WIMPs
Penetrating the neutrino floor Power of Directionality
Neil Spooner, IDM 2018
e.g. C.J.G. O’Hare 1505.0806 • position of Sun never coincides with Cygnus
solar neutrinos
WIMPs
Penetrating the neutrino floor Power of Directionality
Neil Spooner, IDM 2018
DMDM
e
Nuclear recoil Electron recoil
Francesco Pandolfi PTOLEMY Meeting, 27.11.18
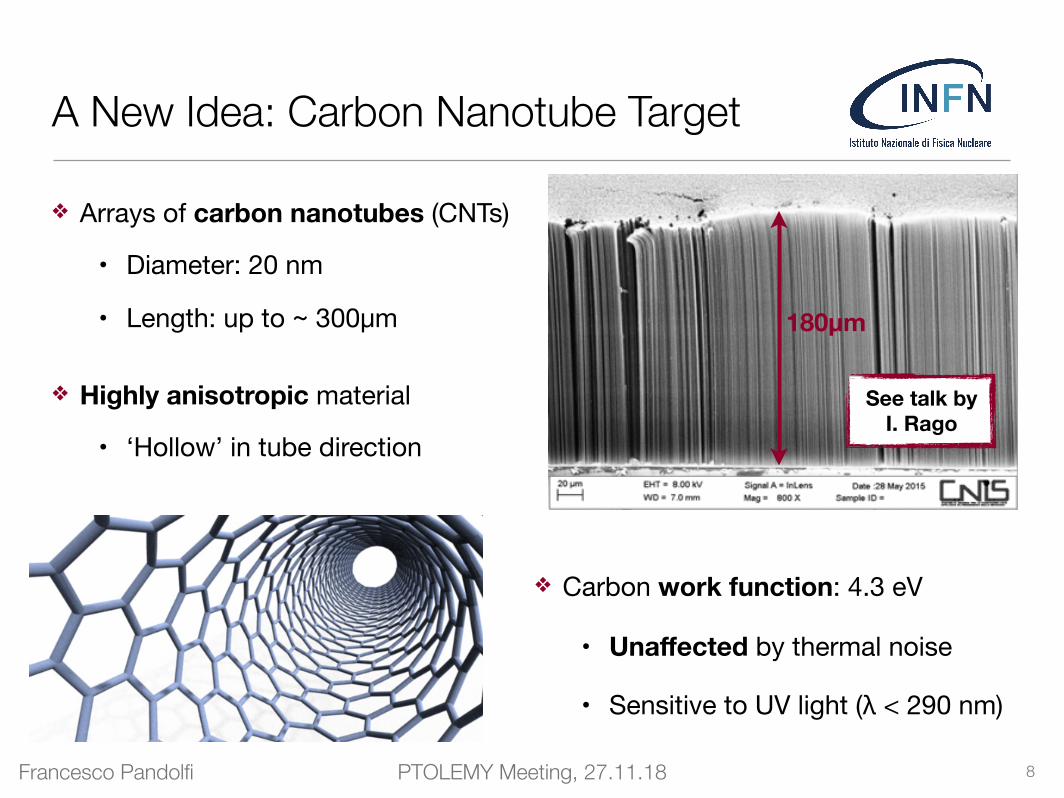
A New Idea: Carbon Nanotube Target
❖ Arrays of carbon nanotubes (CNTs)
• Diameter: 20 nm
• Length: up to ~ 300µm
❖ Highly anisotropic material
• ‘Hollow’ in tube direction
!8
180µm
❖ Carbon work function: 4.3 eV
• Unaffected by thermal noise
• Sensitive to UV light (λ < 290 nm)
See talk by I. Rago
Francesco Pandolfi PTOLEMY Meeting, 27.11.18
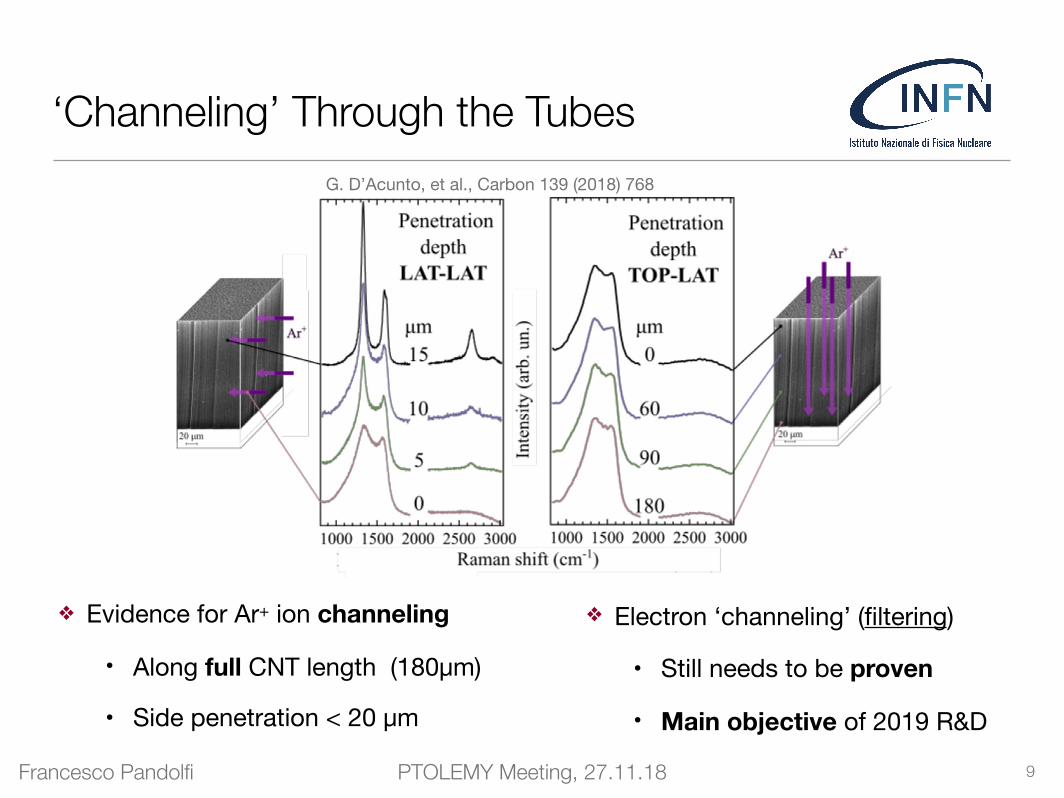
‘Channeling’ Through the Tubes
❖ Evidence for Ar+ ion channeling
• Along full CNT length (180µm)
• Side penetration < 20 µm
!9
C 1s core level at high integrated flux in the two bombarding ge-ometries (LAT and TOP). In Fig. 4 we report the C 1s core levels,together with the results of the fitting analysis in different com-ponents, and an histogram of the relative intensity of eachcomponent.
Upon ion bombardment, the sp2 component representative ofthe perfect planar C bonding is reduced, as also the p-p*-excitation.The sp3-like peak associated to bond deformation increases forboth geometries (LAT and TOP), as reported in Fig. 4 (bottom panel)where the percentage of the different components of the C 1s corelevel peaks as obtained through the fitting procedure are reported.
We notice that the variations with respect to the pristine C 1s signalis higher for the TOP than for the LAT geometry, in agreement withthe observed anisotropic channelling. Furthermore, a new peak at284.1 eV BE appears after bombardment, reachingmore than 20% ofthe total signal in the case of TOP bombardment, and about 5% inthe LAT geometry. The lower binding energy with respect to the sp2
peak suggests the presence of vacancies with unsaturated danglingbonds [43,44]. Thus, the XPS C 1s core level is a good fingerprint ofthe produced defects after the ion bombardment, characterised bythe presence of a high percentage of distorted C bonds and also ofvacancies; they produce dangling bonds when the honeycomb
Fig. 2. SEM and Raman spectroscopy of ion-bombarded MWCNTs with 5 keV Arþ at high integrated flux (1.5" 1017 ions/cm2), with different geometries: lateral bombardment (leftpanels), top bombardment (right panels). SEM images, top view (b,c) and lateral view (f,g). Raman spectra focused on the sample top (a, green, and d, blue) and on the side (e,orange, and h, violet); the Raman fitting components are reported as gray curves superimposed over the experimental data. Raman data of the clean pristine sample are shown forcomparison in all panels, as gray spectra. (A colour version of this figure can be viewed online.)
Fig. 3. Raman spectroscopy data of LAT (left) and TOP (right) ion-bombarded MWCNTs with 5 keV Arþ at saturation (1.5" 1017 ions/cm2) measured from the sample side, atdifferent depths into the sample. Raman data from the side (0 mm) to 15 mm depth after lateral bombardment (left panel), and on the lateral side from the top to the bottom (180 mmdepth) of the CNT brush after top bombardment (right panel). (A colour version of this figure can be viewed online.)
G. D'Acunto et al. / Carbon 139 (2018) 768e775 771
❖ Electron ‘channeling’ (filtering)
• Still needs to be proven
• Main objective of 2019 R&D
G. D’Acunto, et al., Carbon 139 (2018) 768

Francesco Pandolfi PTOLEMY Meeting, 27.11.18
So Here’s The Idea: A ‘Dark-PMT’
❖ CNT array serves as ‘dark’-photocathode
• DM extracts photoelectron of few eV
• e- escapes only if in CNT direction
❖ Electron then accelerated by E field
• Hits silicon detector with E ~ few keV
!10
DM ‘Wind’
DM
e
Electron recoil
EDM ~ 1/2 MDM (v/c)2
with v = 300 km/s: EDM ~ 0.5 (MDM/MeV) [eV]
so if all E transfered to e-: Ee ~ 5-50 eV (for MDM = 10-100 MeV)

Francesco Pandolfi PTOLEMY Meeting, 27.11.18
The Experiment: Two Dark-PMTs
❖ One pointing to Cygnus, one orthogonal
• Search variable: N1-N2
• In-situ BG measurement (for free)
• (Could also measure 14C activity?)
!11
Dark-PMT 1Dark-PMT 2
PTOLEMY Meeting, 27.11.18
5
100 g CNT are needed. In principle, the system is scal-able at will, since the target mass does not need to beconcentrated in a small region.
Single electrons counts can be triggered by environ-ment neutrons as well. This is a well known sourceof background a✏icting all direct DM search experi-ments and the screening techniques are the standardones. Thermal neutrons have scattering lengths of fewfermis with electrons in graphene, but they have notenough energy to extract them e�ciently from the ma-terial. A neutron moderation screen, as those currentlyused in these kind of experiments, has to be includedwhen devising the apparatus. We assume that workingwith compact units as HPDs, this kind of screening mightbe achieved more easily than with other configurations.
Another source of single electron counts, which belongsto similar configurations too, is the electron thermo-emission. This can strongly be attenuated by coolingthe device down to cryogenic temperatures. However, asnoted in [21], the thermionic electron current from an ef-fective surface of 1 m2 of graphene should definitely benegligible at room temperatures being proportional to3
j ⇡ T 3 exp (��wf/kT ) (5)
This is essentially due to the fact that the work-function�wf in graphene is almost three times as large than thetypical work-function of photocathodes.
As for the field emission, this has also been studied in[18] where it is found that its starts being significant forelectric fields above 1V/nm, way larger than the ones weconsider, see (2).
Conclusions. We have shown that single wall car-bon nanotube arrays might serve as directional detectorsalso for sub-GeV DM particles, if an appropriate externalelectric field is applied and electron recoils are studied.An appreciable anisotropic response, as large as A ⇠ 0.4in (3), is reached with a particular orientation orienta-tion of the target with respect to the DM wind. Sincethe proposed detection scheme does not require any pre-cise determination of the electron ejection angle and re-coil energy, the carbon nanotube array target could beintegrated and tested in a compact Hybrid Photodiodesystem — a technology already available — made blindto light. High target masses can be arranged within lim-ited volumes with respect to configurations proposing touse graphene planes.
The results presented are obtained starting from theconclusions reached by Hochberg et al. [2] on DM scatter-ing on graphene planes and adapted to the wrapped con-figuration of single wall carbon nanotubes. The fact that
3 with a coe�cient � = 115.8 A/m2 K�3.
carbon nanotubes, and interstices among them in the ar-ray, almost behave as empty channels is still an essentialfeature to obtain the results of the calculations describedhere. The mean free paths attainable in these configura-tions are definitely higher if compared to dense targetsas graphite or any crystal. We also observe that, in thedetection scheme proposed, di↵erently from [1], small ir-regularities in the geometry of nanotubes are inessential.For comparison with previous work, we present the
exclusion plot, see Fig. 3, which can be obtained withthe detection configuration here proposed. We performa full calculation including ⇡ and sp2� electrons. The
FIG. 3: We compare our results with those obtained byHochberg et al. [2]. Calculations are done including bothelectrons from ⇡�orbitals and from sp2�hybridized orbitals.The exposure of 1 kg⇥year is used.
latter figure summarizes the potentialities of the schemeproposed. They result to be very much comparable towhat found in [2], although with rather di↵erent appara-tus and practical realization. To conclude, we notice thatthe device here described might be used alternatively asa detector of heavier DM particles. Just by changing thedirection of the electric field, one could count positivecarbon ions recoiled out of and channeled by the carbonnanotubes (or within the interstices among them), as inthe original proposal [1] [3].Acknowledgements. We are very grateful to Yonit
Hochberg for several comments and suggestions on themanuscript and to Chris Tully for informative discus-sions. We also thank Maria Grazia Betti, Carlo Mari-ani and Francesco Mauri for several useful hints on thephysics of CNTs. We thank an anonymous referee forextremely useful comments and suggestions. G.C. ac-knowledges partial support from ERC Ideas ConsolidatorGrant CRYSBEAM G.A. n.615089.Appendix: DM-electron scattering. In this Ap-
pendix we report the essential formulae we have used toobtain the results in the text. We have adapted the ex-pressions in [2] to the configuration with CNTs.The M� DM mass needed to eject electrons from
graphene is about 3 MeV at the galactic escape velocity.In the �e� scattering process, part of the momentum is
PTOLEMY-G3 (arxiv:1606.08849)CNT arrays (arxiv:1706.02487)
1kg·year exposure
The Experiment
❖ Competitive sensitivity for MeV DM
• Comparable to PTOLEMY-G3

Francesco Pandolfi PTOLEMY Meeting, 27.11.18
Electron Detector: Silicon APD for Now
❖ Need to detect electrons with E ~ few keV
❖ First try will be with silicon APDs
• Know-how in Rome (CMS)
❖ Commercial APDs (Hamamatsu) designed for photons, not electrons
• Protective ceramic window
• Would absorb electrons
❖ Ordered window-less APDs
• And with reduced passivation layer
!12
4 Photodetectors CMS–ECAL TDR
108
APDs have a lower effective gain at these wavelengths. Consequently for the reverse APDs theeffective gain drops at wavelengths above 550 nm, reducing by a factor of four at 880 nm. Thischange in effective gain is shown in Fig. 4.4.
In APDs with this reverse structure the response to ionizing radiation is much smaller andto first order is proportional to the thickness of the p
+
layer in front of the amplification region. Itis typically between 2–4% compared to a standard PIN photodiode.
Fig. 4.1:
Schematic view of an APD with reverse structure. Light enters from the top via theSi
3
N
4
protection and the p
++
layer.
Fig. 4.2:
Calculation of the field distribution in an APD from EG&G. The field peaks at thep–n junction with more than 200 kV/cm.
Electric Field Profile (M=50)
0
50000
100000
150000
200000
250000
300000
0 50 100 150 200
Distance from the p++ layer [µm]
E [V
/cm
]
Francesco Pandolfi PTOLEMY Meeting, 27.11.18
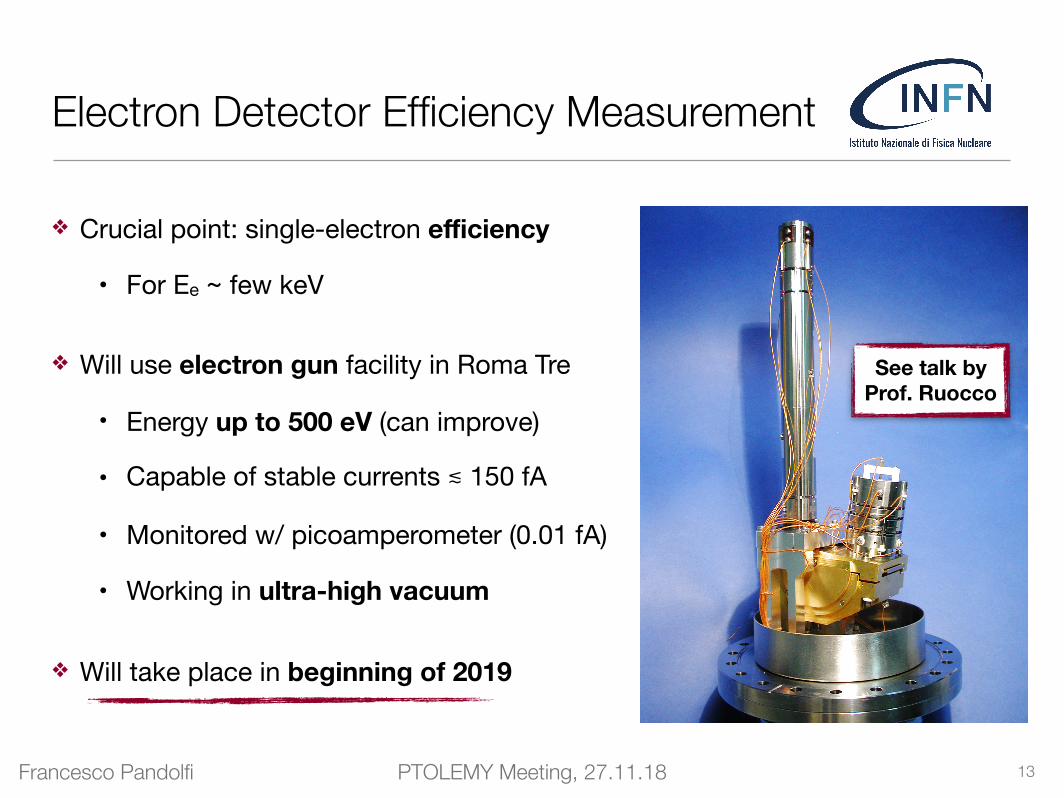
Electron Detector Efficiency Measurement
❖ Crucial point: single-electron efficiency
• For Ee ~ few keV
❖ Will use electron gun facility in Roma Tre
• Energy up to 500 eV (can improve)
• Capable of stable currents ≲ 150 fA
• Monitored w/ picoamperometer (0.01 fA)
• Working in ultra-high vacuum
❖ Will take place in beginning of 2019
!13
See talk by Prof. Ruocco

Francesco Pandolfi PTOLEMY Meeting, 27.11.18
First Step: Building a ‘Dark-PMTUV’
!14
DM ‘Wind’
UV Light
Dark-PMT
Dark-PMTUV
UV-
tran
spar
ent s
uppo
rt

Francesco Pandolfi PTOLEMY Meeting, 27.11.18
Dark-PMT: A Timeline
!15
November 2018 Order of customized silicon APDs
February 2019 Measurement of APD keV-electron efficiency
March-April 2019 Growth of CNTs on UV-transparent substrate (target: 300 µm)
Summer 2019 Assembly of Dark-PMTUV prototype (UV-transparent substrate)
Autumn 2019 Test Dark-PMTUV performance with UV lamp

Francesco Pandolfi PTOLEMY Meeting, 27.11.18
Conclusions
❖ Large (ton) mass detectors: no signal of heavy DM
• Approaching the neutrino ‘floor’
❖ There is a case for sub-GeV DM (eg SIMPs)
• And limits are much weaker: don’t need tons, could start with grams
❖ Carbon nanotubes: an interesting material
• ‘Hollow’ in one direction
❖ We propose to build a light DM detector based on arrays of CNTs
• Sensitive to direction of DM signal
❖ Working on having a ‘dark-PMT’ prototype by end of 2019
!16
Copyright © 2022 FDOKUMEN