StereoSelectivity of Human Serum Albumin to Enantiomeric and Isoelectronic Pollutants Dissected by...
18
Stereo-Selectivity of Human Serum Albumin to Enantiomeric and Isoelectronic Pollutants Dissected by Spectroscopy, Calorimetry and Bioinformatics Ejaz Ahmad 1 , Gulam Rabbani 1 , Nida Zaidi 1 , Saurabh Singh 2 , Mohd Rehan 3 , Mohd Moin Khan 1 , Shah Kamranur Rahman 1 , Zainuddin Quadri 1 , Mohd. Shadab 1 , Mohd Tashfeen Ashraf 4 , Naidu Subbarao 3 , Rajiv Bhat 2 , Rizwan Hasan Khan 1 * 1 Interdisciplinary Biotechnology Unit, Aligarh Muslim University, Aligarh, India, 2 School of Biotechnology, Jawaharlal Nehru University, New Delhi, India, 3 School of Computational and Integrative Sciences, Jawaharlal Nehru University, New Delhi, India, 4 School of Biotechnology, Gautam Buddha University, Greater Noida, India Abstract 1–naphthol (1N), 2–naphthol (2N) and 8–quinolinol (8H) are general water pollutants. 1N and 2N are the configurational enantiomers and 8H is isoelectronic to 1N and 2N. These pollutants when ingested are transported in the blood by proteins like human serum albumin (HSA). Binding of these pollutants to HSA has been explored to elucidate the specific selectivity of molecular recognition by this multiligand binding protein. The association constants (K b ) of these pollutants to HSA were moderate (10 4 –10 5 M 21 ). The proximity of the ligands to HSA is also revealed by their average binding distance, r, which is estimated to be in the range of 4.39–5.37 nm. The binding free energy (DG) in each case remains effectively the same for each site because of enthalpy–entropy compensation (EEC). The difference observed between DC p exp and DC p calc are suggested to be caused by binding–induced flexibility changes in the HSA. Efforts are also made to elaborate the differences observed in binding isotherms obtained through multiple approaches of calorimetry, spectroscopy and bioinformatics. We suggest that difference in dissociation constants of pollutants by calorimetry, spectroscopic and computational approaches could correspond to occurrence of different set of populations of pollutants having different molecular characteristics in ground state and excited state. Furthermore, our observation of enhanced binding of pollutants (2N and 8H) in the presence of hemin signifies that ligands like hemin may enhance the storage period of these pollutants in blood that may even facilitate the ill effects of these pollutants. Citation: Ahmad E, Rabbani G, Zaidi N, Singh S, Rehan M, et al. (2011) Stereo-Selectivity of Human Serum Albumin to Enantiomeric and Isoelectronic Pollutants Dissected by Spectroscopy, Calorimetry and Bioinformatics. PLoS ONE 6(11): e26186. doi:10.1371/journal.pone.0026186 Editor: Jo ¨ rg Langowski, German Cancer Research Center, Germany Received May 12, 2011; Accepted September 22, 2011; Published November 2, 2011 Copyright: ß 2011 Ahmad et al. This is an open-access article distributed under the terms of the Creative Commons Attribution License, which permits unrestricted use, distribution, and reproduction in any medium, provided the original author and source are credited. Funding: Financial assistance to E. Ahmad in the form of a Senior Research Fellowship was supported by the Council of Scientific and Industrial Research (CSIR), New Delhi, India. The funders had no role in study design, data collection and analysis, decision to publish, or preparation of the manuscript. Competing Interests: The authors have declared that no competing interests exist. * E-mail: [email protected] Introduction a–naphthol [1–naphthol (1N)], b–naphthol [2–naphthol (2N)] and 8–quinolinol [8–hydoxy quinoline (8H)] are non-persistent organic water pollutants. They have similar properties. They are sparingly soluble in water and exhibit antiseptic properties. One way in which naphthols differ from each other is the form of their crystals. 1N crystallizes in prisms and 2N in plates. Cellular presence of 1N causes depolymerization of spindle microtubules and apparent uncoupling of karyokinesis and cytokinesis in mitotic cells. Although at a much lower frequency, presence of 2N also causes similar configurations. 1N has been investigated as a mutagen and reproductive effector and has also been associated with reduced testosterone levels [1]. Naphthols are used in the synthesis of certain azo–dyes and antioxidants for rubbers and as indicators in chemical analyses. 8H is used as a metal chelating agent, in preparing antiseptics, deodorants, fungicides etc. Their accumulation in body causes cyanosis, liver damage, nephritis, circulatory collapse and even death. All these three pollutants are transported in blood by plasma proteins like human serum albumin (HSA). HSA is a 585 amino acid long heart-shape monomer comprising three structurally homologous domains each of which displays specific and functional characteristics. Each of these three domains is composed of sub- domains A and B providing flexibility to the protein molecule so that the protein can bind to a variety of ligands. HSA is responsible for the transport, storage and metabolism of many therapeutic drugs in the blood thereby restricting their free, active concentrations and therefore can significantly affect their pharmacokinetics and metabolism. Two distinct binding sites, commonly referred to as Sudlow site 1 and site 2, have been identified in HSA for various drugs [2]. Site 1 binds to bulky hydrophobic and heterocyclic molecules with a centrally located negative charge (e.g. warfarin, phenylbutazone). Site 2 binds to aromatic carboxylic acids with a negative charge at one end distal from the remaining hydrophobic structure (e.g. diazepam, ibuprofen). Binding of ligands to albumin alters the pattern and volume of distribution, lowers the rate of clearance, and increases the plasma half-life of the ligand. A detailed characterization of the protein’s binding property to different ligands is therefore necessary not only to understand its key physiological functions but also to understand its impact on ligand transport and delivery. PLoS ONE | www.plosone.org 1 November 2011 | Volume 6 | Issue 11 | e26186
-
Upload
independent -
Category
Documents
-
view
3 -
download
0
Transcript of StereoSelectivity of Human Serum Albumin to Enantiomeric and Isoelectronic Pollutants Dissected by...

Stereo-Selectivity of Human Serum Albumin toEnantiomeric and Isoelectronic Pollutants Dissected bySpectroscopy, Calorimetry and BioinformaticsEjaz Ahmad1, Gulam Rabbani1, Nida Zaidi1, Saurabh Singh2, Mohd Rehan3, Mohd Moin Khan1, Shah
Kamranur Rahman1, Zainuddin Quadri1, Mohd. Shadab1, Mohd Tashfeen Ashraf4, Naidu Subbarao3,
Rajiv Bhat2, Rizwan Hasan Khan1*
1 Interdisciplinary Biotechnology Unit, Aligarh Muslim University, Aligarh, India, 2 School of Biotechnology, Jawaharlal Nehru University, New Delhi, India, 3 School of
Computational and Integrative Sciences, Jawaharlal Nehru University, New Delhi, India, 4 School of Biotechnology, Gautam Buddha University, Greater Noida, India
Abstract
1–naphthol (1N), 2–naphthol (2N) and 8–quinolinol (8H) are general water pollutants. 1N and 2N are the configurationalenantiomers and 8H is isoelectronic to 1N and 2N. These pollutants when ingested are transported in the blood by proteinslike human serum albumin (HSA). Binding of these pollutants to HSA has been explored to elucidate the specific selectivityof molecular recognition by this multiligand binding protein. The association constants (Kb) of these pollutants to HSA weremoderate (104–105 M21). The proximity of the ligands to HSA is also revealed by their average binding distance, r, which isestimated to be in the range of 4.39–5.37 nm. The binding free energy (DG) in each case remains effectively the same foreach site because of enthalpy–entropy compensation (EEC). The difference observed between DCp
exp and DCpcalc are
suggested to be caused by binding–induced flexibility changes in the HSA. Efforts are also made to elaborate thedifferences observed in binding isotherms obtained through multiple approaches of calorimetry, spectroscopy andbioinformatics. We suggest that difference in dissociation constants of pollutants by calorimetry, spectroscopic andcomputational approaches could correspond to occurrence of different set of populations of pollutants having differentmolecular characteristics in ground state and excited state. Furthermore, our observation of enhanced binding of pollutants(2N and 8H) in the presence of hemin signifies that ligands like hemin may enhance the storage period of these pollutants inblood that may even facilitate the ill effects of these pollutants.
Citation: Ahmad E, Rabbani G, Zaidi N, Singh S, Rehan M, et al. (2011) Stereo-Selectivity of Human Serum Albumin to Enantiomeric and Isoelectronic PollutantsDissected by Spectroscopy, Calorimetry and Bioinformatics. PLoS ONE 6(11): e26186. doi:10.1371/journal.pone.0026186
Editor: Jorg Langowski, German Cancer Research Center, Germany
Received May 12, 2011; Accepted September 22, 2011; Published November 2, 2011
Copyright: ! 2011 Ahmad et al. This is an open-access article distributed under the terms of the Creative Commons Attribution License, which permitsunrestricted use, distribution, and reproduction in any medium, provided the original author and source are credited.
Funding: Financial assistance to E. Ahmad in the form of a Senior Research Fellowship was supported by the Council of Scientific and Industrial Research (CSIR),New Delhi, India. The funders had no role in study design, data collection and analysis, decision to publish, or preparation of the manuscript.
Competing Interests: The authors have declared that no competing interests exist.
* E-mail: [email protected]
Introduction
a–naphthol [1–naphthol (1N)], b–naphthol [2–naphthol (2N)]and 8–quinolinol [8–hydoxy quinoline (8H)] are non-persistentorganic water pollutants. They have similar properties. They aresparingly soluble in water and exhibit antiseptic properties. Oneway in which naphthols differ from each other is the form of theircrystals. 1N crystallizes in prisms and 2N in plates. Cellularpresence of 1N causes depolymerization of spindle microtubulesand apparent uncoupling of karyokinesis and cytokinesis in mitoticcells. Although at a much lower frequency, presence of 2N alsocauses similar configurations. 1N has been investigated as amutagen and reproductive effector and has also been associatedwith reduced testosterone levels [1]. Naphthols are used in thesynthesis of certain azo–dyes and antioxidants for rubbers and asindicators in chemical analyses. 8H is used as a metal chelatingagent, in preparing antiseptics, deodorants, fungicides etc. Theiraccumulation in body causes cyanosis, liver damage, nephritis,circulatory collapse and even death.
All these three pollutants are transported in blood by plasmaproteins like human serum albumin (HSA). HSA is a 585 amino
acid long heart-shape monomer comprising three structurallyhomologous domains each of which displays specific and functionalcharacteristics. Each of these three domains is composed of sub-domains A and B providing flexibility to the protein molecule so thatthe protein can bind to a variety of ligands. HSA is responsible forthe transport, storage and metabolism of many therapeutic drugs inthe blood thereby restricting their free, active concentrations andtherefore can significantly affect their pharmacokinetics andmetabolism. Two distinct binding sites, commonly referred to asSudlow site 1 and site 2, have been identified in HSA for variousdrugs [2]. Site 1 binds to bulky hydrophobic and heterocyclicmolecules with a centrally located negative charge (e.g. warfarin,phenylbutazone). Site 2 binds to aromatic carboxylic acids with anegative charge at one end distal from the remaining hydrophobicstructure (e.g. diazepam, ibuprofen). Binding of ligands to albuminalters the pattern and volume of distribution, lowers the rate ofclearance, and increases the plasma half-life of the ligand. A detailedcharacterization of the protein’s binding property to differentligands is therefore necessary not only to understand its keyphysiological functions but also to understand its impact on ligandtransport and delivery.
PLoS ONE | www.plosone.org 1 November 2011 | Volume 6 | Issue 11 | e26186
Here we have examined the protein-ligand associations of HSAto the pollutants (1N, 2N and 8H) by utilizing spectroscopictechniques, calorimetry and computational method of moleculardocking. With 1N and 2N being the configurational enantiomerswith a difference in the position of –OH group and 8H beingisoelectronic to 1N and 2N (–CH– of 1N is replaced by –N– in8H), the objective of this study is to elucidate the specific selectivityof molecular recognition by a multiligand binding protein.Moreover, the differences obtained in the molecular-interactiondata by multiple techniques have been dissected to understand andexplore intricacies of protein-ligand interaction.
Materials and Methods
MaterialsEssentially fatty acid free human serum albumin (A1887), 1N
(N2780) and 2N (185507) were product of Sigma-Aldrich, USAwhereas 8H (24874) was procured from Qualigens, India. Allother reagents and buffer compounds used were of analyticalgrade.
Preparation of solutionsAll experiments were carried out in 20 mM Tris–HCl pH 7.4
buffer. HSA was used without further purification as its purity waschecked by SDS–PAGE at high concentration. HSA was dialyzedproperly against respective buffer. Its concentration was deter-mined spectrophotometerically by using E1%
280nm = 5.3. Pollutantstocks were stored in dark to minimize photolytic degradation.
UV-Visible Spectroscopic measurementsAbsorption measurements were performed at 37uC on Perkin-
Elmer Lambda 25 double beam UV–Vis spectrophotometerattached with peltier temperature programmer-1 (PTP–1). A fixedconcentration of HSA (12 mM) with increasing concentrations ofpollutants from 0 to 600 mM (molar ratio of P:L = 1:50) wereadded and the pollutant blank of equal concentrations weresubtracted to the protein-pollutant spectra. From these data, wecan determine the dissociation constant (Kd) for the HSA–pollutant interaction according to the following Equation [3]:
1
DA~
Kd
DA?½S"z
1
DA?ð1Þ
where DA = A-Ao (for 1N and 2N) and DA = Ao-A (for 8H); A andAo were the absorption of HSA at 280 nm in presence andabsence of pollutants respectively; [S] is the concentration of thesepollutants; DA‘ is the change in the absorption where protein wascompletely saturated by the ligands. The association constants (Kb)were derived from the inverse of dissociation constant (Kd). Thedegree of cooperativity (h) for the HSA–pollutant binding systemswere obtained from the Hill Equation:
logDA
DA?{DA
! "~hlog½S"zlogKb ð2Þ
in which the intercept (logKb) and the value of DA‘ werecalculated and used from the above Equation 1. The change infree energy was calculated from:
DG0~{RTlnKb ð3Þ
where R (1.987 cal.mol21.K21) is the gas constant.
Steady state fluorescence quenching measurementsSchimadzu 5301PC fluorescence spectrophotometer equipped
with a constant temperature holder and the temperatures (25, 37and 45uC) were maintained by a constant temperature watercirculator (Julabo Eyela). The excitation and emission slits wereboth set at 3 and 5 nm respectively. The titration of the pollutants(0–100 mM) to 2 mM HSA solution was carried out in a dual-pathlength fluorescence cuvette (1063.5 mm). The shorter path lengthwas oriented towards the emission side. Such a low concentrationof HSA (2 mM) with absorbance value of ,0.07 was usedthroughout the fluorescence experiments to minimize the innerfilter effect. Intrinsic fluorescence was measured by exciting at295 nm to probe exclusively the tryptophan only. The emissionspectra were recorded in the range of 300–500 nm and the datawere plotted at 320 nm because no emission of pollutants occurredat 320 nm if excited at 295 nm. The decrease in fluorescenceintensity at 320 nm was analyzed according to the Stern–VolmerEquation [4]:
Fo
F~Ksv½Q"z1 ð4Þ
where Fo and F were the fluorescence intensities in absence andpresence of quencher (pollutants), Ksv is the Stern–Volmerquenching constant and:
Ksv~Kqto ð5Þ
where Kq is the bimolecular rate constant of the quenchingreaction and t0 the average integral fluorescence life time oftryptophan which is ,4.3161029 sec. Binding constants andbinding sites were obtained from [5]:
logFo
F{1
# $~logKbznlog½Q" ð6Þ
where, Kb is the binding constant and n is number of binding sites.The change in free energy was calculated from Equation 3whereas change in enthalpy and entropy at different temperatureswere analyzed from van’t Hoff Equation:
ln Kb~{DH0
RTz
DS0
Rð7Þ
and second law of thermodynamics:
DG0~DH0{TDS0 ð8Þ
where DGu is free energy change, DHu is the enthalpy change, DSuis entropy change.
For the determination of binding sites, titration of pollutants toHSA in absence and presence of site markers (probes) wereperformed as a competitive experiment. 2 mM HSA was incubatedwith 4 mM site markers (1:2) to saturate completely thecorresponding sites. Pollutants were gradually added to theHSA–site markers. The data were analyzed in the same way asdiscussed above.
Tryptophan fluorescence resonance energy transfer(FRET) to the pollutants
The fluorescence spectra of HSA (2 mM) and absorption spectraof pollutants (2 mM) between 300 to 400 nm were scanned in
HSA-Pollutant Interaction
PLoS ONE | www.plosone.org 2 November 2011 | Volume 6 | Issue 11 | e26186

similar way as given in method sections ‘Fluorescence Quenching’and ‘UV-Visible’ experiments at 37uC. If the emission spectrum ofdonor (W214 of HSA) significantly overlap with the absorptionspectrum of acceptor (1N, 2N and 8H), these donor-acceptor pairswill considered in Forster distance and then we could ascertain thepossibility of energy transfer [6]. Therefore, the degree of energytransfer depends upon the area of overlap and the distancebetween these donor-acceptor molecules. The efficiency of energytransfer (E) is calculated using the following Equation [7]:
E~1{F
Fo~
R6o
R6ozr6
ð9Þ
where Fo and F were the fluorescence intensities of HSA in absenceand presence of pollutants respectively; r is the distance betweendonor and acceptor and Ro is the critical distance at which transferefficiency equals to 50% which can be calculated from the followingEquation:
R6o~8:79|10{25K2n{4QJ ð10Þ
where K2 is the orientation factor related to the geometry of the donorand acceptor of dipoles, n is the refractive index of the medium, Q isthe fluorescence quantum yield of the donor in absence of acceptor;and J expresses the degree of spectral overlap between the donoremission and the acceptor absorption which can be evaluated byintegrating the overlap spectral area in between 300 to 400 nm fromfollowing Equation:
J~
Ð?o F(l)e(l)l4dlÐ?
o F(l)dlð11Þ
where F(l) is the fluorescence intensity of the donor at wavelengthrange l which is dimensionless, and e(l) is the molar absorptivity(extinction coefficient) of the acceptor at wavelength l in M21 cm21.In our present study K2, Q and n were taken as 2/3, 0.118 and 1.336respectively [8].
Isothermal titration calorimetryThe calorimetric measurements were carried out on a titration
calorimeter from Microcal (Northampton, MA) at 15, 25, 37 and45uC in 20 mM Tris–HCl buffer pH 7.4. The solutions of HSAand pollutants were filtered and degassed properly on Thermovacimmediately before titrations. To fill the cell, the titrand was filled
in a syringe and the syringe was tapped gently with the needlepointing upward and slightly working the plunger up and down toremove any trapped air bubble in the syringe. Now, the solution of24.4 mM HSA in the 1.44 ml sample cell was titrated with 3 mMpollutants (1N, 2N and 8H) using a 288 ml automatic rotatingsyringe stirring at 307 rpm. Titration experiments consisted of 36injections of 8 ml each of duration 20 s with 2 s filter period and180 s spacing between each injection. The analog input range was+/21.25 V and the reference power was set at 20 mcal s21. Theheat associated with each injection was observed as a peak thatcorresponded to the power required to keep the sample andreference cells at identical temperatures. Control experiments wereperformed by titrating pollutants into the same buffer to obtain theheats of ligand dilution. The net enthalpy for each HSA–pollutantassociation was determined by subtraction of the component heatsof dilution from each injection heat pulse. Integration with respectto time of the heats produced per serial injection of pollu-tant yielded the corresponding binding isotherm. The bindingisotherms were best fitted for sequential binding sites [9] by usingOrigin 7.0 provided with the MicroCal instrument. The least x2
values or lowest errors were obtained to a two site sequentialbinding model from Marquardt minimization algorithm [10] toobtain best fitting values until constant x2 values were achieved fordetermination of the association constants (Kb values), stoichiom-etry (n) and enthalpy change (DH). Other thermodynamicparameters such as change in free energy (DG) and change inentropy (DS) were obtained from Equations 3 and 8. Please gothrough Supplementary Materials S1. The temperaturedependence of enthalpy change of molecular association contrib-utes to the change in specific heat capacity [11]:
DCexpP ~
DH
Tð12Þ
Molecular Docking StudiesThe PDB structure 1AO6 of HSA was taken for molecular
docking of phenolic compounds 1N, 2N and 8H to site 1 and site 2of HSA. The complexes of HSA with site 1 markers (Warfarin,1H9Z; Phenylbutazone, 2BXC) and with site 2 markers (Diazepam,2BXF; Ibuprofen, 2BXG) were downloaded from BrookhavenProtein Databank. The residues falling within 5 A of the above siteswere extracted and combined to define the binding site residues.From Pubchem database the SDF format for 3D structures of 1N(CID: 7005), 2N (CID: 8663) and 8H (CID: 1923) weredownloaded. Molecular docking simulations of all the three
Figure 1. Absorption spectra of HSA gradually titrated with pollutants (A) 1N, (B) 2N, and (C) 8H at 376C. HSA–pollutant spectra weresubtracted from the spectra of equal amount of pollutants. HSA = 12 mM and 1N = 2N = 8H = 0 to 600 mM.doi:10.1371/journal.pone.0026186.g001
HSA-Pollutant Interaction
PLoS ONE | www.plosone.org 3 November 2011 | Volume 6 | Issue 11 | e26186

phenolic compounds were performed with Autodock4.0 program[12]. Autodock uses Lamarkian genetic algorithm to calculate thepossible conformations of the ligand that binds to the protein.Gasteiger charges were added to the ligands. Polar hydrogenatoms, Kollman charges were merged to the protein. A Grid of60660660 A with spacing of 0.375 A was generated, covering allthe active site residues. For docking simulations the parameterswere set to 10 GA runs terminating after a maximum of 25,00,000 energy evaluations, population size was set to150 andcrossover rate of 0.8. For flexible docking, the above parameterswere same, but the residues involve in rigid docking as well assome other important neighboring residues of binding sites wereset to flexible. For further analysis, the conformer with the lowestbinding energy with best fitness score was used. The binding
energies of docked molecules were also calculated using X-score[13] to cross check the values obtained from Autodock4.0program. The hydrogen bonding and hydrophobic interactionsbetween ligand and protein were calculated using LigPlot [14].PyMol version 0.99 [15] and chimera version 1.3 [16] were usedfor visualization. Differences in accessible surface area (ASA) ofprotein before and after ligand complexations were calculatedfrom NACCESS version 2.1.1 [17]. The change in ASA forresidue, X was calculated from the Equation:
DASAX~ASA(HSA{pollutant)X{ASA(HSA)X ð13Þ
Upon pollutant interaction if a residue lost more than 10 A2 of itsASA, it was considered as being involved in the interaction [18].
Figure 2. (A) Plot of 1/DA (at 280 nm) against 1/[S] and (B) Hill plot of log [DA/(DA‘-DA)] vs log [Pollutant] at 376C. HSA = 12 mMand1N = 2N = 8H = 0 to 60 mM.doi:10.1371/journal.pone.0026186.g002
HSA-Pollutant Interaction
PLoS ONE | www.plosone.org 4 November 2011 | Volume 6 | Issue 11 | e26186
The ITC obtained DCexpP , values were further compared with
the calculated values (DCcalcP ,) from the change in non-polar and
polar accessible surface area (DASA) of HSA upon interaction withpollutants [19]:
DCcalcP ~0:45(DASA)Nonpolar{0:26(DASA)Polar ð14Þ
Results
UV-visible absorption spectroscopyIn UV–absorption spectrum, the far–UV region corresponds to
secondary structures whereas near–UV region is related to the
tertiary structures of the protein. Hence, change in absorption ofprotein in UV region can be used to investigate ligand inducedalterations in protein and to estimate the extent of protein-ligandinteraction. The UV spectral changes as observed upon pollutanttitration to HSA are shown in Figure 1. Upon interaction witheach pollutant the intensity of first peak at 220 nm was found todecrease gradually. Presence of 1N at higher concentration leadsto formation of two new distinguishable peaks. Presence of 2Nleads to formation of two clear independent peaks (at 215 and238 nm) even at lower concentrations. Presence of 8H howeverwas totally ineffective in generating new peaks. The intensity ofHSA spectrum in near–UV region was increased with a slight redshift in the presence of 1N and 2N. Unlike these two compounds,presence of 8H decreased the intensity in the region around280 nm and increased the intensity in the region from 244 to274 nm with a clear observation of two isobestic points. Such typeof changes in far– and near–UV regions implied that both thetertiary and secondary structures of HSA were altered uponinteraction with pollutants. Dissociation constants (Kd) as obtainedfrom the slope of plot 1/DA vs 1/[S] for HSA–1N, HSA–2N andHSA–8H systems (Figure 2A) were estimated to be 9.6661025 M,6.6961025 M and 5061025 M respectively. Binding constants(Kb) for the above systems were calculated from the obtainedvalues of Kd (Table 2). The observed values of DA‘ for HSA–1N,HSA–2N and HSA–8H systems were 0.10738, 0.13399 and0.1727 respectively which indicated that the highest equivalence isachieved at the molar ratios of 1:8 for HSA to 1N, 1:11 for HSA to2N and 1:40 for HSA to 8H (Table 2). The slope of log [DA/(DA‘-DA)] vs log [S] plot gives the value of Hill coefficient (h) as ameasure of or degree of cooperativity (Figure 2B) in which DA‘was obtained from Figure 2A. For binding of a ligand at more thanone site to a protein, the coefficient can also be deduced as theminimum number of interacting binding sites for ligands. The hvalues approaching to unity implies that HSA–pollutant interac-tions were non–cooperative.
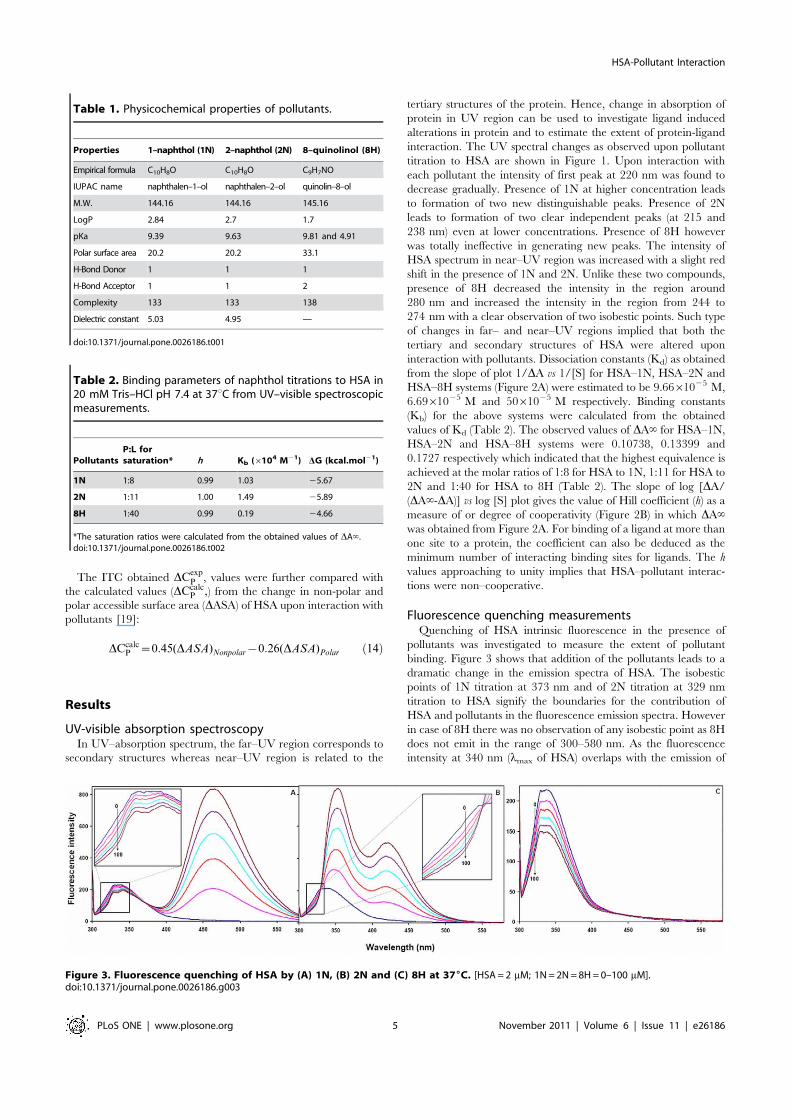
Fluorescence quenching measurementsQuenching of HSA intrinsic fluorescence in the presence of
pollutants was investigated to measure the extent of pollutantbinding. Figure 3 shows that addition of the pollutants leads to adramatic change in the emission spectra of HSA. The isobesticpoints of 1N titration at 373 nm and of 2N titration at 329 nmtitration to HSA signify the boundaries for the contribution ofHSA and pollutants in the fluorescence emission spectra. Howeverin case of 8H there was no observation of any isobestic point as 8Hdoes not emit in the range of 300–580 nm. As the fluorescenceintensity at 340 nm (lmax of HSA) overlaps with the emission of
Table 1. Physicochemical properties of pollutants.
Properties 1–naphthol (1N) 2–naphthol (2N) 8–quinolinol (8H)
Empirical formula C10H8O C10H8O C9H7NO
IUPAC name naphthalen–1–ol naphthalen–2–ol quinolin–8–ol
M.W. 144.16 144.16 145.16
LogP 2.84 2.7 1.7
pKa 9.39 9.63 9.81 and 4.91
Polar surface area 20.2 20.2 33.1
H-Bond Donor 1 1 1
H-Bond Acceptor 1 1 2
Complexity 133 133 138
Dielectric constant 5.03 4.95 —
doi:10.1371/journal.pone.0026186.t001
Table 2. Binding parameters of naphthol titrations to HSA in20 mM Tris–HCl pH 7.4 at 37uC from UV–visible spectroscopicmeasurements.
PollutantsP:L forsaturation* h Kb (6104 M21) DG (kcal.mol21)
1N 1:8 0.99 1.03 25.67
2N 1:11 1.00 1.49 25.89
8H 1:40 0.99 0.19 24.66
*The saturation ratios were calculated from the obtained values of DA‘.doi:10.1371/journal.pone.0026186.t002
Figure 3. Fluorescence quenching of HSA by (A) 1N, (B) 2N and (C) 8H at 376C. [HSA = 2 mM; 1N = 2N = 8H = 0–100 mM].doi:10.1371/journal.pone.0026186.g003
HSA-Pollutant Interaction
PLoS ONE | www.plosone.org 5 November 2011 | Volume 6 | Issue 11 | e26186
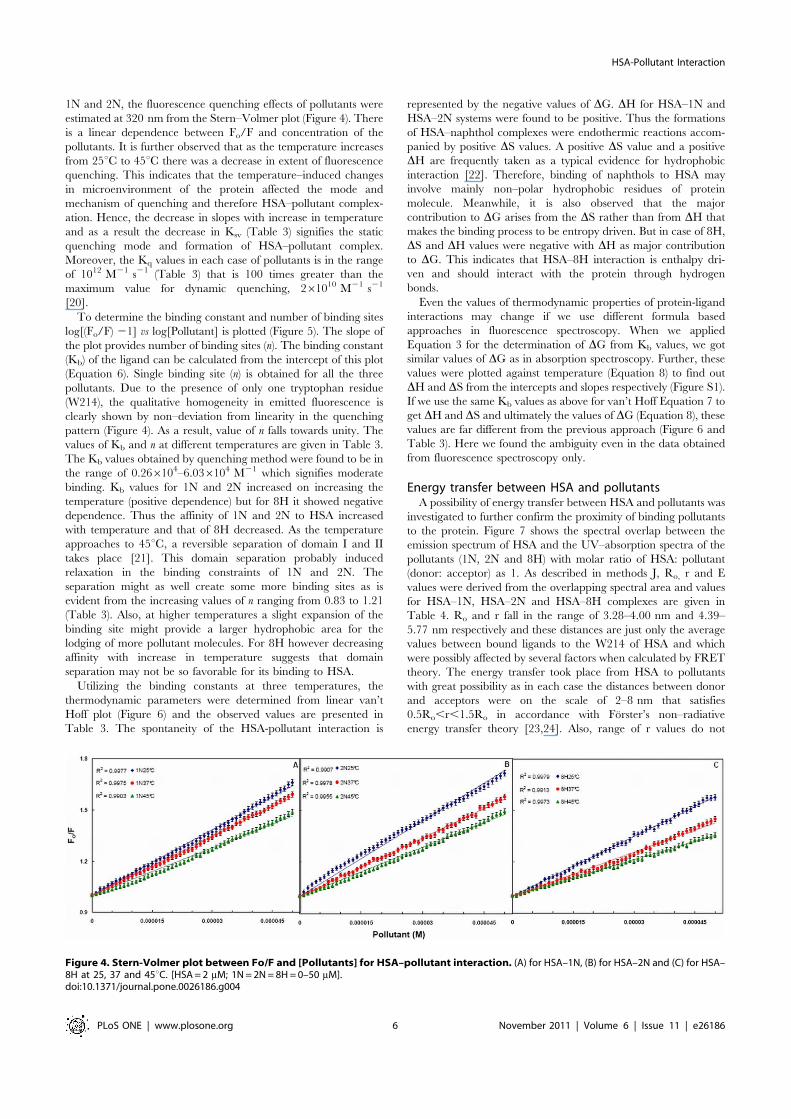
1N and 2N, the fluorescence quenching effects of pollutants wereestimated at 320 nm from the Stern–Volmer plot (Figure 4). Thereis a linear dependence between Fo/F and concentration of thepollutants. It is further observed that as the temperature increasesfrom 25uC to 45uC there was a decrease in extent of fluorescencequenching. This indicates that the temperature–induced changesin microenvironment of the protein affected the mode andmechanism of quenching and therefore HSA–pollutant complex-ation. Hence, the decrease in slopes with increase in temperatureand as a result the decrease in Ksv (Table 3) signifies the staticquenching mode and formation of HSA–pollutant complex.Moreover, the Kq values in each case of pollutants is in the rangeof 1012 M21 s21 (Table 3) that is 100 times greater than themaximum value for dynamic quenching, 261010 M21 s21
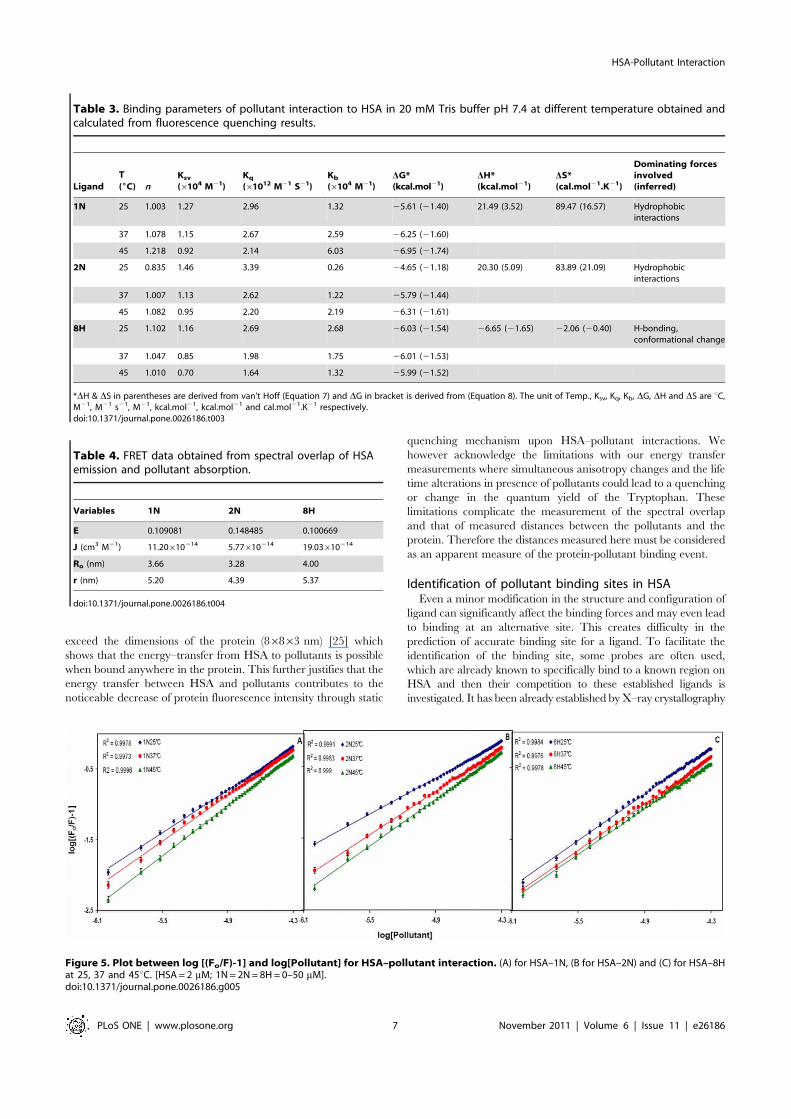
[20].To determine the binding constant and number of binding sites
log[(Fo/F) 21] vs log[Pollutant] is plotted (Figure 5). The slope ofthe plot provides number of binding sites (n). The binding constant(Kb) of the ligand can be calculated from the intercept of this plot(Equation 6). Single binding site (n) is obtained for all the threepollutants. Due to the presence of only one tryptophan residue(W214), the qualitative homogeneity in emitted fluorescence isclearly shown by non–deviation from linearity in the quenchingpattern (Figure 4). As a result, value of n falls towards unity. Thevalues of Kb and n at different temperatures are given in Table 3.The Kb values obtained by quenching method were found to be inthe range of 0.266104–6.036104 M21 which signifies moderatebinding. Kb values for 1N and 2N increased on increasing thetemperature (positive dependence) but for 8H it showed negativedependence. Thus the affinity of 1N and 2N to HSA increasedwith temperature and that of 8H decreased. As the temperatureapproaches to 45uC, a reversible separation of domain I and IItakes place [21]. This domain separation probably inducedrelaxation in the binding constraints of 1N and 2N. Theseparation might as well create some more binding sites as isevident from the increasing values of n ranging from 0.83 to 1.21(Table 3). Also, at higher temperatures a slight expansion of thebinding site might provide a larger hydrophobic area for thelodging of more pollutant molecules. For 8H however decreasingaffinity with increase in temperature suggests that domainseparation may not be so favorable for its binding to HSA.
Utilizing the binding constants at three temperatures, thethermodynamic parameters were determined from linear van’tHoff plot (Figure 6) and the observed values are presented inTable 3. The spontaneity of the HSA-pollutant interaction is
represented by the negative values of DG. DH for HSA–1N andHSA–2N systems were found to be positive. Thus the formationsof HSA–naphthol complexes were endothermic reactions accom-panied by positive DS values. A positive DS value and a positiveDH are frequently taken as a typical evidence for hydrophobicinteraction [22]. Therefore, binding of naphthols to HSA mayinvolve mainly non–polar hydrophobic residues of proteinmolecule. Meanwhile, it is also observed that the majorcontribution to DG arises from the DS rather than from DH thatmakes the binding process to be entropy driven. But in case of 8H,DS and DH values were negative with DH as major contributionto DG. This indicates that HSA–8H interaction is enthalpy dri-ven and should interact with the protein through hydrogenbonds.
Even the values of thermodynamic properties of protein-ligandinteractions may change if we use different formula basedapproaches in fluorescence spectroscopy. When we appliedEquation 3 for the determination of DG from Kb values, we gotsimilar values of DG as in absorption spectroscopy. Further, thesevalues were plotted against temperature (Equation 8) to find outDH and DS from the intercepts and slopes respectively (Figure S1).If we use the same Kb values as above for van’t Hoff Equation 7 toget DH and DS and ultimately the values of DG (Equation 8), thesevalues are far different from the previous approach (Figure 6 andTable 3). Here we found the ambiguity even in the data obtainedfrom fluorescence spectroscopy only.
Energy transfer between HSA and pollutantsA possibility of energy transfer between HSA and pollutants was
investigated to further confirm the proximity of binding pollutantsto the protein. Figure 7 shows the spectral overlap between theemission spectrum of HSA and the UV–absorption spectra of thepollutants (1N, 2N and 8H) with molar ratio of HSA: pollutant(donor: acceptor) as 1. As described in methods J, Ro, r and Evalues were derived from the overlapping spectral area and valuesfor HSA–1N, HSA–2N and HSA–8H complexes are given inTable 4. Ro and r fall in the range of 3.28–4.00 nm and 4.39–5.77 nm respectively and these distances are just only the averagevalues between bound ligands to the W214 of HSA and whichwere possibly affected by several factors when calculated by FRETtheory. The energy transfer took place from HSA to pollutantswith great possibility as in each case the distances between donorand acceptors were on the scale of 2–8 nm that satisfies0.5Ro,r,1.5Ro in accordance with Forster’s non–radiativeenergy transfer theory [23,24]. Also, range of r values do not
Figure 4. Stern-Volmer plot between Fo/F and [Pollutants] for HSA–pollutant interaction. (A) for HSA–1N, (B) for HSA–2N and (C) for HSA–8H at 25, 37 and 45uC. [HSA = 2 mM; 1N = 2N = 8H = 0–50 mM].doi:10.1371/journal.pone.0026186.g004
HSA-Pollutant Interaction
PLoS ONE | www.plosone.org 6 November 2011 | Volume 6 | Issue 11 | e26186
exceed the dimensions of the protein (86863 nm) [25] whichshows that the energy–transfer from HSA to pollutants is possiblewhen bound anywhere in the protein. This further justifies that theenergy transfer between HSA and pollutants contributes to thenoticeable decrease of protein fluorescence intensity through static
quenching mechanism upon HSA–pollutant interactions. Wehowever acknowledge the limitations with our energy transfermeasurements where simultaneous anisotropy changes and the lifetime alterations in presence of pollutants could lead to a quenchingor change in the quantum yield of the Tryptophan. Theselimitations complicate the measurement of the spectral overlapand that of measured distances between the pollutants and theprotein. Therefore the distances measured here must be consideredas an apparent measure of the protein-pollutant binding event.
Identification of pollutant binding sites in HSAEven a minor modification in the structure and configuration of
ligand can significantly affect the binding forces and may even leadto binding at an alternative site. This creates difficulty in theprediction of accurate binding site for a ligand. To facilitate theidentification of the binding site, some probes are often used,which are already known to specifically bind to a known region onHSA and then their competition to these established ligands isinvestigated. It has been already established by X–ray crystallography
Table 3. Binding parameters of pollutant interaction to HSA in 20 mM Tris buffer pH 7.4 at different temperature obtained andcalculated from fluorescence quenching results.
LigandT(6C) n
Ksv
(6104 M21)Kq
(61012 M21 S21)Kb
(6104 M21)DG*(kcal.mol21)
DH*(kcal.mol21)
DS*(cal.mol21.K21)
Dominating forcesinvolved(inferred)
1N 25 1.003 1.27 2.96 1.32 25.61 (21.40) 21.49 (3.52) 89.47 (16.57) Hydrophobicinteractions
37 1.078 1.15 2.67 2.59 26.25 (21.60)
45 1.218 0.92 2.14 6.03 26.95 (21.74)
2N 25 0.835 1.46 3.39 0.26 24.65 (21.18) 20.30 (5.09) 83.89 (21.09) Hydrophobicinteractions
37 1.007 1.13 2.62 1.22 25.79 (21.44)
45 1.082 0.95 2.20 2.19 26.31 (21.61)
8H 25 1.102 1.16 2.69 2.68 26.03 (21.54) 26.65 (21.65) 22.06 (20.40) H-bonding,conformational change
37 1.047 0.85 1.98 1.75 26.01 (21.53)
45 1.010 0.70 1.64 1.32 25.99 (21.52)
*DH & DS in parentheses are derived from van’t Hoff (Equation 7) and DG in bracket is derived from (Equation 8). The unit of Temp., Ksv, Kq, Kb, DG, DH and DS are uC,M21, M21 s21, M21, kcal.mol21, kcal.mol21 and cal.mol21.K21 respectively.doi:10.1371/journal.pone.0026186.t003
Figure 5. Plot between log [(Fo/F)-1] and log[Pollutant] for HSA–pollutant interaction. (A) for HSA–1N, (B for HSA–2N) and (C) for HSA–8Hat 25, 37 and 45uC. [HSA = 2 mM; 1N = 2N = 8H = 0–50 mM].doi:10.1371/journal.pone.0026186.g005
Table 4. FRET data obtained from spectral overlap of HSAemission and pollutant absorption.
Variables 1N 2N 8H
E 0.109081 0.148485 0.100669
J (cm3 M21) 11.20610214 5.77610214 19.03610214
Ro (nm) 3.66 3.28 4.00
r (nm) 5.20 4.39 5.37
doi:10.1371/journal.pone.0026186.t004
HSA-Pollutant Interaction
PLoS ONE | www.plosone.org 7 November 2011 | Volume 6 | Issue 11 | e26186
studies that hemin is probe for subdomain IB [26], bilirubin is probefor the region between subdomain IB & IIA [27], warfarin is probefor subdomain IIA or Sudlow site 1 [28] and diazepam is probe forsubdomain IIIA or Sudlow site 2 [29]. Experiments of pollutantsbinding competitively to HSA were performed by pre–saturating theprotein molecule with hemin, bilirubin, warfarin and diazepam. Inorder to compare the effect of site markers on HSA–pollutantsystems, the emitted fluorescence intensity data in the absence andpresence of probes were plotted using Stern–Volmer Equation(Figure 8) and the results are summarized in Table 5. The decrease in
fluorescence quenching by 1N, 2N and 8H in presence of warfarinand diazepam show that all these three pollutants compete withwarfarin and diazepam. This suggests that these ligands bind tosubdomain IIA in the Sudlow site 1 and to subdomain IIIA in Sudlowsite 2, the respective binding sites of warfarin and diazepam.
However the presence of hemin and that of bilirubin showpositive heterotropic cooperativity or allosteric activation forbinding of 1N. This implies that albumin on interaction with theseprobes tends to have increased binding of 1N. This alsodemonstrates the non–occupancy of 1N to the subdomain IB and
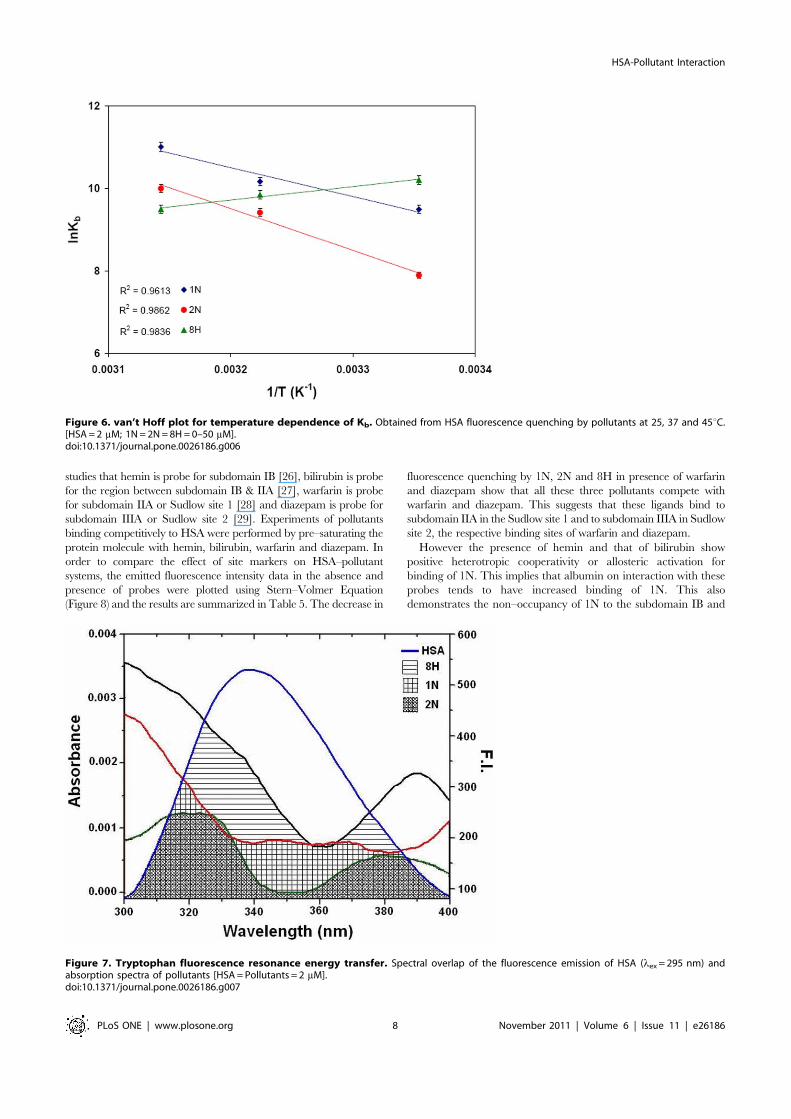
Figure 6. van’t Hoff plot for temperature dependence of Kb. Obtained from HSA fluorescence quenching by pollutants at 25, 37 and 45uC.[HSA = 2 mM; 1N = 2N = 8H = 0–50 mM].doi:10.1371/journal.pone.0026186.g006
Figure 7. Tryptophan fluorescence resonance energy transfer. Spectral overlap of the fluorescence emission of HSA (lex = 295 nm) andabsorption spectra of pollutants [HSA = Pollutants = 2 mM].doi:10.1371/journal.pone.0026186.g007
HSA-Pollutant Interaction
PLoS ONE | www.plosone.org 8 November 2011 | Volume 6 | Issue 11 | e26186

between subdomain IB & IIA, respective sites for hemin andbilirubin. The observed increase in binding of 1N further establishconformational alterations in albumin as binding of one ligandinfluences binding of the other. These allosteric effects were likely toresult from conformational changes in protein with partiallyoverlapping binding sites. Hence, the allosteric effects of hemin aswell as bilirubin site on 1N binding site may also imply the sharing ofa common face among these sites. This is in accordance with thework of Droge et al. [30] where binding of site 2 marker increases thechange in enthalpy for interaction of site 1 marker.
The tryptophan (W214) emissions of HSA–2N and HSA–8Hsystems in absence and presence of bilirubin were almost identicalbut in presence of hemin it resembled to HSA–1N system. Hereonly hemin induced conformational changes were effective in theenhancement of 2N and 8H binding to the HSA. Thus, ligands likehemin may prolong the storage period of the three pollutants inblood and facilitate in maximizing the effects of these pollutants onthe organisms.
Calorimetric investigation of HSA–pollutant associationStudies using isothermal titration calorimeter were carried
out in order to further investigate the thermodynamics ofHSA–pollutant interactions (Figure 9). Temperature dependenceof protein–ligand interactions were monitored at 15, 25, 37 and45uC. The results are summarized in Table 6. It is observed thatthe order of association constants (Kb) for HSA–pollutant complexformation is 2N.1N.8H and 1N.8H.2N at site1 and site2respectively. DG, DH and DS for complex formation are plotted asa function of temperature (Figure 10). The negative values of theinteraction free energy change (DG) in each case of HSA–pollutantassociation reveal that binding occurs spontaneously. The negativeDG value directly relates to the binding affinity and the stability ofcomplex. Except for 1N and 8H binding at site 1, both the bindingenthalpy and binding entropy were found to be negative. This is ausual observation in protein-ligand interaction [22] as a favorablebinding enthalpy essentially results in greater entropic constraintleading to more unfavorable contribution to binding free energy.
Figure 8. Competative binding of (A) 1N, (B) 2N and (C) 8H to HSA in the presence of site markers at 356C. [HSA = 2 mM; sitemarkers = 4 mM; 1N = 2N = 8H = 0–50 mM].doi:10.1371/journal.pone.0026186.g008
Table 5. The competitive experiments of HSA–pollutant system with different site markers.
CategorySiteMarkers Probes for
Binding Constants(M21)$
Inhibition of Pollutantbinding by these probes*
Enhancement ofPollutant binding bythese probes#
Non-drugs Hemin Subdomain I (IB) 1.16108 1N (0%) 1N (80%)
2N (0%) 2N (40%)
8H (0%) 8H (50%)
Bilirubin b/w Subdomain IB & IIA 9.56107 1N (0%) 1N (35%)
2N (0%) 2N (0%)
8H (0%) 8H (0%)
Drugs Warfarin Subdomain IIA (Sudlow site 1) 3.36105 1N (30%) 1N (0%)
2N (70%) 2N (0%)
8H (50%) 8H (0%)
Diazepam Subdomain IIIA (Sudlow site 2) 3.86105 1N (10%) 1N (0%)
2N (10%) 2N (0%)
8H (45%) 8H (0%)
$Binding constants of these probes to HSA as taken from other reported studies; hemin [46], bilirubin [47], warfarin [48] and diazepam [49].*1N/2N/8H mediated W214 fluorescence quenching was inhibited by these site markers up to this %.#1N/2N/8H mediated W214 fluorescence quenching was enhanced by these site markers up to this %.doi:10.1371/journal.pone.0026186.t005
HSA-Pollutant Interaction
PLoS ONE | www.plosone.org 9 November 2011 | Volume 6 | Issue 11 | e26186
Though the binding enthalpies and entropies of 1N, 2N and 8H toHSA interaction at the two sites differ, their binding free energychanges (DG) remain effectively the same. This is because ofenthalpy–entropy compensation (EEC) where changes in thebinding enthalpy are well compensated by changes in the bindingentropy. The protein–ligand interaction at site 2, (Figure 10 (B),Table 6), binding enthalpy and entropy show greater variationthan the total free energy which implies significant EEC at site 2[31].
Except for 8H binding at site 1, the negative enthalpy ofreaction was observed to increase with increase in temperaturethat suggests that the interactions were enthalpy-driven. Howeverat higher temperatures the HSA–pollutant complexation, exceptfor binding of 8H at site 1, is shifted towards entropically favoredassociation. It is possible that larger entropy of water at subdomainIIA and a greater hydrophobic character of 8H could beresponsible for entropically-driven interaction of 8H at site 1.Also, binding of 1N at site 1 is observed to have a peculiartransition as a function of temperature (Figure 10A). Its associationto HSA at ,34uC (TS) is totally driven by enthalpy as entropyapproaches zero. In all the other cases of HSA–pollutantinteraction the TS is below 15uC. Also, temperature at whichthe enthalpy contribution becomes negligible (TH) falls below15uC in all cases of the present study.
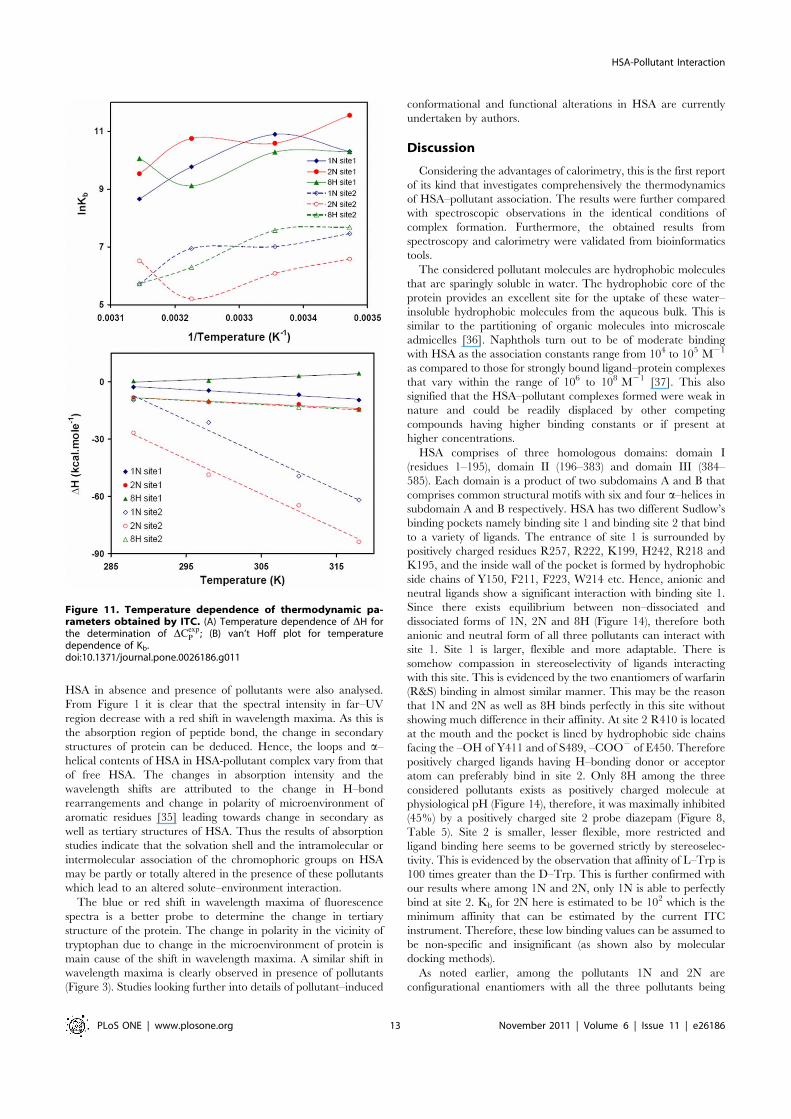
The van’t Hoff plot or the temperature dependence of pollutantbinding constants to each site of HSA is shown in Figure 11A. Theobserved non–linearity of the van’t Hoff plot may be due tolinkage of other processes such as conformational changesoccurring during protein–ligand interaction [32]. The firstderivative of temperature dependence of enthalpy change is usedfor the calculation of experimental heat capacity change (DCp
exp).From the slope of DH vs temperature (Figure 11B), the obtainedDCp
exp for binding of 1N, 2N and 8H at site 1 were 20.2187,20.1896 and 0.1432 kcal.mol21.K21 respectively whereas for site 2these values were 21.819, 21.8227 and 20.2122 kcal.mol21.K21
respectively (Table 6). DCpexp is comparatively larger and negative
at site 2 that indicates a larger change in solvent exposed surface
area in domain III. A negative DCpexp also signifies specific binding
of ligand accompanied by burial of non–polar surface [33,34].The thermodynamic signatures of protein–ligand interactions
impersonate the type of forces responsible for ligand association[22]. In this process the uptake/release of water and ion molecules,the restriction of degrees of freedom of polypeptide main chain andside groups or minimal loss of conformational degrees of freedom,changes in vibrational content, burial of water–accessible surfacearea and hydrophobic interactions sum up to give net entropycontribution. The H–bond formation and van der Waalsinteractions sum up to provide enthalpy contribution to free energyof association. On the basis of these findings we have inferred theforces responsible for corresponding HSA–pollutant interactionsand are described in Table 6.
Molecular DockingFor the better understanding of HSA–pollutant binding the
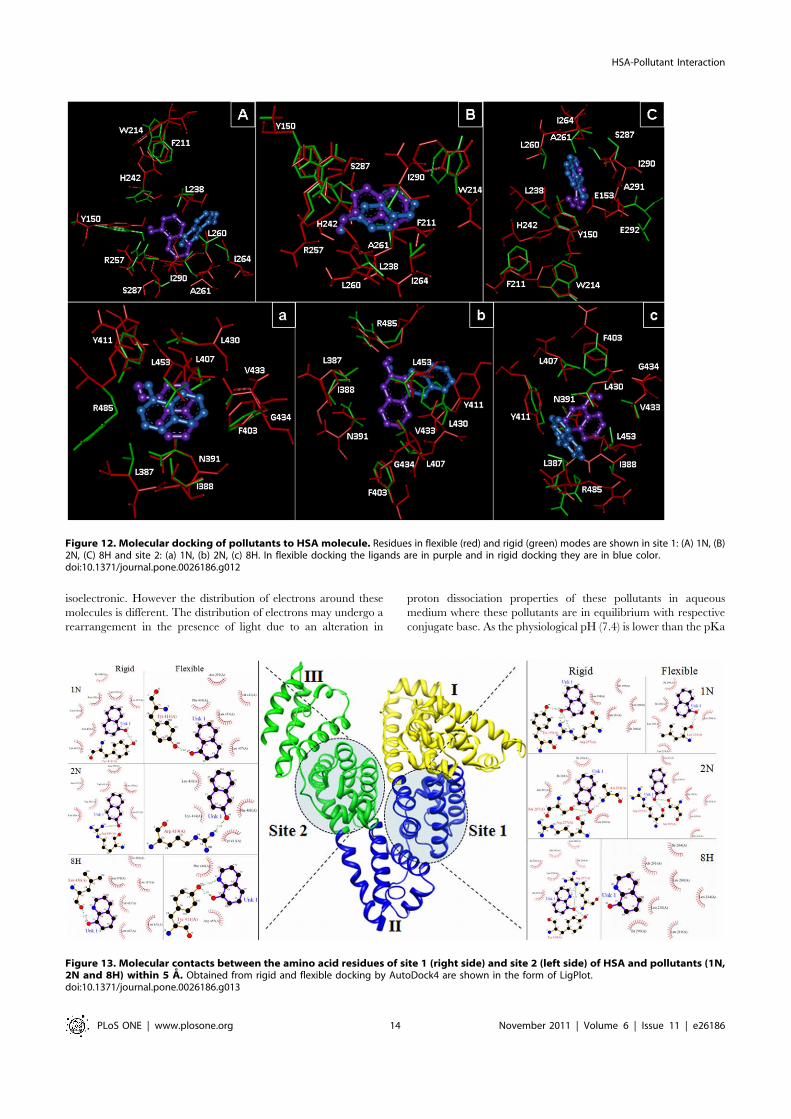
complementary applications of molecular docking of pollutants onHSA has been performed with Autodock simulation analyses inboth rigid and flexible conditions. As in most of the studied cases thedocking simulations are based upon the protein crystal structure inrigid state. But upon ligand binding the proteins acquire differentconformations. Unless significant freedom was allowed in thestructural flexibility of the protein, it is unlikely these results yielduseful information about the specific residues involved in theinteractions with the pollutants if they are supposed to dock onlyflexible ligand and a rigid protein. Hence, both ligand and proteinmolecules were set to be in flexible mode. These two differentconditions were considered. The best energy ranked results areshown in Figure 12 and Figure 13 and are summarized in Table S1and Table S2. The flexible docking results suggest that both site 1and site 2 could occupy all the three pollutants 1N, 2N and 8H butshared different binding region in the same site. The bindingconstants (Kb) obtained from flexible molecular simulations (TableS1) reveal that the pollutants bind loosely at the peripheral side ofthe cavity at site 1 (Kb in the order of 105) whereas they bind tightlyand deep inside at site 2 (Kb in the order of 106). At site 1, variations
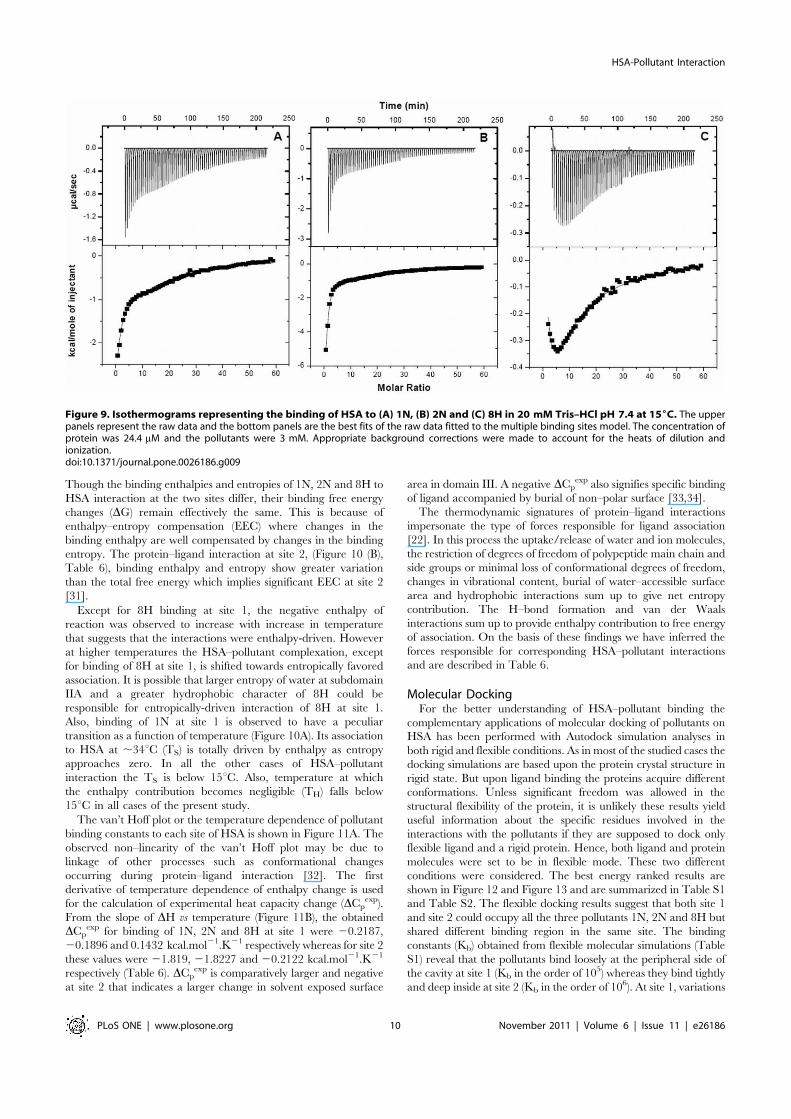
Figure 9. Isothermograms representing the binding of HSA to (A) 1N, (B) 2N and (C) 8H in 20 mM Tris–HCl pH 7.4 at 156C. The upperpanels represent the raw data and the bottom panels are the best fits of the raw data fitted to the multiple binding sites model. The concentration ofprotein was 24.4 mM and the pollutants were 3 mM. Appropriate background corrections were made to account for the heats of dilution andionization.doi:10.1371/journal.pone.0026186.g009
HSA-Pollutant Interaction
PLoS ONE | www.plosone.org 10 November 2011 | Volume 6 | Issue 11 | e26186
in the water structure may help to make the pocket lesser adaptableto ligands [29]. The interactions between the HSA and pollutantswere exclusively hydrophobic in nature as reflected by several non–polar (F211, 223; W214; A215, 261, 291; L219, 238, 260; V241;I264, 290), one polar (S287) and few charged (R218, 222, 257;H242) residues at site 1. Similarly site 2 is made of several non–polar(F488; L387, 430, 453; I388; A449; V485, P384), one polar (Y411)
and few charged (E450, 489; N391, R411, 485) residues. Theseresidues were in the proximity distance of 5 A of the bound ligands.Although the involvement of non polar residues makes theinteractions to be hydrophobic in nature but the strong intermo-lecular H–bonding possibility between pollutants and HSA alsoexists. In flexible docking binding of 8H at site 1 doesn’t involve anyH–bond and is stabilized by hydrophobic interactions only (Table
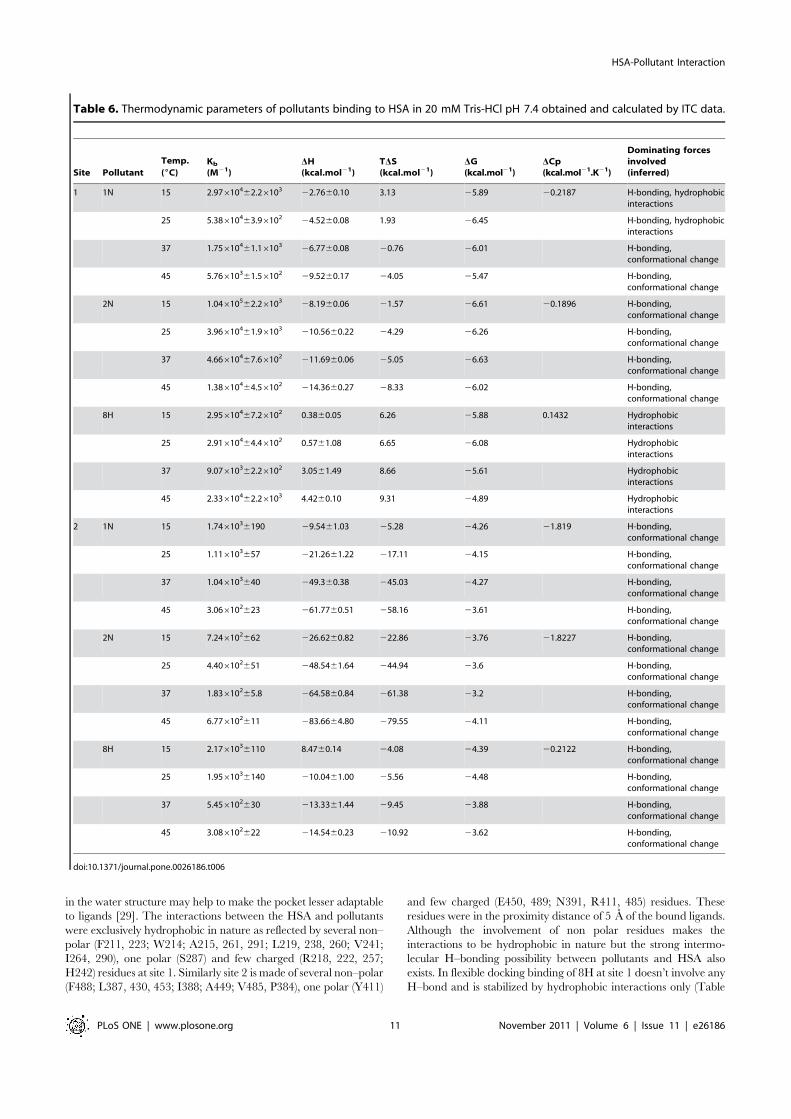
Table 6. Thermodynamic parameters of pollutants binding to HSA in 20 mM Tris-HCl pH 7.4 obtained and calculated by ITC data.
Site PollutantTemp.(6C)
Kb
(M21)DH(kcal.mol21)
TDS(kcal.mol21)
DG(kcal.mol21)
DCp(kcal.mol21.K21)
Dominating forcesinvolved(inferred)
1 1N 15 2.97610462.26103 22.7660.10 3.13 25.89 20.2187 H-bonding, hydrophobicinteractions
25 5.38610463.96102 24.5260.08 1.93 26.45 H-bonding, hydrophobicinteractions
37 1.75610461.16103 26.7760.08 20.76 26.01 H-bonding,conformational change
45 5.76610361.56102 29.5260.17 24.05 25.47 H-bonding,conformational change
2N 15 1.04610562.26103 28.1960.06 21.57 26.61 20.1896 H-bonding,conformational change
25 3.96610461.96103 210.5660.22 24.29 26.26 H-bonding,conformational change
37 4.66610467.66102 211.6960.06 25.05 26.63 H-bonding,conformational change
45 1.38610464.56102 214.3660.27 28.33 26.02 H-bonding,conformational change
8H 15 2.95610467.26102 0.3860.05 6.26 25.88 0.1432 Hydrophobicinteractions
25 2.91610464.46102 0.5761.08 6.65 26.08 Hydrophobicinteractions
37 9.07610362.26102 3.0561.49 8.66 25.61 Hydrophobicinteractions
45 2.33610462.26103 4.4260.10 9.31 24.89 Hydrophobicinteractions
2 1N 15 1.7461036190 29.5461.03 25.28 24.26 21.819 H-bonding,conformational change
25 1.116103657 221.2661.22 217.11 24.15 H-bonding,conformational change
37 1.046103640 249.360.38 245.03 24.27 H-bonding,conformational change
45 3.066102623 261.7760.51 258.16 23.61 H-bonding,conformational change
2N 15 7.246102662 226.6260.82 222.86 23.76 21.8227 H-bonding,conformational change
25 4.406102651 248.5461.64 244.94 23.6 H-bonding,conformational change
37 1.83610265.8 264.5860.84 261.38 23.2 H-bonding,conformational change
45 6.776102611 283.6664.80 279.55 24.11 H-bonding,conformational change
8H 15 2.1761036110 8.4760.14 24.08 24.39 20.2122 H-bonding,conformational change
25 1.9561036140 210.0461.00 25.56 24.48 H-bonding,conformational change
37 5.456102630 213.3361.44 29.45 23.88 H-bonding,conformational change
45 3.086102622 214.5460.23 210.92 23.62 H-bonding,conformational change
doi:10.1371/journal.pone.0026186.t006
HSA-Pollutant Interaction
PLoS ONE | www.plosone.org 11 November 2011 | Volume 6 | Issue 11 | e26186

S1) whereas in case of rigid docking 8H forms H-bond with Y150and R257 (Fig. 13 & Table S1).
Further identification of amino acid residues involved in ligandinteraction, the accessible surface area (ASA) of protein before andafter ligand binding were calculated (Table S1). It was found thatin flexible docking the DASA of L238, 260, I264, 290, N391,Y411, V433, L453 for 1N; L238, 260, 430, R257, 410, I290,A291, Y411, F488 for 2N; and L219, 238, I290, Y411, R485,F488 for 8H were ranged from 10.53 to 41.52 A2. Hence, theseresidues were observed to take part in pollutants binding to HSAthrough H–bonding and hydrophobic interactions. These ligandsoccupied a small space in the cavity as was evident by theobservation that maximum four residues were strongly involved inthe hydrophobic complexation (from DASA results) while thereexisted an involvement of eleven residues for site 1 markerwarfarin, and seven residues for site 2 marker diazepam. This is
the reason why warfarin (and up to some extent diazepam too) isable to effectively compete with the binding pollutants (Figure 8).The change in Gibbs free energy (DG) of HSA–pollutantinteractions calculated from computational approach range from27.2 to 28.3 kcal.mol21 that was higher than the experimentalvalues obtained from spectroscopy and ITC. DCp
calc values (fromEquation 14) are very small and in the range of 0.010–0.039 kcal.mol21K21 (Table S1). Thus results obtained fromdocking also indicated that the HSA–pollutant interactions weredominated by hydrophobic forces.
Conformational changes in HSA upon pollutantinteractions
To determine whether pollutants affect the structure of HSAmolecule or not, the qualitative features of UV–visible andfluorescence spectroscopy as well as thermodynamic signatures of
Figure 10. Thermodynamic signatures for 1N, 2N and 8H associations to HSA (A) for binding site 1 and (B) for binding site 2. Thecorresponding temperatures in uC are indicated.doi:10.1371/journal.pone.0026186.g010
HSA-Pollutant Interaction
PLoS ONE | www.plosone.org 12 November 2011 | Volume 6 | Issue 11 | e26186
HSA in absence and presence of pollutants were also analysed.From Figure 1 it is clear that the spectral intensity in far–UVregion decrease with a red shift in wavelength maxima. As this isthe absorption region of peptide bond, the change in secondarystructures of protein can be deduced. Hence, the loops and a–helical contents of HSA in HSA-pollutant complex vary from thatof free HSA. The changes in absorption intensity and thewavelength shifts are attributed to the change in H–bondrearrangements and change in polarity of microenvironment ofaromatic residues [35] leading towards change in secondary aswell as tertiary structures of HSA. Thus the results of absorptionstudies indicate that the solvation shell and the intramolecular orintermolecular association of the chromophoric groups on HSAmay be partly or totally altered in the presence of these pollutantswhich lead to an altered solute–environment interaction.
The blue or red shift in wavelength maxima of fluorescencespectra is a better probe to determine the change in tertiarystructure of the protein. The change in polarity in the vicinity oftryptophan due to change in the microenvironment of protein ismain cause of the shift in wavelength maxima. A similar shift inwavelength maxima is clearly observed in presence of pollutants(Figure 3). Studies looking further into details of pollutant–induced
conformational and functional alterations in HSA are currentlyundertaken by authors.
Discussion
Considering the advantages of calorimetry, this is the first reportof its kind that investigates comprehensively the thermodynamicsof HSA–pollutant association. The results were further comparedwith spectroscopic observations in the identical conditions ofcomplex formation. Furthermore, the obtained results fromspectroscopy and calorimetry were validated from bioinformaticstools.
The considered pollutant molecules are hydrophobic moleculesthat are sparingly soluble in water. The hydrophobic core of theprotein provides an excellent site for the uptake of these water–insoluble hydrophobic molecules from the aqueous bulk. This issimilar to the partitioning of organic molecules into microscaleadmicelles [36]. Naphthols turn out to be of moderate bindingwith HSA as the association constants range from 104 to 105 M21
as compared to those for strongly bound ligand–protein complexesthat vary within the range of 106 to 108 M21 [37]. This alsosignified that the HSA–pollutant complexes formed were weak innature and could be readily displaced by other competingcompounds having higher binding constants or if present athigher concentrations.
HSA comprises of three homologous domains: domain I(residues 1–195), domain II (196–383) and domain III (384–585). Each domain is a product of two subdomains A and B thatcomprises common structural motifs with six and four a–helices insubdomain A and B respectively. HSA has two different Sudlow’sbinding pockets namely binding site 1 and binding site 2 that bindto a variety of ligands. The entrance of site 1 is surrounded bypositively charged residues R257, R222, K199, H242, R218 andK195, and the inside wall of the pocket is formed by hydrophobicside chains of Y150, F211, F223, W214 etc. Hence, anionic andneutral ligands show a significant interaction with binding site 1.Since there exists equilibrium between non–dissociated anddissociated forms of 1N, 2N and 8H (Figure 14), therefore bothanionic and neutral form of all three pollutants can interact withsite 1. Site 1 is larger, flexible and more adaptable. There issomehow compassion in stereoselectivity of ligands interactingwith this site. This is evidenced by the two enantiomers of warfarin(R&S) binding in almost similar manner. This may be the reasonthat 1N and 2N as well as 8H binds perfectly in this site withoutshowing much difference in their affinity. At site 2 R410 is locatedat the mouth and the pocket is lined by hydrophobic side chainsfacing the –OH of Y411 and of S489, –COO2 of E450. Thereforepositively charged ligands having H–bonding donor or acceptoratom can preferably bind in site 2. Only 8H among the threeconsidered pollutants exists as positively charged molecule atphysiological pH (Figure 14), therefore, it was maximally inhibited(45%) by a positively charged site 2 probe diazepam (Figure 8,Table 5). Site 2 is smaller, lesser flexible, more restricted andligand binding here seems to be governed strictly by stereoselec-tivity. This is evidenced by the observation that affinity of L–Trp is100 times greater than the D–Trp. This is further confirmed withour results where among 1N and 2N, only 1N is able to perfectlybind at site 2. Kb for 2N here is estimated to be 102 which is theminimum affinity that can be estimated by the current ITCinstrument. Therefore, these low binding values can be assumed tobe non-specific and insignificant (as shown also by moleculardocking methods).
As noted earlier, among the pollutants 1N and 2N areconfigurational enantiomers with all the three pollutants being
Figure 11. Temperature dependence of thermodynamic pa-rameters obtained by ITC. (A) Temperature dependence of DH forthe determination of DCexp
P ; (B) van’t Hoff plot for temperaturedependence of Kb.doi:10.1371/journal.pone.0026186.g011
HSA-Pollutant Interaction
PLoS ONE | www.plosone.org 13 November 2011 | Volume 6 | Issue 11 | e26186
isoelectronic. However the distribution of electrons around thesemolecules is different. The distribution of electrons may undergo arearrangement in the presence of light due to an alteration in
proton dissociation properties of these pollutants in aqueousmedium where these pollutants are in equilibrium with respectiveconjugate base. As the physiological pH (7.4) is lower than the pKa
Figure 12. Molecular docking of pollutants to HSA molecule. Residues in flexible (red) and rigid (green) modes are shown in site 1: (A) 1N, (B)2N, (C) 8H and site 2: (a) 1N, (b) 2N, (c) 8H. In flexible docking the ligands are in purple and in rigid docking they are in blue color.doi:10.1371/journal.pone.0026186.g012
Figure 13. Molecular contacts between the amino acid residues of site 1 (right side) and site 2 (left side) of HSA and pollutants (1N,2N and 8H) within 5 A. Obtained from rigid and flexible docking by AutoDock4 are shown in the form of LigPlot.doi:10.1371/journal.pone.0026186.g013
HSA-Pollutant Interaction
PLoS ONE | www.plosone.org 14 November 2011 | Volume 6 | Issue 11 | e26186
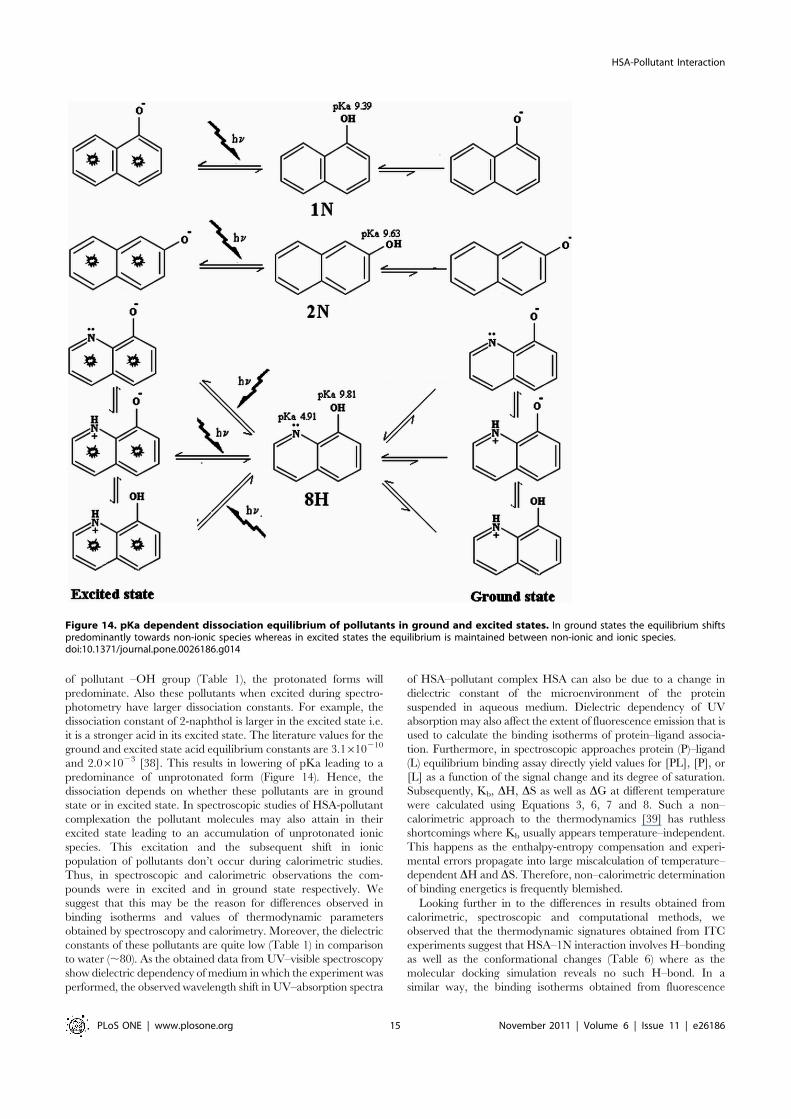
of pollutant –OH group (Table 1), the protonated forms willpredominate. Also these pollutants when excited during spectro-photometry have larger dissociation constants. For example, thedissociation constant of 2-naphthol is larger in the excited state i.e.it is a stronger acid in its excited state. The literature values for theground and excited state acid equilibrium constants are 3.1610210
and 2.061023 [38]. This results in lowering of pKa leading to apredominance of unprotonated form (Figure 14). Hence, thedissociation depends on whether these pollutants are in groundstate or in excited state. In spectroscopic studies of HSA-pollutantcomplexation the pollutant molecules may also attain in theirexcited state leading to an accumulation of unprotonated ionicspecies. This excitation and the subsequent shift in ionicpopulation of pollutants don’t occur during calorimetric studies.Thus, in spectroscopic and calorimetric observations the com-pounds were in excited and in ground state respectively. Wesuggest that this may be the reason for differences observed inbinding isotherms and values of thermodynamic parametersobtained by spectroscopy and calorimetry. Moreover, the dielectricconstants of these pollutants are quite low (Table 1) in comparisonto water (,80). As the obtained data from UV–visible spectroscopyshow dielectric dependency of medium in which the experiment wasperformed, the observed wavelength shift in UV–absorption spectra
of HSA–pollutant complex HSA can also be due to a change indielectric constant of the microenvironment of the proteinsuspended in aqueous medium. Dielectric dependency of UVabsorption may also affect the extent of fluorescence emission that isused to calculate the binding isotherms of protein–ligand associa-tion. Furthermore, in spectroscopic approaches protein (P)–ligand(L) equilibrium binding assay directly yield values for [PL], [P], or[L] as a function of the signal change and its degree of saturation.Subsequently, Kb, DH, DS as well as DG at different temperaturewere calculated using Equations 3, 6, 7 and 8. Such a non–calorimetric approach to the thermodynamics [39] has ruthlessshortcomings where Kb usually appears temperature–independent.This happens as the enthalpy-entropy compensation and experi-mental errors propagate into large miscalculation of temperature–dependent DH and DS. Therefore, non–calorimetric determinationof binding energetics is frequently blemished.
Looking further in to the differences in results obtained fromcalorimetric, spectroscopic and computational methods, weobserved that the thermodynamic signatures obtained from ITCexperiments suggest that HSA–1N interaction involves H–bondingas well as the conformational changes (Table 6) where as themolecular docking simulation reveals no such H–bond. In asimilar way, the binding isotherms obtained from fluorescence
Figure 14. pKa dependent dissociation equilibrium of pollutants in ground and excited states. In ground states the equilibrium shiftspredominantly towards non-ionic species whereas in excited states the equilibrium is maintained between non-ionic and ionic species.doi:10.1371/journal.pone.0026186.g014
HSA-Pollutant Interaction
PLoS ONE | www.plosone.org 15 November 2011 | Volume 6 | Issue 11 | e26186

quenching data suggested that only hydrophobic interactionswere responsible for interaction of 1N and 2N to HSA whichagain conflicted the calorimetric results and indicated that H–bonding was possible. However the formation of H–bondsbetween HSA and pollutants can be explained on the basis ofwater molecules. In HSA matrix, the trapped water moleculefound near W214 drives the dipole–dipole interaction with W214in subdomain IIA [40] giving it a peculiar conformation.Therefore, change in dielectric medium upon interaction offoreign ligands revealed that the reorientation of trapped watermolecule would be allowed. Also, Crystallographic structure ofHSA (PDB: 1E78) shows that K199 is arranged near this trappedwater molecule [41]. K199 would give the determinant effect onthe local conformation near water through its amino groups. Asshown in Table S1 there is an involvement of K199 in 2Ninteraction and upon 2N interaction the water molecule canmove and reorient to rearrange the H–bonding patterns of waterto protein molecule that will lead to change in dipole–dipolerelaxation and a conformational change subsequently. The –OHgroup of 2N may also be indirectly involved in energy andmotional relaxation of water molecule as well as the dielectricrelaxation in vicinity of water molecule. Here, the specific H–bonding patterns between HSA–pollutants determine the orien-tation of pollutants in the binding sites where each pollutantmolecule adopts a different orientation in order to permit an H–bond with polar and charged residues, hence, R257 in site 1 andR410 and Y411 in site 2 may determine the ligand orientation.Thus, despite the contradicting results obtained from differentexperimental approaches, involvement of H–bonds between sidechain of amino acid residues and ‘O’ and ‘N’ atoms of pollutantsand therefore the electrostatic forces in HSA–pollutant complex-ation should not be ignored.
The internal dynamics of protein is affected by interaction ofligands [42] which affects the energetics of protein–ligandassociation because the accessibility to solvent of binding cavitiesis a subject of issue in which rapid exchange with pollutantsnecessitates a noteworthy role for conformational dynamics inorder to access the pollutant molecules [43]. Hence, the decreasein configurational freedom of protein molecule upon complexa-tion, ultimately, the loss of side chain and backbone entropy uponbinding is assigned by positive value of DCp, and this positive valueis an indication of the exposure of protein hydrophobic surfaces[44]. Whereas, a relatively large but negative contribution to theDCp arises from the desolvation of exposed nonpolar groups uponligand binding. From ITC the positive DCp
exp is shown only byHSA–8H in site 1 (smallest in magnitude) and other were innegative while from molecular docking simulations all pairs shownegative DCp
calc except HSA–2N in site 1. The estimated values ofDCp
calc based on the values of DASAnon–polar and DASApolar
obtained from molecular docking were different in signs and farsmaller in magnitude than the DCp
exp obtained from ITC. Thisdifference may be caused by binding induced flexibility changeand protonation/deprotonation effect of proteins and pollutantmolecules. UV–visible spectra and thermodynamic signaturesreveal about the pollutant–induced conformational changes inHSA. In addition, at physiological pH although the pollutantmolecules were predominantly in neutral form but equilibriumbetween protonated and deprotonated species exists (Figure 14)whereas in docking studies the molecules were taken only in theirneutral form.
EEC is a common phenomenon especially where watermolecule involves in binding where the enthalpic gain from aH–bond by itself is counterbalanced by the dehydration penaltyfor burying polar chemical functions and entropic losses from
burial of the involved groups. In addition, EEC is ubiquitous in theassociation reactions which occur through non–covalent interac-tions [45]. This EEC effect is often endorsed to an exchange inwhich a larger enthalpic interaction results in a compensating lossof entropy due to motional constraints. In this study, the observeddifference in EEC effects seems to be due to difference in thesolvation energies of the pollutants.
From energy transfer studies, higher value of E and the smallervalue of r for HSA–2N system as compared to HSA-1N and HSA-8H system were indication of a closer association and possiblyhigher perturbation of the structure. Hence, for 1N and 8H,thermodynamics and molecular docking approaches advocate forsequential binding in two sites of HSA but UV–visible absorptionand fluorescence quenching (spectroscopy) insist it to be in singlesite. The difference in the obtained binding site stoichiometryamong experimental techniques (2 from ITC and 1 fromspectroscopy) can be explained in another way. Spectrometrically,1:1 stoichiometry was determined, which could come from thepossibility that the observed conformational changes result fromonly one of the binding sites. With fluorescence the observation ofonly one site could come from a photo physical problem, becauseonly one tryptophan is available for quenching or energy transfer.Upon the first binding event, the W214 is quenched tocompleteness, or in the case of FRET, the W214 can donate toonly one of the acceptors at one time; thus, the second bindingevent becomes invisible.
The lower affinity of pollutants to HSA at higher temperaturessuggests that the temperature dependant binding of HSA–pollutant may be associated with the modulation of physiologicalto non–physiological changes and native to non–native proteinstructural changes exaggerated by pollutants.
Conclusively, HSA binding sites are used as a model for thedevelopment of rational drug design because of their ligand–binding specificity. These sites are flexible and do not responsestraightforward to ligand to occupy in the cavity. The differencein occupancy and difference in binding patterns of the samepollutants in two different sites are a matter of structural rigidity,packing interactions and a subject to movement in thedimensions of the two cavities where one site may undergo somemore collapse or be more conformationally mobile than the otherone due to the conformational heterogeneity of the two sites. Thepolar as well as hydrophobic nature of both HSA binding sitesand pollutants provide a template that is similar to naturallyoccurring catalytic sites and their corresponding substrates whereeven a small variation in DG leads to discrepancies in estimationof the concerned forces. Hence, only thermodynamic andspectroscopic data are not enough for such calculations but inaddition to these obtained calorimetric and non–calorimetricparameters the crystal structures of HSA–pollutant will grant aprecise scaffold for the estimation of exact forces involved. Nowsuch a complete study will improve the bioinformatics forpredictions concerning probable conformational heterogeneitiesfor different protein–ligand associations. Thus, our study mayrepresent the molecular basis for the important function of thetargeting and transport of pollutants as well as other ligands byserum albumin throughout the circulatory system. Besides,though there are great conformational and morphologicaldifferences in all protein–ligand pairs, the present study will behelpful in all protein–ligand studies as the comparative use ofsimplified approaches deal out the dissection of the molecularmechanisms of intermolecular association. Based on the results of thepresent study we have seen that not only a functional groupreplacement but translocation of the group in a ligand greatly affectsthe interaction with protein where HSA interacts to configurational
HSA-Pollutant Interaction
PLoS ONE | www.plosone.org 16 November 2011 | Volume 6 | Issue 11 | e26186

enantiomers and isoelectronics in a different way. Here, even theresults of identical study obtained from different techniques such asspectroscopy, calorimetry and bioinformatics were contradictory dueto several factors and limitations of the used techniques. Therefore,although there are thousand explanations for an obtained result,whether that result is right or wrong, interdisciplinary approacheswith great preventative measures are key requisite for the solution of aproblem productively.
Supporting Information
Material S1 Isothermal titration Calorimetry.(PDF)
Figure S1 Temperature dependence of DG (Equation 8).Here DG values were obtained from Equation 3 of HSA fluorescencequenching by pollutants at 25, 37 and 45uC [HSA = 2 mM;1N = 2N = 8H = 0–50 mM].(TIF)
Table S1 Interaction profile of pollutants with HSA afterflexible docking with Autodock where number of contacts for
corresponding residues to the ligand are given in parentheses andresidues corresponding to DASA.10 A2 are in bold.(PDF)
Table S2 Interaction profile of pollutants with HSA afterrigid docking with Autodock where number of contacts forcorresponding residues to the ligand are given in parenthesesand residues corresponding to DASA.10 A2 are in bold.(PDF)
Acknowledgments
We express our deep appreciation to Er. Bharatendu Chaturvedi, Facultyof Engineering, AMU, Aligarh for his generous support in mathematicalcalculations. We would like to thank the reviewers for their helpfulcomments, suggestions and encouragement.
Author Contributions
Conceived and designed the experiments: EA RHK. Performed theexperiments: EA GR NZ SS MR MMK SKR ZQ MS MTA. Analyzed thedata: EA RHK. Contributed reagents/materials/analysis tools: EA NS RBRHK. Wrote the paper: EA RHK.
References
1. Meeker JD, Ryan L, Barr DB, Hauser R (2006) Exposure to nonpersistentinsecticides and male reproductive hormones. Epidemiology 17: 61–68.
2. Sudlow G, Birkett DJ, Wade DN (1975) The characterization of two specificdrug binding sites on human serum albumin. Mol Pharmacol 11: 824–832.
3. Yeung BKS, Xiaotang W, Sigman JA, Petillo PA, Lu Y (1997) Construction andcharacterization of a manganese-binding site in cytochrome c peroxidase:towards a novel manganese peroxidase. Chem Biol 4: 215–221.
4. Lakowicz JR Principles of fluorescence spectroscopy, Plenum Press, New York.5. Feng XZ, Lin Z, Yang LJ, Wang C, Bai CL (1998) Investigation of the
interaction between acridine orange and bovine serum albumin. Talanta 47:1223–1229.
6. Forster T (1948) Intermolecular Energy Migration and Fluorescence. Ann Phys2: 55–75.
7. Il’ichev YV, Perry JL, Simon JD (2002) Interaction of Ochratoxin A withHuman Serum Albumin. Preferential Binding of the Dianion and pH Effects.J Phys Chem B 106: 452–459.
8. Cyril L, Earl JK, Sperry WM Biochemists Handbook, E & FN Epon Led. Press,London.
9. Sharma R, Kishore N (2008) Isothermal titration calorimetric and spectroscopicstudies on (alcohol+salt) induced partially folded state of a-lactalbumin and itsbinding with 8-anilino-1-naphthalenesulfonic acid. J Chem Thermodyn 2:1141–1151.
10. Bevington PR Data Reduction and Error Analysis for the Physical Sciences, McGraw-Hill, New York.
11. Privalov PL, Potekhin SA (1987) Scanning microcalorimetry in studyingtemperature-induced changes in proteins. Methods Enzymol 131: 4–51.
12. Morris GM, Huey R, Lindstrom W, Sanner MF, Belew RK, et al. (2009)AutoDock4 and AutoDockTools4 Automated docking with selective receptorflexibility. J Comput Chem 16: 2785–2791.
13. Wang R, Lai L, Wang S (2002) Further Development and Validation ofEmpirical Scoring Functions for Structure-Based Binding Affinity Prediction.J Comput Aided Mol Des 16: 11–26.
14. Wallace AC, Laskowski RA, Thornton JM (1995) LIGPLOT: a program togenerate schematic diagrams of protein-ligand interactions. Protein Eng 8:127–134.
15. DeLano WL The PyMOL Molecular Graphics System, DeLano Scientific, SanCarlos, CA, USA.
16. Pettersen EF, Goddard TD, Huang CC, Couch GS, Greenblatt DM, et al.(2004) UCSF Chimera-a visualization system for exploratory research andanalysis. J Comput Chem 25: 1605–1612.
17. Hubbard SJ, Thornton JM NACCESS, Computer Program, Department ofBiochemistry and Molecular Biology, University College, London.
18. Sahoo BK, Ghosh KS, Dasgupta S (2008) Investigating the binding of curcuminderivatives to bovine serum albumin. Biophys Chem 132: 81–88.
19. Murphy KP, Freire E (1992) Thermodynamics of structural stability andcooperative folding behavior in proteins. Adv Protein Chem 43: 313–361.
20. Ware WR (1962) Oxygen quenching of fluorescence in solution: anexperimental study of the diffusion process. J Phys Chem 66: 455–458.
21. Flora K, Brennan JD, Baker GA, Doody MA, Bright FV (1998) Unfolding ofacrylodan-labeled human serum albumin probed by steady-state and time-resolved fluorescence methods. Biophys J 75: 1084–1096.
22. Ross PD, Subramanian S (1981) Thermodynamics of protein associationreactions: forces contributing to stability. Biochemistry 20: 3096–3102.
23. Hu YJ, Liu Y, Zhang LX (2005) Studies of interaction between colchicine andbovine serum albumin by fluorescence quenching method. J Mol Struct 750:174–178.
24. Bi SY, Song DQ, Tian Y, Zhou X, Liu Z, et al. (2005) Molecular SpectroscopicStudy on the Interaction of Tetracyclines with Serum Albumins. SpectrochimActa A 61: 629–636.
25. Sugio S, Kashima A, Mochizuki S, Noda M, Kobayashi K (1999) Crystalstructure of human serum albumin at 2.5 A resolution. Protein Eng 12:439–446.
26. Dockal M, Carter DC, Ruker F (1999) The three recombinant domains ofhuman serum albumin. Structural characterization and ligand bindingproperties. J Biol Chem 274: 29303–29310.
27. Petersen CE, Ha CE, Harohalli K, Feix JB, Bhagavan NV (2000) A dynamicmodel for bilirubin binding to human serum albumin. J Biol Chem 275:20985–20995.
28. Petitpas I, Bhattacharya AA, Twine S, East M, Curry S (2001) Crystal structureanalysis of warfarin binding to human serum albumin: anatomy of drug site I.J Biol Chem 276: 22804–22809.
29. Ghuman J, Zunszain PA, Petitpas I, Bhattacharya AA, Otagiri M, et al. (2005)Structural Basis of the Drug-binding Specificity of Human Serum Albumin.J Mol Biol 353: 38–52.
30. Droge JH, Janssen LH, Wilting J (1985) Evidence for the fatty acid-inducedheterogeneity of the N and B conformations of human serum albumin. BiochemPharmacol 34: 3299–3304.
31. Musah RA, Jensen GM, Bunte SW, Rosenfeld RJ, Goodin DB (2002) ArtificialProtein Cavities as Specific Ligand-binding Templates: Characterization of anEngineered Heterocyclic Cation-binding Site that Preserves the EvolvedSpecificity of the Parent Protein. J Mol Biol 315: 845–857.
32. Kumaran S, Grucza RA, Waksman G (2003) The tandem Src homology 2domain of the Syk kinase: a molecular device that adapts to interpho-sphotyrosine distances. Proc Natl Acad Sci U S A 100: 14828–14833.
33. Jelen F, Lachowicz P, Apostoluk W, Mateja A, Derewenda ZS, et al. (2009)Dissecting the thermodynamics of GAP-RhoA interactions. J Struct Biol 165:10–18.
34. Spolar RS, Record MT (1994) Coupling of local folding to site-specific bindingof proteins to DNA. Science 263: 777–784.
35. Donovan JW (1969) Changes in ultraviolet absorption produced by alteration ofprotein conformation. J Biol Chem 244: 1961–1967.
36. Alkilany AM, Frey RL, Ferry JL, Murphy CJ (2008) Gold Nanorods asNanoadmicelles: 1–Naphthol Partitioning into a Nanorod–Bound SurfactantBilayer. Langmuir 24: 10235–10239.
37. Kragh-Hansen U (1990) Structure and ligand binding properties of humanserum albumin. Dan Med Bull 37: 57–84.
38. Gomez MA (2003) Excited State Properties of 2-Naphthol. Laboratory write upfrom Physical Chemistry Laboratory, Department of Chemistry, Vassar College.
39. Jelesarov I, Bosshard HR (1999) Isothermal titration calorimetry and differentialscanning calorimetry as complementary tools to investigate the energetics ofbiomolecular recognition. J Mol Recognit 12: 3–18.
40. Otosu T, Nishimoto E, Yamashita S (2010) Multiple conformational state ofhuman serum albumin around single tryptophan residue at various pH revealedby time-resolved fluorescence spectroscopy. J Biochem 147: 191–200.
HSA-Pollutant Interaction
PLoS ONE | www.plosone.org 17 November 2011 | Volume 6 | Issue 11 | e26186
41. Bhattacharya AA, Curry S, Franks NP (2000) Binding of the general anestheticspropofol and halothane to human serum albumin. High resolution crystalstructures. J Biol Chem 275: 38731–38738.
42. Cross AJ, Fleming GR (1986) Influence of inhibitor binding on the internalmotions of lysozyme. Biophys J 50: 507–512.
43. Fitzgerald MM, Musah RA, McRee DE, Goodin DB (1996) A ligand-gated,hinged loop rearrangement opens a channel to a buried artificial protein cavity.Nat Struct Biol 3: 626–631.
44. Singh SK, Kishore N (2006) Thermodynamic Insights into the Binding of TritonX-100 to Globular Proteins: A Calorimetric and Spectroscopic Investigation.J Phys Chem B 110: 9728–9737.
45. Bjelic S, Jelesarov I (2008) A survey of the year 2007 literature on applications ofisothermal titration calorimetry. J Mol Recognit 21: 289–311.
46. Adams PA, Berman MC (1980) Kinetics and mechanism of the interactionbetween human serum albumin and monomeric haemin. Biochem J 191:95–102.
47. Brodersen R (1982) Physical chemistry of bilirubin: binding to macromoleculesand membranes. In: Heirwegh KPM, Brown SB, eds. Bilirubin, Vol. 1:Chemistry, CRC Press, Boca Raton, FL.
48. Pinkerton TC, Koeplinger KA (1990) Determination of warfarin-human serumalbumin protein binding parameters be an improved Hummel- Dreyer highperformance liquid chromatographic method using internal surface reversedphase columns. Anal Chem 62: 2114–2122.
49. Kragh-Hansen U (1991) Octanoate binding to the indole and benzodiazepinebinding region of human serum albumin. Biochem J 273: 641–644.
HSA-Pollutant Interaction
PLoS ONE | www.plosone.org 18 November 2011 | Volume 6 | Issue 11 | e26186