Optimally conditioned scaled ABS algorithms for linear systems
arX
iv:1
301.
3757
v1 [
cond
-mat
.sup
r-co
n] 1
6 Ja
n 20
13
Effects of isoelectronic Ru substitution at the Fe site on the energy gaps of optimally
F-doped SmFeAsO
D. Daghero,1 M. Tortello,1 G.A. Ummarino,1 V.A. Stepanov,2
F. Bernardini,3 M. Tropeano,4 M. Putti,5, 4 and R.S. Gonnelli1
1Dipartimento di Scienza Applicata e Tecnologia, Politecnico di Torino, 10129 Torino, Italy2P.N. Lebedev Physical Institute, Russian Academy of Sciences, 119991 Moscow, Russia
3Dipartimento di Fisica, Universita di Cagliari, 09042 Monserrato (CA), Italy4Dipartimento di Fisica, Universita di Genova, via Dodecaneso 33, 16146 Genova, Italy
5CNR-SPIN, Corso Perrone 24, 16152 Genova, Italy
We studied the effects of isoelectronic Ru substitution at the Fe site on the energy gaps of optimallyF-doped SmFeAsO by means of point-contact Andreev reflection spectroscopy. The results showthat the SmFe1−xRuxAsO0.85F0.15 system keeps a multigap character at least up to x = 0.50,and that the gap amplitudes ∆1 and ∆2 scale almost linearly with the local critical temperatureTAc . The gap ratios 2∆i/kBTc remain approximately constant only as long as Tc ≥ 30K, but
increase dramatically when Tc decreases further. This trend seems to be common to many Fe-based superconductors, irrespective of their family. Based on first-principle calculations of thebandstructure and of the density of states projected on the different bands, we show that thistrend, as well as the Tc dependence of the gaps and the reduction of Tc upon Ru doping, can beexplained within an effective three-band Eliashberg model as being due to a suppression of thesuperfluid density at finite temperature that, in turns, modifies the temperature dependence of thecharacteristic spin-fluctuation energy.
PACS numbers: 74.50.+r , 74.70.Dd, 74.45.+c
INTRODUCTION
The discovery of Fe-based superconductors (FeBS) [1]with Tc as high as 55 K has shown that cuprates no longerrepresent the only class of high-Tc compounds. One ofthe reasons of the great excitement in the scientific com-munity and of the impressive amount of work producedup to now is certainly that these materials give the op-portunity to study high-Tc superconductivity in differentsystems, in the hope to enucleate its key elements. Theparent stoichiometric compounds of most FeBS are notsuperconducting (with few exceptions, like LiFeAs andLaFePO) but display a metallic behaviour (as opposedto the Mott insulating state of cuprates) and feature along-range antiferromagnetic (AFM) spin-density-wave(SDW) order. Superconductivity appears upon dopingand, in some systems, also by applying pressure; how-ever, the order of the transition between magnetic andsuperconducting phases seems not to be universal thoughincreasing evidences are being collected of a region of co-existence of superconductivity and magnetism. Contraryto cuprates (where the superconducting region in thephase diagram is dome-shaped and the maximum Tc cor-responds to a well-defined “optimal” doping) in FeBS su-perconductivity sometimes appears with Tc already veryclose to the maximum and shows a weak doping depen-dence in a broad doping range. A central feature of FeBS– which is tightly connected to the origin of superconduc-tivity according to the most widely accepted theories –is their multiband character. They feature indeed two orthree hole pockets around the Γ point of the first Bril-
louin zone and two electron pockets at the M point (inthe folded Brillouin zone) [2, 3]. In 1111 compounds,all the relevant Fermi surface sheets are weakly warpedcylinders parallel to the kz axis (as expected in a layeredmaterial) while a greater degree of three-dimensionalityis observed in 122 compounds. These multiple bands andtheir almost perfect nesting in the parent compound ex-plain the AFM instability. The weakening of the nestinginduced by doping instead leads to spin fluctuations thatwould act as the glue for the formation of Cooper pairs. Aspin-fluctuation mediated pairing would be mainly inter-
band and would favour the opening of superconductingenergy gaps of different sign on different Fermi surfacesheets, the so-called s± symmetry [4]. Though manytheoretical and experimental results support this theory[5, 6] there is not, up to now, a definitive proof of sucha picture. Things are further considerably complicatedby the fact that the electronic banstructure is very sensi-tive to some fine structural parameters, like the Fe-As-Febond angle and more particularly the height of the pnic-togen atom (hAs) above the Fe layer. Possibly becauseof this sensitivity, in many situations the gap structureof FeBS can vary considerably within the same system,giving rise to line nodes, point nodes, deep gap minimaetc. [7–10]. In 1111 compounds, hAs has been proposedas a switch between high-Tc nodeless superconductivityand low-Tc nodal superconductivity [11].
In the effort to discriminate the effects of different pa-rameters on the superconducting and magnetic phasesof FeBS many different chemical substitutions have beenperformed. The main effect of aliovalent substitutions is
2
to dope the parent compound with charge, either elec-trons [12, 13] or holes [14] thus allowing to explore thephase diagram. Isovalent substitutions [15–18], insteadwere tried to modify the lattice structure, create “chem-ical pressure”, introduce disorder (acting as magnetic ornon-magnetic impurities) etc. A further degree of free-dom is the site of substitution, that can reside either inthe spacing layer [14] or in the active one containing Fe[15–18], which is possibly directly involved in the mag-netic pairing via spin fluctuations.Here we report on point-contact Andreev-reflection
spectroscopy (PCARS) measurements performed inSmFe1−xRuxAsO0.85F0.15 with x ranging from 0 to 0.50.The considerable decrease of Tc in this series of sampleshas been attributed to disorder in the Fe sub-lattice [15]and/or occurrence of a short-range static magnetic or-der [19]. PCARS results clearly indicate the presenceof a multigap character at all the investigated levels ofRu substitution. The superconducting gaps decrease ap-proximately linearly with the local critical temperatureof the contact, TA
c but, even when the latter is reduced bya factor 5 with respect to the optimal value, they showno sign of nodes, either intrinsic or “accidental”. Forboth gaps, the 2∆/kBTc ratio is rather constant down toTAc > 30K but then increases consistently below this crit-
ical temperature. Comparison with other results in liter-ature indicates that many different FeBS fit in this trend,which suggests the possibility to study some propertiescommon to different compounds in a single samples seriesthat allows spanning a very wide range of critical temper-atures. Thanks to ab-initio electronic structure calcula-tions, the trend of the gaps as a function of TA
c has beenreproduced within a minimal three-band, s± Eliashbergmodel. This model also takes into account the so-called“feedback” effect, i.e. the effect of the condensate on theantiferromagnetic spin fluctuations possibly responsiblefor the superconductivity in these compounds. The evo-lution as a function of Tc of the temperature dependenceof the condensate necessary to reproduce the experimen-tal data looks rather similar to that obtained from Lon-don penetration-depth measurements performed in otherFeBS, particularly in the region of coexistence of super-conductivity and magnetism. This fact suggests that, inagreement with ref. [19], proximity of superconductiv-ity and magnetism in these samples might be one of themain reasons for the decrease of Tc and for the observedbehavior of the energy gaps.
EXPERIMENTAL DETAILS
The polycrystalline SmFe1−xRuxAsO0.85F0.15 sampleswere synthesized as described in Ref. [15]. The startingmixture of fine powder of SmAs and 99.9% pure Fe2O3,RuO2, FeF2, Fe and Ru was pressed in pellets and thenput through a two-step reaction process involving a first
0.0 0.1 0.2 0.3 0.4 0.53.92
3.94
3.96
3.98
4.00
a-ax
is (
Ang
stro
m)
Ru content (x)
8.2
8.3
8.4
8.5
8.6 c-axis (A
ngstrom)
FIG. 1: Lattice constants for SmFe1−xRuxAsO0.85F0.15 atdifferent Ru content x. Lines are only guides to the eye.
x Tc (K) ρ0 (mΩ cm)
0 52.0 0.33
0.05 42.8 0.87
0.10 21.5 1.33
0.25 28.1 1.20
0.30 13.6 1.69
0.50 13.5 0.70
TABLE I: Resistive critical temperatures and residual resis-tivities (defined as in ref. [15]) for SmFe1−xRuxAsO0.85F0.15
samples at different Ru contents. Tc and ρ0 for the sampleswith x = 0.25 and x = 0.50 are different from those reportedin ref. [15].
heating to 450 and a second heating to 1000−1075. X-ray diffraction analysis showed small amounts of SmOF(up to 6 %) in the final samples. Figure 1 shows the de-pendence of the lattice constants a and c on the Ru con-tent x, indicating that Ru substitution for Fe is effective.Resistive critical temperatures and residual resistivitiesfor the samples used in this work are reported in table I.The samples with x = 0.25 and x = 0.50 have higher Tc
and much improved transport properties (namely, resis-tivity, magnetoresistance and Hall mobility) than thosereported in ref. [15] for the same doping contents, eventhough they were prepared in the same way. The possi-ble reason of this difference is under investigation. In anycase, these samples were particularly suited for PCARSmeasurements, since the longer mean free path makes iteasier to attain the spectroscopic conditions, as explainedbelow.
Point contact spectroscopy is a local, surface-sensitivetechnique and it is therefore necessary to avoid any sur-face degradation or contamination. The samples werethus always kept in dry atmosphere, and broken to ex-pose a clean surface prior to point-contact fabrication.The point contacts were made by putting a small drop ofAg paste on that surface, as described elsewhere [20, 21].
3
With respect to the standard “needle-anvil” technique,this configuration ensures a greater mechanical and ther-mal stability of the contacts and also allows the wholemounting for point contact to be hermetically closed inthe cold head of the cryogenic insert thus avoiding anyexposition to air and moisture during the transfer fromthe glove box (where the point contacts are fabricated)to the cryogenic environment. Although the Ag drop hasa diameter of at least 50µm, the real electric contact oc-curs only between some of the Ag grains and the samplesurface. The true contact is thus the parallel of sev-eral nanoscopic junctions that can well be in the ballisticregime (i.e. have a radius smaller than the electron meanfree path). In Ref. [15] a rough evaluation of the meanfree path in SmFe1−xRuxAsO0.85F0.15 gave ℓ = 3 − 10nm without any clear dependence on the Ru content. Inthe cleaner samples with x = 0.25 and x = 0.50, thesame evaluation gives ℓ ≃ 7 nm and ℓ ≃ 20 nm, respec-tively. Such small values of the mean free path makethe fulfillment of the ballistic condition a ≪ ℓ (where ais the contact radius) be very difficult to achieve. Forinstance, with these values of ℓ and the residual resistiv-ities taken from table I, the Sharvin equation [22] wouldrequire resistances of the order of several kΩ for the con-tact to be ballistic. The typical experimental resistanceof the contacts is instead in the range 10−100Ω. Indeed,many of the contacts were not spectroscopic or showedheating effects. A large number of measurements wasthen necessary to achieve a relatively small number ofsuccessful measurements. All the results reported here,except those shown in fig.3, are thus referred to the smallfraction of contacts that do not show heating effects andgave a clear Andreev-reflection signal. In these cases,the existence of many parallel nanojunctions can be in-voked to reconcile the actual contact resistance with therequirement of ballistic transport [21]. In some cases,the Sharvin condition was fulfilled at low temperaturebut broke down on increasing the temperature becauseof the decrease in the mean free path. In these cases,the values of the gaps at low temperature can be takenas meaningful anyway, though their temperature depen-dence and eventually the value of the local critical tem-perature can be slightly affected by the non-ideality ofthe contact.
RESULTS AND DISCUSSION
Point-contact Andreev-reflection results
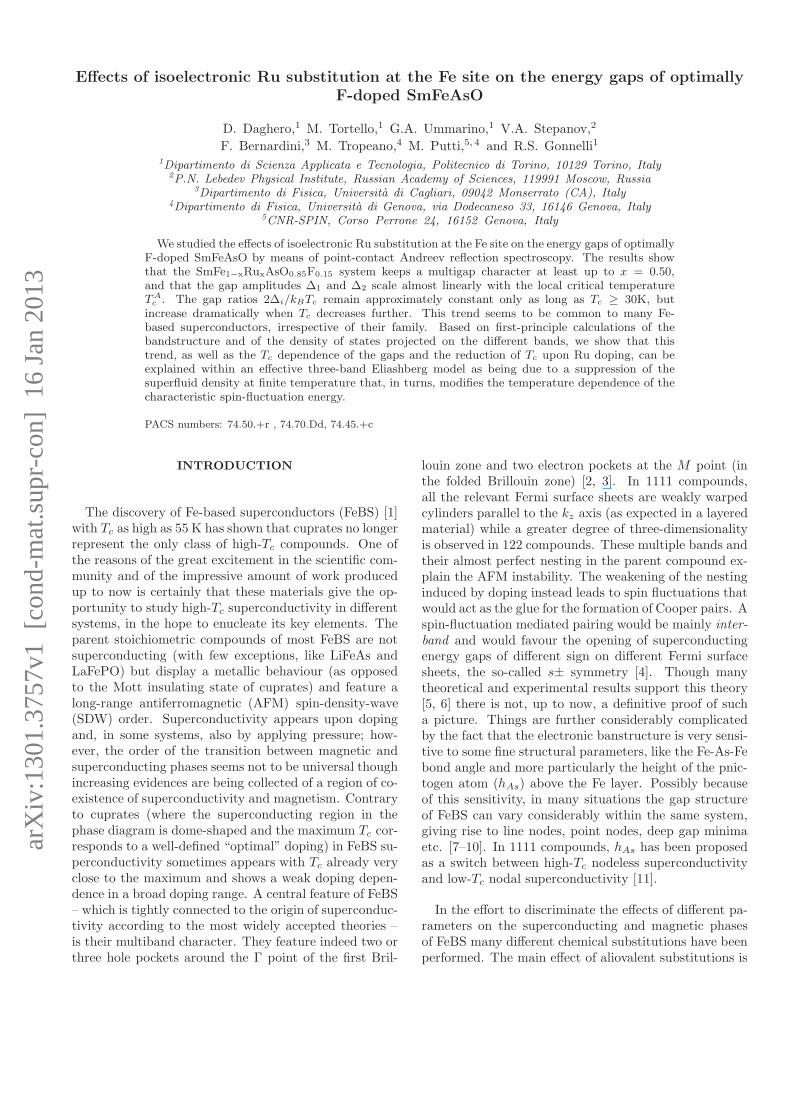
Figure 2 reports the temperature dependence of theraw conductance curves (obtained by numerical differen-tiation of the I−V characteristics) of one of the contactsthat did not show any anomaly. The curves were mea-sured in the x = 0.10 sample, and the normal-state resis-tance of the contact is around 50Ω. The curves show the
-40 -30 -20 -10 0 10 20 30 400.019
0.020
0.021
0.022 T (K) 4.2 7.0 9.1 11.1 13.1 14.6 16.0 17.0 17.6 18.0 19.0 20.0 21.0 22.0 23.0
Con
duct
ance
(Ω
-1)
Voltage (mV)
-100 -50 0 50 100
0.019
0.020
0.021
0.022
0.023
Voltage (mV)
Con
duct
ance
(1/
Ω)
FIG. 2: Temperature dependence of the raw conductancecurve of a point contact on the x = 0.10 sample. The normalstate resistance is RN = 50Ω. The inset shows the curves at4.2 K and at 21.0 K in an extended voltage range, to highlightthe excess conductance persisting up to about 100 mV.
typical features already observed in SmFeAs(O1−xFx)[23], in LaFeAs(O1−xFx) [20] and in other 1111 com-pounds. In particular, they feature clear maxima relatedto a presumably nodeless gap, shoulders suggestive of asecond larger gap and additional structures that, as re-cently shown [24], can be explained as being due to thestrong electron-boson coupling. The excess conductanceat high voltage, extending up to about 100 mV (see inset)is also typical of these systems [24]. The temperature atwhich the Andreev-reflection features disappear and theconductance becomes equal to the normal-state one is thelocal critical temperature of the contact, or Andreev crit-ical temperature TA
c . As shown in fig.2 this temperatureis easy to identify in spectroscopic contacts because italso marks the point where conductance curves recordedat slightly different temperature start to be superimposedto one another (here the curves at 21.0, 22.0 and 23.0 Kcoincide within the experimental noise).
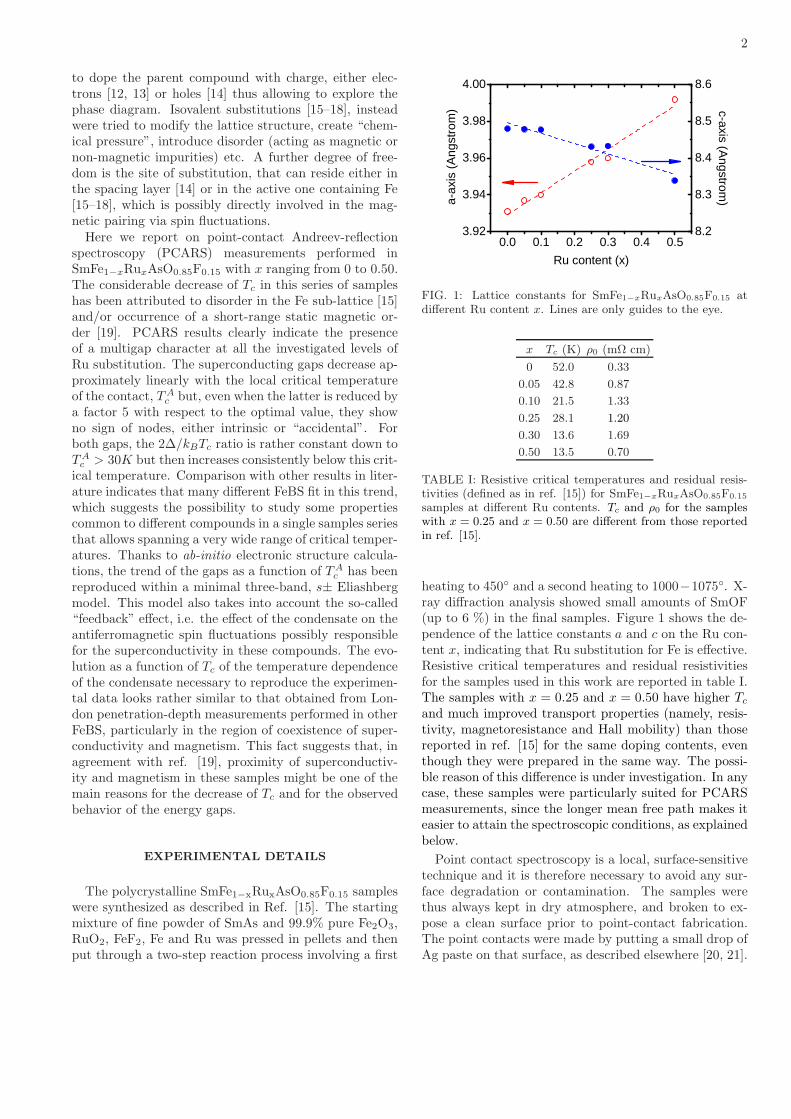
In contrast, Figure 3 reports two examples of conduc-tance curves that show, together with an Andreev sig-nal, deep and wide dips that, at low temperature, occurat energies comparable to those of the large gap. Asshown elsewhere [21, 25] these dips are likely to be dueto the current becoming overcritical in the region of thecontact and prevent a proper determination of the gapamplitudes. On increasing temperature, they move to-ward lower voltage (due to the decrease of the criticalcurrent) causing an apparent shrinkage of the Andreevsignal, finally giving rise to a sharp cusp at zero bias.
Going back to the case of ballistic contacts as in Fig.2,the conductance at or just above TA
c can be used to nor-malize all the curves at T < TA
c . In principle, a conduc-tance curve recorded at a given temperature should benormalized to the normal-state conductance at the same
4
-80 -60 -40 -20 0 20 40 60 80
0,08
0,09
0,10
0,11
0,12 T (K)
4.2
8.0
12.0
15.1
18.0
20.0
22.1
24.1
Co
nd
ucta
nce
(Ω
-1)
Voltage (mV)
DIPS
-80 -60 -40 -20 0 20 40 60 80
0,06
0,07
0,08
0,09
0,10
0,11
DIPS
(b)(a) T (K)
4.2
9.8
15.1
20.1
21.0
22.1
Voltage (mV)
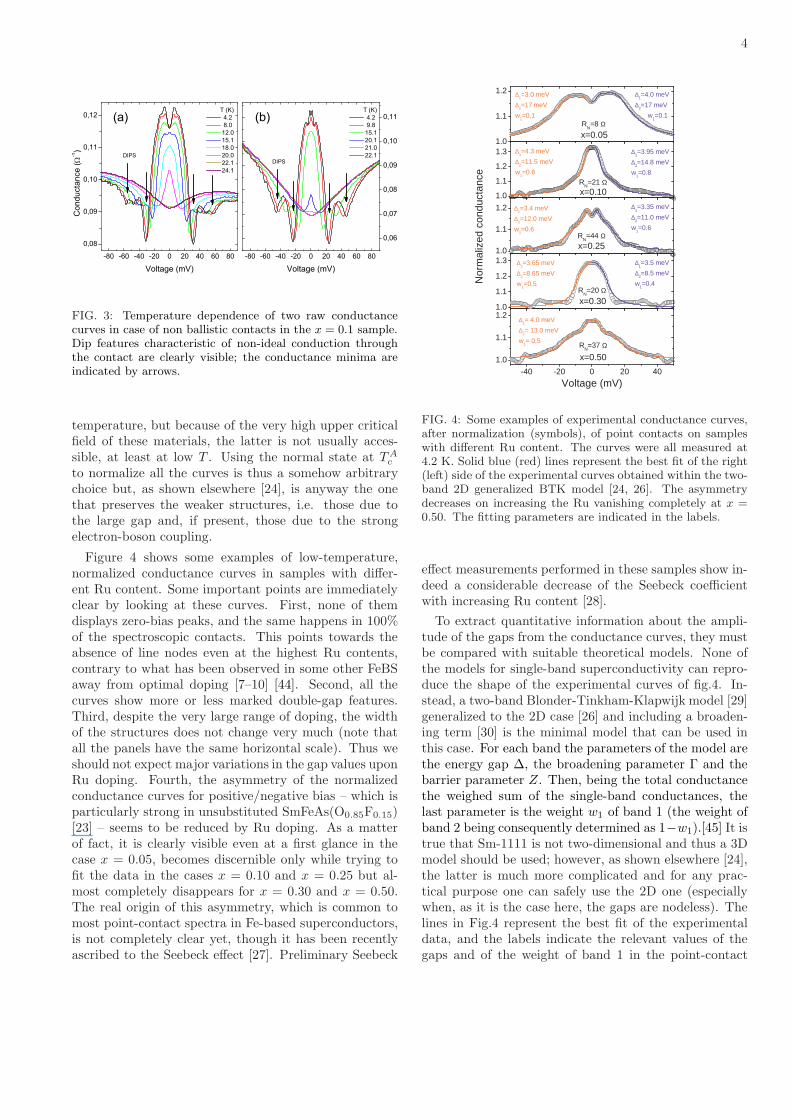
FIG. 3: Temperature dependence of two raw conductancecurves in case of non ballistic contacts in the x = 0.1 sample.Dip features characteristic of non-ideal conduction throughthe contact are clearly visible; the conductance minima areindicated by arrows.
temperature, but because of the very high upper criticalfield of these materials, the latter is not usually acces-sible, at least at low T . Using the normal state at TA
c
to normalize all the curves is thus a somehow arbitrarychoice but, as shown elsewhere [24], is anyway the onethat preserves the weaker structures, i.e. those due tothe large gap and, if present, those due to the strongelectron-boson coupling.
Figure 4 shows some examples of low-temperature,normalized conductance curves in samples with differ-ent Ru content. Some important points are immediatelyclear by looking at these curves. First, none of themdisplays zero-bias peaks, and the same happens in 100%of the spectroscopic contacts. This points towards theabsence of line nodes even at the highest Ru contents,contrary to what has been observed in some other FeBSaway from optimal doping [7–10] [44]. Second, all thecurves show more or less marked double-gap features.Third, despite the very large range of doping, the widthof the structures does not change very much (note thatall the panels have the same horizontal scale). Thus weshould not expect major variations in the gap values uponRu doping. Fourth, the asymmetry of the normalizedconductance curves for positive/negative bias – which isparticularly strong in unsubstituted SmFeAs(O0.85F0.15)[23] – seems to be reduced by Ru doping. As a matterof fact, it is clearly visible even at a first glance in thecase x = 0.05, becomes discernible only while trying tofit the data in the cases x = 0.10 and x = 0.25 but al-most completely disappears for x = 0.30 and x = 0.50.The real origin of this asymmetry, which is common tomost point-contact spectra in Fe-based superconductors,is not completely clear yet, though it has been recentlyascribed to the Seebeck effect [27]. Preliminary Seebeck
1.0
1.1
1.2
1.31.0
1.1
1.2
1.0
1.1
1.2
1.0
1.1
1.2
1.3
-40 -20 0 20 40
1.0
1.1
1.2
RN=21 Ω
∆1=3.95 meV
∆2=14.8 meV
w1=0.8
∆1=4.3 meV
∆2=11.5 meV
w1=0.6
x=0.10
∆1=4.0 meV
∆2=17 meV
w1=0.1
∆1=3.0 meV
∆2=17 meV
w1=0.1
x=0.05R
N=8 Ω
RN=44 Ω
∆1=3.35 meV
∆2=11.0 meV
w1=0.6
∆1=3.4 meV
∆2=12.0 meV
w1=0.6
Nor
mal
ized
con
duct
ance
x=0.25
RN=20 Ω
∆1=3.5 meV
∆2=8.5 meV
w1=0.4
∆1=3.65 meV
∆2=8.65 meV
w1=0.5
x=0.30
RN=37 Ω
∆1= 4.0 meV
∆2= 13.0 meV
w1= 0.5
Voltage (mV)
x=0.50
FIG. 4: Some examples of experimental conductance curves,after normalization (symbols), of point contacts on sampleswith different Ru content. The curves were all measured at4.2 K. Solid blue (red) lines represent the best fit of the right(left) side of the experimental curves obtained within the two-band 2D generalized BTK model [24, 26]. The asymmetrydecreases on increasing the Ru vanishing completely at x =0.50. The fitting parameters are indicated in the labels.
effect measurements performed in these samples show in-deed a considerable decrease of the Seebeck coefficientwith increasing Ru content [28].
To extract quantitative information about the ampli-tude of the gaps from the conductance curves, they mustbe compared with suitable theoretical models. None ofthe models for single-band superconductivity can repro-duce the shape of the experimental curves of fig.4. In-stead, a two-band Blonder-Tinkham-Klapwijk model [29]generalized to the 2D case [26] and including a broaden-ing term [30] is the minimal model that can be used inthis case. For each band the parameters of the model arethe energy gap ∆, the broadening parameter Γ and thebarrier parameter Z. Then, being the total conductancethe weighed sum of the single-band conductances, thelast parameter is the weight w1 of band 1 (the weight ofband 2 being consequently determined as 1−w1).[45] It istrue that Sm-1111 is not two-dimensional and thus a 3Dmodel should be used; however, as shown elsewhere [24],the latter is much more complicated and for any prac-tical purpose one can safely use the 2D one (especiallywhen, as it is the case here, the gaps are nodeless). Thelines in Fig.4 represent the best fit of the experimentaldata, and the labels indicate the relevant values of thegaps and of the weight of band 1 in the point-contact
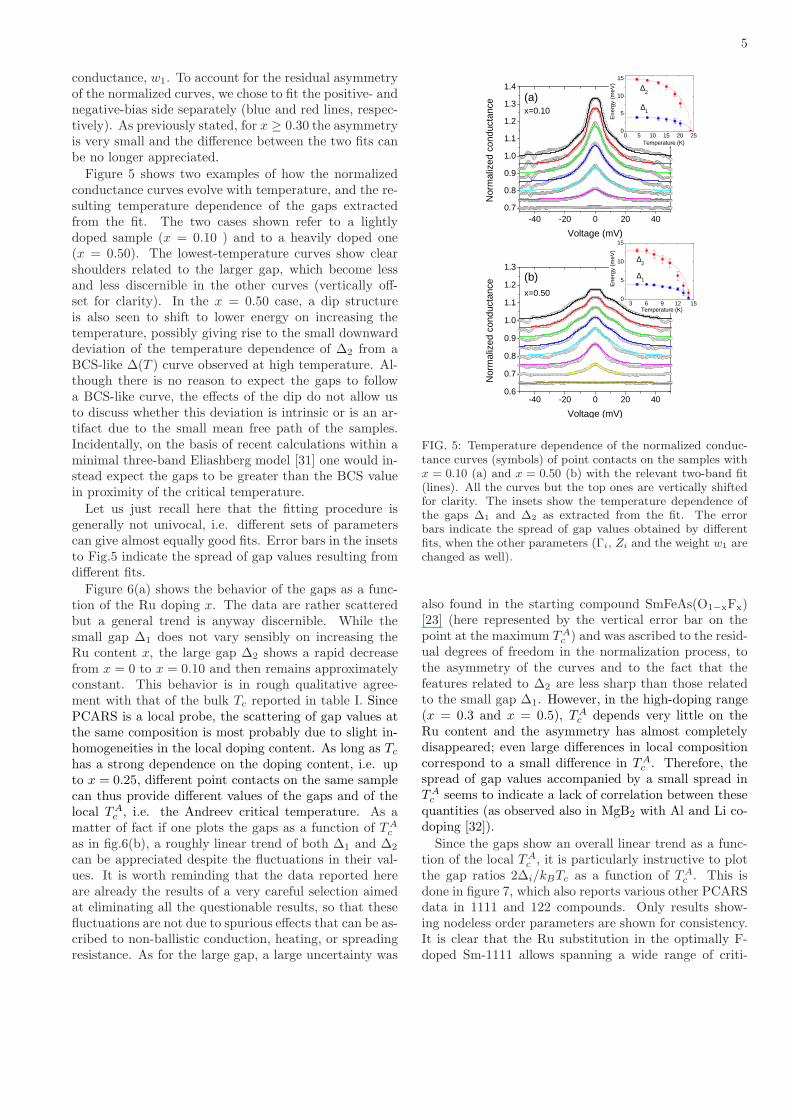
5
conductance, w1. To account for the residual asymmetryof the normalized curves, we chose to fit the positive- andnegative-bias side separately (blue and red lines, respec-tively). As previously stated, for x ≥ 0.30 the asymmetryis very small and the difference between the two fits canbe no longer appreciated.
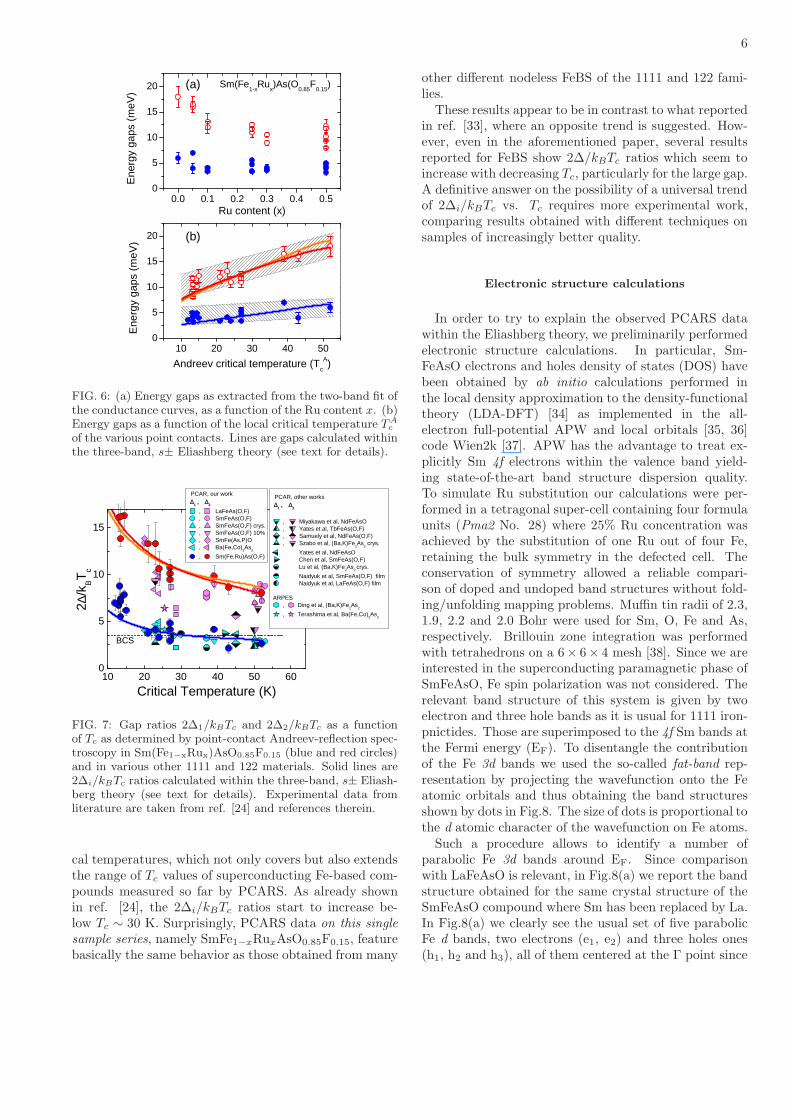
Figure 5 shows two examples of how the normalizedconductance curves evolve with temperature, and the re-sulting temperature dependence of the gaps extractedfrom the fit. The two cases shown refer to a lightlydoped sample (x = 0.10 ) and to a heavily doped one(x = 0.50). The lowest-temperature curves show clearshoulders related to the larger gap, which become lessand less discernible in the other curves (vertically off-set for clarity). In the x = 0.50 case, a dip structureis also seen to shift to lower energy on increasing thetemperature, possibly giving rise to the small downwarddeviation of the temperature dependence of ∆2 from aBCS-like ∆(T ) curve observed at high temperature. Al-though there is no reason to expect the gaps to followa BCS-like curve, the effects of the dip do not allow usto discuss whether this deviation is intrinsic or is an ar-tifact due to the small mean free path of the samples.Incidentally, on the basis of recent calculations within aminimal three-band Eliashberg model [31] one would in-stead expect the gaps to be greater than the BCS valuein proximity of the critical temperature.
Let us just recall here that the fitting procedure isgenerally not univocal, i.e. different sets of parameterscan give almost equally good fits. Error bars in the insetsto Fig.5 indicate the spread of gap values resulting fromdifferent fits.
Figure 6(a) shows the behavior of the gaps as a func-tion of the Ru doping x. The data are rather scatteredbut a general trend is anyway discernible. While thesmall gap ∆1 does not vary sensibly on increasing theRu content x, the large gap ∆2 shows a rapid decreasefrom x = 0 to x = 0.10 and then remains approximatelyconstant. This behavior is in rough qualitative agree-ment with that of the bulk Tc reported in table I. SincePCARS is a local probe, the scattering of gap values atthe same composition is most probably due to slight in-homogeneities in the local doping content. As long as Tc
has a strong dependence on the doping content, i.e. upto x = 0.25, different point contacts on the same samplecan thus provide different values of the gaps and of thelocal TA
c , i.e. the Andreev critical temperature. As amatter of fact if one plots the gaps as a function of TA
c
as in fig.6(b), a roughly linear trend of both ∆1 and ∆2
can be appreciated despite the fluctuations in their val-ues. It is worth reminding that the data reported hereare already the results of a very careful selection aimedat eliminating all the questionable results, so that thesefluctuations are not due to spurious effects that can be as-cribed to non-ballistic conduction, heating, or spreadingresistance. As for the large gap, a large uncertainty was
-40 -20 0 20 400.7
0.8
0.9
1.0
1.1
1.2
1.3
1.4
0 5 10 15 20 250
5
10
15
-40 -20 0 20 400.6
0.7
0.8
0.9
1.0
1.1
1.2
1.3
3 6 9 12 150
5
10
15
Nor
mal
ized
con
duct
ance
Voltage (mV)
x=0.10
(a)∆
2
Ene
rgy
(meV
)
Temperature (K)
∆1
(b)
Nor
mal
ized
con
duct
ance
Voltage (mV)
x=0.50
∆2
∆1
Temperature (K)
Ene
rgy
(meV
)
FIG. 5: Temperature dependence of the normalized conduc-tance curves (symbols) of point contacts on the samples withx = 0.10 (a) and x = 0.50 (b) with the relevant two-band fit(lines). All the curves but the top ones are vertically shiftedfor clarity. The insets show the temperature dependence ofthe gaps ∆1 and ∆2 as extracted from the fit. The errorbars indicate the spread of gap values obtained by differentfits, when the other parameters (Γi, Zi and the weight w1 arechanged as well).
also found in the starting compound SmFeAs(O1−xFx)[23] (here represented by the vertical error bar on thepoint at the maximum TA
c ) and was ascribed to the resid-ual degrees of freedom in the normalization process, tothe asymmetry of the curves and to the fact that thefeatures related to ∆2 are less sharp than those relatedto the small gap ∆1. However, in the high-doping range(x = 0.3 and x = 0.5), TA
c depends very little on theRu content and the asymmetry has almost completelydisappeared; even large differences in local compositioncorrespond to a small difference in TA
c . Therefore, thespread of gap values accompanied by a small spread inTAc seems to indicate a lack of correlation between these
quantities (as observed also in MgB2 with Al and Li co-doping [32]).
Since the gaps show an overall linear trend as a func-tion of the local TA
c , it is particularly instructive to plotthe gap ratios 2∆i/kBTc as a function of TA
c . This isdone in figure 7, which also reports various other PCARSdata in 1111 and 122 compounds. Only results show-ing nodeless order parameters are shown for consistency.It is clear that the Ru substitution in the optimally F-doped Sm-1111 allows spanning a wide range of criti-
6
0.0 0.1 0.2 0.3 0.4 0.50
5
10
15
20
10 20 30 40 500
5
10
15
20
Sm(Fe1-x
Rux)As(O
0.85F
0.15)
Ene
rgy
gaps
(m
eV)
Ru content (x)
(a)
(b)
Ene
rgy
gaps
(m
eV)
Andreev critical temperature (Tc
A)
FIG. 6: (a) Energy gaps as extracted from the two-band fit ofthe conductance curves, as a function of the Ru content x. (b)Energy gaps as a function of the local critical temperature TA
c
of the various point contacts. Lines are gaps calculated withinthe three-band, s± Eliashberg theory (see text for details).
10 20 30 40 50 600
5
10
15
PCAR, other works ∆
1 , ∆
2
, Miyakawa et al, NdFeAsO, Yates et al, TbFeAs(O,F), Samuely et al, NdFeAs(O,F), Szabo et al, (Ba,K)Fe
2As
2 crys.
Yates et al, NdFeAsO Chen et al, SmFeAs(O,F) Lu et al, (Ba,K)Fe
2As
2 crys.
Naidyuk et al, SmFeAs(O,F) film Naidyuk et al, LaFeAs(O,F) film
ARPES, Ding et al, (Ba,K)Fe
2As
2
, Terashima et al, Ba(Fe,Co)2As
2
2∆/k
BT
c
Critical Temperature (K)
PCAR, our work ∆
1 , ∆
2
, LaFeAs(O,F), SmFeAs(O,F), SmFeAs(O,F) crys., SmFeAs(O,F) 10%, SmFe(As,P)O, Ba(Fe,Co)
2As
2
, Sm(Fe,Ru)As(O,F)
BCS
FIG. 7: Gap ratios 2∆1/kBTc and 2∆2/kBTc as a functionof Tc as determined by point-contact Andreev-reflection spec-troscopy in Sm(Fe1−xRux)AsO0.85F0.15 (blue and red circles)and in various other 1111 and 122 materials. Solid lines are2∆i/kBTc ratios calculated within the three-band, s± Eliash-berg theory (see text for details). Experimental data fromliterature are taken from ref. [24] and references therein.
cal temperatures, which not only covers but also extendsthe range of Tc values of superconducting Fe-based com-pounds measured so far by PCARS. As already shownin ref. [24], the 2∆i/kBTc ratios start to increase be-low Tc ∼ 30 K. Surprisingly, PCARS data on this single
sample series, namely SmFe1−xRuxAsO0.85F0.15, featurebasically the same behavior as those obtained from many
other different nodeless FeBS of the 1111 and 122 fami-lies.These results appear to be in contrast to what reported
in ref. [33], where an opposite trend is suggested. How-ever, even in the aforementioned paper, several resultsreported for FeBS show 2∆/kBTc ratios which seem toincrease with decreasing Tc, particularly for the large gap.A definitive answer on the possibility of a universal trendof 2∆i/kBTc vs. Tc requires more experimental work,comparing results obtained with different techniques onsamples of increasingly better quality.
Electronic structure calculations
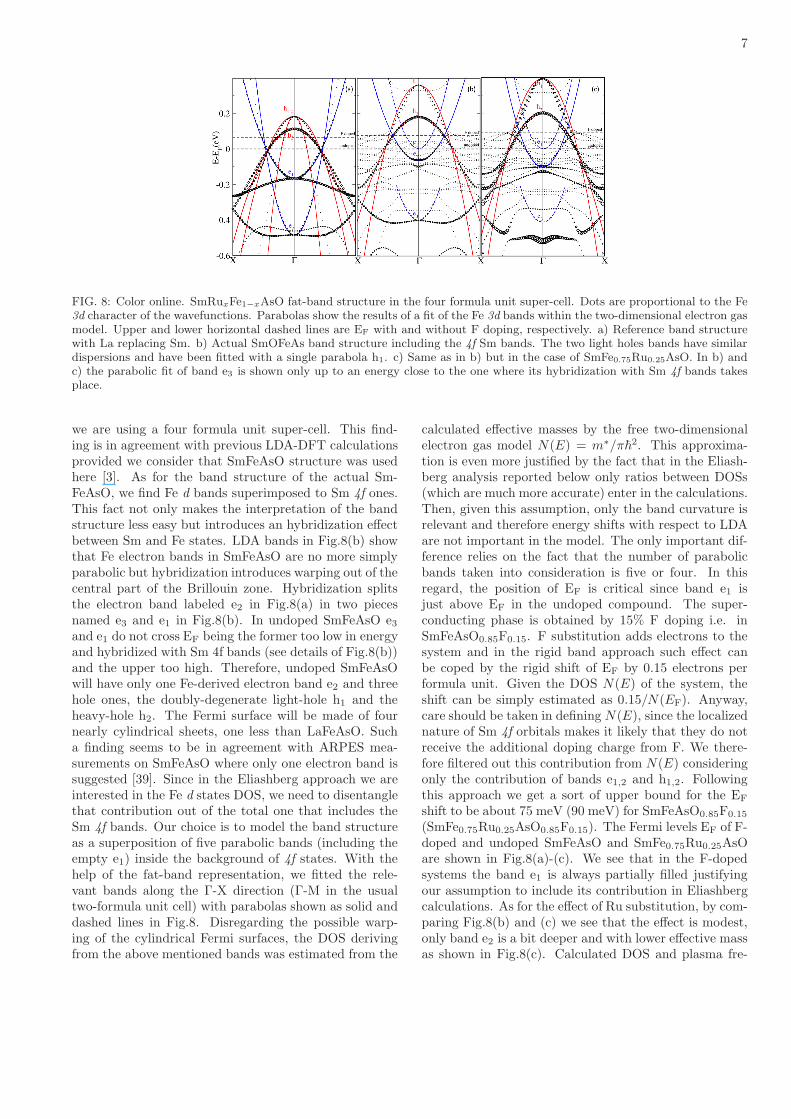
In order to try to explain the observed PCARS datawithin the Eliashberg theory, we preliminarily performedelectronic structure calculations. In particular, Sm-FeAsO electrons and holes density of states (DOS) havebeen obtained by ab initio calculations performed inthe local density approximation to the density-functionaltheory (LDA-DFT) [34] as implemented in the all-electron full-potential APW and local orbitals [35, 36]code Wien2k [37]. APW has the advantage to treat ex-plicitly Sm 4f electrons within the valence band yield-ing state-of-the-art band structure dispersion quality.To simulate Ru substitution our calculations were per-formed in a tetragonal super-cell containing four formulaunits (Pma2 No. 28) where 25% Ru concentration wasachieved by the substitution of one Ru out of four Fe,retaining the bulk symmetry in the defected cell. Theconservation of symmetry allowed a reliable compari-son of doped and undoped band structures without fold-ing/unfolding mapping problems. Muffin tin radii of 2.3,1.9, 2.2 and 2.0 Bohr were used for Sm, O, Fe and As,respectively. Brillouin zone integration was performedwith tetrahedrons on a 6× 6× 4 mesh [38]. Since we areinterested in the superconducting paramagnetic phase ofSmFeAsO, Fe spin polarization was not considered. Therelevant band structure of this system is given by twoelectron and three hole bands as it is usual for 1111 iron-pnictides. Those are superimposed to the 4f Sm bands atthe Fermi energy (EF). To disentangle the contributionof the Fe 3d bands we used the so-called fat-band rep-resentation by projecting the wavefunction onto the Featomic orbitals and thus obtaining the band structuresshown by dots in Fig.8. The size of dots is proportional tothe d atomic character of the wavefunction on Fe atoms.Such a procedure allows to identify a number of
parabolic Fe 3d bands around EF. Since comparisonwith LaFeAsO is relevant, in Fig.8(a) we report the bandstructure obtained for the same crystal structure of theSmFeAsO compound where Sm has been replaced by La.In Fig.8(a) we clearly see the usual set of five parabolicFe d bands, two electrons (e1, e2) and three holes ones(h1, h2 and h3), all of them centered at the Γ point since
7
FIG. 8: Color online. SmRuxFe1−xAsO fat-band structure in the four formula unit super-cell. Dots are proportional to the Fe3d character of the wavefunctions. Parabolas show the results of a fit of the Fe 3d bands within the two-dimensional electron gasmodel. Upper and lower horizontal dashed lines are EF with and without F doping, respectively. a) Reference band structurewith La replacing Sm. b) Actual SmOFeAs band structure including the 4f Sm bands. The two light holes bands have similardispersions and have been fitted with a single parabola h1. c) Same as in b) but in the case of SmFe0.75Ru0.25AsO. In b) andc) the parabolic fit of band e3 is shown only up to an energy close to the one where its hybridization with Sm 4f bands takesplace.
we are using a four formula unit super-cell. This find-ing is in agreement with previous LDA-DFT calculationsprovided we consider that SmFeAsO structure was usedhere [3]. As for the band structure of the actual Sm-FeAsO, we find Fe d bands superimposed to Sm 4f ones.This fact not only makes the interpretation of the bandstructure less easy but introduces an hybridization effectbetween Sm and Fe states. LDA bands in Fig.8(b) showthat Fe electron bands in SmFeAsO are no more simplyparabolic but hybridization introduces warping out of thecentral part of the Brillouin zone. Hybridization splitsthe electron band labeled e2 in Fig.8(a) in two piecesnamed e3 and e1 in Fig.8(b). In undoped SmFeAsO e3and e1 do not cross EF being the former too low in energyand hybridized with Sm 4f bands (see details of Fig.8(b))and the upper too high. Therefore, undoped SmFeAsOwill have only one Fe-derived electron band e2 and threehole ones, the doubly-degenerate light-hole h1 and theheavy-hole h2. The Fermi surface will be made of fournearly cylindrical sheets, one less than LaFeAsO. Sucha finding seems to be in agreement with ARPES mea-surements on SmFeAsO where only one electron band issuggested [39]. Since in the Eliashberg approach we areinterested in the Fe d states DOS, we need to disentanglethat contribution out of the total one that includes theSm 4f bands. Our choice is to model the band structureas a superposition of five parabolic bands (including theempty e1) inside the background of 4f states. With thehelp of the fat-band representation, we fitted the rele-vant bands along the Γ-X direction (Γ-M in the usualtwo-formula unit cell) with parabolas shown as solid anddashed lines in Fig.8. Disregarding the possible warp-ing of the cylindrical Fermi surfaces, the DOS derivingfrom the above mentioned bands was estimated from the
calculated effective masses by the free two-dimensionalelectron gas model N(E) = m∗/π~2. This approxima-tion is even more justified by the fact that in the Eliash-berg analysis reported below only ratios between DOSs(which are much more accurate) enter in the calculations.Then, given this assumption, only the band curvature isrelevant and therefore energy shifts with respect to LDAare not important in the model. The only important dif-ference relies on the fact that the number of parabolicbands taken into consideration is five or four. In thisregard, the position of EF is critical since band e1 isjust above EF in the undoped compound. The super-conducting phase is obtained by 15% F doping i.e. inSmFeAsO0.85F0.15. F substitution adds electrons to thesystem and in the rigid band approach such effect canbe coped by the rigid shift of EF by 0.15 electrons performula unit. Given the DOS N(E) of the system, theshift can be simply estimated as 0.15/N(EF). Anyway,care should be taken in defining N(E), since the localizednature of Sm 4f orbitals makes it likely that they do notreceive the additional doping charge from F. We there-fore filtered out this contribution from N(E) consideringonly the contribution of bands e1,2 and h1,2. Followingthis approach we get a sort of upper bound for the EF
shift to be about 75 meV (90 meV) for SmFeAsO0.85F0.15
(SmFe0.75Ru0.25AsO0.85F0.15). The Fermi levels EF of F-doped and undoped SmFeAsO and SmFe0.75Ru0.25AsOare shown in Fig.8(a)-(c). We see that in the F-dopedsystems the band e1 is always partially filled justifyingour assumption to include its contribution in Eliashbergcalculations. As for the effect of Ru substitution, by com-paring Fig.8(b) and (c) we see that the effect is modest,only band e2 is a bit deeper and with lower effective massas shown in Fig.8(c). Calculated DOS and plasma fre-
8
x = 0 meff DOS (st/Ha/Bohr2) ωp (meV)
e1 0.739 0.2352 714.04
e2 1.508 0.4800 975.56
h1 0.908 0.2890 1391.91
h2 2.057 0.6547 844.86
x = 0.25
e1 0.668 0.2127 782.19
e2 0.882 0.2809 1136.49
h1 0.957 0.3048 1428.07
h2 1.736 0.5526 864.74
TABLE II: Calculated effective masses, DOS and plasma fre-quencies for SmFe1−xRuxAsO0.85F0.15 at doping levels x = 0and x = 0.25. h1 is doubly degenerate.
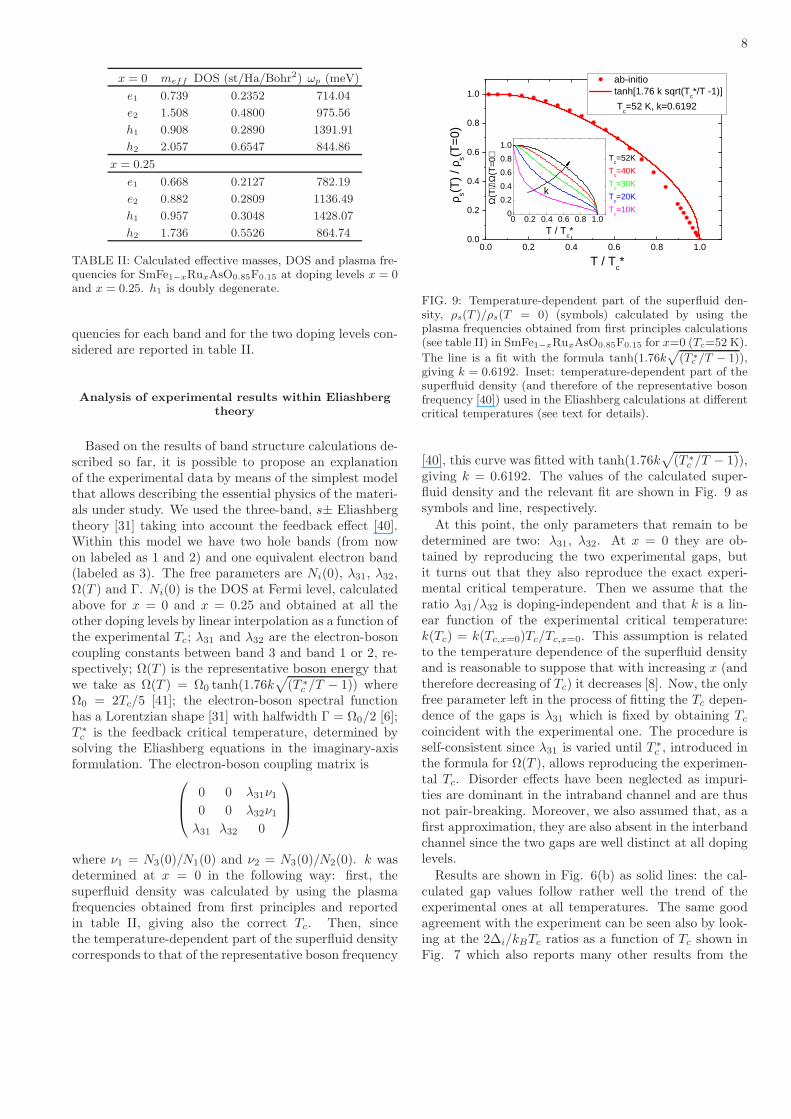
quencies for each band and for the two doping levels con-sidered are reported in table II.
Analysis of experimental results within Eliashberg
theory
Based on the results of band structure calculations de-scribed so far, it is possible to propose an explanationof the experimental data by means of the simplest modelthat allows describing the essential physics of the materi-als under study. We used the three-band, s± Eliashbergtheory [31] taking into account the feedback effect [40].Within this model we have two hole bands (from nowon labeled as 1 and 2) and one equivalent electron band(labeled as 3). The free parameters are Ni(0), λ31, λ32,Ω(T ) and Γ. Ni(0) is the DOS at Fermi level, calculatedabove for x = 0 and x = 0.25 and obtained at all theother doping levels by linear interpolation as a function ofthe experimental Tc; λ31 and λ32 are the electron-bosoncoupling constants between band 3 and band 1 or 2, re-spectively; Ω(T ) is the representative boson energy thatwe take as Ω(T ) = Ω0 tanh(1.76k
√
(T ∗
c /T − 1)) whereΩ0 = 2Tc/5 [41]; the electron-boson spectral functionhas a Lorentzian shape [31] with halfwidth Γ = Ω0/2 [6];T ∗
c is the feedback critical temperature, determined bysolving the Eliashberg equations in the imaginary-axisformulation. The electron-boson coupling matrix is
0 0 λ31ν10 0 λ32ν1λ31 λ32 0
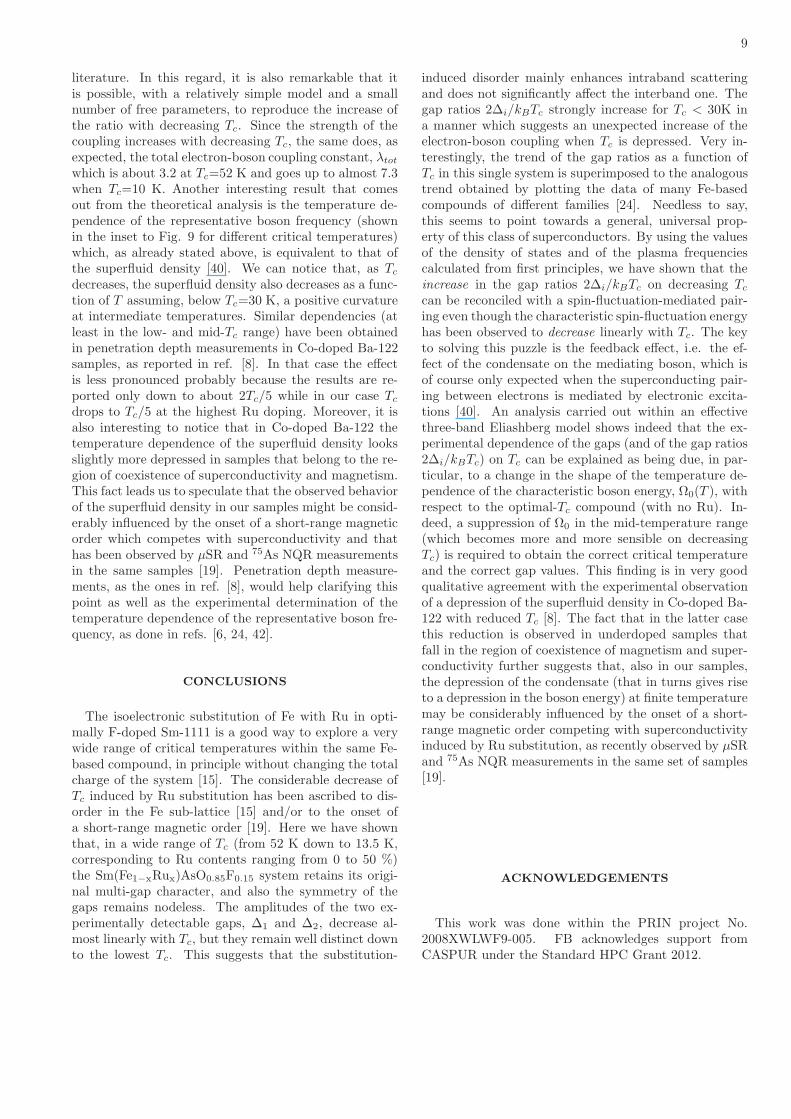
where ν1 = N3(0)/N1(0) and ν2 = N3(0)/N2(0). k wasdetermined at x = 0 in the following way: first, thesuperfluid density was calculated by using the plasmafrequencies obtained from first principles and reportedin table II, giving also the correct Tc. Then, sincethe temperature-dependent part of the superfluid densitycorresponds to that of the representative boson frequency
0.0 0.2 0.4 0.6 0.8 1.00.0
0.2
0.4
0.6
0.8
1.0
ab-initio tanh[1.76 k sqrt(T
c*/T -1)]
Tc=52 K, k=0.6192
ρ s(T)
/ ρs(T
=0)
T / Tc*
0 0.2 0.4 0.6 0.8 1.00
0.2
0.4
0.6
0.8
1.0
Tc=52K
Tc=40K
Tc=30K
Tc=20K
Tc=10K
Ω(Τ
) / Ω
(Τ=0
)
T / Tc*
k
FIG. 9: Temperature-dependent part of the superfluid den-sity, ρs(T )/ρs(T = 0) (symbols) calculated by using theplasma frequencies obtained from first principles calculations(see table II) in SmFe1−xRuxAsO0.85F0.15 for x=0 (Tc=52 K).
The line is a fit with the formula tanh(1.76k√
(T ∗
c /T − 1)),giving k = 0.6192. Inset: temperature-dependent part of thesuperfluid density (and therefore of the representative bosonfrequency [40]) used in the Eliashberg calculations at differentcritical temperatures (see text for details).
[40], this curve was fitted with tanh(1.76k√
(T ∗
c /T − 1)),giving k = 0.6192. The values of the calculated super-fluid density and the relevant fit are shown in Fig. 9 assymbols and line, respectively.
At this point, the only parameters that remain to bedetermined are two: λ31, λ32. At x = 0 they are ob-tained by reproducing the two experimental gaps, butit turns out that they also reproduce the exact experi-mental critical temperature. Then we assume that theratio λ31/λ32 is doping-independent and that k is a lin-ear function of the experimental critical temperature:k(Tc) = k(Tc,x=0)Tc/Tc,x=0. This assumption is relatedto the temperature dependence of the superfluid densityand is reasonable to suppose that with increasing x (andtherefore decreasing of Tc) it decreases [8]. Now, the onlyfree parameter left in the process of fitting the Tc depen-dence of the gaps is λ31 which is fixed by obtaining Tc
coincident with the experimental one. The procedure isself-consistent since λ31 is varied until T ∗
c , introduced inthe formula for Ω(T ), allows reproducing the experimen-tal Tc. Disorder effects have been neglected as impuri-ties are dominant in the intraband channel and are thusnot pair-breaking. Moreover, we also assumed that, as afirst approximation, they are also absent in the interbandchannel since the two gaps are well distinct at all dopinglevels.
Results are shown in Fig. 6(b) as solid lines: the cal-culated gap values follow rather well the trend of theexperimental ones at all temperatures. The same goodagreement with the experiment can be seen also by look-ing at the 2∆i/kBTc ratios as a function of Tc shown inFig. 7 which also reports many other results from the
9
literature. In this regard, it is also remarkable that itis possible, with a relatively simple model and a smallnumber of free parameters, to reproduce the increase ofthe ratio with decreasing Tc. Since the strength of thecoupling increases with decreasing Tc, the same does, asexpected, the total electron-boson coupling constant, λtot
which is about 3.2 at Tc=52 K and goes up to almost 7.3when Tc=10 K. Another interesting result that comesout from the theoretical analysis is the temperature de-pendence of the representative boson frequency (shownin the inset to Fig. 9 for different critical temperatures)which, as already stated above, is equivalent to that ofthe superfluid density [40]. We can notice that, as Tc
decreases, the superfluid density also decreases as a func-tion of T assuming, below Tc=30 K, a positive curvatureat intermediate temperatures. Similar dependencies (atleast in the low- and mid-Tc range) have been obtainedin penetration depth measurements in Co-doped Ba-122samples, as reported in ref. [8]. In that case the effectis less pronounced probably because the results are re-ported only down to about 2Tc/5 while in our case Tc
drops to Tc/5 at the highest Ru doping. Moreover, it isalso interesting to notice that in Co-doped Ba-122 thetemperature dependence of the superfluid density looksslightly more depressed in samples that belong to the re-gion of coexistence of superconductivity and magnetism.This fact leads us to speculate that the observed behaviorof the superfluid density in our samples might be consid-erably influenced by the onset of a short-range magneticorder which competes with superconductivity and thathas been observed by µSR and 75As NQR measurementsin the same samples [19]. Penetration depth measure-ments, as the ones in ref. [8], would help clarifying thispoint as well as the experimental determination of thetemperature dependence of the representative boson fre-quency, as done in refs. [6, 24, 42].
CONCLUSIONS
The isoelectronic substitution of Fe with Ru in opti-mally F-doped Sm-1111 is a good way to explore a verywide range of critical temperatures within the same Fe-based compound, in principle without changing the totalcharge of the system [15]. The considerable decrease ofTc induced by Ru substitution has been ascribed to dis-order in the Fe sub-lattice [15] and/or to the onset ofa short-range magnetic order [19]. Here we have shownthat, in a wide range of Tc (from 52 K down to 13.5 K,corresponding to Ru contents ranging from 0 to 50 %)the Sm(Fe1−xRux)AsO0.85F0.15 system retains its origi-nal multi-gap character, and also the symmetry of thegaps remains nodeless. The amplitudes of the two ex-perimentally detectable gaps, ∆1 and ∆2, decrease al-most linearly with Tc, but they remain well distinct downto the lowest Tc. This suggests that the substitution-
induced disorder mainly enhances intraband scatteringand does not significantly affect the interband one. Thegap ratios 2∆i/kBTc strongly increase for Tc < 30K ina manner which suggests an unexpected increase of theelectron-boson coupling when Tc is depressed. Very in-terestingly, the trend of the gap ratios as a function ofTc in this single system is superimposed to the analogoustrend obtained by plotting the data of many Fe-basedcompounds of different families [24]. Needless to say,this seems to point towards a general, universal prop-erty of this class of superconductors. By using the valuesof the density of states and of the plasma frequenciescalculated from first principles, we have shown that theincrease in the gap ratios 2∆i/kBTc on decreasing Tc
can be reconciled with a spin-fluctuation-mediated pair-ing even though the characteristic spin-fluctuation energyhas been observed to decrease linearly with Tc. The keyto solving this puzzle is the feedback effect, i.e. the ef-fect of the condensate on the mediating boson, which isof course only expected when the superconducting pair-ing between electrons is mediated by electronic excita-tions [40]. An analysis carried out within an effectivethree-band Eliashberg model shows indeed that the ex-perimental dependence of the gaps (and of the gap ratios2∆i/kBTc) on Tc can be explained as being due, in par-ticular, to a change in the shape of the temperature de-pendence of the characteristic boson energy, Ω0(T ), withrespect to the optimal-Tc compound (with no Ru). In-deed, a suppression of Ω0 in the mid-temperature range(which becomes more and more sensible on decreasingTc) is required to obtain the correct critical temperatureand the correct gap values. This finding is in very goodqualitative agreement with the experimental observationof a depression of the superfluid density in Co-doped Ba-122 with reduced Tc [8]. The fact that in the latter casethis reduction is observed in underdoped samples thatfall in the region of coexistence of magnetism and super-conductivity further suggests that, also in our samples,the depression of the condensate (that in turns gives riseto a depression in the boson energy) at finite temperaturemay be considerably influenced by the onset of a short-range magnetic order competing with superconductivityinduced by Ru substitution, as recently observed by µSRand 75As NQR measurements in the same set of samples[19].
ACKNOWLEDGEMENTS
This work was done within the PRIN project No.2008XWLWF9-005. FB acknowledges support fromCASPUR under the Standard HPC Grant 2012.
10
[1] Y. Kamihara, T. Watanabe, M. Hirano, and H. Hosono,J. Am. Chem. Soc. 130, 3296 (2008).
[2] I. I. Mazin and J. Schmalian, Physica C 469, 614 (2009).[3] I. I. Mazin, M. D. Johannes, L. Boeri, K. Koepernik, and
D. J. Singh, Phys. Rev. B 78, 085104 (2008).[4] I. I. Mazin, D. J. Singh, M. D. Johannes, and M. H. Du,
Phys. Rev. Lett. 101, 057003 (2008).[5] C.-T. Chen, C. C. Tsuei, M. B. Ketchen, Z.-A. Ren, and
Z. X. Zhao, Nature Phys. 6, 260 (2010).[6] D. S. Inosov, J. T. Park, P. Bourges, D. L. Sun,
Y. Sidis, A. Schneidewind, K. Hradil, D. Haug, C. T.Lin, B. Keimer, et al., Nature Phys. 6, 178 (2010).
[7] J.-P. Reid, M. A. Tanatar, X. G. Luo, H. Shakeripour,N. Doiron-Leyraud, N. Ni, S. L. Budko, P. C. Canfield,R. Prozorov, and L. Taillefer, Phys. rev. B 82, 064501(2010).
[8] R. Prozorov and V. G. Kogan, Rep. Prog. Phys. 74,124505 (2011).
[9] J.-P. Reid, M. A. Tanatar, X. G. Luo, H. Shak-eripour, S. Rene de Cotret, N. Doiron-Leyraud, J. Chang,B. Shen, H.-H. Wen, H. Kim, et al. (2011), unpublished,arXiv:1105.2232.
[10] P. J. Hirschfeld, M. M. Korshunov, and I. I. Mazin, Rep.Prog. Phys. 74, 124508 (2011).
[11] K. Kuroki, H. Usui, S. Onari, R. Arita, and H. Aoki,Phys. Rev. B 79, 224511 (2009).
[12] S. C. Lee, A. Kawabata, T. Moyoshi, Y. Kobayashi, andM. Sato, J. Phys. Soc. Jpn. 78, 043703 (2009).
[13] A. S. Sefat, A. Huq, M. A. McGuire, R. Jin, B. C. Sales,D. Mandrus, L. M. D. Cranswick, P. W. Stephens, andK. H. Stone, Phys. Rev. B 78, 104505 (2008).
[14] H.-H. Wen, G. Mu, L. Fang, H. Yang, and X. Zhu, Eu-rophys. Lett. 82, 17009 (2008).
[15] M. Tropeano, M. R. Cimberle, C. Ferdeghini, G. Lamura,A. Martinelli, A. Palenzona, I. Pallecchi, A. Sala,I. Sheikin, F. Bernardini, et al., Phys. Rev. B 81, 184504(2010).
[16] N. D. Zhigadlo, S. Katrych, M. Bendele, P. J. W. Moll,M. Tortello, S. Weyeneth, V. Y. Pomjakushin, J. Kanter,R. Puzniak, Z. Bukowski, et al., Phys. Rev. B 84, 134526(2011).
[17] M. A. McGuire, D. J. Singh, A. S. Sefat, B. C. Sales, andD. Mandrus, J. Solid State Chem. 182, 2326 (2009).
[18] S. C. Lee, E. Satomi, Y. Kobayashi, and M. Sato, J. Phys.Soc. Jpn. 79, 023702 (2010).
[19] S. Sanna, P. Carretta, P. Bonfa, G. Prando, G. Allodi,R. De Renzi, T. Shiroka, G. Lamura, A. Martinelli, andM. Putti, Phys. Rev. Lett. 107, 227003 (2011).
[20] R. S. Gonnelli, D. Daghero, M. Tortello, G. A. Um-marino, V. A. Stepanov, J. S. Kim, and R. K. Kremer,Phys. Rev. B 79, 184526 (2009).
[21] D. Daghero and R. Gonnelli, Supercond. Sci. Technol.23, 043001 (2010).
[22] Y. V. Sharvin, Zh. Eksp. Teor. Fiz. 48, 984 (1965), engl.Transl. Sov. Phys.-JETP 21, 655 (1965).
[23] D. Daghero, M. Tortello, R. S. Gonnelli, V. A. Stepanov,N. D. Zhigadlo, and J. Karpinski, Phys. Rev. B 80,060502(R) (2009).
[24] D. Daghero, M. Tortello, G. Ummarino, and R. S.
Gonnelli, Rep. Prog. Phys. 74, 124509 (2011).[25] G. Sheet, S. Mukhopadhyay, and P. Raychaudhuri, Phys.
Rev. B 69, 134507 (2004).[26] S. Kashiwaya, Y. Tanaka, M. Koyanagi, and K. Ka-
jimura, Phys. Rev. B 53, 2667 (1996).[27] Y. G. Naidyuk, O. E. Kvitnitskaya, I. K. Yanson,
G. Fuchs, S. Haindl, M. Kidszun, L. Schultz, andB. Holzapfel, Supercond. Sci. Technol. 24, 065010 (2010).
[28] M. Putti et al., in preparation.[29] G. E. Blonder, M. Tinkham, and T. M. Klapwijk, Phys.
Rev. B 25, 4515 (1982).[30] A. Plecenik, M. Grajcar, v. Benacka, P. Seidel, and
A. Pfuch, Phys. Rev. B 49, 10016 (1994).[31] G. A. Ummarino, M. Tortello, D. Daghero, and R. S.
Gonnelli, Phys. Rev. B 80, 172503 (2009).[32] G. A. Daghero, D. Ummarino, M. Tortello, D. Delaude,
R. S. Gonnelli, V. A. Stepanov, M. Monni, and A. Palen-zona, Supercond. Sci. Technol. 22, 025012 (2009).
[33] D. S. Inosov, J. T. Park, A. Charnukha, Y. Li, A. V.Boris, B. Keimer, and V. Hinkov, Phys. Rev. B 83,214520 (2011).
[34] J. P. Perdew and Y. Wang, Phys. Rev. B 45, 13244(1992).
[35] D. Singh, Phys. Rev. B 43, 6388 (1991).[36] E. Sjostedt, L. Nordstrom, and D. J. Singh, Solid State
Commun. 114, 15 (2000).[37] B. Blaha, K. Schwarz, G. K. H. Madsen, D. Kvasnicka,
and J. Luitz, WIEN2k: An Augmented Plane Wave PlusLocal Orbitals Program for Calculating Crystal Proper-ties, Techn. Universitt Wien, Wien, Austria (2001), seehttp://www.wien2k.at.
[38] P. E. Blochl, O. Jepsen, and O. K. Andersen, Phys. Rev.B 49, 16223 (1994).
[39] L. Yang, B. Xie, B. Zhou, Y. Zhang, Q. Ge, F. Wu,X. Wang, X. Chen, and D. Feng, J. Phys. Chem. Solids72, 460 (2011).
[40] G. A. Ummarino, Phys. Rev. B 83, 092508 (2011).[41] J. Paglione and R. L. Greene, Nature Phys. 6, 645 (2010).[42] M. Tortello, D. Daghero, G. A. Ummarino, V. A.
Stepanov, J. Jiang, J. D. Weiss, E. E. Hellstrom, andR. S. Gonnelli, Phys. Rev. Lett. 105, 237002 (2010).
[43] A. A. Golubov, A. Brinkman, Y. Tanaka, I. I. Mazin, andO. V. Dolgov, Phys. Rev. Lett. 103, 077003 (2009).
[44] Moreover, none of the curves we measured showed thefinite-energy peaks associated with quasiparticle inter-ference predicted, in some conditions, in the nodeless s±symmetry [43]. The occurrence and the voltage positionof these peaks is controlled, in the relevant theory, by amixing parameter α which has not been related yet to ex-perimental parameters. Therefore, either these peaks arenot present because the conditions for their observationare not fulfilled, or they are smeared out, particularly atthe Z values typical of our contacts, by the broadeningeffects.
[45] The BTK model provides reliable results also in the caseof parallel nano-junctions. Simulations show that the fitof the total conductance in this case gives “effective” pa-rameters. The “effective” gap turns out to be approxi-mately equal to the average of the gaps of the individualcontacts.
Copyright © 2022 FDOKUMEN


![Fast universal hashing on GPGPU calculation [RU]](https://static.fdokumen.com/doc/165x107/63365ee8ad6427665b0c2df6/fast-universal-hashing-on-gpgpu-calculation-ru.jpg)