Status of Key Australian Fish Stocks Reports 2012
420
Status of Key Australian Fish Stocks Reports 2012
-
Upload
khangminh22 -
Category
Documents
-
view
0 -
download
0
Transcript of Status of Key Australian Fish Stocks Reports 2012
Status ofKey Australian Fish Stocks Reports 2012
STATUS OF KEY AUSTRALIAN FISH STOCKS REPORTS 2012 - 2 -
Contributors
Department ofPrimary Industries
STATUS OF KEY AUSTRALIAN FISH STOCKS REPORTS 2012 - 3 -
Foreword
Fish are a valuable, limited, but renewable resource, which we must carefully manage for the benefit of all Australians, both present and future generations. Fish are not only a healthy and globally important food source, but also play an integral role in the fabric of our society, providing cultural and recreational opportunities for many.
In recent years, the Australian community has become increasingly aware of the need to conserve our natural aquatic resources (ocean, estuary, river, wetland and other aquatic habitats) and to maintain biological diversity in ecosystems that support fisheries and aquaculture.
Awareness is also increasing about the sustainable management of fisheries and how good research and management can allow historically overfished stocks to rebuild and recover. An area of growing public interest is the ability of aquatic environments to sustain catches of fish species to help meet growing world food needs, using both wild-capture and aquaculture fisheries, while at the same time ensuring that broader ecological needs are met.
We must remember that fish play an important role in Australia’s primary production landscape. For some time, Australians have recognised the need to manage our fish resources wisely, and Australia is a world leader in contemporary fisheries management. Australia also recognises the growing significance of food security as a global issue, and seafood production has a critical and increasing role to play. Just as we have allocated areas of land for farming, we must set aside parts of our marine environment for fishing and aquaculture activities. These areas and their resources must be managed for ecologically sustainable food production.
It is with this focus that the Fisheries Research and Development Corporation commissioned the development of the first national Status of key Australian fish stocks reports. The reports were prepared by the Australian Bureau of Agricultural and Resource Economics and Sciences, in collaboration with government fishery research agencies in all Australian jurisdictions with marine fisheries. Over 80 researchers contributed to this first edition.
Forty-nine species chapters are presented, providing short summaries, based on scientific assessments, of stock status of species or species complexes. The species in these initial reports were selected on the basis of their contribution to Australian fisheries, in terms of both value and quantity of catch.
The Status of key Australian fish stocks reports do not aim to be an eco-labelling guide, but rather a scientifically robust, simple tool to inform fishers, seafood consumers, managers, policy makers and the broader community, and allow ready comparisons between the status of the key wild-caught fish stocks around Australia.
Ian Curnow Chair, Australian Fisheries Management Forum
The Hon. Harry Woods Chair of the Fisheries Research and Development Corporation Board of Directors
December 2012
STATUS OF KEY AUSTRALIAN FISH STOCKS REPORTS 2012 - 4 -
Acknowledgments Inside front coverContributors 2Foreword 3Summary 7Introduction 19Fishing methods 32
Molluscs 67
Abalones 691. Blacklip Abalone Haliotis rubra 702. Greenlip Abalone Haliotis laevigata 79
Scallops 873. Commercial Scallop Pecten fumatus 884. Saucer Scallop Amusium balloti 94
Squids 1035. Gould’s Squid Nototodarus gouldi 1046. Southern Calamari Sepioteuthis australis 109
Crustaceans 115
Crabs 1177. Blue Swimmer Crab Portunus armatus 1188. Giant Crab Pseudocarcinus gigas 1269. Mud Crab Scylla serrata, S. olivacea 131
Lobsters & Bugs 13910. Balmain Bug Ibacus alticrenatus, I. brucei, I. chacei, I. peronii 14011. Moreton Bay Bug Thenus australiensis, T. parindicus 14512. Eastern Rocklobster Sagmariasus verreauxi 15113. Southern Rocklobster Jasus edwardsii 15614. Tropical Rocklobster Panulirus ornatus 16215. Western Rocklobster Panulirus cygnus 167
Prawns 17316. Eastern King Prawn Melicertus plebejus 17417. Blue and Red Endeavour Prawns Metapenaeus endeavouri, M. ensis 17918. Tiger Prawns Penaeus esculentus, P. semisulcatus 18619. Western King Prawn Melicertus latisulcatus 19320. White Banana Prawn Fenneropenaeus merguiensis 201
Contents
STATUS OF KEY AUSTRALIAN FISH STOCKS REPORTS 2012 - 5 -
Sharks 20921. Blacktip Shark Carcharhinus tilstoni, C. limbatus, C. sorrah 21222. Dusky Shark Carcharhinus obscurus 21823. Gummy Shark Mustelus antarcticus 22524. Sandbar Shark Carcharhinus plumbeus 23125. School Shark Galeorhinus galeus 236
Finfish 24326. Australian Salmon Arripis trutta, A. truttaceus 24627. Barramundi Lates calcarifer 25428. Blue Grenadier Macruronus novaezelandiae 26029. Coral Trout Plectropomus spp., Variola spp. 26630. Australian Sardine Sardinops sagax 27231. Sea Mullet Mugil cephalus 28032. Spanish Mackerel Scomberomorus commerson 285
Flathead 29333. Deepwater Flathead Neoplatycephalus conatus 29434. Dusky Flathead Platycephalus fuscus 29935. Tiger Flathead Neoplatycephalus richardsoni 305
Snappers & Emperors 31136. Crimson Snapper Lutjanus erythropterus 31237. Goldband Snapper Pristipomoides multidens 31838. Red Emperor Lutjanus sebae 32539. Redthroat Emperor Lethrinus miniatus 33240. Saddletail Snapper Lutjanus malabaricus 33741. Snapper Pagrus auratus 344
Tuna & Billfish 35742. Bigeye Tuna Thunnus obesus 35843. Southern Bluefin Tuna Thunnus maccoyii 36344. Yellowfin Tuna Thunnus albacares 36845. Swordfish Xiphias gladius 373
Whiting 37946. King George Whiting Sillaginodes punctata 38047. Sand Whiting Sillago ciliata 38648. Eastern School Whiting Sillago flindersi 39149. Stout Whiting Sillago robusta 396
Glossary 403

STATUS OF KEY AUSTRALIAN FISH STOCKS REPORTS 2012 - 7 -
The Status of key Australian fish stocks reports assess the biological sustainability of the key wild caught fish stocks against a nationally agreed framework. In short, for the key fish stocks the reports examine whether the abundance of fish (or biomass) and the level of harvest from the stock are sustainable. This initial edition of the reports is the first step towards national fishery-wide reporting, that will consider other aspects of ecologically sustainable development, such as the effects of fishing on the marine environment, economic performance and governance. While these issues are not considered in the stock status classifications, the reports provide comments on the effects of fishing on the marine environment and environmental effects on the stocks.
Australia has one of the largest marine domains in the world, covering an area larger than the Australian mainland. We also have a long history of Indigenous, commercial and recreational fishing in our waters. Over the past decade, Australia’s fisheries production, both wild-capture and aquaculture, has generated, on average, $2.65 billion per year. In 2010–11, wild-capture fisheries contributed 59 per cent of the total value of Australia’s fisheries production ($1.3 billion) and produced more than 160 000 tonnes (t) of seafood, for local, domestic and export markets.
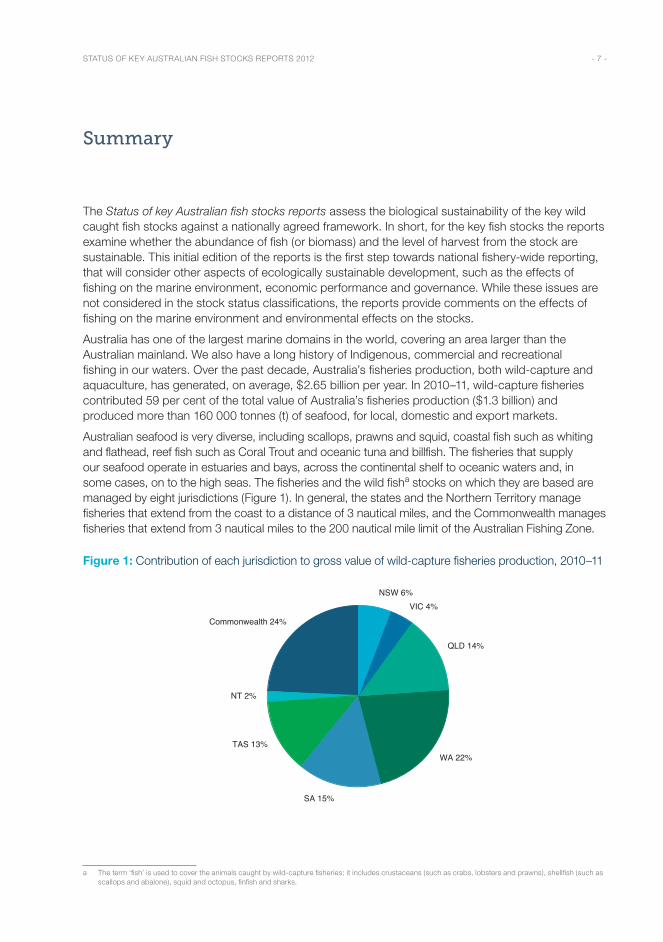
Australian seafood is very diverse, including scallops, prawns and squid, coastal fish such as whiting and flathead, reef fish such as Coral Trout and oceanic tuna and billfish. The fisheries that supply our seafood operate in estuaries and bays, across the continental shelf to oceanic waters and, in some cases, on to the high seas. The fisheries and the wild fisha stocks on which they are based are managed by eight jurisdictions (Figure 1). In general, the states and the Northern Territory manage fisheries that extend from the coast to a distance of 3 nautical miles, and the Commonwealth manages fisheries that extend from 3 nautical miles to the 200 nautical mile limit of the Australian Fishing Zone.
Figure 1: Contribution of each jurisdiction to gross value of wild-capture fisheries production, 2010–11
Commonwealth 24%
NT 2%
TAS 13%
SA 15%
WA 22%
QLD 14%
VIC 4%NSW 6%
a The term ‘fish’ is used to cover the animals caught by wild-capture fisheries; it includes crustaceans (such as crabs, lobsters and prawns), shellfish (such as scallops and abalone), squid and octopus, finfish and sharks.
Summary
STATUS OF KEY AUSTRALIAN FISH STOCKS REPORTS 2012 - 8 -
The productivity and sustainability of wild-capture fisheries depend on the wild fish stocks and marine ecosystems that support the fish. Fish species tend to form relatively discrete populations in different geographical areas that are referred to as biological stocks. Since separate biological stocks have limited interbreeding, fishing one may not directly affect others. The size and distribution of individual biological stocks vary greatly between species. For example, Southern Bluefin Tuna comprises a single biological stock that spans much of the world’s southern oceans. In comparison, hundreds to many thousands of separate biological stocks of Blacklip Abalone are thought to exist in Australia. A key aim of fisheries management is to ensure that biological stocks are maintained at sustainable levels. Although state/territory and Commonwealth jurisdictional boundaries may be appropriate from a governance perspective, many biological stocks straddle these boundaries, spanning the waters of more than one jurisdiction. The same fish species may be caught in several jurisdictions, in several fisheries and, in some cases, also outside Australian waters. The catch in the different jurisdictions may be from separate biological stocks of the species, which have little interaction, or from a single biological stock. Therefore, a national approach to assessing and reporting on the status of fish stocks is critical to understanding the state of wild-caught fish stocks and Australian fisheries management.
The stock status classifications presented in the Status of key Australian fish stocks reports are at the biological stock level wherever possible, even where a biological stock spans the waters of more than one Australian jurisdiction—that is, shared stocks. This recognises the biological boundaries of fish stocks rather than manmade boundaries of management units or jurisdictions. Where insufficient information was available to determine biological stock structure or where large numbers of small biological stocks made biological stock–based assessments impractical, stock status assessments were made at the level of management unit (i.e. individual fisheries, a group of fisheries or a region defined by management) or jurisdiction. Within the reports the term ‘stock status’ is applied generically to the status of biological stocks, management units and populations assessed at the jurisdictional level.
The Status of key Australian fish stocks reports 2012 are the first national reports on the status of Australian wild-caught fish stocks. The reports provide stock status assessments for 49 wild-caught species (or species complexes, in some cases) that contribute around 70 per cent of the annual catch and 80 per cent of the value of Australian wild-capture fisheries. The reports represent a significant step towards a national approach to reporting for Australian fisheries. These inaugural reports focus on the status of fish stocks based on five categories: sustainable stock, overfished stock, transitional–recovering stock, transitional–depleting stock and undefined stock. Future reports are envisaged to consider a larger number of species.
Traditionally, fishery status reporting has been undertaken separately within each Australian jurisdiction for commercial wild-capture fisheries. The jurisdictional reports use differing terminology and reference points to classify fish stocks. The Status of key Australian fish stocks reports present assessments of stock status using a nationally agreed framework, to improve consistency in reporting across jurisdictions. At present, separate jurisdictional reports, such as the Fishery status reports produced for Commonwealth fisheries by the Australian Bureau of Agricultural and Resource Economics and Sciences (ABARES), will continue to be produced to meet legislative and policy requirements specific to each jurisdiction. For Commonwealth fish stocks, the inaugural Status of key Australian fish stocks reports consider equivalent biological information to that presented in the Fishery status reports 2010 but present classifications based on the nationally agreed classification framework. In developing the Status of key Australian fish stocks reports, several jurisdictions have reviewed their status determination processes and are modifying their jurisdictional reports to follow the framework applied in the national reports, where possible. As future editions of the Status of key Australian fish stocks reports are produced, increased coverage (i.e. including more species and reporting on fishery-level issues) may lead to a reduced requirement for separate jurisdictional reports.
STATUS OF KEY AUSTRALIAN FISH STOCKS REPORTS 2012 - 9 -
National framework for stock status reporting
The national reporting framework used in the Status of key Australian fish stocks reports was developed collaboratively by fisheries scientists from around Australia. This framework uses standardised terminology and reference points for stock status classifications. Wherever possible, the classifications are presented at the biological stock level, even where a biological stock spans the waters of more than one Australian jurisdiction (i.e. shared stocks). This level of reporting aims to recognise the biological boundaries of fish stocks rather than manmade boundaries of management units (i.e. fisheries) or jurisdictions (i.e. the borders of the waters of the Commonwealth, the states or the Northern Territory). The biological stock level of reporting recognises that all Australian fisheries for a particular species may not be of the same biological stock; for example, fishing for Tiger Prawns on the east coast of Queensland has no impact on the status of Tiger Prawns stocks in the Gulf of Carpentaria. Jurisdictional fishery status reports do not always present status at the biological stock level. In the Status of key Australian fish stocks reports, reporting was undertaken at the level of manmade management units or within jurisdictional boundaries only in cases where biological stock delineation is not known (i.e. it is not known exactly where one stock finishes and the next begins) or the numbers of stocks for a species are very high. The term ‘stock status’ is used throughout to refer generically to all three levels of stock status assessment, i.e. biological stocks, management units and populations assessed at the jurisdictional level.
The national framework for these reports considers both the abundance (number or biomass [weight]) of fish in a stock and the level of fishing pressure (rate of fishing) applied to a stock. The status classifications assess whether the current abundance of fish in a stock is adequate—that is, whether there is a large enough proportion of the original adult stock remaining that the production of juveniles is not significantly reduced. They also assess whether the amount of fish currently being removed through fishing is adequately controlled to ensure that stock abundance is not reduced to a point where production of juveniles is significantly reduced. The framework makes these assessments against the biomass reference point of ‘recruitment overfished’, which is the point at which the spawning stock biomass has been reduced by fishing so that average recruitment levels are significantly reduced. There are five classification categories (refer to Introduction for full description):
• Sustainable stock—indicates that biomass (or biomass proxy) is at a level sufficient to ensure that, on average, future levels of recruitment are adequate (i.e. not recruitment overfished) and that fishing pressure is adequately controlled to avoid the stock becoming recruitment overfished.
• Transitional–recovering stock—indicates that biomass is recruitment overfished, but management measures are in place to promote stock recovery, and recovery is occurring.
• Transitional–depleting stock—indicates that biomass is not yet recruitment overfished, but fishing pressure is too high and moving the stock in the direction of becoming recruitment overfished.
• Overfished stock—indicates that the stock is recruitment overfished and current management is not adequate to recover the stock, or that adequate management measures have been put in place but have not yet resulted in measurable improvements.
• Undefined stock—indicates that not enough information exists to determine stock status.
STATUS OF KEY AUSTRALIAN FISH STOCKS REPORTS 2012 - 10 -
Key results
In total, 150 stock status assessments were undertaken across the 49 species chapters, with assessments undertaken at the biological stock level, wherever possible.
A stock status classification could be determined from 111 of the stocks assessed. The remaining 39 were classified as undefined stocks. The undefined stock classification does not necessarily mean the stock is at increased risk. It means that there is limited or conflicting information available to undertake the assessment.
Of the 111 stock status classifications that could be assigned, 98 stocks were assessed as being sustainable stocks, 8 transitional–recovering stocks, 3 transitional–depleting stocks, and 2 overfished stocks (Tables 1 and 2). The two stocks classified as overfished are the Southern Bluefin Tuna stock and the School Shark stock.
There were 81 stock status assessments carried out at the biological stock level. Of these, 53 biological stocks were considered sustainable stocks, 5 transitional–recovering stocks, 3 transitional–depleting stocks, 2 overfished stocks, and 18 undefined stocks (Tables 1 and 2).
Sixty-nine stock status assessments could not be carried out at the biological stock level. Of these, 45 stock status assessments are presented at the management unit level and 24 at the jurisdiction level.
Of the 45 stock status assessments carried out at the management unit level, 35 management units were considered to be sustainable stocks and 2 transitional–recovering stocks; none were classified as transitional–depleting stocks or overfished stocks, and 8 were undefined stocks (Tables 1 and 2).
Of the 24 jurisdiction-based stock status assessments, 10 assessments were considered sustainable stocks and 1 transitional–recovering stock; none were classified as transitional–depleting stocks or overfished stocks, and 13 were undefined stocks (Tables 1 and 2).
The total volume of catch reported in the Status of key Australian fish stocks reports from Australian managed fisheries is 121 230 t. This volume represents over 70 per cent of the total Australian wild catch reported in 2009–10 (i.e. 173 340 t). The 121 230 t total does not include international catches (i.e. catch taken outside Australian waters by countries other than Australia) of the tuna and billfish species that are reported in the Status of key Australian fish stocks reports. The Australian catch of these species is small in comparison to the international catch.
Of the Australian catch reported in the Status of key Australian fish stocks reports, 91 per cent is from sustainable stocks, less than 1 per cent is from transitional–recovering stocks, less than 1 per cent from transitional–depleting stocks, 3.5 per cent is from overfished stocks, and 4.5 per cent is from undefined stocks (Table 2).
In future editions of the Status of key Australian fish stocks reports, it is intended that most species currently assessed for stock status at the level of management unit or jurisdiction will be assessed at the biological stock level, where research has revealed the biological stock boundaries.
In addition to assessing the status of the species, the Status of key Australian fish stocks reports provide key statistics and main features of the fisheries that target each species, the effects of fishing on the marine environment and environmental effects on fish stocks .
STATUS OF KEY AUSTRALIAN FISH STOCKS REPORTS 2012 - 11 -
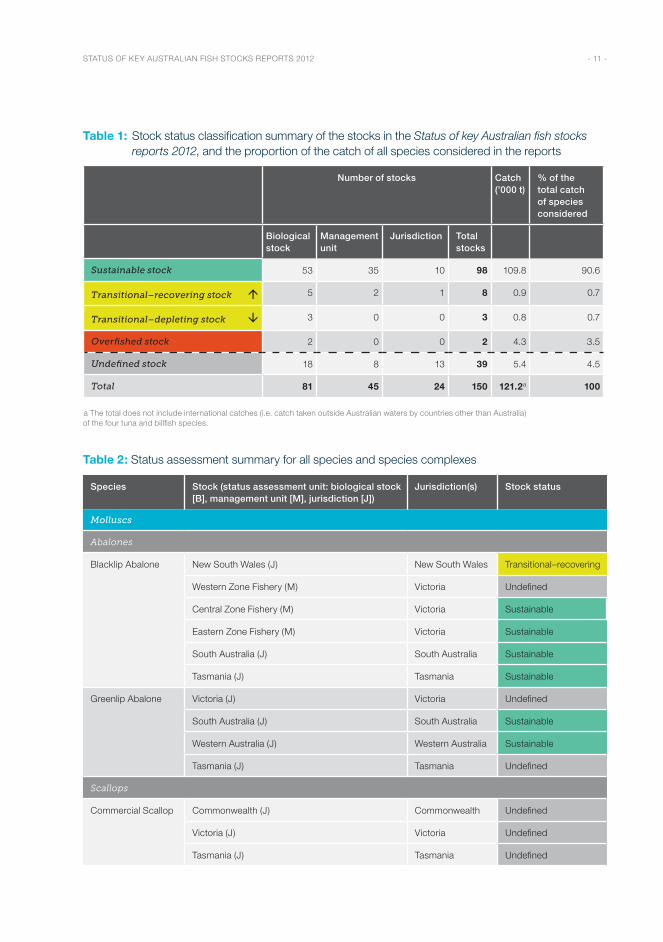
Table 1: Stock status classification summary of the stocks in the Status of key Australian fish stocks reports 2012, and the proportion of the catch of all species considered in the reports
Number of stocks Catch (’000 t)
% of the total catch of species considered
Biological stock
Management unit
Jurisdiction Total stocks
Sustainable stock 53 35 10 98 109.8 90.6
Transitional–recovering stock á 5 2 1 8 0.9 0.7
Transitional–depleting stock â 3 0 0 3 0.8 0.7
Overfished stock 2 0 0 2 4.3 3.5
Undefined stock 18 8 13 39 5.4 4.5
Total 81 45 24 150 121.2a 100
a The total does not include international catches (i.e. catch taken outside Australian waters by countries other than Australia) of the four tuna and billfish species.
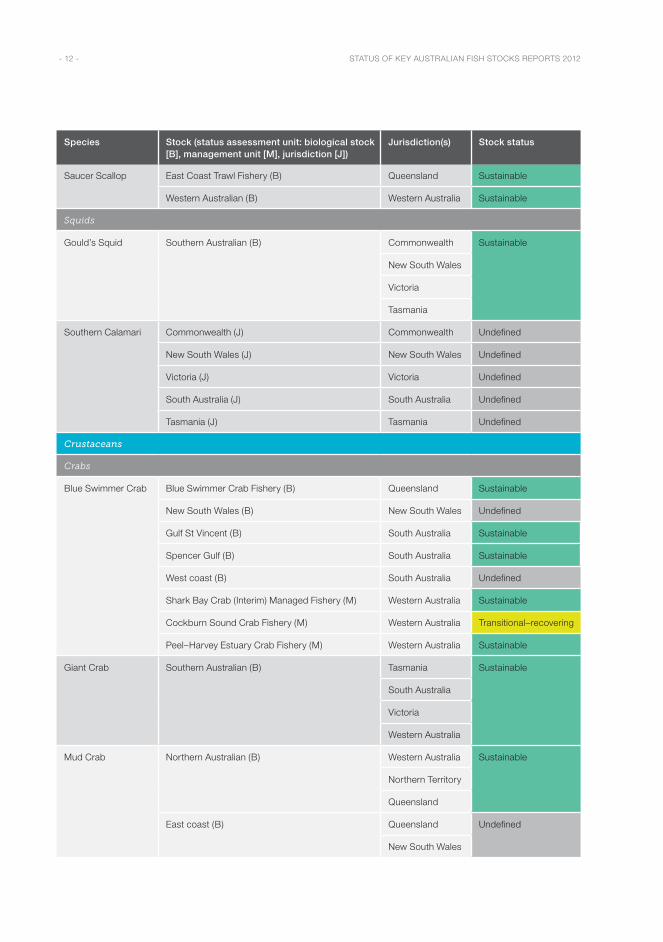
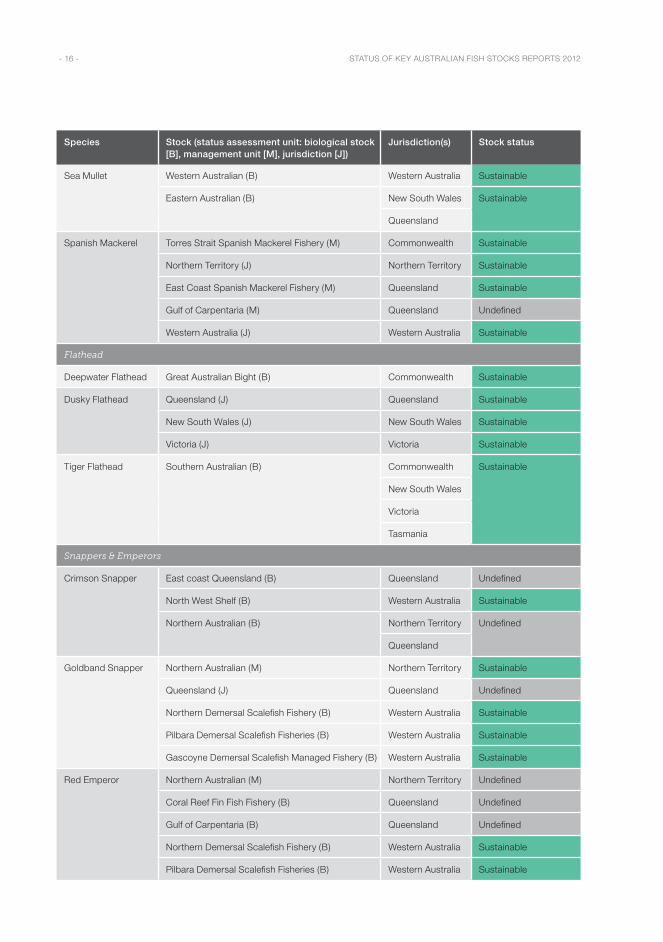
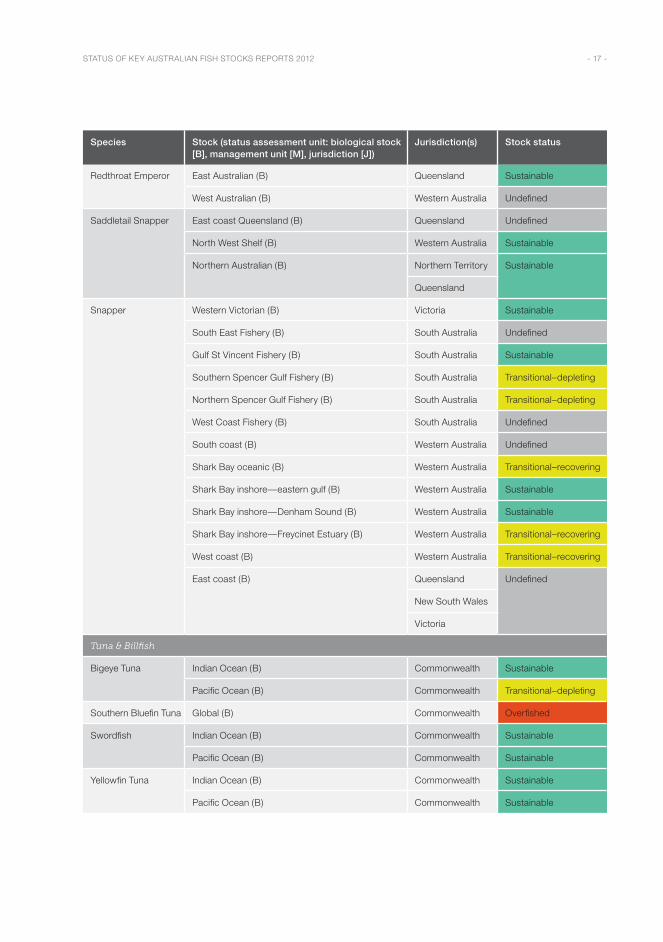
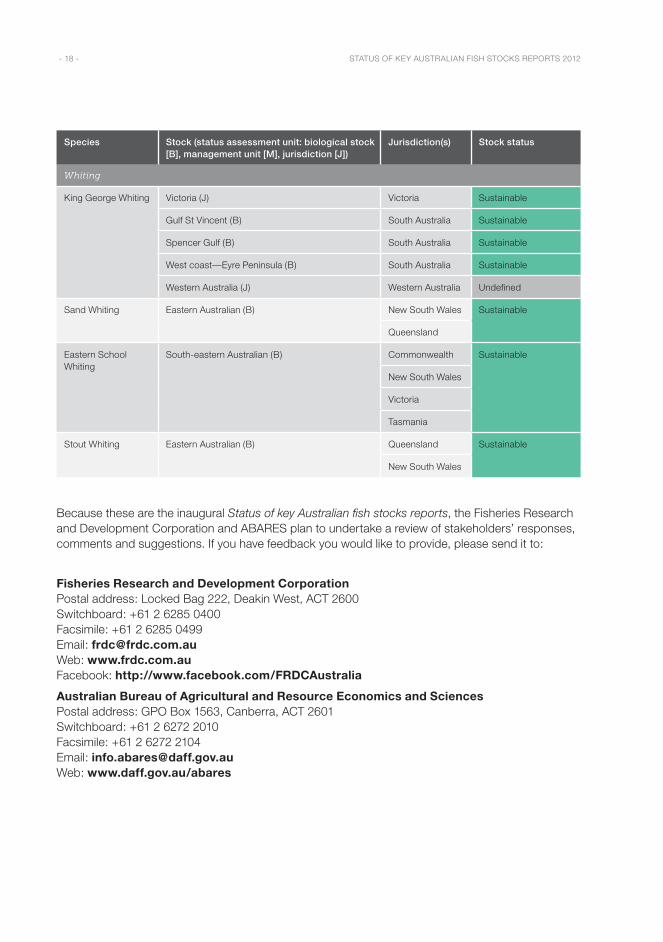
Table 2: Status assessment summary for all species and species complexes
Species Stock (status assessment unit: biological stock [B], management unit [M], jurisdiction [J])
Jurisdiction(s) Stock status
Molluscs
Abalones
Blacklip Abalone New South Wales (J) New South Wales Transitional–recovering
Western Zone Fishery (M) Victoria Undefined
Central Zone Fishery (M) Victoria Sustainable
Eastern Zone Fishery (M) Victoria Sustainable
South Australia (J) South Australia Sustainable
Tasmania (J) Tasmania Sustainable
Greenlip Abalone Victoria (J) Victoria Undefined
South Australia (J) South Australia Sustainable
Western Australia (J) Western Australia Sustainable
Tasmania (J) Tasmania Undefined
Scallops
Commercial Scallop Commonwealth (J) Commonwealth Undefined
Victoria (J) Victoria Undefined
Tasmania (J) Tasmania Undefined
STATUS OF KEY AUSTRALIAN FISH STOCKS REPORTS 2012 - 12 -
Species Stock (status assessment unit: biological stock [B], management unit [M], jurisdiction [J])
Jurisdiction(s) Stock status
Saucer Scallop East Coast Trawl Fishery (B) Queensland Sustainable
Western Australian (B) Western Australia Sustainable
Squids
Gould’s Squid Southern Australian (B) Commonwealth Sustainable
New South Wales
Victoria
Tasmania
Southern Calamari Commonwealth (J) Commonwealth Undefined
New South Wales (J) New South Wales Undefined
Victoria (J) Victoria Undefined
South Australia (J) South Australia Undefined
Tasmania (J) Tasmania Undefined
Crustaceans
Crabs
Blue Swimmer Crab Blue Swimmer Crab Fishery (B) Queensland Sustainable
New South Wales (B) New South Wales Undefined
Gulf St Vincent (B) South Australia Sustainable
Spencer Gulf (B) South Australia Sustainable
West coast (B) South Australia Undefined
Shark Bay Crab (Interim) Managed Fishery (M) Western Australia Sustainable
Cockburn Sound Crab Fishery (M) Western Australia Transitional–recovering
Peel–Harvey Estuary Crab Fishery (M) Western Australia Sustainable
Giant Crab Southern Australian (B) Tasmania Sustainable
South Australia
Victoria
Western Australia
Mud Crab Northern Australian (B) Western Australia Sustainable
Northern Territory
Queensland
East coast (B) Queensland Undefined
New South Wales
STATUS OF KEY AUSTRALIAN FISH STOCKS REPORTS 2012 - 13 -
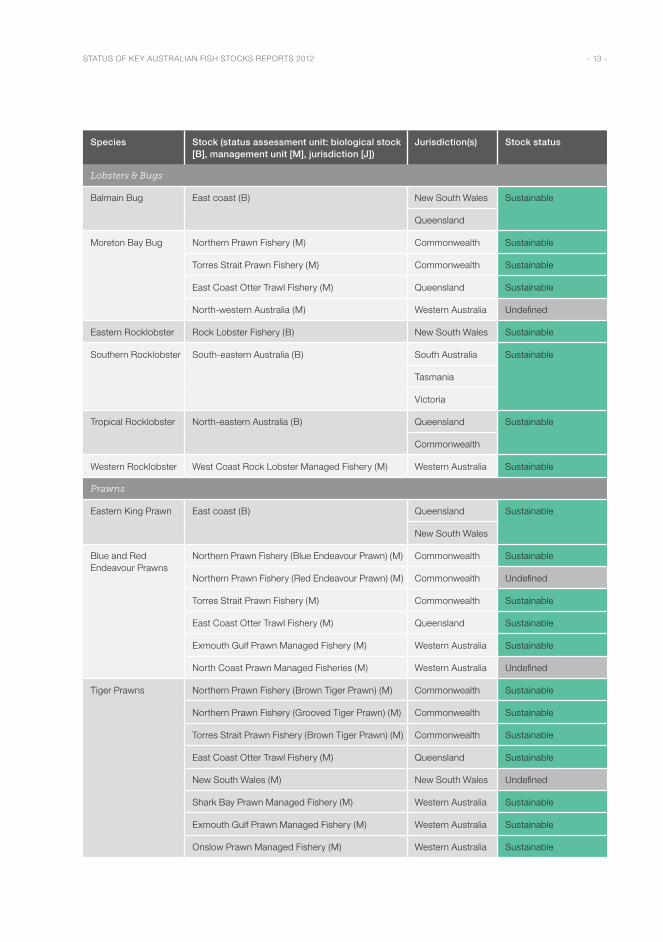
Species Stock (status assessment unit: biological stock [B], management unit [M], jurisdiction [J])
Jurisdiction(s) Stock status
Lobsters & Bugs
Balmain Bug East coast (B) New South Wales Sustainable
Queensland
Moreton Bay Bug Northern Prawn Fishery (M) Commonwealth Sustainable
Torres Strait Prawn Fishery (M) Commonwealth Sustainable
East Coast Otter Trawl Fishery (M) Queensland Sustainable
North-western Australia (M) Western Australia Undefined
Eastern Rocklobster Rock Lobster Fishery (B) New South Wales Sustainable
Southern Rocklobster South-eastern Australia (B) South Australia Sustainable
Tasmania
Victoria
Tropical Rocklobster North-eastern Australia (B) Queensland Sustainable
Commonwealth
Western Rocklobster West Coast Rock Lobster Managed Fishery (M) Western Australia Sustainable
Prawns
Eastern King Prawn East coast (B) Queensland Sustainable
New South Wales
Blue and Red Endeavour Prawns
Northern Prawn Fishery (Blue Endeavour Prawn) (M) Commonwealth Sustainable
Northern Prawn Fishery (Red Endeavour Prawn) (M) Commonwealth Undefined
Torres Strait Prawn Fishery (M) Commonwealth Sustainable
East Coast Otter Trawl Fishery (M) Queensland Sustainable
Exmouth Gulf Prawn Managed Fishery (M) Western Australia Sustainable
North Coast Prawn Managed Fisheries (M) Western Australia Undefined
Tiger Prawns Northern Prawn Fishery (Brown Tiger Prawn) (M) Commonwealth Sustainable
Northern Prawn Fishery (Grooved Tiger Prawn) (M) Commonwealth Sustainable
Torres Strait Prawn Fishery (Brown Tiger Prawn) (M) Commonwealth Sustainable
East Coast Otter Trawl Fishery (M) Queensland Sustainable
New South Wales (M) New South Wales Undefined
Shark Bay Prawn Managed Fishery (M) Western Australia Sustainable
Exmouth Gulf Prawn Managed Fishery (M) Western Australia Sustainable
Onslow Prawn Managed Fishery (M) Western Australia Sustainable
STATUS OF KEY AUSTRALIAN FISH STOCKS REPORTS 2012 - 14 -
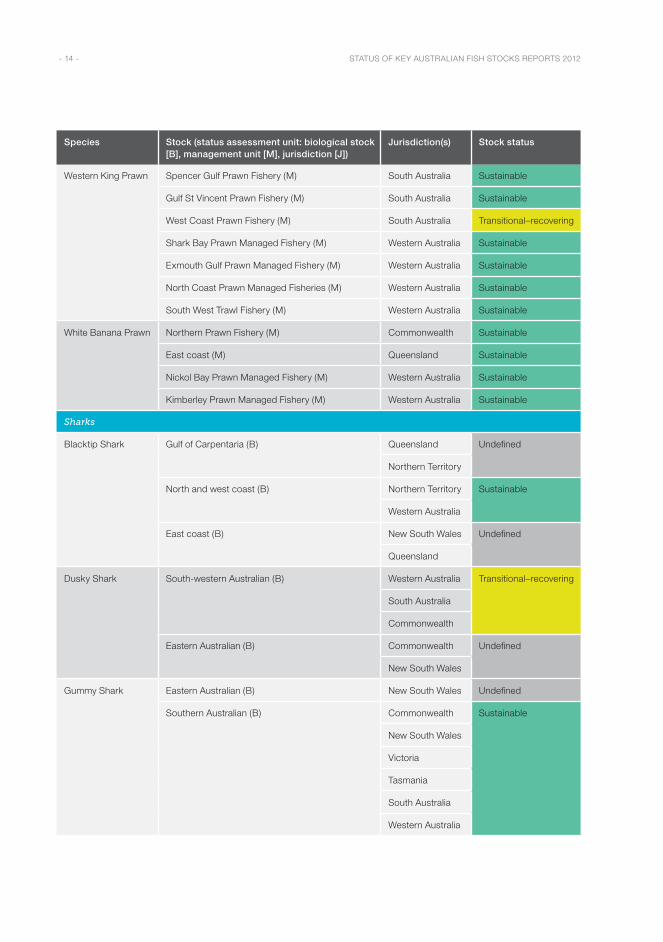
Species Stock (status assessment unit: biological stock [B], management unit [M], jurisdiction [J])
Jurisdiction(s) Stock status
Western King Prawn Spencer Gulf Prawn Fishery (M) South Australia Sustainable
Gulf St Vincent Prawn Fishery (M) South Australia Sustainable
West Coast Prawn Fishery (M) South Australia Transitional–recovering
Shark Bay Prawn Managed Fishery (M) Western Australia Sustainable
Exmouth Gulf Prawn Managed Fishery (M) Western Australia Sustainable
North Coast Prawn Managed Fisheries (M) Western Australia Sustainable
South West Trawl Fishery (M) Western Australia Sustainable
White Banana Prawn Northern Prawn Fishery (M) Commonwealth Sustainable
East coast (M) Queensland Sustainable
Nickol Bay Prawn Managed Fishery (M) Western Australia Sustainable
Kimberley Prawn Managed Fishery (M) Western Australia Sustainable
Sharks
Blacktip Shark Gulf of Carpentaria (B) Queensland Undefined
Northern Territory
North and west coast (B) Northern Territory Sustainable
Western Australia
East coast (B) New South Wales Undefined
Queensland
Dusky Shark South-western Australian (B) Western Australia Transitional–recovering
South Australia
Commonwealth
Eastern Australian (B) Commonwealth Undefined
New South Wales
Gummy Shark Eastern Australian (B) New South Wales Undefined
Southern Australian (B) Commonwealth Sustainable
New South Wales
Victoria
Tasmania
South Australia
Western Australia
STATUS OF KEY AUSTRALIAN FISH STOCKS REPORTS 2012 - 15 -
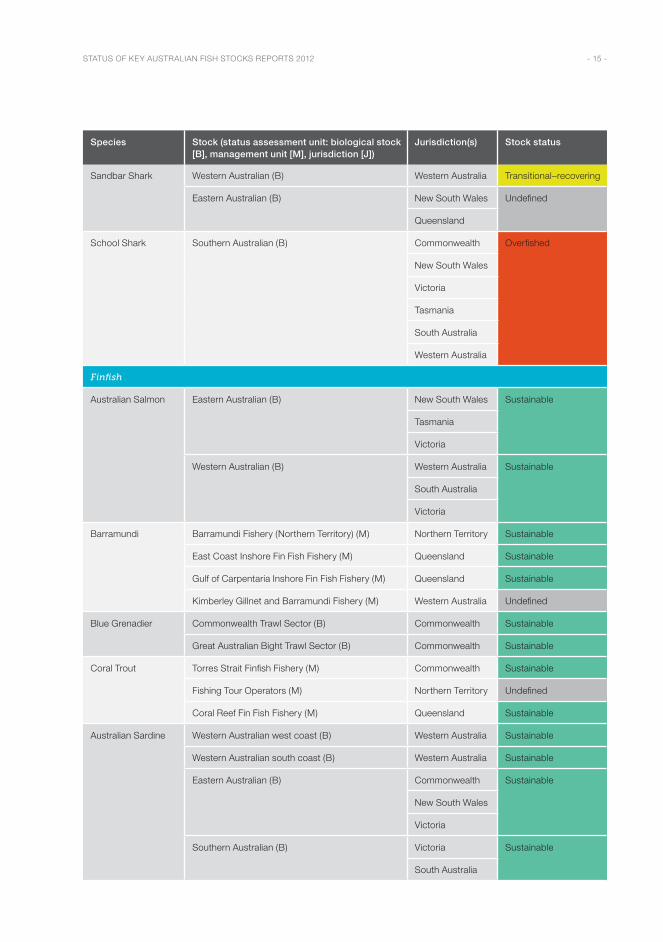
Species Stock (status assessment unit: biological stock [B], management unit [M], jurisdiction [J])
Jurisdiction(s) Stock status
Sandbar Shark Western Australian (B) Western Australia Transitional–recovering
Eastern Australian (B) New South Wales Undefined
Queensland
School Shark Southern Australian (B) Commonwealth Overfished
New South Wales
Victoria
Tasmania
South Australia
Western Australia
Finfish
Australian Salmon Eastern Australian (B) New South Wales Sustainable
Tasmania
Victoria
Western Australian (B) Western Australia Sustainable
South Australia
Victoria
Barramundi Barramundi Fishery (Northern Territory) (M) Northern Territory Sustainable
East Coast Inshore Fin Fish Fishery (M) Queensland Sustainable
Gulf of Carpentaria Inshore Fin Fish Fishery (M) Queensland Sustainable
Kimberley Gillnet and Barramundi Fishery (M) Western Australia Undefined
Blue Grenadier Commonwealth Trawl Sector (B) Commonwealth Sustainable
Great Australian Bight Trawl Sector (B) Commonwealth Sustainable
Coral Trout Torres Strait Finfish Fishery (M) Commonwealth Sustainable
Fishing Tour Operators (M) Northern Territory Undefined
Coral Reef Fin Fish Fishery (M) Queensland Sustainable
Australian Sardine Western Australian west coast (B) Western Australia Sustainable
Western Australian south coast (B) Western Australia Sustainable
Eastern Australian (B) Commonwealth Sustainable
New South Wales
Victoria
Southern Australian (B) Victoria Sustainable
South Australia
STATUS OF KEY AUSTRALIAN FISH STOCKS REPORTS 2012 - 16 -
Species Stock (status assessment unit: biological stock [B], management unit [M], jurisdiction [J])
Jurisdiction(s) Stock status
Sea Mullet Western Australian (B) Western Australia Sustainable
Eastern Australian (B) New South Wales Sustainable
Queensland
Spanish Mackerel Torres Strait Spanish Mackerel Fishery (M) Commonwealth Sustainable
Northern Territory (J) Northern Territory Sustainable
East Coast Spanish Mackerel Fishery (M) Queensland Sustainable
Gulf of Carpentaria (M) Queensland Undefined
Western Australia (J) Western Australia Sustainable
Flathead
Deepwater Flathead Great Australian Bight (B) Commonwealth Sustainable
Dusky Flathead Queensland (J) Queensland Sustainable
New South Wales (J) New South Wales Sustainable
Victoria (J) Victoria Sustainable
Tiger Flathead Southern Australian (B) Commonwealth Sustainable
New South Wales
Victoria
Tasmania
Snappers & Emperors
Crimson Snapper East coast Queensland (B) Queensland Undefined
North West Shelf (B) Western Australia Sustainable
Northern Australian (B) Northern Territory Undefined
Queensland
Goldband Snapper Northern Australian (M) Northern Territory Sustainable
Queensland (J) Queensland Undefined
Northern Demersal Scalefish Fishery (B) Western Australia Sustainable
Pilbara Demersal Scalefish Fisheries (B) Western Australia Sustainable
Gascoyne Demersal Scalefish Managed Fishery (B) Western Australia Sustainable
Red Emperor Northern Australian (M) Northern Territory Undefined
Coral Reef Fin Fish Fishery (B) Queensland Undefined
Gulf of Carpentaria (B) Queensland Undefined
Northern Demersal Scalefish Fishery (B) Western Australia Sustainable
Pilbara Demersal Scalefish Fisheries (B) Western Australia Sustainable
STATUS OF KEY AUSTRALIAN FISH STOCKS REPORTS 2012 - 17 -
Species Stock (status assessment unit: biological stock [B], management unit [M], jurisdiction [J])
Jurisdiction(s) Stock status
Redthroat Emperor East Australian (B) Queensland Sustainable
West Australian (B) Western Australia Undefined
Saddletail Snapper East coast Queensland (B) Queensland Undefined
North West Shelf (B) Western Australia Sustainable
Northern Australian (B) Northern Territory Sustainable
Queensland
Snapper Western Victorian (B) Victoria Sustainable
South East Fishery (B) South Australia Undefined
Gulf St Vincent Fishery (B) South Australia Sustainable
Southern Spencer Gulf Fishery (B) South Australia Transitional–depleting
Northern Spencer Gulf Fishery (B) South Australia Transitional–depleting
West Coast Fishery (B) South Australia Undefined
South coast (B) Western Australia Undefined
Shark Bay oceanic (B) Western Australia Transitional–recovering
Shark Bay inshore—eastern gulf (B) Western Australia Sustainable
Shark Bay inshore—Denham Sound (B) Western Australia Sustainable
Shark Bay inshore—Freycinet Estuary (B) Western Australia Transitional–recovering
West coast (B) Western Australia Transitional–recovering
East coast (B) Queensland Undefined
New South Wales
Victoria
Tuna & Billfish
Bigeye Tuna Indian Ocean (B) Commonwealth Sustainable
Pacific Ocean (B) Commonwealth Transitional–depleting
Southern Bluefin Tuna Global (B) Commonwealth Overfished
Swordfish Indian Ocean (B) Commonwealth Sustainable
Pacific Ocean (B) Commonwealth Sustainable
Yellowfin Tuna Indian Ocean (B) Commonwealth Sustainable
Pacific Ocean (B) Commonwealth Sustainable
STATUS OF KEY AUSTRALIAN FISH STOCKS REPORTS 2012 - 18 -
Species Stock (status assessment unit: biological stock [B], management unit [M], jurisdiction [J])
Jurisdiction(s) Stock status
Whiting
King George Whiting Victoria (J) Victoria Sustainable
Gulf St Vincent (B) South Australia Sustainable
Spencer Gulf (B) South Australia Sustainable
West coast—Eyre Peninsula (B) South Australia Sustainable
Western Australia (J) Western Australia Undefined
Sand Whiting Eastern Australian (B) New South Wales Sustainable
Queensland
Eastern School Whiting
South-eastern Australian (B) Commonwealth Sustainable
New South Wales
Victoria
Tasmania
Stout Whiting Eastern Australian (B) Queensland Sustainable
New South Wales
Because these are the inaugural Status of key Australian fish stocks reports, the Fisheries Research and Development Corporation and ABARES plan to undertake a review of stakeholders’ responses, comments and suggestions. If you have feedback you would like to provide, please send it to:
Fisheries Research and Development Corporation Postal address: Locked Bag 222, Deakin West, ACT 2600 Switchboard: +61 2 6285 0400 Facsimile: +61 2 6285 0499 Email: [email protected] Web: www.frdc.com.au Facebook: http://www.facebook.com/FRDCAustralia
Australian Bureau of Agricultural and Resource Economics and Sciences Postal address: GPO Box 1563, Canberra, ACT 2601 Switchboard: +61 2 6272 2010 Facsimile: +61 2 6272 2104 Email: [email protected] Web: www.daff.gov.au/abares
STATUS OF KEY AUSTRALIAN FISH STOCKS REPORTS 2012 - 19 -
Authors
Matthew Flood, Ilona Stobutzki, James Andrews, Crispian Ashby, Gavin Begg, Rick Fletcher, David Galeano, Caleb Gardner, Beth Gibson, Charles Gray, Patrick Hone, Peter Horvat, Bryan McDonald, Ross Quinn, Kevin Rowling, Keith Sainsbury, Thor Saunders, Sean Sloan, Tony Smith and Tim Ward
Australian fisheries
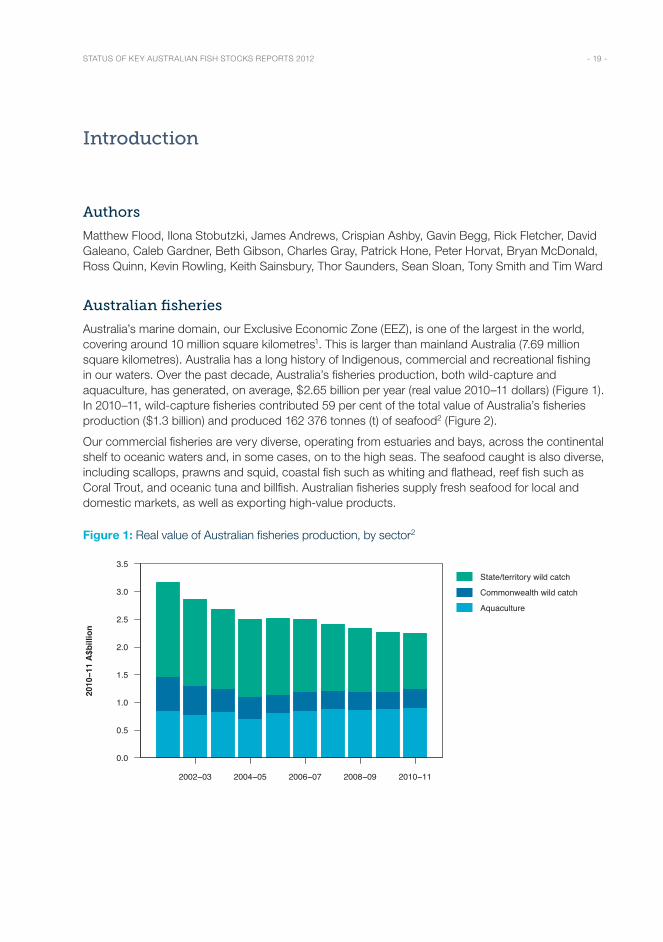
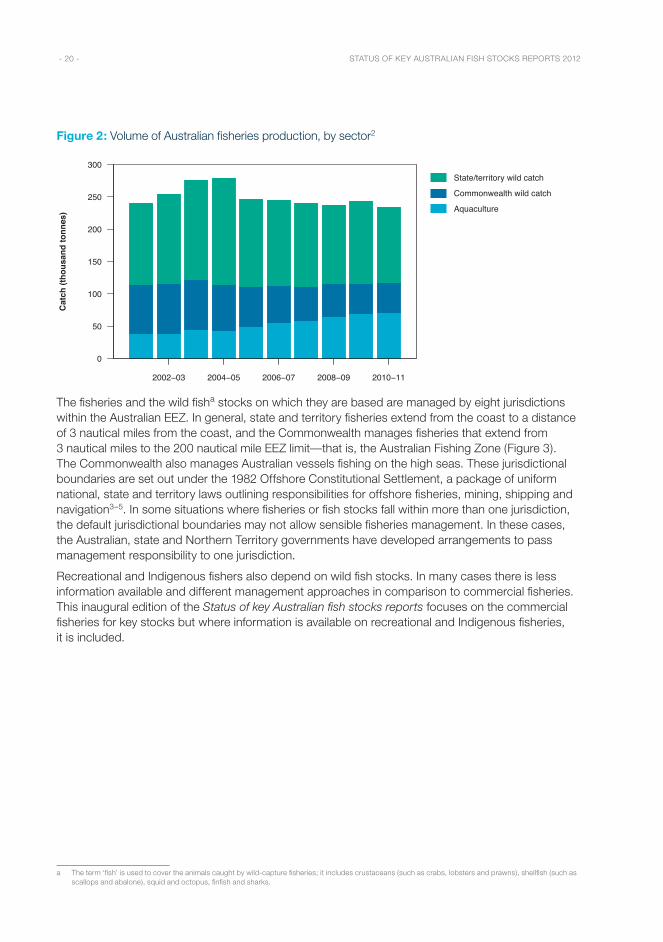
Australia’s marine domain, our Exclusive Economic Zone (EEZ), is one of the largest in the world, covering around 10 million square kilometres1. This is larger than mainland Australia (7.69 million square kilometres). Australia has a long history of Indigenous, commercial and recreational fishing in our waters. Over the past decade, Australia’s fisheries production, both wild-capture and aquaculture, has generated, on average, $2.65 billion per year (real value 2010–11 dollars) (Figure 1). In 2010–11, wild-capture fisheries contributed 59 per cent of the total value of Australia’s fisheries production ($1.3 billion) and produced 162 376 tonnes (t) of seafood2 (Figure 2).
Our commercial fisheries are very diverse, operating from estuaries and bays, across the continental shelf to oceanic waters and, in some cases, on to the high seas. The seafood caught is also diverse, including scallops, prawns and squid, coastal fish such as whiting and flathead, reef fish such as Coral Trout, and oceanic tuna and billfish. Australian fisheries supply fresh seafood for local and domestic markets, as well as exporting high-value products.
Figure 1: Real value of Australian fisheries production, by sector2
Financial Year
2002−03 2004−05 2006−07 2008−09 2010−11
0.0
0.5
1.0
1.5
2.0
2.5
3.0
3.5State/territory wild catch
Commonwealth wild catch
Aquaculture
2010
−11
A$b
illio
n
Introduction
STATUS OF KEY AUSTRALIAN FISH STOCKS REPORTS 2012 - 20 -
Figure 2: Volume of Australian fisheries production, by sector2
Financial Year
2002−03 2004−05 2006−07 2008−09 2010−11
0
50
100
150
200
250
300State/territory wild catch
Commonwealth wild catch
Aquaculture
Cat
ch (t
hous
and
tonn
es)
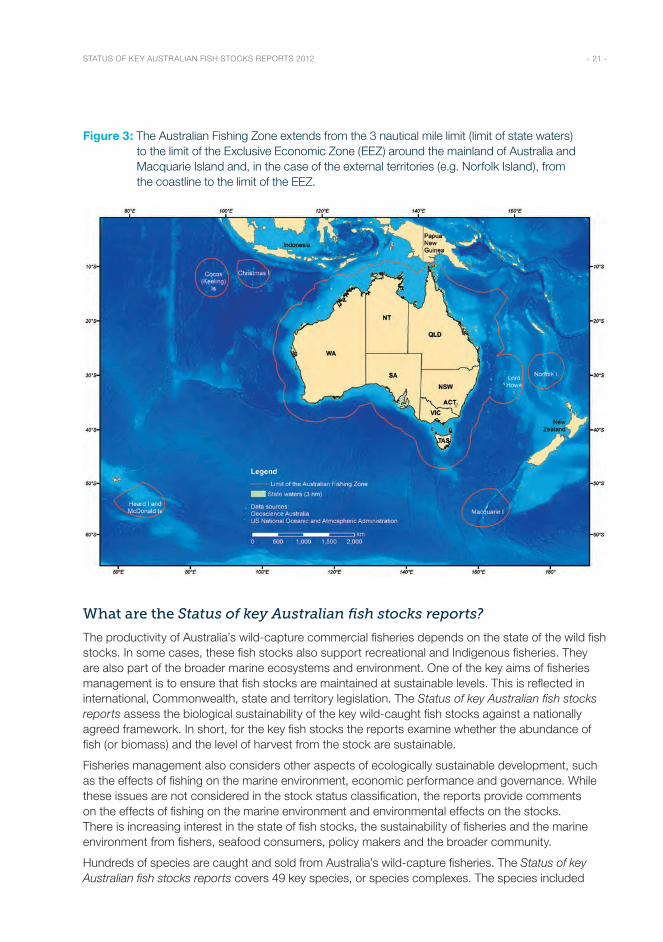
The fisheries and the wild fisha stocks on which they are based are managed by eight jurisdictions within the Australian EEZ. In general, state and territory fisheries extend from the coast to a distance of 3 nautical miles from the coast, and the Commonwealth manages fisheries that extend from 3 nautical miles to the 200 nautical mile EEZ limit—that is, the Australian Fishing Zone (Figure 3). The Commonwealth also manages Australian vessels fishing on the high seas. These jurisdictional boundaries are set out under the 1982 Offshore Constitutional Settlement, a package of uniform national, state and territory laws outlining responsibilities for offshore fisheries, mining, shipping and navigation3–5. In some situations where fisheries or fish stocks fall within more than one jurisdiction, the default jurisdictional boundaries may not allow sensible fisheries management. In these cases, the Australian, state and Northern Territory governments have developed arrangements to pass management responsibility to one jurisdiction.
Recreational and Indigenous fishers also depend on wild fish stocks. In many cases there is less information available and different management approaches in comparison to commercial fisheries. This inaugural edition of the Status of key Australian fish stocks reports focuses on the commercial fisheries for key stocks but where information is available on recreational and Indigenous fisheries, it is included.
a The term ‘fish’ is used to cover the animals caught by wild-capture fisheries; it includes crustaceans (such as crabs, lobsters and prawns), shellfish (such as scallops and abalone), squid and octopus, finfish and sharks.
STATUS OF KEY AUSTRALIAN FISH STOCKS REPORTS 2012 - 21 -
Figure 3: The Australian Fishing Zone extends from the 3 nautical mile limit (limit of state waters) to the limit of the Exclusive Economic Zone (EEZ) around the mainland of Australia and Macquarie Island and, in the case of the external territories (e.g. Norfolk Island), from the coastline to the limit of the EEZ.
What are the Status of key Australian fish stocks reports?
The productivity of Australia’s wild-capture commercial fisheries depends on the state of the wild fish stocks. In some cases, these fish stocks also support recreational and Indigenous fisheries. They are also part of the broader marine ecosystems and environment. One of the key aims of fisheries management is to ensure that fish stocks are maintained at sustainable levels. This is reflected in international, Commonwealth, state and territory legislation. The Status of key Australian fish stocks reports assess the biological sustainability of the key wild-caught fish stocks against a nationally agreed framework. In short, for the key fish stocks the reports examine whether the abundance of fish (or biomass) and the level of harvest from the stock are sustainable.
Fisheries management also considers other aspects of ecologically sustainable development, such as the effects of fishing on the marine environment, economic performance and governance. While these issues are not considered in the stock status classification, the reports provide comments on the effects of fishing on the marine environment and environmental effects on the stocks. There is increasing interest in the state of fish stocks, the sustainability of fisheries and the marine environment from fishers, seafood consumers, policy makers and the broader community.
Hundreds of species are caught and sold from Australia’s wild-capture fisheries. The Status of key Australian fish stocks reports covers 49 key species, or species complexes. The species included
STATUS OF KEY AUSTRALIAN FISH STOCKS REPORTS 2012 - 22 -
were chosen primarily on the basis of their contribution to Australian fisheries; they represent around 70 per cent of the annual catch and 80 per cent of the value of Australian fisheries6. They also reflect the wide diversity of species found in Australian fisheries and markets, including shellfish, crustaceans (such as prawns and crabs), squid, finfish and sharks. They cover species from the tropical waters of northern Australia to the temperate waters of the south, and species caught on the high seas.
Traditionally ‘fishery status reports’ have been produced by most jurisdictions, covering the key fish stocks they manage, and reporting on the effectiveness of their fisheries management. However, the format and type of stock status assessments vary, as does the terminology used to describe the status of stocks7–13. This, at least in part, reflects the different regulatory requirements in different jurisdictions with marine fisheries. However, it makes understanding stock status at a national level challenging. Also, some biological stocks of fish span more than one jurisdiction—in these cases, it can be difficult to understand the overall status of the shared biological stocks.
The Status of key Australian fish stocks reports provide the first national, scientifically robust stock status assessments for key Australian fish stocks. They have been developed with the involvement of fisheries research agencies from all jurisdictions. They provide a key information source for fishers, seafood consumers, policy makers and the broader community. They will also inform the broader international community about Australia’s fisheries management performance.
At present, separate jurisdictional reports, such as the Fishery status reports produced for Commonwealth fisheries by the Australian Bureau of Agricultural and Resource Economics and Sciences (ABARES), will continue to be produced to meet legislative and policy requirements specific to each jurisdiction. Typically, jurisdictional reporting is undertaken at a fishery level, and may include information on the history of catch and fishing activity, management conditions, stock status, any bycatch or ecological impacts of the fishery on the environment, and the extent of recreational interest in a stock or species. Jurisdictional reports may also include the legislative and policy objectives for a fishery and any economic conditions affecting performance. They tend to be annual, so that there is regular feedback on management performance. For Commonwealth fish stocks, the inaugural Status of key Australian fish stocks reports consider equivalent biological information to that presented in the Fishery status reports 201013 but present classifications based on the nationally agreed Status of key Australian fish stocks reports classification framework. In developing the Status of key Australian fish stocks reports, several jurisdictions have reviewed their status determination processes and are modifying their jurisdictional reports to follow the framework applied in the national reports, where possible. As future editions of the Status of key Australian fish stocks reports are produced, increased coverage (i.e. including more species and reporting on fishery level issues) may lead to a reduced requirement for separate jurisdictional reports.
Fish stocks
The Status of key Australian fish stocks reports focus on the status of biological fish stocks wherever possible; hence, it is important to distinguish between biological stocks and fisheries. Biological stocks are relatively discrete populations of a fish species, usually in a given geographical area and with negligible interbreeding with other biological stocks of the same species. Although one fish species may exist in many geographical locations around Australia (or worldwide), fish caught in different areas may come from separate biological stocks. Individual biological stocks may be found in a single jurisdiction or may be shared across two or more jurisdictions. In some cases, individual biological stocks may also extend into the high seas. The size and distribution of individual biological stocks vary greatly between species. For example, Southern Bluefin Tuna comprises a single biological stock that spans much of the world’s southern oceans. In comparison, hundreds to many thousands of separate biological stocks of Blacklip Abalone are thought to exist in Australia. Since
STATUS OF KEY AUSTRALIAN FISH STOCKS REPORTS 2012 - 23 -
separate biological stocks have limited connection with one another, fishing one may not directly affect others. Hence, it is important to assess each biological stock separately, where possible.
Biological stocks are natural resources, and different biological stocks may have different natural abundance, growth rates and mortality rates. Different biological stocks may also be influenced by different environmental factors, depending on where they occur. As a result, the amount of catch that can be sustainably removed may vary from one biological stock to another, even within a species.
In contrast, fisheries are a management unit engaged in harvesting fish. Fisheries are typically defined in terms of the people involved, the species caught, the area of water or seabed fished, fishing methods and the types of boats used14. A single biological stock may be caught by one or a number of fisheries. Similarly, a single fishery may catch one or a number of different species, from one or more different biological stocks. Some of the species and biological stocks fished by Australian fisheries are migratory and are taken in both the Australian EEZ and the high seas or the EEZ of other countries.
A key measure of fisheries management performance is the status of the fish stocks, the natural resource on which the fisheries depend. Therefore, the Status of key Australian fish stocks reports provide status classification for fish stocks. Where possible, this takes into account the impacts of all fisheries at the level of individual biological stocks. Where the stock delineation is not known (i.e. it is not known exactly where one biological stock finishes and the next begins) or the numbers of biological stocks for a species are very high (e.g. Blacklip Abalone), reporting has been undertaken at the level of either the jurisdiction or the management unit. The level of reporting (biological stock, management unit or jurisdiction) for each species is presented at the beginning of each chapter, along with the rationale for this choice. Within these reports the term ‘stock’ is used generically in reference to all three levels of stock status assessment, i.e. biological stocks, management units and populations assessed at the jurisdictional level. In future editions of the Status of key Australian fish stocks reports, it is intended that most species currently assessed at the management unit or jurisdiction level will be assessed at the biological stock level, wherever research has revealed the biological boundaries of the stocks for the species.
Fisheries management
In general, fisheries are managed to ensure the ongoing sustainability of harvest from the fish stocks in that fishery. Management also aims to optimise resource allocation (balancing social and economic considerations) and to minimise adverse impacts of fishing on the environment. Australian fisheries are managed in line with the United Nations Convention on the Law of the Sea (UNCLOS), which is reflected in the legislation and policy of the Commonwealth, states and territories. The United Nations Food and Agriculture Organization’s (FAO’s) Code of Conduct for Responsible Fishing provides guidelines for the implementation of UNCLOS, with the high-level requirement that:
States should prevent overfishing and excess fishing capacity and should implement management measures to ensure that fishing effort is commensurate with the productive capacity of the fishery resources and their sustainable utilization. States should take measures to rehabilitate populations as far as possible and when appropriate15.
Generally, fisheries managers set limits on either the amount of fishing effort (including when, where and with what gear catches can be taken—referred to as input controls) or the level of catch that can be taken from a stock (referred to as output controls). These decisions are usually based on the best available science at the time of the decision, but may also take into account other factors, such as economics. Fisheries management is generally an adaptive process, since fish stocks can be influenced not only by the fisheries harvest but also by environmental effects and natural variation. Fisheries also change in response to changes in market demands, fuel prices and other issues. One of the key factors that managers and fishers need to respond to is the state of fish stocks and how this can change over time, in response to fishing, environmental effects and potentially other factors
STATUS OF KEY AUSTRALIAN FISH STOCKS REPORTS 2012 - 24 -
(such as other human impacts, climate change or extreme natural events). These inaugural Status of key Australian fish stocks reports focus on this key element: the state of fish stocks.
In the context of ecologically sustainable development, fisheries management performance can also be assessed against economic, social and broader ecological or environmental aspects of a fishery. The effectiveness and efficiency of the governance system itself can also be considered. The jurisdictional fishery status reports cover these broader elements of fisheries management to varying extents7–13. These inaugural Status of key Australian fish stocks reports focus on fish stock status; future editions or companion reports are envisaged to provide broader assessments of Australian fisheries. Although the broader ecological effects of fishing, such as bycatch (the incidental catch of non-commercial species), are not formally assessed here, they are discussed briefly for each species. The broader ecological effects tend to be at the fishery scale, rather than the fish stock scale.
Stock status classification system
In general, stock status classifications assess whether the current abundance (number or biomass [weight]) of fish in a stock is at an adequate level and whether the level of fishing pressure (the amount of fish being removed through fishing) is adequately controlled through management. The terminology, criteria and reference points used for stock status classification can vary across the separate jurisdictional status reports.
The abundance of a wild fish stock is usually compared with the abundance of that same stock before any fishing had taken place. Abundance is considered to be adequate if there is a large enough proportion of the original adult stock remaining that production of juveniles is not significantly reduced. That is, the abundance of adults has not been reduced to the point where there is increased risk of recruitment failure. This will vary between different species of fish.
In terms of fishing pressure, stock status considers whether the current level of fishing pressure is adequately controlled to ensure that the stock abundance is not reduced to a point where production of juveniles is significantly reduced.
The classification system agreed on by the Status of key Australian fish stocks reports Advisory Group combines information on both the current stock size and the level of catch into a single classification for each stock (Table 1; Figure 4). To classify stocks into one of these categories, the current abundance and level of fishing pressure are compared with defined biological reference points (see ‘Reference points’, below). Stocks are then classified as a sustainable stock, transitional–recovering stock, transitional–depleting stock or overfished stock. For ease of interpretation, the classifications are also depicted by a colour-coding system. An ‘overfished stock’ classification (red) indicates that a management response is required, to ensure the sustainability of the stock in question.
The term ‘sustainable stock’ in the Status of key Australian fish stocks reports refers specifically to the biological status of fish stocks and does not take into account broader ecological or economic considerations. A sustainable stock classification is given to stocks that are above the biological limit reference point of ‘recruitment overfished’ (see below) and for which the level of current fishing mortality is considered unlikely to cause the stock to become recruitment overfished. Given the focus of the Status of key Australian fish stocks reports on stock status, the term does not have the broader meaning of terms such as ‘ecologically sustainable’ or ‘ecologically viable’, which consider the sustainability of the entire ecosystem and the role of specific stocks in the function of the ecosystem16 (see glossary for full definitions). As outlined above, it is envisaged that broader ecological considerations will be considered in future editions or companion reports.
STATUS OF KEY AUSTRALIAN FISH STOCKS REPORTS 2012 - 25 -
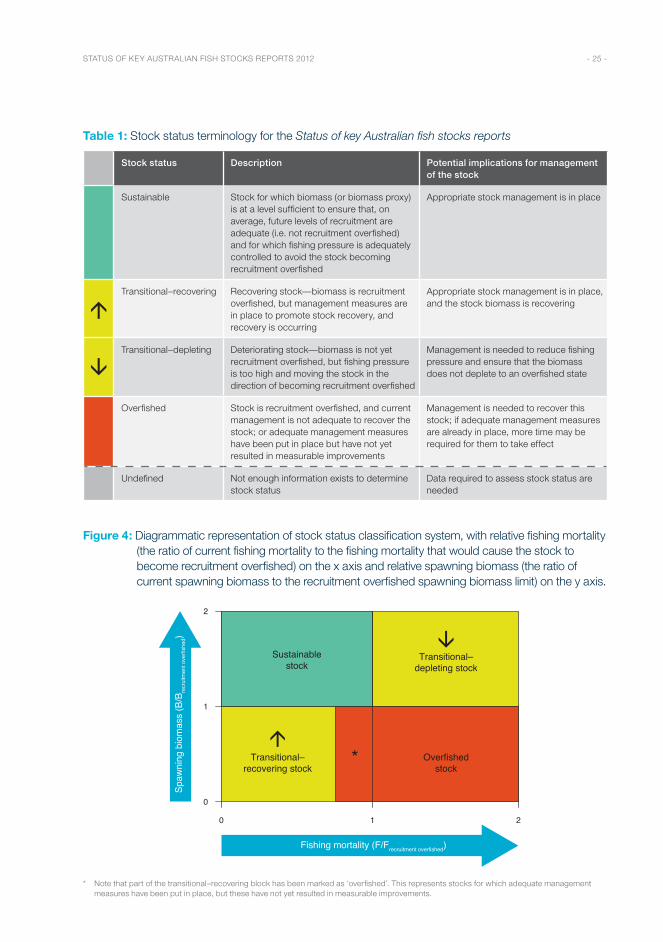
Table 1: Stock status terminology for the Status of key Australian fish stocks reports
Stock status Description Potential implications for management of the stock
Sustainable Stock for which biomass (or biomass proxy) is at a level sufficient to ensure that, on average, future levels of recruitment are adequate (i.e. not recruitment overfished) and for which fishing pressure is adequately controlled to avoid the stock becoming recruitment overfished
Appropriate stock management is in place
áTransitional–recovering Recovering stock—biomass is recruitment
overfished, but management measures are in place to promote stock recovery, and recovery is occurring
Appropriate stock management is in place, and the stock biomass is recovering
âTransitional–depleting Deteriorating stock—biomass is not yet
recruitment overfished, but fishing pressure is too high and moving the stock in the direction of becoming recruitment overfished
Management is needed to reduce fishing pressure and ensure that the biomass does not deplete to an overfished state
Overfished Stock is recruitment overfished, and current management is not adequate to recover the stock; or adequate management measures have been put in place but have not yet resulted in measurable improvements
Management is needed to recover this stock; if adequate management measures are already in place, more time may be required for them to take effect
Undefined Not enough information exists to determine stock status
Data required to assess stock status are needed
Figure 4: Diagrammatic representation of stock status classification system, with relative fishing mortality (the ratio of current fishing mortality to the fishing mortality that would cause the stock to become recruitment overfished) on the x axis and relative spawning biomass (the ratio of current spawning biomass to the recruitment overfished spawning biomass limit) on the y axis.
0
2
1
Overfishedstock
*
Spaw
ning
bio
mas
s (B
/Bre
crui
tmen
t ove
rfish
ed)
Fishing mortality (F/Frecruitment overfished)
0 1 2
Sustainablestock
Transitional–recovering stock
Transitional–depleting stock
* Note that part of the transitional–recovering block has been marked as ‘overfished’. This represents stocks for which adequate management measures have been put in place, but these have not yet resulted in measurable improvements.
STATUS OF KEY AUSTRALIAN FISH STOCKS REPORTS 2012 - 26 -
Reference points
Biological reference points provide guidance on determining whether stock abundance is too low or fishing pressure is too high. Formal reference points in a fishery generally include targets to indicate where we would like to be and limits to show what to avoid. Stock assessments usually produce estimates of abundance and fishing pressure over time, which can be assessed against biological reference points. The use of reference points to guide management decisions is consistent with the FAO’s Code of Conduct for Responsible Fishing15.
Limit reference points
The limit reference points used to determine stock status for management response vary across the Australian jurisdictions. For example, Commonwealth fish stocks with a biomass below 20 per cent of the unfished abundance (biomass) level are generally classified as overfished, whereas, in New South Wales, stocks are generally considered overfished when they are below 30 per cent of the unfished abundance (biomass). The reference points for Commonwealth fisheries are specified in the Commonwealth Fisheries Harvest Strategy Policy17, and Commonwealth fisheries are assessed against these reference points. Most other Australian jurisdictions have similar policies or legislative frameworks.
In assessing fish stock status nationally, ‘recruitment overfished’ was agreed as the biological limit reference point for determining whether or not a fish stock is overfished. ‘Recruitment overfished’ is defined as follows:
The point at which a stock is considered to be recruitment overfished is the point where the spawning stock biomass has been reduced through catch, so that average recruitment levels are significantly reduced.
The percentage of unfished abundance considered to be recruitment overfished varies to some extent across species and stocks, based on differences in biology. The recruitment overfished limit reference point for abundance in the Status of key Australian fish stocks reports is different from the limit reference points defined in some jurisdictions, which include economic considerations or a precautionary buffer against measurement uncertainty. Reference points that include economic considerations or precautionary buffers can be very useful in particular decision-making contexts. However, it is intended that the national reporting be based solely on biological considerations, and these other considerations and buffers are therefore not included in the biological limit reference point used in the Status of key Australian fish stocks reports.
With respect to fishing pressure, for a stock to be classified as a sustainable stock in the Status of key Australian fish stocks reports, the current level of fishing pressure must be at a level considered to be unlikely to cause the stock to become recruitment overfished—that is, recruitment overfishing should not be occurring (see glossary for a more detailed explanation of recruitment overfishing).
Target reference points
Target reference points correspond to levels of biomass and fishing pressure that are considered to be ideal. Generally, management aims to ensure that stocks are maintained at these levels and away from limit levels. Target reference points commonly incorporate management objectives, such as maximising the sustainable yield or economic returns. For example, the Commonwealth Fisheries Harvest Strategy Policy seeks to maintain fish stocks, on average, at a target biomass equal to the biomass that would produce maximum economic yield17. As with limit reference points, a range of target reference points are currently used in the different fisheries and jurisdictions across Australia. There is no single agreed national target level, and hence it is not yet possible to include quantitative information based on targets in stock status determinations. While the stock status determinations provided in these Status of key Australian fish stocks reports rely on limit reference points, it is envisaged that future editions will consider stock status in relation to targets as well as limits.
STATUS OF KEY AUSTRALIAN FISH STOCKS REPORTS 2012 - 27 -
Defining stock status—weight of evidence approach
Assessing the status of fish stocks can be a difficult task. The methods used to monitor and assess stock status vary, ranging from simple catch levels to complex stock assessments. Smaller and lower value stocks and fisheries often have fewer data available or limited resources to undertake quantitative stock assessments. If targeted catch from a stock is very low, or a species is only taken in small numbers as byproduct, it may be inappropriate to invest in the development of resource-intensive quantitative stock assessment models. It is important to note, however, that robust stock status assessments can be made without having quantitative stock assessments.
In the Status of key Australian fish stocks reports, a weight-of-evidence approach has been used to establish an evidentiary base to support stock status determination. This is achieved by systematically considering a range of biological and fisheries information. The approach provides a structured, scientific process for assembly and review of indicators of biomass status and levels of fishing mortality. For most fish stocks, particularly in the smaller fisheries, only a subset of the types of evidence is available and/or useful. Expert judgment plays an important role in stock status determination, with an emphasis on documenting the key evidence and rationale for the decision. The decision-making process is undertaken separately for abundance and fishing pressure.
Lines of evidence used in the weight-of-evidence approach include:
• empirical indicators (catch, effort, catch rate, size- or age-based indicators, spatial and temporal distribution of the fishery)
• risk assessments
• fishery-independent surveys
• quantitative stock assessment models
• harvest strategies.
It is intended that all stocks considered in the Status of key Australian fish stocks reports be classified by the same standards, regardless of the evidence base used.
Stock assessments
Stock assessments are one of the main sources of information for determining stock status. Stock assessments are mathematical and statistical models used to predict the stock abundance and response to fishing. They typically incorporate information on growth, natural mortality, the stock–recruitment relationship and carrying capacity, and data from fishery-dependent (e.g. catch and fishing effort) and fishery-independent (e.g. surveys) sources. The outputs of these assessments generally include an indication of the unfished stock abundance (i.e. how big the stock was before fishing started), an indication of the current stock abundance and an indication of current fishing pressure. In combination with biological reference points, the information from a stock assessment can be used to determine the stock status classification.
Abundance: Stock assessments for different species use different ways of measuring current stock size because of differences in biology and management systems. Measurements include spawning stock biomass, total biomass and egg or pup production. In the Status of key Australian fish stocks reports, each of these terms is used. However, regardless of the measure of biomass, the basic premise is that the level of abundance (biomass) must be above the level considered to be recruitment overfished for the stock to be classified as a sustainable stock. This means that the abundance of adults will not have been reduced to the point where there is increased risk of recruitment failure.
STATUS OF KEY AUSTRALIAN FISH STOCKS REPORTS 2012 - 28 -
Fishing pressure: In some cases in the Status of key Australian fish stocks reports, estimates of fishing mortality are explicitly stated for a stock, where they are available. In these cases, the actual fishing mortality can be compared with fishing mortality limits set by management rules to determine whether current fishing pressure is likely to cause the stock to become recruitment overfished. In other cases, stock assessment models are used to determine total allowable catches (TACs), which are designed to ensure that the stock remains at (or will return to) an adequate size—often defined by target reference points. In these cases, it is meaningful to compare the catch from a stock with that recommended by the TAC. If the catch is below or equal to a biologically meaningful TAC, the current level of fishing pressure is unlikely to cause the stock to become recruitment overfished.
Effects of fishing on the marine environment
The stock status classification provided for each stock does not take into account the effects of fishing on the marine environment. As discussed previously, these elements of the broader concept of ecologically sustainable development tend to be at the fishery level, rather than the stock level. It is envisaged that future editions of the Status of key Australian fish stocks reports, or companion reports, will provide broader assessments of Australian fisheries that will include formal classification of fisheries based on the effects of fishing on the marine environment. Although no formal classification has been attributed yet, the effects of fishing on the marine environment are briefly explored in each chapter, and measures that have been put in place to mitigate detrimental effects are described.
Assessments of Australian fisheries under the Environment Protection and Biodiversity Conservation Act 1999
The environmental performance of Commonwealth-managed fisheries and state and Northern Territory fisheries that have an export component and/or operate in Commonwealth waters is assessed under the Environment Protection and Biodiversity Conservation Act 1999 (EPBC Act).
The Australian Government Department of Sustainability, Environment, Water, Population and Communities (DSEWPaC) assesses a fishery’s management arrangements for consistency with the EPBC Act using criteria listed in the Guidelines for the ecologically sustainable management of fisheries – 2nd edition16. The guidelines outline specific principles and objectives to ensure a strategic and transparent way of evaluating the ecological sustainability of fishery management arrangements. The guidelines include the principles that:
• a fishery must be conducted in a manner that does not lead to overfishing, or for those stocks that are overfished, the fishery must be conducted such that there is a high degree of probability the stock(s) will recover, and
• fishing operations should be managed to minimise their impact on the structure, productivity, function and biological diversity of ecosystems18.
An assessment is undertaken if:
• product from the fishery is to be exported
• the fishery is to operate in Commonwealth waters, and/or
• the fishery is to be managed by the Commonwealth.
Part 13 A—export. An Australian native wildlife specimen can only be exported for commercial purposes if it is approved for export from a program such as an approved wildlife trade operation, or is included in the list of exempt native specimens.
STATUS OF KEY AUSTRALIAN FISH STOCKS REPORTS 2012 - 29 -
Part 13—species and communities. Under Part 13 of the EPBC Act, it is an offence to harm listed threatened species (except a conservation-dependent species) in Commonwealth waters unless a fisher has obtained a permit or the management arrangements for the fishery are accredited under the Act. Management arrangements can be accredited under Part 13 if the Environment Minister is satisfied that:
• the management arrangements require individual fishers to take all reasonable steps to avoid killing or injuring a member of a species protected under the EPBC Act (i.e. a threatened species, a listed migratory species, a listed marine species or cetacean)
• the fishery does not, or is not likely to, adversely affect the conservation status of protected species, or affect the survival and recovery of listed threatened species18.
Part 10—strategic assessment of Commonwealth managed fisheries. The EPBC Act also requires that Commonwealth-managed fisheries undergo strategic assessment of the impacts on matters of national environmental significance, including the Commonwealth marine area. The outcomes of a strategic assessment inform other decisions under the EPBC Act for Commonwealth-managed fisheries.
EPBC Act assessments focus on the operation of a fishery as a whole, rather than specifically on individual species within a fishery. Hence, the details of EPBC Act assessments are not provided in all of the species chapters of this edition of the Status of key Australian fish stocks reports. However, details for all fisheries assessed are available on DSEWPaC’s website (www.environment.gov.au/coasts/fisheries/index.html#fisheries).
Environmental effects on stocks
Many fish stocks vary naturally due to the effects of the environment, even in the absence of fishing. For example, recruitment of prawns can be affected by rainfall19–20. Weather events, ocean currents, changes in climate and disease can all affect fish abundance. Where links have been established between environmental factors and stock abundance for a given species, these are outlined in the species chapters.
Non-fishing factors that affect the sustainability of fish stocks
Along with fishing pressure and natural environmental factors, human activities that are unrelated to fishing can also have a substantial impact on the sustainability of fish stocks—for example, the clearing of mangroves for coastal development. Although the impacts of human activities are not discussed on a species-by-species basis in the Status of key Australian fish stocks reports, it is important to note that these factors may, in some cases, have a greater impact on fish stocks than fishing.
What to expect in each species report
The Status of key Australian fish stocks reports contain 49 stock status assessment chapters that cover the status of 49 species or species complexes. Each chapter describes the distribution of stocks around Australia, providing stock status classifications for each. In cases where biological stock delineation is known and biological stock numbers are not too high, information is presented at the level of biological stocks. In other cases, information is presented at the management unit or jurisdiction level. Each chapter also includes information on the main fishing methods, the management measures, the number of vessels that catch the species, and the amount of catch from commercial, recreational and Indigenous fisheries. The effects of fishing on the marine environment are described, along with mitigation measures, and an indication is also given of environmental factors that can affect the stocks.
STATUS OF KEY AUSTRALIAN FISH STOCKS REPORTS 2012 - 30 -
Reporting period
This first edition of the Status of key Australian fish stocks reports presents data up to 2010—the most recent data and assessments available at the time of publishing across all Australian jurisdictions with marine fisheries. Where significant changes are known to have occurred since 2010, this is stated in the chapter but the new information has not been used to inform stock status classification. In general, data are presented on the basis of calendar years, unless otherwise indicated (e.g. where financial years are used instead).
Process for production of the Status of key Australian fish stocks reports
The national Status of key Australian fish stocks reports rely on a consistent reporting framework. The framework has been designed and agreed on by the Status of key Australian fish stocks reports Advisory Group (established in the second half of 2011), comprising heads of fisheries research agencies from all Australian jurisdictions. The Advisory Group agreed on the process for identifying the species to be included, developed the species chapter template, and agreed on a common set of terminology and reference points against which stocks were to be assessed. The agreed approach for producing the Status of key Australian fish stocks reports was endorsed by the Australian Fisheries Management Forum.
For each of the 49 species or species complexes chosen for inclusion in the reports, the Advisory Group identified ‘lead’ and ‘support’ jurisdictions for drafting species chapters. Stock status determination was undertaken in a collaborative manner, involving the relevant experts and team members in the jurisdictions in which the stocks are managed. This process meant that the researchers engaged in studying and assessing these species were responsible for the status assessment. For stocks that are shared by multiple jurisdictions, the lead jurisdiction was responsible for facilitating a process and discussion to determine the overall status for the stocks.
The individual Status of key Australian fish stocks reports have been reviewed by ABARES and the Status of key Australian fish stocks reports Advisory Group. In addition, the Fisheries Research and Development Corporation facilitated an anonymous technical peer review of each of the 49 species or species complex chapters. The reports were provided to the relevant fisheries management agency in each Australian jurisdiction for comment.
References1. Geoscience Australia 2012, The Law of the Sea, Geoscience Australia, Canberra, www.ga.gov.au/marine/
jurisdiction/law-of-the-sea.html.
2. Australian Bureau of Agricultural and Resource Economics and Sciences 2012, Australian fisheries statistics 2011, ABARES, Canberra.
3. Australian Government Attorney-General’s Department 1980, Offshore Constitutional Settlement, a milestone in co-operative federalism, Attorney-General’s Department, Australian Government Publishing Service, Canberra.
4. Australian Government Department of Agriculture, Fisheries and Forestry 2012a, Management processes affecting Commonwealth fisheries, fact sheet, DAFF, Canberra, www.daff.gov.au/__data/assets/pdf_file/0005/5792/ res_share_factsheet.pdf.
5. Australian Government Department of Agriculture, Fisheries and Forestry 2012b, Managing Australian fisheries, DAFF, Canberra, www.daff.gov.au/fisheries/domestic/state-fisheries.
6. Australian Bureau of Agricultural and Resource Economics and Sciences 2011, Australian fisheries statistics 2010, ABARES, Canberra.
7. Victorian Department of Primary Industries 2008, Fishery status report 2008, Fisheries Management Report Series 63, DPI, Melbourne.
8. Fletcher, WJ & Santoro, K (eds) 2011, State of the fisheries and aquatic resources report 2010/11, Western Australian Department of Fisheries, Perth.
STATUS OF KEY AUSTRALIAN FISH STOCKS REPORTS 2012 - 31 -
9. Northern Territory Department of Resources 2011, Fishery status report 2010, Fishery Report 106, Northern Territory Government, Darwin.
10. Primary Industries and Resources South Australia 2007, South Australian fisheries resources—current status and recent trends 2006, PIRSA paper 49, PIRSA, Adelaide.
11. Queensland Department of Employment, Economic Development and Innovation 2011, Stock status of Queensland’s fisheries resources 2011, DEEDI, Brisbane.
12. Rowling, K, Hegarty, A & Ives, M (eds) 2010, Status of fisheries resources in NSW 2008/09, Industry & Investment NSW, Cronulla.
13. Woodhams, J, Stobutzki, I, Vieira, S, Curtotti, R & Begg, GA (eds) 2011, Fishery status reports 2010: status of fish stocks and fisheries managed by the Australian Government, Australian Bureau of Agricultural and Resource Economics and Sciences, Canberra.
14. Fletcher, WJ, Chesson, J, Fisher, M, Sainsbury, KJ, Hundloe, T, Smith, ADM & Whitworth, B 2002, National ESD reporting framework for Australian fisheries: the ‘How to’ guide for wild capture fisheries, FRDC project 2000/145, Canberra.
15. Food and Agriculture Organization of the United Nations 2012, FAO Code of Conduct for Responsible Fisheries, FAO, Rome, www.fao.org/docrep/005/v9878e/v9878e00.HTM#76.
16. Australian Government Department of the Environment and Water Resources 2007, Guidelines for the ecologically sustainable management of fisheries, 2nd edn, DEWR, Canberra.
17. Australian Government Department of Agriculture, Fisheries and Forestry 2007, Commonwealth Fisheries Harvest Strategy: policy and guidelines, DAFF, Canberra.
18. Australian Government Department of Sustainability, Environment, Water, Population and Communities 2012, Fisheries and the environment, DSEWPaC, Canberra, www.environment.gov.au/coasts/fisheries/index.html#fisheries.
19. Lenanton, RC, Caputi, N, Kangas, MI & Craine, M 2009, The ongoing influence of the Leeuwin Current on economically important fish and invertebrates off temperate Western Australia—has it changed? Journal of the Royal Society of Western Australia, 92: 111–127.
20. Vance, DJ, Bishop, J, Dichmont, CM, Hall, N, McInnes, K & Taylore, BR 2003, Management of common banana prawn stocks of the Gulf of Carpentaria: separating the effects of fishing from those of the environment, CSIRO, AFMA project 98/0716.
STATUS OF KEY AUSTRALIAN FISH STOCKS REPORTS 2012 - 32 -
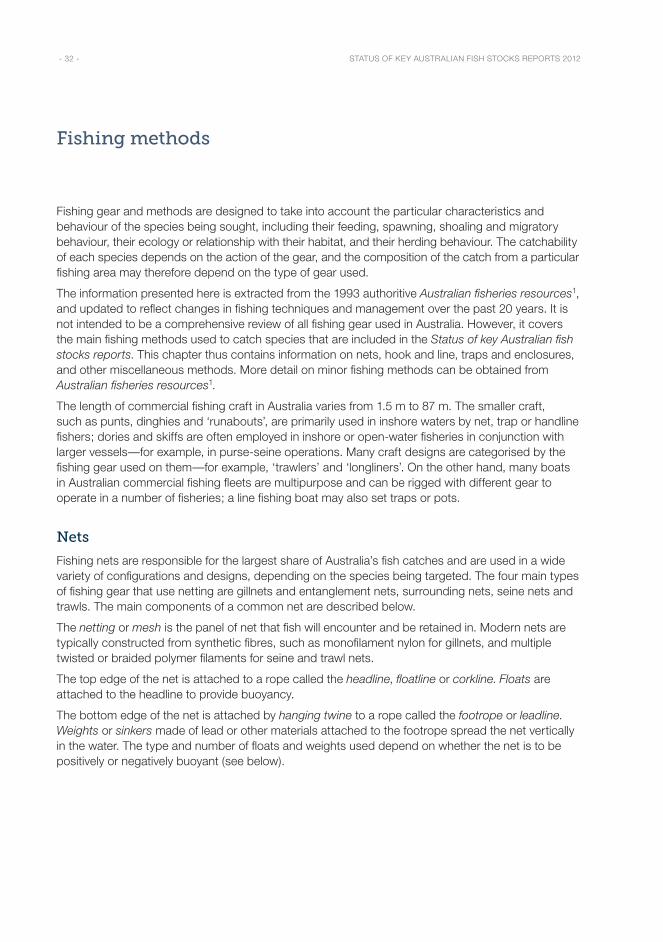
Fishing gear and methods are designed to take into account the particular characteristics and behaviour of the species being sought, including their feeding, spawning, shoaling and migratory behaviour, their ecology or relationship with their habitat, and their herding behaviour. The catchability of each species depends on the action of the gear, and the composition of the catch from a particular fishing area may therefore depend on the type of gear used.
The information presented here is extracted from the 1993 authoritive Australian fisheries resources1, and updated to reflect changes in fishing techniques and management over the past 20 years. It is not intended to be a comprehensive review of all fishing gear used in Australia. However, it covers the main fishing methods used to catch species that are included in the Status of key Australian fish stocks reports. This chapter thus contains information on nets, hook and line, traps and enclosures, and other miscellaneous methods. More detail on minor fishing methods can be obtained from Australian fisheries resources1.
The length of commercial fishing craft in Australia varies from 1.5 m to 87 m. The smaller craft, such as punts, dinghies and ‘runabouts’, are primarily used in inshore waters by net, trap or handline fishers; dories and skiffs are often employed in inshore or open-water fisheries in conjunction with larger vessels—for example, in purse-seine operations. Many craft designs are categorised by the fishing gear used on them—for example, ‘trawlers’ and ‘longliners’. On the other hand, many boats in Australian commercial fishing fleets are multipurpose and can be rigged with different gear to operate in a number of fisheries; a line fishing boat may also set traps or pots.
Nets
Fishing nets are responsible for the largest share of Australia’s fish catches and are used in a wide variety of configurations and designs, depending on the species being targeted. The four main types of fishing gear that use netting are gillnets and entanglement nets, surrounding nets, seine nets and trawls. The main components of a common net are described below.
The netting or mesh is the panel of net that fish will encounter and be retained in. Modern nets are typically constructed from synthetic fibres, such as monofilament nylon for gillnets, and multiple twisted or braided polymer filaments for seine and trawl nets.
The top edge of the net is attached to a rope called the headline, floatline or corkline. Floats are attached to the headline to provide buoyancy.
The bottom edge of the net is attached by hanging twine to a rope called the footrope or leadline. Weights or sinkers made of lead or other materials attached to the footrope spread the net vertically in the water. The type and number of floats and weights used depend on whether the net is to be positively or negatively buoyant (see below).
Fishing methods
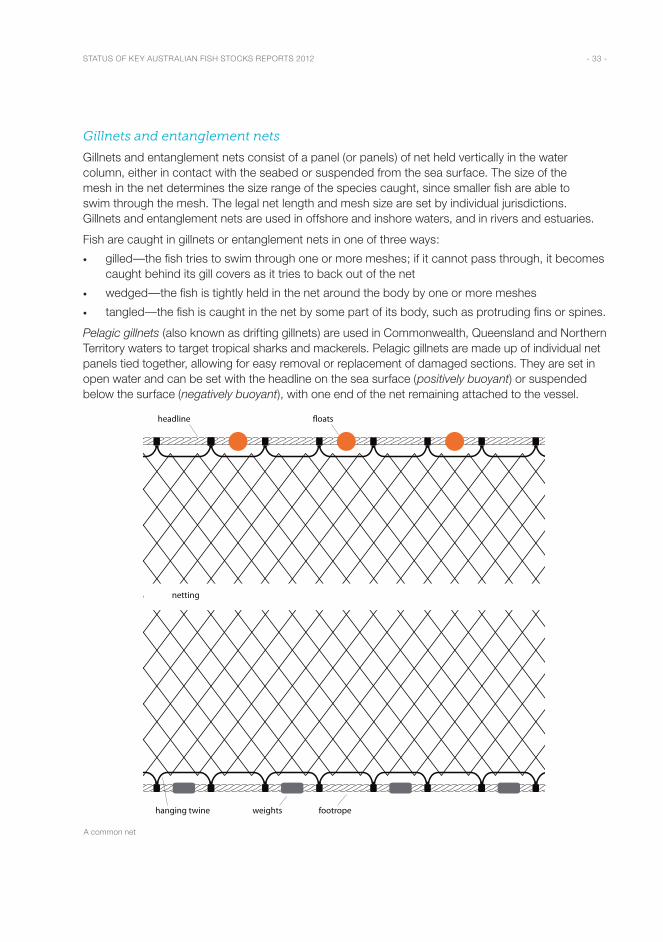
STATUS OF KEY AUSTRALIAN FISH STOCKS REPORTS 2012 - 33 -
Gillnets and entanglement nets
Gillnets and entanglement nets consist of a panel (or panels) of net held vertically in the water column, either in contact with the seabed or suspended from the sea surface. The size of the mesh in the net determines the size range of the species caught, since smaller fish are able to swim through the mesh. The legal net length and mesh size are set by individual jurisdictions. Gillnets and entanglement nets are used in offshore and inshore waters, and in rivers and estuaries.
Fish are caught in gillnets or entanglement nets in one of three ways:
• gilled—the fish tries to swim through one or more meshes; if it cannot pass through, it becomes caught behind its gill covers as it tries to back out of the net
• wedged—the fish is tightly held in the net around the body by one or more meshes
• tangled—the fish is caught in the net by some part of its body, such as protruding fins or spines.
Pelagic gillnets (also known as drifting gillnets) are used in Commonwealth, Queensland and Northern Territory waters to target tropical sharks and mackerels. Pelagic gillnets are made up of individual net panels tied together, allowing for easy removal or replacement of damaged sections. They are set in open water and can be set with the headline on the sea surface (positively buoyant) or suspended below the surface (negatively buoyant), with one end of the net remaining attached to the vessel.
A common net
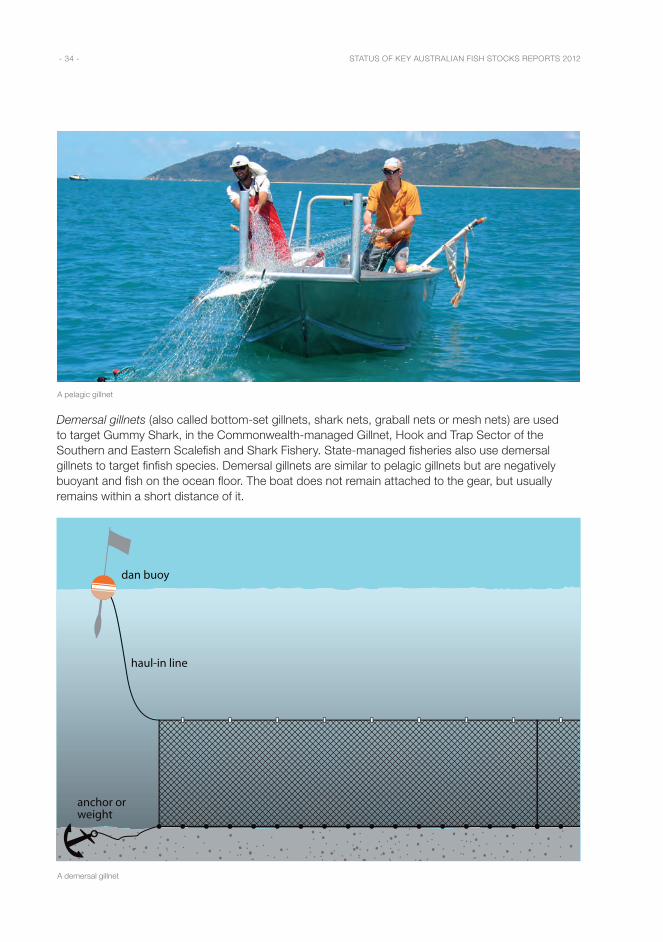
STATUS OF KEY AUSTRALIAN FISH STOCKS REPORTS 2012 - 34 -
A pelagic gillnet
Demersal gillnets (also called bottom-set gillnets, shark nets, graball nets or mesh nets) are used to target Gummy Shark, in the Commonwealth-managed Gillnet, Hook and Trap Sector of the Southern and Eastern Scalefish and Shark Fishery. State-managed fisheries also use demersal gillnets to target finfish species. Demersal gillnets are similar to pelagic gillnets but are negatively buoyant and fish on the ocean floor. The boat does not remain attached to the gear, but usually remains within a short distance of it.
A demersal gillnet
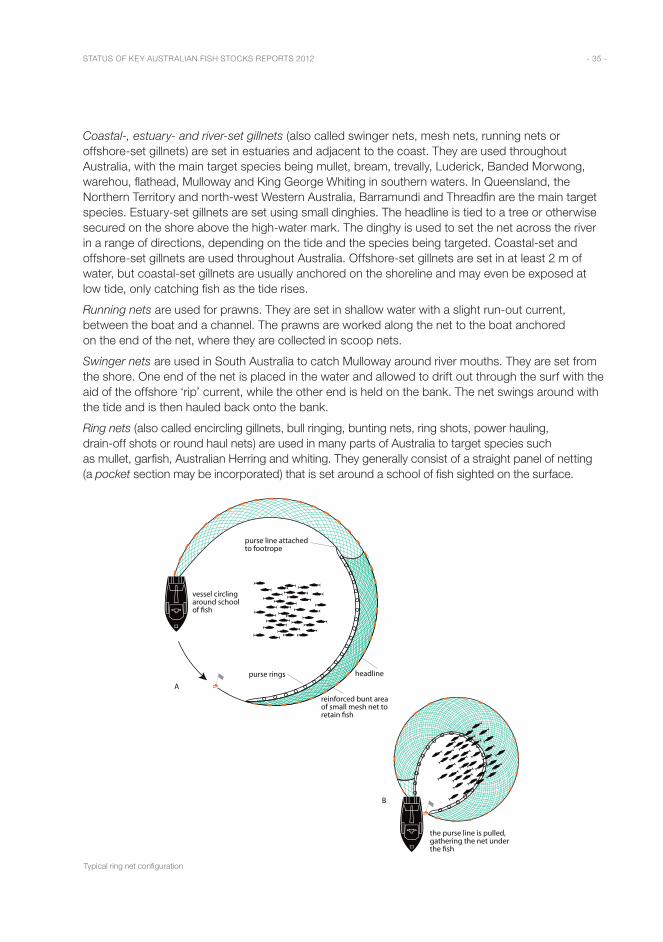
STATUS OF KEY AUSTRALIAN FISH STOCKS REPORTS 2012 - 35 -
Coastal-, estuary- and river-set gillnets (also called swinger nets, mesh nets, running nets or offshore-set gillnets) are set in estuaries and adjacent to the coast. They are used throughout Australia, with the main target species being mullet, bream, trevally, Luderick, Banded Morwong, warehou, flathead, Mulloway and King George Whiting in southern waters. In Queensland, the Northern Territory and north-west Western Australia, Barramundi and Threadfin are the main target species. Estuary-set gillnets are set using small dinghies. The headline is tied to a tree or otherwise secured on the shore above the high-water mark. The dinghy is used to set the net across the river in a range of directions, depending on the tide and the species being targeted. Coastal-set and offshore-set gillnets are used throughout Australia. Offshore-set gillnets are set in at least 2 m of water, but coastal-set gillnets are usually anchored on the shoreline and may even be exposed at low tide, only catching fish as the tide rises.
Running nets are used for prawns. They are set in shallow water with a slight run-out current, between the boat and a channel. The prawns are worked along the net to the boat anchored on the end of the net, where they are collected in scoop nets.
Swinger nets are used in South Australia to catch Mulloway around river mouths. They are set from the shore. One end of the net is placed in the water and allowed to drift out through the surf with the aid of the offshore ‘rip’ current, while the other end is held on the bank. The net swings around with the tide and is then hauled back onto the bank.
Ring nets (also called encircling gillnets, bull ringing, bunting nets, ring shots, power hauling, drain-off shots or round haul nets) are used in many parts of Australia to target species such as mullet, garfish, Australian Herring and whiting. They generally consist of a straight panel of netting (a pocket section may be incorporated) that is set around a school of fish sighted on the surface.
Typical ring net configuration
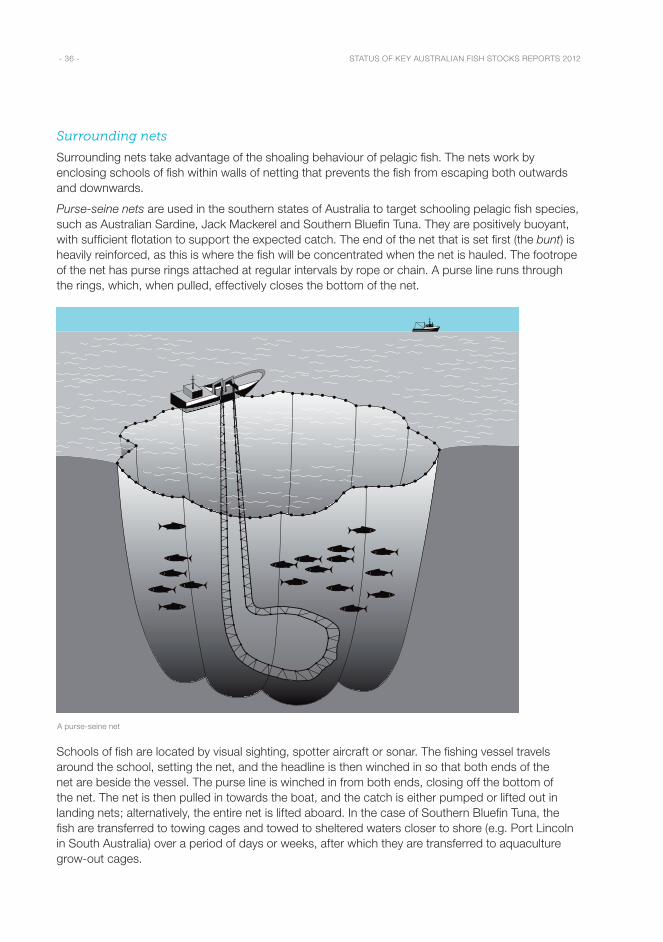
STATUS OF KEY AUSTRALIAN FISH STOCKS REPORTS 2012 - 36 -
Surrounding nets
Surrounding nets take advantage of the shoaling behaviour of pelagic fish. The nets work by enclosing schools of fish within walls of netting that prevents the fish from escaping both outwards and downwards.
Purse-seine nets are used in the southern states of Australia to target schooling pelagic fish species, such as Australian Sardine, Jack Mackerel and Southern Bluefin Tuna. They are positively buoyant, with sufficient flotation to support the expected catch. The end of the net that is set first (the bunt) is heavily reinforced, as this is where the fish will be concentrated when the net is hauled. The footrope of the net has purse rings attached at regular intervals by rope or chain. A purse line runs through the rings, which, when pulled, effectively closes the bottom of the net.
A purse-seine net
Schools of fish are located by visual sighting, spotter aircraft or sonar. The fishing vessel travels around the school, setting the net, and the headline is then winched in so that both ends of the net are beside the vessel. The purse line is winched in from both ends, closing off the bottom of the net. The net is then pulled in towards the boat, and the catch is either pumped or lifted out in landing nets; alternatively, the entire net is lifted aboard. In the case of Southern Bluefin Tuna, the fish are transferred to towing cages and towed to sheltered waters closer to shore (e.g. Port Lincoln in South Australia) over a period of days or weeks, after which they are transferred to aquaculture grow-out cages.
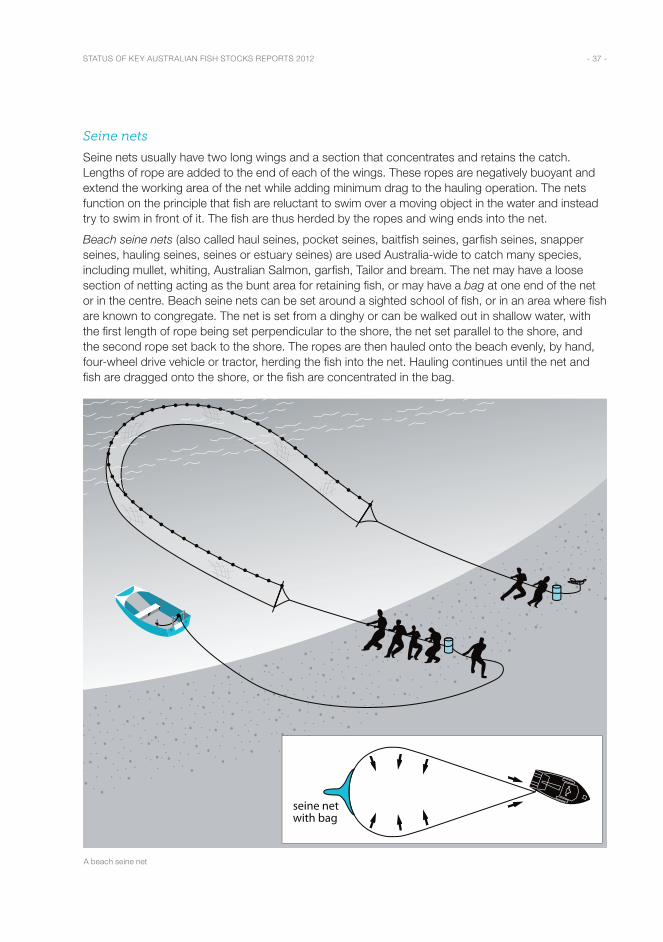
STATUS OF KEY AUSTRALIAN FISH STOCKS REPORTS 2012 - 37 -
Seine nets
Seine nets usually have two long wings and a section that concentrates and retains the catch. Lengths of rope are added to the end of each of the wings. These ropes are negatively buoyant and extend the working area of the net while adding minimum drag to the hauling operation. The nets function on the principle that fish are reluctant to swim over a moving object in the water and instead try to swim in front of it. The fish are thus herded by the ropes and wing ends into the net.
Beach seine nets (also called haul seines, pocket seines, baitfish seines, garfish seines, snapper seines, hauling seines, seines or estuary seines) are used Australia-wide to catch many species, including mullet, whiting, Australian Salmon, garfish, Tailor and bream. The net may have a loose section of netting acting as the bunt area for retaining fish, or may have a bag at one end of the net or in the centre. Beach seine nets can be set around a sighted school of fish, or in an area where fish are known to congregate. The net is set from a dinghy or can be walked out in shallow water, with the first length of rope being set perpendicular to the shore, the net set parallel to the shore, and the second rope set back to the shore. The ropes are then hauled onto the beach evenly, by hand, four-wheel drive vehicle or tractor, herding the fish into the net. Hauling continues until the net and fish are dragged onto the shore, or the fish are concentrated in the bag.
A beach seine net
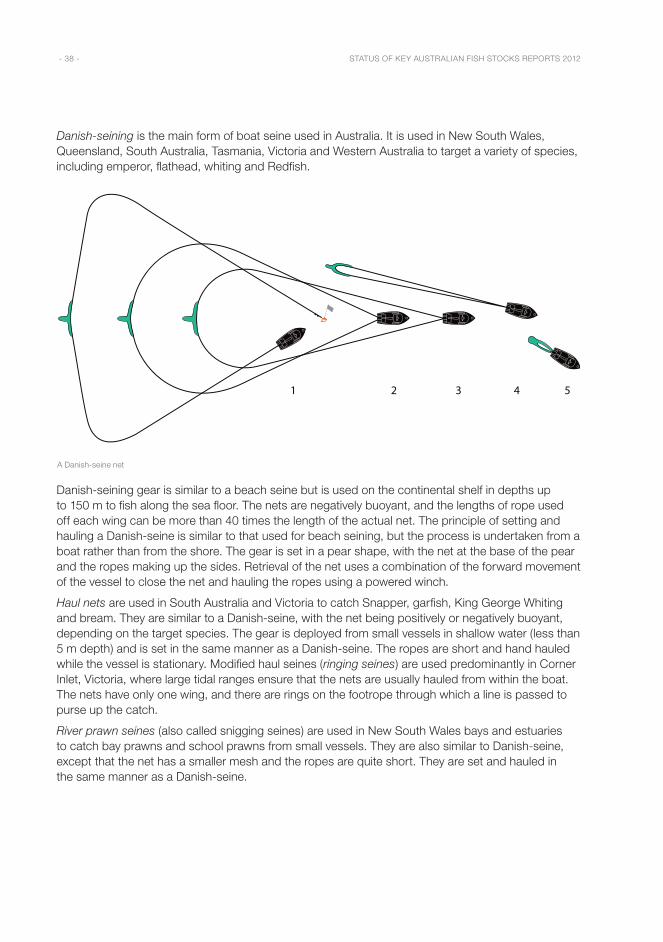
STATUS OF KEY AUSTRALIAN FISH STOCKS REPORTS 2012 - 38 -
Danish-seining is the main form of boat seine used in Australia. It is used in New South Wales, Queensland, South Australia, Tasmania, Victoria and Western Australia to target a variety of species, including emperor, flathead, whiting and Redfish.
A Danish-seine net
Danish-seining gear is similar to a beach seine but is used on the continental shelf in depths up to 150 m to fish along the sea floor. The nets are negatively buoyant, and the lengths of rope used off each wing can be more than 40 times the length of the actual net. The principle of setting and hauling a Danish-seine is similar to that used for beach seining, but the process is undertaken from a boat rather than from the shore. The gear is set in a pear shape, with the net at the base of the pear and the ropes making up the sides. Retrieval of the net uses a combination of the forward movement of the vessel to close the net and hauling the ropes using a powered winch.
Haul nets are used in South Australia and Victoria to catch Snapper, garfish, King George Whiting and bream. They are similar to a Danish-seine, with the net being positively or negatively buoyant, depending on the target species. The gear is deployed from small vessels in shallow water (less than 5 m depth) and is set in the same manner as a Danish-seine. The ropes are short and hand hauled while the vessel is stationary. Modified haul seines (ringing seines) are used predominantly in Corner Inlet, Victoria, where large tidal ranges ensure that the nets are usually hauled from within the boat. The nets have only one wing, and there are rings on the footrope through which a line is passed to purse up the catch.
River prawn seines (also called snigging seines) are used in New South Wales bays and estuaries to catch bay prawns and school prawns from small vessels. They are also similar to Danish-seine, except that the net has a smaller mesh and the ropes are quite short. They are set and hauled in the same manner as a Danish-seine.
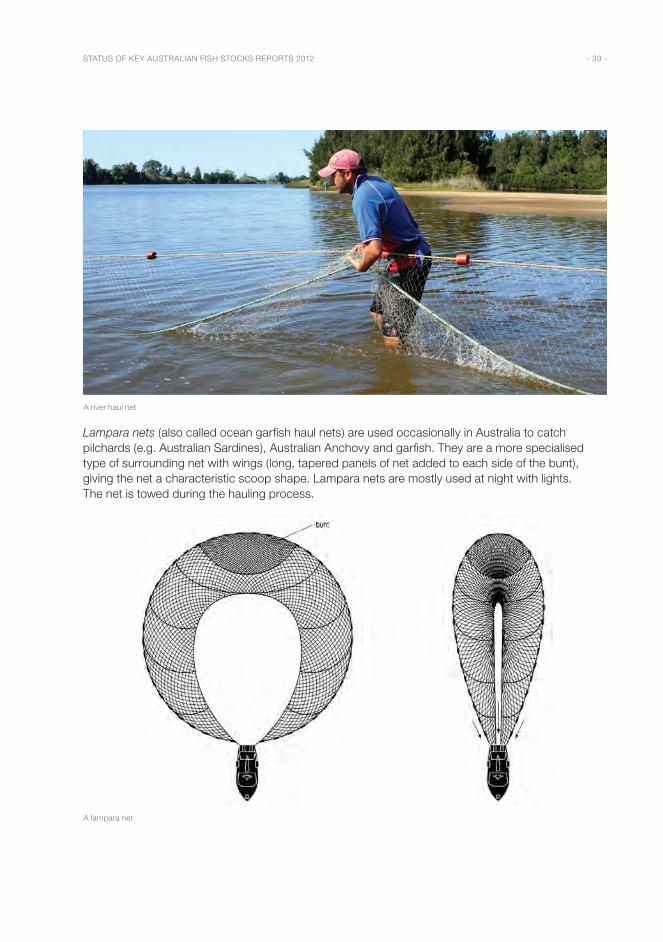
STATUS OF KEY AUSTRALIAN FISH STOCKS REPORTS 2012 - 39 -
A river haul net
Lampara nets (also called ocean garfish haul nets) are used occasionally in Australia to catch pilchards (e.g. Australian Sardines), Australian Anchovy and garfish. They are a more specialised type of surrounding net with wings (long, tapered panels of net added to each side of the bunt), giving the net a characteristic scoop shape. Lampara nets are mostly used at night with lights. The net is towed during the hauling process.
A lampara net
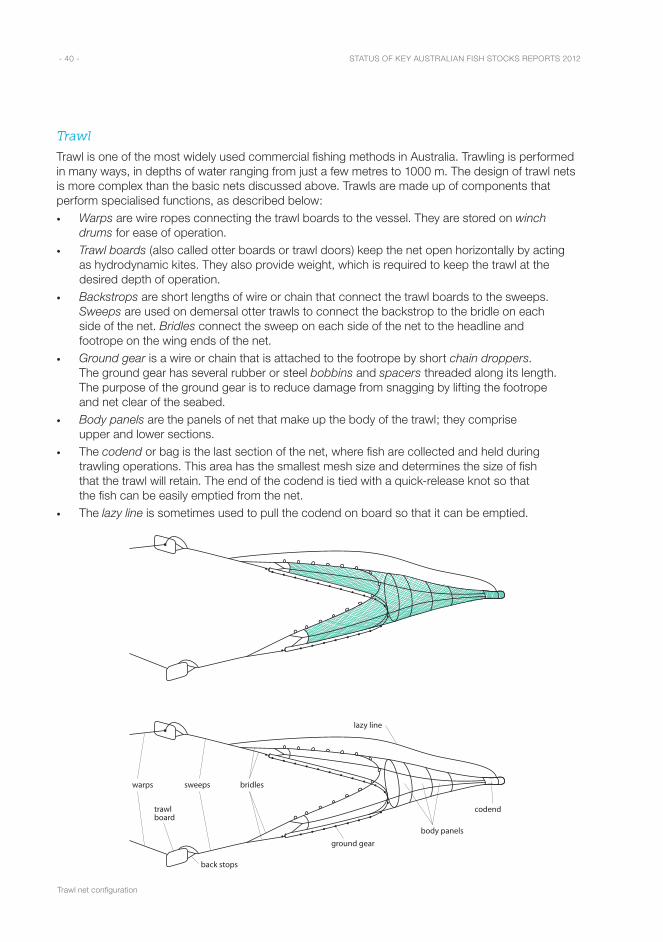
STATUS OF KEY AUSTRALIAN FISH STOCKS REPORTS 2012 - 40 -
Trawl
Trawl is one of the most widely used commercial fishing methods in Australia. Trawling is performed in many ways, in depths of water ranging from just a few metres to 1000 m. The design of trawl nets is more complex than the basic nets discussed above. Trawls are made up of components that perform specialised functions, as described below:• Warps are wire ropes connecting the trawl boards to the vessel. They are stored on winch
drums for ease of operation. • Trawl boards (also called otter boards or trawl doors) keep the net open horizontally by acting
as hydrodynamic kites. They also provide weight, which is required to keep the trawl at the desired depth of operation.
• Backstrops are short lengths of wire or chain that connect the trawl boards to the sweeps. Sweeps are used on demersal otter trawls to connect the backstrop to the bridle on each side of the net. Bridles connect the sweep on each side of the net to the headline and footrope on the wing ends of the net.
• Ground gear is a wire or chain that is attached to the footrope by short chain droppers. The ground gear has several rubber or steel bobbins and spacers threaded along its length. The purpose of the ground gear is to reduce damage from snagging by lifting the footrope and net clear of the seabed.
• Body panels are the panels of net that make up the body of the trawl; they comprise upper and lower sections.
• The codend or bag is the last section of the net, where fish are collected and held during trawling operations. This area has the smallest mesh size and determines the size of fish that the trawl will retain. The end of the codend is tied with a quick-release knot so that the fish can be easily emptied from the net.
• The lazy line is sometimes used to pull the codend on board so that it can be emptied.
warps sweeps bridles
back stops
ground gear
lazy line
trawlboard
codend
body panels
Trawl net configuration
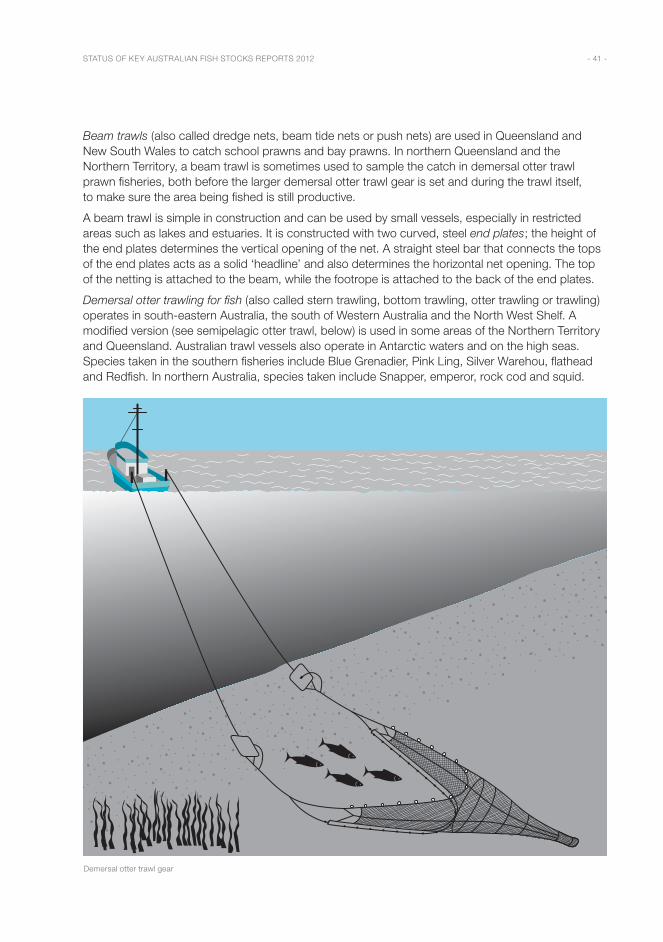
STATUS OF KEY AUSTRALIAN FISH STOCKS REPORTS 2012 - 41 -
Beam trawls (also called dredge nets, beam tide nets or push nets) are used in Queensland and New South Wales to catch school prawns and bay prawns. In northern Queensland and the Northern Territory, a beam trawl is sometimes used to sample the catch in demersal otter trawl prawn fisheries, both before the larger demersal otter trawl gear is set and during the trawl itself, to make sure the area being fished is still productive.
A beam trawl is simple in construction and can be used by small vessels, especially in restricted areas such as lakes and estuaries. It is constructed with two curved, steel end plates; the height of the end plates determines the vertical opening of the net. A straight steel bar that connects the tops of the end plates acts as a solid ‘headline’ and also determines the horizontal net opening. The top of the netting is attached to the beam, while the footrope is attached to the back of the end plates.
Demersal otter trawling for fish (also called stern trawling, bottom trawling, otter trawling or trawling) operates in south-eastern Australia, the south of Western Australia and the North West Shelf. A modified version (see semipelagic otter trawl, below) is used in some areas of the Northern Territory and Queensland. Australian trawl vessels also operate in Antarctic waters and on the high seas. Species taken in the southern fisheries include Blue Grenadier, Pink Ling, Silver Warehou, flathead and Redfish. In northern Australia, species taken include Snapper, emperor, rock cod and squid.
Demersal otter trawl gear
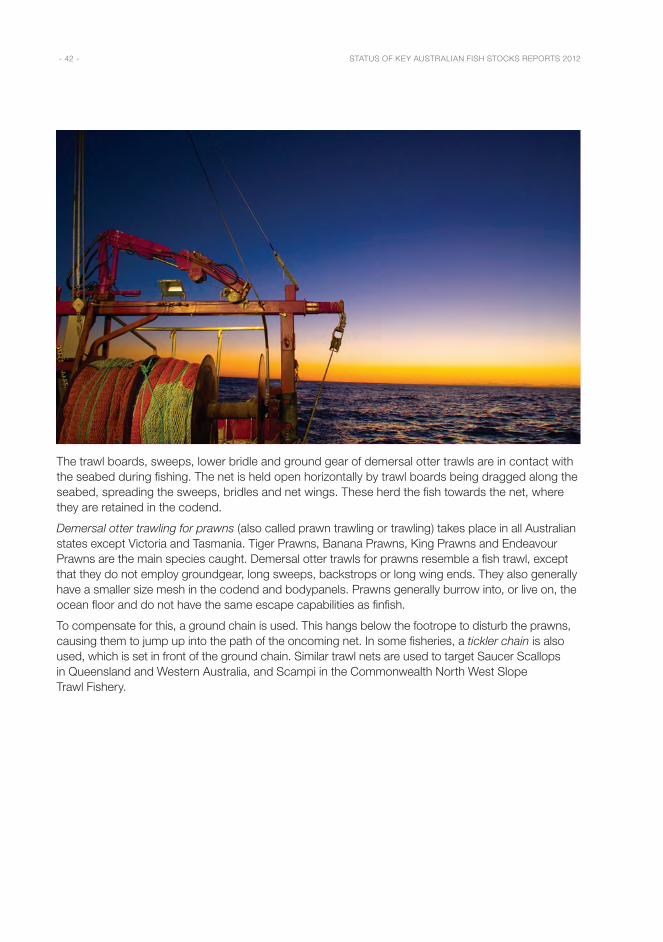
STATUS OF KEY AUSTRALIAN FISH STOCKS REPORTS 2012 - 42 -
The trawl boards, sweeps, lower bridle and ground gear of demersal otter trawls are in contact with the seabed during fishing. The net is held open horizontally by trawl boards being dragged along the seabed, spreading the sweeps, bridles and net wings. These herd the fish towards the net, where they are retained in the codend.
Demersal otter trawling for prawns (also called prawn trawling or trawling) takes place in all Australian states except Victoria and Tasmania. Tiger Prawns, Banana Prawns, King Prawns and Endeavour Prawns are the main species caught. Demersal otter trawls for prawns resemble a fish trawl, except that they do not employ groundgear, long sweeps, backstrops or long wing ends. They also generally have a smaller size mesh in the codend and bodypanels. Prawns generally burrow into, or live on, the ocean floor and do not have the same escape capabilities as finfish.
To compensate for this, a ground chain is used. This hangs below the footrope to disturb the prawns, causing them to jump up into the path of the oncoming net. In some fisheries, a tickler chain is also used, which is set in front of the ground chain. Similar trawl nets are used to target Saucer Scallops in Queensland and Western Australia, and Scampi in the Commonwealth North West Slope Trawl Fishery.
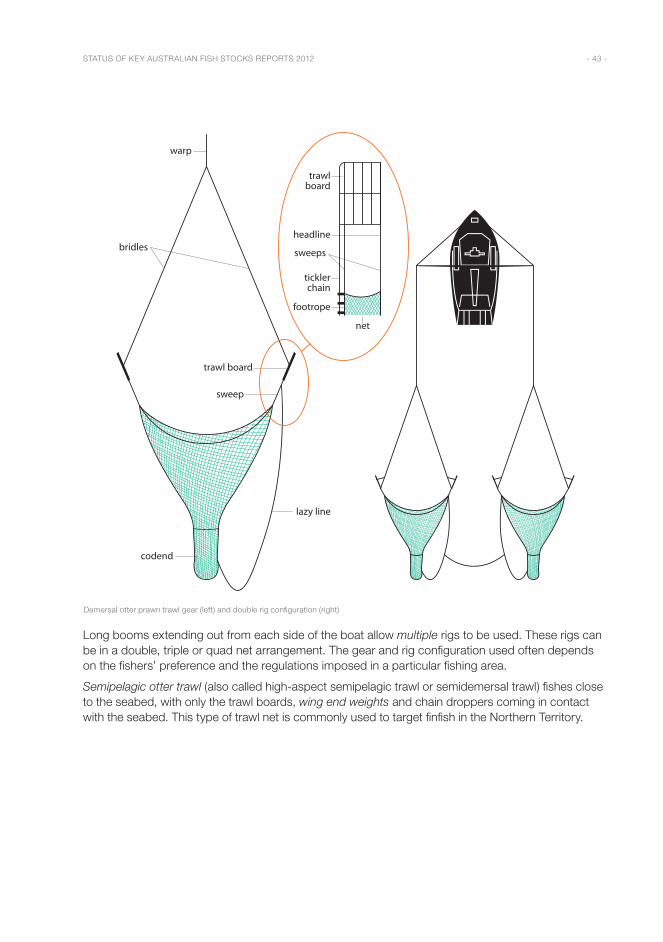
STATUS OF KEY AUSTRALIAN FISH STOCKS REPORTS 2012 - 43 -
lazy line
warp
bridles
codend
trawl board
sweep
sweeps
trawlboard
ticklerchain
footrope
headline
net
Demersal otter prawn trawl gear (left) and double rig configuration (right)
Long booms extending out from each side of the boat allow multiple rigs to be used. These rigs can be in a double, triple or quad net arrangement. The gear and rig configuration used often depends on the fishers’ preference and the regulations imposed in a particular fishing area.
Semipelagic otter trawl (also called high-aspect semipelagic trawl or semidemersal trawl) fishes close to the seabed, with only the trawl boards, wing end weights and chain droppers coming in contact with the seabed. This type of trawl net is commonly used to target finfish in the Northern Territory.
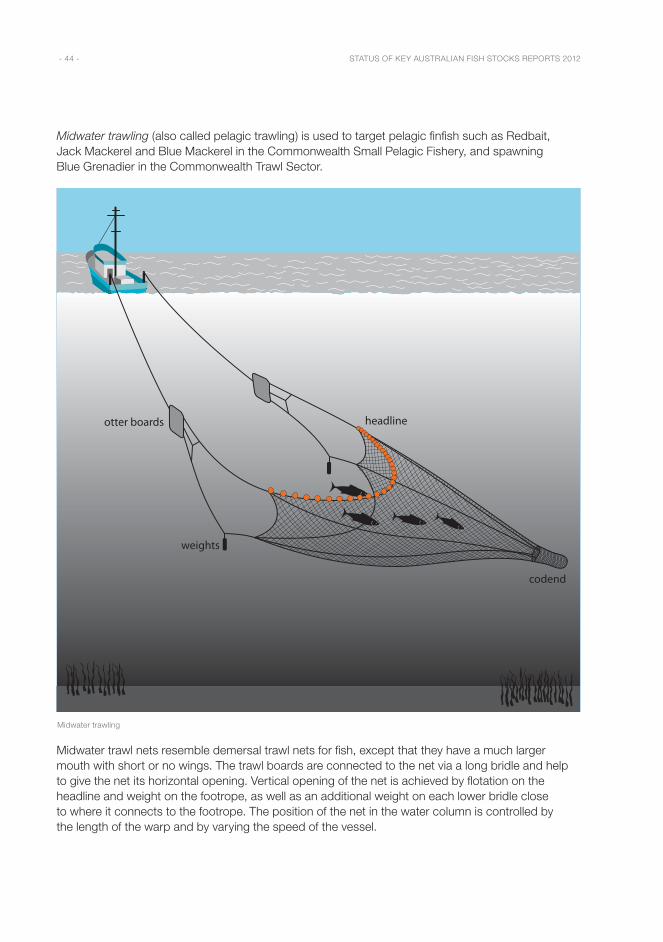
STATUS OF KEY AUSTRALIAN FISH STOCKS REPORTS 2012 - 44 -
Midwater trawling (also called pelagic trawling) is used to target pelagic finfish such as Redbait, Jack Mackerel and Blue Mackerel in the Commonwealth Small Pelagic Fishery, and spawning Blue Grenadier in the Commonwealth Trawl Sector.
weights
otter boards headline
codend
Midwater trawling
Midwater trawl nets resemble demersal trawl nets for fish, except that they have a much larger mouth with short or no wings. The trawl boards are connected to the net via a long bridle and help to give the net its horizontal opening. Vertical opening of the net is achieved by flotation on the headline and weight on the footrope, as well as an additional weight on each lower bridle close to where it connects to the footrope. The position of the net in the water column is controlled by the length of the warp and by varying the speed of the vessel.
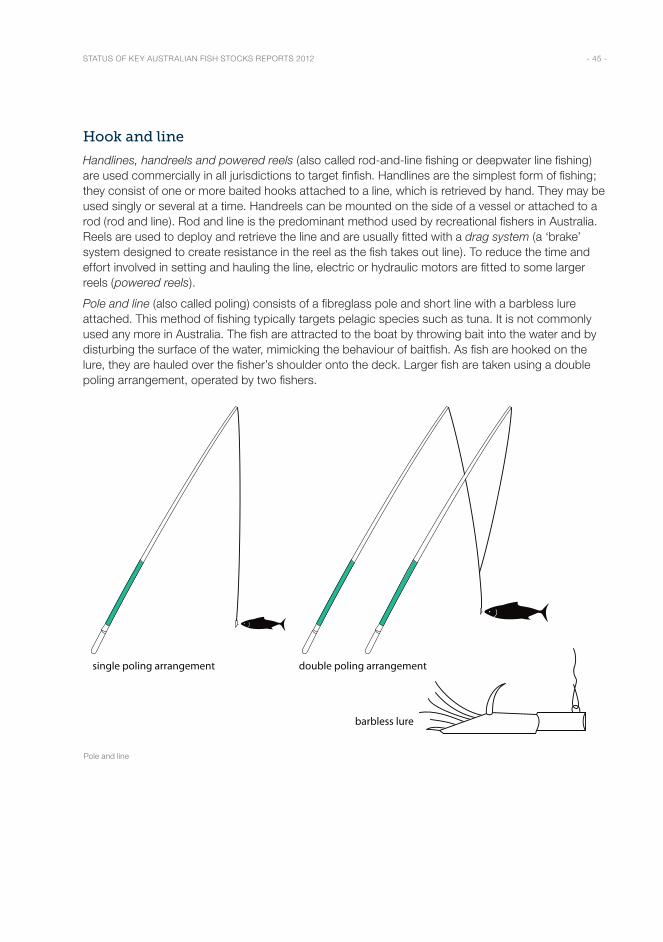
STATUS OF KEY AUSTRALIAN FISH STOCKS REPORTS 2012 - 45 -
Hook and line
Handlines, handreels and powered reels (also called rod-and-line fishing or deepwater line fishing) are used commercially in all jurisdictions to target finfish. Handlines are the simplest form of fishing; they consist of one or more baited hooks attached to a line, which is retrieved by hand. They may be used singly or several at a time. Handreels can be mounted on the side of a vessel or attached to a rod (rod and line). Rod and line is the predominant method used by recreational fishers in Australia. Reels are used to deploy and retrieve the line and are usually fitted with a drag system (a ‘brake’ system designed to create resistance in the reel as the fish takes out line). To reduce the time and effort involved in setting and hauling the line, electric or hydraulic motors are fitted to some larger reels (powered reels).
Pole and line (also called poling) consists of a fibreglass pole and short line with a barbless lure attached. This method of fishing typically targets pelagic species such as tuna. It is not commonly used any more in Australia. The fish are attracted to the boat by throwing bait into the water and by disturbing the surface of the water, mimicking the behaviour of baitfish. As fish are hooked on the lure, they are hauled over the fisher’s shoulder onto the deck. Larger fish are taken using a double poling arrangement, operated by two fishers.
Pole and line
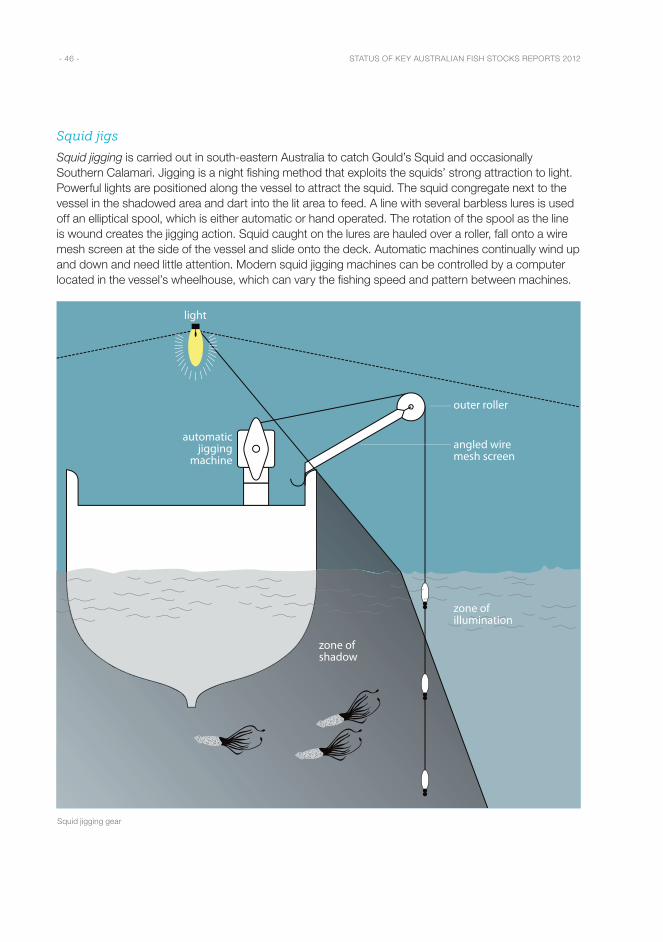
STATUS OF KEY AUSTRALIAN FISH STOCKS REPORTS 2012 - 46 -
Squid jigs
Squid jigging is carried out in south-eastern Australia to catch Gould’s Squid and occasionally Southern Calamari. Jigging is a night fishing method that exploits the squids’ strong attraction to light. Powerful lights are positioned along the vessel to attract the squid. The squid congregate next to the vessel in the shadowed area and dart into the lit area to feed. A line with several barbless lures is used off an elliptical spool, which is either automatic or hand operated. The rotation of the spool as the line is wound creates the jigging action. Squid caught on the lures are hauled over a roller, fall onto a wire mesh screen at the side of the vessel and slide onto the deck. Automatic machines continually wind up and down and need little attention. Modern squid jigging machines can be controlled by a computer located in the vessel’s wheelhouse, which can vary the fishing speed and pattern between machines.
Squid jigging gear
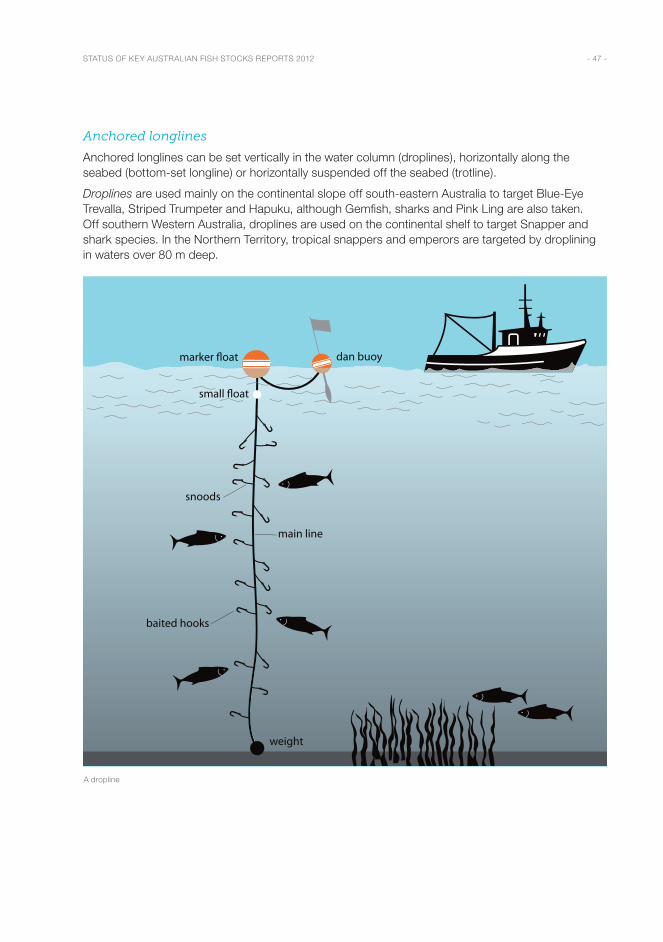
STATUS OF KEY AUSTRALIAN FISH STOCKS REPORTS 2012 - 47 -
Anchored longlines
Anchored longlines can be set vertically in the water column (droplines), horizontally along the seabed (bottom-set longline) or horizontally suspended off the seabed (trotline).
Droplines are used mainly on the continental slope off south-eastern Australia to target Blue-Eye Trevalla, Striped Trumpeter and Hapuku, although Gemfish, sharks and Pink Ling are also taken. Off southern Western Australia, droplines are used on the continental shelf to target Snapper and shark species. In the Northern Territory, tropical snappers and emperors are targeted by droplining in waters over 80 m deep.
A dropline
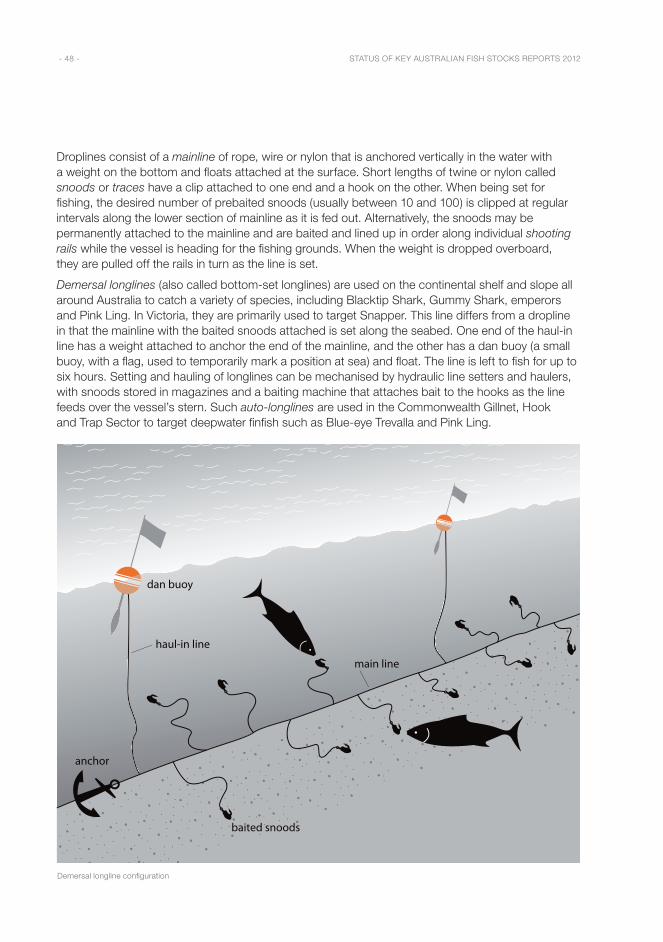
STATUS OF KEY AUSTRALIAN FISH STOCKS REPORTS 2012 - 48 -
Droplines consist of a mainline of rope, wire or nylon that is anchored vertically in the water with a weight on the bottom and floats attached at the surface. Short lengths of twine or nylon called snoods or traces have a clip attached to one end and a hook on the other. When being set for fishing, the desired number of prebaited snoods (usually between 10 and 100) is clipped at regular intervals along the lower section of mainline as it is fed out. Alternatively, the snoods may be permanently attached to the mainline and are baited and lined up in order along individual shooting rails while the vessel is heading for the fishing grounds. When the weight is dropped overboard, they are pulled off the rails in turn as the line is set.
Demersal longlines (also called bottom-set longlines) are used on the continental shelf and slope all around Australia to catch a variety of species, including Blacktip Shark, Gummy Shark, emperors and Pink Ling. In Victoria, they are primarily used to target Snapper. This line differs from a dropline in that the mainline with the baited snoods attached is set along the seabed. One end of the haul-in line has a weight attached to anchor the end of the mainline, and the other has a dan buoy (a small buoy, with a flag, used to temporarily mark a position at sea) and float. The line is left to fish for up to six hours. Setting and hauling of longlines can be mechanised by hydraulic line setters and haulers, with snoods stored in magazines and a baiting machine that attaches bait to the hooks as the line feeds over the vessel’s stern. Such auto-longlines are used in the Commonwealth Gillnet, Hook and Trap Sector to target deepwater finfish such as Blue-eye Trevalla and Pink Ling.
Demersal longline configuration
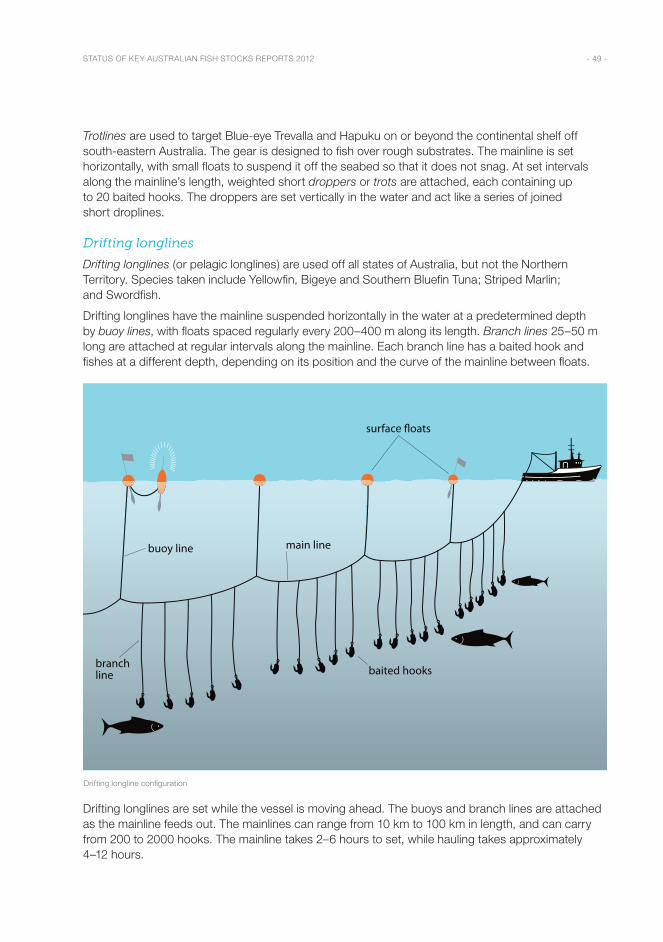
STATUS OF KEY AUSTRALIAN FISH STOCKS REPORTS 2012 - 49 -
Trotlines are used to target Blue-eye Trevalla and Hapuku on or beyond the continental shelf off south-eastern Australia. The gear is designed to fish over rough substrates. The mainline is set horizontally, with small floats to suspend it off the seabed so that it does not snag. At set intervals along the mainline’s length, weighted short droppers or trots are attached, each containing up to 20 baited hooks. The droppers are set vertically in the water and act like a series of joined short droplines.
Drifting longlines
Drifting longlines (or pelagic longlines) are used off all states of Australia, but not the Northern Territory. Species taken include Yellowfin, Bigeye and Southern Bluefin Tuna; Striped Marlin; and Swordfish.
Drifting longlines have the mainline suspended horizontally in the water at a predetermined depth by buoy lines, with floats spaced regularly every 200–400 m along its length. Branch lines 25–50 m long are attached at regular intervals along the mainline. Each branch line has a baited hook and fishes at a different depth, depending on its position and the curve of the mainline between floats.
Drifting longline configuration
Drifting longlines are set while the vessel is moving ahead. The buoys and branch lines are attached as the mainline feeds out. The mainlines can range from 10 km to 100 km in length, and can carry from 200 to 2000 hooks. The mainline takes 2–6 hours to set, while hauling takes approximately 4–12 hours.
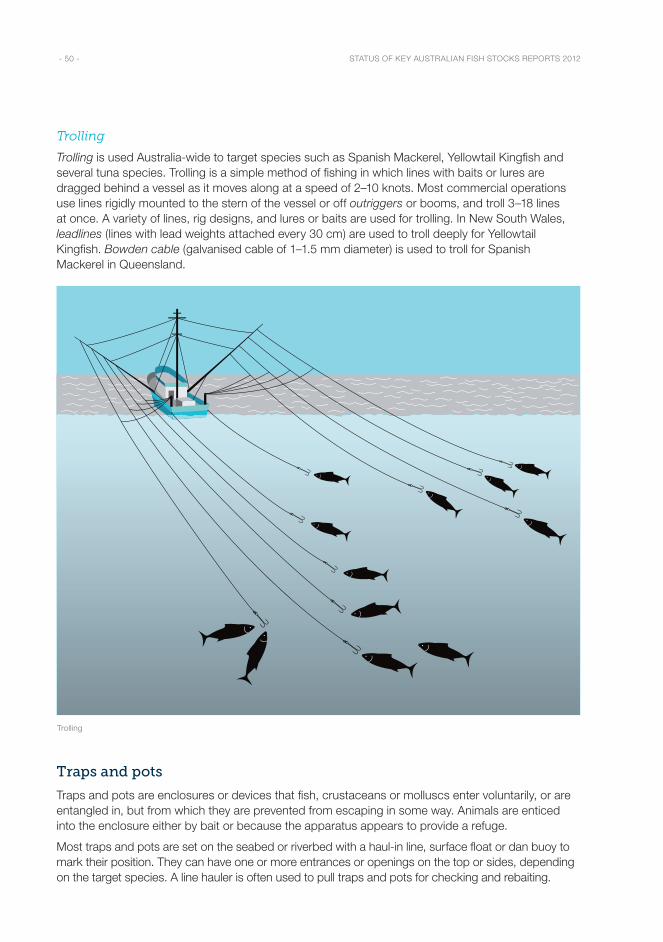
STATUS OF KEY AUSTRALIAN FISH STOCKS REPORTS 2012 - 50 -
Trolling
Trolling is used Australia-wide to target species such as Spanish Mackerel, Yellowtail Kingfish and several tuna species. Trolling is a simple method of fishing in which lines with baits or lures are dragged behind a vessel as it moves along at a speed of 2–10 knots. Most commercial operations use lines rigidly mounted to the stern of the vessel or off outriggers or booms, and troll 3–18 lines at once. A variety of lines, rig designs, and lures or baits are used for trolling. In New South Wales, leadlines (lines with lead weights attached every 30 cm) are used to troll deeply for Yellowtail Kingfish. Bowden cable (galvanised cable of 1–1.5 mm diameter) is used to troll for Spanish Mackerel in Queensland.
Trolling
Traps and pots
Traps and pots are enclosures or devices that fish, crustaceans or molluscs enter voluntarily, or are entangled in, but from which they are prevented from escaping in some way. Animals are enticed into the enclosure either by bait or because the apparatus appears to provide a refuge.
Most traps and pots are set on the seabed or riverbed with a haul-in line, surface float or dan buoy to mark their position. They can have one or more entrances or openings on the top or sides, depending on the target species. A line hauler is often used to pull traps and pots for checking and rebaiting.
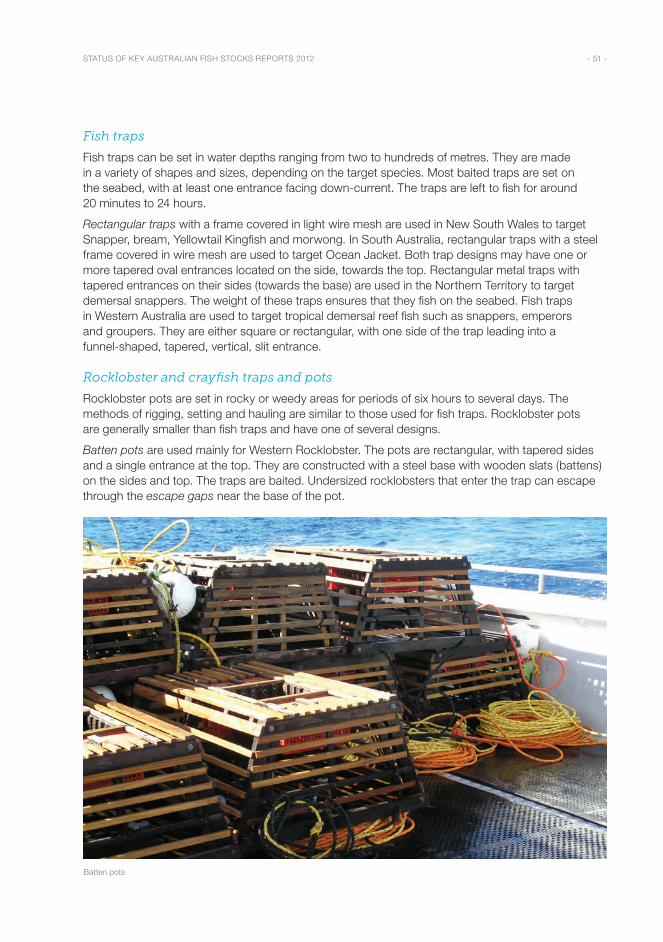
STATUS OF KEY AUSTRALIAN FISH STOCKS REPORTS 2012 - 51 -
Fish traps
Fish traps can be set in water depths ranging from two to hundreds of metres. They are made in a variety of shapes and sizes, depending on the target species. Most baited traps are set on the seabed, with at least one entrance facing down-current. The traps are left to fish for around 20 minutes to 24 hours.
Rectangular traps with a frame covered in light wire mesh are used in New South Wales to target Snapper, bream, Yellowtail Kingfish and morwong. In South Australia, rectangular traps with a steel frame covered in wire mesh are used to target Ocean Jacket. Both trap designs may have one or more tapered oval entrances located on the side, towards the top. Rectangular metal traps with tapered entrances on their sides (towards the base) are used in the Northern Territory to target demersal snappers. The weight of these traps ensures that they fish on the seabed. Fish traps in Western Australia are used to target tropical demersal reef fish such as snappers, emperors and groupers. They are either square or rectangular, with one side of the trap leading into a funnel-shaped, tapered, vertical, slit entrance.
Rocklobster and crayfish traps and pots
Rocklobster pots are set in rocky or weedy areas for periods of six hours to several days. The methods of rigging, setting and hauling are similar to those used for fish traps. Rocklobster pots are generally smaller than fish traps and have one of several designs.
Batten pots are used mainly for Western Rocklobster. The pots are rectangular, with tapered sides and a single entrance at the top. They are constructed with a steel base with wooden slats (battens) on the sides and top. The traps are baited. Undersized rocklobsters that enter the trap can escape through the escape gaps near the base of the pot.
Batten pots
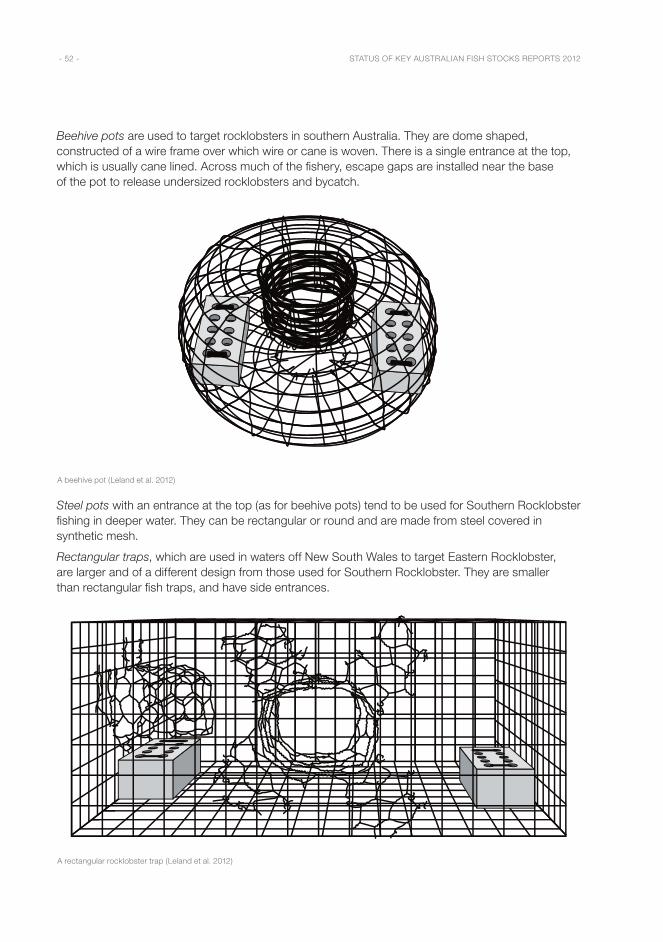
STATUS OF KEY AUSTRALIAN FISH STOCKS REPORTS 2012 - 52 -
Beehive pots are used to target rocklobsters in southern Australia. They are dome shaped, constructed of a wire frame over which wire or cane is woven. There is a single entrance at the top, which is usually cane lined. Across much of the fishery, escape gaps are installed near the base of the pot to release undersized rocklobsters and bycatch.
A beehive pot (Leland et al. 2012)
Steel pots with an entrance at the top (as for beehive pots) tend to be used for Southern Rocklobster fishing in deeper water. They can be rectangular or round and are made from steel covered in synthetic mesh.
Rectangular traps, which are used in waters off New South Wales to target Eastern Rocklobster, are larger and of a different design from those used for Southern Rocklobster. They are smaller than rectangular fish traps, and have side entrances.
A rectangular rocklobster trap (Leland et al. 2012)
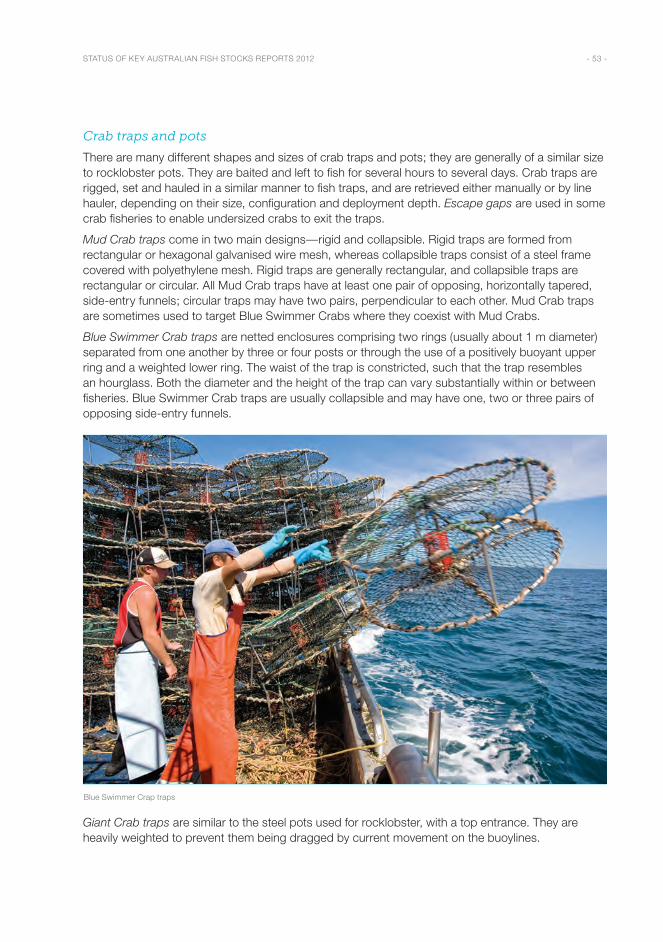
STATUS OF KEY AUSTRALIAN FISH STOCKS REPORTS 2012 - 53 -
Crab traps and pots
There are many different shapes and sizes of crab traps and pots; they are generally of a similar size to rocklobster pots. They are baited and left to fish for several hours to several days. Crab traps are rigged, set and hauled in a similar manner to fish traps, and are retrieved either manually or by line hauler, depending on their size, configuration and deployment depth. Escape gaps are used in some crab fisheries to enable undersized crabs to exit the traps.
Mud Crab traps come in two main designs—rigid and collapsible. Rigid traps are formed from rectangular or hexagonal galvanised wire mesh, whereas collapsible traps consist of a steel frame covered with polyethylene mesh. Rigid traps are generally rectangular, and collapsible traps are rectangular or circular. All Mud Crab traps have at least one pair of opposing, horizontally tapered, side-entry funnels; circular traps may have two pairs, perpendicular to each other. Mud Crab traps are sometimes used to target Blue Swimmer Crabs where they coexist with Mud Crabs.
Blue Swimmer Crab traps are netted enclosures comprising two rings (usually about 1 m diameter) separated from one another by three or four posts or through the use of a positively buoyant upper ring and a weighted lower ring. The waist of the trap is constricted, such that the trap resembles an hourglass. Both the diameter and the height of the trap can vary substantially within or between fisheries. Blue Swimmer Crab traps are usually collapsible and may have one, two or three pairs of opposing side-entry funnels.
Blue Swimmer Crap traps
Giant Crab traps are similar to the steel pots used for rocklobster, with a top entrance. They are heavily weighted to prevent them being dragged by current movement on the buoylines.
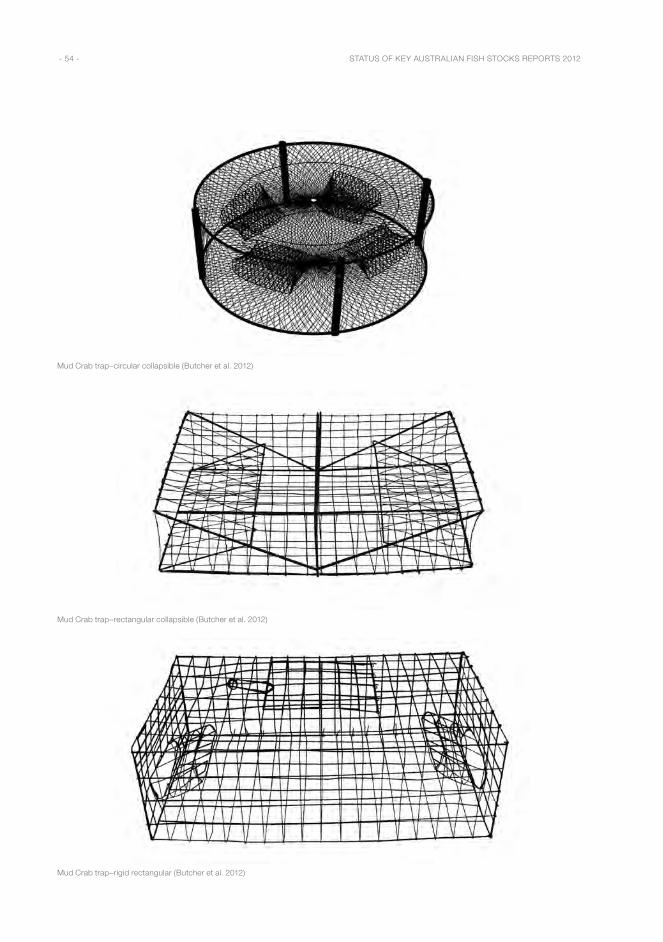
STATUS OF KEY AUSTRALIAN FISH STOCKS REPORTS 2012 - 54 -
Mud Crab trap–circular collapsible (Butcher et al. 2012)
Mud Crab trap–rectangular collapsible (Butcher et al. 2012)
Mud Crab trap–rigid rectangular (Butcher et al. 2012)
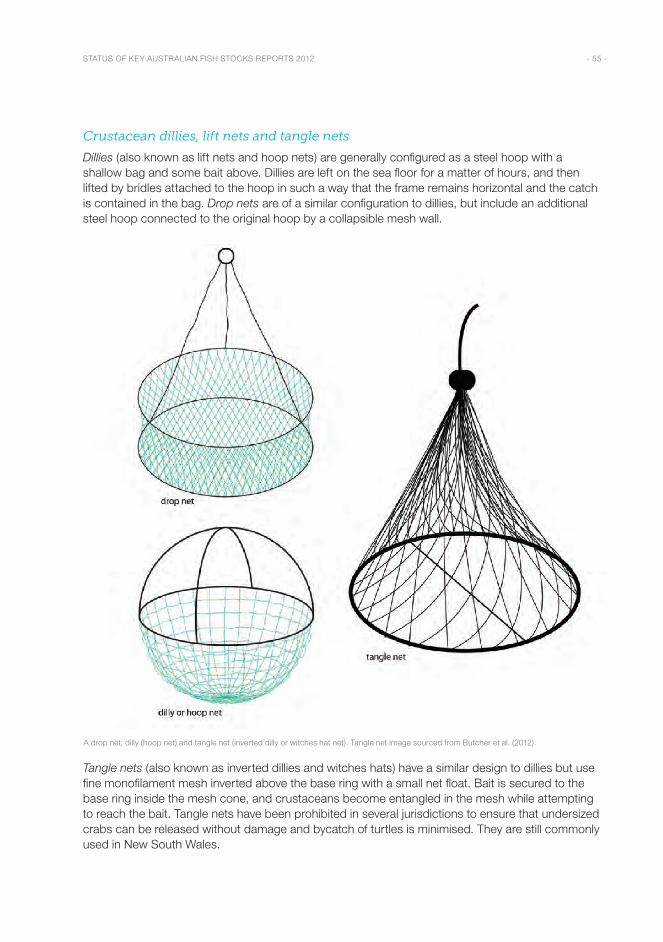
STATUS OF KEY AUSTRALIAN FISH STOCKS REPORTS 2012 - 55 -
Crustacean dillies, lift nets and tangle nets
Dillies (also known as lift nets and hoop nets) are generally configured as a steel hoop with a shallow bag and some bait above. Dillies are left on the sea floor for a matter of hours, and then lifted by bridles attached to the hoop in such a way that the frame remains horizontal and the catch is contained in the bag. Drop nets are of a similar configuration to dillies, but include an additional steel hoop connected to the original hoop by a collapsible mesh wall.
A drop net, dilly (hoop net) and tangle net (inverted dilly or witches hat net). Tangle net image sourced from Butcher et al. (2012).
Tangle nets (also known as inverted dillies and witches hats) have a similar design to dillies but use fine monofilament mesh inverted above the base ring with a small net float. Bait is secured to the base ring inside the mesh cone, and crustaceans become entangled in the mesh while attempting to reach the bait. Tangle nets have been prohibited in several jurisdictions to ensure that undersized crabs can be released without damage and bycatch of turtles is minimised. They are still commonly used in New South Wales.
STATUS OF KEY AUSTRALIAN FISH STOCKS REPORTS 2012 - 56 -
Hawaiian-style flat tangle nets (also known as Spanner Crab nets or flat snares) comprise a square or circular steel frame across which a layer of multifilament mesh is tightly stretched, and bait is positioned centrally. These nets may be deployed individually or as part of a demersal line attached to a float line for periods of 30 minutes to several hours.
Octopus traps or pots
Octopus traps or pots are, or have been, used commercially in central and southern Western Australia, South Australia and Tasmania. Octopus pots are made of plastic, pottery or PVC tubing, weighted with concrete, and typically have a volume of 4 litres. Octopus enter the pots seeking safe refuges.
Pots are clipped along a demersal mainline at regular intervals, with up to 500 pots set on a single line. The mainline is weighted or anchored at both ends with a haul-in line and buoy attached to each weight or anchor. The pots are left to fish for approximately 7–45 days, allowing the octopus to use them as a home. Pots are weighted to minimise movement of the gear in exposed waters.
Fish nets used as traps
Nets or netting material are used in many configurations to trap fish species.
Lift nets (also called hoop nets) are used in southern Western Australia and (rarely) in Victoria to catch Australian Sardines and Australian Herring. The net resembles a large dilly with a weight in the end, forming a long, tapered bag. The net is set off wharfs or from small vessels. It can be used by night with a light or by day with berley to attract fish. The net is hauled vertically, trapping the aggregation of fish.
Tunnel nets are used along the coast or in estuaries in southern Queensland to target many species, including mullet, Tailor, flathead and Luderick. The net is constructed of two long (up to a combined length of 1700 m) wings and a central pocket or ‘tunnel’. An area in which fish concentrate, or a school of fish, is located at high tide, and the net is staked in position to form a large arrow shape, with the wing ends circling inwards to lead escaping fish back into the net. The net relies on fish encountering the net as they move with the receding tide. The fish become concentrated in the tunnel, which remains in the water at low tide. The tunnel section is finally lifted on board a dinghy and emptied.
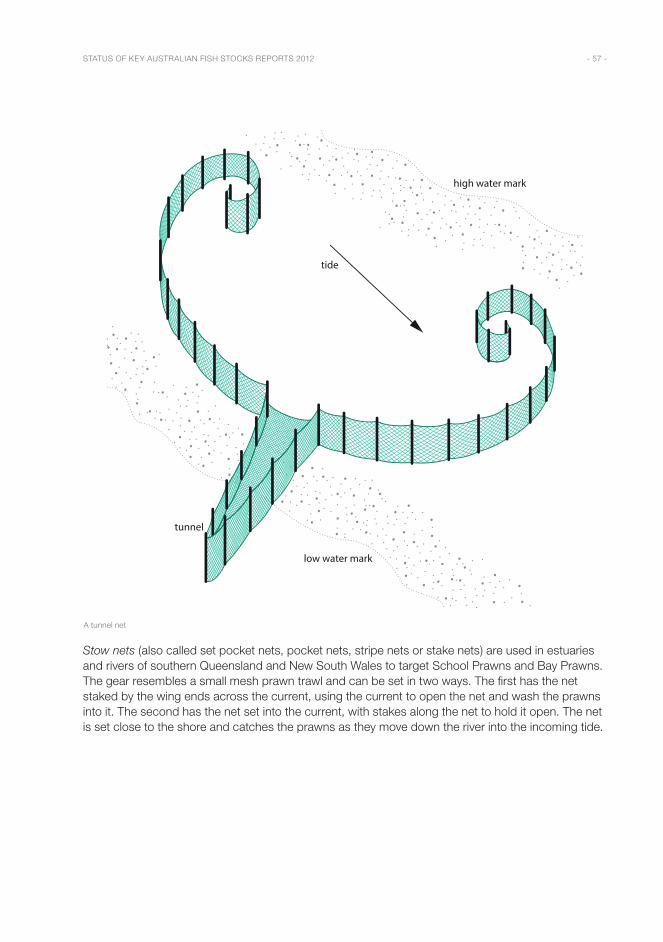
STATUS OF KEY AUSTRALIAN FISH STOCKS REPORTS 2012 - 57 -
tunnel
low water mark
high water mark
tide
A tunnel net
Stow nets (also called set pocket nets, pocket nets, stripe nets or stake nets) are used in estuaries and rivers of southern Queensland and New South Wales to target School Prawns and Bay Prawns. The gear resembles a small mesh prawn trawl and can be set in two ways. The first has the net staked by the wing ends across the current, using the current to open the net and wash the prawns into it. The second has the net set into the current, with stakes along the net to hold it open. The net is set close to the shore and catches the prawns as they move down the river into the incoming tide.
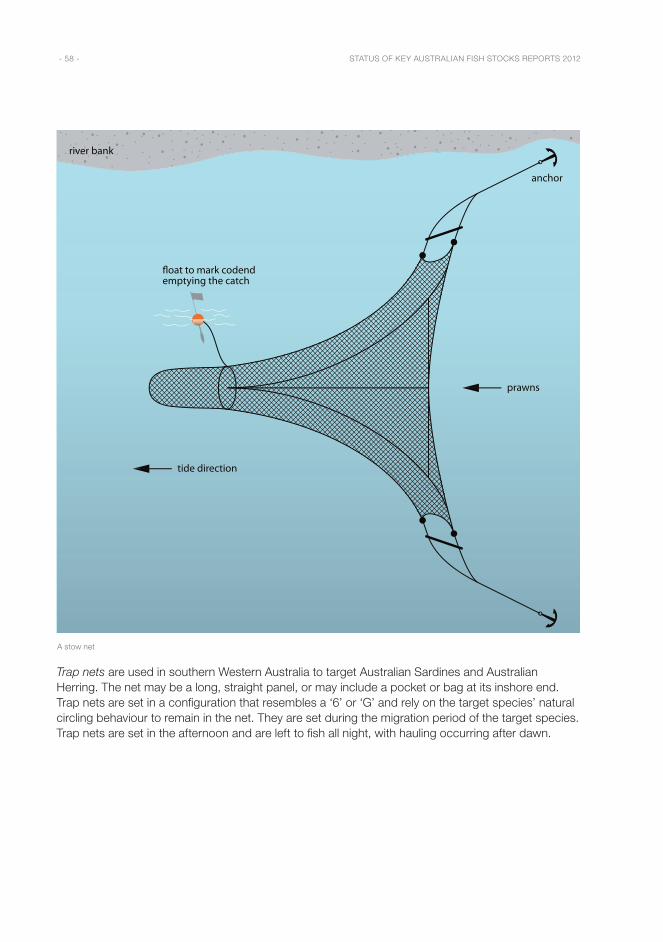
STATUS OF KEY AUSTRALIAN FISH STOCKS REPORTS 2012 - 58 -
A stow net
Trap nets are used in southern Western Australia to target Australian Sardines and Australian Herring. The net may be a long, straight panel, or may include a pocket or bag at its inshore end. Trap nets are set in a configuration that resembles a ‘6’ or ‘G’ and rely on the target species’ natural circling behaviour to remain in the net. They are set during the migration period of the target species. Trap nets are set in the afternoon and are left to fish all night, with hauling occurring after dawn.
STATUS OF KEY AUSTRALIAN FISH STOCKS REPORTS 2012 - 59 -
Dredges
Dredges (toothed mud dredges) are used extensively in the waters off Victoria and Tasmania, including Bass Strait, to take Commercial Scallop. The Australian-designed scallop dredge consists of a heavy steel frame covered with steel mesh on all sides, except the front (i.e. the towed side). A toothed bar mounted across the lower front of the dredge helps to ‘dig’ the scallops out of the substrate. The weight of the dredge keeps it on the seabed as it is towed. As the dredge is dragged across the seabed, the scallops or mussels in its path enter the dredge and are retained by the mesh. A drag can last for 10–60 minutes, after which the dredge is winched up to the back of the vessel. The dredge enters a tipper device on the back of the vessel, and the contents are tipped onto a sorting table.
Diving
Diving as a method of fishing is carried out in all states of Australia. Species targeted include abalone, Tropical Rocklobster, Pearl Oyster, Sea Urchins and occasionally Commercial Scallop. The three styles of diving used in Australia are snorkelling (or free diving), scuba (self-contained underwater breathing apparatus) diving and hookah diving (using surface-supplied air).
The five main gear components used in snorkelling or free diving are a face mask, flippers or fins, a snorkel, a weight belt and a wetsuit. When free diving, the diver’s air supply is limited by lung capacity, and so snorkelling is a shallow-water activity. Scuba divers carry air tanks, in addition to the basic snorkelling gear, which enable them to stay under water longer and to work in deeper waters. Divers are still restricted by the amount of air that can be stored in the tank, so if long periods under the water are required hookah gear is used. Hookah divers are supplied with air via an air line from a compressor in a boat.
Divers in different fisheries also use several hand-held implements to aid in collection. Abalone divers use a chisel-like tool known as an abalone iron to remove the abalone from the rocks, and a netting bag to hold the abalone collected. Divers collecting Blue Mussel scrape them off pylons and rocks with a knife and place them in a bag. Divers collecting Tropical Rocklobster use hand-held implements such as snares, nets or spears to catch the lobsters. Divers collecting Pearl Oyster, Sea Urchins and Commercial Scallop collect them by hand and place them in a bag similar to that used by abalone divers.
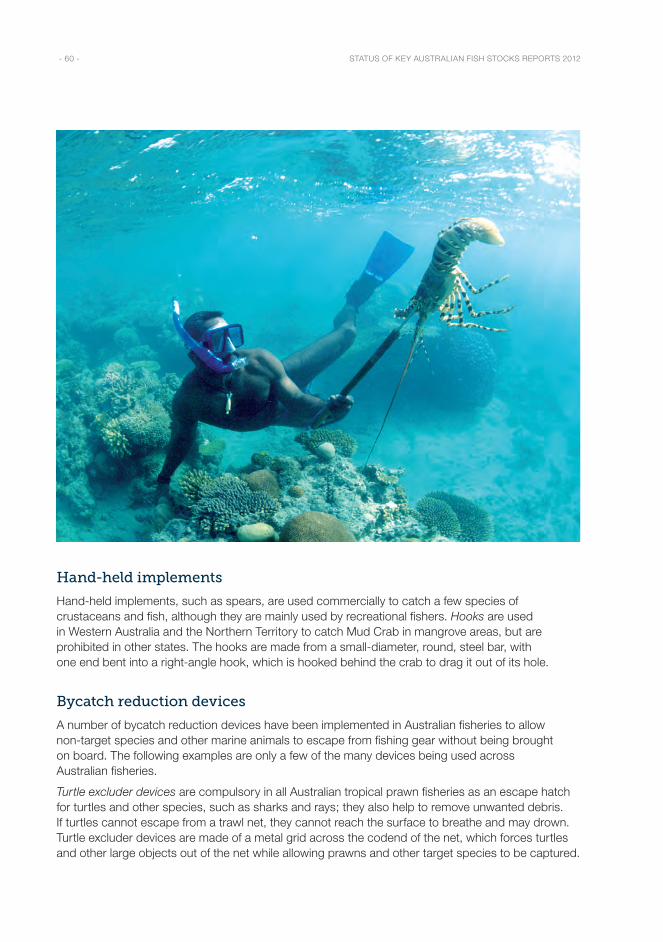
STATUS OF KEY AUSTRALIAN FISH STOCKS REPORTS 2012 - 60 -
Hand-held implements
Hand-held implements, such as spears, are used commercially to catch a few species of crustaceans and fish, although they are mainly used by recreational fishers. Hooks are used in Western Australia and the Northern Territory to catch Mud Crab in mangrove areas, but are prohibited in other states. The hooks are made from a small-diameter, round, steel bar, with one end bent into a right-angle hook, which is hooked behind the crab to drag it out of its hole.
Bycatch reduction devices
A number of bycatch reduction devices have been implemented in Australian fisheries to allow non-target species and other marine animals to escape from fishing gear without being brought on board. The following examples are only a few of the many devices being used across Australian fisheries.
Turtle excluder devices are compulsory in all Australian tropical prawn fisheries as an escape hatch for turtles and other species, such as sharks and rays; they also help to remove unwanted debris. If turtles cannot escape from a trawl net, they cannot reach the surface to breathe and may drown. Turtle excluder devices are made of a metal grid across the codend of the net, which forces turtles and other large objects out of the net while allowing prawns and other target species to be captured.
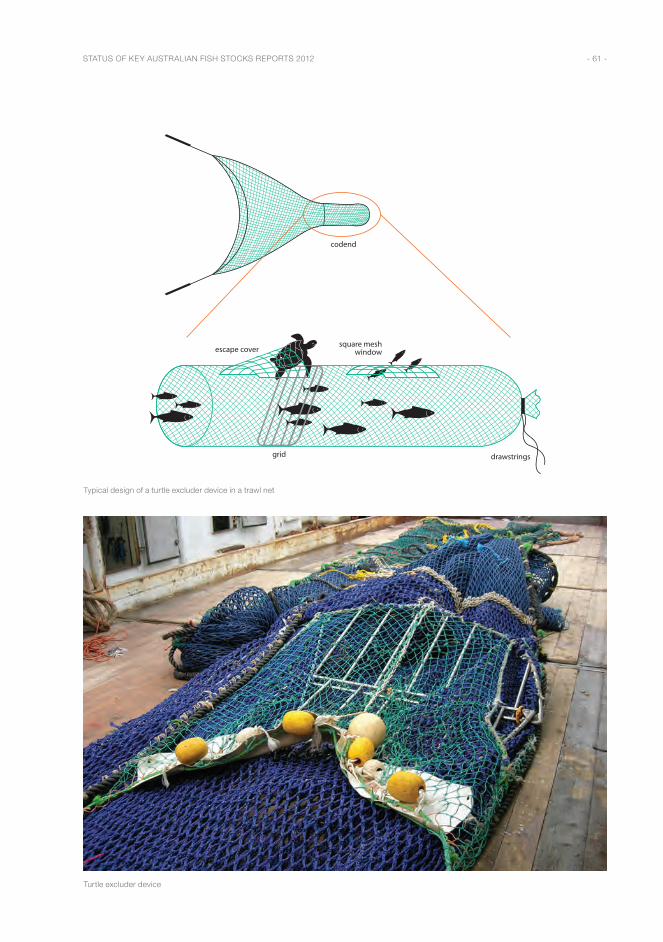
STATUS OF KEY AUSTRALIAN FISH STOCKS REPORTS 2012 - 61 -
escape cover
codend
grid drawstrings
square meshwindow
Typical design of a turtle excluder device in a trawl net
Turtle excluder device
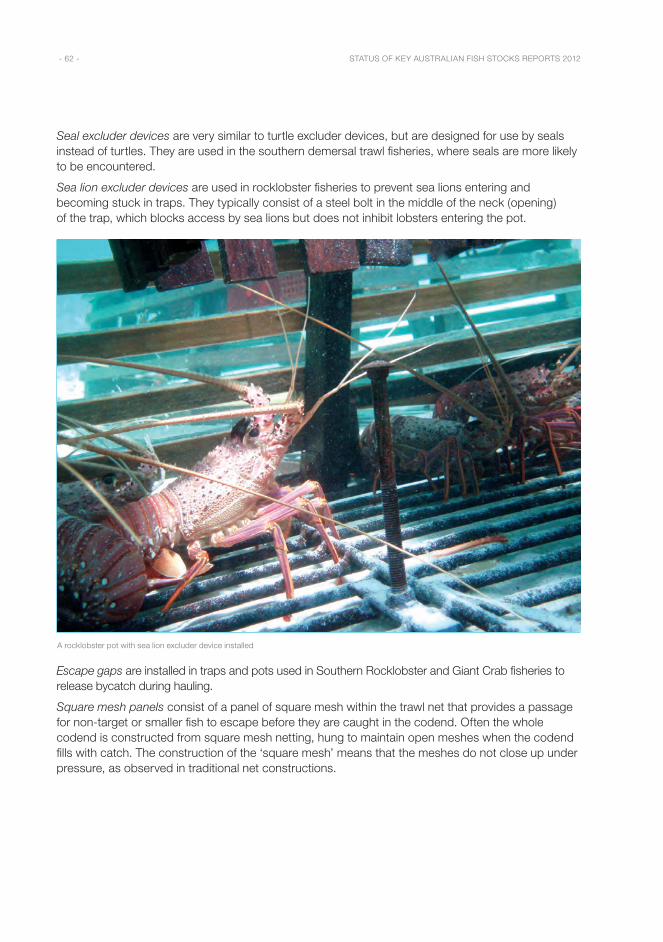
STATUS OF KEY AUSTRALIAN FISH STOCKS REPORTS 2012 - 62 -
Seal excluder devices are very similar to turtle excluder devices, but are designed for use by seals instead of turtles. They are used in the southern demersal trawl fisheries, where seals are more likely to be encountered.
Sea lion excluder devices are used in rocklobster fisheries to prevent sea lions entering and becoming stuck in traps. They typically consist of a steel bolt in the middle of the neck (opening) of the trap, which blocks access by sea lions but does not inhibit lobsters entering the pot.
A rocklobster pot with sea lion excluder device installed
Escape gaps are installed in traps and pots used in Southern Rocklobster and Giant Crab fisheries to release bycatch during hauling.
Square mesh panels consist of a panel of square mesh within the trawl net that provides a passage for non-target or smaller fish to escape before they are caught in the codend. Often the whole codend is constructed from square mesh netting, hung to maintain open meshes when the codend fills with catch. The construction of the ‘square mesh’ means that the meshes do not close up under pressure, as observed in traditional net constructions.
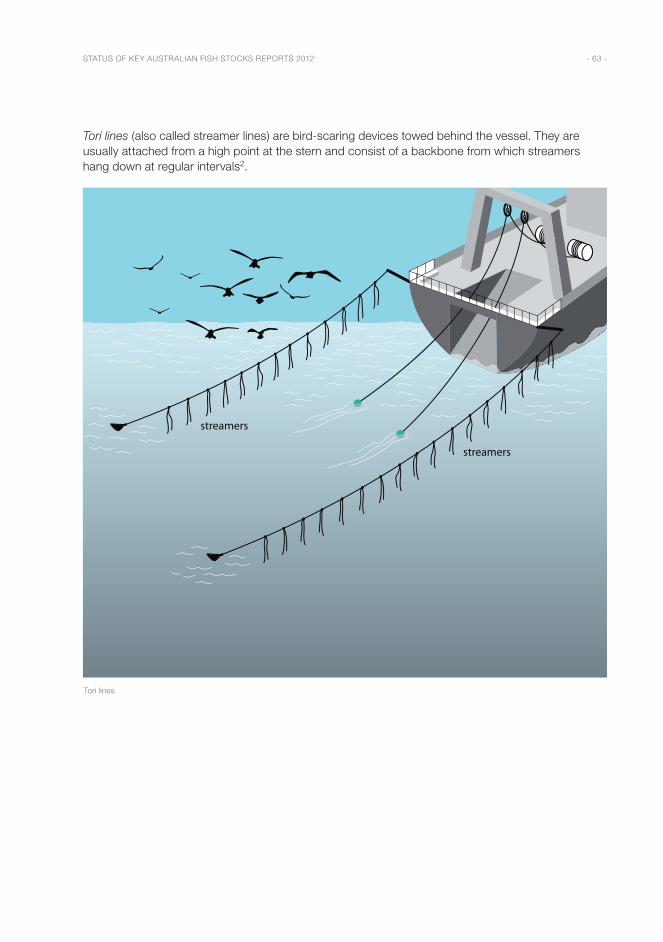
STATUS OF KEY AUSTRALIAN FISH STOCKS REPORTS 2012 - 63 -
Tori lines (also called streamer lines) are bird-scaring devices towed behind the vessel. They are usually attached from a high point at the stern and consist of a backbone from which streamers hang down at regular intervals2.
Tori lines
STATUS OF KEY AUSTRALIAN FISH STOCKS REPORTS 2012 - 64 -
Underwater setting chutes allow hooks to be deployed below the sea surface and therefore out of the reach and sight of foraging seabirds. This has traditionally been achieved by setting through a chute attached to the stern of a vessel that opens 1–2 metres below the surface.
Line weighting is used in demersal longline fisheries to deliver hooks to the target fishing depth as efficiently as possible, minimising the time that the hooks are within sight of seabirds.
Electronic monitoring systems are a form of fisheries surveillance, in which equipment that is installed on fishing vessels provides information about the vessels’ position and activity. More recent technology uses global positioning system (GPS), sensors and cameras to record and store video data of fishing activity. In Australia, video data are being used to observe interactions with threatened, endangered and protected species such as seals, sea lions and dolphins. Observations made from the data have seen management changes introduced into a number of fisheries which offer further protection for these species.
References 1. Kailola, P, Williams, MJ, Stewart, PC, Reichlet, RE, McNee, A & Grieve, C 1993, Australian fisheries resources,
Bureau of Resource Sciences & Fisheries Research and Development Corporation, Canberra.
2. Keith, C 1999, Tori line design for New Zealand domestic pelagic longlines, Conservation Advisory Science Notes No. 248, Department of Conservation, Wellington.
Image sourcesButcher, PA, Leland, JC, Broadhurst, MK, Paterson, BD & Mayer, DG 2012, Giant mud crab (Scylla serrata): relative efficiencies of common traps and impacts to discards, ICES Journal of Marine Science, 69: 1511 –1522.
Fisheries Research and Development Corporation.
Leland, JC, Butcher, PA, Broadhurst, MK, Paterson, BD & Mayer, DG 2012, Damage and physiological stress to juvenile eastern rock lobster (Sagmariasus verreauxi) discarded after trapping and hand collection, Fisheries Research, 137: 63–70.
Line drawing: Alison Mortlock, AngelInk 2012.

STATUS OF KEY AUSTRALIAN FISH STOCKS REPORTS 2012 - 65 -

Molluscs
M O L L U S C S A R E V E R Y D I V E R S E I N A P P E A R A N C E A N D H A B I T A N D
I N C L U D E S P E C I E S S U C H A S A B A L O N E , S C A L L O P S A N D S Q U I D .

A B A L O N E S A R E A F A M I LY O F R E E F - D W E L L I N G M A R I N E S N A I L S W I D E LY D I S T R I B U T E D A C R O S S T R O P I C A L A N D T E M P E R AT E C O A S TA L A R E A S .
Molluscs : AbalonesBlacklip Abalone / Greenlip Abalone
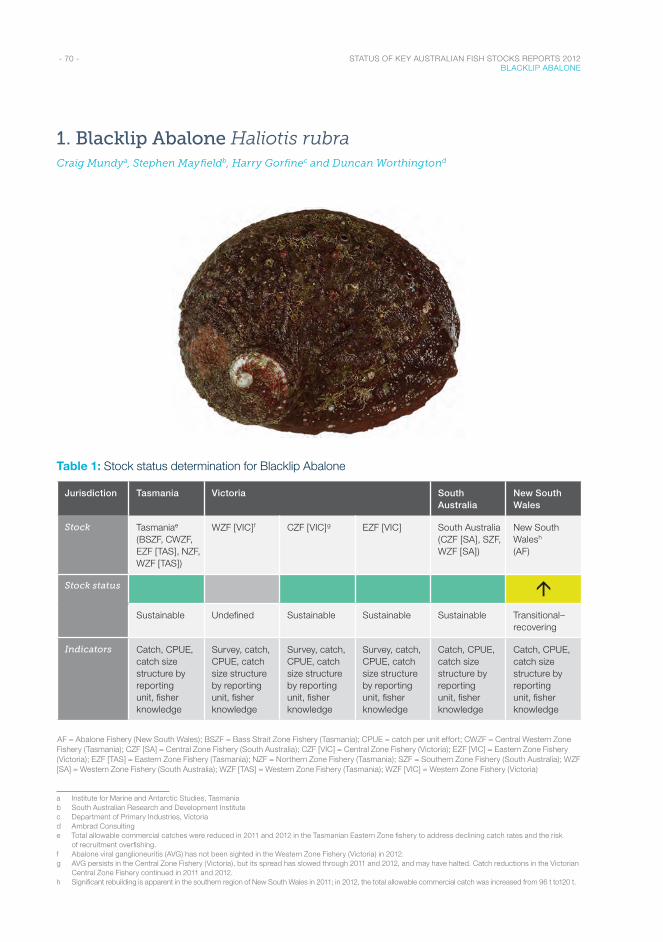
- 70 - STATUS OF KEY AUSTRALIAN FISH STOCKS REPORTS 2012 BLACKLIP ABALONE
1. Blacklip Abalone Haliotis rubraCraig Mundya, Stephen Mayfieldb, Harry Gorfinec and Duncan Worthingtond
Table 1: Stock status determination for Blacklip Abalone e f g h
Jurisdiction Tasmania Victoria South Australia
New South Wales
Stock Tasmaniae (BSZF, CWZF, EZF [TAS], NZF, WZF [TAS])
WZF [VIC]f CZF [VIC]g EZF [VIC] South Australia (CZF [SA], SZF, WZF [SA])
New South Walesh (AF)
Stock status áSustainable Undefined Sustainable Sustainable Sustainable Transitional–
recovering
Indicators Catch, CPUE, catch size structure by reporting unit, fisher knowledge
Survey, catch, CPUE, catch size structure by reporting unit, fisher knowledge
Survey, catch, CPUE, catch size structure by reporting unit, fisher knowledge
Survey, catch, CPUE, catch size structure by reporting unit, fisher knowledge
Catch, CPUE, catch size structure by reporting unit, fisher knowledge
Catch, CPUE, catch size structure by reporting unit, fisher knowledge
AF = Abalone Fishery (New South Wales); BSZF = Bass Strait Zone Fishery (Tasmania); CPUE = catch per unit effort; CWZF = Central Western Zone Fishery (Tasmania); CZF [SA] = Central Zone Fishery (South Australia); CZF [VIC] = Central Zone Fishery (Victoria); EZF [VIC] = Eastern Zone Fishery (Victoria); EZF [TAS] = Eastern Zone Fishery (Tasmania); NZF = Northern Zone Fishery (Tasmania); SZF = Southern Zone Fishery (South Australia); WZF [SA] = Western Zone Fishery (South Australia); WZF [TAS] = Western Zone Fishery (Tasmania); WZF [VIC] = Western Zone Fishery (Victoria)
a Institute for Marine and Antarctic Studies, Tasmaniab South Australian Research and Development Institutec Department of Primary Industries, Victoriad Ambrad Consultinge Total allowable commercial catches were reduced in 2011 and 2012 in the Tasmanian Eastern Zone fishery to address declining catch rates and the risk
of recruitment overfishing.f Abalone viral ganglioneuritis (AVG) has not been sighted in the Western Zone Fishery (Victoria) in 2012.g AVG persists in the Central Zone Fishery (Victoria), but its spread has slowed through 2011 and 2012, and may have halted. Catch reductions in the Victorian
Central Zone Fishery continued in 2011 and 2012.h Significant rebuilding is apparent in the southern region of New South Wales in 2011; in 2012, the total allowable commercial catch was increased from 96 t to120 t.
- 71 - STATUS OF KEY AUSTRALIAN FISH STOCKS REPORTS 2012 BLACKLIP ABALONE
Stock structure
Empirical field studies1 and molecular techniques2–3 both strongly suggest that Blacklip Abalone (Haliotis rubra) fisheries comprise a large number of small, independent populations. Each biological stock may extend over only a few hundred metres, and each Blacklip Abalone fishery is likely to consist of an indeterminate number of these small biological stocks. The number of biological stocks (hundreds or many thousands) may vary among fishing zones. Given the large number of biological stocks, it is not practical to assess each biological stock separately. Where all management units within a jurisdiction have the same status, a single classification is given for the jurisdiction. Where the separate management units within a jurisdiction are assessed as having a different status, the classification for each management unit is reported separately.
Stock status
All states rely on empirical performance measures—specifically, catch, catch per unit effort (CPUE) (as kilograms of abalone harvested per hour) and commercial catch size structure. The annual catch in Blacklip Abalone fisheries is generally equivalent to the total allowable commercial catch (TACC), with negligible overcatch or undercatch of the TACC.
Tasmania
Status and TACCs are determined by annual fishery assessments and a process involving multiple workshops (four each year). Annual assessments of the Tasmanian fishery zones rely heavily on fishery-dependent data4. There are no direct or derived estimates of biomass or fishing mortality. Mean CPUE and CPUE frequency distribution are key performance measures. Catch, catch rates, commercial catch size structure and diver observations are reviewed, leading to an expert opinion that is based on the weight of evidence. Each TACC is set at a level considered sustainable and to minimise the potential for biological stocks becoming recruitment overfished.
In the Eastern Zone Fishery (Tasmania) management unit, a legal minimum length of 13.8 cm provides two years of spawning before Blacklip Abalone are recruited to the fishery. Relative stock biomass in this fishery (estimated using CPUE as a proxy) has varied substantially since 1995, with evidence of an approximate eight-year cycle. Based on declining CPUE between 2000 and 2003, the TACC was reduced from 1190 tonnes (t) to 857 t in 2002, and to 770 t in 2004. Based on recent increasing CPUE and increasing median length of the commercial catch, the TACC was increased by 5 per cent in 2008, 2009 and 2010, resulting in a TACC of 896 t by 2010. Geometric mean catch rate (CPUE) across the zone was lowest in 2002 at 46 kg/hour, and highest in 2009 at 83 kg/hour, but declined to 63 kg/hour in 2010.
This evidence indicates that biological stocks in the Eastern Zone Fishery management unit are unlikely to be recruitment overfished, and that the current level of fishing mortality is unlikely to cause these biological stocks to become recruitment overfished.
The Western Zone Fishery (Tasmania) management unit has a legal minimum length of 14 cm in the south and south-west, and 13.6 cm in the north-west, to provide two years of spawning before Blacklip Abalone are recruited to the fishery. The Western Zone Fishery was split into two zones—western and central western—in 2007; the two zones are considered here as a single zone for continuity during the period 2000–10. The TACC in this management unit was reduced in 2008 from 1400 t to 1228 t, in association with a zonal restructure and a downturn in CPUE. The TACC reduction reflects a management action to redistribute effort from the south of the western zone to the under-utilised north. The CPUE has declined gradually from 138 kg/hour in 2000 to 106 kg/hour
- 72 - STATUS OF KEY AUSTRALIAN FISH STOCKS REPORTS 2012 BLACKLIP ABALONE
in 2010. However, the 2010 CPUE is high relative to other regions and also to the CPUE observed in this zone over the previous two decades.
This evidence indicates that the biological stocks in the Western Zone Fishery management unit are unlikely to be recruitment overfished, and that the current level of fishing mortality is unlikely to cause the biological stocks to become recruitment overfished.
The Northern Zone Fishery (Tasmania) and the Bass Strait Zone Fishery (Tasmania) were separated in 2003 but are discussed together here to provide continuity in the stock data. The legal minimum length varies between fishing blocks across this region between 11 cm, 12.7 cm and 13.2 cm, to provide two years of spawning before Blacklip Abalone are recruited to the fishery. Catch and catch rates have varied between 2000 and 2010 as a function of changing market preference and adaptive management (effort redistribution and change in legal minimum length). The combined TACC for the Northern Zone Fishery and the Bass Strait Zone Fishery reached a high of 402.5 t in 2008. Geometric mean CPUE peaked at 81 kg/hour in 2008, and peaked again in 2010 at a comparatively high TACC of 332.5 t4, suggesting that catch levels are sustainable.
This evidence indicates that the biological stocks in the Northern Zone Fishery management unit are unlikely to be recruitment overfished, and that the current level of fishing mortality is unlikely to cause the biological stocks to become recruitment overfished.
On the basis of the evidence provided above, Blacklip Abalone in Tasmania is classified as a sustainable stock.
Western Zone Fishery (Victoria) management unit
The Victorian fisheries for Blacklip Abalone are managed as three different management units: western zone, central zone and eastern zone, each with independent TACCs and annual fishery assessments. Legal minimum length is set independently of the fishing zones, along gradients in biological growth rates. Industry has requested progressive increases in legal minimum lengths at localised scales, based on size-at-maturity and growth data, where available. In the western zone, higher legal minimum lengths were adopted to mitigate potentially adverse impacts from the resumption of harvesting in areas that were previously affected by the abalone viral ganglioneuritis (AVG) disease.
Annual assessments of the Western Zone Fishery (Victoria) management unit rely heavily on fishery-dependent data. There are no direct or derived estimates of biomass or fishing mortality. Mean CPUE is a key performance measure. Catch and CPUE in this management unit were stable between 2000 and 20055, until the appearance of AVG in the wild abalone fishery. The effect of AVG on western zone biological stocks was significant6, resulting in managed catch reductions from around 280 t in 2000 to around 50 t by 2010. Normal fishing has not resumed in this management unit. A structured fishing program commenced in 2009, allowing limited catch (200 kg) to be taken at strategic locations.
Insufficient information is available to confidently classify the status of this management unit. Because of the lack of evidence, the Western Zone Fishery management unit is classified as an undefined stock.
Central Zone Fishery (Victoria) management unit
Annual assessments of this management unit rely heavily on fishery-dependent data. There are no direct or derived estimates of biomass or fishing mortality. Mean CPUE is a key performance measure. Catch and CPUE in this management unit were stable between 2000 and 20055. The spread of AVG into the western end of the Central Zone Fishery affected production from
- 73 - STATUS OF KEY AUSTRALIAN FISH STOCKS REPORTS 2012 BLACKLIP ABALONE
approximately 8.5 per cent of fishing area from 2008. Managed catch reductions were implemented, reducing the TACC from around 620 t in 2007 to 429 t in 2010. CPUE declined to a 10-year low of 74 kg/hour in 2010. However, CPUE in this management unit in 2010 remains high relative to 1980–95, when CPUE averaged 64 kg/hour.
Using CPUE as a proxy for stock biomass, this evidence indicates that biological stocks in the Central Zone Fishery management unit are unlikely to be recruitment overfished, and that the current level of fishing mortality is unlikely to cause these biological stocks to become recruitment overfished.
On the basis of the evidence provided above, the Central Zone Fishery management unit is classified as a sustainable stock.
Eastern Zone Fishery (Victoria) management unit
Annual assessments of this management unit rely heavily on fishery-dependent data. There are no direct or derived estimates of biomass or fishing mortality. Mean CPUE is a key performance measure. Catch in the eastern zone has been relatively stable between 2000 and 2010; it was 460 t in 2000, 490 t in 2008 and 460 t in 2010. CPUE has been stable at a 20-year historical high between 2004 and 20105, with an average CPUE in 2010 of 112 kg/hour5.
This evidence indicates that the biological stocks in the Eastern Zone Fishery management unit are unlikely to be recruitment overfished, and that the current level of fishing mortality is unlikely to cause these biological stocks to become recruitment overfished.
On the basis of the evidence provided above, the Eastern Zone Fishery (Victoria) management unit is classified as a sustainable stock.
South Australia
In the South Australian fisheries, assessments of Blacklip Abalone rely heavily on fishery-dependent data. There are no direct or derived estimates of biomass or fishing mortality. CPUE is a key performance indicator.
In the Western Zone Fishery (South Australia) management unit, a minimum legal length of 13 cm is in place for Blacklip Abalone, which allows spawning to occur before Blacklip Abalone are recruited to the fishery. Total catch was stable between 2000 and 2009, declining by 6 per cent in 20107. The CPUE for Blacklip Abalone in the western zone was high between 2001 and 2008 (mean of 75 kg/hour), most likely due to increased recruitment in the late 1990s7. CPUE has since declined and, in 2010, was 68 kg/hour, which is similar to the long-term mean between 1980 and 2010 (65 kg/hour). This evidence indicates that biological stocks in the Western Zone Fishery management unit are unlikely to be recruitment overfished, and that the current level of fishing mortality is unlikely to cause these biological stocks to become recruitment overfished.
In the Central Zone Fishery (South Australia) management unit, a minimum legal length of 13 cm is in place to allow spawning to occur before Blacklip Abalone are recruited to the fishery. Total catches between 2006 and 2010 (24 t/year) were substantially lower than those from 2000 to 2005 (mean of 37 t/year), as a result of TACC reductions. CPUE was stable between 2000 and 2010 (range: 61–75 kg/hour; mean: 68 kg/hour). This evidence indicates that biological stocks in the Central Zone Fishery management unit are unlikely to be recruitment overfished, and that the current level of fishing mortality is unlikely to cause these biological stocks to become recruitment overfished.
In the Southern Zone Fishery (South Australia) management unit, a minimum legal length of 12.5 cm applies across most of the fishery, which allows spawning to occur before Blacklip Abalone are recruited to the fishery. About 30 per cent of the catch has been harvested from so-called
- 74 - STATUS OF KEY AUSTRALIAN FISH STOCKS REPORTS 2012 BLACKLIP ABALONE
‘fish-down’ areas, where the minimum legal length is 11 cm; Blacklip Abalone in these areas reach sexual maturity at a smaller shell length than those elsewhere in the fishery8. Total catch has been stable between 2000 and 2010, with CPUE in both non-fish-down and fish-down areas at near record high levels9. This evidence indicates that the biological stocks in the Southern Zone Fishery management unit are unlikely to be recruitment overfished, and that the current level of fishing mortality is unlikely to cause the biological stocks to become recruitment overfished. Fine-scale spatial assessment and management are currently being implemented in this fishery.
On the basis of the evidence provided above, Blacklip Abalone in South Australia is classified as a sustainable stock.
New South Wales
The Abalone Fishery (New South Wales) is managed as a single management unit with a single TACC. Annual assessments of this management unit rely heavily on fishery-dependent data. The fishery is reviewed by an independent total allowable catch committee, which also determines the annual TACC. There are no direct or derived estimates of biomass or fishing mortality. Mean CPUE and catch are key performance measures. A legal minimum length of 11.7 cm allows spawning to occur before Blacklip Abalone are recruited to the fishery.
This management unit was stable at a TACC of 333 t through the late 1980s and 1990s. Following mortality of abalone associated with infection with Perkinsus (a disease that affects shellfish10), biological stocks declined sharply in the south between 2002 and 2005. Large reductions in TACC were made, from 333 t in 1999 to 75 t in 2008. The TACC was held at 75 t in 2009 and 2010.
After the significant reductions in TACC which occurred during the early 2000s, there has been a strong recovery in CPUE since 2005, particularly in the southern areas that support the majority of the current catch. Northern areas of the state remain impacted by mortality of abalone associated with Perkinsus. Although CPUE is increasing in a similar fashion to the more productive southern New South Wales regions, catch remains very low11. For the period 2005–10, a number of regions have supported the majority (~90 per cent) of the New South Wales TACC. CPUE in these regions has increased from 10–15 kg/hour in 2005 to 30–40 kg/hour in 201011. Doubling of CPUE in these regions, associated with reductions in TACC, suggests that current fishery management will facilitate biological stock recovery. This evidence indicates that the current level of fishing mortality should allow these biological stocks to recover from their recruitment overfished state.
On the basis of the evidence provided above, Blacklip Abalone in New South Wales is classified as a transitional–recovering stock.
Table 2: Blacklip Abalone biology2,12
Longevity and maximum size 25 years; 20 cm shell length
Maturity (50%) 5 years; 7.5–14 cm shell length
Additional source: Institute for Marine and Antarctic Studies, unpublished length-frequency data
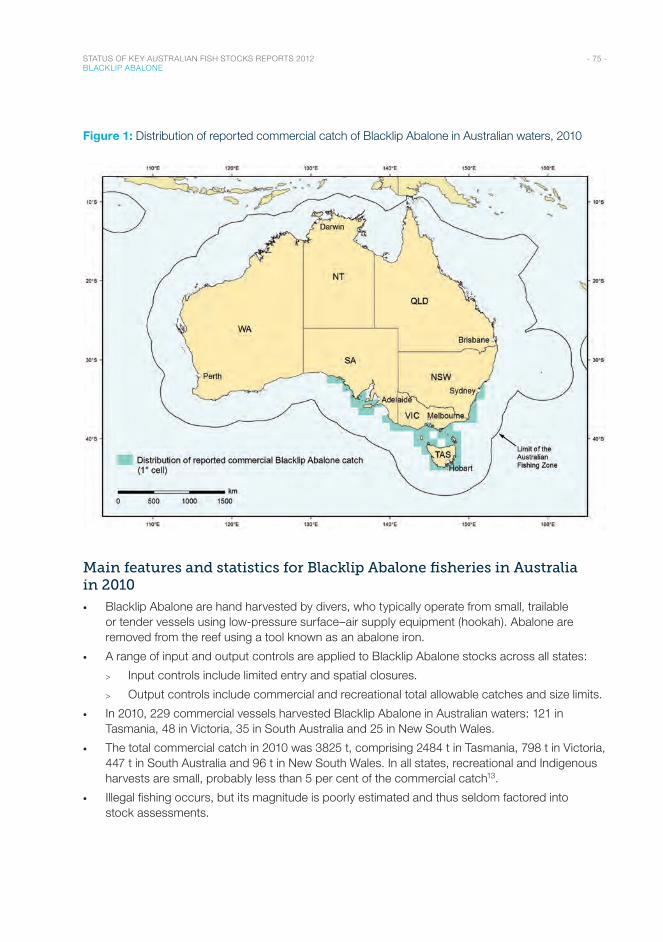
- 75 - STATUS OF KEY AUSTRALIAN FISH STOCKS REPORTS 2012 BLACKLIP ABALONE
Figure 1: Distribution of reported commercial catch of Blacklip Abalone in Australian waters, 2010
Main features and statistics for Blacklip Abalone fisheries in Australia in 2010
• Blacklip Abalone are hand harvested by divers, who typically operate from small, trailable or tender vessels using low-pressure surface–air supply equipment (hookah). Abalone are removed from the reef using a tool known as an abalone iron.
• A range of input and output controls are applied to Blacklip Abalone stocks across all states:
> Input controls include limited entry and spatial closures.
> Output controls include commercial and recreational total allowable catches and size limits.
• In 2010, 229 commercial vessels harvested Blacklip Abalone in Australian waters: 121 in Tasmania, 48 in Victoria, 35 in South Australia and 25 in New South Wales.
• The total commercial catch in 2010 was 3825 t, comprising 2484 t in Tasmania, 798 t in Victoria, 447 t in South Australia and 96 t in New South Wales. In all states, recreational and Indigenous harvests are small, probably less than 5 per cent of the commercial catch13.
• Illegal fishing occurs, but its magnitude is poorly estimated and thus seldom factored into stock assessments.
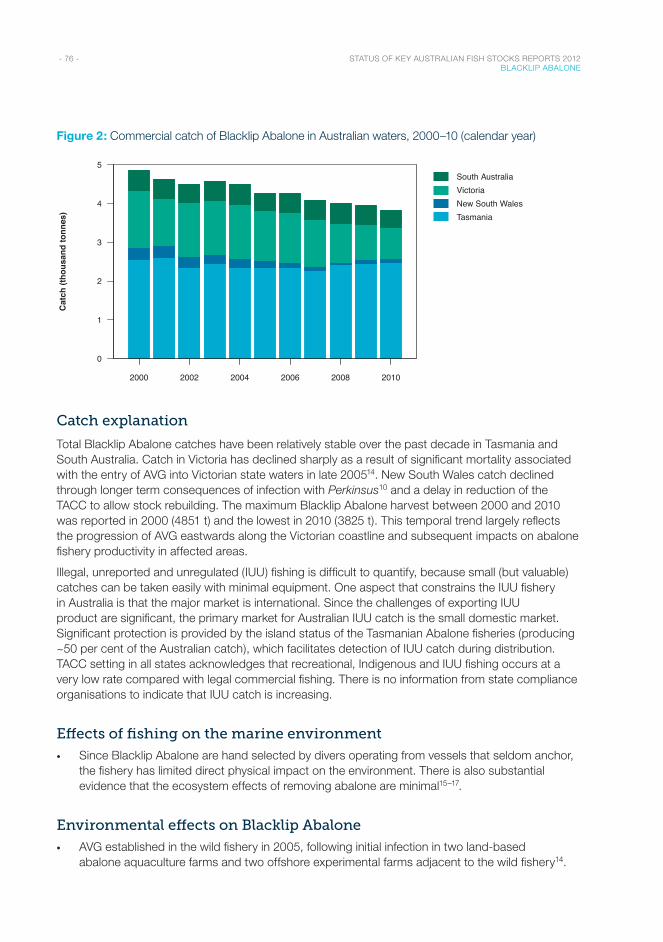
- 76 - STATUS OF KEY AUSTRALIAN FISH STOCKS REPORTS 2012 BLACKLIP ABALONE
Figure 2: Commercial catch of Blacklip Abalone in Australian waters, 2000–10 (calendar year)
Year
2000 2002 2004 2006 2008 2010
0
1
2
3
4
5South AustraliaVictoriaNew South WalesTasmania
Cat
ch (t
hous
and
tonn
es)
Catch explanation
Total Blacklip Abalone catches have been relatively stable over the past decade in Tasmania and South Australia. Catch in Victoria has declined sharply as a result of significant mortality associated with the entry of AVG into Victorian state waters in late 200514. New South Wales catch declined through longer term consequences of infection with Perkinsus10 and a delay in reduction of the TACC to allow stock rebuilding. The maximum Blacklip Abalone harvest between 2000 and 2010 was reported in 2000 (4851 t) and the lowest in 2010 (3825 t). This temporal trend largely reflects the progression of AVG eastwards along the Victorian coastline and subsequent impacts on abalone fishery productivity in affected areas.
Illegal, unreported and unregulated (IUU) fishing is difficult to quantify, because small (but valuable) catches can be taken easily with minimal equipment. One aspect that constrains the IUU fishery in Australia is that the major market is international. Since the challenges of exporting IUU product are significant, the primary market for Australian IUU catch is the small domestic market. Significant protection is provided by the island status of the Tasmanian Abalone fisheries (producing ~50 per cent of the Australian catch), which facilitates detection of IUU catch during distribution. TACC setting in all states acknowledges that recreational, Indigenous and IUU fishing occurs at a very low rate compared with legal commercial fishing. There is no information from state compliance organisations to indicate that IUU catch is increasing.
Effects of fishing on the marine environment
• Since Blacklip Abalone are hand selected by divers operating from vessels that seldom anchor, the fishery has limited direct physical impact on the environment. There is also substantial evidence that the ecosystem effects of removing abalone are minimal15–17.
Environmental effects on Blacklip Abalone
• AVG established in the wild fishery in 2005, following initial infection in two land-based abalone aquaculture farms and two offshore experimental farms adjacent to the wild fishery14.
- 77 - STATUS OF KEY AUSTRALIAN FISH STOCKS REPORTS 2012 BLACKLIP ABALONE
AVG is highly pathogenic, resulting in estimated mortalities of 60–95 per cent in infected wild populations.
• Southward and westward strengthening of the relatively oligotrophic East Australian Current into the inshore waters of eastern Victoria and Tasmania is thought to have triggered changes in near-shore community structure over the past two decades, primarily through range expansion of species such as the Hollow-spined Sea Urchin (Centrostephanus rodgersii) from New South Wales to Tasmania and Victoria, and significant reduction in the biomass of Giant Kelp (Macrocystis porifera)18–20. This has resulted in localised depletions of abalone populations and a reduction in the habitat available for abalone21–22.
• Above-average warm-water events were assumed to have resulted in minor mortalities of abalone in Tasmania in February 2010 (Tasmanian Abalone Divers, pers. comm.), although the spatial extent and magnitude of the mortalities were not quantified. These events are expected to increase under most climate change scenarios.
References1. Prince, JD, Sellers, TL, Ford, WB & Talbot, SR 1987, Experimental evidence for limited dispersal of haliotid larvae
(genus Haliotis, Mollusca, Gastropoda), Journal of Experimental Marine Biology and Ecology, 106: 243–263.
2. Miller, KJ, Maynard, BT & Mundy, CN 2009, Genetic diversity and gene flow in collapsed and healthy abalone fisheries, Molecular Ecology, 18: 200–211.
3. Temby, N, Miller, KJ & Mundy, CN 2007, Evidence of genetic subdivision among populations of blacklip abalone (Haliotis rubra Leach) in Tasmania, Marine and Freshwater Research, 58(8): 733–742.
4. Tarbath, D & Gardner, C 2011, Tasmanian abalone fishery—2010, Abalone fishery assessment, Hobart, Tasmania, Institute for Marine and Antarctic Sciences, University of Tasmania, Hobart.
5. Victorian Department of Primary Industries 2012, Abalone catch and effort: catch and effort by quota year (April–March) and zone during 1980/81–2010/11, www.dpi.vic.gov.au/fisheries/commercial-fishing/commercial-fish-production-2011/abalones-catch-effort.
6. Mayfield, S, McGarvey, R, Gorfine, HK, Peeters, H, Burch, P & Sharma, S 2011, Survey estimates of fishable biomass following a mass mortality in an Australian molluscan fishery, Journal of Fish Diseases, 34: 287–302.
7. Stobart, B, Dent, JJ, Matthews, D, Chick, RC & Mayfield, S 2011, Western Zone Abalone (Haliotis laevigata & H. rubra) Fishery (Region A), fishery status report for PIRSA Fisheries and Aquaculture, SARDI Aquatic Sciences Publication F2011/000290-1, SARDI Research Report Series 565, South Australian Research and Development Institute, Adelaide.
8. Mayfield, S & Saunders, TM (eds) 2008, Towards optimising the spatial scale of abalone fishery management, final report to the Fisheries Research and Development Corporation, project 2004/019, SARDI Aquatic Sciences publication F2008/000082-1, SARDI Research Report Series 273, South Australian Research and Development Institute, Adelaide.
9. Mayfield, S & Hogg, A 2011, Southern Zone Abalone Fishery (Haliotis rubra and H. laevigata), fishery assessment report for PIRSA Fisheries and Aquaculture, SARDI Aquatic Sciences publication F2007/000552-3, SARDI Research Report Series 535, South Australian Research and Development Institute, Adelaide.
10. Liggins, GW & Upston, J 2010, Investigating and managing the Perkinsus-related mortality of blacklip abalone in NSW, final report to the Fisheries Research and Development Corporation, project 2004/084, Industry & Investment, Fisheries Final Report Series 120, Cronulla.
11. New South Wales Total Allowable Catch Committee 2012, Total Allowable Catch Committee report and determination for 2012/2013—Abalone Fishery, New South Wales Government, www.dpi.nsw.gov.au/__data/assets/pdf_file/0005/436280/Abalone-Report-and-Determination-2012-13.pdf.
12. Tarbath, DB & Officer, RA 2003, Size-limits and yield for blacklip abalone in northern Tasmania, technical report 17, Tasmanian Aquaculture and Fisheries Institute, Hobart.
13. Henry, GW & Lyle, JM 2003, The National Recreational and Indigenous Fishing Survey, final report to the Fisheries Research and Development Corporation, project 99/158.
14. Gorfine, H, Day, R, Bardos, D, Taylor, B, Prince, J, Sainsbury, K & Dichmont, C 2008, Rapid response to abalone virus depletion in western Victoria: information acquisition and reefcode assessment, final report to the Fisheries Research and Development Corporation, project 2007/066, University of Melbourne, Melbourne.
15. Hamer, P, Jenkins, G, Womersley, B & Mills, K 2010, Understanding the ecological role of abalone in the reef ecosystem of Victoria, Fisheries Research Report 2006/040, Marine and Freshwater Resources Institute, Queenscliff, Victoria.
16. Jenkins, GP 2004, The ecosystem effects of abalone fishing: a review, Marine and Freshwater Research, 55: 545–552.
- 78 - STATUS OF KEY AUSTRALIAN FISH STOCKS REPORTS 2012 BLACKLIP ABALONE
17. Valentine, JP, Tarbath, DB, Frusher, SD, Mundy, CN & Buxton, CD 2010, Limited evidence for ecosystem-level change on reefs exposed to Haliotis rubra (blacklip abalone) exploitation, Austral Ecology, 35: 806–817.
18. Ling, SD 2008, Range expansion of a habitat-modifying species leads to loss of taxonomic diversity: a new and impoverished reef state, Oecologia, 156: 883–894.
19. Ling, SD, Johnson, CR, Ridgway, K, Hobday, AJ & Haddon, M 2009, Climate driven range extension of a sea urchin: inferring future trends by analysis of recent population dynamics, Global Change Biology, 15(3): 719–731.
20. Ridgway, KR 2007, Long-term trend and decadal variability of the southward penetration of the East Australian Current, Geophysical Research Letters, 34 L13613.
21. Johnson, CR, Banks, SC, Barrett, NS, Cazassus, F, Dunstan, PK, Edgar, GJ, Frusher, SD, Gardner, C, Haddon, M, Helidoniotis, F, Hill, KL, Holbrook, NJ, Hosie, GW, Last, PR, Ling, SD, Melbourne, TJ, Miller, K, Pecl, GT, Richardson, AJ, Ridgway, KR, Rintoul, SR, Ritz, DA, Ross, DJ, Sanderson, JC, Shepherd, SA, Slotwinski, A, Swadling, KM & Taw, N 2011, Climate change cascades: shifts in oceanography, species’ ranges and subtidal marine community dynamics in eastern Tasmania, Journal of Experimental Marine Biology and Ecology, 400: 17–32.
22. Strain, EMA & Johnson, CR 2009, Competition between an invasive urchin and commercially fished abalone: effect on body condition, reproduction and survivorship, Marine Ecology Progress Series, 377: 169–182.
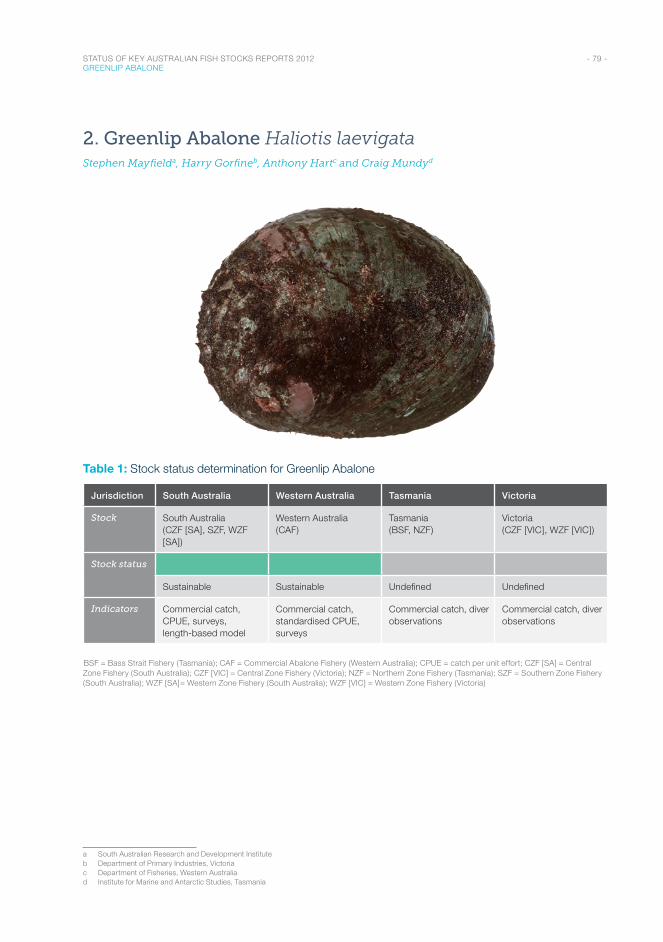
- 79 - STATUS OF KEY AUSTRALIAN FISH STOCKS REPORTS 2012 GREENLIP ABALONE
2. Greenlip Abalone Haliotis laevigataStephen Mayfielda, Harry Gorfineb, Anthony Hartc and Craig Mundyd
Table 1: Stock status determination for Greenlip Abalone
Jurisdiction South Australia Western Australia Tasmania Victoria
Stock South Australia (CZF [SA], SZF, WZF [SA])
Western Australia (CAF)
Tasmania (BSF, NZF)
Victoria (CZF [VIC], WZF [VIC])
Stock status
Sustainable Sustainable Undefined Undefined
Indicators Commercial catch, CPUE, surveys, length-based model
Commercial catch, standardised CPUE, surveys
Commercial catch, diver observations
Commercial catch, diver observations
BSF = Bass Strait Fishery (Tasmania); CAF = Commercial Abalone Fishery (Western Australia); CPUE = catch per unit effort; CZF [SA] = Central Zone Fishery (South Australia); CZF [VIC] = Central Zone Fishery (Victoria); NZF = Northern Zone Fishery (Tasmania); SZF = Southern Zone Fishery (South Australia); WZF [SA]= Western Zone Fishery (South Australia); WZF [VIC] = Western Zone Fishery (Victoria)
a South Australian Research and Development Instituteb Department of Primary Industries, Victoriac Department of Fisheries, Western Australiad Institute for Marine and Antarctic Studies, Tasmania
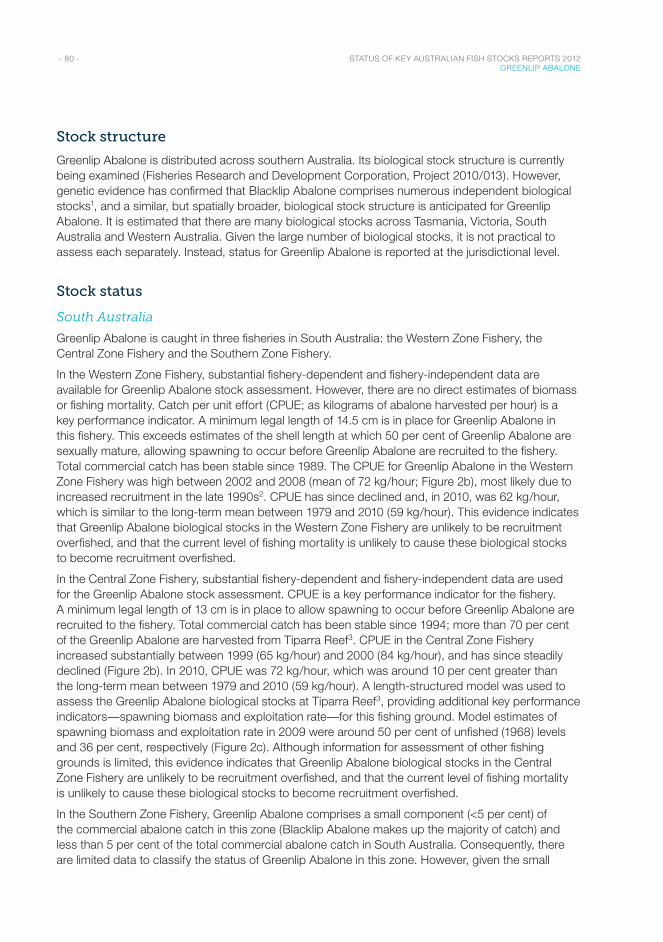
- 80 - STATUS OF KEY AUSTRALIAN FISH STOCKS REPORTS 2012 GREENLIP ABALONE
Stock structure
Greenlip Abalone is distributed across southern Australia. Its biological stock structure is currently being examined (Fisheries Research and Development Corporation, Project 2010/013). However, genetic evidence has confirmed that Blacklip Abalone comprises numerous independent biological stocks1, and a similar, but spatially broader, biological stock structure is anticipated for Greenlip Abalone. It is estimated that there are many biological stocks across Tasmania, Victoria, South Australia and Western Australia. Given the large number of biological stocks, it is not practical to assess each separately. Instead, status for Greenlip Abalone is reported at the jurisdictional level.
Stock status
South Australia
Greenlip Abalone is caught in three fisheries in South Australia: the Western Zone Fishery, the Central Zone Fishery and the Southern Zone Fishery.
In the Western Zone Fishery, substantial fishery-dependent and fishery-independent data are available for Greenlip Abalone stock assessment. However, there are no direct estimates of biomass or fishing mortality. Catch per unit effort (CPUE; as kilograms of abalone harvested per hour) is a key performance indicator. A minimum legal length of 14.5 cm is in place for Greenlip Abalone in this fishery. This exceeds estimates of the shell length at which 50 per cent of Greenlip Abalone are sexually mature, allowing spawning to occur before Greenlip Abalone are recruited to the fishery. Total commercial catch has been stable since 1989. The CPUE for Greenlip Abalone in the Western Zone Fishery was high between 2002 and 2008 (mean of 72 kg/hour; Figure 2b), most likely due to increased recruitment in the late 1990s2. CPUE has since declined and, in 2010, was 62 kg/hour, which is similar to the long-term mean between 1979 and 2010 (59 kg/hour). This evidence indicates that Greenlip Abalone biological stocks in the Western Zone Fishery are unlikely to be recruitment overfished, and that the current level of fishing mortality is unlikely to cause these biological stocks to become recruitment overfished.
In the Central Zone Fishery, substantial fishery-dependent and fishery-independent data are used for the Greenlip Abalone stock assessment. CPUE is a key performance indicator for the fishery. A minimum legal length of 13 cm is in place to allow spawning to occur before Greenlip Abalone are recruited to the fishery. Total commercial catch has been stable since 1994; more than 70 per cent of the Greenlip Abalone are harvested from Tiparra Reef3. CPUE in the Central Zone Fishery increased substantially between 1999 (65 kg/hour) and 2000 (84 kg/hour), and has since steadily declined (Figure 2b). In 2010, CPUE was 72 kg/hour, which was around 10 per cent greater than the long-term mean between 1979 and 2010 (59 kg/hour). A length-structured model was used to assess the Greenlip Abalone biological stocks at Tiparra Reef3, providing additional key performance indicators—spawning biomass and exploitation rate—for this fishing ground. Model estimates of spawning biomass and exploitation rate in 2009 were around 50 per cent of unfished (1968) levels and 36 per cent, respectively (Figure 2c). Although information for assessment of other fishing grounds is limited, this evidence indicates that Greenlip Abalone biological stocks in the Central Zone Fishery are unlikely to be recruitment overfished, and that the current level of fishing mortality is unlikely to cause these biological stocks to become recruitment overfished.
In the Southern Zone Fishery, Greenlip Abalone comprises a small component (<5 per cent) of the commercial abalone catch in this zone (Blacklip Abalone makes up the majority of catch) and less than 5 per cent of the total commercial abalone catch in South Australia. Consequently, there are limited data to classify the status of Greenlip Abalone in this zone. However, given the small
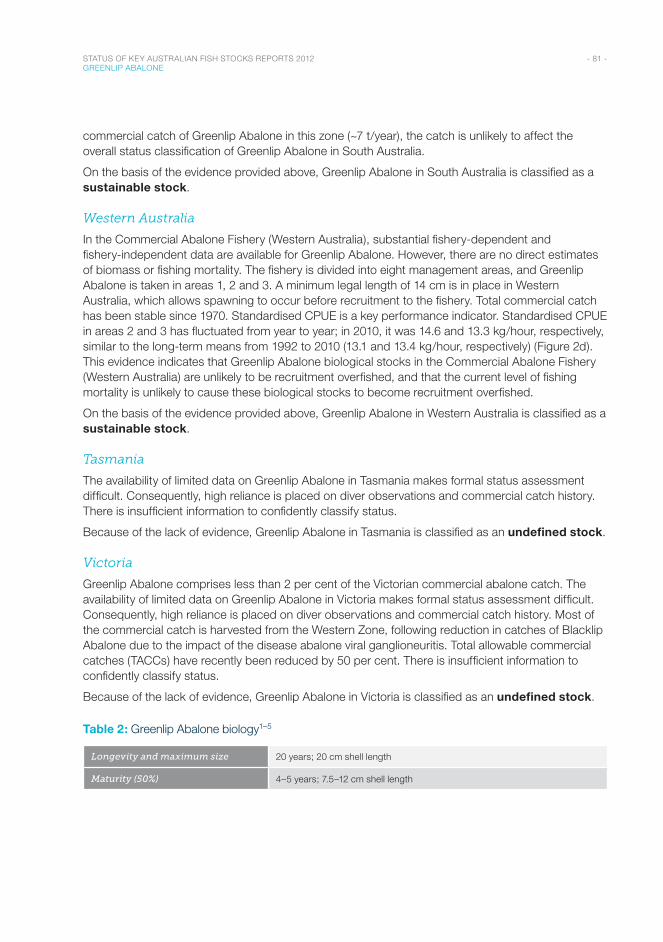
- 81 - STATUS OF KEY AUSTRALIAN FISH STOCKS REPORTS 2012 GREENLIP ABALONE
commercial catch of Greenlip Abalone in this zone (~7 t/year), the catch is unlikely to affect the overall status classification of Greenlip Abalone in South Australia.
On the basis of the evidence provided above, Greenlip Abalone in South Australia is classified as a sustainable stock.
Western Australia
In the Commercial Abalone Fishery (Western Australia), substantial fishery-dependent and fishery-independent data are available for Greenlip Abalone. However, there are no direct estimates of biomass or fishing mortality. The fishery is divided into eight management areas, and Greenlip Abalone is taken in areas 1, 2 and 3. A minimum legal length of 14 cm is in place in Western Australia, which allows spawning to occur before recruitment to the fishery. Total commercial catch has been stable since 1970. Standardised CPUE is a key performance indicator. Standardised CPUE in areas 2 and 3 has fluctuated from year to year; in 2010, it was 14.6 and 13.3 kg/hour, respectively, similar to the long-term means from 1992 to 2010 (13.1 and 13.4 kg/hour, respectively) (Figure 2d). This evidence indicates that Greenlip Abalone biological stocks in the Commercial Abalone Fishery (Western Australia) are unlikely to be recruitment overfished, and that the current level of fishing mortality is unlikely to cause these biological stocks to become recruitment overfished.
On the basis of the evidence provided above, Greenlip Abalone in Western Australia is classified as a sustainable stock.
Tasmania
The availability of limited data on Greenlip Abalone in Tasmania makes formal status assessment difficult. Consequently, high reliance is placed on diver observations and commercial catch history. There is insufficient information to confidently classify status.
Because of the lack of evidence, Greenlip Abalone in Tasmania is classified as an undefined stock.
Victoria
Greenlip Abalone comprises less than 2 per cent of the Victorian commercial abalone catch. The availability of limited data on Greenlip Abalone in Victoria makes formal status assessment difficult. Consequently, high reliance is placed on diver observations and commercial catch history. Most of the commercial catch is harvested from the Western Zone, following reduction in catches of Blacklip Abalone due to the impact of the disease abalone viral ganglioneuritis. Total allowable commercial catches (TACCs) have recently been reduced by 50 per cent. There is insufficient information to confidently classify status.
Because of the lack of evidence, Greenlip Abalone in Victoria is classified as an undefined stock.
Table 2: Greenlip Abalone biology1–5
Longevity and maximum size 20 years; 20 cm shell length
Maturity (50%) 4–5 years; 7.5–12 cm shell length
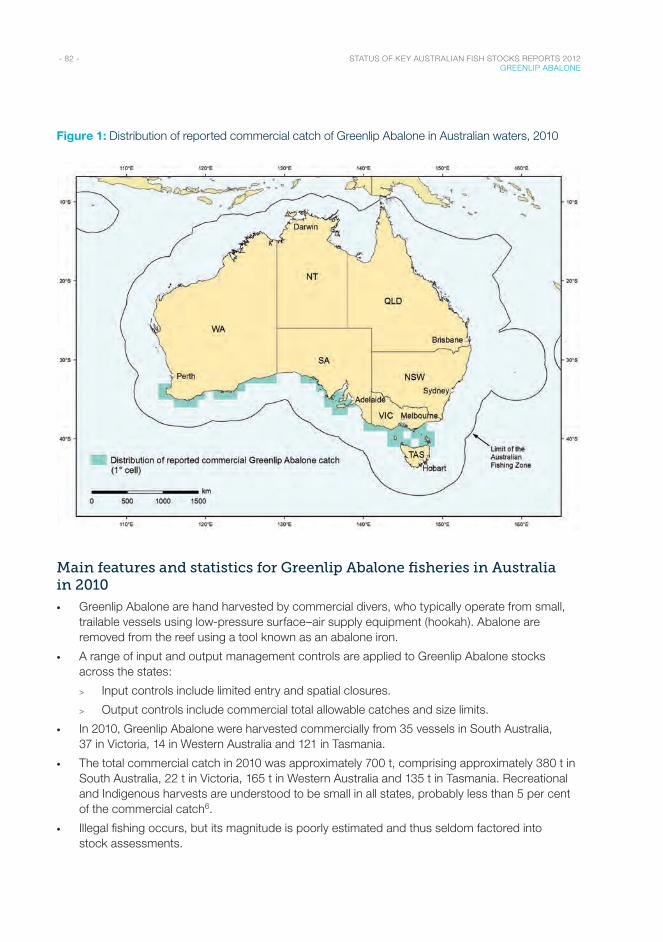
- 82 - STATUS OF KEY AUSTRALIAN FISH STOCKS REPORTS 2012 GREENLIP ABALONE
Figure 1: Distribution of reported commercial catch of Greenlip Abalone in Australian waters, 2010
Main features and statistics for Greenlip Abalone fisheries in Australia in 2010
• Greenlip Abalone are hand harvested by commercial divers, who typically operate from small, trailable vessels using low-pressure surface–air supply equipment (hookah). Abalone are removed from the reef using a tool known as an abalone iron.
• A range of input and output management controls are applied to Greenlip Abalone stocks across the states:
> Input controls include limited entry and spatial closures.
> Output controls include commercial total allowable catches and size limits.
• In 2010, Greenlip Abalone were harvested commercially from 35 vessels in South Australia, 37 in Victoria, 14 in Western Australia and 121 in Tasmania.
• The total commercial catch in 2010 was approximately 700 t, comprising approximately 380 t in South Australia, 22 t in Victoria, 165 t in Western Australia and 135 t in Tasmania. Recreational and Indigenous harvests are understood to be small in all states, probably less than 5 per cent of the commercial catch6.
• Illegal fishing occurs, but its magnitude is poorly estimated and thus seldom factored into stock assessments.
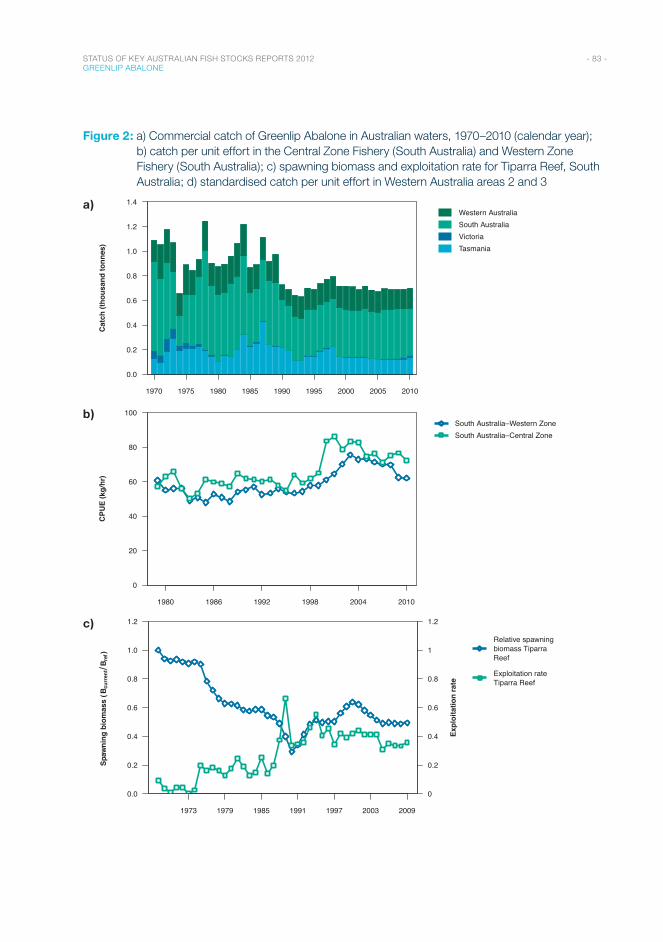
- 83 - STATUS OF KEY AUSTRALIAN FISH STOCKS REPORTS 2012 GREENLIP ABALONE
Figure 2: a) Commercial catch of Greenlip Abalone in Australian waters, 1970–2010 (calendar year); b) catch per unit effort in the Central Zone Fishery (South Australia) and Western Zone Fishery (South Australia); c) spawning biomass and exploitation rate for Tiparra Reef, South Australia; d) standardised catch per unit effort in Western Australia areas 2 and 3
a)
Year
1970 1975 1980 1985 1990 1995 2000 2005 2010
0.0
0.2
0.4
0.6
0.8
1.0
1.2
1.4Western AustraliaSouth AustraliaVictoriaTasmania
Cat
ch (t
hous
and
tonn
es)
b)
Year
1980 1986 1992 1998 2004 2010
0
20
40
60
80
100South Australia–Western ZoneSouth Australia–Central Zone
CPU
E (k
g/hr
)
c)
Year
1973 1979 1985 1991 1997 2003 2009
0.0
0.2
0.4
0.6
0.8
1.0
1.2
0
0.2
0.4
0.6
0.8
1
1.2
Relative spawningbiomass TiparraReef
Exploitation rateTiparra Reef
Spaw
ning
bio
mas
s (B
curr
ent
B ref
)
Expl
oita
tion
rate
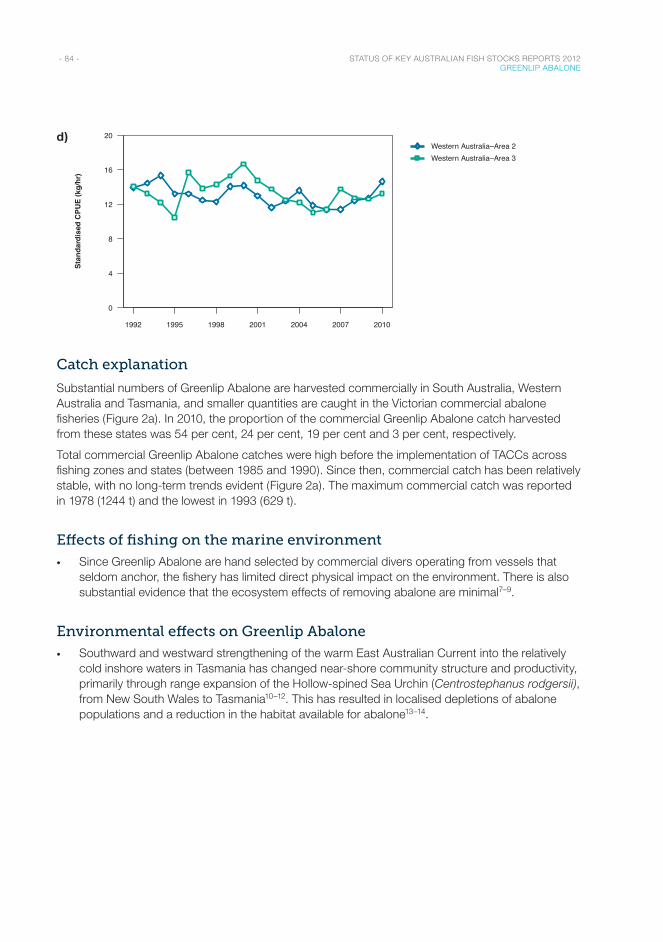
- 84 - STATUS OF KEY AUSTRALIAN FISH STOCKS REPORTS 2012 GREENLIP ABALONE
d)
Year
1992 1995 1998 2001 2004 2007 2010
0
4
8
12
16
20Western Australia–Area 2Western Australia–Area 3
Stan
dard
ised
CPU
E (k
g/hr
)
Catch explanation
Substantial numbers of Greenlip Abalone are harvested commercially in South Australia, Western Australia and Tasmania, and smaller quantities are caught in the Victorian commercial abalone fisheries (Figure 2a). In 2010, the proportion of the commercial Greenlip Abalone catch harvested from these states was 54 per cent, 24 per cent, 19 per cent and 3 per cent, respectively.
Total commercial Greenlip Abalone catches were high before the implementation of TACCs across fishing zones and states (between 1985 and 1990). Since then, commercial catch has been relatively stable, with no long-term trends evident (Figure 2a). The maximum commercial catch was reported in 1978 (1244 t) and the lowest in 1993 (629 t).
Effects of fishing on the marine environment
• Since Greenlip Abalone are hand selected by commercial divers operating from vessels that seldom anchor, the fishery has limited direct physical impact on the environment. There is also substantial evidence that the ecosystem effects of removing abalone are minimal7–9.
Environmental effects on Greenlip Abalone
• Southward and westward strengthening of the warm East Australian Current into the relatively cold inshore waters in Tasmania has changed near-shore community structure and productivity, primarily through range expansion of the Hollow-spined Sea Urchin (Centrostephanus rodgersii), from New South Wales to Tasmania10–12. This has resulted in localised depletions of abalone populations and a reduction in the habitat available for abalone13–14.
- 85 - STATUS OF KEY AUSTRALIAN FISH STOCKS REPORTS 2012 GREENLIP ABALONE
References1. Miller, KJ, Maynard, BT & Mundy, CN 2009, Genetic diversity and gene flow in collapsed and healthy abalone fisheries,
Molecular Ecology, 18: 200–211.
2. Stobart, B, Dent, JJ, Matthews, D, Chick, RC & Mayfield, S 2011, Western Zone Abalone (Haliotis laevigata and H. rubra) Fishery (Region A), fishery status report for PIRSA Fisheries and Aquaculture, SARDI publication F2011/000290-1, SARDI Research Report Series 565, South Australian Research and Development Institute, Adelaide.
3. Mayfield, S, Carlson, I & Chick, RC 2010, Central Zone Abalone (Haliotis laevigata and H. rubra) Fishery, confidential fishery assessment report for PIRSA, SARDI publication F2007/000611-3, SARDI Research Report Series 510, South Australian Research and Development Institute, Adelaide.
4. Mayfield, S & Hogg, A 2011, Southern Zone Abalone Fishery (Haliotis rubra and H. laevigata), fishery assessment report for PIRSA Fisheries and Aquaculture, SARDI publication F2007/000552-3, SARDI Research Report Series 535, South Australian Research and Development Institute, Adelaide.
5. Fletcher, WJ & Santoro, K (eds) 2011, State of the fisheries and aquatic resources report 2010/11, Western Australian Department of Fisheries, Perth.
6. Henry, GW & Lyle, JM 2003, The national recreational and Indigenous fishing survey, Fisheries Research and Development Corporation project 1999/158, Australian Government Department of Agriculture, Fisheries and Forestry, Canberra, http://eprints.utas.edu.au/2526/1/Henry_Lyle_Nationalsurvey.pdf.
7. Hamer, P, Jenkins, G, Womersley, B & Mills, K 2010, Understanding the ecological role of abalone in the reef ecosystem of Victoria, Fisheries Research Report 2006/040, Marine and Freshwater Resources Institute, Queenscliff, Victoria.
8. Jenkins, GP 2004, The ecosystem effects of abalone fishing: a review, Marine and Freshwater Research, 55: 545–552.
9. Valentine, JP, Tarbath, DB, Frusher, SD, Mundy, CN & Buxton, CD 2010, Limited evidence for ecosystem-level change on reefs exposed to Haliotis rubra (blacklip abalone) exploitation, Austral Ecology, 35: 806–817.
10. Ling, SD 2008, Range expansion of a habitat-modifying species leads to loss of taxonomic diversity: a new and impoverished reef state, Oecologia, 156: 883–894.
11. Ling, SD, Johnson, CR, Ridgway, K, Hobday, AJ & Haddon, M 2009, Climate driven range extension of a sea urchin: inferring future trends by analysis of recent population dynamics, Global Change Biology, 15(3): 719–731.
12. Ridgway, KR 2007, Long-term trend and decadal variability of the southward penetration of the East Australian Current, Geophysical Research Letters, 34: L13613.
13. Johnson, CR, Banks, SC, Barrett, NS, Cazassus, F, Dunstan, PK, Edgar, GJ, Frusher, SD, Gardner, C, Haddon, M, Helidoniotis, F, Hill, KL, Holbrook, NJ, Hosie, GW, Last, PR, Ling, SD, Melbourne, TJ, Miller, K, Pecl, GT, Richardson, AJ, Ridgway, KR, Rintoul, SR, Ritz, DA, Ross, DJ, Sanderson, JC, Shepherd, SA, Slotwinski, A, Swadling, KM & Taw, N 2011, Climate change cascades: shifts in oceanography, species’ ranges and subtidal marine community dynamics in eastern Tasmania, Journal of Experimental Marine Biology and Ecology, 400: 17–32.
14. Strain, EMA & Johnson, CR 2009, Competition between an invasive urchin and commercially fished abalone: effect on body condition, reproduction and survivorship, Marine Ecology Progress Series, 377: 169–182.

Molluscs : ScallopsCommercial Scallop / Saucer Scallop
S C A L L O P S C O M P R I S E A R O U N D 3 5 0 S P E C I E S W O R L D W I D E , B U T A U S T R A L I A
H A S O N LY T W O M A I N C O M M E R C I A L S P E C I E S , C O M M E R C I A L S C A L L O P S A N D S A U C E R S C A L L O P S .
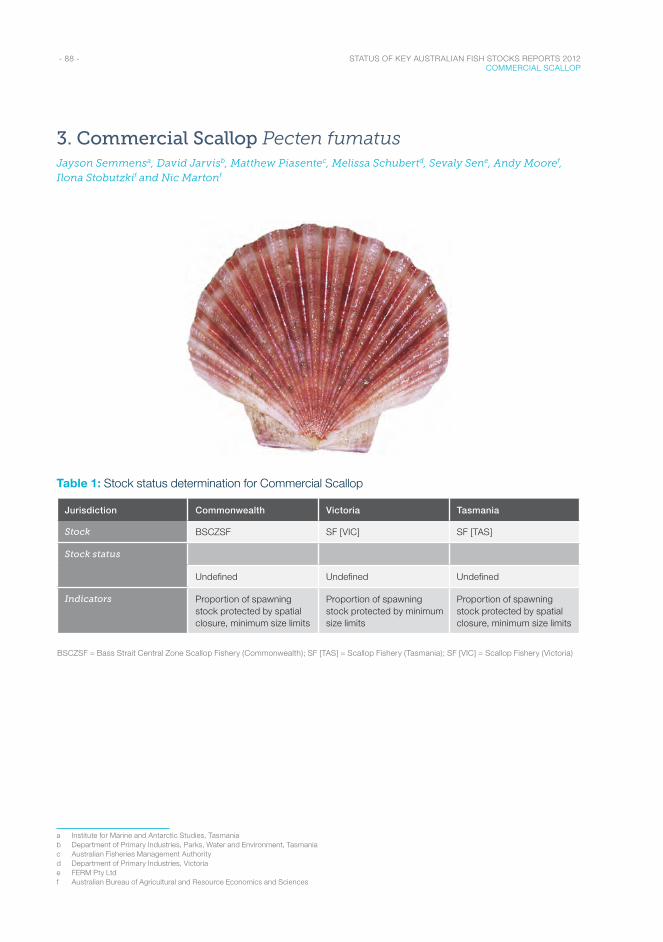
- 88 - STATUS OF KEY AUSTRALIAN FISH STOCKS REPORTS 2012 COMMERCIAL SCALLOP
3. Commercial Scallop Pecten fumatusJayson Semmensa, David Jarvisb, Matthew Piasentec, Melissa Schubertd, Sevaly Sene, Andy Mooref, Ilona Stobutzkif and Nic Martonf
Table 1: Stock status determination for Commercial Scallop
Jurisdiction Commonwealth Victoria Tasmania
Stock BSCZSF SF [VIC] SF [TAS]
Stock status
Undefined Undefined Undefined
Indicators Proportion of spawning stock protected by spatial closure, minimum size limits
Proportion of spawning stock protected by minimum size limits
Proportion of spawning stock protected by spatial closure, minimum size limits
BSCZSF = Bass Strait Central Zone Scallop Fishery (Commonwealth); SF [TAS] = Scallop Fishery (Tasmania); SF [VIC] = Scallop Fishery (Victoria)
a Institute for Marine and Antarctic Studies, Tasmaniab Department of Primary Industries, Parks, Water and Environment, Tasmaniac Australian Fisheries Management Authorityd Department of Primary Industries, Victoriae FERM Pty Ltdf Australian Bureau of Agricultural and Resource Economics and Sciences
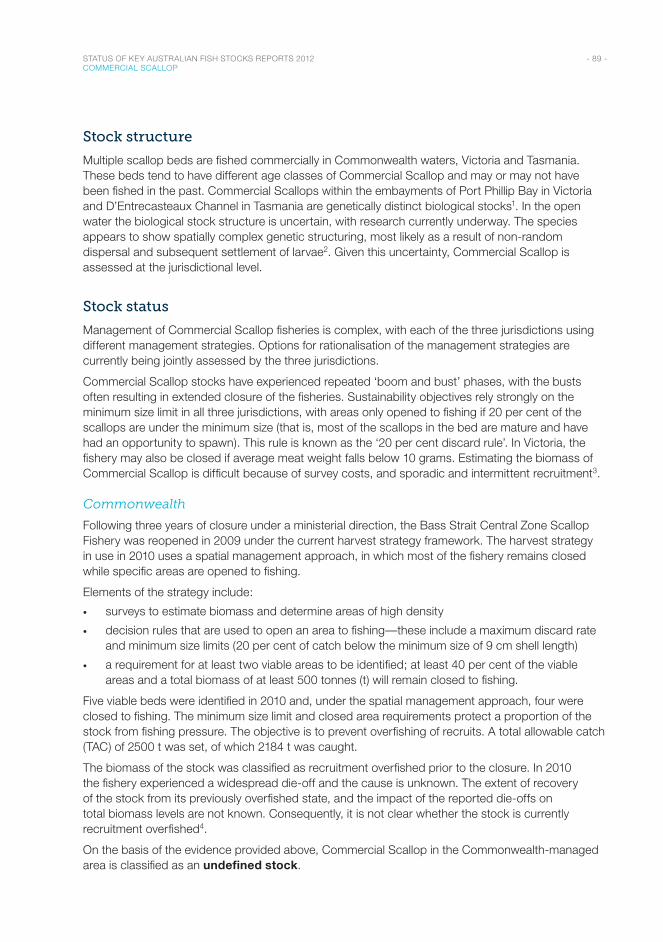
- 89 - STATUS OF KEY AUSTRALIAN FISH STOCKS REPORTS 2012 COMMERCIAL SCALLOP
Stock structure
Multiple scallop beds are fished commercially in Commonwealth waters, Victoria and Tasmania. These beds tend to have different age classes of Commercial Scallop and may or may not have been fished in the past. Commercial Scallops within the embayments of Port Phillip Bay in Victoria and D’Entrecasteaux Channel in Tasmania are genetically distinct biological stocks1. In the open water the biological stock structure is uncertain, with research currently underway. The species appears to show spatially complex genetic structuring, most likely as a result of non-random dispersal and subsequent settlement of larvae2. Given this uncertainty, Commercial Scallop is assessed at the jurisdictional level.
Stock status
Management of Commercial Scallop fisheries is complex, with each of the three jurisdictions using different management strategies. Options for rationalisation of the management strategies are currently being jointly assessed by the three jurisdictions.
Commercial Scallop stocks have experienced repeated ‘boom and bust’ phases, with the busts often resulting in extended closure of the fisheries. Sustainability objectives rely strongly on the minimum size limit in all three jurisdictions, with areas only opened to fishing if 20 per cent of the scallops are under the minimum size (that is, most of the scallops in the bed are mature and have had an opportunity to spawn). This rule is known as the ‘20 per cent discard rule’. In Victoria, the fishery may also be closed if average meat weight falls below 10 grams. Estimating the biomass of Commercial Scallop is difficult because of survey costs, and sporadic and intermittent recruitment3.
Commonwealth
Following three years of closure under a ministerial direction, the Bass Strait Central Zone Scallop Fishery was reopened in 2009 under the current harvest strategy framework. The harvest strategy in use in 2010 uses a spatial management approach, in which most of the fishery remains closed while specific areas are opened to fishing.
Elements of the strategy include:
• surveys to estimate biomass and determine areas of high density
• decision rules that are used to open an area to fishing—these include a maximum discard rate and minimum size limits (20 per cent of catch below the minimum size of 9 cm shell length)
• a requirement for at least two viable areas to be identified; at least 40 per cent of the viable areas and a total biomass of at least 500 tonnes (t) will remain closed to fishing.
Five viable beds were identified in 2010 and, under the spatial management approach, four were closed to fishing. The minimum size limit and closed area requirements protect a proportion of the stock from fishing pressure. The objective is to prevent overfishing of recruits. A total allowable catch (TAC) of 2500 t was set, of which 2184 t was caught.
The biomass of the stock was classified as recruitment overfished prior to the closure. In 2010 the fishery experienced a widespread die-off and the cause is unknown. The extent of recovery of the stock from its previously overfished state, and the impact of the reported die-offs on total biomass levels are not known. Consequently, it is not clear whether the stock is currently recruitment overfished4.
On the basis of the evidence provided above, Commercial Scallop in the Commonwealth-managed area is classified as an undefined stock.
- 90 - STATUS OF KEY AUSTRALIAN FISH STOCKS REPORTS 2012 COMMERCIAL SCALLOP
Victoria
For Victorian managed stocks, there is a minimum size limit of 8 cm shell length. The Victorian scallop fishery extends 20 nautical miles from the Victorian coastline, with most fishing occurring in eastern Victoria. Commercial Scallop fishing is not permitted in Victorian bays or inlets.
A 2009 fishery survey5 found low densities of Commercial Scallop and negligible recruitment. As a result, the total allowable commercial catch (TACC) for the 2010–11 and 2011–12 fishing seasons was set at zero. Although strategies are in place to prevent overfishing, the historical status of the Victorian stocks is unclear; in particular, it is unclear whether the stocks were recruitment overfished historically.
On the basis of the evidence provided above, Commercial Scallop in Victoria is classified as an undefined stock.
Tasmania
For Tasmanian-managed stocks, there is a minimum size limit of 9 cm shell length, which is a proxy for the Commercial Scallop being 3+ years of age and having had at least two major spawnings6. The minimum size limit ensures that a proportion of the mature stocks receive negligible fishing mortality, which prevents recruitment overfishing. The Tasmanian fishery was closed to fishing in 2009 and 2010 because the majority of scallops were below the minimum size. Although harvesting is managed with the aim of preventing the stocks becoming recruitment overfished, the historical status of the Tasmanian stocks is unclear; in particular, it is unclear whether the stocks are recruitment overfished.
On the basis of the evidence provided above, Commercial Scallop in Tasmania is classified as an undefined stock.
Table 2: Commercial Scallop biology1–2,6
Longevity and maximum size 7+ years; >12 cm shell length
Maturity Second year (~7–8 cm shell length, depending on region)
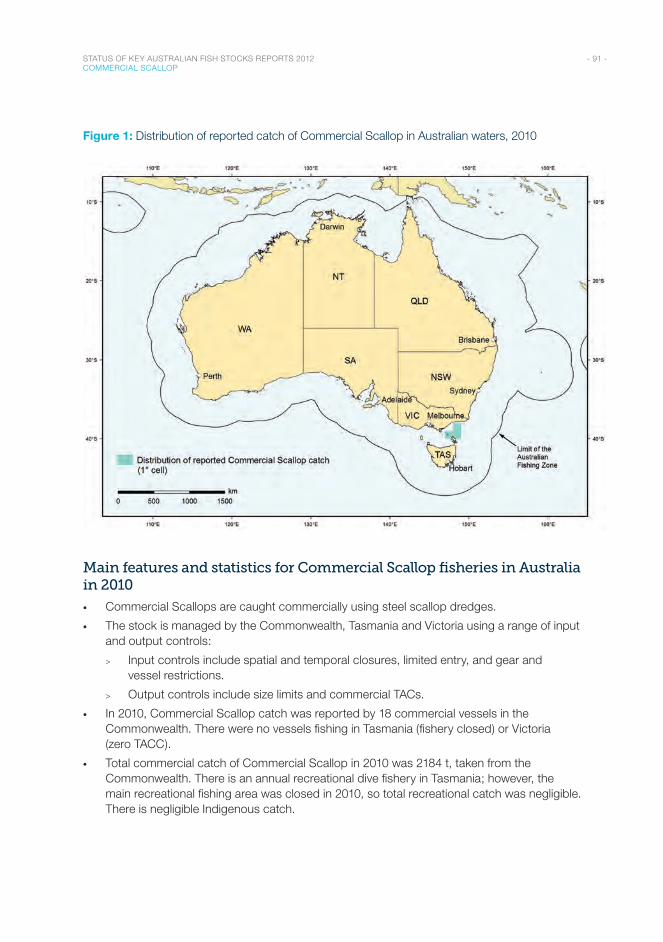
- 91 - STATUS OF KEY AUSTRALIAN FISH STOCKS REPORTS 2012 COMMERCIAL SCALLOP
Figure 1: Distribution of reported catch of Commercial Scallop in Australian waters, 2010
Main features and statistics for Commercial Scallop fisheries in Australia in 2010
• Commercial Scallops are caught commercially using steel scallop dredges.
• The stock is managed by the Commonwealth, Tasmania and Victoria using a range of input and output controls:
> Input controls include spatial and temporal closures, limited entry, and gear and vessel restrictions.
> Output controls include size limits and commercial TACs.
• In 2010, Commercial Scallop catch was reported by 18 commercial vessels in the Commonwealth. There were no vessels fishing in Tasmania (fishery closed) or Victoria (zero TACC).
• Total commercial catch of Commercial Scallop in 2010 was 2184 t, taken from the Commonwealth. There is an annual recreational dive fishery in Tasmania; however, the main recreational fishing area was closed in 2010, so total recreational catch was negligible. There is negligible Indigenous catch.
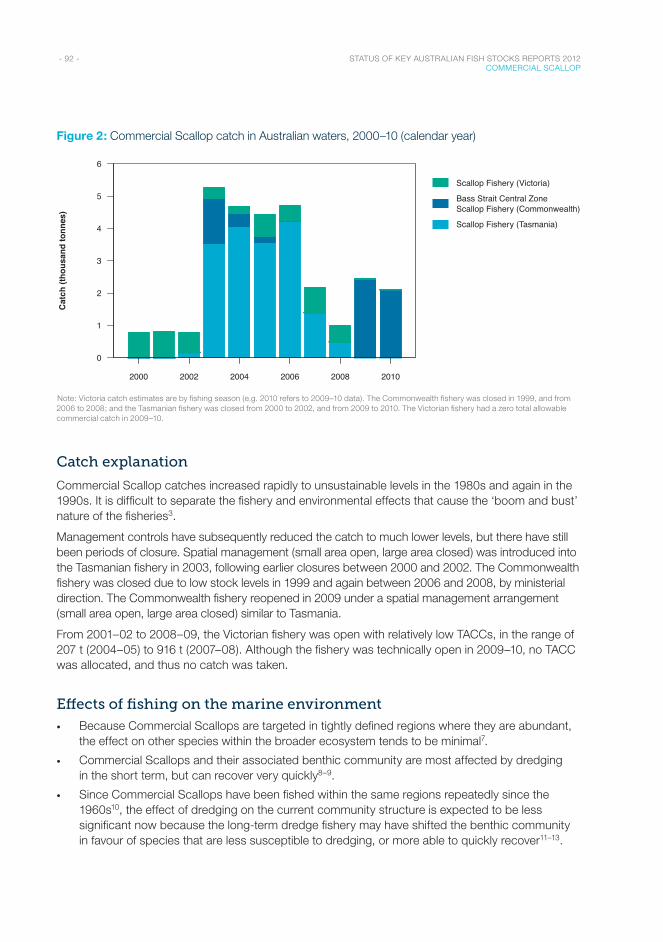
- 92 - STATUS OF KEY AUSTRALIAN FISH STOCKS REPORTS 2012 COMMERCIAL SCALLOP
Figure 2: Commercial Scallop catch in Australian waters, 2000–10 (calendar year)
Year
2000 2002 2004 2006 2008 2010
0
1
2
3
4
5
6
Scallop Fishery (Victoria)
Bass Strait Central ZoneScallop Fishery (Commonwealth)
Scallop Fishery (Tasmania)
Cat
ch (t
hous
and
tonn
es)
Note: Victoria catch estimates are by fishing season (e.g. 2010 refers to 2009–10 data). The Commonwealth fishery was closed in 1999, and from 2006 to 2008; and the Tasmanian fishery was closed from 2000 to 2002, and from 2009 to 2010. The Victorian fishery had a zero total allowable commercial catch in 2009–10.
Catch explanation
Commercial Scallop catches increased rapidly to unsustainable levels in the 1980s and again in the 1990s. It is difficult to separate the fishery and environmental effects that cause the ‘boom and bust’ nature of the fisheries3.
Management controls have subsequently reduced the catch to much lower levels, but there have still been periods of closure. Spatial management (small area open, large area closed) was introduced into the Tasmanian fishery in 2003, following earlier closures between 2000 and 2002. The Commonwealth fishery was closed due to low stock levels in 1999 and again between 2006 and 2008, by ministerial direction. The Commonwealth fishery reopened in 2009 under a spatial management arrangement (small area open, large area closed) similar to Tasmania.
From 2001–02 to 2008–09, the Victorian fishery was open with relatively low TACCs, in the range of 207 t (2004–05) to 916 t (2007–08). Although the fishery was technically open in 2009–10, no TACC was allocated, and thus no catch was taken.
Effects of fishing on the marine environment
• Because Commercial Scallops are targeted in tightly defined regions where they are abundant, the effect on other species within the broader ecosystem tends to be minimal7.
• Commercial Scallops and their associated benthic community are most affected by dredging in the short term, but can recover very quickly8–9.
• Since Commercial Scallops have been fished within the same regions repeatedly since the 1960s10, the effect of dredging on the current community structure is expected to be less significant now because the long-term dredge fishery may have shifted the benthic community in favour of species that are less susceptible to dredging, or more able to quickly recover11–13.
- 93 - STATUS OF KEY AUSTRALIAN FISH STOCKS REPORTS 2012 COMMERCIAL SCALLOP
Environmental effects on Commercial Scallop
• Recruitment of Commercial Scallop is sporadic and intermittent. More significantly, the stock–recruitment relationship of scallops is poorly understood3. Scallops are also known to have highly variable levels of natural mortality, which are attributable to density-dependent food shortages, seabed bottom type, disease, environmental conditions and predation, as well as other, inexplicable causes14.
• Stock relationships are influenced by ocean currents2. Changes in ocean currents through climate change or upwelling events would be expected to affect recruitment.
• Changes in Commercial Scallop community structure can be driven more by environmental effects than dredging impact8.
References1. Woodburn, L 1990, Genetic variation in southern Australian Pecten, in MCL Dredge, WF Zacharin & LM Joll (eds),
Proceedings of the Australasian Scallop Workshop, Tasmanian Government Printer, Hobart, 226–240.
2. Semmens, JM, Ovenden, JR, Jones, NAR, Mendo, TC, Macbeth, M, Broderick, D, Filardo, F, Street, R, Tracey, S, Hartmann, K & Buxton, CD 2012, Establishing fine-scale industry based spatial management and harvest strategies for the Commercial Scallop fishery in South East Australia, final report to the Fisheries Research and Development Corporation, project 2008/022, Institute for Marine and Antarctic Studies, University of Tasmania, Hobart.
3. Young, PC, Martin, RB, McLoughlin, RJ & West, G 1988, Variability in spatfall and recruitment of commercial scallops (Pecten fumatus) in Bass Strait, in MCL Dredge, WF Zacharin & LM Joll (eds), Proceedings of the Australian Scallop Workshop, Tasmanian Government Printer, Hobart, 80–91.
4. Woodhams, J, Stobutzki, I, Vieira, S, Curtotti, R & Begg, GA (eds) 2011, Fishery status reports 2010: status of fish stocks and fisheries managed by the Australian Government, Australian Bureau of Agricultural and Resource Economics and Sciences, Canberra.
5. Harrington, JJ, Leporati, S & Semmens, JM 2010, 2009 Victorian Scallop Fishery Survey final report, Tasmanian Aquaculture and Fisheries Institute, University of Tasmania, Hobart.
6. Young, PC & Martin, RB 1989, The scallop fisheries of Australia and their management, Reviews in Aquatic Sciences, 1: 615–638.
7. Haddon, M, Harrington, JJ & Semmens, JM 2006, Juvenile scallop discard rates and bed dynamics: testing the management rules for scallops in Bass Strait, final report to the Fisheries Research and Development Corporation, project 2003/017, Tasmanian Aquaculture and Fisheries Institute, University of Tasmania, Hobart.
8. Currie, DR & Parry, GD 1999, Impacts and efficiency of scallop dredging on different soft substrates, Canadian Journal of Fisheries and Aquatic Science, 56: 539–550.
9. Harrington, JJ, Haddon, M & Semmens, JM 2008, Facilitating industry self-management for spatially managed stocks: a scallop case study, final report to the Fisheries Research and Development Corporation, project 2005/0027, Tasmanian Aquaculture and Fisheries Institute, University of Tasmania, Hobart.
10. Gwyther, D, Cropp, DA, Joll, LM & Dredge, MCL 1991, Fisheries and aquaculture: Australia, in Scallops: biology, ecology and aquaculture, Elsevier, New York.
11. Jennings, S, Kaiser, MJ, Blaxter, JHS, Southward, AJ & Tyler, PA 1998, The effects of fishing on marine ecosystems, in JHS Blaxter, AJ Southward & PA Tyler (eds), Advances in Marine Biology, Academic Press, London.
12. Kaiser, MJ, Collie, JS, Hall, SJ, Jennings, S & Poiner, IR 2002, Modification of marine habitats by trawling activities: prognosis and solutions, Fishing & Fisheries, 3: 114–136.
13. Peterson, CH, Summerson, HC & Fegley, SR 1987, Ecological consequences of mechanical harvesting of clams, Fisheries Bulletin, 85: 281–298.
14. Gwyther, D & McShane, PE 1988, Growth rate and natural mortality of the scallop Pecten alba Tate in Port Phillip Bay, Australia, and evidence for changes in growth rate after a 20-year period, Fisheries Resources, 6: 347–361.
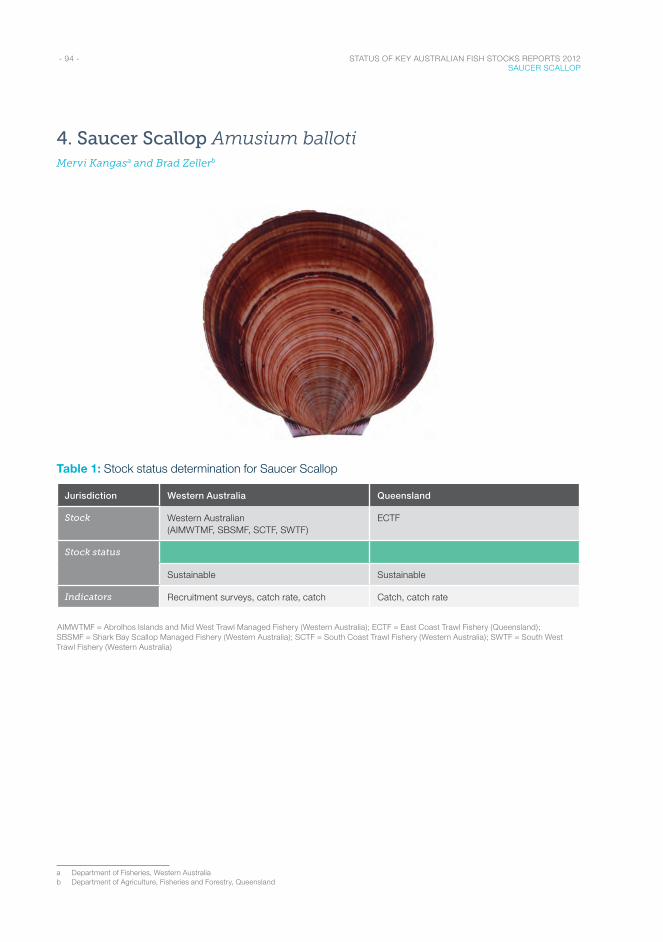
- 94 - STATUS OF KEY AUSTRALIAN FISH STOCKS REPORTS 2012 SAUCER SCALLOP
4. Saucer Scallop Amusium ballotiMervi Kangasa and Brad Zellerb
Table 1: Stock status determination for Saucer Scallop
Jurisdiction Western Australia Queensland
Stock Western Australian (AIMWTMF, SBSMF, SCTF, SWTF)
ECTF
Stock status
Sustainable Sustainable
Indicators Recruitment surveys, catch rate, catch Catch, catch rate
AIMWTMF = Abrolhos Islands and Mid West Trawl Managed Fishery (Western Australia); ECTF = East Coast Trawl Fishery (Queensland); SBSMF = Shark Bay Scallop Managed Fishery (Western Australia); SCTF = South Coast Trawl Fishery (Western Australia); SWTF = South West Trawl Fishery (Western Australia)
a Department of Fisheries, Western Australiab Department of Agriculture, Fisheries and Forestry, Queensland
- 95 - STATUS OF KEY AUSTRALIAN FISH STOCKS REPORTS 2012 SAUCER SCALLOP
Stock structure
Saucer Scallop is distributed from the New South Wales south coast to the Northern Territory and down the Western Australia coast to Esperance1. There are two genetically separate biological stocks of Saucer Scallop that are separated across northern Australian waters: the western Australian biological stock and the eastern Australian biological stock. The western Australian biological stock spans most of the Western Australia coast; it is divided into a number of functionally independent management units that reflect the geography and differences in larval life history. As a result, the Shark Bay, Abrolhos Islands, and South West and South Coast trawl fisheries’ biological sub-stocks need to be managed and monitored separately. Stock classification for the western Australian biological stock is based on evidence from each of the management units. The eastern Australian biological stock occurs from Innisfail (Queensland) to Jervis Bay (New South Wales). No commercial fishery for Saucer Scallop exists in New South Wales waters, and hence biological stock classification is based on the commercial fishery in central and southern Queensland (22–27ºS).
Stock status
Western Australian biological stock
The western Australian Saucer Scallop biological stock is taken commercially from four management units, and stock assessments have been undertaken at the fishery level. Information from each of the assessments is combined here to determine the status of the biological stock.
The Shark Bay Scallop Managed Fishery (Western Australia) management unit is managed under a harvest strategy based on a constant escapement policy, to ensure adequate spawning biomass. Commercial catch rate threshold levels are used (400–450 kg meat weight/day) to stop fishing, to maintain breeding stock during the key spawning period (April–June); closure can be triggered when this level is reached, or on a date in May, irrespective of catch rate2. The current threshold levels are deemed to leave an adequate level of spawning stock to provide recruitment in the acceptable range, given ‘normal’ environmental conditions. A part of the biological stock is also carried over to the following year to provide a buffer for the spawning stock in case of low recruitment. Recruitment surveys are carried out before each season3–4 to determine a catch projection and whether the fishery should open. The commercial catch projection for 2010 was 1475 tonnes (t) (whole weight), and a total of 1592 t was taken2, which is within the acceptable catch range (1250–3000 t). This management strategy ensures that the biomass of this part of the biological stock is unlikely to be recruitment overfished. As well, fishing mortality is set at a level that is commensurate with the biomass and therefore will not cause this part of the biological stock to become recruitment overfished.
The Abrolhos Islands and Mid West Trawl Managed Fishery (Western Australia) management unit is also managed under a harvest strategy based on a constant escapement policy, to ensure that adequate spawning biomass is available during each spawning season. Breeding stock levels are maintained by fishing after the majority of the mature scallops spawn, setting the fishing period according to the catch prediction (based on recruitment surveys), and closing the fishery at a threshold catch-rate level (250 kg meat weight/day), or not opening sections of the fishery if the abundance is not considered sufficient2. The commercial catch projection for 2010 was 880–1320 t (whole weight), and a total of 806 t was taken2. Two factors contributed to the level of catch being below the target catch range: the Wallabi area was not fished to its potential catch, and fishing ceased early because the catch-rate threshold was met. This management strategy ensures that the biomass of this part of the biological stock is unlikely to be recruitment overfished, and fishing mortality will not be at a level that will cause this part of the biological stock to become recruitment overfished.
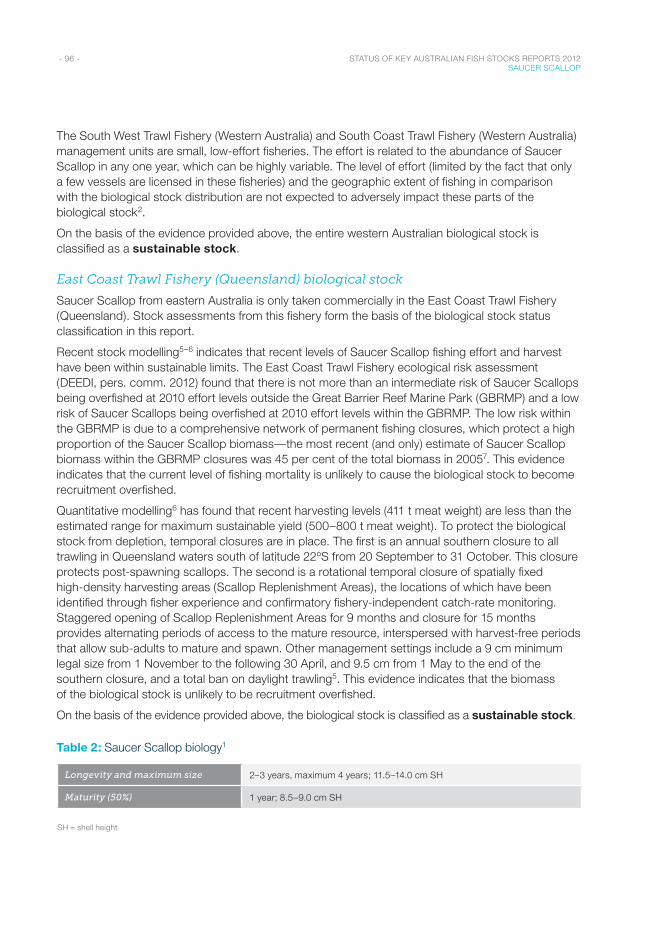
- 96 - STATUS OF KEY AUSTRALIAN FISH STOCKS REPORTS 2012 SAUCER SCALLOP
The South West Trawl Fishery (Western Australia) and South Coast Trawl Fishery (Western Australia) management units are small, low-effort fisheries. The effort is related to the abundance of Saucer Scallop in any one year, which can be highly variable. The level of effort (limited by the fact that only a few vessels are licensed in these fisheries) and the geographic extent of fishing in comparison with the biological stock distribution are not expected to adversely impact these parts of the biological stock2.
On the basis of the evidence provided above, the entire western Australian biological stock is classified as a sustainable stock.
East Coast Trawl Fishery (Queensland) biological stock
Saucer Scallop from eastern Australia is only taken commercially in the East Coast Trawl Fishery (Queensland). Stock assessments from this fishery form the basis of the biological stock status classification in this report.
Recent stock modelling5–6 indicates that recent levels of Saucer Scallop fishing effort and harvest have been within sustainable limits. The East Coast Trawl Fishery ecological risk assessment (DEEDI, pers. comm. 2012) found that there is not more than an intermediate risk of Saucer Scallops being overfished at 2010 effort levels outside the Great Barrier Reef Marine Park (GBRMP) and a low risk of Saucer Scallops being overfished at 2010 effort levels within the GBRMP. The low risk within the GBRMP is due to a comprehensive network of permanent fishing closures, which protect a high proportion of the Saucer Scallop biomass—the most recent (and only) estimate of Saucer Scallop biomass within the GBRMP closures was 45 per cent of the total biomass in 20057. This evidence indicates that the current level of fishing mortality is unlikely to cause the biological stock to become recruitment overfished.
Quantitative modelling6 has found that recent harvesting levels (411 t meat weight) are less than the estimated range for maximum sustainable yield (500–800 t meat weight). To protect the biological stock from depletion, temporal closures are in place. The first is an annual southern closure to all trawling in Queensland waters south of latitude 22ºS from 20 September to 31 October. This closure protects post-spawning scallops. The second is a rotational temporal closure of spatially fixed high-density harvesting areas (Scallop Replenishment Areas), the locations of which have been identified through fisher experience and confirmatory fishery-independent catch-rate monitoring. Staggered opening of Scallop Replenishment Areas for 9 months and closure for 15 months provides alternating periods of access to the mature resource, interspersed with harvest-free periods that allow sub-adults to mature and spawn. Other management settings include a 9 cm minimum legal size from 1 November to the following 30 April, and 9.5 cm from 1 May to the end of the southern closure, and a total ban on daylight trawling5. This evidence indicates that the biomass of the biological stock is unlikely to be recruitment overfished.
On the basis of the evidence provided above, the biological stock is classified as a sustainable stock.
Table 2: Saucer Scallop biology1
Longevity and maximum size 2–3 years, maximum 4 years; 11.5–14.0 cm SH
Maturity (50%) 1 year; 8.5–9.0 cm SH
SH = shell height
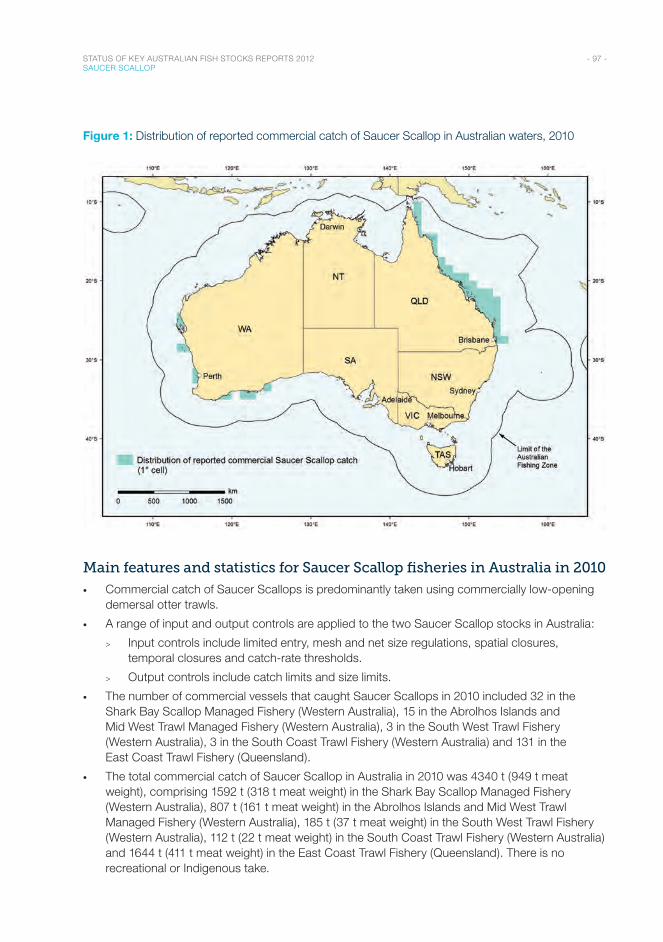
- 97 - STATUS OF KEY AUSTRALIAN FISH STOCKS REPORTS 2012 SAUCER SCALLOP
Figure 1: Distribution of reported commercial catch of Saucer Scallop in Australian waters, 2010
Main features and statistics for Saucer Scallop fisheries in Australia in 2010
• Commercial catch of Saucer Scallops is predominantly taken using commercially low-opening demersal otter trawls.
• A range of input and output controls are applied to the two Saucer Scallop stocks in Australia:
> Input controls include limited entry, mesh and net size regulations, spatial closures, temporal closures and catch-rate thresholds.
> Output controls include catch limits and size limits.
• The number of commercial vessels that caught Saucer Scallops in 2010 included 32 in the Shark Bay Scallop Managed Fishery (Western Australia), 15 in the Abrolhos Islands and Mid West Trawl Managed Fishery (Western Australia), 3 in the South West Trawl Fishery (Western Australia), 3 in the South Coast Trawl Fishery (Western Australia) and 131 in the East Coast Trawl Fishery (Queensland).
• The total commercial catch of Saucer Scallop in Australia in 2010 was 4340 t (949 t meat weight), comprising 1592 t (318 t meat weight) in the Shark Bay Scallop Managed Fishery (Western Australia), 807 t (161 t meat weight) in the Abrolhos Islands and Mid West Trawl Managed Fishery (Western Australia), 185 t (37 t meat weight) in the South West Trawl Fishery (Western Australia), 112 t (22 t meat weight) in the South Coast Trawl Fishery (Western Australia) and 1644 t (411 t meat weight) in the East Coast Trawl Fishery (Queensland). There is no recreational or Indigenous take.
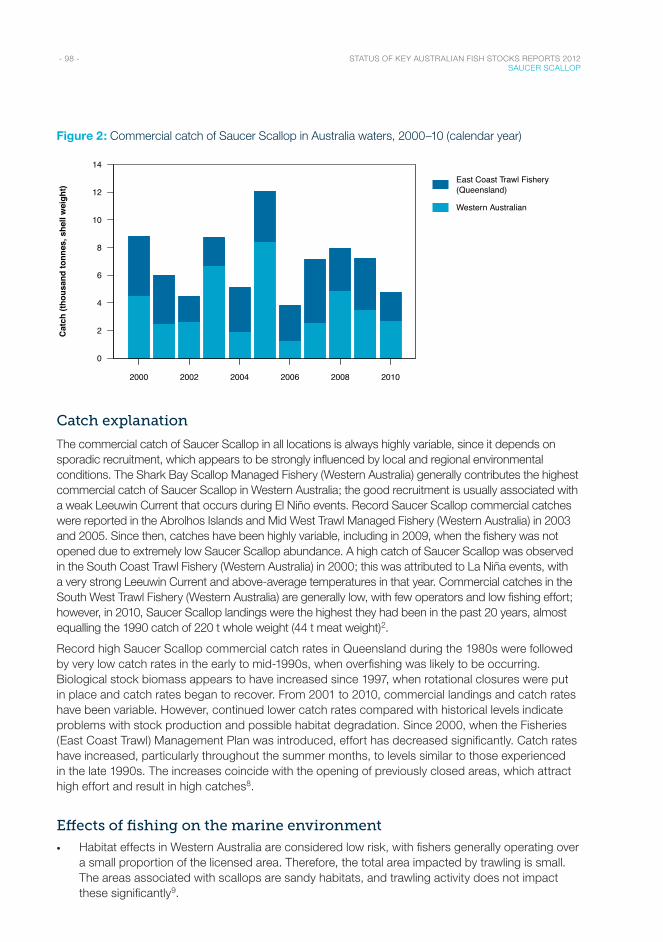
- 98 - STATUS OF KEY AUSTRALIAN FISH STOCKS REPORTS 2012 SAUCER SCALLOP
Figure 2: Commercial catch of Saucer Scallop in Australia waters, 2000–10 (calendar year)
Year
2000 2002 2004 2006 2008 2010
0
2
4
6
8
10
12
14
East Coast Trawl Fishery(Queensland)
Western Australian
Cat
ch (t
hous
and
tonn
es, s
hell
wei
ght)
Catch explanation
The commercial catch of Saucer Scallop in all locations is always highly variable, since it depends on sporadic recruitment, which appears to be strongly influenced by local and regional environmental conditions. The Shark Bay Scallop Managed Fishery (Western Australia) generally contributes the highest commercial catch of Saucer Scallop in Western Australia; the good recruitment is usually associated with a weak Leeuwin Current that occurs during El Niño events. Record Saucer Scallop commercial catches were reported in the Abrolhos Islands and Mid West Trawl Managed Fishery (Western Australia) in 2003 and 2005. Since then, catches have been highly variable, including in 2009, when the fishery was not opened due to extremely low Saucer Scallop abundance. A high catch of Saucer Scallop was observed in the South Coast Trawl Fishery (Western Australia) in 2000; this was attributed to La Niña events, with a very strong Leeuwin Current and above-average temperatures in that year. Commercial catches in the South West Trawl Fishery (Western Australia) are generally low, with few operators and low fishing effort; however, in 2010, Saucer Scallop landings were the highest they had been in the past 20 years, almost equalling the 1990 catch of 220 t whole weight (44 t meat weight)2.
Record high Saucer Scallop commercial catch rates in Queensland during the 1980s were followed by very low catch rates in the early to mid-1990s, when overfishing was likely to be occurring. Biological stock biomass appears to have increased since 1997, when rotational closures were put in place and catch rates began to recover. From 2001 to 2010, commercial landings and catch rates have been variable. However, continued lower catch rates compared with historical levels indicate problems with stock production and possible habitat degradation. Since 2000, when the Fisheries (East Coast Trawl) Management Plan was introduced, effort has decreased significantly. Catch rates have increased, particularly throughout the summer months, to levels similar to those experienced in the late 1990s. The increases coincide with the opening of previously closed areas, which attract high effort and result in high catches8.
Effects of fishing on the marine environment
• Habitat effects in Western Australia are considered low risk, with fishers generally operating over a small proportion of the licensed area. Therefore, the total area impacted by trawling is small. The areas associated with scallops are sandy habitats, and trawling activity does not impact these significantly9.
- 99 - STATUS OF KEY AUSTRALIAN FISH STOCKS REPORTS 2012 SAUCER SCALLOP
• Food-chain effects are considered low risk in Western Australia because the total biomass taken by these fisheries is small. Moreover, because of the high natural variability of scallop stock abundance6, it is unlikely that any predators are highly dependent on this species9.
• Bycatch reduction devices are mandatory in the Shark Bay Scallop Managed Fishery (Western Australia) and Abrolhos Islands and Mid West Trawl Managed Fishery (Western Australia). Turtle excluder devices are mandatory in the East Coast Trawl Fishery (Queensland) and are effective in removing larger bycatch species (e.g. turtles, sharks and rays). Compliance monitoring of bycatch reduction devices and vessel activities (through vessel monitoring systems) occurs in each management area. Since 2009, the Queensland Government has provided material and financial incentives to assist the widespread uptake and effective use of square-mesh codend bycatch reduction devices, which reduce the catch of smaller bycatch species10.
Environmental effects on Saucer Scallop
• In Western Australia, strong La Niña conditions have generally resulted in below-average Saucer Scallop recruitment in Shark Bay11–13. There were two significant flooding events and record high water temperatures from December 2010 to February 2011 that appear to be linked with the very strong La Niña event14. These appear to have had a significant negative influence on the Saucer Scallop fisheries. This La Niña event may also have negatively impacted scallop stocks in the Abrolhos Islands.
• An investigation into the effect of environmental variables on the Queensland Saucer Scallop stock has recently been proposed.
References1. Kailola, PJ, Williams, MJ, Stewart, PC, Reichelt, RE, McNee, A & Grieve, C 1993, Australian fisheries resources, Bureau of
Resource Sciences & the Fisheries Research and Development Corporation, Canberra.
2. Fletcher, WJ & Santoro, K (eds) 2011, State of the fisheries and aquatic resources report 2010/11, Department of Fisheries, Western Australia.
3. Joll, LM & Caputi, N 1995, Environmental influences on recruitment in the saucer scallop (Amusium balloti) fishery of Shark Bay, Western Australia, ICES Marine Science Symposia, 199: 47–53.
4. Kangas, M, Sporer, E, Brown, S, Shanks, M, Chandrapavan, A & Thomson, A 2011, Stock assessment for the Shark Bay Scallop Fishery, Fisheries Research Report 226, Department of Fisheries, Western Australia.
5. Campbell, MJ, Campbell, AB, Officer, RA, O’Neill, MF, Mayer, DG, Thwaites, A, Jebreen, EJ, Courtney, AJ, Gribble, N, Lawrence, ML, Prosser, AJ & Drabsch, SL 2010, Harvest strategy evaluation to optimise the sustainability and value of the Queensland scallop fishery, final report to the Fisheries Research and Development Corporation, project 2006/024, Queensland Department of Employment, Economic Development and Innovation, Brisbane.
6. Campbell, AB, O’Neill, MF, Leigh GM, Wang Y-G & Jebreen, EJ 2012, Reference points for the Queensland scallop fishery, final report to the Fisheries Research and Development Corporation, project 2009/089, Queensland Department of Employment, Economic Development and Innovation, Brisbane.
7. Pitcher, CR, Doherty, P, Arnold, P, Hooper, J, Gribble, N, Bartlett, C, Browne, M, Campbell, N, Cannard, T, Cappo, M, Carini, G, Chalmers, S, Cheers, S, Chetwynd, D, Colefax, A, Coles, R, Cook, S, Davie, P, De’ath, G, Devereux, D, Done, B, Donovan, T, Ehrke, B, Ellis, N, Ericson, G, Fellegara, I, Forcey, K, Furey, M, Gledhill, D, Good, N, Gordon, S, Haywood, M, Jacobsen, I, Johnson, J, Jones, M, Kinninmoth, S, Kistle, S, Last, P, Leite, A, Marks, S, McLeod, I, Oczkowicz, S, Rose, C, Seabright, D, Sheils, J, Sherlock, M, Skelton, P, Smith, D, Smith, G, Speare, P, Stowar, M, Strickland, C, Sutcliffe, P, Van der Geest, C, Venables, W, Walsh, C, Wassenberg, T, Welna, A & Yearsley, G 2007, Seabed biodiversity on the continental shelf of the Great Barrier Reef World Heritage Area, final report to the AIMS/CSIRO/QM/QDPI Cooperative Research Centre for the Great Barrier Reef World Heritage Area, CSIRO Marine and Atmospheric Research, Brisbane.
8. Queensland Department of Employment, Economic Development and Innovation 2011, Stock status of Queensland’s fisheries resources 2011, DEEDI, Brisbane.
9. Kangas, M, McCrea, J, Fletcher, W, Sporer, E & Weir, V 2006, Shark Bay scallop fishery, ESD Report Series no. 2, Department of Fisheries, Western Australia.
- 100 - STATUS OF KEY AUSTRALIAN FISH STOCKS REPORTS 2012 SAUCER SCALLOP
10. Courtney, AJ, Campbell, MJ, Roy, DP, Tonks, ML, Chilcott, KE & Kyne, PM 2008, Round scallops and square-meshes: a comparison of four codend types on the catch rates of target species and bycatch in the Queensland (Australia) saucer scallop (Amusium balloti) trawl fishery, Marine and Freshwater Research, 59: 849–864.
11. Joll, LM & Caputi, N 1995, Geographic variation in the reproductive cycle of the saucer scallop, Amusium balloti (Bernardi, 1861) (Mollusca: Pectinidae), along the Western Australian coast, Marine and Freshwater Research, 46: 779–792.
12. Caputi, N, Penn, JW, Joll, LM & Chubb, CF 1998, Stock–recruitment–environment relationships for invertebrate species of Western Australia, in GS Jamieson & A Campbell (eds), Proceedings of the North Pacific Symposium on Invertebrate Stock Assessment and Management, Canadian Special Publication of Fisheries and Aquatic Sciences, 125: 247–255.
13. Lenanton, RC, Caputi, N, Kangas, M & Craine M 2009, The ongoing influence of the Leeuwin Current on economically important fish and invertebrates off temperate Western Australia—has it changed?, Journal of the Royal Society of Western Australia, 92(2): 111–127.
14. Pearce, A, Lenanton, R, Jackson, G, Moore, J, Feng, M & Gaughan, D 2011, The ‘marine heat wave’ off Western Australia during the summer of 2010/11, Fisheries Research Report no. 222, Western Australia Department of Fisheries, Perth.

- 101 - STATUS OF KEY AUSTRALIAN FISH STOCKS REPORTS 2012 SAUCER SCALLOP

Molluscs : SquidGould’s Squid / Southern Calamari
S Q U I D A R E A D I V E R S E G R O U P O F I N V E R T E B R AT E S A N D R A N G E I N S I Z E F R O M 2 C M T O A B O U T 18 M . U N L I K E O T H E R
M O L L U S C S , T H E Y D O N ’ T H A V E E X T E R N A L S H E L L S .
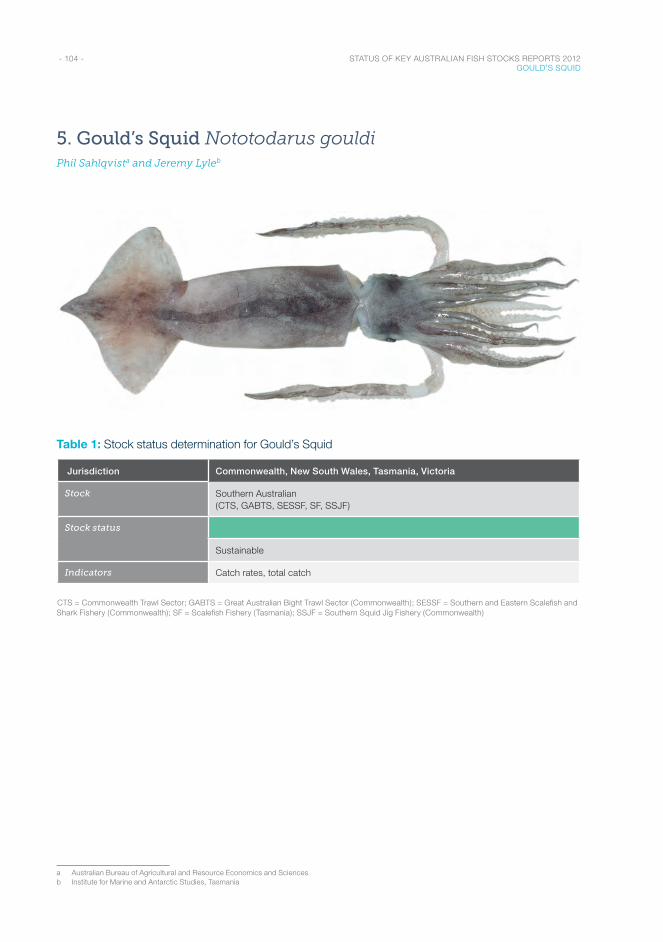
- 104 - STATUS OF KEY AUSTRALIAN FISH STOCKS REPORTS 2012 GOULD’S SQUID
5. Gould’s Squid Nototodarus gouldiPhil Sahlqvista and Jeremy Lyleb
Table 1: Stock status determination for Gould’s Squid
Jurisdiction Commonwealth, New South Wales, Tasmania, Victoria
Stock Southern Australian (CTS, GABTS, SESSF, SF, SSJF)
Stock status
Sustainable
Indicators Catch rates, total catch
CTS = Commonwealth Trawl Sector; GABTS = Great Australian Bight Trawl Sector (Commonwealth); SESSF = Southern and Eastern Scalefish and Shark Fishery (Commonwealth); SF = Scalefish Fishery (Tasmania); SSJF = Southern Squid Jig Fishery (Commonwealth)
a Australian Bureau of Agricultural and Resource Economics and Sciencesb Institute for Marine and Antarctic Studies, Tasmania
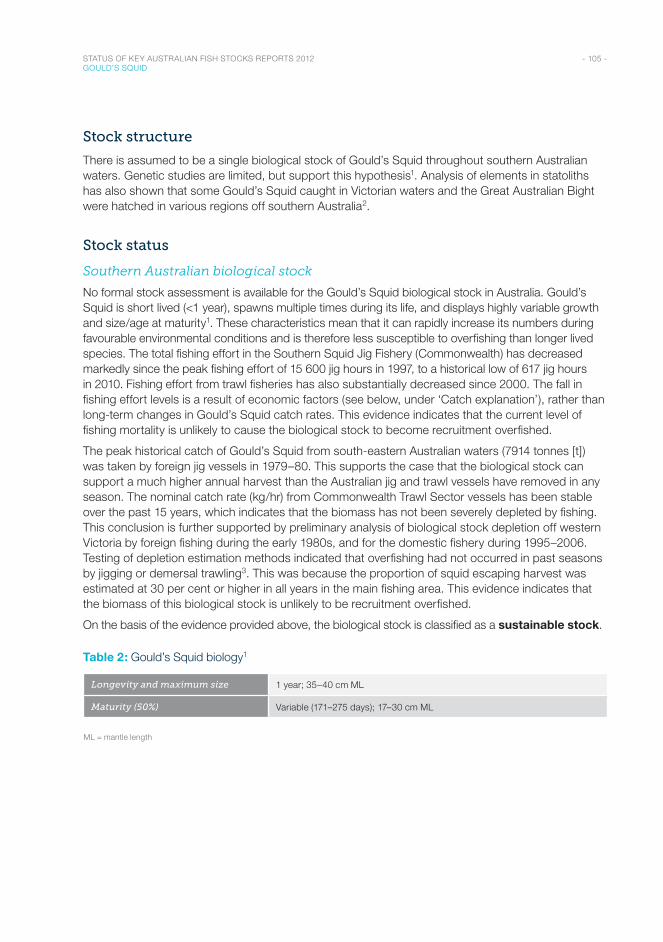
- 105 - STATUS OF KEY AUSTRALIAN FISH STOCKS REPORTS 2012 GOULD’S SQUID
Stock structure
There is assumed to be a single biological stock of Gould’s Squid throughout southern Australian waters. Genetic studies are limited, but support this hypothesis1. Analysis of elements in statoliths has also shown that some Gould’s Squid caught in Victorian waters and the Great Australian Bight were hatched in various regions off southern Australia2.
Stock status
Southern Australian biological stock
No formal stock assessment is available for the Gould’s Squid biological stock in Australia. Gould’s Squid is short lived (<1 year), spawns multiple times during its life, and displays highly variable growth and size/age at maturity1. These characteristics mean that it can rapidly increase its numbers during favourable environmental conditions and is therefore less susceptible to overfishing than longer lived species. The total fishing effort in the Southern Squid Jig Fishery (Commonwealth) has decreased markedly since the peak fishing effort of 15 600 jig hours in 1997, to a historical low of 617 jig hours in 2010. Fishing effort from trawl fisheries has also substantially decreased since 2000. The fall in fishing effort levels is a result of economic factors (see below, under ‘Catch explanation’), rather than long-term changes in Gould’s Squid catch rates. This evidence indicates that the current level of fishing mortality is unlikely to cause the biological stock to become recruitment overfished.
The peak historical catch of Gould’s Squid from south-eastern Australian waters (7914 tonnes [t]) was taken by foreign jig vessels in 1979–80. This supports the case that the biological stock can support a much higher annual harvest than the Australian jig and trawl vessels have removed in any season. The nominal catch rate (kg/hr) from Commonwealth Trawl Sector vessels has been stable over the past 15 years, which indicates that the biomass has not been severely depleted by fishing. This conclusion is further supported by preliminary analysis of biological stock depletion off western Victoria by foreign fishing during the early 1980s, and for the domestic fishery during 1995–2006. Testing of depletion estimation methods indicated that overfishing had not occurred in past seasons by jigging or demersal trawling3. This was because the proportion of squid escaping harvest was estimated at 30 per cent or higher in all years in the main fishing area. This evidence indicates that the biomass of this biological stock is unlikely to be recruitment overfished.
On the basis of the evidence provided above, the biological stock is classified as a sustainable stock.
Table 2: Gould’s Squid biology1
Longevity and maximum size 1 year; 35–40 cm ML
Maturity (50%) Variable (171–275 days); 17–30 cm ML
ML = mantle length
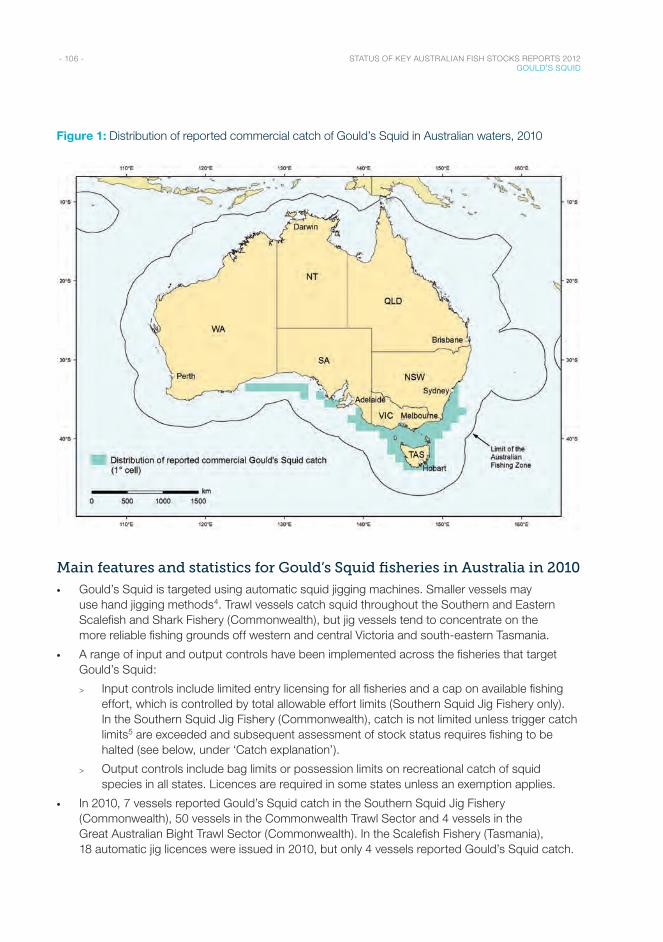
- 106 - STATUS OF KEY AUSTRALIAN FISH STOCKS REPORTS 2012 GOULD’S SQUID
Figure 1: Distribution of reported commercial catch of Gould’s Squid in Australian waters, 2010
Main features and statistics for Gould’s Squid fisheries in Australia in 2010
• Gould’s Squid is targeted using automatic squid jigging machines. Smaller vessels may use hand jigging methods4. Trawl vessels catch squid throughout the Southern and Eastern Scalefish and Shark Fishery (Commonwealth), but jig vessels tend to concentrate on the more reliable fishing grounds off western and central Victoria and south-eastern Tasmania.
• A range of input and output controls have been implemented across the fisheries that target Gould’s Squid:
> Input controls include limited entry licensing for all fisheries and a cap on available fishing effort, which is controlled by total allowable effort limits (Southern Squid Jig Fishery only). In the Southern Squid Jig Fishery (Commonwealth), catch is not limited unless trigger catch limits5 are exceeded and subsequent assessment of stock status requires fishing to be halted (see below, under ‘Catch explanation’).
> Output controls include bag limits or possession limits on recreational catch of squid species in all states. Licences are required in some states unless an exemption applies.
• In 2010, 7 vessels reported Gould’s Squid catch in the Southern Squid Jig Fishery (Commonwealth), 50 vessels in the Commonwealth Trawl Sector and 4 vessels in the Great Australian Bight Trawl Sector (Commonwealth). In the Scalefish Fishery (Tasmania), 18 automatic jig licences were issued in 2010, but only 4 vessels reported Gould’s Squid catch.
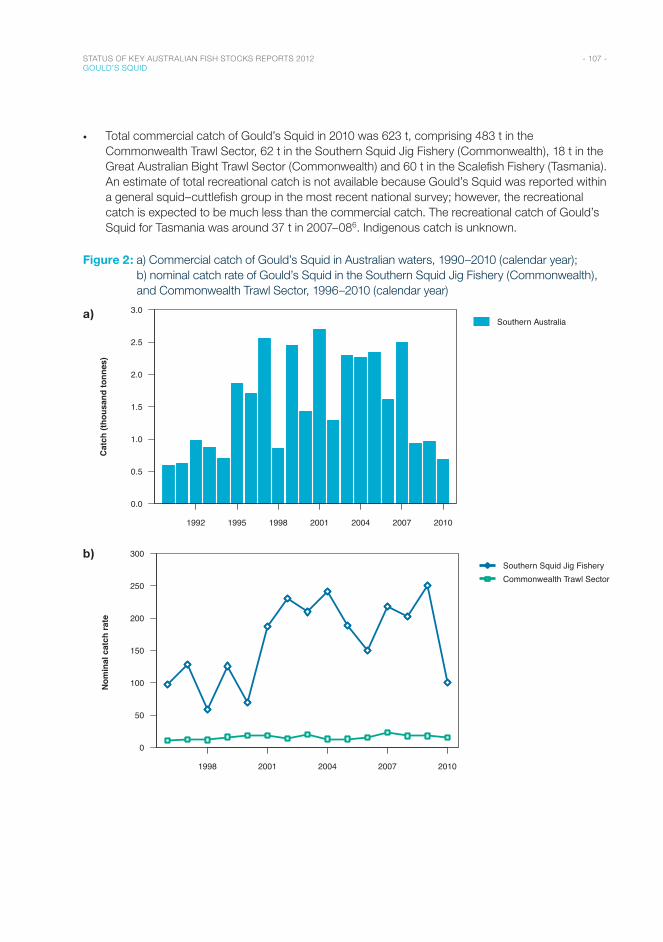
- 107 - STATUS OF KEY AUSTRALIAN FISH STOCKS REPORTS 2012 GOULD’S SQUID
• Total commercial catch of Gould’s Squid in 2010 was 623 t, comprising 483 t in the Commonwealth Trawl Sector, 62 t in the Southern Squid Jig Fishery (Commonwealth), 18 t in the Great Australian Bight Trawl Sector (Commonwealth) and 60 t in the Scalefish Fishery (Tasmania). An estimate of total recreational catch is not available because Gould’s Squid was reported within a general squid–cuttlefish group in the most recent national survey; however, the recreational catch is expected to be much less than the commercial catch. The recreational catch of Gould’s Squid for Tasmania was around 37 t in 2007–086. Indigenous catch is unknown.
Figure 2: a) Commercial catch of Gould’s Squid in Australian waters, 1990–2010 (calendar year); b) nominal catch rate of Gould’s Squid in the Southern Squid Jig Fishery (Commonwealth), and Commonwealth Trawl Sector, 1996–2010 (calendar year)
a)
Year
1992 1995 1998 2001 2004 2007 2010
0.0
0.5
1.0
1.5
2.0
2.5
3.0Southern Australia
Cat
ch (t
hous
and
tonn
es)
b)
Year
1998 2001 2004 2007 2010
0
50
100
150
200
250
300Southern Squid Jig FisheryCommonwealth Trawl Sector
Nom
inal
cat
ch ra
te
- 108 - STATUS OF KEY AUSTRALIAN FISH STOCKS REPORTS 2012 GOULD’S SQUID
Catch explanation
The annual catch history for Gould’s Squid shows great variability between years (see Figure 2a). Most of this variability is in the Southern Squid Jig Fishery (Commonwealth) catch, which first dominated domestic landings in 1995 and reached a peak of 2001 t in 1997. In 1999 and 2007, the Scalefish Fishery (Tasmania) also contributed much of the total catch. Since 2005, the Southern Squid Jig Fishery (Commonwealth) component of the catch has decreased significantly, as a result of unreliable catch rates (see Figure 2b), the length of the season on the main fishing grounds due to the availability of squid and poor economic conditions. High costs of fishing, and low global and domestic prices for squid (and thus low profitability), are the main economic factors driving low effort in the fishery.
Effects of fishing on the marine environment
• Jig fishing methods are highly selective. An ecological risk assessment of the Southern Squid Jig Fishery (Commonwealth) was completed in 2006 and did not identify any indicators of threat to the environment from jig fishing. The trawling method used in the Commonwealth Trawl Sector and Great Australian Bight Trawl Sector (Commonwealth) has potential for interactions with threatened, endangered and protected species, particularly seals, seabirds, and seahorses and pipefishes (syngnathids). These fisheries have in place bycatch and discarding workplans or bycatch catch triggers to reduce these interactions and environmental impacts.
Environmental effects on Gould’s Squid
• The Gould’s Squid biological stock can vary significantly in abundance between years, and environmental conditions are widely acknowledged as influences on larval and juvenile survival. Environmental factors such as sea temperature and nutrient concentrations have also been linked to growth rate, particularly for females1.
References1. Jackson, GD & McGrath-Steer, BL 2003, Arrow squid in southern Australian waters—supplying management needs
through biological investigations, final report to the Fisheries Research and Development Corporation, project 1999/112, Institute of Antarctic and Southern Ocean Studies, University of Tasmania, Hobart.
2. Virtue, P, Green, C, Pethybridge, H, Moltschaniwskyj, N, Wotherspoon, S & Jackson, G 2011, Arrow squid: stock variability, fishing techniques, trophic linkages—facing the challenges, final report to the Fisheries Research and Development Corporation, project 2006/12, Institute for Marine and Antarctic Studies, Hobart.
3. Sahlqvist, P & Skirtun, M 2011, Southern Squid Jig Fishery, in J Woodhams, I Stobutzki, S Vieira, R Curtotti & GA Begg (eds), Fishery status reports 2010: status of fish stocks and fisheries managed by the Australian Government, Australian Bureau of Agricultural and Resource Economics and Sciences, Canberra.
4. Willcox, S, Lyle, J & Steer, M 2001, Tasmanian arrow squid fishery—status report 2001, internal report, Tasmanian Aquaculture and Fisheries Institute, University of Tasmania, Hobart.
5. Australian Fisheries Management Authority 2007, Southern Squid Jig Fishery harvest strategy, AFMA, Canberra.
6. Lyle, JM, Tracey, SR, Stark, KE & Wotherspoon, S 2009, 2007–08 survey of recreational fishing in Tasmania, internal report, Tasmanian Aquaculture and Fisheries Institute, University of Tasmania, Hobart.
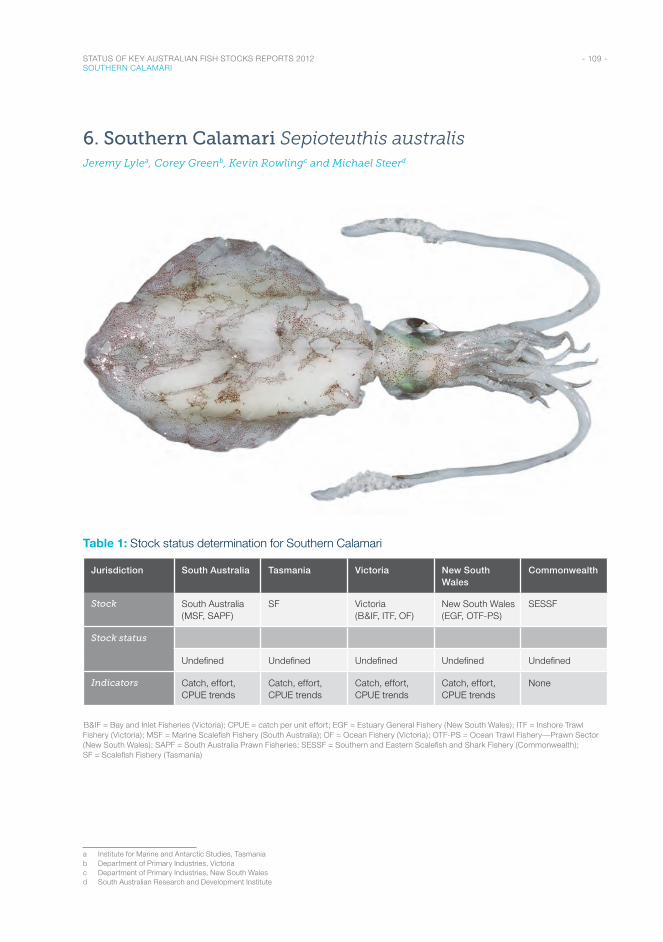
- 109 - STATUS OF KEY AUSTRALIAN FISH STOCKS REPORTS 2012 SOUTHERN CALAMARI
6. Southern Calamari Sepioteuthis australisJeremy Lylea, Corey Greenb, Kevin Rowlingc and Michael Steerd
Table 1: Stock status determination for Southern Calamari
Jurisdiction South Australia Tasmania Victoria New South Wales
Commonwealth
Stock South Australia (MSF, SAPF)
SF Victoria (B&IF, ITF, OF)
New South Wales (EGF, OTF-PS)
SESSF
Stock status
Undefined Undefined Undefined Undefined Undefined
Indicators Catch, effort, CPUE trends
Catch, effort, CPUE trends
Catch, effort, CPUE trends
Catch, effort, CPUE trends
None
B&IF = Bay and Inlet Fisheries (Victoria); CPUE = catch per unit effort; EGF = Estuary General Fishery (New South Wales); ITF = Inshore Trawl Fishery (Victoria); MSF = Marine Scalefish Fishery (South Australia); OF = Ocean Fishery (Victoria); OTF-PS = Ocean Trawl Fishery—Prawn Sector (New South Wales); SAPF = South Australia Prawn Fisheries; SESSF = Southern and Eastern Scalefish and Shark Fishery (Commonwealth); SF = Scalefish Fishery (Tasmania)
a Institute for Marine and Antarctic Studies, Tasmaniab Department of Primary Industries, Victoriac Department of Primary Industries, New South Walesd South Australian Research and Development Institute
- 110 - STATUS OF KEY AUSTRALIAN FISH STOCKS REPORTS 2012 SOUTHERN CALAMARI
Stock structure
The biological stock structure across the distributional range of Southern Calamari has not been examined. However, life history dynamics, and study of movement and statolith microchemistry in Tasmania, suggest some localised biological stock structuring1. In the absence of robust information on biological stock boundaries, stock status is reported at the jurisdictional level.
Stock status
Limited information is available on this species. Hence, the information that is available from each jurisdiction is combined below.
The species is characterised by strong interannual variability in abundance, as a result of a life span of less than one year, and spawning and recruitment variability2–3. In the absence of quantitative assessments, South Australia and Tasmania have implemented performance indicators based on commercial catch, effort and catch rate trends. Comparison of these indicators against limit reference points in both jurisdictions suggests that Southern Calamari is currently harvested within sustainable limits.
No formal performance indicators are applied in New South Wales or Victoria, apart from reports of trends in production (including effort and catch rates). Commercial landings and catch rates in New South Wales have been relatively stable in recent years. For Victoria, the commercial fishery is characterised by decreasing effort and increasing catch and catch rates. In the Commonwealth, Southern Calamari is considered to be a byproduct species, and little is known about stock structure, biomass or the effects of fishing pressure.
Stock assessments have not been completed, except for an assessment for South Australia up to 2007. Consequently, insufficient information is available to confidently classify the status of Southern Calamari in each jurisdiction. Hence Southern Calamari in each jurisdiction is classified as an undefined stock.
Table 2: Southern Calamari biology4
Longevity and maximum size <1 year; 55 cm dorsal mantle length, 3–4 kg
Maturity (50%) 3–6 months; 15–20 cm dorsal mantle length
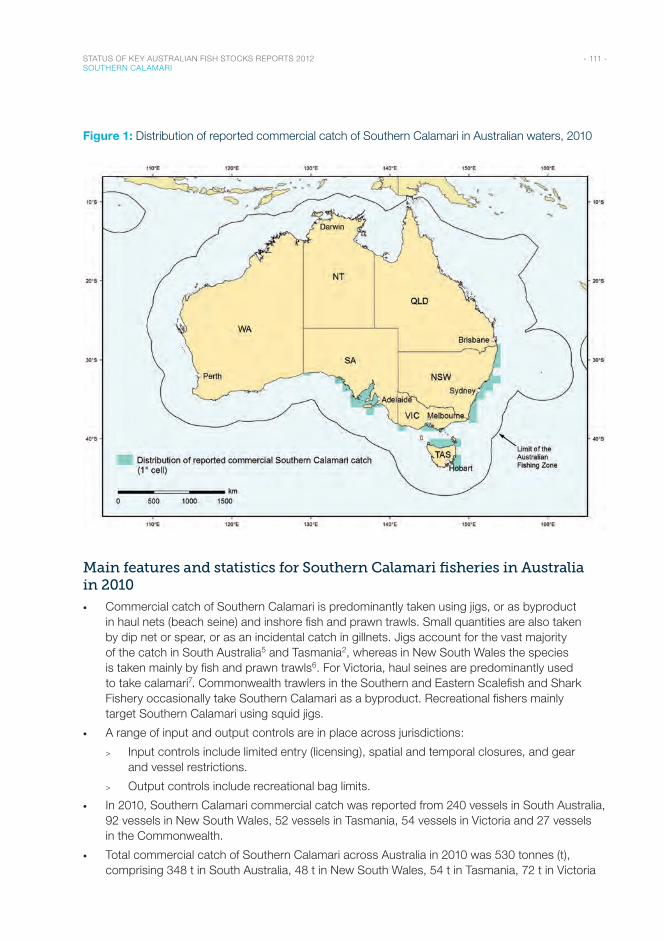
- 111 - STATUS OF KEY AUSTRALIAN FISH STOCKS REPORTS 2012 SOUTHERN CALAMARI
Figure 1: Distribution of reported commercial catch of Southern Calamari in Australian waters, 2010
Main features and statistics for Southern Calamari fisheries in Australia in 2010
• Commercial catch of Southern Calamari is predominantly taken using jigs, or as byproduct in haul nets (beach seine) and inshore fish and prawn trawls. Small quantities are also taken by dip net or spear, or as an incidental catch in gillnets. Jigs account for the vast majority of the catch in South Australia5 and Tasmania2, whereas in New South Wales the species is taken mainly by fish and prawn trawls6. For Victoria, haul seines are predominantly used to take calamari7. Commonwealth trawlers in the Southern and Eastern Scalefish and Shark Fishery occasionally take Southern Calamari as a byproduct. Recreational fishers mainly target Southern Calamari using squid jigs.
• A range of input and output controls are in place across jurisdictions:
> Input controls include limited entry (licensing), spatial and temporal closures, and gear and vessel restrictions.
> Output controls include recreational bag limits.
• In 2010, Southern Calamari commercial catch was reported from 240 vessels in South Australia, 92 vessels in New South Wales, 52 vessels in Tasmania, 54 vessels in Victoria and 27 vessels in the Commonwealth.
• Total commercial catch of Southern Calamari across Australia in 2010 was 530 tonnes (t), comprising 348 t in South Australia, 48 t in New South Wales, 54 t in Tasmania, 72 t in Victoria
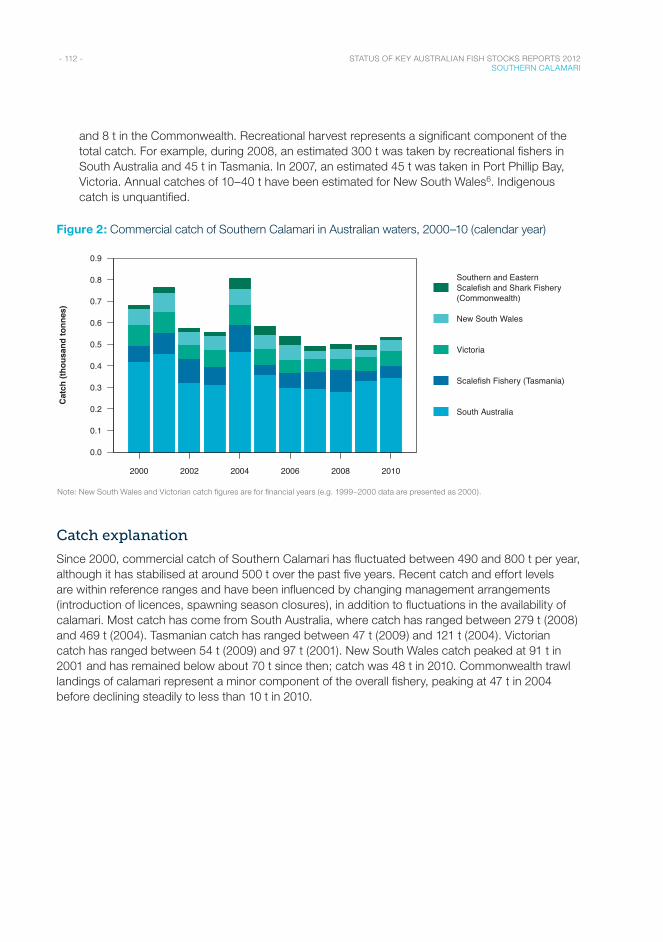
- 112 - STATUS OF KEY AUSTRALIAN FISH STOCKS REPORTS 2012 SOUTHERN CALAMARI
and 8 t in the Commonwealth. Recreational harvest represents a significant component of the total catch. For example, during 2008, an estimated 300 t was taken by recreational fishers in South Australia and 45 t in Tasmania. In 2007, an estimated 45 t was taken in Port Phillip Bay, Victoria. Annual catches of 10–40 t have been estimated for New South Wales6. Indigenous catch is unquantified.
Figure 2: Commercial catch of Southern Calamari in Australian waters, 2000–10 (calendar year)
Year
2000 2002 2004 2006 2008 2010
0.0
0.1
0.2
0.3
0.4
0.5
0.6
0.7
0.8
0.9
Southern and EasternScalefish and Shark Fishery(Commonwealth)
New South Wales
Victoria
Scalefish Fishery (Tasmania)
South Australia
Cat
ch (t
hous
and
tonn
es)
Note: New South Wales and Victorian catch figures are for financial years (e.g. 1999–2000 data are presented as 2000).
Catch explanation
Since 2000, commercial catch of Southern Calamari has fluctuated between 490 and 800 t per year, although it has stabilised at around 500 t over the past five years. Recent catch and effort levels are within reference ranges and have been influenced by changing management arrangements (introduction of licences, spawning season closures), in addition to fluctuations in the availability of calamari. Most catch has come from South Australia, where catch has ranged between 279 t (2008) and 469 t (2004). Tasmanian catch has ranged between 47 t (2009) and 121 t (2004). Victorian catch has ranged between 54 t (2009) and 97 t (2001). New South Wales catch peaked at 91 t in 2001 and has remained below about 70 t since then; catch was 48 t in 2010. Commonwealth trawl landings of calamari represent a minor component of the overall fishery, peaking at 47 t in 2004 before declining steadily to less than 10 t in 2010.
- 113 - STATUS OF KEY AUSTRALIAN FISH STOCKS REPORTS 2012 SOUTHERN CALAMARI
Effects of fishing on the marine environment
• Jigs are the primary method used to fish for Southern Calamari, and have few bycatch or environmental impacts. However, fishing often targets aggregations, which may be spawning. In Tasmania, effort on spawning aggregations is controlled by seasonal spawning area closures2.
Environmental effects on Southern Calamari
• Southern Calamari is highly plastic in its life cycle traits3, and a detailed understanding of the links between environmental factors and growth, reproduction and survival characteristics is a research priority.
• Spawning occurs in shallow inshore waters, with egg mop deposits attached to sea grass, macro-algae and reef substrates8. Environmental pressures on these habitats include the effects of coastal development, marine pollution, ocean warming and changing weather patterns9. These pressures have the potential to influence spawning dynamics and success.
References1. Pecl, GT, Tracey, SR, Danyushevsky, L, Wotherspoon, S & Moltschaniwskyj, NA 2011, Elemental fingerprints of southern
calamari (Sepioteuthis australis) reveal local recruitment sources and allow assessment of the importance of closed areas, Canadian Journal of Fisheries and Aquatic Sciences, 68(8): 1351–1360.
2. Hartmann, K & Lyle, JM 2011, Tasmanian scalefish fishery—2009–10, Institute for Marine and Antarctic Studies Report, University of Tasmania, Hobart.
3. Pecl, GT, Moltschaniwskyj, NA, Tracey, S & Jordan, AR 2004, Inter-annual plasticity of squid life history and population structure: ecological and management implications, Oecologia, 139(4): 515–524.
4. Pecl, GP 2001, Flexible reproductive strategies in tropical and temperate Sepioteuthis squids, Marine Biology, 138: 93–101.
5. Steer, MA, Lloyd, MT & Jackson, WB 2007, Southern calamari (Sepioteuthis australis) fishery, fishery assessment report to PIRSA, SARDI publication F2007/000528-2, South Australian Research and Development Institute, Adelaide.
6. Rowling, KR, Hegarty, AM & Ives, M 2010, Status of fisheries resources in NSW 2008/09, Industry & Investment NSW, Cronulla.
7. Green, CP, Morris, L, Brown, L, Parry, G, Ryan, KL & Conron, S 2012, Victoria’s bay and inlet calamari stock assessment 2008, Fisheries Victoria Internal Report Series no. 24, Victorian Department of Primary Industries, Melbourne.
8. Steer, MA, Moltschaniwskyj, NA & Gowland, FC 2002, Temporal variability in embryonic development and mortality in the southern calamari Sepioteuthis australis: a field assessment, Marine Ecology Progress Series, 243: 143– 150.
9. Hobday, AJ, Poloczanska, ES & Matear, RJ (eds) 2008, Implications of climate change for Australian fisheries and aquaculture: a preliminary assessment, report to the Australian Government Department of Climate Change, Canberra.

Crustaceans
C R U S TA C E A N S A R E A M O N G T H E M O S T W I D E S P R E A D A N D D I V E R S E
G R O U P O F I N V E R T E B R AT E S , I N C L U D I N G C R A B S , B U G S , L O B S T E R S A N D P R A W N S .

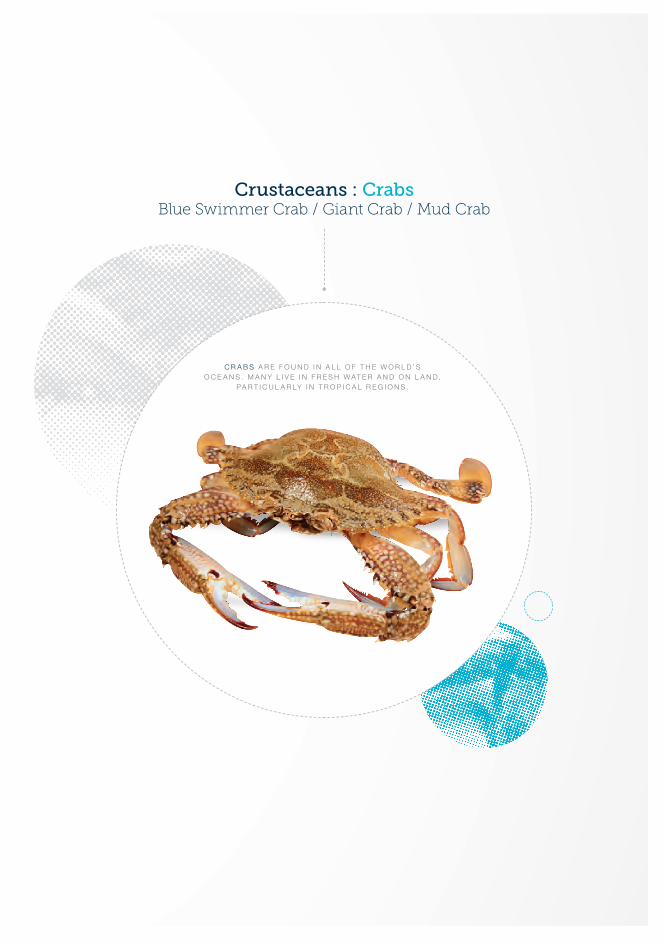
Crustaceans : CrabsBlue Swimmer Crab / Giant Crab / Mud Crab
C R A B S A R E F O U N D I N A L L O F T H E W O R L D ’ S O C E A N S . M A N Y L I V E I N F R E S H W AT E R A N D O N L A N D ,
PA R T I C U L A R LY I N T R O P I C A L R E G I O N S .
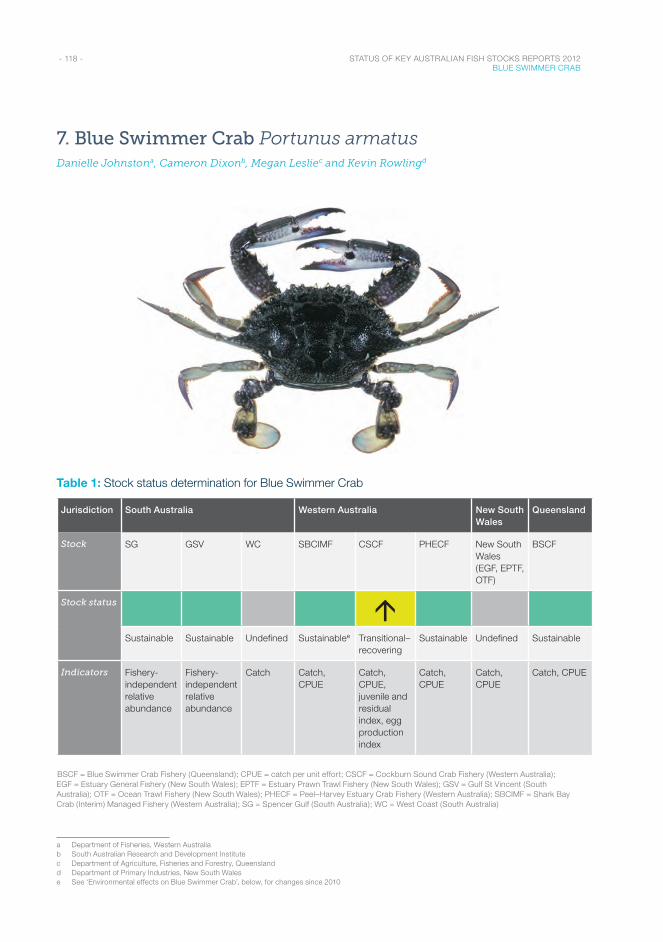
- 118 - STATUS OF KEY AUSTRALIAN FISH STOCKS REPORTS 2012 BLUE SWIMMER CRAB
7. Blue Swimmer Crab Portunus armatus Danielle Johnstona, Cameron Dixonb, Megan Lesliec and Kevin Rowlingd
Table 1: Stock status determination for Blue Swimmer Crab e
Jurisdiction South Australia Western Australia New South Wales
Queensland
Stock SG GSV WC SBCIMF CSCF PHECF New South Wales (EGF, EPTF, OTF)
BSCF
Stock status áSustainable Sustainable Undefined Sustainablee Transitional–
recoveringSustainable Undefined Sustainable
Indicators Fishery- independent relative abundance
Fishery- independent relative abundance
Catch Catch, CPUE
Catch, CPUE, juvenile and residual index, egg production index
Catch, CPUE
Catch, CPUE
Catch, CPUE
BSCF = Blue Swimmer Crab Fishery (Queensland); CPUE = catch per unit effort; CSCF = Cockburn Sound Crab Fishery (Western Australia); EGF = Estuary General Fishery (New South Wales); EPTF = Estuary Prawn Trawl Fishery (New South Wales); GSV = Gulf St Vincent (South Australia); OTF = Ocean Trawl Fishery (New South Wales); PHECF = Peel–Harvey Estuary Crab Fishery (Western Australia); SBCIMF = Shark Bay Crab (Interim) Managed Fishery (Western Australia); SG = Spencer Gulf (South Australia); WC = West Coast (South Australia)
a Department of Fisheries, Western Australiab South Australian Research and Development Institutec Department of Agriculture, Fisheries and Forestry, Queenslandd Department of Primary Industries, New South Walese See ‘Environmental effects on Blue Swimmer Crab’, below, for changes since 2010
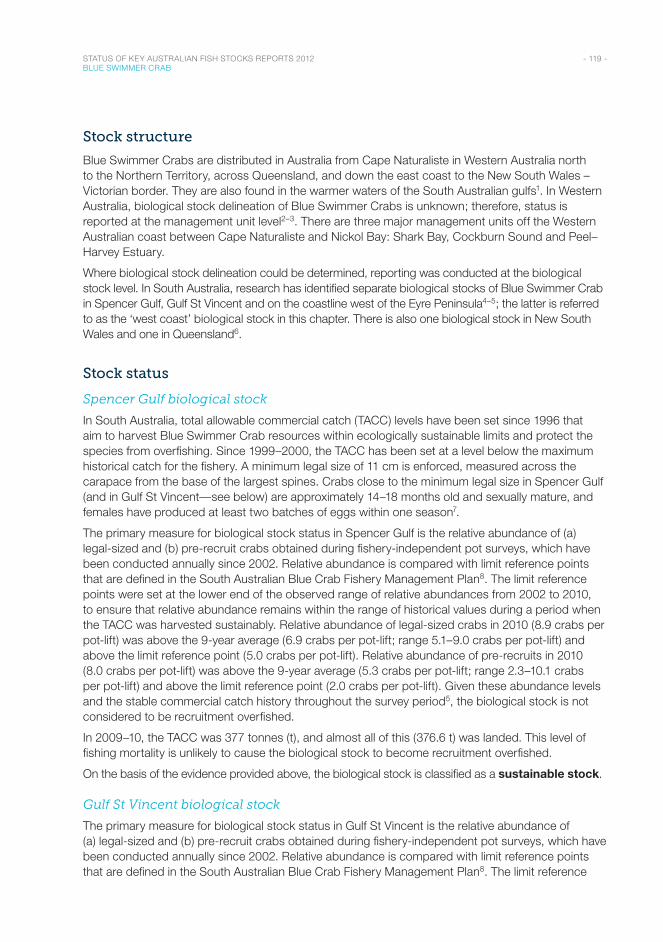
- 119 - STATUS OF KEY AUSTRALIAN FISH STOCKS REPORTS 2012 BLUE SWIMMER CRAB
Stock structure
Blue Swimmer Crabs are distributed in Australia from Cape Naturaliste in Western Australia north to the Northern Territory, across Queensland, and down the east coast to the New South Wales – Victorian border. They are also found in the warmer waters of the South Australian gulfs1. In Western Australia, biological stock delineation of Blue Swimmer Crabs is unknown; therefore, status is reported at the management unit level2–3. There are three major management units off the Western Australian coast between Cape Naturaliste and Nickol Bay: Shark Bay, Cockburn Sound and Peel–Harvey Estuary.
Where biological stock delineation could be determined, reporting was conducted at the biological stock level. In South Australia, research has identified separate biological stocks of Blue Swimmer Crab in Spencer Gulf, Gulf St Vincent and on the coastline west of the Eyre Peninsula4–5; the latter is referred to as the ‘west coast’ biological stock in this chapter. There is also one biological stock in New South Wales and one in Queensland6.
Stock status
Spencer Gulf biological stock
In South Australia, total allowable commercial catch (TACC) levels have been set since 1996 that aim to harvest Blue Swimmer Crab resources within ecologically sustainable limits and protect the species from overfishing. Since 1999–2000, the TACC has been set at a level below the maximum historical catch for the fishery. A minimum legal size of 11 cm is enforced, measured across the carapace from the base of the largest spines. Crabs close to the minimum legal size in Spencer Gulf (and in Gulf St Vincent—see below) are approximately 14–18 months old and sexually mature, and females have produced at least two batches of eggs within one season7.
The primary measure for biological stock status in Spencer Gulf is the relative abundance of (a) legal-sized and (b) pre-recruit crabs obtained during fishery-independent pot surveys, which have been conducted annually since 2002. Relative abundance is compared with limit reference points that are defined in the South Australian Blue Crab Fishery Management Plan8. The limit reference points were set at the lower end of the observed range of relative abundances from 2002 to 2010, to ensure that relative abundance remains within the range of historical values during a period when the TACC was harvested sustainably. Relative abundance of legal-sized crabs in 2010 (8.9 crabs per pot-lift) was above the 9-year average (6.9 crabs per pot-lift; range 5.1–9.0 crabs per pot-lift) and above the limit reference point (5.0 crabs per pot-lift). Relative abundance of pre-recruits in 2010 (8.0 crabs per pot-lift) was above the 9-year average (5.3 crabs per pot-lift; range 2.3–10.1 crabs per pot-lift) and above the limit reference point (2.0 crabs per pot-lift). Given these abundance levels and the stable commercial catch history throughout the survey period5, the biological stock is not considered to be recruitment overfished.
In 2009–10, the TACC was 377 tonnes (t), and almost all of this (376.6 t) was landed. This level of fishing mortality is unlikely to cause the biological stock to become recruitment overfished.
On the basis of the evidence provided above, the biological stock is classified as a sustainable stock.
Gulf St Vincent biological stock
The primary measure for biological stock status in Gulf St Vincent is the relative abundance of (a) legal-sized and (b) pre-recruit crabs obtained during fishery-independent pot surveys, which have been conducted annually since 2002. Relative abundance is compared with limit reference points that are defined in the South Australian Blue Crab Fishery Management Plan8. The limit reference
- 120 - STATUS OF KEY AUSTRALIAN FISH STOCKS REPORTS 2012 BLUE SWIMMER CRAB
points were set at the lower end of the observed range of relative abundances from 2002 to 2010, to ensure that relative abundance remains within the range of historical values during a period when the TACC was harvested sustainably. Relative abundance of legal-sized crabs in 2010 (3.1 crabs per pot-lift) was close to the 9-year average (3.2 crabs per pot-lift; range 1.6–4.7 crabs per pot-lift) and above the limit reference point (1.5 crabs per pot-lift). Relative abundance of pre-recruits in 2010 (7.3 crabs per pot-lift) was well above the 9-year average (4.4 crabs per pot-lift; range 0.4–10.7 crabs per pot-lift) and the limit reference point (1.5 crabs per pot-lift). Given these abundance levels and the stable commercial catch history throughout the survey period5, the biological stock is not considered to be recruitment overfished.
In 2009–10, the TACC was 241.9 t, and only 158.5 t (66 per cent) was landed. This level of fishing mortality is unlikely to cause the biological stock to become recruitment overfished.
On the basis of the evidence provided above, the biological stock is classified as a sustainable stock.
West coast biological stock
Blue Swimmer Crabs are captured in low quantities (generally <50 t annually) on the west coast, as part of the Marine Scalefish Fishery. Fishers target a range of species, and effort patterns generally reflect changes in seasonal abundance of the species captured and their market prices. As for the gulf fisheries, a minimum legal size of 11 cm is enforced, under the assumption that growth rates and size at sexual maturity are similar for the west coast. Given these circumstances, it is unlikely that the west coast Blue Swimmer Crab biological stock is recruitment overfished. However, insufficient information is available to confidently classify the status of this biological stock.
On the basis of the evidence provided above, the biological stock is classified as an undefined stock.
Shark Bay Crab (Interim) Managed Fishery (Western Australia) management unit
The fishery for Blue Swimmer Crab in Shark Bay has expanded over the past 10 years to become Australia’s highest producing Blue Swimmer Crab fishery. In 2010, commercial landings of Blue Swimmer Crab from the trap sector of the fishery and as byproduct of the prawn trawl fishery totalled 828 t. This is an increase of 1 per cent over the 2009 season9. Despite this increased catch, the mean annual catch per unit effort (CPUE) since 2001 has shown no clear trend, ranging between 1.4 and 1.8 kg/pot-lift. In 2010, it was 1.5 kg/pot-lift, which is well above the management threshold value of 1.0 kg/pot-lift. The management unit is not considered to be recruitment overfished.
Male Blue Swimmer Crabs in Shark Bay become sexually mature at 11.5 cm carapace width, whereas females become sexually mature below 10 cm carapace width. The commercial minimum size of 13.5 cm carapace width should ensure adequate egg production for Blue Swimmer Crab stocks under typical environmental conditions. It should also ensure that female Blue Swimmer Crabs are exposed to negligible fishing pressure and have an opportunity to breed before they recruit into the fishery. The protection offered by minimum size limits ensures that fishing mortality is unlikely to cause the management unit to become recruitment overfished.
On the basis of the evidence provided above, the management unit is classified as a sustainable stock.
Cockburn Sound Crab Fishery (Western Australia) management unit
Historically, variations in recruitment in Cockburn Sound have largely depended on environmental conditions, which have resulted in large fluctuations in both stock abundance and the annual commercial catch10. A shift by commercial fishers from using set nets to using traps in the mid-1990s resulted in a marked increase in mean annual crab landings. Following a series of high catches in the late 1990s (250–350 t), the catch declined significantly11–12. Fishery-independent surveys indicated
- 121 - STATUS OF KEY AUSTRALIAN FISH STOCKS REPORTS 2012 BLUE SWIMMER CRAB
that low recruitment was generated by high fishing pressure combined with poor environmental conditions, which reduced the spawning stock to low levels and required closure of the fishery in December 200611–12. Recovery of the spawning stock and subsequent recruitment were slower than expected; fishery-independent trawl surveys indicated that the strength of recruitment and spawning stock biomass did not improve sufficiently to reopen the fishery until December 20099. The fishing season for 2010 was restricted to 3.5 months to ensure that the catch level and catch composition were consistent with enabling continued recovery of the spawning stock biomass. The catch levels and season length in future years will continue to be based on survey results, to ensure that the level of fishing mortality is such that the management unit can continue to recover from its recruitment overfished state.
On the basis of the evidence provided above, the management unit is classified as a transitional–recovering stock.
Peel–Harvey Estuary Crab Fishery (Western Australia) management unit
Commercial catch levels have been in the range of 50–90 t annually. A recreational survey in the Peel–Harvey Estuary during 2007–08 estimated that the recreational catch accounted for an additional 110–180 t—approximately 60–70 per cent of the total catch9. The commercial effort has been stable for the past 14 years, and CPUE over this period has varied between 0.9 and 1.5 kg/pot-lift, with no overall upward or downward trend. In 2010, CPUE was 1.17 kg/pot-lift9. The management unit is not considered to be recruitment overfished.
The breeding stock in this region is protected by the setting of legal minimum size limits (12.7–13.0 cm carapace width) well above the size-at-maturity (8.6–9.8 cm carapace width) and restricted effort levels in the commercial fishery. Additionally, spawning occurs outside the estuary following flushing of crabs from the estuary during winter, providing the spawning stock with added spatial protection, since the stock is not targeted outside the estuary. The protection offered by minimum size limits ensures that fishing mortality is unlikely to cause the management unit to become recruitment overfished.
On the basis of the evidence provided above, the management unit is classified as a sustainable stock.
New South Wales biological stock
Blue Swimmer Crabs occur in coastal and estuarine waters along the length of the New South Wales coastline. Recreational landings are not well documented but are thought to be significant, and occur throughout the range. Five estuaries account for 95 per cent of commercial landings (the most important being Wallis Lake). Commercial landings and catch rates from crab potting have declined in recent years; the reasons for these declines are being investigated. Recreational landings are likely to be greater than commercial catch, but no recent estimates are available.
Insufficient information is available to confidently classify the status of this biological stock; as a result, the biological stock is classified as an undefined stock.
Queensland Blue Swimmer Crab biological stock
Blue Swimmer Crabs are found in coastal and estuarine waters along the entire Queensland coast, but are fished mainly in the southern part of Queensland. Since 2003, the CPUE of commercial pot harvest has been relatively stable (approximately 45 kg/day), and did not trigger the annual limit reference point in 2010. CPUE of commercial trawl harvest has also remained relatively stable since 2000 (approximately 6.5 kg/day)13. The biological stock is unlikely to be recruitment overfished.
Temporary and permanent spatial closures within the Great Barrier Reef Marine Park ensure that a substantial proportion of the Blue Swimmer Crab biomass is protected from depletion. Additionally,
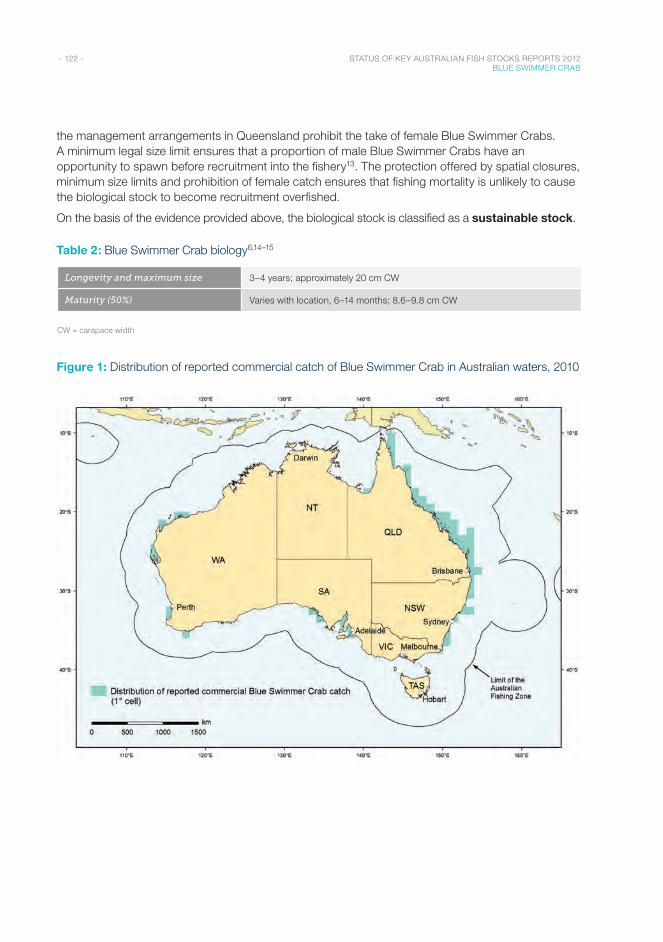
- 122 - STATUS OF KEY AUSTRALIAN FISH STOCKS REPORTS 2012 BLUE SWIMMER CRAB
the management arrangements in Queensland prohibit the take of female Blue Swimmer Crabs. A minimum legal size limit ensures that a proportion of male Blue Swimmer Crabs have an opportunity to spawn before recruitment into the fishery13. The protection offered by spatial closures, minimum size limits and prohibition of female catch ensures that fishing mortality is unlikely to cause the biological stock to become recruitment overfished.
On the basis of the evidence provided above, the biological stock is classified as a sustainable stock.
Table 2: Blue Swimmer Crab biology6,14–15
Longevity and maximum size 3–4 years; approximately 20 cm CW
Maturity (50%) Varies with location, 6–14 months; 8.6–9.8 cm CW
CW = carapace width
Figure 1: Distribution of reported commercial catch of Blue Swimmer Crab in Australian waters, 2010
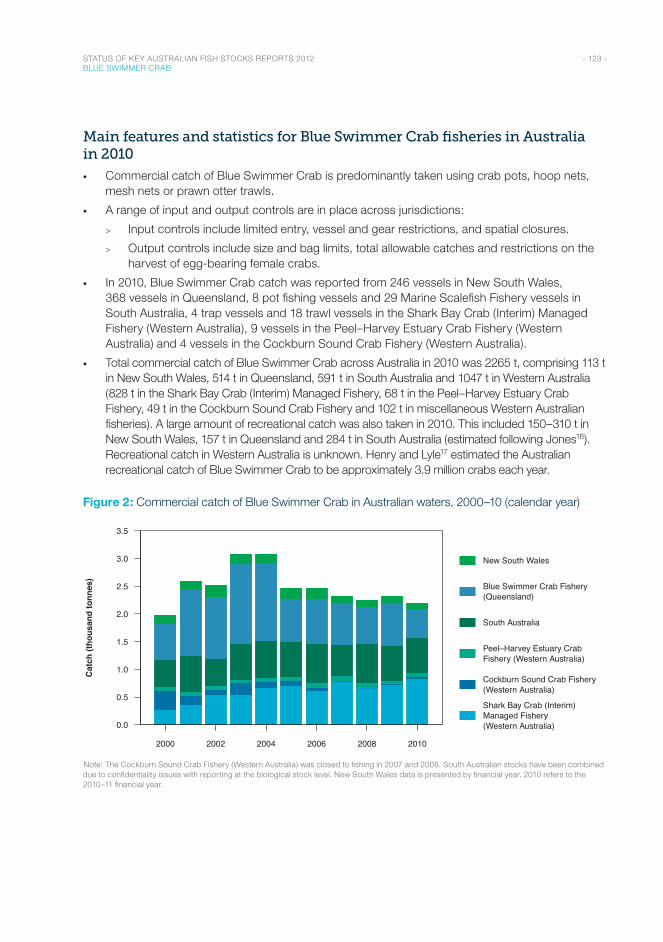
- 123 - STATUS OF KEY AUSTRALIAN FISH STOCKS REPORTS 2012 BLUE SWIMMER CRAB
Main features and statistics for Blue Swimmer Crab fisheries in Australia in 2010
• Commercial catch of Blue Swimmer Crab is predominantly taken using crab pots, hoop nets, mesh nets or prawn otter trawls.
• A range of input and output controls are in place across jurisdictions:
> Input controls include limited entry, vessel and gear restrictions, and spatial closures.
> Output controls include size and bag limits, total allowable catches and restrictions on the harvest of egg-bearing female crabs.
• In 2010, Blue Swimmer Crab catch was reported from 246 vessels in New South Wales, 368 vessels in Queensland, 8 pot fishing vessels and 29 Marine Scalefish Fishery vessels in South Australia, 4 trap vessels and 18 trawl vessels in the Shark Bay Crab (Interim) Managed Fishery (Western Australia), 9 vessels in the Peel–Harvey Estuary Crab Fishery (Western Australia) and 4 vessels in the Cockburn Sound Crab Fishery (Western Australia).
• Total commercial catch of Blue Swimmer Crab across Australia in 2010 was 2265 t, comprising 113 t in New South Wales, 514 t in Queensland, 591 t in South Australia and 1047 t in Western Australia (828 t in the Shark Bay Crab (Interim) Managed Fishery, 68 t in the Peel–Harvey Estuary Crab Fishery, 49 t in the Cockburn Sound Crab Fishery and 102 t in miscellaneous Western Australian fisheries). A large amount of recreational catch was also taken in 2010. This included 150–310 t in New South Wales, 157 t in Queensland and 284 t in South Australia (estimated following Jones16). Recreational catch in Western Australia is unknown. Henry and Lyle17 estimated the Australian recreational catch of Blue Swimmer Crab to be approximately 3.9 million crabs each year.
Figure 2: Commercial catch of Blue Swimmer Crab in Australian waters, 2000–10 (calendar year)
Year
2000 2002 2004 2006 2008 2010
0.0
0.5
1.0
1.5
2.0
2.5
3.0
3.5
New South Wales
Blue Swimmer Crab Fishery(Queensland)
South Australia
Peel–Harvey Estuary CrabFishery (Western Australia)
Cockburn Sound Crab Fishery(Western Australia)
Shark Bay Crab (Interim)Managed Fishery(Western Australia)
Cat
ch (t
hous
and
tonn
es)
Note: The Cockburn Sound Crab Fishery (Western Australia) was closed to fishing in 2007 and 2008. South Australian stocks have been combined due to confidentiality issues with reporting at the biological stock level. New South Wales data is presented by financial year. 2010 refers to the 2010–11 financial year.
- 124 - STATUS OF KEY AUSTRALIAN FISH STOCKS REPORTS 2012 BLUE SWIMMER CRAB
Catch explanation
In New South Wales, annual commercial landings of Blue Swimmer Crab were relatively stable, at 150–200 t, from the 1970s until 2007–08. Since then, reported landings have been about 100 t per year. Since 2000, significant changes have taken place in the management of New South Wales estuarine commercial fisheries, following the creation of a number of ‘recreational only’ fishing areas, and the number of fishers licensed in the Estuary General Fishery (New South Wales) has declined as a result of the associated buyback of licences. Recreational landings of Blue Swimmer Crabs are now likely to be greater than commercial landings and are estimated to be 150–310 t per year18.
In Queensland, the fishery is predominantly a commercial fishery, with 82 per cent of the total harvest taken by commercial fishers in 2009 (based on a 2005 recreational catch estimate)19. The reported commercial catch was highest between 2001 and 2004, and both the catch and the number of fishing days decreased in 2005. The catch was relatively stable until 2010, when the annual reported commercial pot catch of Blue Swimmer Crabs decreased, from 717 t in 2009 to 514 t in 201013. The number of active pot licences in the fishery decreased from 180 in 2009 to 145 in 2010, and fishing effort days decreased by 2800 days from 2009 to 2010.
Catches from the west coast of South Australia ranged from 9 to 56 t between 2000 and 2010. Commercial catches from Spencer Gulf (South Australia) and Gulf St Vincent (South Australia) increased annually from 1983–84 to 1995–96 before the introduction of a TACC. The TACC was initially set at 520 t for the 1996–97 fishing season, representing a 29 per cent decrease in the catch. Over the next four seasons, the TACC gradually increased until it reached 626.8 t in 2000–01, where it has remained since. The TACC was not fully caught until 2007–08, mainly because of quota being held and not caught by less efficient hoop-net fishers. Currently, pot fishers hold 99.9 per cent of the TACC in Spencer Gulf (South Australia) and Gulf St Vincent (South Australia).
In Western Australia, the recent catches in the Cockburn Sound Crab Fishery have been low because of management actions (fishery closures) to rebuild the stock in this region. The annual catch in the Peel–Harvey Estuary Crab Fishery (Western Australia) had been slowly increasing from 50 t to 90 t since 2000, but in the past two years it has declined due to a relatively higher proportion of undersized crabs and low body weights of legal-sized crabs. The annual catch in the Shark Bay Crab (Interim) Managed Fishery (Western Australia) has increased from 500 t to more than 800 t over the past five years, as the level of retention of crabs by the trawl fleet has increased in response to improvements in markets and prices.
Effects of fishing on the marine environment
• Since the commercial catch of crabs generally represents a relatively small proportion of the biomass, these fisheries are unlikely to have significant impacts on the food chain.
• Fishing with traps results in limited habitat disturbance, since it is generally conducted over sand habitats, which are resilient.
• Although part of the Blue Swimmer Crab catch in the Shark Bay Crab (Interim) Managed Fishery is harvested during otter trawling operations for prawn in Shark Bay, Western Australia, this activity is highly regulated and restricted to a small proportion of the area.
Environmental effects on Blue Swimmer Crab
• In South Australia, proposed marine park boundaries are likely to overlap with a small proportion of Blue Swimmer Crab fishing habitat. This is likely to protect a portion of the biological stock but may increase the intensity of fishing in other areas.
- 125 - STATUS OF KEY AUSTRALIAN FISH STOCKS REPORTS 2012 BLUE SWIMMER CRAB
• There is some evidence to suggest that the distribution of Blue Swimmer Crabs is extending further south in both of South Australia’s gulfs5. It is possible that this is related to climate change.
• Climate change impacts on Western Australian crab stocks need further investigation. In particular, the extreme marine heatwave event of the summer of 2010–11 and its effect on juvenile and adult stocks require further study. Record high water temperatures (4.5 °C above average20) and flooding events were experienced in Shark Bay and may have affected spawning and survival of adult crabs. Recent surveys in late 2011 and 2012 have identified a significant stock decline, which will require substantial management adjustments.
References1. Kailola, PJ, Williams, MJ, Stewart, PC, Reichelt, RE, McNee, A & Grieve, C 1993, Australian fisheries resources, Bureau of
Resource Sciences & the Fisheries Research and Development Corporation, Canberra.
2. Chaplin, JA & Sezmis, E 2008, A genetic assessment of the relationships among the assemblages of the blue swimmer crab, Portunus pelagicus, in Cockburn Sound, the Swan River Estuary and Warnbro Sound, final report for the Western Australian Department of Fisheries, Centre for Fish and Fisheries Research, Murdoch University.
3. Chaplin, J, Yap, ES, Sezmis, E & Potter, IC 2001, Genetic (microsatellite) determination of the stock structure of the blue swimmer crab in Australia, report to the Fisheries Research and Development Corporation, FRDC project 98/118, Centre for Fish and Fisheries Research, Murdoch University.
4. Bryars, S & Adams, M 1999, An allozyme study of the blue swimmer crab, Portunus pelagicus (Crustacea: Portunidae), in Australia: stock delineation in southern Australia and evidence for a cryptic species in northern waters, Marine and Freshwater Research, 50: 15–26.
5. Dixon, CD & Hooper, GE 2011, Blue crab Portunus armatus fishery (2009/10), stock assessment report to PIRSA Fisheries and Aquaculture by the South Australian Research and Development Institute (Aquatic Sciences), SARDI publication F2007/000729-7, SARDI Research Report Series no. 531, SARDI, Adelaide.
6. Sumpton, W, Gaddes, S, McLennan, M, Campbell, M, Tonks, M, Good, N & Hagedoorn, W 2003, Fisheries biology and assessment of the blue swimmer crab (Portunus pelagicus) in Queensland, FRDC project 98/117, Queensland Department of Primary Industries & the Fisheries Research and Development Corporation, Brisbane.
7. Kumar, M, Xiao, Y, Venema, S & Hooper, G 2003, Reproductive cycle of the blue swimmer crab, Portunus pelagicus, off southern Australia, Journal of the Marine Biological Association of the United Kingdom, 83(5): 983–994.
8. Primary Industries and Regions South Australia 2012, Management plan for the South Australian commercial blue crab fishery, South Australian Fisheries Management Series, paper 58, PIRSA, Adelaide.
9. Fletcher, WJ & Santoro, K (eds) 2011, State of the fisheries and aquatic resources report 2010/11, Western Australian Department of Fisheries, Perth.
10. de Lestang, S, Bellchambers LM, Caputi N, Thomson, AW, Pember, MB, Johnston, DJ & Harris, DC 2010, Stock-recruitment-environment relationship in a Portunus pelagicus fishery in Western Australia, in GH Kruse, GL Eckert, RJ Foy, RN Lipcius, B Sainte-Marie, DL Stram & D Woodby (eds), Biology and management of exploited crab populations under climate change, Alaska Sea Grant, University of Alaska Fairbanks, Fairbanks.
11. Johnston, DJ, Harris, D, Caputi, N & Thomson, P 2011, Decline of a blue swimmer crab (Portunus pelagicus) fishery in Western Australia—history, contributing factors and future management strategy, Fisheries Research, 109(1): 119–130.
12. Johnston, D, Harris, D, Caputi, N, de Lestang, S & Thomson, A 2011, Status of the Cockburn Sound Crab Fishery, Fisheries Research Report no. 219, Western Australian Department of Fisheries, North Beach.
13. Queensland Department of Employment, Economic Development and Innovation 2011, Annual status report 2011: Blue Swimmer Crab Fishery, DEEDI, Brisbane.
14. de Lestang, S, Hall, NG & Potter, IC 2003, Reproductive biology of the blue swimmer crab, Portunus pelagicus (Decapoda: Portunidae) in five water bodies on the west coast of Australia, Fishery Bulletin, 101: 745–757.
15. de Lestang, S, Hall, NG & Potter, IC 2003, Do the age compositions and growth of the crab Portunus pelagicus in marine embayments and estuaries differ?, Journal of the Marine Biological Association of the United Kingdom, 83: 1–8.
16. Jones, K 2009, South Australian recreational fishing survey, South Australian Fisheries Management Series, paper 54, Primary Industries and Resources of South Australia Fisheries, Adelaide.
17. Henry, GW & Lyle, JM 2003 (eds), The national recreational and Indigenous fishing survey, Fisheries Research and Development Corporation project 1999/158, Australian Government Department of Agriculture, Fisheries and Forestry, Canberra, http://eprints.utas.edu.au/2526/1/Henry_Lyle_Nationalsurvey.pdf.
18. Rowling, K, Hegarty, A & Ives, M (eds) 2010, Blue swimmer crab (Portunus pelagicus), in Status of fishery resources in NSW 2008/09, Industry & Investment NSW, Cronulla, 39–42.
19. McInnes, K 2008, Experimental results from the fourth Queensland recreational fishing diary program (2005), Queensland Department of Primary Industries and Fisheries, Brisbane.
20. Pearce, A, Lenanton, G, Jackson, J, Moore, J, Feng, M & Gaughan, D 2011, The ‘marine heat wave’ off Western Australia during the summer of 2010/11, Fisheries Research Report 22, Western Australian Department of Fisheries, North Beach.
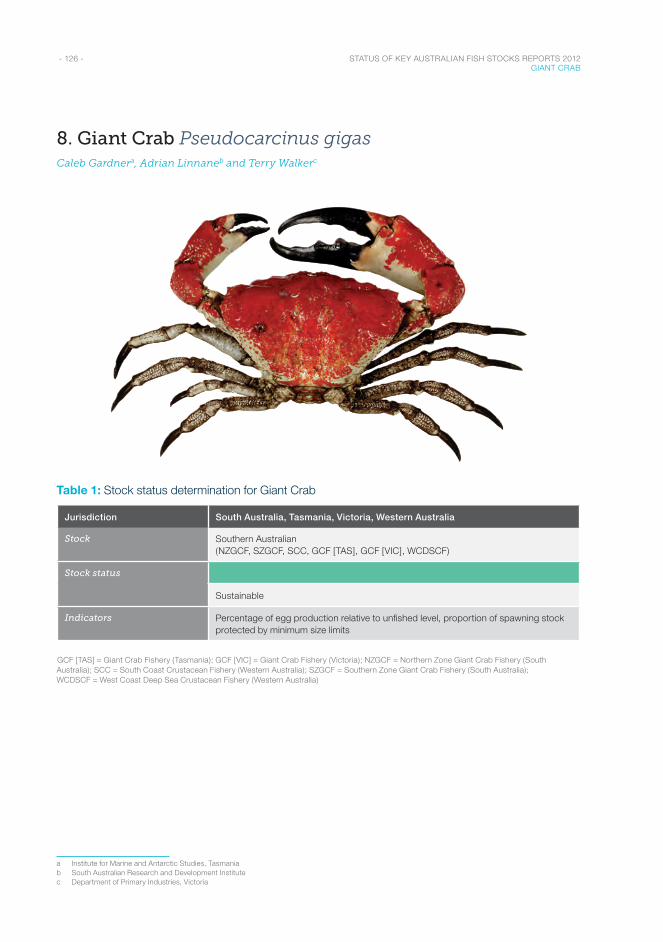
- 126 - STATUS OF KEY AUSTRALIAN FISH STOCKS REPORTS 2012 GIANT CRAB
8. Giant Crab Pseudocarcinus gigasCaleb Gardnera, Adrian Linnaneb and Terry Walkerc
Table 1: Stock status determination for Giant Crab
Jurisdiction South Australia, Tasmania, Victoria, Western Australia
Stock Southern Australian (NZGCF, SZGCF, SCC, GCF [TAS], GCF [VIC], WCDSCF)
Stock status
Sustainable
Indicators Percentage of egg production relative to unfished level, proportion of spawning stock protected by minimum size limits
GCF [TAS] = Giant Crab Fishery (Tasmania); GCF [VIC] = Giant Crab Fishery (Victoria); NZGCF = Northern Zone Giant Crab Fishery (South Australia); SCC = South Coast Crustacean Fishery (Western Australia); SZGCF = Southern Zone Giant Crab Fishery (South Australia); WCDSCF = West Coast Deep Sea Crustacean Fishery (Western Australia)
a Institute for Marine and Antarctic Studies, Tasmaniab South Australian Research and Development Institutec Department of Primary Industries, Victoria
- 127 - STATUS OF KEY AUSTRALIAN FISH STOCKS REPORTS 2012 GIANT CRAB
Stock structure
Giant crab, from Western Australia to Tasmania, is considered a single biological stock because the species occurs in a continuous distribution across this range. The larval duration is around 50 days, with larval release occurring along the edge of the continental shelf. The shelf is a high-current area, facilitating dispersal. Oceanographic modelling has indicated that Giant Crab dispersal occurs over large spatial scales1–3.
Stock status
Southern Australian biological stock
This cross-jurisdictional biological stock has components in Tasmania, Western Australia, South Australia and Victoria. Each jurisdiction assesses that part of the biological stock that occurs in its waters. The status presented here for the entire biological stock has been established using evidence from all four jurisdictions.
For the Tasmanian part of the biological stock (where most of the commercial catch is taken), a length-based model has been developed to estimate annual levels of biomass and egg production; the model is based on data that include catch-and-effort data from commercial fisheries4. The assessment estimated that egg production is stable at 19 per cent of unfished levels5, which is conservative relative to benchmarks in similar crustacean fisheries6. Hence, this part of the biological stock is not considered to be recruitment overfished.
The total allowable commercial catch (TACC) for the Tasmanian part of the biological stock has been reduced from 104 tonnes (t) in 2003–04 to 47 t in 2012–13, with the objective of increasing abundance and catch rates. In the 2010–11 quota year (March to February), only 90 per cent of the TACC was taken. Commercial catch has been below the TACC since at least 2005–06. This level of fishing mortality is unlikely to cause this part of the biological stock to become recruitment overfished.
For the remainder of the biological stock, commercial catch is relatively low (a total of 35 t in 2010–11) and comes from across the continental shelf break, from Albany (Western Australia) to eastern Victoria. Across this broad region, commercial catch rates provide an indication of the status of the legal-sized portion of the biological stock (but not the total biological stock); the commercial catch rate is stable in South Australia7 but falling in Victoria8. Management of fishing mortality in this broader area is through both a TACC and use of legal minimum lengths to protect the abundance of mature undersize crabs. Male and female Giant Crabs reach maturity below the 15 cm size limit applied across this region9. The legal minimum lengths aim to ensure that egg production remains at least 40 per cent of the unfished levels10. This is a more conservative measure than applied in the Tasmanian fishery because of the data constraints. The non-Tasmanian part of the biological stock is not considered to be recruitment overfished, and current levels of fishing mortality are unlikely to cause this part of the biological stock to become recruitment overfished.
On the basis of the evidence provided above, the biological stock is classified as a sustainable stock.
Table 2: Giant Crab biology1–3,10
Longevity and maximum size 30+ years; >20 cm CL; ~10 kg
Maturity (50%) 12.5–14 cm CL, depending on region
CL = carapace length
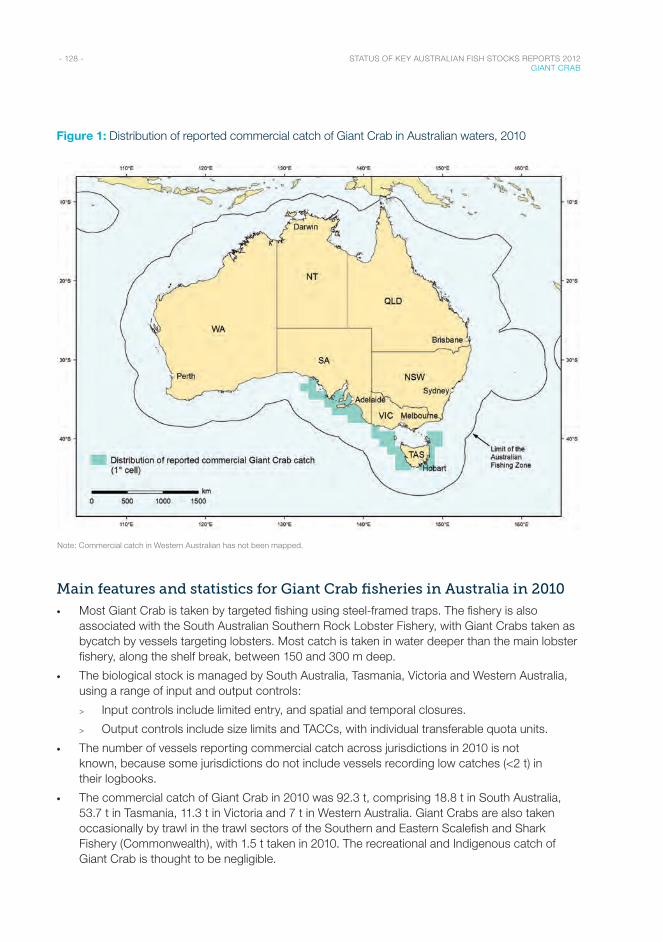
- 128 - STATUS OF KEY AUSTRALIAN FISH STOCKS REPORTS 2012 GIANT CRAB
Figure 1: Distribution of reported commercial catch of Giant Crab in Australian waters, 2010
Note: Commercial catch in Western Australian has not been mapped.
Main features and statistics for Giant Crab fisheries in Australia in 2010
• Most Giant Crab is taken by targeted fishing using steel-framed traps. The fishery is also associated with the South Australian Southern Rock Lobster Fishery, with Giant Crabs taken as bycatch by vessels targeting lobsters. Most catch is taken in water deeper than the main lobster fishery, along the shelf break, between 150 and 300 m deep.
• The biological stock is managed by South Australia, Tasmania, Victoria and Western Australia, using a range of input and output controls:
> Input controls include limited entry, and spatial and temporal closures.
> Output controls include size limits and TACCs, with individual transferable quota units.
• The number of vessels reporting commercial catch across jurisdictions in 2010 is not known, because some jurisdictions do not include vessels recording low catches (<2 t) in their logbooks.
• The commercial catch of Giant Crab in 2010 was 92.3 t, comprising 18.8 t in South Australia, 53.7 t in Tasmania, 11.3 t in Victoria and 7 t in Western Australia. Giant Crabs are also taken occasionally by trawl in the trawl sectors of the Southern and Eastern Scalefish and Shark Fishery (Commonwealth), with 1.5 t taken in 2010. The recreational and Indigenous catch of Giant Crab is thought to be negligible.
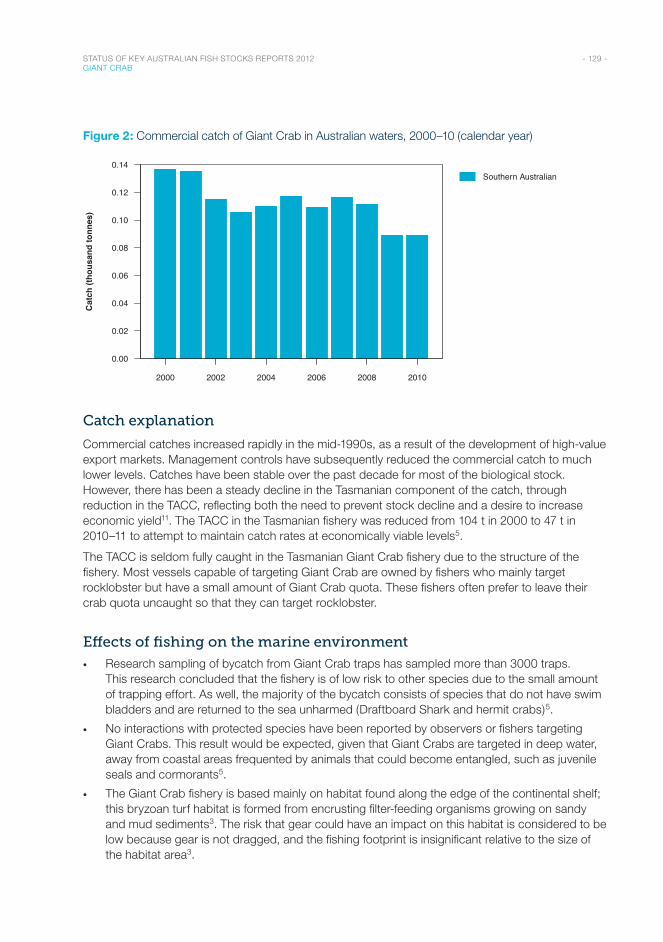
- 129 - STATUS OF KEY AUSTRALIAN FISH STOCKS REPORTS 2012 GIANT CRAB
Figure 2: Commercial catch of Giant Crab in Australian waters, 2000–10 (calendar year)
Year
2000 2002 2004 2006 2008 2010
0.00
0.02
0.04
0.06
0.08
0.10
0.12
0.14Southern Australian
Cat
ch (t
hous
and
tonn
es)
Catch explanation
Commercial catches increased rapidly in the mid-1990s, as a result of the development of high-value export markets. Management controls have subsequently reduced the commercial catch to much lower levels. Catches have been stable over the past decade for most of the biological stock. However, there has been a steady decline in the Tasmanian component of the catch, through reduction in the TACC, reflecting both the need to prevent stock decline and a desire to increase economic yield11. The TACC in the Tasmanian fishery was reduced from 104 t in 2000 to 47 t in 2010–11 to attempt to maintain catch rates at economically viable levels5.
The TACC is seldom fully caught in the Tasmanian Giant Crab fishery due to the structure of the fishery. Most vessels capable of targeting Giant Crab are owned by fishers who mainly target rocklobster but have a small amount of Giant Crab quota. These fishers often prefer to leave their crab quota uncaught so that they can target rocklobster.
Effects of fishing on the marine environment
• Research sampling of bycatch from Giant Crab traps has sampled more than 3000 traps. This research concluded that the fishery is of low risk to other species due to the small amount of trapping effort. As well, the majority of the bycatch consists of species that do not have swim bladders and are returned to the sea unharmed (Draftboard Shark and hermit crabs)5.
• No interactions with protected species have been reported by observers or fishers targeting Giant Crabs. This result would be expected, given that Giant Crabs are targeted in deep water, away from coastal areas frequented by animals that could become entangled, such as juvenile seals and cormorants5.
• The Giant Crab fishery is based mainly on habitat found along the edge of the continental shelf; this bryzoan turf habitat is formed from encrusting filter-feeding organisms growing on sandy and mud sediments3. The risk that gear could have an impact on this habitat is considered to be low because gear is not dragged, and the fishing footprint is insignificant relative to the size of the habitat area3.
- 130 - STATUS OF KEY AUSTRALIAN FISH STOCKS REPORTS 2012 GIANT CRAB
Environmental effects on Giant Crab
• Recruitment is not distributed evenly; some areas appear to have much higher levels of juvenile abundance than others. This is not a function of habitat but appears to be related to larval drift and thus current movement3. Changes in ocean currents through climate change or upwelling events would be expected to affect recruitment.
References1. Gardner, C 1998, First record of larvae of the giant crab Pseudocarcinus gigas in the plankton, Papers and Proceedings
of the Royal Society of Tasmania, 132: 47–48.
2. Gardner, C & Quintana, R 1998, Larval development of the Australian giant crab Pseudocarcinus gigas (Lamarck, 1818) (Decapoda: Oziidae) reared in the laboratory, Journal of Plankton Research, 20(6): 1169–1188.
3. Williams, A, Gardner, C, Althaus, F, Barker, B & Mills, D 2009, Understanding shelf-break habitat for sustainable management of fisheries with spatial overlap, final report to the Fisheries Research and Development Corporation, project 2004/066, CSIRO Marine and Atmospheric Research, Hobart.
4. Gardner, C, Haddon, M, Hobday, D & McGarvey, R 2007, Development of the tools for long term management of the giant crab resource: data collection methodology, stock assessment and harvest strategy evaluation, final report to the Fisheries Research and Development Corporation, Canberra.
5. Hartmann, K & Gardner, C 2011, Giant Crab stock assessment report 2009/10, Tasmanian Aquaculture and Fisheries Institute, Hobart.
6. Fogarty, MJ & Gendron, L 2004, Biological reference points for American lobster (Homarus americanus) populations: limits to exploitation and the precautionary approach, Canadian Journal of Fisheries and Aquatic Sciences, 61(8): 1392–1403.
7. Currie, DR 2011, South Australian Giant Crab (Pseudocarcinus gigas), fishery status report 2010–11, status report to PIRSA Fisheries & Aquaculture, South Australian Research and Development Institute (Aquatic Sciences), SARDI publication F2011/000332-2, SARDI Research Report Series no. 591, SARDI, Adelaide.
8. Walker, T 2012, Victorian giant crab fishery stock assessment report 2012, Victorian Department of Primary Industries, Melbourne.
9. Gardner, C & Williams, H 2002, Maturation of male giant crab Pseudocarcinus gigas and the potential for sperm limitation in the Tasmanian fishery, Marine and Freshwater Research, 53: 661–667.
10. McGarvey, R, Matthews, JM & Levings, AH 1999, Yield-, value-, and egg-per-recruit of Giant Crab, Pseudocarcinus gigas, South Australian Research and Development Institute, Adelaide.
11. Gardner, C, Ziegler, P & Jennings, S 2009, Re-assessing giant crab (Pseudocarcinus gigas) size limits to optimise value and sustainability of the fishery, final report to the Fisheries Research and Development Corporation, project 2006/22, FRDC, Canberra.

- 131 - STATUS OF KEY AUSTRALIAN FISH STOCKS REPORTS 2012 MUD CRAB
9. Mud Crab Scylla serrata, S. olivacea Mark Gruberta, Megan Leslieb and Michelle Winningb
Giant Mud Crab (Scylla serrata)
Table 1: Stock status determination for Giant Mud Crab
Jurisdiction Northern Territory, Queensland, Western Australia New South Wales, Queensland
Stock Northern Australian (MCF [NT], MCF [QLD], MCF [WA])
East coast (EGF, MCF [QLD])
Stock status
Sustainable Undefined
Indicators Catch, effort and CPUE, size frequency and sex ratio of harvest (from monthly processor monitoring in Northern Territory only)
Catch, effort and CPUE
CPUE = catch per unit effort; EGF = Estuary General Fishery (New South Wales); MCF [NT] = Mud Crab Fishery (Northern Territory); MCF [QLD] = Mud Crab Fishery (Queensland); MCF [WA] = Mud Crab Fishery (Western Australia)
a Department of Primary Industry and Fisheries, Northern Territoryb Department of Agriculture, Fisheries and Forestry, Queensland
- 132 - STATUS OF KEY AUSTRALIAN FISH STOCKS REPORTS 2012 MUD CRAB
Stock structure
Two species of Mud Crab are found in Australian waters: the Giant Mud Crab (Scylla serrata) and the Orange Mud Crab (S. olivacea). The former constitutes the majority (>99 per cent) of the commercial Mud Crab catch in the Northern Territory and Queensland, and the entire commercial catch in New South Wales. The catch composition in the Western Australian Mud Crab fishery is uncertain.
The life history and fisheries biology of Giant Mud Crab in the Northern Territory and Queensland are well documented1–5 but, with the exception of Butcher6, comparatively little information is available on these aspects from Western Australia or New South Wales. There are no published accounts of the biology of Orange Mud Crab in Australian waters. Hence, all catch and biological information in this chapter refers to S. serrata unless otherwise indicated.
Ovigerous female Giant Mud Crabs migrate up to 95 km offshore to release their eggs3, which can number up to 10.8 million7. These features, coupled with a planktonic larval stage that can last for several weeks (depending on water temperature and salinity)8 give this species significant capacity for dispersal.
A recent study on Giant Mud Crabs from around the Indo–West Pacific region9 found two distinct genetic clades: a widespread clade comprising three separate geographic clusters (west Indian Ocean; Red Sea – South China Sea; and west Pacific, including the eastern seaboard of Australia), and an endemic north-west Australia clade, extending from Western Australia to the tip of Cape York. In this chapter, the first clade is referred to as the ‘east coast’ biological stock, and the second as the ‘northern Australian’ biological stock.
The lack of gene flow between the two clades found in Australia is probably due to the constricted westward flow of waters from the Coral Sea imposed by the Torres Strait, which limits the passage of ‘west Pacific larvae’ into the Arafura Sea and beyond; and the southward flow of the East Australian Current.
Stock status
Northern Australian biological stock
The limited infrastructure in northern Australia means that commercial crabbing activities are restricted to a few key areas serviced by roads and boat ramps; large areas of Mud Crab habitat receive little or no commercial crabbing effort. Catch by recreational and Indigenous fishers accounts for around 20 per cent of the overall catch of the northern Australian biological stock (as indicated by Henry & Lyle10, and associated commercial catch data). The relatively small take by these sectors has not been incorporated into this assessment. Each jurisdiction assesses that part of the biological stock that occurs in its waters. The status presented here for the entire biological stock has been established using evidence from all three jurisdictions.
The Northern Territory Mud Crab fishery accounts for approximately 70 per cent of the total commercial harvest of the northern Australian Giant Mud Crab biological stock. A size–age–sex monthly stock synthesis model applied to corresponding commercial catch-and-effort data (to December 2010; Carl Walters, unpublished) suggests that monthly fishing mortality ranges from benign rates of 0.05 for females and 0.15 for males during periods of low vulnerability (the timing of which differs between sexes) to very high rates of 2.85 for males and 3.25 for females during periods of peak vulnerability. The monthly values, when averaged over the course of a year, yield annual fishing mortality rates of 1.23 and 1.17 for males and females, respectively. These figures approximate the estimate of natural mortality for Giant Mud Crabs of 1.05. The general rule in
- 133 - STATUS OF KEY AUSTRALIAN FISH STOCKS REPORTS 2012 MUD CRAB
fisheries population dynamics is that fishing mortality should usually be kept at or below this value to avoid overfishing and prevent the biological stock from becoming overfished.
The stock synthesis model also produced estimates of annual recruits (in year t +1) and female vulnerable abundance in January one year earlier (year t), over the past 25 years (i.e. since the beginning of the fishery). These estimates, when plotted against each other, showed no indication of reduced average recruitment at low spawning stock sizes—that is, there was no evidence of overfishing. The Northern Territory component of the northern Australian biological stock has not been recruitment overfished.
The western part of the Queensland Mud Crab fishery accounts for almost all of the remaining 30 per cent of the total commercial harvest of the northern Australian Giant Mud Crab biological stock. The male-only harvest policy in this state (see below, under ‘Main features and statistics for Mud Crab fisheries in Australia in 2010’) means that the biomass of female Giant Mud Crabs is largely unaffected by the fishery, although a small level of handling and post-release mortality of females is likely11.
A stock assessment of the western part of the Queensland Mud Crab fishery for 1998 to 2008 (which incorporated a 5 per cent increase in fishing efficiency each year12) suggested that the fishing mortality rate for males in 2008, when the catch was 178 tonnes (t), was around 0.6. Since 2010 catch in the fishery was almost the same (177 t), it is reasonable to assume that the fishing mortality rate in 2010 was the same as (or similar to) that in 2008. This level of fishing mortality is unlikely to cause the western Queensland component of the northern Australian biological stock to become recruitment overfished.
The Western Australian Mud Crab fishery accounts for less than 0.5 per cent of the total commercial harvest of the northern Australian Giant Mud Crab biological stock. The small commercial catch in this state is a result of the logistical difficulties associated with operating in, and transporting product from, the far north of Western Australia, rather than low abundances of Giant Mud Crabs. A minimum legal size of 15 cm carapace width (applied to both sexes of Giant Mud Crab) ensures that at least 90 per cent of harvested crabs will have reached sexual maturity before capture (based on data from the Northern Territory5). This ensures that a large proportion of mature crabs have zero fishing mortality.
The biology of Giant Mud Crab (high fecundity and scope for larval dispersal), combined with conservative catch controls, large unfished areas (which may buffer the effects of fishing), and low to moderate levels of fishing mortality (for one or both sexes), means that the biomass of this biological stock is unlikely to be recruitment overfished and that current catch levels are unlikely to cause the biological stock to become recruitment overfished.
On the basis of the evidence provided above, the biological stock is classified as a sustainable stock.
East coast biological stock
This cross-jurisdictional biological stock spans the east coast of Australia from the tip of Cape York (Queensland) to the southern limit of New South Wales. With the exception of far north Queensland (i.e. north of Cairns), roads and fishing infrastructure on the eastern seaboard are well developed and do not restrict access to the Giant Mud Crab resource. Catch by recreational and Indigenous fishers accounts for around 40 per cent of the overall catch of the east coast biological stock (as indicated by Henry & Lyle10, and associated commercial catch data).
The most recent estimate of the fishing mortality rate for male Giant Mud Crabs in eastern Queensland (based on commercial data to 2008) is around 1.512. Although this level of fishing mortality is unlikely to cause this part of the biological stock to become recruitment overfished,
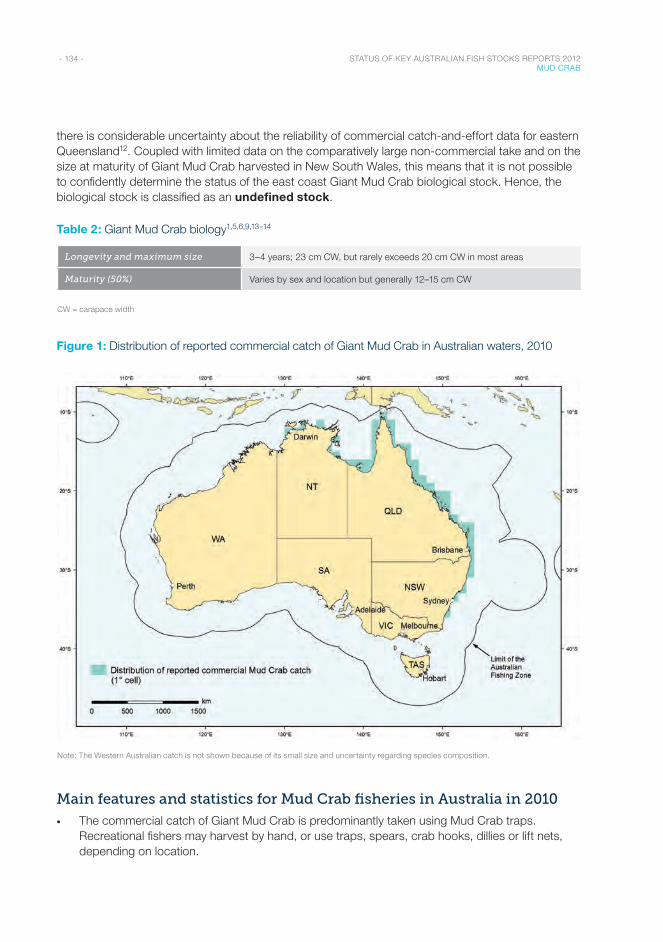
- 134 - STATUS OF KEY AUSTRALIAN FISH STOCKS REPORTS 2012 MUD CRAB
there is considerable uncertainty about the reliability of commercial catch-and-effort data for eastern Queensland12. Coupled with limited data on the comparatively large non-commercial take and on the size at maturity of Giant Mud Crab harvested in New South Wales, this means that it is not possible to confidently determine the status of the east coast Giant Mud Crab biological stock. Hence, the biological stock is classified as an undefined stock.
Table 2: Giant Mud Crab biology1,5,6,9,13–14
Longevity and maximum size 3–4 years; 23 cm CW, but rarely exceeds 20 cm CW in most areas
Maturity (50%) Varies by sex and location but generally 12–15 cm CW
CW = carapace width
Figure 1: Distribution of reported commercial catch of Giant Mud Crab in Australian waters, 2010
Note: The Western Australian catch is not shown because of its small size and uncertainty regarding species composition.
Main features and statistics for Mud Crab fisheries in Australia in 2010
• The commercial catch of Giant Mud Crab is predominantly taken using Mud Crab traps. Recreational fishers may harvest by hand, or use traps, spears, crab hooks, dillies or lift nets, depending on location.
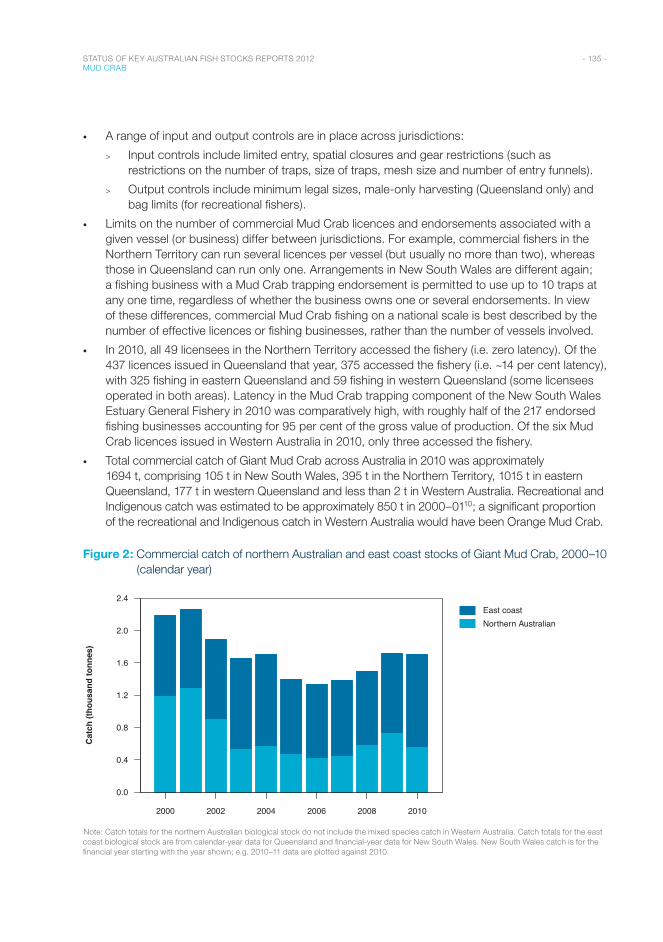
- 135 - STATUS OF KEY AUSTRALIAN FISH STOCKS REPORTS 2012 MUD CRAB
• A range of input and output controls are in place across jurisdictions:
> Input controls include limited entry, spatial closures and gear restrictions (such as restrictions on the number of traps, size of traps, mesh size and number of entry funnels).
> Output controls include minimum legal sizes, male-only harvesting (Queensland only) and bag limits (for recreational fishers).
• Limits on the number of commercial Mud Crab licences and endorsements associated with a given vessel (or business) differ between jurisdictions. For example, commercial fishers in the Northern Territory can run several licences per vessel (but usually no more than two), whereas those in Queensland can run only one. Arrangements in New South Wales are different again; a fishing business with a Mud Crab trapping endorsement is permitted to use up to 10 traps at any one time, regardless of whether the business owns one or several endorsements. In view of these differences, commercial Mud Crab fishing on a national scale is best described by the number of effective licences or fishing businesses, rather than the number of vessels involved.
• In 2010, all 49 licensees in the Northern Territory accessed the fishery (i.e. zero latency). Of the 437 licences issued in Queensland that year, 375 accessed the fishery (i.e. ~14 per cent latency), with 325 fishing in eastern Queensland and 59 fishing in western Queensland (some licensees operated in both areas). Latency in the Mud Crab trapping component of the New South Wales Estuary General Fishery in 2010 was comparatively high, with roughly half of the 217 endorsed fishing businesses accounting for 95 per cent of the gross value of production. Of the six Mud Crab licences issued in Western Australia in 2010, only three accessed the fishery.
• Total commercial catch of Giant Mud Crab across Australia in 2010 was approximately 1694 t, comprising 105 t in New South Wales, 395 t in the Northern Territory, 1015 t in eastern Queensland, 177 t in western Queensland and less than 2 t in Western Australia. Recreational and Indigenous catch was estimated to be approximately 850 t in 2000–0110; a significant proportion of the recreational and Indigenous catch in Western Australia would have been Orange Mud Crab.
Figure 2: Commercial catch of northern Australian and east coast stocks of Giant Mud Crab, 2000–10 (calendar year)
Year
2000 2002 2004 2006 2008 2010
0.0
0.4
0.8
1.2
1.6
2.0
2.4East coastNorthern Australian
Cat
ch (t
hous
and
tonn
es)
Note: Catch totals for the northern Australian biological stock do not include the mixed species catch in Western Australia. Catch totals for the east coast biological stock are from calendar-year data for Queensland and financial-year data for New South Wales. New South Wales catch is for the financial year starting with the year shown; e.g. 2010–11 data are plotted against 2010.
- 136 - STATUS OF KEY AUSTRALIAN FISH STOCKS REPORTS 2012 MUD CRAB
Catch explanation
Commercial catches of the northern Australian biological stock exceeded 1100 t in 2000 and 2001 but then declined, and have stabilised at around 400–700 t per year for the past five years. This change was driven by variable catches in the Northern Territory; while catches in western Queensland were relatively stable (135–175 t). The record catches in 2000 and 2001 are thought to be due to high recruitment during favourable environmental conditions (i.e. high wet-season rainfall) in the Northern Territory. The commercial catch in western Queensland has been higher than average in recent years (2008–10), possibly due to increases in effort, a greater abundance of legal-sized males and/or an increase in their catchability. The decline in catch in the Northern Territory is probably due to a decrease in wet-season rainfall and the introduction (in 2001) of the ‘commercially unsuitable crab’ rule, which prohibits the retention of recently moulted ‘soft’ crabs by commercial fishers in the Northern Territory.
Commercial catches of the east coast biological stock have been more consistent, ranging between 900 and 1100 t since 2005. In 2010, catch increased by 16 per cent over the catch in 2009, suggesting a greater abundance of legal-sized males and/or an increase in the catchability of individuals. In this case, almost all of the interannual variability was driven by catches in eastern Queensland, since the New South Wales catch was relatively small.
Effects of fishing on the marine environment
• Entanglement of turtles in polyethylene mesh traps is a problem in eastern Queensland15. To address this, Fisheries Queensland has released a guide to responsible crabbing, which outlines several gear modifications aimed at reducing turtle interactions and preventing trap loss and subsequent ghost fishing16.
• Discard rates of undersized Mud Crabs can be as high as 70 per cent of the total catch in some areas14. Bycatch of small fishes (particularly Yellowfin Bream) is also of concern on the east coast (P Butcher, pers. comm. 2012). The Northern Territory Department of Primary Industry and Fisheries, and Fisheries New South Wales have both evaluated the effectiveness of escape vents in reducing the retention of undersized Mud Crabs and small teleost bycatch in Mud Crab traps. The results will be available in late 2012. The Northern Territory department has also developed escape vents that can be fitted to wire mesh traps. These are currently being distributed to fishers in Queensland and the Northern Territory for evaluation.
• Limb loss of crabs caught in monofilament tangle nets (hoop nets) is a problem in New South Wales (P Butcher, pers. comm. 2012). To address this, a study by Fisheries New South Wales has compared limb loss of crabs caught in a variety of gear types (including tangle nets) and has recommended that the use of tangle nets be discontinued11.
- 137 - STATUS OF KEY AUSTRALIAN FISH STOCKS REPORTS 2012 MUD CRAB
Environmental effects on Mud Crabs
• Commercial catch rates generally show positive correlations with environmental factors such as rainfall or sea surface temperature, depending on location17. Catch rates are more strongly linked to sea surface temperature at higher latitudes and rainfall at lower latitudes.
• Juvenile Giant Mud Crabs prefer to settle on seagrass rather than on mud or sand18. Hence, the availability of this habitat type may affect recruitment success of this species.
• Mud Crabs could potentially benefit from moderate climate change in some areas. Increased water temperatures at higher latitudes might increase growth rates and reproductive activity, while greater rainfall in the tropics might increase primary and secondary productivity, thereby providing more food for juvenile crabs.
References1. Heasman, MP 1980, Aspects of the general biology and fishery of the mud crab Scylla serrata (Forskål), in Moreton Bay,
Queensland, PhD thesis, University of Queensland, Brisbane.
2. Hill, BJ, Williams, MJ & Dutton, P 1982, Distribution of juvenile, subadult and adult Scylla serrata on tidal flats in Australia, Marine Biology, 69: 117–120.
3. Hill, BJ 1994, Offshore spawning by the portunid crab Scylla serrata (Crustacea Decapoda), Marine Biology, 120: 379–384.
4. Hyland, SJ, Hill, BJ & Lee, CP 1984, Movement within and between different habitats by the portunid crab Scylla serrata, Marine Biology, 80: 57–61.
5. Knuckey, IA 1999, Mud crab (Scylla serrata) population dynamics in the Northern Territory, Australia and their relationship to the commercial fishery, PhD thesis, Northern Territory University, Darwin.
6. Butcher, PA 2004, Mud crab (Scylla serrata) and marine park management in estuaries of the Solitary Islands Marine Park, New South Wales, PhD thesis, University of New England, Armidale.
7. Davis, JA, Churchill, GJ, Hecht, T & Sorgeloos, P 2004, Spawning characteristics of the South African mudcrab Scylla serrata (Forskål) in captivity, Journal of the World Aquaculture Society, 35: 121–133.
8. Nurdiani, R & Zeng, CS 2007, Effects of temperature and salinity on the survival and development of mud crab, Scylla serrata (Forskål), larvae, Aquaculture Research, 38: 1529–1538.
9. He, L, Zhang, A, Zhu, C, Weese, D & Qiao, Z 2011, Phylogeography of the mud crab (Scylla serrata) in the Indo-West Pacific reappraised from mitochondrial molecular and oceanographic clues: transoceanic dispersal and coastal sequential colonization, Marine Ecology, 32: 52–64.
10. Henry, GW & Lyle, JM (eds) 2003, The national recreational and Indigenous fishing survey, Fisheries Research Development Corporation project 99/158, Australian Government Department of Agriculture, Fisheries and Forestry, Canberra, http://eprints.utas.edu.au/2526/1/Henry_Lyle_Nationalsurvey.pdf.
11. Butcher, PA, Leland, JC, Broadhurst, MK, Paterson BD & Mayer, DG 2012, Giant mud crab (Scylla serrata): relative efficiencies of common traps and impacts to discards, ICES Journal of Marine Science, 69: 1511–1522.
12. Brown, IW 2010, Taking female mud crabs: assessment of risks and benefits, Department of Employment, Economic Development and Innovation, Deception Bay, Queensland, www.frdc.com.au/research/final-reports/Pages/ 2009-031-DLD.aspx.
13. Jebreen, E, Helmke, S, Lunow, C, Bullock, C, Gribble, N, Whybird, O & Coles, R 2008, Fisheries long term monitoring program, Mud Crab (Scylla serrata) report: 2000–2002, PR08-3498, Department of Primary Industries and Fisheries, Brisbane, www.dpi.qld.gov.au/documents/Fisheries_SustainableFishing/Mud-Crab-2000-2002-report.pdf.
14. Ward, TM, Schmarr, DW & McGarvey, R 2008, Northern Territory Mud Crab Fishery: 2007 stock assessment, report to the Northern Territory Department of Primary Industry, Fisheries and Mines, SARDI Research Report Series no. 244, South Australian Research and Development Institute, West Beach, www.nt.gov.au/d/Content/File/p/Research/NT_Mud_Crab_2007.pdf.
15. Fisheries Research and Development Corporation 2010, Library shares bycatch innovations, FISH, 18(4): 24–25, FRDC, Canberra.
16. Queensland Department of Employment, Economic Development and Innovation 2010, Responsible crabbing, PR10–5111, DEEDI, Brisbane, www.dpi.qld.gov.au/documents/Fisheries_RecreationalFishing/Responsible-crabbing-in-Qld-DL-flyer.pdf.
17. Meynecke, JO, Grubert, MA & Gillson, J 2012, Giant mud crab (Scylla serrata) catches and climate drivers in Australia—a large scale comparison, Marine and Freshwater Research, 63: 84–94.
18. Webley, JAC, Connolly, RM & Young, RA 2009, Habitat selectivity of megalopae and juvenile mud crabs (Scylla serrata): implications for recruitment mechanism, Marine Biology, 156: 891–899.

Crustaceans : Lobsters & BugsBalmain Bug / Moreton Bay Bug / Eastern Rocklobster
Southern Rocklobster / Tropical Rocklobster / Western Rocklobster
L O B S T E R S & B U G S A R E F O U N D A R O U N D M U C H O F T H E A U S T R A L I A N C O A S T L I N E . R O C K L O B S T E R S
A R E A K E Y H I G H - V A L U E E X P O R T.
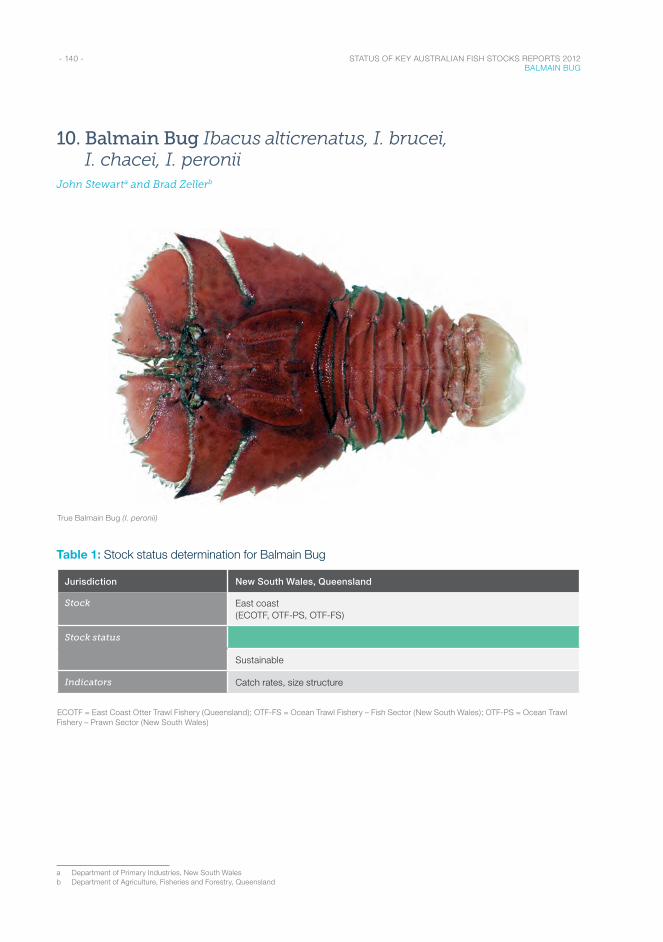
- 140 - STATUS OF KEY AUSTRALIAN FISH STOCKS REPORTS 2012 BALMAIN BUG
10. Balmain Bug Ibacus alticrenatus, I. brucei, I. chacei, I. peronii
John Stewarta and Brad Zellerb
True Balmain Bug (I. peronii)
Table 1: Stock status determination for Balmain Bug
Jurisdiction New South Wales, Queensland
Stock East coast (ECOTF, OTF-PS, OTF-FS)
Stock status
Sustainable
Indicators Catch rates, size structure
ECOTF = East Coast Otter Trawl Fishery (Queensland); OTF-FS = Ocean Trawl Fishery – Fish Sector (New South Wales); OTF-PS = Ocean Trawl Fishery – Prawn Sector (New South Wales)
a Department of Primary Industries, New South Walesb Department of Agriculture, Fisheries and Forestry, Queensland
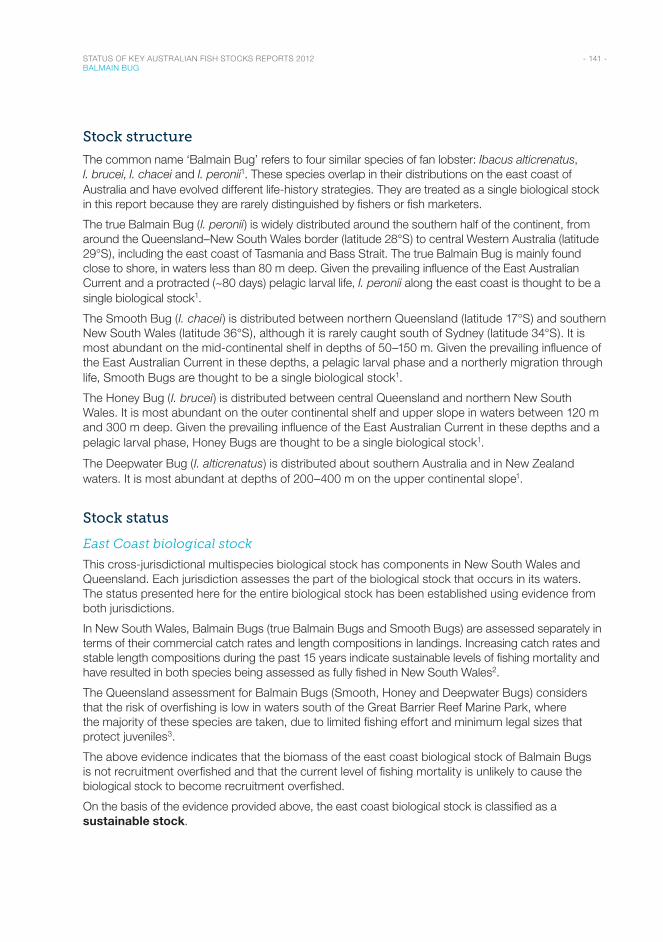
- 141 - STATUS OF KEY AUSTRALIAN FISH STOCKS REPORTS 2012 BALMAIN BUG
Stock structure
The common name ‘Balmain Bug’ refers to four similar species of fan lobster: Ibacus alticrenatus, I. brucei, I. chacei and I. peronii1. These species overlap in their distributions on the east coast of Australia and have evolved different life-history strategies. They are treated as a single biological stock in this report because they are rarely distinguished by fishers or fish marketers.
The true Balmain Bug (I. peronii) is widely distributed around the southern half of the continent, from around the Queensland–New South Wales border (latitude 28°S) to central Western Australia (latitude 29°S), including the east coast of Tasmania and Bass Strait. The true Balmain Bug is mainly found close to shore, in waters less than 80 m deep. Given the prevailing influence of the East Australian Current and a protracted (~80 days) pelagic larval life, I. peronii along the east coast is thought to be a single biological stock1.
The Smooth Bug (I. chacei) is distributed between northern Queensland (latitude 17°S) and southern New South Wales (latitude 36°S), although it is rarely caught south of Sydney (latitude 34°S). It is most abundant on the mid-continental shelf in depths of 50–150 m. Given the prevailing influence of the East Australian Current in these depths, a pelagic larval phase and a northerly migration through life, Smooth Bugs are thought to be a single biological stock1.
The Honey Bug (I. brucei) is distributed between central Queensland and northern New South Wales. It is most abundant on the outer continental shelf and upper slope in waters between 120 m and 300 m deep. Given the prevailing influence of the East Australian Current in these depths and a pelagic larval phase, Honey Bugs are thought to be a single biological stock1.
The Deepwater Bug (I. alticrenatus) is distributed about southern Australia and in New Zealand waters. It is most abundant at depths of 200–400 m on the upper continental slope1.
Stock status
East Coast biological stock
This cross-jurisdictional multispecies biological stock has components in New South Wales and Queensland. Each jurisdiction assesses the part of the biological stock that occurs in its waters. The status presented here for the entire biological stock has been established using evidence from both jurisdictions.
In New South Wales, Balmain Bugs (true Balmain Bugs and Smooth Bugs) are assessed separately in terms of their commercial catch rates and length compositions in landings. Increasing catch rates and stable length compositions during the past 15 years indicate sustainable levels of fishing mortality and have resulted in both species being assessed as fully fished in New South Wales2.
The Queensland assessment for Balmain Bugs (Smooth, Honey and Deepwater Bugs) considers that the risk of overfishing is low in waters south of the Great Barrier Reef Marine Park, where the majority of these species are taken, due to limited fishing effort and minimum legal sizes that protect juveniles3.
The above evidence indicates that the biomass of the east coast biological stock of Balmain Bugs is not recruitment overfished and that the current level of fishing mortality is unlikely to cause the biological stock to become recruitment overfished.
On the basis of the evidence provided above, the east coast biological stock is classified as a sustainable stock.
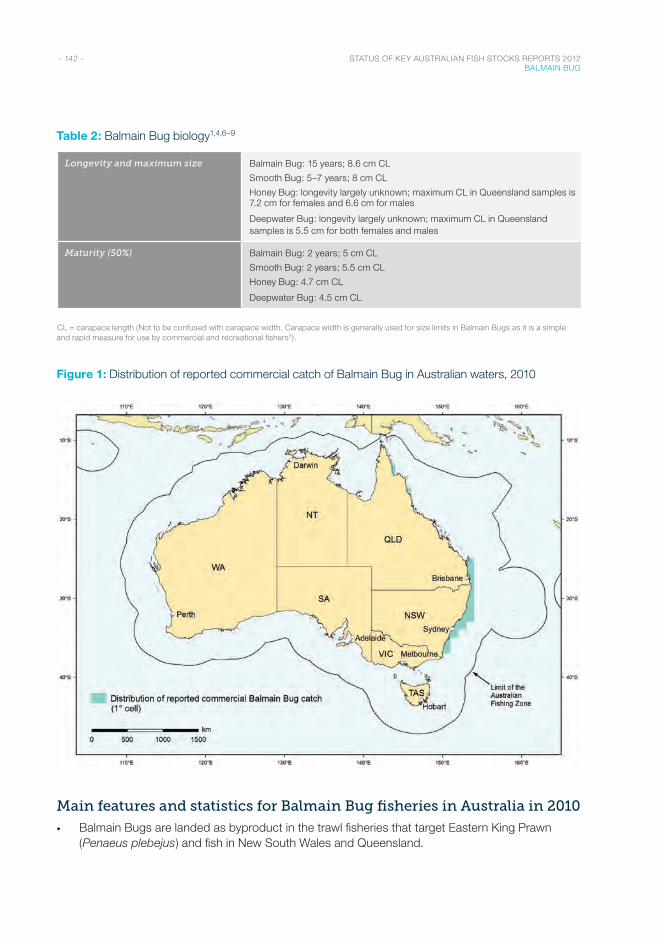
- 142 - STATUS OF KEY AUSTRALIAN FISH STOCKS REPORTS 2012 BALMAIN BUG
Table 2: Balmain Bug biology1,4,6–9
Longevity and maximum size Balmain Bug: 15 years; 8.6 cm CL
Smooth Bug: 5–7 years; 8 cm CL
Honey Bug: longevity largely unknown; maximum CL in Queensland samples is 7.2 cm for females and 6.6 cm for males
Deepwater Bug: longevity largely unknown; maximum CL in Queensland samples is 5.5 cm for both females and males
Maturity (50%) Balmain Bug: 2 years; 5 cm CL
Smooth Bug: 2 years; 5.5 cm CL
Honey Bug: 4.7 cm CL
Deepwater Bug: 4.5 cm CL
CL = carapace length (Not to be confused with carapace width. Carapace width is generally used for size limits in Balmain Bugs as it is a simple and rapid measure for use by commercial and recreational fishers5).
Figure 1: Distribution of reported commercial catch of Balmain Bug in Australian waters, 2010
Main features and statistics for Balmain Bug fisheries in Australia in 2010
• Balmain Bugs are landed as byproduct in the trawl fisheries that target Eastern King Prawn (Penaeus plebejus) and fish in New South Wales and Queensland.
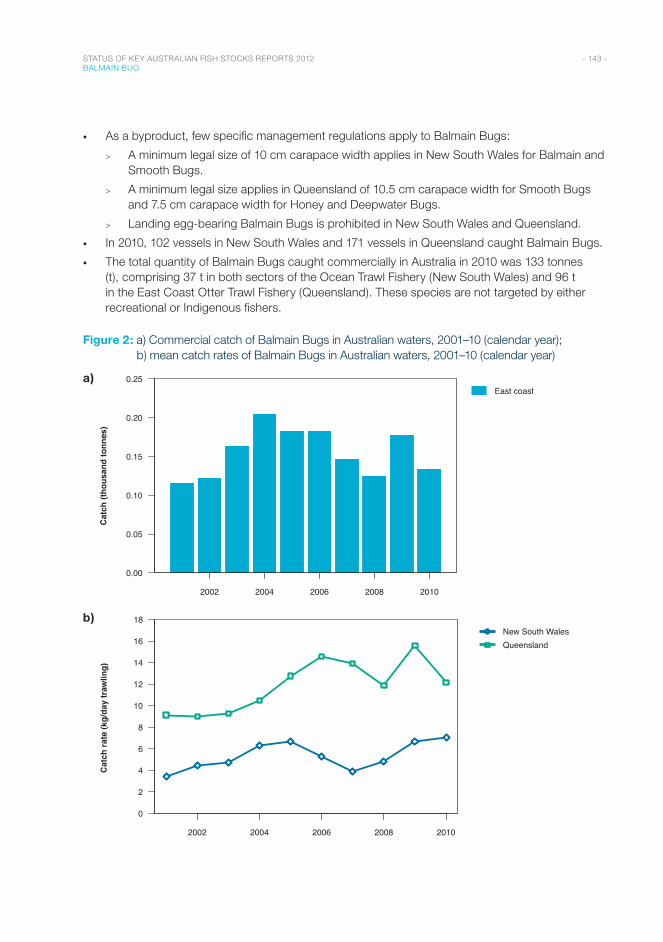
- 143 - STATUS OF KEY AUSTRALIAN FISH STOCKS REPORTS 2012 BALMAIN BUG
• As a byproduct, few specific management regulations apply to Balmain Bugs:
> A minimum legal size of 10 cm carapace width applies in New South Wales for Balmain and Smooth Bugs.
> A minimum legal size applies in Queensland of 10.5 cm carapace width for Smooth Bugs and 7.5 cm carapace width for Honey and Deepwater Bugs.
> Landing egg-bearing Balmain Bugs is prohibited in New South Wales and Queensland.
• In 2010, 102 vessels in New South Wales and 171 vessels in Queensland caught Balmain Bugs.
• The total quantity of Balmain Bugs caught commercially in Australia in 2010 was 133 tonnes (t), comprising 37 t in both sectors of the Ocean Trawl Fishery (New South Wales) and 96 t in the East Coast Otter Trawl Fishery (Queensland). These species are not targeted by either recreational or Indigenous fishers.
Figure 2: a) Commercial catch of Balmain Bugs in Australian waters, 2001–10 (calendar year); b) mean catch rates of Balmain Bugs in Australian waters, 2001–10 (calendar year)
a)
Year
2002 2004 2006 2008 2010
0.00
0.05
0.10
0.15
0.20
0.25East coast
Cat
ch (t
hous
and
tonn
es)
b)
Year
2002 2004 2006 2008 2010
0
2
4
6
8
10
12
14
16
18New South WalesQueensland
Cat
ch ra
te (k
g/da
y tr
awlin
g)
- 144 - STATUS OF KEY AUSTRALIAN FISH STOCKS REPORTS 2012 BALMAIN BUG
Catch explanation
Total landings have fluctuated between about 100 t and 200 t per year since 2001. Most of the catch (~80 per cent) in Queensland waters is Smooth Bugs; in New South Wales, about equal quantities of Smooth and Balmain Bugs are landed. Catches of Deepwater Bugs in Queensland appear to be limited to a few tonnes (<20 t) annually from boats operating in deeper water (>100 m). Catch rates (kg/day) have been increasing or stable in both New South Wales and Queensland over the past decade, with catch rates being lower in New South Wales in comparison to Queensland. In Queensland, total landings and nominal catch rates of Balmain Bugs (Smooth Bugs) are strongly influenced by effort targeting deepwater Eastern King Prawns.
Effects of fishing on the marine environment
• Bycatch reduction devices and turtle excluder devices are employed by all boats to minimise the amount of bycatch.
• The East Coast Otter Trawl Fishery (Queensland) interacts with a number of protected species, including turtles, sea snakes and sawfish. These interactions are monitored through mandatory ‘Species of Conservation Interest’ logbooks.
Environmental effects on Balmain Bugs
• The major environmental factor influencing the Balmain Bug biological stock is likely to be the southerly flow of the East Australian Current. The impact of changes in the East Australian Current on recruitment of these species is currently unknown1,8.
References1. Haddy, JA, Stewart, J & Graham, KJ 2007, Fishery and biology of commercially exploited Australian fan lobsters
(Ibacus spp.), in KL Lavalli & E Spanier (eds), The biology and fisheries of the Slipper Lobster, Crustacean Issues, vol. 17, CRC Press, Boca Raton.
2. Rowling, K, Hegarty, A & Ives M (eds) 2010, Bugs (Ibacus spp.), in Status of fisheries resources in NSW 2008/09, Industry & Investment NSW, Cronulla, 61–64.
3. Queensland Department of Employment, Economic Development and Innovation 2011, Stock status of Queensland’s fisheries resources 2011, DEEDI, Brisbane, www.daff.qld.gov.au/documents/Fisheries_SustainableFishing/ Stock-Status-of-Queenslands-Fisheries-Resources-2011.pdf.
4. Haddy, JA, Courtney, AJ & Roy, DP 2005, Aspects of the reproductive biology and growth of Balmain bugs (Ibacus spp.) (Scyllaridae), Journal of Crustacean Biology, 25(2): 263–273.
5. Roberts, SD & Steer MA 2010, By-product assessment in the Spencer Gulf Prawn Fishery with an emphasis on developing management options for Balmain Bugs, South Australian Research and Development Institute (Aquatic Sciences), SARDI publication F2010/000165-1, SARDI Research Report Series no. 439, SARDI, Adelaide.
6. Stewart, J 1999, Aspects of the biology of Balmain and smooth bugs, Ibacus spp, (Decapoda: Scyllaridae) off Eastern Australia, PhD thesis, University of Sydney.
7. Stewart, J & Kennelly, SJ 2000, Growth of the scyllarid lobsters Ibacus peronii and I. chacei, Marine Biology, 136: 921–930.
8. Stewart, J, Kennelly, SJ & Hoegh-Guldberg, O 1997, Size at sexual maturity and the reproductive biology of two species of scyllarid lobster from New South Wales and Victoria, Australia, Crustaceana 70(3): 344–367.
9. Stewart, J & Kennelly, SJ 1998, Contrasting movements of two exploited scyllarid lobsters of the genus Ibacus off the east coast of Australia, Fisheries Research, 36: 127–132.
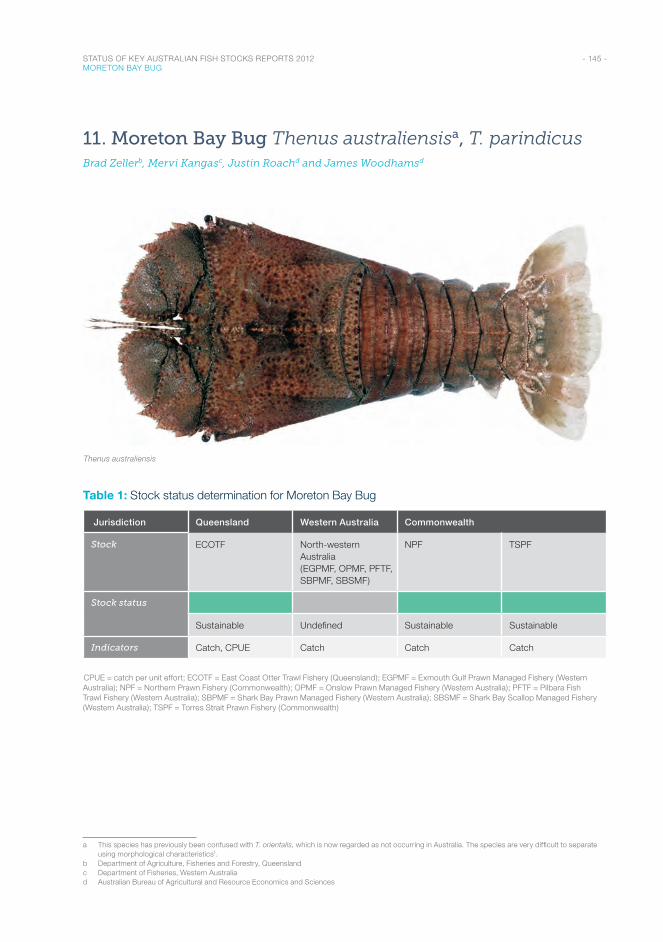
- 145 - STATUS OF KEY AUSTRALIAN FISH STOCKS REPORTS 2012 MORETON BAY BUG
11. Moreton Bay Bug Thenus australiensisa, T. parindicusBrad Zellerb, Mervi Kangasc, Justin Roachd and James Woodhamsd
Thenus australiensis
Table 1: Stock status determination for Moreton Bay Bug
Jurisdiction Queensland Western Australia Commonwealth
Stock ECOTF North-western Australia (EGPMF, OPMF, PFTF, SBPMF, SBSMF)
NPF TSPF
Stock status
Sustainable Undefined Sustainable Sustainable
Indicators Catch, CPUE Catch Catch Catch
CPUE = catch per unit effort; ECOTF = East Coast Otter Trawl Fishery (Queensland); EGPMF = Exmouth Gulf Prawn Managed Fishery (Western Australia); NPF = Northern Prawn Fishery (Commonwealth); OPMF = Onslow Prawn Managed Fishery (Western Australia); PFTF = Pilbara Fish Trawl Fishery (Western Australia); SBPMF = Shark Bay Prawn Managed Fishery (Western Australia); SBSMF = Shark Bay Scallop Managed Fishery (Western Australia); TSPF = Torres Strait Prawn Fishery (Commonwealth)
a This species has previously been confused with T. orientalis, which is now regarded as not occurring in Australia. The species are very difficult to separate using morphological characteristics1.
b Department of Agriculture, Fisheries and Forestry, Queenslandc Department of Fisheries, Western Australiad Australian Bureau of Agricultural and Resource Economics and Sciences
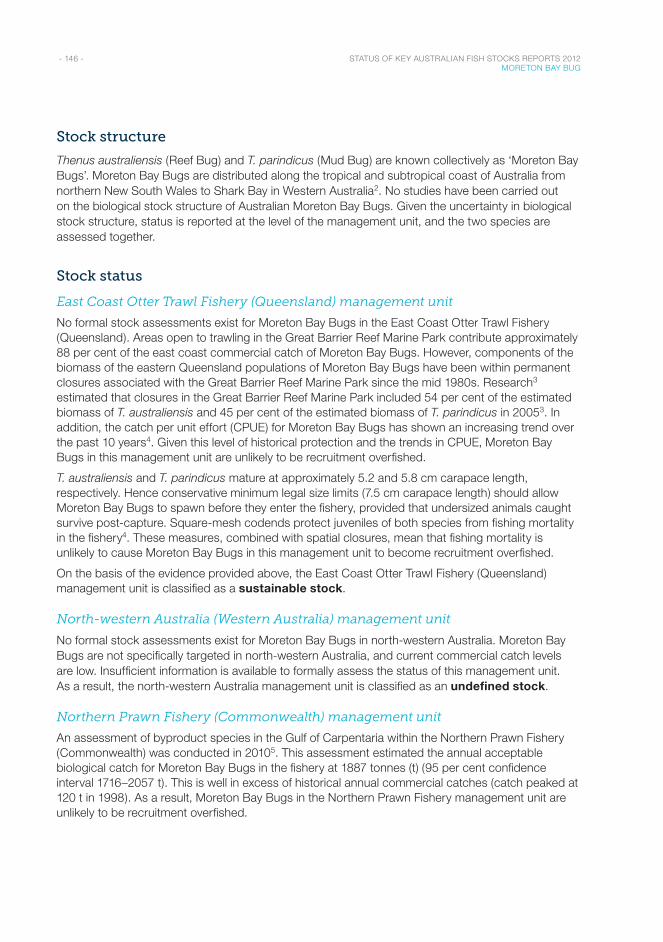
- 146 - STATUS OF KEY AUSTRALIAN FISH STOCKS REPORTS 2012 MORETON BAY BUG
Stock structure
Thenus australiensis (Reef Bug) and T. parindicus (Mud Bug) are known collectively as ‘Moreton Bay Bugs’. Moreton Bay Bugs are distributed along the tropical and subtropical coast of Australia from northern New South Wales to Shark Bay in Western Australia2. No studies have been carried out on the biological stock structure of Australian Moreton Bay Bugs. Given the uncertainty in biological stock structure, status is reported at the level of the management unit, and the two species are assessed together.
Stock status
East Coast Otter Trawl Fishery (Queensland) management unit
No formal stock assessments exist for Moreton Bay Bugs in the East Coast Otter Trawl Fishery (Queensland). Areas open to trawling in the Great Barrier Reef Marine Park contribute approximately 88 per cent of the east coast commercial catch of Moreton Bay Bugs. However, components of the biomass of the eastern Queensland populations of Moreton Bay Bugs have been within permanent closures associated with the Great Barrier Reef Marine Park since the mid 1980s. Research3 estimated that closures in the Great Barrier Reef Marine Park included 54 per cent of the estimated biomass of T. australiensis and 45 per cent of the estimated biomass of T. parindicus in 20053. In addition, the catch per unit effort (CPUE) for Moreton Bay Bugs has shown an increasing trend over the past 10 years4. Given this level of historical protection and the trends in CPUE, Moreton Bay Bugs in this management unit are unlikely to be recruitment overfished.
T. australiensis and T. parindicus mature at approximately 5.2 and 5.8 cm carapace length, respectively. Hence conservative minimum legal size limits (7.5 cm carapace length) should allow Moreton Bay Bugs to spawn before they enter the fishery, provided that undersized animals caught survive post-capture. Square-mesh codends protect juveniles of both species from fishing mortality in the fishery4. These measures, combined with spatial closures, mean that fishing mortality is unlikely to cause Moreton Bay Bugs in this management unit to become recruitment overfished.
On the basis of the evidence provided above, the East Coast Otter Trawl Fishery (Queensland) management unit is classified as a sustainable stock.
North-western Australia (Western Australia) management unit
No formal stock assessments exist for Moreton Bay Bugs in north-western Australia. Moreton Bay Bugs are not specifically targeted in north-western Australia, and current commercial catch levels are low. Insufficient information is available to formally assess the status of this management unit. As a result, the north-western Australia management unit is classified as an undefined stock.
Northern Prawn Fishery (Commonwealth) management unit
An assessment of byproduct species in the Gulf of Carpentaria within the Northern Prawn Fishery (Commonwealth) was conducted in 20105. This assessment estimated the annual acceptable biological catch for Moreton Bay Bugs in the fishery at 1887 tonnes (t) (95 per cent confidence interval 1716–2057 t). This is well in excess of historical annual commercial catches (catch peaked at 120 t in 1998). As a result, Moreton Bay Bugs in the Northern Prawn Fishery management unit are unlikely to be recruitment overfished.
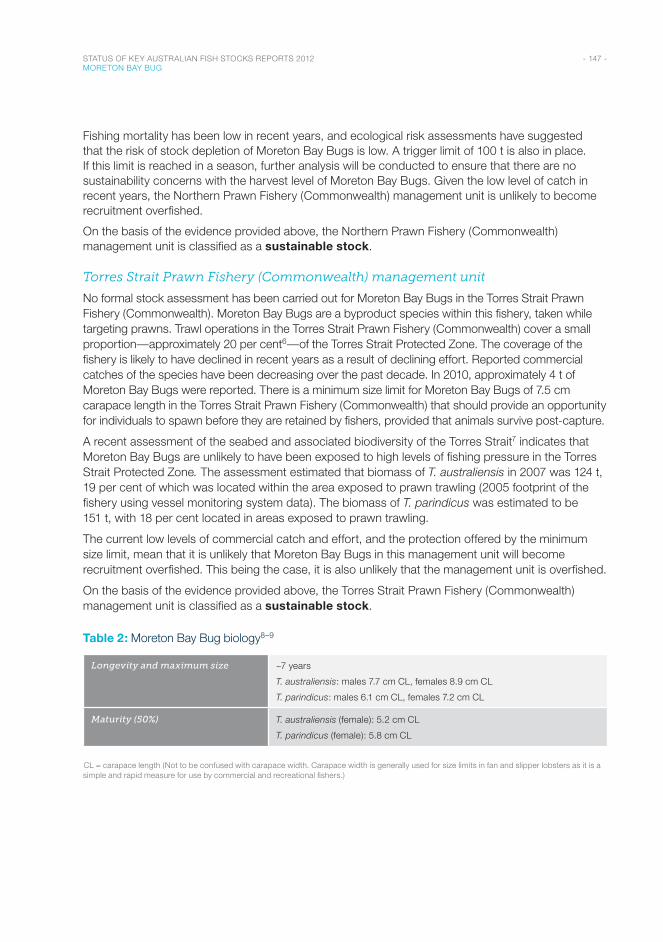
- 147 - STATUS OF KEY AUSTRALIAN FISH STOCKS REPORTS 2012 MORETON BAY BUG
Fishing mortality has been low in recent years, and ecological risk assessments have suggested that the risk of stock depletion of Moreton Bay Bugs is low. A trigger limit of 100 t is also in place. If this limit is reached in a season, further analysis will be conducted to ensure that there are no sustainability concerns with the harvest level of Moreton Bay Bugs. Given the low level of catch in recent years, the Northern Prawn Fishery (Commonwealth) management unit is unlikely to become recruitment overfished.
On the basis of the evidence provided above, the Northern Prawn Fishery (Commonwealth) management unit is classified as a sustainable stock.
Torres Strait Prawn Fishery (Commonwealth) management unit
No formal stock assessment has been carried out for Moreton Bay Bugs in the Torres Strait Prawn Fishery (Commonwealth). Moreton Bay Bugs are a byproduct species within this fishery, taken while targeting prawns. Trawl operations in the Torres Strait Prawn Fishery (Commonwealth) cover a small proportion—approximately 20 per cent6—of the Torres Strait Protected Zone. The coverage of the fishery is likely to have declined in recent years as a result of declining effort. Reported commercial catches of the species have been decreasing over the past decade. In 2010, approximately 4 t of Moreton Bay Bugs were reported. There is a minimum size limit for Moreton Bay Bugs of 7.5 cm carapace length in the Torres Strait Prawn Fishery (Commonwealth) that should provide an opportunity for individuals to spawn before they are retained by fishers, provided that animals survive post-capture.
A recent assessment of the seabed and associated biodiversity of the Torres Strait7 indicates that Moreton Bay Bugs are unlikely to have been exposed to high levels of fishing pressure in the Torres Strait Protected Zone. The assessment estimated that biomass of T. australiensis in 2007 was 124 t, 19 per cent of which was located within the area exposed to prawn trawling (2005 footprint of the fishery using vessel monitoring system data). The biomass of T. parindicus was estimated to be 151 t, with 18 per cent located in areas exposed to prawn trawling.
The current low levels of commercial catch and effort, and the protection offered by the minimum size limit, mean that it is unlikely that Moreton Bay Bugs in this management unit will become recruitment overfished. This being the case, it is also unlikely that the management unit is overfished.
On the basis of the evidence provided above, the Torres Strait Prawn Fishery (Commonwealth) management unit is classified as a sustainable stock.
Table 2: Moreton Bay Bug biology8–9
Longevity and maximum size ~7 years
T. australiensis: males 7.7 cm CL, females 8.9 cm CL
T. parindicus: males 6.1 cm CL, females 7.2 cm CL
Maturity (50%) T. australiensis (female): 5.2 cm CL
T. parindicus (female): 5.8 cm CL
CL = carapace length (Not to be confused with carapace width. Carapace width is generally used for size limits in fan and slipper lobsters as it is a simple and rapid measure for use by commercial and recreational fishers.)
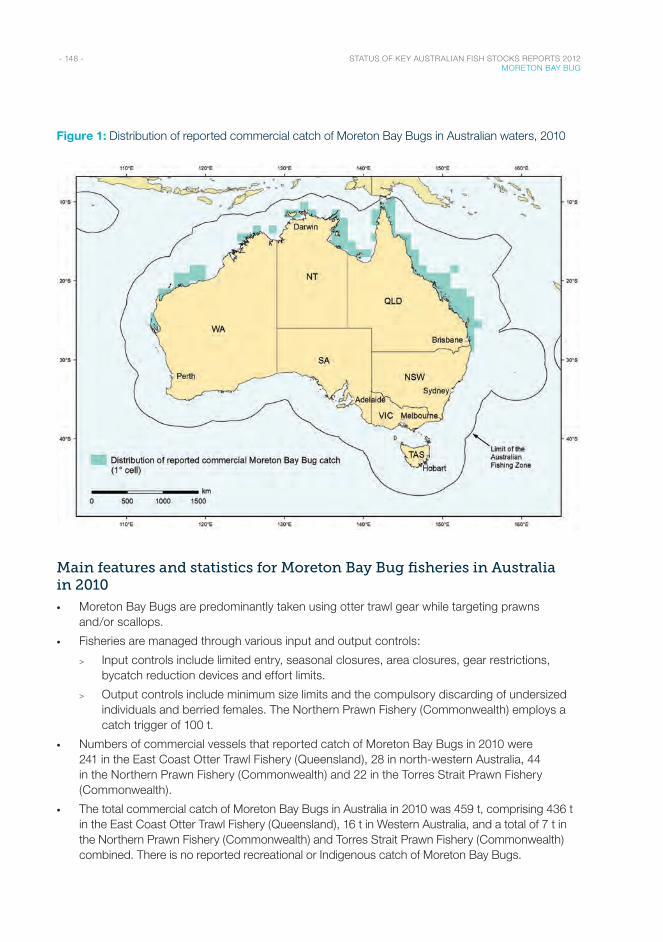
- 148 - STATUS OF KEY AUSTRALIAN FISH STOCKS REPORTS 2012 MORETON BAY BUG
Figure 1: Distribution of reported commercial catch of Moreton Bay Bugs in Australian waters, 2010
Main features and statistics for Moreton Bay Bug fisheries in Australia in 2010
• Moreton Bay Bugs are predominantly taken using otter trawl gear while targeting prawns and/or scallops.
• Fisheries are managed through various input and output controls:
> Input controls include limited entry, seasonal closures, area closures, gear restrictions, bycatch reduction devices and effort limits.
> Output controls include minimum size limits and the compulsory discarding of undersized individuals and berried females. The Northern Prawn Fishery (Commonwealth) employs a catch trigger of 100 t.
• Numbers of commercial vessels that reported catch of Moreton Bay Bugs in 2010 were 241 in the East Coast Otter Trawl Fishery (Queensland), 28 in north-western Australia, 44 in the Northern Prawn Fishery (Commonwealth) and 22 in the Torres Strait Prawn Fishery (Commonwealth).
• The total commercial catch of Moreton Bay Bugs in Australia in 2010 was 459 t, comprising 436 t in the East Coast Otter Trawl Fishery (Queensland), 16 t in Western Australia, and a total of 7 t in the Northern Prawn Fishery (Commonwealth) and Torres Strait Prawn Fishery (Commonwealth) combined. There is no reported recreational or Indigenous catch of Moreton Bay Bugs.
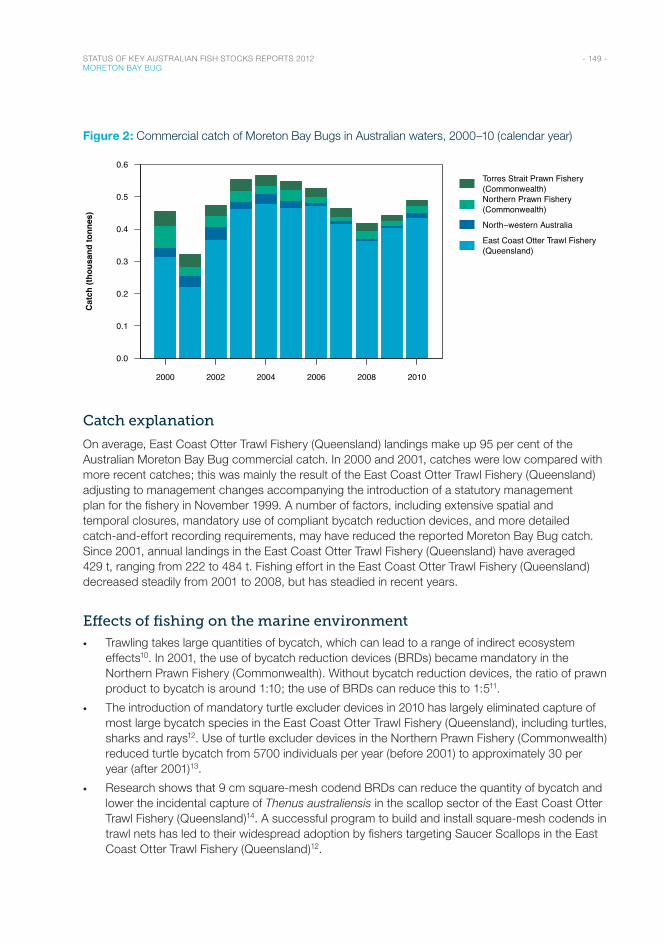
- 149 - STATUS OF KEY AUSTRALIAN FISH STOCKS REPORTS 2012 MORETON BAY BUG
Figure 2: Commercial catch of Moreton Bay Bugs in Australian waters, 2000–10 (calendar year)
Year
2000 2002 2004 2006 2008 2010
0.0
0.1
0.2
0.3
0.4
0.5
0.6Torres Strait Prawn Fishery(Commonwealth)Northern Prawn Fishery(Commonwealth)
North−western Australia
East Coast Otter Trawl Fishery(Queensland)
Cat
ch (t
hous
and
tonn
es)
Catch explanation
On average, East Coast Otter Trawl Fishery (Queensland) landings make up 95 per cent of the Australian Moreton Bay Bug commercial catch. In 2000 and 2001, catches were low compared with more recent catches; this was mainly the result of the East Coast Otter Trawl Fishery (Queensland) adjusting to management changes accompanying the introduction of a statutory management plan for the fishery in November 1999. A number of factors, including extensive spatial and temporal closures, mandatory use of compliant bycatch reduction devices, and more detailed catch-and-effort recording requirements, may have reduced the reported Moreton Bay Bug catch. Since 2001, annual landings in the East Coast Otter Trawl Fishery (Queensland) have averaged 429 t, ranging from 222 to 484 t. Fishing effort in the East Coast Otter Trawl Fishery (Queensland) decreased steadily from 2001 to 2008, but has steadied in recent years.
Effects of fishing on the marine environment
• Trawling takes large quantities of bycatch, which can lead to a range of indirect ecosystem effects10. In 2001, the use of bycatch reduction devices (BRDs) became mandatory in the Northern Prawn Fishery (Commonwealth). Without bycatch reduction devices, the ratio of prawn product to bycatch is around 1:10; the use of BRDs can reduce this to 1:511.
• The introduction of mandatory turtle excluder devices in 2010 has largely eliminated capture of most large bycatch species in the East Coast Otter Trawl Fishery (Queensland), including turtles, sharks and rays12. Use of turtle excluder devices in the Northern Prawn Fishery (Commonwealth) reduced turtle bycatch from 5700 individuals per year (before 2001) to approximately 30 per year (after 2001)13.
• Research shows that 9 cm square-mesh codend BRDs can reduce the quantity of bycatch and lower the incidental capture of Thenus australiensis in the scallop sector of the East Coast Otter Trawl Fishery (Queensland)14. A successful program to build and install square-mesh codends in trawl nets has led to their widespread adoption by fishers targeting Saucer Scallops in the East Coast Otter Trawl Fishery (Queensland)12.
- 150 - STATUS OF KEY AUSTRALIAN FISH STOCKS REPORTS 2012 MORETON BAY BUG
Environmental effects on Moreton Bay Bugs
• There are suggestions that ocean acidification, changes in ocean current patterns (e.g. strengthening of the East Australian Current), and increased intensity of tropical storms associated with climate change may affect food availability, larval survival, dispersion and settlement patterns, abundance of Moreton Bay Bugs, and the distribution and level of catches15.
• Increased rainfall and sea level rise have been identified16 as key impacts of climate change in the region of the Northern Prawn Fishery (Commonwealth). These impacts have the potential to modify the geographical distribution of Moreton Bay Bug stocks.
References1. Burton, TE & Davie, PJF 2007, A revision of the shovel-nosed lobsters of the genus Thenus (Crustacea: Decapoda:
Scyllaridae), with descriptions of three new species, Zootaxa, 1429: 1–38.
2. George, RW & Griffin, DJG 1972, The shovel nosed lobsters of Australia, Australian Natural History, September 1972: 227–231.
3. Pitcher, CR, Doherty, P, Arnold, P, Hooper, J, Gribble, N, Bartlett, C, Browne, M, Campbell, N, Cannard, T, Cappo, M, Carini, G, Chalmers, S, Cheers, S, Chetwynd, D, Colefax, A, Coles, R, Cook, S, Davie, P, De’ath, G, Devereux, D, Done, B, Donovan, T, Ehrke, B, Ellis, N, Ericson, G, Fellegara, I, Forcey, K, Furey, M, Gledhill, D, Good, N, Gordon, S, Haywood, M, Jacobsen, I, Johnson, J, Jones, M, Kinninmoth, S, Kistle, S, Last, P, Leite, A, Marks, S, McLeod, I, Oczkowicz, S, Rose, C, Seabright, D, Sheils, J, Sherlock, M, Skelton, P, Smith, D, Smith, G, Speare, P, Stowar, M, Strickland, C, Sutcliffe, P, Van der Geest, C, Venables, W, Walsh, C, Wassenberg, T, Welna, A & Yearsley, G 2007, Seabed biodiversity on the continental shelf of the Great Barrier Reef World Heritage Area, AIMS/CSIRO/QM/QDPI CRC Reef Research Task final report.
4. Queensland Department of Employment, Economic Development and Innovation 2011, Stock status of Queensland’s fisheries resources 2011, DEEDI, Brisbane.
5. Milton, DA, Fry, GC, Kuhnert, P, Tonks, M, Zhou, S & Zhu, M 2010, Assessing data poor resources: developing a management strategy for byproduct species in the Northern Prawn Fishery, final report to the Fisheries Research and Development Corporation, project 2006/008.
6. Turnbull, C & Rose, CL 2007, Towards ecologically sustainable management of the Torres Strait Prawn Fishery, CRC Torres Strait Task T1.5 final report, Department of Primary Industries and Fisheries, Queensland.
7. Pitcher, CR, Haywood, M, Hooper, J, Coles, R, Bartlett, C, Browne, M, Cannard, T, Carini, G, Carter, A, Cheers, S, Chetwynd, D, Colefax, A, Cook, S, Davie, P, Ellis, N, Fellegara, I, Forcey, K, Furey, M, Gledhill, D, Hendriks, P, Jacobsen, I, Johnson, J, Jones, M, Last, P, Marks, S, McLeod, I, Sheils, J, Sheppard, J, Smith, G, Strickland, C, Van der Geest, C, Venables, W, Wassenberg, T & Yearsley, G 2007, Mapping and characterisation of the biotic and physical attributes of the Torres Strait ecosystem, CSIRO/QM/QDPI CRC Torres Strait Task final report.
8. Courtney, AJ 1997, Final report (project #92/102): A study of the biological parameters associated with yield optimisation of Moreton Bay Bugs, Thenus spp., Queensland Department of Primary Industries, Brisbane.
9. Jones, CM 1988, The biology and behaviour of bay lobsters, Thenus spp. (Decapoda: Scyllaridae), in northern Queensland, Australia, PhD thesis, University of Queensland.
10. Dayton, PK, Thrush SF, Agardy, MT & Hofman, RJ 1995, Environmental effects of fishing, Aquatic Conservation: Marine and Freshwater Ecosystems, 5: 205–232.
11. Raudzens, E 2007, At sea testing of the popeye fishbox bycatch reduction device onboard the FV Adelaide Pearl for approval in Australia’s Northern Prawn Fishery, Australian Fisheries Management Authority, Canberra.
12. Roy, D & Jebreen, E 2011, Extension of Fisheries Research and Development Corporation funded research results on improved bycatch reduction devices to the Queensland East Coast Otter Trawl Fishery, final report to the Fisheries Research and Development Corporation, project 2008/101, http://trove.nla.gov.au/work/156800774?selectedversion=NBD47756793.
13. Griffiths, S, Kenyon, R, Bulman, C, Dowdney, J, Williams, A, Sporcic, M & Fuller, M 2007, Ecological risk assessment for the effects of fishing: report for the Northern Prawn Fishery, Australian Fisheries Management Authority, Canberra.
14. Courtney, AJ, Campbell, MJ, Roy, DP, Tonks, ML, Chilcott, KE & Kyne, PM 2008, Round scallops and square-meshes: a comparison of four codend types on the catch rates of target species and bycatch in the Queensland (Australia) saucer scallop (Amusium balloti) trawl fishery, Marine and Freshwater Research, 59: 849–864.
15. Morison, AK & Pears, RJ 2012, Assessment of the ecological vulnerability of the East Coast Otter Trawl Fishery to climate change: a brief synthesis of information and results of an expert workshop, Great Barrier Reef Marine Park Authority, Townsville.
16. Hobday, AJ, Poloczanska, ES & Matear, RJ (eds) 2008, Implications of climate change for Australian fisheries and aquaculture: a preliminary assessment, report to the Australian Government Department of Climate Change, Canberra.
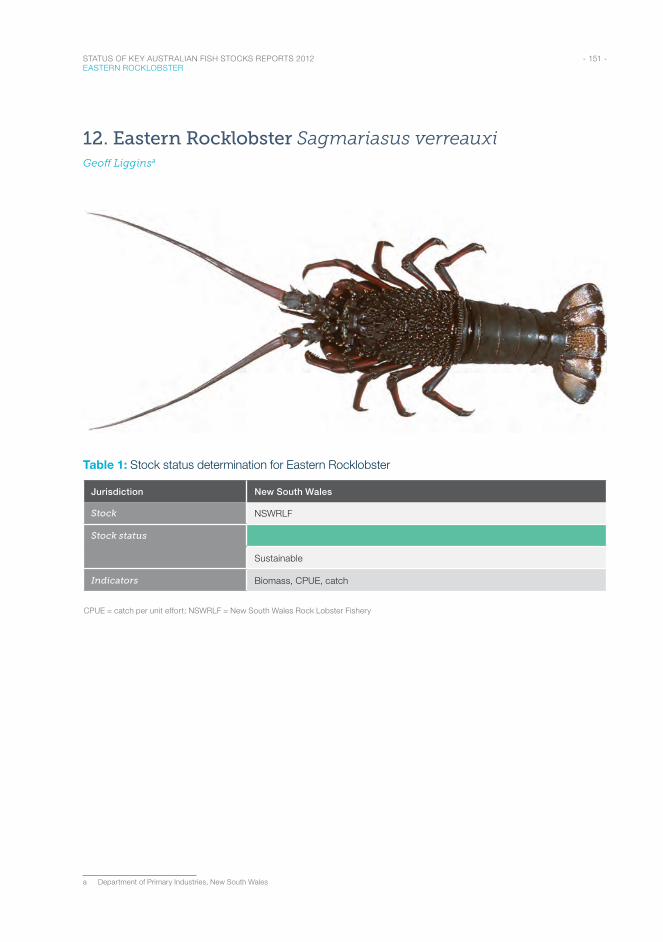
- 151 - STATUS OF KEY AUSTRALIAN FISH STOCKS REPORTS 2012 EASTERN ROCKLOBSTER
12. Eastern Rocklobster Sagmariasus verreauxiGeoff Ligginsa
Table 1: Stock status determination for Eastern Rocklobster
Jurisdiction New South Wales
Stock NSWRLF
Stock status
Sustainable
Indicators Biomass, CPUE, catch
CPUE = catch per unit effort; NSWRLF = New South Wales Rock Lobster Fishery
a Department of Primary Industries, New South Wales
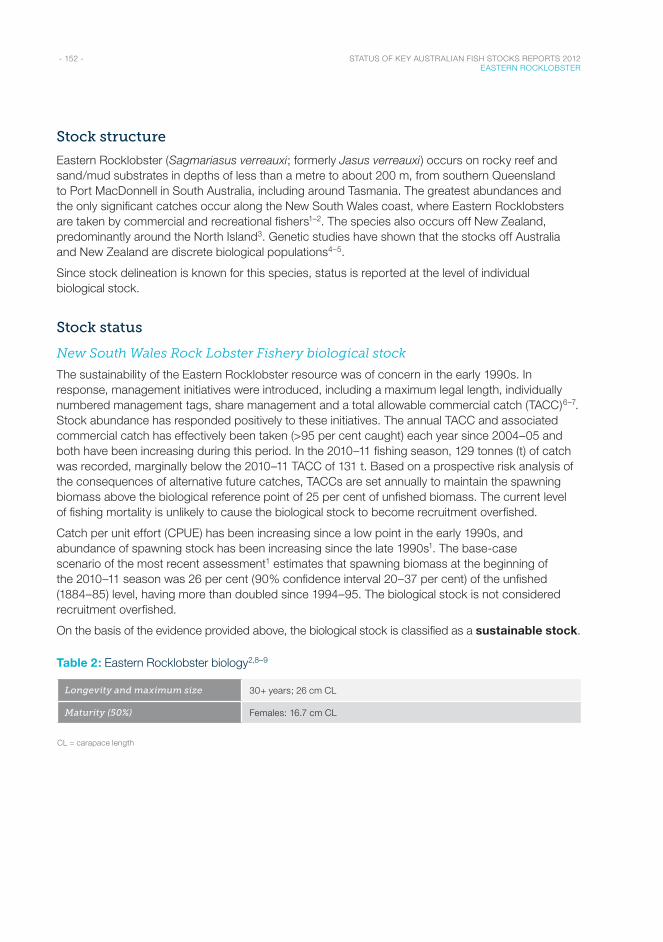
- 152 - STATUS OF KEY AUSTRALIAN FISH STOCKS REPORTS 2012 EASTERN ROCKLOBSTER
Stock structure
Eastern Rocklobster (Sagmariasus verreauxi; formerly Jasus verreauxi) occurs on rocky reef and sand/mud substrates in depths of less than a metre to about 200 m, from southern Queensland to Port MacDonnell in South Australia, including around Tasmania. The greatest abundances and the only significant catches occur along the New South Wales coast, where Eastern Rocklobsters are taken by commercial and recreational fishers1–2. The species also occurs off New Zealand, predominantly around the North Island3. Genetic studies have shown that the stocks off Australia and New Zealand are discrete biological populations4–5.
Since stock delineation is known for this species, status is reported at the level of individual biological stock.
Stock status
New South Wales Rock Lobster Fishery biological stock
The sustainability of the Eastern Rocklobster resource was of concern in the early 1990s. In response, management initiatives were introduced, including a maximum legal length, individually numbered management tags, share management and a total allowable commercial catch (TACC)6–7. Stock abundance has responded positively to these initiatives. The annual TACC and associated commercial catch has effectively been taken (>95 per cent caught) each year since 2004–05 and both have been increasing during this period. In the 2010–11 fishing season, 129 tonnes (t) of catch was recorded, marginally below the 2010–11 TACC of 131 t. Based on a prospective risk analysis of the consequences of alternative future catches, TACCs are set annually to maintain the spawning biomass above the biological reference point of 25 per cent of unfished biomass. The current level of fishing mortality is unlikely to cause the biological stock to become recruitment overfished.
Catch per unit effort (CPUE) has been increasing since a low point in the early 1990s, and abundance of spawning stock has been increasing since the late 1990s1. The base-case scenario of the most recent assessment1 estimates that spawning biomass at the beginning of the 2010–11 season was 26 per cent (90% confidence interval 20–37 per cent) of the unfished (1884–85) level, having more than doubled since 1994–95. The biological stock is not considered recruitment overfished.
On the basis of the evidence provided above, the biological stock is classified as a sustainable stock.
Table 2: Eastern Rocklobster biology2,8–9
Longevity and maximum size 30+ years; 26 cm CL
Maturity (50%) Females: 16.7 cm CL
CL = carapace length
- 153 - STATUS OF KEY AUSTRALIAN FISH STOCKS REPORTS 2012 EASTERN ROCKLOBSTER
Figure 1: Distribution of reported commercial catch of Eastern Rocklobster in Australian waters, 2010
Main features and statistics for Eastern Rocklobster fisheries in Australia in 2010
• Commercial catch of Eastern Rocklobster is predominantly taken using traps (approximately 99 per cent of catch). The remainder of catch is taken while free diving.
• A range of input and output controls are in place across the New South Wales Rock Lobster Fishery:
> Input controls include spatial closures throughout sanctuary zones in marine parks and aquatic reserves, restrictions on the size and design of traps, and restriction of recreational fishers to a single trap.
> Output controls include TACCs, individual transferable quotas, minimum (10.4 cm carapace length [CL]) and maximum (18 cm CL) legal lengths, bans on the take of berried females and a possession limit of two lobsters for recreational fishers.
• In 2010, there were 9727 shares in the fishery, and the commercial catch of Eastern Rocklobster was reported from 107 shareholders (representing approximately 107 vessels).
• The total reported commercial catch of Eastern Rocklobster in Australia in 2010–11 was 129 t. Recent modelling has assumed that the unreported catch by commercial fishers is 8.5–17 per cent of the TACC, and that recreational catch is 10–19 per cent of the TACC.
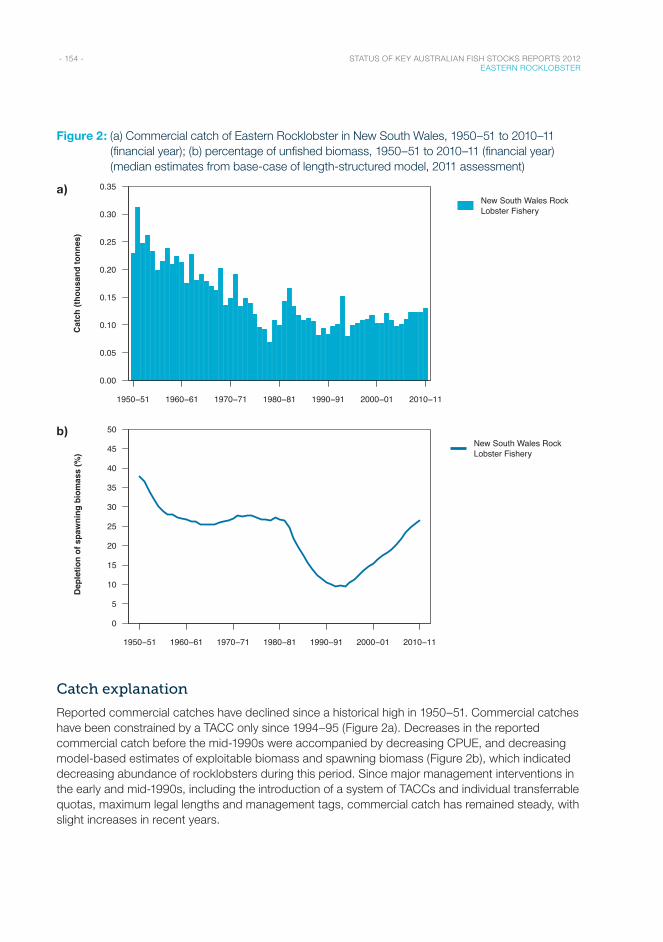
- 154 - STATUS OF KEY AUSTRALIAN FISH STOCKS REPORTS 2012 EASTERN ROCKLOBSTER
Figure 2: (a) Commercial catch of Eastern Rocklobster in New South Wales, 1950–51 to 2010–11 (financial year); (b) percentage of unfished biomass, 1950–51 to 2010–11 (financial year) (median estimates from base-case of length-structured model, 2011 assessment)
a)
Financial Year
1950−51 1960−61 1970−71 1980−81 1990−91 2000−01 2010−11
0.00
0.05
0.10
0.15
0.20
0.25
0.30
0.35New South Wales RockLobster Fishery
Cat
ch (t
hous
and
tonn
es)
b)
Financial Year
1950−51 1960−61 1970−71 1980−81 1990−91 2000−01 2010−11
0
5
10
15
20
25
30
35
40
45
50New South Wales RockLobster Fishery
Dep
letio
n of
spa
wni
ng b
iom
ass
(%)
Catch explanation
Reported commercial catches have declined since a historical high in 1950–51. Commercial catches have been constrained by a TACC only since 1994–95 (Figure 2a). Decreases in the reported commercial catch before the mid-1990s were accompanied by decreasing CPUE, and decreasing model-based estimates of exploitable biomass and spawning biomass (Figure 2b), which indicated decreasing abundance of rocklobsters during this period. Since major management interventions in the early and mid-1990s, including the introduction of a system of TACCs and individual transferrable quotas, maximum legal lengths and management tags, commercial catch has remained steady, with slight increases in recent years.
- 155 - STATUS OF KEY AUSTRALIAN FISH STOCKS REPORTS 2012 EASTERN ROCKLOBSTER
Effects of fishing on the marine environment
• Bycatch from the commercial fishery is minimal, and fishing with traps results in limited physical disturbance of benthic habitats.
• Loss of traps in the deepwater component of the fishery, due to cut-off by other vessels, results in some mortality of rocklobsters from ghost fishing. This mortality is the subject of current research (funded by the Fisheries Research and Development Corporation) and is being mitigated using sacrificial panels in traps and acoustic release technology to provide ‘at call’ access to submerged headgear.
• Physical impacts of fish and prawn trawling on benthic areas inhabited by rocklobsters (in particular, low-relief reefs on the mid-continental shelf) may have negative effects on the rocklobster population and subsequent catches at affected locations.
Environmental effects on Eastern Rocklobster
• Changes in water temperature and the spatial and temporal behaviour of the East Australian Current, as a result of climate change, could potentially affect the distribution of spawning stock, larval dispersal, and the strength and distribution of recruitment of peuruli. This will influence the distribution and abundance of juvenile rocklobsters recruiting to the fishable stock, and subsequently spatial and temporal patterns of catch in the fishery.
References1. Liggins, GW, Miller, ME, Jackson, M & Ballinger, G 2011, Resource assessment—lobster, Department of Industry &
Investment NSW, Sydney.
2. Montgomery, SS & Liggins, GW (in press), Recovery of the eastern rocklobster Sagmariasus verreauxi off New South Wales, Australia, Marine Biology Research.
3. Kensler, CB 1967, The distribution of spiny lobsters in New Zealand waters (Crustacea: Decapods: Palinuridae), New Zealand Journal of Marine and Freshwater Research, 1: 412–420.
4. Brasher, DJ, Ovenden, JD, Booth, JD & White, RWG 1992, Genetic subdivision of Australian and New Zealand populations of Jasus verreauxi (Decapoda: Palinuridae)—preliminary evidence from mitochondrial genome, New Zealand Journal of Marine and Freshwater Research, 26: 53–58.
5. Ovenden, JR & Brasher, DJ 1994, Stock identity of the red (Jasus edwardsii) and green (J. verreauxi) rocklobsters inferred from mitochondrial DNA analysis, in BF Phillips, JS Cobb & J Kittaka (eds), Spiny lobster management, Oxford Fishing News Books, Cambridge, Massachusetts, 230–249.
6. Fisheries Management (Lobster Share Management Plan) Regulation 2000, appendix, New South Wales Government.
7. NSW Department of Primary Industries 2007, Fishery management strategy for the NSW Lobster Fishery, NSW Department of Primary Industries, Cronulla.
8. Montgomery, SS 1992, Sizes at first maturity and at onset of breeding in female Jasus verreauxi (Decapoda: Palinuridae) from New South Wales, Australia, Australian Journal of Marine and Freshwater Research, 3: 1373–1379.
9. Montgomery, SS, Liggins, GW, Craig, JR & McLeod, JR 2009, Growth of the spiny lobster Jasus verreauxi (Decapoda:Palinuridae) off the east coast of Australia, New Zealand Journal of Marine and Freshwater Research, 43:113–123.
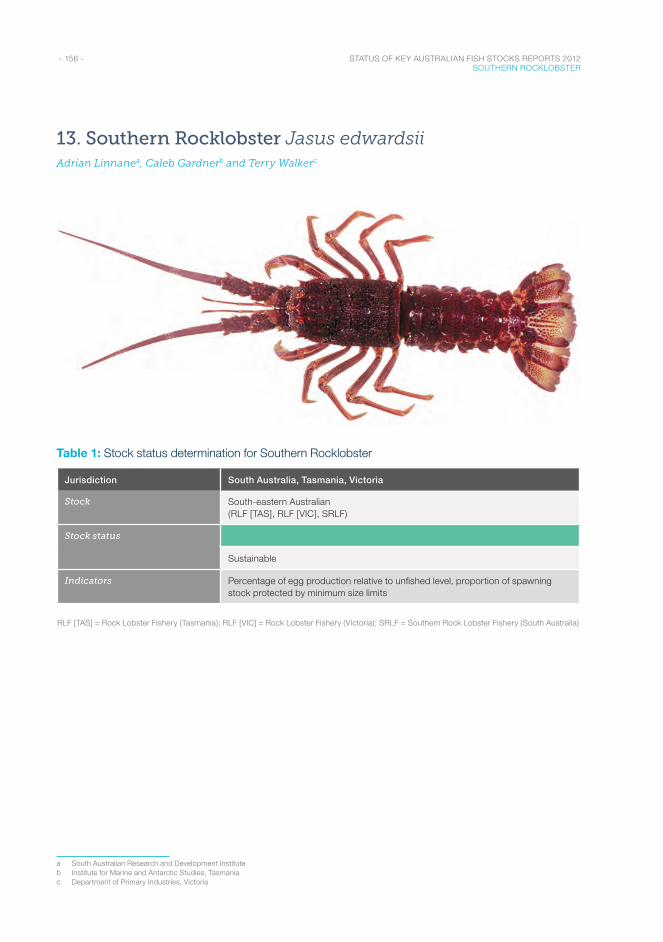
- 156 - STATUS OF KEY AUSTRALIAN FISH STOCKS REPORTS 2012 SOUTHERN ROCKLOBSTER
13. Southern Rocklobster Jasus edwardsiiAdrian Linnanea, Caleb Gardnerb and Terry Walkerc
Table 1: Stock status determination for Southern Rocklobster
Jurisdiction South Australia, Tasmania, Victoria
Stock South-eastern Australian (RLF [TAS], RLF [VIC], SRLF)
Stock status
Sustainable
Indicators Percentage of egg production relative to unfished level, proportion of spawning stock protected by minimum size limits
RLF [TAS] = Rock Lobster Fishery (Tasmania); RLF [VIC] = Rock Lobster Fishery (Victoria); SRLF = Southern Rock Lobster Fishery (South Australia)
a South Australian Research and Development Instituteb Institute for Marine and Antarctic Studies, Tasmaniac Department of Primary Industries, Victoria
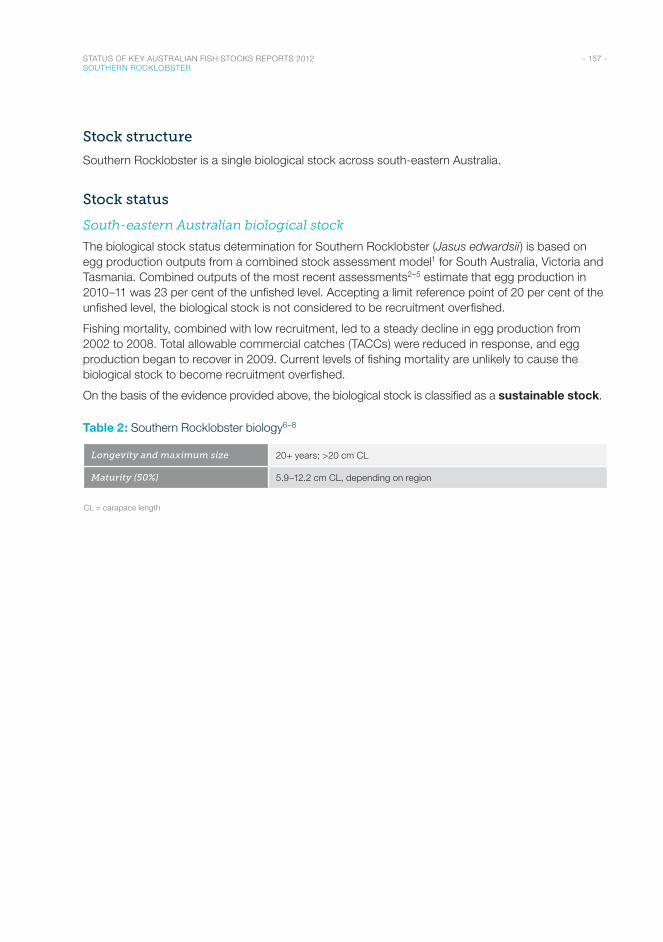
- 157 - STATUS OF KEY AUSTRALIAN FISH STOCKS REPORTS 2012 SOUTHERN ROCKLOBSTER
Stock structure
Southern Rocklobster is a single biological stock across south-eastern Australia.
Stock status
South-eastern Australian biological stock
The biological stock status determination for Southern Rocklobster (Jasus edwardsii) is based on egg production outputs from a combined stock assessment model1 for South Australia, Victoria and Tasmania. Combined outputs of the most recent assessments2–5 estimate that egg production in 2010–11 was 23 per cent of the unfished level. Accepting a limit reference point of 20 per cent of the unfished level, the biological stock is not considered to be recruitment overfished.
Fishing mortality, combined with low recruitment, led to a steady decline in egg production from 2002 to 2008. Total allowable commercial catches (TACCs) were reduced in response, and egg production began to recover in 2009. Current levels of fishing mortality are unlikely to cause the biological stock to become recruitment overfished.
On the basis of the evidence provided above, the biological stock is classified as a sustainable stock.
Table 2: Southern Rocklobster biology6–8
Longevity and maximum size 20+ years; >20 cm CL
Maturity (50%) 5.9–12.2 cm CL, depending on region
CL = carapace length
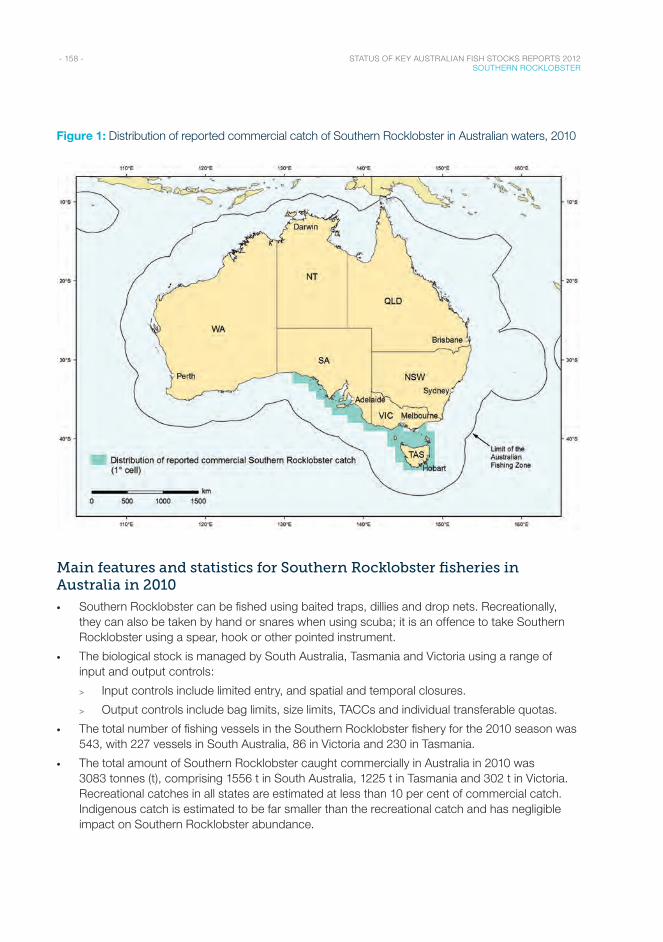
- 158 - STATUS OF KEY AUSTRALIAN FISH STOCKS REPORTS 2012 SOUTHERN ROCKLOBSTER
Figure 1: Distribution of reported commercial catch of Southern Rocklobster in Australian waters, 2010
Main features and statistics for Southern Rocklobster fisheries in Australia in 2010
• Southern Rocklobster can be fished using baited traps, dillies and drop nets. Recreationally, they can also be taken by hand or snares when using scuba; it is an offence to take Southern Rocklobster using a spear, hook or other pointed instrument.
• The biological stock is managed by South Australia, Tasmania and Victoria using a range of input and output controls:
> Input controls include limited entry, and spatial and temporal closures.
> Output controls include bag limits, size limits, TACCs and individual transferable quotas.
• The total number of fishing vessels in the Southern Rocklobster fishery for the 2010 season was 543, with 227 vessels in South Australia, 86 in Victoria and 230 in Tasmania.
• The total amount of Southern Rocklobster caught commercially in Australia in 2010 was 3083 tonnes (t), comprising 1556 t in South Australia, 1225 t in Tasmania and 302 t in Victoria. Recreational catches in all states are estimated at less than 10 per cent of commercial catch. Indigenous catch is estimated to be far smaller than the recreational catch and has negligible impact on Southern Rocklobster abundance.
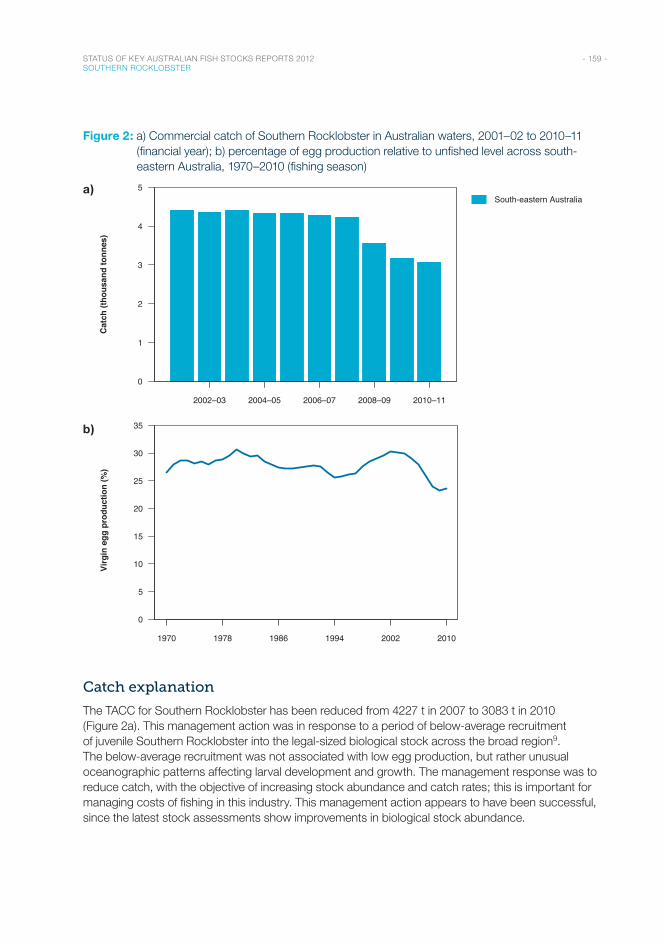
- 159 - STATUS OF KEY AUSTRALIAN FISH STOCKS REPORTS 2012 SOUTHERN ROCKLOBSTER
Figure 2: a) Commercial catch of Southern Rocklobster in Australian waters, 2001–02 to 2010–11 (financial year); b) percentage of egg production relative to unfished level across south-eastern Australia, 1970–2010 (fishing season)
a)
Financial Year
2002–03 2004–05 2006–07 2008–09 2010–11
0
1
2
3
4
5South-eastern Australia
Cat
ch (t
hous
and
tonn
es)
b)
Season
1970 1978 1986 1994 2002 2010
0
5
10
15
20
25
30
35
Virg
in e
gg p
rodu
ctio
n (%
)
Catch explanation
The TACC for Southern Rocklobster has been reduced from 4227 t in 2007 to 3083 t in 2010 (Figure 2a). This management action was in response to a period of below-average recruitment of juvenile Southern Rocklobster into the legal-sized biological stock across the broad region9. The below-average recruitment was not associated with low egg production, but rather unusual oceanographic patterns affecting larval development and growth. The management response was to reduce catch, with the objective of increasing stock abundance and catch rates; this is important for managing costs of fishing in this industry. This management action appears to have been successful, since the latest stock assessments show improvements in biological stock abundance.
- 160 - STATUS OF KEY AUSTRALIAN FISH STOCKS REPORTS 2012 SOUTHERN ROCKLOBSTER
Effects of fishing on the marine environment
• In South Australia, concern has been expressed about potential interactions with Australian Sea Lions in the fishery, specifically the risk of juvenile pups entering pots10. Sea lion excluder devices are routinely fitted into pots in areas where interactions are likely to occur.
• Whale entanglements are recognised as a management issue by the Victorian Southern Rock Lobster Fishery Management Plan11, which has responded with a fishery code of practice to prevent and respond to whale entanglements.
• The Southern Rocklobster biological stock is being rebuilt off eastern Tasmania to assist in the management of Long-spined Sea Urchins2,12. These urchins, which have extended their range southwards from New South Wales, can create barren patches of reef through overgrazing. Rebuilding the Southern Rocklobster biological stock may reduce barren formation through predation on the urchins.
• Habitat impacts of gear have been researched and assessed as being of negligible risk13.
Environmental effects on Southern Rocklobster
• The potential impact of climate change on recruitment, growth and mortality has been identified as a risk across the range of the species14.
• Recruitment, catchability and growth can vary substantially from year to year as a result of environmental changes, including water temperature and movement of oceanic currents9. As mentioned above, below-average recruitment is not necessarily associated with low egg production, but can result from unusual oceanographic patterns that can affect larval development and growth.
References1. Punt, AE, McGarvey, R, Linnane, A, Phillips, J, Triantafillos, L & Feenstra, J 2012, Evaluating empirical decision rules for
southern rock lobster fisheries: a South Australian example, Fisheries Research, 115–116: 60–71.
2. Gardner, C, Hartmann, K & Hobday, D 2011, Tasmanian Rock Lobster Fishery 2009/10, fishery assessment report, Tasmanian Aquaculture and Fisheries Institute, University of Tasmania, Hobart.
3. Linnane, A, McGarvey, R, Feenstra, J & Hawthorne, P 2011, Southern Zone Rock Lobster (Jasus edwardsii) Fishery 2009/10, fishery assessment report to PIRSA Fisheries and Aquaculture by the South Australian Research and Development Institute (Aquatic Sciences), SARDI publication F2007/000276-4, SARDI Research Report Series no. 560, SARDI, Adelaide.
4. Linnane, A, McGarvey, R, Feenstra, J & Hoare, M 2011, Northern Zone Rock Lobster (Jasus edwardsii) Fishery 2009/10, fishery assessment report to PIRSA Fisheries and Aquaculture by the South Australian Research and Development Institute (Aquatic Sciences), SARDI publication F2007/000320-4, SARDI Research Report Series no. 561, SARDI, Adelaide.
5. Walker, TI, Trinnie, FI & Reilly, DJ 2012, Victorian Rock Lobster Fishery stock assessment report 2011, Fisheries Victoria, Department of Primary Industries, Victoria.
6. Gardner, C, Frusher, S, Barrett, N, Haddon, M & Buxton, C 2006, Spatial variation in size at onset of maturity of female southern rocklobster Jasus edwardsii around Tasmania, Australia, Scientia Marina, 70: 423–430.
7. Hobday, DK & Ryan, TJ 1997, Contrasting sizes at sexual maturity of southern rocklobsters (Jasus edwardsii) in the two Victorian fishing zones: implications for total egg production and management, Marine and Freshwater Research, 48: 1009–1114.
8. Linnane, A, Penny, S & Ward, T 2008, Contrasting fecundity, size at maturity and reproductive potential of southern rocklobster Jasus edwardsii in two South Australian fishing regions, Journal of the Marine Biological Association of the UK, 88: 583–589.
9. Linnane, A, Gardner, C, Hobday, D, Punt, A, McGarvey, R, Feenstra, J, Matthews, J & Green, B 2010, Evidence of large-scale spatial declines in recruitment patterns of southern rocklobster Jasus edwardsii, across south-eastern Australia, Fisheries Research, 105: 163–171.
- 161 - STATUS OF KEY AUSTRALIAN FISH STOCKS REPORTS 2012 SOUTHERN ROCKLOBSTER
10. Goldsworthy, SD, Page, B, Shaughnessy, PD & Linnane, A 2010, Mitigating seal interactions in the SRLF and the Gillnet Sector SESSF in South Australia, report to the Fisheries Research and Development Institute by the South Australian Research and Development Institute (Aquatic Sciences), SARDI publication F2009/000613-1, SARDI Research Report Series no. 405, SARDI, Adelaide.
11. Department of Primary Industries 2009, Victorian Rock Lobster Fishery Management Plan, Fisheries Victoria Management Report Series no. 70, Department of Primary Industries, Victoria.
12. Ling, SD, Johnson, CR, Frusher, SD & King, CK 2008, Reproductive potential of a marine ecosystem engineer at the edge of a newly expanded range, Global Change Biology, 14: 907–915.
13. Casement, D & Svane, I 1999, Direct effects of rocklobster pots on temperate shallow rocky reefs in South Australia, a study report to the South Australian rock lobster industry, South Australian Research and Development Institute (Aquatic Sciences), Adelaide.
14. Pecl, G, Frusher, S, Gardner, C, Haward, M, Hobday, A, Jennings, S, Nursey-Bray, M, Punt, A, Revill, H & van Putten, I 2009, The east coast Tasmanian Rock Lobster Fishery—vulnerability to climate change impacts and adaptation response options, report to the Department of Climate Change, Australia.
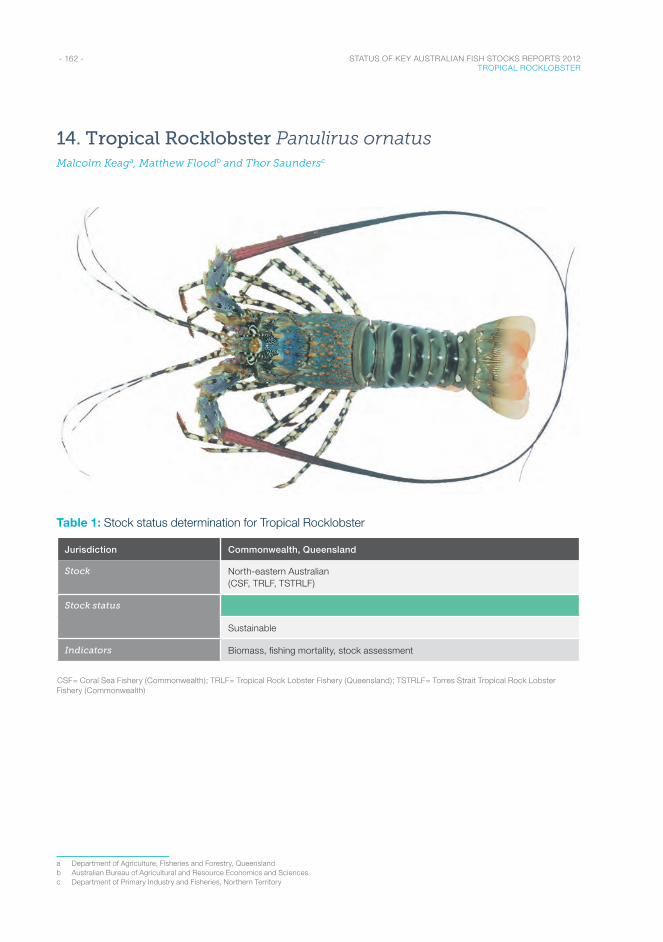
- 162 - STATUS OF KEY AUSTRALIAN FISH STOCKS REPORTS 2012 TROPICAL ROCKLOBSTER
14. Tropical Rocklobster Panulirus ornatusMalcolm Keaga, Matthew Floodb and Thor Saundersc
Table 1: Stock status determination for Tropical Rocklobster
Jurisdiction Commonwealth, Queensland
Stock North-eastern Australian (CSF, TRLF, TSTRLF)
Stock status
Sustainable
Indicators Biomass, fishing mortality, stock assessment
CSF= Coral Sea Fishery (Commonwealth); TRLF= Tropical Rock Lobster Fishery (Queensland); TSTRLF= Torres Strait Tropical Rock Lobster Fishery (Commonwealth)
a Department of Agriculture, Fisheries and Forestry, Queenslandb Australian Bureau of Agricultural and Resource Economics and Sciencesc Department of Primary Industry and Fisheries, Northern Territory
- 163 - STATUS OF KEY AUSTRALIAN FISH STOCKS REPORTS 2012 TROPICAL ROCKLOBSTER
Stock structure
The Tropical Rocklobster populations in northern Queensland (managed by Queensland), the Coral Sea (managed by the Commonwealth) and the Torres Strait (managed under the Torres Strait Protected Zone Joint Authority) are thought to comprise a single biological stock, as a result of the mixing of larvae in the Coral Sea1. Stock assessments have not been carried out for the complete biological stock, but have been conducted on the various parts of the biological stock.
Stock status
North-eastern Australia biological stock
Stock status for the entire Tropical Rocklobster biological stock has been established using evidence from the Queensland, Coral Sea and Torres Strait parts of the biological stock.
For the Torres Strait part of the biological stock, the most recent assessment2 estimated that biomass in 2010 was 75 per cent of the unfished (1973) level. This part of the biological stock is not considered to be recruitment overfished. The model generated a nominal total allowable catch (TAC) for 2010 of 853 tonnes (t), with 763 t caught3. Therefore, the level of fishing mortality is unlikely to cause this part of the biological stock to become recruitment overfished.
For the Queensland part of the biological stock, the most recent stock assessment4 estimated that biomass at the start of 2008 was 60–70 per cent of the unfished (1988) level. The commercial catch since 2009 has been less than the conservatively set TAC (195 t in 2010)5. As a result, this part of the biological stock is not considered to be recruitment overfished, and current fishing mortality is unlikely to cause this part of the biological stock to become recruitment overfished.
No formal stock assessments have been carried out for the Coral Sea part of the biological stock, but there is only limited targeting of Tropical Rocklobster in this area. Estimates of density on Coral Sea reefs, inferred from fishers’ catch rates, suggest that lobster abundance is likely to be many times higher than would be required to support the total historical catch (<10 t)3. This part of the biological stock is not considered to be recruitment overfished. Additionally, no commercial catch was recorded in 2010. Therefore, fishing mortality is unlikely to cause this part of the biological stock to become recruitment overfished.
On the basis of the evidence provided above, the biological stock is classified as a sustainable stock.
Other potential stocks
Although Tropical Rocklobster is present in both the Northern Territory and northern Western Australia, it is not commercially fished in either jurisdiction or in Queensland waters of the Gulf of Carpentaria. Biological stock structures in these regions have not been studied.
Table 2: Tropical Rocklobster biology6–8
Longevity and maximum size 3–5+ years; >15 cm CL
Maturity (50%) 2–3 years; ~10 cm CL
CL = carapace length
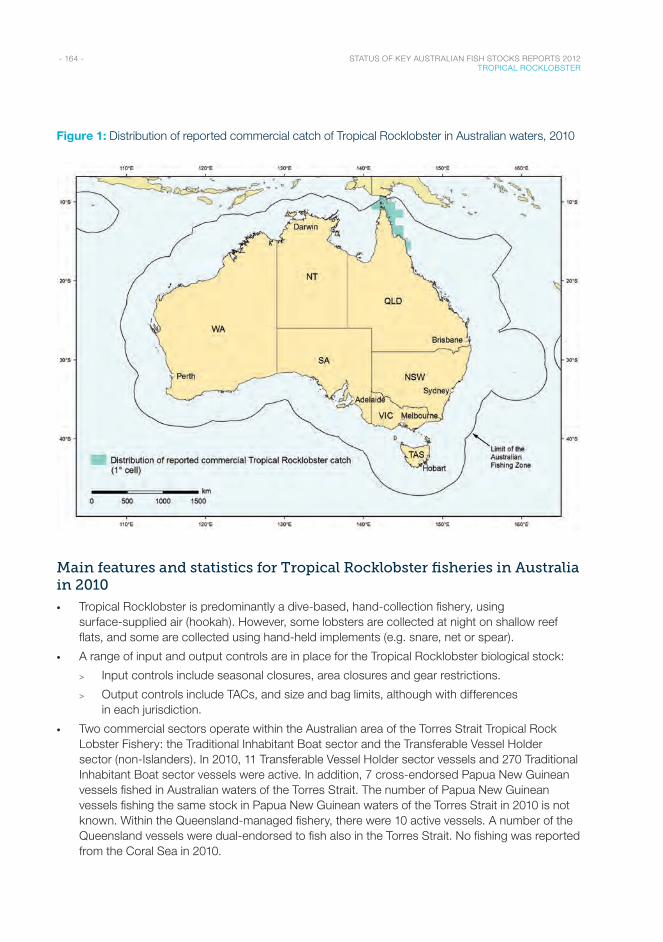
- 164 - STATUS OF KEY AUSTRALIAN FISH STOCKS REPORTS 2012 TROPICAL ROCKLOBSTER
Figure 1: Distribution of reported commercial catch of Tropical Rocklobster in Australian waters, 2010
Main features and statistics for Tropical Rocklobster fisheries in Australia in 2010
• Tropical Rocklobster is predominantly a dive-based, hand-collection fishery, using surface-supplied air (hookah). However, some lobsters are collected at night on shallow reef flats, and some are collected using hand-held implements (e.g. snare, net or spear).
• A range of input and output controls are in place for the Tropical Rocklobster biological stock:
> Input controls include seasonal closures, area closures and gear restrictions.
> Output controls include TACs, and size and bag limits, although with differences in each jurisdiction.
• Two commercial sectors operate within the Australian area of the Torres Strait Tropical Rock Lobster Fishery: the Traditional Inhabitant Boat sector and the Transferable Vessel Holder sector (non-Islanders). In 2010, 11 Transferable Vessel Holder sector vessels and 270 Traditional Inhabitant Boat sector vessels were active. In addition, 7 cross-endorsed Papua New Guinean vessels fished in Australian waters of the Torres Strait. The number of Papua New Guinean vessels fishing the same stock in Papua New Guinean waters of the Torres Strait in 2010 is not known. Within the Queensland-managed fishery, there were 10 active vessels. A number of the Queensland vessels were dual-endorsed to fish also in the Torres Strait. No fishing was reported from the Coral Sea in 2010.
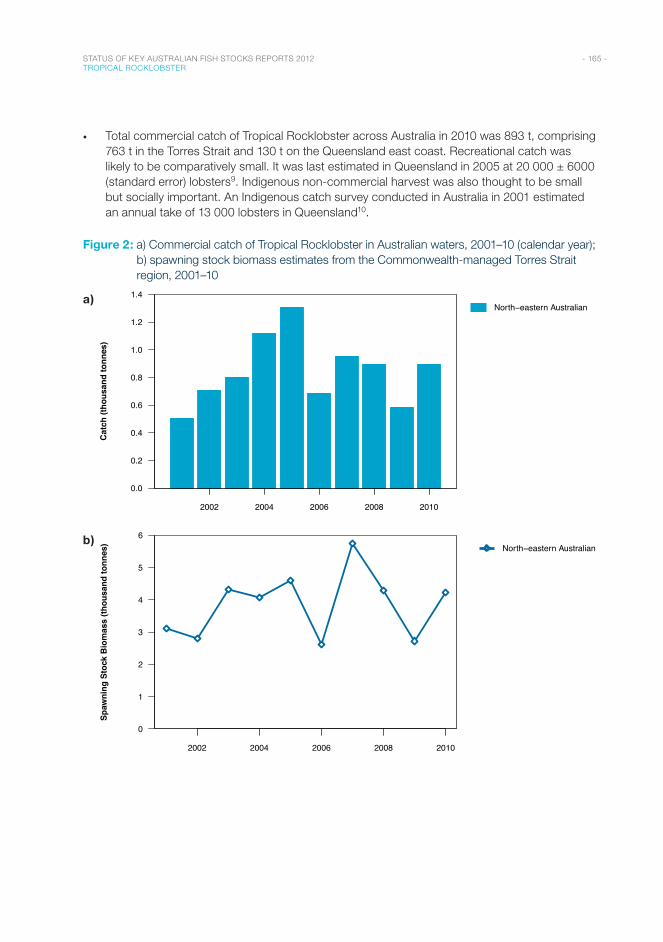
- 165 - STATUS OF KEY AUSTRALIAN FISH STOCKS REPORTS 2012 TROPICAL ROCKLOBSTER
• Total commercial catch of Tropical Rocklobster across Australia in 2010 was 893 t, comprising 763 t in the Torres Strait and 130 t on the Queensland east coast. Recreational catch was likely to be comparatively small. It was last estimated in Queensland in 2005 at 20 000 ± 6000 (standard error) lobsters9. Indigenous non-commercial harvest was also thought to be small but socially important. An Indigenous catch survey conducted in Australia in 2001 estimated an annual take of 13 000 lobsters in Queensland10.
Figure 2: a) Commercial catch of Tropical Rocklobster in Australian waters, 2001–10 (calendar year); b) spawning stock biomass estimates from the Commonwealth-managed Torres Strait region, 2001–10
a)
Year
2002 2004 2006 2008 2010
0.0
0.2
0.4
0.6
0.8
1.0
1.2
1.4North−eastern Australian
Cat
ch (t
hous
and
tonn
es)
b)
Year
2002 2004 2006 2008 2010
0
1
2
3
4
5
6North−eastern Australian
Spaw
ning
Sto
ck B
iom
ass
(thou
sand
tonn
es)
- 166 - STATUS OF KEY AUSTRALIAN FISH STOCKS REPORTS 2012 TROPICAL ROCKLOBSTER
Catch explanation
Commercial catch of Tropical Rocklobster peaked in 2005 at approximately 1300 t (estimated whole weight) and has since declined to an average of approximately 800 t per year over the period 2006–10. Fluctuations in yearly catch of Tropical Rocklobster may be explained by fluctuations in recruitment and/or in economic drivers, such as input prices (e.g. fuel) and demand for rocklobster, particularly in major export markets3,5.
There is no indicator that covers the entire biological stock. However the integrated stock assessment model for the Torres Strait provides an estimated biomass each year for the following three years2. Estimated spawning stock biomass results show the variability expected, given the known dependence of the Tropical Rocklobster’s life cycle on environmental conditions. However, there were no significant trends in the spawning biomass for the period 2001–102.
Effects of fishing on the marine environment
• Fishing for Tropical Rocklobster has little direct impact on the marine environment or other fish species, since hand-collection fishing methods allow careful selection of catch3.
Environmental effects on Tropical Rocklobster
• The abundance of Tropical Rocklobster is highly influenced by environmental conditions, which affect settlement and recruitment. Ocean current and wind patterns affect transport of larvae and create variability in abundance. These variations should be taken into account in setting TACs1,7.
References1. Pitcher, CR, Turnbull, CT, Atfield, J, Griffin, D, Dennis, D & Skewes, T 2005, Biology, larval transport modelling and
commercial logbook data analysis to support management of the NE Queensland rocklobster Panulirus ornatus fishery, Fisheries Research and Development Corporation project 2002/008, CSIRO Marine Research, Brisbane.
2. Plagányi, É, Dennis, D & Campbell, R 2011, 2011 assessment of the Tropical Rocklobster (Panulirus ornatus) Fishery in the Torres Straits, CSIRO Marine and Atmospheric Research, Brisbane.
3. Woodhams, J, Stobutzki, I, Vieira, S, Curtotti, R & Begg, GA (eds) 2011, Fishery status reports 2010: status of fish stocks and fisheries managed by the Australian Government, Australian Bureau of Agricultural and Resource Economics and Sciences, Canberra.
4. Turnbull, CT 2008, Report to the ECTRL WG on modifications to the assessment process—July 2008, updated August 2008, Queensland Department of Primary Industries and Fisheries, Cairns.
5. Queensland Department of Employment, Economic Development and Innovation 2011, Annual status report 2011: commercial crayfish and rocklobster fishery, DEEDI, Brisbane.
6. Kailola, PJ, Williams, M, Stewart, P, Riechelt, R, McNee, A & Grieve, C 1993, Australian fisheries resources, Bureau of Resource Sciences & Fisheries Research and Development Corporation, Canberra.
7. MacFarlane, JW & Moore, R 1986, Reproduction of the ornate rocklobster, Panulirus ornatus (Fabricius), in Papua New Guinea, Australian Journal of Marine and Freshwater Research, 37: 55–65.
8. Skewes, TD, Pitcher, CR & Dennis, DM 1997, Growth of ornate rocklobsters, Panulirus ornatus, in Torres Strait, Australia, Marine and Freshwater Research, 48: 497–501.
9. McInnes, K 2008, Experimental results from the fourth Queensland recreational fishing diary program (2005): PR08-3838, Queensland Department of Primary Industries and Fisheries, Brisbane.
10. Henry, GW & Lyle, JM 2003 (eds), National recreational and Indigenous fishing survey, Fisheries Research and Development Corporation project 99/158, Australian Government Department of Agriculture, Fisheries and Forestry, Canberra, http://eprints.utas.edu.au/2526/1/Henry_Lyle_Nationalsurvey.pdf.
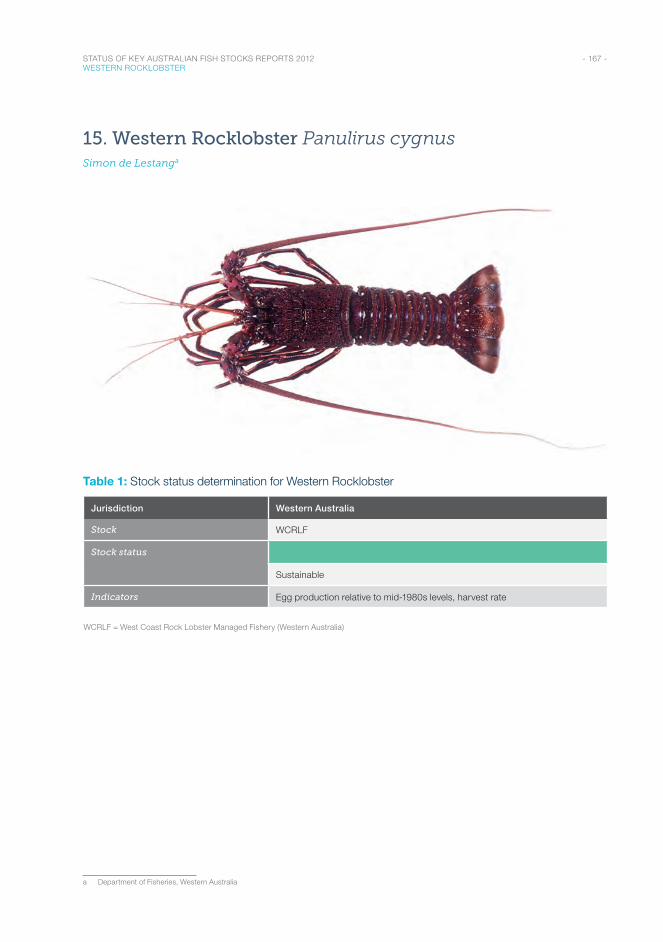
- 167 - STATUS OF KEY AUSTRALIAN FISH STOCKS REPORTS 2012 WESTERN ROCKLOBSTER
15. Western Rocklobster Panulirus cygnusSimon de Lestanga
Table 1: Stock status determination for Western Rocklobster
Jurisdiction Western Australia
Stock WCRLF
Stock status
Sustainable
Indicators Egg production relative to mid-1980s levels, harvest rate
WCRLF = West Coast Rock Lobster Managed Fishery (Western Australia)
a Department of Fisheries, Western Australia
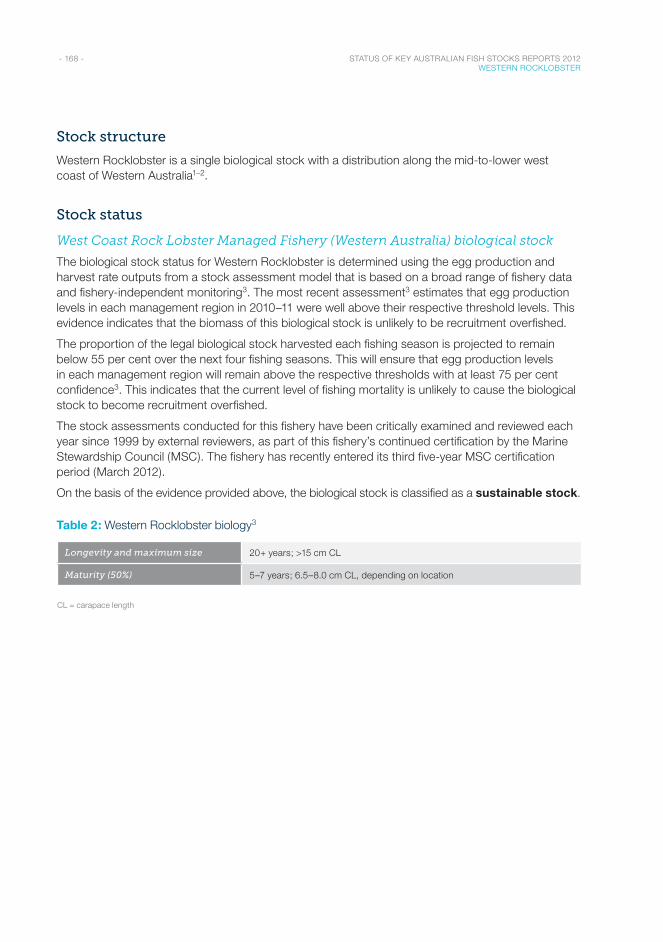
- 168 - STATUS OF KEY AUSTRALIAN FISH STOCKS REPORTS 2012 WESTERN ROCKLOBSTER
Stock structure
Western Rocklobster is a single biological stock with a distribution along the mid-to-lower west coast of Western Australia1–2.
Stock status
West Coast Rock Lobster Managed Fishery (Western Australia) biological stock
The biological stock status for Western Rocklobster is determined using the egg production and harvest rate outputs from a stock assessment model that is based on a broad range of fishery data and fishery-independent monitoring3. The most recent assessment3 estimates that egg production levels in each management region in 2010–11 were well above their respective threshold levels. This evidence indicates that the biomass of this biological stock is unlikely to be recruitment overfished.
The proportion of the legal biological stock harvested each fishing season is projected to remain below 55 per cent over the next four fishing seasons. This will ensure that egg production levels in each management region will remain above the respective thresholds with at least 75 per cent confidence3. This indicates that the current level of fishing mortality is unlikely to cause the biological stock to become recruitment overfished.
The stock assessments conducted for this fishery have been critically examined and reviewed each year since 1999 by external reviewers, as part of this fishery’s continued certification by the Marine Stewardship Council (MSC). The fishery has recently entered its third five-year MSC certification period (March 2012).
On the basis of the evidence provided above, the biological stock is classified as a sustainable stock.
Table 2: Western Rocklobster biology3
Longevity and maximum size 20+ years; >15 cm CL
Maturity (50%) 5–7 years; 6.5–8.0 cm CL, depending on location
CL = carapace length
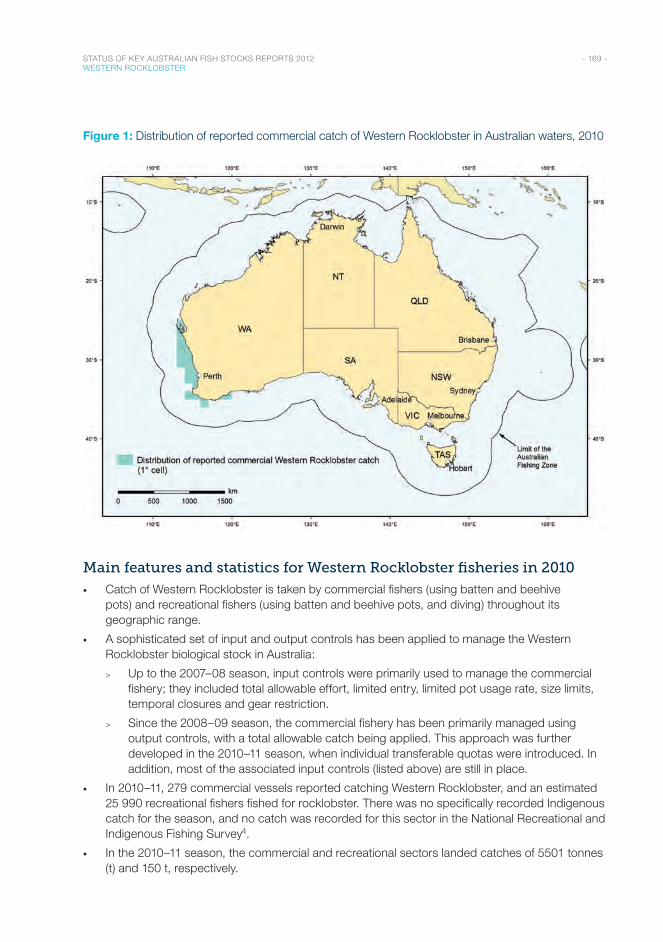
- 169 - STATUS OF KEY AUSTRALIAN FISH STOCKS REPORTS 2012 WESTERN ROCKLOBSTER
Figure 1: Distribution of reported commercial catch of Western Rocklobster in Australian waters, 2010
Main features and statistics for Western Rocklobster fisheries in 2010
• Catch of Western Rocklobster is taken by commercial fishers (using batten and beehive pots) and recreational fishers (using batten and beehive pots, and diving) throughout its geographic range.
• A sophisticated set of input and output controls has been applied to manage the Western Rocklobster biological stock in Australia:
> Up to the 2007–08 season, input controls were primarily used to manage the commercial fishery; they included total allowable effort, limited entry, limited pot usage rate, size limits, temporal closures and gear restriction.
> Since the 2008–09 season, the commercial fishery has been primarily managed using output controls, with a total allowable catch being applied. This approach was further developed in the 2010–11 season, when individual transferable quotas were introduced. In addition, most of the associated input controls (listed above) are still in place.
• In 2010–11, 279 commercial vessels reported catching Western Rocklobster, and an estimated 25 990 recreational fishers fished for rocklobster. There was no specifically recorded Indigenous catch for the season, and no catch was recorded for this sector in the National Recreational and Indigenous Fishing Survey4.
• In the 2010–11 season, the commercial and recreational sectors landed catches of 5501 tonnes (t) and 150 t, respectively.
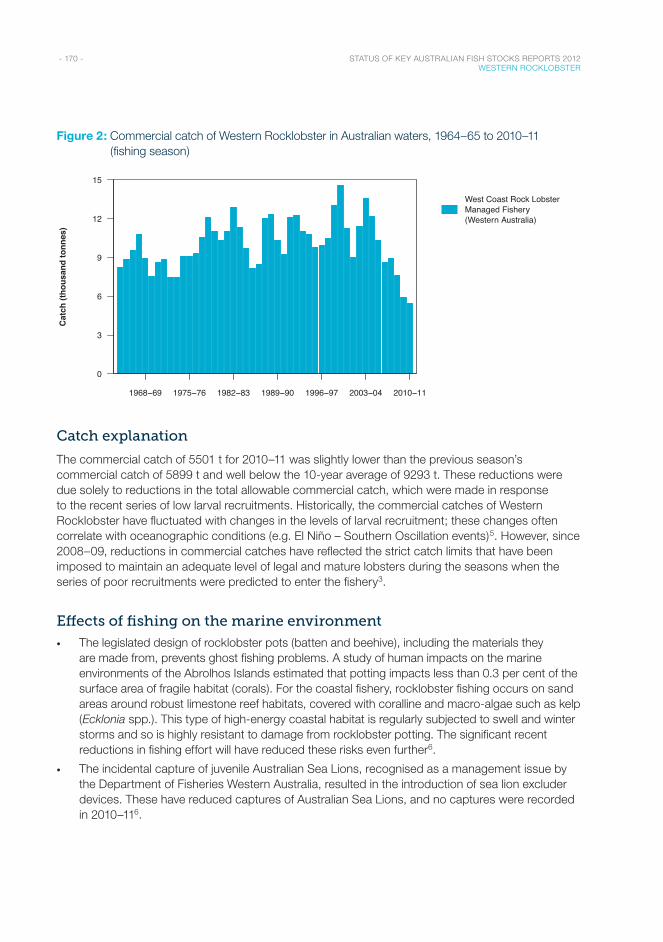
- 170 - STATUS OF KEY AUSTRALIAN FISH STOCKS REPORTS 2012 WESTERN ROCKLOBSTER
Figure 2: Commercial catch of Western Rocklobster in Australian waters, 1964–65 to 2010–11 (fishing season)
Financial Year
1968−69 1975−76 1982−83 1989−90 1996−97 2003−04 2010−11
0
3
6
9
12
15
West Coast Rock LobsterManaged Fishery(Western Australia)
Cat
ch (t
hous
and
tonn
es)
Catch explanation
The commercial catch of 5501 t for 2010–11 was slightly lower than the previous season’s commercial catch of 5899 t and well below the 10-year average of 9293 t. These reductions were due solely to reductions in the total allowable commercial catch, which were made in response to the recent series of low larval recruitments. Historically, the commercial catches of Western Rocklobster have fluctuated with changes in the levels of larval recruitment; these changes often correlate with oceanographic conditions (e.g. El Niño – Southern Oscillation events)5. However, since 2008–09, reductions in commercial catches have reflected the strict catch limits that have been imposed to maintain an adequate level of legal and mature lobsters during the seasons when the series of poor recruitments were predicted to enter the fishery3.
Effects of fishing on the marine environment
• The legislated design of rocklobster pots (batten and beehive), including the materials they are made from, prevents ghost fishing problems. A study of human impacts on the marine environments of the Abrolhos Islands estimated that potting impacts less than 0.3 per cent of the surface area of fragile habitat (corals). For the coastal fishery, rocklobster fishing occurs on sand areas around robust limestone reef habitats, covered with coralline and macro-algae such as kelp (Ecklonia spp.). This type of high-energy coastal habitat is regularly subjected to swell and winter storms and so is highly resistant to damage from rocklobster potting. The significant recent reductions in fishing effort will have reduced these risks even further6.
• The incidental capture of juvenile Australian Sea Lions, recognised as a management issue by the Department of Fisheries Western Australia, resulted in the introduction of sea lion excluder devices. These have reduced captures of Australian Sea Lions, and no captures were recorded in 2010–116.
- 171 - STATUS OF KEY AUSTRALIAN FISH STOCKS REPORTS 2012 WESTERN ROCKLOBSTER
• Australian Sea Lions, seals and sharks are particularly susceptible to injury or death through entanglement in uncut plastic bait bands. These bands also contribute to plastic debris washed up on shorelines. In 2012, a state-wide ban on the carriage of bait bands out to sea was implemented.
• Research monitoring of commercial bycatch occurs across the fishery. No issues of concern have been identified6.
Environmental effects on Western Rocklobster
• Annual variation in the abundance of puerulus (larval lobsters) has historically been associated with fluctuations in offshore water temperatures, the strength of the Leeuwin Current and the incidence of storm fronts crossing the west coast during spring5. More recently, other factors, such as offshore winds during settlement, have been identified as possible contributors to these variations.
• Many aspects of the Western Rocklobster’s life history, such as growth, migration, size at maturity and catchability, appear to be sensitive to changes in water temperature. Recent increasing long-term trends in water temperature have occurred at the same time as declines in size at maturity6 and size at migration7, and an increase in the proportion of female lobsters moulting out of setose in autumn8.
References1. Johnson, MS 1999, Temporal variation of recruits as a basis of ephemeral genetic heterogeneity in the western
rocklobster, Panulirus cygnus George, Marine Biology (Berlin), 135: 133–139.
2. Thompson, AP, Hanley, JR & Johnson, MS 1996, Genetic structure of the western rocklobster, Panulirus cygnus, with the benefit of hindsight, Marine and Freshwater Research, 47: 889–896.
3. de Lestang, S, Caputi, N, How, J, Thomson, A & Stephenson, P 2012, Stock assessment for the West Coast Rock Lobster Fishery, Fisheries Research Report 217, Western Australian Department of Fisheries, North Beach, www.fish.wa.gov.au/Documents/research_reports/frr217.pdf.
4. Henry, GW & Lyle, JM (eds) 2003, The national recreational and Indigenous fishing survey, Fisheries Research and Development Corporation project 1999/158, Australian Government Department of Agriculture, Fisheries and Forestry, Canberra, http://eprints.utas.edu.au/2526/1/Henry_Lyle_Nationalsurvey.pdf.
5. Caputi, N, Chubb, CF & Pearce, A 2001, Environmental effects on recruitment of the western rocklobster, Panulirus cygnus, Marine and Freshwater Research, 52: 1167–1175.
6. Melville-Smith, R & de Lestang, S 2006, Spatial and temporal variation in the size at maturity of the western rocklobster Panulirus cygnus, Marine Biology, 150: 183–195.
7. Caputi, N, Melville-Smith, R, de Lestang, S, Pearce, P & Feng, M 2010, The effect of climate change on the western rocklobster (Panulirus cygnus) fishery of Western Australia, Canadian Journal of Fish and Aquatic Sciences, 67: 85–96.
8. de Lestang, S & Melville-Smith, R 2006, Interannual variation in the moult cycle and size at double breeding of mature female western rocklobster Panulirus cygnus, ICES Journal of Marine Science, 63: 1631–1639.

Crustaceans : PrawnsEastern King Prawn / Blue and Red Endeavour Prawns / Tiger Prawns
Western King Prawn / White Banana Prawn
P R A W N S A R E O N E O F T H E M O S T V E R S AT I L E A N D W I D E LY A V A I L A B L E S E A F O O D S W O R L D W I D E .
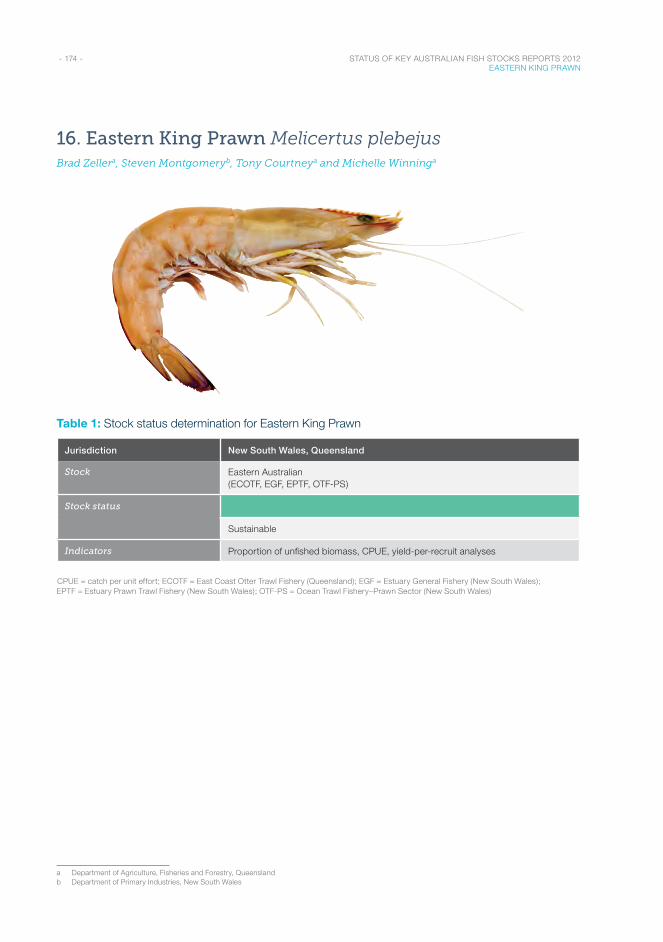
- 174 - STATUS OF KEY AUSTRALIAN FISH STOCKS REPORTS 2012 EASTERN KING PRAWN
16. Eastern King Prawn Melicertus plebejusBrad Zellera, Steven Montgomeryb, Tony Courtneya and Michelle Winninga
Table 1: Stock status determination for Eastern King Prawn
Jurisdiction New South Wales, Queensland
Stock Eastern Australian (ECOTF, EGF, EPTF, OTF-PS)
Stock status
Sustainable
Indicators Proportion of unfished biomass, CPUE, yield-per-recruit analyses
CPUE = catch per unit effort; ECOTF = East Coast Otter Trawl Fishery (Queensland); EGF = Estuary General Fishery (New South Wales); EPTF = Estuary Prawn Trawl Fishery (New South Wales); OTF-PS = Ocean Trawl Fishery –Prawn Sector (New South Wales)
a Department of Agriculture, Fisheries and Forestry, Queenslandb Department of Primary Industries, New South Wales
- 175 - STATUS OF KEY AUSTRALIAN FISH STOCKS REPORTS 2012 EASTERN KING PRAWN
Stock structure
Eastern King Prawn is one of two Australian species (the other being Western King Prawn) recognised by the standard fish name ‘King Prawn’1. Eastern King Prawns are harvested in Queensland and New South Wales fisheries and are considered a single multi-jurisdictional biological stock2–3. There are two contiguous management units for the stock: one from 22 to 28ºS in Queensland, and another along the whole New South Wales coast (28–37.5ºS). A comprehensive assessment of recruitment dynamics and optimal yield of the whole Eastern King Prawn fishery biological stock is under way. Status determination is made on the basis of the single multi-jurisdictional biological stock.
Stock status
Eastern Australian biological stock
The most recent quantitative stock assessment undertaken on the biological stock3 estimated maximum sustainable yield (MSY) at 2612 tonnes (t) (90 per cent confidence interval 1694–4065 t) and effort at MSY (EMSY), standardised to the number of boat nights in 2001, as 25 664 boat nights (90 per cent confidence interval 15 477–67 447 boat nights). Although the overall trend in nominal trawl effort in both Queensland and New South Wales has declined in recent years, from around 30 000 boat days in 2000 to less than 20 000 boat days in 2009–10, the fishing power of vessels has increased by around 50 per cent over the past two decades4. The decline in nominal effort has been offset by the increase in fishing power, leading to higher catch rates and record harvests in Queensland in recent years5.
Population modelling6 indicated that the New South Wales part of the biological stock was very resilient under the assumption of stable levels of recruitment from Queensland. From 2008 to 2010, total landings from Queensland and New South Wales exceeded 3000 t. Although this catch exceeds the MSY estimate, it is within the 90 per cent confidence intervals of the mean. Given that catch and standardised catch per unit effort have been fairly stable over the past 20 years, it is unlikely that the biological stock is recruitment overfished.
It is unlikely that fishing effort will increase in this fishery, given the increasing costs of production (fuel, labour, etc.). The catch of prawns in 2010, although higher than in 2009, was within the range observed in the past 10 years. The current level of fishing mortality is unlikely to cause the biological stock to become recruitment overfished.
On the basis of the evidence provided above, the biological stock is classified as a sustainable stock.
Table 2: Eastern King Prawn biology7
Longevity and maximum size 3 years; males 4.7 cm CL, females 6.1 cm CL
Maturity (50%) Females 4 cm CL
CL = carapace length
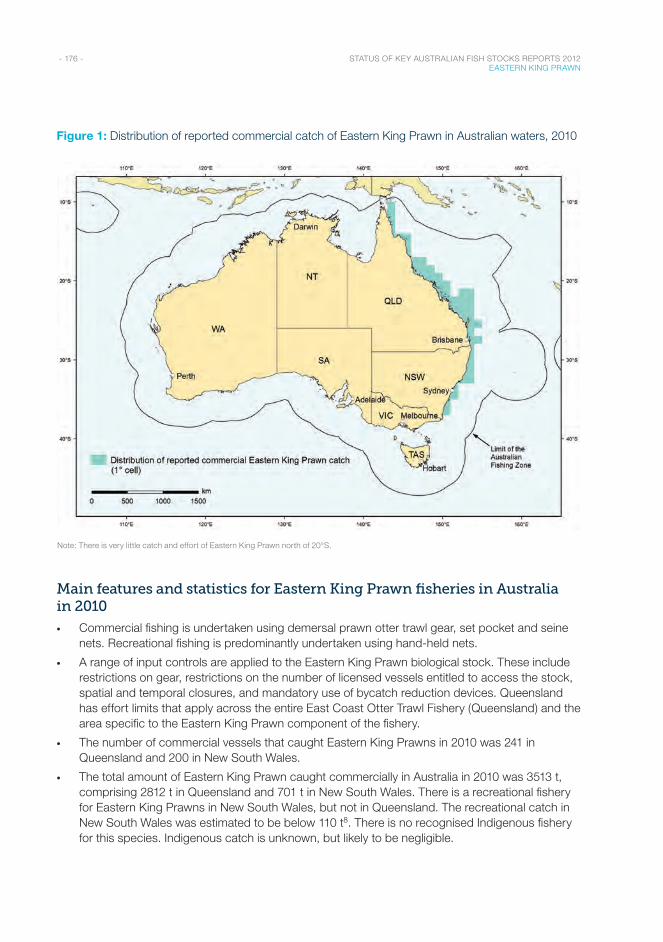
- 176 - STATUS OF KEY AUSTRALIAN FISH STOCKS REPORTS 2012 EASTERN KING PRAWN
Figure 1: Distribution of reported commercial catch of Eastern King Prawn in Australian waters, 2010
Note: There is very little catch and effort of Eastern King Prawn north of 20°S.
Main features and statistics for Eastern King Prawn fisheries in Australia in 2010
• Commercial fishing is undertaken using demersal prawn otter trawl gear, set pocket and seine nets. Recreational fishing is predominantly undertaken using hand-held nets.
• A range of input controls are applied to the Eastern King Prawn biological stock. These include restrictions on gear, restrictions on the number of licensed vessels entitled to access the stock, spatial and temporal closures, and mandatory use of bycatch reduction devices. Queensland has effort limits that apply across the entire East Coast Otter Trawl Fishery (Queensland) and the area specific to the Eastern King Prawn component of the fishery.
• The number of commercial vessels that caught Eastern King Prawns in 2010 was 241 in Queensland and 200 in New South Wales.
• The total amount of Eastern King Prawn caught commercially in Australia in 2010 was 3513 t, comprising 2812 t in Queensland and 701 t in New South Wales. There is a recreational fishery for Eastern King Prawns in New South Wales, but not in Queensland. The recreational catch in New South Wales was estimated to be below 110 t8. There is no recognised Indigenous fishery for this species. Indigenous catch is unknown, but likely to be negligible.
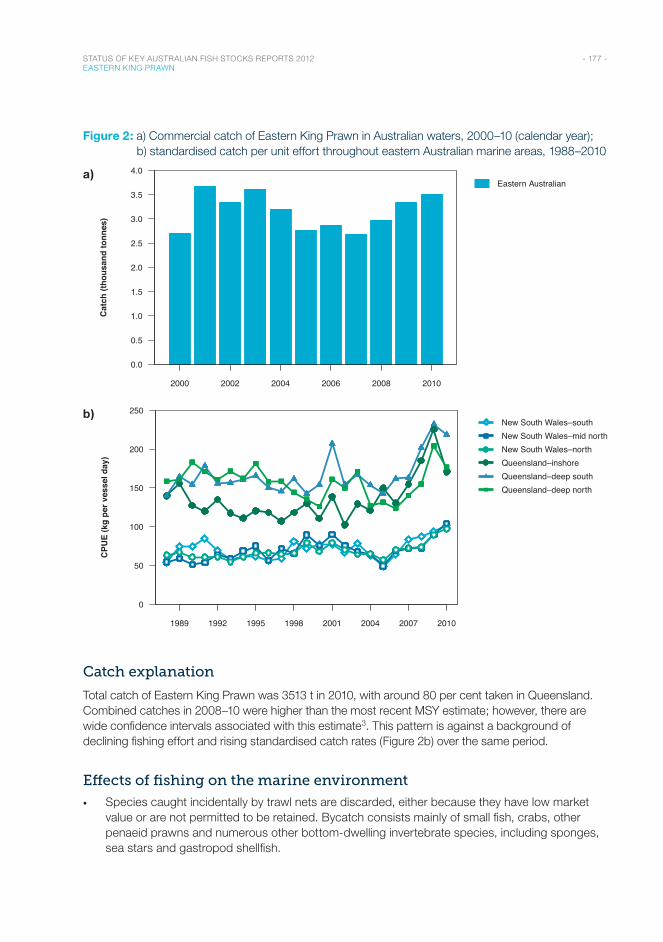
- 177 - STATUS OF KEY AUSTRALIAN FISH STOCKS REPORTS 2012 EASTERN KING PRAWN
Figure 2: a) Commercial catch of Eastern King Prawn in Australian waters, 2000–10 (calendar year); b) standardised catch per unit effort throughout eastern Australian marine areas, 1988–2010
a)
Year
2000 2002 2004 2006 2008 2010
0.0
0.5
1.0
1.5
2.0
2.5
3.0
3.5
4.0Eastern Australian
Cat
ch (t
hous
and
tonn
es)
b)
Catch explanation
Total catch of Eastern King Prawn was 3513 t in 2010, with around 80 per cent taken in Queensland. Combined catches in 2008–10 were higher than the most recent MSY estimate; however, there are wide confidence intervals associated with this estimate3. This pattern is against a background of declining fishing effort and rising standardised catch rates (Figure 2b) over the same period.
Effects of fishing on the marine environment
• Species caught incidentally by trawl nets are discarded, either because they have low market value or are not permitted to be retained. Bycatch consists mainly of small fish, crabs, other penaeid prawns and numerous other bottom-dwelling invertebrate species, including sponges, sea stars and gastropod shellfish.
Year
1989 1992 1995 1998 2001 2004 2007 2010
0
50
100
150
200
250New South Wales–southNew South Wales–mid northNew South Wales–northQueensland–inshoreQueensland–deep southQueensland–deep north
CPU
E (k
g pe
r ves
sel d
ay)
- 178 - STATUS OF KEY AUSTRALIAN FISH STOCKS REPORTS 2012 EASTERN KING PRAWN
• The mandatory use of bycatch reduction devices has been shown to reduce bycatch in the trawl fisheries9–11.
• Interactions known to occur between the fishing gear used to target Eastern King Prawn and protected species, such as sea turtles and sea snakes, are partly mitigated by mandatory use of turtle excluder and other bycatch reduction devices.
Environmental effects on Eastern King Prawn
• Climate change is likely to have a significant long-term effect on the distribution of this species. Under a scenario of increasing sea surface temperatures, a strengthening East Australian Current and changing freshwater flows, the distribution of Eastern King Prawn may shift southwards, potentially impacting recruitment and the timing of migration2,12.
• An analysis of 23 years of daily logbook catches of Eastern King Prawns in Moreton Bay13 suggests that, under a climate change scenario of increasing coastal water temperatures, the abundance of Eastern King Prawn recruits in spring and early summer is likely to decline, resulting in a slight long-term reduction in abundance in south-east Queensland.
• Destruction of seagrass beds and alteration of water flows in estuaries could affect the area of nursery grounds available to recruiting prawns. This may affect the size of the biological stock available for capture.
References1. Seafood Services Australia 2012, Standard fish name: king prawn, http://fishnames.com.au/fishnames/fishnames.
php?pid=51.
2. Montgomery, SS 1990, Possible impacts of the greenhouse effect on commercial prawn populations and fisheries in New South Wales, Wetlands (Australia), 10: 35–39.
3. O’Neill, MF, Courtney, AJ, Good, NM, Turnbull, CT, Yeomans, KM, Staunton-Smith, J & Shootingstar, C 2005, Reference point management and the role of catch-per-unit effort in prawn and scallop fisheries, final report to the Fisheries Research and Development Corporation, project 1999/120, Queensland Department of Primary Industries and Fisheries, Brisbane.
4. O’Neill, MF & Leigh, GM 2006, Fishing power and catch rates in the Queensland East Coast Trawl Fishery, Queensland Department of Primary Industries and Fisheries, Brisbane.
5. Queensland Department of Employment, Economic Development and Innovation 2011, Stock status of Queensland’s fisheries resources 2011, DEEDI, Brisbane.
6. Ives, MC & Scandol, JP 2007, A bayesian analysis of NSW eastern king prawn stocks (Melicertus plebejus) using multiple model structures, Fisheries Research, 84(3): 314–327.
7. Lloyd-Jones, LR, Wang, Y-G, Courtney, AJ, Prosser, AJ & Montgomery, SS 2012, Latitudinal and seasonal effects on growth of the Australian Eastern King Prawn (Melicertus plebejus), Canadian Journal of Fisheries and Aquatic Sciences, 69: 1525–1538.
8. Rowling, K, Hegarty, A & Ives, M (eds) 2010, Status of fisheries resources in NSW 2008/09, NSW Industry & Investment, Cronulla.
9. Broadhurst, MK 2003, Reducing unwanted bycatch and improving size selectivity in NSW prawn fisheries, Professional Fisherman, October 2003: 16–17.
10. Broadhurst, MK, Macbeth, WG & Wooden, MEL 2005, Reducing the discarding of small prawns in NSW’s commercial and recreational prawn fisheries, final report to the Fisheries Research and Development Corporation, project 2001/031, NSW Fisheries, Cronulla.
11. Courtney, AJ, Tonks, ML, Campbell, MJ, Roy, DP, Gaddes, SW, Kyne, PM & O’Neill, MF 2006, Quantifying the effects of bycatch reduction devices in Queensland’s (Australia) shallow water Eastern King Prawn (Penaeus plebejus) trawl fishery, Fisheries Research, 80(2–3): 136–147.
12. Pecl, GT, Ward, T, Doubleday, Z, Clarke, S, Day, J, Dixon, C, Frusher, S, Gibbs, P, Hobday, A, Hutchinson, N, Jennings, S, Jones, K, Li, X, Spooner, D & Stoklosa, R 2011, Risk assessment of impacts of climate change for key marine species in south eastern Australia, part 1: fisheries and aquaculture risk assessment, Fisheries Research and Development Corporation, project 2009/070.
13. Courtney, T & O’Neill, M 2011, Abiotic influences on southeast Queensland prawn fisheries and implications for climate change, Seafood CRC project 2009/774, Queensland Department of Employment, Economic Development and Innovation, Brisbane.
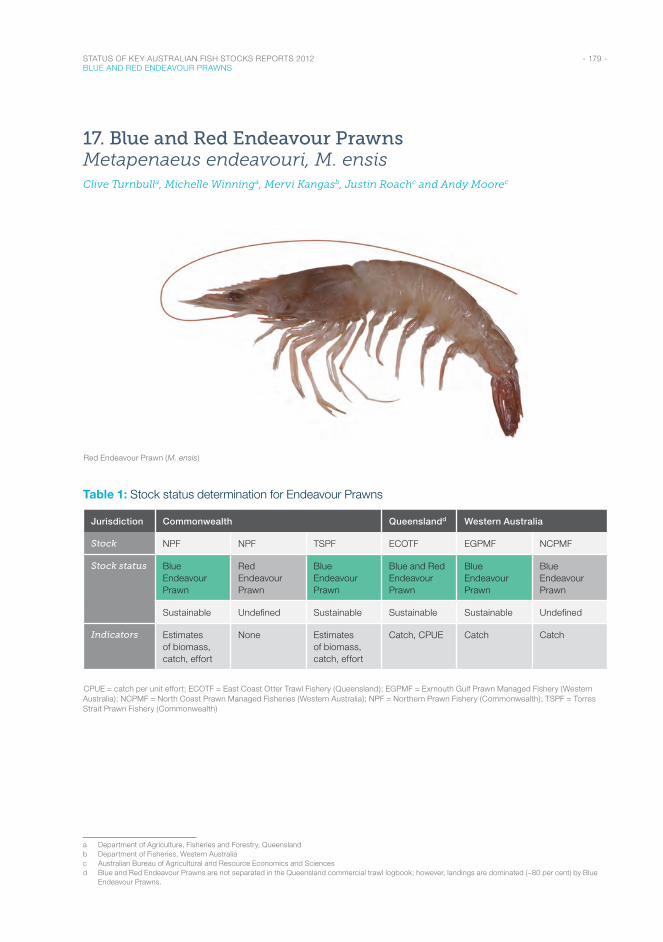
- 179 - STATUS OF KEY AUSTRALIAN FISH STOCKS REPORTS 2012 BLUE AND RED ENDEAVOUR PRAWNS
17. Blue and Red Endeavour Prawns Metapenaeus endeavouri, M. ensisClive Turnbulla, Michelle Winninga, Mervi Kangasb, Justin Roachc and Andy Moorec
Red Endeavour Prawn (M. ensis)
Table 1: Stock status determination for Endeavour Prawns
Jurisdiction Commonwealth Queenslandd Western Australia
Stock NPF NPF TSPF ECOTF EGPMF NCPMF
Stock status Blue Endeavour Prawn
Red Endeavour Prawn
Blue Endeavour Prawn
Blue and Red Endeavour Prawn
Blue Endeavour Prawn
Blue Endeavour Prawn
Sustainable Undefined Sustainable Sustainable Sustainable Undefined
Indicators Estimates of biomass, catch, effort
None Estimates of biomass, catch, effort
Catch, CPUE Catch Catch
CPUE = catch per unit effort; ECOTF = East Coast Otter Trawl Fishery (Queensland); EGPMF = Exmouth Gulf Prawn Managed Fishery (Western Australia); NCPMF = North Coast Prawn Managed Fisheries (Western Australia); NPF = Northern Prawn Fishery (Commonwealth); TSPF = Torres Strait Prawn Fishery (Commonwealth)
a Department of Agriculture, Fisheries and Forestry, Queenslandb Department of Fisheries, Western Australiac Australian Bureau of Agricultural and Resource Economics and Sciencesd Blue and Red Endeavour Prawns are not separated in the Queensland commercial trawl logbook; however, landings are dominated (~80 per cent) by Blue
Endeavour Prawns.
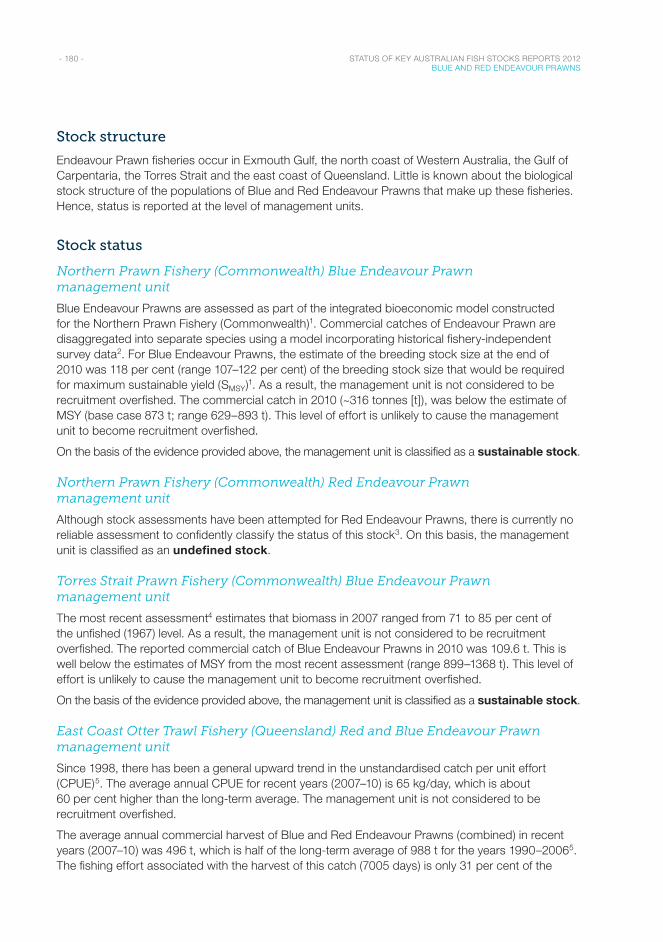
- 180 - STATUS OF KEY AUSTRALIAN FISH STOCKS REPORTS 2012 BLUE AND RED ENDEAVOUR PRAWNS
Stock structure
Endeavour Prawn fisheries occur in Exmouth Gulf, the north coast of Western Australia, the Gulf of Carpentaria, the Torres Strait and the east coast of Queensland. Little is known about the biological stock structure of the populations of Blue and Red Endeavour Prawns that make up these fisheries. Hence, status is reported at the level of management units.
Stock status
Northern Prawn Fishery (Commonwealth) Blue Endeavour Prawn management unit
Blue Endeavour Prawns are assessed as part of the integrated bioeconomic model constructed for the Northern Prawn Fishery (Commonwealth)1. Commercial catches of Endeavour Prawn are disaggregated into separate species using a model incorporating historical fishery-independent survey data2. For Blue Endeavour Prawns, the estimate of the breeding stock size at the end of 2010 was 118 per cent (range 107–122 per cent) of the breeding stock size that would be required for maximum sustainable yield (SMSY)1. As a result, the management unit is not considered to be recruitment overfished. The commercial catch in 2010 (~316 tonnes [t]), was below the estimate of MSY (base case 873 t; range 629–893 t). This level of effort is unlikely to cause the management unit to become recruitment overfished.
On the basis of the evidence provided above, the management unit is classified as a sustainable stock.
Northern Prawn Fishery (Commonwealth) Red Endeavour Prawn management unit
Although stock assessments have been attempted for Red Endeavour Prawns, there is currently no reliable assessment to confidently classify the status of this stock3. On this basis, the management unit is classified as an undefined stock.
Torres Strait Prawn Fishery (Commonwealth) Blue Endeavour Prawn management unit
The most recent assessment4 estimates that biomass in 2007 ranged from 71 to 85 per cent of the unfished (1967) level. As a result, the management unit is not considered to be recruitment overfished. The reported commercial catch of Blue Endeavour Prawns in 2010 was 109.6 t. This is well below the estimates of MSY from the most recent assessment (range 899–1368 t). This level of effort is unlikely to cause the management unit to become recruitment overfished.
On the basis of the evidence provided above, the management unit is classified as a sustainable stock.
East Coast Otter Trawl Fishery (Queensland) Red and Blue Endeavour Prawn management unit
Since 1998, there has been a general upward trend in the unstandardised catch per unit effort (CPUE)5. The average annual CPUE for recent years (2007–10) is 65 kg/day, which is about 60 per cent higher than the long-term average. The management unit is not considered to be recruitment overfished.
The average annual commercial harvest of Blue and Red Endeavour Prawns (combined) in recent years (2007–10) was 496 t, which is half of the long-term average of 988 t for the years 1990–20065. The fishing effort associated with the harvest of this catch (7005 days) is only 31 per cent of the
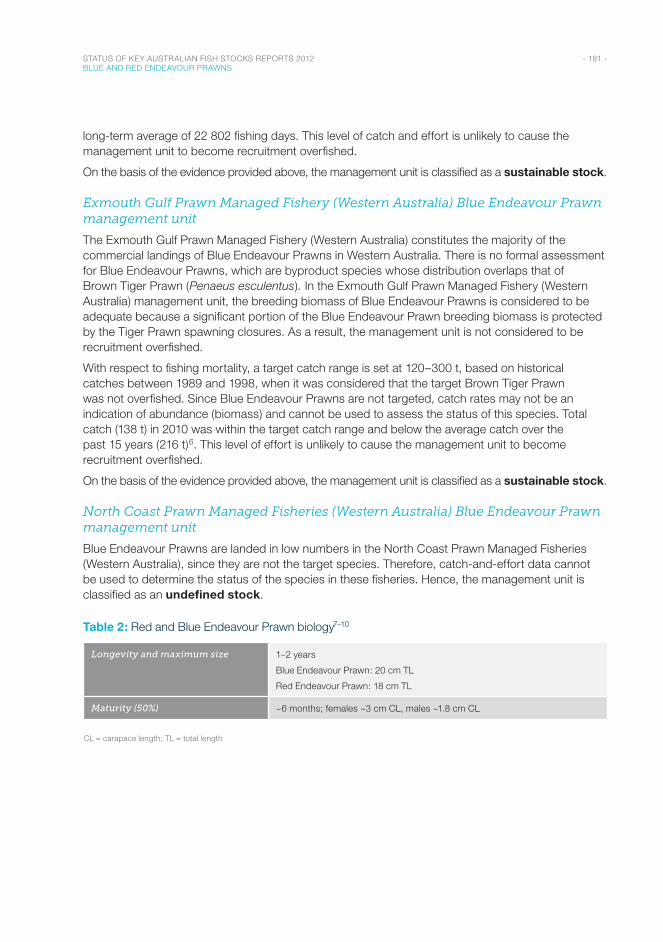
- 181 - STATUS OF KEY AUSTRALIAN FISH STOCKS REPORTS 2012 BLUE AND RED ENDEAVOUR PRAWNS
long-term average of 22 802 fishing days. This level of catch and effort is unlikely to cause the management unit to become recruitment overfished.
On the basis of the evidence provided above, the management unit is classified as a sustainable stock.
Exmouth Gulf Prawn Managed Fishery (Western Australia) Blue Endeavour Prawn management unit
The Exmouth Gulf Prawn Managed Fishery (Western Australia) constitutes the majority of the commercial landings of Blue Endeavour Prawns in Western Australia. There is no formal assessment for Blue Endeavour Prawns, which are byproduct species whose distribution overlaps that of Brown Tiger Prawn (Penaeus esculentus). In the Exmouth Gulf Prawn Managed Fishery (Western Australia) management unit, the breeding biomass of Blue Endeavour Prawns is considered to be adequate because a significant portion of the Blue Endeavour Prawn breeding biomass is protected by the Tiger Prawn spawning closures. As a result, the management unit is not considered to be recruitment overfished.
With respect to fishing mortality, a target catch range is set at 120–300 t, based on historical catches between 1989 and 1998, when it was considered that the target Brown Tiger Prawn was not overfished. Since Blue Endeavour Prawns are not targeted, catch rates may not be an indication of abundance (biomass) and cannot be used to assess the status of this species. Total catch (138 t) in 2010 was within the target catch range and below the average catch over the past 15 years (216 t)6. This level of effort is unlikely to cause the management unit to become recruitment overfished.
On the basis of the evidence provided above, the management unit is classified as a sustainable stock.
North Coast Prawn Managed Fisheries (Western Australia) Blue Endeavour Prawn management unit
Blue Endeavour Prawns are landed in low numbers in the North Coast Prawn Managed Fisheries (Western Australia), since they are not the target species. Therefore, catch-and-effort data cannot be used to determine the status of the species in these fisheries. Hence, the management unit is classified as an undefined stock.
Table 2: Red and Blue Endeavour Prawn biology7–10
Longevity and maximum size 1–2 years
Blue Endeavour Prawn: 20 cm TL
Red Endeavour Prawn: 18 cm TL
Maturity (50%) ~6 months; females ~3 cm CL, males ~1.8 cm CL
CL = carapace length; TL = total length
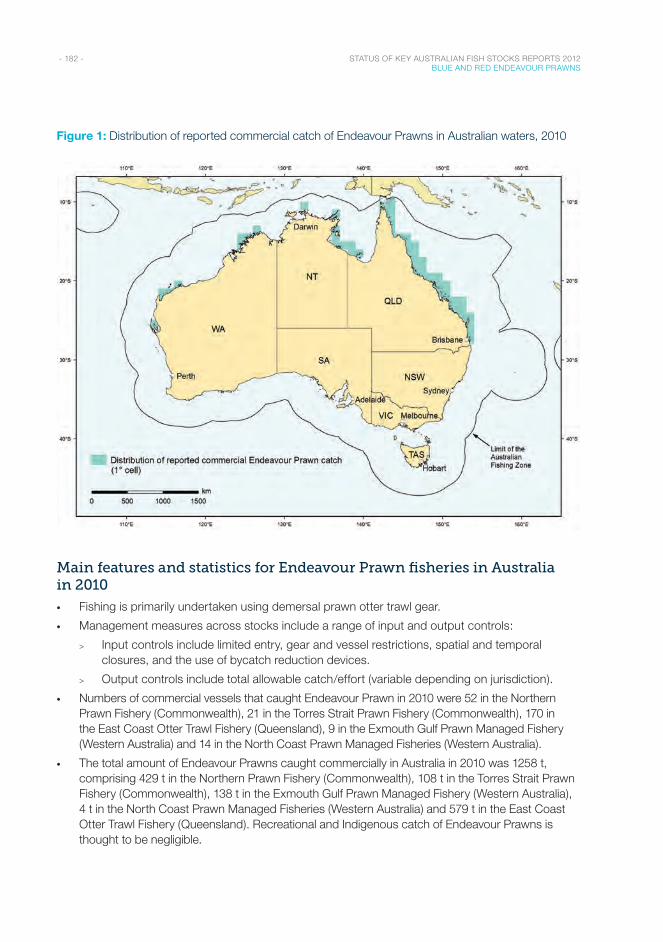
- 182 - STATUS OF KEY AUSTRALIAN FISH STOCKS REPORTS 2012 BLUE AND RED ENDEAVOUR PRAWNS
Figure 1: Distribution of reported commercial catch of Endeavour Prawns in Australian waters, 2010
Main features and statistics for Endeavour Prawn fisheries in Australia in 2010
• Fishing is primarily undertaken using demersal prawn otter trawl gear.
• Management measures across stocks include a range of input and output controls:
> Input controls include limited entry, gear and vessel restrictions, spatial and temporal closures, and the use of bycatch reduction devices.
> Output controls include total allowable catch/effort (variable depending on jurisdiction).
• Numbers of commercial vessels that caught Endeavour Prawn in 2010 were 52 in the Northern Prawn Fishery (Commonwealth), 21 in the Torres Strait Prawn Fishery (Commonwealth), 170 in the East Coast Otter Trawl Fishery (Queensland), 9 in the Exmouth Gulf Prawn Managed Fishery (Western Australia) and 14 in the North Coast Prawn Managed Fisheries (Western Australia).
• The total amount of Endeavour Prawns caught commercially in Australia in 2010 was 1258 t, comprising 429 t in the Northern Prawn Fishery (Commonwealth), 108 t in the Torres Strait Prawn Fishery (Commonwealth), 138 t in the Exmouth Gulf Prawn Managed Fishery (Western Australia), 4 t in the North Coast Prawn Managed Fisheries (Western Australia) and 579 t in the East Coast Otter Trawl Fishery (Queensland). Recreational and Indigenous catch of Endeavour Prawns is thought to be negligible.
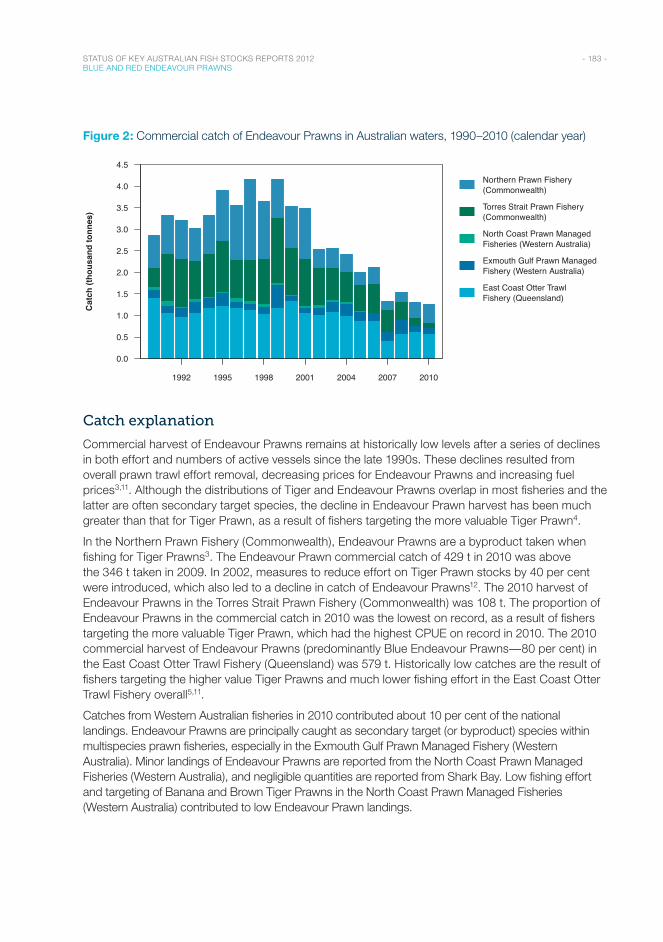
- 183 - STATUS OF KEY AUSTRALIAN FISH STOCKS REPORTS 2012 BLUE AND RED ENDEAVOUR PRAWNS
Figure 2: Commercial catch of Endeavour Prawns in Australian waters, 1990–2010 (calendar year)
Year
1992 1995 1998 2001 2004 2007 2010
0.0
0.5
1.0
1.5
2.0
2.5
3.0
3.5
4.0
4.5
Northern Prawn Fishery(Commonwealth)
Torres Strait Prawn Fishery(Commonwealth)
North Coast Prawn ManagedFisheries (Western Australia)
Exmouth Gulf Prawn ManagedFishery (Western Australia)
East Coast Otter TrawlFishery (Queensland)
Cat
ch (t
hous
and
tonn
es)
Catch explanation
Commercial harvest of Endeavour Prawns remains at historically low levels after a series of declines in both effort and numbers of active vessels since the late 1990s. These declines resulted from overall prawn trawl effort removal, decreasing prices for Endeavour Prawns and increasing fuel prices3,11. Although the distributions of Tiger and Endeavour Prawns overlap in most fisheries and the latter are often secondary target species, the decline in Endeavour Prawn harvest has been much greater than that for Tiger Prawn, as a result of fishers targeting the more valuable Tiger Prawn4.
In the Northern Prawn Fishery (Commonwealth), Endeavour Prawns are a byproduct taken when fishing for Tiger Prawns3. The Endeavour Prawn commercial catch of 429 t in 2010 was above the 346 t taken in 2009. In 2002, measures to reduce effort on Tiger Prawn stocks by 40 per cent were introduced, which also led to a decline in catch of Endeavour Prawns12. The 2010 harvest of Endeavour Prawns in the Torres Strait Prawn Fishery (Commonwealth) was 108 t. The proportion of Endeavour Prawns in the commercial catch in 2010 was the lowest on record, as a result of fishers targeting the more valuable Tiger Prawn, which had the highest CPUE on record in 2010. The 2010 commercial harvest of Endeavour Prawns (predominantly Blue Endeavour Prawns—80 per cent) in the East Coast Otter Trawl Fishery (Queensland) was 579 t. Historically low catches are the result of fishers targeting the higher value Tiger Prawns and much lower fishing effort in the East Coast Otter Trawl Fishery overall5,11.
Catches from Western Australian fisheries in 2010 contributed about 10 per cent of the national landings. Endeavour Prawns are principally caught as secondary target (or byproduct) species within multispecies prawn fisheries, especially in the Exmouth Gulf Prawn Managed Fishery (Western Australia). Minor landings of Endeavour Prawns are reported from the North Coast Prawn Managed Fisheries (Western Australia), and negligible quantities are reported from Shark Bay. Low fishing effort and targeting of Banana and Brown Tiger Prawns in the North Coast Prawn Managed Fisheries (Western Australia) contributed to low Endeavour Prawn landings.
- 184 - STATUS OF KEY AUSTRALIAN FISH STOCKS REPORTS 2012 BLUE AND RED ENDEAVOUR PRAWNS
Effects of fishing on the marine environment
• There is typically a high proportion of bycatch, relative to retained product, in otter trawl fisheries. Post-release survival of these species is variable13.
• The use of turtle excluder devices and bycatch reduction devices is mandatory in all Australian tropical prawn trawl fisheries. Use of turtle excluder devices in the Northern Prawn Fishery (Commonwealth) reduced turtle bycatch from 5700 individuals per year (before 2001) to approximately 30 per year (after 2001)14. The introduction of turtle excluder devices in the Western Australia prawn trawl fisheries in 2003 reduced turtle bycatch by at least 95 per cent15.
• Interactions with species protected under the Environment Protection and Biodiversity Conservation Act 1999, such as sea snakes and seabirds, are routinely monitored.
• The Northern Prawn Fishery (Commonwealth) was certified as a sustainable and well-managed fishery by the Marine Stewardship Council in November 2012.
Environmental effects on Endeavour Prawns
• Nursery grounds (such as seagrass beds) are important for maintaining Endeavour Prawn stocks in the Northern Prawn Fishery (Commonwealth). Management strategies therefore involve the closure of significant nursery areas to trawling to protect stocks16.
• Prawn distribution can be driven by environmental factors. For example, in a study on the distribution of Endeavour Prawns in the Gulf of Carpentaria, Blue Endeavour Prawns were found to be most abundant in the south-eastern gulf and shallower parts of the western gulf, where sediments were either sand or muddy sand. The Red Endeavour Prawn had its highest abundance in the north-eastern gulf and in deeper areas of the western gulf. Here, the sediments were more than 60 per cent mud17.
References1. Australian Fisheries Management Authority 2011, Status of tiger prawn stocks at the end of 2010 and estimated TACS for
2010 in the NPF, report by CSIRO to the Northern Prawn Fishery Resource Assessment Group, AFMA, Canberra.
2. Venables, WN & Dichmont, CM 2004, GLMs, GAMs and GLMMs: an overview of theory for applications in fisheries research, Fisheries Research, 70(2): 319–337.
3. Woodhams, J, Stobutzki, I, Vieira, S, Curtotti, R & Begg, GA (eds) 2011, Fishery status reports 2010: status of fish stocks and fisheries managed by the Australian Government, Australian Bureau of Agricultural and Resource Economics and Sciences, Canberra.
4. Turnbull, CT, Tanimoto, M, O’Neill, MF, Campbell, A & Fairweather, CL 2009, Torres Strait Spatial Management Research Project 2007–09, final report for DAFF Consultancy DAFF83/06, Queensland Department of Employment, Economic Development and Innovation, Brisbane.
5. Queensland Department of Employment, Economic Development and Innovation 2011, Stock status of Queensland’s fisheries resources 2011, DEEDI, Brisbane.
6. Fletcher, WJ & Santoro, K (eds) 2011, State of the fisheries and aquatic resources report 2009/10, Western Australian Department of Fisheries, Perth.
7. Kailola, PJ, Williams, MJ, Stewart, PC, Reichlet, RE, McNee, A & Grieve, C 1993, Australian fisheries resources, Bureau of Resource Sciences & Fisheries Research and Development Corporation, Canberra.
8. Keating, JA, Watson, RA & Sterling, DJ 1990, Reproductive biology of Penaeus esculentus (Haswell, 1879) and Metapenaeus endeavouri (Schmitt, 1926) in Torres Strait, in JE Mellors (ed.), Torres Strait prawn project: a review of research 1986–1988, Queensland Department of Primary Industries Information Series, Queensland Department of Primary Industries, Brisbane, 51–61.
9. Somers, IE, Poiner, IR & Harris, AN 1987, A study of the species composition and distribution of commercial penaeid prawns in Torres Strait, Australian Journal of Marine and Freshwater Research, 38: 47–61.
10. Yearsley, GK, Last, PR & Ward, RD 1999, Australian seafood handbook: domestic species, CSIRO Marine Research, Hobart.
- 185 - STATUS OF KEY AUSTRALIAN FISH STOCKS REPORTS 2012 BLUE AND RED ENDEAVOUR PRAWNS
11. Queensland Department of Employment, Economic Development and Innovation 2011, Annual status report 2011: East Coast Otter Trawl Fishery, DEEDI, Brisbane.
12. Barwick, M 2011, Northern Prawn Fishery data summary 2010, NPF Industry Pty Ltd, Australia.
13. Raudzens, E 2007, At sea testing of the Popeye Fishbox bycatch reduction device onboard the FV Adelaide Pearl for approval in Australia’s Northern Prawn Fishery, Australian Fisheries Management Authority, Canberra.
14. Griffith, S, Kenyon, R, Bulman, C, Dowdney, J, Williams, A, Sporcic, M & Fuller, M 2007, Ecological risk assessment for the effects of fishing: report for the Northern Prawn Fishery, report for the Australian Fisheries Management Authority, Canberra.
15. Kangas, MI & Thomson, A 2004, Implementation and assessment of bycatch reduction devices in the Shark Bay and Exmouth Gulf trawl fisheries, final report to the Fisheries Research and Development Corporation, project 2000/189.
16. Kenyon, RA, Jarrett, AE, Bishop, JFB, Taranto, TJ, Dichmont, CM & Zhou, S 2005, Documenting the history of and providing protocols and criteria for changing existing and establishing new closures in the NPF, final report to the Australian Fisheries Management Authority, project R02/0881, AFMA, Canberra.
17. Somers, IE 1987, Sediment type as a factor in the distribution of commercial prawn species in the Western Gulf of Carpentaria, Australia, Australian Journal of Marine and Freshwater Research, 38: 133–149.
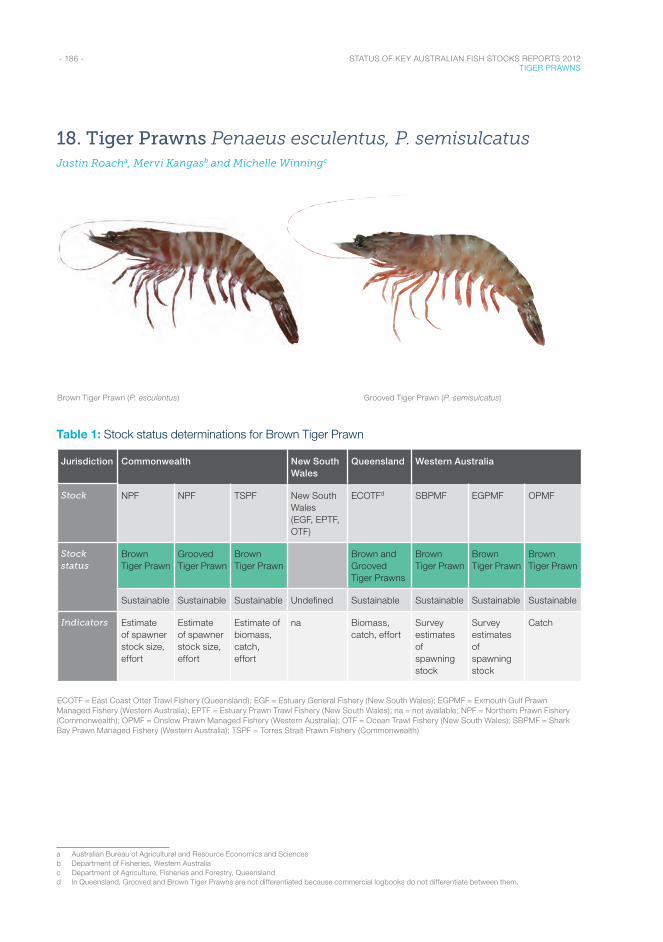
- 186 - STATUS OF KEY AUSTRALIAN FISH STOCKS REPORTS 2012 TIGER PRAWNS
18. Tiger Prawns Penaeus esculentus, P. semisulcatusJustin Roacha, Mervi Kangasb and Michelle Winningc
Brown Tiger Prawn (P. esculentus) Grooved Tiger Prawn (P. semisulcatus)
Table 1: Stock status determinations for Brown Tiger Prawn
Jurisdiction Commonwealth New South Wales
Queensland Western Australia
Stock NPF NPF TSPF New South Wales (EGF, EPTF, OTF)
ECOTFd SBPMF EGPMF OPMF
Stock status
Brown Tiger Prawn
Grooved Tiger Prawn
Brown Tiger Prawn
Brown and Grooved Tiger Prawns
Brown Tiger Prawn
Brown Tiger Prawn
Brown Tiger Prawn
Sustainable Sustainable Sustainable Undefined Sustainable Sustainable Sustainable Sustainable
Indicators Estimate of spawner stock size, effort
Estimate of spawner stock size, effort
Estimate of biomass, catch, effort
na Biomass, catch, effort
Survey estimates of spawning stock
Survey estimates of spawning stock
Catch
ECOTF = East Coast Otter Trawl Fishery (Queensland); EGF = Estuary General Fishery (New South Wales); EGPMF = Exmouth Gulf Prawn Managed Fishery (Western Australia); EPTF = Estuary Prawn Trawl Fishery (New South Wales); na = not available; NPF = Northern Prawn Fishery (Commonwealth); OPMF = Onslow Prawn Managed Fishery (Western Australia); OTF = Ocean Trawl Fishery (New South Wales); SBPMF = Shark Bay Prawn Managed Fishery (Western Australia); TSPF = Torres Strait Prawn Fishery (Commonwealth)
a Australian Bureau of Agricultural and Resource Economics and Sciencesb Department of Fisheries, Western Australiac Department of Agriculture, Fisheries and Forestry, Queenslandd In Queensland, Grooved and Brown Tiger Prawns are not differentiated because commercial logbooks do not differentiate between them.
- 187 - STATUS OF KEY AUSTRALIAN FISH STOCKS REPORTS 2012 TIGER PRAWNS
Stock structure
Since biological stock structure for these species is uncertain, stock status classifications are undertaken at the management unit level for fisheries in the Commonwealth, Queensland and Western Australia, and the jurisdiction level for New South Wales. The standard name ‘Tiger Prawn’ refers to the species Penaeus esculentus, P. semisulcatus and Marsupenaeus japonicus. Only P. esculentus (Brown Tiger Prawn) and P. semisulcatus (Grooved Tiger Prawn) are considered in this chapter because M. japonicus is not caught commercially in Australian waters.
Stock status
Northern Prawn Fishery (Commonwealth) Brown Tiger Prawn management unit
Brown and Grooved Tiger Prawn stocks are assessed as part of the annual integrated bioeconomic model undertaken for the Northern Prawn Fishery (NPF)1. The base-case estimate of spawner stock size for Brown Tiger Prawn at the end of 2010 was 165 per cent (range 109–165 per cent) of the spawner stock size at maximum sustainable yield (SMSY)1. On this basis, the management unit is not considered to be recruitment overfished.
In 2010, effort (1175 boat days) was below the level that would achieve MSY (EMSY; 4723 boat days)1. This level of effort is unlikely to cause the management unit to become recruitment overfished.
On the basis of the evidence provided above, Brown Tiger Prawn in the Northern Prawn Fishery management unit is classified as a sustainable stock.
Northern Prawn Fishery (Commonwealth) Grooved Tiger Prawn management unit
The base-case estimate of spawner stock size for Grooved Tiger Prawn at the end of 2010 was 142 per cent of SMSY (range 130–143 per cent)1. On this basis, the management unit is not considered to be recruitment overfished.
In 2011, effort (3928 boat days) was below the estimate of EMSY (12 063 boat days)1. This level of effort is unlikely to cause the management unit to become recruitment overfished.
On the basis of the evidence provided above, Grooved Tiger Prawn in the Northern Prawn Fishery management unit is classified as a sustainable stock.
Torres Strait Prawn Fishery (Commonwealth) Brown Tiger Prawn management unit
The most recent assessment uses two separate modelling approaches, producing two separate estimates of MSY and EMSY
2. Commercial catch of this stock has been below the mean estimates of MSY (606 tonnes [t] and 676 t) for the past five seasons (2006–10), and effort has been below the estimates of EMSY (8245 and 9197 fishing nights) for the past seven seasons (2004–10)3. This level of catch and effort is unlikely to cause the management unit to become recruitment overfished.
Some components of the assessment were updated in 20074; this indicated that biomass in 2006 was 60–80 per cent of the unfished (1980) level. This was considerably higher than biomass that supports MSY (BMSY), estimated to be around 28–38 per cent of the unfished level2,4. As a result of the 2006 biomass estimate and low levels of catch and effort since that estimate, the management unit is not considered to be recruitment overfished.
On the basis of the evidence provided above, Brown Tiger Prawn in the Torres Strait Prawn Fishery management unit is classified as a sustainable stock.
- 188 - STATUS OF KEY AUSTRALIAN FISH STOCKS REPORTS 2012 TIGER PRAWNS
New South Wales
Uncertainty exists around the stock structure. Tiger Prawns caught in New South Wales are at the edge of their geographic range, and catches are very low5. Hence, no stock assessment has been completed. Insufficient information is available to confidently classify the status of this stock; as a result, the management unit is classified as an undefined stock.
East Coast Otter Trawl Fishery (Queensland) Brown and Grooved Tiger Prawn management unit
Brown and Grooved Tiger Prawns are recorded as ‘Tiger Prawns’ by Queensland commercial fishers. The most recent assessment of Tiger Prawn fishing effort (2004) estimated the EMSY at 19 618 fishing days. From 2001 to 2007, effort for Tiger Prawns decreased by 75 per cent and, since 2007, effort has been below EMSY
6. This level of fishing effort is unlikely to cause the management unit to become recruitment overfished.
The most recent assessment estimated that the biomass in 2003 was 137 per cent of the unfished (1988) level7. In addition, the recent East Coast Otter Trawl Fishery ecological risk assessment found that there is a low risk of Brown Tiger Prawns being overfished at 2010 effort levels6. The management unit is not considered to be recruitment overfished.
On the basis of the evidence provided above, Tiger Prawns in the East Coast Otter Trawl Fishery management unit are classified as a sustainable stock.
Shark Bay Prawn Managed Fishery (Western Australia) Brown Tiger Prawn management unit
Standardised catch per unit effort data are used as an indicator of abundance, and can be used to monitor changes in stock levels from year to year. The average commercial catch and catch rate are compared with a 10-year (1989–98) reference point8.
This Brown Tiger Prawn management unit is also assessed each year using fishery-independent recruitment and spawning stock surveys. These methods are the primary means for assessing stock status. Recruitment surveys provide an index of annual recruitment and are also the basis of an annual Brown Tiger Prawn catch prediction.
A spawning stock–recruitment relationship exists for Brown Tiger Prawns9–11, and the maintenance of adequate spawning stock (using a threshold catch rate) is the key management objective. Brown Tiger Prawns are managed to reference levels (catch rates) and accompanying decision rules. A mandatory closure of the Brown Tiger Prawn spawning area is enforced, either to a catch rate threshold or on a set date (around June–July), whichever is sooner, to protect the spawning stock. The fishery operates on a real-time management basis: commercial catch rates are monitored nightly to ensure that the Brown Tiger Prawn spawning areas are closed at the appropriate time. As fishing ceases in this area, fishery-independent surveys are then conducted to verify catch rates.
The 2010 spawning stock surveys showed a mean catch rate of 27.1 kg/hour in the Brown Tiger Prawn spawning area. This is within the target threshold range of 25–30 kg/hr12, indicating that the biomass of this management unit is unlikely to be recruitment overfished. With respect to fishing mortality, the assessment also set a target catch range for the 2010 season of 400–700 t. Total catch (423 t) was within the target catch range and below the average catch over the past 15 years (540 t)12. This evidence indicates that the current level of fishing mortality is unlikely to cause the management unit to become recruitment overfished.
On the basis of the evidence provided above, Brown Tiger Prawn in the Shark Bay Prawn Managed Fishery management unit is classified as a sustainable stock.
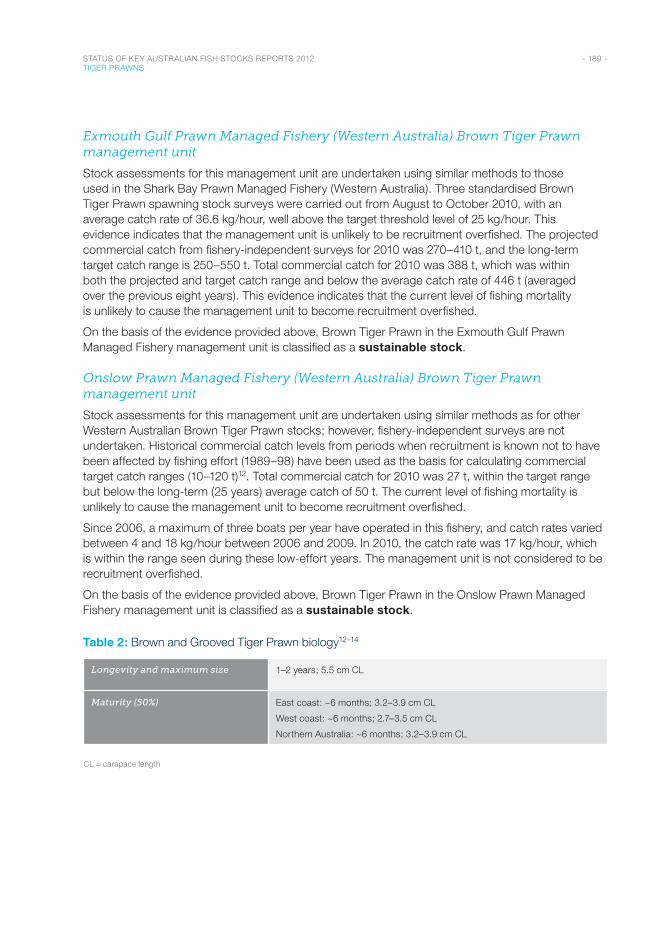
- 189 - STATUS OF KEY AUSTRALIAN FISH STOCKS REPORTS 2012 TIGER PRAWNS
Exmouth Gulf Prawn Managed Fishery (Western Australia) Brown Tiger Prawn management unit
Stock assessments for this management unit are undertaken using similar methods to those used in the Shark Bay Prawn Managed Fishery (Western Australia). Three standardised Brown Tiger Prawn spawning stock surveys were carried out from August to October 2010, with an average catch rate of 36.6 kg/hour, well above the target threshold level of 25 kg/hour. This evidence indicates that the management unit is unlikely to be recruitment overfished. The projected commercial catch from fishery-independent surveys for 2010 was 270–410 t, and the long-term target catch range is 250–550 t. Total commercial catch for 2010 was 388 t, which was within both the projected and target catch range and below the average catch rate of 446 t (averaged over the previous eight years). This evidence indicates that the current level of fishing mortality is unlikely to cause the management unit to become recruitment overfished.
On the basis of the evidence provided above, Brown Tiger Prawn in the Exmouth Gulf Prawn Managed Fishery management unit is classified as a sustainable stock.
Onslow Prawn Managed Fishery (Western Australia) Brown Tiger Prawn management unit
Stock assessments for this management unit are undertaken using similar methods as for other Western Australian Brown Tiger Prawn stocks; however, fishery-independent surveys are not undertaken. Historical commercial catch levels from periods when recruitment is known not to have been affected by fishing effort (1989–98) have been used as the basis for calculating commercial target catch ranges (10–120 t)12. Total commercial catch for 2010 was 27 t, within the target range but below the long-term (25 years) average catch of 50 t. The current level of fishing mortality is unlikely to cause the management unit to become recruitment overfished.
Since 2006, a maximum of three boats per year have operated in this fishery, and catch rates varied between 4 and 18 kg/hour between 2006 and 2009. In 2010, the catch rate was 17 kg/hour, which is within the range seen during these low-effort years. The management unit is not considered to be recruitment overfished.
On the basis of the evidence provided above, Brown Tiger Prawn in the Onslow Prawn Managed Fishery management unit is classified as a sustainable stock.
Table 2: Brown and Grooved Tiger Prawn biology12–14
Longevity and maximum size 1–2 years; 5.5 cm CL
Maturity (50%) East coast: ~6 months; 3.2–3.9 cm CL
West coast: ~6 months; 2.7–3.5 cm CL
Northern Australia: ~6 months; 3.2 –3.9 cm CL
CL = carapace length
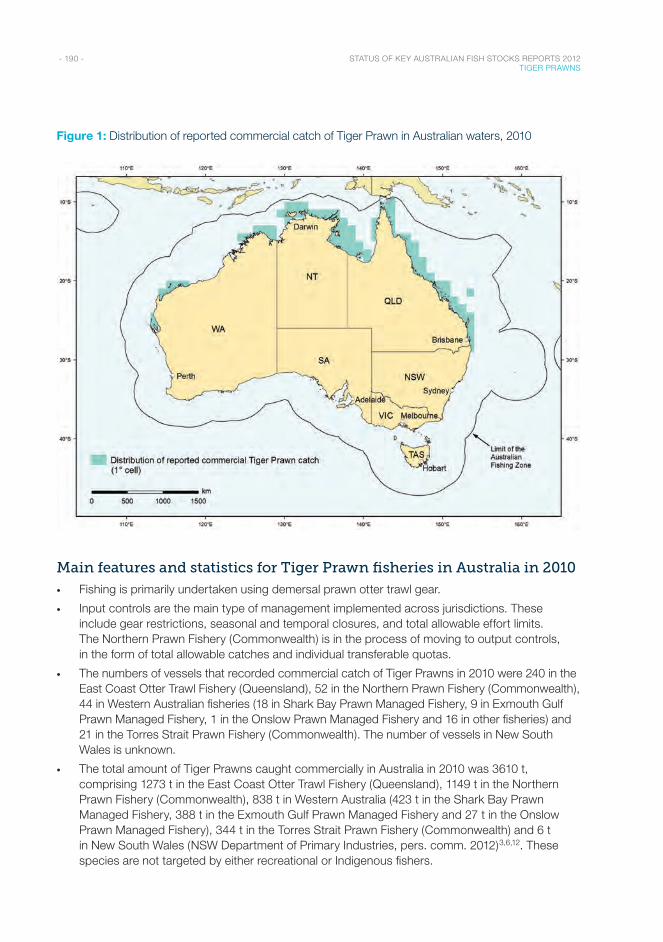
- 190 - STATUS OF KEY AUSTRALIAN FISH STOCKS REPORTS 2012 TIGER PRAWNS
Figure 1: Distribution of reported commercial catch of Tiger Prawn in Australian waters, 2010
Main features and statistics for Tiger Prawn fisheries in Australia in 2010
• Fishing is primarily undertaken using demersal prawn otter trawl gear.
• Input controls are the main type of management implemented across jurisdictions. These include gear restrictions, seasonal and temporal closures, and total allowable effort limits. The Northern Prawn Fishery (Commonwealth) is in the process of moving to output controls, in the form of total allowable catches and individual transferable quotas.
• The numbers of vessels that recorded commercial catch of Tiger Prawns in 2010 were 240 in the East Coast Otter Trawl Fishery (Queensland), 52 in the Northern Prawn Fishery (Commonwealth), 44 in Western Australian fisheries (18 in Shark Bay Prawn Managed Fishery, 9 in Exmouth Gulf Prawn Managed Fishery, 1 in the Onslow Prawn Managed Fishery and 16 in other fisheries) and 21 in the Torres Strait Prawn Fishery (Commonwealth). The number of vessels in New South Wales is unknown.
• The total amount of Tiger Prawns caught commercially in Australia in 2010 was 3610 t, comprising 1273 t in the East Coast Otter Trawl Fishery (Queensland), 1149 t in the Northern Prawn Fishery (Commonwealth), 838 t in Western Australia (423 t in the Shark Bay Prawn Managed Fishery, 388 t in the Exmouth Gulf Prawn Managed Fishery and 27 t in the Onslow Prawn Managed Fishery), 344 t in the Torres Strait Prawn Fishery (Commonwealth) and 6 t in New South Wales (NSW Department of Primary Industries, pers. comm. 2012)3,6,12. These species are not targeted by either recreational or Indigenous fishers.
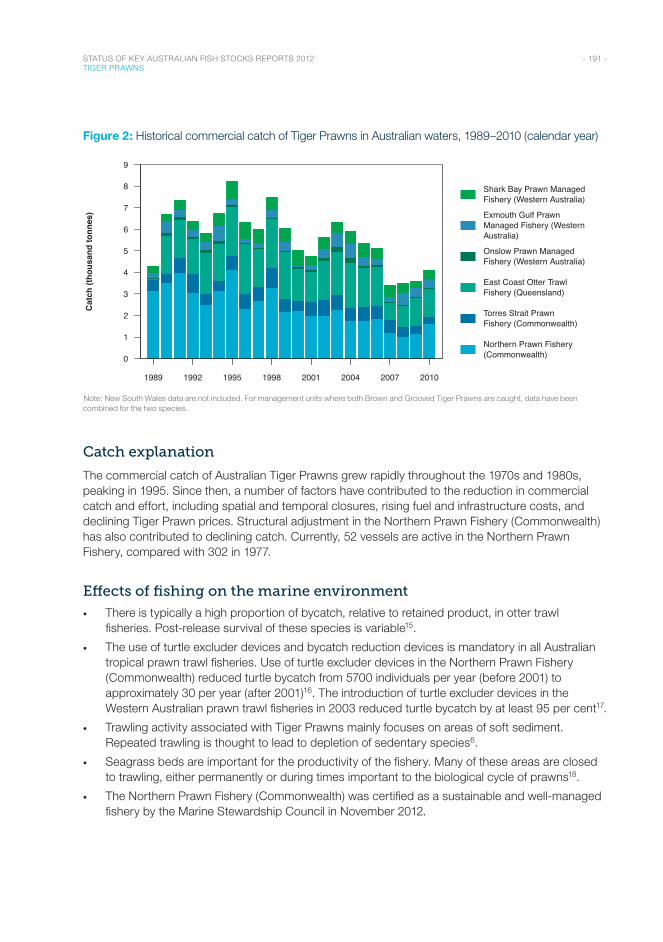
- 191 - STATUS OF KEY AUSTRALIAN FISH STOCKS REPORTS 2012 TIGER PRAWNS
Figure 2: Historical commercial catch of Tiger Prawns in Australian waters, 1989–2010 (calendar year)
Year
1989 1992 1995 1998 2001 2004 2007 2010
0
1
2
3
4
5
6
7
8
9
Shark Bay Prawn ManagedFishery (Western Australia)
Exmouth Gulf PrawnManaged Fishery (WesternAustralia)
Onslow Prawn ManagedFishery (Western Australia)
East Coast Otter TrawlFishery (Queensland)
Torres Strait PrawnFishery (Commonwealth)
Northern Prawn Fishery(Commonwealth)
Cat
ch (t
hous
and
tonn
es)
Note: New South Wales data are not included. For management units where both Brown and Grooved Tiger Prawns are caught, data have been combined for the two species.
Catch explanation
The commercial catch of Australian Tiger Prawns grew rapidly throughout the 1970s and 1980s, peaking in 1995. Since then, a number of factors have contributed to the reduction in commercial catch and effort, including spatial and temporal closures, rising fuel and infrastructure costs, and declining Tiger Prawn prices. Structural adjustment in the Northern Prawn Fishery (Commonwealth) has also contributed to declining catch. Currently, 52 vessels are active in the Northern Prawn Fishery, compared with 302 in 1977.
Effects of fishing on the marine environment
• There is typically a high proportion of bycatch, relative to retained product, in otter trawl fisheries. Post-release survival of these species is variable15.
• The use of turtle excluder devices and bycatch reduction devices is mandatory in all Australian tropical prawn trawl fisheries. Use of turtle excluder devices in the Northern Prawn Fishery (Commonwealth) reduced turtle bycatch from 5700 individuals per year (before 2001) to approximately 30 per year (after 2001)16. The introduction of turtle excluder devices in the Western Australian prawn trawl fisheries in 2003 reduced turtle bycatch by at least 95 per cent17.
• Trawling activity associated with Tiger Prawns mainly focuses on areas of soft sediment. Repeated trawling is thought to lead to depletion of sedentary species6.
• Seagrass beds are important for the productivity of the fishery. Many of these areas are closed to trawling, either permanently or during times important to the biological cycle of prawns18.
• The Northern Prawn Fishery (Commonwealth) was certified as a sustainable and well-managed fishery by the Marine Stewardship Council in November 2012.
- 192 - STATUS OF KEY AUSTRALIAN FISH STOCKS REPORTS 2012 TIGER PRAWNS
Environmental effects on Tiger Prawns
• Biomass of prawns can be highly variable and affected by environmental factors such as water temperatures, cyclones, and broadscale oceanographic features19–20. Cyclones can have either a positive or a negative impact on prawn biomass and availability. Early-season (December–January) cyclones can increase mortality of small prawns through the scouring of nursery areas, destroying seagrass and algal habitats. Conversely, mortality can decrease when water becomes turbid, because predation decreases12.
References1. Australian Fisheries Management Authority 2011, Status of tiger prawn stocks at the end of 2010 and estimated TACS
for 2011 in the NPF, report by CSIRO to the Northern Prawn Fishery Resource Assessment Group, AFMA, Canberra.
2. O’Neill, MF & Turnbull, CT 2006, Stock assessment of the Torres Strait tiger prawn fishery (Peneaus esculentus), Queensland Department of Primary Industries and Fisheries, Brisbane.
3. Woodhams, J, Stobutzki, I, Vieira, S, Curtotti, R & Begg, GA (eds) 2011, Fishery status reports 2010: status of fish stocks and fisheries managed by the Australian Government, Australian Bureau of Agricultural and Resource Economics and Sciences, Canberra.
4. Taylor, S, Turnbull, C, Marrington, J & George, M (eds) 2007, Torres Strait prawn handbook 2007, Australian Fisheries Management Authority, Canberra.
5. Rowling, K, Hegarty, A & Ives, M (eds) 2010, Brown tiger prawn, in Status of fisheries resources in NSW 2008/09, Industry & Investment NSW, Cronulla, 57–59.
6. Queensland Department of Employment, Economic Development and Innovation 2011, Stock status of Queensland’s fisheries resources 2011, DEEDI, Brisbane.
7. Turnbull, CT & Gribble, NA 2004, Assessment of the northern Queensland tiger and endeavour prawn stocks: 2004 update, DPI&F Information Series QI 03014, Queensland Department of Primary Industries and Fisheries, Brisbane.
8. Kangas, M, McCrea, J, Fletcher, W, Sporer, E & Weir, V 2006, Shark Bay Prawn Fishery, ESD Report Series 3, Western Australian Department of Fisheries, North Beach.
9. Caputi, N 1993, Aspects of spawner-recruit relationships, with particular reference to crustacean stocks; a review, Australian Journal of Marine and Freshwater Research, 44: 589–607.
10. Caputi, N, Penn, JW, Joll, LM & Chubb, CF 1998, Stock–recruitment–environment relationships for invertebrate species of Western Australia, in GS Jamieson & A Campbell (eds), Proceedings of the North Pacific Symposium on Invertebrate Stock Assessment and Management, Canadian Special Publication of Fisheries and Aquatic Sciences, 125: 247–255.
11. Penn, JW, Caputi, N & Hall, NG 1995, Stock-recruitment relationships for the tiger prawn (Penaeus esculentus) stocks in Western Australia, ICES Marine Science Symposium 199: 320–333.
12. Fletcher, WJ & Santoro, K (eds) 2011, State of the fisheries and aquatic resources report 2009/10, Western Australian Department of Fisheries, Perth.
13. Somers, IE 1987, Sediment type as a factor in the distribution of commercial prawn species in the Western Gulf of Carpentaria, Australia, Australian Journal of Marine and Freshwater Research, 38: 133–149.
14. Yearsley, GK, Last, PR & Ward, RD 1999, Australian seafood handbook: domestic species, CSIRO Marine Research, Hobart.
15. Raudzens, E 2007, At sea testing of the Popeye Fishbox bycatch reduction device onboard the FV Adelaide Pearl for approval in Australia’s Northern Prawn Fishery, Australian Fisheries Management Authority, Canberra.
16. Griffith, S, Kenyon, R, Bulman, C, Dowdney, J, Williams, A, Sporcic, M & Fuller, M 2007, Ecological risk assessment for the effects of fishing: report for the Northern Prawn Fishery, report for the Australian Fisheries Management Authority, Canberra.
17. Kangas, MI & Thomson, A 2004, Implementation and assessment of bycatch reduction devices in the Shark Bay and Exmouth Gulf trawl fisheries, final report, Fisheries Research and Development Corporation, project 2000/189, Western Australian Department of Fisheries, Perth.
18. Kenyon, RA, Jarrett, AE, Bishop, JFB, Taranto, TJ, Dichmont, CM & Zhou, S 2005, Documenting the history of and providing protocols and criteria for changing existing and establishing new closures in the NPF, final report to the Australian Fisheries Management Authority, project R02/0881, AFMA, Canberra.
19. Lenanton, RC, Caputi, N, Kangas, MI & Craine, M 2009, The ongoing influence of the Leeuwin Current on economically important fish and invertebrates off temperate Western Australia—has it changed?, Journal of the Royal Society of Western Australia, 92: 111–127.
20. Vance, DJ, Bishop, J, Dichmont, CM, Hall, N, McInnes, K & Taylore, BR 2003, Management of common banana prawn stocks of the Gulf of Carpentaria: separating the effects of fishing from those of the environment, Australian Fisheries Management Authority project 98/0716, CSIRO Marine Research, Cleveland.
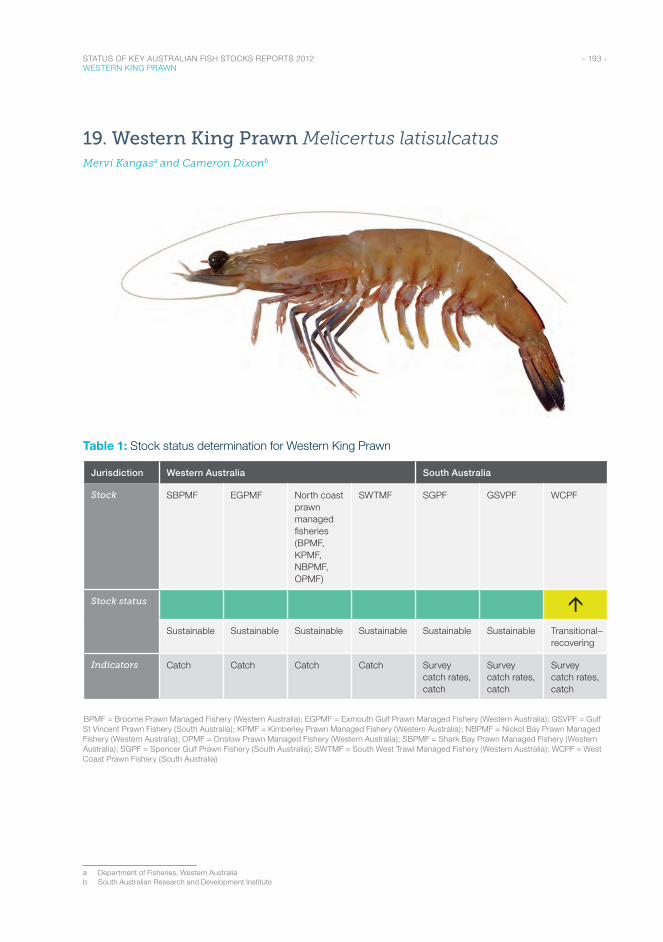
- 193 - STATUS OF KEY AUSTRALIAN FISH STOCKS REPORTS 2012 WESTERN KING PRAWN
19. Western King Prawn Melicertus latisulcatusMervi Kangasa and Cameron Dixonb
Table 1: Stock status determination for Western King Prawn
Jurisdiction Western Australia South Australia
Stock SBPMF EGPMF North coast prawn managed fisheries (BPMF, KPMF, NBPMF, OPMF)
SWTMF SGPF GSVPF WCPF
Stock status áSustainable Sustainable Sustainable Sustainable Sustainable Sustainable Transitional–
recovering
Indicators Catch Catch Catch Catch Survey catch rates, catch
Survey catch rates, catch
Survey catch rates, catch
BPMF = Broome Prawn Managed Fishery (Western Australia); EGPMF = Exmouth Gulf Prawn Managed Fishery (Western Australia); GSVPF = Gulf St Vincent Prawn Fishery (South Australia); KPMF = Kimberley Prawn Managed Fishery (Western Australia); NBPMF = Nickol Bay Prawn Managed Fishery (Western Australia); OPMF = Onslow Prawn Managed Fishery (Western Australia); SBPMF = Shark Bay Prawn Managed Fishery (Western Australia); SGPF = Spencer Gulf Prawn Fishery (South Australia); SWTMF = South West Trawl Managed Fishery (Western Australia); WCPF = West Coast Prawn Fishery (South Australia)
a Department of Fisheries, Western Australiab South Australian Research and Development Institute
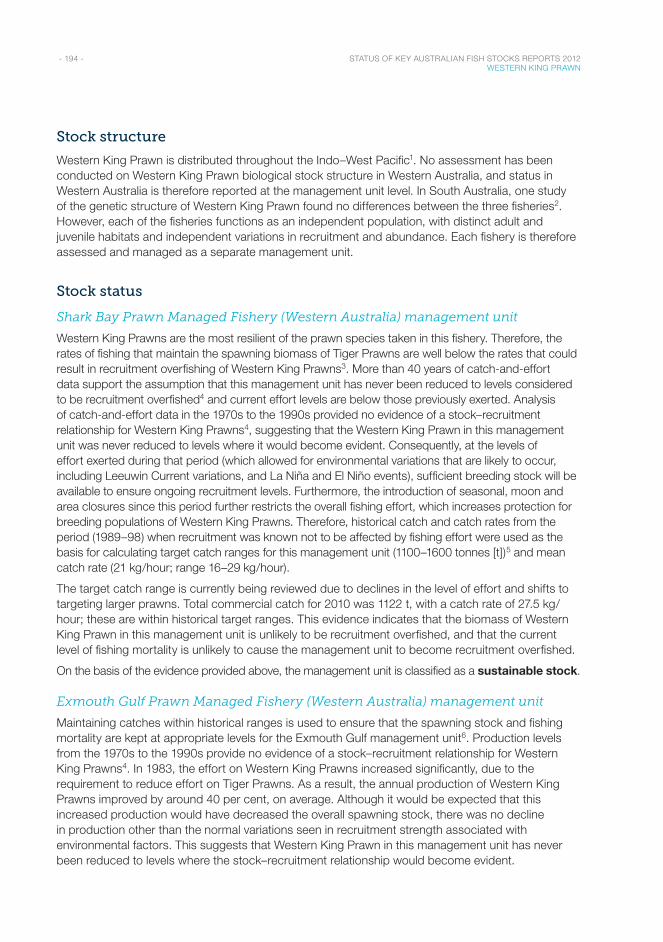
- 194 - STATUS OF KEY AUSTRALIAN FISH STOCKS REPORTS 2012 WESTERN KING PRAWN
Stock structure
Western King Prawn is distributed throughout the Indo–West Pacific1. No assessment has been conducted on Western King Prawn biological stock structure in Western Australia, and status in Western Australia is therefore reported at the management unit level. In South Australia, one study of the genetic structure of Western King Prawn found no differences between the three fisheries2. However, each of the fisheries functions as an independent population, with distinct adult and juvenile habitats and independent variations in recruitment and abundance. Each fishery is therefore assessed and managed as a separate management unit.
Stock status
Shark Bay Prawn Managed Fishery (Western Australia) management unit
Western King Prawns are the most resilient of the prawn species taken in this fishery. Therefore, the rates of fishing that maintain the spawning biomass of Tiger Prawns are well below the rates that could result in recruitment overfishing of Western King Prawns3. More than 40 years of catch-and-effort data support the assumption that this management unit has never been reduced to levels considered to be recruitment overfished4 and current effort levels are below those previously exerted. Analysis of catch-and-effort data in the 1970s to the 1990s provided no evidence of a stock–recruitment relationship for Western King Prawns4, suggesting that the Western King Prawn in this management unit was never reduced to levels where it would become evident. Consequently, at the levels of effort exerted during that period (which allowed for environmental variations that are likely to occur, including Leeuwin Current variations, and La Niña and El Niño events), sufficient breeding stock will be available to ensure ongoing recruitment levels. Furthermore, the introduction of seasonal, moon and area closures since this period further restricts the overall fishing effort, which increases protection for breeding populations of Western King Prawns. Therefore, historical catch and catch rates from the period (1989–98) when recruitment was known not to be affected by fishing effort were used as the basis for calculating target catch ranges for this management unit (1100–1600 tonnes [t])5 and mean catch rate (21 kg/hour; range 16–29 kg/hour).
The target catch range is currently being reviewed due to declines in the level of effort and shifts to targeting larger prawns. Total commercial catch for 2010 was 1122 t, with a catch rate of 27.5 kg/hour; these are within historical target ranges. This evidence indicates that the biomass of Western King Prawn in this management unit is unlikely to be recruitment overfished, and that the current level of fishing mortality is unlikely to cause the management unit to become recruitment overfished.
On the basis of the evidence provided above, the management unit is classified as a sustainable stock.
Exmouth Gulf Prawn Managed Fishery (Western Australia) management unit
Maintaining catches within historical ranges is used to ensure that the spawning stock and fishing mortality are kept at appropriate levels for the Exmouth Gulf management unit6. Production levels from the 1970s to the 1990s provide no evidence of a stock–recruitment relationship for Western King Prawns4. In 1983, the effort on Western King Prawns increased significantly, due to the requirement to reduce effort on Tiger Prawns. As a result, the annual production of Western King Prawns improved by around 40 per cent, on average. Although it would be expected that this increased production would have decreased the overall spawning stock, there was no decline in production other than the normal variations seen in recruitment strength associated with environmental factors. This suggests that Western King Prawn in this management unit has never been reduced to levels where the stock–recruitment relationship would become evident.
- 195 - STATUS OF KEY AUSTRALIAN FISH STOCKS REPORTS 2012 WESTERN KING PRAWN
This indicates that, at current effort levels and with variations in environmental conditions, sufficient breeding stock will be available to ensure adequate recruitment in the future.
Catch and catch-rate levels from 1989 to 1998 have been used as the basis for calculating a target catch range of 350–500 t5 and a catch rate of 12 kg/hour (range 8–14 kg/hour). The target catch range is currently being reviewed due to declines in the level of effort and shifts to targeting larger prawns. The commercial catch for 2010 of 254 t reflects these changes, although the catch rate (9.8 kg/hour) was within the target range. This evidence indicates that the biomass of Western King Prawn in this management unit is unlikely to be recruitment overfished, and that the current level of fishing mortality is unlikely to cause the management unit to become recruitment overfished.
On the basis of the evidence provided above, the management unit is classified as a sustainable stock.
North coast prawn managed fisheries (Western Australia) management unit
The north coast prawn managed fisheries management unit is made up of four separate fisheries but reported as one unit because of minimal catch. Western King Prawns form part of total prawn landings in these multispecies prawn fisheries. Only in the Broome Prawn Managed Fishery (Western Australia) are Western King Prawns the key target species. Current commercial catch compared with historical ranges is therefore used to assess the level of fishing mortality for these fisheries. Historical catch levels from periods when recruitment was known not to be affected by fishing effort (1991–98) have been used as the basis for calculating target catch ranges; these are 65–295 t5 for the north coast prawn fisheries combined. Total commercial catch for 2010 was less than 10 t, well below the target catch range and the long-term (20-year) average combined catch of 140 t. For the Broome Prawn Managed Fishery (Western Australia), the catch rate in 2010 was 24 kg/hour, within the target catch-rate range (19–43 kg/hour). The low catches are attributed to very low effort expended in these fisheries, as a result of the current low market value of Western King Prawns and high costs of fishing. This evidence indicates that the biomass of the management unit is unlikely to be recruitment overfished, and that the current level of fishing mortality is unlikely to cause the management unit to become recruitment overfished.
On the basis of the evidence provided above, the management unit is classified as a sustainable stock.
South West Trawl Managed Fishery (Western Australia) management unit
Historical catch and catch-rate ranges are used to assess spawning stock and fishing mortality for the small prawn fisheries in the south-west region of Western Australia. Historical catch levels from periods when recruitment was known not to be affected by fishing effort (1990–99) have been used as the basis for calculating target catch ranges and catch rates. The target catch range is 10–40 t, and the target catch rate is 14–52 kg/day. Total commercial catch for 2010 was 12 t5, which is within the target catch range and below the long-term (20-year) average catch of 18 t. The 2010 catch rate was 60 kg/day, which is higher than the historical catch range. This evidence indicates that the biomass of the management unit is unlikely to be recruitment overfished, and that the current level of fishing mortality is unlikely to cause the management unit to become recruitment overfished.
On the basis of the evidence provided above, the management unit is classified as a sustainable stock.
Spencer Gulf Prawn Fishery (South Australia) management unit
The primary measures for stock status in Spencer Gulf are the average catch rates obtained during fishery-independent surveys conducted in February, April and November, which are used as indices of relative biomass. Since the fishery has maintained a long and stable history of commercial catches and recruitment7, the performance indicators for relative biomass aim to maintain survey catch rates within historical ranges. Mean catch rates for surveys conducted in February, April and
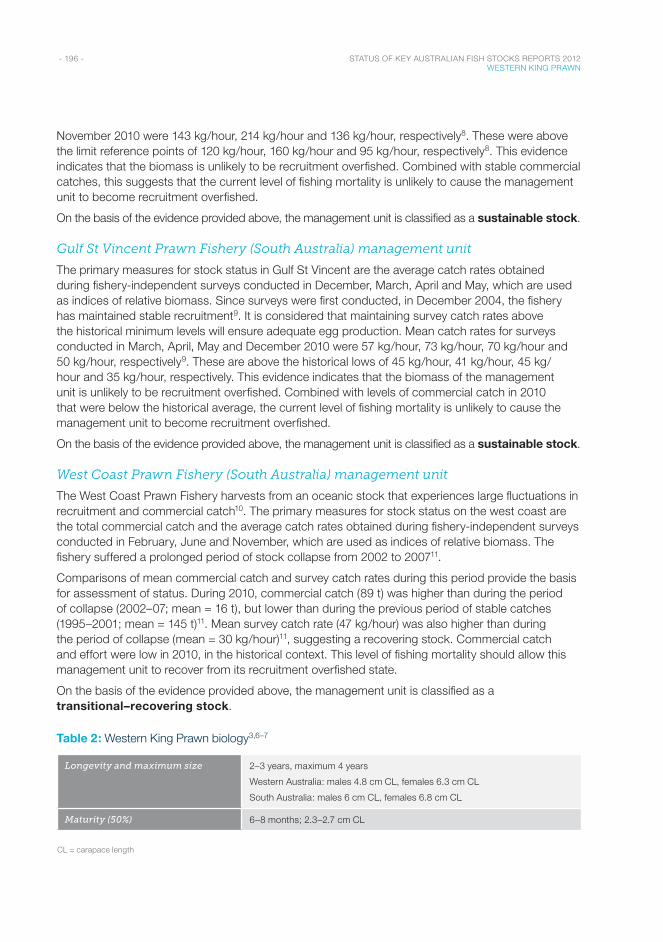
- 196 - STATUS OF KEY AUSTRALIAN FISH STOCKS REPORTS 2012 WESTERN KING PRAWN
November 2010 were 143 kg/hour, 214 kg/hour and 136 kg/hour, respectively8. These were above the limit reference points of 120 kg/hour, 160 kg/hour and 95 kg/hour, respectively8. This evidence indicates that the biomass is unlikely to be recruitment overfished. Combined with stable commercial catches, this suggests that the current level of fishing mortality is unlikely to cause the management unit to become recruitment overfished.
On the basis of the evidence provided above, the management unit is classified as a sustainable stock.
Gulf St Vincent Prawn Fishery (South Australia) management unit
The primary measures for stock status in Gulf St Vincent are the average catch rates obtained during fishery-independent surveys conducted in December, March, April and May, which are used as indices of relative biomass. Since surveys were first conducted, in December 2004, the fishery has maintained stable recruitment9. It is considered that maintaining survey catch rates above the historical minimum levels will ensure adequate egg production. Mean catch rates for surveys conducted in March, April, May and December 2010 were 57 kg/hour, 73 kg/hour, 70 kg/hour and 50 kg/hour, respectively9. These are above the historical lows of 45 kg/hour, 41 kg/hour, 45 kg/hour and 35 kg/hour, respectively. This evidence indicates that the biomass of the management unit is unlikely to be recruitment overfished. Combined with levels of commercial catch in 2010 that were below the historical average, the current level of fishing mortality is unlikely to cause the management unit to become recruitment overfished.
On the basis of the evidence provided above, the management unit is classified as a sustainable stock.
West Coast Prawn Fishery (South Australia) management unit
The West Coast Prawn Fishery harvests from an oceanic stock that experiences large fluctuations in recruitment and commercial catch10. The primary measures for stock status on the west coast are the total commercial catch and the average catch rates obtained during fishery-independent surveys conducted in February, June and November, which are used as indices of relative biomass. The fishery suffered a prolonged period of stock collapse from 2002 to 200711.
Comparisons of mean commercial catch and survey catch rates during this period provide the basis for assessment of status. During 2010, commercial catch (89 t) was higher than during the period of collapse (2002–07; mean = 16 t), but lower than during the previous period of stable catches (1995–2001; mean = 145 t)11. Mean survey catch rate (47 kg/hour) was also higher than during the period of collapse (mean = 30 kg/hour)11, suggesting a recovering stock. Commercial catch and effort were low in 2010, in the historical context. This level of fishing mortality should allow this management unit to recover from its recruitment overfished state.
On the basis of the evidence provided above, the management unit is classified as a transitional–recovering stock.
Table 2: Western King Prawn biology3,6–7
Longevity and maximum size 2–3 years, maximum 4 years
Western Australia: males 4.8 cm CL, females 6.3 cm CL
South Australia: males 6 cm CL, females 6.8 cm CL
Maturity (50%) 6–8 months; 2.3–2.7 cm CL
CL = carapace length
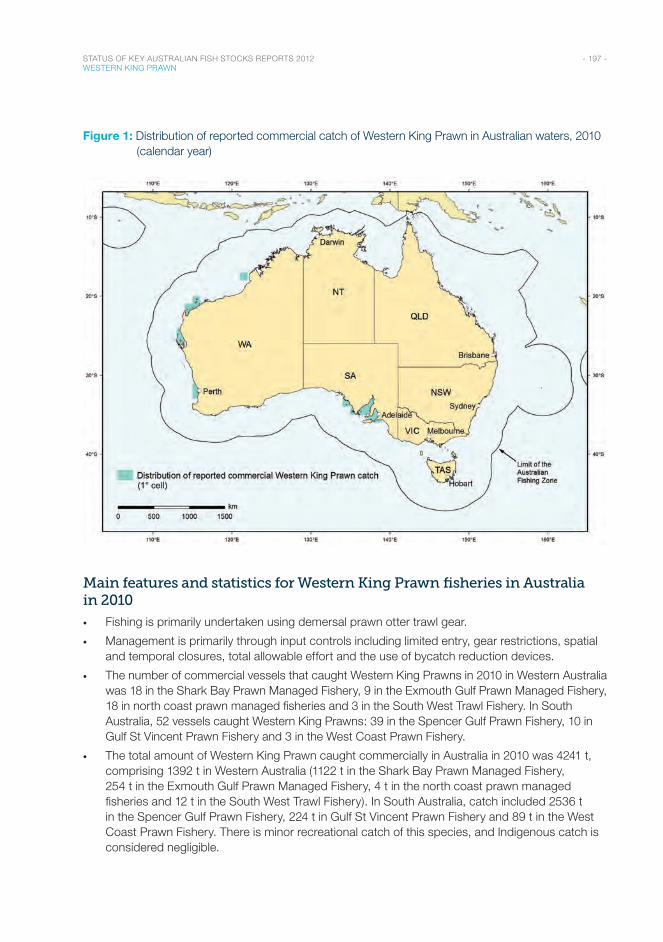
- 197 - STATUS OF KEY AUSTRALIAN FISH STOCKS REPORTS 2012 WESTERN KING PRAWN
Figure 1: Distribution of reported commercial catch of Western King Prawn in Australian waters, 2010 (calendar year)
Main features and statistics for Western King Prawn fisheries in Australia in 2010
• Fishing is primarily undertaken using demersal prawn otter trawl gear.
• Management is primarily through input controls including limited entry, gear restrictions, spatial and temporal closures, total allowable effort and the use of bycatch reduction devices.
• The number of commercial vessels that caught Western King Prawns in 2010 in Western Australia was 18 in the Shark Bay Prawn Managed Fishery, 9 in the Exmouth Gulf Prawn Managed Fishery, 18 in north coast prawn managed fisheries and 3 in the South West Trawl Fishery. In South Australia, 52 vessels caught Western King Prawns: 39 in the Spencer Gulf Prawn Fishery, 10 in Gulf St Vincent Prawn Fishery and 3 in the West Coast Prawn Fishery.
• The total amount of Western King Prawn caught commercially in Australia in 2010 was 4241 t, comprising 1392 t in Western Australia (1122 t in the Shark Bay Prawn Managed Fishery, 254 t in the Exmouth Gulf Prawn Managed Fishery, 4 t in the north coast prawn managed fisheries and 12 t in the South West Trawl Fishery). In South Australia, catch included 2536 t in the Spencer Gulf Prawn Fishery, 224 t in Gulf St Vincent Prawn Fishery and 89 t in the West Coast Prawn Fishery. There is minor recreational catch of this species, and Indigenous catch is considered negligible.
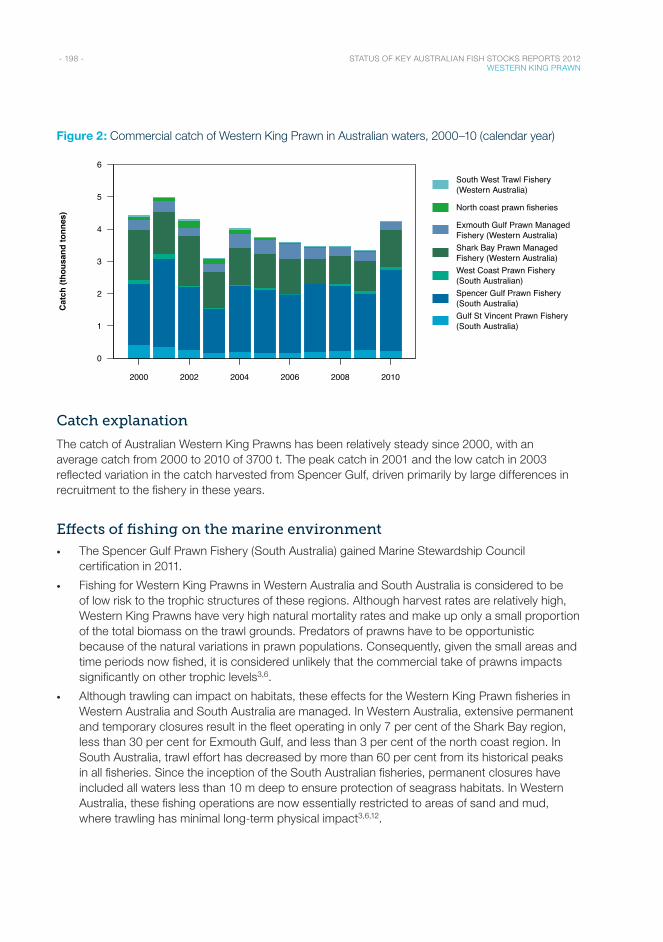
- 198 - STATUS OF KEY AUSTRALIAN FISH STOCKS REPORTS 2012 WESTERN KING PRAWN
Figure 2: Commercial catch of Western King Prawn in Australian waters, 2000–10 (calendar year)
Year
2000 2002 2004 2006 2008 2010
0
1
2
3
4
5
6
South West Trawl Fishery(Western Australia)
North coast prawn fisheries
Exmouth Gulf Prawn ManagedFishery (Western Australia)Shark Bay Prawn ManagedFishery (Western Australia)West Coast Prawn Fishery(South Australian) Spencer Gulf Prawn Fishery(South Australia)Gulf St Vincent Prawn Fishery(South Australia)
Cat
ch (t
hous
and
tonn
es)
Catch explanation
The catch of Australian Western King Prawns has been relatively steady since 2000, with an average catch from 2000 to 2010 of 3700 t. The peak catch in 2001 and the low catch in 2003 reflected variation in the catch harvested from Spencer Gulf, driven primarily by large differences in recruitment to the fishery in these years.
Effects of fishing on the marine environment
• The Spencer Gulf Prawn Fishery (South Australia) gained Marine Stewardship Council certification in 2011.
• Fishing for Western King Prawns in Western Australia and South Australia is considered to be of low risk to the trophic structures of these regions. Although harvest rates are relatively high, Western King Prawns have very high natural mortality rates and make up only a small proportion of the total biomass on the trawl grounds. Predators of prawns have to be opportunistic because of the natural variations in prawn populations. Consequently, given the small areas and time periods now fished, it is considered unlikely that the commercial take of prawns impacts significantly on other trophic levels3,6.
• Although trawling can impact on habitats, these effects for the Western King Prawn fisheries in Western Australia and South Australia are managed. In Western Australia, extensive permanent and temporary closures result in the fleet operating in only 7 per cent of the Shark Bay region, less than 30 per cent for Exmouth Gulf, and less than 3 per cent of the north coast region. In South Australia, trawl effort has decreased by more than 60 per cent from its historical peaks in all fisheries. Since the inception of the South Australian fisheries, permanent closures have included all waters less than 10 m deep to ensure protection of seagrass habitats. In Western Australia, these fishing operations are now essentially restricted to areas of sand and mud, where trawling has minimal long-term physical impact3,6,12.
- 199 - STATUS OF KEY AUSTRALIAN FISH STOCKS REPORTS 2012 WESTERN KING PRAWN
• All prawn trawlers operating in Western Australia must use bycatch reduction devices, including turtle excluder devices and hoppers to increase survival of returned fish. In South Australia, all boats use crab bags, and 49 of the 52 boats use hopper systems to ensure rapid return of bycatch to the water. In the Gulf St Vincent Prawn Fishery (South Australia), all boats recently adopted specialised mesh codends with rigid grids that substantially reduce bycatch volumes (SARDI, unpublished data).
• Although trawling does capture a wide variety of byproduct and bycatch species, studies in Western Australia and South Australia found no significant difference in biodiversity between trawled and non-trawled areas12–13.
Environmental effects on Western King Prawn
• The biomass of Western King Prawns can be highly variable, and is affected by environmental factors such as water temperatures, cyclones and broadscale oceanographic features such as the Leeuwin Current14.
• Flooding events in Shark Bay during December 2010 and February 2011, associated with strong La Niña events in November 2010 and February 2011, could have had a significant effect on the prawn fishery15.
• In South Australia, there is some evidence to suggest that strong El Niño conditions result in unfavourable upwelling in critical spawning grounds, which may result in recruitment failure16.
References1. Grey, DL, Dall, W & Baker, A 1983, A guide to the Australian penaeid prawns, Northern Territory Department of Primary
Production, Darwin.
2. Carrick, NA 2003, Gulf prawn (Melicertus latisulcatus) fishery, Fishery Assessment Report to PIRSA Fisheries, SARDI publication RD03/0079-2, SARDI Research Report Series no. 161, South Australian Research and Development Institute, Adelaide.
3. Kangas, M, McCrea, J, Fletcher, W, Sporer, E & Weir, V 2006, Shark Bay Prawn Fishery, ESD Report Series 3, Western Australian Department of Fisheries, North Beach.
4. Penn, JW, Watson, RA, Caputi, N & Hall, N 1997, Protecting vulnerable stocks in multi-species prawn fisheries, in DA Hancock, DC Smith, A Grant & JP Buemer (eds), Developing and sustaining world fisheries resources: the state of science and management, 2nd World Fisheries Congress, CSIRO, Australia, 122–129.
5. Fletcher, WJ & Santoro, K (eds) 2011, State of the fisheries and aquatic resources report 2010/11, Western Australian Department of Fisheries, Perth.
6. Kangas, M, McCrea, J, Fletcher, W, Sporer, E & Weir, V 2006, Exmouth Gulf Prawn Fishery, ESD Report Series 1, Western Australian Department of Fisheries, North Beach.
7. Dixon, CD, Hooper, GE & Burch, P 2012, Spencer Gulf Prawn Penaeus (Melicertus) latisulcatus Fishery 2010/11, Fishery Assessment Report to PIRSA Fisheries and Aquaculture, SARDI publication F2007/000770-5, SARDI Research Report Series 603, South Australian Research and Development Institute (Aquatic Sciences), Adelaide.
8. Dixon, CD & Sloan, S 2007, Management plan for the South Australian Spencer Gulf Prawn Fishery, South Australian Fisheries Management Series, paper 54, Primary Industries and Resources South Australia, Adelaide.
9. Dixon, CD, Hooper, GE & Burch P 2012, Gulf St Vincent Prawn, Penaeus (Melicertus) latisulcatus, Fishery 2010/11, Fishery Assessment Report to PIRSA Fisheries and Aquaculture, SARDI publication F2007/000782-5, SARDI Research Report Series 631, South Australian Research and Development Institute (Aquatic Sciences), Adelaide.
10. Dixon, CD & Roberts, SD 2006, West Coast Prawn (Melicertus latisulcatus) Fishery, Fishery Assessment Report to PIRSA Fisheries, SARDI publication RD03/0076–4, SARDI Research Report Series 122, South Australian Research and Development Institute (Aquatic Sciences), Adelaide.
11. Hooper, GE, Dixon, CD & Roberts, SD 2011, West Coast Prawn, Penaeus (Melicertus latisulcatus), Fishery 2010, Fishery Status Report to PIRSA Fisheries and Aquaculture, SARDI publication F2007/000772-4, SARDI Research Report Series 563, South Australian Research and Development Institute (Aquatic Sciences), Adelaide.
12. Kangas, M, Morrison, S, Unsworth, P, Lai, E, Wright, I & Thomson, A 2007, Development of biodiversity and habitat monitoring systems for key trawl fisheries in Western Australia, final report, Fisheries Research and Development Corporation, project 2002/038, Fisheries Research Report 160, Fisheries Western Australia, North Beach.

- 200 - STATUS OF KEY AUSTRALIAN FISH STOCKS REPORTS 2012 WESTERN KING PRAWN
13. Currie, DR, Dixon, CD, Roberts, SD, Hooper, GE, Sorokin, SJ & Ward, TM 2009, Fishery-independent by-catch survey to inform risk assessment of the Spencer Gulf Prawn Trawl Fishery, report to PIRSA Fisheries, South Australian Research and Development Institute (Aquatic Sciences), Adelaide.
14. Lenanton, RC, Caputi, N, Kangas, MI & Craine, M 2009, The ongoing influence of the Leeuwin Current on economically important fish and invertebrates off temperate Western Australia—has it changed?, Journal of the Royal Society of Western Australia, 92: 111–127.
15. Pearce, A, Lenanton, R, Jackson, G, Moore, J, Feng, M & Gaughan, D 2011, The ‘marine heat wave’ off Western Australia during the summer of 2010/11, Fisheries Research Report 222, Western Australian Department of Fisheries, North Beach.
16. Carrick, N 2008, Determining the impact of environmental variability on the sustainability, fishery dynamics and economic performance of the West Coast prawn fishery, Fisheries Research and Development Corporation project 2005/082, FRDC & Fisheries and Environmental Consulting Services, Canberra.
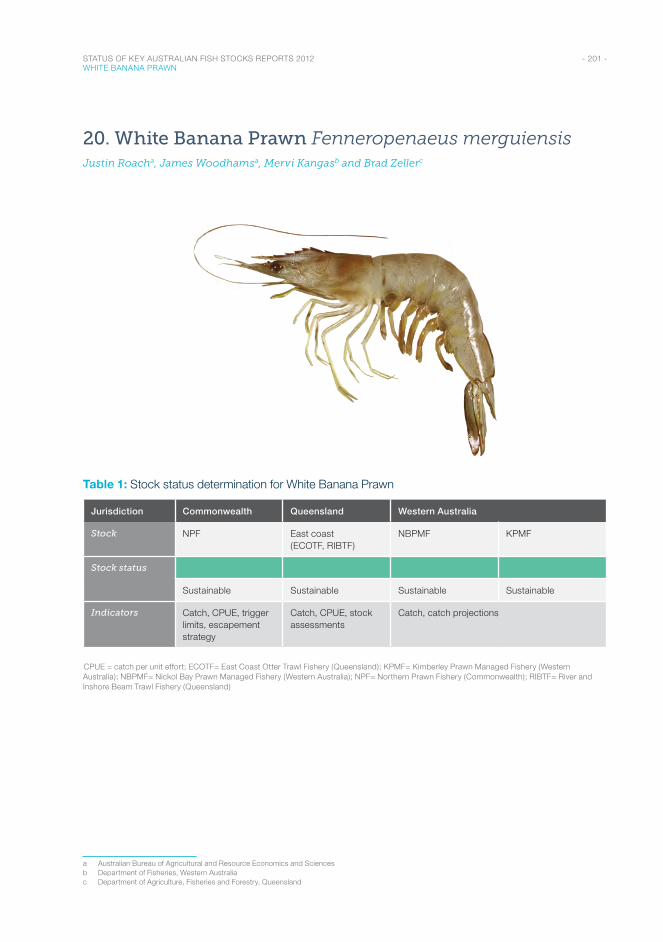
- 201 - STATUS OF KEY AUSTRALIAN FISH STOCKS REPORTS 2012 WHITE BANANA PRAWN
20. White Banana Prawn Fenneropenaeus merguiensisJustin Roacha, James Woodhamsa, Mervi Kangasb and Brad Zellerc
Table 1: Stock status determination for White Banana Prawn
Jurisdiction Commonwealth Queensland Western Australia
Stock NPF East coast (ECOTF, RIBTF)
NBPMF KPMF
Stock status
Sustainable Sustainable Sustainable Sustainable
Indicators Catch, CPUE, trigger limits, escapement strategy
Catch, CPUE, stock assessments
Catch, catch projections
CPUE = catch per unit effort; ECOTF= East Coast Otter Trawl Fishery (Queensland); KPMF= Kimberley Prawn Managed Fishery (Western Australia); NBPMF= Nickol Bay Prawn Managed Fishery (Western Australia); NPF= Northern Prawn Fishery (Commonwealth); RIBTF= River and Inshore Beam Trawl Fishery (Queensland)
a Australian Bureau of Agricultural and Resource Economics and Sciencesb Department of Fisheries, Western Australiac Department of Agriculture, Fisheries and Forestry, Queensland
- 202 - STATUS OF KEY AUSTRALIAN FISH STOCKS REPORTS 2012 WHITE BANANA PRAWN
Stock structure
The biological stock structure of White Banana Prawn is uncertain. There is some evidence that there may be separate biological stocks of White Banana Prawn in the Northern Prawn Fishery (Commonwealth); however, the boundaries of these biological stocks are unknown1. Additionally, biological stocks within Western Australia and Queensland are unlikely to be completely independent, although it does appear that biological stocks separated by large distances are more independent than adjacent biological stocks2. In the absence of clear information on biological stock structure, status is reported at the management unit level.
Stock status
Northern Prawn Fishery (Commonwealth) management unit
Recruitment of White Banana Prawns in the Northern Prawn Fishery (Commonwealth) is thought to be largely determined by rainfall3. As a result, a reliable stock–recruitment relationship has not been established. No formal stock assessment exists for this stock. However, a model that predicts catch, using rainfall data, is currently being developed by CSIRO (the Commonwealth Scientific and Industrial Research Organisation).
The harvest strategy for White Banana Prawns in the Northern Prawn Fishery (Commonwealth) is designed to allow for sufficient escapement to ensure adequate spawning biomass (based on historical data). This is achieved through season length and catch-rate thresholds4. The harvest strategy is designed to perform under conditions of substantial variation in biomass that are thought to be largely independent of fishing.
In 2010, the season ran for approximately 10 weeks (the minimum season length is 6 weeks), with total reported commercial landings of 5642 tonnes (t). This catch is similar to that of the previous two seasons and is approximately 25 per cent above the average catch of the preceding 10 years (2000–09). The commercial catch in 2011 was higher, at 7141 t. These catch levels are indicative of a larger than average biomass, assuming that fishing power has remained relatively constant. Although fishing mortality is thought to be high for White Banana Prawns in some years5, the species is thought to be resilient to fishing pressure. Effort expended on White Banana Prawns in the Northern Prawn Fishery (Commonwealth) in 2010 (3146 vessel days) was around 82 per cent of the average effort over the preceding 10 years.
The recent historically high commercial catch of White Banana Prawns and a longer than minimum season length (supported by high catch rates) indicate that the management unit is unlikely to be recruitment overfished. The comparatively low effort indicates that fishing mortality is unlikely to cause the management unit to become recruitment overfished.
On the basis of the evidence provided above, the Northern Prawn Fishery (Commonwealth) management unit is classified as a sustainable stock.
East coast (Queensland) White Banana Prawn management unit
The White Banana Prawn fishery is characterised by highly variable commercial catches, which are believed to be strongly affected by environmental factors such as rainfall, salinity, river flow and temperature2–3. The most recent quantitative assessment of the Queensland White Banana Prawn stock2 estimated that annual maximum sustainable yield (MSY) in 2004 was 802 t, with a 90 per cent confidence interval of 453–1031 t. In 2004, the reported total catch was 928 t, which exceeded MSY. However, it appears that recruitment in 2004 was high, and hence the available biomass was also high—biomass did not fall below 50–70 per cent of unfished biomass. It is important to note that MSY
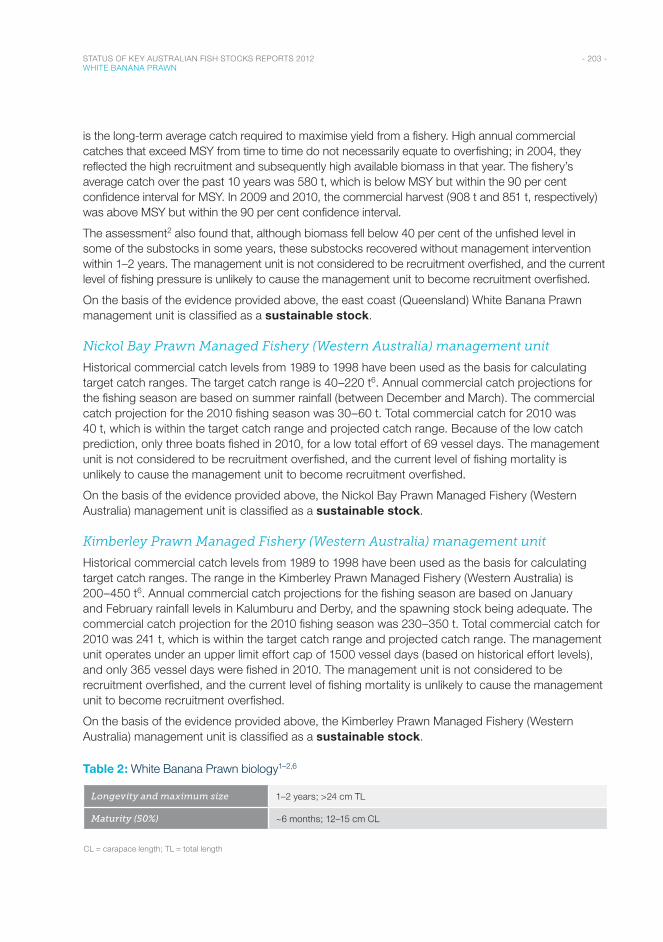
- 203 - STATUS OF KEY AUSTRALIAN FISH STOCKS REPORTS 2012 WHITE BANANA PRAWN
is the long-term average catch required to maximise yield from a fishery. High annual commercial catches that exceed MSY from time to time do not necessarily equate to overfishing; in 2004, they reflected the high recruitment and subsequently high available biomass in that year. The fishery’s average catch over the past 10 years was 580 t, which is below MSY but within the 90 per cent confidence interval for MSY. In 2009 and 2010, the commercial harvest (908 t and 851 t, respectively) was above MSY but within the 90 per cent confidence interval.
The assessment2 also found that, although biomass fell below 40 per cent of the unfished level in some of the substocks in some years, these substocks recovered without management intervention within 1–2 years. The management unit is not considered to be recruitment overfished, and the current level of fishing pressure is unlikely to cause the management unit to become recruitment overfished.
On the basis of the evidence provided above, the east coast (Queensland) White Banana Prawn management unit is classified as a sustainable stock.
Nickol Bay Prawn Managed Fishery (Western Australia) management unit
Historical commercial catch levels from 1989 to 1998 have been used as the basis for calculating target catch ranges. The target catch range is 40–220 t6. Annual commercial catch projections for the fishing season are based on summer rainfall (between December and March). The commercial catch projection for the 2010 fishing season was 30–60 t. Total commercial catch for 2010 was 40 t, which is within the target catch range and projected catch range. Because of the low catch prediction, only three boats fished in 2010, for a low total effort of 69 vessel days. The management unit is not considered to be recruitment overfished, and the current level of fishing mortality is unlikely to cause the management unit to become recruitment overfished.
On the basis of the evidence provided above, the Nickol Bay Prawn Managed Fishery (Western Australia) management unit is classified as a sustainable stock.
Kimberley Prawn Managed Fishery (Western Australia) management unit
Historical commercial catch levels from 1989 to 1998 have been used as the basis for calculating target catch ranges. The range in the Kimberley Prawn Managed Fishery (Western Australia) is 200–450 t6. Annual commercial catch projections for the fishing season are based on January and February rainfall levels in Kalumburu and Derby, and the spawning stock being adequate. The commercial catch projection for the 2010 fishing season was 230–350 t. Total commercial catch for 2010 was 241 t, which is within the target catch range and projected catch range. The management unit operates under an upper limit effort cap of 1500 vessel days (based on historical effort levels), and only 365 vessel days were fished in 2010. The management unit is not considered to be recruitment overfished, and the current level of fishing mortality is unlikely to cause the management unit to become recruitment overfished.
On the basis of the evidence provided above, the Kimberley Prawn Managed Fishery (Western Australia) management unit is classified as a sustainable stock.
Table 2: White Banana Prawn biology1–2,6
Longevity and maximum size 1–2 years; >24 cm TL
Maturity (50%) ~6 months; 12–15 cm CL
CL = carapace length; TL = total length
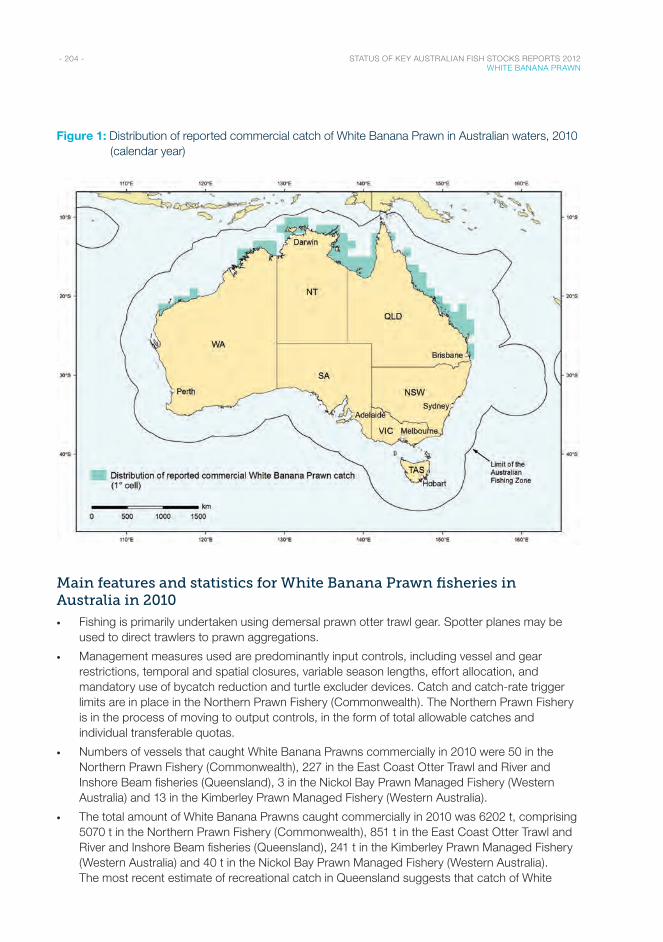
- 204 - STATUS OF KEY AUSTRALIAN FISH STOCKS REPORTS 2012 WHITE BANANA PRAWN
Figure 1: Distribution of reported commercial catch of White Banana Prawn in Australian waters, 2010 (calendar year)
Main features and statistics for White Banana Prawn fisheries in Australia in 2010
• Fishing is primarily undertaken using demersal prawn otter trawl gear. Spotter planes may be used to direct trawlers to prawn aggregations.
• Management measures used are predominantly input controls, including vessel and gear restrictions, temporal and spatial closures, variable season lengths, effort allocation, and mandatory use of bycatch reduction and turtle excluder devices. Catch and catch-rate trigger limits are in place in the Northern Prawn Fishery (Commonwealth). The Northern Prawn Fishery is in the process of moving to output controls, in the form of total allowable catches and individual transferable quotas.
• Numbers of vessels that caught White Banana Prawns commercially in 2010 were 50 in the Northern Prawn Fishery (Commonwealth), 227 in the East Coast Otter Trawl and River and Inshore Beam fisheries (Queensland), 3 in the Nickol Bay Prawn Managed Fishery (Western Australia) and 13 in the Kimberley Prawn Managed Fishery (Western Australia).
• The total amount of White Banana Prawns caught commercially in 2010 was 6202 t, comprising 5070 t in the Northern Prawn Fishery (Commonwealth), 851 t in the East Coast Otter Trawl and River and Inshore Beam fisheries (Queensland), 241 t in the Kimberley Prawn Managed Fishery (Western Australia) and 40 t in the Nickol Bay Prawn Managed Fishery (Western Australia). The most recent estimate of recreational catch in Queensland suggests that catch of White
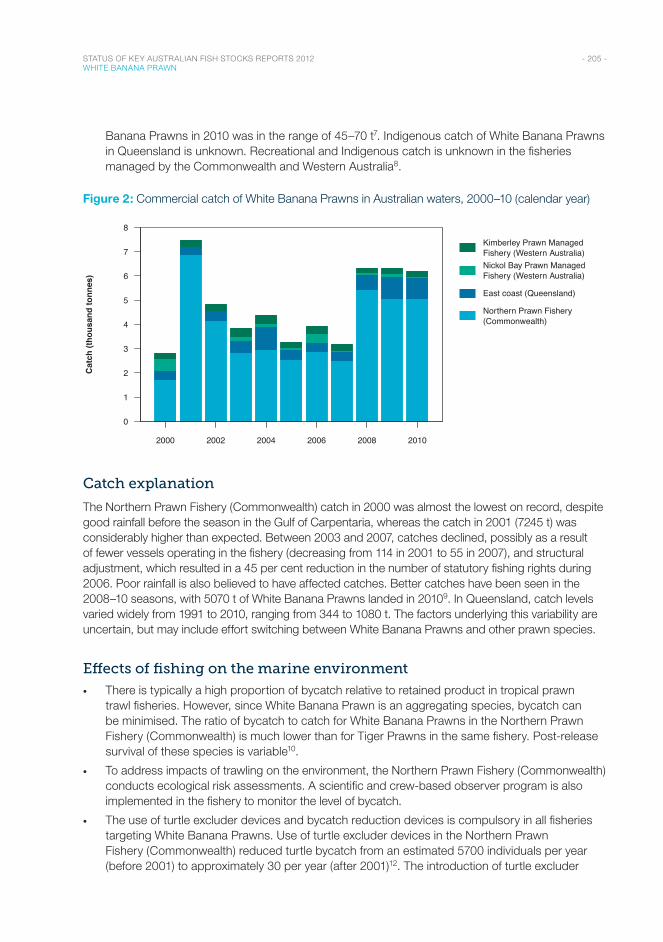
- 205 - STATUS OF KEY AUSTRALIAN FISH STOCKS REPORTS 2012 WHITE BANANA PRAWN
Banana Prawns in 2010 was in the range of 45–70 t7. Indigenous catch of White Banana Prawns in Queensland is unknown. Recreational and Indigenous catch is unknown in the fisheries managed by the Commonwealth and Western Australia8.
Figure 2: Commercial catch of White Banana Prawns in Australian waters, 2000–10 (calendar year)
Year
2000 2002 2004 2006 2008 2010
0
1
2
3
4
5
6
7
8
Kimberley Prawn ManagedFishery (Western Australia)Nickol Bay Prawn ManagedFishery (Western Australia)
East coast (Queensland)
Northern Prawn Fishery(Commonwealth)
Cat
ch (t
hous
and
tonn
es)
Catch explanation
The Northern Prawn Fishery (Commonwealth) catch in 2000 was almost the lowest on record, despite good rainfall before the season in the Gulf of Carpentaria, whereas the catch in 2001 (7245 t) was considerably higher than expected. Between 2003 and 2007, catches declined, possibly as a result of fewer vessels operating in the fishery (decreasing from 114 in 2001 to 55 in 2007), and structural adjustment, which resulted in a 45 per cent reduction in the number of statutory fishing rights during 2006. Poor rainfall is also believed to have affected catches. Better catches have been seen in the 2008–10 seasons, with 5070 t of White Banana Prawns landed in 20109. In Queensland, catch levels varied widely from 1991 to 2010, ranging from 344 to 1080 t. The factors underlying this variability are uncertain, but may include effort switching between White Banana Prawns and other prawn species.
Effects of fishing on the marine environment
• There is typically a high proportion of bycatch relative to retained product in tropical prawn trawl fisheries. However, since White Banana Prawn is an aggregating species, bycatch can be minimised. The ratio of bycatch to catch for White Banana Prawns in the Northern Prawn Fishery (Commonwealth) is much lower than for Tiger Prawns in the same fishery. Post-release survival of these species is variable10.
• To address impacts of trawling on the environment, the Northern Prawn Fishery (Commonwealth) conducts ecological risk assessments. A scientific and crew-based observer program is also implemented in the fishery to monitor the level of bycatch.
• The use of turtle excluder devices and bycatch reduction devices is compulsory in all fisheries targeting White Banana Prawns. Use of turtle excluder devices in the Northern Prawn Fishery (Commonwealth) reduced turtle bycatch from an estimated 5700 individuals per year (before 2001) to approximately 30 per year (after 2001)12. The introduction of turtle excluder
- 206 - STATUS OF KEY AUSTRALIAN FISH STOCKS REPORTS 2012 WHITE BANANA PRAWN
devices in the Western Australia prawn trawl fisheries in 2003 reduced turtle bycatch by at least 95 per cent13. Turtle excluder devices have reduced annual sea turtle interactions to an intermediate–low risk in the East Coast Otter Trawl Fishery (Queensland)11.
• The Northern Prawn Fishery (Commonwealth) was certified as a sustainable and well-managed fishery by the Marine Stewardship Council in November 2012.
Environmental effects on White Banana Prawn
• The abundance of prawns can be highly variable and influenced by environmental factors such as water temperatures, cyclones and broadscale oceanographic features3. For example, in Western Australia, cyclones can have either a positive or a negative impact on prawn biomass and availability. Early-season (December–January) cyclones can increase mortality of small prawns through the scouring of nursery areas, which destroys seagrass and algal habitat. Conversely, mortality can decrease when water becomes turbid because prawn mortality through predation is reduced6.
• River flow as a result of rainfall is highly correlated with offshore commercial catches of banana prawns in the south-eastern Gulf of Carpentaria3. It has been suggested that increased river flow has different effects on different stages of the White Banana Prawn life cycle: high flows can increase emigration of juveniles from estuaries; increased flows can prevent immigration, settlement and survival of post-larvae; and rainfall run-off may increase the overall productivity, through the contribution of increased nutrient input to increased growth and survival rates2.
References1. Yearsley, GK, Last, PR & Ward, RD 1999, Australian seafood handbook: domestic species, CSIRO Marine Research, Hobart.
2. Tanimoto, M, Courtney, AJ, O’Neil, MF & Leigh, GM 2006, Stock assessment of the Queensland (Australia) east coast banana prawn (Penaeus merguiensis), Queensland Department of Primary Industries and Fisheries, Brisbane.
3. Vance, DJ, Bishop, J, Dichmont, CM, Hall, N, McInnes, K & Taylor, BR 2003, Management of common banana prawn stocks of the Gulf of Carpentaria: separating the effects of fishing from those of the environment, ARF project 98/0716, CSIRO Marine Research, Cleveland.
4. Dichmont, CM, Jarrett, A, Hill, F & Brown, M 2012, Harvest strategy for the Northern Prawn Fishery under input controls, Australian Fisheries Management Authority, Canberra.
5. Zhou, S, Dichmont, CM, Burridge, CY, Venables, WV, Toscas, PJ & Vance, D 2007, Is catchability density-dependent for schooling prawns?, Fisheries Research, 85: 23–36.
6. Fletcher, WJ & Santoro, K (eds) 2011, State of the fisheries and aquatic resources report 2009/10, Western Australian Department of Fisheries, Perth.
7. Taylor, S, Webley, J & McInnes, K 2012, 2010 statewide recreational fishing survey, Queensland Department of Agriculture, Fisheries and Forestry, Brisbane.
8. Henry, GW & Lyle, JM 2003, The national recreational and Indigenous fishing survey, Fisheries Research and Development Corporation project 99/158, Australian Government Department of Agriculture, Fisheries and Forestry, Canberra, http://eprints.utas.edu.au/2526/1/Henry_Lyle_Nationalsurvey.pdf.
9. Woodhams, J, Stobutzki, I, Vieira, S, Curtotti, R & Begg, GA (eds) 2011, Fishery status reports 2010: status of fish stocks and fisheries managed by the Australian Government, Australian Bureau of Agricultural and Resource Economics and Sciences, Canberra.
10. Raudzens, E 2007, At sea testing of the Popeye Fishbox bycatch reduction device onboard the FV Adelaide Pearl for approval in Australia’s Northern Prawn Fishery, Australian Fisheries Management Authority, Canberra.
11. Pears, RJ, Morison, AK, Jebreen, EJ, Dunning, M, Pitcher, CR, Courtney, AJ, Houlden, B & Jacobsen, IP 2011, Ecological risk assessment of the East Coast Otter Trawl Fishery in the Great Barrier Reef Marine Park, technical report, 2 vols, Great Barrier Reef Marine Park Authority, Townsville.
12. Griffiths, S, Kenyon, R, Bulman, C, Dowdney, J, Williams, A, Sporcic, M & Fuller, M 2007, Ecological risk assessment for the effects of fishing: report for the Northern Prawn Fishery, report to the Australian Fisheries Management Authority, Canberra.
13. Kangas, MI & Thomson, A 2004, Implementation and assessment of bycatch reduction devices in the Shark Bay and Exmouth Gulf trawl fisheries, final report, Fisheries Research and Development Corporation project 2000/189, Western Australian Department of Fisheries, Perth.

- 207 - STATUS OF KEY AUSTRALIAN FISH STOCKS REPORTS 2012 WHITE BANANA PRAWN


S H A R K S A R E F O U N D W O R L D W I D E . T H E R E A R E A B O U T 4 0 0 S P E C I E S O F S H A R K S . O F T H E S E , A R O U N D
18 0 S P E C I E S O C C U R I N A U S T R A L I A N W AT E R S , O F W H I C H A B O U T 7 0
A R E T H O U G H T T O B E E N D E M I C .
Sharks

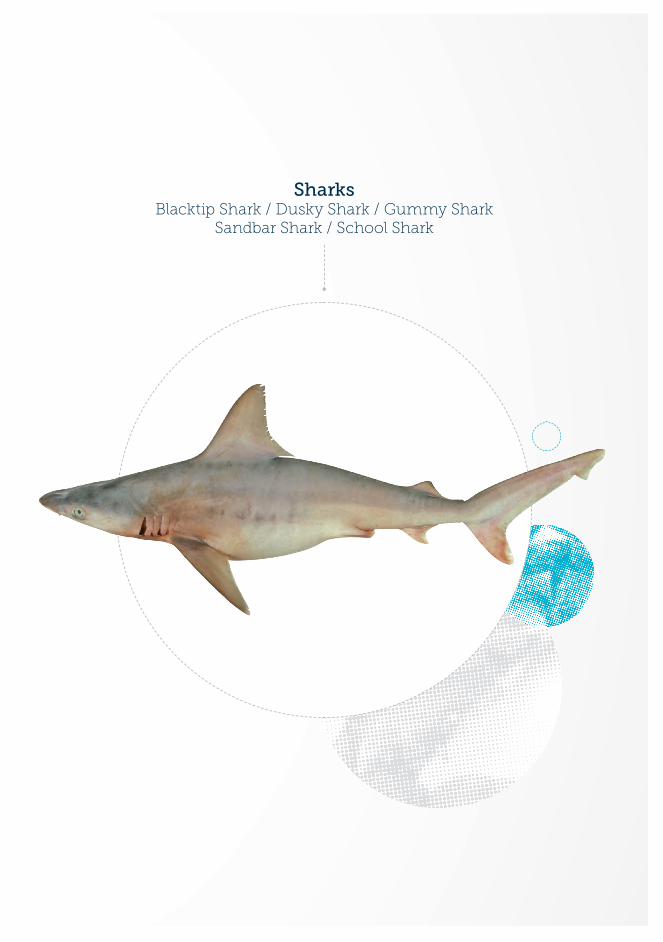
SharksBlacktip Shark / Dusky Shark / Gummy Shark
Sandbar Shark / School Shark
- 212 - STATUS OF KEY AUSTRALIAN FISH STOCKS REPORTS 2012 BLACKTIP SHARK
21. Blacktip Shark Carcharhinus tilstoni, C. limbatus, C. sorrah
Grant Johnsona, Rory McAuleyb, Vic Peddemorsc and Anthony Roelofsd
Carcharhinus tilstoni
Table 1: Stock status determination for Blacktip Shark
Jurisdiction New South Wales, Queensland
Northern Territory, Queensland
Northern Territory, Western Australia
Stock East coast (ECIFFF, OTLF)
Gulf of Carpentaria (GOCIFFF, ONLF)
North and west coast (JANSF, ONLF, NCSF)
Stock status
Undefined Undefined Sustainable
Indicators Catch Catch Catch, CPUE, pup production
CPUE = catch per unit effort; ECIFFF = East Coast Inshore Fin Fish Fishery (Queensland); GOCIFFF = Gulf of Carpentaria Inshore Fin Fish Fishery (Queensland); JANSF = Joint Authority Northern Shark Fishery; NCSF = North Coast Shark Fishery (Western Australia); ONLF = Offshore Net and Line Fishery (Northern Territory); OTLF = Ocean Trap and Line Fishery (New South Wales)
a Department of Primary Industry and Fisheries, Northern Territoryb Department of Fisheries, Western Australiac Department of Primary Industries, New South Walesd Department of Agriculture, Fisheries and Forestry, Queensland
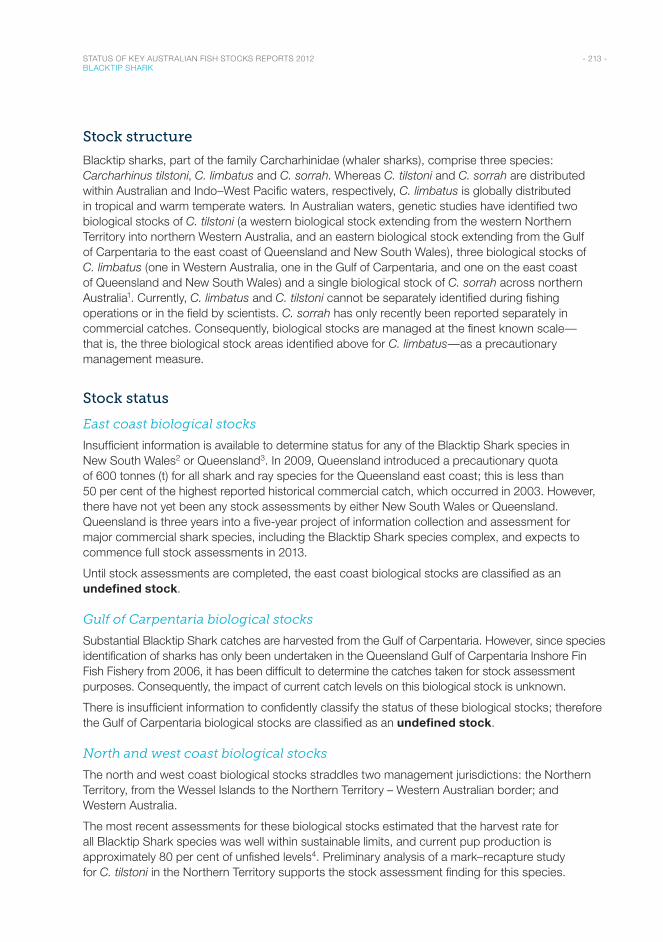
- 213 - STATUS OF KEY AUSTRALIAN FISH STOCKS REPORTS 2012 BLACKTIP SHARK
Stock structure
Blacktip sharks, part of the family Carcharhinidae (whaler sharks), comprise three species: Carcharhinus tilstoni, C. limbatus and C. sorrah. Whereas C. tilstoni and C. sorrah are distributed within Australian and Indo–West Pacific waters, respectively, C. limbatus is globally distributed in tropical and warm temperate waters. In Australian waters, genetic studies have identified two biological stocks of C. tilstoni (a western biological stock extending from the western Northern Territory into northern Western Australia, and an eastern biological stock extending from the Gulf of Carpentaria to the east coast of Queensland and New South Wales), three biological stocks of C. limbatus (one in Western Australia, one in the Gulf of Carpentaria, and one on the east coast of Queensland and New South Wales) and a single biological stock of C. sorrah across northern Australia1. Currently, C. limbatus and C. tilstoni cannot be separately identified during fishing operations or in the field by scientists. C. sorrah has only recently been reported separately in commercial catches. Consequently, biological stocks are managed at the finest known scale—that is, the three biological stock areas identified above for C. limbatus—as a precautionary management measure.
Stock status
East coast biological stocks
Insufficient information is available to determine status for any of the Blacktip Shark species in New South Wales2 or Queensland3. In 2009, Queensland introduced a precautionary quota of 600 tonnes (t) for all shark and ray species for the Queensland east coast; this is less than 50 per cent of the highest reported historical commercial catch, which occurred in 2003. However, there have not yet been any stock assessments by either New South Wales or Queensland. Queensland is three years into a five-year project of information collection and assessment for major commercial shark species, including the Blacktip Shark species complex, and expects to commence full stock assessments in 2013.
Until stock assessments are completed, the east coast biological stocks are classified as an undefined stock.
Gulf of Carpentaria biological stocks
Substantial Blacktip Shark catches are harvested from the Gulf of Carpentaria. However, since species identification of sharks has only been undertaken in the Queensland Gulf of Carpentaria Inshore Fin Fish Fishery from 2006, it has been difficult to determine the catches taken for stock assessment purposes. Consequently, the impact of current catch levels on this biological stock is unknown.
There is insufficient information to confidently classify the status of these biological stocks; therefore the Gulf of Carpentaria biological stocks are classified as an undefined stock.
North and west coast biological stocks
The north and west coast biological stocks straddles two management jurisdictions: the Northern Territory, from the Wessel Islands to the Northern Territory – Western Australian border; and Western Australia.
The most recent assessments for these biological stocks estimated that the harvest rate for all Blacktip Shark species was well within sustainable limits, and current pup production is approximately 80 per cent of unfished levels4. Preliminary analysis of a mark–recapture study for C. tilstoni in the Northern Territory supports the stock assessment finding for this species.
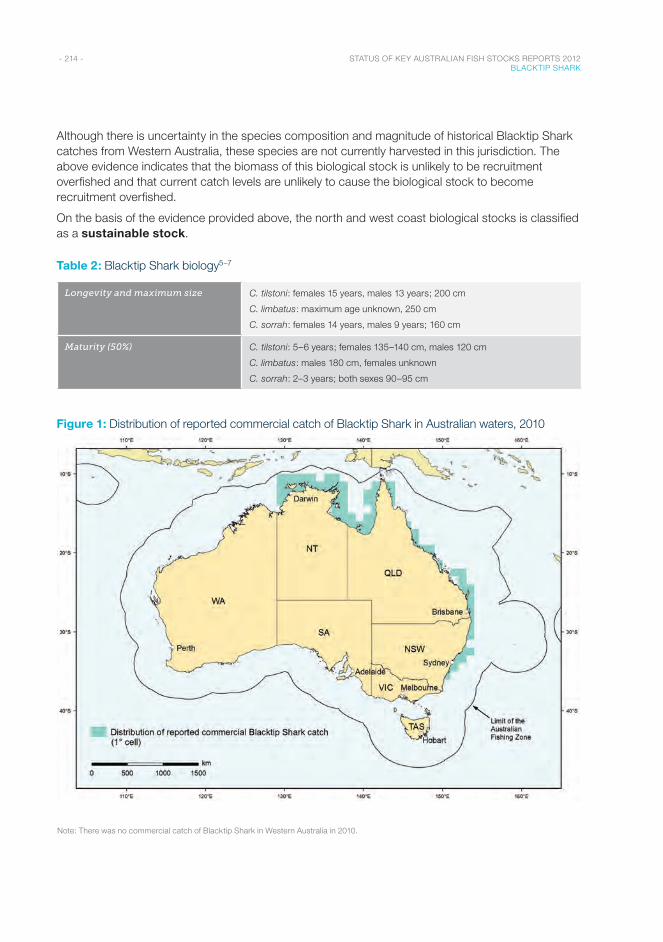
- 214 - STATUS OF KEY AUSTRALIAN FISH STOCKS REPORTS 2012 BLACKTIP SHARK
Although there is uncertainty in the species composition and magnitude of historical Blacktip Shark catches from Western Australia, these species are not currently harvested in this jurisdiction. The above evidence indicates that the biomass of this biological stock is unlikely to be recruitment overfished and that current catch levels are unlikely to cause the biological stock to become recruitment overfished.
On the basis of the evidence provided above, the north and west coast biological stocks is classified as a sustainable stock.
Table 2: Blacktip Shark biology5–7
Longevity and maximum size C. tilstoni: females 15 years, males 13 years; 200 cm
C. limbatus: maximum age unknown, 250 cm
C. sorrah: females 14 years, males 9 years; 160 cm
Maturity (50%) C. tilstoni: 5–6 years; females 135–140 cm, males 120 cm
C. limbatus: males 180 cm, females unknown
C. sorrah: 2–3 years; both sexes 90–95 cm
Figure 1: Distribution of reported commercial catch of Blacktip Shark in Australian waters, 2010
Note: There was no commercial catch of Blacktip Shark in Western Australia in 2010.
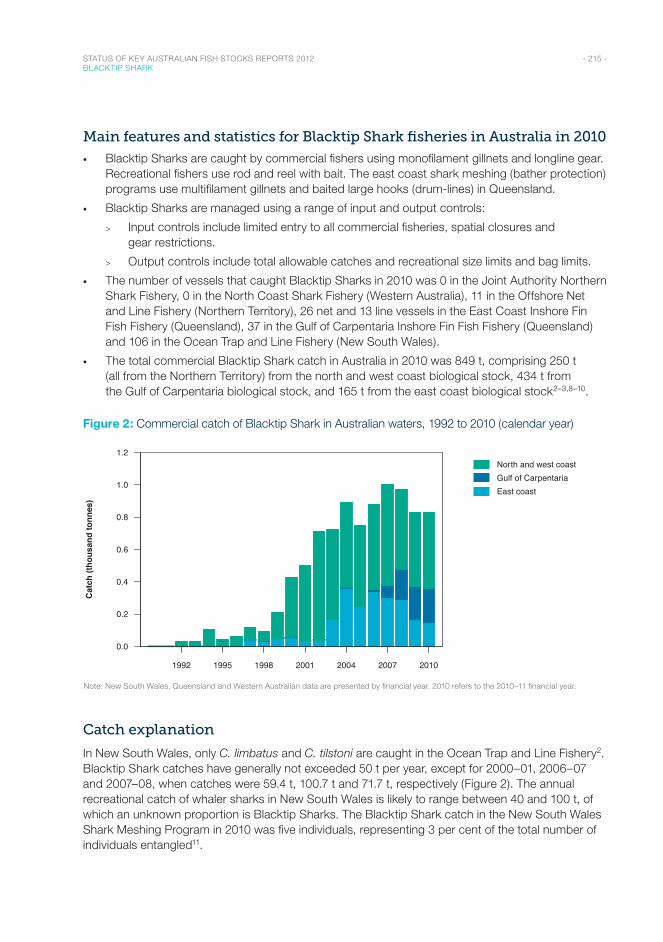
- 215 - STATUS OF KEY AUSTRALIAN FISH STOCKS REPORTS 2012 BLACKTIP SHARK
Main features and statistics for Blacktip Shark fisheries in Australia in 2010
• Blacktip Sharks are caught by commercial fishers using monofilament gillnets and longline gear. Recreational fishers use rod and reel with bait. The east coast shark meshing (bather protection) programs use multifilament gillnets and baited large hooks (drum-lines) in Queensland.
• Blacktip Sharks are managed using a range of input and output controls:
> Input controls include limited entry to all commercial fisheries, spatial closures and gear restrictions.
> Output controls include total allowable catches and recreational size limits and bag limits.
• The number of vessels that caught Blacktip Sharks in 2010 was 0 in the Joint Authority Northern Shark Fishery, 0 in the North Coast Shark Fishery (Western Australia), 11 in the Offshore Net and Line Fishery (Northern Territory), 26 net and 13 line vessels in the East Coast Inshore Fin Fish Fishery (Queensland), 37 in the Gulf of Carpentaria Inshore Fin Fish Fishery (Queensland) and 106 in the Ocean Trap and Line Fishery (New South Wales).
• The total commercial Blacktip Shark catch in Australia in 2010 was 849 t, comprising 250 t (all from the Northern Territory) from the north and west coast biological stock, 434 t from the Gulf of Carpentaria biological stock, and 165 t from the east coast biological stock2–3,8–10.
Figure 2: Commercial catch of Blacktip Shark in Australian waters, 1992 to 2010 (calendar year)
Year
1992 1995 1998 2001 2004 2007 2010
0.0
0.2
0.4
0.6
0.8
1.0
1.2North and west coastGulf of CarpentariaEast coast
Cat
ch (t
hous
and
tonn
es)
Note: New South Wales, Queensland and Western Australian data are presented by financial year. 2010 refers to the 2010–11 financial year.
Catch explanation
In New South Wales, only C. limbatus and C. tilstoni are caught in the Ocean Trap and Line Fishery2. Blacktip Shark catches have generally not exceeded 50 t per year, except for 2000–01, 2006–07 and 2007–08, when catches were 59.4 t, 100.7 t and 71.7 t, respectively (Figure 2). The annual recreational catch of whaler sharks in New South Wales is likely to range between 40 and 100 t, of which an unknown proportion is Blacktip Sharks. The Blacktip Shark catch in the New South Wales Shark Meshing Program in 2010 was five individuals, representing 3 per cent of the total number of individuals entangled11.
- 216 - STATUS OF KEY AUSTRALIAN FISH STOCKS REPORTS 2012 BLACKTIP SHARK
Catches of Blacktip Sharks in Queensland have been at or above 150 t since 2003, when more specific reporting was introduced (Figure 2). In the 2009–10 quota year, Blacktip Sharks comprised 38 per cent of the 501 t landed (of the 600 t total allowable commercial catch). On average, C. sorrah makes up only about 5 per cent of the total catch of the Blacktip Shark complex in Queensland east coast waters3.
For the Queensland part of the Gulf of Carpentaria Blacktip Shark catch, more species-specific logbook reporting for sharks was introduced in 2006 for Gulf net fishers. Data before this were not separated to species level. Catch in 2010 was 213 t, of which C. sorrah comprised around 10 per cent8.
In the Northern Territory, the Blacktip Shark catch increased from 272 t in 2001 to 469 t in 2010, with catches being stable and above 400 t since 2006 (Figure 2). In Western Australia, catches have generally been below 100 t over the past 20 years, although they peaked in 2001–02 and 2002–03 at 199 t and 208 t, respectively (Figure 2). Following the introduction of new management arrangements for the Joint Authority Northern Shark Fishery and the North Coast Shark Fishery in 2005, the mean annual Blacktip Shark catch was 67 t until 2009–10, when activity in these fisheries ceased9. There is no current harvest of Blacktip Sharks in Western Australia.
Effects of fishing on the marine environment
• Commercial gillnets and longline have almost no impact on marine habitat and are quite selective; bycatch makes up only a small proportion of the catch. However, these fishing methods do interact with threatened, endangered and protected (TEP) species. Although reported interactions are low, the impact on the populations of most TEP species is unknown3,8–10,12–13. Longline fishing on the east coast has been shown to have the potential to threaten the long-term viability of the east coast stock of Grey Nurse Shark14.
Environmental effects on Blacktip Shark
• The impact of environmental factors on Blacktip Shark biological stocks is unknown. However, these species are adapted to a range of environmental conditions, and are therefore likely to be resilient to environmental changes.
References1. Ovenden, JR, Street, R, Broderick, D, Kashiwagi, T & Salini, J 2007, Genetic population structure of black-tip sharks
(Carcharhinus tilstoni and C. sorrah) in northern Australia, in J Salini, R McAuley, S Blaber, R Buckworth, J Chidlow, N Gribble, JR Ovenden, S Peverell, R Pillans, J Stevens, I Stobutzki, C Tarca & T Walker, T (eds), Northern Australian sharks and rays: the sustainability of target and bycatch species, phase 2, Fisheries Research and Development Corporation, Cleveland.
2. Rowling, KA, Hegarty, A & Ives, M 2010, Status of fisheries resources in NSW 2008/09, Industry & Investment NSW, Cronulla.
3. Queensland Department of Employment, Economic Development and Innovation 2011, Annual status report 2010—East Coast Inshore Fin Fish Fishery, Queensland Department of Primary Industries and Fisheries, Brisbane.
4. Grubert, MA, Saunders, TM, Martin, JM, Lee, HS & Walters, CJ (in press), Stock assessments of selected Northern Territory fishes, Fishery Report no. 110, Northern Territory Government.
5. Harry, AV 2011, Life histories of commercially important tropical sharks from the Great Barrier Reef World Heritage Area, PhD thesis, James Cook University, Townsville.
6. Harry, AV, Tobin, AJ, Simpfendorfer, CA, Welch, DJ, Mapleston, A, White, J, Williams, AJ & Stapley, J 2011, Evaluating catch and mitigating risk in a multi-species, tropical, inshore shark fishery within the Great Barrier Reef World Heritage Area, Marine and Freshwater Research 62: 710–721.
7. Last, PR & Stevens, J 2009, Sharks and rays of Australia, CSIRO Publishing, Collingwood.
8. Queensland Department of Employment, Economic Development and Innovation 2011, Annual status report 2010—Gulf of Carpentaria Inshore Fin Fish Fishery, Queensland Department of Primary Industries and Fisheries, Brisbane.
- 217 - STATUS OF KEY AUSTRALIAN FISH STOCKS REPORTS 2012 BLACKTIP SHARK
9. McAuley, R & Sarginson, N 2011, Northern shark fisheries status report, in WJ Fletcher & K Santoro (eds), State of the fisheries and aquatic resources report 2010/11, Department of Fisheries, Government of Western Australia, Perth.
10. Northern Territory Government 2011, Fishery status report 2010, Fishery Report no. 106, Northern Territory Government Department of Resources, Darwin.
11. Andrews, T & Peddemors, V 2012, Shark meshing (bather protection) program 2011–12 annual performance report, NSW Department of Primary Industries, Orange.
12. Queensland Department of Employment, Economic Development and Innovation 2011, Fishery observation in the East Coast Fin Fish Fishery, Fisheries Queensland, Brisbane.
13. Stapley, J & Rose, C 2009, A report on data collected by fisheries observers in the Queensland offshore Commercial Mesh Net Fishery (N9) in the Gulf of Carpentaria, 2000–2006, Queensland Department of Primary Industries and Fisheries, Brisbane.
14. Bradshaw, CJE, Peddemors, VM, McAuley RB & Harcourt, RG 2008, Population viability of eastern Australia Grey Nurse Sharks under fishing mitigation and climate change, final report to the Australian Government Department of the Environment, Water, Heritage and the Arts, Canberra.
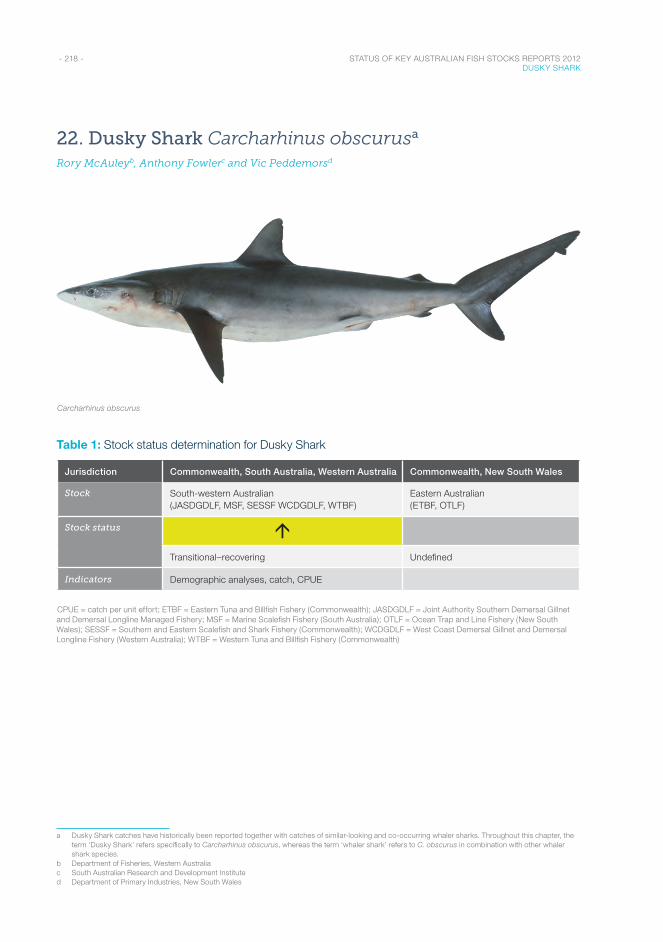
- 218 - STATUS OF KEY AUSTRALIAN FISH STOCKS REPORTS 2012 DUSKY SHARK
22. Dusky Shark Carcharhinus obscurusa
Rory McAuleyb, Anthony Fowlerc and Vic Peddemorsd
Carcharhinus obscurus
Table 1: Stock status determination for Dusky Shark
Jurisdiction Commonwealth, South Australia, Western Australia Commonwealth, New South Wales
Stock South-western Australian (JASDGDLF, MSF, SESSF WCDGDLF, WTBF)
Eastern Australian (ETBF, OTLF)
Stock status áTransitional–recovering Undefined
Indicators Demographic analyses, catch, CPUE
CPUE = catch per unit effort; ETBF = Eastern Tuna and Billfish Fishery (Commonwealth); JASDGDLF = Joint Authority Southern Demersal Gillnet and Demersal Longline Managed Fishery; MSF = Marine Scalefish Fishery (South Australia); OTLF = Ocean Trap and Line Fishery (New South Wales); SESSF = Southern and Eastern Scalefish and Shark Fishery (Commonwealth); WCDGDLF = West Coast Demersal Gillnet and Demersal Longline Fishery (Western Australia); WTBF = Western Tuna and Billfish Fishery (Commonwealth)
a Dusky Shark catches have historically been reported together with catches of similar-looking and co-occurring whaler sharks. Throughout this chapter, the term ‘Dusky Shark’ refers specifically to Carcharhinus obscurus, whereas the term ‘whaler shark’ refers to C. obscurus in combination with other whaler shark species.
b Department of Fisheries, Western Australiac South Australian Research and Development Instituted Department of Primary Industries, New South Wales
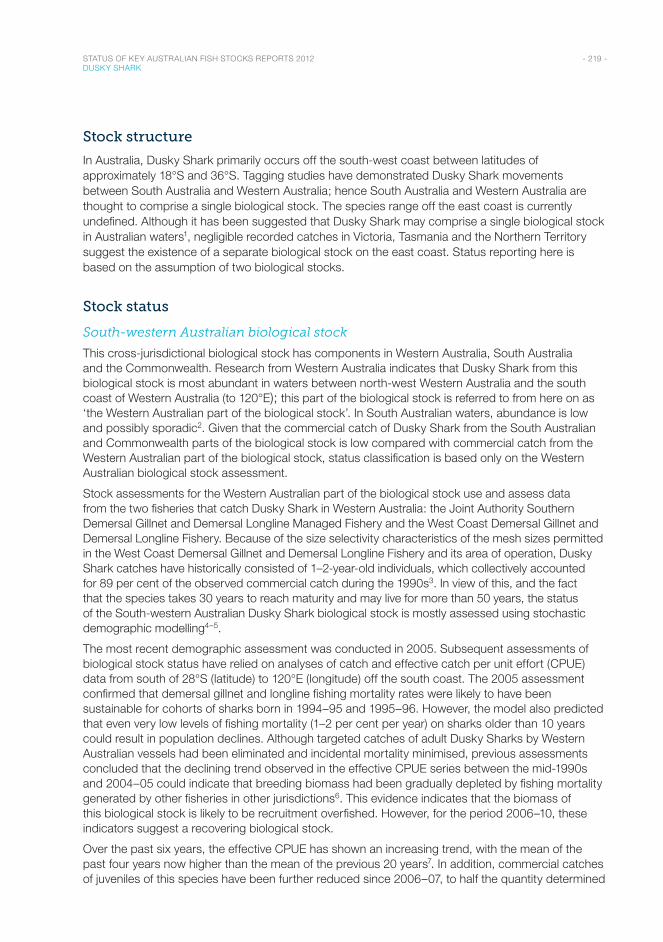
- 219 - STATUS OF KEY AUSTRALIAN FISH STOCKS REPORTS 2012 DUSKY SHARK
Stock structure
In Australia, Dusky Shark primarily occurs off the south-west coast between latitudes of approximately 18°S and 36°S. Tagging studies have demonstrated Dusky Shark movements between South Australia and Western Australia; hence South Australia and Western Australia are thought to comprise a single biological stock. The species range off the east coast is currently undefined. Although it has been suggested that Dusky Shark may comprise a single biological stock in Australian waters1, negligible recorded catches in Victoria, Tasmania and the Northern Territory suggest the existence of a separate biological stock on the east coast. Status reporting here is based on the assumption of two biological stocks.
Stock status
South-western Australian biological stock
This cross-jurisdictional biological stock has components in Western Australia, South Australia and the Commonwealth. Research from Western Australia indicates that Dusky Shark from this biological stock is most abundant in waters between north-west Western Australia and the south coast of Western Australia (to 120°E); this part of the biological stock is referred to from here on as ‘the Western Australian part of the biological stock’. In South Australian waters, abundance is low and possibly sporadic2. Given that the commercial catch of Dusky Shark from the South Australian and Commonwealth parts of the biological stock is low compared with commercial catch from the Western Australian part of the biological stock, status classification is based only on the Western Australian biological stock assessment.
Stock assessments for the Western Australian part of the biological stock use and assess data from the two fisheries that catch Dusky Shark in Western Australia: the Joint Authority Southern Demersal Gillnet and Demersal Longline Managed Fishery and the West Coast Demersal Gillnet and Demersal Longline Fishery. Because of the size selectivity characteristics of the mesh sizes permitted in the West Coast Demersal Gillnet and Demersal Longline Fishery and its area of operation, Dusky Shark catches have historically consisted of 1–2-year-old individuals, which collectively accounted for 89 per cent of the observed commercial catch during the 1990s3. In view of this, and the fact that the species takes 30 years to reach maturity and may live for more than 50 years, the status of the South-western Australian Dusky Shark biological stock is mostly assessed using stochastic demographic modelling4–5.
The most recent demographic assessment was conducted in 2005. Subsequent assessments of biological stock status have relied on analyses of catch and effective catch per unit effort (CPUE) data from south of 28°S (latitude) to 120°E (longitude) off the south coast. The 2005 assessment confirmed that demersal gillnet and longline fishing mortality rates were likely to have been sustainable for cohorts of sharks born in 1994–95 and 1995–96. However, the model also predicted that even very low levels of fishing mortality (1–2 per cent per year) on sharks older than 10 years could result in population declines. Although targeted catches of adult Dusky Sharks by Western Australian vessels had been eliminated and incidental mortality minimised, previous assessments concluded that the declining trend observed in the effective CPUE series between the mid-1990s and 2004–05 could indicate that breeding biomass had been gradually depleted by fishing mortality generated by other fisheries in other jurisdictions6. This evidence indicates that the biomass of this biological stock is likely to be recruitment overfished. However, for the period 2006–10, these indicators suggest a recovering biological stock.
Over the past six years, the effective CPUE has shown an increasing trend, with the mean of the past four years now higher than the mean of the previous 20 years7. In addition, commercial catches of juveniles of this species have been further reduced since 2006–07, to half the quantity determined
- 220 - STATUS OF KEY AUSTRALIAN FISH STOCKS REPORTS 2012 DUSKY SHARK
to be sustainable for cohorts of sharks born in 1994–95 and 1995–96. Therefore, along with the introduction of comprehensive measures to mitigate cryptic mortality of older Dusky Sharks within all Western Australian–managed commercial fisheries, the current management arrangements are considered suitably precautionary to ensure that fishing mortality is now at a level that should allow the biological stock to recover from its recruitment overfished state.
On the basis of the evidence provided above, the biological stock is classified as a transitional–recovering stock.
Eastern Australian biological stock
In New South Wales, whaler sharks (Carcharhinus spp.), including Dusky Shark (C. obscurus), have historically not been identified and reported at the species level in the commercial catch logbooks. Observer data indicate that whaler sharks represent the second highest shark species catch in the New South Wales Ocean Trap and Line Fishery (15 per cent of overall shark catch)8. Insufficient information is available to determine status for any of the whaler shark species in New South Wales, including Dusky Shark9 in their jurisdictions.
Dusky Sharks are taken as a non-target species by Commonwealth fishers in the Eastern Tuna and Billfish Fishery, but have not had their biological stock status assessed. Occasional very small catches (200 kg or less) of Dusky Shark have also been reported from the Commonwealth Coral Sea Fishery. Collaboration is currently under way between New South Wales Fisheries and the Queensland Department of Agriculture, Fisheries and Forestry to confirm the stock structure of Dusky Shark.
Insufficient information is available to confidently classify the status of this biological stock; as a result, it is classified as an undefined stock.
Table 2: Dusky Shark biology1,4,6–7,10–11
Longevity and maximum size 40–55 years, >289 cm FL, 365 cm TL
Maturity (50%) Females: 27–32 years; 251 cm FL
FL = fork length; TL = total length
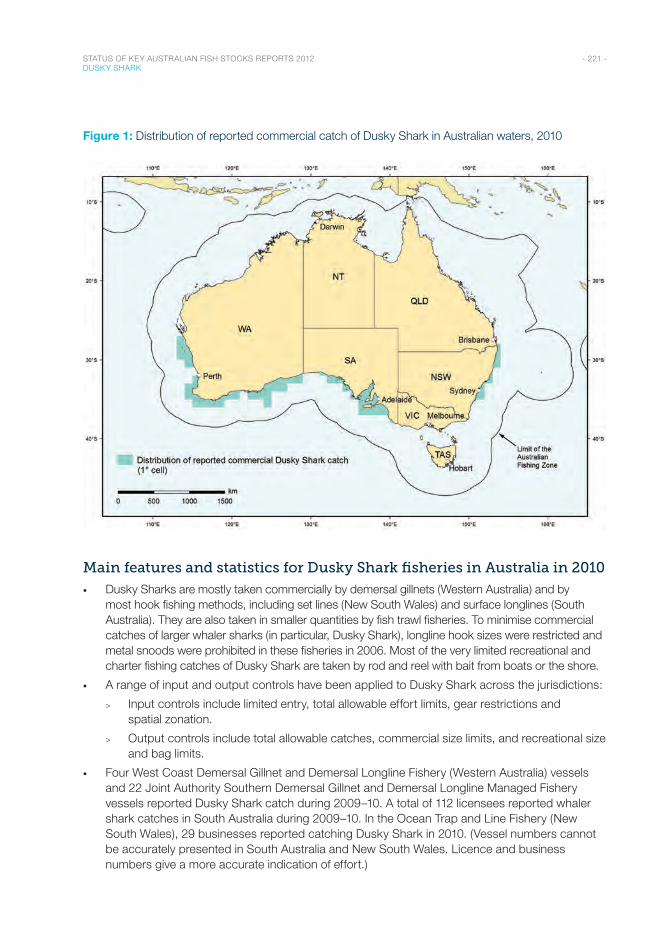
- 221 - STATUS OF KEY AUSTRALIAN FISH STOCKS REPORTS 2012 DUSKY SHARK
Figure 1: Distribution of reported commercial catch of Dusky Shark in Australian waters, 2010
Main features and statistics for Dusky Shark fisheries in Australia in 2010
• Dusky Sharks are mostly taken commercially by demersal gillnets (Western Australia) and by most hook fishing methods, including set lines (New South Wales) and surface longlines (South Australia). They are also taken in smaller quantities by fish trawl fisheries. To minimise commercial catches of larger whaler sharks (in particular, Dusky Shark), longline hook sizes were restricted and metal snoods were prohibited in these fisheries in 2006. Most of the very limited recreational and charter fishing catches of Dusky Shark are taken by rod and reel with bait from boats or the shore.
• A range of input and output controls have been applied to Dusky Shark across the jurisdictions:
> Input controls include limited entry, total allowable effort limits, gear restrictions and spatial zonation.
> Output controls include total allowable catches, commercial size limits, and recreational size and bag limits.
• Four West Coast Demersal Gillnet and Demersal Longline Fishery (Western Australia) vessels and 22 Joint Authority Southern Demersal Gillnet and Demersal Longline Managed Fishery vessels reported Dusky Shark catch during 2009–10. A total of 112 licensees reported whaler shark catches in South Australia during 2009–10. In the Ocean Trap and Line Fishery (New South Wales), 29 businesses reported catching Dusky Shark in 2010. (Vessel numbers cannot be accurately presented in South Australia and New South Wales. Licence and business numbers give a more accurate indication of effort.)
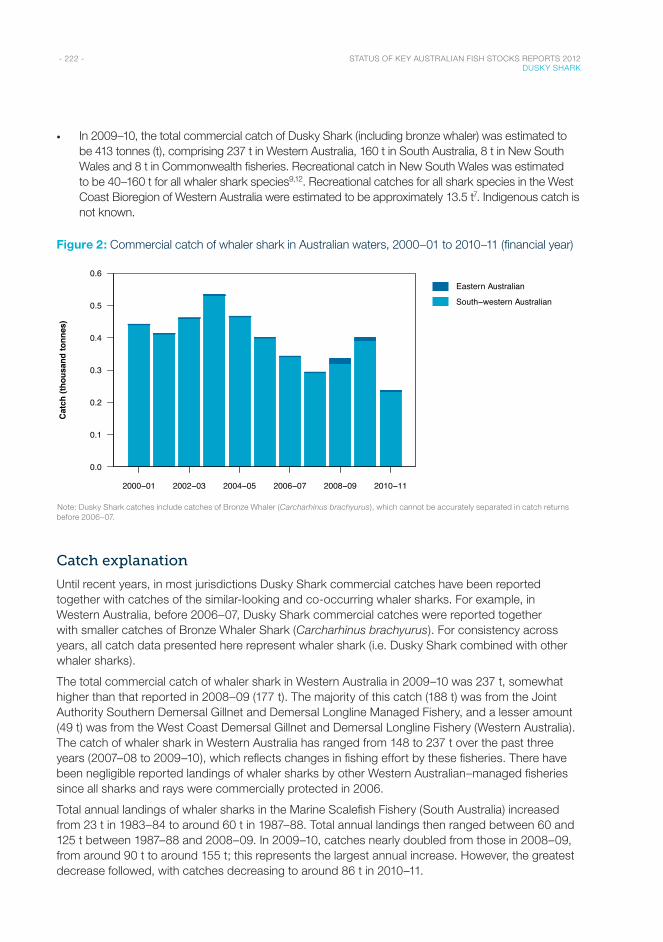
- 222 - STATUS OF KEY AUSTRALIAN FISH STOCKS REPORTS 2012 DUSKY SHARK
• In 2009–10, the total commercial catch of Dusky Shark (including bronze whaler) was estimated to be 413 tonnes (t), comprising 237 t in Western Australia, 160 t in South Australia, 8 t in New South Wales and 8 t in Commonwealth fisheries. Recreational catch in New South Wales was estimated to be 40–160 t for all whaler shark species9,12. Recreational catches for all shark species in the West Coast Bioregion of Western Australia were estimated to be approximately 13.5 t7. Indigenous catch is not known.
Figure 2: Commercial catch of whaler shark in Australian waters, 2000–01 to 2010–11 (financial year)
Financial Year
2000−01 2002−03 2004−05 2006−07 2008−09 2010−11
0.0
0.1
0.2
0.3
0.4
0.5
0.6Eastern Australian
South−western Australian
Cat
ch (t
hous
and
tonn
es)
Note: Dusky Shark catches include catches of Bronze Whaler (Carcharhinus brachyurus), which cannot be accurately separated in catch returns before 2006–07.
Catch explanation
Until recent years, in most jurisdictions Dusky Shark commercial catches have been reported together with catches of the similar-looking and co-occurring whaler sharks. For example, in Western Australia, before 2006–07, Dusky Shark commercial catches were reported together with smaller catches of Bronze Whaler Shark (Carcharhinus brachyurus). For consistency across years, all catch data presented here represent whaler shark (i.e. Dusky Shark combined with other whaler sharks).
The total commercial catch of whaler shark in Western Australia in 2009–10 was 237 t, somewhat higher than that reported in 2008–09 (177 t). The majority of this catch (188 t) was from the Joint Authority Southern Demersal Gillnet and Demersal Longline Managed Fishery, and a lesser amount (49 t) was from the West Coast Demersal Gillnet and Demersal Longline Fishery (Western Australia). The catch of whaler shark in Western Australia has ranged from 148 to 237 t over the past three years (2007–08 to 2009–10), which reflects changes in fishing effort by these fisheries. There have been negligible reported landings of whaler sharks by other Western Australian–managed fisheries since all sharks and rays were commercially protected in 2006.
Total annual landings of whaler sharks in the Marine Scalefish Fishery (South Australia) increased from 23 t in 1983–84 to around 60 t in 1987–88. Total annual landings then ranged between 60 and 125 t between 1987–88 and 2008–09. In 2009–10, catches nearly doubled from those in 2008–09, from around 90 t to around 155 t; this represents the largest annual increase. However, the greatest decrease followed, with catches decreasing to around 86 t in 2010–11.
- 223 - STATUS OF KEY AUSTRALIAN FISH STOCKS REPORTS 2012 DUSKY SHARK
For the eastern Australian biological stock, the most significant commercial catches of Dusky Shark are in the Ocean Trap and Line Fishery (New South Wales) as a key non-target species9. Shark catch in New South Wales was not required to be reported at the species level until 1991 and, until July 2009, fishers were not required to report individual species catches from a suite of 52 shark species. Dusky Shark catches are unlikely to have exceeded 30 t per year; 2009–10 catch was reported as 7.9 t. Catch of Dusky Shark in the Eastern Tuna and Billfish Fishery (Commonwealth) in 2010 was 2.8 t. Catch in the Eastern Tuna and Billfish Fishery (Commonwealth) has ranged from around 0.5 t to around 6 t since 2000.
Effects of fishing on the marine environment
• A recent analysis of potential changes in the ecosystem structure of the south and west coasts of Western Australia13 found no evidence of any systematic change in species diversity richness or trophic level. This indicates that the Western Australian fisheries are not having a material impact on the food chain or trophic structure.
• The catch composition of demersal gillnets is highly targeted towards a small number of shark species; the majority of landings consist of only three targeted species of sharks3. Levels of bycatch are therefore relatively low.
• Demersal gillnets and longlines do not significantly impact on benthic habitats where the gear is set—this is usually away from reefs7.
• Demersal gillnets can potentially interact with seals and Australian Sea Lions14. Work is currently under way to understand the potential interaction rates.
Environmental effects on Dusky Shark
• Climate change and variability have the potential to impact on fish stocks in a range of ways, including influencing their geographic distribution (e.g. latitudinal shifts in distribution, changes in distribution patterns of prey species)15. However, it is unclear how climate change may affect risks to sustainability of Dusky Shark.
References1. Benavides, MT, Horn, RL, Feldheim, KA, Shivji, MS, Clarke, SC, Wintner, S, Natanson, L, Braccini, M, Boomer, JJ,
Gulak, SJB & Chapman, DD 2011, Global phylogeography of the dusky shark Carcharhinus obscurus: implications for fisheries management and monitoring the shark fin trade, Endangered Species Research, 14: 13–22.
2. Jones, K 2008, Review of the fishery status for whaler sharks (Carcharhinus spp.) in South Australian and adjacent waters, FRDC project 2004/067, SARDI publication F2007/000721-1, South Australian Research and Development Institute (Aquatic Sciences), Adelaide.
3. McAuley, R & Simpfendorfer, C 2003, Catch composition of the Western Australian temperate demersal gillnet and demersal longline fisheries, 1994–1999, Fisheries Research Report 146, Western Australian Department of Fisheries, Perth.
4. McAuley, R, Lenanton, R, Chidlow, J, Allison, R & Heist, E 2005, Biology and stock assessment of the thickskin (sandbar) shark, Carcharhinus plumbeus, in Western Australia and further refinement of the dusky shark, Carcharhinus obscurus, stock assessment, final report, Fisheries Research and Development Corporation project 2000/134, Fisheries Research Report 151, Western Australian Department of Fisheries, Perth.
5. Simpfendorfer, CA 1999, Demographic analysis of the dusky shark fishery in southwestern Australia, in JA Musick (ed.), Life in the slow lane: ecology and conservation of long-lived marine animals, American Fisheries Society Symposium 23, American Fisheries Society, Bethesda, Maryland, 149–160.
6. Rogers, P, Huveneers, C, Goldsworthy, SD, Cheung, WWL, Jones, KG, Mitchell, JG & Seuront, L (in press), Ecology, movement patterns and vulnerability of two sympatric carcharhinids in gulf and shelf ecosystems off southern Australia, Marine and Freshwater Research.
- 224 - STATUS OF KEY AUSTRALIAN FISH STOCKS REPORTS 2012 DUSKY SHARK
7. McAuley, R & Sarginson, N 2011, Demersal gillnet and longline fisheries status report, in WJ Fletcher & K Santoro (eds) 2011, State of the fisheries and aquatic resources report 2010/11, Western Australian Department of Fisheries, Perth, 269–281.
8. Macbeth, WG, Geraghty, PT, Peddemors, VM & Gray, CA 2009, Observer-based study of targeted commercial fishing for large shark species in waters off northern New South Wales, Fisheries Final Report Series no. 114, Industry & Investment NSW, Cronulla.
9. Rowling, KA, Hegarty, A & Ives, M 2010, Status of fisheries resources in NSW 2008/09, Industry & Investment NSW, Cronulla.
10. Last, PR & Stevens, JD 1994, Sharks and rays of Australia, Australian Natural History, 24(11): 70.
11. Simpfendorfer, CA, McAuley, R, Chidlow, J & Unsworth, P 2002, Validated age and growth of the dusky shark, Carcharhinus obscurus, from Western Australian Waters, Marine and Freshwater Research, 53: 567–573.
12. Henry, GW & Lyle, JM 2003, The national recreational and indigenous fishing survey, Fisheries Research and Development Corporation project 99/158, Australian Government Department of Agriculture, Fisheries and Forestry, Canberra, http://eprints.utas.edu.au/2526/1/Henry_Lyle_Nationalsurvey.pdf.
13. Hall, NG & Wise, BW 2010, Development of an ecosystem approach to the monitoring and management of Western Australian fisheries, Fisheries Research Report 215, Western Australian Department of Fisheries, Perth.
14. Campbell, R 2011, Assessing and managing interactions of protected species and listed marine species with commercial fisheries in Western Australia, Fisheries Research Report 223, Western Australian Department of Fisheries, Perth.
15. Chin, A & Kyne, P 2007, Vulnerability of chondrichthyan fishes of the Great Barrier Reef to climate change, in JE Johnson & PA Marshall (eds), Climate change and the Great Barrier Reef: a vulnerability assessment, Great Barrier Reef Marine Park Authority & Australian Greenhouse Office, Australia, 394–425.
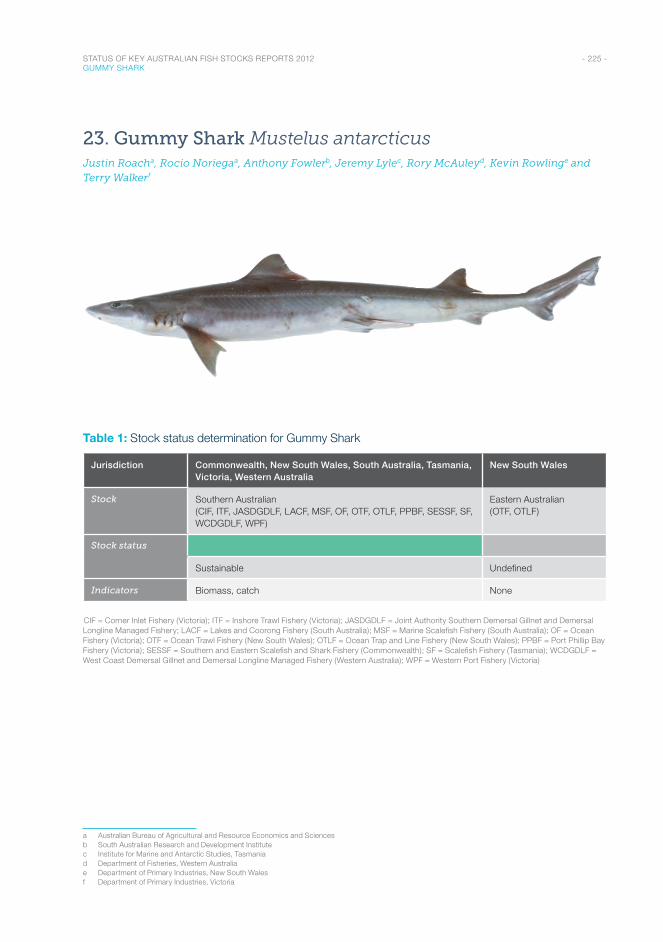
- 225 - STATUS OF KEY AUSTRALIAN FISH STOCKS REPORTS 2012 GUMMY SHARK
23. Gummy Shark Mustelus antarcticusJustin Roacha, Rocio Noriegaa, Anthony Fowlerb, Jeremy Lylec, Rory McAuleyd, Kevin Rowlinge and Terry Walkerf
Table 1: Stock status determination for Gummy Shark
Jurisdiction Commonwealth, New South Wales, South Australia, Tasmania, Victoria, Western Australia
New South Wales
Stock Southern Australian (CIF, ITF, JASDGDLF, LACF, MSF, OF, OTF, OTLF, PPBF, SESSF, SF, WCDGDLF, WPF)
Eastern Australian (OTF, OTLF)
Stock status
Sustainable Undefined
Indicators Biomass, catch None
CIF = Corner Inlet Fishery (Victoria); ITF = Inshore Trawl Fishery (Victoria); JASDGDLF = Joint Authority Southern Demersal Gillnet and Demersal Longline Managed Fishery; LACF = Lakes and Coorong Fishery (South Australia); MSF = Marine Scalefish Fishery (South Australia); OF = Ocean Fishery (Victoria); OTF = Ocean Trawl Fishery (New South Wales); OTLF = Ocean Trap and Line Fishery (New South Wales); PPBF = Port Phillip Bay Fishery (Victoria); SESSF = Southern and Eastern Scalefish and Shark Fishery (Commonwealth); SF = Scalefish Fishery (Tasmania); WCDGDLF = West Coast Demersal Gillnet and Demersal Longline Managed Fishery (Western Australia); WPF = Western Port Fishery (Victoria)
a Australian Bureau of Agricultural and Resource Economics and Sciencesb South Australian Research and Development Institutec Institute for Marine and Antarctic Studies, Tasmaniad Department of Fisheries, Western Australiae Department of Primary Industries, New South Walesf Department of Primary Industries, Victoria
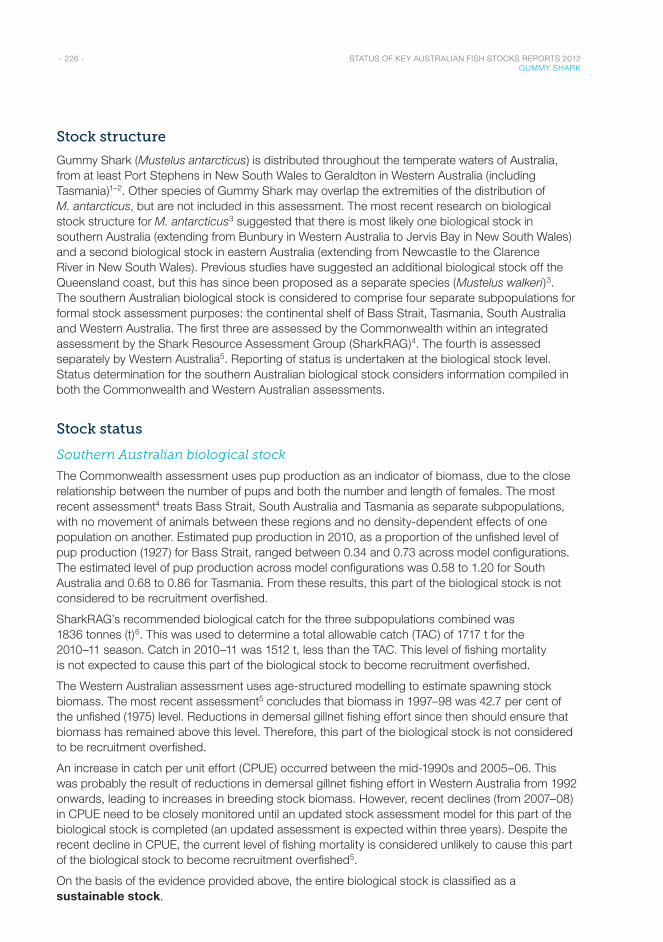
- 226 - STATUS OF KEY AUSTRALIAN FISH STOCKS REPORTS 2012 GUMMY SHARK
Stock structure
Gummy Shark (Mustelus antarcticus) is distributed throughout the temperate waters of Australia, from at least Port Stephens in New South Wales to Geraldton in Western Australia (including Tasmania)1–2. Other species of Gummy Shark may overlap the extremities of the distribution of M. antarcticus, but are not included in this assessment. The most recent research on biological stock structure for M. antarcticus3 suggested that there is most likely one biological stock in southern Australia (extending from Bunbury in Western Australia to Jervis Bay in New South Wales) and a second biological stock in eastern Australia (extending from Newcastle to the Clarence River in New South Wales). Previous studies have suggested an additional biological stock off the Queensland coast, but this has since been proposed as a separate species (Mustelus walkeri)3. The southern Australian biological stock is considered to comprise four separate subpopulations for formal stock assessment purposes: the continental shelf of Bass Strait, Tasmania, South Australia and Western Australia. The first three are assessed by the Commonwealth within an integrated assessment by the Shark Resource Assessment Group (SharkRAG)4. The fourth is assessed separately by Western Australia5. Reporting of status is undertaken at the biological stock level. Status determination for the southern Australian biological stock considers information compiled in both the Commonwealth and Western Australian assessments.
Stock status
Southern Australian biological stock
The Commonwealth assessment uses pup production as an indicator of biomass, due to the close relationship between the number of pups and both the number and length of females. The most recent assessment4 treats Bass Strait, South Australia and Tasmania as separate subpopulations, with no movement of animals between these regions and no density-dependent effects of one population on another. Estimated pup production in 2010, as a proportion of the unfished level of pup production (1927) for Bass Strait, ranged between 0.34 and 0.73 across model configurations. The estimated level of pup production across model configurations was 0.58 to 1.20 for South Australia and 0.68 to 0.86 for Tasmania. From these results, this part of the biological stock is not considered to be recruitment overfished.
SharkRAG’s recommended biological catch for the three subpopulations combined was 1836 tonnes (t)6. This was used to determine a total allowable catch (TAC) of 1717 t for the 2010–11 season. Catch in 2010–11 was 1512 t, less than the TAC. This level of fishing mortality is not expected to cause this part of the biological stock to become recruitment overfished.
The Western Australian assessment uses age-structured modelling to estimate spawning stock biomass. The most recent assessment5 concludes that biomass in 1997–98 was 42.7 per cent of the unfished (1975) level. Reductions in demersal gillnet fishing effort since then should ensure that biomass has remained above this level. Therefore, this part of the biological stock is not considered to be recruitment overfished.
An increase in catch per unit effort (CPUE) occurred between the mid-1990s and 2005–06. This was probably the result of reductions in demersal gillnet fishing effort in Western Australia from 1992 onwards, leading to increases in breeding stock biomass. However, recent declines (from 2007–08) in CPUE need to be closely monitored until an updated stock assessment model for this part of the biological stock is completed (an updated assessment is expected within three years). Despite the recent decline in CPUE, the current level of fishing mortality is considered unlikely to cause this part of the biological stock to become recruitment overfished5.
On the basis of the evidence provided above, the entire biological stock is classified as a sustainable stock.
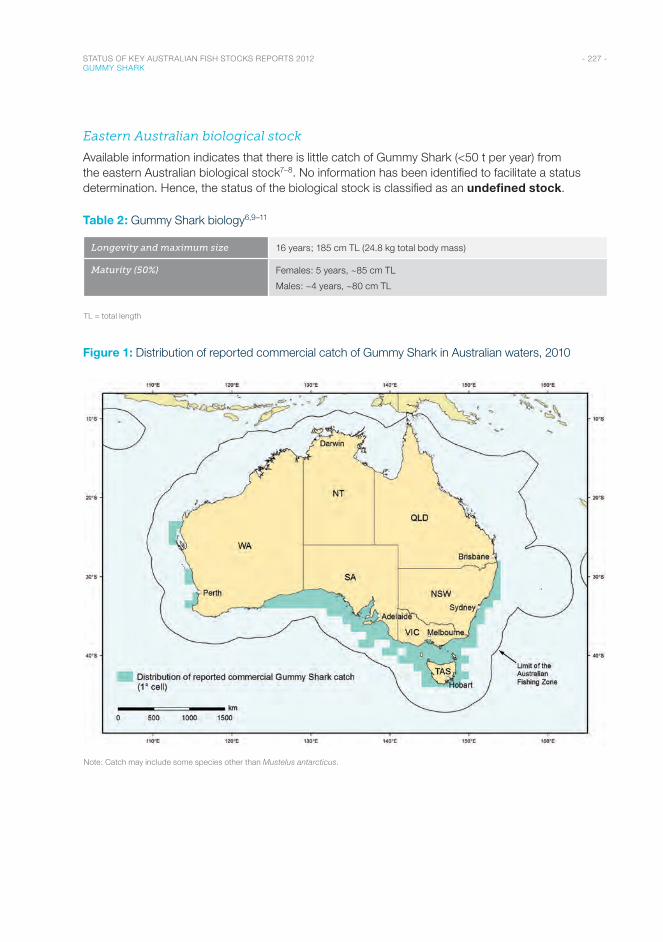
- 227 - STATUS OF KEY AUSTRALIAN FISH STOCKS REPORTS 2012 GUMMY SHARK
Eastern Australian biological stock
Available information indicates that there is little catch of Gummy Shark (<50 t per year) from the eastern Australian biological stock7–8. No information has been identified to facilitate a status determination. Hence, the status of the biological stock is classified as an undefined stock.
Table 2: Gummy Shark biology6,9–11
Longevity and maximum size 16 years; 185 cm TL (24.8 kg total body mass)
Maturity (50%) Females: 5 years, ~85 cm TL
Males: ~4 years, ~80 cm TL
TL = total length
Figure 1: Distribution of reported commercial catch of Gummy Shark in Australian waters, 2010
Note: Catch may include some species other than Mustelus antarcticus.
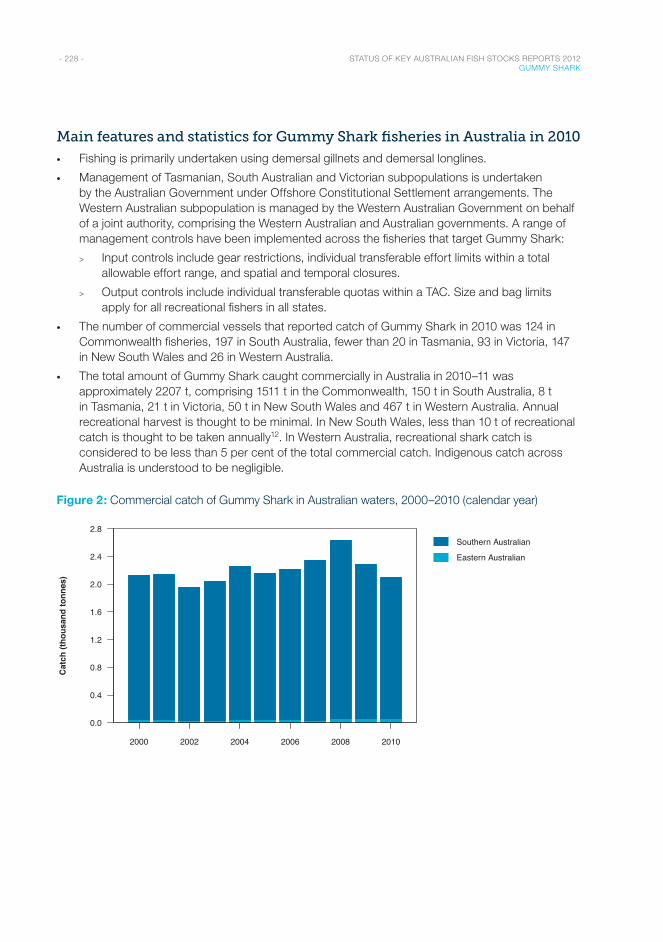
- 228 - STATUS OF KEY AUSTRALIAN FISH STOCKS REPORTS 2012 GUMMY SHARK
Main features and statistics for Gummy Shark fisheries in Australia in 2010
• Fishing is primarily undertaken using demersal gillnets and demersal longlines.
• Management of Tasmanian, South Australian and Victorian subpopulations is undertaken by the Australian Government under Offshore Constitutional Settlement arrangements. The Western Australian subpopulation is managed by the Western Australian Government on behalf of a joint authority, comprising the Western Australian and Australian governments. A range of management controls have been implemented across the fisheries that target Gummy Shark:
> Input controls include gear restrictions, individual transferable effort limits within a total allowable effort range, and spatial and temporal closures.
> Output controls include individual transferable quotas within a TAC. Size and bag limits apply for all recreational fishers in all states.
• The number of commercial vessels that reported catch of Gummy Shark in 2010 was 124 in Commonwealth fisheries, 197 in South Australia, fewer than 20 in Tasmania, 93 in Victoria, 147 in New South Wales and 26 in Western Australia.
• The total amount of Gummy Shark caught commercially in Australia in 2010–11 was approximately 2207 t, comprising 1511 t in the Commonwealth, 150 t in South Australia, 8 t in Tasmania, 21 t in Victoria, 50 t in New South Wales and 467 t in Western Australia. Annual recreational harvest is thought to be minimal. In New South Wales, less than 10 t of recreational catch is thought to be taken annually12. In Western Australia, recreational shark catch is considered to be less than 5 per cent of the total commercial catch. Indigenous catch across Australia is understood to be negligible.
Figure 2: Commercial catch of Gummy Shark in Australian waters, 2000–2010 (calendar year)
Year
2000 2002 2004 2006 2008 2010
0.0
0.4
0.8
1.2
1.6
2.0
2.4
2.8Southern Australian
Eastern Australian
Cat
ch (t
hous
and
tonn
es)
- 229 - STATUS OF KEY AUSTRALIAN FISH STOCKS REPORTS 2012 GUMMY SHARK
Catch explanation
In the early 1970s, the introduction of monofilament gillnets (which are more effective than hooks at catching Gummy Shark) and concerns over mercury content in other large shark species saw Gummy Shark become the most commonly commercially targeted shark species in southern Australia. Commonwealth catch peaked in 1992–93 at 2435 t. In 1997, an upper mesh size limit of 165 mm was introduced. Individual transferable quotas were introduced in 2001. Commonwealth commercial catch has remained relatively stable since this time.
In Western Australia, commercial catch has remained fairly constant for the past 10 years. However, in 2009, the Department of Fisheries Western Australia transitioned the fishery to a more explicit effort management system, with the objectives of removing excessive latent effort capacity and restricting effort within fisheries targeting Gummy Shark to 2001–02 levels.
Effects of fishing on the marine environment
• Interactions with marine mammals (Australian Sea Lions, Australian Fur Seals, New Zealand Fur Seals and dolphins) in some gillnet fisheries continue to be a major issue. Mitigation actions that have been implemented include spatial closures, increased monitoring and implementation of the Australian Sea Lion Management Strategy in the Southern and Eastern Scalefish and Shark Fishery13.
• Offal management strategies, introduced in April 2011, include requirements for gillnet operators to remove any biological materials from nets before they are set. This has been effective in reducing seabird interactions in other fisheries14.
• Dolphin interactions in the Commonwealth gillnet sector have recently been identified as an issue, based on the increased monitoring associated with Australian Sea Lions14. The Australian Fisheries Management Authority has closed the area where most interaction has occurred and increased observer coverage to 100 per cent in adjacent areas.
Environmental effects on Gummy Shark
• Sea level rise and changes in sea temperature associated with climate change are of potential concern to Gummy Shark biological stocks, since the habitats they use as nursery and feeding grounds are potentially prone to the effects of climate change15.
- 230 - STATUS OF KEY AUSTRALIAN FISH STOCKS REPORTS 2012 GUMMY SHARK
References1. Gardner, MG & Ward, RD 2002, Taxonomic affinities within Australian and New Zealand Mustelus sharks inferred from
allozymes, mitochondrial DNA and precaudal vertebrae counts, Copeia, 2002(2): 356–363.
2. Last, PR & Stevens, JD 2009, Sharks and rays of Australia, CSIRO Publishing, Collingwood.
3. White, WT & Last, PR 2008, Description of two new species of gummy sharks, genus Mustelus (Carcharhiniformes: Triakidae), from Australian waters, in PR Last, WT White & JJ Pogonoski (eds), Descriptions of new Australian chondrichthyans, CSIRO Marine and Atmospheric Research Paper 22, CSIRO Marine and Atmospheric Research, Canberra, 189–202.
4. Punt, AE & Thompson, R 2011, Gummy shark (Mustelus antarcticus) assessment based on data up to 2009, in GN Tuck (ed.), Stock assessment for the Southern and Eastern Scalefish and Shark Fishery: 2010, part 1, Australian Fisheries Management Authority & CSIRO Marine and Atmospheric Research, Hobart, 294–328.
5. McAuley, R & Sarginson, N 2011, Demersal gillnet and longline fisheries status report, in WJ Fletcher & K Santoro (eds), State of the fisheries and aquatic resources report 2010/11, Western Australian Department of Fisheries, Perth, 269–281.
6. Shark Resource Assessment Group 2010, 2009 stock assessment report for gummy shark (Mustelus antarcticus), prepared for the South East Management Advisory Committee, Australian Fisheries Management Authority, Canberra.
7. NSW Department of Primary Industries 2006, Fishery management strategy for the NSW Ocean Trap and Line Fishery, NSW Department of Primary Industries.
8. NSW Department of Primary Industries 2007, Fishery management strategy for the NSW Ocean Trawl Fishery, NSW Department of Primary Industries.
9. Moulton, PM, Walker, TI & Saddlier, SR 1992, Age and growth studies of gummy shark, Mustelus antarcticus (Günther), and school shark, Galeorhinus galeus (Linnaeus), from southern-Australian waters, Australian Journal of Marine and Freshwater Research, 43: 1241–1267.
10. Walker, TI 2007, Spatial and temporal variation in the reproductive biology of gummy shark Mustelus antarcticus (Chondrichthyes: Triakidae) harvested off southern Australia, Marine and Freshwater Research, 58: 67–97.
11. Walker, TI 2010, Population biology and dynamics of the gummy shark (Mustelus antarcticus) harvested off southern Australia, PhD thesis, University of Melbourne, Melbourne.
12. Steffe, S, Murphy, J, Chapman, D, Tarlington, BE, Gordon, GNG & Grinberg, A 1996, An assessment of the impact of offshore recreational fishing in New South Wales on the management of commercial fisheries, final report, Fisheries Research and Development Corporation project 94/053, FRDC, Sydney.
13. Australian Fisheries Management Authority 2010, Australian sea lion management strategy, Southern and Eastern Scalefish and Shark Fishery (SESSF), AFMA, Canberra.
14. Australian Fisheries Management Authority 2011, Fisheries Management (Southern and Eastern Scalefish and Shark Fishery management plan 2003) Temporary Order 2011, AFMA, Canberra.
15. Hobday, AJ, Poloczanska, ES & Matear, RJ 2007, Climate impacts on Australian fisheries and aquaculture: implications for the effects of climate change, report to the Department of Climate Change, Canberra.
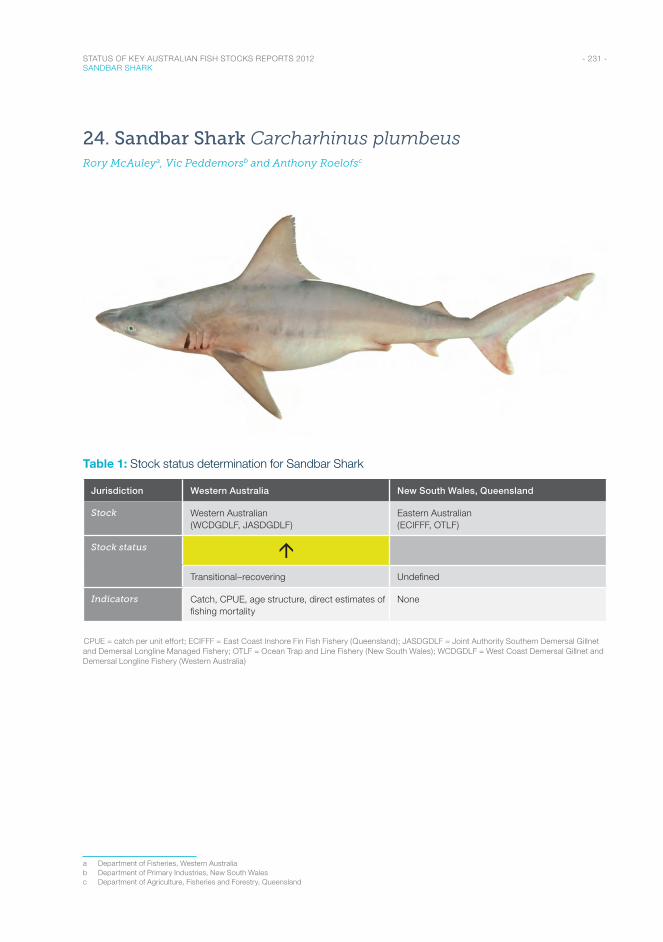
- 231 - STATUS OF KEY AUSTRALIAN FISH STOCKS REPORTS 2012 SANDBAR SHARK
24. Sandbar Shark Carcharhinus plumbeusRory McAuleya, Vic Peddemorsb and Anthony Roelofsc
Table 1: Stock status determination for Sandbar Shark
Jurisdiction Western Australia New South Wales, Queensland
Stock Western Australian (WCDGDLF, JASDGDLF)
Eastern Australian (ECIFFF, OTLF)
Stock status áTransitional–recovering Undefined
Indicators Catch, CPUE, age structure, direct estimates of fishing mortality
None
CPUE = catch per unit effort; ECIFFF = East Coast Inshore Fin Fish Fishery (Queensland); JASDGDLF = Joint Authority Southern Demersal Gillnet and Demersal Longline Managed Fishery; OTLF = Ocean Trap and Line Fishery (New South Wales); WCDGDLF = West Coast Demersal Gillnet and Demersal Longline Fishery (Western Australia)
a Department of Fisheries, Western Australiab Department of Primary Industries, New South Walesc Department of Agriculture, Fisheries and Forestry, Queensland
- 232 - STATUS OF KEY AUSTRALIAN FISH STOCKS REPORTS 2012 SANDBAR SHARK
Stock structure
Sandbar Shark occurs off the east and west coasts of Australia from approximately 17°S to 32°S off the east coast, and 13°S to 36°S off the west coast1. Due to the limited recorded catches in the Northern Territory and southern Australia, the species is considered to be represented by separate eastern and western biological stocks in Australian waters2. Status is reported at the biological stock level.
Stock status
Western Australian biological stock
Sandbar Sharks are targeted in Western Australia by the West Coast Demersal Gillnet and Demersal Longline Fishery and are also taken in the Joint Authority Southern Demersal Gillnet and Demersal Longline Managed Fishery. They were previously targeted by the Western Australian North Coast Shark Fishery and the Joint Authority Northern Shark Fishery. The Western Australian stock assessment uses current and historical data from all these fisheries.
Because of the longevity of Sandbar Shark and the age-specific nature of targeted fishing mortality, a sufficiently long time series of data on catch per unit effort (CPUE) is not yet available for dynamic stock assessment modelling. Therefore, assessment of this biological stock has been undertaken using empirically derived estimates of fishing mortality and demographic modelling techniques3–4.
The demographic model indicated that combined levels of fishing mortality in the targeted shark fisheries, non-target shark fisheries and recreational fishing sector became increasingly unsustainable between 2001 and 2004 (when catches peaked at 918 tonnes [t]), and possibly since 1997–985. This was supported by fishery-independent surveys that showed declines in CPUE between 2002 and 2005, which may be indicative of declining biomass5.
Expected reductions in recruitment caused by previously excessive catches are unlikely to be reflected in the CPUE data until cohorts born since 2004–05 enter the fishery at 6–9 years of age (i.e. over the coming three years). However, Sandbar Shark catches in 2008–09 (81 t) and 2009–10 (107 t) were within the levels deemed by the assessments to allow gradual recovery of the breeding stock5. Assessments also indicate that, in 2010, the spawning stock biomass is likely to be close to the minimum acceptable limit (40 per cent of the unfished biomass [B0])5. Current levels of fishing are considered suitably precautionary to ensure that the recovery of this biological stock is occurring.
On the basis of the evidence provided above, the biological stock is classified as a transitional–recovering stock.
Eastern Australian biological stock
In New South Wales, whaler sharks (Carcharhinus spp.), including Sandbar Shark have historically not been adequately identified and reported at the species level in commercial catch logbooks6. However, observer data indicates that Sandbar Shark is the dominant whaler shark species caught in the Ocean Trap and Line Fishery (New South Wales) (35 per cent of overall shark catch)7. The East Coast Inshore Fin Fish Fishery (Queensland) net and line fisheries contribute minimal quantities (<3 t per year) to the overall eastern Australian harvest of Sandbar Shark.
Insufficient information is available to determine the status for any of the whaler shark species in New South Wales, including Sandbar Shark8. Collaboration is currently under way with Fisheries Queensland to determine the stock structure of Sandbar Shark.
Insufficient information is available to confidently classify the status of this biological stock; therefore the biological stock is classified as an undefined stock.
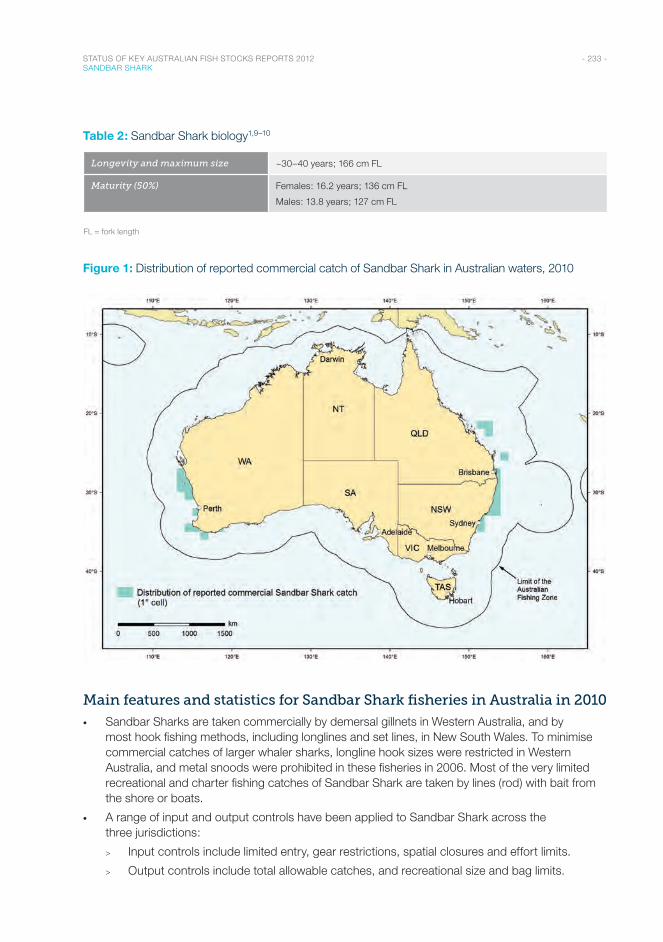
- 233 - STATUS OF KEY AUSTRALIAN FISH STOCKS REPORTS 2012 SANDBAR SHARK
Table 2: Sandbar Shark biology1,9–10
Longevity and maximum size ~30–40 years; 166 cm FL
Maturity (50%) Females: 16.2 years; 136 cm FL
Males: 13.8 years; 127 cm FL
FL = fork length
Figure 1: Distribution of reported commercial catch of Sandbar Shark in Australian waters, 2010
Main features and statistics for Sandbar Shark fisheries in Australia in 2010
• Sandbar Sharks are taken commercially by demersal gillnets in Western Australia, and by most hook fishing methods, including longlines and set lines, in New South Wales. To minimise commercial catches of larger whaler sharks, longline hook sizes were restricted in Western Australia, and metal snoods were prohibited in these fisheries in 2006. Most of the very limited recreational and charter fishing catches of Sandbar Shark are taken by lines (rod) with bait from the shore or boats.
• A range of input and output controls have been applied to Sandbar Shark across the three jurisdictions:
> Input controls include limited entry, gear restrictions, spatial closures and effort limits.
> Output controls include total allowable catches, and recreational size and bag limits.
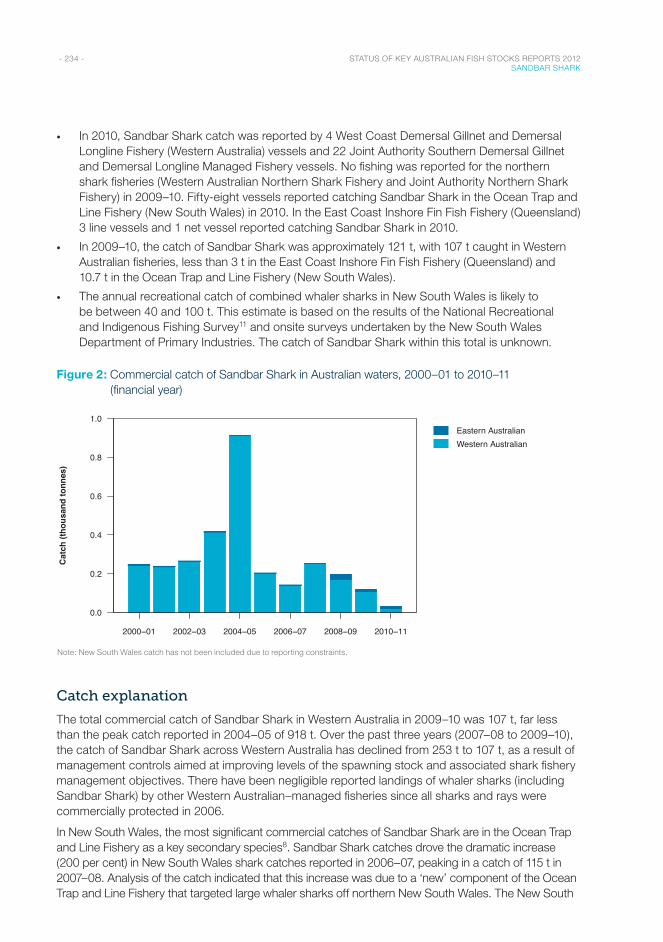
- 234 - STATUS OF KEY AUSTRALIAN FISH STOCKS REPORTS 2012 SANDBAR SHARK
• In 2010, Sandbar Shark catch was reported by 4 West Coast Demersal Gillnet and Demersal Longline Fishery (Western Australia) vessels and 22 Joint Authority Southern Demersal Gillnet and Demersal Longline Managed Fishery vessels. No fishing was reported for the northern shark fisheries (Western Australian Northern Shark Fishery and Joint Authority Northern Shark Fishery) in 2009–10. Fifty-eight vessels reported catching Sandbar Shark in the Ocean Trap and Line Fishery (New South Wales) in 2010. In the East Coast Inshore Fin Fish Fishery (Queensland) 3 line vessels and 1 net vessel reported catching Sandbar Shark in 2010.
• In 2009–10, the catch of Sandbar Shark was approximately 121 t, with 107 t caught in Western Australian fisheries, less than 3 t in the East Coast Inshore Fin Fish Fishery (Queensland) and 10.7 t in the Ocean Trap and Line Fishery (New South Wales).
• The annual recreational catch of combined whaler sharks in New South Wales is likely to be between 40 and 100 t. This estimate is based on the results of the National Recreational and Indigenous Fishing Survey11 and onsite surveys undertaken by the New South Wales Department of Primary Industries. The catch of Sandbar Shark within this total is unknown.
Figure 2: Commercial catch of Sandbar Shark in Australian waters, 2000–01 to 2010–11 (financial year)
Financial Year
2000−01 2002−03 2004−05 2006−07 2008−09 2010−11
0.0
0.2
0.4
0.6
0.8
1.0Eastern AustralianWestern Australian
Cat
ch (t
hous
and
tonn
es)
Note: New South Wales catch has not been included due to reporting constraints.
Catch explanation
The total commercial catch of Sandbar Shark in Western Australia in 2009–10 was 107 t, far less than the peak catch reported in 2004–05 of 918 t. Over the past three years (2007–08 to 2009–10), the catch of Sandbar Shark across Western Australia has declined from 253 t to 107 t, as a result of management controls aimed at improving levels of the spawning stock and associated shark fishery management objectives. There have been negligible reported landings of whaler sharks (including Sandbar Shark) by other Western Australian–managed fisheries since all sharks and rays were commercially protected in 2006.
In New South Wales, the most significant commercial catches of Sandbar Shark are in the Ocean Trap and Line Fishery as a key secondary species8. Sandbar Shark catches drove the dramatic increase (200 per cent) in New South Wales shark catches reported in 2006–07, peaking in a catch of 115 t in 2007–08. Analysis of the catch indicated that this increase was due to a ‘new’ component of the Ocean Trap and Line Fishery that targeted large whaler sharks off northern New South Wales. The New South
- 235 - STATUS OF KEY AUSTRALIAN FISH STOCKS REPORTS 2012 SANDBAR SHARK
Wales Department of Primary Industries therefore implemented specific conditions and restrictions on shark fishing (targeted or otherwise) in the Ocean Trap and Line Fishery during 2008–09 that included a total allowable commercial catch (TACC) for large shark (i.e. whaler, hammerhead and mackerel shark) species, maximum catch limits for individual TACC shark fishing trips, and a restricted permit for fishers specifically targeting Sandbar Sharks. The reported catch declined to 10.7 t in 2009–10.
Effects of fishing on the marine environment
• A recent analysis of potential changes in the ecosystem structure of the south and west coasts of Western Australia12 found no evidence of any systematic change in species diversity richness or trophic level, indicating that this fishery is not having a material impact on the food chain or trophic structure.
• The demersal gillnets and longlines used to catch Sandbar Shark do not significantly impact on benthic habitats where the gear is set—usually away from reefs to avoid damage to nets5. However, they do have the potential to interact with threatened and endangered species.
Environmental effects on Sandbar Sharks
• Climate change and climate variability have the potential to impact fish stocks in a range of ways, including influencing their geographic distribution (e.g. latitudinal shifts in distribution). However, it is unclear how climate change may affect risks to sustainability.
References1. McAuley, R, Lenanton, R, Chidlow, J, Allison, R & Heist, E 2005, Biology and stock assessment of the thickskin (sandbar)
shark, Carcharhinus plumbeus, in Western Australia and further refinement of the dusky shark, Carcharhinus obscurus, stock assessment, final report to the Fisheries Research and Development Corporation, project 2000/134, Fisheries Research Report 151, Western Australian Department of Fisheries, Perth.
2. Welch, DJ, Ovenden, J, Simpfendorfer, C, Tobin, A, Morgan, JAT, Street, R, White, J, Harry, A, Schroeder, R & Macbeth, WG 2011, Stock structure of exploited shark species in north-eastern Australia, report to the Fisheries Research and Development Corporation, project 2007/035, Fishing & Fisheries Research Centre Technical Report 12, James Cook University, Townsville.
3. McAuley, RB, Simpfendorfer, CA & Hall, NG 2007, A method for evaluating the impacts of fishing mortality and stochastic influences on the demography of two long-lived shark stocks, ICES Journal of Marine Science, 64: 1710–1722.
4. McAuley, RB, Simpfendorfer, CA & Wright, IW 2008, Gillnet mesh selectivity of the sandbar shark, Carcharhinus plumbeus: implications for fisheries management, ICES Journal of Marine Science, 64: 1702–1709.
5. McAuley, R & Sarginson, N 2011, Demersal gillnet and longline fisheries status report, in WJ Fletcher & K Santoro (eds), State of the fisheries and aquatic resources report 2010/11, Western Australian Department of Fisheries, Perth, 269–281.
6. Macbeth, WG, Vandenberg, M & Graham, KJ 2008, Identifying sharks and rays: a guide for NSW commercial fishers, NSW Department of Primary Industries, Sydney.
7. Macbeth, WG, Geraghty, PT, Peddemors, VM & Gray, CA 2009, Observer-based study of targeted commercial fishing for large shark species in waters off northern New South Wales, Fisheries Final Report Series no. 114, Industry & Investment NSW, Cronulla.
8. Rowling, KA, Hegarty, A & Ives, M 2010, Status of fisheries resources in NSW 2008/09, Industry & Investment NSW, Cronulla.
9. McAuley, RB, Simpfendorfer, CA, Hyndes, GA, Allison, RR, Chidlow, JA, Newman, SJ & Lenanton, RCJ 2006, Validated age and growth of the sandbar shark, Carcharhinus plumbeus (Nardo, 1827) in the waters off Western Australia, Environmental Biology of Fishes, 77: 385–400.
10. McAuley, RB, Simpfendorfer, CA, Hyndes, GA & Lenanton, RCJ 2007, Distribution and reproductive biology of the sandbar shark, Carcharhinus plumbeus, (Nardo, 1827) in Western Australian waters, Marine and Freshwater Research, 58: 116–126.
11. Henry, GW & Lyle, JM 2003, The national recreational and indigenous fishing survey, Fisheries Research and Development Corporation project 99/158, Australian Government Department of Agriculture, Fisheries and Forestry, Canberra, http://eprints.utas.edu.au/2526/1/Henry_Lyle_Nationalsurvey.pdf.
12. Hall, NG & Wise, BW 2010, Development of an ecosystem approach to the monitoring and management of Western Australian fisheries, Fisheries Research Report 215, Western Australian Fisheries and Marine Research Laboratories, North Beach.
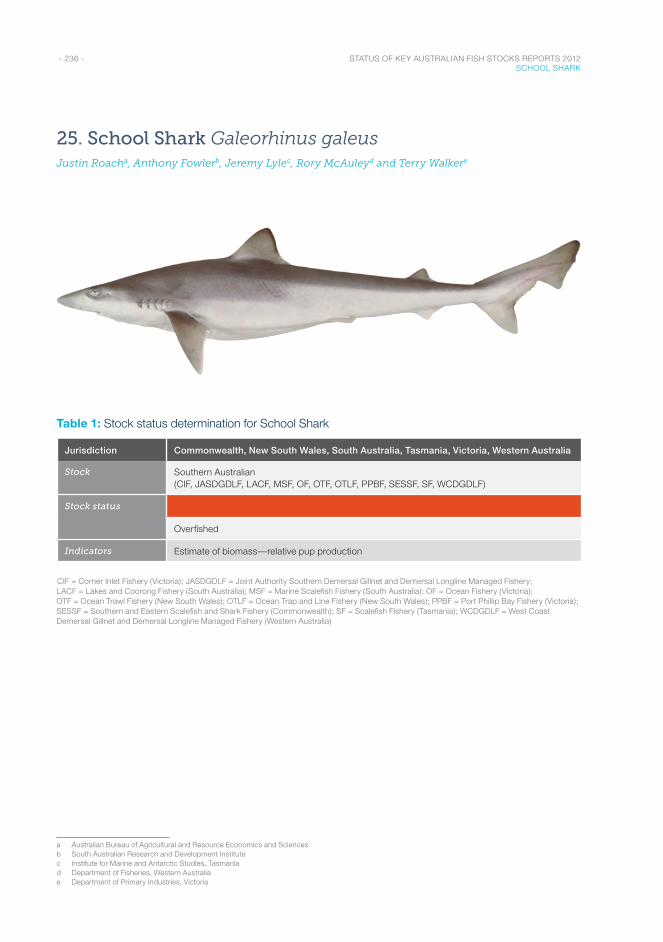
- 236 - STATUS OF KEY AUSTRALIAN FISH STOCKS REPORTS 2012 SCHOOL SHARK
25. School Shark Galeorhinus galeusJustin Roacha, Anthony Fowlerb, Jeremy Lylec, Rory McAuleyd and Terry Walkere
Table 1: Stock status determination for School Shark
Jurisdiction Commonwealth, New South Wales, South Australia, Tasmania, Victoria, Western Australia
Stock Southern Australian (CIF, JASDGDLF, LACF, MSF, OF, OTF, OTLF, PPBF, SESSF, SF, WCDGDLF)
Stock status
Overfished
Indicators Estimate of biomass—relative pup production
CIF = Corner Inlet Fishery (Victoria); JASDGDLF = Joint Authority Southern Demersal Gillnet and Demersal Longline Managed Fishery; LACF = Lakes and Coorong Fishery (South Australia); MSF = Marine Scalefish Fishery (South Australia); OF = Ocean Fishery (Victoria); OTF = Ocean Trawl Fishery (New South Wales); OTLF = Ocean Trap and Line Fishery (New South Wales); PPBF = Port Phillip Bay Fishery (Victoria); SESSF = Southern and Eastern Scalefish and Shark Fishery (Commonwealth); SF = Scalefish Fishery (Tasmania); WCDGDLF = West Coast Demersal Gillnet and Demersal Longline Managed Fishery (Western Australia)
a Australian Bureau of Agricultural and Resource Economics and Sciencesb South Australian Research and Development Institutec Institute for Marine and Antarctic Studies, Tasmaniad Department of Fisheries, Western Australiae Department of Primary Industries, Victoria
- 237 - STATUS OF KEY AUSTRALIAN FISH STOCKS REPORTS 2012 SCHOOL SHARK
Stock structure
School Shark has a broad distribution throughout temperate waters of the eastern North Atlantic, western South Atlantic, north-eastern and south-eastern Pacific, off South Africa, New Zealand and southern Australia. A single genetic stock exists in Australian waters, and a spatially structured fishery assessment model is applied to this biological stock1.
Stock status
Southern Australian biological stock
Assessments since 1991 have consistently estimated that the School Shark biological stock is less than 20 per cent of the unfished biomass. The most recent integrated stock assessment was published in 20092. Some uncertainty remains regarding the accuracy of the model estimates of productivity, but current estimates of very low intrinsic productivity (2 per cent)2 result in slow recovery projections. There is also concern regarding the use of commercial catch per unit effort (CPUE) as an index of abundance: total allowable catch reductions since 2002 may have resulted in most fishers avoiding School Shark, causing CPUE to be an unreliable index of abundance.
The most recent assessment estimates that biomass in 2009 was 8–17 per cent of the unfished (1927) level. This range is below the Commonwealth Fisheries Harvest Strategy Policy3 proxy limit reference point (20 per cent of the unfished level). Most stock assessment sensitivity analyses suggest that the adult biomass has stabilised and may even be recovering at present commercial catch levels, but some indicate that it is still in decline. Because of insufficient monitoring data, it is not possible to determine at this stage whether rebuilding has commenced. The biological stock is considered to be recruitment overfished.
This biological stock is subject to a recovery strategy, adopted in 2008, that requires the biological stock to be rebuilt to 20 per cent of the unfished level within 32 years (one mean generation time plus 10 years). Acknowledging that the low intrinsic productivity estimate for School Shark is uncertain, the assessment indicates that an annual commercial catch of 26 tonnes (t) or less per year would be required to return the biological stock to 20 per cent of unfished levels within 32 years. The most recent stock assessment report1 indicates that the current level of fishing mortality is expected to prevent the biological stock from recovering from its recruitment overfished state within the timeframe specified by the recovery strategy.
On the basis of the evidence provided above, the biological stock is classified as an overfished stock.
Table 2: School Shark biology4–7
Longevity and maximum size 50 years; ~175 cm TL, 32.5 kg
Maturity (50%) 12–16 years; mean length at female maturity and pupping are 124 and 142 cm, respectively
TL = total length
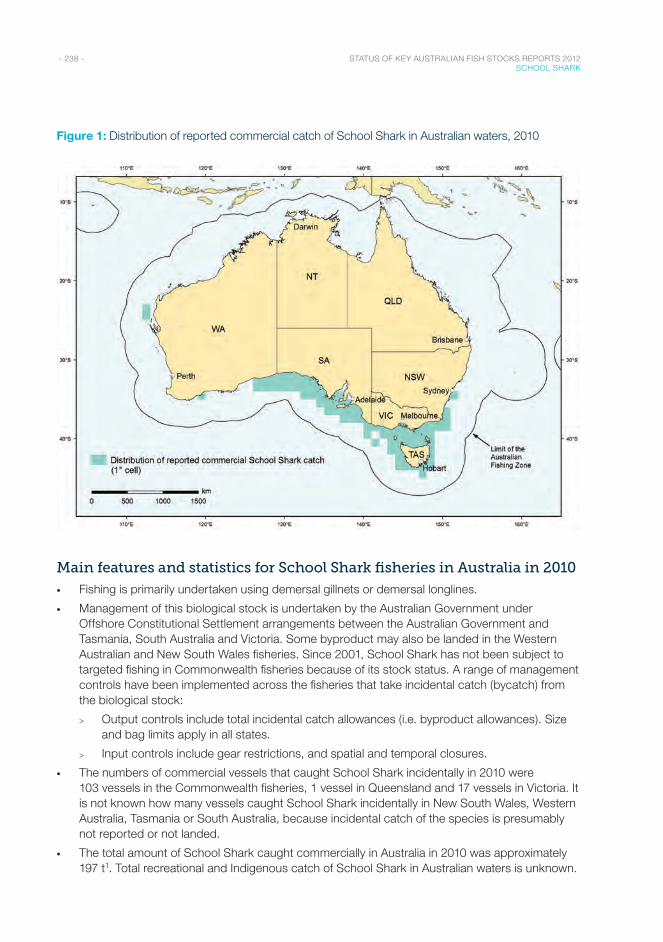
- 238 - STATUS OF KEY AUSTRALIAN FISH STOCKS REPORTS 2012 SCHOOL SHARK
Figure 1: Distribution of reported commercial catch of School Shark in Australian waters, 2010
Main features and statistics for School Shark fisheries in Australia in 2010
• Fishing is primarily undertaken using demersal gillnets or demersal longlines.
• Management of this biological stock is undertaken by the Australian Government under Offshore Constitutional Settlement arrangements between the Australian Government and Tasmania, South Australia and Victoria. Some byproduct may also be landed in the Western Australian and New South Wales fisheries. Since 2001, School Shark has not been subject to targeted fishing in Commonwealth fisheries because of its stock status. A range of management controls have been implemented across the fisheries that take incidental catch (bycatch) from the biological stock:
> Output controls include total incidental catch allowances (i.e. byproduct allowances). Size and bag limits apply in all states.
> Input controls include gear restrictions, and spatial and temporal closures.
• The numbers of commercial vessels that caught School Shark incidentally in 2010 were 103 vessels in the Commonwealth fisheries, 1 vessel in Queensland and 17 vessels in Victoria. It is not known how many vessels caught School Shark incidentally in New South Wales, Western Australia, Tasmania or South Australia, because incidental catch of the species is presumably not reported or not landed.
• The total amount of School Shark caught commercially in Australia in 2010 was approximately 197 t1. Total recreational and Indigenous catch of School Shark in Australian waters is unknown.
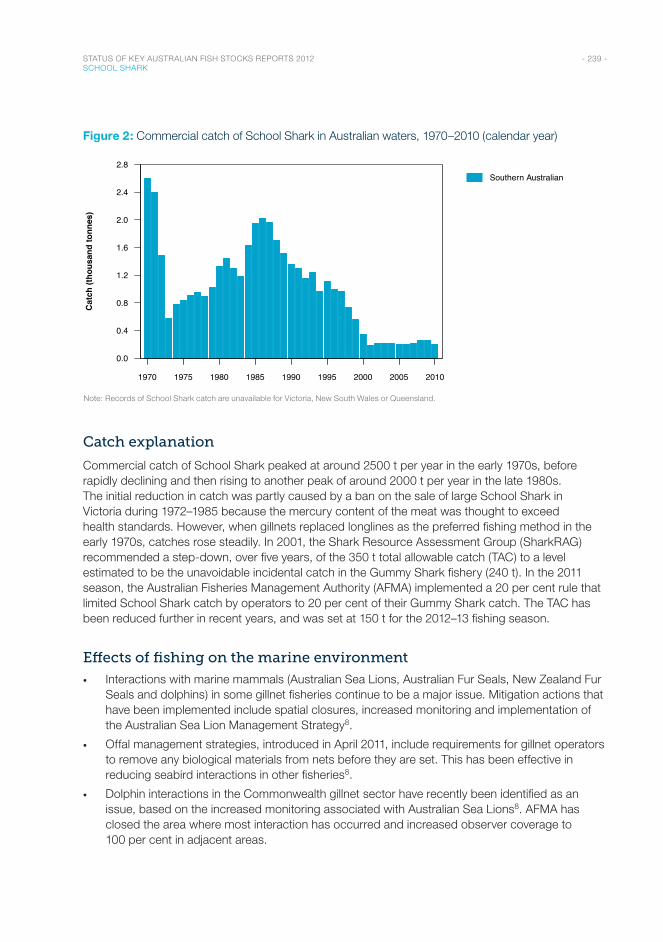
- 239 - STATUS OF KEY AUSTRALIAN FISH STOCKS REPORTS 2012 SCHOOL SHARK
Figure 2: Commercial catch of School Shark in Australian waters, 1970–2010 (calendar year)
Year
1970 1975 1980 1985 1990 1995 2000 2005 2010
0.0
0.4
0.8
1.2
1.6
2.0
2.4
2.8Southern Australian
Cat
ch (t
hous
and
tonn
es)
Note: Records of School Shark catch are unavailable for Victoria, New South Wales or Queensland.
Catch explanation
Commercial catch of School Shark peaked at around 2500 t per year in the early 1970s, before rapidly declining and then rising to another peak of around 2000 t per year in the late 1980s. The initial reduction in catch was partly caused by a ban on the sale of large School Shark in Victoria during 1972–1985 because the mercury content of the meat was thought to exceed health standards. However, when gillnets replaced longlines as the preferred fishing method in the early 1970s, catches rose steadily. In 2001, the Shark Resource Assessment Group (SharkRAG) recommended a step-down, over five years, of the 350 t total allowable catch (TAC) to a level estimated to be the unavoidable incidental catch in the Gummy Shark fishery (240 t). In the 2011 season, the Australian Fisheries Management Authority (AFMA) implemented a 20 per cent rule that limited School Shark catch by operators to 20 per cent of their Gummy Shark catch. The TAC has been reduced further in recent years, and was set at 150 t for the 2012–13 fishing season.
Effects of fishing on the marine environment
• Interactions with marine mammals (Australian Sea Lions, Australian Fur Seals, New Zealand Fur Seals and dolphins) in some gillnet fisheries continue to be a major issue. Mitigation actions that have been implemented include spatial closures, increased monitoring and implementation of the Australian Sea Lion Management Strategy8.
• Offal management strategies, introduced in April 2011, include requirements for gillnet operators to remove any biological materials from nets before they are set. This has been effective in reducing seabird interactions in other fisheries8.
• Dolphin interactions in the Commonwealth gillnet sector have recently been identified as an issue, based on the increased monitoring associated with Australian Sea Lions8. AFMA has closed the area where most interaction has occurred and increased observer coverage to 100 per cent in adjacent areas.
- 240 - STATUS OF KEY AUSTRALIAN FISH STOCKS REPORTS 2012 SCHOOL SHARK
Environmental effects on School Shark
• Sea level rise and changes in sea temperature associated with climate change are of potential concern to the School Shark biological stock, since the habitats they use as nursery and feeding grounds are potentially prone to the effects of climate change9.
References1. Shark Resource Assessment Group 2011, 2011 stock assessment report for school shark (Galeorhinus galeus), prepared
for the South East Management Advisory Committee, Australian Fisheries Management Authority, Canberra.
2. Shark Resource Assessment Group 2009, 2009 stock assessment report for school shark (Galeorhinus galeus), prepared for the South East Management Advisory Committee, Australian Fisheries Management Authority, Canberra.
3. Australian Government Department of Agriculture Fisheries and Forestry 2007, Commonwealth Fisheries Harvest Strategy Policy: policy and guidelines, DAFF, Canberra.
4. Last, PR & Stevens, JD 2009, Sharks and rays of Australia, CSIRO Publishing, Collingwood.
5. Moulton, PM, Walker, TI & Saddlier, SR 1992, Age and growth studies of gummy shark, Mustelus antarcticus (Günther), and school shark, Galeorhinus galeus (Linnaeus), from southern-Australian waters, Australian Journal of Marine and Freshwater Research, 43: 1241–1267.
6. Punt, AE & Walker, TI 1998, Stock assessment and risk analysis for the school shark (Galeorhinus galeus) off southern Australia, Marine and Freshwater Research, 49(7): 719–731.
7. Walker, TI 2005, Reproduction in fisheries science, in WC Hamlett (ed.), Reproductive biology and phylogeny of chondrichthyes: sharks, batoids and chimaeras, Science Publishers, Enfield, New Hampshire, 81–127.
8. Australian Fisheries Management Authority 2011, Fisheries Management (Southern and Eastern Scalefish and Shark Fishery management plan 2003) Temporary Order 2011, AFMA, Canberra.
9. Australian Government Department of Sustainability, Environment, Water, Population and Communities 2011, Species group report card–sharks. Supporting the draft marine bioregional plan for the South-west Marine Region, DSEWPaC , Canberra.

- 241 - STATUS OF KEY AUSTRALIAN FISH STOCKS REPORTS 2012 SCHOOL SHARK

Finfish
F I N F I S H A R E T H E T R U E F I S H E S : G I L L- B E A R I N G A Q U AT I C A N I M A L S , H A V I N G A B A C K B O N E A N D F I N S ,
F O U N D F R O M M O U N TA I N S T R E A M S T O T H E D E E P E S T O C E A N S .

FinfishAustralian Salmon / Barramundi / Blue Grenadier / Coral Trout
Australian Sardine / Sea Mullet / Spanish Mackerel
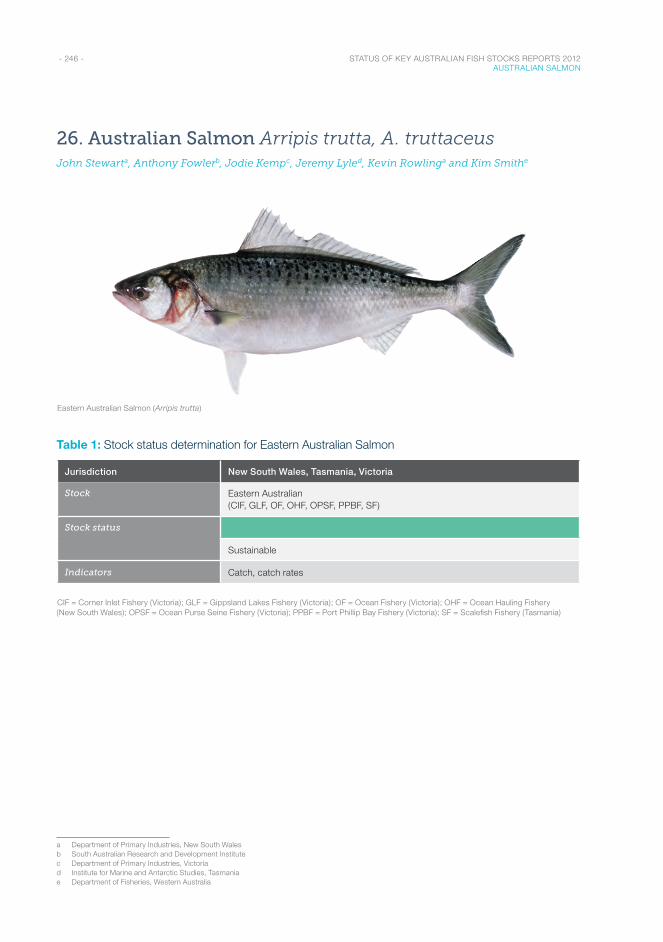
- 246 - STATUS OF KEY AUSTRALIAN FISH STOCKS REPORTS 2012 AUSTRALIAN SALMON
26. Australian Salmon Arripis trutta, A. truttaceusJohn Stewarta, Anthony Fowlerb, Jodie Kempc, Jeremy Lyled, Kevin Rowlinga and Kim Smithe
Eastern Australian Salmon (Arripis trutta)
Table 1: Stock status determination for Eastern Australian Salmon
Jurisdiction New South Wales, Tasmania, Victoria
Stock Eastern Australian (CIF, GLF, OF, OHF, OPSF, PPBF, SF)
Stock status
Sustainable
Indicators Catch, catch rates
CIF = Corner Inlet Fishery (Victoria); GLF = Gippsland Lakes Fishery (Victoria); OF = Ocean Fishery (Victoria); OHF = Ocean Hauling Fishery (New South Wales); OPSF = Ocean Purse Seine Fishery (Victoria); PPBF = Port Phillip Bay Fishery (Victoria); SF = Scalefish Fishery (Tasmania)
a Department of Primary Industries, New South Walesb South Australian Research and Development Institutec Department of Primary Industries, Victoriad Institute for Marine and Antarctic Studies, Tasmaniae Department of Fisheries, Western Australia
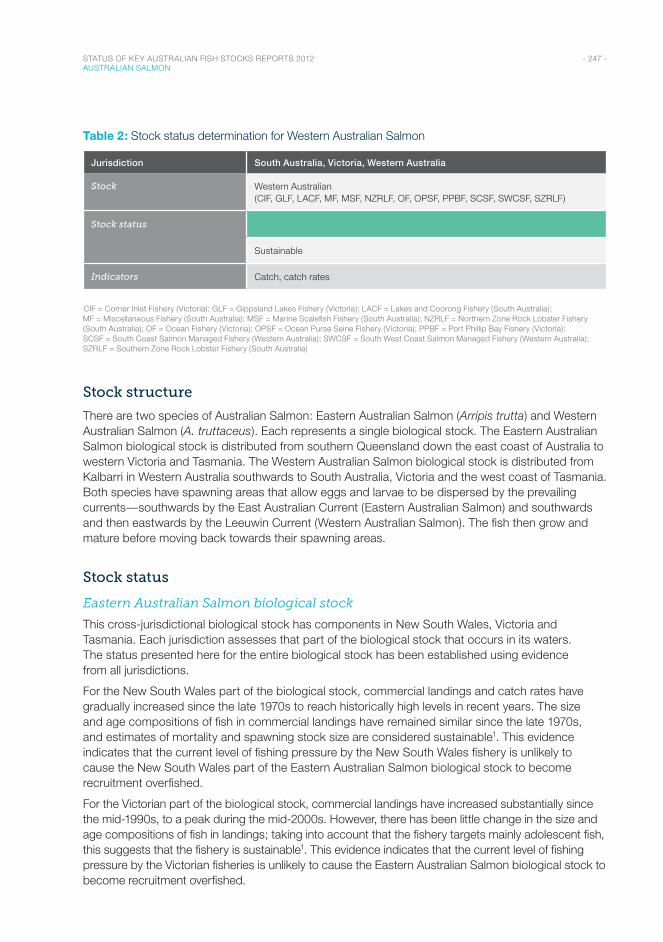
- 247 - STATUS OF KEY AUSTRALIAN FISH STOCKS REPORTS 2012 AUSTRALIAN SALMON
Table 2: Stock status determination for Western Australian Salmon
Jurisdiction South Australia, Victoria, Western Australia
Stock Western Australian (CIF, GLF, LACF, MF, MSF, NZRLF, OF, OPSF, PPBF, SCSF, SWCSF, SZRLF)
Stock status
Sustainable
Indicators Catch, catch rates
CIF = Corner Inlet Fishery (Victoria); GLF = Gippsland Lakes Fishery (Victoria); LACF = Lakes and Coorong Fishery (South Australia); MF = Miscellaneous Fishery (South Australia); MSF = Marine Scalefish Fishery (South Australia); NZRLF = Northern Zone Rock Lobster Fishery (South Australia); OF = Ocean Fishery (Victoria); OPSF = Ocean Purse Seine Fishery (Victoria); PPBF = Port Phillip Bay Fishery (Victoria); SCSF = South Coast Salmon Managed Fishery (Western Australia); SWCSF = South West Coast Salmon Managed Fishery (Western Australia); SZRLF = Southern Zone Rock Lobster Fishery (South Australia)
Stock structure
There are two species of Australian Salmon: Eastern Australian Salmon (Arripis trutta) and Western Australian Salmon (A. truttaceus). Each represents a single biological stock. The Eastern Australian Salmon biological stock is distributed from southern Queensland down the east coast of Australia to western Victoria and Tasmania. The Western Australian Salmon biological stock is distributed from Kalbarri in Western Australia southwards to South Australia, Victoria and the west coast of Tasmania. Both species have spawning areas that allow eggs and larvae to be dispersed by the prevailing currents—southwards by the East Australian Current (Eastern Australian Salmon) and southwards and then eastwards by the Leeuwin Current (Western Australian Salmon). The fish then grow and mature before moving back towards their spawning areas.
Stock status
Eastern Australian Salmon biological stock
This cross-jurisdictional biological stock has components in New South Wales, Victoria and Tasmania. Each jurisdiction assesses that part of the biological stock that occurs in its waters. The status presented here for the entire biological stock has been established using evidence from all jurisdictions.
For the New South Wales part of the biological stock, commercial landings and catch rates have gradually increased since the late 1970s to reach historically high levels in recent years. The size and age compositions of fish in commercial landings have remained similar since the late 1970s, and estimates of mortality and spawning stock size are considered sustainable1. This evidence indicates that the current level of fishing pressure by the New South Wales fishery is unlikely to cause the New South Wales part of the Eastern Australian Salmon biological stock to become recruitment overfished.
For the Victorian part of the biological stock, commercial landings have increased substantially since the mid-1990s, to a peak during the mid-2000s. However, there has been little change in the size and age compositions of fish in landings; taking into account that the fishery targets mainly adolescent fish, this suggests that the fishery is sustainable1. This evidence indicates that the current level of fishing pressure by the Victorian fisheries is unlikely to cause the Eastern Australian Salmon biological stock to become recruitment overfished.
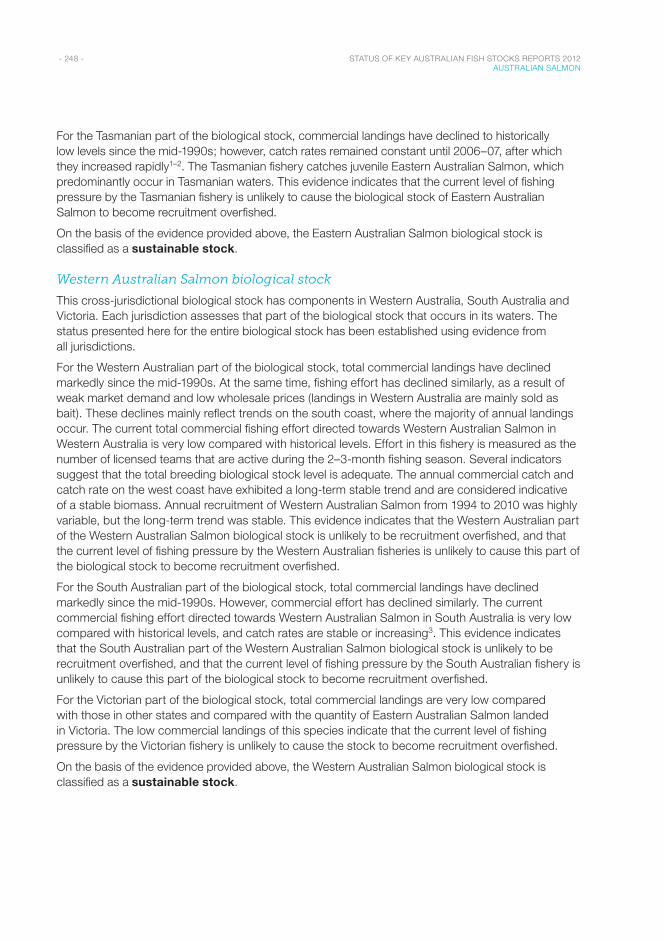
- 248 - STATUS OF KEY AUSTRALIAN FISH STOCKS REPORTS 2012 AUSTRALIAN SALMON
For the Tasmanian part of the biological stock, commercial landings have declined to historically low levels since the mid-1990s; however, catch rates remained constant until 2006–07, after which they increased rapidly1–2. The Tasmanian fishery catches juvenile Eastern Australian Salmon, which predominantly occur in Tasmanian waters. This evidence indicates that the current level of fishing pressure by the Tasmanian fishery is unlikely to cause the biological stock of Eastern Australian Salmon to become recruitment overfished.
On the basis of the evidence provided above, the Eastern Australian Salmon biological stock is classified as a sustainable stock.
Western Australian Salmon biological stock
This cross-jurisdictional biological stock has components in Western Australia, South Australia and Victoria. Each jurisdiction assesses that part of the biological stock that occurs in its waters. The status presented here for the entire biological stock has been established using evidence from all jurisdictions.
For the Western Australian part of the biological stock, total commercial landings have declined markedly since the mid-1990s. At the same time, fishing effort has declined similarly, as a result of weak market demand and low wholesale prices (landings in Western Australia are mainly sold as bait). These declines mainly reflect trends on the south coast, where the majority of annual landings occur. The current total commercial fishing effort directed towards Western Australian Salmon in Western Australia is very low compared with historical levels. Effort in this fishery is measured as the number of licensed teams that are active during the 2–3-month fishing season. Several indicators suggest that the total breeding biological stock level is adequate. The annual commercial catch and catch rate on the west coast have exhibited a long-term stable trend and are considered indicative of a stable biomass. Annual recruitment of Western Australian Salmon from 1994 to 2010 was highly variable, but the long-term trend was stable. This evidence indicates that the Western Australian part of the Western Australian Salmon biological stock is unlikely to be recruitment overfished, and that the current level of fishing pressure by the Western Australian fisheries is unlikely to cause this part of the biological stock to become recruitment overfished.
For the South Australian part of the biological stock, total commercial landings have declined markedly since the mid-1990s. However, commercial effort has declined similarly. The current commercial fishing effort directed towards Western Australian Salmon in South Australia is very low compared with historical levels, and catch rates are stable or increasing3. This evidence indicates that the South Australian part of the Western Australian Salmon biological stock is unlikely to be recruitment overfished, and that the current level of fishing pressure by the South Australian fishery is unlikely to cause this part of the biological stock to become recruitment overfished.
For the Victorian part of the biological stock, total commercial landings are very low compared with those in other states and compared with the quantity of Eastern Australian Salmon landed in Victoria. The low commercial landings of this species indicate that the current level of fishing pressure by the Victorian fishery is unlikely to cause the stock to become recruitment overfished.
On the basis of the evidence provided above, the Western Australian Salmon biological stock is classified as a sustainable stock.
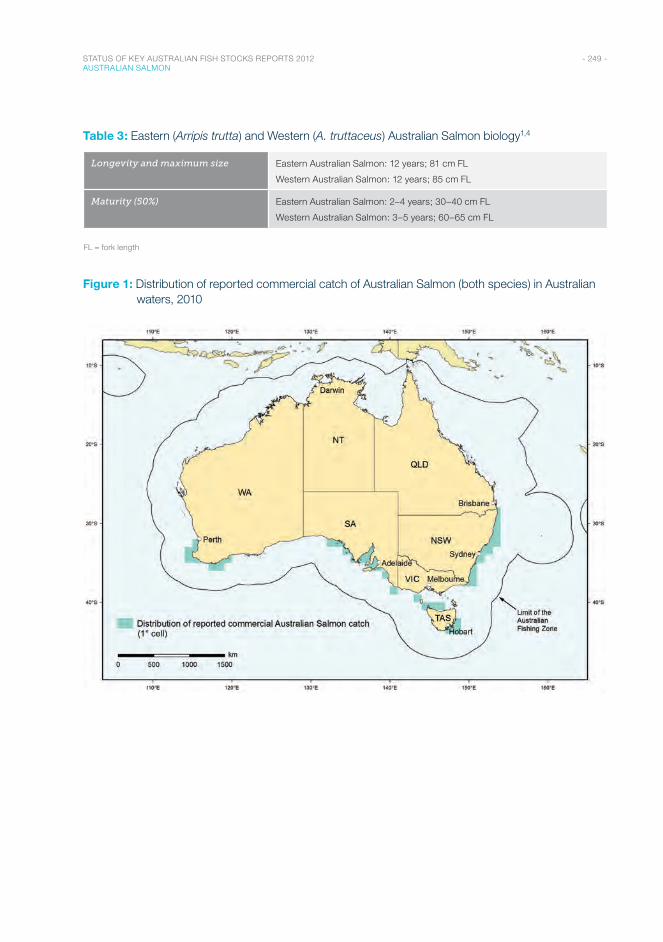
- 249 - STATUS OF KEY AUSTRALIAN FISH STOCKS REPORTS 2012 AUSTRALIAN SALMON
Table 3: Eastern (Arripis trutta) and Western (A. truttaceus) Australian Salmon biology1,4
Longevity and maximum size Eastern Australian Salmon: 12 years; 81 cm FL
Western Australian Salmon: 12 years; 85 cm FL
Maturity (50%) Eastern Australian Salmon: 2–4 years; 30–40 cm FL
Western Australian Salmon: 3–5 years; 60–65 cm FL
FL = fork length
Figure 1: Distribution of reported commercial catch of Australian Salmon (both species) in Australian waters, 2010
- 250 - STATUS OF KEY AUSTRALIAN FISH STOCKS REPORTS 2012 AUSTRALIAN SALMON
Main features and statistics for Australian Salmon fisheries in Australia in 2010
Eastern Australian Salmon
• Commercial catch of Eastern Australian Salmon is predominantly taken using purse-seine nets and beach haul nets. Recreational fishers typically use rod and reel with bait or artificial lures from boats, surf beaches and rocky headlands.
• A range of input and output controls are in place across jurisdictions:
> Input controls include limited entry and gear restrictions.
> Output controls include size limits and recreational bag limits. Tasmania applies a 435 t commercial catch trigger limit.
• In 2010, 155 fishers reported catching Eastern Australian Salmon in New South Wales. In Tasmania, 43 operators reported catching Eastern Australian Salmon, although the vast majority of these landings were reported by fewer than five operators.
• Total commercial catch of Eastern Australian Salmon across Australia in 2010–11 was 1487 t, comprising 312 t in Tasmania, 388 t in Victoria and 787 t in New South Wales. Recreational catch in New South Wales is estimated to be 150–210 t per year5. Recreational catch in Tasmania was estimated at 48 t in 2007–08, compared with 110 t in 2000–012. Indigenous catch is unknown.
Western Australian Salmon
• Commercial catch of Western Australian Salmon is predominantly taken using beach haul nets. Recreational fishers typically use rod and reel with bait or artificial lures from surf beaches and rocky headlands.
• A range of input and output controls are in place across jurisdictions:
> Input controls include limited entry, gear restrictions and area closures.
> Output controls include size limits and recreational bag limits.
• In 2010, there were 18 licensees in the South Coast Salmon Managed Fishery and 5 licensees in the South West Coast Salmon Managed Fishery. Not all fishers were active in 2010. No other fishers are licensed to harvest Western Australian Salmon commercially in Western Australia. The commercial catch of Western Australian Salmon in South Australia was taken by 76 vessels in 2010–11.
• Total commercial catch of Western Australian Salmon in 2010–11 was 351 t, comprising 172 t in Western Australia, 153 t in South Australia and 26 t in Victoria. The current recreational catch of Western Australian Salmon is unknown. The most recent estimate for Western Australia was made by the 2000–01 National Recreational and Indigenous Fishing Survey6, which estimated an annual catch of 136 t. The most recent estimate of the recreational catch in South Australia is 91.3 t7. Indigenous catch is unknown.
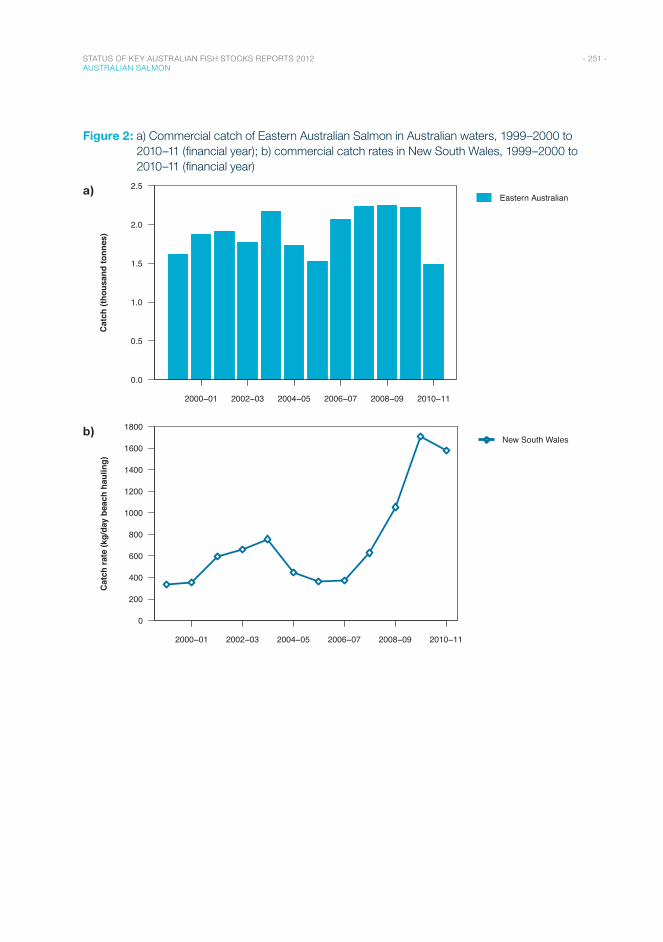
- 251 - STATUS OF KEY AUSTRALIAN FISH STOCKS REPORTS 2012 AUSTRALIAN SALMON
Figure 2: a) Commercial catch of Eastern Australian Salmon in Australian waters, 1999–2000 to 2010–11 (financial year); b) commercial catch rates in New South Wales, 1999–2000 to 2010–11 (financial year)
a)
Financial Year
2000−01 2002−03 2004−05 2006−07 2008−09 2010−11
0.0
0.5
1.0
1.5
2.0
2.5Eastern Australian
Cat
ch (t
hous
and
tonn
es)
b)
Financial Year
2000−01 2002−03 2004−05 2006−07 2008−09 2010−11
0
200
400
600
800
1000
1200
1400
1600
1800New South Wales
Cat
ch ra
te (k
g/da
y be
ach
haul
ing)
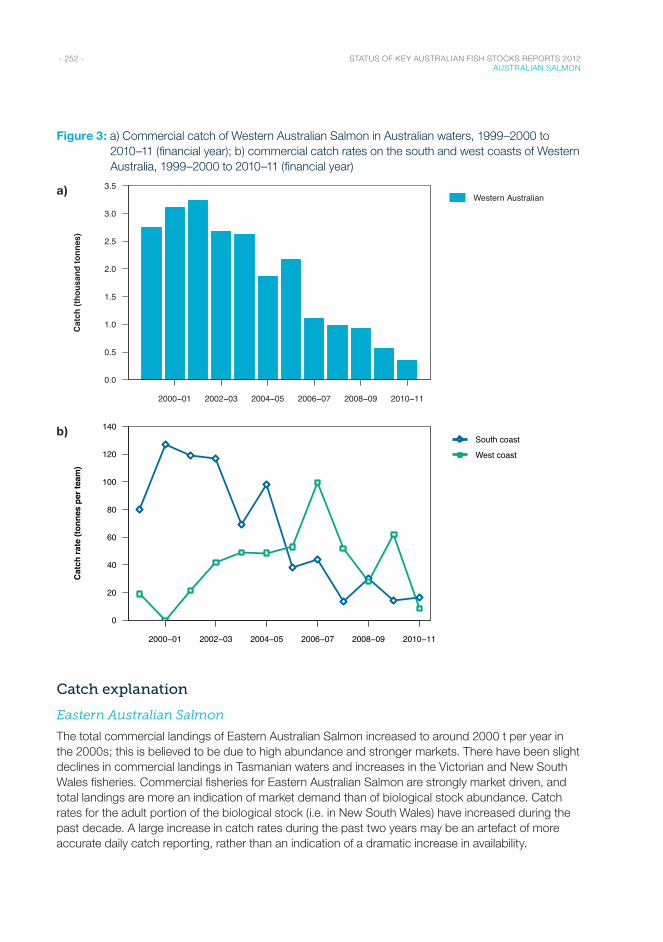
- 252 - STATUS OF KEY AUSTRALIAN FISH STOCKS REPORTS 2012 AUSTRALIAN SALMON
Figure 3: a) Commercial catch of Western Australian Salmon in Australian waters, 1999–2000 to 2010–11 (financial year); b) commercial catch rates on the south and west coasts of Western Australia, 1999–2000 to 2010–11 (financial year)
a)
Financial Year
2000−01 2002−03 2004−05 2006−07 2008−09 2010−11
0.0
0.5
1.0
1.5
2.0
2.5
3.0
3.5Western Australian
Cat
ch (t
hous
and
tonn
es)
b)
Financial Year
2000−01 2002−03 2004−05 2006−07 2008−09 2010−11
0
20
40
60
80
100
120
140South coast
West coast
Cat
ch ra
te (t
onne
s pe
r tea
m)
Catch explanation
Eastern Australian Salmon
The total commercial landings of Eastern Australian Salmon increased to around 2000 t per year in the 2000s; this is believed to be due to high abundance and stronger markets. There have been slight declines in commercial landings in Tasmanian waters and increases in the Victorian and New South Wales fisheries. Commercial fisheries for Eastern Australian Salmon are strongly market driven, and total landings are more an indication of market demand than of biological stock abundance. Catch rates for the adult portion of the biological stock (i.e. in New South Wales) have increased during the past decade. A large increase in catch rates during the past two years may be an artefact of more accurate daily catch reporting, rather than an indication of a dramatic increase in availability.
- 253 - STATUS OF KEY AUSTRALIAN FISH STOCKS REPORTS 2012 AUSTRALIAN SALMON
Western Australian Salmon
The total commercial landings of Western Australian Salmon have declined in Western Australia and South Australia. Total commercial landings in Western Australia have been declining since 1995, when a peak of 4046 t was reported. This trend reflects declining catches in the South Coast Bioregion of Western Australia8, where the annual catch steadily declined from a historical peak of 2728 t in 1995 to 291 t in 2010. This decline was largely caused by decreased fishing effort, which is attributed to weak market demand. In contrast, the catch trend in the West Coast Bioregion of Western Australia was non-directional over the long term, although annual landings have varied widely from less than 1 t (in 2000) to 1364 t (in 1968). West Coast Bioregion landings of 1316 t in 1995 and 1194 t in 2006 were close to the historical peak reached in 1968. A substantial decline in the South Australian commercial catch from 2003–04 onwards reflects a decline in fishing effort associated with area closures and some major operators leaving the fishery.
Effects of fishing on the marine environment
• The fishing methods used to target Australian Salmon are highly selective and targeted. As a result, there is little bycatch in these fisheries1.
Environmental effects on Eastern and Western Australian Salmon
• The life cycles of Eastern and Western Australian Salmon are strongly linked to the prevailing currents throughout their distributions. The East Australian, Leeuwin and Capes currents appear to influence the distribution of spawning, larval dispersal, the strength and distribution of juvenile recruitment, and the distribution of fishery landings. Environmentally driven changes to these currents may affect recruitment and the distribution and abundance of both species.
References1. Stewart, J, Hughes, JM, McAllister, J, Lyle, J & MacDonald, M 2011, Australian salmon (Arripis trutta): population
structure, reproduction, diet and composition of commercial and recreational catches, Fisheries Final Report Series no. 129, Industry & Investment NSW.
2. Hartmann, K & Lyle JM 2011, Tasmanian scalefish fishery 2009/10, Institute for Marine and Antarctic Studies, University of Tasmania, Hobart.
3. Fowler, AJ, McGarvey R, Steer, MA & Feenstra, JE 2011, The South Australian Marine Scalefish Fishery stock status report, report to PIRSA Fisheries and Aquaculture, South Australian Research and Development Institute (Aquatic Sciences), SARDI Publication F2007/000565-6, SARDI Research Report Series no. 586, SARDI, Adelaide.
4. Kailola, PM, Williams, MJ, Stewart, PC, Reichelt, RE, McNee, A & Grieve, C 1993, Australian fisheries resources, Bureau of Resource Sciences & the Fisheries Research and Development Corporation, Canberra.
5. Rowling, K, Hegarty A & Ives, M (eds.) 2010, Status of fisheries resources in NSW 2008/09, NSW Industry & Investment, Cronulla.
6. Henry, GW & Lyle, JM 2003, The national recreational and Indigenous fishing survey, Fisheries Research Development Corporation project 99/158, Australian Government Department of Agriculture, Fisheries and Forestry, Canberra, http://eprints.utas.edu.au/2526/1/Henry_Lyle_Nationalsurvey.pdf.
7. Jones, GK 2009, South Australian recreational fishing survey, South Australian Fisheries Management Series paper 54, PIRSA Fisheries, Adelaide.
8. Fletcher, WJ & Santoro, K (eds) 2011, State of the fisheries and aquatic resources report 2009/10, Western Australian Department of Fisheries, Perth.
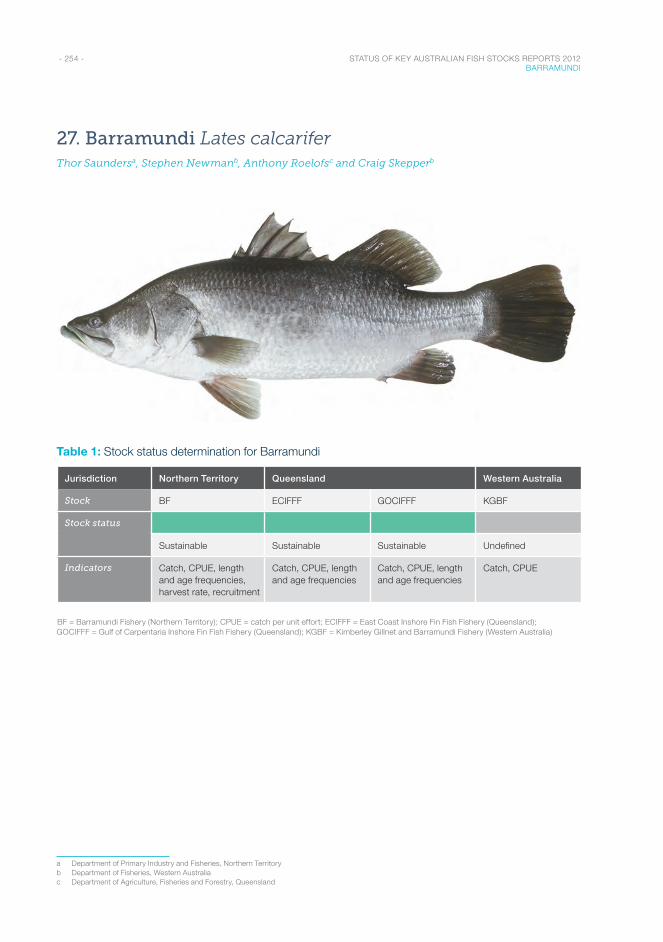
- 254 - STATUS OF KEY AUSTRALIAN FISH STOCKS REPORTS 2012 BARRAMUNDI
27. Barramundi Lates calcariferThor Saundersa, Stephen Newmanb, Anthony Roelofsc and Craig Skepperb
Table 1: Stock status determination for Barramundi
Jurisdiction Northern Territory Queensland Western Australia
Stock BF ECIFFF GOCIFFF KGBF
Stock status
Sustainable Sustainable Sustainable Undefined
Indicators Catch, CPUE, length and age frequencies, harvest rate, recruitment
Catch, CPUE, length and age frequencies
Catch, CPUE, length and age frequencies
Catch, CPUE
BF = Barramundi Fishery (Northern Territory); CPUE = catch per unit effort; ECIFFF = East Coast Inshore Fin Fish Fishery (Queensland); GOCIFFF = Gulf of Carpentaria Inshore Fin Fish Fishery (Queensland); KGBF = Kimberley Gillnet and Barramundi Fishery (Western Australia)
a Department of Primary Industry and Fisheries, Northern Territory b Department of Fisheries, Western Australiac Department of Agriculture, Fisheries and Forestry, Queensland
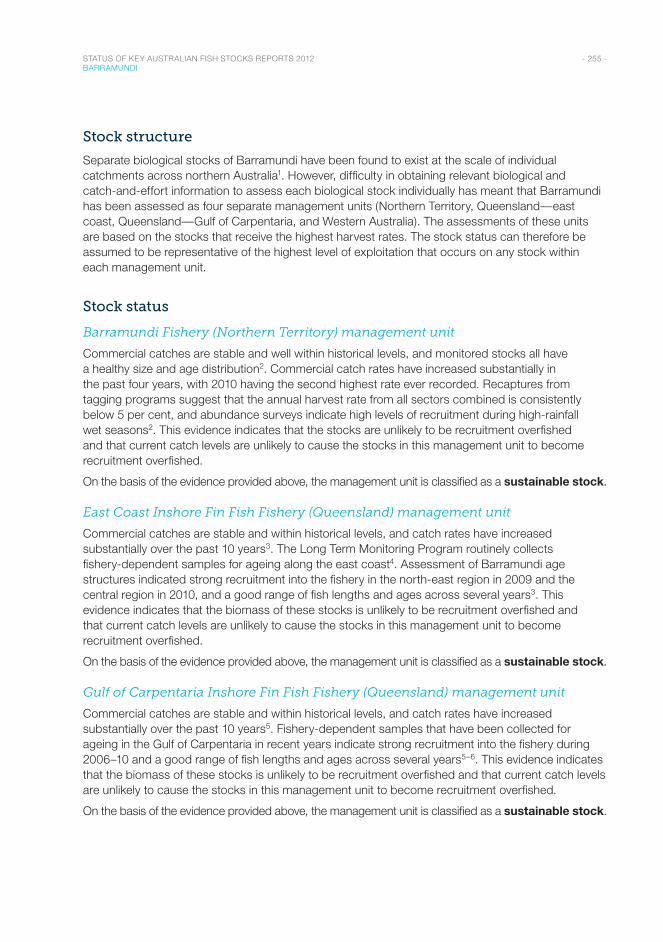
- 255 - STATUS OF KEY AUSTRALIAN FISH STOCKS REPORTS 2012 BARRAMUNDI
Stock structure
Separate biological stocks of Barramundi have been found to exist at the scale of individual catchments across northern Australia1. However, difficulty in obtaining relevant biological and catch-and-effort information to assess each biological stock individually has meant that Barramundi has been assessed as four separate management units (Northern Territory, Queensland—east coast, Queensland—Gulf of Carpentaria, and Western Australia). The assessments of these units are based on the stocks that receive the highest harvest rates. The stock status can therefore be assumed to be representative of the highest level of exploitation that occurs on any stock within each management unit.
Stock status
Barramundi Fishery (Northern Territory) management unit
Commercial catches are stable and well within historical levels, and monitored stocks all have a healthy size and age distribution2. Commercial catch rates have increased substantially in the past four years, with 2010 having the second highest rate ever recorded. Recaptures from tagging programs suggest that the annual harvest rate from all sectors combined is consistently below 5 per cent, and abundance surveys indicate high levels of recruitment during high-rainfall wet seasons2. This evidence indicates that the stocks are unlikely to be recruitment overfished and that current catch levels are unlikely to cause the stocks in this management unit to become recruitment overfished.
On the basis of the evidence provided above, the management unit is classified as a sustainable stock.
East Coast Inshore Fin Fish Fishery (Queensland) management unit
Commercial catches are stable and within historical levels, and catch rates have increased substantially over the past 10 years3. The Long Term Monitoring Program routinely collects fishery-dependent samples for ageing along the east coast4. Assessment of Barramundi age structures indicated strong recruitment into the fishery in the north-east region in 2009 and the central region in 2010, and a good range of fish lengths and ages across several years3. This evidence indicates that the biomass of these stocks is unlikely to be recruitment overfished and that current catch levels are unlikely to cause the stocks in this management unit to become recruitment overfished.
On the basis of the evidence provided above, the management unit is classified as a sustainable stock.
Gulf of Carpentaria Inshore Fin Fish Fishery (Queensland) management unit
Commercial catches are stable and within historical levels, and catch rates have increased substantially over the past 10 years5. Fishery-dependent samples that have been collected for ageing in the Gulf of Carpentaria in recent years indicate strong recruitment into the fishery during 2006–10 and a good range of fish lengths and ages across several years5–6. This evidence indicates that the biomass of these stocks is unlikely to be recruitment overfished and that current catch levels are unlikely to cause the stocks in this management unit to become recruitment overfished.
On the basis of the evidence provided above, the management unit is classified as a sustainable stock.
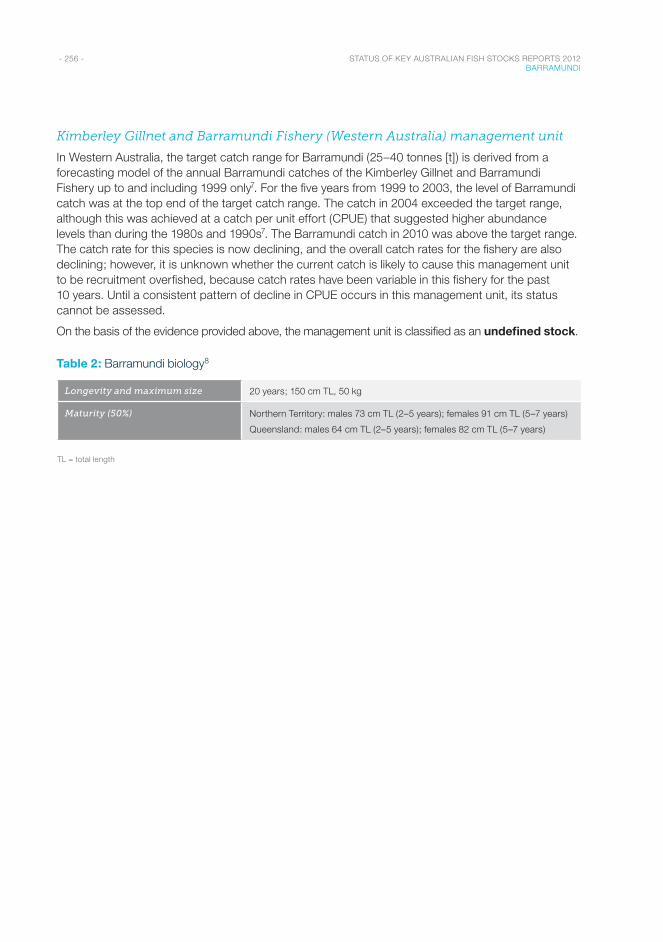
- 256 - STATUS OF KEY AUSTRALIAN FISH STOCKS REPORTS 2012 BARRAMUNDI
Kimberley Gillnet and Barramundi Fishery (Western Australia) management unit
In Western Australia, the target catch range for Barramundi (25–40 tonnes [t]) is derived from a forecasting model of the annual Barramundi catches of the Kimberley Gillnet and Barramundi Fishery up to and including 1999 only7. For the five years from 1999 to 2003, the level of Barramundi catch was at the top end of the target catch range. The catch in 2004 exceeded the target range, although this was achieved at a catch per unit effort (CPUE) that suggested higher abundance levels than during the 1980s and 1990s7. The Barramundi catch in 2010 was above the target range. The catch rate for this species is now declining, and the overall catch rates for the fishery are also declining; however, it is unknown whether the current catch is likely to cause this management unit to be recruitment overfished, because catch rates have been variable in this fishery for the past 10 years. Until a consistent pattern of decline in CPUE occurs in this management unit, its status cannot be assessed.
On the basis of the evidence provided above, the management unit is classified as an undefined stock.
Table 2: Barramundi biology8
Longevity and maximum size 20 years; 150 cm TL, 50 kg
Maturity (50%) Northern Territory: males 73 cm TL (2–5 years); females 91 cm TL (5–7 years)
Queensland: males 64 cm TL (2–5 years); females 82 cm TL (5–7 years)
TL = total length
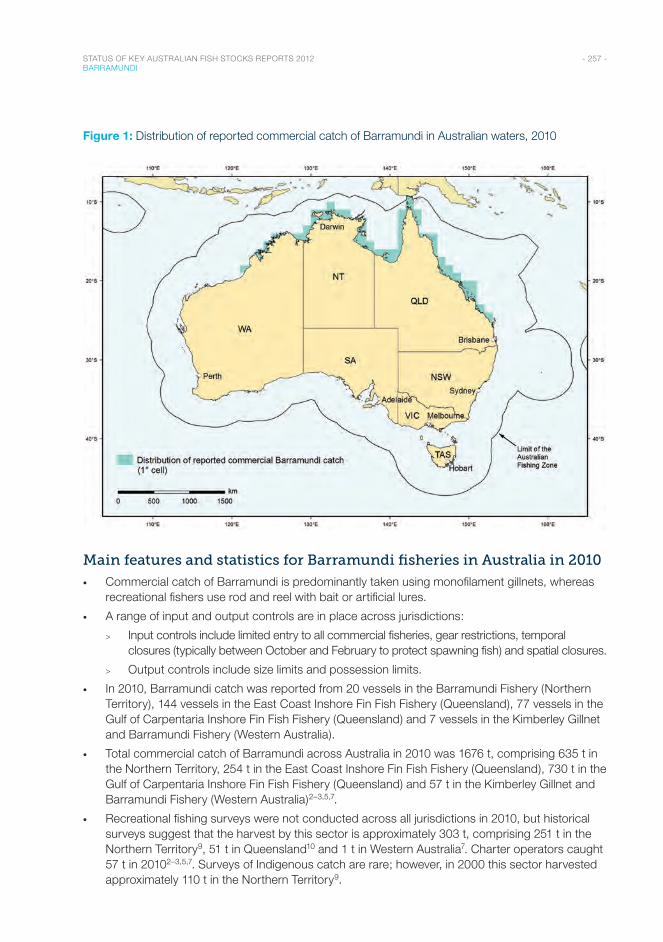
- 257 - STATUS OF KEY AUSTRALIAN FISH STOCKS REPORTS 2012 BARRAMUNDI
Figure 1: Distribution of reported commercial catch of Barramundi in Australian waters, 2010
Main features and statistics for Barramundi fisheries in Australia in 2010
• Commercial catch of Barramundi is predominantly taken using monofilament gillnets, whereas recreational fishers use rod and reel with bait or artificial lures.
• A range of input and output controls are in place across jurisdictions:
> Input controls include limited entry to all commercial fisheries, gear restrictions, temporal closures (typically between October and February to protect spawning fish) and spatial closures.
> Output controls include size limits and possession limits.
• In 2010, Barramundi catch was reported from 20 vessels in the Barramundi Fishery (Northern Territory), 144 vessels in the East Coast Inshore Fin Fish Fishery (Queensland), 77 vessels in the Gulf of Carpentaria Inshore Fin Fish Fishery (Queensland) and 7 vessels in the Kimberley Gillnet and Barramundi Fishery (Western Australia).
• Total commercial catch of Barramundi across Australia in 2010 was 1676 t, comprising 635 t in the Northern Territory, 254 t in the East Coast Inshore Fin Fish Fishery (Queensland), 730 t in the Gulf of Carpentaria Inshore Fin Fish Fishery (Queensland) and 57 t in the Kimberley Gillnet and Barramundi Fishery (Western Australia)2–3,5,7.
• Recreational fishing surveys were not conducted across all jurisdictions in 2010, but historical surveys suggest that the harvest by this sector is approximately 303 t, comprising 251 t in the Northern Territory9, 51 t in Queensland10 and 1 t in Western Australia7. Charter operators caught 57 t in 20102–3,5,7. Surveys of Indigenous catch are rare; however, in 2000 this sector harvested approximately 110 t in the Northern Territory9.
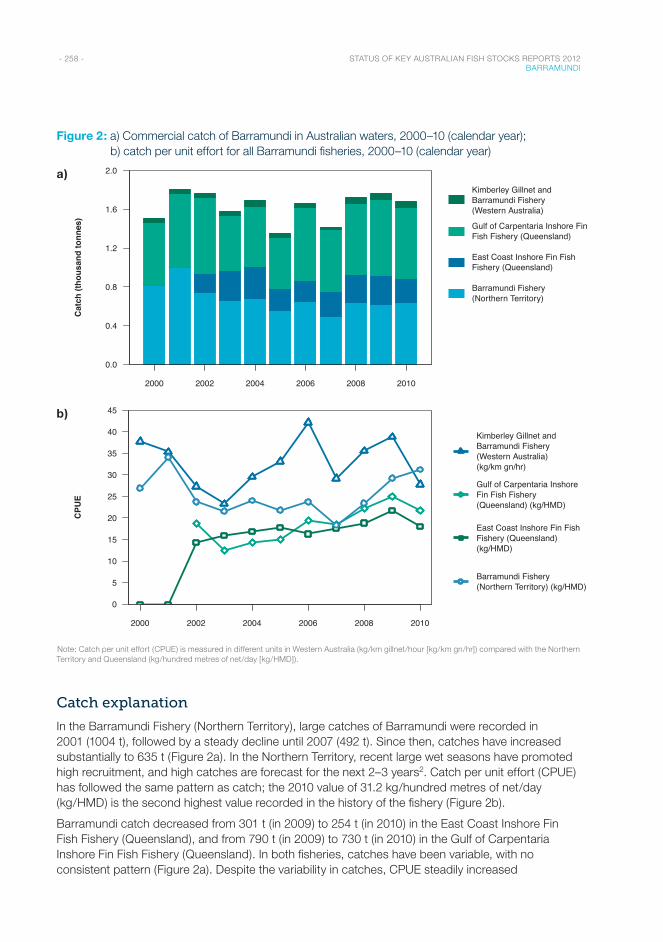
- 258 - STATUS OF KEY AUSTRALIAN FISH STOCKS REPORTS 2012 BARRAMUNDI
Figure 2: a) Commercial catch of Barramundi in Australian waters, 2000–10 (calendar year); b) catch per unit effort for all Barramundi fisheries, 2000–10 (calendar year)
a)
b)
Note: Catch per unit effort (CPUE) is measured in different units in Western Australia (kg/km gillnet/hour [kg/km gn/hr]) compared with the Northern Territory and Queensland (kg/hundred metres of net/day [kg/HMD]).
Catch explanation
In the Barramundi Fishery (Northern Territory), large catches of Barramundi were recorded in 2001 (1004 t), followed by a steady decline until 2007 (492 t). Since then, catches have increased substantially to 635 t (Figure 2a). In the Northern Territory, recent large wet seasons have promoted high recruitment, and high catches are forecast for the next 2–3 years2. Catch per unit effort (CPUE) has followed the same pattern as catch; the 2010 value of 31.2 kg/hundred metres of net/day (kg/HMD) is the second highest value recorded in the history of the fishery (Figure 2b).
Barramundi catch decreased from 301 t (in 2009) to 254 t (in 2010) in the East Coast Inshore Fin Fish Fishery (Queensland), and from 790 t (in 2009) to 730 t (in 2010) in the Gulf of Carpentaria Inshore Fin Fish Fishery (Queensland). In both fisheries, catches have been variable, with no consistent pattern (Figure 2a). Despite the variability in catches, CPUE steadily increased
Year
2000 2002 2004 2006 2008 2010
0.0
0.4
0.8
1.2
1.6
2.0
Kimberley Gillnet andBarramundi Fishery(Western Australia)
Gulf of Carpentaria Inshore FinFish Fishery (Queensland)
East Coast Inshore Fin FishFishery (Queensland)
Barramundi Fishery(Northern Territory)
Cat
ch (t
hous
and
tonn
es)
Year
2000 2002 2004 2006 2008 2010
0
5
10
15
20
25
30
35
40
45
Kimberley Gillnet andBarramundi Fishery(Western Australia)(kg/km gn/hr)
Gulf of Carpentaria InshoreFin Fish Fishery(Queensland) (kg/HMD)
East Coast Inshore Fin FishFishery (Queensland)(kg/HMD)
Barramundi Fishery(Northern Territory) (kg/HMD)
CPU
E
- 259 - STATUS OF KEY AUSTRALIAN FISH STOCKS REPORTS 2012 BARRAMUNDI
from 14.3 kg/HMD in 2002 to 21.8 kg/HMD in 2009 in the East Coast Inshore Fin Fish Fishery (Queensland), and from 17.9 kg/HMD in 2001 to 24.9 kg/HMD in 2009 in the Gulf of Carpentaria Inshore Fin Fish Fishery (Queensland). In 2010, CPUE declined slightly to 18 kg/HMD in the East Coast Inshore Fin Fish Fishery (Queensland) and to 21.7 kg/HMD in the Gulf of Carpentaria Inshore Fin Fish Fishery (Queensland; Figure 2b). In 2010, none of the trigger points were exceeded3,5.
The Barramundi catch in the Kimberley Gillnet and Barramundi Fishery (Western Australia) is small compared with other Australian fisheries and has varied from 27 t to 60 t over the past 10 years. CPUE has followed the same pattern as catch. Exceptions were in 2006, when low catches were associated with high CPUE (42.2 kg/km gillnet/hour), and in 2010, when high catches were associated with low CPUE (27.7 kg/km gillnet/hour). CPUE declined substantially from 38.8 kg/km gillnet/hour in 2009 to the 2010 level7.
Effects of fishing on the marine environment
• Commercial gillnets have almost no impact on coastal habitat and are quite selective, with bycatch making up only a small proportion of the catch. However, commercial gillnets do interact with threatened, endangered and protected (TEP) species. Although reported interactions are low, the impact on the populations of TEP species is unknown2–3,5,7.
Environmental effects on Barramundi
• The duration and magnitude of the wet season strongly drives biomass of Barramundi stocks, with large wet seasons resulting in higher recruitment than smaller wet seasons6,11.
References1. Keenan, CP 1994, Recent evolution of population structure in Australian barramundi, Lates calcarifer (Bloch): an
example of isolation by distance in one dimension, Australian Journal of Marine and Freshwater Research, 45: 1123–1148.
2. Northern Territory Government 2011, Fishery status report 2010, Northern Territory Department of Resources, Fishery Report no. 106.
3. Queensland Department of Employment, Economic Development and Innovation 2011, Annual status report 2010— East Coast Inshore Fin Fish Fishery, DEEDI, Brisbane.
4. Fisheries Queensland 2010, Fisheries Long Term Monitoring Program Sampling Protocol – Barramundi (2008 onwards) Section 1, Department of Employment, Economic Development and Innovation, Brisbane.
5. Queensland Department of Employment, Economic Development and Innovation 2011, Annual status report 2010— Gulf of Carpentaria Inshore Fin Fish Fishery, DEEDI, Brisbane.
6. Halliday, IA, Saunders, T, Sellin, M, Allsop, Q, Robins, JB, McLennan, M & Kurnoth P 2012, Flow impacts on estuarine finfish fisheries of the Gulf of Carpentaria, FRDC project 2007/002, Queensland Department of Agriculture, Fisheries and Forestry.
7. Newman, SJ, Skepper, C, Mitsopoulos, G, McAuley, R & Green, R 2011, North coast nearshore and estuarine fishery status report, in WJ Fletcher & K Santoro (eds), State of the fisheries and aquatic resources report 2010/11, Western Australia Department of Fisheries, Perth, 183–189.
8. Davis, TLO 1982, Maturity and sexuality in barramundi, Lates calcarifer (Bloch), in the Northern Territory and south-eastern Gulf of Carpentaria, Australian Journal of Marine and Freshwater Research, 33: 529–545.
9. Coleman, APM 2004, The national recreational fishing survey, Fishery Report 72, Northern Territory Department of Business, Industry and Resource Development, Darwin.
10. McInnes, K 2008, Experimental results from the fourth Queensland recreational fishing diary program (2005), Queensland Department of Primary Industries and Fisheries, Brisbane.
11. Robins, JB, Halliday, IA, Staunton-Smith, J, Mayer, DG & Sellin, MJ 2005, Freshwater flow requirements of estuarine fisheries in tropical Australia: a review of the state of knowledge and application of a suggested approach, Marine and Freshwater Research, 56: 343–360.
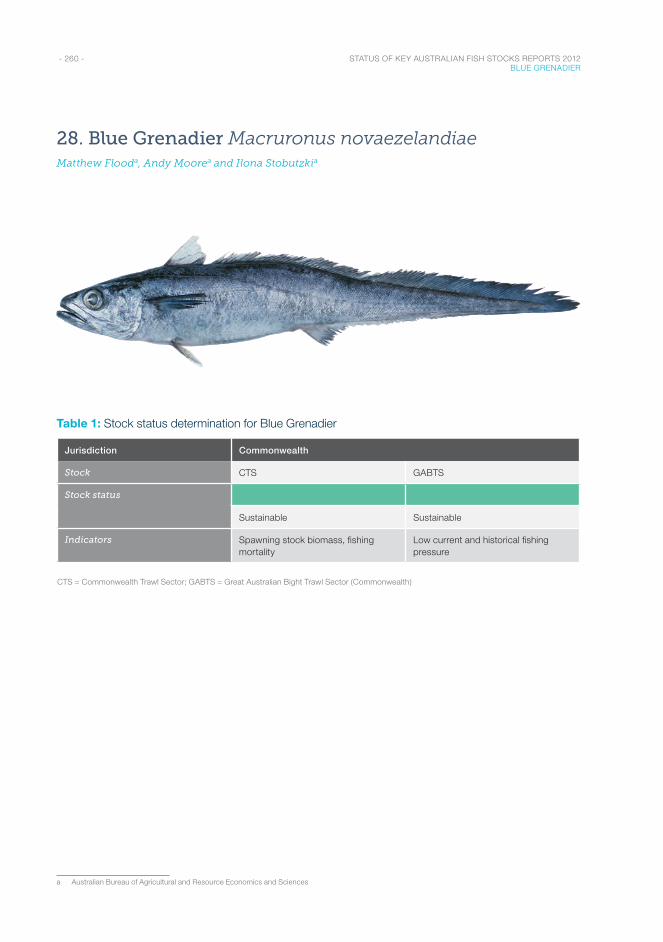
- 260 - STATUS OF KEY AUSTRALIAN FISH STOCKS REPORTS 2012 BLUE GRENADIER
28. Blue Grenadier Macruronus novaezelandiaeMatthew Flooda, Andy Moorea and Ilona Stobutzkia
Table 1: Stock status determination for Blue Grenadier
Jurisdiction Commonwealth
Stock CTS GABTS
Stock status
Sustainable Sustainable
Indicators Spawning stock biomass, fishing mortality
Low current and historical fishing pressure
CTS = Commonwealth Trawl Sector; GABTS = Great Australian Bight Trawl Sector (Commonwealth)
a Australian Bureau of Agricultural and Resource Economics and Sciences
- 261 - STATUS OF KEY AUSTRALIAN FISH STOCKS REPORTS 2012 BLUE GRENADIER
Stock structure
Data from otolith studies provide support for two separate biological stocks of Blue Grenadier: one in the region of the Great Australian Bight Trawl Sector (Commonwealth) and the other in the region of the Commonwealth Trawl Sector1.
Stock status
Commonwealth Trawl Sector biological stock
Blue Grenadier in the Commonwealth Trawl Sector and the Gillnet, Hook and Trap Sector (Commonwealth) is managed under a multiyear total allowable catch (TAC). The Commonwealth Trawl Sector accounts for the vast majority of the catch from these two sectors (99.9 per cent in the 2010 fishing season). Given the limited catch from the Gillnet Hook and Trap Sector, the biological stock is referred to in this report as the Commonwealth Trawl Sector biological stocka. The most recent assessment2 includes estimates of spawning biomass from acoustic surveys in 2003–10 and egg survey estimates of female spawning biomass in 1994. The assessment estimated the female spawning stock biomass in 2010 to be 87 per cent of the unfished level. The biological stock is not considered to be recruitment overfished.
On the basis of the 2008 assessment3, a long-term recommended biological catch of 4700 tonnes (t) per year was established for 2009 to 20114. The 2010 TAC was set at 4700 t. Uncaught quota in 2009 resulted in an adjusted TAC for the 2010 fishing season of 5088 t5. Total commercial catch in the 2010 fishing season was below this TAC, at 4031 t. This level of fishing mortality is unlikely to cause the biological stock to become recruitment overfished.
On the basis of the evidence provided above, the biological stock is classified as a sustainable stock.
Great Australian Bight Trawl Sector (Commonwealth) biological stock
There have been no stock assessments for the Great Australian Bight Trawl Sector (Commonwealth) biological stock of Blue Grenadier, and no estimates of fishing mortality or biomass have been made. A catch trigger of 400 t is in place, above which data collection and the development of an assessment plan are required. A cease-to-fish catch trigger of 500 t also applies6.
Blue Grenadier from this biological stock are targeted on the upper continental slope (around 200–700 m depth). Fishing effort on the Great Australian Bight continental slope has been decreasing since 2005 due to targeting of shelf species, and accounted for 3 per cent of total effort in the fishery in 20107. There is substantial slope habitat across the Great Australian Bight and Western Australia, with fishing generally limited to a small area. It is therefore likely that parts of this biological stock remain unfished. Commercial catches of Blue Grenadier are typically low in the Great Australian Bight Trawl Fishery (9 t in 2010), with a peak commercial catch in 2005 of 422 t. This evidence suggests that the current level of fishing mortality is unlikely to cause the biological stock to become recruitment overfished, and that the biological stock is unlikely to be recruitment overfished.
On the basis of the evidence provided above, the biological stock is classified as a sustainable stock.
a The fishery includes two components, a winter fishery targeting spawning aggregations on the west coast of Tasmania, and a non-spawning fishery, which is less targeted.
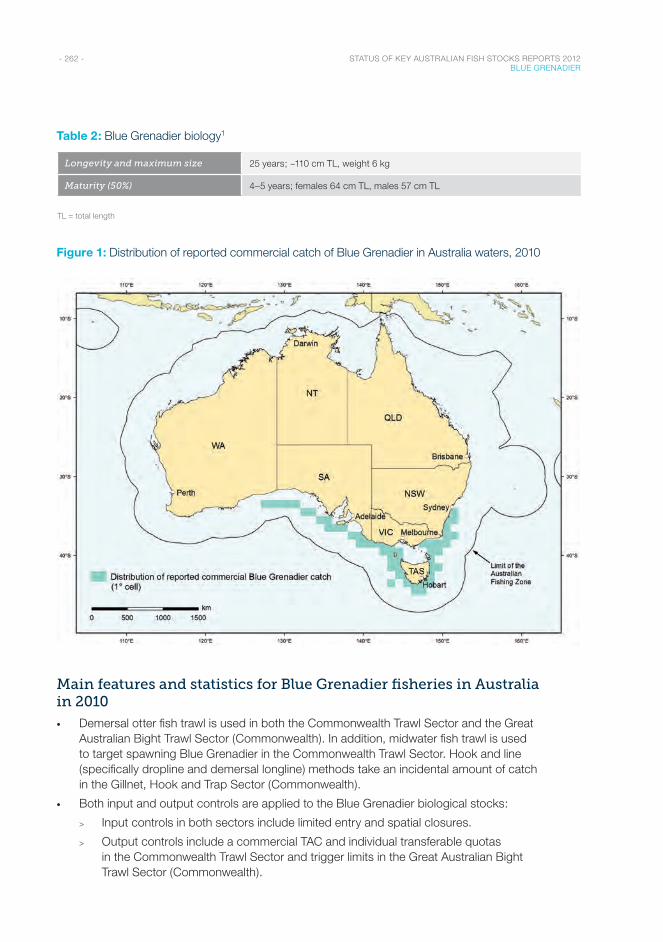
- 262 - STATUS OF KEY AUSTRALIAN FISH STOCKS REPORTS 2012 BLUE GRENADIER
Table 2: Blue Grenadier biology1
Longevity and maximum size 25 years; ~110 cm TL, weight 6 kg
Maturity (50%) 4–5 years; females 64 cm TL, males 57 cm TL
TL = total length
Figure 1: Distribution of reported commercial catch of Blue Grenadier in Australia waters, 2010
Main features and statistics for Blue Grenadier fisheries in Australia in 2010
• Demersal otter fish trawl is used in both the Commonwealth Trawl Sector and the Great Australian Bight Trawl Sector (Commonwealth). In addition, midwater fish trawl is used to target spawning Blue Grenadier in the Commonwealth Trawl Sector. Hook and line (specifically dropline and demersal longline) methods take an incidental amount of catch in the Gillnet, Hook and Trap Sector (Commonwealth).
• Both input and output controls are applied to the Blue Grenadier biological stocks:
> Input controls in both sectors include limited entry and spatial closures.
> Output controls include a commercial TAC and individual transferable quotas in the Commonwealth Trawl Sector and trigger limits in the Great Australian Bight Trawl Sector (Commonwealth).
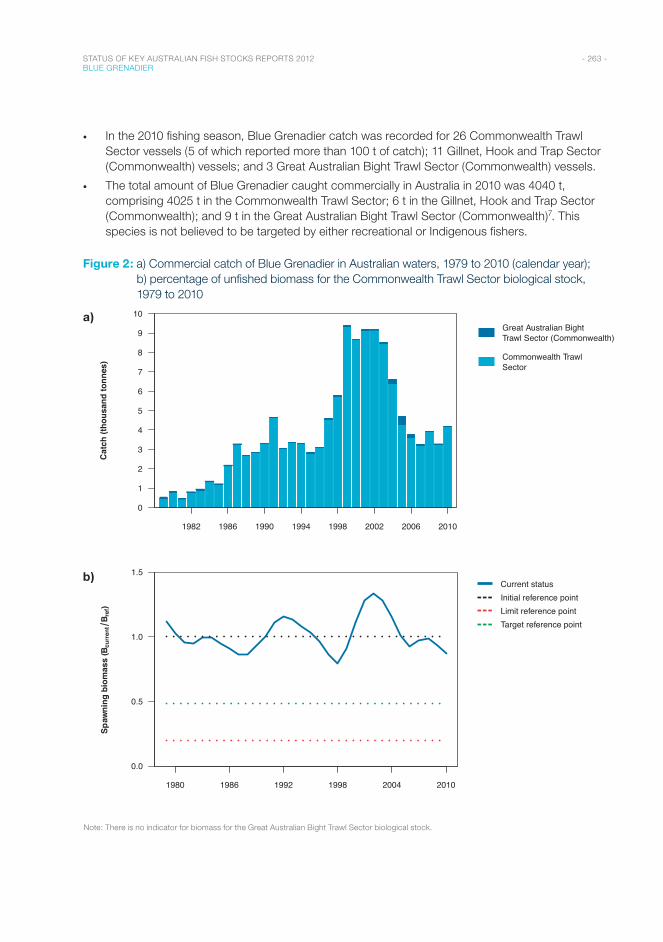
- 263 - STATUS OF KEY AUSTRALIAN FISH STOCKS REPORTS 2012 BLUE GRENADIER
• In the 2010 fishing season, Blue Grenadier catch was recorded for 26 Commonwealth Trawl Sector vessels (5 of which reported more than 100 t of catch); 11 Gillnet, Hook and Trap Sector (Commonwealth) vessels; and 3 Great Australian Bight Trawl Sector (Commonwealth) vessels.
• The total amount of Blue Grenadier caught commercially in Australia in 2010 was 4040 t, comprising 4025 t in the Commonwealth Trawl Sector; 6 t in the Gillnet, Hook and Trap Sector (Commonwealth); and 9 t in the Great Australian Bight Trawl Sector (Commonwealth)7. This species is not believed to be targeted by either recreational or Indigenous fishers.
Figure 2: a) Commercial catch of Blue Grenadier in Australian waters, 1979 to 2010 (calendar year); b) percentage of unfished biomass for the Commonwealth Trawl Sector biological stock, 1979 to 2010
a)
b)
Year
1980 1986 1992 1998 2004 2010
0.0
0.5
1.0
1.5Current statusInitial reference pointLimit reference pointTarget reference point
Spaw
ning
bio
mas
s (B
curr
ent
B ref
)
Note: There is no indicator for biomass for the Great Australian Bight Trawl Sector biological stock.
Year
1982 1986 1990 1994 1998 2002 2006 2010
0
1
2
3
4
5
6
7
8
9
10Great Australian BightTrawl Sector (Commonwealth)
Commonwealth TrawlSector
Cat
ch (t
hous
and
tonn
es)
- 264 - STATUS OF KEY AUSTRALIAN FISH STOCKS REPORTS 2012 BLUE GRENADIER
Catch explanation
In the Commonwealth Trawl Sector, commercial catch increased from 1999 to 2004, with a corresponding increase in effort. Commercial catch and catch per unit effort have been relatively constant over recent years.
Commercial catch of Blue Grenadier in the Great Australian Bight Trawl Sector (Commonwealth) has historically been low, only exceeding 50 t from 2004 to 2007, as a result of increasing fishing effort on the continental slope over this period. Fishing effort on the slope has dramatically decreased since this period, with catches not exceeding 10 t since 2008.
Effects of fishing on the marine environment
• There can be a substantial level of bycatch in the fish trawl sector. In 2006, mandatory gear requirements were introduced for otter trawls to reduce the catch of small species and juvenile fish.
• Interactions occur with animals protected under the Environment Protection and Biodiversity Conservation Act 1999. Interactions are known to occur with marine mammals (dolphins, seals and sea lions), seabirds, some shark species, and seahorses and pipefish (syngnathids).
• Seal interactions have been observed in the winter factory vessel trawl fishery for Blue Grenadier off western Tasmania (in the Commonwealth Trawl Sector). Seal excluder devices have been compulsory in this component of the Southern and Eastern Scalefish and Shark Fishery (Commonwealth) since 2005, with the aim of reducing seal mortalities. Operations have developed further mitigation protocols, including using breakaway ties that keep the net closed until it is below depths that seals regularly inhabit, adopting techniques to close the trawl opening during recovery to minimise opportunities for seals to enter the net, switching off gantry lights that are not required during night trawling to avoid attracting bait species and seals, and dumping offal only when the boat is not engaged in deploying or hauling gear8.
Environmental effects on Blue Grenadier
• Changes in ecosystem structure and function due to changes in climate may affect larval recruitment of Blue Grenadier9.
- 265 - STATUS OF KEY AUSTRALIAN FISH STOCKS REPORTS 2012 BLUE GRENADIER
References1. Hamer, P, Kemp, J, Robertson, S & Hindell, J 2009, Use of otolith chemistry and shape to assess the stock structure of
Blue Grenadier (Macruronus novaezelandiae) in the Commonwealth Trawl and Great Australian Bight fisheries, final report to the Fisheries Research and Development Corporation, project 2007/030, Fisheries Research Branch, Queenscliff.
2. Tuck, GN 2012, Stock assessment of blue grenadier (Macruronus novaezelandiae) based on data up to 2010. Addendum with Model BC22, in GN Tuck (ed.), Stock assessment for the Southern and Eastern Scalefish and Shark Fishery 2011, part 1, Australian Fisheries Management Authority & CSIRO Marine and Atmospheric Research, Hobart.
3. Tuck, GN 2008, Updated stock assessment of blue grenadier Macruronus novaezelandiae based on data up to 2007, CSIRO Marine and Atmospheric Research, Hobart.
4. Slope Resource Assessment Group 2010, 2009 stock assessment report for SESSF species assessed by SlopeRAG, report to the Australian Fisheries Management Authority, Canberra.
5. Australian Fisheries Management Authority 2011, AFMA CatchWatch, a report from the Australian Fisheries Management Authority, Southern and Eastern Scalefish and Shark Fishery 2010 27, April 2011, AFMA, Canberra, www.afma.gov.au/wp-content/uploads/2010/06/Catch-vs-TAC.4v2.pdf.
6. Australian Fisheries Management Authority 2008, Southern and Eastern Scalefish and Shark Fishery—Great Australian Bight Trawl Sector. Management arrangements booklet, AFMA, Canberra.
7. Woodhams, J, Stobutzki, I, Vieira, S, Curtotti, R & Begg, GA (eds) 2011, Fishery status reports 2010: status of fish stocks and fisheries managed by the Australian Government, Australian Bureau of Agricultural and Resource Economics and Sciences, Canberra.
8. South East Trawl Fishing Industry Association 2007, Industry code of practice to minimise interactions with seals, SETFIA, Shearwater, Tasmania.
9. Hobday, AJ, Poloczanska, ES & Matear, R 2007, Implications of climate change for Australian fisheries and aquaculture: a preliminary assessment, CSIRO Marine and Atmospheric Research report to the Australian Government Department of Climate Change, Canberra.
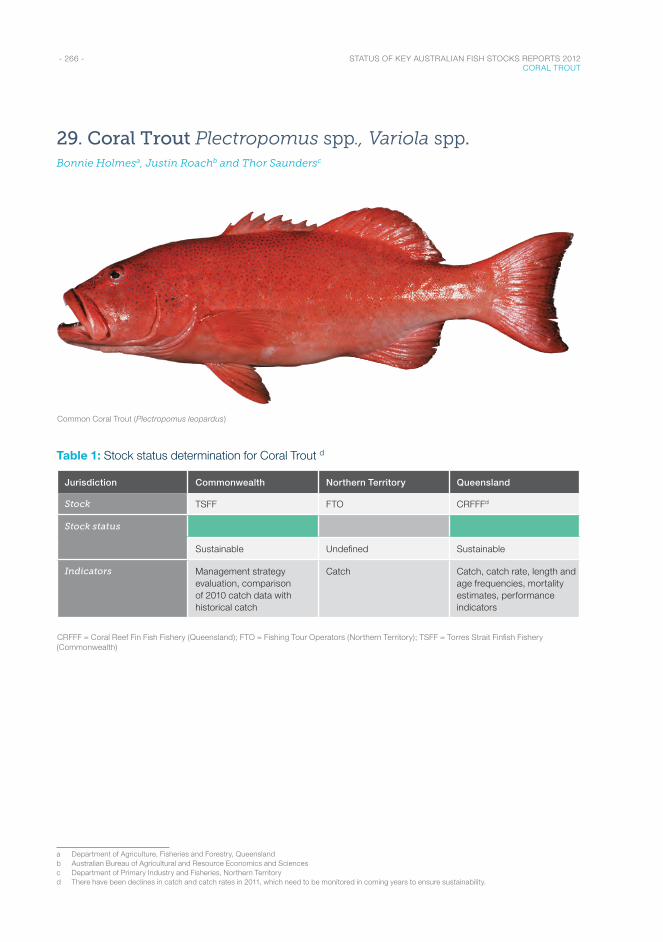
- 266 - STATUS OF KEY AUSTRALIAN FISH STOCKS REPORTS 2012 CORAL TROUT
29. Coral Trout Plectropomus spp., Variola spp.Bonnie Holmesa, Justin Roachb and Thor Saundersc
Common Coral Trout (Plectropomus leopardus)
Table 1: Stock status determination for Coral Trout d
Jurisdiction Commonwealth Northern Territory Queensland
Stock TSFF FTO CRFFFd
Stock status
Sustainable Undefined Sustainable
Indicators Management strategy evaluation, comparison of 2010 catch data with historical catch
Catch Catch, catch rate, length and age frequencies, mortality estimates, performance indicators
CRFFF = Coral Reef Fin Fish Fishery (Queensland); FTO = Fishing Tour Operators (Northern Territory); TSFF = Torres Strait Finfish Fishery (Commonwealth)
a Department of Agriculture, Fisheries and Forestry, Queenslandb Australian Bureau of Agricultural and Resource Economics and Sciencesc Department of Primary Industry and Fisheries, Northern Territoryd There have been declines in catch and catch rates in 2011, which need to be monitored in coming years to ensure sustainability.
- 267 - STATUS OF KEY AUSTRALIAN FISH STOCKS REPORTS 2012 CORAL TROUT
Stock structure
Assessments of Coral Trout take into account a species complex in the Commonwealth and Queensland jurisdictions. This complex comprises Common Coral Trout (Plectropomus leopardus), Barcheek Coral Trout (P. maculatus), Bluespotted Coral Trout (P. laevis), Passionfruit Coral Trout (P. areolatus), Yellow-edge Coronation Trout (Variola louti) and White-edge Coronation Trout (V. albimarginata). The biological stock structure of Coral Trout is spatially complex and remains uncertain; hence, status is reported at the management unit level rather than individual biological stocks.
Stock status
Torres Strait Finfish Fishery (Commonwealth) management unit
No formal stock assessment has been conducted in the Torres Strait Finfish Fishery (Commonwealth), but a management strategy evaluation1 tested four model simulations. All models estimated that biomass in 2004 was greater than 60 per cent of the unfished level (in 1965), and it was estimated that biomass would be greater than 70 per cent of the unfished level by 2025 at 2007 fishing levels. The management unit is not considered to be recruitment overfished.
Catch in recent years has been below historical catch levels and well below the lowest catch level simulated in the management strategy evaluation (80 tonnes [t] per year). A catch simulation at 80 t suggested that Coral Trout biomass in the fishery would increase to greater than 80 per cent of the unfished biomass within 20 years1. The current level of fishing mortality is unlikely to cause the management unit to become recruitment overfished.
On the basis of the evidence provided above, the Torres Strait Finfish Fishery (Commonwealth) management unit is classified as a sustainable stock.
Fishing Tour Operators (Northern Territory) management unit
The status of Coral Trout is unknown in the Northern Territory. Only small catches are reported from the Fishing Tour Operator sector, and no catch is reported from the commercial sector2.
Insufficient information is available to confidently determine status; as a result, the Fishing Tour Operators (Northern Territory) management unit is classified as an undefined stock.
Coral Reef Fin Fish Fishery (Queensland) management unit
The spatially complex nature of Coral Trout means that it has not been possible to conduct a traditional stock assessment on the east coast of Queensland. However, other assessments, such as the Effects of Line Fishing project3, have enabled simulation of Coral Trout populations based on varying management arrangements.
Approximately 33 per cent of the Great Barrier Reef Marine Park is closed to fishing, protecting fish in these areas from fishing. As well, from 2006 to 2010, Fisheries Queensland conducted annual fishery-independent line surveys to monitor catch rates and gather information on biological stock structure. Data collected during this time have contributed to the development of standardised catch-rate performance measures for the fishery. The annual standardised catch rate in 2009–10 did not fall below 90 per cent of the average standardised catch rate for all preceding quota years4. Data in 2009–10 indicated a good recruitment of 2-year-old fish to the fishery. These results indicate that the biomass in 2010 was at a level not considered to be recruitment overfished.
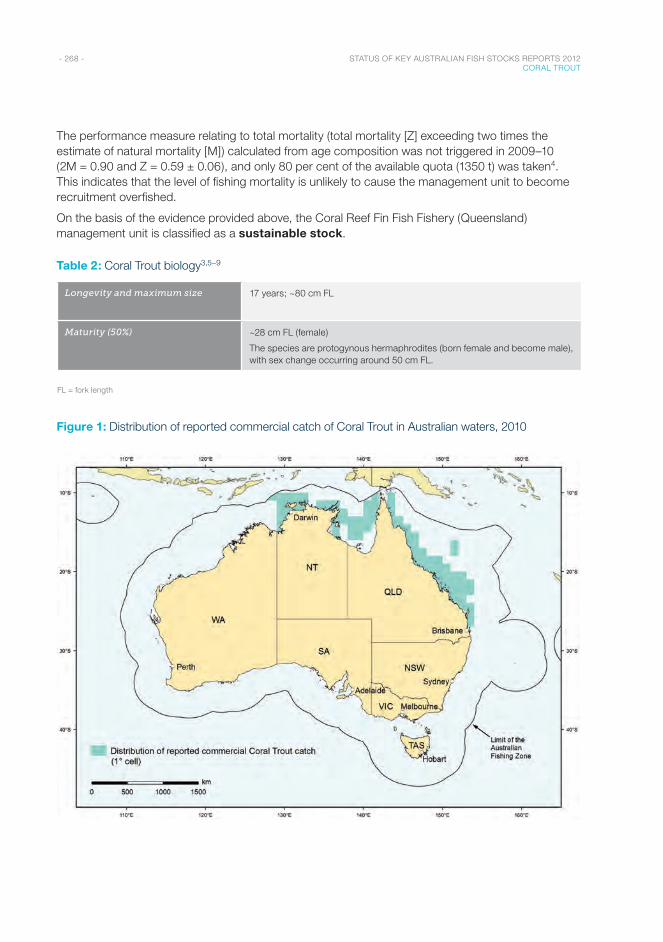
- 268 - STATUS OF KEY AUSTRALIAN FISH STOCKS REPORTS 2012 CORAL TROUT
The performance measure relating to total mortality (total mortality [Z] exceeding two times the estimate of natural mortality [M]) calculated from age composition was not triggered in 2009–10 (2M = 0.90 and Z = 0.59 ± 0.06), and only 80 per cent of the available quota (1350 t) was taken4. This indicates that the level of fishing mortality is unlikely to cause the management unit to become recruitment overfished.
On the basis of the evidence provided above, the Coral Reef Fin Fish Fishery (Queensland) management unit is classified as a sustainable stock.
Table 2: Coral Trout biology3,5–9
Longevity and maximum size 17 years; ~80 cm FL
Maturity (50%) ~28 cm FL (female)
The species are protogynous hermaphrodites (born female and become male), with sex change occurring around 50 cm FL.
FL = fork length
Figure 1: Distribution of reported commercial catch of Coral Trout in Australian waters, 2010
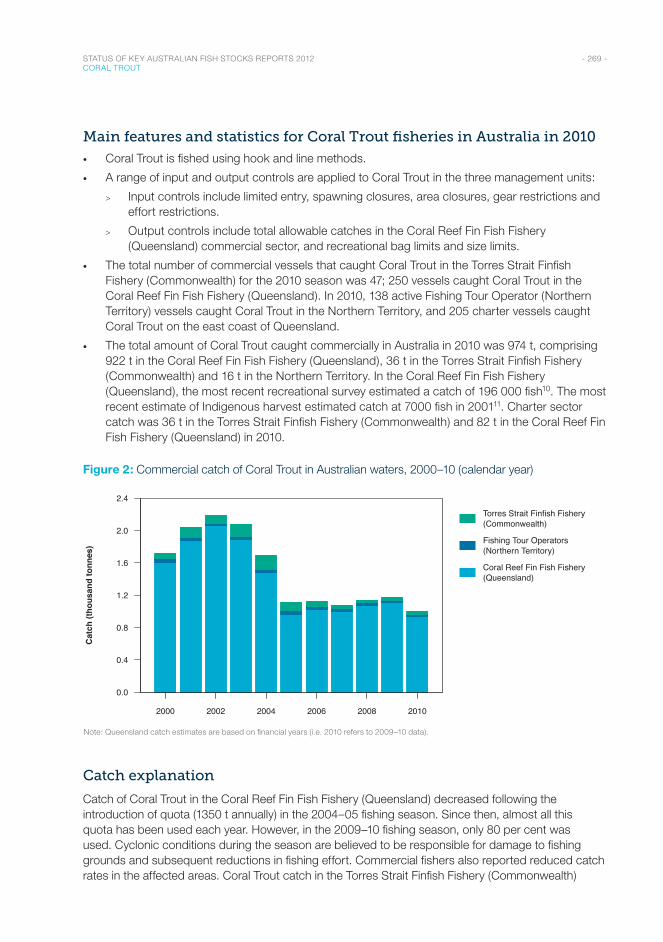
- 269 - STATUS OF KEY AUSTRALIAN FISH STOCKS REPORTS 2012 CORAL TROUT
Main features and statistics for Coral Trout fisheries in Australia in 2010
• Coral Trout is fished using hook and line methods.
• A range of input and output controls are applied to Coral Trout in the three management units:
> Input controls include limited entry, spawning closures, area closures, gear restrictions and effort restrictions.
> Output controls include total allowable catches in the Coral Reef Fin Fish Fishery (Queensland) commercial sector, and recreational bag limits and size limits.
• The total number of commercial vessels that caught Coral Trout in the Torres Strait Finfish Fishery (Commonwealth) for the 2010 season was 47; 250 vessels caught Coral Trout in the Coral Reef Fin Fish Fishery (Queensland). In 2010, 138 active Fishing Tour Operator (Northern Territory) vessels caught Coral Trout in the Northern Territory, and 205 charter vessels caught Coral Trout on the east coast of Queensland.
• The total amount of Coral Trout caught commercially in Australia in 2010 was 974 t, comprising 922 t in the Coral Reef Fin Fish Fishery (Queensland), 36 t in the Torres Strait Finfish Fishery (Commonwealth) and 16 t in the Northern Territory. In the Coral Reef Fin Fish Fishery (Queensland), the most recent recreational survey estimated a catch of 196 000 fish10. The most recent estimate of Indigenous harvest estimated catch at 7000 fish in 200111. Charter sector catch was 36 t in the Torres Strait Finfish Fishery (Commonwealth) and 82 t in the Coral Reef Fin Fish Fishery (Queensland) in 2010.
Figure 2: Commercial catch of Coral Trout in Australian waters, 2000–10 (calendar year)
Year
2000 2002 2004 2006 2008 2010
0.0
0.4
0.8
1.2
1.6
2.0
2.4
Torres Strait Finfish Fishery(Commonwealth)
Fishing Tour Operators(Northern Territory)
Coral Reef Fin Fish Fishery(Queensland)
Cat
ch (t
hous
and
tonn
es)
Note: Queensland catch estimates are based on financial years (i.e. 2010 refers to 2009–10 data).
Catch explanation
Catch of Coral Trout in the Coral Reef Fin Fish Fishery (Queensland) decreased following the introduction of quota (1350 t annually) in the 2004–05 fishing season. Since then, almost all this quota has been used each year. However, in the 2009–10 fishing season, only 80 per cent was used. Cyclonic conditions during the season are believed to be responsible for damage to fishing grounds and subsequent reductions in fishing effort. Commercial fishers also reported reduced catch rates in the affected areas. Coral Trout catch in the Torres Strait Finfish Fishery (Commonwealth)
- 270 - STATUS OF KEY AUSTRALIAN FISH STOCKS REPORTS 2012 CORAL TROUT
increased to 36 t in 2010, compared with the previous year’s catch of 27 t. However, this is still well below the historical high of 174 t in 2004. Factors that have caused this reduction include fewer active fishers and increased costs of fishing12. In the Northern Territory, Fishing Tour Operator catch has been steady over the past 10 years at around 30–40 t. However, in 2010 the catch decreased to approximately 16 t. The reasons for this are unknown.
Effects of fishing on the marine environment
• Some sharks (including Grey Reef and Whitetip Reef Sharks) are known to be caught by Traditional Inhabitant Boat and Transferable Vessel Holder fishers, but a recent study found that sharks make up less than 5 per cent of total catch in the Torres Strait Finfish Fishery (Commonwealth) and are not retained9.
• In the 2009–10 fishing season, no fishery observer program trips were conducted in the Coral Reef Fin Fish Fishery (Queensland). Therefore, the proportion of bycatch is unknown. Bycatch information will be collected by the fishery observer program during 2011, with results reported in 2012.
• There were no reported interactions with any protected species by the Torres Strait Finfish Fishery (Commonwealth; in 2010) or the Coral Reef Fin Fish Fishery (Queensland; in the 2009–10 fishing season), indicating that the impact of this fishery on protected species is low.
Environmental effects on Coral Trout
• The 2009 Coral Reef Fin Fish Fishery (Queensland) annual status report noted that effort shifted away from areas affected by Tropical Cyclone Hamish in March 20094. Tobin et al.13 reported on the effects of three tropical cyclones on the Coral Reef Fin Fish Fishery industry, including a decrease in Coral Trout catch rates of around one-third in regions with the most structural reef damage. The destruction, scouring and displacement of reef habitat were significant and widespread across large areas of the reef. In addition to the structural reef damage, commercial fishers reported reduced catch rates of all species throughout the directly impacted areas13. The analysis identifies depressed catch rates in affected areas following cyclones for a duration of 12–24 months.
• Climate change impacts are a concern for coral reef ecosystems. Climate change has been linked to increases in the number and extent of coral bleaching events14 and changes in ocean chemistry. These events also have the potential to impact on the replenishment rates of coral reef fin fish populations15, individual growth rates and spawning output16, and may influence the geographic distribution of coral reef species (e.g. latitudinal shifts in distribution).
References1. Williams, AJ, Begg, GA, Little, LR, Currey, LM, Ballagh, AC & Murchie, CD 2007, Evaluation of the eastern Torres Strait
Reef Line Fishery, Fishing and Fisheries Research Centre, technical report 1, James Cook University, Townsville.
2. Northern Territory Government 2011, Fishery status reports 2010, Fishery Report no. 106, Northern Territory Government Department of Resources, Darwin.
3. Mapstone, BD, Davies, CR, Little, LR, Punt, AE, Smith, ADM, Pantus, F, Lou, DC, Williams, AJ, Jones, A, Ayling, AM, Russ, GR & McDonald, AD 2004, The effects of line fishing on the Great Barrier Reef and evaluations of alternative potential management strategies, technical report 54, CRC Reef Research Centre, Townsville.
4. Queensland Department of Employment, Economic Development and Innovation 2010, Annual status report for the Coral Reef Fin Fish Fishery, DEEDI, Brisbane.
5. Anderson, C, Clarke, K, Higgs, J & Ryan, S 2005, Ecological assessment of the Queensland Coral Reef Fin Fish Fishery, Queensland Department of Primary Industries and Fisheries, Brisbane.
- 271 - STATUS OF KEY AUSTRALIAN FISH STOCKS REPORTS 2012 CORAL TROUT
6. Ferreira, BP 1995, Reproduction of the common coral trout Plectropomus leopardus (Serranidae: Epinephelinae) from the Central and Northern Great Barrier Reef, Australia, Bulletin of Marine Science, 56: 653–669.
7. Kailola, PJ, Williams, MJ, Stewart, PC, Reichelt, RE, McNee, A & Grieve, C 1993, Australian fisheries resources, Bureau of Resource Sciences & Fisheries Research and Development Corporation, Canberra.
8. Samoilys, MA 1997, Periodicity of spawning aggregations of coral trout, Plectropomus leopardus (Pisces: Serranidae) on the northern Great Barrier Reef, Marine Ecology Progress Series, 160: 149–159.
9. Williams, G, Currey, LM, Begg, GA, Murchie, CD & Ballagh, AC 2008, Population biology of coral trout species in eastern Torres Strait: implications for fisheries management, Continental Shelf Research, 28: 2129–2142.
10. McInnes, K 2008, Experimental results from the fourth Queensland recreational fishing diary program (2005), Queensland Department of Primary Industries and Fisheries, Brisbane.
11. Henry, GW & Lyle, JM 2003, National recreational and indigenous fishing survey, Fisheries Research Development Corporation project 99/158, Australian Government Department of Agriculture, Fisheries and Forestry, Canberra.
12. Torres Strait Finfish Working Group 2010, TSFFWG papers, meeting 2010.1, meeting of the TSFFWG, Thursday Island, 31 March 2010, http://pzja.gov.au/wp-content/uploads/2011/06/TSFFWG-Meeting-31-March-2010_-Papers.pdf.
13. Tobin, A, Schlaff, A, Tobin, R, Penny, A, Ayling, T, Ayling, A, Krause, B, Welch, D, Sutton, S, Sawynok, B, Marshall, N, Marshall, P & Maynard, J 2010, Adapting to change: minimising uncertainty about the effects of rapidly-changing environmental conditions on the Queensland Coral Reef Fin Fish Fishery, final report to the Fisheries Research and Development Corporation, project 2008/103, Fishing & Fisheries Research Centre Technical Report no. 11, James Cook University, Townsville.
14. Hoegh-Guldberg, O, Mumby, PJ, Hooten, AJ, Steneck, RS, Greenfield, P, Gomez, E, Harvell, CD, Sale, PF, Edwards, AJ, Caldeira, K, Knowlton, N, Eakin, CM, Iglesias-Prieto, R, Muthiga, N, Bradbury, RH, Dubi, A & Hatziolos, ME 2007, Coral reefs under rapid climate changes and ocean acidification, Science, 318: 1737–1742.
15. Hughes, T 2010, Marine and Tropical Sciences Research Facility milestone report for program 2.5i.3, report to the Australian Government Department of the Environment, Water, Heritage and the Arts, www.rrrc.org.au/publications/downloads/25i3-JCU-Hughes-T-2010-March-Milestone-Report.pdf.
16. Johnson, JE & Welch, DJ 2010, Marine fisheries management in a changing climate: a review of vulnerability and future options, Reviews in Fisheries Science, 18(1): 106–124.
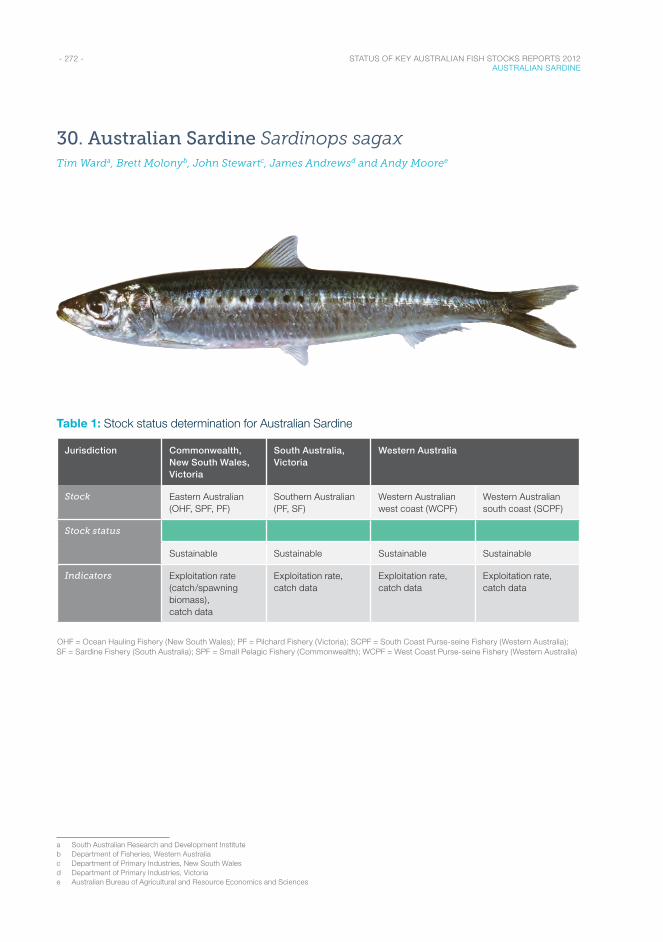
- 272 - STATUS OF KEY AUSTRALIAN FISH STOCKS REPORTS 2012 AUSTRALIAN SARDINE
30. Australian Sardine Sardinops sagaxTim Warda, Brett Molonyb, John Stewartc, James Andrewsd and Andy Mooree
Table 1: Stock status determination for Australian Sardine
Jurisdiction Commonwealth, New South Wales, Victoria
South Australia, Victoria
Western Australia
Stock Eastern Australian (OHF, SPF, PF)
Southern Australian (PF, SF)
Western Australian west coast (WCPF)
Western Australian south coast (SCPF)
Stock status
Sustainable Sustainable Sustainable Sustainable
Indicators Exploitation rate (catch/spawning biomass), catch data
Exploitation rate, catch data
Exploitation rate, catch data
Exploitation rate, catch data
OHF = Ocean Hauling Fishery (New South Wales); PF = Pilchard Fishery (Victoria); SCPF = South Coast Purse-seine Fishery (Western Australia); SF = Sardine Fishery (South Australia); SPF = Small Pelagic Fishery (Commonwealth); WCPF = West Coast Purse-seine Fishery (Western Australia)
a South Australian Research and Development Instituteb Department of Fisheries, Western Australiac Department of Primary Industries, New South Walesd Department of Primary Industries, Victoriae Australian Bureau of Agricultural and Resource Economics and Sciences
- 273 - STATUS OF KEY AUSTRALIAN FISH STOCKS REPORTS 2012 AUSTRALIAN SARDINE
Stock structure
There is a growing consensus that the Australian Sardine population comprises four separate biological stocks1–2. Bass Strait effectively separates the biological stocks that occur off eastern and southern Australia3. A single biological stock occurs off South Australia and western Victoria1, and a further two separate biological stocks occur off the south and west coasts of Western Australia2,4. Since stock delineation is known for this species, status is reported at the level of individual biological stocks.
Stock status
The maximum sustainable yield for low–trophic level (forage) species, such as Australian Sardine, is typically achieved at depletion levels of approximately 60 per cent, equivalent to 40 per cent of unfished biomass5. However, harvest strategies for fisheries for these species also need to consider potential impacts on biodiversity and ecosystem health6. Biomass levels above 75 per cent of the unfished level have been identified as a global average for achieving a balance between protecting ecosystem function and biodiversity and providing for food production and economic development of low–trophic level species5. Australian ecosystems are considerably less sensitive to harvesting of low–trophic level species than other systems worldwide5.
Low–trophic level species often undergo large fluctuations in abundance over a range of spatial and temporal scales. For example, two mass mortality events in the 1990s each killed up to 70 per cent of the adult population of Australian Sardine2,7–8. Hence, performance indicators that relate to levels of depletion of unfished biomass are unsuitable for the management of Commonwealth and state fisheries for Australian Sardine9–10.
Spawning biomass of Australian Sardine can be estimated using the daily egg production method (DEPM)11–13. Exploitation rate (i.e. catch/spawning biomass) is a suitable performance indicator for Australian Sardine. Indicators of ecosystem health monitored and modelled in relation to the Sardine Fishery (South Australia), combined with other information on the low sensitivity of Australian ecosystems to harvesting of low–trophic level species, suggests that 30 per cent is a conservative limit reference point for defining overfishing that takes into account the species’ ecological importance (see Figure 4)5–6,9–10.
The information available to assess biological stock status and the frequency of formal assessments vary among jurisdictions, largely in response to recent catch levels. Catch-and-effort data are monitored annually in all jurisdictions. Estimates of spawning biomass have been obtained using the DEPM for each of the four biological stocks, and population modelling has been undertaken for the southern Australian biological stock and the two Western Australian biological stocks.
Eastern Australian biological stock
Estimates obtained in 1997, 1998 and 2004, using the DEPM, suggest that the spawning biomass of Australian Sardine off eastern Australia is at least 25 000–30 000 tonnes (t)14–16. The biological stock is not considered to be recruitment overfished. Recent catches of approximately 3000–5000 t equate to exploitation rates of less than 25 per cent17. This level of fishing mortality is below the limit reference point and unlikely to cause the biological stock to become recruitment overfished.
On the basis of the evidence provided above, the eastern Australian Sardine biological stock is classified as a sustainable stock.
- 274 - STATUS OF KEY AUSTRALIAN FISH STOCKS REPORTS 2012 AUSTRALIAN SARDINE
Southern Australian biological stock
Assessment of the southern Australian Sardine biological stock has involved annual and, more recently, biennial DEPM surveys; in non-survey years, it has involved population modelling based on spawning biomass (estimated through the DEPM), and catch-per-unit-effort and catch-at-age data12–13,18. Estimates of spawning biomass obtained using the DEPM are shown in Figure 3. The current spawning biomass is approximately 200 000 t13, which is above the lower limit reference point of 150 000 t identified in the Sardine Fishery (South Australia) harvest strategy (Figure 3). The exploitation rate (i.e. catch/spawning biomass) is also below the upper limit reference point of 30 per cent (Figure 4). The biological stock is not considered to be recruitment overfished. Recent annual catches of approximately 34 000 t equate to an exploitation rate of approximately 17 per cent. This level of fishing mortality is below the limit reference point and unlikely to cause the biological stock to become recruitment overfished (Figure 4).
On the basis of the evidence provided above, the southern Australian Sardine biological stock is classified as a sustainable stock.
Western Australian west coast biological stock
Population modelling, based on spawning biomass estimates (from the DEPM), and catch-at-age and catch data19 suggest that exploitation rates since the late 2000s for the Western Australian west coast biological stock are less than 10 per cent (2328 t from an estimated spawning biomass of approximately 25 000 t)20. The biological stock is not considered to be recruitment overfished. This level of fishing mortality is below the limit reference point and is unlikely to cause the biological stock to become recruitment overfished.
On the basis of the evidence provided above, the Western Australian west coast biological stock of Australian Sardine is classified as a sustainable stock.
Western Australian south coast biological stock
Population modelling based on spawning biomass estimates (from the DEPM), and catch-at-age and catch data19 suggest that exploitation rates since the late 2000s for the Western Australian south coast stock are around 3 per cent (<3000 t from an estimated spawning biomass of approximately 97 000 t)20. The stock is not considered to be recruitment overfished. This level of fishing mortality is below the limit reference point and unlikely to cause the biological stock to become recruitment overfished.
On the basis of the evidence provided above, the Western Australian south coast biological stock of Australian Sardine is classified as a sustainable stock.
Table 2: Australian Sardine biology1,16
Longevity and maximum size 9 years; 20–25 cm SL
Maturity (50%) 1–2 years; 14.5 cm SL
SL = standard length
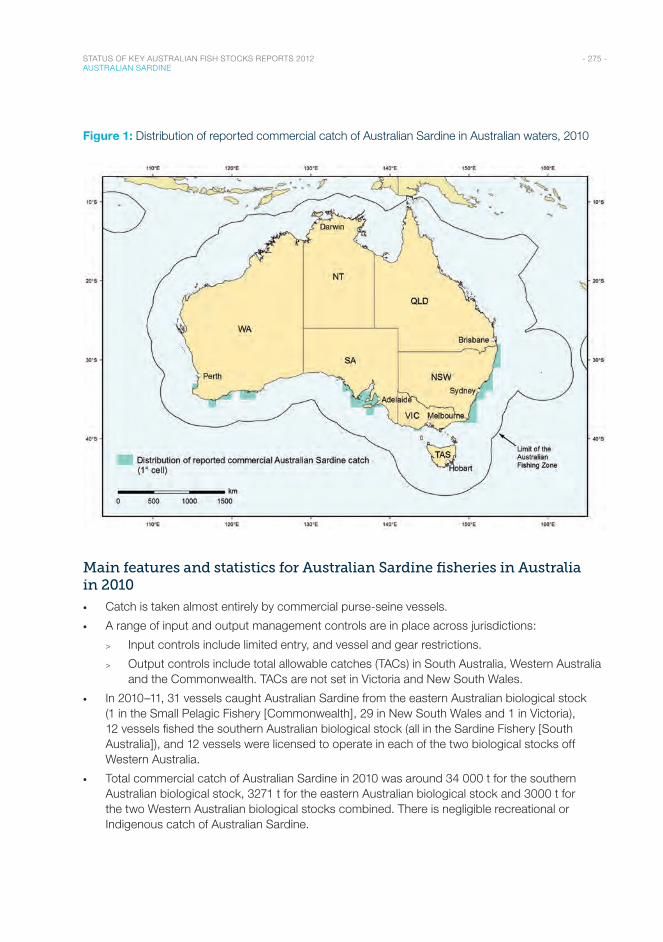
- 275 - STATUS OF KEY AUSTRALIAN FISH STOCKS REPORTS 2012 AUSTRALIAN SARDINE
Figure 1: Distribution of reported commercial catch of Australian Sardine in Australian waters, 2010
Main features and statistics for Australian Sardine fisheries in Australia in 2010
• Catch is taken almost entirely by commercial purse-seine vessels.
• A range of input and output management controls are in place across jurisdictions:
> Input controls include limited entry, and vessel and gear restrictions.
> Output controls include total allowable catches (TACs) in South Australia, Western Australia and the Commonwealth. TACs are not set in Victoria and New South Wales.
• In 2010–11, 31 vessels caught Australian Sardine from the eastern Australian biological stock (1 in the Small Pelagic Fishery [Commonwealth], 29 in New South Wales and 1 in Victoria), 12 vessels fished the southern Australian biological stock (all in the Sardine Fishery [South Australia]), and 12 vessels were licensed to operate in each of the two biological stocks off Western Australia.
• Total commercial catch of Australian Sardine in 2010 was around 34 000 t for the southern Australian biological stock, 3271 t for the eastern Australian biological stock and 3000 t for the two Western Australian biological stocks combined. There is negligible recreational or Indigenous catch of Australian Sardine.
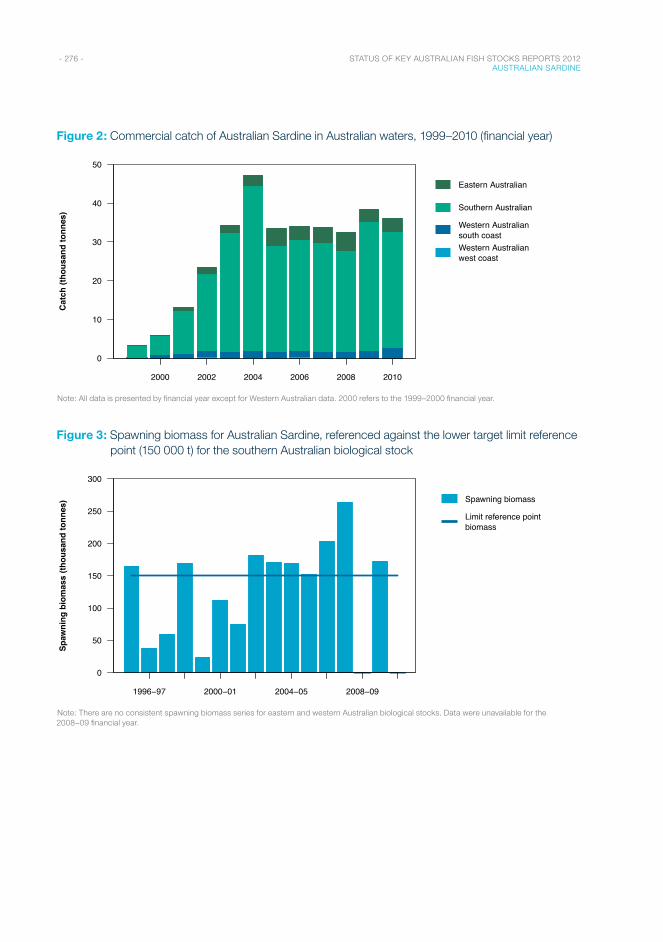
- 276 - STATUS OF KEY AUSTRALIAN FISH STOCKS REPORTS 2012 AUSTRALIAN SARDINE
Figure 2: Commercial catch of Australian Sardine in Australian waters, 1999–2010 (financial year)
Year
2000 2002 2004 2006 2008 2010
0
10
20
30
40
50
Eastern Australian
Southern Australian
Western Australiansouth coastWestern Australianwest coast
Cat
ch (t
hous
and
tonn
es)
Note: All data is presented by financial year except for Western Australian data. 2000 refers to the 1999–2000 financial year.
Figure 3: Spawning biomass for Australian Sardine, referenced against the lower target limit reference point (150 000 t) for the southern Australian biological stock
Financial Year
1996−97 2000−01 2004−05 2008−09
0
50
100
150
200
250
300
Spawning biomass
Limit reference pointbiomass
Spaw
ning
bio
mas
s (th
ousa
nd to
nnes
)
Note: There are no consistent spawning biomass series for eastern and western Australian biological stocks. Data were unavailable for the 2008–09 financial year.
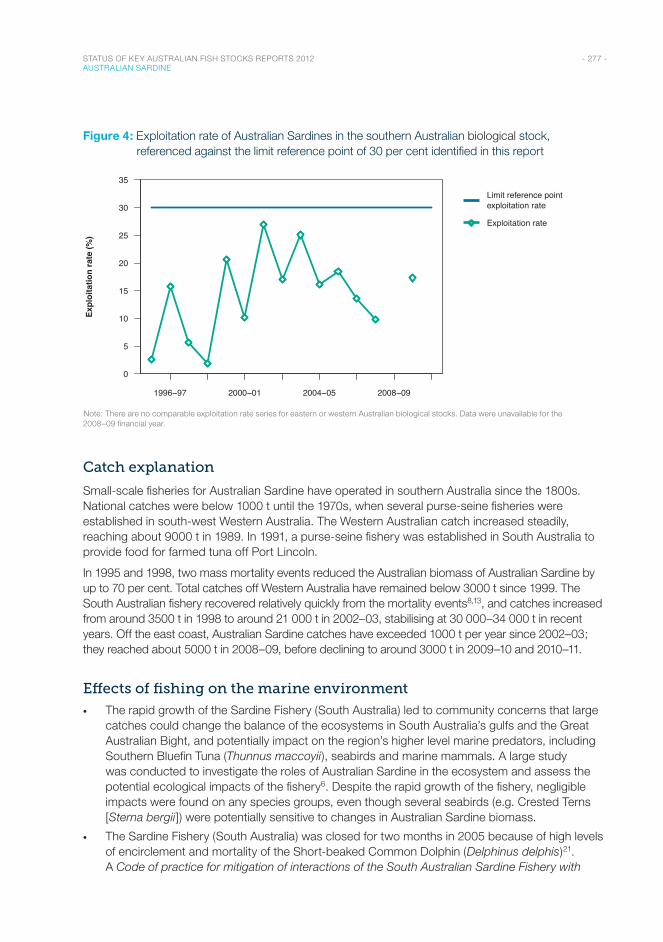
- 277 - STATUS OF KEY AUSTRALIAN FISH STOCKS REPORTS 2012 AUSTRALIAN SARDINE
Figure 4: Exploitation rate of Australian Sardines in the southern Australian biological stock, referenced against the limit reference point of 30 per cent identified in this report
Financial Year
1996−97 2000−01 2004−05 2008−09
0
5
10
15
20
25
30
35
Limit reference pointexploitation rate
Exploitation rate
Expl
oita
tion
rate
(%)
Note: There are no comparable exploitation rate series for eastern or western Australian biological stocks. Data were unavailable for the 2008–09 financial year.
Catch explanation
Small-scale fisheries for Australian Sardine have operated in southern Australia since the 1800s. National catches were below 1000 t until the 1970s, when several purse-seine fisheries were established in south-west Western Australia. The Western Australian catch increased steadily, reaching about 9000 t in 1989. In 1991, a purse-seine fishery was established in South Australia to provide food for farmed tuna off Port Lincoln.
In 1995 and 1998, two mass mortality events reduced the Australian biomass of Australian Sardine by up to 70 per cent. Total catches off Western Australia have remained below 3000 t since 1999. The South Australian fishery recovered relatively quickly from the mortality events8,13, and catches increased from around 3500 t in 1998 to around 21 000 t in 2002–03, stabilising at 30 000–34 000 t in recent years. Off the east coast, Australian Sardine catches have exceeded 1000 t per year since 2002–03; they reached about 5000 t in 2008–09, before declining to around 3000 t in 2009–10 and 2010–11.
Effects of fishing on the marine environment
• The rapid growth of the Sardine Fishery (South Australia) led to community concerns that large catches could change the balance of the ecosystems in South Australia’s gulfs and the Great Australian Bight, and potentially impact on the region’s higher level marine predators, including Southern Bluefin Tuna (Thunnus maccoyii), seabirds and marine mammals. A large study was conducted to investigate the roles of Australian Sardine in the ecosystem and assess the potential ecological impacts of the fishery6. Despite the rapid growth of the fishery, negligible impacts were found on any species groups, even though several seabirds (e.g. Crested Terns [Sterna bergii]) were potentially sensitive to changes in Australian Sardine biomass.
• The Sardine Fishery (South Australia) was closed for two months in 2005 because of high levels of encirclement and mortality of the Short-beaked Common Dolphin (Delphinus delphis)21. A Code of practice for mitigation of interactions of the South Australian Sardine Fishery with
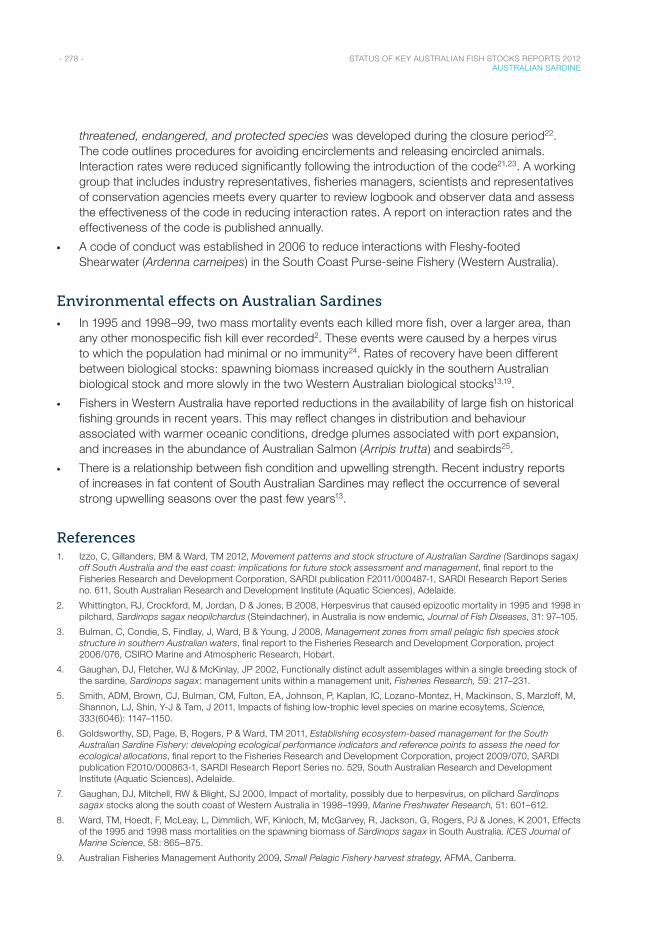
- 278 - STATUS OF KEY AUSTRALIAN FISH STOCKS REPORTS 2012 AUSTRALIAN SARDINE
threatened, endangered, and protected species was developed during the closure period22. The code outlines procedures for avoiding encirclements and releasing encircled animals. Interaction rates were reduced significantly following the introduction of the code21,23. A working group that includes industry representatives, fisheries managers, scientists and representatives of conservation agencies meets every quarter to review logbook and observer data and assess the effectiveness of the code in reducing interaction rates. A report on interaction rates and the effectiveness of the code is published annually.
• A code of conduct was established in 2006 to reduce interactions with Fleshy-footed Shearwater (Ardenna carneipes) in the South Coast Purse-seine Fishery (Western Australia).
Environmental effects on Australian Sardines
• In 1995 and 1998–99, two mass mortality events each killed more fish, over a larger area, than any other monospecific fish kill ever recorded2. These events were caused by a herpes virus to which the population had minimal or no immunity24. Rates of recovery have been different between biological stocks: spawning biomass increased quickly in the southern Australian biological stock and more slowly in the two Western Australian biological stocks13,19.
• Fishers in Western Australia have reported reductions in the availability of large fish on historical fishing grounds in recent years. This may reflect changes in distribution and behaviour associated with warmer oceanic conditions, dredge plumes associated with port expansion, and increases in the abundance of Australian Salmon (Arripis trutta) and seabirds25.
• There is a relationship between fish condition and upwelling strength. Recent industry reports of increases in fat content of South Australian Sardines may reflect the occurrence of several strong upwelling seasons over the past few years13.
References1. Izzo, C, Gillanders, BM & Ward, TM 2012, Movement patterns and stock structure of Australian Sardine (Sardinops sagax)
off South Australia and the east coast: implications for future stock assessment and management, final report to the Fisheries Research and Development Corporation, SARDI publication F2011/000487-1, SARDI Research Report Series no. 611, South Australian Research and Development Institute (Aquatic Sciences), Adelaide.
2. Whittington, RJ, Crockford, M, Jordan, D & Jones, B 2008, Herpesvirus that caused epizootic mortality in 1995 and 1998 in pilchard, Sardinops sagax neopilchardus (Steindachner), in Australia is now endemic, Journal of Fish Diseases, 31: 97–105.
3. Bulman, C, Condie, S, Findlay, J, Ward, B & Young, J 2008, Management zones from small pelagic fish species stock structure in southern Australian waters, final report to the Fisheries Research and Development Corporation, project 2006/076, CSIRO Marine and Atmospheric Research, Hobart.
4. Gaughan, DJ, Fletcher, WJ & McKinlay, JP 2002, Functionally distinct adult assemblages within a single breeding stock of the sardine, Sardinops sagax: management units within a management unit, Fisheries Research, 59: 217–231.
5. Smith, ADM, Brown, CJ, Bulman, CM, Fulton, EA, Johnson, P, Kaplan, IC, Lozano-Montez, H, Mackinson, S, Marzloff, M, Shannon, LJ, Shin, Y-J & Tam, J 2011, Impacts of fishing low-trophic level species on marine ecosytems, Science, 333(6046): 1147–1150.
6. Goldsworthy, SD, Page, B, Rogers, P & Ward, TM 2011, Establishing ecosystem-based management for the South Australian Sardine Fishery: developing ecological performance indicators and reference points to assess the need for ecological allocations, final report to the Fisheries Research and Development Corporation, project 2009/070, SARDI publication F2010/000863-1, SARDI Research Report Series no. 529, South Australian Research and Development Institute (Aquatic Sciences), Adelaide.
7. Gaughan, DJ, Mitchell, RW & Blight, SJ 2000, Impact of mortality, possibly due to herpesvirus, on pilchard Sardinops sagax stocks along the south coast of Western Australia in 1998–1999, Marine Freshwater Research, 51: 601–612.
8. Ward, TM, Hoedt, F, McLeay, L, Dimmlich, WF, Kinloch, M, McGarvey, R, Jackson, G, Rogers, PJ & Jones, K 2001, Effects of the 1995 and 1998 mass mortalities on the spawning biomass of Sardinops sagax in South Australia, ICES Journal of Marine Science, 58: 865–875.
9. Australian Fisheries Management Authority 2009, Small Pelagic Fishery harvest strategy, AFMA, Canberra.
- 279 - STATUS OF KEY AUSTRALIAN FISH STOCKS REPORTS 2012 AUSTRALIAN SARDINE
10. Shanks, S 2005, Management plan for the South Australian Pilchard Fishery, South Australian Fisheries Management Series Paper 47, Primary Industries and Resources South Australia, Adelaide.
11. Gaughan, DJ, Mitchell, RWD, Leary, TI & Wright, IW 2004, A sudden collapse in distribution of Pacific sardine (Sardinops sagax) in southwestern Australia enables an objective re-assessment of biomass estimates, Fishery Bulletin, 102: 617–633.
12. Ward, TM, Burch, P, McLeay, LJ & Ivey, AR 2011a, Use of the daily egg production method for stock assessment of sardine, Sardinops sagax; lessons learnt over a decade of application off southern Australia, Reviews in Fisheries Science: 19(1): 1–20.
13. Ward, TM, Ivey, AR & Burch, P 2011b, Spawning biomass of sardine, Sardinops sagax, in waters off South Australia in 2011, final report to PIRSA Fisheries, SARDI publication F2007/000566-4, SARDI Research Report Series no. 584, South Australian Research and Development Institute (Aquatic Sciences), Adelaide.
14. Staunton Smith, J & Ward, T 2000, Stock assessment of pelagic bait fishes in Southern Queensland with special reference to pilchards (Sardinops sagax). Final report to the Fisheries Research and Development Corporation, projects 95/043 and 98/130, Department of Primary Industries, Queensland, Australia.
15. Ward, TM & Rogers, PJ 2007, Development and evaluation of egg-based stock assessment methods for blue mackerel, Scomber australisicus, in southern Australia, final report to the Fisheries Research and Development Corporation, project 2002/061, SARDI Aquatic Sciences, Adelaide.
16. Stewart, J, Ballinger, G & Ferrell, D 2010, Review of the biology and fishery for Australian sardines (Sardinops sagax) in New South Wales—2010, Industry & Investment NSW, Cronulla.
17. Ward, TM, Lyle, J, Keane, JP, Begg, G, Hobsbawn, P, Ivey, I, Sakabe, R & Steer, MA 2012, Commonwealth Small Pelagic Fishery: fishery assessment report 2011, report to the Australian Fisheries Management Authority, SARDI publication 3, SARDI Research Report Series no. 614, South Australian Research and Development Institute (Aquatic Sciences), Adelaide.
18. Ward, TM, Burch, P & Ivey, AR 2010, South Australian Sardine (Sardinops sagax) Fishery: stock assessment report 2010, report to PIRSA Fisheries, SARDI publication F2007/000765-3, SARDI Report Series no. 496, South Australian Research and Development Institute (Aquatic Sciences), Adelaide.
19. Gaughan, DJ, Craine, M, Stephenson, P, Leary, T & Lewis, P 2008, Regrowth of pilchard (Sardinops sagax) stocks off southern WA following the mass mortality event of 1989/99, final report to the Fisheries Research and Development Corporation, project 2000/135, Fisheries Research Report 176, Western Australian Department of Fisheries, Perth.
20. Fletcher, WJ & Santoro, K 2011, State of the fisheries and aquatic resources report 2009/10, Department of Fisheries, Western Australia.
21. Hamer, DJ, Ward, TM & McGarvey, R 2008, Measurement, management and mitigation of operational interactions between the South Australian Sardine Fishery and short-beaked common dolphins (Delphinus delphis), Biological Conservation, 141: 2865–2878.
22. South Australian Sardine Industry Association 2012, Code of practice for mitigation of interactions of the South Australian Sardine Fishery with threatened, endangered, and protected species, South Australian Sardine Industry Association, Port Lincoln, www.sasardines.com.au/links-resources.html.
23. Ward, TM, Ivey, A, Hamer, DJ & Burch, P 2011, Effectiveness of an industry code of practice in mitigating the operational interactions of the South Australian Sardine Fishery with the short-beaked common dolphin (Delphinus delphis), SARDI publication F2010/000726-2, SARDI Research Report Series no. 583, South Australian Research and Development Institute (Aquatic Sciences), Adelaide.
24. Jones, JB, Hyatt, AD, Hine, PM, Whittington, RJ, Griffin, DA & Bax, NJ 1997, Australasian pilchard mortalities, World Journal of microbiology and biotechnology, 13(4): 383–392.
25. Muhling, BA, Beckley, LE, Gaughan, DJ, Jones, C, Miskiewicz, AG & Hesp, A 2008, Spawning, larval abundance and growth rate of Sardinops sagax off southwestern Australia: influence of an anomalous eastern boundary current, Marine Ecology Progress Series, 364: 157–167.
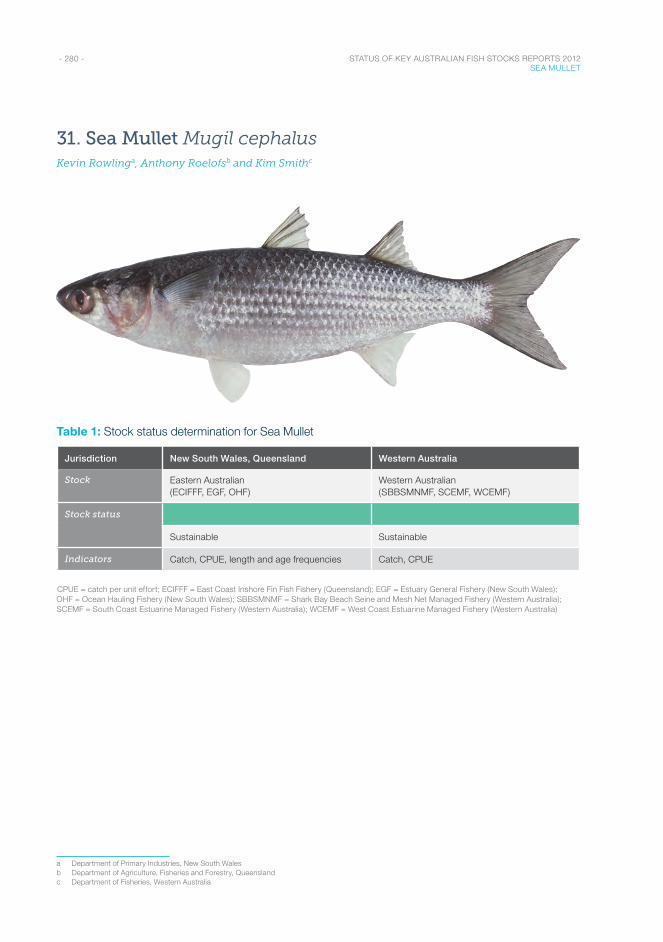
- 280 - STATUS OF KEY AUSTRALIAN FISH STOCKS REPORTS 2012 SEA MULLET
31. Sea Mullet Mugil cephalusKevin Rowlinga, Anthony Roelofsb and Kim Smithc
Table 1: Stock status determination for Sea Mullet
Jurisdiction New South Wales, Queensland Western Australia
Stock Eastern Australian (ECIFFF, EGF, OHF)
Western Australian (SBBSMNMF, SCEMF, WCEMF)
Stock status
Sustainable Sustainable
Indicators Catch, CPUE, length and age frequencies Catch, CPUE
CPUE = catch per unit effort; ECIFFF = East Coast Inshore Fin Fish Fishery (Queensland); EGF = Estuary General Fishery (New South Wales); OHF = Ocean Hauling Fishery (New South Wales); SBBSMNMF = Shark Bay Beach Seine and Mesh Net Managed Fishery (Western Australia); SCEMF = South Coast Estuarine Managed Fishery (Western Australia); WCEMF = West Coast Estuarine Managed Fishery (Western Australia)
a Department of Primary Industries, New South Walesb Department of Agriculture, Fisheries and Forestry, Queenslandc Department of Fisheries, Western Australia
- 281 - STATUS OF KEY AUSTRALIAN FISH STOCKS REPORTS 2012 SEA MULLET
Stock structure
Results of extensive tagging studies1 suggest a single east coast biological stock of Sea Mullet, extending from central Queensland to eastern Victoria. The biological stock structure of Sea Mullet off Western Australia is likely to be complex, although limited tagging and genetic studies2–3 suggest mixing of fish throughout the lower west coast region, where the majority of the catch is taken. Therefore, a single Western Australian biological stock is assumed here. Status for Sea Mullet is reported at the level of individual biological stocks.
Stock status
Eastern Australian biological stock
The eastern Australian biological stock has a long history of relatively stable commercial landings and catch rates for estuary and ocean fisheries in both New South Wales and Queensland4–5. Length and age composition of catches is regularly monitored, and results suggest consistent recruitment and age composition during recent years4–5. Sea Mullet are relatively fast-growing fish, with the majority of landings comprising fish between 2 and 5 years of age. This evidence indicates that the biomass of this biological stock is unlikely to be recruitment overfished. Recent commercial landings have been close to the long-term average catch, since the 1940s, of 4957 tonnes (t)4–5. This evidence indicates that the current level of fishing mortality is unlikely to cause the biological stock to become recruitment overfished.
On the basis of the evidence provided above, the biological stock is classified as a sustainable stock.
Western Australian biological stock
Sea Mullet occurs in all coastal regions of Western Australia, but commercial targeting of the species is mainly restricted to waters from Shark Bay southwards. Sea Mullet is managed separately in the four Western Australian bioregions, although the level of connectivity between the different populations is unknown6. The level of fishery assessment for Sea Mullet is determined by a risk assessment, based on trends in commercial catches and catch rates. Catch rates were relatively stable over the period 1980–2000, and have increased slightly since 20006. The available evidence indicates that this biological stock is unlikely to be recruitment overfished.
On the basis of the evidence provided above, the biological stock is classified as a sustainable stock.
Table 2: Sea Mullet biology7–8
Longevity and maximum size Eastern Australia: 10 years; 60 cm FL
Western Australia: males 8 years; females 12 years
Maturity (50%) Eastern Australia: males 33 cm FL; females 37 cm FL
Western Australia: both sexes 37 cm TL
FL = fork length; TL = total length
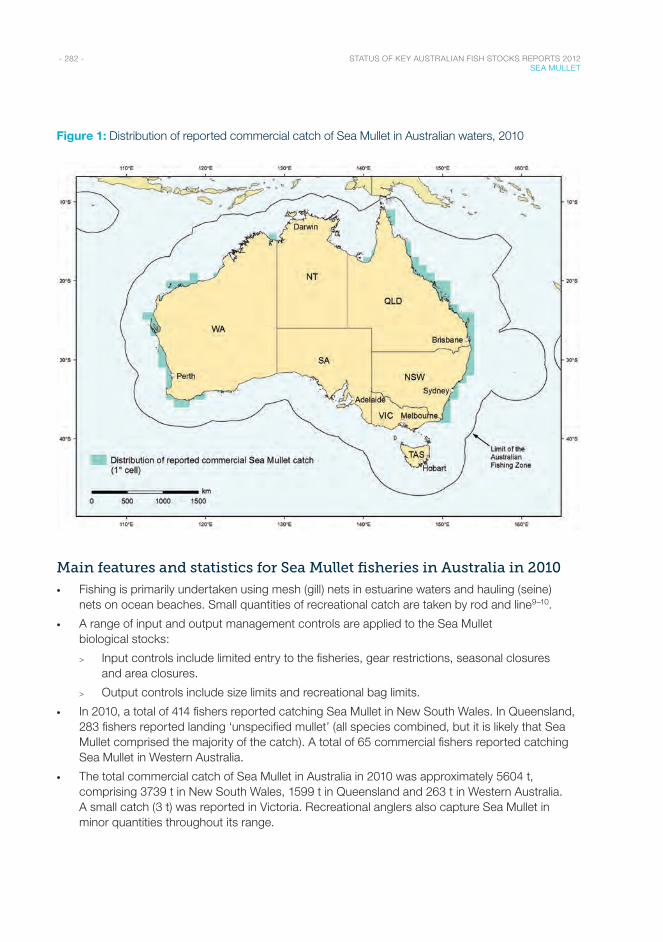
- 282 - STATUS OF KEY AUSTRALIAN FISH STOCKS REPORTS 2012 SEA MULLET
Figure 1: Distribution of reported commercial catch of Sea Mullet in Australian waters, 2010
Main features and statistics for Sea Mullet fisheries in Australia in 2010
• Fishing is primarily undertaken using mesh (gill) nets in estuarine waters and hauling (seine) nets on ocean beaches. Small quantities of recreational catch are taken by rod and line9–10.
• A range of input and output management controls are applied to the Sea Mullet biological stocks:
> Input controls include limited entry to the fisheries, gear restrictions, seasonal closures and area closures.
> Output controls include size limits and recreational bag limits.
• In 2010, a total of 414 fishers reported catching Sea Mullet in New South Wales. In Queensland, 283 fishers reported landing ‘unspecified mullet’ (all species combined, but it is likely that Sea Mullet comprised the majority of the catch). A total of 65 commercial fishers reported catching Sea Mullet in Western Australia.
• The total commercial catch of Sea Mullet in Australia in 2010 was approximately 5604 t, comprising 3739 t in New South Wales, 1599 t in Queensland and 263 t in Western Australia. A small catch (3 t) was reported in Victoria. Recreational anglers also capture Sea Mullet in minor quantities throughout its range.
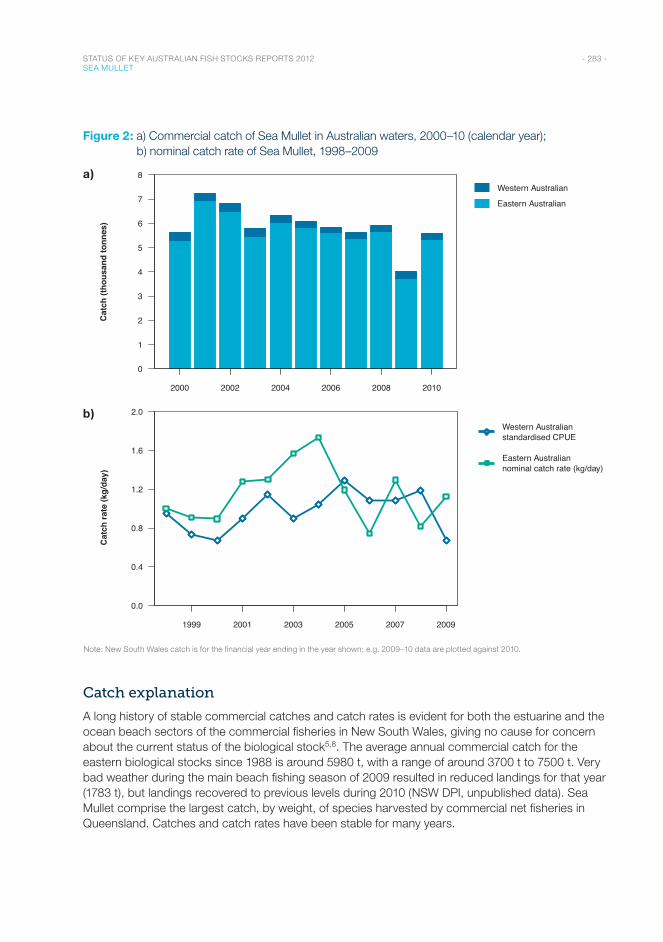
- 283 - STATUS OF KEY AUSTRALIAN FISH STOCKS REPORTS 2012 SEA MULLET
Figure 2: a) Commercial catch of Sea Mullet in Australian waters, 2000–10 (calendar year); b) nominal catch rate of Sea Mullet, 1998–2009
a)
Year
2000 2002 2004 2006 2008 2010
0
1
2
3
4
5
6
7
8Western Australian
Eastern Australian
Cat
ch (t
hous
and
tonn
es)
b)
Year
1999 2001 2003 2005 2007 2009
0.0
0.4
0.8
1.2
1.6
2.0
Western Australianstandardised CPUE
Eastern Australiannominal catch rate (kg/day)
Cat
ch ra
te (k
g/da
y)
Note: New South Wales catch is for the financial year ending in the year shown; e.g. 2009–10 data are plotted against 2010.
Catch explanation
A long history of stable commercial catches and catch rates is evident for both the estuarine and the ocean beach sectors of the commercial fisheries in New South Wales, giving no cause for concern about the current status of the biological stock5,8. The average annual commercial catch for the eastern biological stocks since 1988 is around 5980 t, with a range of around 3700 t to 7500 t. Very bad weather during the main beach fishing season of 2009 resulted in reduced landings for that year (1783 t), but landings recovered to previous levels during 2010 (NSW DPI, unpublished data). Sea Mullet comprise the largest catch, by weight, of species harvested by commercial net fisheries in Queensland. Catches and catch rates have been stable for many years.
- 284 - STATUS OF KEY AUSTRALIAN FISH STOCKS REPORTS 2012 SEA MULLET
In Western Australia, landings of Sea Mullet have recently been lower than historical levels, due to lower levels of targeted commercial fishing effort6. Sea Mullet is taken by ‘multispecies’ net fisheries, and the quantity caught can be influenced by the availability of higher value species and market demand, as well as Sea Mullet abundance. Annual catch declined from 500–700 t in the 1970s and 1980s to around 200–300 t in recent years, as a result of reduced fishing effort.
Effects of fishing on the marine environment
• No effects have been identified.
Environmental effects on Sea Mullet
• Sea Mullet penetrate far up rivers, often into fresh water, and barriers to fish passage (such as weirs and dams) can reduce the amount of habitat available to the species.
• Being highly dependent on riverine and estuarine habitats, Sea Mullet populations are vulnerable to fluctuations in water quality—eutrophication and hypoxia can cause significant fish kills.
References1. Kesteven, GL 1953, Further results of tagging sea mullet, Mugil cephalus Linnaeus on the eastern Australian coast,
Australian Journal of Marine and Freshwater Research, 4: 251–306.
2. Thomson, JM 1951, Growth and habits of the sea mullet, Mugil dobula Gunther, in Western Australia, Australian Journal of Marine and Freshwater Research, 2: 193–225.
3. Watts, RJ & Johnson, MS 2004, Estuaries, lagoons and enclosed embayments: habitats that enhance subdivision of inshore fishes, Marine and Freshwater Research, 55: 641–651.
4. Queensland Department of Employment, Economic Development and Innovation 2011, Stock status of Queensland’s fisheries resources 2011, DEEDI, Brisbane.
5. Rowling, K, Hegarty, A & Ives, M 2010, Status of fisheries resources in NSW 2008/09, Industry & Investment NSW, Cronulla.
6. Fletcher, WJ & Santoro, K (eds), 2011, State of the fisheries and aquatic resources report 2010/11, Western Australian Department of Fisheries, Perth.
7. Gaughan, D, Ayvazian, S, Nowara, G, Craine, M & Brown, J 2006, The development of a rigorous sampling program for a long-term annual index of recruitment for finfish species from south-western Australia, final report, Fisheries Research and Development Corporation project 1999/153, Fisheries Research Report 154, Western Australian Department of Fisheries, Perth.
8. Smith, KA & Deguara, KL 2002, Review of biological information and stock assessment for the NSW sea mullet resource, NSW Fisheries Resource Assessment Series no. 12, NSW Fisheries, Cronulla.
9. Henry, GW & Lyle, JM 2003, The national recreational and indigenous fishing survey, Fisheries Research Development Corporation project 99/158, Australian Government Department of Agriculture, Fisheries and Forestry, Canberra, http://eprints.utas.edu.au/2526/1/Henry_Lyle_Nationalsurvey.pdf.
10. McInnes, K 2008, Experimental results from the fourth Queensland recreational fishing diary program (2005), Queensland Department of Primary Industries and Fisheries, Brisbane.
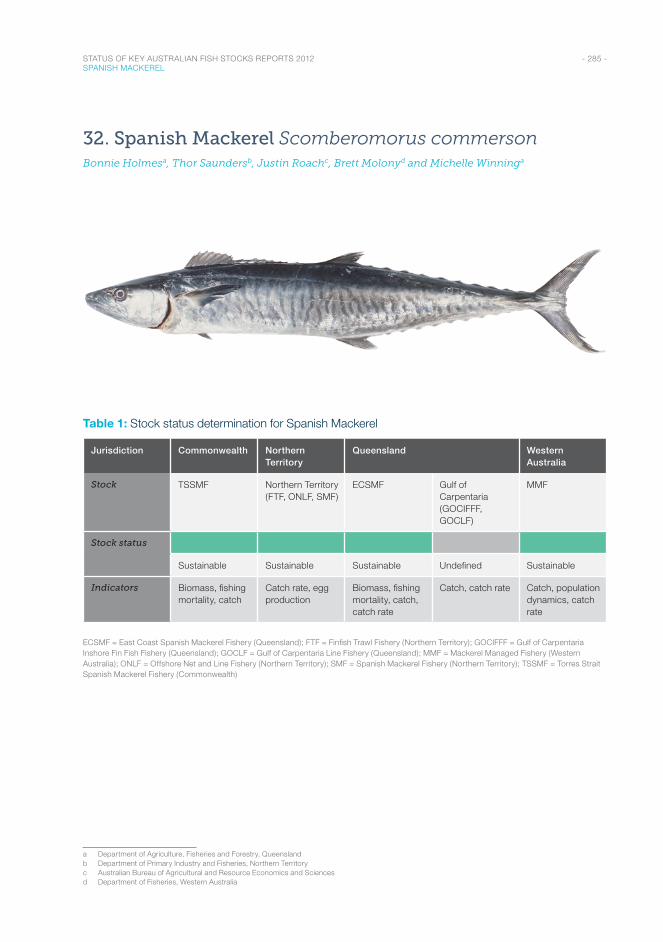
- 285 - STATUS OF KEY AUSTRALIAN FISH STOCKS REPORTS 2012 SPANISH MACKEREL
32. Spanish Mackerel Scomberomorus commersonBonnie Holmesa, Thor Saundersb, Justin Roachc, Brett Molonyd and Michelle Winninga
Table 1: Stock status determination for Spanish Mackerel
Jurisdiction Commonwealth Northern Territory
Queensland Western Australia
Stock TSSMF Northern Territory (FTF, ONLF, SMF)
ECSMF Gulf of Carpentaria (GOCIFFF, GOCLF)
MMF
Stock status
Sustainable Sustainable Sustainable Undefined Sustainable
Indicators Biomass, fishing mortality, catch
Catch rate, egg production
Biomass, fishing mortality, catch, catch rate
Catch, catch rate Catch, population dynamics, catch rate
ECSMF = East Coast Spanish Mackerel Fishery (Queensland); FTF = Finfish Trawl Fishery (Northern Territory); GOCIFFF = Gulf of Carpentaria Inshore Fin Fish Fishery (Queensland); GOCLF = Gulf of Carpentaria Line Fishery (Queensland); MMF = Mackerel Managed Fishery (Western Australia); ONLF = Offshore Net and Line Fishery (Northern Territory); SMF = Spanish Mackerel Fishery (Northern Territory); TSSMF = Torres Strait Spanish Mackerel Fishery (Commonwealth)
a Department of Agriculture, Fisheries and Forestry, Queenslandb Department of Primary Industry and Fisheries, Northern Territoryc Australian Bureau of Agricultural and Resource Economics and Sciencesd Department of Fisheries, Western Australia
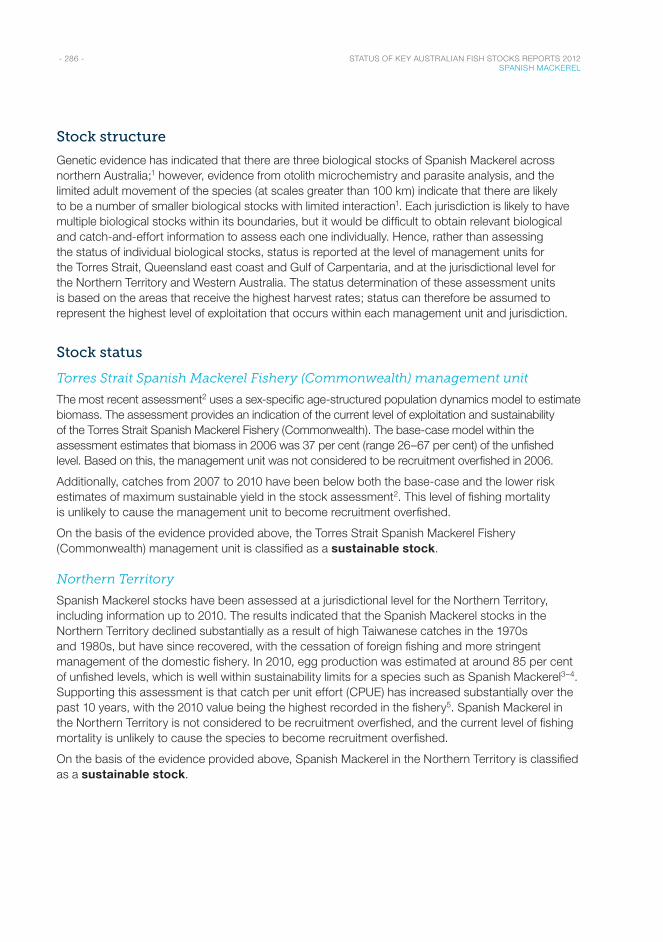
- 286 - STATUS OF KEY AUSTRALIAN FISH STOCKS REPORTS 2012 SPANISH MACKEREL
Stock structure
Genetic evidence has indicated that there are three biological stocks of Spanish Mackerel across northern Australia;1 however, evidence from otolith microchemistry and parasite analysis, and the limited adult movement of the species (at scales greater than 100 km) indicate that there are likely to be a number of smaller biological stocks with limited interaction1. Each jurisdiction is likely to have multiple biological stocks within its boundaries, but it would be difficult to obtain relevant biological and catch-and-effort information to assess each one individually. Hence, rather than assessing the status of individual biological stocks, status is reported at the level of management units for the Torres Strait, Queensland east coast and Gulf of Carpentaria, and at the jurisdictional level for the Northern Territory and Western Australia. The status determination of these assessment units is based on the areas that receive the highest harvest rates; status can therefore be assumed to represent the highest level of exploitation that occurs within each management unit and jurisdiction.
Stock status
Torres Strait Spanish Mackerel Fishery (Commonwealth) management unit
The most recent assessment2 uses a sex-specific age-structured population dynamics model to estimate biomass. The assessment provides an indication of the current level of exploitation and sustainability of the Torres Strait Spanish Mackerel Fishery (Commonwealth). The base-case model within the assessment estimates that biomass in 2006 was 37 per cent (range 26–67 per cent) of the unfished level. Based on this, the management unit was not considered to be recruitment overfished in 2006.
Additionally, catches from 2007 to 2010 have been below both the base-case and the lower risk estimates of maximum sustainable yield in the stock assessment2. This level of fishing mortality is unlikely to cause the management unit to become recruitment overfished.
On the basis of the evidence provided above, the Torres Strait Spanish Mackerel Fishery (Commonwealth) management unit is classified as a sustainable stock.
Northern Territory
Spanish Mackerel stocks have been assessed at a jurisdictional level for the Northern Territory, including information up to 2010. The results indicated that the Spanish Mackerel stocks in the Northern Territory declined substantially as a result of high Taiwanese catches in the 1970s and 1980s, but have since recovered, with the cessation of foreign fishing and more stringent management of the domestic fishery. In 2010, egg production was estimated at around 85 per cent of unfished levels, which is well within sustainability limits for a species such as Spanish Mackerel3–4. Supporting this assessment is that catch per unit effort (CPUE) has increased substantially over the past 10 years, with the 2010 value being the highest recorded in the fishery5. Spanish Mackerel in the Northern Territory is not considered to be recruitment overfished, and the current level of fishing mortality is unlikely to cause the species to become recruitment overfished.
On the basis of the evidence provided above, Spanish Mackerel in the Northern Territory is classified as a sustainable stock.
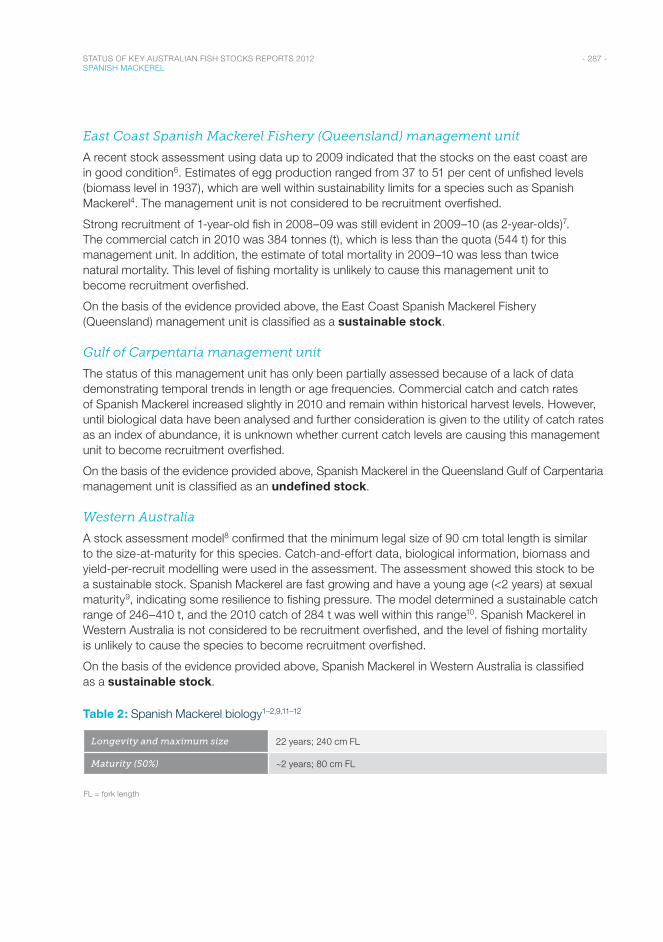
- 287 - STATUS OF KEY AUSTRALIAN FISH STOCKS REPORTS 2012 SPANISH MACKEREL
East Coast Spanish Mackerel Fishery (Queensland) management unit
A recent stock assessment using data up to 2009 indicated that the stocks on the east coast are in good condition6. Estimates of egg production ranged from 37 to 51 per cent of unfished levels (biomass level in 1937), which are well within sustainability limits for a species such as Spanish Mackerel4. The management unit is not considered to be recruitment overfished.
Strong recruitment of 1-year-old fish in 2008–09 was still evident in 2009–10 (as 2-year-olds)7. The commercial catch in 2010 was 384 tonnes (t), which is less than the quota (544 t) for this management unit. In addition, the estimate of total mortality in 2009–10 was less than twice natural mortality. This level of fishing mortality is unlikely to cause this management unit to become recruitment overfished.
On the basis of the evidence provided above, the East Coast Spanish Mackerel Fishery (Queensland) management unit is classified as a sustainable stock.
Gulf of Carpentaria management unit
The status of this management unit has only been partially assessed because of a lack of data demonstrating temporal trends in length or age frequencies. Commercial catch and catch rates of Spanish Mackerel increased slightly in 2010 and remain within historical harvest levels. However, until biological data have been analysed and further consideration is given to the utility of catch rates as an index of abundance, it is unknown whether current catch levels are causing this management unit to become recruitment overfished.
On the basis of the evidence provided above, Spanish Mackerel in the Queensland Gulf of Carpentaria management unit is classified as an undefined stock.
Western Australia
A stock assessment model8 confirmed that the minimum legal size of 90 cm total length is similar to the size-at-maturity for this species. Catch-and-effort data, biological information, biomass and yield-per-recruit modelling were used in the assessment. The assessment showed this stock to be a sustainable stock. Spanish Mackerel are fast growing and have a young age (<2 years) at sexual maturity9, indicating some resilience to fishing pressure. The model determined a sustainable catch range of 246–410 t, and the 2010 catch of 284 t was well within this range10. Spanish Mackerel in Western Australia is not considered to be recruitment overfished, and the level of fishing mortality is unlikely to cause the species to become recruitment overfished.
On the basis of the evidence provided above, Spanish Mackerel in Western Australia is classified as a sustainable stock.
Table 2: Spanish Mackerel biology1–2,9,11–12
Longevity and maximum size 22 years; 240 cm FL
Maturity (50%) ~2 years; 80 cm FL
FL = fork length
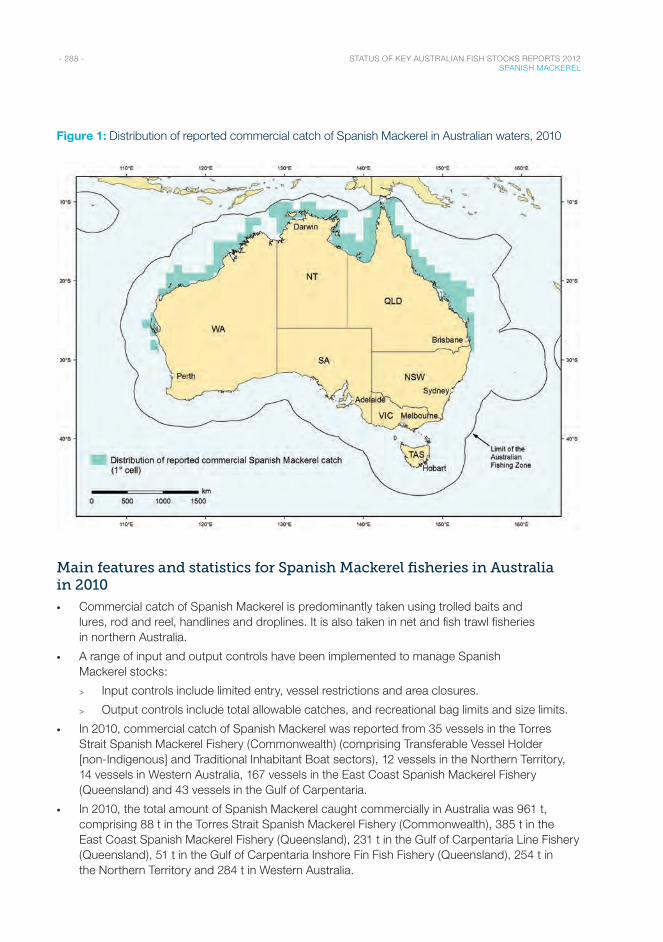
- 288 - STATUS OF KEY AUSTRALIAN FISH STOCKS REPORTS 2012 SPANISH MACKEREL
Figure 1: Distribution of reported commercial catch of Spanish Mackerel in Australian waters, 2010
Main features and statistics for Spanish Mackerel fisheries in Australia in 2010
• Commercial catch of Spanish Mackerel is predominantly taken using trolled baits and lures, rod and reel, handlines and droplines. It is also taken in net and fish trawl fisheries in northern Australia.
• A range of input and output controls have been implemented to manage Spanish Mackerel stocks:
> Input controls include limited entry, vessel restrictions and area closures.
> Output controls include total allowable catches, and recreational bag limits and size limits.
• In 2010, commercial catch of Spanish Mackerel was reported from 35 vessels in the Torres Strait Spanish Mackerel Fishery (Commonwealth) (comprising Transferable Vessel Holder [non-Indigenous] and Traditional Inhabitant Boat sectors), 12 vessels in the Northern Territory, 14 vessels in Western Australia, 167 vessels in the East Coast Spanish Mackerel Fishery (Queensland) and 43 vessels in the Gulf of Carpentaria.
• In 2010, the total amount of Spanish Mackerel caught commercially in Australia was 961 t, comprising 88 t in the Torres Strait Spanish Mackerel Fishery (Commonwealth), 385 t in the East Coast Spanish Mackerel Fishery (Queensland), 231 t in the Gulf of Carpentaria Line Fishery (Queensland), 51 t in the Gulf of Carpentaria Inshore Fin Fish Fishery (Queensland), 254 t in the Northern Territory and 284 t in Western Australia.
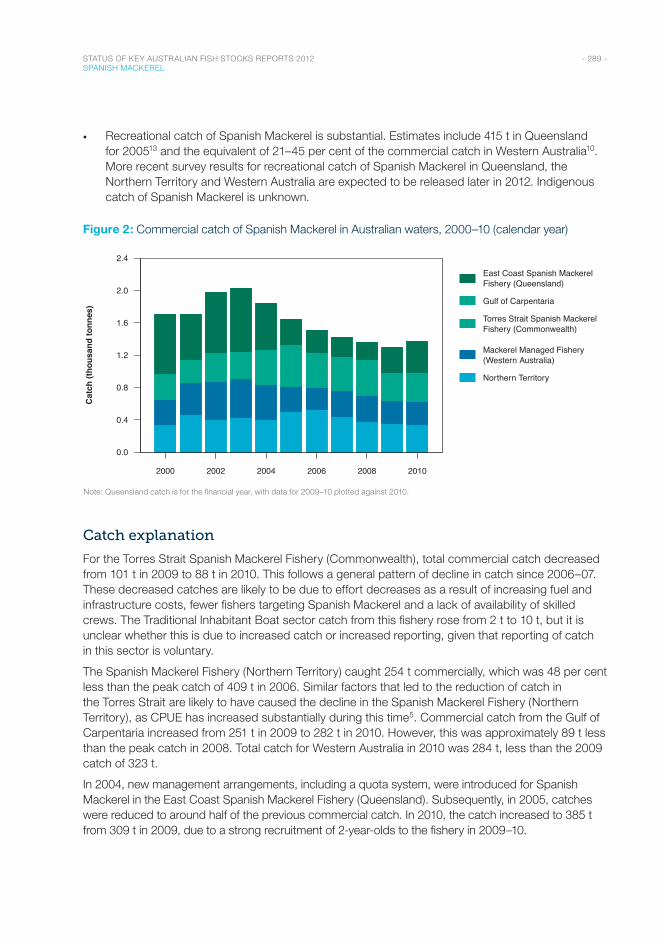
- 289 - STATUS OF KEY AUSTRALIAN FISH STOCKS REPORTS 2012 SPANISH MACKEREL
• Recreational catch of Spanish Mackerel is substantial. Estimates include 415 t in Queensland for 200513 and the equivalent of 21–45 per cent of the commercial catch in Western Australia10. More recent survey results for recreational catch of Spanish Mackerel in Queensland, the Northern Territory and Western Australia are expected to be released later in 2012. Indigenous catch of Spanish Mackerel is unknown.
Figure 2: Commercial catch of Spanish Mackerel in Australian waters, 2000–10 (calendar year)
Year
2000 2002 2004 2006 2008 2010
0.0
0.4
0.8
1.2
1.6
2.0
2.4
East Coast Spanish MackerelFishery (Queensland)
Gulf of Carpentaria
Torres Strait Spanish MackerelFishery (Commonwealth)
Mackerel Managed Fishery(Western Australia)
Northern Territory
Cat
ch (t
hous
and
tonn
es)
Note: Queensland catch is for the financial year, with data for 2009–10 plotted against 2010.
Catch explanation
For the Torres Strait Spanish Mackerel Fishery (Commonwealth), total commercial catch decreased from 101 t in 2009 to 88 t in 2010. This follows a general pattern of decline in catch since 2006–07. These decreased catches are likely to be due to effort decreases as a result of increasing fuel and infrastructure costs, fewer fishers targeting Spanish Mackerel and a lack of availability of skilled crews. The Traditional Inhabitant Boat sector catch from this fishery rose from 2 t to 10 t, but it is unclear whether this is due to increased catch or increased reporting, given that reporting of catch in this sector is voluntary.
The Spanish Mackerel Fishery (Northern Territory) caught 254 t commercially, which was 48 per cent less than the peak catch of 409 t in 2006. Similar factors that led to the reduction of catch in the Torres Strait are likely to have caused the decline in the Spanish Mackerel Fishery (Northern Territory), as CPUE has increased substantially during this time5. Commercial catch from the Gulf of Carpentaria increased from 251 t in 2009 to 282 t in 2010. However, this was approximately 89 t less than the peak catch in 2008. Total catch for Western Australia in 2010 was 284 t, less than the 2009 catch of 323 t.
In 2004, new management arrangements, including a quota system, were introduced for Spanish Mackerel in the East Coast Spanish Mackerel Fishery (Queensland). Subsequently, in 2005, catches were reduced to around half of the previous commercial catch. In 2010, the catch increased to 385 t from 309 t in 2009, due to a strong recruitment of 2-year-olds to the fishery in 2009–10.
- 290 - STATUS OF KEY AUSTRALIAN FISH STOCKS REPORTS 2012 SPANISH MACKEREL
Effects of fishing on the marine environment
• All Spanish Mackerel in Western Australia and most in other jurisdictions are targeted using trolled lines, which have almost no impact on the habitats where they are used, and result in little bycatch, relative to the target species.
• Commercial gillnets interact with threatened, endangered and protected species. Although reported interactions are low, the impact on the populations of these species is unknown.
• An analysis of community structure of finfish in the bioregions in Western Australia14 where mackerel fishing has been undertaken has found no evidence of any significant shift over the past 30 years15.
Environmental effects on Spanish Mackerel
• Warm coastal waters associated with El Niño events are believed to lead to increased primary production, with improvements in larval survival and recruitment (Tobin, unpublished report).
• Marine heatwave events in late 2010 – early 2011 in Western Australia appear to have temporarily shifted distribution of Spanish Mackerel southward16. It is currently unclear if this is a one-off event or a longer term shift in the system (i.e. regime shift).
References1. Buckworth, RC, Newman, SJ, Ovenden, JR, Lester, RJG & McPherson, GR 2007, The stock structure of northern and
western Australian spanish mackerel, final report, Fisheries Research and Development Corporation project 1998/159, Fishery Report 88, Northern Territory Department of Primary Industry, Fisheries and Mines, Australia.
2. Begg, GA, Chen, CCM, O’Neill, MF & Rose, DB 2006, Stock assessment of the Torres Strait Spanish Mackerel Fishery, technical report 66, CRC Reef Research Centre, Townsville.
3. Grubert, MA, Saunders, TM, Martin, JM, Lee, HS & Walters, CJ (in press), Stock assessments of selected Northern Territory fishes, Fishery Report No. 110, Northern Territory Government, Australia.
4. Welch, DJ, Hoyle, SD, Gribble, N & McPherson, G 2002, Preliminary assessment of the East Coast Spanish Mackerel Fishery in Queensland, Queensland Department of Primary Industries, Brisbane.
5. Northern Territory Government 2011, Fishery status reports 2010, Fishery Report 106, Northern Territory Department of Resources, Darwin.
6. Campbell, AB, O’Neill, MF, Staunton-Smith, J, Atfield, J & Kirkwood, J 2012, Stock assessment of the Australian East Coast Spanish Mackerel (Scomberomorus commerson) Fishery, Queensland Department of Employment, Economic Development and Innovation, Brisbane.
7. Queensland Department of Employment, Economic Development and Innovation 2011, Stock status of Queensland’s fisheries resources 2011, DEEDI, Brisbane.
8. Mackie, M, Gaughan, DJ & Buckworth, RC 2003, Stock assessment of narrow-barred Spanish mackerel (Scomberomorus commerson) in Western Australia, final report, Fisheries Research and Development Corporation project 1999/151, Western Australian Department of Fisheries, Perth.
9. McPherson, GR 1993, Reproductive biology of the narrow-barred Spanish mackerel (Scomberomorus commerson Lacepede, 1800) in Queensland waters, Asian Fisheries Science, 6: 169–182.
10. Fletcher, WJ & Santoro, K (eds) 2011, State of the fisheries and aquatic resources report 2010/11, Western Australian Department of Fisheries, Perth.
11. Kailola, PJ, Williams, MJ, Stewart, PC, Reichelt, RE, McNee, A & Grieve, C 1993, Australian fisheries resources, Bureau of Resource Sciences & Fisheries Research and Development Corporation, Canberra.
12. McPherson, GR 1992, Age and growth of the narrow-barred Spanish mackerel (Scomberomorus commerson Lacepede, 1800) in north-eastern Queensland waters, Australian Journal of Marine and Freshwater Research, 43(5): 1269–1282.
13. McInnes, K 2008, Experimental results from the fourth Queensland recreational fishing diary program (2005), Queensland Department of Primary Industries and Fisheries, Brisbane.
14. Fletcher, WJ & Santoro, K (eds), 2011, State of the fisheries and aquatic resources report 2010/11, Western Australian Department of Fisheries, Perth.
15. Hall, NG & Wise, BW 2010, Development of an ecosystem approach to the monitoring and management of Western Australian fisheries, Fisheries Research Report 125, Western Australian Department of Fisheries, Perth.
16. Pearce, A, Lenanton, R, Jackson, G, Moore, J, Feng, M & Gaughan, D 2011, The ‘marine heat wave’ off Western Australia during the summer of 2010/11, Fisheries Research Report 222, Western Australian Department of Fisheries, Perth.

- 291 - STATUS OF KEY AUSTRALIAN FISH STOCKS REPORTS 2012 SPANISH MACKEREL

Finfish : FlatheadDeepwater Flathead / Dusky Flathead / Tiger Flathead
F L AT H E A D A R E N O T E D F O R T H E I R U N U S U A L B O D Y S H A P E . F L AT H E A D A R E B O T T O M - D W E L L I N G
F I N F I S H F O U N D I N A R A N G E O F H A B I TAT S I N B O T H T R O P I C A L A N D T E M P E R AT E W AT E R S .
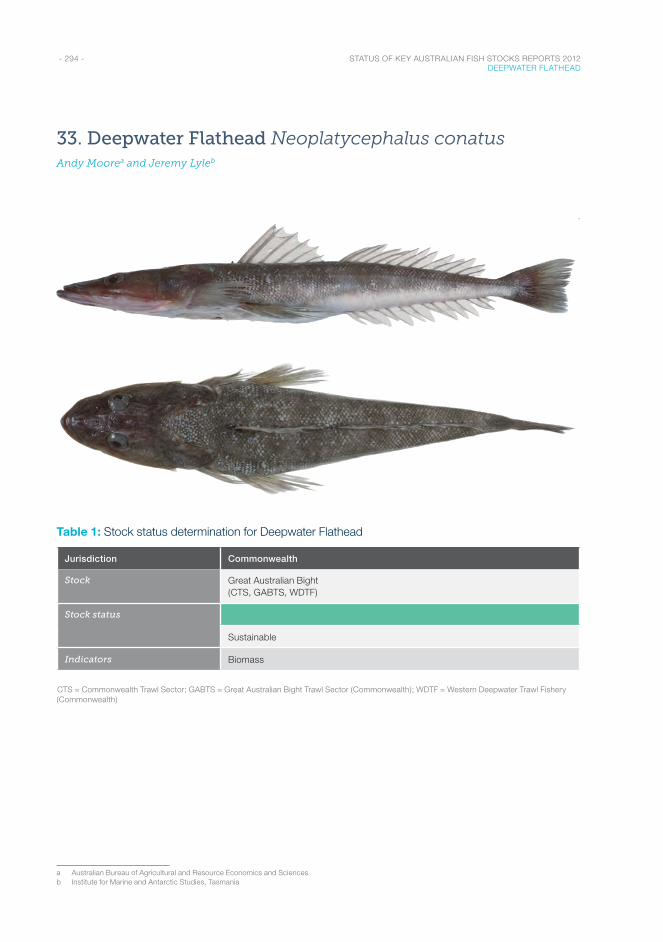
- 294 - STATUS OF KEY AUSTRALIAN FISH STOCKS REPORTS 2012 DEEPWATER FLATHEAD
33. Deepwater Flathead Neoplatycephalus conatusAndy Moorea and Jeremy Lyleb
Table 1: Stock status determination for Deepwater Flathead
Jurisdiction Commonwealth
Stock Great Australian Bight (CTS, GABTS, WDTF)
Stock status
Sustainable
Indicators Biomass
CTS = Commonwealth Trawl Sector; GABTS = Great Australian Bight Trawl Sector (Commonwealth); WDTF = Western Deepwater Trawl Fishery (Commonwealth)
a Australian Bureau of Agricultural and Resource Economics and Sciencesb Institute for Marine and Antarctic Studies, Tasmania
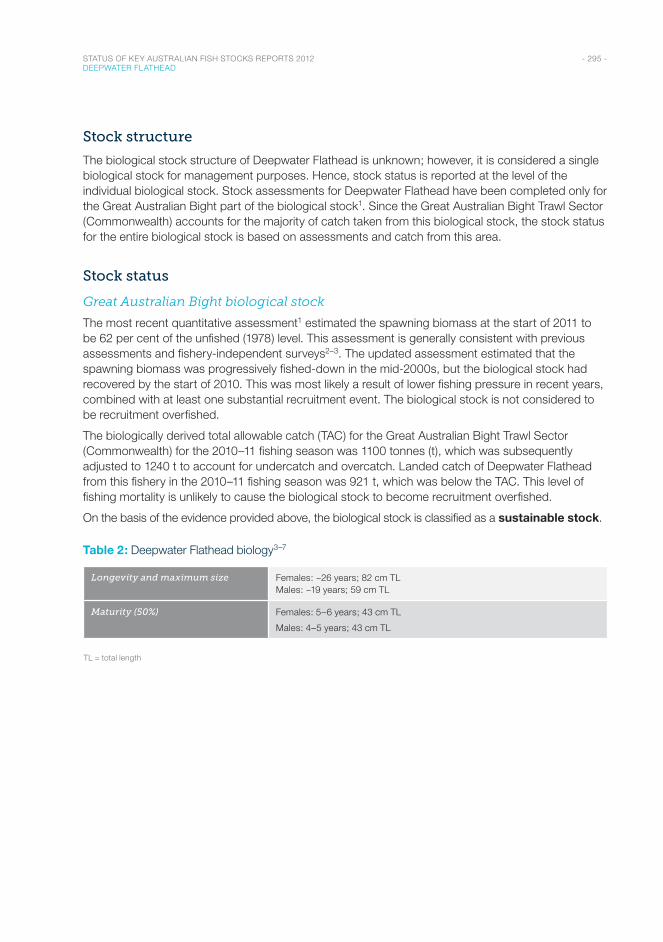
- 295 - STATUS OF KEY AUSTRALIAN FISH STOCKS REPORTS 2012 DEEPWATER FLATHEAD
Stock structure
The biological stock structure of Deepwater Flathead is unknown; however, it is considered a single biological stock for management purposes. Hence, stock status is reported at the level of the individual biological stock. Stock assessments for Deepwater Flathead have been completed only for the Great Australian Bight part of the biological stock1. Since the Great Australian Bight Trawl Sector (Commonwealth) accounts for the majority of catch taken from this biological stock, the stock status for the entire biological stock is based on assessments and catch from this area.
Stock status
Great Australian Bight biological stock
The most recent quantitative assessment1 estimated the spawning biomass at the start of 2011 to be 62 per cent of the unfished (1978) level. This assessment is generally consistent with previous assessments and fishery-independent surveys2–3. The updated assessment estimated that the spawning biomass was progressively fished-down in the mid-2000s, but the biological stock had recovered by the start of 2010. This was most likely a result of lower fishing pressure in recent years, combined with at least one substantial recruitment event. The biological stock is not considered to be recruitment overfished.
The biologically derived total allowable catch (TAC) for the Great Australian Bight Trawl Sector (Commonwealth) for the 2010–11 fishing season was 1100 tonnes (t), which was subsequently adjusted to 1240 t to account for undercatch and overcatch. Landed catch of Deepwater Flathead from this fishery in the 2010–11 fishing season was 921 t, which was below the TAC. This level of fishing mortality is unlikely to cause the biological stock to become recruitment overfished.
On the basis of the evidence provided above, the biological stock is classified as a sustainable stock.
Table 2: Deepwater Flathead biology3–7
Longevity and maximum size Females: ~26 years; 82 cm TL Males: ~19 years; 59 cm TL
Maturity (50%) Females: 5–6 years; 43 cm TL
Males: 4–5 years; 43 cm TL
TL = total length
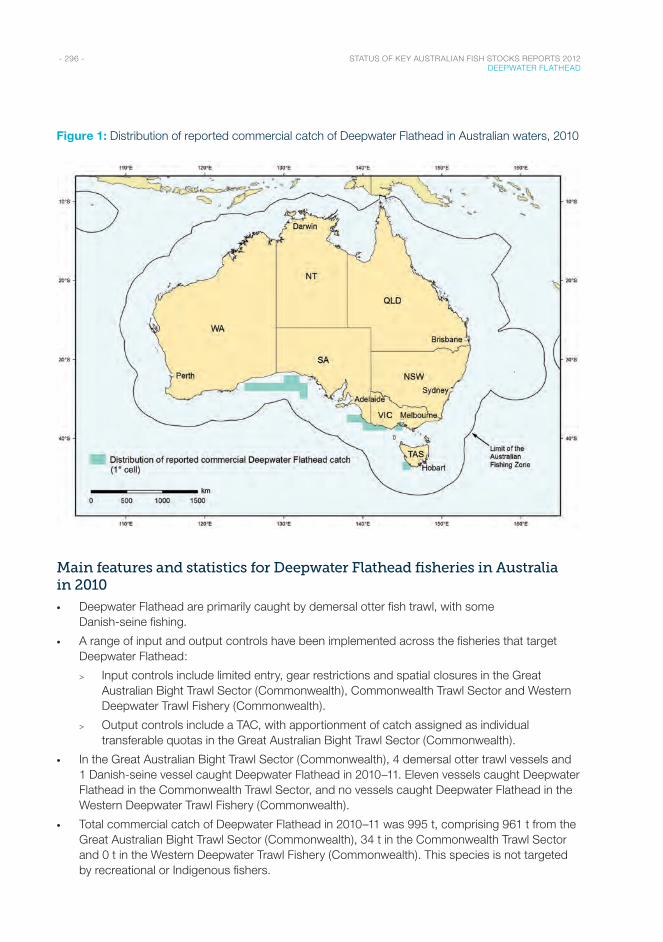
- 296 - STATUS OF KEY AUSTRALIAN FISH STOCKS REPORTS 2012 DEEPWATER FLATHEAD
Figure 1: Distribution of reported commercial catch of Deepwater Flathead in Australian waters, 2010
Main features and statistics for Deepwater Flathead fisheries in Australia in 2010
• Deepwater Flathead are primarily caught by demersal otter fish trawl, with some Danish-seine fishing.
• A range of input and output controls have been implemented across the fisheries that target Deepwater Flathead:
> Input controls include limited entry, gear restrictions and spatial closures in the Great Australian Bight Trawl Sector (Commonwealth), Commonwealth Trawl Sector and Western Deepwater Trawl Fishery (Commonwealth).
> Output controls include a TAC, with apportionment of catch assigned as individual transferable quotas in the Great Australian Bight Trawl Sector (Commonwealth).
• In the Great Australian Bight Trawl Sector (Commonwealth), 4 demersal otter trawl vessels and 1 Danish-seine vessel caught Deepwater Flathead in 2010–11. Eleven vessels caught Deepwater Flathead in the Commonwealth Trawl Sector, and no vessels caught Deepwater Flathead in the Western Deepwater Trawl Fishery (Commonwealth).
• Total commercial catch of Deepwater Flathead in 2010–11 was 995 t, comprising 961 t from the Great Australian Bight Trawl Sector (Commonwealth), 34 t in the Commonwealth Trawl Sector and 0 t in the Western Deepwater Trawl Fishery (Commonwealth). This species is not targeted by recreational or Indigenous fishers.
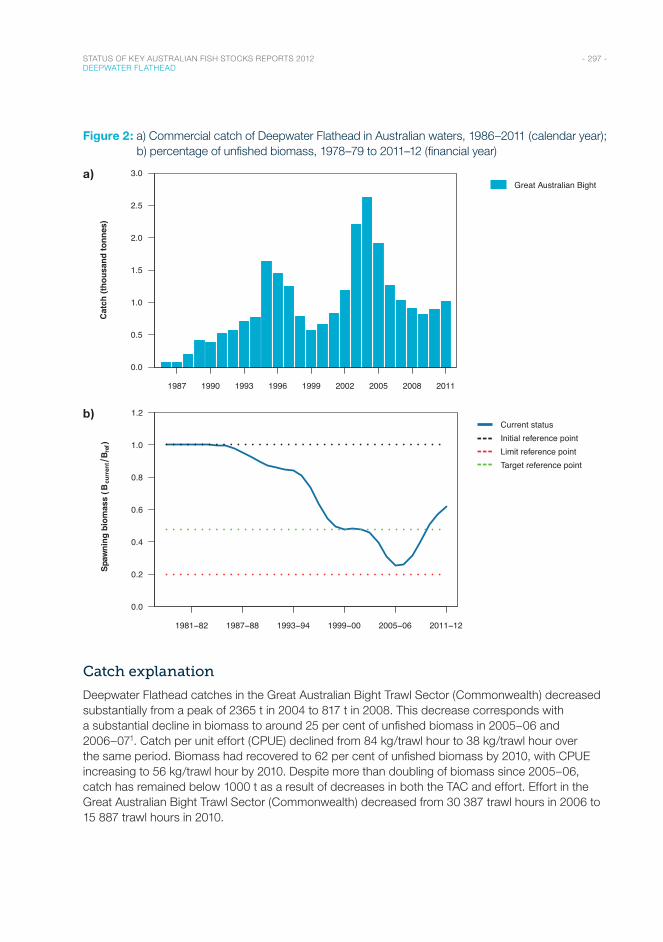
- 297 - STATUS OF KEY AUSTRALIAN FISH STOCKS REPORTS 2012 DEEPWATER FLATHEAD
Figure 2: a) Commercial catch of Deepwater Flathead in Australian waters, 1986–2011 (calendar year); b) percentage of unfished biomass, 1978–79 to 2011–12 (financial year)
a)
Year
1987 1990 1993 1996 1999 2002 2005 2008 2011
0.0
0.5
1.0
1.5
2.0
2.5
3.0Great Australian Bight
Cat
ch (t
hous
and
tonn
es)
b)
Financial Year
1981−82 1987−88 1993−94 1999−00 2005−06 2011−12
0.0
0.2
0.4
0.6
0.8
1.0
1.2Current statusInitial reference pointLimit reference pointTarget reference point
Spaw
ning
bio
mas
s (B
curr
ent
B ref
)
Catch explanation
Deepwater Flathead catches in the Great Australian Bight Trawl Sector (Commonwealth) decreased substantially from a peak of 2365 t in 2004 to 817 t in 2008. This decrease corresponds with a substantial decline in biomass to around 25 per cent of unfished biomass in 2005–06 and 2006–071. Catch per unit effort (CPUE) declined from 84 kg/trawl hour to 38 kg/trawl hour over the same period. Biomass had recovered to 62 per cent of unfished biomass by 2010, with CPUE increasing to 56 kg/trawl hour by 2010. Despite more than doubling of biomass since 2005–06, catch has remained below 1000 t as a result of decreases in both the TAC and effort. Effort in the Great Australian Bight Trawl Sector (Commonwealth) decreased from 30 387 trawl hours in 2006 to 15 887 trawl hours in 2010.
- 298 - STATUS OF KEY AUSTRALIAN FISH STOCKS REPORTS 2012 DEEPWATER FLATHEAD
Effects of fishing on the marine environment
• The Great Australian Bight Trawl Sector (Commonwealth), Commonwealth Trawl Sector and Western Deepwater Trawl Fishery (Commonwealth) catch non-target species (bycatch). These fisheries have bycatch and discarding workplans or bycatch catch triggers in place to reduce interactions with non-target species and minimise environmental impacts8–10.
Environmental effects on Deepwater Flathead
• Changes in ecosystem structure and function associated with changes in the climate may affect larval recruitment of Deepwater Flathead11.
References1. Klaer, N 2011, Deepwater flathead (Neoplatycephalus conatus) stock assessment based on data up to 2009/10, in
GN Tuck (ed.), Stock assessment for the Southern and Eastern Scalefish and Shark Fishery 2010, part 2, Australian Fisheries Management Authority & CSIRO Marine and Atmospheric Research, Hobart.
2. Knuckey, I, Hudson, R & Koopman, M 2008, Resource survey of the Great Australian Bight Trawl Fishery 2008, report to the Australian Fisheries Management Authority, Canberra.
3. Knuckey, I, Koopman, M & Hudson, R 2009, Resource survey of the Great Australian Bight Trawl Fishery, report to the Australian Fisheries Management Authority, Canberra.
4. Kailola, PJ, Williams, MJ, Stewart, PC, Reichelt, RE, McNee, A & Grieve, C 1993, Australian fisheries resources, Bureau of Resource Sciences & Fisheries Research and Development Corporation, Canberra.
5. Knuckey, I & Brown, L 2002 Assessment of bycatch in the Great Australian Bight Trawl Fishery, Fisheries Research and Development Corporation project 2000/169, Marine and Freshwater Resources Institute, Victorian Department of Natural Resources and Environment, Queenscliff.
6. Stokie, T & Krusic-Golub, K, 2005, Age estimation of Bight redfish and deepwater flathead in the Great Australian Bight Trawl Fishery, 2004/05, Australian Fisheries Management Authority, Canberra.
7. Stokie, T & Talman, S 2003, Age estimation of deepwater flathead (Neoplatycephalus conatus), report to the Australian Fisheries Management Authority, Canberra.
8. Australian Fisheries Management Authority 2009, South East Trawl Fishery (board trawl & Danish seine) bycatch and discarding workplan 1 July 2009 to 30 June 2011, AFMA, Canberra, www.afma.gov.au/wp-content/uploads/2010/06/set_bwp_2009_06_16.pdf.
9. Australian Fisheries Management Authority 2010, Great Australian Bight Trawl Fishery bycatch and discarding workplan, 1 November 2010 to 31 October 2012, AFMA, Canberra, www.afma.gov.au/wp-content/uploads/2010/06/GABTF-Workplan-1-Nov-2010-to-31-Oct-2012.pdf.
10. Australian Government Department of Agriculture, Fisheries and Forestry 2007, Commonwealth Fisheries Harvest Strategy: policy and guidelines, DAFF, Canberra.
11. Hobday, AJ, Poloczanska, ES & Matear, R 2007, Implications of climate change for Australian fisheries and aquaculture: a preliminary assessment, CSIRO Marine and Atmospheric Research report to the Department of Climate Change, Canberra.
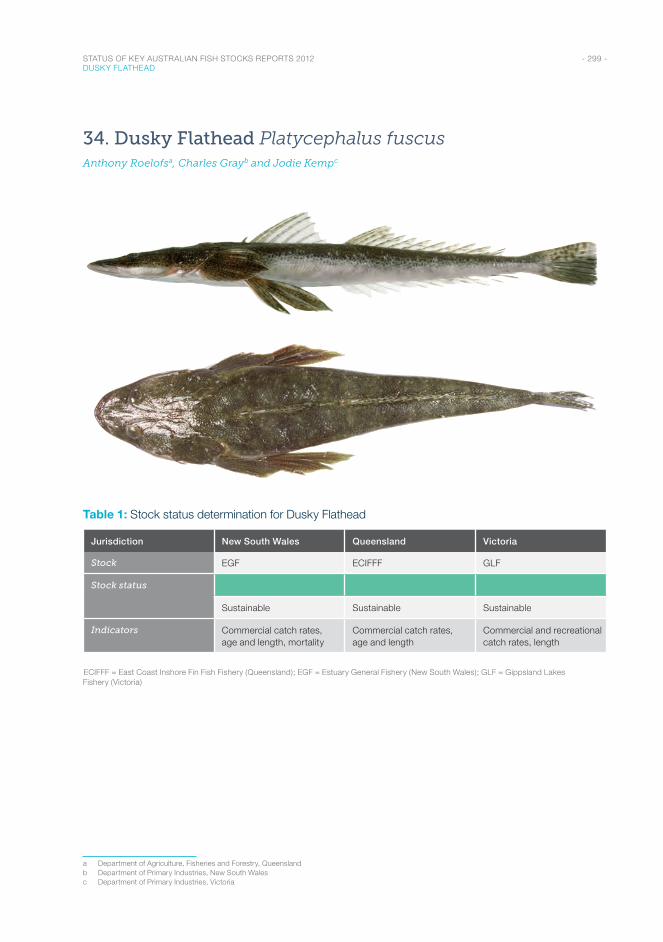
- 299 - STATUS OF KEY AUSTRALIAN FISH STOCKS REPORTS 2012 DUSKY FLATHEAD
34. Dusky Flathead Platycephalus fuscusAnthony Roelofsa, Charles Grayb and Jodie Kempc
Table 1: Stock status determination for Dusky Flathead
Jurisdiction New South Wales Queensland Victoria
Stock EGF ECIFFF GLF
Stock status
Sustainable Sustainable Sustainable
Indicators Commercial catch rates, age and length, mortality
Commercial catch rates, age and length
Commercial and recreational catch rates, length
ECIFFF = East Coast Inshore Fin Fish Fishery (Queensland); EGF = Estuary General Fishery (New South Wales); GLF = Gippsland Lakes Fishery (Victoria)
a Department of Agriculture, Fisheries and Forestry, Queenslandb Department of Primary Industries, New South Walesc Department of Primary Industries, Victoria
- 300 - STATUS OF KEY AUSTRALIAN FISH STOCKS REPORTS 2012 DUSKY FLATHEAD
Stock structure
The biological stock structure of Dusky Flathead populations is not known. As a result, status assessments of the potential individual biological stocks have not been completed. Some assessments of Dusky Flathead have been completed at a jurisdictional level. In the absence of information on biological stock boundaries, status is reported at the jurisdictional level.
Stock status
New South Wales
Commercial landings of Dusky Flathead have been relatively stable for the past four decades, fluctuating between 150 and 200 tonnes (t) annually1. For the past decade, commercial catch per unit effort for Dusky Flathead has been steady2. In addition, long-term length-frequency distributions of commercial landings appear stable, although some temporal and spatial variability has been reported in the length composition of landings1. Reported estimates of annual total mortality were temporally and spatially variable between 1995 and 1997, ranging from 0.45 to 1.641. For the fishery to be sustainable, it is considered that fishing mortality should not exceed natural mortality. This evidence indicates that the biomass of Dusky Flathead in New South Wales is not considered to be recruitment overfished, and the current level of fishing mortality is unlikely to cause the Dusky Flathead to become overfished.
On the basis of the evidence provided above, Dusky Flathead in New South Wales is classified as a sustainable stock.
Queensland
The most recent stock status assessment for Dusky Flathead in the East Coast Inshore Fin Fish Fishery (Queensland) was completed in 20113. The assessment used a weight-of-evidence approach to assign an exploitation category; it considered information from biological monitoring (length and age), commercial catch and effort information from logbooks, and recreational catch data from surveys in 2000 and 20054,5. Commercial gillnet catches and catch rates decreased slightly in 2010, but are within historical levels dating back to 1993 and are considered stable. A commercial catch performance measure (a change of more than 30 per cent over three years) was not triggered in 2010. Biological monitoring of Dusky Flathead indicates a spread of lengths and ages within the catches of both commercial and recreational sectors from 2007 to 2010. This evidence indicates that the biomass of Dusky Flathead in Queensland is unlikely to be recruitment overfished.
The commercial and recreational fishery predominantly harvests female fish because of minimum and maximum legal sizes that are in place. The current minimum legal size (40 cm) protects most male fish from harvest, while the maximum legal size (75 cm) protects large fecund female fish. An in-possession limit of five Dusky Flathead per recreational fisher is also in place. The current management regime for Dusky Flathead means that the allowable level of fishing mortality is unlikely to cause Dusky Flathead in Queensland to become recruitment overfished.
On the basis of the evidence provided above, Dusky Flathead in Queensland is classified as a sustainable stock.
- 301 - STATUS OF KEY AUSTRALIAN FISH STOCKS REPORTS 2012 DUSKY FLATHEAD
Victoria
The most recent fishery assessment for the Gippsland Lakes, Victoria, which included Dusky Flathead, was completed in 2011 (J Kemp, pers. comm, August 2012.). The assessment of Dusky Flathead uses a weight-of-evidence approach that assesses commercial and recreational catch rates, and length-frequency distributions. Commercial and recreational catch rates are highly variable. Following a peak in commercial mesh-net catch rates in 2005–06, there has been a decrease in recent years. Similarly, there has been a decrease in catch rates of Dusky Flathead by recreational anglers for the past four years. Despite these decreases, catch rates by commercial nets for the past four years have been higher than those recorded from 1986–87 to 2004–05. There is no compelling evidence to suggest that the reduction in commercial catch rates since 2005–06 is a result of the species being recruitment overfished in Victoria. Fluctuations in the indicators are instead likely to be the result of environmental conditions affecting spawning success and/or recruitment to the fishery. This evidence indicates that the biomass of Dusky Flathead in Victoria is unlikely to be recruitment overfished. The catch of Dusky Flathead in 2010 was less than the average catch for the period 2002–09. The current level of fishing mortality is unlikely to cause Dusky Flathead in Victoria to become recruitment overfished.
On the basis of the evidence provided above, Dusky Flathead in Victoria is classified as a sustainable stock.
Table 2: Dusky Flathead biology6–7
Longevity and maximum size Females: 16 years; 120 cm TL
Males: 11 years; 62 cm TL
Maturity (50%) Varies according to location. The most recent study in New South Wales reports 32 cm TL for males and 57 cm TL for females.
TL = total length
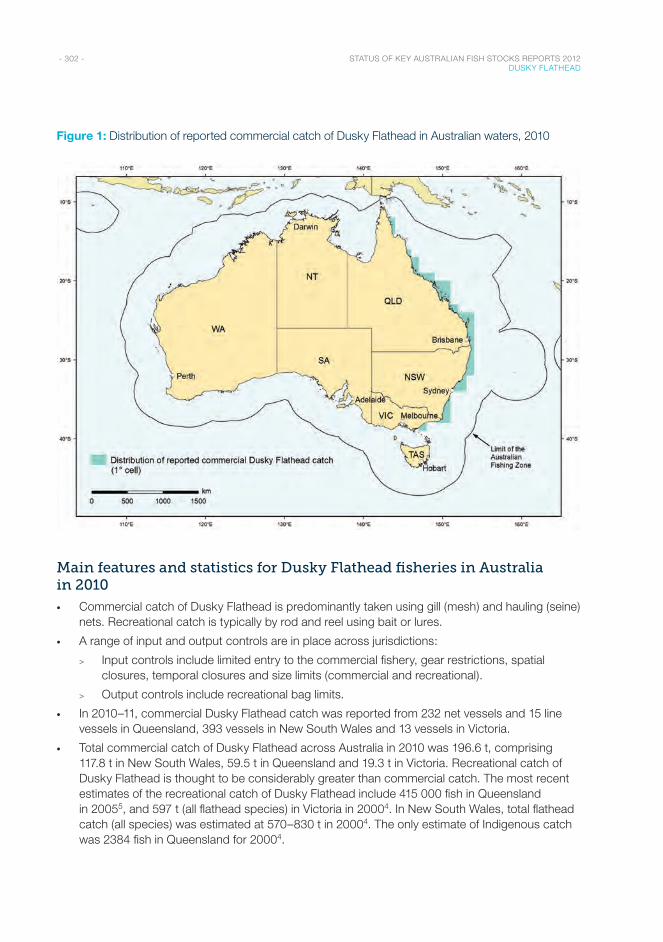
- 302 - STATUS OF KEY AUSTRALIAN FISH STOCKS REPORTS 2012 DUSKY FLATHEAD
Figure 1: Distribution of reported commercial catch of Dusky Flathead in Australian waters, 2010
Main features and statistics for Dusky Flathead fisheries in Australia in 2010
• Commercial catch of Dusky Flathead is predominantly taken using gill (mesh) and hauling (seine) nets. Recreational catch is typically by rod and reel using bait or lures.
• A range of input and output controls are in place across jurisdictions:
> Input controls include limited entry to the commercial fishery, gear restrictions, spatial closures, temporal closures and size limits (commercial and recreational).
> Output controls include recreational bag limits.
• In 2010–11, commercial Dusky Flathead catch was reported from 232 net vessels and 15 line vessels in Queensland, 393 vessels in New South Wales and 13 vessels in Victoria.
• Total commercial catch of Dusky Flathead across Australia in 2010 was 196.6 t, comprising 117.8 t in New South Wales, 59.5 t in Queensland and 19.3 t in Victoria. Recreational catch of Dusky Flathead is thought to be considerably greater than commercial catch. The most recent estimates of the recreational catch of Dusky Flathead include 415 000 fish in Queensland in 20055, and 597 t (all flathead species) in Victoria in 20004. In New South Wales, total flathead catch (all species) was estimated at 570–830 t in 20004. The only estimate of Indigenous catch was 2384 fish in Queensland for 20004.
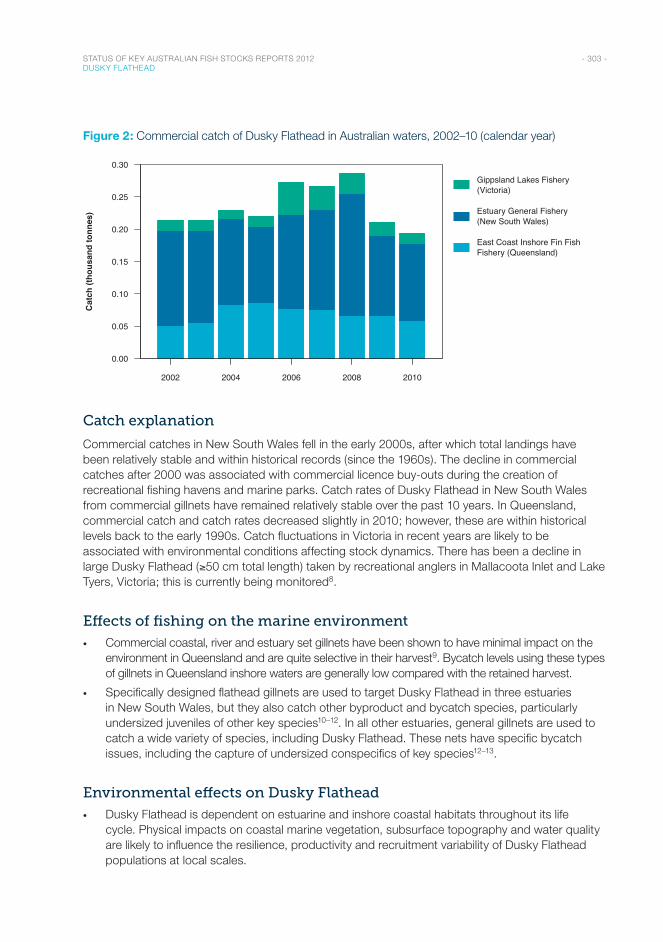
- 303 - STATUS OF KEY AUSTRALIAN FISH STOCKS REPORTS 2012 DUSKY FLATHEAD
Figure 2: Commercial catch of Dusky Flathead in Australian waters, 2002–10 (calendar year)
Year
2002 2004 2006 2008 2010
0.00
0.05
0.10
0.15
0.20
0.25
0.30
Gippsland Lakes Fishery(Victoria)
Estuary General Fishery(New South Wales)
East Coast Inshore Fin FishFishery (Queensland)
Cat
ch (t
hous
and
tonn
es)
Catch explanation
Commercial catches in New South Wales fell in the early 2000s, after which total landings have been relatively stable and within historical records (since the 1960s). The decline in commercial catches after 2000 was associated with commercial licence buy-outs during the creation of recreational fishing havens and marine parks. Catch rates of Dusky Flathead in New South Wales from commercial gillnets have remained relatively stable over the past 10 years. In Queensland, commercial catch and catch rates decreased slightly in 2010; however, these are within historical levels back to the early 1990s. Catch fluctuations in Victoria in recent years are likely to be associated with environmental conditions affecting stock dynamics. There has been a decline in large Dusky Flathead (≥50 cm total length) taken by recreational anglers in Mallacoota Inlet and Lake Tyers, Victoria; this is currently being monitored8.
Effects of fishing on the marine environment
• Commercial coastal, river and estuary set gillnets have been shown to have minimal impact on the environment in Queensland and are quite selective in their harvest9. Bycatch levels using these types of gillnets in Queensland inshore waters are generally low compared with the retained harvest.
• Specifically designed flathead gillnets are used to target Dusky Flathead in three estuaries in New South Wales, but they also catch other byproduct and bycatch species, particularly undersized juveniles of other key species10–12. In all other estuaries, general gillnets are used to catch a wide variety of species, including Dusky Flathead. These nets have specific bycatch issues, including the capture of undersized conspecifics of key species12–13.
Environmental effects on Dusky Flathead
• Dusky Flathead is dependent on estuarine and inshore coastal habitats throughout its life cycle. Physical impacts on coastal marine vegetation, subsurface topography and water quality are likely to influence the resilience, productivity and recruitment variability of Dusky Flathead populations at local scales.
- 304 - STATUS OF KEY AUSTRALIAN FISH STOCKS REPORTS 2012 DUSKY FLATHEAD
References1. Gray, CA, Gale, VJ, Stringfellow, SL & Raines, LP 2002, Variations in sex, length and age compositions of commercial
catches of Platycephalus fuscus (Pisces: Platycephalidae) in New South Wales, Australia, Marine and Freshwater Research, 53: 1091–1100.
2. Rowling, K, Hegarty, A & Ives, M (eds) 2010, Status of fisheries resources in NSW 2008/09, Industry & Investment NSW, Cronulla.
3. Queensland Department of Employment, Economic Development and Innovation 2011, Stock status of Queensland’s fisheries resources 2011, DEEDI, Brisbane.
4. Henry, GW & Lyle, JM 2003 (eds), National recreational and indigenous fishing survey, Fisheries Research and Development Corporation, project 99/158, Australian Government Department of Agriculture, Fisheries and Forestry, Canberra.
5. McInnes, K 2008, Experimental results from the fourth Queensland recreational fishing diary program (2005), Queensland Department of Primary Industries and Fisheries, Brisbane.
6. Gray, CA & Barnes, LM 2008, Reproduction and growth of dusky flathead (Platycephalus fuscus) in NSW estuaries, Fisheries Final Report Series no. 101, NSW Department of Primary Industries, Cronulla.
7. Kailola, PJ, Williams, MJ, Stewart, PC, Reichelt, RE, McNee, A & Grieve, C 1993, Australian fisheries resources, Bureau of Resource Sciences & the Fisheries Research and Development Corporation, Canberra.
8. Kemp, J, Brown, L, Conron, S, Bruce T, Bridge, N, MacDonald, CM & Ryan KL 2012, East Gippsland small estuary fisheries assessment 2009, Fisheries Victoria Internal Report Series no. 3, Victorian Department of Primary Industries, Melbourne.
9. Halliday, IA, Ley, JA, Tobin, A, Garrett, R, Gribble, NA & Mayer, DG 2001, The effects of net fishing: addressing biodiversity and bycatch issues in Queensland inshore waters, Fisheries Research and Development Corporation, project 97/206, Queensland Department of Primary Industries, Deception Bay.
10. Broadhurst, MK, Gray, CA, Young, DJ & Johnson, DD 2003, Relative efficiency and size selectivity of bottom-set gillnets for dusky flathead, Platycephalus fuscus and other species in New South Wales, Australia, Archive of Fishery and Marine Research, 50: 289–302.
11. Gray, CA, Broadhurst, MK, Johnson, DD & Young, DJ 2005, Influences of hanging ratio, fishing height, twine diameter and material of bottom-set gillnets on catches of dusky flathead Platycephalus fuscus and non-target species in New South Wales, Australia, Fisheries Science, 71: 1216–1227.
12. Gray, CA, Johnson, DD, Young, DJ & Broadhurst, MK 2004, Discards from the commercial gillnet fishery for dusky flathead, Platycephalus fuscus, in New South Wales, Australia: spatial variability and initial effects of change in minimum legal length of target species, Fisheries Management and Ecology, 11: 323–333.
13. Gray, CA 2002, Management implications of discarding in an estuarine multi-species gillnet fishery, Fisheries Research, 56: 177–192.
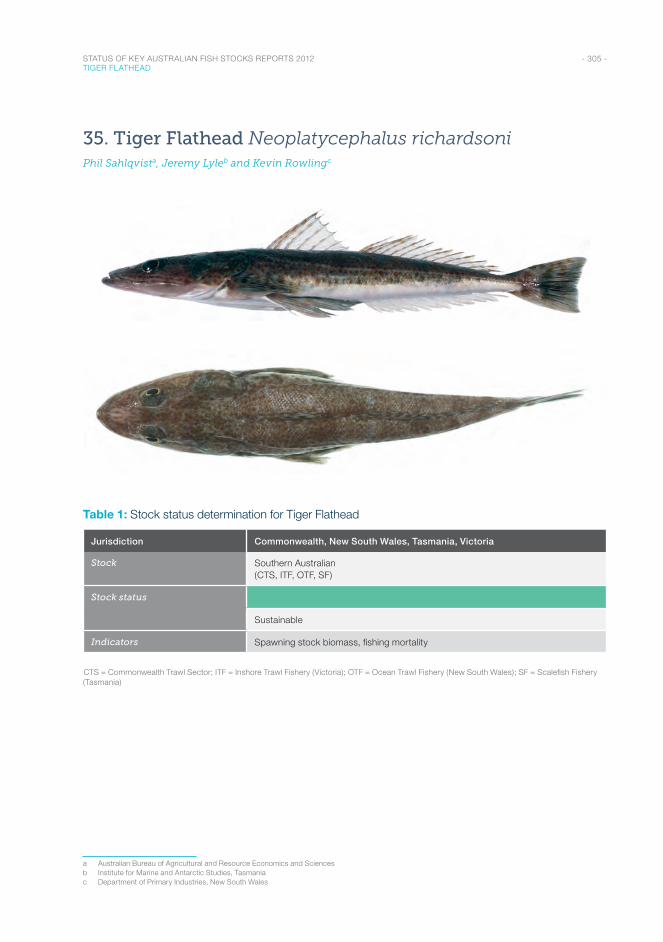
- 305 - STATUS OF KEY AUSTRALIAN FISH STOCKS REPORTS 2012 TIGER FLATHEAD
35. Tiger Flathead Neoplatycephalus richardsoniPhil Sahlqvista, Jeremy Lyleb and Kevin Rowlingc
Table 1: Stock status determination for Tiger Flathead
Jurisdiction Commonwealth, New South Wales, Tasmania, Victoria
Stock Southern Australian (CTS, ITF, OTF, SF)
Stock status
Sustainable
Indicators Spawning stock biomass, fishing mortality
CTS = Commonwealth Trawl Sector; ITF = Inshore Trawl Fishery (Victoria); OTF = Ocean Trawl Fishery (New South Wales); SF = Scalefish Fishery (Tasmania)
a Australian Bureau of Agricultural and Resource Economics and Sciencesb Institute for Marine and Antarctic Studies, Tasmaniac Department of Primary Industries, New South Wales
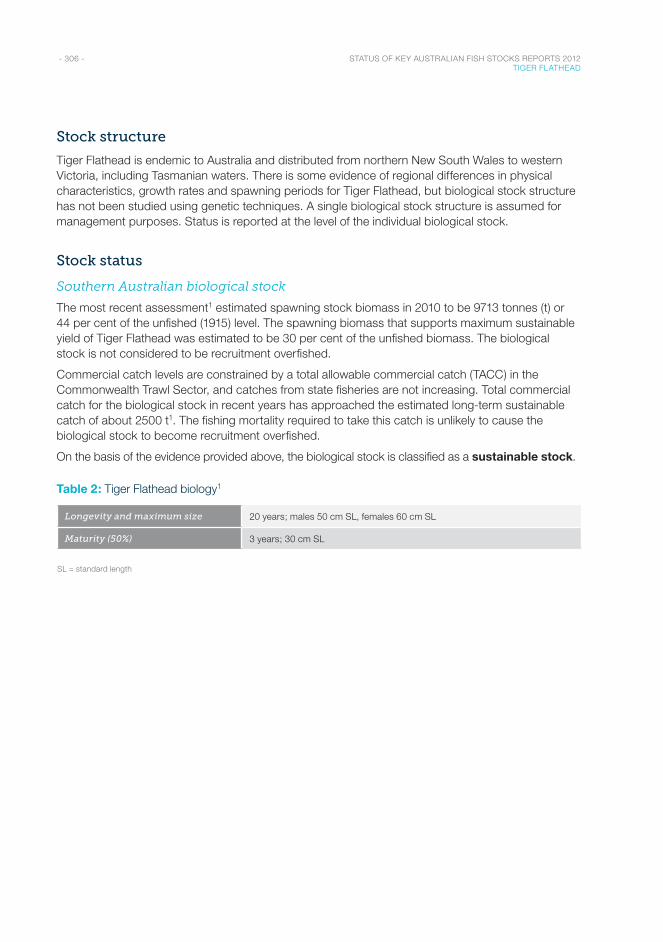
- 306 - STATUS OF KEY AUSTRALIAN FISH STOCKS REPORTS 2012 TIGER FLATHEAD
Stock structure
Tiger Flathead is endemic to Australia and distributed from northern New South Wales to western Victoria, including Tasmanian waters. There is some evidence of regional differences in physical characteristics, growth rates and spawning periods for Tiger Flathead, but biological stock structure has not been studied using genetic techniques. A single biological stock structure is assumed for management purposes. Status is reported at the level of the individual biological stock.
Stock status
Southern Australian biological stock
The most recent assessment1 estimated spawning stock biomass in 2010 to be 9713 tonnes (t) or 44 per cent of the unfished (1915) level. The spawning biomass that supports maximum sustainable yield of Tiger Flathead was estimated to be 30 per cent of the unfished biomass. The biological stock is not considered to be recruitment overfished.
Commercial catch levels are constrained by a total allowable commercial catch (TACC) in the Commonwealth Trawl Sector, and catches from state fisheries are not increasing. Total commercial catch for the biological stock in recent years has approached the estimated long-term sustainable catch of about 2500 t1. The fishing mortality required to take this catch is unlikely to cause the biological stock to become recruitment overfished.
On the basis of the evidence provided above, the biological stock is classified as a sustainable stock.
Table 2: Tiger Flathead biology1
Longevity and maximum size 20 years; males 50 cm SL, females 60 cm SL
Maturity (50%) 3 years; 30 cm SL
SL = standard length
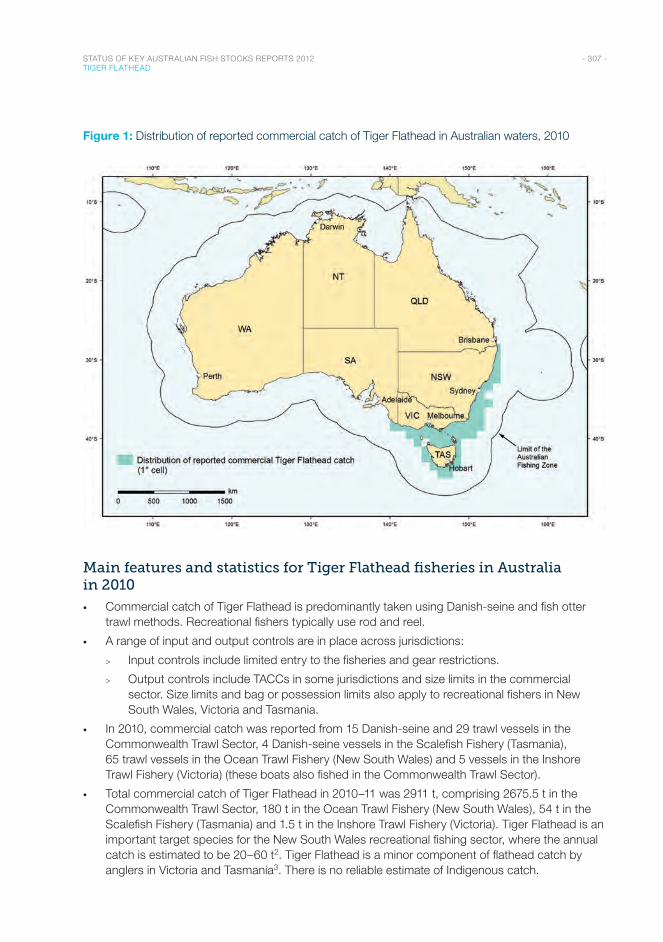
- 307 - STATUS OF KEY AUSTRALIAN FISH STOCKS REPORTS 2012 TIGER FLATHEAD
Figure 1: Distribution of reported commercial catch of Tiger Flathead in Australian waters, 2010
Main features and statistics for Tiger Flathead fisheries in Australia in 2010
• Commercial catch of Tiger Flathead is predominantly taken using Danish-seine and fish otter trawl methods. Recreational fishers typically use rod and reel.
• A range of input and output controls are in place across jurisdictions:
> Input controls include limited entry to the fisheries and gear restrictions.
> Output controls include TACCs in some jurisdictions and size limits in the commercial sector. Size limits and bag or possession limits also apply to recreational fishers in New South Wales, Victoria and Tasmania.
• In 2010, commercial catch was reported from 15 Danish-seine and 29 trawl vessels in the Commonwealth Trawl Sector, 4 Danish-seine vessels in the Scalefish Fishery (Tasmania), 65 trawl vessels in the Ocean Trawl Fishery (New South Wales) and 5 vessels in the Inshore Trawl Fishery (Victoria) (these boats also fished in the Commonwealth Trawl Sector).
• Total commercial catch of Tiger Flathead in 2010–11 was 2911 t, comprising 2675.5 t in the Commonwealth Trawl Sector, 180 t in the Ocean Trawl Fishery (New South Wales), 54 t in the Scalefish Fishery (Tasmania) and 1.5 t in the Inshore Trawl Fishery (Victoria). Tiger Flathead is an important target species for the New South Wales recreational fishing sector, where the annual catch is estimated to be 20–60 t2. Tiger Flathead is a minor component of flathead catch by anglers in Victoria and Tasmania3. There is no reliable estimate of Indigenous catch.
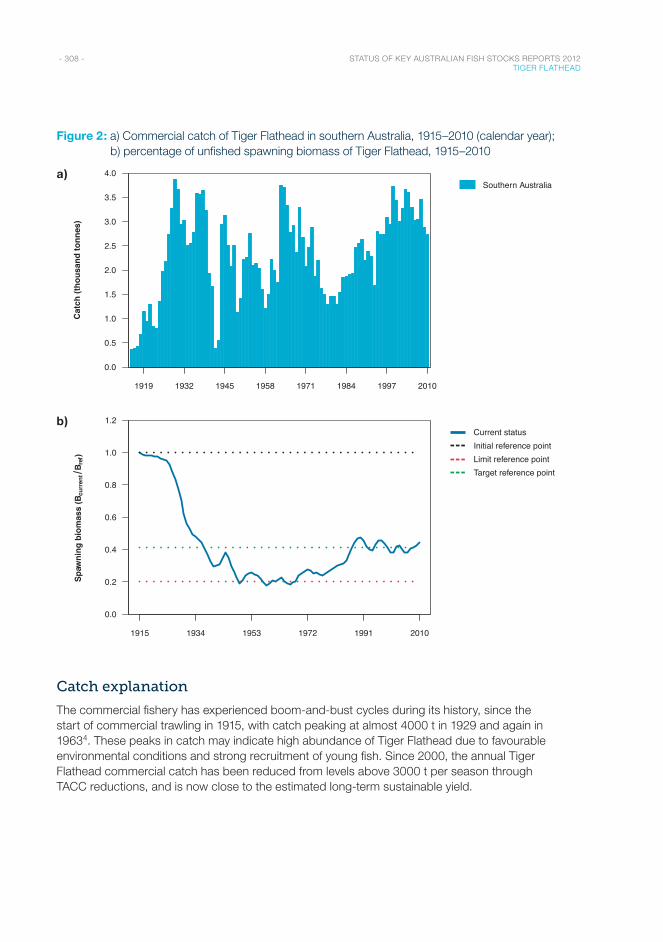
- 308 - STATUS OF KEY AUSTRALIAN FISH STOCKS REPORTS 2012 TIGER FLATHEAD
Figure 2: a) Commercial catch of Tiger Flathead in southern Australia, 1915–2010 (calendar year); b) percentage of unfished spawning biomass of Tiger Flathead, 1915–2010
a)
Year
1919 1932 1945 1958 1971 1984 1997 2010
0.0
0.5
1.0
1.5
2.0
2.5
3.0
3.5
4.0Southern Australia
Cat
ch (t
hous
and
tonn
es)
b)
Year
1915 1934 1953 1972 1991 2010
0.0
0.2
0.4
0.6
0.8
1.0
1.2Current statusInitial reference pointLimit reference pointTarget reference point
Spaw
ning
bio
mas
s (B
curr
ent
B ref
)
Catch explanation
The commercial fishery has experienced boom-and-bust cycles during its history, since the start of commercial trawling in 1915, with catch peaking at almost 4000 t in 1929 and again in 19634. These peaks in catch may indicate high abundance of Tiger Flathead due to favourable environmental conditions and strong recruitment of young fish. Since 2000, the annual Tiger Flathead commercial catch has been reduced from levels above 3000 t per season through TACC reductions, and is now close to the estimated long-term sustainable yield.
- 309 - STATUS OF KEY AUSTRALIAN FISH STOCKS REPORTS 2012 TIGER FLATHEAD
Effects of fishing on the marine environment
• Trawling and Danish-seining methods have the potential for interactions with threatened, endangered and protected species, particularly seals, seabirds, and seahorses and pipefishes (syngnathids). Fishery management agencies and the trawling industry are investigating methods for reducing these interactions—for example, seal excluder devices in trawl and Danish-seine nets, and bird-scaring devices to deter warp strikes. Observer programs and reporting requirements ensure that interactions with protected species are managed.
• Otter trawl methods of fishing can potentially have detrimental impacts on benthic habitats.
• Discarding of quota species catch can be significant in some parts of the Commonwealth Trawl Sector. However, discard rates for Tiger Flathead are low (less than 10 per cent), and trawl and Danish-seine fishers are now using nets with large meshes to reduce capture of undersized fish.
Environmental impacts on Tiger Flathead
• There is some speculation that past peaks in abundance of Tiger Flathead may have been linked to favourable, but undetermined, environmental conditions5. Recent strong recruitment of small flathead may have a similar environmental basis. However, the effect of long-term shifts in the marine environment, such as those associated with global climate change, cannot yet be predicted for the Tiger Flathead biological stock.
References1. Klaer, N 2010, Tiger Flathead (Neoplatycephalus richardsoni) stock assessment based on data up to 2009,
report to the Shelf Resource Assessment Group, Hobart.
2. Rowling, KR, Hegarty, AM & Ives, M 2010, Status of fisheries resources in NSW 2008/09, Industry & Investment NSW, Cronulla.
3. Ziegler, PE & Lyle, JM 2010, Tasmanian scalefish fishery 2008/09, Tasmanian Aquaculture and Fisheries Institute, University of Tasmania, Hobart.
4. Stobutzki, I, Ward, P, Vieira, S, Moore, A, Sahlqvist, P, Leatherbarrow, A, Patterson, H, Barnes, B, Noriega, R & Rodgers, M 2011, Commonwealth trawl and scalefish hook sectors, in J Woodhams, I Stobutzki, S Vieira, R Curtotti & GA Begg (eds), Fishery status reports 2010: status of fish stocks and fisheries managed by the Australian Government, Australian Bureau of Agricultural and Resource Economics and Sciences, Canberra.
5. Shelf Resource Assessment Group 2011, 2010 stock assessment summaries for species assessed by ShelfRAG, version 22, December 2010, Australian Fisheries Management Authority, Canberra.

Finfish : Snappers & EmperorsCrimson Snapper / Goldband Snapper / Red Emperor
Redthroat Emperor / Saddletail Snapper / Snapper
S N A P P E R S A N D E M P E R O R S A R E T Y P I C A L LY A G R O U P O F R E E F - D W E L L I N G S P E C I E S T H AT I N H A B I T T R O P I C A L A N D T E M P E R AT E W AT E R S
A R O U N D A U S T R A L I A A N D W O R L D W I D E .
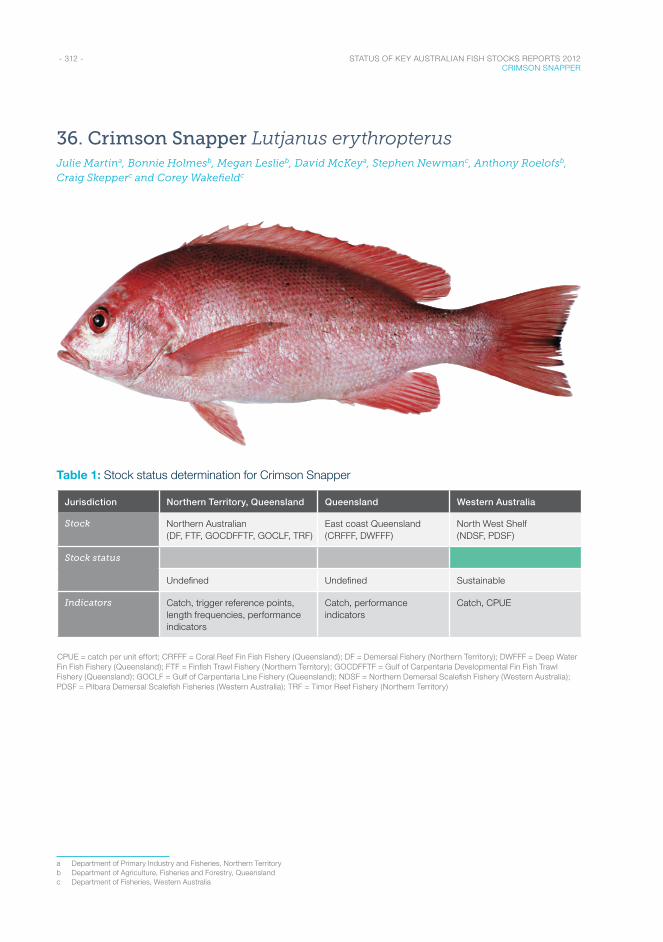
- 312 - STATUS OF KEY AUSTRALIAN FISH STOCKS REPORTS 2012 CRIMSON SNAPPER
36. Crimson Snapper Lutjanus erythropterusJulie Martina, Bonnie Holmesb, Megan Leslieb, David McKeya, Stephen Newmanc, Anthony Roelofsb, Craig Skepperc and Corey Wakefieldc
Table 1: Stock status determination for Crimson Snapper
Jurisdiction Northern Territory, Queensland Queensland Western Australia
Stock Northern Australian (DF, FTF, GOCDFFTF, GOCLF, TRF)
East coast Queensland (CRFFF, DWFFF)
North West Shelf (NDSF, PDSF)
Stock status
Undefined Undefined Sustainable
Indicators Catch, trigger reference points, length frequencies, performance indicators
Catch, performance indicators
Catch, CPUE
CPUE = catch per unit effort; CRFFF = Coral Reef Fin Fish Fishery (Queensland); DF = Demersal Fishery (Northern Territory); DWFFF = Deep Water Fin Fish Fishery (Queensland); FTF = Finfish Trawl Fishery (Northern Territory); GOCDFFTF = Gulf of Carpentaria Developmental Fin Fish Trawl Fishery (Queensland); GOCLF = Gulf of Carpentaria Line Fishery (Queensland); NDSF = Northern Demersal Scalefish Fishery (Western Australia); PDSF = Pilbara Demersal Scalefish Fisheries (Western Australia); TRF = Timor Reef Fishery (Northern Territory)
a Department of Primary Industry and Fisheries, Northern Territoryb Department of Agriculture, Fisheries and Forestry, Queenslandc Department of Fisheries, Western Australia
- 313 - STATUS OF KEY AUSTRALIAN FISH STOCKS REPORTS 2012 CRIMSON SNAPPER
Stock structure
Crimson Snapper is a widespread Indo–Pacific species found throughout tropical Australian waters. Research on the biological stock structure of this species has only occurred in northern Australian waters, including the Timor Sea, the Arafura Sea and the Gulf of Carpentaria1. A single genetic stock was found across this region. It is believed that the species has a similar biological stock structure to Saddletail Snapper (Lutjanus malibaricus)—that is, a North West Shelf biological stock and a biological stock off the east coast of Queensland, in addition to the northern Australian biological stock.
Stock status
Northern Australian biological stock
This cross-jurisdictional biological stock has components in the Northern Territory and Queensland. Each jurisdiction assesses that part of the biological stock that occurs in its waters. Status presented here for the entire biological stock has been established using evidence from both jurisdictions.
The Northern Territory manages the commercial harvest of Crimson Snapper and Saddletail Snapper together, as red snapper. For the Northern Territory part of the biological stock, the most recent assessment2 estimated that the biomass of the red snapper group in 1990 was 24 000 tonnes (t). This estimate took into account high fishing pressure from foreign fleets, which peaked at 4200 t in 1989. Stock reduction analysis in 1996 indicated that, for the biological stock to be reduced to 24 000 t in 1990, the unfished biomass would have been approximately 50 000 t. Hence, biomass in 1990 was estimated to be 45–50 per cent of the unfished level.
Licensed activity by foreign fleets in northern Australian waters ceased in 1991, and total commercial catch in the Northern Territory decreased substantially between 1991 and 1995 (to less than 100 t annually). Over the past 15 years (1995–2010), the commercial Northern Territory Crimson Snapper catch has not exceeded 350 t annually and has averaged around 22 per cent of the commercial red snapper catch. In 2010, the total commercial catch of Crimson Snapper was 275 t. The most recent estimate of annual sustainable yield for Crimson Snapper is 850 t2–3.
It is assumed that further reductions in biomass since this time are unlikely because of the reduced effort since 1990. Hence, the Northern Territory part of the biological stock is not considered to be recruitment overfished, and fishing mortality is unlikely to cause this part of the biological stock to become recruitment overfished.
For the Queensland part of the biological stock, commercial catch in 2010 was 279 t. Since no information is available on biomass, insufficient information is available to confidently classify the status of this part of the biological stock.
As a result of the uncertainty in the Queensland part of the biological stock, and the fact that the total catch in Queensland was higher than in the Northern Territory, the entire biological stock is classified as an undefined stock.
East coast Queensland biological stock
Since the quota management system was introduced in 2004, commercial harvest has increased from less than 1 t in 2005 to around 20 t per year since 2008. Current biological information is unavailable, and no stock assessment has been completed. Insufficient information is available to confidently classify the status of this biological stock; as a result, the biological stock is classified as an undefined stock.
- 314 - STATUS OF KEY AUSTRALIAN FISH STOCKS REPORTS 2012 CRIMSON SNAPPER
North West Shelf biological stock
Crimson Snapper is exploited primarily on the north-west coast of Western Australia as a component of the Pilbara Demersal Scalefish Fisheries (Western Australia) and Northern Demersal Scalefish Fishery (Western Australia)4. Crimson Snapper is assessed on the basis of the status of several indicator species (e.g. Red Emperor, Lutjanus sebae) that represent the entire inshore demersal suite of species (occurring at depths of 30–250 m). The major performance measures for these indicator species relate to spawning stock levels. The target level of spawning biomass is 40 per cent of the unfished level, and the limit level is 30 per cent of the unfished level. Data analysis using an integrated age-structured model determined that the spawning biomass levels of the indicator species were greater than 40 per cent of the unfished level in the Pilbara Demersal Scalefish Fisheries (Western Australia) and the Northern Demersal Scalefish Fishery (Western Australia) in 20075. The Crimson Snapper biological stock is not considered to be recruitment overfished.
Fishing mortality (F)–based assessments5 indicated that the fishing levels on the indicator species were either lower than the target level, or between the target and threshold levels. These assessments use reference levels that are based on ratios of natural mortality (M) for each species, such that Ftarget = 2/3M, Fthreshold = M and Flimit = 3/2M. This level of fishing mortality is unlikely to cause the biological stock to become recruitment overfished.
On the basis of the evidence provided above, the biological stock is classified as a sustainable stock.
Table 2: Crimson Snapper biology6–7
Longevity and maximum size 42 years; 47 cm SL
Maturity (50%) Males: 27–28 cm SL
Females: 35–37 cm SL
SL = standard length
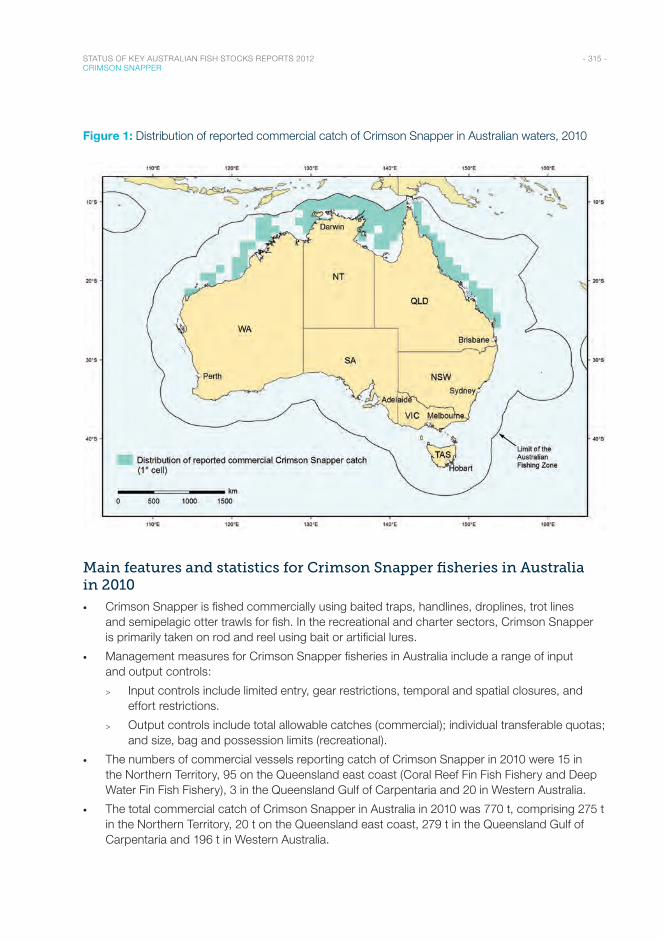
- 315 - STATUS OF KEY AUSTRALIAN FISH STOCKS REPORTS 2012 CRIMSON SNAPPER
Figure 1: Distribution of reported commercial catch of Crimson Snapper in Australian waters, 2010
Main features and statistics for Crimson Snapper fisheries in Australia in 2010
• Crimson Snapper is fished commercially using baited traps, handlines, droplines, trot lines and semipelagic otter trawls for fish. In the recreational and charter sectors, Crimson Snapper is primarily taken on rod and reel using bait or artificial lures.
• Management measures for Crimson Snapper fisheries in Australia include a range of input and output controls:
> Input controls include limited entry, gear restrictions, temporal and spatial closures, and effort restrictions.
> Output controls include total allowable catches (commercial); individual transferable quotas; and size, bag and possession limits (recreational).
• The numbers of commercial vessels reporting catch of Crimson Snapper in 2010 were 15 in the Northern Territory, 95 on the Queensland east coast (Coral Reef Fin Fish Fishery and Deep Water Fin Fish Fishery), 3 in the Queensland Gulf of Carpentaria and 20 in Western Australia.
• The total commercial catch of Crimson Snapper in Australia in 2010 was 770 t, comprising 275 t in the Northern Territory, 20 t on the Queensland east coast, 279 t in the Queensland Gulf of Carpentaria and 196 t in Western Australia.
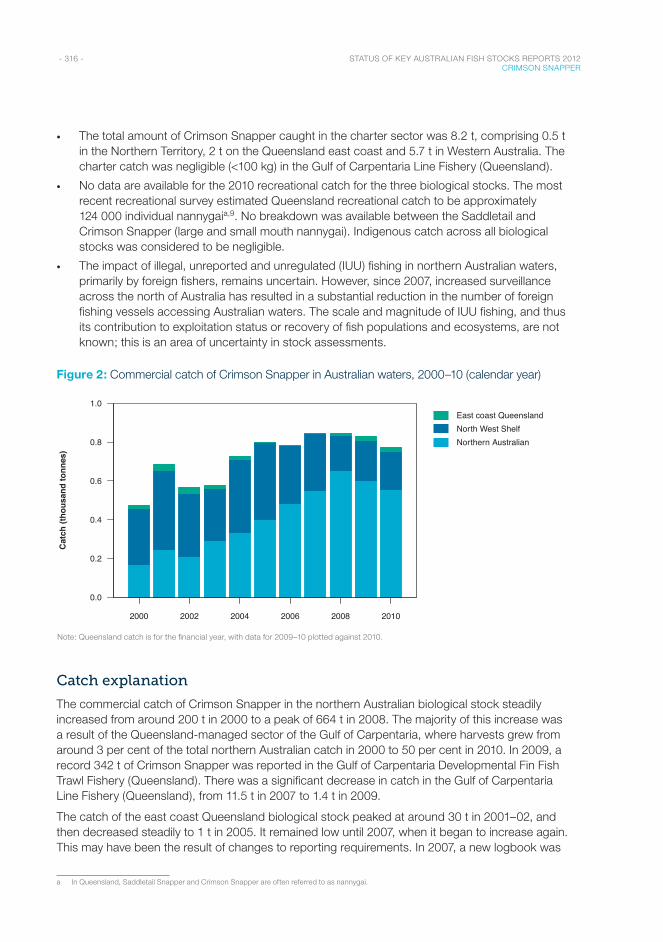
- 316 - STATUS OF KEY AUSTRALIAN FISH STOCKS REPORTS 2012 CRIMSON SNAPPER
• The total amount of Crimson Snapper caught in the charter sector was 8.2 t, comprising 0.5 t in the Northern Territory, 2 t on the Queensland east coast and 5.7 t in Western Australia. The charter catch was negligible (<100 kg) in the Gulf of Carpentaria Line Fishery (Queensland).
• No data are available for the 2010 recreational catch for the three biological stocks. The most recent recreational survey estimated Queensland recreational catch to be approximately 124 000 individual nannygaia,9. No breakdown was available between the Saddletail and Crimson Snapper (large and small mouth nannygai). Indigenous catch across all biological stocks was considered to be negligible.
• The impact of illegal, unreported and unregulated (IUU) fishing in northern Australian waters, primarily by foreign fishers, remains uncertain. However, since 2007, increased surveillance across the north of Australia has resulted in a substantial reduction in the number of foreign fishing vessels accessing Australian waters. The scale and magnitude of IUU fishing, and thus its contribution to exploitation status or recovery of fish populations and ecosystems, are not known; this is an area of uncertainty in stock assessments.
Figure 2: Commercial catch of Crimson Snapper in Australian waters, 2000–10 (calendar year)
Year
2000 2002 2004 2006 2008 2010
0.0
0.2
0.4
0.6
0.8
1.0East coast QueenslandNorth West ShelfNorthern Australian
Cat
ch (t
hous
and
tonn
es)
Note: Queensland catch is for the financial year, with data for 2009–10 plotted against 2010.
Catch explanation
The commercial catch of Crimson Snapper in the northern Australian biological stock steadily increased from around 200 t in 2000 to a peak of 664 t in 2008. The majority of this increase was a result of the Queensland-managed sector of the Gulf of Carpentaria, where harvests grew from around 3 per cent of the total northern Australian catch in 2000 to 50 per cent in 2010. In 2009, a record 342 t of Crimson Snapper was reported in the Gulf of Carpentaria Developmental Fin Fish Trawl Fishery (Queensland). There was a significant decrease in catch in the Gulf of Carpentaria Line Fishery (Queensland), from 11.5 t in 2007 to 1.4 t in 2009.
The catch of the east coast Queensland biological stock peaked at around 30 t in 2001–02, and then decreased steadily to 1 t in 2005. It remained low until 2007, when it began to increase again. This may have been the result of changes to reporting requirements. In 2007, a new logbook was
a In Queensland, Saddletail Snapper and Crimson Snapper are often referred to as nannygai.
- 317 - STATUS OF KEY AUSTRALIAN FISH STOCKS REPORTS 2012 CRIMSON SNAPPER
introduced to the Coral Reef Fin Fish Fishery (Queensland), and reporting of ‘nannygai-unspecified’ dropped from 18 t in 2006–07 to less than 100 kg in 2009–10. By 2010, reported catches of Crimson Snapper had increased to 20 t.
The catch of Crimson Snapper in the North West Shelf biological stock has been stable, in the range of 180–205 t, over the past three years (2008–10), despite variation in effort allocation levels across multiple fisheries.
Effects of fishing on the marine environment
• Beyond the removal of fish, there is little evidence to suggest that the fisheries targeting Crimson Snapper impact significantly on benthic or pelagic ecological communities in the area as a whole.
Environmental effects on Crimson Snapper
• Climate change and variability have the potential to impact fish stocks in a range of ways, including geographic distribution (e.g. latitudinal shifts in distribution). However, it is unclear how climate change may affect risks to sustainability.
• Changes in ocean chemistry have the potential to affect the replenishment rates of fish populations9, as well as individual growth rates and spawning output10.
References1. Salini, J, Ovenden, J, Street, R, Pendrey, R, Haryantis & Ngurah 2006, Genetic population structure of red snappers
(Lutjanus malabaricus Bloch & Schneider, 1801 and Lutjanus erythropterus Bloch, 1790) in central and eastern Indonesia and northern Australia, Journal of Fish Biology, 68(suppl. B): 217–234.
2. Ramm, DC 1997, Towards the sustainable use of Northern Territory fishery resources: review workshops led by Carl J Walters, final report to the Fisheries Research and Development Corporation, project 96/158, Fishery Report no. 39: 34, Northern Territory Department of Primary Industry and Fisheries, Darwin.
3. Ramm, DC 1994, Australia’s northern trawl fishery, final report to the Fisheries Research and Development Corporation, project 86/049, Fishery Report no. 32: 59, Northern Territory Department of Primary Industry and Fisheries, Darwin.
4. Fletcher, W J & Santoro, K (eds) 2011, State of the fisheries and aquatic resources report 2010/11, Western Australian Department of Fisheries, Perth.
5. Newman, SJ, Wakefield, C, Skepper, C, Marriott, R, Cliff, M, Boddington, D, Mitsopoulos, G, Rome, B, Green, R & Blazeski, S 2011, North coast demersal fisheries status report, in WJ Fletcher & K Santoro (eds), State of the fisheries and aquatic resources report 2010/11, Western Australian Department of Fisheries, Perth, 190–208.
6. Fry, G & Milton, DA 2009, Age, growth and mortality estimates for populations of red snappers Lutjanus erythropterus and L. malabaricus from northern Australia and eastern Indonesia, Fisheries Science, 75: 1219–1229.
7. Fry, G, Milton, DA, Van Der Velde, T, Stobutzki, I, Andamari, R, Badrudin & Sumiono, B 2009, Reproductive dynamics and nursery habitat preferences of two commercially important Indo-Pacific red snappers Lutjanus erythropterus and L. malabaricus, Fisheries Science, 75: 145–158.
8. McInnes, K 2008, Experimental results from the fourth Queensland recreational fishing diary program (2005), Queensland Department of Primary Industries and Fisheries, Brisbane.
9. Hughes, T 2010, Marine and Tropical Sciences Research Facility milestone report for program 2.5i.3, report to the Australian Government Department of the Environment, Water, Heritage and the Arts, www.rrrc.org.au/publications/downloads/25i3-JCU-Hughes-T-2010-March-Milestone-Report.pdf.
10. Johnson, JE & Welch, DJ 2010, Marine fisheries management in a changing climate: a review of vulnerability and future options, Reviews in Fisheries Science, 18(1): 106–124.
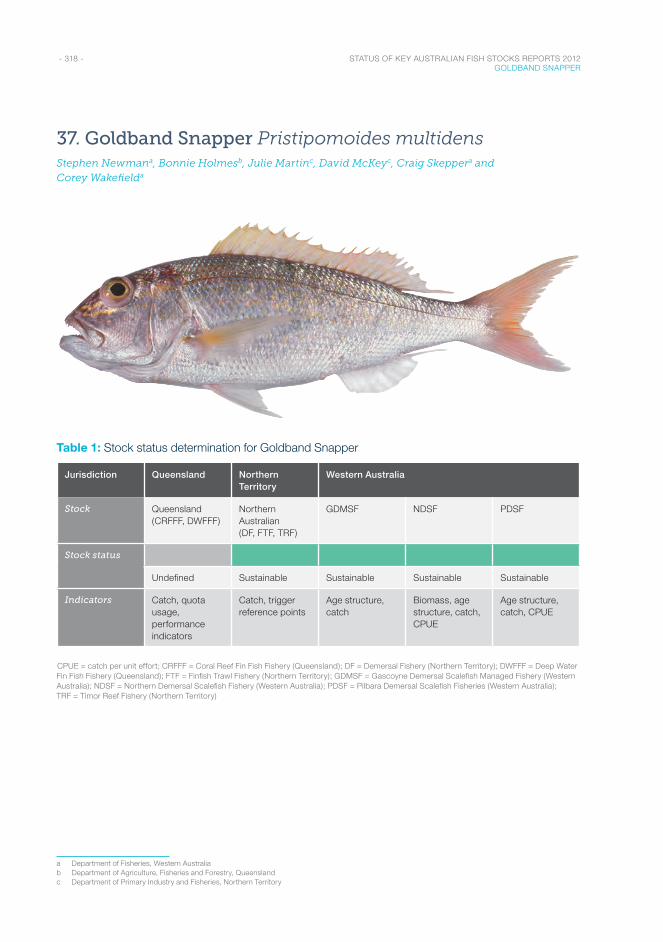
- 318 - STATUS OF KEY AUSTRALIAN FISH STOCKS REPORTS 2012 GOLDBAND SNAPPER
37. Goldband Snapper Pristipomoides multidensStephen Newmana, Bonnie Holmesb, Julie Martinc, David McKeyc, Craig Skeppera and Corey Wakefielda
Table 1: Stock status determination for Goldband Snapper
Jurisdiction Queensland Northern Territory
Western Australia
Stock Queensland (CRFFF, DWFFF)
Northern Australian (DF, FTF, TRF)
GDMSF NDSF PDSF
Stock status
Undefined Sustainable Sustainable Sustainable Sustainable
Indicators Catch, quota usage, performance indicators
Catch, trigger reference points
Age structure, catch
Biomass, age structure, catch, CPUE
Age structure, catch, CPUE
CPUE = catch per unit effort; CRFFF = Coral Reef Fin Fish Fishery (Queensland); DF = Demersal Fishery (Northern Territory); DWFFF = Deep Water Fin Fish Fishery (Queensland); FTF = Finfish Trawl Fishery (Northern Territory); GDMSF = Gascoyne Demersal Scalefish Managed Fishery (Western Australia); NDSF = Northern Demersal Scalefish Fishery (Western Australia); PDSF = Pilbara Demersal Scalefish Fisheries (Western Australia); TRF = Timor Reef Fishery (Northern Territory)
a Department of Fisheries, Western Australiab Department of Agriculture, Fisheries and Forestry, Queenslandc Department of Primary Industry and Fisheries, Northern Territory
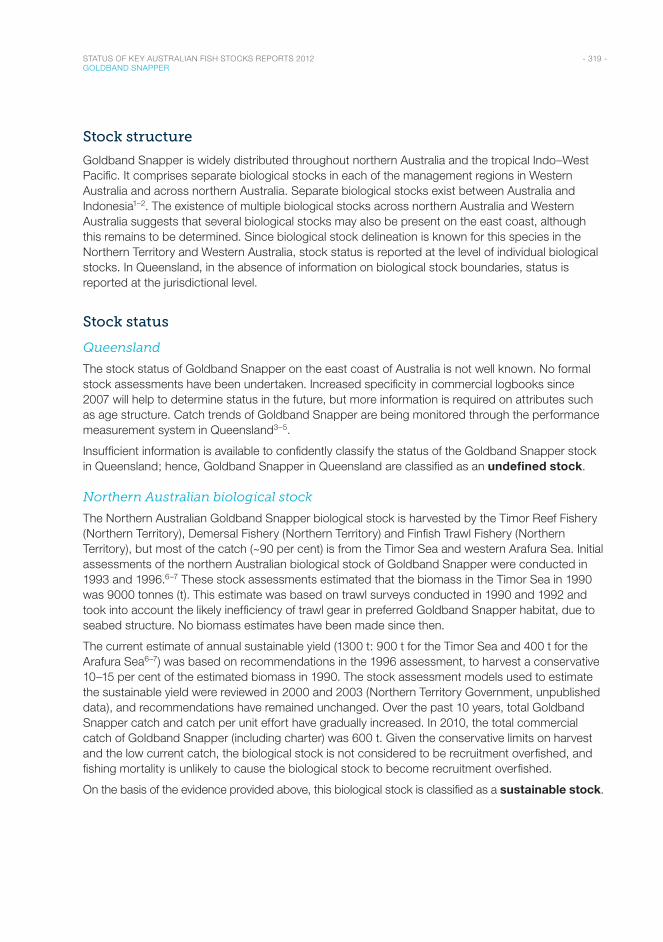
- 319 - STATUS OF KEY AUSTRALIAN FISH STOCKS REPORTS 2012 GOLDBAND SNAPPER
Stock structure
Goldband Snapper is widely distributed throughout northern Australia and the tropical Indo–West Pacific. It comprises separate biological stocks in each of the management regions in Western Australia and across northern Australia. Separate biological stocks exist between Australia and Indonesia1–2. The existence of multiple biological stocks across northern Australia and Western Australia suggests that several biological stocks may also be present on the east coast, although this remains to be determined. Since biological stock delineation is known for this species in the Northern Territory and Western Australia, stock status is reported at the level of individual biological stocks. In Queensland, in the absence of information on biological stock boundaries, status is reported at the jurisdictional level.
Stock status
Queensland
The stock status of Goldband Snapper on the east coast of Australia is not well known. No formal stock assessments have been undertaken. Increased specificity in commercial logbooks since 2007 will help to determine status in the future, but more information is required on attributes such as age structure. Catch trends of Goldband Snapper are being monitored through the performance measurement system in Queensland3–5.
Insufficient information is available to confidently classify the status of the Goldband Snapper stock in Queensland; hence, Goldband Snapper in Queensland are classified as an undefined stock.
Northern Australian biological stock
The Northern Australian Goldband Snapper biological stock is harvested by the Timor Reef Fishery (Northern Territory), Demersal Fishery (Northern Territory) and Finfish Trawl Fishery (Northern Territory), but most of the catch (~90 per cent) is from the Timor Sea and western Arafura Sea. Initial assessments of the northern Australian biological stock of Goldband Snapper were conducted in 1993 and 1996.6–7 These stock assessments estimated that the biomass in the Timor Sea in 1990 was 9000 tonnes (t). This estimate was based on trawl surveys conducted in 1990 and 1992 and took into account the likely inefficiency of trawl gear in preferred Goldband Snapper habitat, due to seabed structure. No biomass estimates have been made since then.
The current estimate of annual sustainable yield (1300 t: 900 t for the Timor Sea and 400 t for the Arafura Sea6–7) was based on recommendations in the 1996 assessment, to harvest a conservative 10–15 per cent of the estimated biomass in 1990. The stock assessment models used to estimate the sustainable yield were reviewed in 2000 and 2003 (Northern Territory Government, unpublished data), and recommendations have remained unchanged. Over the past 10 years, total Goldband Snapper catch and catch per unit effort have gradually increased. In 2010, the total commercial catch of Goldband Snapper (including charter) was 600 t. Given the conservative limits on harvest and the low current catch, the biological stock is not considered to be recruitment overfished, and fishing mortality is unlikely to cause the biological stock to become recruitment overfished.
On the basis of the evidence provided above, this biological stock is classified as a sustainable stock.
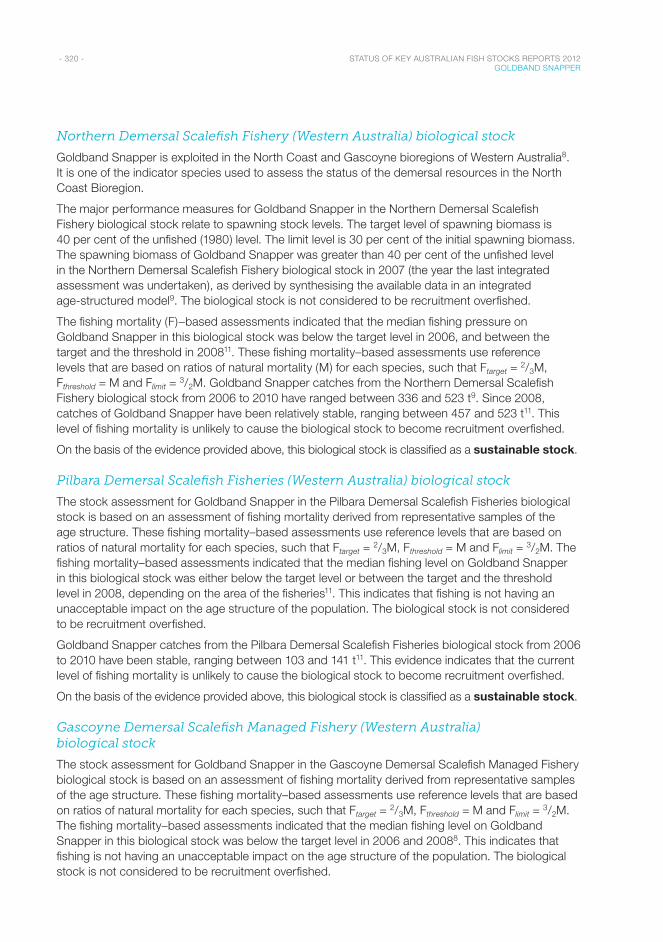
- 320 - STATUS OF KEY AUSTRALIAN FISH STOCKS REPORTS 2012 GOLDBAND SNAPPER
Northern Demersal Scalefish Fishery (Western Australia) biological stock
Goldband Snapper is exploited in the North Coast and Gascoyne bioregions of Western Australia8. It is one of the indicator species used to assess the status of the demersal resources in the North Coast Bioregion.
The major performance measures for Goldband Snapper in the Northern Demersal Scalefish Fishery biological stock relate to spawning stock levels. The target level of spawning biomass is 40 per cent of the unfished (1980) level. The limit level is 30 per cent of the initial spawning biomass. The spawning biomass of Goldband Snapper was greater than 40 per cent of the unfished level in the Northern Demersal Scalefish Fishery biological stock in 2007 (the year the last integrated assessment was undertaken), as derived by synthesising the available data in an integrated age-structured model9. The biological stock is not considered to be recruitment overfished.
The fishing mortality (F)–based assessments indicated that the median fishing pressure on Goldband Snapper in this biological stock was below the target level in 2006, and between the target and the threshold in 200811. These fishing mortality–based assessments use reference levels that are based on ratios of natural mortality (M) for each species, such that Ftarget = 2/3M, Fthreshold = M and Flimit = 3/2M. Goldband Snapper catches from the Northern Demersal Scalefish Fishery biological stock from 2006 to 2010 have ranged between 336 and 523 t9. Since 2008, catches of Goldband Snapper have been relatively stable, ranging between 457 and 523 t11. This level of fishing mortality is unlikely to cause the biological stock to become recruitment overfished.
On the basis of the evidence provided above, this biological stock is classified as a sustainable stock.
Pilbara Demersal Scalefish Fisheries (Western Australia) biological stock
The stock assessment for Goldband Snapper in the Pilbara Demersal Scalefish Fisheries biological stock is based on an assessment of fishing mortality derived from representative samples of the age structure. These fishing mortality–based assessments use reference levels that are based on ratios of natural mortality for each species, such that Ftarget = 2/3M, Fthreshold = M and Flimit = 3/2M. The fishing mortality–based assessments indicated that the median fishing level on Goldband Snapper in this biological stock was either below the target level or between the target and the threshold level in 2008, depending on the area of the fisheries11. This indicates that fishing is not having an unacceptable impact on the age structure of the population. The biological stock is not considered to be recruitment overfished.
Goldband Snapper catches from the Pilbara Demersal Scalefish Fisheries biological stock from 2006 to 2010 have been stable, ranging between 103 and 141 t11. This evidence indicates that the current level of fishing mortality is unlikely to cause the biological stock to become recruitment overfished.
On the basis of the evidence provided above, this biological stock is classified as a sustainable stock.
Gascoyne Demersal Scalefish Managed Fishery (Western Australia) biological stock
The stock assessment for Goldband Snapper in the Gascoyne Demersal Scalefish Managed Fishery biological stock is based on an assessment of fishing mortality derived from representative samples of the age structure. These fishing mortality–based assessments use reference levels that are based on ratios of natural mortality for each species, such that Ftarget = 2/3M, Fthreshold = M and Flimit = 3/2M. The fishing mortality–based assessments indicated that the median fishing level on Goldband Snapper in this biological stock was below the target level in 2006 and 20088. This indicates that fishing is not having an unacceptable impact on the age structure of the population. The biological stock is not considered to be recruitment overfished.
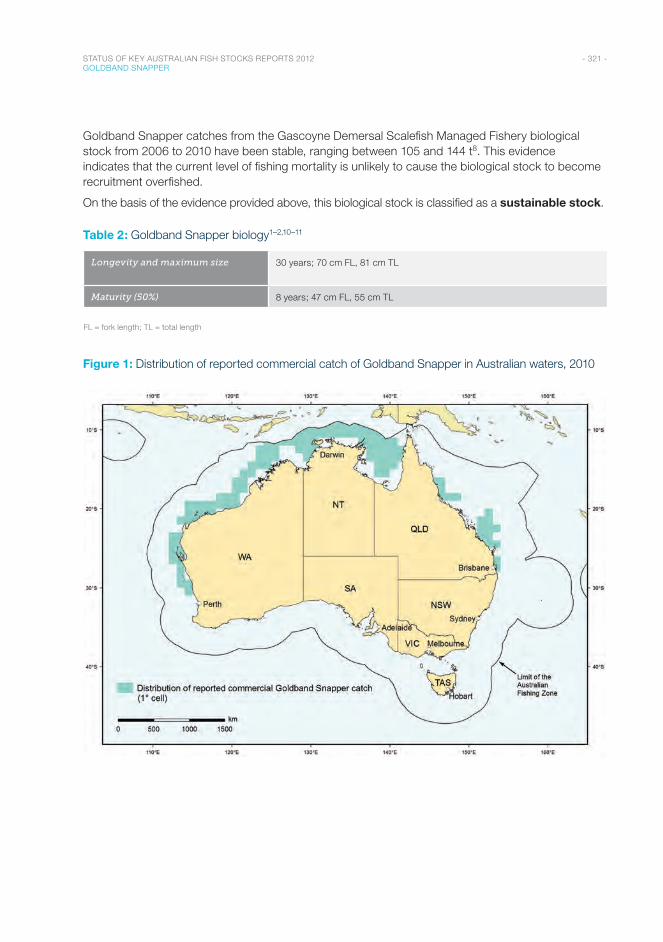
- 321 - STATUS OF KEY AUSTRALIAN FISH STOCKS REPORTS 2012 GOLDBAND SNAPPER
Goldband Snapper catches from the Gascoyne Demersal Scalefish Managed Fishery biological stock from 2006 to 2010 have been stable, ranging between 105 and 144 t8. This evidence indicates that the current level of fishing mortality is unlikely to cause the biological stock to become recruitment overfished.
On the basis of the evidence provided above, this biological stock is classified as a sustainable stock.
Table 2: Goldband Snapper biology1–2,10–11
Longevity and maximum size 30 years; 70 cm FL, 81 cm TL
Maturity (50%) 8 years; 47 cm FL, 55 cm TL
FL = fork length; TL = total length
Figure 1: Distribution of reported commercial catch of Goldband Snapper in Australian waters, 2010

- 322 - STATUS OF KEY AUSTRALIAN FISH STOCKS REPORTS 2012 GOLDBAND SNAPPER
Main features and statistics for Goldband Snapper fisheries in Australia in 2010
• Goldband Snapper is taken commercially using baited traps, vertical lines (drop lines, longlines and hand lines) and semidemersal fish trawls. Charter and recreational catch is typically taken by rod and reel using bait, lures or jigs.
• A range of input and output controls have been applied to Goldband Snapper across the three jurisdictions:
> Input controls include limited entry, gear restrictions, spatial zonation and effort limits.
> Output controls include total allowable catches, and recreational size and bag limits.
• In 2010, Goldband Snapper catch was reported from 28 vessels from the Coral Reef Fin Fish Fishery (Queensland), 17 vessels from the Northern Territory, 7 vessels from the Northern Demersal Scalefish Fishery (Western Australia) and 10 vessels from the Gascoyne Demersal Scalefish Managed Fishery (Western Australia). Twenty three vessels reported catch of Goldband Snapper in the Pilbara Demersal Scalefish Fisheries (Western Australia) (comprising 6 vessels from the Pilbara Fish Trawl and Pilbara Fish Trap fisheries and 7 vessels from the Pilbara Line Fishery). A small quantity of Goldband Snapper was reported as incidental catch by 2 vessels from the Gulf of Carpentaria.
• Total commercial catch of Goldband Snapper across Australia in 2010 was 1410 t, comprising 52 t in Queensland (2009–10 financial year), 600 t in the Northern Territory and 758 t in Western Australia (523 t in the Northern Demersal Scalefish Fishery, 141 t in the Pilbara Demersal Scalefish Fisheries and 94 t in the Gascoyne Demersal Scalefish Managed Fishery).
• The total amount of Goldband Snapper caught in the charter sector in 2010 was around 10 t, comprising 350 kg on the Queensland east coast, 0.5 t in the Northern Territory and 8.8 t in Western Australia. No data are available for the recreational catch in 2010 on the east coast of Australia, the Gulf of Carpentaria, the Northern Territory or Western Australia. Indigenous catches for the northern Australian biological stocks are considered to be negligible12.
• The impact of illegal, unreported and unregulated (IUU) fishing in northern Australian waters, primarily by foreign fishers, remains uncertain. However, since 2007, increased surveillance across the north of Australia has resulted in a substantial reduction in the number of foreign fishing vessels accessing Australian waters. The scale and magnitude of IUU fishing, and thus its contribution to exploitation status or recovery of fish populations and ecosystems, are not known; this is an area of uncertainty in stock assessments.
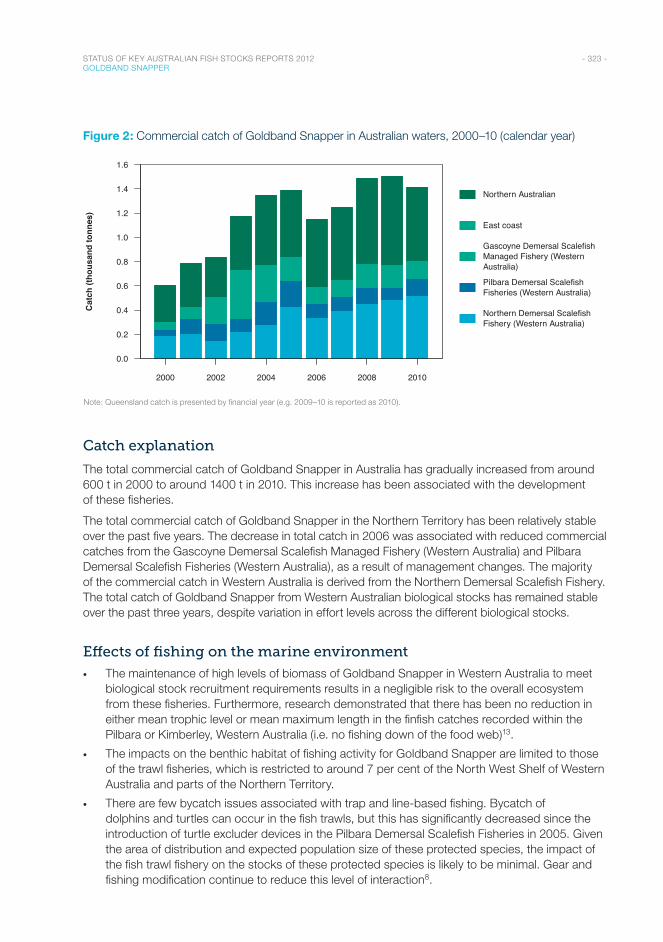
- 323 - STATUS OF KEY AUSTRALIAN FISH STOCKS REPORTS 2012 GOLDBAND SNAPPER
Figure 2: Commercial catch of Goldband Snapper in Australian waters, 2000–10 (calendar year)
Year
2000 2002 2004 2006 2008 2010
0.0
0.2
0.4
0.6
0.8
1.0
1.2
1.4
1.6
Northern Australian
East coast
Gascoyne Demersal ScalefishManaged Fishery (WesternAustralia)
Pilbara Demersal ScalefishFisheries (Western Australia)
Northern Demersal ScalefishFishery (Western Australia)
Cat
ch (t
hous
and
tonn
es)
Note: Queensland catch is presented by financial year (e.g. 2009–10 is reported as 2010).
Catch explanation
The total commercial catch of Goldband Snapper in Australia has gradually increased from around 600 t in 2000 to around 1400 t in 2010. This increase has been associated with the development of these fisheries.
The total commercial catch of Goldband Snapper in the Northern Territory has been relatively stable over the past five years. The decrease in total catch in 2006 was associated with reduced commercial catches from the Gascoyne Demersal Scalefish Managed Fishery (Western Australia) and Pilbara Demersal Scalefish Fisheries (Western Australia), as a result of management changes. The majority of the commercial catch in Western Australia is derived from the Northern Demersal Scalefish Fishery. The total catch of Goldband Snapper from Western Australian biological stocks has remained stable over the past three years, despite variation in effort levels across the different biological stocks.
Effects of fishing on the marine environment
• The maintenance of high levels of biomass of Goldband Snapper in Western Australia to meet biological stock recruitment requirements results in a negligible risk to the overall ecosystem from these fisheries. Furthermore, research demonstrated that there has been no reduction in either mean trophic level or mean maximum length in the finfish catches recorded within the Pilbara or Kimberley, Western Australia (i.e. no fishing down of the food web)13.
• The impacts on the benthic habitat of fishing activity for Goldband Snapper are limited to those of the trawl fisheries, which is restricted to around 7 per cent of the North West Shelf of Western Australia and parts of the Northern Territory.
• There are few bycatch issues associated with trap and line-based fishing. Bycatch of dolphins and turtles can occur in the fish trawls, but this has significantly decreased since the introduction of turtle excluder devices in the Pilbara Demersal Scalefish Fisheries in 2005. Given the area of distribution and expected population size of these protected species, the impact of the fish trawl fishery on the stocks of these protected species is likely to be minimal. Gear and fishing modification continue to reduce this level of interaction8.
- 324 - STATUS OF KEY AUSTRALIAN FISH STOCKS REPORTS 2012 GOLDBAND SNAPPER
Environmental effects on Goldband Snapper
• Climate change and variability have the potential to impact fish stocks in a range of ways, including influencing their geographic distribution (e.g. latitudinal shifts in distribution). However, it is unclear how climate change may affect risks to sustainability.
• Changes in ocean chemistry have the potential to impact on the replenishment rates of fish populations14, and on individual growth rates and spawning output15.
References1. Newman, SJ, Steckis, RA, Edmonds, JS & Lloyd, J 2000, Stock structure of the goldband snapper, Pristipomoides
multidens (Pisces: Lutjanidae) from the waters of northern and western Australia by stable isotope ratio analysis of sagittal otolith carbonate, Marine Ecology Progress Series, 198: 239–247.
2. Ovenden, JR, Lloyd, J, Newman, SJ, Keenan, CP & Slater, LS 2002, Spatial genetic subdivision between northern Australian and southeast Asian populations of Pristipomoides multidens: a tropical marine reef fish species, Fisheries Research, 59(1–2): 57–69.
3. Queensland Department of Employment, Economic Development and Innovation 2010, Annual status report for the Coral Reef Fin Fish Fishery, DEEDI , Brisbane.
4. Queensland Department of Employment, Economic Development and Innovation 2011, Stock status of Queensland’s fisheries resources 2011, DEEDI, Brisbane.
5. Queensland Department of Employment, Economic Development and Innovation 2012, Annual status report for the Deep Water Fin Fish Fishery, DEEDI, Brisbane.
6. Ramm, D 1994, Australia’s Northern Trawl Fishery, final report to the Fisheries Research and Development Corporation project 86/049, Fishery Report 32, Northern Territory Department of Primary Industry and Fisheries, Darwin.
7. Ramm, DC 1997, Towards the sustainable use of Northern Territory fishery resources: review workshops led by Carl J Walters, final report to the Fisheries Research and Development Corporation, project 96/158, Fishery Report 39, Northern Territory Department of Primary Industry and Fisheries, Darwin.
8. Fletcher, WJ & Santoro, K (eds) 2011, State of the fisheries and aquatic resources report 2009/10, Western Australian Department of Fisheries, Perth.
9. Newman, SJ, Wakefield, C, Skepper, C, Marriott, R, Cliff, M, Boddington, D, Mitsopoulos, G, Rome, B, Green, R & Blazeski, S 2011, North coast demersal fisheries status report, in WJ Fletcher & K Santoro (eds), State of the fisheries and aquatic resources report 2010/11, Western Australian Department of Fisheries, Perth, 190–208.
10. Newman, SJ & Dunk, IJ 2003, Age validation, growth, mortality and additional population parameters of the goldband snapper (Pristipomoides multidens) off the Kimberley coast of northwestern Australia, Fishery Bulletin, 101(1): 116–128.
11. Newman, SJ, Moran, MJ & Lenanton, RCJ 2001, Stock assessment of the outer-shelf species in the Kimberley region of tropical Western Australia, final report to the Fisheries Research and Development Corporation, project 97/136, Fisheries Western Australia, Perth.
12. Henry, GW & Lyle, JM 2003, The national recreational and indigenous fishing survey, Fisheries Research and Development Corporation project 99/158, Australian Government Department of Agriculture, Fisheries and Forestry, Canberra, http://eprints.utas.edu.au/2526/1/Henry_Lyle_Nationalsurvey.pdf.
13. Hall, NG & Wise, BS 2011, Development of an ecosystem approach to the monitoring and management of Western Australian fisheries, report to the Fisheries Research and Development Corporation, project 2005-063, Fisheries Research Report 215, Western Australian Department of Fisheries, Perth.
14. Hughes, T 2010, Marine and Tropical Sciences Research Facility milestone report for program 2.5i.3, report to the Australian Government Department of the Environment, Water, Heritage and the Arts, Canberra, www.rrrc.org.au/publications/downloads/25i3-JCU-Hughes-T-2010-March-Milestone-Report.pdf.
15. Johnson, JE & Welch, DJ 2010, Marine fisheries management in a changing climate: a review of vulnerability and future options, Reviews in Fisheries Science, 18(1): 106–124.
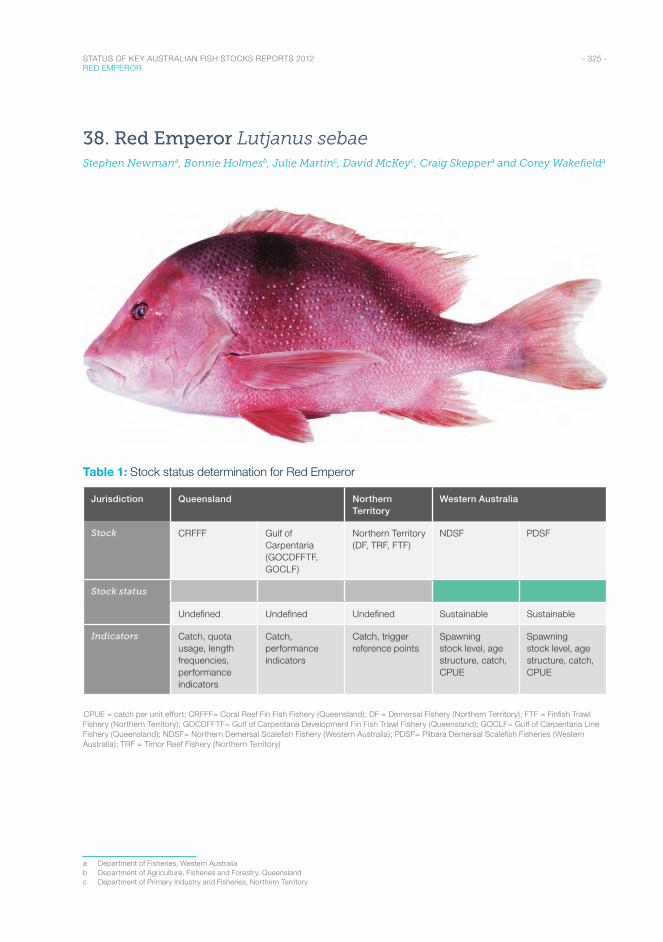
- 325 - STATUS OF KEY AUSTRALIAN FISH STOCKS REPORTS 2012 RED EMPEROR
38. Red Emperor Lutjanus sebaeStephen Newmana, Bonnie Holmesb, Julie Martinc, David McKeyc, Craig Skeppera and Corey Wakefielda
Table 1: Stock status determination for Red Emperor
Jurisdiction Queensland Northern Territory
Western Australia
Stock CRFFF Gulf of Carpentaria (GOCDFFTF, GOCLF)
Northern Territory (DF, TRF, FTF)
NDSF PDSF
Stock status
Undefined Undefined Undefined Sustainable Sustainable
Indicators Catch, quota usage, length frequencies, performance indicators
Catch, performance indicators
Catch, trigger reference points
Spawning stock level, age structure, catch, CPUE
Spawning stock level, age structure, catch, CPUE
CPUE = catch per unit effort; CRFFF= Coral Reef Fin Fish Fishery (Queensland); DF = Demersal Fishery (Northern Territory); FTF = Finfish Trawl Fishery (Northern Territory); GOCDFFTF= Gulf of Carpentaria Development Fin Fish Trawl Fishery (Queensland); GOCLF= Gulf of Carpentaria Line Fishery (Queensland); NDSF= Northern Demersal Scalefish Fishery (Western Australia); PDSF= Pilbara Demersal Scalefish Fisheries (Western Australia); TRF = Timor Reef Fishery (Northern Territory)
a Department of Fisheries, Western Australiab Department of Agriculture, Fisheries and Forestry, Queenslandc Department of Primary Industry and Fisheries, Northern Territory
- 326 - STATUS OF KEY AUSTRALIAN FISH STOCKS REPORTS 2012 RED EMPEROR
Stock structure
Red Emperor is exploited primarily in the North Coast Bioregion of Western Australia1, where it is one of the indicator species used to assess the status of the demersal resources. Smaller catches are taken in the Northern Territory and Queensland. In Western Australia, Red Emperor comprises separate biological stocks, one in each of the main management regions: the Northern Demersal Scalefish Fishery (Western Australia) and the Pilbara Demersal Scalefish Fisheries (Western Australia)2–3. Status is reported at the level of individual biological stocks in Western Australia. Since multiple biological stocks are present in Western Australia, there is a high likelihood of multiple biological stocks across the Northern Territory. However, there is currently no clear evidence of biological stock delineation in this jurisdiction, and status is reported at the jurisdictional level. Separate biological stocks are present in the Gulf of Carpentaria and on the Queensland east coast4. Status is reported at the level of individual biological stocks in Queensland.
Stock status
Coral Reef Fin Fish Fishery (Queensland) biological stock
Commercial catches have increased steadily since the introduction of quota in 2003–04. Increased specificity in commercial logbooks implemented in 2007 will help to determine status in the future, but more information is required on age structure and recreational catch5–6. There is currently insufficient information available to confidently classify the status of the biological stock; hence the biological stock is classified as an undefined stock.
Gulf of Carpentaria biological stock
Commercial catches and catch rates have increased since 2007. Limited data are available on the distribution and abundance of Red Emperor in the Gulf of Carpentaria5–7. There is currently insufficient information available to confidently classify the status of the biological stock; hence the biological stock is classified as an undefined stock.
Northern Territory
Red Emperor comprises around 2 per cent of the total catch in the Northern Territory offshore snapper fisheries and is managed as part of the ‘byproduct’ species group in the Demersal Fishery and Finfish Trawl Fishery (Northern Territory). The performance indicators and trigger points are based on significant changes in species composition of the catch8. Since 1995, catches of Red Emperor have remained at 2–4.5 per cent of the total annual catch and, since 2002, catches have remained between 40 and 50 tonnes (t). The trigger reference point (if annual catch increases as a proportion of the total catch by more than 25 per cent above the five-year average) was not reached in 2010.
This evidence indicates that the current level of fishing mortality is unlikely to cause Red Emperor in the Northern Territory to become recruitment overfished. However, at present, insufficient information is available to determine the biomass of the species. On the basis of the evidence provided above, Red Emperor in the Northern Territory is classified as an undefined stock.
Northern Demersal Scalefish Fishery (Western Australia) biological stock
The major performance measures for Red Emperor in the Northern Demersal Scalefish Fishery (Western Australia) biological stock relate to spawning stock levels. The target level of spawning biomass is 40 per cent of unfished (1980) levels. The limit level is 30 per cent of the unfished levels. The spawning biomass of Red Emperor was greater than 40 per cent of the unfished
- 327 - STATUS OF KEY AUSTRALIAN FISH STOCKS REPORTS 2012 RED EMPEROR
level in the Northern Demersal Scalefish Fishery (Western Australia) biological stock in 2007 (the year the last integrated assessment was undertaken), as derived by synthesising the available data in an integrated age-structured model9. The biological stock is not considered to be recruitment overfished.
An assessment of fishing mortality derived from representative samples of the age structure of Red Emperor was also undertaken for the Northern Demersal Scalefish Fishery (Western Australia) biological stock in 2006 and 2008. These fishing mortality (F)–based assessments use reference levels that are based on ratios of natural mortality (M) for each species, such that Ftarget = 2/3M, Fthreshold = M and Flimit = 3/2M. The fishing mortality–based assessments indicated that the fishing level on Red Emperor was lower than the target level in 2006 and 20089. This indicates that fishing is not having an unacceptable impact on the age structure of the population.
Red Emperor catch levels in the Northern Demersal Scalefish Fishery from 2006 to 2010 have been relatively stable, ranging between 142 and 176 t9. This evidence indicates that the current level of fishing mortality is unlikely to cause the biological stock to become recruitment overfished.
On the basis of the evidence provided above, the biological stock is classified as a sustainable stock.
Pilbara Demersal Scalefish Fisheries (Western Australia) biological stock
The major performance measures for Red Emperor in the Pilbara Demersal Scalefish Fisheries biological stock are similar to those in the Northern Demersal Scalefish Fishery (Western Australia) biological stock and relate to spawning stock levels. The target level of spawning biomass is 40 per cent of unfished (1972) biomass. The limit level is 30 per cent of the unfished spawning biomass. The spawning biomass of Red Emperor overall was greater than 40 per cent of the unfished level in the Pilbara Demersal Scalefish Fisheries (Western Australia) biological stock in 2007 (the year the last integrated assessment was undertaken), as derived by synthesising the available data in an integrated age-structured model9. The biological stock is not considered to be recruitment overfished.
An assessment of fishing mortality derived from representative samples of the age structure of Red Emperor was also undertaken for separate management areas in the Pilbara Demersal Scalefish Fisheries (Western Australia) in 2007. These fishing mortality (F)–based assessments use reference levels that are based on ratios of natural mortality (M) for each species, such that Ftarget = 2/3M, Fthreshold = M and Flimit = 3/2M. The fishing mortality–based assessments indicated that the fishing level on Red Emperor in 2007 was between the target and the threshold level, but above the limit level in some areas9. This indicates that fishing was having an impact on the age structure of the population in some management areas. Effort reductions since 2008 have resulted in decreasing and stabilising catch levels. In 2007, the Red Emperor catch in the Pilbara Demersal Scalefish Fisheries was 187 t. The catch dropped to 154 t in 2008 and remained at a similar level in 2009 (159 t) and 2010 (167 t). From 2008 to 2010, the catch-rate trends of Red Emperor in all trawl managed areas increased each year. This was considered to be a response to the effort reductions imposed on the trawl fishery since 2008. This evidence indicates that the current level of fishing mortality is unlikely to cause the biological stock to become recruitment overfished.
On the basis of the evidence provided above, the biological stock is classified as a sustainable stock.
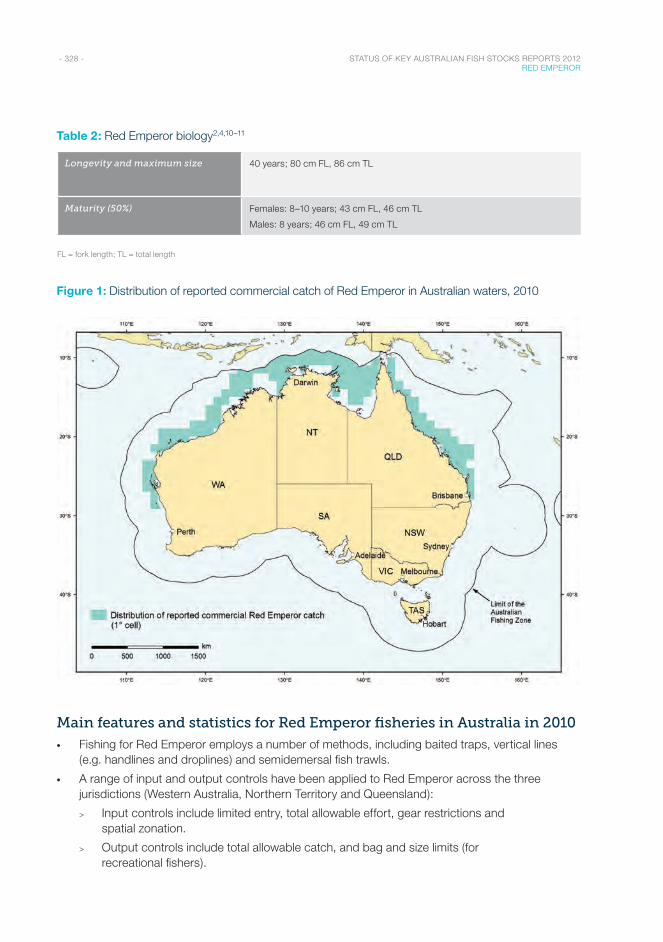
- 328 - STATUS OF KEY AUSTRALIAN FISH STOCKS REPORTS 2012 RED EMPEROR
Table 2: Red Emperor biology2,4,10–11
Longevity and maximum size 40 years; 80 cm FL, 86 cm TL
Maturity (50%) Females: 8–10 years; 43 cm FL, 46 cm TL
Males: 8 years; 46 cm FL, 49 cm TL
FL = fork length; TL = total length
Figure 1: Distribution of reported commercial catch of Red Emperor in Australian waters, 2010
Main features and statistics for Red Emperor fisheries in Australia in 2010
• Fishing for Red Emperor employs a number of methods, including baited traps, vertical lines (e.g. handlines and droplines) and semidemersal fish trawls.
• A range of input and output controls have been applied to Red Emperor across the three jurisdictions (Western Australia, Northern Territory and Queensland):
> Input controls include limited entry, total allowable effort, gear restrictions and spatial zonation.
> Output controls include total allowable catch, and bag and size limits (for recreational fishers).
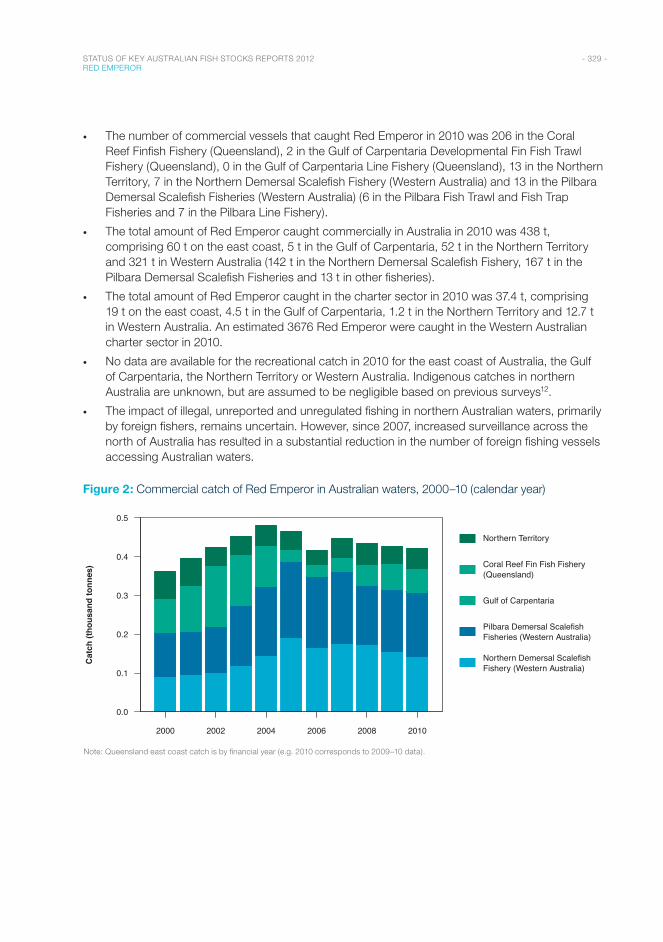
- 329 - STATUS OF KEY AUSTRALIAN FISH STOCKS REPORTS 2012 RED EMPEROR
• The number of commercial vessels that caught Red Emperor in 2010 was 206 in the Coral Reef Finfish Fishery (Queensland), 2 in the Gulf of Carpentaria Developmental Fin Fish Trawl Fishery (Queensland), 0 in the Gulf of Carpentaria Line Fishery (Queensland), 13 in the Northern Territory, 7 in the Northern Demersal Scalefish Fishery (Western Australia) and 13 in the Pilbara Demersal Scalefish Fisheries (Western Australia) (6 in the Pilbara Fish Trawl and Fish Trap Fisheries and 7 in the Pilbara Line Fishery).
• The total amount of Red Emperor caught commercially in Australia in 2010 was 438 t, comprising 60 t on the east coast, 5 t in the Gulf of Carpentaria, 52 t in the Northern Territory and 321 t in Western Australia (142 t in the Northern Demersal Scalefish Fishery, 167 t in the Pilbara Demersal Scalefish Fisheries and 13 t in other fisheries).
• The total amount of Red Emperor caught in the charter sector in 2010 was 37.4 t, comprising 19 t on the east coast, 4.5 t in the Gulf of Carpentaria, 1.2 t in the Northern Territory and 12.7 t in Western Australia. An estimated 3676 Red Emperor were caught in the Western Australian charter sector in 2010.
• No data are available for the recreational catch in 2010 for the east coast of Australia, the Gulf of Carpentaria, the Northern Territory or Western Australia. Indigenous catches in northern Australia are unknown, but are assumed to be negligible based on previous surveys12.
• The impact of illegal, unreported and unregulated fishing in northern Australian waters, primarily by foreign fishers, remains uncertain. However, since 2007, increased surveillance across the north of Australia has resulted in a substantial reduction in the number of foreign fishing vessels accessing Australian waters.
Figure 2: Commercial catch of Red Emperor in Australian waters, 2000–10 (calendar year)
Year
2000 2002 2004 2006 2008 2010
0.0
0.1
0.2
0.3
0.4
0.5
Northern Territory
Coral Reef Fin Fish Fishery(Queensland)
Gulf of Carpentaria
Pilbara Demersal ScalefishFisheries (Western Australia)
Northern Demersal ScalefishFishery (Western Australia)
Cat
ch (t
hous
and
tonn
es)
Note: Queensland east coast catch is by financial year (e.g. 2010 corresponds to 2009–10 data).
- 330 - STATUS OF KEY AUSTRALIAN FISH STOCKS REPORTS 2012 RED EMPEROR
Catch explanation
The catch of Red Emperor increased steadily between 2000 and 2004, before levelling out and decreasing slightly towards 2010. Catch from the Northern Territory has remained steady at around 50 t per year since 2002. The decrease in catch from 2004 may relate to the introduction of individual transferable quotas in Queensland’s fisheries, which significantly reduced catch and effort. In more recent years (2009–10), commercial catch has remained steady at approximately 60 t. The total catch of Red Emperor from Western Australian biological stocks has remained relatively stable, despite variation in effort allocation levels across the different biological stocks.
Effects of fishing on the marine environment
• The maintenance of high levels of biomass of Red Emperor in each of the fisheries in Western Australia to meet biological stock recruitment requirements results in a negligible risk to the overall ecosystem from these fisheries. Furthermore, research demonstrated that there has been no reduction in either mean trophic level or mean maximum length in the finfish catches recorded in the Pilbara or Kimberley in Western Australia (i.e. no fishing-down of the food web)13.
• The trap and line-based fishing methods for Red Emperor have minimal impacts on habitat9.
• Impacts on habitat from trawling are expected to be minimal because trawling is restricted to only 7 per cent of the North West Shelf and parts of the Northern Territory. Trawling does not occur in the Kimberley region14.
• Bycatch of dolphins and turtles during trawling has been reduced significantly since the introduction of bycatch reduction devices in Pilbara trawl nets in 2005. Given the area of distribution and expected population size of these protected species, the impact of the fish trawl fishery on the stocks of these protected species is likely to be minimal. Gear and fishing modification continue to reduce the level of interaction1.
Environmental effects on Red Emperor
• Climate change and variability have the potential to impact fish stocks in a range of ways, including influencing their geographic distribution (e.g. latitudinal shifts in distribution). However, it is unclear how climate change may affect risks to sustainability.
• Changes in ocean chemistry have the potential to impact on the replenishment rates of fish populations15, and on individual growth rates and spawning output16.
References1. Fletcher, WJ & Santoro, K (eds) 2011, State of the fisheries and aquatic resources report 2010/11, Western Australian
Department of Fisheries, Perth.
2. Stephenson, PC, Edmonds, JS, Moran, MJ & Caputi, N 2001, Analysis of stable isotopes to investigate stock structure of red emperor and Rankin cod in northern Western Australia, Journal of Fish Biology, 58: 126–144.
3. van Herwerden, L, Aspden, WJ, Newman, SJ, Pegg, GG, Briskey, L & Sinclair, W 2009, A comparison of the population genetics of Lethrinus miniatus and Lutjanus sebae from the east and west coasts of Australia: evidence for panmixia and isolation, Fisheries Research, 100(2): 148–155.
4. O’Neill, MF, Leigh, GM, Martin, JM, Newman, SJ, Chambers, M, Dichmont, CM & Buckworth, RC 2011, Sustaining productivity of tropical red snappers using new monitoring and reference points, Fisheries Research and Development Corporation project 2009/037, Queensland Department of Employment, Economic Development and Innovation, Brisbane, www.frdc.com.au/research/Documents/Final_reports/2009-037-DLD.pdf.
5. Queensland Department of Employment, Economic Development and Innovation 2010, Annual status report for the Coral Reef Fin Fish Fishery, DEEDI Brisbane.
- 331 - STATUS OF KEY AUSTRALIAN FISH STOCKS REPORTS 2012 RED EMPEROR
6. Queensland Department of Employment, Economic Development and Innovation 2011, Stock status of Queensland’s fisheries resources 2011, DEEDI, Brisbane.
7. Queensland Department of Employment, Economic Development and Innovation 2010b, Annual status report for the Gulf of Carpentaria Line Fishery, DEEDI, Brisbane.
8. Northern Territory Government 2011, Fishery status reports 2010, Fishery Report 106, Northern Territory Government Department of Resources, Darwin.
9. Newman, SJ, Wakefield, C, Skepper, C, Marriott, R, Cliff, M, Boddington, D, Mitsopoulos, G, Rome, B, Green, R & Blazeski, S 2011, North coast demersal fisheries status report, in WJ Fletcher & K Santoro (eds), State of the fisheries and aquatic resources report 2010/11, Western Australian Department of Fisheries, Perth, 190–208.
10. Newman, SJ, Moran, MJ & Lenanton, RCJ 2001, Stock assessment of the outer-shelf species in the Kimberley region of tropical Western Australia, final Report to the Fisheries Research and Development Corporation, project 97/136, Western Australian Department of Fisheries, Perth.
11. Newman, SJ, Skepper, CL & Wakefield, CB 2010, Age estimation and otolith characteristics of an unusually old, red emperor snapper (Lutjanus sebae) captured off the Kimberley coast of north-western Australia, Journal of Applied Ichthyology, 26(1): 120–122.
12. Henry, GW & Lyle, JM 2003, The national recreational and Indigenous fishing survey, Fisheries Research and Development Corporation project 99/158, Australian Government Department of Agriculture, Fisheries and Forestry, Canberra, http://eprints.utas.edu.au/2526/1/Henry_Lyle_Nationalsurvey.pdf.
13. Hall, NG & Wise, BS 2011, Development of an ecosystem approach to the monitoring and management of Western Australian fisheries, report to the Fisheries Research and Development Corporation, project 2005-063, Fisheries Research Report 215, Western Australian Department of Fisheries, Perth.
14. Newman, SJ & Dunk, IJ 2002, Growth, age validation, mortality, and other population characteristics of the red emperor snapper, Lutjanus sebae (Cuvier, 1828), off the Kimberley coast of north-western Australia, Estuarine, Coastal and Shelf Science, 55(1): 67–80.
15. Hughes, T 2010, Marine and Tropical Sciences Research Facility milestone report for program 2.5i.3, report to the Australian Government Department of the Environment, Water, Heritage and the Arts, Canberra, www.rrrc.org.au/publications/downloads/25i3-JCU-Hughes-T-2010-March-Milestone-Report.pdf.
16. Johnson, JE & Welch, DJ 2010, Marine fisheries management in a changing climate: a review of vulnerability and future options, Reviews in Fisheries Science, 18(1): 106–124.
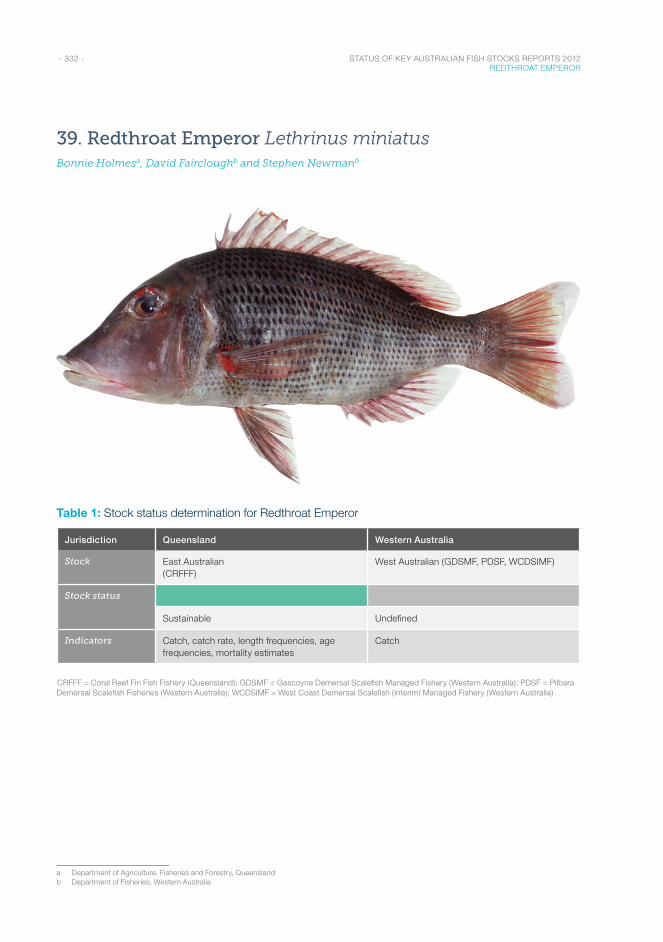
- 332 - STATUS OF KEY AUSTRALIAN FISH STOCKS REPORTS 2012 REDTHROAT EMPEROR
39. Redthroat Emperor Lethrinus miniatusBonnie Holmesa, David Faircloughb and Stephen Newmanb
Table 1: Stock status determination for Redthroat Emperor
Jurisdiction Queensland Western Australia
Stock East Australian (CRFFF)
West Australian (GDSMF, PDSF, WCDSIMF)
Stock status
Sustainable Undefined
Indicators Catch, catch rate, length frequencies, age frequencies, mortality estimates
Catch
CRFFF = Coral Reef Fin Fish Fishery (Queensland); GDSMF = Gascoyne Demersal Scalefish Managed Fishery (Western Australia); PDSF = Pilbara Demersal Scalefish Fisheries (Western Australia); WCDSIMF = West Coast Demersal Scalefish (Interim) Managed Fishery (Western Australia)
a Department of Agriculture, Fisheries and Forestry, Queenslandb Department of Fisheries, Western Australia
- 333 - STATUS OF KEY AUSTRALIAN FISH STOCKS REPORTS 2012 REDTHROAT EMPEROR
Stock structure
Genetic analysis suggests that there are two separate biological stocks of Redthroat Emperor in western and eastern Australian waters1. Hence, reporting is undertaken at the biological stock level.
Stock status
East Australian biological stock
The most recent assessment of the Redthroat Emperor biological stock2 analysed fishery data using an age-structured model that incorporated all available information on catch, catch per unit effort and age structure. The model estimated that biomass in 2004 was approximately 70 per cent of the unfished (1946) level. The biological stock is not considered to be recruitment overfished.
The assessment also indicated that commercial catch has been well below the current total allowable commercial catch (TACC) (700 tonnes [t]) each year since the TACC was set in 2006; only 43 per cent of the quota was taken in the 2009–10 season. This level of fishing mortality is unlikely to cause the biological stock to become recruitment overfished.
On the basis of the evidence provided above, the biological stock is classified as a sustainable stock.
West Australian biological stock
No stock assessment has been completed. Insufficient information is available to confidently classify the status of this biological stock; as a result, the biological stock is classified as an undefined stock.
Table 2: Redthroat Emperor biology1,3–4
Longevity and maximum size 20 years; 65 cm TL
Maturity (50%) Females: ~31 cm TL
TL = total length
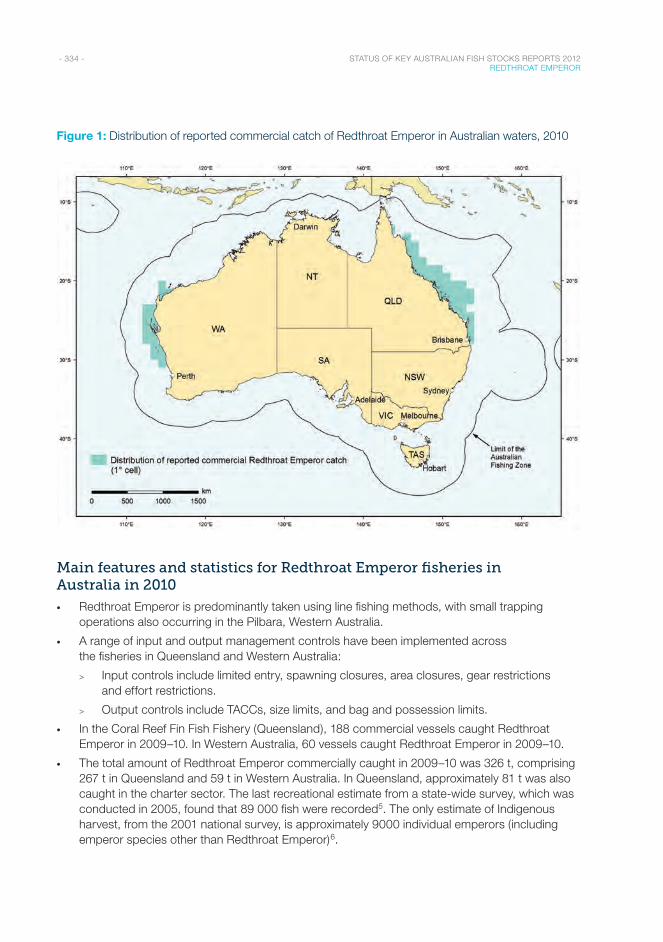
- 334 - STATUS OF KEY AUSTRALIAN FISH STOCKS REPORTS 2012 REDTHROAT EMPEROR
Figure 1: Distribution of reported commercial catch of Redthroat Emperor in Australian waters, 2010
Main features and statistics for Redthroat Emperor fisheries in Australia in 2010
• Redthroat Emperor is predominantly taken using line fishing methods, with small trapping operations also occurring in the Pilbara, Western Australia.
• A range of input and output management controls have been implemented across the fisheries in Queensland and Western Australia:
> Input controls include limited entry, spawning closures, area closures, gear restrictions and effort restrictions.
> Output controls include TACCs, size limits, and bag and possession limits.
• In the Coral Reef Fin Fish Fishery (Queensland), 188 commercial vessels caught Redthroat Emperor in 2009–10. In Western Australia, 60 vessels caught Redthroat Emperor in 2009–10.
• The total amount of Redthroat Emperor commercially caught in 2009–10 was 326 t, comprising 267 t in Queensland and 59 t in Western Australia. In Queensland, approximately 81 t was also caught in the charter sector. The last recreational estimate from a state-wide survey, which was conducted in 2005, found that 89 000 fish were recorded5. The only estimate of Indigenous harvest, from the 2001 national survey, is approximately 9000 individual emperors (including emperor species other than Redthroat Emperor)6.
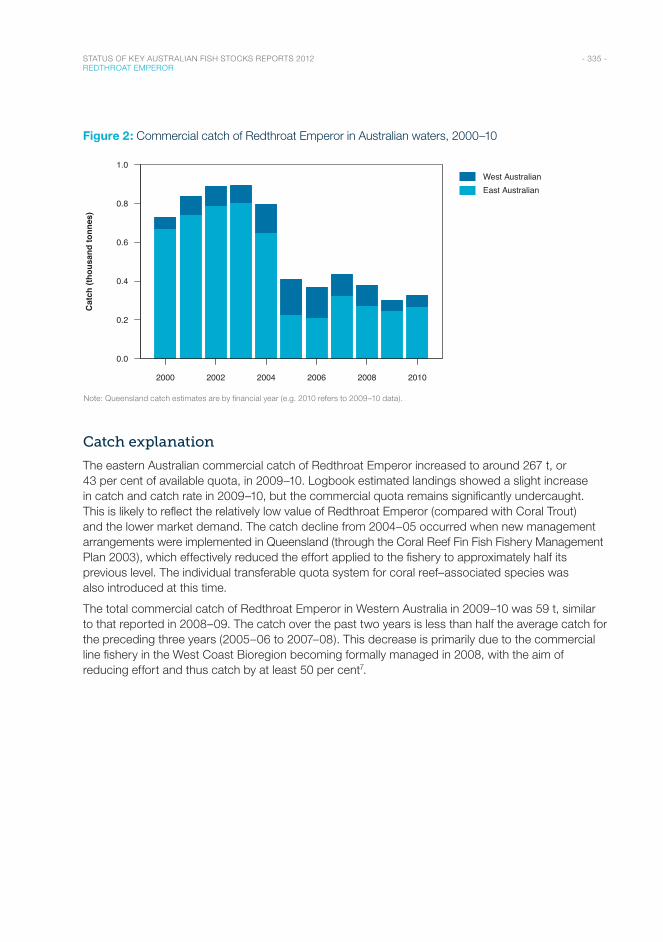
- 335 - STATUS OF KEY AUSTRALIAN FISH STOCKS REPORTS 2012 REDTHROAT EMPEROR
Figure 2: Commercial catch of Redthroat Emperor in Australian waters, 2000–10
Year
2000 2002 2004 2006 2008 2010
0.0
0.2
0.4
0.6
0.8
1.0West AustralianEast Australian
Cat
ch (t
hous
and
tonn
es)
Note: Queensland catch estimates are by financial year (e.g. 2010 refers to 2009–10 data).
Catch explanation
The eastern Australian commercial catch of Redthroat Emperor increased to around 267 t, or 43 per cent of available quota, in 2009–10. Logbook estimated landings showed a slight increase in catch and catch rate in 2009–10, but the commercial quota remains significantly undercaught. This is likely to reflect the relatively low value of Redthroat Emperor (compared with Coral Trout) and the lower market demand. The catch decline from 2004–05 occurred when new management arrangements were implemented in Queensland (through the Coral Reef Fin Fish Fishery Management Plan 2003), which effectively reduced the effort applied to the fishery to approximately half its previous level. The individual transferable quota system for coral reef–associated species was also introduced at this time.
The total commercial catch of Redthroat Emperor in Western Australia in 2009–10 was 59 t, similar to that reported in 2008–09. The catch over the past two years is less than half the average catch for the preceding three years (2005–06 to 2007–08). This decrease is primarily due to the commercial line fishery in the West Coast Bioregion becoming formally managed in 2008, with the aim of reducing effort and thus catch by at least 50 per cent7.
- 336 - STATUS OF KEY AUSTRALIAN FISH STOCKS REPORTS 2012 REDTHROAT EMPEROR
Effects of fishing on the marine environment
• Beyond the removal of fish, there is little evidence to suggest that the fisheries targeting Redthroat Emperor impact significantly on the marine environment.
Environmental effects on Redthroat Emperor
• Coral bleaching events (see Hoegh-Guldberg et al.8) and changes in ocean chemistry have the potential to impact on the replenishment rates of coral reef fin fish populations9, individual growth rates and spawning output10.
References1. van Herwerden, L, Aspden, WJ, Newman, SJ, Pegg, GG, Briskey, L & Sinclair, W 2009, A comparison of the population
genetics of Lethrinus miniatus and Lutjanus sebae from the east and west coasts of Australia: evidence for panmixia and isolation, Fisheries Research, 100(2): 148–155.
2. Leigh, GM, Williams, AJ, Begg, GA, Gribble, NA & Whybird, OJ 2006, Stock assessment of the Queensland east coast red throat emperor (Lethrinus miniatus) fishery, Queensland Department of Primary Industries and Fisheries, Brisbane.
3. Williams, AJ 2003, Spatial patterns in population biology of a large coral reef fish: what role can movement play?, PhD thesis, James Cook University, Townsville.
4. Williams, AJ, Davies, CR, Mapstone, BD & Russ, GR 2003, Scales of spatial variation in demography of a large coral-reef fish—an exception to the typical model?, Fishery Bulletin, 101(3): 673–683.
5. McInnes, K 2008, Experimental results from the fourth Queensland recreational fishing diary program (2005), Queensland Department of Primary Industries and Fisheries, Brisbane.
6. Henry, GW & Lyle, JM 2003, The national recreational and indigenous fishing survey, Fisheries Research and Development Corporation project 99/158, Australian Government Department of Agriculture, Fisheries and Forestry, Canberra, http://eprints.utas.edu.au/2526/1/Henry_Lyle_Nationalsurvey.pdf.
7. Fairclough, D, Lai, E, Bruce, C, Moore, N & Syers, C 2011, West coast demersal scalefish resource and status report, in WJ Fletcher & K Santoro (eds), State of the fisheries and aquatic resources report 2010/11, Western Australian Department of Fisheries, Perth, 96–106.
8. Hoegh-Guldberg, O, Mumby, PJ, Hooten, AJ, Steneck, RS, Greenfield, P, Gomez, E, Harvell, CD, Sale, PF, Edwards, AJ, Caldeira, K, Knowlton, N, Eakin, CM, Iglesias-Prieto, R, Muthiga, N, Bradbury, RH, Dubi, A & Hatziolos, ME 2007, Coral reefs under rapid climate changes and ocean acidification, Science, 318: 1737–1742.
9. Hughes, T 2010, Marine and Tropical Sciences Research Facility milestone report for program 2.5i.3, report to the Australian Government Department of the Environment, Water, Heritage and the Arts, Canberra, www.rrrc.org.au/publications/downloads/25i3-JCU-Hughes-T-2010-March-Milestone-Report.pdf.
10. Johnson, JE & Welch, DJ 2010, Marine fisheries management in a changing climate: a review of vulnerability and future options, Reviews in Fisheries Science, 18(1): 106–124.
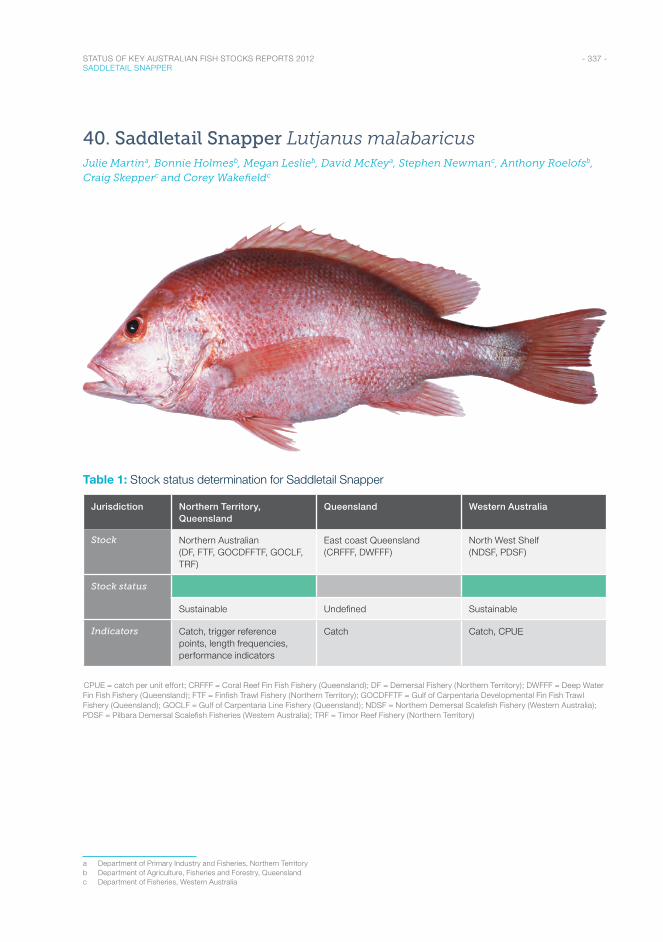
- 337 - STATUS OF KEY AUSTRALIAN FISH STOCKS REPORTS 2012 SADDLETAIL SNAPPER
40. Saddletail Snapper Lutjanus malabaricusJulie Martina, Bonnie Holmesb, Megan Leslieb, David McKeya, Stephen Newmanc, Anthony Roelofsb, Craig Skepperc and Corey Wakefieldc
Table 1: Stock status determination for Saddletail Snapper
Jurisdiction Northern Territory, Queensland
Queensland Western Australia
Stock Northern Australian (DF, FTF, GOCDFFTF, GOCLF, TRF)
East coast Queensland (CRFFF, DWFFF)
North West Shelf (NDSF, PDSF)
Stock status
Sustainable Undefined Sustainable
Indicators Catch, trigger reference points, length frequencies, performance indicators
Catch Catch, CPUE
CPUE = catch per unit effort; CRFFF = Coral Reef Fin Fish Fishery (Queensland); DF = Demersal Fishery (Northern Territory); DWFFF = Deep Water Fin Fish Fishery (Queensland); FTF = Finfish Trawl Fishery (Northern Territory); GOCDFFTF = Gulf of Carpentaria Developmental Fin Fish Trawl Fishery (Queensland); GOCLF = Gulf of Carpentaria Line Fishery (Queensland); NDSF = Northern Demersal Scalefish Fishery (Western Australia); PDSF = Pilbara Demersal Scalefish Fisheries (Western Australia); TRF = Timor Reef Fishery (Northern Territory)
a Department of Primary Industry and Fisheries, Northern Territoryb Department of Agriculture, Fisheries and Forestry, Queenslandc Department of Fisheries, Western Australia
- 338 - STATUS OF KEY AUSTRALIAN FISH STOCKS REPORTS 2012 SADDLETAIL SNAPPER
Stock structure
Saddletail Snapper is a widespread Indo–Pacific species found from Shark Bay in Western Australia across northern Australia to the east coast of Queensland1. The species is comprised of three biological stocks: the North West Shelf biological stock, the northern Australian biological stock (including the Timor Sea, Arafura Sea and Gulf of Carpentaria) and the east coast of Queensland biological stock2–3.
Stock status
Northern Australian biological stock
This cross-jurisdictional biological stock has components in the Northern Territory and Queensland. Each jurisdiction assesses that part of the biological stock that occurs in its waters. Status presented here for the entire biological stock has been established using evidence from both jurisdictions.
The Northern Territory manages the commercial harvest of Saddletail Snapper and Crimson Snapper together as red snapper. Over the past 10 years, Saddletail Snapper has averaged around 78 per cent of the Northern Territory commercial red snapper harvest. For the Northern Territory part of this biological stock, the most recent assessment4 estimated that the biomass of the red snapper group in 1990 was 24 000 tonnes (t). This estimate took into account high fishing pressure from foreign fleets (1970–1989), which peaked at 4200 t in 1989. Stock reduction analysis conducted in 1996 indicated that, for the biological stock to be reduced to 24 000 t in 1990, the unfished biomass would have been approximately 50 000 t. Hence, biomass in 1990 was estimated to be 45–50 per cent of the unfished level.
Licensed activity by foreign fleets in northern Australian waters ceased in 1991, and total catch of red snapper in the Northern Territory decreased substantially between 1991 and 1995 (to less than 100 t annually). Over the past 15 years (1995–2010), domestic effort in the Arafura Sea, where more than 80 per cent of red snapper is taken, has been minimal compared with pre-1991 levels. The most recent estimate of annual sustainable yield for Saddletail Snapper is 2900 t4–5. In 2010, the total commercial catch of Saddletail Snapper was 1041 t.
It is assumed that, as a result of the reduced effort since 1990, further reductions in biomass are unlikely. Hence, the Northern Territory part of the biological stock is not considered to be recruitment overfished, and fishing mortality is unlikely to cause this part of the biological stock to become recruitment overfished.
For the Queensland part of the biological stock, commercial catch in 2010 was 193 t. Since no information is available on biomass, there is insufficient information to confidently classify the status of this part of the biological stock.
Since the Northern Territory part of the biological stock constituted the majority of the total catch in 2010, the status of this part of the biological stock is indicative of the entire biological stock. Hence, the biological stock is classified as a sustainable stock.
East coast Queensland biological stock
Since the quota management system was introduced in 2004, commercial harvest has dropped to around 50 t per year. Current biological information is unavailable. Uncertainty also exists around the biological stock structure, and no stock assessment has been completed. Insufficient information is available to confidently classify the status of this biological stock; as a result, the biological stock is classified as an undefined stock.
- 339 - STATUS OF KEY AUSTRALIAN FISH STOCKS REPORTS 2012 SADDLETAIL SNAPPER
North West Shelf biological stock
Saddletail Snapper is exploited primarily on the north-west coast of Western Australia as a component of the Pilbara Demersal Scalefish Fisheries (Western Australia) and Northern Demersal Scalefish Fishery (Western Australia)6. Saddletail Snapper is assessed on the basis of the status of several indicator species (e.g. Red Emperor, Lutjanus sebae) that represent the inshore demersal suite of species (30–250 m depth). The major performance measures for these indicator species relate to spawning stock levels. The target level of spawning biomass is 40 per cent of the unfished level. The limit level is 30 per cent of the initial spawning biomass. Data analysis using an integrated age-structured model determined that the spawning biomass levels of the indicator species were greater than 40 per cent of the unfished level in the Pilbara Demersal Scalefish Fisheries (Western Australia) and the Northern Demersal Scalefish Fishery (Western Australia) in 20077. The biological stock is not considered to be recruitment overfished.
The fishing mortality (F)–based assessments7 indicated that the fishing levels on the indicator species were either lower than the target level or between the target and threshold levels. These fishing mortality–based assessments use reference levels based on ratios of natural mortality (M) for each species, such that Ftarget = 2/3M, Fthreshold = M and Flimit = 3/2M. This level of fishing mortality is unlikely to cause the biological stock to become recruitment overfished.
On the basis of the evidence provided above, the biological stock is classified as a sustainable stock.
Table 2: Saddletail Snapper biology8–9
Longevity and maximum size 33 years; 68 cm SL
Maturity (50%) 9 years; males 27–28 cm SL, females 35–37 cm SL
SL = standard length
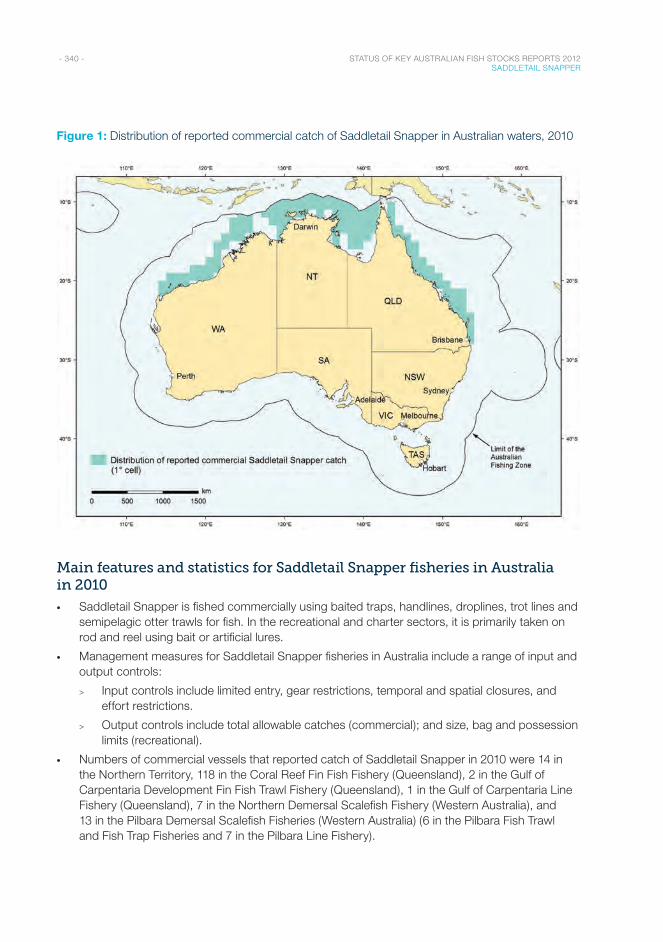
- 340 - STATUS OF KEY AUSTRALIAN FISH STOCKS REPORTS 2012 SADDLETAIL SNAPPER
Figure 1: Distribution of reported commercial catch of Saddletail Snapper in Australian waters, 2010
Main features and statistics for Saddletail Snapper fisheries in Australia in 2010
• Saddletail Snapper is fished commercially using baited traps, handlines, droplines, trot lines and semipelagic otter trawls for fish. In the recreational and charter sectors, it is primarily taken on rod and reel using bait or artificial lures.
• Management measures for Saddletail Snapper fisheries in Australia include a range of input and output controls:
> Input controls include limited entry, gear restrictions, temporal and spatial closures, and effort restrictions.
> Output controls include total allowable catches (commercial); and size, bag and possession limits (recreational).
• Numbers of commercial vessels that reported catch of Saddletail Snapper in 2010 were 14 in the Northern Territory, 118 in the Coral Reef Fin Fish Fishery (Queensland), 2 in the Gulf of Carpentaria Development Fin Fish Trawl Fishery (Queensland), 1 in the Gulf of Carpentaria Line Fishery (Queensland), 7 in the Northern Demersal Scalefish Fishery (Western Australia), and 13 in the Pilbara Demersal Scalefish Fisheries (Western Australia) (6 in the Pilbara Fish Trawl and Fish Trap Fisheries and 7 in the Pilbara Line Fishery).
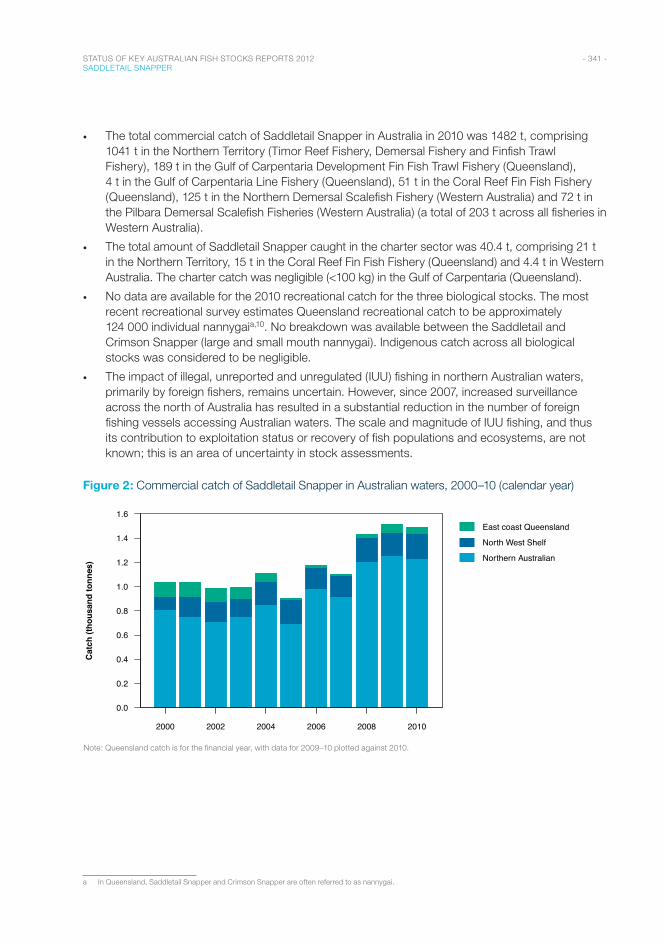
- 341 - STATUS OF KEY AUSTRALIAN FISH STOCKS REPORTS 2012 SADDLETAIL SNAPPER
• The total commercial catch of Saddletail Snapper in Australia in 2010 was 1482 t, comprising 1041 t in the Northern Territory (Timor Reef Fishery, Demersal Fishery and Finfish Trawl Fishery), 189 t in the Gulf of Carpentaria Development Fin Fish Trawl Fishery (Queensland), 4 t in the Gulf of Carpentaria Line Fishery (Queensland), 51 t in the Coral Reef Fin Fish Fishery (Queensland), 125 t in the Northern Demersal Scalefish Fishery (Western Australia) and 72 t in the Pilbara Demersal Scalefish Fisheries (Western Australia) (a total of 203 t across all fisheries in Western Australia).
• The total amount of Saddletail Snapper caught in the charter sector was 40.4 t, comprising 21 t in the Northern Territory, 15 t in the Coral Reef Fin Fish Fishery (Queensland) and 4.4 t in Western Australia. The charter catch was negligible (<100 kg) in the Gulf of Carpentaria (Queensland).
• No data are available for the 2010 recreational catch for the three biological stocks. The most recent recreational survey estimates Queensland recreational catch to be approximately 124 000 individual nannygaia,10. No breakdown was available between the Saddletail and Crimson Snapper (large and small mouth nannygai). Indigenous catch across all biological stocks was considered to be negligible.
• The impact of illegal, unreported and unregulated (IUU) fishing in northern Australian waters, primarily by foreign fishers, remains uncertain. However, since 2007, increased surveillance across the north of Australia has resulted in a substantial reduction in the number of foreign fishing vessels accessing Australian waters. The scale and magnitude of IUU fishing, and thus its contribution to exploitation status or recovery of fish populations and ecosystems, are not known; this is an area of uncertainty in stock assessments.
Figure 2: Commercial catch of Saddletail Snapper in Australian waters, 2000–10 (calendar year)
Year
2000 2002 2004 2006 2008 2010
0.0
0.2
0.4
0.6
0.8
1.0
1.2
1.4
1.6East coast Queensland
North West Shelf
Northern Australian
Cat
ch (t
hous
and
tonn
es)
Note: Queensland catch is for the financial year, with data for 2009–10 plotted against 2010.
a In Queensland, Saddletail Snapper and Crimson Snapper are often referred to as nannygai.
- 342 - STATUS OF KEY AUSTRALIAN FISH STOCKS REPORTS 2012 SADDLETAIL SNAPPER
Catch explanation
Total commercial catch of Saddletail Snapper remained stable at around 1000 t until 2006, when catches began to rise steadily from around 1200 t to around 1500 t in 2010. This was a result of increased harvest in the northern Australian biological stock. Catch in the Queensland-managed sector of the Gulf of Carpentaria was less than 1 per cent of the northern Australian harvest in 2000, but has gradually increased, accounting for around 16 per cent in 2010. In 2009, a record 229 t of Saddletail Snapper was reported in the Gulf of Carpentaria Developmental Fin Fish Trawl Fishery (Queensland). Catch in the Northern Territory–managed sector of the northern Australian biological stock has also increased, from around 800 t in 2006 to around 1000 t in 2010.
The east coast Queensland harvest decreased from more than 100 t in 2000 to 7.5 t in 2005. The catch remained low until 2007, when it began to increase again. This may have been the result of changes to reporting requirements. In 2007, a more detailed logbook was introduced to the Coral Reef Fin Fish Fishery (Queensland), and reporting of ‘nannygai-unspecified’ dropped from 18 t in 2006–07 to less than 100 kg in 2009–10.
The catch of Saddletail Snapper in Western Australia has been stable at 198–203 t over the past three years (2008–10), despite variation in effort allocation levels across multiple fisheries.
Effects of fishing on the marine environment
• Beyond the removal of fish, there is little evidence to suggest that the fisheries targeting Saddletail Snapper impact significantly on benthic or pelagic ecological communities in the area as a whole.
Environmental effects on Saddletail Snapper
• Climate change and variability have the potential to impact fish stocks in a range of ways, including influencing their geographic distribution (e.g. latitudinal shifts in distribution). However, it is unclear how climate change may affect risks to sustainability.
• Changes in ocean chemistry have the potential to impact on the replenishment rates of fish populations11, and also individual growth rates and spawning output12.
References1. Newman, SJ 2002, Growth rate, age determination, natural mortality and production potential of the scarlet seaperch,
Lutjanus malabaricus Schneider 1801, off the Pilbara coast of north-western Australia, Fisheries Research, 58: 215–225.
2. Elliot, NG 1996, Allozyme and mitochondrial DNA analysis of the tropical saddle-tail sea perch, Lutjanus malabaricus (Schneider), from Australian Waters, Marine and Freshwater Research, 47: 869–876.
3. Salini, J, Ovenden, J, Street, R, Pendrey, R, Haryantis & Ngurah 2006, Genetic population structure of red snappers (Lutjanus malabaricus Bloch & Schneider, 1801 and Lutjanus erythropterus Bloch, 1790) in central and eastern Indonesia and northern Australia, Journal of Fish Biology, 68(suppl. B): 217–234.
4. Ramm, DC 1997, Towards the sustainable use of Northern Territory fishery resources: review workshops led by Carl J Walters, final report to the Fisheries Research and Development Corporation, project 96/158, Fishery Report 39, Northern Territory Department of Primary Industry and Fisheries, Darwin.
5. Ramm, DC 1994, Australia’s Northern Trawl Fishery, final report to the Fisheries Research and Development Corporation project 86/049, Fishery Report 32, Northern Territory Department of Primary Industry and Fisheries, Darwin.
6. Fletcher, WJ & Santoro, K (eds) 2011, State of the fisheries and aquatic resources report 2010/11, Western Australian Department of Fisheries, Perth.
7. Newman, SJ, Wakefield, C, Skepper, C, Marriott, R, Cliff, M, Boddington, D, Mitsopoulos, G, Rome, B, Green, R & Blazeski, S 2011, North coast demersal fisheries status report, in WJ Fletcher & K Santoro, State of the fisheries and aquatic resources report 2010/11, Western Australian Department of Fisheries, Perth, 190–208.

- 343 - STATUS OF KEY AUSTRALIAN FISH STOCKS REPORTS 2012 SADDLETAIL SNAPPER
8. Fry, G & Milton, DA 2009, Age, growth and mortality estimates for populations of red snappers Lutjanus erythropterus and L. malabaricus from northern Australia and eastern Indonesia, Fisheries Science, 75: 1219–1229.
9. Fry, G, Milton, DA, Van Der Velde, T, Stobutzki, I, Andamari, R, Badrudin & Sumiono, B 2009, Reproductive dynamics and nursery habitat preferences of two commercially important Indo–Pacific red snappers Lutjanus erythropterus and L. malabaricus, Fisheries Science, 75: 145–158.
10. McInnes, K 2008, Experimental results from the fourth Queensland recreational fishing diary program (2005), Queensland Department of Primary Industries and Fisheries, Brisbane.
11. Hughes, T 2010, Marine and Tropical Sciences Research Facility milestone report for program 2.5i.3, report to the Australian Government Department of the Environment, Water, Heritage and the Arts, Canberra, www.rrrc.org.au/publications/downloads/25i3-JCU-Hughes-T-2010-March-Milestone-Report.pdf.
12. Johnson, JE & Welch, DJ 2010, Marine fisheries management in a changing climate: a review of vulnerability and future options, Reviews in Fisheries Science, 18(1): 106–124.
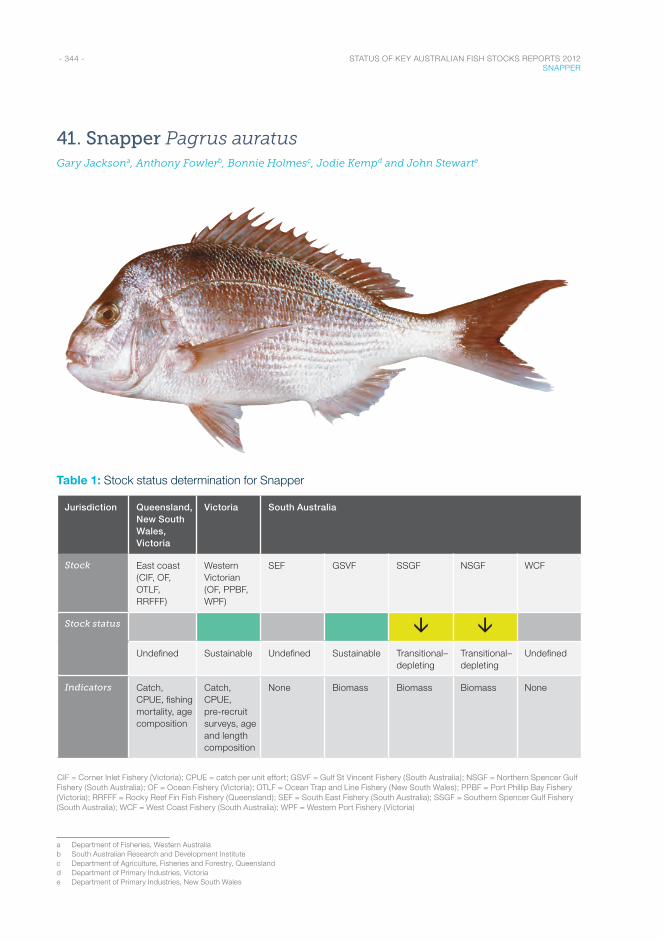
- 344 - STATUS OF KEY AUSTRALIAN FISH STOCKS REPORTS 2012 SNAPPER
41. Snapper Pagrus auratusGary Jacksona, Anthony Fowlerb, Bonnie Holmesc, Jodie Kempd and John Stewarte
Table 1: Stock status determination for Snapper
Jurisdiction Queensland, New South Wales, Victoria
Victoria South Australia
Stock East coast (CIF, OF, OTLF, RRFFF)
Western Victorian (OF, PPBF, WPF)
SEF GSVF SSGF NSGF WCF
Stock status â âUndefined Sustainable Undefined Sustainable Transitional–
depletingTransitional– depleting
Undefined
Indicators Catch, CPUE, fishing mortality, age composition
Catch, CPUE, pre-recruit surveys, age and length composition
None Biomass Biomass Biomass None
CIF = Corner Inlet Fishery (Victoria); CPUE = catch per unit effort; GSVF = Gulf St Vincent Fishery (South Australia); NSGF = Northern Spencer Gulf Fishery (South Australia); OF = Ocean Fishery (Victoria); OTLF = Ocean Trap and Line Fishery (New South Wales); PPBF = Port Phillip Bay Fishery (Victoria); RRFFF = Rocky Reef Fin Fish Fishery (Queensland); SEF = South East Fishery (South Australia); SSGF = Southern Spencer Gulf Fishery (South Australia); WCF = West Coast Fishery (South Australia); WPF = Western Port Fishery (Victoria)
a Department of Fisheries, Western Australiab South Australian Research and Development Institutec Department of Agriculture, Fisheries and Forestry, Queenslandd Department of Primary Industries, Victoriae Department of Primary Industries, New South Wales
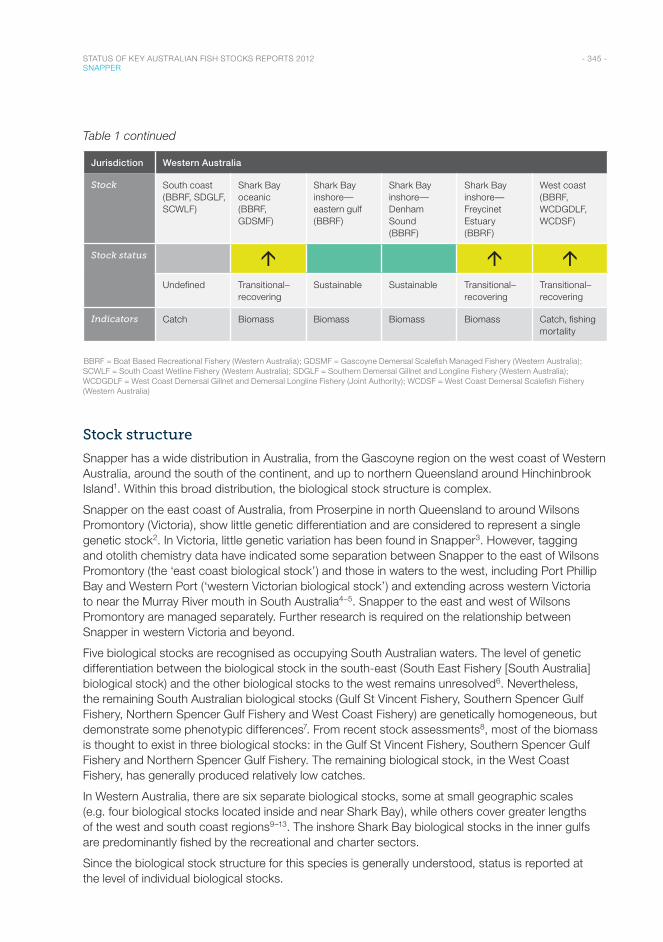
- 345 - STATUS OF KEY AUSTRALIAN FISH STOCKS REPORTS 2012 SNAPPER
Table 1 continued
Jurisdiction Western Australia
Stock South coast (BBRF, SDGLF, SCWLF)
Shark Bay oceanic (BBRF, GDSMF)
Shark Bay inshore—eastern gulf (BBRF)
Shark Bay inshore—Denham Sound (BBRF)
Shark Bay inshore—Freycinet Estuary (BBRF)
West coast (BBRF, WCDGDLF, WCDSF)
Stock status á á áUndefined Transitional–
recoveringSustainable Sustainable Transitional–
recoveringTransitional– recovering
Indicators Catch Biomass Biomass Biomass Biomass Catch, fishing mortality
BBRF = Boat Based Recreational Fishery (Western Australia); GDSMF = Gascoyne Demersal Scalefish Managed Fishery (Western Australia); SCWLF = South Coast Wetline Fishery (Western Australia); SDGLF = Southern Demersal Gillnet and Longline Fishery (Western Australia); WCDGDLF = West Coast Demersal Gillnet and Demersal Longline Fishery (Joint Authority); WCDSF = West Coast Demersal Scalefish Fishery (Western Australia)
Stock structure
Snapper has a wide distribution in Australia, from the Gascoyne region on the west coast of Western Australia, around the south of the continent, and up to northern Queensland around Hinchinbrook Island1. Within this broad distribution, the biological stock structure is complex.
Snapper on the east coast of Australia, from Proserpine in north Queensland to around Wilsons Promontory (Victoria), show little genetic differentiation and are considered to represent a single genetic stock2. In Victoria, little genetic variation has been found in Snapper3. However, tagging and otolith chemistry data have indicated some separation between Snapper to the east of Wilsons Promontory (the ‘east coast biological stock’) and those in waters to the west, including Port Phillip Bay and Western Port (‘western Victorian biological stock’) and extending across western Victoria to near the Murray River mouth in South Australia4–5. Snapper to the east and west of Wilsons Promontory are managed separately. Further research is required on the relationship between Snapper in western Victoria and beyond.
Five biological stocks are recognised as occupying South Australian waters. The level of genetic differentiation between the biological stock in the south-east (South East Fishery [South Australia] biological stock) and the other biological stocks to the west remains unresolved6. Nevertheless, the remaining South Australian biological stocks (Gulf St Vincent Fishery, Southern Spencer Gulf Fishery, Northern Spencer Gulf Fishery and West Coast Fishery) are genetically homogeneous, but demonstrate some phenotypic differences7. From recent stock assessments8, most of the biomass is thought to exist in three biological stocks: in the Gulf St Vincent Fishery, Southern Spencer Gulf Fishery and Northern Spencer Gulf Fishery. The remaining biological stock, in the West Coast Fishery, has generally produced relatively low catches.
In Western Australia, there are six separate biological stocks, some at small geographic scales (e.g. four biological stocks located inside and near Shark Bay), while others cover greater lengths of the west and south coast regions9–13. The inshore Shark Bay biological stocks in the inner gulfs are predominantly fished by the recreational and charter sectors.
Since the biological stock structure for this species is generally understood, status is reported at the level of individual biological stocks.
- 346 - STATUS OF KEY AUSTRALIAN FISH STOCKS REPORTS 2012 SNAPPER
Stock status
East coast biological stock
Components of this biological stock in both Queensland and New South Wales have been heavily fished for many years, under different management arrangements. However, the status of the biological stock has never been assessed on a whole-stock basis; rather, the state components have been assessed using different methodologies. These assessments have arrived at different outcomes.
Queensland assessed the part of the biological stock based on a sex, age and length stock analysis model. The assessment in 200914 indicated that exploitable biomass was approximately 35 per cent of unfished biomass and would continue to decline if fishing pressures remained unchanged. Updated mortality estimates in 2010, combined with decreasing commercial catch and no increase in catch rate, indicated that biological stock status had not improved. Based on this information, Queensland considered Snapper in Queensland waters to be recruitment overfished.
The assessment undertaken in New South Wales was largely based on attempting to maximise the yield per recruit in a fishery that was known to have been heavily exploited for a very long time (>50 years), and had been shown to be in a state best described as ‘growth overfished’15. Management to address this problem was instigated in 2001, when the minimum legal length for Snapper was increased from 28 to 30 cm total length. Since then, increases in commercial catch and catch rate of Snapper in New South Wales, together with increases in the proportion of fish aged more than 5 years in landings, indicate that the biomass is unlikely to be recruitment overfished. However, the size composition data from detailed monitoring of the fishery show that the New South Wales portion of the biological stock continues to be heavily fished, and the status has remained at ‘growth overfished’ in all recent assessments.
An assessment of the status of the eastern biological stock of Snapper in waters adjacent to Victoria was undertaken in 201116. The assessment found that insufficient data were available to adequately assess the status of Snapper in these waters. The catch of Snapper for this part of the state is much less than for the western biological stocks; for commercial fishers, the eastern biological stock of Snapper has historically been considered a byproduct species.
Because of conflicting signals and the fact that no stock assessment has been conducted on the biological stock as a whole, the east coast biological stock is classified as an undefined stock.
A formal cross-jurisdictional stock assessment of this biological stock is needed as a matter of priority. New South Wales and Queensland have data sets that can be used in a future joint stock assessment. The undefined classification will not be resolved until this combined biological stock assessment has been completed.
Western Victorian biological stock
The most recent stock assessment for Snapper in Victoria was undertaken in 201116. It assessed commercial and recreational catch rates, fishery-independent pre-recruitment catch rates and age–length frequency distributions for the western biological stock. Commercial catch rates have shown an increasing trend since the late 1990s. Effort for all gear types in Victoria has decreased since 1999, as a result of a reduction in the number of licensed fishers in Victorian waters, and is at historically low levels.
Catch rate indicators for the western Victorian biological stock are in ‘good condition’ for 7 of the 10 indicators used to assess the status of the biological stock16, indicating that the biomass of the biological stock is unlikely to be recruitment overfished. Despite low recruitments in 2005–06 and
- 347 - STATUS OF KEY AUSTRALIAN FISH STOCKS REPORTS 2012 SNAPPER
2010–11, the recent series of moderate recruitment years (2007–08, 2008–09, 2009–10) is expected to generate average abundance over the coming few years. These fluctuations are probably the result of environmental conditions affecting spawning success and/or recruitment to the fishery.
Based on the analyses outlined above, the current level of fishing mortality is unlikely to cause the biological stock to become recruitment overfished. The recent shift in the targeting of Snapper by Commonwealth- or state-licensed trawlers may pose a significant risk of overfishing the biological stock. Before 2005, Snapper taken as bycatch by Commonwealth-licensed trawlers was usually less than 20 tonnes (t) per year; landings by Victorian-licensed trawl fishers have generally been between zero and about 1.7 t per year, but increased to about 34 t in 2011. Fisheries managers are currently working with the commercial fishing industry to ensure that this risk is managed.
On the basis of the evidence provided above, the biological stock is classified as a sustainable stock.
South East Fishery (South Australia) biological stock
The South Australian South East Fishery biological stock has traditionally provided much lower catches than the three gulf-based biological stocks described below. Catches rose considerably through the mid–late 2000s, as a result of substantial increases in longline fishing effort, reflecting the uptake of the new longline fishing technology. Since 2003–04, commercial longline catch per unit effort (CPUE) has increased, indicating an increase in fishable biomass. No estimates of size and age structures are available for this biological stock, indicating a lack of indicators of year-class strength and recruitment history.
Historically, this biological stock has provided only incidental catches and low catch rates. However, from 2007–08, the catch and catch rates increased exponentially to record levels. There is recent evidence for at least one very strong recruitment event, which suggests that the population is not recruitment overfished8.
Given the fact that the biological stock has not previously been heavily exploited, combined with a lack of information on biomass and fish movement, the biological stock is classified as an undefined stock.
Gulf St Vincent Fishery (South Australia) biological stock
Commercial catches and catch rates for this biological stock have historically been consistently low. However, since 2008–09, there have been exponential increases in catch, effort and CPUE, to unprecedented levels. This is consistent with a substantial recent increase in biomass. Population age structures indicate that this relates to the recent recruitment of several strong year-classes to the population. As a consequence, the recent stock assessment suggests that, between 2000 and 2009, the stock biomass nearly doubled, to more than 2900 t8. Therefore, the biomass of this biological stock is unlikely to be recruitment overfished.
As a result of the estimated increasing biomass, catch and effort have increased substantially. The current CPUE is at historically high levels and has been increasing since 2007. The catch in 2010 was 454 t, which is approximately 16 per cent of the estimated biomass. This level of catch is unlikely to cause the biological stock to become recruitment overfished.
On the basis of the evidence provided above, the biological stock is classified as a sustainable stock.
Southern Spencer Gulf Fishery (South Australia) biological stock
From 2004–05, there was a substantial increase in commercial longline fishing effort for this biological stock, which related to the uptake of new longline fishing technology8. This resulted in a substantial increase in the effectiveness of fishers, culminating in dramatic increases in catches and
- 348 - STATUS OF KEY AUSTRALIAN FISH STOCKS REPORTS 2012 SNAPPER
CPUE. However, from 2008–09, CPUE declined dramatically, suggesting that the fishable biomass had become depleted8. This evidence indicates that the current level of fishing mortality is likely to cause the biological stock to become recruitment overfished.
Age-structure data indicate that no strong year-class has recruited to this biological stock since 1999. The stock assessment integrated these data and suggested that, between 2004 and 2009, biomass fell from 4200 to 3600 t8. Since recruitment for Snapper in South Australia is known to be highly variable and environmentally driven8, it is unclear if the poor recent recruitment is related to overfishing.
On the basis of the evidence provided above, the biological stock is classified as a transitional–depleting stock.
Northern Spencer Gulf Fishery (South Australia) biological stock
The Northern Spencer Gulf Fishery (South Australia) biological stock was traditionally the most important of the South Australian biological stocks, generally providing more than 50 per cent of the state’s total catch. However, during the mid–late 2000s, its contribution declined to approximately 20 per cent. These lower catches reflect declines in fishing effort, which are consistent with a decline in biomass. The high levels of CPUE associated with these lower levels of catch and effort are thought to relate to hyperstability, reflecting the aggregative behaviour of Snapper and the experience of the fishers in this region17.
The suggestion of a decline in biomass relative to the 1990s is supported by the lack of recruitment of any strong year-classes to the population since 1999. It is not clear whether this lack of recruitment reflects the biological stock being recruitment overfished or an absence of environmental conditions conducive to spawning. In the absence of further recruitment, fishing mortality is likely to deplete the biological stock even further.
On the basis of the evidence provided above, the biological stock is classified as a transitional–depleting stock.
West Coast Fishery (South Australia) biological stock
The South Australian West Coast Fishery biological stock has traditionally provided much lower catches than the three gulf-based biological stocks described above. Catches rose considerably through the mid–late 2000s, as a result of substantial increases in longline fishing effort, reflecting the uptake of the new longline fishing technology. However, since 2003–04, commercial longline CPUE has declined, indicating a possible decline in fishable biomass. No estimates of size and age structures are available for this biological stock, indicating a lack of indicators of year-class strength and recruitment history.
Insufficient information is available to confidently classify the status of this biological stock; as a result, the biological stock is classified as an undefined stock.
South coast biological stock
This biological stock has not been formally assessed; hence, insufficient information is available to confidently classify its status. The biological stock is classified as an undefined stock.
Shark Bay oceanic biological stock
The most recent model-based stock assessment (Department of Fisheries 2011, unpublished) indicated that spawning biomass in 2010 was approximately 30 per cent of the unfished level, which is also the minimum threshold level for this biological stock. The biomass is estimated to have been increasing
- 349 - STATUS OF KEY AUSTRALIAN FISH STOCKS REPORTS 2012 SNAPPER
since a historical low of around 20 per cent in 2003 and is expected to reach the management target level (40 per cent of the unfished level) by 2014, suggesting a recovering biological stock.
The total allowable commercial catch (TACC) was reduced in 2007 (it had initially been reduced by 40 per cent in 2004) to 277 t to further assist biological stock recovery, with the aim of achieving the target level of 40 per cent of the unfished level by 2014. Since 263 t was caught in 2010, this level of fishing mortality should allow continued recovery of the biological stock.
On the basis of the evidence provided above, the biological stock is classified as a transitional–recovering stock.
Shark Bay inshore—eastern gulf biological stock
The most recent model-based stock assessment (Department of Fisheries 2011, unpublished) indicated that spawning biomass was approximately 60 per cent of the unfished level, which is well above the management target (40 per cent of unfished biomass) and the minimum threshold level (30 per cent of unfished biomass). The biological stock is not considered to be recruitment overfished.
There was no commercial catch of Snapper in the eastern gulf biological stock in 2010. As well, recreational catch was minor (4 t) and within the target catch range (0–12 t). This level of fishing mortality is unlikely to cause this biological stock to become recruitment overfished.
On the basis of the evidence provided above, the biological stock is classified as a sustainable stock.
Shark Bay inshore—Denham Sound biological stock
The most recent model-based stock assessment (Department of Fisheries 2011, unpublished) indicated that spawning biomass was approximately 42 per cent of the unfished level, which is above the management target (40 per cent of unfished biomass) and the minimum threshold level (30 per cent of unfished biomass). The biological stock is not considered to be recruitment overfished.
The total commercial catch of Snapper in the Denham Sound biological stock was less than 0.5 t in 2010. As well, recreational catch was minor (7 t) and within the target catch range (0–12 t). This level of fishing mortality is unlikely to cause this biological stock to become recruitment overfished.
On the basis of the evidence provided above, the biological stock is classified as a sustainable stock.
Shark Bay inshore—Freycinet Estuary biological stock
The most recent model-based stock assessment (Department of Fisheries 2011, unpublished) indicated that spawning biomass was approximately 22 per cent of the unfished level. This level of biomass is below both the management target level (40 per cent of unfished biomass) and the minimum threshold level (30 per cent of unfished biomass). Modelled estimates indicate that the biological stock will continue to rebuild very slowly to around 25 per cent of unfished biomass by 2015. The biological stock is considered recruitment overfished (according to the 30 per cent threshold level in Western Australia). However, biomass has been increasing in recent years, suggesting a recovering biological stock.
There was no commercial catch of Snapper from the Freycinet Estuary biological stock in 2010. As well, recreational catch was minor (1 t) and within the target catch range (0–3.8 t). This level of fishing mortality should allow the biological stock to recover from its recruitment overfished state.
On the basis of the evidence provided above, the biological stock is classified as a transitional–recovering stock.
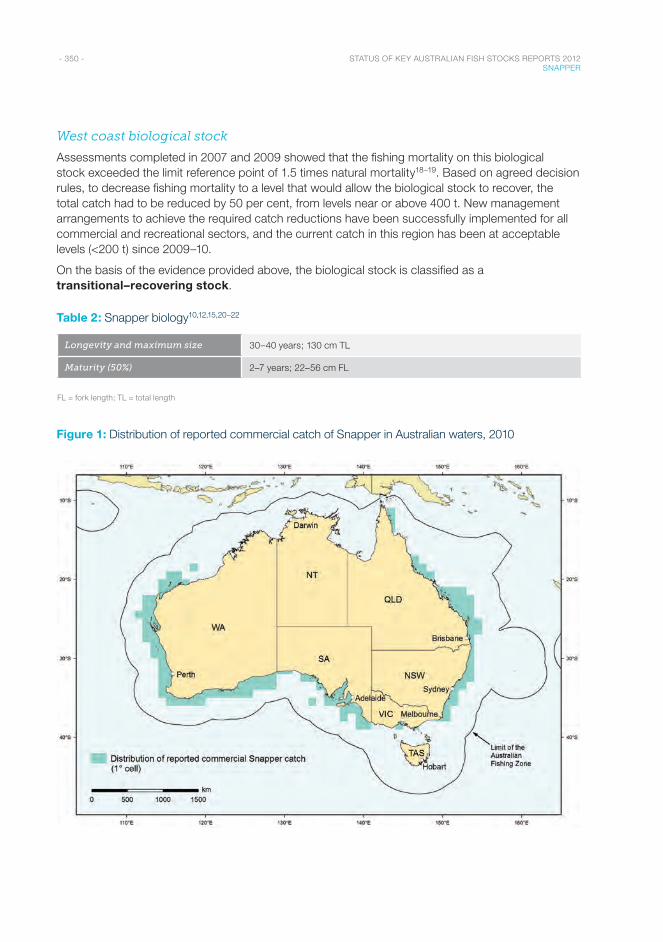
- 350 - STATUS OF KEY AUSTRALIAN FISH STOCKS REPORTS 2012 SNAPPER
West coast biological stock
Assessments completed in 2007 and 2009 showed that the fishing mortality on this biological stock exceeded the limit reference point of 1.5 times natural mortality18–19. Based on agreed decision rules, to decrease fishing mortality to a level that would allow the biological stock to recover, the total catch had to be reduced by 50 per cent, from levels near or above 400 t. New management arrangements to achieve the required catch reductions have been successfully implemented for all commercial and recreational sectors, and the current catch in this region has been at acceptable levels (<200 t) since 2009–10.
On the basis of the evidence provided above, the biological stock is classified as a transitional–recovering stock.
Table 2: Snapper biology10,12,15,20–22
Longevity and maximum size 30–40 years; 130 cm TL
Maturity (50%) 2–7 years; 22–56 cm FL
FL = fork length; TL = total length
Figure 1: Distribution of reported commercial catch of Snapper in Australian waters, 2010
- 351 - STATUS OF KEY AUSTRALIAN FISH STOCKS REPORTS 2012 SNAPPER
Main features and statistics for Snapper fisheries in Australia in 2010
• Snapper are taken commercially using baited traps, vertical lines (drop lines and handlines), bottom set longlines and semidemersal fish trawls. Charter and recreational catch is typically taken by rod and reel using bait, lures or jigs.
• A range of input and output controls have been applied to Snapper across the four jurisdictions:
> Input controls include limited entry, gear restrictions, spatial zonation and effort limits.
> Output controls include TACCs, total allowable recreational catches, and recreational size and bag limits.
• In 2010, commercial Snapper catch was taken by 134 vessels in Queensland (Rocky Reef Fin Fish Fishery), 280 vessels in New South Wales, 19 vessels fishing the east coast biological stock in Victoria, 79 vessels fishing the Victorian western biological stock and 309 vessels in South Australia. In Western Australia, 13 commercial vessels caught Snapper in the Gascoyne Demersal Scalefish Managed Fishery, 50 vessels in the West Coast Demersal Scalefish Fishery, 4 vessels in the West Coast Demersal Gillnet and Demersal Longline Fishery and 22 vessels in the Southern Demersal Gillnet and Longline Fishery.
• The total amount of Snapper caught commercially in Australia in 2010 was more than 1800 t, comprising 78 t from the Rocky Reef Fin Fish Fishery (Queensland), 283 t from New South Wales, 83 t from Victoria’s Port Phillip Bay (2009–10), 5 t from Victorian coastal waters beyond bays and inlets, 202 t from the northern Spencer Gulf, 82 t from the southern Spencer Gulf, 454 t from Gulf St Vincent, 263 t from the Gascoyne Demersal Scalefish Managed Fishery (Western Australia) (Shark Bay oceanic biological stock), 140 t from the West Coast Demersal Scalefish Fishery (Western Australia), 15 t from the West Coast Demersal Gillnet and Demersal Longline Fishery (Joint Authority) (west coast biological stock) and approximately 40 t off the Western Australian south coast by the wetline fleet and the Southern Demersal Gillnet and Long Line Fishery (Western Australia) (south coast biological stock).
• The total amount of Snapper caught by charter fishers in Australia in 2010 was 164 t, comprising 44 t from the Queensland charter sector; approximately 17 t from the New South Wales charter sector; 40 t in the northern Spencer Gulf, 15 t in the southern Spencer Gulf and 25 t in Gulf St Vincent; and, in Western Australia, 13 t from the Shark Bay oceanic biological stock and 10 t from the west coast biological stock.
• The most recent recreational catch estimates indicate catches of around 550 t from Queensland in 2005, around 224 t from New South Wales in 2001, 400 t from Victoria in 2006–0723, 17 t from the northern Spencer Gulf in 2010, 41 t from the southern Spencer Gulf in 2010, 37 t from Gulf St Vincent in 2010, 30 t from the Shark Bay oceanic biological stock in 2007–08, approximately 11 t from the three inner Shark Bay biological stocks in 2010 and 24 t from the west coast biological stock in 2010.
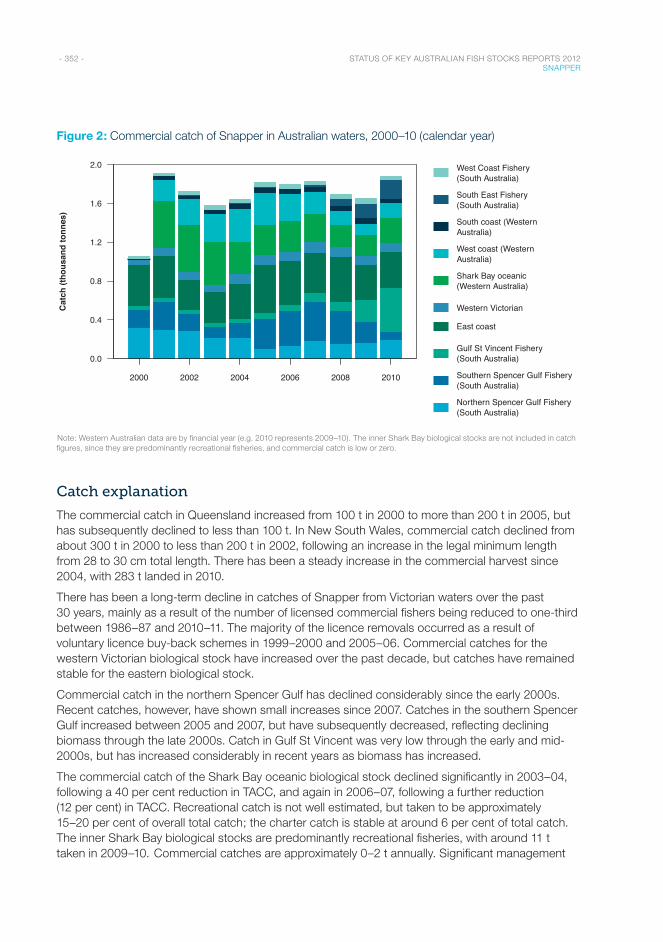
- 352 - STATUS OF KEY AUSTRALIAN FISH STOCKS REPORTS 2012 SNAPPER
Figure 2: Commercial catch of Snapper in Australian waters, 2000–10 (calendar year)
2000 2002 2004 2006 2008 2010
0.0
0.4
0.8
1.2
1.6
2.0 West Coast Fishery(South Australia)
South East Fishery(South Australia)
South coast (WesternAustralia)
West coast (WesternAustralia)
Shark Bay oceanic(Western Australia)
Western Victorian
East coast
Gulf St Vincent Fishery(South Australia)
Southern Spencer Gulf Fishery(South Australia)
Northern Spencer Gulf Fishery(South Australia)
Cat
ch (t
hous
and
tonn
es)
Note: Western Australian data are by financial year (e.g. 2010 represents 2009–10). The inner Shark Bay biological stocks are not included in catch figures, since they are predominantly recreational fisheries, and commercial catch is low or zero.
Catch explanation
The commercial catch in Queensland increased from 100 t in 2000 to more than 200 t in 2005, but has subsequently declined to less than 100 t. In New South Wales, commercial catch declined from about 300 t in 2000 to less than 200 t in 2002, following an increase in the legal minimum length from 28 to 30 cm total length. There has been a steady increase in the commercial harvest since 2004, with 283 t landed in 2010.
There has been a long-term decline in catches of Snapper from Victorian waters over the past 30 years, mainly as a result of the number of licensed commercial fishers being reduced to one-third between 1986–87 and 2010–11. The majority of the licence removals occurred as a result of voluntary licence buy-back schemes in 1999–2000 and 2005–06. Commercial catches for the western Victorian biological stock have increased over the past decade, but catches have remained stable for the eastern biological stock.
Commercial catch in the northern Spencer Gulf has declined considerably since the early 2000s. Recent catches, however, have shown small increases since 2007. Catches in the southern Spencer Gulf increased between 2005 and 2007, but have subsequently decreased, reflecting declining biomass through the late 2000s. Catch in Gulf St Vincent was very low through the early and mid-2000s, but has increased considerably in recent years as biomass has increased.
The commercial catch of the Shark Bay oceanic biological stock declined significantly in 2003–04, following a 40 per cent reduction in TACC, and again in 2006–07, following a further reduction (12 per cent) in TACC. Recreational catch is not well estimated, but taken to be approximately 15–20 per cent of overall total catch; the charter catch is stable at around 6 per cent of total catch. The inner Shark Bay biological stocks are predominantly recreational fisheries, with around 11 t taken in 2009–10. Commercial catches are approximately 0–2 t annually. Significant management
- 353 - STATUS OF KEY AUSTRALIAN FISH STOCKS REPORTS 2012 SNAPPER
measures were applied to the west coast fishery in recent years to reduce overall catches of all sectors by 50 per cent, in order to reduce fishing mortality to acceptable levels.
Effects of fishing on the marine environment
• Snapper are generalist feeders and normally just one of a number of such species inhabiting continental shelf waters; as a result, effects on the food chain from fishing for Snapper are considered to be low risk. This is supported by a recent study, completed in the three Western Australian bioregions24 where Snapper are captured, that found no evidence of material changes in finfish community structure over the past 30 years25.
• Most of the fisheries that target adult Snapper use hooks and lines. This means that the commercial fisheries have very little direct impact on benthic habitats.
Environmental effects on Snapper
• Climate change consequences for Snapper biological stocks around Australia are currently being considered as part of projects funded by the National Climate Change Adaptation Research Program and the Fisheries Research and Development Corporation. Warming conditions at northern margins of Snapper distribution may see existing spawning grounds no longer viable.
• Recruitment variability in this species is typically driven by environmental factors10, although the mechanisms are not fully understood.
References1. Kailola, PJ, Williams, MJ, Stewart, PC, Reichelt, RE, McNee, A & Grieve, C 1993, Australian Fisheries Resources,
Bureau of Resource Sciences & the Fisheries Research and Development Corporation, Canberra.
2. Sumpton, WD, Ovenden, JR, Keenan CP & Street, R 2008, Evidence for a stock discontinuity of snapper (Pagrus auratus) on the east coast of Australia, Fisheries Research, 94(1): 92–98.
3. Meggs, LB & Austin CM 2003, Low allozyme variation in snapper, Pagrus auratus, in Victoria, Australia, Fisheries Management and Ecology, 10: 155–162.
4. Hamer, PA, Acevedo, S, Jenkins, GP & Newman, A 2011, Connectivity of a large embayment and coastal fishery: spawning aggregations in one bay source local and broad-scale fishery replenishment, Journal of Fish Biology, 78: 1090–1109.
5. Sanders, MJ 1974, Tagging study indicates two stocks of snapper (Chrysophrys auratus) off south east Australia, Australian Journal of Marine and Freshwater Research, 8:371–374.
6. Donnellan, SC & McGlennon, D 1996, Stock identification and discrimination in snapper (Pagrus auratus) in Southern Australia, final report to the Fisheries Research and Development Corporation, project 94/168, South Australian Research and Development Institute, Adelaide.
7. Fowler, AJ, Gillanders, BM & Hall, KC 2004, Adult migration, population replenishment and geographic structure for snapper in SA, final report to the Fisheries Research and Development Corporation, project 2002/001, SARDI publication RD04/0163, South Australian Research and Development Institute (Aquatic Sciences), Adelaide.
8. Fowler, AJ, McGarvey, R, Feenstra, JE & Jackson, WB 2010, Snapper (Pagrus auratus) fishery, Fishery Assessment Report to PIRSA Fisheries, SARDI publication F2007/000523-2, SARDI Research Report Series 473, South Australian Research and Development Institute (Aquatic Sciences), Adelaide.
9. Edmonds, JS, Steckis, RA, Moran, MJ, Caputi, N & Morita, M 1999, Stock delineation of pink snapper Pagrus auratus and tailor Pomatomus saltatrix from Western Australia by analysis of stable isotope and strontium/calcium ratios in otolith carbonate, Journal of Fish Biology, 55: 243–259.
10. Jackson, G 2007, Fisheries biology and management of pink snapper, Pagrus auratus, in the inner gulfs of Shark Bay, Western Australia, PhD thesis, Murdoch University, Perth.
11. Johnson, MS, Creagh, S & Moran, M 1986, Genetic subdivision of stocks of snapper, Chrysophrys unicolor, in Shark Bay, Western Australia, Australian Journal of Marine and Freshwater Research, 37: 337–345.
- 354 - STATUS OF KEY AUSTRALIAN FISH STOCKS REPORTS 2012 SNAPPER
12. Lenanton, R, St John, J, Keay, I, Wakefield, C, Jackson, G, Wise, B & Gaughan, D (eds) 2009, Spatial scales of exploitation among populations of demersal scalefish: implications for management, part 2, Stock structure and biology of two indicator species, West Australian dhufish (Glaucosoma hebraicum) and pink snapper (Pagrus auratus), in the West Coast Bioregion, Fisheries Research Report 174, Western Australian Department of Fisheries, Perth.
13. Moran, M, Burton, C & Jenke, J 2003, Long-term movement patterns of continental shelf and inner gulf snapper (Pagrus auratus, Sparidae) from tagging in the Shark Bay region of Western Australia, Marine and Freshwater Research, 54: 913–922.
14. Campbell, AB, O’Neill, MF, Sumpton, W, Kirkwood, J & Wesche, S 2009, Stock assessment summary of the Queensland snapper fishery (Australia) and management strategies for improving sustainability, Queensland Department of Employment, Economic Development and Innovation, Brisbane.
15. Ferrell, DJ & Sumpton, W 1998, Assessment of the fishery for snapper (Pagrus auratus) in Queensland and New South Wales, final report, Fisheries Research and Development Corporation, project 93/074, Queensland Department of Primary Industries & New South Wales Fisheries Research Institute, Sydney.
16. Kemp, J, Conron, S, Hamer, P, Bruce, T, Bridge, N & Brown, L 2012, Victorian snapper stock assessment 2011, Fisheries Victoria Assessment Report Series no. 64, Department of Primary Industries, Melbourne.
17. Fowler, AJ & McGlennon, D 2011, Variation in productivity of a key snapper, Chrysophrys auratus, fishery related to recruitment and fleet dynamics, Fisheries Management and Ecology, 12: 411–423.
18. Fairclough, D, Johnson, C & Lai, E 2009, West Coast Demersal Scalefish Fishery, in WJ Fletcher & K Santoro K (eds), State of the fisheries report 2008/09, Western Australian Department of Fisheries, Perth, 71–79.
19. Wise, BS, St John, J & Lenanton, RC (eds) 2007, Spatial scales of exploitation among populations of demersal scalefish: implications for management, part 1, Stock status of the key indicator species for the demersal scalefish fishery in the West Coast Bioregion, Fisheries Research Report 163, Western Australian Department of Fisheries, Perth.
20. Coutin, PC, Cashmore, S & Sivakumuran, KP 2003, Assessment of the snapper fishery in Victoria, final report, Fisheries Research and Development Corporation, project 97/128, Marine and Freshwater Resources Institute, Victorian Department of Primary Industries, Queenscliff.
21. Stewart, J, Rowling, K, Hegarty, AM & Nuttall, A 2010, Size and age at sexual maturity of snapper (Pagrus auratus) in New South Wales 2008/09, Fisheries Research Report Series 27, Industry & Investment NSW, Cronulla.
22. Wakefield, CB 2006, Latitudinal and temporal comparisons of the reproductive biology and growth of snapper, Pagrus auratus, in Western Australia, PhD thesis, Murdoch University, Perth.
23. Ryan, KL, Morison, AK & Conron, S 2009, Evaluating methods of obtaining total catch estimates for individual Victorian bay and inlet recreational fisheries, final report, Fisheries Research and Development Corporation, project 2003/047, Victorian Department of Primary Industries, Queenscliff.
24. Fletcher, WJ & Santoro K (eds) 2011, State of the fisheries and aquatic resources report 2009/10, Western Australian Department of Fisheries, Perth.
25. Hall, NG & Wise, BS 2011, Development of an ecosystem approach to the monitoring and management of Western Australian fisheries, Fisheries Research and Development Corporation, project 2005/063, Fisheries Research Report 215, Western Australian Department of Fisheries, Perth.

- 355 - STATUS OF KEY AUSTRALIAN FISH STOCKS REPORTS 2012 SNAPPER

Finfish : Tuna & BillfishBigeye Tuna / Southern Bluefin Tuna / Yellowfin Tuna / Swordfish
T U N A A N D B I L L F I S H A R E H I G H LY M I G R AT O R Y, P E L A G I C F I N F I S H F O U N D I N A L L T H E W O R L D ’ S O C E A N S .
T H E Y I N C L U D E I C O N I C S P E C I E S S U C H A S T U N A , M A R L I N A N D S W O R D F I S H .
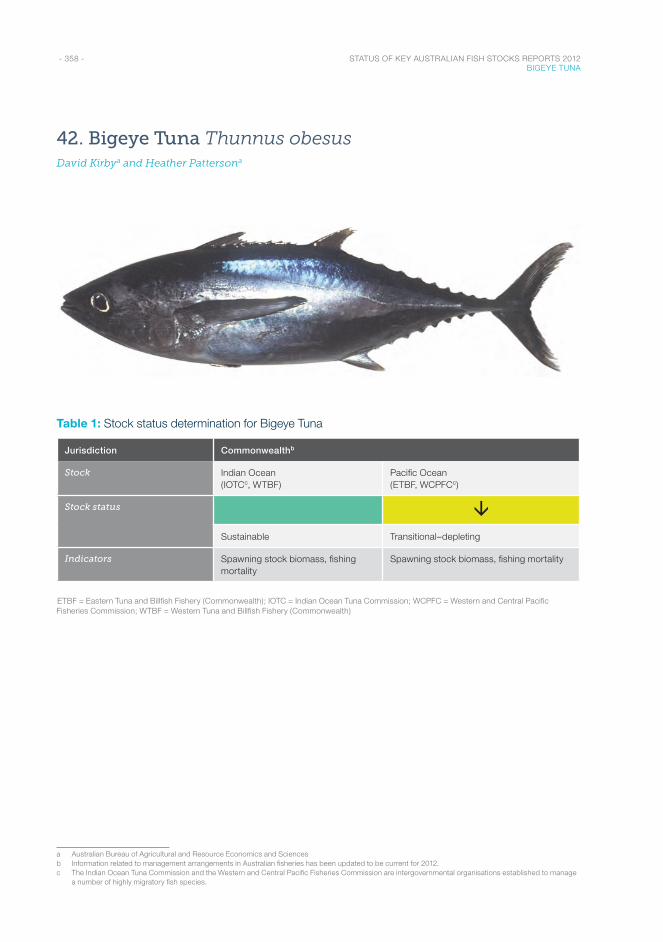
- 358 - STATUS OF KEY AUSTRALIAN FISH STOCKS REPORTS 2012 BIGEYE TUNA
42. Bigeye Tuna Thunnus obesusDavid Kirbya and Heather Pattersona
Table 1: Stock status determination for Bigeye Tuna
Jurisdiction Commonwealthb
Stock Indian Ocean (IOTCc, WTBF)
Pacific Ocean (ETBF, WCPFCc)
Stock status âSustainable Transitional–depleting
Indicators Spawning stock biomass, fishing mortality
Spawning stock biomass, fishing mortality
ETBF = Eastern Tuna and Billfish Fishery (Commonwealth); IOTC = Indian Ocean Tuna Commission; WCPFC = Western and Central Pacific Fisheries Commission; WTBF = Western Tuna and Billfish Fishery (Commonwealth)
a Australian Bureau of Agricultural and Resource Economics and Sciencesb Information related to management arrangements in Australian fisheries has been updated to be current for 2012.c The Indian Ocean Tuna Commission and the Western and Central Pacific Fisheries Commission are intergovernmental organisations established to manage
a number of highly migratory fish species.
- 359 - STATUS OF KEY AUSTRALIAN FISH STOCKS REPORTS 2012 BIGEYE TUNA
Stock structure
The Indian Ocean and Pacific Ocean are considered to comprise two distinct biological stocks and are managed under separate regional fisheries management organisations. Genetic studies have indicated a single biological stock across the Pacific Ocean1. In the Indian Ocean, tagging studies have indicated large movements of Bigeye Tuna, supporting the assumption of a single biological stock2. The Indian Ocean biological stock is under the jurisdiction of the Indian Ocean Tuna Commissiona. The Pacific Ocean stock is under the jurisdiction of the Western and Central Pacific Fisheries Commissionb. Since biological stock delineation is known, status is reported at the level of individual biological stocks.
Stock status
The data used to determine stock status are from 2008 or 2009 because of lags in reporting catch data to the Indian Ocean Tuna Commission and the Western and Central Pacific Fisheries Commission.
Indian Ocean biological stock
In the Indian Ocean, the most recent assessment3 estimated that the biomass of the Bigeye Tuna biological stock in 2009 was 34 per cent of initial unfished biomass. The biological stock is therefore unlikely to be recruitment overfished. This assessment also estimated that fishing mortality in 2009 was below the level associated with maximum sustainable yield (MSY) (79 per cent of mortality at MSY). This level of fishing mortality is unlikely to cause the biological stock to become recruitment overfished. On the basis of the evidence provided above, the Indian Ocean biological stock is classified as a sustainable stock.
Pacific Ocean biological stock
In the Pacific Ocean, the most recent assessment4 estimated that biomass of the Bigeye Tuna biological stock in 2008 was 32 per cent of initial unfished biomass. The biological stock is therefore unlikely to be recruitment overfished. This assessment also estimated that fishing mortality was well above the level associated with MSY (128–197 per cent of mortality at MSY). The current fishing mortality is likely to cause the biological stock to become recruitment overfished. On the basis of the evidence provided above, the Pacific Ocean biological stock is classified as a transitional–depleting stock.
Table 2: Bigeye Tuna biology5
Longevity and maximum size ~16 years; 200 cm FL
Maturity (50%) ~3 years; ~100 cm FL
FL = fork length
a www.iotc.orgb www.wcpfc.int
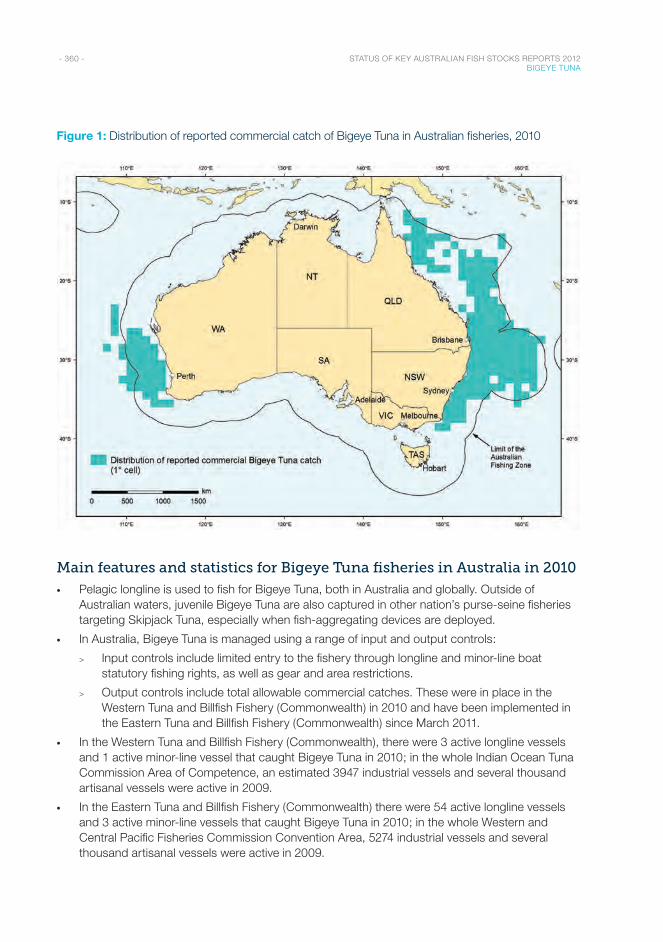
- 360 - STATUS OF KEY AUSTRALIAN FISH STOCKS REPORTS 2012 BIGEYE TUNA
Figure 1: Distribution of reported commercial catch of Bigeye Tuna in Australian fisheries, 2010
Main features and statistics for Bigeye Tuna fisheries in Australia in 2010
• Pelagic longline is used to fish for Bigeye Tuna, both in Australia and globally. Outside of Australian waters, juvenile Bigeye Tuna are also captured in other nation’s purse-seine fisheries targeting Skipjack Tuna, especially when fish-aggregating devices are deployed.
• In Australia, Bigeye Tuna is managed using a range of input and output controls:
> Input controls include limited entry to the fishery through longline and minor-line boat statutory fishing rights, as well as gear and area restrictions.
> Output controls include total allowable commercial catches. These were in place in the Western Tuna and Billfish Fishery (Commonwealth) in 2010 and have been implemented in the Eastern Tuna and Billfish Fishery (Commonwealth) since March 2011.
• In the Western Tuna and Billfish Fishery (Commonwealth), there were 3 active longline vessels and 1 active minor-line vessel that caught Bigeye Tuna in 2010; in the whole Indian Ocean Tuna Commission Area of Competence, an estimated 3947 industrial vessels and several thousand artisanal vessels were active in 2009.
• In the Eastern Tuna and Billfish Fishery (Commonwealth) there were 54 active longline vessels and 3 active minor-line vessels that caught Bigeye Tuna in 2010; in the whole Western and Central Pacific Fisheries Commission Convention Area, 5274 industrial vessels and several thousand artisanal vessels were active in 2009.
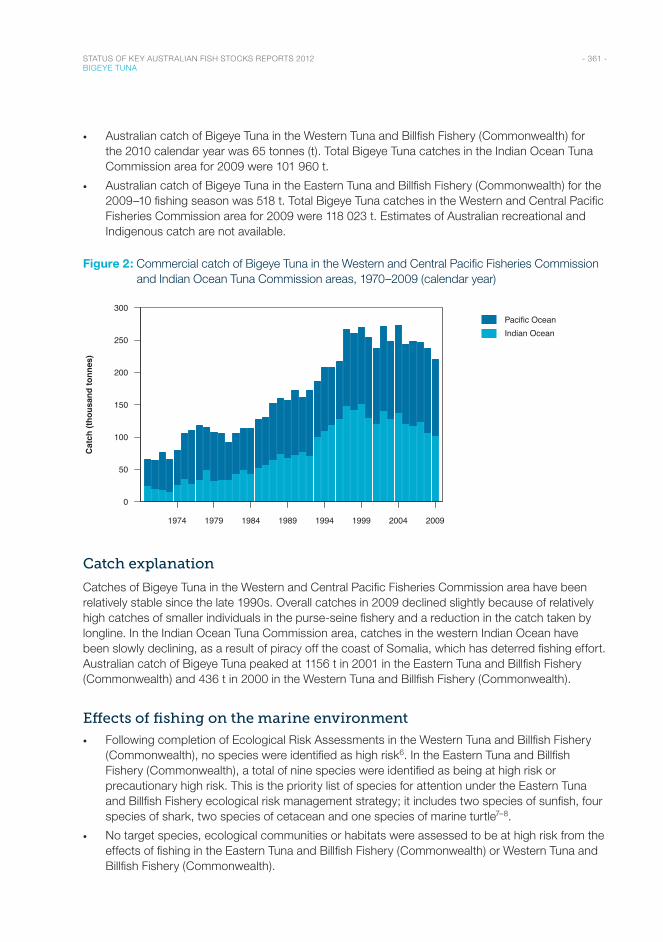
- 361 - STATUS OF KEY AUSTRALIAN FISH STOCKS REPORTS 2012 BIGEYE TUNA
• Australian catch of Bigeye Tuna in the Western Tuna and Billfish Fishery (Commonwealth) for the 2010 calendar year was 65 tonnes (t). Total Bigeye Tuna catches in the Indian Ocean Tuna Commission area for 2009 were 101 960 t.
• Australian catch of Bigeye Tuna in the Eastern Tuna and Billfish Fishery (Commonwealth) for the 2009–10 fishing season was 518 t. Total Bigeye Tuna catches in the Western and Central Pacific Fisheries Commission area for 2009 were 118 023 t. Estimates of Australian recreational and Indigenous catch are not available.
Figure 2: Commercial catch of Bigeye Tuna in the Western and Central Pacific Fisheries Commission and Indian Ocean Tuna Commission areas, 1970–2009 (calendar year)
Year
1974 1979 1984 1989 1994 1999 2004 2009
0
50
100
150
200
250
300Pacific OceanIndian Ocean
Cat
ch (t
hous
and
tonn
es)
Catch explanation
Catches of Bigeye Tuna in the Western and Central Pacific Fisheries Commission area have been relatively stable since the late 1990s. Overall catches in 2009 declined slightly because of relatively high catches of smaller individuals in the purse-seine fishery and a reduction in the catch taken by longline. In the Indian Ocean Tuna Commission area, catches in the western Indian Ocean have been slowly declining, as a result of piracy off the coast of Somalia, which has deterred fishing effort. Australian catch of Bigeye Tuna peaked at 1156 t in 2001 in the Eastern Tuna and Billfish Fishery (Commonwealth) and 436 t in 2000 in the Western Tuna and Billfish Fishery (Commonwealth).
Effects of fishing on the marine environment
• Following completion of Ecological Risk Assessments in the Western Tuna and Billfish Fishery (Commonwealth), no species were identified as high risk6. In the Eastern Tuna and Billfish Fishery (Commonwealth), a total of nine species were identified as being at high risk or precautionary high risk. This is the priority list of species for attention under the Eastern Tuna and Billfish Fishery ecological risk management strategy; it includes two species of sunfish, four species of shark, two species of cetacean and one species of marine turtle7–8.
• No target species, ecological communities or habitats were assessed to be at high risk from the effects of fishing in the Eastern Tuna and Billfish Fishery (Commonwealth) or Western Tuna and Billfish Fishery (Commonwealth).
- 362 - STATUS OF KEY AUSTRALIAN FISH STOCKS REPORTS 2012 BIGEYE TUNA
• Australia implements regulations to minimise the environmental impact of fisheries for tuna and tuna-like species on pelagic ecosystems, specifically on seabirds, sea turtles and sharks. Both the Indian Ocean Tuna Commission and the Western and Central Pacific Fisheries Commission have passed conservation and management measures that are broadly consistent with each other and with Australia’s domestic requirements.
• Australia has prohibited the practice of shark finning in longline fisheries managed by the Commonwealth and the use of wire traces in these fisheries, to reduce fishery impacts on sharks.
Environmental effects on Bigeye Tuna
• The distribution and abundance of tuna can be affected by environmental factors9–10. For example, seasonal changes in the abundance of Bigeye and Yellowfin Tuna on the east coast of Australia are linked to the expansion and contraction of the East Australian Current11.
References1. Grewe, PM & Hampton, J 1998, An assessment of bigeye (Thunnus obesus) population structure in the Pacific Ocean,
based on mitochondrial DNA and DNA microsatellite analysis, SOEST 98-05, JIMAR Contribution 98–320, Joint Institute for Marine and Atmospheric Research, University of Hawaii, Honolulu.
2. Indian Ocean Tuna Commission 2011, Report of the fourteenth session of the Scientific Committee, Victoria, Seychelles, 12–17 December 2011.
3. Indian Ocean Tuna Commission 2010, Report of the thirteenth session of the Scientific Committee, Victoria, Seychelles, 6–10 December 2010.
4. Harley, S, Hoyle, S, Williams, P, Hampton, J & Kleiber, P 2009, Stock assessment of bigeye tuna in the western and central Pacific Ocean, working paper WCPFC-SC5-SA-2009/SA-WP-04, Western and Central Pacific Fisheries Commission Scientific Committee, fifth regular session, Vanuatu, 10–21 August 2009.
5. Froese, R & Pauly, DE 2009, FishBase, version 02/2009, FishBase Consortium, www.fishbase.org.
6. Zhou, S, Fuller, M & Smith, T 2009, Rapid quantitative risk assessment for fish species in seven Commonwealth fisheries, report for the Australian Fisheries Management Authority, CSIRO Marine and Atmospheric Research, Cleveland.
7. Australian Fisheries Management Authority 2009, Residual risk assessment of the level 2 ecological risk assessment: species results. Report for the Eastern Tuna and Billfish Fishery, Australian Fisheries Management Authority, Canberra.
8. Zhou, S, Smith, T & Fuller, M 2007, Rapid quantitative risk assessment for fish species in selected Commonwealth fisheries, report for the Australian Fisheries Management Authority, CSIRO Marine and Atmospheric Research, Cleveland.
9. Hobday, AJ & Young, J 2007, Pelagic fisheries, in AJ Hobday, ES Poloczanska & RJ Matear (eds), Climate impacts on Australian fisheries and aquaculture: implications for the effects of climate change, report for the Australian Greenhouse Office, Canberra, 47–53.
10. Lehodey, P, Hampton, J, Brill, RW, Nicol, S, Senina, I, Calmettes, B, Portner, HO, Bopp, L, Ilyina, T, Bell, JD & Sibert, J 2011, Vulnerability of oceanic fisheries in the tropical Pacific to climate change, in JD Bell, JE Johnson & AJ Hobday (eds), Vulnerability of tropical Pacific fisheries and aquaculture to climate change, Secretariat of the Pacific Community, Noumea, New Caledonia, 433–492.
11. Campbell, RA 1999, Long term trends in yellowfin tuna abundance in the south-west Pacific: with an emphasis on the eastern Australian Fishing Zone, final report to the Australian Fisheries Management Authority, Canberra.
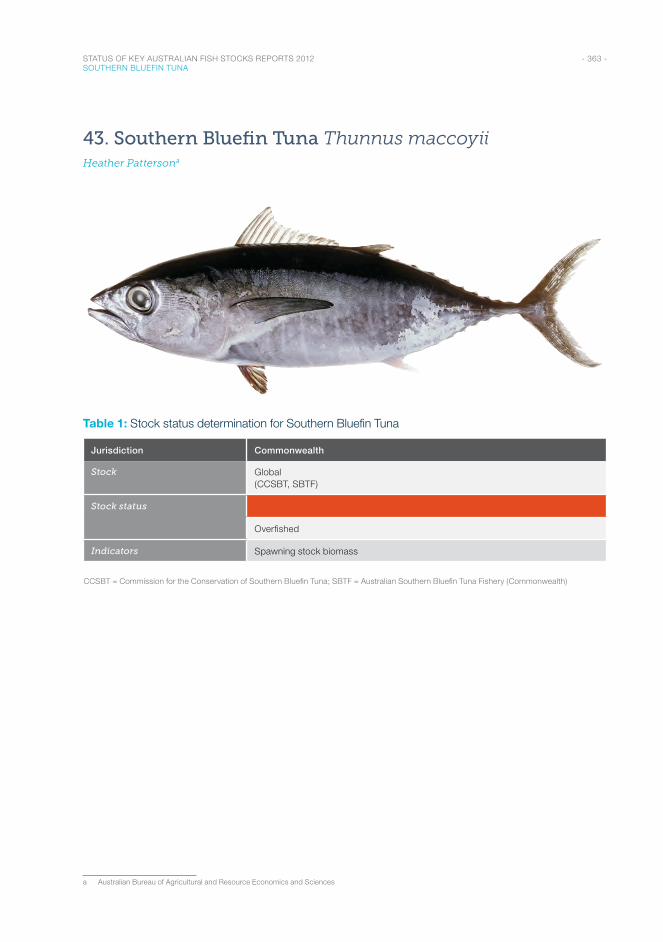
- 363 - STATUS OF KEY AUSTRALIAN FISH STOCKS REPORTS 2012 SOUTHERN BLUEFIN TUNA
43. Southern Bluefin Tuna Thunnus maccoyiiHeather Pattersona
Table 1: Stock status determination for Southern Bluefin Tuna
Jurisdiction Commonwealth
Stock Global (CCSBT, SBTF)
Stock status
Overfished
Indicators Spawning stock biomass
CCSBT = Commission for the Conservation of Southern Bluefin Tuna; SBTF = Australian Southern Bluefin Tuna Fishery (Commonwealth)
a Australian Bureau of Agricultural and Resource Economics and Sciences
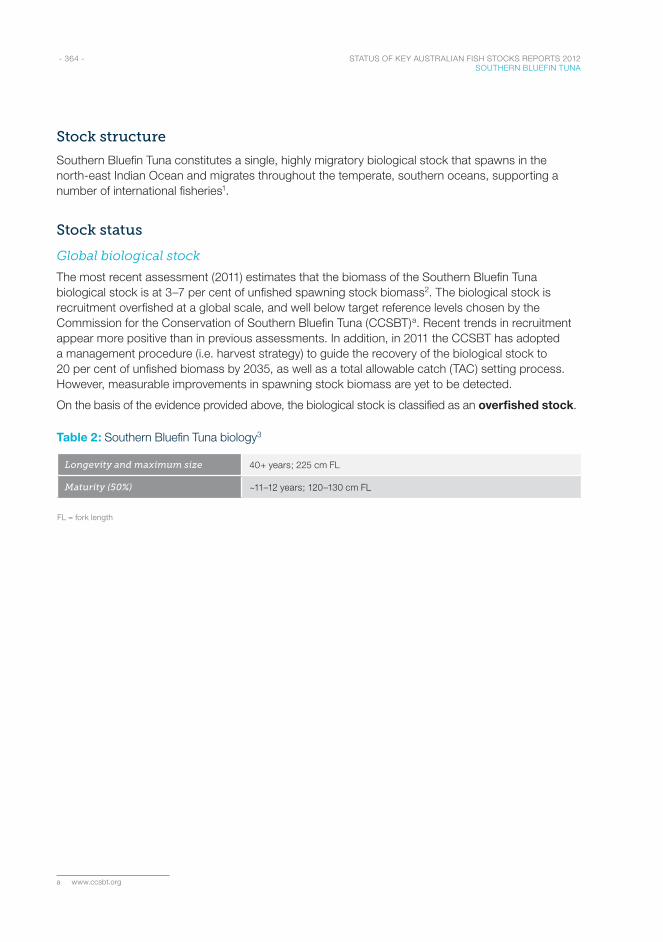
- 364 - STATUS OF KEY AUSTRALIAN FISH STOCKS REPORTS 2012 SOUTHERN BLUEFIN TUNA
Stock structure
Southern Bluefin Tuna constitutes a single, highly migratory biological stock that spawns in the north-east Indian Ocean and migrates throughout the temperate, southern oceans, supporting a number of international fisheries1.
Stock status
Global biological stock
The most recent assessment (2011) estimates that the biomass of the Southern Bluefin Tuna biological stock is at 3–7 per cent of unfished spawning stock biomass2. The biological stock is recruitment overfished at a global scale, and well below target reference levels chosen by the Commission for the Conservation of Southern Bluefin Tuna (CCSBT)a. Recent trends in recruitment appear more positive than in previous assessments. In addition, in 2011 the CCSBT has adopted a management procedure (i.e. harvest strategy) to guide the recovery of the biological stock to 20 per cent of unfished biomass by 2035, as well as a total allowable catch (TAC) setting process. However, measurable improvements in spawning stock biomass are yet to be detected.
On the basis of the evidence provided above, the biological stock is classified as an overfished stock.
Table 2: Southern Bluefin Tuna biology3
Longevity and maximum size 40+ years; 225 cm FL
Maturity (50%) ~11–12 years; 120–130 cm FL
FL = fork length
a www.ccsbt.org
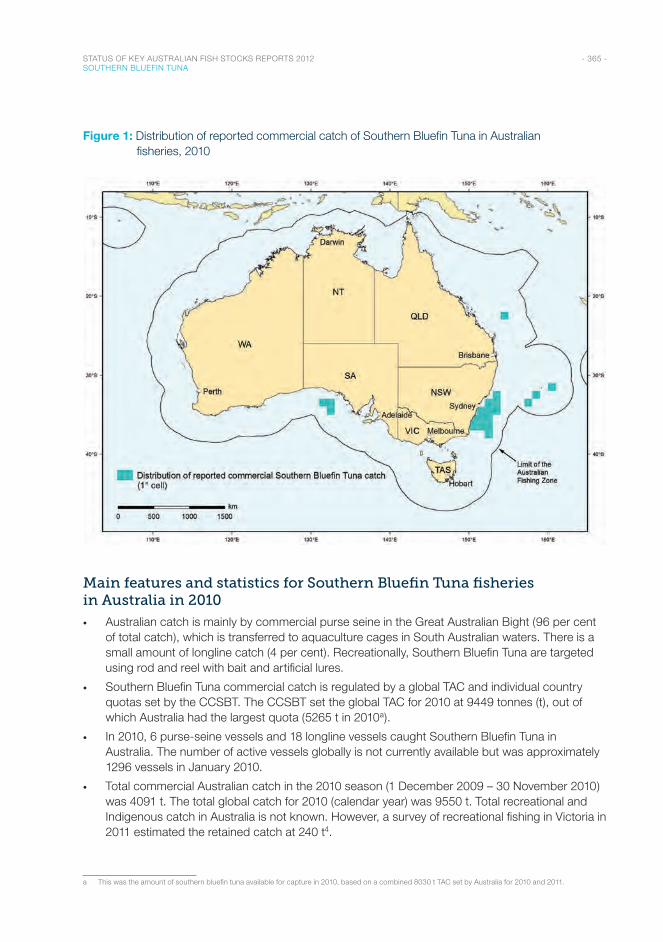
- 365 - STATUS OF KEY AUSTRALIAN FISH STOCKS REPORTS 2012 SOUTHERN BLUEFIN TUNA
Figure 1: Distribution of reported commercial catch of Southern Bluefin Tuna in Australian fisheries, 2010
Main features and statistics for Southern Bluefin Tuna fisheries in Australia in 2010
• Australian catch is mainly by commercial purse seine in the Great Australian Bight (96 per cent of total catch), which is transferred to aquaculture cages in South Australian waters. There is a small amount of longline catch (4 per cent). Recreationally, Southern Bluefin Tuna are targeted using rod and reel with bait and artificial lures.
• Southern Bluefin Tuna commercial catch is regulated by a global TAC and individual country quotas set by the CCSBT. The CCSBT set the global TAC for 2010 at 9449 tonnes (t), out of which Australia had the largest quota (5265 t in 2010a).
• In 2010, 6 purse-seine vessels and 18 longline vessels caught Southern Bluefin Tuna in Australia. The number of active vessels globally is not currently available but was approximately 1296 vessels in January 2010.
• Total commercial Australian catch in the 2010 season (1 December 2009 – 30 November 2010) was 4091 t. The total global catch for 2010 (calendar year) was 9550 t. Total recreational and Indigenous catch in Australia is not known. However, a survey of recreational fishing in Victoria in 2011 estimated the retained catch at 240 t4.
a This was the amount of southern bluefin tuna available for capture in 2010, based on a combined 8030 t TAC set by Australia for 2010 and 2011.
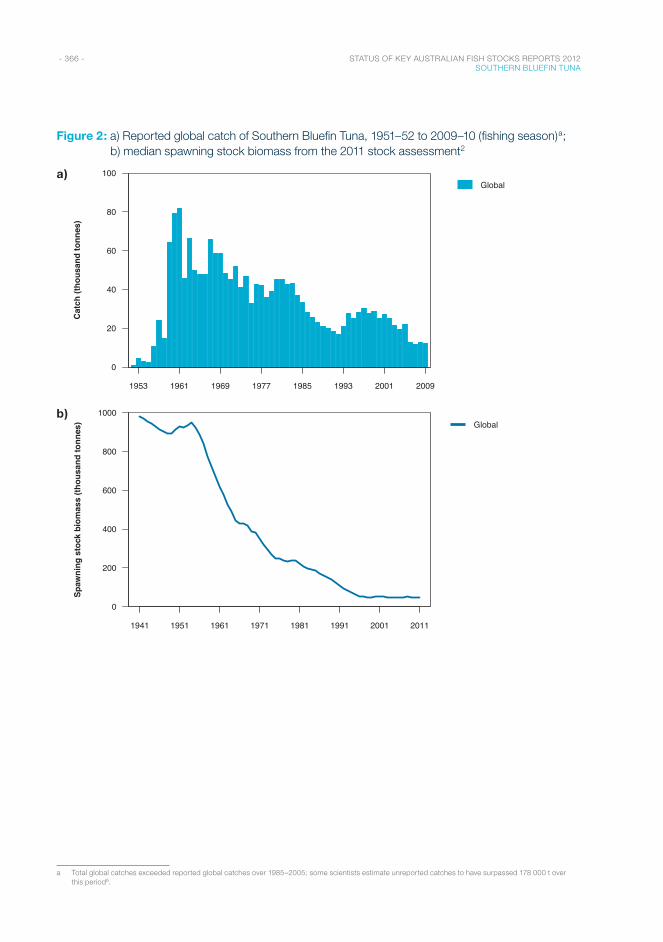
- 366 - STATUS OF KEY AUSTRALIAN FISH STOCKS REPORTS 2012 SOUTHERN BLUEFIN TUNA
Figure 2: a) Reported global catch of Southern Bluefin Tuna, 1951–52 to 2009–10 (fishing season)a; b) median spawning stock biomass from the 2011 stock assessment2
a)
Year
1953 1961 1969 1977 1985 1993 2001 2009
0
20
40
60
80
100Global
Cat
ch (t
hous
and
tonn
es)
b)
Year
1941 1951 1961 1971 1981 1991 2001 2011
0
200
400
600
800
1000Global
Spaw
ning
sto
ck b
iom
ass
(thou
sand
tonn
es)
a Total global catches exceeded reported global catches over 1985–2005; some scientists estimate unreported catches to have surpassed 178 000 t over this period6.
- 367 - STATUS OF KEY AUSTRALIAN FISH STOCKS REPORTS 2012 SOUTHERN BLUEFIN TUNA
Catch explanation
Commercial catches were very high in the early years of the fishery, before declining steadily in the early 1950s. Catch in the Australian Southern Bluefin Tuna Fishery (Commonwealth) is strongly linked to the global quota. In 2009, the global quota was reduced because of the poor state of the biological stock. Australia’s quota was reduced from 5265 t per year to 8030 t for two years (2010 and 2011), while the global quota was reduced from 11 810 t in 2009 to 9449 t for two years (2010 and 2011).
Effects of fishing on the marine environment
• Southern Bluefin Tuna was listed as conservation dependent under the Environment Protection and Biodiversity Conservation Act 1999 in 2010.
• A Ecological Risk Assessment on non-target species in the purse-seine fishery found that the risk to the sustainability of non-target species was low5.
Environmental effects on Southern Bluefin Tuna
• Interannual variation in abundance of Southern Bluefin Tuna in the Great Australian Bight is well documented. This variation has not been directly linked to environmental variables7, although it is possible that environmental factors play a role.
References1. Proctor, CH, Thresher, RE, Gunn, JS, Mills, DJ, Harrowfield, IR & Sie, SH 1995, Stock structure of the southern
bluefin tuna Thunnus maccoyii: an investigation based on probe micro analysis of otolith composition, Marine Biology, 122(4): 511–526.
2. Commission for the Conservation of Southern Bluefin Tuna 2011, Report of the sixteenth meeting of the Scientific Committee, Bali, Indonesia, 19–28 July 2011.
3. Gomon, M, Bray, D & Kuiter, R 2008, Fishes of Australia’s south coast, New Holland Publishers, Sydney.
4. Green, C, Brown, P, Giri, K, Bell, J & Conron, S 2012, Quantifying the recreational catch of southern bluefin tuna off the Victorian coast, Recreational Fishing Grants Program Research Report, Victorian Department of Primary Industries, Victoria.
5. Zhou, S, Fuller, M & Smith, T 2009, Rapid quantitative risk assessment for fish species in seven Commonwealth fisheries, report for the Australian Fisheries Management Authority, Canberra.
6. Polacheck, T & Davies, C 2008, Considerations of implications of large unreported catches of southern bluefin tuna for assessments of tropical tunas, and the need for independent verification of catch and effort statistics, CSIRO Marine and Atmospheric Research Paper 023, CSIRO, Hobart.
7. Hobday, AJ & Young, J 2007, Pelagic fisheries, in AJ Hobday, ES Poloczanska & RJ Matear (eds), Climate impacts on Australian fisheries and aquaculture: implications for the effects of climate change, report for the Australian Greenhouse Office, Canberra, 47–53.
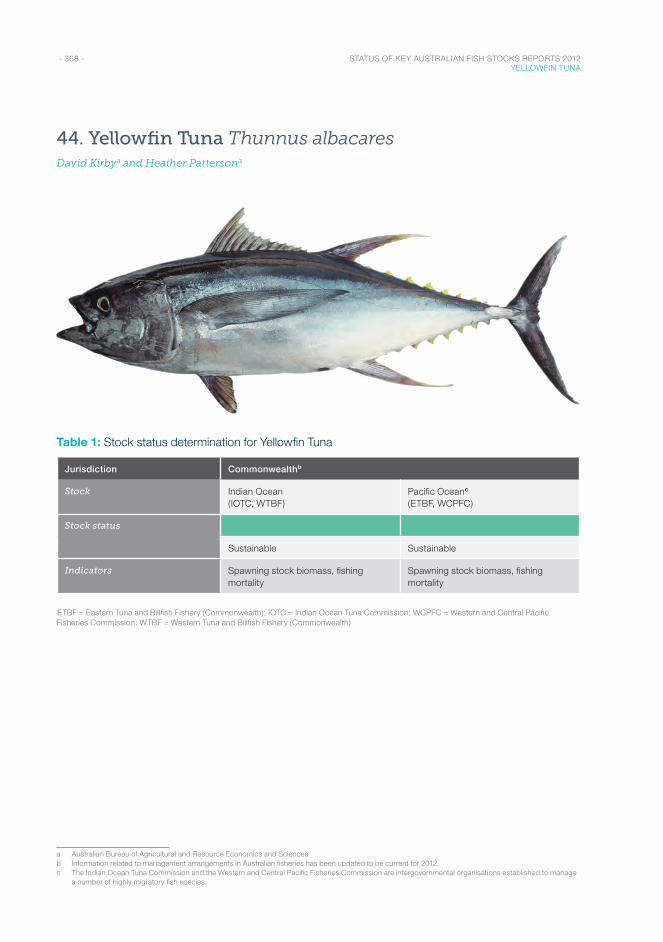
- 368 - STATUS OF KEY AUSTRALIAN FISH STOCKS REPORTS 2012 YELLOWFIN TUNA
44. Yellowfin Tuna Thunnus albacaresDavid Kirbya and Heather Pattersona
Table 1: Stock status determination for Yellowfin Tuna
Jurisdiction Commonwealthb
Stock Indian Ocean (IOTC, WTBF)
Pacific Oceanc (ETBF, WCPFC)
Stock status
Sustainable Sustainable
Indicators Spawning stock biomass, fishing mortality
Spawning stock biomass, fishing mortality
ETBF = Eastern Tuna and Billfish Fishery (Commonwealth); IOTC = Indian Ocean Tuna Commission; WCPFC = Western and Central Pacific Fisheries Commission; WTBF = Western Tuna and Billfish Fishery (Commonwealth)
a Australian Bureau of Agricultural and Resource Economics and Sciencesb Information related to management arrangements in Australian fisheries has been updated to be current for 2012.c The Indian Ocean Tuna Commission and the Western and Central Pacific Fisheries Commission are intergovernmental organisations established to manage
a number of highly migratory fish species.
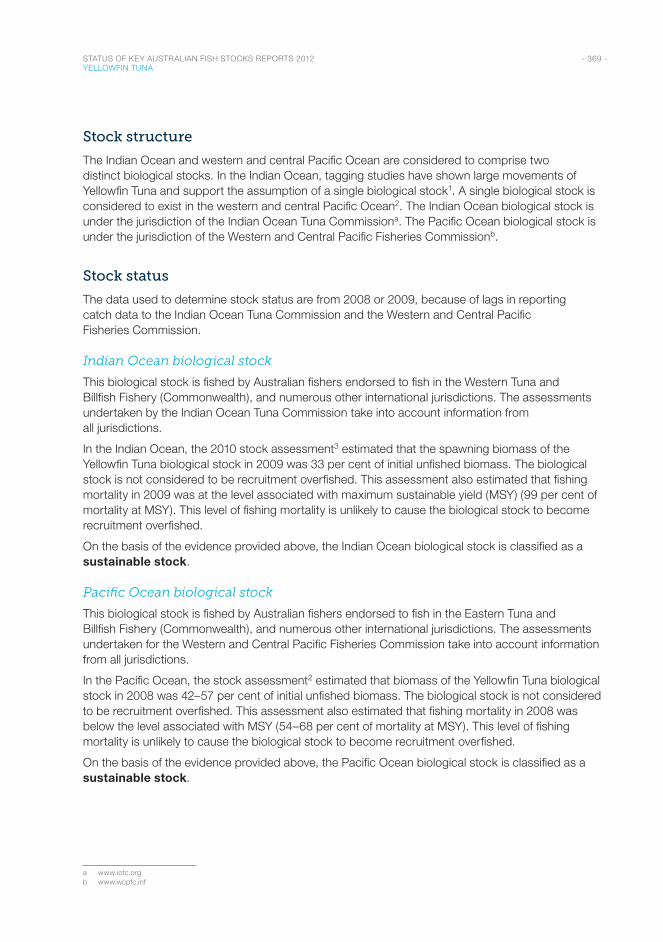
- 369 - STATUS OF KEY AUSTRALIAN FISH STOCKS REPORTS 2012 YELLOWFIN TUNA
Stock structure
The Indian Ocean and western and central Pacific Ocean are considered to comprise two distinct biological stocks. In the Indian Ocean, tagging studies have shown large movements of Yellowfin Tuna and support the assumption of a single biological stock1. A single biological stock is considered to exist in the western and central Pacific Ocean2. The Indian Ocean biological stock is under the jurisdiction of the Indian Ocean Tuna Commissiona. The Pacific Ocean biological stock is under the jurisdiction of the Western and Central Pacific Fisheries Commissionb.
Stock status
The data used to determine stock status are from 2008 or 2009, because of lags in reporting catch data to the Indian Ocean Tuna Commission and the Western and Central Pacific Fisheries Commission.
Indian Ocean biological stock
This biological stock is fished by Australian fishers endorsed to fish in the Western Tuna and Billfish Fishery (Commonwealth), and numerous other international jurisdictions. The assessments undertaken by the Indian Ocean Tuna Commission take into account information from all jurisdictions.
In the Indian Ocean, the 2010 stock assessment3 estimated that the spawning biomass of the Yellowfin Tuna biological stock in 2009 was 33 per cent of initial unfished biomass. The biological stock is not considered to be recruitment overfished. This assessment also estimated that fishing mortality in 2009 was at the level associated with maximum sustainable yield (MSY) (99 per cent of mortality at MSY). This level of fishing mortality is unlikely to cause the biological stock to become recruitment overfished.
On the basis of the evidence provided above, the Indian Ocean biological stock is classified as a sustainable stock.
Pacific Ocean biological stock
This biological stock is fished by Australian fishers endorsed to fish in the Eastern Tuna and Billfish Fishery (Commonwealth), and numerous other international jurisdictions. The assessments undertaken for the Western and Central Pacific Fisheries Commission take into account information from all jurisdictions.
In the Pacific Ocean, the stock assessment2 estimated that biomass of the Yellowfin Tuna biological stock in 2008 was 42–57 per cent of initial unfished biomass. The biological stock is not considered to be recruitment overfished. This assessment also estimated that fishing mortality in 2008 was below the level associated with MSY (54–68 per cent of mortality at MSY). This level of fishing mortality is unlikely to cause the biological stock to become recruitment overfished.
On the basis of the evidence provided above, the Pacific Ocean biological stock is classified as a sustainable stock.
a www.iotc.orgb www.wcpfc.inf
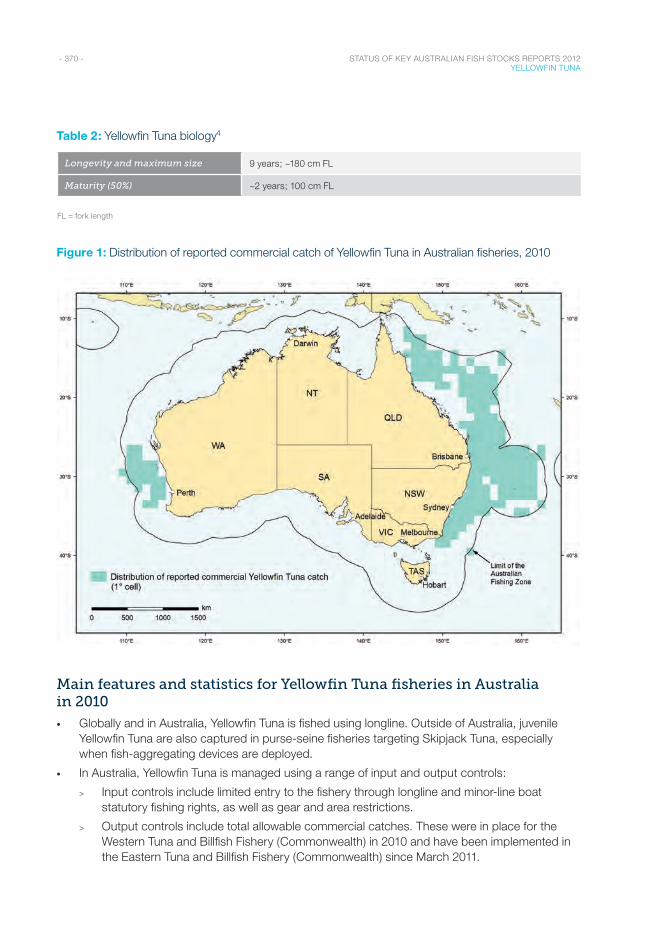
- 370 - STATUS OF KEY AUSTRALIAN FISH STOCKS REPORTS 2012 YELLOWFIN TUNA
Table 2: Yellowfin Tuna biology4
Longevity and maximum size 9 years; ~180 cm FL
Maturity (50%) ~2 years; 100 cm FL
FL = fork length
Figure 1: Distribution of reported commercial catch of Yellowfin Tuna in Australian fisheries, 2010
Main features and statistics for Yellowfin Tuna fisheries in Australia in 2010
• Globally and in Australia, Yellowfin Tuna is fished using longline. Outside of Australia, juvenile Yellowfin Tuna are also captured in purse-seine fisheries targeting Skipjack Tuna, especially when fish-aggregating devices are deployed.
• In Australia, Yellowfin Tuna is managed using a range of input and output controls:
> Input controls include limited entry to the fishery through longline and minor-line boat statutory fishing rights, as well as gear and area restrictions.
> Output controls include total allowable commercial catches. These were in place for the Western Tuna and Billfish Fishery (Commonwealth) in 2010 and have been implemented in the Eastern Tuna and Billfish Fishery (Commonwealth) since March 2011.
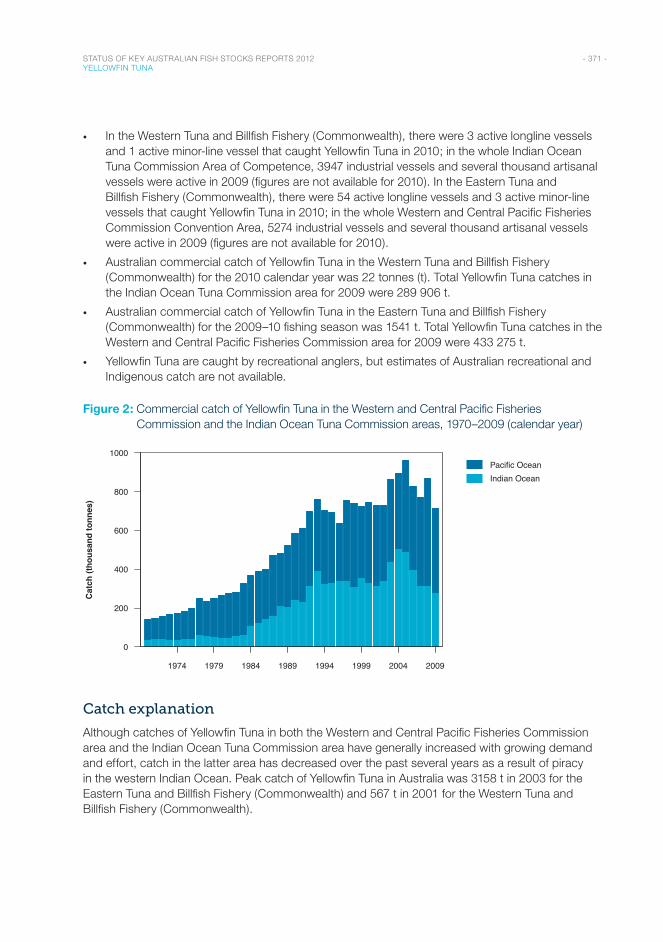
- 371 - STATUS OF KEY AUSTRALIAN FISH STOCKS REPORTS 2012 YELLOWFIN TUNA
• In the Western Tuna and Billfish Fishery (Commonwealth), there were 3 active longline vessels and 1 active minor-line vessel that caught Yellowfin Tuna in 2010; in the whole Indian Ocean Tuna Commission Area of Competence, 3947 industrial vessels and several thousand artisanal vessels were active in 2009 (figures are not available for 2010). In the Eastern Tuna and Billfish Fishery (Commonwealth), there were 54 active longline vessels and 3 active minor-line vessels that caught Yellowfin Tuna in 2010; in the whole Western and Central Pacific Fisheries Commission Convention Area, 5274 industrial vessels and several thousand artisanal vessels were active in 2009 (figures are not available for 2010).
• Australian commercial catch of Yellowfin Tuna in the Western Tuna and Billfish Fishery (Commonwealth) for the 2010 calendar year was 22 tonnes (t). Total Yellowfin Tuna catches in the Indian Ocean Tuna Commission area for 2009 were 289 906 t.
• Australian commercial catch of Yellowfin Tuna in the Eastern Tuna and Billfish Fishery (Commonwealth) for the 2009–10 fishing season was 1541 t. Total Yellowfin Tuna catches in the Western and Central Pacific Fisheries Commission area for 2009 were 433 275 t.
• Yellowfin Tuna are caught by recreational anglers, but estimates of Australian recreational and Indigenous catch are not available.
Figure 2: Commercial catch of Yellowfin Tuna in the Western and Central Pacific Fisheries Commission and the Indian Ocean Tuna Commission areas, 1970–2009 (calendar year)
Year
1974 1979 1984 1989 1994 1999 2004 2009
0
200
400
600
800
1000Pacific OceanIndian Ocean
Cat
ch (t
hous
and
tonn
es)
Catch explanation
Although catches of Yellowfin Tuna in both the Western and Central Pacific Fisheries Commission area and the Indian Ocean Tuna Commission area have generally increased with growing demand and effort, catch in the latter area has decreased over the past several years as a result of piracy in the western Indian Ocean. Peak catch of Yellowfin Tuna in Australia was 3158 t in 2003 for the Eastern Tuna and Billfish Fishery (Commonwealth) and 567 t in 2001 for the Western Tuna and Billfish Fishery (Commonwealth).
- 372 - STATUS OF KEY AUSTRALIAN FISH STOCKS REPORTS 2012 YELLOWFIN TUNA
Effects of fishing on the marine environment
• Following completion of Ecological Risk Assessments in the Western Tuna and Billfish Fishery (Commonwealth), no species were identified as high risk5. In the Eastern Tuna and Billfish Fishery (Commonwealth), a total of nine species were identified as being at high risk or precautionary high risk. This is the priority list of species for attention under the Eastern Tuna and Billfish Fishery ecological risk management strategy; it includes two species of sunfish, four species of shark, two species of cetacean and one species of marine turtle6–7.
• No target species, ecological communities or habitats were assessed to be at high risk from the effects of fishing in the Eastern Tuna and Billfish Fishery (Commonwealth) or Western Tuna and Billfish Fishery (Commonwealth).
• Australia implements regulations to minimise the environmental impact of fisheries for tuna and tuna-like species on pelagic ecosystems, specifically on seabirds, sea turtles and sharks. Both the Indian Ocean Tuna Commission and the Western and Central Pacific Fisheries Commission have passed conservation and management measures that are broadly consistent with each other and with Australia’s domestic requirements.
• Australia has prohibited the practice of shark finning in longline fisheries managed by the Commonwealth and the use of wire traces in these fisheries, to reduce fishery impacts on sharks.
Environmental impacts on Yellowfin Tuna
• The distribution and abundance of tuna can be affected by environmental factors8–9. For example, seasonal changes in the abundance of Bigeye and Yellowfin Tuna on the east coast of Australia are linked to the expansion and contraction of the East Australian Current10.
References1. Langley, A, Herrera, M & Million, J 2010, Stock assessment of yellowfin tuna in the Indian Ocean using MULTIFAN-CL,
working paper IOTC-2010-WPTT-23, Indian Ocean Tuna Commission Working Party on tropical tunas eleventh session, Victoria, Seychelles,18–25 October 2010.
2. Langley, A, Harley, S, Hoyle, S, Davies, N, Hampton J & Kleiber, P 2009, Stock assessment of yellowfin tuna in the western and central Pacific Ocean, working paper WCPFC SC5-SA-2009/SA-WP-03, Western and Central Pacific Fisheries Commission Scientific Committee fifth regular session, Vanuatu, 10–21 August 2009.
3. Indian Ocean Tuna Commission 2010, Report of the thirteenth session of the Scientific Committee, IOTC-2011-SC-R[E], Victoria, Seychelles, 6–10 December 2010.
4. Froese, R & Pauly, DE 2009, FishBase, version 02/2009, FishBase Consortium, www.fishbase.org.
5. Zhou, S, Fuller, M & Smith, T 2009, Rapid quantitative risk assessment for fish species in seven Commonwealth fisheries, report for the Australian Fisheries Management Authority, Canberra.
6. Zhou, S, Smith, T & Fuller, M 2007, Rapid quantitative risk assessment for fish species in selected Commonwealth fisheries, report for the Australian Fisheries Management Authority, Canberra.
7. Australian Fisheries Management Authority 2009, Residual risk assessment of the level 2 ecological risk assessment: species results. Report for the Eastern Tuna and Billfish Fishery, Australian Fisheries Management Authority, Canberra
8. Hobday, AJ & Young, J 2007, Pelagic fisheries, in AJ Hobday, ES Poloczanska & RJ Matear (eds), Climate impacts on Australian fisheries and aquaculture: implications for the effects of climate change, report for the Australian Greenhouse Office, Canberra, 47–53
9. Lehodey, P, Hampton, J, Brill, RW, Nicol, S, Senina, I, Calmettes, B, Portner, HO, Bopp, L, Ilyina, T, Bell, JD & Sibert, J 2011, Vulnerability of oceanic fisheries in the tropical Pacific to climate change, in JD Bell, JE Johnson & AJ Hobday (eds), Vulnerability of tropical Pacific fisheries and aquaculture to climate change, Secretariat of the Pacific Community, Noumea, New Caledonia, 433–492.
10. Campbell, RA 1999, Long term trends in yellowfin tuna abundance in the south-west Pacific: with an emphasis on the eastern Australian Fishing Zone, final report to the Australian Fisheries Management Authority, Canberra.
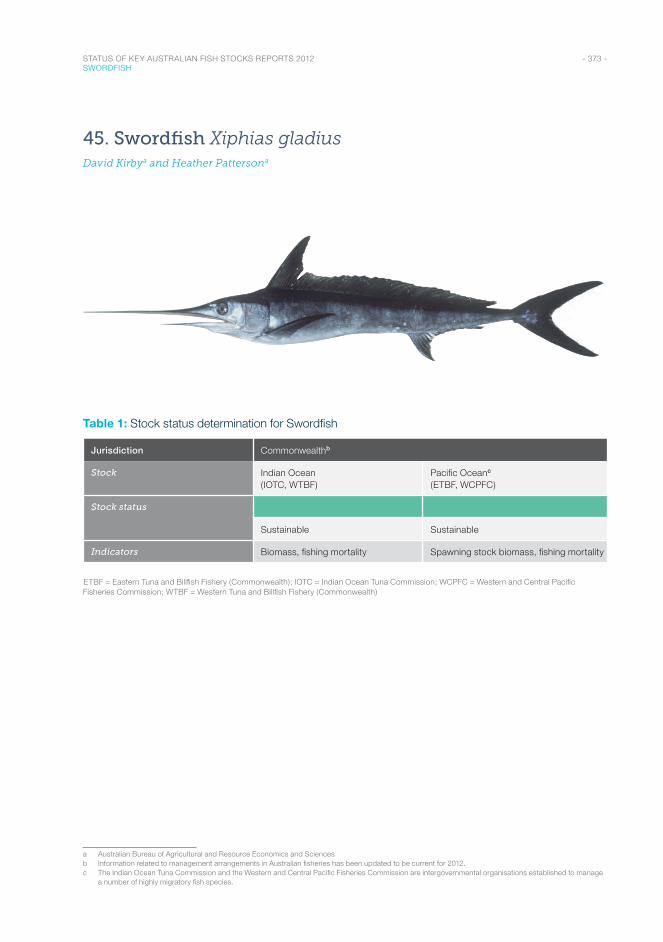
- 373 - STATUS OF KEY AUSTRALIAN FISH STOCKS REPORTS 2012 SWORDFISH
45. Swordfish Xiphias gladiusDavid Kirbya and Heather Pattersona
Table 1: Stock status determination for Swordfish
Jurisdiction Commonwealthb
Stock Indian Ocean (IOTC, WTBF)
Pacific Oceanc (ETBF, WCPFC)
Stock status
Sustainable Sustainable
Indicators Biomass, fishing mortality Spawning stock biomass, fishing mortality
ETBF = Eastern Tuna and Billfish Fishery (Commonwealth); IOTC = Indian Ocean Tuna Commission; WCPFC = Western and Central Pacific Fisheries Commission; WTBF = Western Tuna and Billfish Fishery (Commonwealth)
a Australian Bureau of Agricultural and Resource Economics and Sciencesb Information related to management arrangements in Australian fisheries has been updated to be current for 2012.c The Indian Ocean Tuna Commission and the Western and Central Pacific Fisheries Commission are intergovernmental organisations established to manage
a number of highly migratory fish species.
- 374 - STATUS OF KEY AUSTRALIAN FISH STOCKS REPORTS 2012 SWORDFISH
Stock structure
The Indian and Pacific Oceans are considered to comprise two distinct biological stocks of Swordfish. Research in the Indian Ocean is examining the possibility that two Indian Ocean biological stocks exist in the south-west and south-east Indian Ocean1. However, as this study is still in progress, there is currently no strong evidence for another biological stock, and status determination is undertaken at the management unit level (i.e. Indian Ocean). In the Pacific Ocean, genetic studies have suggested the presence of several semi-independent biological stocks2. However, the delineation of these biological stocks is unknown, and sample sizes were relatively low2. Hence, status is reported at the management unit level (i.e. Pacific Ocean). The Indian Ocean management unit is under the jurisdiction of the Indian Ocean Tuna Commissiona. The Pacific Ocean management unit is under the jurisdiction of the Western and Central Pacific Fisheries Commissionb.
Stock status
The data used to determine status are from 2007 or 2008, because of lags in reporting catch data to the Indian Ocean Tuna Commission and the Western and Central Pacific Fisheries Commission. In addition, the stock assessment for the Pacific Ocean has not been updated since 2008.
Indian Ocean management unit
This management unit is fished by Australian fishers endorsed to fish in the Western Tuna and Billfish Fishery (Commonwealth), and numerous other international jurisdictions. The assessments undertaken by the Indian Ocean Tuna Commission take into account information from all jurisdictions.
In the Indian Ocean, the stock assessment3 estimated that biomass of the Swordfish stock in 2008 was 42 per cent of initial unfished biomass and above the biomass at maximum sustainable yield (MSY) (113 per cent of MSY). The management unit is therefore unlikely to be recruitment overfished. This assessment also estimated that fishing mortality in 2008 was below the level associated with MSY (70 per cent of mortality at MSY). This level of fishing mortality is unlikely to cause the management unit to become recruitment overfished.
On the basis of the evidence provided above, the Indian Ocean management unit is classified as a sustainable stock.
Pacific Ocean management unit
This management unit is fished by Australian fishers endorsed to fish in the Eastern Tuna and Billfish Fishery (Commonwealth), and numerous other international jurisdictions. The assessments undertaken for the Western and Central Pacific Fisheries Commission take into account information from all jurisdictions.
In the south-west Pacific Ocean, the most recent assessment2 estimated that spawning stock biomass of the Swordfish stock in 2007 was well above the biomass at MSY (198 per cent of MSY). The management unit is therefore unlikely to be recruitment overfished. This assessment also estimated that fishing mortality was well below the level associated with MSY (44 per cent of mortality at MSY). This level of fishing mortality is unlikely to cause the management unit to become recruitment overfished.
a www.iotc.orgb www.wcpfc.int
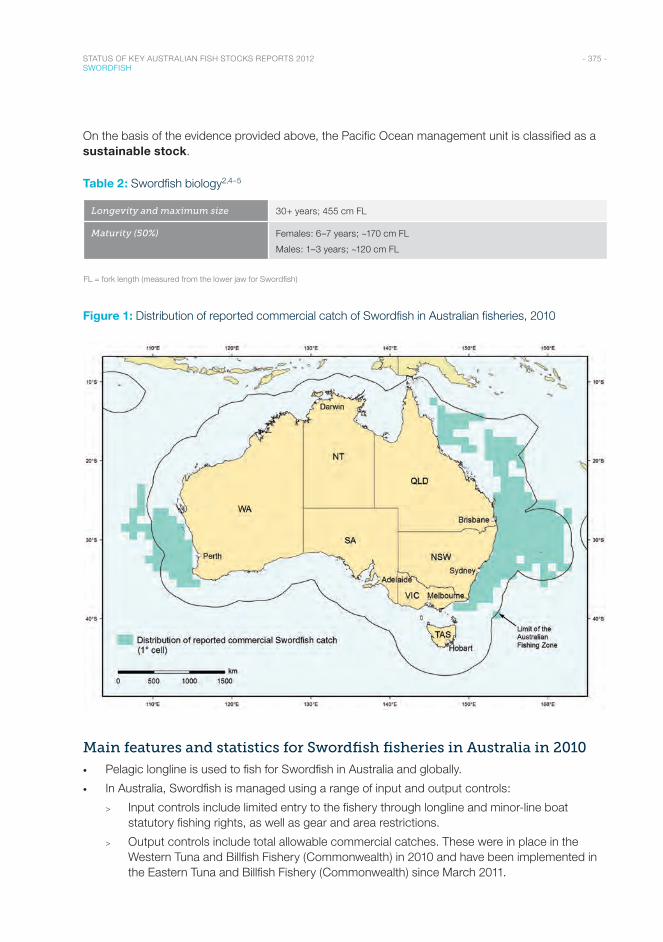
- 375 - STATUS OF KEY AUSTRALIAN FISH STOCKS REPORTS 2012 SWORDFISH
On the basis of the evidence provided above, the Pacific Ocean management unit is classified as a sustainable stock.
Table 2: Swordfish biology2,4–5
Longevity and maximum size 30+ years; 455 cm FL
Maturity (50%) Females: 6–7 years; ~170 cm FL
Males: 1–3 years; ~120 cm FL
FL = fork length (measured from the lower jaw for Swordfish)
Figure 1: Distribution of reported commercial catch of Swordfish in Australian fisheries, 2010
Main features and statistics for Swordfish fisheries in Australia in 2010
• Pelagic longline is used to fish for Swordfish in Australia and globally.
• In Australia, Swordfish is managed using a range of input and output controls:
> Input controls include limited entry to the fishery through longline and minor-line boat statutory fishing rights, as well as gear and area restrictions.
> Output controls include total allowable commercial catches. These were in place in the Western Tuna and Billfish Fishery (Commonwealth) in 2010 and have been implemented in the Eastern Tuna and Billfish Fishery (Commonwealth) since March 2011.
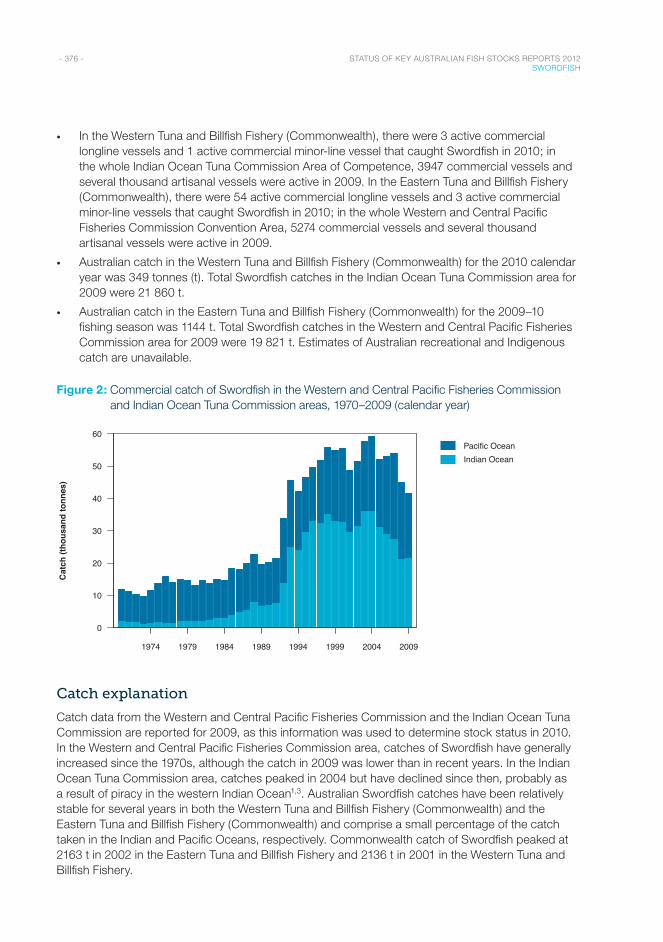
- 376 - STATUS OF KEY AUSTRALIAN FISH STOCKS REPORTS 2012 SWORDFISH
• In the Western Tuna and Billfish Fishery (Commonwealth), there were 3 active commercial longline vessels and 1 active commercial minor-line vessel that caught Swordfish in 2010; in the whole Indian Ocean Tuna Commission Area of Competence, 3947 commercial vessels and several thousand artisanal vessels were active in 2009. In the Eastern Tuna and Billfish Fishery (Commonwealth), there were 54 active commercial longline vessels and 3 active commercial minor-line vessels that caught Swordfish in 2010; in the whole Western and Central Pacific Fisheries Commission Convention Area, 5274 commercial vessels and several thousand artisanal vessels were active in 2009.
• Australian catch in the Western Tuna and Billfish Fishery (Commonwealth) for the 2010 calendar year was 349 tonnes (t). Total Swordfish catches in the Indian Ocean Tuna Commission area for 2009 were 21 860 t.
• Australian catch in the Eastern Tuna and Billfish Fishery (Commonwealth) for the 2009–10 fishing season was 1144 t. Total Swordfish catches in the Western and Central Pacific Fisheries Commission area for 2009 were 19 821 t. Estimates of Australian recreational and Indigenous catch are unavailable.
Figure 2: Commercial catch of Swordfish in the Western and Central Pacific Fisheries Commission and Indian Ocean Tuna Commission areas, 1970–2009 (calendar year)
Year
1974 1979 1984 1989 1994 1999 2004 2009
0
10
20
30
40
50
60Pacific OceanIndian Ocean
Cat
ch (t
hous
and
tonn
es)
Catch explanation
Catch data from the Western and Central Pacific Fisheries Commission and the Indian Ocean Tuna Commission are reported for 2009, as this information was used to determine stock status in 2010. In the Western and Central Pacific Fisheries Commission area, catches of Swordfish have generally increased since the 1970s, although the catch in 2009 was lower than in recent years. In the Indian Ocean Tuna Commission area, catches peaked in 2004 but have declined since then, probably as a result of piracy in the western Indian Ocean1,3. Australian Swordfish catches have been relatively stable for several years in both the Western Tuna and Billfish Fishery (Commonwealth) and the Eastern Tuna and Billfish Fishery (Commonwealth) and comprise a small percentage of the catch taken in the Indian and Pacific Oceans, respectively. Commonwealth catch of Swordfish peaked at 2163 t in 2002 in the Eastern Tuna and Billfish Fishery and 2136 t in 2001 in the Western Tuna and Billfish Fishery.
- 377 - STATUS OF KEY AUSTRALIAN FISH STOCKS REPORTS 2012 SWORDFISH
Effects of fishing on the marine environment
• Following completion of Ecological Risk Assessments in the Western Tuna and Billfish Fishery (Commonwealth), no species were identified as high risk6. In the Eastern Tuna and Billfish Fishery (Commonwealth), a total of nine species were identified as being at high risk or precautionary high risk. This is the priority list of species for attention under the Eastern Tuna and Billfish Fishery ecological risk management strategy; it includes two species of sunfish, four species of shark, two species of cetacean and one species of marine turtle7–8.
• No target species, ecological communities or habitats were assessed to be at high risk from the effects of fishing in the Eastern Tuna and Billfish Fishery (Commonwealth) or Western Tuna and Billfish Fishery (Commonwealth).
• Australia implements regulations to minimise the environmental impact of fisheries for tuna and tuna-like species on pelagic ecosystems, specifically on seabirds, sea turtles and sharks. Both the Indian Ocean Tuna Commission and the Western and Central Pacific Fisheries Commission have passed conservation and management measures that are broadly consistent with each other and with Australia’s domestic requirements.
• Australia has prohibited the practice of shark finning in longline fisheries managed by the Commonwealth and the use of wire traces in these fisheries, to reduce fishery impacts on sharks.
Environmental impacts on Swordfish
• Studies have indicated that the distribution and abundance of Tuna, and possibly Billfish, can be affected by environmental factors9–10.
References1. Kolody D, Campbell, R & Davies, N 2008, A MULTIFAN-CL assessment of south-west Pacific swordfish 1952–2007,
working paper WCPFC-SC4-2008/SA-WP-6, Western and Central Pacific Fisheries Commission Scientific Committee fourth regular session, Papua New Guinea, 11–22 August 2008.
2. Froese, R & Pauly, DE 2009, FishBase, version 02/2009, FishBase Consortium, www.fishbase.org.
3. Poisson, F & Fauvel, C 2009, Reproductive dynamics of swordfish (Xiphias gladius) in the southwestern Indian Ocean (Reunion Island). Part 1: oocyte development, sexual maturity and spawning, Aquatic Living Resources, 22(1), 45–58.
4. Indian Ocean Tuna Commission 2010, Report of the thirteenth session of the Scientific Committee, Victoria, Seychelles, 6–10 December 2010.
5. Indian Ocean Tuna Commission 2011, Report of the fourteenth session of the Scientific Committee, Victoria, Seychelles, 12–17 December 2011.
6. Zhou, S, Fuller, M & Smith, T 2009, Rapid quantitative risk assessment for fish species in seven Commonwealth fisheries, report for the Australian Fisheries Management Authority, Canberra.
7. Zhou, S, Smith, T & Fuller, M 2007, Rapid quantitative risk assessment for fish species in selected Commonwealth fisheries, report for the Australian Fisheries Management Authority, Canberra.
8. Australian Fisheries Management Authority 2009, Residual risk assessment of the level 2 ecological risk assessment: species results. Report for the Eastern Tuna and Billfish Fishery, Australian Fisheries Management Authority, Canberra.
9. Hobday, AJ & Young, J 2007, Pelagic fisheries, in AJ Hobday, ES Poloczanska & RJ Matear (eds), Climate impacts on Australian fisheries and aquaculture: implications for the effects of climate change, report for the Australian Greenhouse Office, Canberra, 4753.
10. Lehodey, P, Hampton, J, Brill, RW, Nicol, S, Senina, I, Calmettes, B, Portner, HO, Bopp, L, Ilyina, T, Bell, JD & Sibert, J 2011, Vulnerability of oceanic fisheries in the tropical Pacific to climate change, in JD Bell, JE Johnson & AJ Hobday (eds), Vulnerability of tropical Pacific fisheries and aquaculture to climate change, Secretariat of the Pacific Community, Noumea, New Caledonia, 433–492.

Finfish : WhitingKing George Whiting / Sand Whiting / Eastern School Whiting
Stout Whiting
W H I T I N G A R E A G R O U P O F S P E C I E S F O U N D I N A U S T R A L I A’ S S H A L L O W C O A S TA L W AT E R S . T H E Y A R E A
P O P U L A R F I N F I S H S P E C I E S W I T H R E C R E AT I O N A L A N G L E R S .
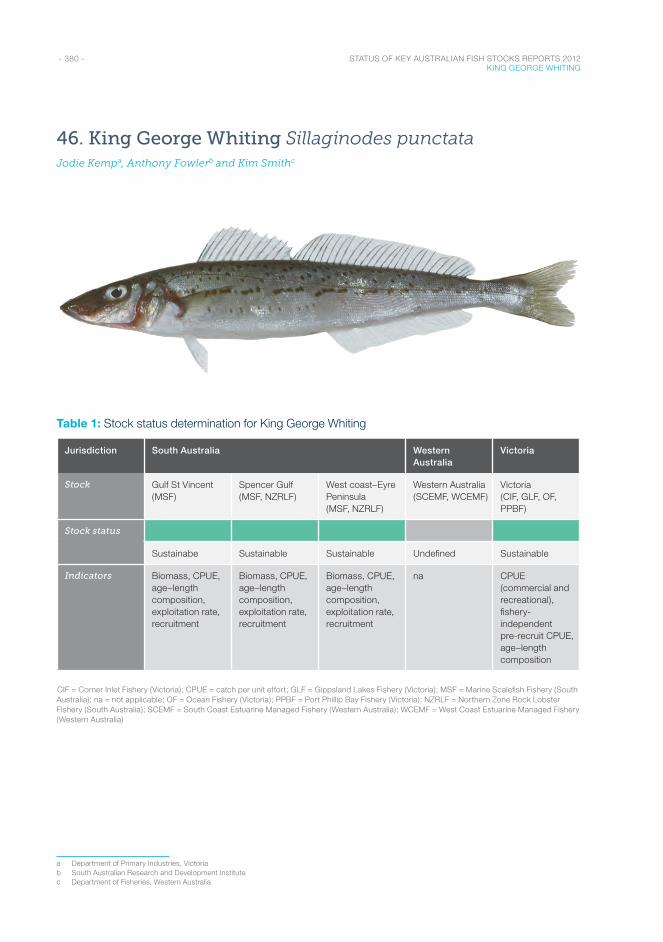
- 380 - STATUS OF KEY AUSTRALIAN FISH STOCKS REPORTS 2012 KING GEORGE WHITING
46. King George Whiting Sillaginodes punctataJodie Kempa, Anthony Fowlerb and Kim Smithc
Table 1: Stock status determination for King George Whiting
Jurisdiction South Australia Western Australia
Victoria
Stock Gulf St Vincent (MSF)
Spencer Gulf (MSF, NZRLF)
West coast–Eyre Peninsula (MSF, NZRLF)
Western Australia (SCEMF, WCEMF)
Victoria (CIF, GLF, OF, PPBF)
Stock status
Sustainabe Sustainable Sustainable Undefined Sustainable
Indicators Biomass, CPUE, age–length composition, exploitation rate, recruitment
Biomass, CPUE, age–length composition, exploitation rate, recruitment
Biomass, CPUE, age–length composition, exploitation rate, recruitment
na CPUE (commercial and recreational), fishery- independent pre-recruit CPUE, age–length composition
CIF = Corner Inlet Fishery (Victoria); CPUE = catch per unit effort; GLF = Gippsland Lakes Fishery (Victoria); MSF = Marine Scalefish Fishery (South Australia); na = not applicable; OF = Ocean Fishery (Victoria); PPBF = Port Phillip Bay Fishery (Victoria); NZRLF = Northern Zone Rock Lobster Fishery (South Australia); SCEMF = South Coast Estuarine Managed Fishery (Western Australia); WCEMF = West Coast Estuarine Managed Fishery (Western Australia)
a Department of Primary Industries, Victoriab South Australian Research and Development Institutec Department of Fisheries, Western Australia
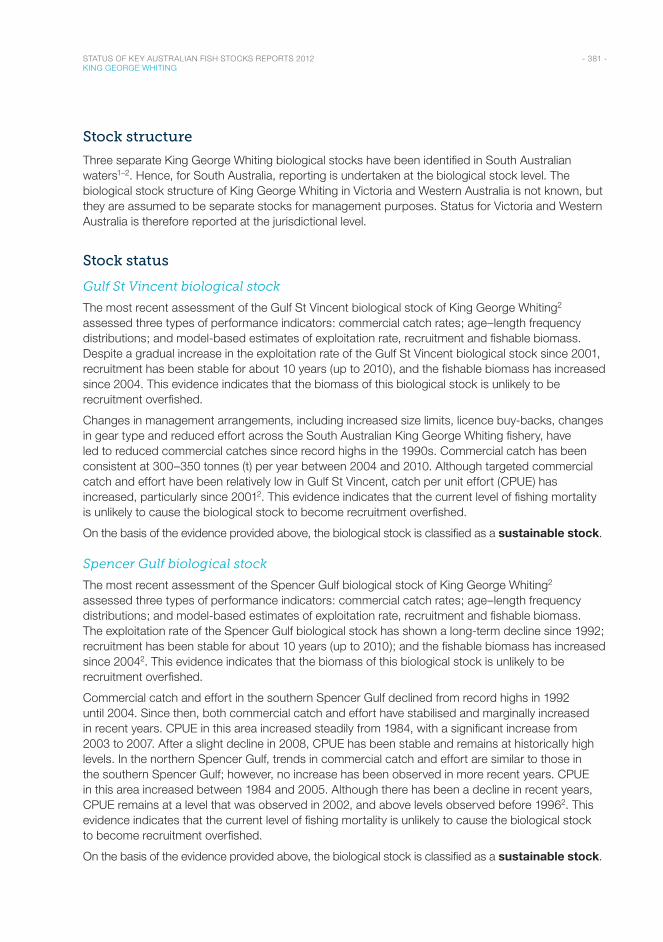
- 381 - STATUS OF KEY AUSTRALIAN FISH STOCKS REPORTS 2012 KING GEORGE WHITING
Stock structure
Three separate King George Whiting biological stocks have been identified in South Australian waters1–2. Hence, for South Australia, reporting is undertaken at the biological stock level. The biological stock structure of King George Whiting in Victoria and Western Australia is not known, but they are assumed to be separate stocks for management purposes. Status for Victoria and Western Australia is therefore reported at the jurisdictional level.
Stock status
Gulf St Vincent biological stock
The most recent assessment of the Gulf St Vincent biological stock of King George Whiting2 assessed three types of performance indicators: commercial catch rates; age–length frequency distributions; and model-based estimates of exploitation rate, recruitment and fishable biomass. Despite a gradual increase in the exploitation rate of the Gulf St Vincent biological stock since 2001, recruitment has been stable for about 10 years (up to 2010), and the fishable biomass has increased since 2004. This evidence indicates that the biomass of this biological stock is unlikely to be recruitment overfished.
Changes in management arrangements, including increased size limits, licence buy-backs, changes in gear type and reduced effort across the South Australian King George Whiting fishery, have led to reduced commercial catches since record highs in the 1990s. Commercial catch has been consistent at 300–350 tonnes (t) per year between 2004 and 2010. Although targeted commercial catch and effort have been relatively low in Gulf St Vincent, catch per unit effort (CPUE) has increased, particularly since 20012. This evidence indicates that the current level of fishing mortality is unlikely to cause the biological stock to become recruitment overfished.
On the basis of the evidence provided above, the biological stock is classified as a sustainable stock.
Spencer Gulf biological stock
The most recent assessment of the Spencer Gulf biological stock of King George Whiting2 assessed three types of performance indicators: commercial catch rates; age–length frequency distributions; and model-based estimates of exploitation rate, recruitment and fishable biomass. The exploitation rate of the Spencer Gulf biological stock has shown a long-term decline since 1992; recruitment has been stable for about 10 years (up to 2010); and the fishable biomass has increased since 20042. This evidence indicates that the biomass of this biological stock is unlikely to be recruitment overfished.
Commercial catch and effort in the southern Spencer Gulf declined from record highs in 1992 until 2004. Since then, both commercial catch and effort have stabilised and marginally increased in recent years. CPUE in this area increased steadily from 1984, with a significant increase from 2003 to 2007. After a slight decline in 2008, CPUE has been stable and remains at historically high levels. In the northern Spencer Gulf, trends in commercial catch and effort are similar to those in the southern Spencer Gulf; however, no increase has been observed in more recent years. CPUE in this area increased between 1984 and 2005. Although there has been a decline in recent years, CPUE remains at a level that was observed in 2002, and above levels observed before 19962. This evidence indicates that the current level of fishing mortality is unlikely to cause the biological stock to become recruitment overfished.
On the basis of the evidence provided above, the biological stock is classified as a sustainable stock.
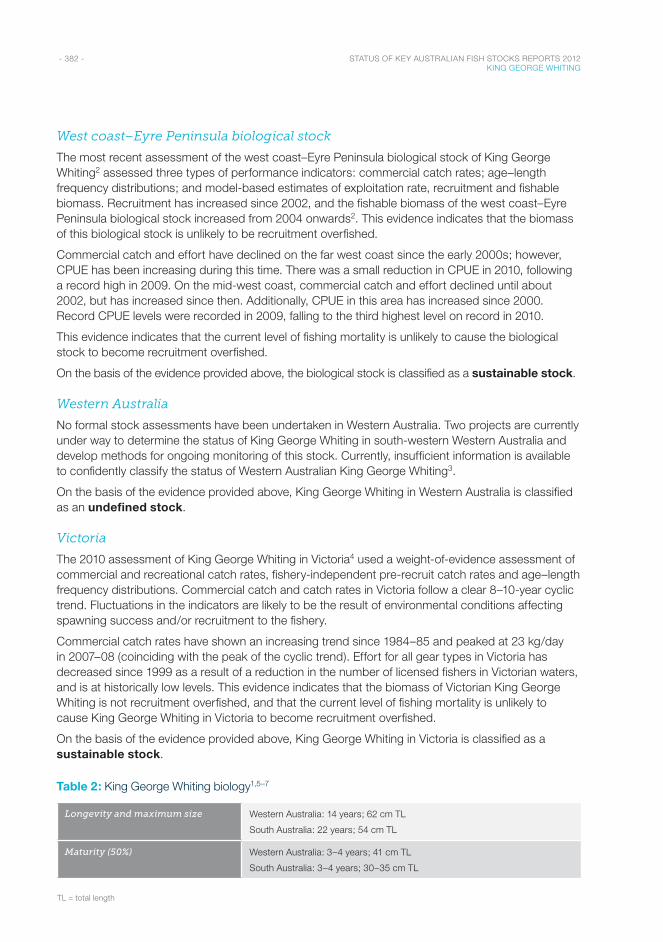
- 382 - STATUS OF KEY AUSTRALIAN FISH STOCKS REPORTS 2012 KING GEORGE WHITING
West coast–Eyre Peninsula biological stock
The most recent assessment of the west coast–Eyre Peninsula biological stock of King George Whiting2 assessed three types of performance indicators: commercial catch rates; age–length frequency distributions; and model-based estimates of exploitation rate, recruitment and fishable biomass. Recruitment has increased since 2002, and the fishable biomass of the west coast–Eyre Peninsula biological stock increased from 2004 onwards2. This evidence indicates that the biomass of this biological stock is unlikely to be recruitment overfished.
Commercial catch and effort have declined on the far west coast since the early 2000s; however, CPUE has been increasing during this time. There was a small reduction in CPUE in 2010, following a record high in 2009. On the mid-west coast, commercial catch and effort declined until about 2002, but has increased since then. Additionally, CPUE in this area has increased since 2000. Record CPUE levels were recorded in 2009, falling to the third highest level on record in 2010.
This evidence indicates that the current level of fishing mortality is unlikely to cause the biological stock to become recruitment overfished.
On the basis of the evidence provided above, the biological stock is classified as a sustainable stock.
Western Australia
No formal stock assessments have been undertaken in Western Australia. Two projects are currently under way to determine the status of King George Whiting in south-western Western Australia and develop methods for ongoing monitoring of this stock. Currently, insufficient information is available to confidently classify the status of Western Australian King George Whiting3.
On the basis of the evidence provided above, King George Whiting in Western Australia is classified as an undefined stock.
Victoria
The 2010 assessment of King George Whiting in Victoria4 used a weight-of-evidence assessment of commercial and recreational catch rates, fishery-independent pre-recruit catch rates and age–length frequency distributions. Commercial catch and catch rates in Victoria follow a clear 8–10-year cyclic trend. Fluctuations in the indicators are likely to be the result of environmental conditions affecting spawning success and/or recruitment to the fishery.
Commercial catch rates have shown an increasing trend since 1984–85 and peaked at 23 kg/day in 2007–08 (coinciding with the peak of the cyclic trend). Effort for all gear types in Victoria has decreased since 1999 as a result of a reduction in the number of licensed fishers in Victorian waters, and is at historically low levels. This evidence indicates that the biomass of Victorian King George Whiting is not recruitment overfished, and that the current level of fishing mortality is unlikely to cause King George Whiting in Victoria to become recruitment overfished.
On the basis of the evidence provided above, King George Whiting in Victoria is classified as a sustainable stock.
Table 2: King George Whiting biology1,5–7
Longevity and maximum size Western Australia: 14 years; 62 cm TL
South Australia: 22 years; 54 cm TL
Maturity (50%) Western Australia: 3–4 years; 41 cm TL
South Australia: 3–4 years; 30–35 cm TL
TL = total length
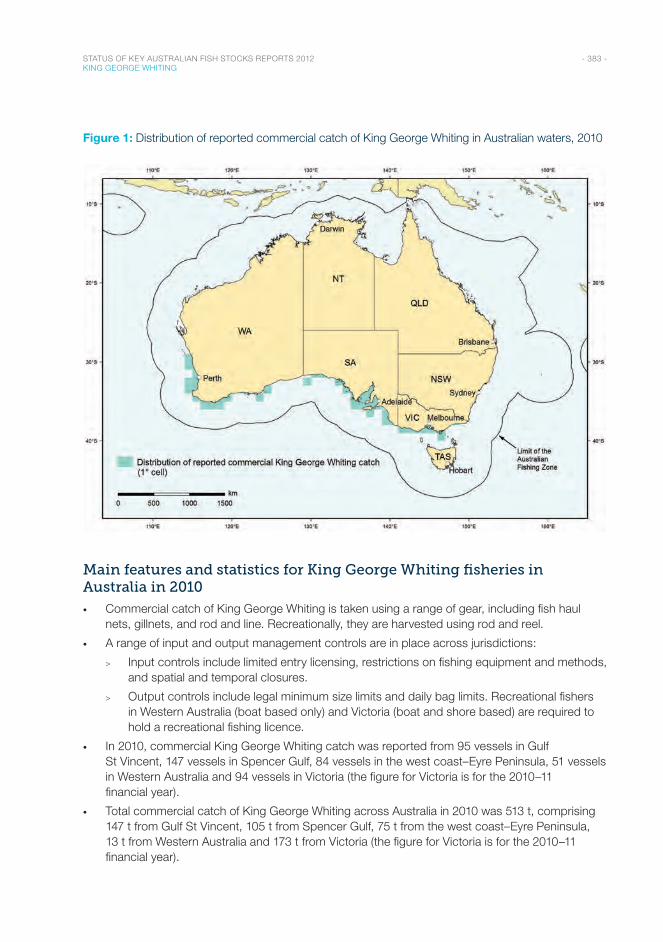
- 383 - STATUS OF KEY AUSTRALIAN FISH STOCKS REPORTS 2012 KING GEORGE WHITING
Figure 1: Distribution of reported commercial catch of King George Whiting in Australian waters, 2010
Main features and statistics for King George Whiting fisheries in Australia in 2010
• Commercial catch of King George Whiting is taken using a range of gear, including fish haul nets, gillnets, and rod and line. Recreationally, they are harvested using rod and reel.
• A range of input and output management controls are in place across jurisdictions:
> Input controls include limited entry licensing, restrictions on fishing equipment and methods, and spatial and temporal closures.
> Output controls include legal minimum size limits and daily bag limits. Recreational fishers in Western Australia (boat based only) and Victoria (boat and shore based) are required to hold a recreational fishing licence.
• In 2010, commercial King George Whiting catch was reported from 95 vessels in Gulf St Vincent, 147 vessels in Spencer Gulf, 84 vessels in the west coast–Eyre Peninsula, 51 vessels in Western Australia and 94 vessels in Victoria (the figure for Victoria is for the 2010–11 financial year).
• Total commercial catch of King George Whiting across Australia in 2010 was 513 t, comprising 147 t from Gulf St Vincent, 105 t from Spencer Gulf, 75 t from the west coast–Eyre Peninsula, 13 t from Western Australia and 173 t from Victoria (the figure for Victoria is for the 2010–11 financial year).
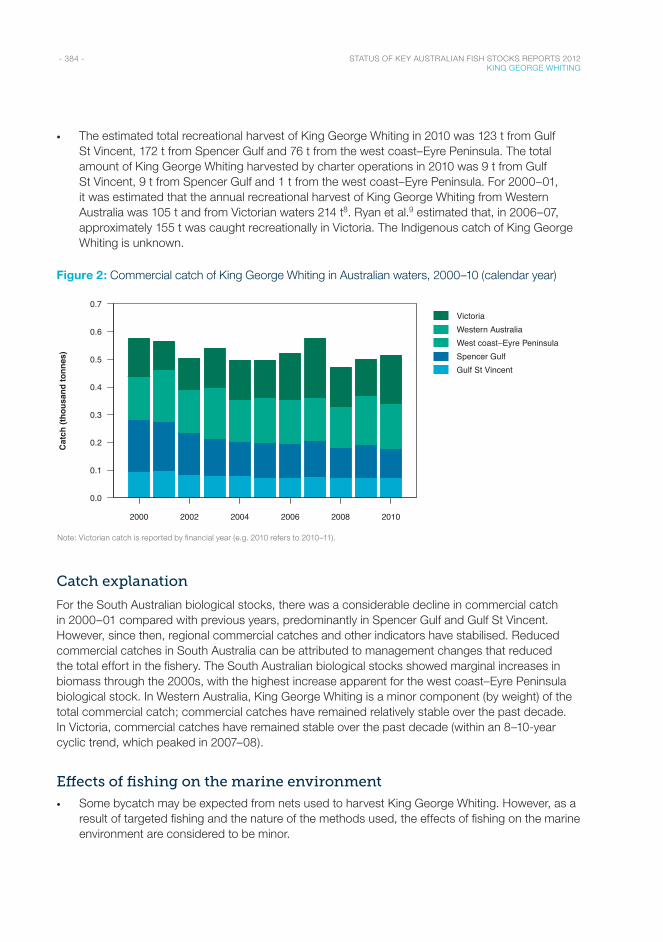
- 384 - STATUS OF KEY AUSTRALIAN FISH STOCKS REPORTS 2012 KING GEORGE WHITING
• The estimated total recreational harvest of King George Whiting in 2010 was 123 t from Gulf St Vincent, 172 t from Spencer Gulf and 76 t from the west coast–Eyre Peninsula. The total amount of King George Whiting harvested by charter operations in 2010 was 9 t from Gulf St Vincent, 9 t from Spencer Gulf and 1 t from the west coast–Eyre Peninsula. For 2000–01, it was estimated that the annual recreational harvest of King George Whiting from Western Australia was 105 t and from Victorian waters 214 t8. Ryan et al.9 estimated that, in 2006–07, approximately 155 t was caught recreationally in Victoria. The Indigenous catch of King George Whiting is unknown.
Figure 2: Commercial catch of King George Whiting in Australian waters, 2000–10 (calendar year)
Year
2000 2002 2004 2006 2008 2010
0.0
0.1
0.2
0.3
0.4
0.5
0.6
0.7VictoriaWestern AustraliaWest coast–Eyre PeninsulaSpencer GulfGulf St Vincent
Cat
ch (t
hous
and
tonn
es)
Note: Victorian catch is reported by financial year (e.g. 2010 refers to 2010–11).
Catch explanation
For the South Australian biological stocks, there was a considerable decline in commercial catch in 2000–01 compared with previous years, predominantly in Spencer Gulf and Gulf St Vincent. However, since then, regional commercial catches and other indicators have stabilised. Reduced commercial catches in South Australia can be attributed to management changes that reduced the total effort in the fishery. The South Australian biological stocks showed marginal increases in biomass through the 2000s, with the highest increase apparent for the west coast–Eyre Peninsula biological stock. In Western Australia, King George Whiting is a minor component (by weight) of the total commercial catch; commercial catches have remained relatively stable over the past decade. In Victoria, commercial catches have remained stable over the past decade (within an 8–10-year cyclic trend, which peaked in 2007–08).
Effects of fishing on the marine environment
• Some bycatch may be expected from nets used to harvest King George Whiting. However, as a result of targeted fishing and the nature of the methods used, the effects of fishing on the marine environment are considered to be minor.
- 385 - STATUS OF KEY AUSTRALIAN FISH STOCKS REPORTS 2012 KING GEORGE WHITING
Environmental impacts on King George Whiting
• Commercial catch and catch rates in Victoria follow a clear 8–10-year cyclic trend. Fluctuations in the indicators are likely to be the result of environmental conditions affecting spawning success and/or recruitment to the fishery. The abundance of post-larval King George Whiting has been low since 2006, indicating that both recreational and commercial catches will be lower than average for the next few years. The next peak season for King George Whiting in Victorian waters is expected to occur between 2015–16 and 2017–184.
• A significant relationship has been found between the abundance of post-larvae in Port Phillip Bay in Victoria and the strength of zonal westerly winds in south-eastern Australia10. The zonal westerly wind index has shown a long-term downward trend since about 1970, suggesting that the strength of the westerly wind flow over Victoria has decreased over the past 40 years. This is consistent with the prediction that westerly winds will weaken in southern Australia as a result of climate change, due to a southward migration of the high-latitude westerly windbelt south of Australia11. This could ultimately have a significant impact on the abundance of larvae that enter Victoria’s bays and inlets, and could negatively influence the long-term commercial catch of King George Whiting (G Jenkins, pers. comm. 2012).
References1. Fowler, AJ, McLeay, L & Short, DA 2000, Spatial variation in size and age structures and reproductive characteristics of
the King George whiting (Percoidei: Sillaginidae) in South Australian waters, Marine and Freshwater Research, 51: 11–22.
2. Fowler, AJ, McGarvey, R, Burch, P & Feenstra, JE 2011, King George Whiting (Sillaginodes punctatus) Fishery, fishery assessment report to PIRSA Fisheries and Aquaculture, SARDI publication no. F2007/000843-3, SARDI Research Report Series 562, South Australian Research and Development Institute (Aquatic Sciences), Adelaide.
3. Fletcher, WJ & Santoro, K (eds) 2011, State of the fisheries and aquatic resources report 2010/11, Western Australian Department of Fisheries, Perth.
4. Kemp, J, Ryan, KL, Brown, L, Bruce, TK, MacDonald, M & Conron, S 2012, Victorian King George whiting bay and inlet stock assessment 2010, Fisheries Victoria Assessment Report Series no. 65, Victorian Department of Primary Industries, Melbourne.
5. Hyndes, GA, Platell, ME, Potter, IC & Lenanton, RCJ 1998, Age composition, growth, reproductive biology and recruitment of King George whiting, Sillaginodes punctata, in south western Australia, Fishery Bulletin, 96: 258–270.
6. Jenkins, GP & May, HMA 1994, Variation in settlement and larval duration of King George whiting, Sillaginodes punctata (Sillaginidae), in Swan Bay, Victoria, Australia, Bulletin of Marine Science, 54, 281–296.
7. Jenkins, GP, Black, KP & Hamer, PA 2000, Determination of spawning areas and larval advection pathways for King George whiting in southeastern Australia using otolith microstructure and hydrodynamic modelling, Inter Research, Victoria, Marine Ecology-Progress Series, 199: 231–242.
8. Henry, GW & Lyle, JM 2003, The national recreational and Indigenous fishing survey, Fisheries Research and Development Corporation project 1999/158, Australian Government Department of Agriculture, Fisheries and Forestry, Canberra, http://eprints.utas.edu.au/2526/1/Henry_Lyle_Nationalsurvey.pdf.
9. Ryan, KL, Morison, AK & Conron, S 2009, Evaluating methods of obtaining total catch estimates for individual Victorian bay and inlet recreational fisheries, final report to the Fisheries Research and Development Corporation, project 2003/047, Victorian Department of Primary Industries, Queenscliff.
10. Jenkins, GP 2005, The influence of climate on the fishery recruitment of a temperate, seagrass associated fish, the King George whiting, Sillaginodes punctata, Marine Ecology-Progress Series, 288: 263–271.
11. Cai, W, Shi, G, Cowan, T, Bi, D & Ribbe, J 2005, The response of the southern annular mode, the East Australian Current, and the southern mid-latitude ocean circulation to global warming, Geophysical Research Letters, 32: L23706.
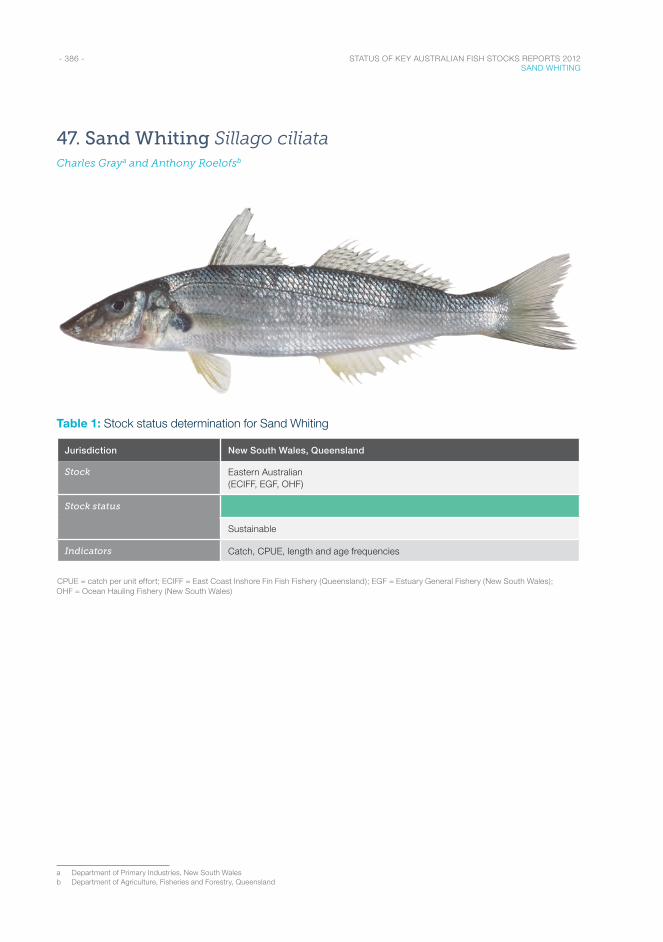
- 386 - STATUS OF KEY AUSTRALIAN FISH STOCKS REPORTS 2012 SAND WHITING
47. Sand Whiting Sillago ciliataCharles Graya and Anthony Roelofsb
Table 1: Stock status determination for Sand Whiting
Jurisdiction New South Wales, Queensland
Stock Eastern Australian (ECIFF, EGF, OHF)
Stock status
Sustainable
Indicators Catch, CPUE, length and age frequencies
CPUE = catch per unit effort; ECIFF = East Coast Inshore Fin Fish Fishery (Queensland); EGF = Estuary General Fishery (New South Wales); OHF = Ocean Hauling Fishery (New South Wales)
a Department of Primary Industries, New South Walesb Department of Agriculture, Fisheries and Forestry, Queensland
- 387 - STATUS OF KEY AUSTRALIAN FISH STOCKS REPORTS 2012 SAND WHITING
Stock structure
Sand Whiting occurs from northern Queensland to eastern Victoria; however, little is known about the biological stock structure of the population. Tagging studies have shown movement of fish between estuaries. Hence, a single biological stock is assumed throughout the range of the species in eastern Australia, and reporting of status is undertaken at the biological stock level.
Stock status
Eastern Australian biological stock
Sand Whiting is a key commercial and recreational species that is fished throughout its distribution along the east coast of Australia. It has a long history of relatively stable commercial landings in both Queensland and New South Wales.
In the Queensland part of the biological stock, commercial catch per unit effort (CPUE) decreased slightly in 2010, but was within historical levels (Figure 2b). CPUE has been relatively stable since the early 2000s (Figure 2b). Length-frequency data from commercial and recreational catch have been consistent since these data were first collected in 2008, indicating a stable biological stock with good recruitment. This evidence indicates that the Queensland part of the biological stock is unlikely to be recruitment overfished. Catch also decreased slightly in 2010, but is within historical levels; it has remained relatively stable since the early 2000s. Fishery-dependent monitoring of commercial and recreational catches in the main fishery area indicates that total mortality in 2010 was below the threshold level, which is set at twice the natural mortality1. The minimum size limit (23 cm fork length) is based on knowledge of size-at-first-maturity, which ensures that a large proportion of the population can spawn before capture1. The combination of a stable commercial catch history, acceptable total mortality estimates and a precautionary minimum legal size indicates that the current level of fishing mortality is unlikely to cause this part of the biological stock to become recruitment overfished1.
In the New South Wales part of the biological stock, Sand Whiting has a history of relatively stable landings (113–160 tonnes [t] between 2001 and 2010; Figure 2a)2. CPUE for estuarine commercial seining in New South Wales has been relatively stable since 1998–99 (Figure 2b), as has the length composition of landings since the 1960s. Sand Whiting grow fast, and retained commercial landings predominantly comprise fish between 2 and 5 years of age3. There is no evidence that recruitment is limited2. This part of the biological stock is not considered to be recruitment overfished. The minimum legal length in New South Wales (27 cm total length) provides opportunity for Sand Whiting to spawn before recruiting to the fishery2. This evidence indicates that the current level of fishing mortality is unlikely to cause this part of the biological stock to become recruitment overfished.
On the basis of the evidence provided above, the entire biological stock is classified as a sustainable stock.
Table 2: Sand Whiting biology4
Longevity and maximum size 12 years; 50 cm FL
Maturity (50%) Males: 17 cm FL
Females: 19 cm FL
FL = fork length
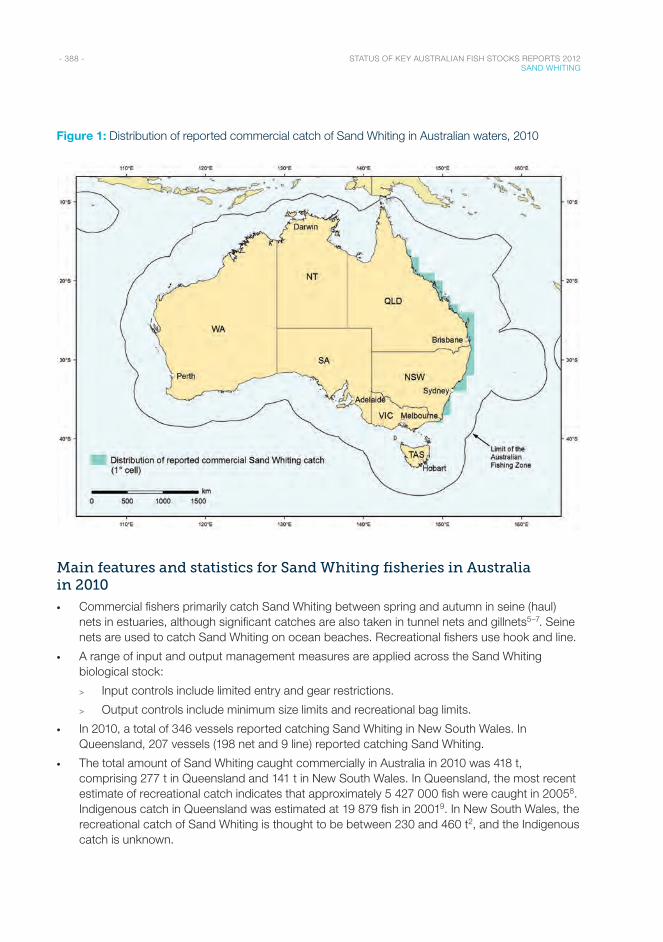
- 388 - STATUS OF KEY AUSTRALIAN FISH STOCKS REPORTS 2012 SAND WHITING
Figure 1: Distribution of reported commercial catch of Sand Whiting in Australian waters, 2010
Main features and statistics for Sand Whiting fisheries in Australia in 2010
• Commercial fishers primarily catch Sand Whiting between spring and autumn in seine (haul) nets in estuaries, although significant catches are also taken in tunnel nets and gillnets5–7. Seine nets are used to catch Sand Whiting on ocean beaches. Recreational fishers use hook and line.
• A range of input and output management measures are applied across the Sand Whiting biological stock:
> Input controls include limited entry and gear restrictions.
> Output controls include minimum size limits and recreational bag limits.
• In 2010, a total of 346 vessels reported catching Sand Whiting in New South Wales. In Queensland, 207 vessels (198 net and 9 line) reported catching Sand Whiting.
• The total amount of Sand Whiting caught commercially in Australia in 2010 was 418 t, comprising 277 t in Queensland and 141 t in New South Wales. In Queensland, the most recent estimate of recreational catch indicates that approximately 5 427 000 fish were caught in 20058. Indigenous catch in Queensland was estimated at 19 879 fish in 20019. In New South Wales, the recreational catch of Sand Whiting is thought to be between 230 and 460 t2, and the Indigenous catch is unknown.
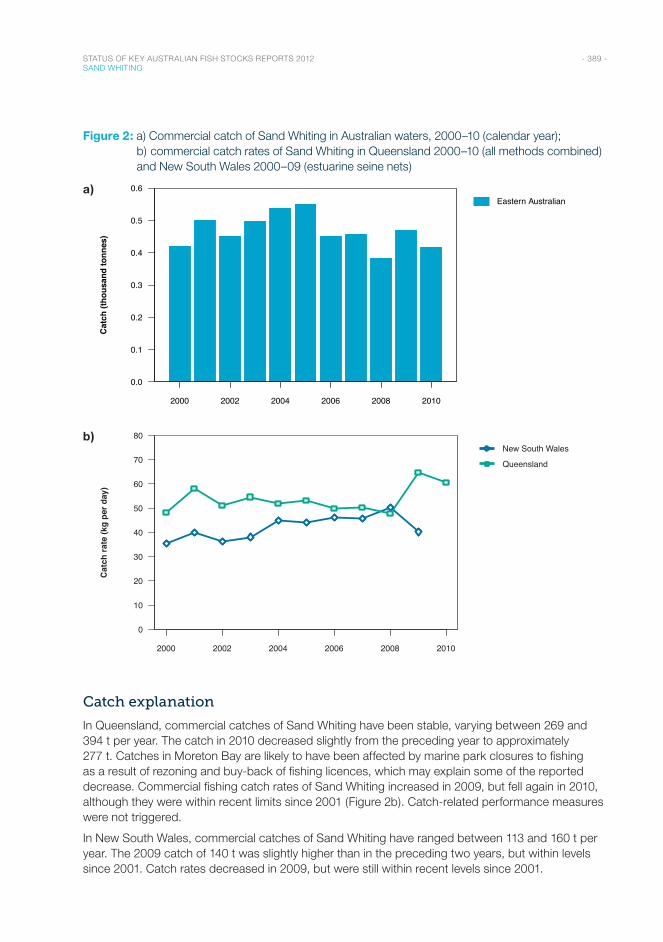
- 389 - STATUS OF KEY AUSTRALIAN FISH STOCKS REPORTS 2012 SAND WHITING
Figure 2: a) Commercial catch of Sand Whiting in Australian waters, 2000–10 (calendar year); b) commercial catch rates of Sand Whiting in Queensland 2000–10 (all methods combined) and New South Wales 2000–09 (estuarine seine nets)
a)
Year
2000 2002 2004 2006 2008 2010
0.0
0.1
0.2
0.3
0.4
0.5
0.6Eastern Australian
Cat
ch (t
hous
and
tonn
es)
b)
Year
2000 2002 2004 2006 2008 2010
0
10
20
30
40
50
60
70
80New South Wales
Queensland
Cat
ch ra
te (k
g pe
r day
)
Catch explanation
In Queensland, commercial catches of Sand Whiting have been stable, varying between 269 and 394 t per year. The catch in 2010 decreased slightly from the preceding year to approximately 277 t. Catches in Moreton Bay are likely to have been affected by marine park closures to fishing as a result of rezoning and buy-back of fishing licences, which may explain some of the reported decrease. Commercial fishing catch rates of Sand Whiting increased in 2009, but fell again in 2010, although they were within recent limits since 2001 (Figure 2b). Catch-related performance measures were not triggered.
In New South Wales, commercial catches of Sand Whiting have ranged between 113 and 160 t per year. The 2009 catch of 140 t was slightly higher than in the preceding two years, but within levels since 2001. Catch rates decreased in 2009, but were still within recent levels since 2001.
- 390 - STATUS OF KEY AUSTRALIAN FISH STOCKS REPORTS 2012 SAND WHITING
Effects of fishing on the marine environment
• Tunnel netting may interact with marine turtles, but interactions with turtles are considered to be very low risk because of attendance rules, the requirement for the tunnel to be set at least 30 m beyond the low water mark and in water more than 30 cm deep, and fishers’ codes of conduct; as a result, the tunnel is never dry. Marine turtles are released with minimal difficulty.
• Seining in estuaries can incur large bycatches of undersized organisms and unwanted species, but use of appropriately sized mesh can reduce unwanted mortalities6,10–12.
• Gillnets used in estuaries can incur substantial bycatches, including the capture of undersized individuals of key species5,7,13.
Environmental effects on Sand Whiting
• No significant environmental effects on Sand Whiting have been identified.
References1. Queensland Department of Employment, Economic Development and Innovation 2011, Stock status of Queensland’s
fisheries resources 2011, DEEDI, Brisbane.
2. Rowling, K, Hegarty, A & Ives, M (eds) 2010, Status of fisheries resources in NSW 2008/09, Industry & Investment NSW, Cronulla.
3. Gray, CA, Pease, BC, Stringfellow, SL, Raines, LP, Rankin, BK & Walford, TR 2000, Sampling estuarine fish species for stock assessment, final report to the Fisheries Research and Development Corporation, project 94/042, NSW Fisheries Final Report Series no. 18, NSW Fisheries Research Institute, Cronulla.
4. Stocks, J, Stewart, J, Gray, CA & West, RJ 2011, Using otolith increment widths to infer spatial, temporal and gender variation in the growth of sand whiting Sillago ciliata, Fisheries Management and Ecology, 18: 121–131.
5. Gray, CA 2002, Management implications of discarding in an estuarine multi-species gill net fishery, Fisheries Research, 56: 177–192.
6. Gray, CA & Kennelly, SJ 2003, Catch characteristics of the commercial beach-seine fisheries in two Australian barrier estuaries, Fisheries Research, 63: 405–422.
7. Gray, CA, Johnson, DD, Broadhurst, MK & Young, DJ 2005, Seasonal, spatial and gear-related influences on relationships between retained and discarded catches in a multi-species gillnet fishery, Fisheries Research: 75, 56–72.
8. McInnes, K 2008, Experimental results from the fourth Queensland recreational fishing diary program (2005), Queensland Department of Primary Industries and Fisheries, Brisbane.
9. Henry, GW & Lyle, JM 2003, National recreational and indigenous fishing survey, Fisheries Research Development Corporation project 99/158, Australian Government Department of Agriculture, Fisheries and Forestry, Canberra, http://eprints.utas.edu.au/2526/1/Henry_Lyle_Nationalsurvey.pdf.
10. Butcher, PA, Broadhurst, MK & Brand, CP 2006, Mortality of sand whiting (Sillago ciliata) released by recreational anglers in an Australian estuary, ICES Journal of Marine Science, 63: 567–571.
11. Gray, CA & Kennelly, SJ 2001, Development of discard-reducing gears and practices in the estuarine prawn and fish haul fisheries in NSW, final report to the Fisheries Research and Development Corporation, project 97/207, NSW Fisheries Final Report Series no. 37, Cronulla Fisheries Centre, Cronulla.
12. Gray, CA, Larson, RB & Kennelly, SJ 2000, Use of transparent netting to improve size selectivity and reduce bycatch in fish seine nets, Fisheries Research, 45: 155–166.
13. Kennelly, SJ & Gray, CA 2000, Reducing the mortality of discarded undersize sand whiting Sillago ciliata in an estuarine seine fishery, Marine and Freshwater Research, 51: 749–753.
14. Gray, CA, Johnson, DD, Young, DJ & Broadhurst, MK 2004, Discards from the commercial gillnet fishery for dusky flathead, Platycephalus fuscus, in New South Wales, Australia: spatial variability and initial effects of change in minimum legal length of target species, Fisheries Management and Ecology, 11: 323–333.
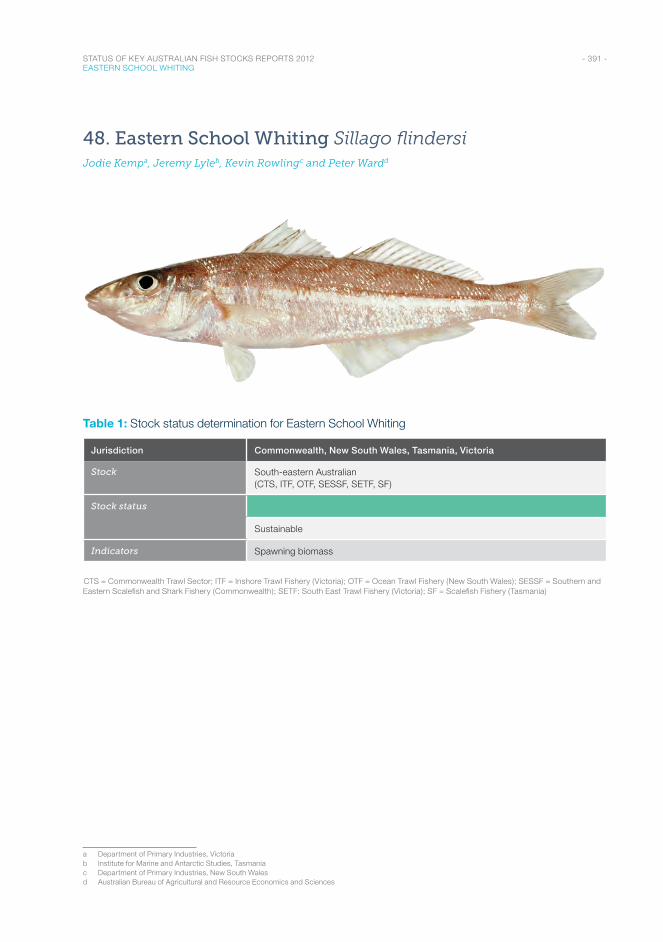
- 391 - STATUS OF KEY AUSTRALIAN FISH STOCKS REPORTS 2012 EASTERN SCHOOL WHITING
48. Eastern School Whiting Sillago flindersiJodie Kempa, Jeremy Lyleb, Kevin Rowlingc and Peter Wardd
Table 1: Stock status determination for Eastern School Whiting
Jurisdiction Commonwealth, New South Wales, Tasmania, Victoria
Stock South-eastern Australian (CTS, ITF, OTF, SESSF, SETF, SF)
Stock status
Sustainable
Indicators Spawning biomass
CTS = Commonwealth Trawl Sector; ITF = Inshore Trawl Fishery (Victoria); OTF = Ocean Trawl Fishery (New South Wales); SESSF = Southern and Eastern Scalefish and Shark Fishery (Commonwealth); SETF: South East Trawl Fishery (Victoria); SF = Scalefish Fishery (Tasmania)
a Department of Primary Industries, Victoriab Institute for Marine and Antarctic Studies, Tasmaniac Department of Primary Industries, New South Walesd Australian Bureau of Agricultural and Resource Economics and Sciences
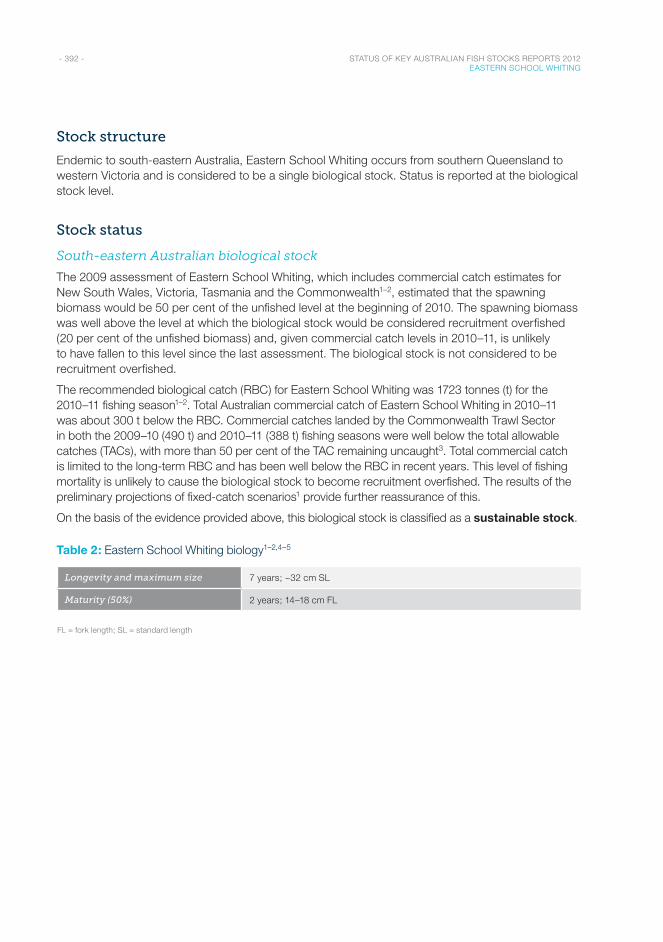
- 392 - STATUS OF KEY AUSTRALIAN FISH STOCKS REPORTS 2012 EASTERN SCHOOL WHITING
Stock structure
Endemic to south-eastern Australia, Eastern School Whiting occurs from southern Queensland to western Victoria and is considered to be a single biological stock. Status is reported at the biological stock level.
Stock status
South-eastern Australian biological stock
The 2009 assessment of Eastern School Whiting, which includes commercial catch estimates for New South Wales, Victoria, Tasmania and the Commonwealth1–2, estimated that the spawning biomass would be 50 per cent of the unfished level at the beginning of 2010. The spawning biomass was well above the level at which the biological stock would be considered recruitment overfished (20 per cent of the unfished biomass) and, given commercial catch levels in 2010–11, is unlikely to have fallen to this level since the last assessment. The biological stock is not considered to be recruitment overfished.
The recommended biological catch (RBC) for Eastern School Whiting was 1723 tonnes (t) for the 2010–11 fishing season1–2. Total Australian commercial catch of Eastern School Whiting in 2010–11 was about 300 t below the RBC. Commercial catches landed by the Commonwealth Trawl Sector in both the 2009–10 (490 t) and 2010–11 (388 t) fishing seasons were well below the total allowable catches (TACs), with more than 50 per cent of the TAC remaining uncaught3. Total commercial catch is limited to the long-term RBC and has been well below the RBC in recent years. This level of fishing mortality is unlikely to cause the biological stock to become recruitment overfished. The results of the preliminary projections of fixed-catch scenarios1 provide further reassurance of this.
On the basis of the evidence provided above, this biological stock is classified as a sustainable stock.
Table 2: Eastern School Whiting biology1–2,4–5
Longevity and maximum size 7 years; ~32 cm SL
Maturity (50%) 2 years; 14–18 cm FL
FL = fork length; SL = standard length
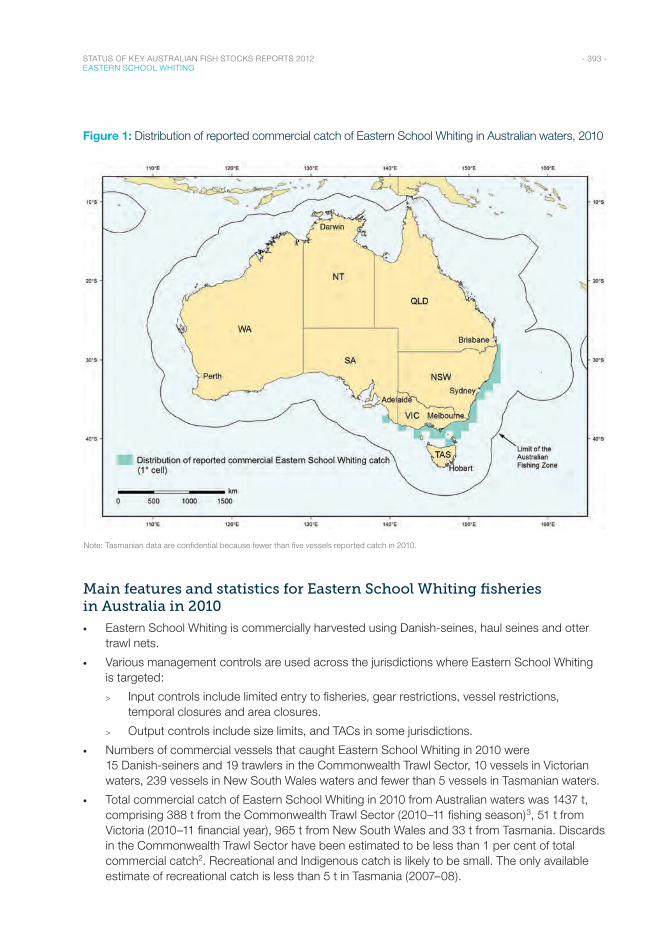
- 393 - STATUS OF KEY AUSTRALIAN FISH STOCKS REPORTS 2012 EASTERN SCHOOL WHITING
Figure 1: Distribution of reported commercial catch of Eastern School Whiting in Australian waters, 2010
Note: Tasmanian data are confidential because fewer than five vessels reported catch in 2010.
Main features and statistics for Eastern School Whiting fisheries in Australia in 2010
• Eastern School Whiting is commercially harvested using Danish-seines, haul seines and otter trawl nets.
• Various management controls are used across the jurisdictions where Eastern School Whiting is targeted:
> Input controls include limited entry to fisheries, gear restrictions, vessel restrictions, temporal closures and area closures.
> Output controls include size limits, and TACs in some jurisdictions.
• Numbers of commercial vessels that caught Eastern School Whiting in 2010 were 15 Danish-seiners and 19 trawlers in the Commonwealth Trawl Sector, 10 vessels in Victorian waters, 239 vessels in New South Wales waters and fewer than 5 vessels in Tasmanian waters.
• Total commercial catch of Eastern School Whiting in 2010 from Australian waters was 1437 t, comprising 388 t from the Commonwealth Trawl Sector (2010–11 fishing season)3, 51 t from Victoria (2010–11 financial year), 965 t from New South Wales and 33 t from Tasmania. Discards in the Commonwealth Trawl Sector have been estimated to be less than 1 per cent of total commercial catch2. Recreational and Indigenous catch is likely to be small. The only available estimate of recreational catch is less than 5 t in Tasmania (2007–08).
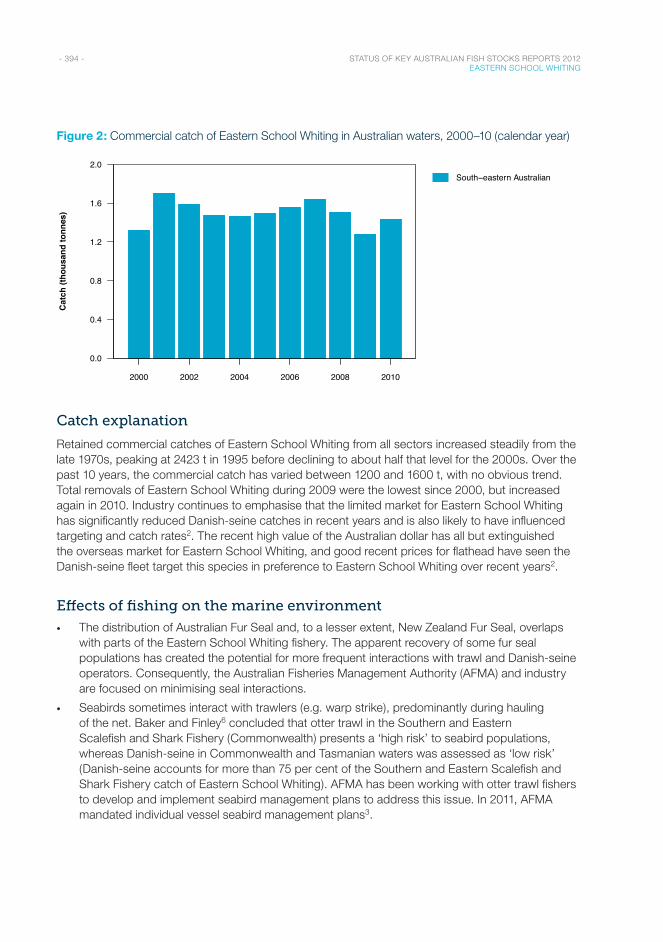
- 394 - STATUS OF KEY AUSTRALIAN FISH STOCKS REPORTS 2012 EASTERN SCHOOL WHITING
Figure 2: Commercial catch of Eastern School Whiting in Australian waters, 2000–10 (calendar year)
Year
2000 2002 2004 2006 2008 2010
0.0
0.4
0.8
1.2
1.6
2.0South−eastern Australian
Cat
ch (t
hous
and
tonn
es)
Catch explanation
Retained commercial catches of Eastern School Whiting from all sectors increased steadily from the late 1970s, peaking at 2423 t in 1995 before declining to about half that level for the 2000s. Over the past 10 years, the commercial catch has varied between 1200 and 1600 t, with no obvious trend. Total removals of Eastern School Whiting during 2009 were the lowest since 2000, but increased again in 2010. Industry continues to emphasise that the limited market for Eastern School Whiting has significantly reduced Danish-seine catches in recent years and is also likely to have influenced targeting and catch rates2. The recent high value of the Australian dollar has all but extinguished the overseas market for Eastern School Whiting, and good recent prices for flathead have seen the Danish-seine fleet target this species in preference to Eastern School Whiting over recent years2.
Effects of fishing on the marine environment
• The distribution of Australian Fur Seal and, to a lesser extent, New Zealand Fur Seal, overlaps with parts of the Eastern School Whiting fishery. The apparent recovery of some fur seal populations has created the potential for more frequent interactions with trawl and Danish-seine operators. Consequently, the Australian Fisheries Management Authority (AFMA) and industry are focused on minimising seal interactions.
• Seabirds sometimes interact with trawlers (e.g. warp strike), predominantly during hauling of the net. Baker and Finley6 concluded that otter trawl in the Southern and Eastern Scalefish and Shark Fishery (Commonwealth) presents a ‘high risk’ to seabird populations, whereas Danish-seine in Commonwealth and Tasmanian waters was assessed as ‘low risk’ (Danish-seine accounts for more than 75 per cent of the Southern and Eastern Scalefish and Shark Fishery catch of Eastern School Whiting). AFMA has been working with otter trawl fishers to develop and implement seabird management plans to address this issue. In 2011, AFMA mandated individual vessel seabird management plans3.
- 395 - STATUS OF KEY AUSTRALIAN FISH STOCKS REPORTS 2012 EASTERN SCHOOL WHITING
• Danish-seining has the potential to affect seahorses and pipefish (syngnathids) because Danish-seiners operate in relatively shallow waters and use nets with a small mesh size. An AFMA–CSIRO (Commonwealth Scientific and Industrial Research Organisation) Ecological Risk Assessment (ERA) indicated that the Spiny Pipehorse was at low risk because the fishery overlaps with only a small portion of the range of this species7.
• In 2008, demersal trawling in the area of the Southern and Eastern Scalefish and Shark Fishery (Commonwealth) was nominated as a key threatening process under the Environment Protection and Biodiversity Conservation Act 1999 because of potential damage to marine benthos. However, the ERA for the fishery7 identified no high-risk habitats on the inner shelf (<100 m) where Eastern School Whiting is caught.
Environmental effects on Eastern School Whiting
• Since Eastern School Whiting is a relatively short-lived species that is caught by the fishery at more than 2 years of age, recruitment is expected to be strongly influenced by environmental conditions, ocean productivity and ecological effects.
References1. Day, J 2010, School whiting (Sillago flindersi): exploration of fixed projected catches and a retrospective look at variability
in recruitment estimates, in GN Tuck (ed.), Stock assessment for the Southern and Eastern Scalefish and Shark Fishery 2010, part 2, Australian Fisheries Management Authority & CSIRO Marine and Atmospheric Research, Hobart, 194–237.
2. Shelf Resource Assessment Group 2011, 2010 Stock assessment summaries for species assessed by ShelfRAG, Australian Fisheries Management Authority, Canberra.
3. Woodhams, J, Stobutzki, I, Vieira, S, Curtotti, R & Begg, GA (eds) 2011, Fishery status reports 2010: status of fish stocks and fisheries managed by the Australian Government, Australian Bureau of Agricultural and Resource Economics and Sciences, Canberra.
4. Dixon, PI, Crozier, RH, Black, M & Church, A 1987, Stock identification and discrimination of commercially important whitings in Australian waters using genetic criteria, final report, Fishing Industry Research Trust Account project 87/117, Centre for Marine Science, University of New South Wales, Sydney.
5. Kailola, PJ, Williams, MJ, Stuart, PC, Reichelt, RE, McNee, A & Grieve, C 1993, Australian fisheries resources, Bureau of Resource Sciences & Fisheries Research and Development Corporation, Canberra.
6. Baker, GB & Finley, LA (in press), National assessment of seabird interactions in trawl, gillnet and purse seine fisheries, FRDC project 2011/058, Fisheries Research and Development Corporation, Canberra.
7. Wayte, S, Dowdney, J, Williams, A, Fuller, M, Bulman, C, Sporcic, M & Smith, A 2007, Ecological risk assessment for the effects of fishing: report for the Western Deepwater Trawl Fishery, report for the Australian Fisheries Management Authority, Canberra.
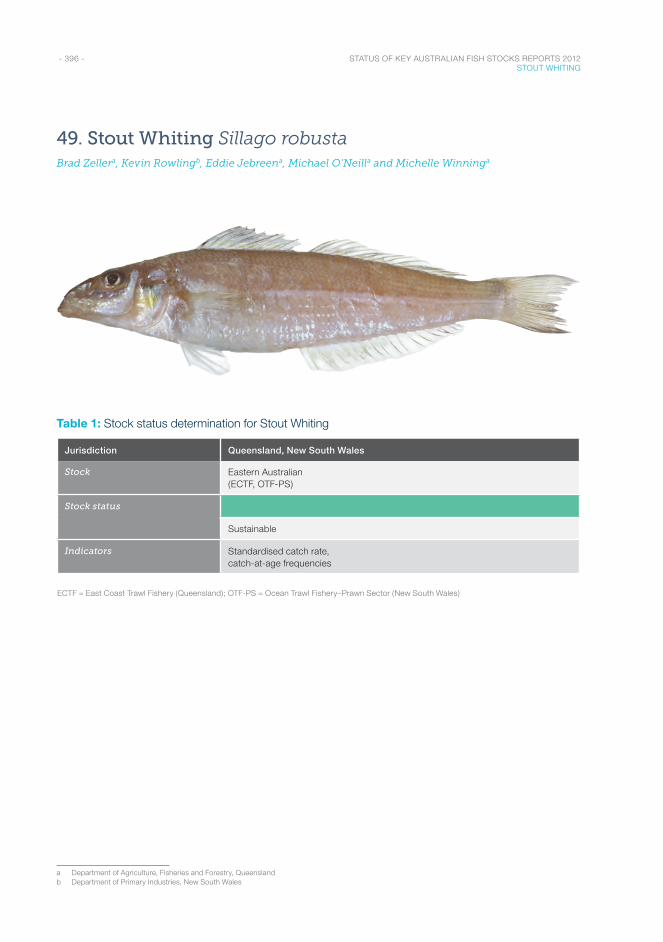
- 396 - STATUS OF KEY AUSTRALIAN FISH STOCKS REPORTS 2012 STOUT WHITING
49. Stout Whiting Sillago robustaBrad Zellera, Kevin Rowlingb, Eddie Jebreena, Michael O’Neilla and Michelle Winninga
Table 1: Stock status determination for Stout Whiting
Jurisdiction Queensland, New South Wales
Stock Eastern Australian (ECTF, OTF -PS)
Stock status
Sustainable
Indicators Standardised catch rate, catch-at-age frequencies
ECTF = East Coast Trawl Fishery (Queensland); OTF-PS = Ocean Trawl Fishery–Prawn Sector (New South Wales)
a Department of Agriculture, Fisheries and Forestry, Queenslandb Department of Primary Industries, New South Wales
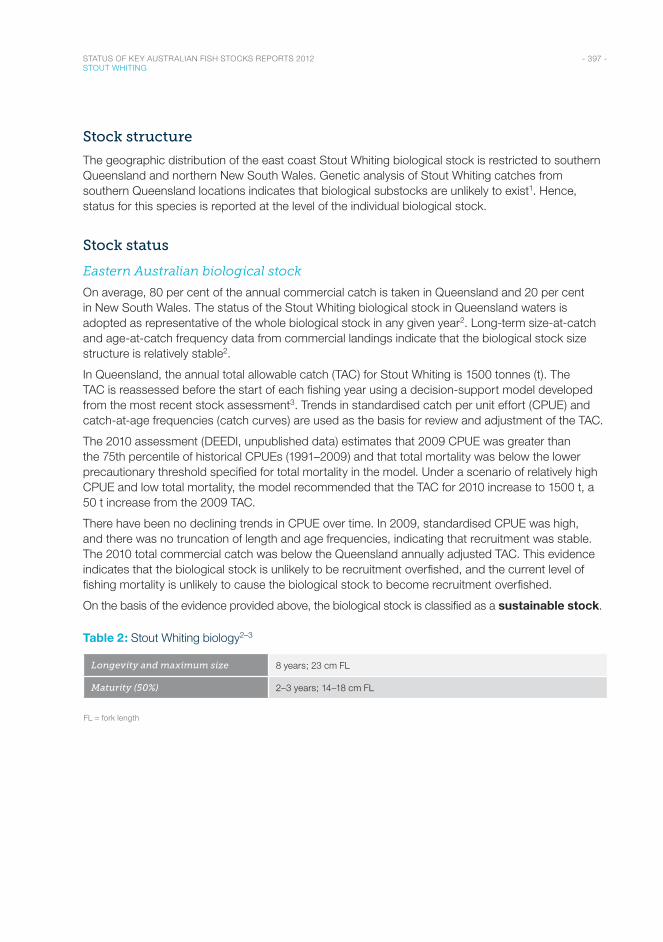
- 397 - STATUS OF KEY AUSTRALIAN FISH STOCKS REPORTS 2012 STOUT WHITING
Stock structure
The geographic distribution of the east coast Stout Whiting biological stock is restricted to southern Queensland and northern New South Wales. Genetic analysis of Stout Whiting catches from southern Queensland locations indicates that biological substocks are unlikely to exist1. Hence, status for this species is reported at the level of the individual biological stock.
Stock status
Eastern Australian biological stock
On average, 80 per cent of the annual commercial catch is taken in Queensland and 20 per cent in New South Wales. The status of the Stout Whiting biological stock in Queensland waters is adopted as representative of the whole biological stock in any given year2. Long-term size-at-catch and age-at-catch frequency data from commercial landings indicate that the biological stock size structure is relatively stable2.
In Queensland, the annual total allowable catch (TAC) for Stout Whiting is 1500 tonnes (t). The TAC is reassessed before the start of each fishing year using a decision-support model developed from the most recent stock assessment3. Trends in standardised catch per unit effort (CPUE) and catch-at-age frequencies (catch curves) are used as the basis for review and adjustment of the TAC.
The 2010 assessment (DEEDI, unpublished data) estimates that 2009 CPUE was greater than the 75th percentile of historical CPUEs (1991–2009) and that total mortality was below the lower precautionary threshold specified for total mortality in the model. Under a scenario of relatively high CPUE and low total mortality, the model recommended that the TAC for 2010 increase to 1500 t, a 50 t increase from the 2009 TAC.
There have been no declining trends in CPUE over time. In 2009, standardised CPUE was high, and there was no truncation of length and age frequencies, indicating that recruitment was stable. The 2010 total commercial catch was below the Queensland annually adjusted TAC. This evidence indicates that the biological stock is unlikely to be recruitment overfished, and the current level of fishing mortality is unlikely to cause the biological stock to become recruitment overfished.
On the basis of the evidence provided above, the biological stock is classified as a sustainable stock.
Table 2: Stout Whiting biology2–3
Longevity and maximum size 8 years; 23 cm FL
Maturity (50%) 2–3 years; 14–18 cm FL
FL = fork length
- 398 - STATUS OF KEY AUSTRALIAN FISH STOCKS REPORTS 2012 STOUT WHITING
Figure 1: Distribution of reported commercial catch of Stout Whiting in Australian waters, 2010
Main features and statistics for Stout Whiting fisheries in Australia in 2010
• Stout Whiting is primarily fished using prawn otter trawl and Danish-seine.
• A range of input and output management controls are in place for Stout Whiting:
> Input controls in New South Wales include spatial and temporal closures, and gear restrictions. In Queensland, catch of Stout Whiting is limited to five commercial licences.
> Output controls in New South Wales include a recreational bag limit of 20 whiting (all species). In Queensland, a TAC and individual transferable quotas limit commercial catch of Stout Whiting.
• In Queensland, 3 commercial fishing vessels caught Stout Whiting in 2010. In New South Wales, 55 commercial vessels reported catch of Stout Whiting in 2010.
• The total amount of Stout Whiting caught commercially in Australia in 2010 was 1336 t, comprising 1170 t in Queensland and 166 t in New South Wales. Recreational and Indigenous landings of the east coast Stout Whiting biological stock are negligible.
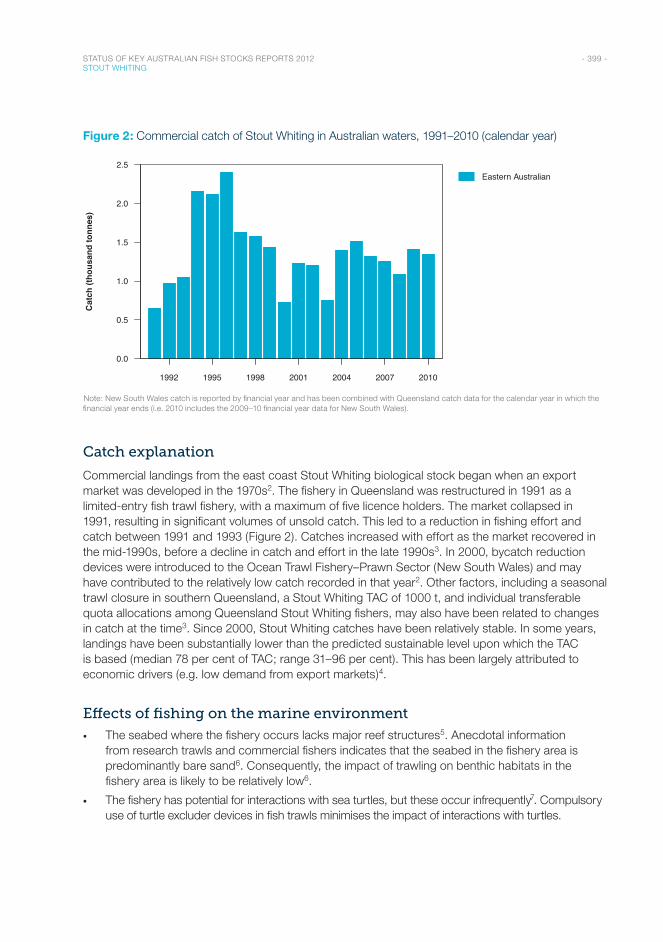
- 399 - STATUS OF KEY AUSTRALIAN FISH STOCKS REPORTS 2012 STOUT WHITING
Figure 2: Commercial catch of Stout Whiting in Australian waters, 1991–2010 (calendar year)
Year
1992 1995 1998 2001 2004 2007 2010
0.0
0.5
1.0
1.5
2.0
2.5Eastern Australian
Cat
ch (t
hous
and
tonn
es)
Note: New South Wales catch is reported by financial year and has been combined with Queensland catch data for the calendar year in which the financial year ends (i.e. 2010 includes the 2009–10 financial year data for New South Wales).
Catch explanation
Commercial landings from the east coast Stout Whiting biological stock began when an export market was developed in the 1970s2. The fishery in Queensland was restructured in 1991 as a limited-entry fish trawl fishery, with a maximum of five licence holders. The market collapsed in 1991, resulting in significant volumes of unsold catch. This led to a reduction in fishing effort and catch between 1991 and 1993 (Figure 2). Catches increased with effort as the market recovered in the mid-1990s, before a decline in catch and effort in the late 1990s3. In 2000, bycatch reduction devices were introduced to the Ocean Trawl Fishery–Prawn Sector (New South Wales) and may have contributed to the relatively low catch recorded in that year2. Other factors, including a seasonal trawl closure in southern Queensland, a Stout Whiting TAC of 1000 t, and individual transferable quota allocations among Queensland Stout Whiting fishers, may also have been related to changes in catch at the time3. Since 2000, Stout Whiting catches have been relatively stable. In some years, landings have been substantially lower than the predicted sustainable level upon which the TAC is based (median 78 per cent of TAC; range 31–96 per cent). This has been largely attributed to economic drivers (e.g. low demand from export markets)4.
Effects of fishing on the marine environment
• The seabed where the fishery occurs lacks major reef structures5. Anecdotal information from research trawls and commercial fishers indicates that the seabed in the fishery area is predominantly bare sand6. Consequently, the impact of trawling on benthic habitats in the fishery area is likely to be relatively low6.
• The fishery has potential for interactions with sea turtles, but these occur infrequently7. Compulsory use of turtle excluder devices in fish trawls minimises the impact of interactions with turtles.
- 400 - STATUS OF KEY AUSTRALIAN FISH STOCKS REPORTS 2012 STOUT WHITING
• Although Danish-seine is legislated as an acceptable method for targeting Stout Whiting in Queensland and New South Wales, it is only used in Queensland. Compared with trawling, Danish-seining harvests Stout Whiting more efficiently, has less physical contact with the seabed, and more effectively reduces some forms of bycatch, including prawns, bugs, squid, sea snakes and pipefish7.
• Sustainability of Stout Whiting taken as bycatch in the East Coast Otter Trawl Fishery (Queensland) has been assessed. At predicted future levels of effort, there is no more than an intermediate risk that discarding will result in an unacceptable decline in Stout Whiting biological stock abundance (Queensland DAFF, unpublished report).
Environmental effects on Stout Whiting
• Since Stout Whiting is a shallow-water oceanic species, it is unlikely that land-based events would significantly affect the biological stock. Marine environmental pressures that may affect the biological stock have not been identified.
References1. Ovenden, J & Butcher, A 1999, An investigation of migration and possible stock structuring by stout whiting, Sillago
robusta, in southern Queensland waters, and its impact on managing the fishery, final report on the pilot program, Southern Fisheries Centre, Queensland Department of Primary Industries, Brisbane.
2. Rowling, K, Hegarty, A & Ives, M (eds) 2010, Stout whiting, in Status of fisheries resources in NSW 2008/09, Industry & Investment NSW, Cronulla, 323–325.
3. O’Neill, M, Yeomans, K, Breddin, I, Jebreen, E & Butcher, A 2002, The Queensland stout whiting fishery 1991 to 2002, Fisheries Assessment Report, Queensland Department of Primary Industries, Brisbane.
4. Queensland Department of Employment, Economic Development and Innovation 2011, Annual status report 2010: finfish (stout whiting) trawl fishery, DEEDI, Brisbane.
5. Interim Marine and Coastal Regionalisation for Australia Technical Group 1998, Interim marine and coastal regionalisation for Australia: an ecosystem-based classification for marine and coastal environments, version 3.3, Environment Australia, Commonwealth Department of the Environment, Canberra.
6. Robins, J & Courtney, AJ 1998, Status report on bycatch within the Queensland Trawl Fishery, in Establishing meaningful targets for bycatch reduction in Australian fisheries, Proceedings of the Australian Society for Fish Biology Workshop, Tasmanian Aquaculture and Fisheries Institute, Hobart, 24–45.
7. Rowsell, N & Davies, J 2011, At-sea observation of the stout whiting fishery 2009–2010, Fisheries Queensland, Department of Employment Economic Development and Innovation, Brisbane.

- 401 - STATUS OF KEY AUSTRALIAN FISH STOCKS REPORTS 2012 STOUT WHITING

Glossary
STATUS OF KEY AUSTRALIAN FISH STOCKS REPORTS 2012 - 404 -
A
Abalone viral ganglioneuritis (AVG). A highly virulent herpes-like virus, which affects the nervous tissue of abalone and rapidly causes death. Can be spread through direct contact, through the water column without contact, and in mucus that infected abalone produce before dying.
Acceptable biological catch. See Recommended biological catch.
Age–length (age–length key or curve). Relationship between age and length, i.e. growth.
Age–length frequency. Numbers of fish in each age class from a sample of fish captured during a fishing season. Sometimes sampled separately for retained and discarded catch. An important data input for age-structured fisheries stock assessments.
Age-structured assessment. Assessment of the status of a fish stock, incorporating a range of data sources, including length- and age-frequency data, to estimate the number of fish of each age each year.
Aggregation. Group of fish that come together, often to feed or spawn.
Aquaculture. Commercial growing of marine or freshwater animals and aquatic plants. Often called ‘fish farming’.
Area closure. Closure of a given area/fishing ground, often for a defined period. Used as a tool in the management of a fishery.
Artisanal fishing. Fishing for subsistence using traditional methods.
Australian Fishing Zone (AFZ). The area extending seaward of coastal waters (i.e. from 3 nautical miles from the territorial sea baseline) to the outer limits of the Exclusive Economic Zone (EEZ). In the case of external territories, such as Christmas Island, the AFZ extends from the territorial sea baseline to the outer limit of the EEZ. The AFZ is defined in the Fisheries Management Act 1991, which also specifies a number of ‘excepted waters’, notably in Antarctica and the Torres Strait, that are excluded from the AFZ.
B
B. See Biomass.
B0 (mean equilibrium unfished biomass). Average biomass level if fishing had not occurred.
Bag limit. The number of fish that one person can legally take and keep in a day’s fishing. Most often applied to recreational fisheries.
Benthic. Associated with the bottom of a water body.
Berried females. Female crustacean carrying eggs.
Biodiversity. Biological diversity; variety among living organisms, including genetic diversity, diversity within and between species, and diversity within ecosystems.
Bioeconomic model. Method of fisheries stock assessment that models the interaction between the biology of harvested species and the human behaviour of fishers as shaped by economic factors.
Biological reference point. Biomass or fishing mortality level used as a standard for comparison. Can be either a ‘target reference point’ or a minimum biologically acceptable limit (‘limit reference point’).
Biological stock. Functionally discrete population that is largely distinct from other populations of the same species and can be regarded as a separate entity for management or assessment purposes.
STATUS OF KEY AUSTRALIAN FISH STOCKS REPORTS 2012 - 405 -
Biomass. Total weight of a stock or a component of a stock.
Biomass limit reference point (BLIM). Stock biomass below which the risk to the stock is regarded as unacceptably high. Usually expressed as a fraction of the average adult biomass prior to the commencement of fishing.
Biomass at maximum economic yield (BMEY). Average biomass corresponding to maximum economic yield.
Biomass at maximum sustainable yield (BMSY). Average biomass corresponding to maximum sustainable yield.
Biomass proxy. A relative biomass level used in place of a quantitatively estimated biological reference point when this is not available. For example, the biomass that sustains maximum economic yield (BMEY).
Bioregion. ‘A region defined by common oceanographic characteristics in its marine environment, and by climate/rainfall characteristics in its inland river systems’a.
Boat nights. A measure of fishing effort. Refers to the number of ‘nights’ that a fishing licence holder is permitted to fish. Generally used in prawn trawl fisheries.
Boom-and-bust cycle. Repeated and regular increases and decreases in the size of a population.
Bycatch. A species that is (a) incidentally taken in a fishery and returned to the sea, or (b) incidentally affected by interacting with fishing equipment in the fishery, but not taken.
Bycatch reduction device (BRD). A device that allows fish and other animals to escape immediately after being taken in or with fishing gear.
Byproduct. A species taken incidentally in a fishery during fishing for another species. The species is retained for sale because it has some commercial value.
C
Carapace. The exoskeleton covering the upper surface of the body of a crustacean.
Carapace length (CL). In prawns, the distance from the posterior margin of the orbit to the mid-caudodorsal margin of the carapace; in lobster, the distance from the tip of the rostrum to the mid-caudodorsal margin of the carapace.
Catch per unit effort (CPUE). The number or weight of fish caught by a unit of fishing effort. Often used as a measure of fish abundance.
Catch prediction. Forecasts undertaken in Western Australian prawn fisheries, based on surveys of recruitment and spawning stocksa.
Catch rate. See Catch per unit effort.
Clade. An ancestor (organism, population or species) and all of its descendants.
Coastal waters. The waters extending seaward from the territorial sea baseline to a distance of 3 nautical miles. The states and the Northern Territory have jurisdiction over the coastal waters adjacent to them.
Codend. The closed end of a trawl net.
a Fletcher, WJ & Santoro, K (eds) 2011, State of the fisheries and aquatic resources report 2010/11, Western Australian Department of Fisheries, Perth.
STATUS OF KEY AUSTRALIAN FISH STOCKS REPORTS 2012 - 406 -
Cohort. Individuals of a stock born in the same spawning season.
Conservation dependent species. The Environment Protection and Biodiversity Conservation Act 1999 dictates that a native species is eligible to be included in the conservation dependent category at a particular time if, at that time, (a) the species is the focus of a specific conservation program the cessation of which would result in the species becoming vulnerable, endangered or critically endangered; or (b) the following subparagraphs are satisfied: (i) the species is a species of fish; (ii) the species is the focus of a plan of management that provides for management actions necessary to stop the decline of, and support the recovery of, the species so that its chances of long-term survival in nature are maximised; (iii) the plan of management is in force under a law of the Commonwealth or of a state or territory; and (iv) cessation of the plan of management would adversely affect the conservation status of the species.
Continental shelf. The continental shelf has been defined in a number of ways. It can mean the area of relatively shallow water that fringes a continent from the shoreline to the top of the continental slope. The top of the continental slope is often defined by the 200 m isobath. Continental shelf is also a defined maritime zone and comprises the continental shelf where it extends beyond the limit of the Exclusive Economic Zone to the limit of the continental margin. This area is also sometimes referred to as ‘extended continental shelf’, and its limit is determined by the United Nations Commission on the Limits of the Continental Shelf.
Continental slope. Region of the outer edge of a continent between the relatively shallow continental shelf and the abyssal depths; often characterised by a relatively steep slope.
Coral bleaching. The loss of colour from corals under stressful environmental conditions. Bleached corals have the ability to recover as conditions return to normal; however, if the conditions remain unfavourable for an extended time, they will die.
Cryptic mortality. Substantial mortality of a fish stock, occurring in part of the fishery, that cannot be detected in fishery data.
D
Daily egg production method (DEPM). A method of estimating the spawning biomass of a fish population from the abundance and distribution of eggs and/or larvae.
Decision rules. Agreed responses that management must make under predefined circumstances regarding stock status. Also called ‘control rules’ or ‘harvest control rules’.
Demersal. Found on or near the benthic habitat (c.f. Pelagic).
Depletion (stock depletion). Reduction in the biomass of a fish stock.
Depletion estimation methods. Stock assessment methods that estimate biomass at the beginning of a period of exploitation, based on the rate of the decline of catch rates with the cumulative removal of individuals or with cumulative effort.
Developmental fishery. A fishery managed under developmental fishery permits. Developmental fishing involves fishing in an area of Australian jurisdiction as specified in the permit; activities include (a) assessing the commercial viability of a fishery, and (b) assessing the commercial viability of kinds of fishing activities, vessels or equipment specified in the permit.
Discarding. Any part of the catch that is returned to the sea, whether dead or alive.
Domestic fishery. Fishery within the Australian Fishing Zone operated by Australian-flagged vessels.
STATUS OF KEY AUSTRALIAN FISH STOCKS REPORTS 2012 - 407 -
E
East Australian Current. A large-scale ocean current that runs south along the east coast of Australia, taking warm tropical waters from the Coral Sea southwards into the temperate waters of the Tasman Sea.
Ecological risk assessment. A process of estimating the effects of human actions on a natural resource.
Ecologically sustainable. ‘Use of natural resources within their capacity to sustain natural processes while maintaining the life-support systems of nature and ensuring that the benefit of the use to the present generation does not diminish the potential to meet the needs and aspirations of future generations’a.
Ecologically viable stock. ‘Ecological viable stock has a general rather than a specific meaning. It refers to the maintenance of the exploited population at high levels of abundance, designed to maintain productivity, provide margins of safety for error and uncertainty, and maintain yields over the long term, in a way that conserves the stocks’ role and function in the ecosystem’a.
Ecosystem. A complex of plant, animal and microorganism communities that, together with the non-living components, interact to maintain a functional unit.
Effort. A measure of the resources used to harvest a fishery’s stocks. The measure of effort appropriate for a fishery depends on the methods used and the management arrangements. Common measures include the number of vessels, the number of hooks set and the number of fishing days or nights.
Effort restriction. Restriction of the permitted amount of fishing effort (e.g. total number of hooks) in a particular fishery; used as a management tool.
Egg survey. Systematic gathering of information on the occurrence and abundance of fish eggs and larvae by collecting them in nets and traps.
El Niño. The extensive warming of the central and eastern Pacific Ocean that leads to a major shift in weather patterns across the Pacific region. In Australia (particularly eastern Australia), El Niño events are associated with an increased probability of drier conditions.
Endangered species. Species in danger of extinction because of its low numbers or degraded habitat, or likely to become so unless the factors affecting its status improve. The Environment Protection and Biodiversity Conservation Act 1999 dictates that a native species is eligible to be included in the endangered category at a particular time if, at that time, (a) it is not critically endangered, and (b) it is facing a very high risk of extinction in the wild in the near future, as determined in accordance with the prescribed criteria.
Endemic species. Species that occurs naturally and exclusively in a given place.
Environment Protection and Biodiversity Conservation Act 1999 (EPBC Act). Australia’s national environment law. The legislation focuses on protecting matters of national importance, such as World Heritage sites, national heritage places, wetlands of international importance (Ramsar wetlands), nationally threatened species and ecological communities, migratory species, Commonwealth marine areas and nuclear actions.
Escapement. The number, expressed as a percentage, of fish that survive through a particular event (e.g. predation, natural mortality, fishing mortality), often to spawn.
a Australian Government Department of the Environment and Water Resources 2007, Guidelines for the ecologically sustainable management of fisheries, 2nd edn, DEWR, Canberra.
STATUS OF KEY AUSTRALIAN FISH STOCKS REPORTS 2012 - 408 -
Eutrophication. The natural or human-induced process by which a body of water becomes enriched in dissolved mineral nutrients (particularly phosphorus and nitrogen) that stimulate the growth of aquatic plants and increase organic production of the water body. Excessive enrichment may result in the depletion of dissolved oxygen and eventually lead to death of many organisms that live in the water.
Exclusive Economic Zone (EEZ). The area that extends from the limit of the territorial sea, which is 12 nautical miles offshore from the territorial sea baseline, to a maximum of 200 nautical miles, measured from the territorial sea baseline. The EEZ is less than 200 nautical miles in extent where it coincides with the EEZ of another country. In this case, the boundaries between the two countries are defined by treaty. Australia has sovereign rights and responsibilities over the water column and the seabed in its EEZ, including the exploration and exploitation of natural resources.
Exploitation rate. The fraction of total animal deaths caused by fishing, usually expressed as an annual value. Can also be defined as the proportion of a population caught during a year.
F
FLIM (fishing mortality limit reference point). The point above which the removal rate from the stock is too high.
FMSY (fishing mortality maximum sustainable yield). The fishing mortality rate that achieves the maximum sustainable yield.
Fecundity. Number of eggs an animal produces each reproductive cycle; the potential reproductive capacity of an organism or population.
Fish-aggregating device (FAD). Buoys or platforms used to attract and ‘hold’ pelagic fishes to enhance fishing. Can be as simple as a floating log or bamboo raft, but tuna fishers setting purse-seine nets around tuna schools now deploy sophisticated FADs that allow satellite tracking and interrogation of information, such as sea surface temperature.
Fishery-dependent data (survey). Data collected directly on a fish or fishery from commercial fishers, processors and retailers. Common methods include logbooks, fishery observers and port sampling (c.f. Fishery-independent data [survey]). More difficult to interpret than fishery-independent data because the fishery-dependent data are influenced by fishers’ attempts to maximise economic returns.
Fishery-independent data (survey). Data collected by systematic survey, carried out by research vessels or contracted commercial fishing vessels, to gather information independently of normal commercial fishing operations.
Fishing down (fish-down). Fishing mortality above FMSY for a stock that is above a biomass target, with the intention of reducing the biomass to the target.
Fishing effort. Amount of fishing taking place, usually described in terms of gear type and the frequency or period of operations (e.g. hooks, trawl hours, net length).
Fishing mortality (F). The instantaneous rate of fish deaths due to fishing a designated component of the fish stock. F reference points may be applied to entire stocks or segments of the stocks and should match the scale of management unit. Instantaneous fishing mortality rates of 0.1, 0.2 and 0.5 are equivalent to 10%, 18% and 39% of deaths of a stock due to fishing. See also Mortality, Natural mortality (M).
STATUS OF KEY AUSTRALIAN FISH STOCKS REPORTS 2012 - 409 -
Fishing power. Effectiveness of a vessel’s fishing effort relative to that of other vessels or in other periods of time. Also used to describe the average fishing mortality per unit of effort of a fishing fleet—this often tends to increase with time as a result of improvements in technology and fisher knowledge.
Fishing season. The period during which a fishery can be accessed by fishers. Sometimes referred to as a fishing year.
Fishing year. See Fishing season.
Fork length (FL). Length of a fish measured as the distance between the tip of the snout and the point of the fork or ‘V’ of the tail. Commonly used to record the length of commercial fish because it is little affected by damage to the tail fin (c.f. Total length). Fork length is measured flat, from point to point, not by stretching a tape along the body surface, which would result in a longer measurement for full-bodied fish like tuna. See also Lower-jaw fork length.
Fully fished. Generally describes a fish stock for which current catches and fishing pressure are close to optimal. In the Status of fisheries resources in NSW 2008/09a, this term has the following specific meaning: ‘Fishing mortality is approximately the same as natural mortality; estimates of biomass are greater than 30% of the estimated unfished biomass; catch rates have been steady for 5–10 years and/or catch rates are greater than 30% of initial catch rates; length and age distributions are stable; species are fished throughout their entire geographic range’.
G
Gear restriction. Restriction on the amount and/or type of fishing gear that can be used by fishers in a particular fishery; used as a management tool.
Generalist feeders. Species that feed on a variety of food types and are not restricted to a particular food source.
Generation time. Average time taken for an individual animal to replace itself in a population.
Ghost fishing. Capture of fish in gear—usually nets or traps—that has been lost.
Gross value of production (GVP). A value obtained by multiplying the volume of catch (whole weight equivalent) by the average per unit beach price. In the case of a multispecies fishery, the fishery’s GVP is the sum of the GVP of each species.
Growth overfished. In the Status of fisheries resources in NSW 2008/09a, this term has the following specific meaning: ‘Yield per recruit would increase if length at first capture was increased or fishing mortality decreased’.
Growth overfishing. Occurs when fish are harvested at an average size that is smaller than the size that would produce the maximum yield per recruit. When a fish stock is growth overfished, increases in fishing effort and fishing mortality produce decreasing yields, even though more individuals are harvested, because of the reduced average size of harvested individuals.
a Rowling, K, Hegarty, A & Ives, M (eds) 2010, Status of fisheries resources in NSW 2008/09, Industry & Investment NSW, Cronulla.
STATUS OF KEY AUSTRALIAN FISH STOCKS REPORTS 2012 - 410 -
H
Harvest control rules. See Decision rules.
Harvest strategy. Strategy outlining how the catch in a fishery will be adjusted from year to year depending on the size of the stock, the economic or social conditions of the fishery, conditions of other interdependent stocks or species, and uncertainty of biological knowledge. Well-managed fisheries have an unambiguous (explicit and quantitative) harvest strategy that is robust to the unpredictable biological fluctuations to which the stock may be subject.
High seas. Waters outside national jurisdictions (i.e. outside Exclusive Economic Zones).
Hyperstability. A relationship between catch per unit effort (CPUE) and abundance in which, initially, CPUE declines more slowly than true abundance.
Hypoxia. A phenomenon that occurs in aquatic environments as dissolved oxygen becomes reduced in concentration to a point at which its level becomes detrimental to aquatic organisms living in the system. Also called oxygen depletion.
I
Incidental catch. See Bycatch
Index of abundance. Relative measure of the abundance of a stock (e.g. catch per unit of effort).
Index of annual recruitment. Estimate of the relative number of individuals entering the fishery each year, usually based on a data source dedicated to the purpose.
Individual transferable effort (ITE). Shares of a total allowable effort that are allocated to individuals. They can be traded permanently or temporarily. Analogous to individual transferable quotas in a fishery managed with a total unit allowable catch. Usually issued at the start of a fishing season.
Individual transferable quota (ITQ). Management tool by which portions of the total allowable catch quota are allocated to fishers (individuals or companies). The fishers have long-term rights over the quota, but can trade quota with others. See also Quota.
Input controls. Management measures that place restraints on who fishes (licence limitations), where they fish (closed areas), when they fish (closed seasons) or how they fish (gear restrictions).
Inshore waters. Waters of the shallower part of the continental shelf, usually less than 3 nautical miles from the coast.
Intrinsic productivity. The natural rate of growth of a population, measured as births minus deaths per capita in the absence of environmental constraints on population increase.
J
Joint authority. An Offshore Constitutional Settlement arrangement whereby a fishery is managed jointly by the Australian Government and one or more states or territories under a single (Commonwealth, or state or territory) jurisdiction.
K
Key commercial species. A species that is, or has been, specifically targeted and is, or has been, a significant component of a fishery.
STATUS OF KEY AUSTRALIAN FISH STOCKS REPORTS 2012 - 411 -
Key threatening process. The Environment Protection and Biodiversity Conservation Act 1999 defines a key threatening process as a process that threatens the survival, abundance or evolutionary development of a native species or ecological community, requiring the formal development of a threat abatement plan. A threatening process is eligible to be treated as a key threatening process if (a) it could cause a native species or an ecological community to become eligible for listing in any category, other than conservation dependent, or (b) it could cause a listed threatened species or a listed threatened ecological community to become eligible to be listed in another category representing a higher degree of endangerment, or (c) it adversely affects two or more listed threatened species (other than conservation dependent species) or two or more listed threatened ecological communities.
L
La Niña. The extensive cooling of the central and eastern Pacific Ocean. In Australia (particularly eastern Australia), La Niña events are associated with an increased probability of wetter conditions.
Latency. Fishing capacity that is authorised for use, but not currently being used. Depending on how a fishery is managed, latency might appear in effort (e.g. unused vessel statutory fishing rights [SFRs], gear SFRs, quota SFRs, permits or nights fishing) or in quota (e.g. where total allowable catches [TACs] are not fully caught in a quota-managed fishery). It is a low-cost indicator of fishers’ views about the profitability of a fishery. High levels of latency can suggest that low expected profits in the fishery do not justify fishing. It is likely that fisheries in which latency exists are close to the open-access equilibrium. Apart from being an indicator of efficiency, a high level of latency in a fishery may be detrimental to the fish stock and to any chances the fishery has of being profitable in the future. For example, a significant increase in the market price of a fishery’s product is likely to entice inactive effort into the fishery. In input-controlled fisheries, if enough inactive effort is triggered, the fish stock could be jeopardised and/or profits dissipated as soon as they arise if the fishery is driven to a point of open-access equilibrium. In an output-controlled fishery, this is less of a problem, provided that TACs are set in accordance with appropriate targets.
Leeuwin Current. A warm ocean current that transports warm tropical water southwards along the Western Australian coast and east around southern Australia.
Length and age frequency. See Age–length frequency.
Length-frequency distribution; modal size. The number of individuals in a catch or catch sample in each group of lengths (length intervals). The modal size is the length group into which most individuals fall. Some distributions may show several modes, reflecting fish of different ages.
Limited-entry fishery. Fishery in which the fishing effort is controlled by restricting the number of operators. Usually requires controlling the number and size of vessels, the transfer of fishing rights and the replacement of vessels (c.f. Open-access fishery).
Logbook. Official record of catch-and-effort data completed by fishers. In many fisheries, a licence condition makes the return of logbooks mandatory.
Lower-jaw fork length. Length of a fish measured as the distance between the tip of the lower jaw and the point of the fork or ‘V’ of the tail. Commonly used to record the length of commercial fish with bills (e.g. Swordfish) because it is little affected by damage to the tail fin (c.f. Total length) and bill. Fork length is measured flat, from point to point, not by stretching a tape along the body surface, which would result in a longer measurement for full-bodied fish like tuna.
STATUS OF KEY AUSTRALIAN FISH STOCKS REPORTS 2012 - 412 -
M
Management strategy evaluation (MSE). Procedure whereby management strategies are tested and compared using simulations of stock and fishery dynamics.
Mantle length. The standard measure of length in coleoid cephalopods (e.g. squid, cuttlefish and octopus). Usually measured along the dorsal midline from the mantle margin to the posterior tip of the body, excluding long tails, or from a line joining the midpoint of the eyes rather than the mantle margin.
Mark–recapture. A method for estimating population size and other parameters by tagging and releasing fish and comparing the ratios of marked (tagged) to unmarked (untagged) individuals in future catches.
Maximum economic yield (MEY). The sustainable catch level for a commercial fishery that allows net economic returns to be maximised. For most practical discount rates and fishing costs, MEY implies that the equilibrium stock of fish is larger than that associated with maximum sustainable yield (MSY). In this sense, MEY is more environmentally conservative than MSY and should, in principle, help protect the fishery from unfavourable environmental impacts that could diminish the fish population.
Maximum sustainable yield (MSY). The maximum average annual catch that can be removed from a stock over an indefinite period under prevailing environmental conditions. MSY defined in this way makes no allowance for environmental variability, and studies have demonstrated that fishing at the level of MSY is often not sustainable.
Migration. Non-random movement of individuals of a stock from one place to another, often in groups.
Minimum size (minimum legal size). Size below which a captured animal may not legally be retained. Usually specified by species. May be varied as a management tool.
Model (population). Hypothesis of how a population functions; often uses mathematical descriptions of growth, recruitment and mortality.
Mortality. Deaths from all causes (usually expressed as a rate or as the proportion of the stock dying each year).
Multispecies fishery. A fishery in which fishers’ profits depend on the catch of more than one species. Fishery data from multispecies fisheries are more difficult to interpret because of uncertainty around the relative targeting of individual species.
N
Natural mortality (M). Deaths of fish from all natural causes except fishing. Usually expressed as an instantaneous rate or as a percentage of fish dying in a year. See also Fishing mortality (F), Mortality.
Nautical mile (nm). A unit of distance derived from the angular measurement of one minute of arc of latitude, but standardised by international agreement as 1852 metres.
Nominal catch. The sum of the catches that are landed (expressed as live weight equivalent). Nominal catches do not include unreported discards.
Non-target species. Species that is unintentionally taken by a fishery or not routinely assessed for fisheries management. See also Bycatch, Byproduct.
STATUS OF KEY AUSTRALIAN FISH STOCKS REPORTS 2012 - 413 -
O
Observer. A certified person on board fishing vessels who collects scientific and technical information for the management authority on the fishing operations and the catch. Observer programs can be used for monitoring fishing operations (e.g. areas fished, fishing effort, gear characteristics, catches and species caught, discards, collecting tag returns). Observers may or may not have legal coercion powers, and their data may or may not be used for non-scientific purposes (e.g. enforcement), depending on the situation.
Oceanic. Open-ocean waters beyond the edge of the continental shelf.
Offshore Constitutional Settlement (OCS). The 1982 package of uniform national, state and territory laws that forms the basis for Australian governments (national, state and territory) to enter into agreements for specified fisheries to be managed by a particular government or group of governments. A fishery might be managed by the Australian Government, one or more state or territory governments, or any combination of the two acting through a joint authority. Fisheries for which OCS arrangements are not in place may be managed under joint control or continue under current management arrangements.
Oligotrophic. Applies to water bodies that are poor in nutrients and have low primary productivity. Low nutrient content reduces plankton blooms, but also results in high dissolved oxygen levels.
Otoliths. Bone-like structures formed in the inner ear of fish. The rings or layers can be counted to determine age.
Otolith microchemistry. A technique used in fisheries management and fisheries biology to delineate stocks and characterise movements and natal origin of fish.
Output controls. Management measures that place restraints on what is caught, including total allowable catch, quota, size limits and species.
Overfished stock. The agreed national reporting framework for the Status of key Australian fish stocks reports defines the term overfished stock as follows: Stock is recruitment overfished, and current management is not adequate to recover the stock; or adequate management measures have been put in place, but have not yet resulted in measurable improvements.
Ovigerous. Carrying or bearing eggs.
P
Pelagic. Inhabiting surface waters rather than the sea floor. Usually applied to free-swimming species such as tunas and sharks (c.f. Demersal).
Performance indicator (performance measure). Parameter used to assess the performance of a fishery against predetermined sustainability objectives.
Perkinsus. Protistan parasites that infect many species of marine molluscs throughout the world and can cause mass mortality.
Planktonic larval stage. An early life stage of many marine organisms, when larvae are dispersed in the water column before settling on suitable habitat and developing into their adult form.
Population modelling. Mathematical description of a population that is designed to fully simulate the life cycle of animals in that population. Can project the effects on the population of environmental factors or biological characteristics of these animals.
STATUS OF KEY AUSTRALIAN FISH STOCKS REPORTS 2012 - 414 -
Possession limit. The maximum number of fish that a person is allowed to have in their possession at any time. It discourages the accumulation of large quantities of fish by recreational fishers.
Precautionary approach. Approach to resource management in which, where there are threats of serious irreversible environmental damage, a lack of full scientific certainty is not used as a reason for postponing measures to prevent environmental degradation. In the application of the precautionary approach, uncertainties should be evaluated and taken into account in a risk-assessment approach, and decisions should be designed to minimise the risk of serious or irreversible damage to the environment.
Pre-recruits. The proportion of a population that has not yet entered a fishery (i.e. not able to be caught or retained).
Productivity (biological). An indication of the birth, growth and death rates of a stock. A highly productive stock is characterised by high birth, growth and mortality rates, and can sustain high harvesting rates.
Productivity (economic). The ability of firms or an industry to convert inputs (labour, capital, fuel, etc.) into output. Economic productivity is often measured using productivity indexes, which show whether more or less output is being produced over time with a unit of input. The index is calculated by comparing changes in total output (fish) to changes in total inputs such as fuel, labour and capital.
Protected species. As per the meaning used in the Environment Protection and Biodiversity Conservation Act 1999.
Protogynous hermaphrodites. Organisms that change sex from female to male during their life cycle.
Puerulus. The last pelagic stage of rocklobster larvae. Surveys to estimate the density of rocklobster puerulus that settle on the seabed are sometimes used to predict future recruitment strength in rocklobster fisheries.
Q
Quota. Amount of catch allocated to a fishery as a whole (total allowable catch) or to an individual fisher or company (individual transferable quota).
Quota species. Species for which catch quotas have been allocated.
R
Real-time management. Method of fisheries management that allows fishing activities (e.g. vessel movements, catch) to be monitored in real time.
Recommended biological catch (RBC). The range of allowable catch for a species or species group. Usually determined by a stock assessment.
Recruit. Usually, a fish that has just become susceptible to the fishery. Sometimes used in relation to population components (e.g. a recruit to the spawning stock).
Recruitment failure. A situation in which a population is not able to naturally produce viable offspring as a consequence of physical factors (e.g. damaged spawning areas) or biological factors (e.g. inadequate numbers of fish).
STATUS OF KEY AUSTRALIAN FISH STOCKS REPORTS 2012 - 415 -
Recruitment overfished. The point at which a stock is considered to be recruitment overfished is the point where the spawning stock biomass has been reduced through catch, so that average recruitment levels are significantly reduced.
Recruitment overfishing. A level of exploitation that, if maintained, would result in the stock falling to levels at which there is a significant risk of recruitment and stock collapse. The corresponding term for the state of the stock is ‘recruitment overfished’, in which the average annual recruitment to the stock is significantly reduced. Both terms define a limit reference point (for exploitation rate or stock size) beyond which urgent management action should be taken to reduce exploitation and recover the stock.
The following uses of the term provide some guidance to how it should be interpreted and applied.
The FAO fisheries glossary (www.fao.org/fi/glossary/default.asp) defines recruitment overfished as ‘a situation in which … annual recruitment … has become significantly reduced. The situation is characterized by a greatly reduced spawning stock, a decreasing proportion of older fish in the catch, and generally very low recruitment year after year’.
Cooka defines recruitment overfished as a situation in which ‘a reduction in the proportion of fish caught would be more than compensated for by the increased number of recruits to the fishery as a result of increased escapement of mature fish’.
The EPBC Guidelines for the ecologically sustainable management of fisheriesb define recruitment overfishing as occurring ‘where fishing activities are causing a reduction in recruitment in succeeding years and cause the mortality of too many fish in total, too many pre-productive fish, or too many fish that have only spawned a few times. The end result is that the stock can no longer replenish itself adequately’.
Various jurisdictions have defined a biomass limit reference point (BLIM) that also corresponds to this concept of recruitment overfishing. These limit reference points (LRPs) are often related to the biomass at which maximum sustainable yield (MSY) occurs. Examples of LRPs include the following:
• BLIM = 0.5BMSY (Commonwealth of Australia).
• BLIM = 0.5BMSY (or greater) (United States).
• BLIM is usually defined relative to fishing mortality rates rather than biomass (European Union).
• BLIM = 0.5BMSY (or greater, e.g. for forage fish) (Marine Stewardship Council).
New Zealand explicitly uses the concept of recruitment overfishing, which is defined as occurring ‘when excessive fishing effort or catch reduces the spawning stock biomass to a level below which future recruitment levels may be jeopardised; this spawning biomass level should correspond closely to the biomass limit reference point’.
No jurisdictions appear to have explicitly defined how much recruitment would be reduced to constitute recruitment overfishing, perhaps because recruitment tends to fluctuate much more than overall stock biomass.
Reference point. Indicator of the level of fishing (or stock size); used as a benchmark for assessment (see also Biological reference point).
a Cook, JG 1984, Glossary of technical terms, in RM May (ed.), Exploitation of marine communities, Springer-Verlag, Berlin, 341–348.b Australian Government Department of the Environment and Water Resources 2007, Guidelines for the ecologically sustainable management of fisheries, 2nd
edn, DEWR, Canberra.
STATUS OF KEY AUSTRALIAN FISH STOCKS REPORTS 2012 - 416 -
Relative abundance. The number of living individuals at a point in time, expressed as a fraction of the average number of living individuals estimated prior to the beginning of fishing.
Risk analysis. Analysis that evaluates the possible outcomes of various harvesting strategies or management options.
Rotational closure. Closure of an area to allow stocks to rebuild, while another area that has been previously closed and allowed to rebuild is fished.
S
Sacrificial panel. Part of a trap designed to rust out after a short period to allow fish to escape if the trap is lost; reduces the impacts of ghost fishing.
Seasonal closure. Closure of a fishing ground for a defined period; used as a management tool, often to protect a particular component of the stock.
Settlement. Transition from a pelagic larval stage to a substrate-associated juvenile or adult existence.
Shared biological stock. A biological stock that spans the waters of more than one jurisdiction.
Shark finning. The removal and retention of shark fins. The remainder of the body is generally discarded, often still alive. The process has been banned in Australian waters, and management measures are in place to reduce or restrict targeting of sharks for fin markets by illegal, unreported and unregulated fishing.
Shell height. A straight-line measurement of molluscs from the hinge to the part of the shell that is furthest away from the hinge.
Shell length. A straight-line measurement of molluscs, often along a straight line at the widest point of the shell.
Size frequency. See Length-frequency distribution.
Spatial closure. A method of fisheries management that prevents fishing in a defined area.
Spawning biomass (SB). The total weight of all adult (reproductively mature) fish in a population.
Spawning stock biomass. See Spawning biomass (SB).
Species complex. Group of similar species that are often difficult to differentiate without detailed examination.
Species group. See Species complex.
Standardised data. Data that have been adjusted to be directly comparable to a unit that is defined as the ‘standard’ one. Standardised catch per unit effort data are often used as an indicator of fish abundance.
Standard length (SL). The length of a fish measured from the tip of the snout to the posterior end of the last vertebra or to the posterior end of the midlateral portion of the hypural plate.
Statoliths. Bone-like structures found in cephalopods that can be used to record life history events. Similar to otoliths found in fish.
Statolith microchemistry. A technique used in fisheries management and fisheries biology to characterise life history, natal origin and movements of cephalopods.
STATUS OF KEY AUSTRALIAN FISH STOCKS REPORTS 2012 - 417 -
Statutory fishing right (SFR). Right to participate in a limited-entry fishery. An SFR can take many forms, including the right to access a particular fishery or area of a fishery, the right to take a particular quantity of a particular type of fish, or the right to use a particular type or quantity of fishing equipment.
Stochastic demographic modelling. Stock assessment method used to estimate the intrinsic productivity and response to fishing of fish stocks, based on age structure, allowing for variation in annual recruitment. Mostly used for stock assessment of shark species.
Stock. Within the Status of key Australian fish stocks reports, the term ‘stock’ is used generically in reference to all three levels of stock status assessment, i.e. biological stocks, management units and populations assessed at the jurisdictional level. See also Biological stock.
Stock–recruitment relationship. Relationship between the size of the parental biomass and the number of recruits it generates. Determination of this relationship is difficult, and involves studying the population’s size–age composition, growth and mortality rates.
Stock reduction analysis. A method of inferring the extent to which a fisheries stock is likely to have been reduced by fishing, assuming constant recruitment. Requires only a time series of total catch data, but can also incorporate other information.
Stock synthesis model. A statistical framework for calibration of a population dynamics model, using a range of fishery and survey data. It is designed to accommodate both age and size structure in the population, and multiple stock subareas. Selectivity can be cast as age specific only, size specific in the observations only, or size specific with the ability to capture the major effect of size-specific survivorship. The overall model contains subcomponents that simulate the population dynamics of the stock and fisheries, derive the expected values for the various observed data, and quantify the magnitude of difference between observed and expected data.
Sustainable stock. The agreed national reporting framework for the Status of key Australian fish stocks reports defines the term ‘sustainably fished’ as follows: Stock for which biomass (or biomass proxy) is at a level sufficient to ensure that, on average, future levels of recruitment are adequate (i.e. not recruitment overfished) and for which fishing pressure is adequately controlled to avoid the stock becoming recruitment overfished.
T
Tagging. Marking or attaching a tag to an animal so that it can be identified when recaptured; used to study fish growth, movement, migration, stock structure and size.
Target biomass (BTARG). The desired biomass of the stock.
Target catch range. The range of annual catches, taking into account natural variations in recruitment to the fished stock, that can be expected under a fishing effort–based management plan.
Target fishing (targeting). Fishing selectively for particular species or sizes of fish.
Target species. See Key commercial species.
Temporal closure. Closure that is implemented to protect fish stocks during specific stages of their life cycle (e.g. while spawning).
Territorial sea (12 nautical mile limit). ‘The Territorial Sea is a belt of water not exceeding 12 nautical miles in width measured from the territorial sea baseline. Australia’s sovereignty extends to the territorial sea, its seabed and subsoil, and to the air space above it. This sovereignty is exercised in accordance with international law as reflected in the Convention on the Law of the Sea.
STATUS OF KEY AUSTRALIAN FISH STOCKS REPORTS 2012 - 418 -
The major limitation on Australia’s exercise of sovereignty in the territorial sea is the right of innocent passage for foreign ships. The territorial sea around certain islands in the Torres Strait is 3 nautical miles’a.
Territorial sea baseline. The baseline from which all the zones (e.g. EEZ) of Australia’s maritime jurisdiction are measured. The baseline is defined as the level of lowest astronomical tide, but straight baselines and bay or river closing lines may be drawn further out from the low-water mark to encompass areas such as the mouths of rivers, bays, ports, roadsteads and fringing reefs.
Threatened species. As per the meaning used in the Environment Protection and Biodiversity Conservation Act 1999.
Torres Strait Protected Zone. An area under an agreement between Australia and Papua New Guinea that describes the boundaries between the two countries and how the sea area may be used. The main reason for the protected zone is so that Torres Strait Islanders and the coastal people of Papua New Guinea can carry on their traditional way of life. For example, traditional people from both countries may move freely (without passports or visas) for traditional activities in the protected zone.
Total allowable catch (TAC). For a fishery, a catch limit set as an output control on fishing (see also Output controls). Where resource-sharing arrangements are in place between commercial and recreational fishers, the term total allowable commercial catch (TACC) applies. The term ‘global’ is applied to TACs that cover fishing mortality from all fleets, including Commonwealth, state and territory fleets.
Total allowable catch (TAC), actual. The agreed TAC for the species with amendments applied, such as carryover or debits from the previous year.
Total allowable commercial catch (TACC). See Total allowable catch (TAC).
Total allowable effort (TAE). An upper limit on the amount of effort that can be applied in the fishery.
Total length (TL). The length from the tip of the snout to the tip of the longer lobe of the caudal fin, usually measured with the lobes compressed along the midline. It is a straight-line measure, not measured over the curve of the body (c.f. Fork length).
Transitional–depleting stock. The agreed national reporting framework for the Status of key Australian fish stocks reports defines the term ‘transitional–depleting stock’ as follows: A deteriorating stock—biomass is not yet recruitment overfished, but fishing pressure is too high and moving the stock in the direction of becoming recruitment overfished.
Transitional–recovering stock. The agreed national reporting framework for the Status of key Australian fish stocks reports defines the term ‘transitional–recovering stock’ as follows: A recovering stock—biomass is recruitment overfished, but management measures are in place to promote stock recovery, and recovery is occurring.
Trigger points. Pre-specified quantities (total catch, spawning biomass, etc.) that indicate the need for a review of fishery management.
a Geoscience Australia 2012, Maritime Boundary Definitions, Geoscience Australia, Canberra, www.ga.gov.au/marine/jurisdiction/maritime-boundary-definitions.html.
STATUS OF KEY AUSTRALIAN FISH STOCKS REPORTS 2012 - 419 -
U
Undefined stock. The agreed national reporting framework for the Status of key Australian fish stocks reports defines the term ‘undefined stock’ as follows: Not enough information exists to determine stock status.
Unfished biomass. Biomass of a stock that has not been fished (also called the ‘unfished’ or ‘unexploited’ biomass or unfished level).
Upwelling. An oceanic process whereby cold, nutrient-rich water is brought to the surface. Typically results in increased productivity of fisheries where it occurs, as a result of the increased nutrients.
V
Vessel monitoring system (VMS). Electronic device that transmits the identity and location of a vessel.
Virgin biomass. See Unfished biomass.
Vulnerable species. Species that will become endangered within 25 years unless mitigating action is taken. See also Endangered species. The Environment Protection and Biodiversity Conservation Act 1999 dictates that a native species is eligible to be included in the vulnerable category at a particular time if, at that time (a) it is not critically endangered or endangered, and (b) it is facing a high risk of extinction in the wild in the medium-term future, as determined in accordance with the prescribed criteria.
W
Warp strike. Incident of seabirds striking trawl gear while interacting with fishing activity. Often results in mortality.
Weight-of-evidence approach. The systematic consideration of a range of biological and fisheries information for assembly and review of indicators of biomass status and levels of fishing mortality to support a status determination. Lines of evidence used in the weight-of-evidence approach include empirical indicators (catch, effort, catch rate, size- or age-based indicators, spatial and temporal distribution of the fishery), risk assessments, fishery-independent surveys, quantitative stock assessment models and harvest strategies.
Y
Yield. Total weight of fish harvested from a fishery.
Yield-per-recruit analysis. Analysis of how growth and natural mortality interact to determine the best size of animals to harvest; for example, it may be more economically beneficial to catch fish when they are young and plentiful, or when they are older and larger but fewer. Biological reference points based on yield-per-recruit analysis will be expected to lack precaution because the potential to reduced future recruitment resulting from decreased parental biomass is not considered.

STATUS OF KEY AUSTRALIAN FISH STOCKS REPORTS 2012 - 420 -