Statistics South Africa Annual Report 2016-2017
250
-
Upload
khangminh22 -
Category
Documents
-
view
1 -
download
0
Transcript of Statistics South Africa Annual Report 2016-2017

Statistics South Africa Private Bag X44 Pretoria 0001 Koch Street, Salvokop Pretoria 0002 User information services: (012) 310 8600 Fax: (012) 310 8500 Main switchboard: (012) 310 8911 Fax: (012) 310 7381 Website: www.statssa.gov.za Email: [email protected]

Annual Report 2016/17
Book 1
Statistics South Africa, 2017
Pali Lehohla, Statistician-General

Annual report 2016/2017 (Book 1) / Statistics South Africa Published by Statistics South Africa, Private Bag X44, Pretoria 0001 © Statistics South Africa, 2017 Users may apply or process this data, provided Statistics South Africa (Stats SA) is acknowledged as the original source of the data; that it is specified that the application and/or analysis is the result of the user’s independent processing of the data; and that neither the basic data nor any reprocessed version or application thereof may be sold or offered for sale in any form whatsoever without prior permission from Stats SA. Annual Report 2016/2017 (Book 1) / Statistics South Africa. Pretoria: Statistics South Africa, 2017 248pp. RP122/2017 ISBN: 978-0-621-45440-6 i. Annual reports – Statistics South Africa ii. Series (LCSH 16) A complete set of Stats SA publications is available at Stats SA Library and the following libraries:
National Library of South Africa, Pretoria Division National Library of South Africa, Cape Town Division Library of Parliament, Cape Town Bloemfontein Public Library Natal Society Library, Pietermaritzburg Johannesburg Public Library Eastern Cape Library Services, King William’s Town Central Regional Library, Polokwane Central Reference Library, Mbombela Central Reference Collection, Kimberley Central Reference Library, Mmabatho
This report is available on the Stats SA website: www.statssa.gov.za Copies are obtainable from: Reprographics, Statistics South Africa Tel: (012) 310 8619 (012) 310 8161 Email: [email protected]

Contents
Section 1: General information 3
Section 2: Performance information 31
Section 3: Governance 95
Section 4: Human resource information 105
Section 5: Financial information 139
List of abbreviations and acronyms 241


Submission of the report to the executive authority Minister JT Radebe It is my pleasure to submit the 2016/17 Annual Report of Statistics South Africa for the period 1 April 2016 to 31 March 2017, in compliance with section 7(2)(c) of the Statistics Act, 1999 (Act No. 6 of 1999), section 40(1)(d)(i) of the Public Finance Management Act, 1999 (Act No. 1 of 1999), and in accordance with section 18 of the Treasury Regulations. PJ Lehohla Statistician-General


Section 1: General information

4
1. Foreword by the Minister
As Minister responsible for Statistics South Africa, I am pleased to hand over the Annual Report for tabling in Parliament. Statistics South Africa is our national statistics agency empowered by the Statistics Act, Act No. 6 of 1999, to play a critical role in our democracy. I took responsibility for Stats SA following the elections of 2014 when I was appointed Minister for Planning, Monitoring and Evaluation. The journey with Stats SA has been a marvelling one. Stats SA has stayed true to form by meeting its targets and delivering to expectation. The measurement of the expenditure side of the Gross Domestic Product (GDP) has been transferred from the South African Reserve Bank (SARB) to Stats SA. This episode ended a seven-decade practice of a dual-line estimation of the GDP, where Stats SA had all along been responsible for the production side of the GDP. In the year under review, Stats SA moved into a new home, ISIbalo House, at Salvokop in Pretoria. The new Stats SA headquarters is located next to the Freedom Park precinct where the names are displayed of our illustrious heroes who have fought for the democracy that we enjoy today. The ISIbalo House location echoes our message that freedom, information and democracy are intertwined into inseparability. This notion hammers home the decision by government in 2009 to place Stats SA side by side with the planning function. Stats SA, while close to the policy space, continues to enjoy its independence at all times. National statistics agencies all over the world require solid leadership. They further require a proper and yet robust interface among all the institutions as prescribed by legislation. To this date, we have observed a great relationship between myself as Minister responsible for statistics as well as with the South African Statistics Council and the Statistician-General (SG). As Minister, I approve the Work Programme of Stats SA. The Statistics Council is an independent body that represents members of society from all walks of life. It is responsible for providing advice to both the Minister and the SG. The SG is responsible for the implementation of the Statistics Act. The current SG is concluding his employment contract this year and the search for a new SG is on course. Stats SA is leapfrogging towards the use of advanced technology. We have observed the deployment of computer-assisted personal interviews (CAPI) during the 2016 Community Survey (CS). The results of the CS were released to the South African public exactly two months after concluding fieldwork. Stats SA is currently taking steps to attend to the CAPI transition in its field collections. As Stats SA turns the corner on technology, it still has to get to work to attend to matters of legislative reform, trade statistics and entrenching the role of official statistics within the planning function.

5
Our democracy was never handed on a silver platter to us. We toiled hard to achieve the current dispensation. It is therefore very critical that we protect our gains. Stats SA, therefore, is one of the institutions that we need to continue protecting our gains so that the agency can discharge of its duties with all the requisite independence. Mr JT Radebe (MP) Minister in the Presidency: Planning, Monitoring and Evaluation

6
2. Foreword by the Chairperson of the Statistics Council
The year 2016/17 is marked by the occurrence and the achievement of three historic milestones in the area of official statistics: The first publication by Statistics South Africa of a complete set of National Accounts; the completion, and occupation by Statistics South Africa, of the new home of Statistics South Africa – ISIbalo House; and the successful hosting of the first United Nations World Data Forum on African soil and, more specifically, in Cape Town, South Africa. Stats SA has been responsible for the publication of one side – the production side – of National Accounts. The South African Reserve Bank (SARB) had, for the past seventy years, been responsible for the drawing up and publication of the expenditure side of National Accounts. In June 2016, a joint effort of Stats SA and the SARB culminated in the successful publication by Stats SA of a set of National Accounts covering both the production and expenditure sides. This achievement elevated South Africa’s advancement towards the United Nations Fundamental Principles of Official Statistics. The National Accounts System on the continent has been subjected to a torrent of unfair criticism through Afro-pessimism attacks on its quality and credibility. ISIbalo House is the new home of Stats SA. This is a state-of-the-art building in many respects. It is a benchmark Public Private Partnership, the construction of which took eighteen months and which now houses all of Stats SA’s divisions under one roof. The contribution of Stats SA in global statistical development has been manifested again this year by the successful hosting of the first United Nations World Data Forum in this country and in the city of Cape Town. The outcome of the UN World Data Forum was the adoption of the Cape Town Global Action Plan for Sustainable Development Data with the following six strategic areas:
1. Coordination and strategic leadership on data for sustainable development
2. Innovation and modernization of national statistical systems
3. Strengthening of basic statistical activities and programmes, with particular focus on addressing the monitoring needs of the 2030 Agenda
4. Dissemination and use of sustainable development data
5. Multi-stakeholder partnerships for sustainable development data
6. Mobilize resources and coordinate efforts for statistical capacity building The UN World Data Forum has put the United Nations Statistics Commission on the driving seat in the development of statistical response to the global data and statistical needs, as called for by heads of state and

7
government and contained in the document titled, Transforming our world: the 2030 Agenda for Sustainable Development. The implementation of the Cape Town Global Action Plan for Sustainable Development Data shall serve to advance national statistics and statistical coordination in response to the global 2030 Development Agenda. These global statistical developments – in which Stats SA is playing such an important part – have coincided with efforts at strengthening the South African National Statistics System. In this regard, the drawing up of legislation governing statistics must enhance the competence of South Africa in advancing the strategic areas contained in the Cape Town Global Action Plan. It therefore became necessary that research be done in global best practices on how to institutionalise a statistical system that is able to meet contemporary and future demands for statistics. Both the Statistics Council and Stats SA have consulted widely, and the results of the consultation and research are currently informing the drafting of the amendment to the Statistics Act. The current tight budget in the country bears threat of minimising the advancement of the Agenda for Statistical Development. Indeed, quality statistics are needed to provide evidence of the development and of the evaluation of the success, effectiveness or otherwise, of government policies and programmes. It is important that ways be found to ensure that the production of information that leads to sound decision-making is sustained. The tight fiscal space does provide an opportunity to improve efficiencies within organs of state in the area of statistical production. Currently there are various statistical surveys conducted by organs of state, outside the provisions of the Statistics Act. What must be considered is pulling these resources together for the production of official statistics in line with the provisions of the Act. The next fiscal year is the year in which it is expected that the contract of the current Statistician-General, Dr Pali Lehohla, will come to an end. The contribution of Dr Lehohla in the development of statistics in South Africa, the continent and the world is indescribably and arguably the loftiest ever. His ability to generate statistical products that relate to the needs of people and their living conditions has made statistics simple and meaningful. This era, during which statistics in South Africa and the continent had risen to prominence under his leadership, needs to be clearly documented. Council is grateful for the opportunity to work with such an illustrious and compassionate leader. Special thanks goes to the Minister for his leadership and guidance. Mr MB Mphahlele Chairperson: Statistics Council

8
3. Accounting Officer’s review
This is the last of sixteen reports I have tabled before Parliament as the Statistician-General of South Africa, the longest at that and the longest-serving Head of Department. As such I have organised the input into three distinct categories. The first is the beginning, the second is about leading and the third is about my exit, with key messages on risks.
The beginning
Seventeen years ago in 2000, I had the privilege of being appointed as South Africa’s first Statistician-General. The statistics law had been passed in 1999, i.e. the Statistics Act of 1999 (Act No. 6 of 1999). This would regulate the South African statistics system. Dr Mark Orkin, my predecessor, handed down to me this brand new and most modern law that would go down in history as the last Statistics Act to be enacted globally at the end of the 20th century. This made Act 6 of 1999 one of the most modern acts in the 21st century. The Statistics Act, the United Nations Fundamental Principles for Official Statistics, and other protocols such as the Special Data Dissemination Standards, laid a firm foundation for statistical development in South Africa. This set us apart, anchored us well, and enabled us to accelerate and excel in statistical practice. Seventeen years ago, a necessary wave of many programmes aimed at transformation (such as restructuring and implementation of Chapter B (Special), the Voluntary Severance Package, retrenchments at the very top, and the unfinished business of uniform dispensation) almost paralysed the organisation. The organisation was bleeding from the trauma of change. Adding to this trauma were the following: significance and impact of Census ’96, the enormity of compliance emanating from the Public Finance Management Act, the impending second census under democratic rule – Census 2001, the restructuring of economic statistics, the implementation of provincial offices, and significant budget constraints. The staff were anxious and eager for change, and they demanded participation in the affairs of the organisation. Although my appointment was internal and I was part of the leadership in this whirlwind of change, the theatre looked very strange and intimidating once I put on the lens of Statistician-General. Although very much expected from the staff, especially the black African majority, that I was the most likely candidate to be the Statistician-General, the breaking of the news that I had indeed been appointed ushered new hope, escalated expectations and often times veered into negating the significant accomplishments that my predecessor had made and which I actually shared in the making. There was at no point ever a situation of difference in my leadership and that of Mark Orkin, Ros Hirschowitz and Annette Myburgh. We were committed to hard work. The transition from Mark Orkin to myself as the Statistician-General was thus smooth and did not see any departures of senior staff from the organisation. Instead it witnessed the consolidation and leapfrogging of the gains attained in the five years of

9
Orkin’s tenure. Despite the smooth handover, getting to the top was always going to be overwhelming, and the environment looked strange and intimidating. Given those challenges, l had steeled myself against this moment over a period of time and had thought through what my first steps would be with the assistance of the leadership that I had created over the preparatory phase in the race for the position of Statistician-General. I was thus able to summon the key levers that would enable the organisation to move forward. First it was commitment to training and ensuring that the leadership of the trade unions was the first to be trained abroad in statistical methods. Their leadership was to pay off in time, because skills development were to permeate the organisation and be a culture that sees Stats SA as the learning organisation it is today. This became a key pillar for a leading coalition in the Agenda for Change which, from the onset of my appointment, we had been committed to. The first thirty days were crucial in defining my tenure as the Statistician-General, and the immediacy of the December holidays provided me the respite needed for further thinking through what we would deliver in the first quarter of the following year. The next stage was about ensuring that we sharpen our focus on systems, and in this regard much earlier on, we formalised the discipline of planning and project management. The progress was initially slow and resistance levels were generally high. But training those who have to plan, led to change emerging organically, and today Stats SA boasts a high-quality project management programme that has enabled staff to be effective in the way they execute their work. This has set us apart from the rest here in South Africa, in Africa and globally. Third, we were open and eager to learn. We copied and imitated fast. We pledged transparency and by so doing, reduced the potential for error, especially the commitment of same mistakes. We did things differently, and that led to making progress. Fourth, the allegations of corruption and impropriety – however painful – ensured that we created an environment of taking accountability very seriously. I actually called the Public Service to investigate me. That set the tone at the top from the onset. Of course the allegations were malicious and false.
Leading
The subsequent years from 2003 to 2006 were dedicated to transformative leadership and content coordination. As regards leadership, I subscribed to the notion of a self-liquidating catalytic role which in the main focuses on reinvention through innovation and continuous improvement. This, I would argue, constitutes the hallmark of Statistics South Africa. In these seventeen years we have built a cadre of women and men that are enthusiastic and serious about their professional life. The reports emerging from Statistics South Africa since 2005 have improved significantly with the adoption of an end-to-end quality management system that embedded Clearance Teams and documents that accompany the clearance process. The clearance was run through a sign-off ceremony where different series producers would convene in my office and a series of questions would be raised. This led to the creation of organic quality teams who dissolved the barriers. With the walls and silos broken, the quality of products improved significantly. The problem, however, still remained that the series necessarily still emerged as a single series, therefore only capable of describing phenomena instead of analysing and unveiling diagnosis. By 2007, the urge for embedding space in our work was too strong to resist, and discussions on regional science were intensified. So we sought an institution that would be designed to deliver a well-rounded statistician or researcher capable of thinking in space. By creating the Centre for Regional and Urban Innovation and Statistical Exploration (CRUISE) at Stellenbosch University in 2009, we created a transformative intellectual platform for Stats SA offerings, which instigated significant customer delight. CRUISE drove a crucial point of inflection in Stats SA, which anticipated the discipline of planning and predated the National Development Plan, confirming that Stats SA staff always were and continue to be innovative and ahead of their time. In the last two years, from 2015, we embarked on seven crucial projects through which we have delivered significant value to the state and to the staff of Stats SA. For the staff of Stats SA, we have built a new home at the precinct of Freedom Park, and the space could possibly be themed with the Chapter 9 Institutions to drive a clear message home about the rights-based culture of South Africa. The building represents what is possible in a Public Private Partnership (PPP), but beyond that it is a five-star green building using natural spring water for

10
cooling purposes. It was the fastest PPP to be concluded – from its conception to the building and occupation of ISIbalo House – and with a clean bill of health from the Auditor-General. The second project was the Citizen Satisfaction Survey, which pointed very good evidence for political decisions in KwaZulu-Natal for service delivery. Unfortunately the resources were only available in KwaZulu-Natal. The downside of this is that the state is becoming uneven in creating knowledge markets, thus asymmetries in information can be destructive in policymaking and destroy value. The third project was the Community Survey, a large-scale survey reaching out to 1,5 million households that provided high-quality data at the lowest cost ever per household within the shortest space of time (six weeks). This was exceptionally well executed within time and significantly reduced cost. The fourth project was the delivery of planning tools in the state, and the essence of these are first and foremost their diagnostic capability from which predictions can be made about possible outcomes. With that in mind, a prescriptive discipline to planning is now within reach in South Africa. These tools are now ready for use in the state. The fifth project was putting the expenditure and production side of the GDP under one roof, thus ending a bad practice of statistical production in the country that spanned seventy years. The sixth project (which is still ongoing) is on legislative reform. In this regard we should be seeking to focus on the significance of data revolution in statistical production, enhancing a state-wide cadre of people managing the system of evidence, embedding geography as an indispensable dataset for planning, and enhancing and elevating the authority of the Statistician-General. The seventh project was about hosting the very first United Nations World Data Forum, which provided traction for data revolution and the Cape Town Global Action Plan (CTGAP) for SDGs. No doubt the record of Stats SA delivery is beyond match. The question is whether the record can be emulated. With the raft and skills of women and men to whom time was dedicated to empower them there should be minimal disruption as leadership changes guard. However, even under the best of circumstances it is highly improbable for Stats SA to perform and sustain the level of performance it has come to be expected of Stats SA.
Risks
So as I exit, I do so with trepidation as undoubtedly the African widow syndrome is upon us; not because of inadequacies of Stats SA and its staff but because of matters not under the control of Stats SA. During my period as Statistician-General I contributed in building a formidable institution, a paragon of hope for the nation. Yet this brick-by-brick construction faces major risks. There are too many vacancies in critical posts that have not been filled because of unresolved matters of structure between the Public Service Administration and Stats SA. As a Statistician-General, the evidence marshalled is overwhelmingly pointing to the legitimacy of the structure that Stats SA is using, otherwise the Auditor-General would have made a finding. This risk that has now taken more than a year heralds a disastrous state of affairs for the fact-finder of the nation. It should be solved without any further delay, otherwise the incoming Statistician-General will be like an African widow who laments and embellishes poverty as the means of elevating the powers of the late husband who was very successful. So the outgoing Statistician-General should not be emulated least the widow will be accused of poisoning the late husband – misery is appreciation of the best thing that happened to her: being married to this great man. The second risk is the result of far more than average cuts in financial allocations to Stats SA by Treasury: critical posts in Stats SA have not been filled since September 2016 to date, whilst key people have resigned. The more than average and deep cuts that Stats SA has suffered have put it at an intolerable risk. Whilst I have to express my deepest appreciation to the people of South Africa who had to put up with some of the most annoying and costly mistakes I have made (such as the CPI debacle of 2003), I am terribly concerned about the state of resourcing in Stats SA. Even under the best of leadership, Stats SA will not succeed if there is no urgent remedy for this parlous state of resourcing.

11
Let me take this opportunity to thank South Africans from all walks of life who have allowed me to be a constant feature in their lives – piercing into their most valued secrets of how much they earn and how much they spend, how many children they have, how much alcohol they consume and how much they spend on education. These are questions to which South Africans responded. Let me thank the global statistics fraternity that I came to know through my privileged position of service. Let me thank the four Ministers under whom I served: former ministers Jay Naidoo, Dr Essop Pahad, and Trevor Manuel (under whom I served the longest and who had a profound influence in the structure of statistics – not only in South Africa but also globally) and finally the current Minister under whom I served, Honourable Jeff Radebe. Let me thank the Presidents under whom I served: the late President Nelson Mandela (who I had the privilege of personally enumerating twice), President Thabo Mbeki (under whom I first took my responsibility as Statistician-General), President Kgalema Motlanthe (with whom we mounted a successful campaign in Senwabarwana in Limpopo), and finally, President Jacob Zuma, under whose current leadership I conclude my sojourn as Statistician-General. Let me thank the Chairs of the Statistics Council with whom I served: Dr Hilary Southall, Mr Howard Gabriels, and current chair, Mr Ben Mphahlele. Finally, as I bow out, I wish to thank the staff of this mighty organisation – too many to thank by name, but those who were there in the darkest of hours as we stood to ensure the mighty organisation remains unshaken are Risenga Maluleke, Ros Hirschowitz, Lena Soares, Akhtari Henning and Jonas Mathabe. They remained rock solid at any time when my leadership was tested and many a times it was. Lastly, my family whom I denied many years of my presence but who still stood in front through thick and thin to protect me. Dr Pali Lehohla Statistician-General and Head of Statistics South Africa November 2000 to October 2017

12
4. Management report for the year ended 31 March 2017
Report by the Accounting Officer to the Executive Authority and Parliament of the Republic of South Africa
1. Overview of the operations of Statistics South Africa
In pursuit of A better life for all, the government has worked consistently towards eradicating poverty and reducing inequality. These goals will be achieved by building on the achievements of the past by growing an inclusive economy, accompanied by an expanded and capable workforce, and better access to electricity, water and sanitation in decent community settlements. Statistical information is the evidential knowledge base and the foundation for meeting these goals. Statistics are vital for planning, good governance, policy formulation, monitoring and evaluation, and for decision-making. The overarching strategic goal of the department is to increase the supply of official statistics to inform evidence-based decisions by expanding and transforming the statistical information base. The following key strategic priorities have enabled the department to achieve its mandate:
Key strategic priorities
Statistics South Africa (Stats SA) adopted a new strategy for 2015/16–2019/20. In line with the strategy, the department focused on the following key priorities during the 2016/17 financial year:
Informed nation
• Compiling GDP from the expenditure side
• Conducting a Community Survey
Trusted statistics
• Increasing the use of statistical information (focus on municipalities and schools)
Partners in statistics
• Driving the legislative reform
• Commencing with the compilation of a National Strategy for the Development of Statistics
Capable organisation
• Finalising construction of the new building
• Driving a business modernisation programme
Statistical leadership
• Building statistical leadership capability
• Driving the agenda for change

13
2. Overview of the financial results of Statistics South Africa
2.1 Departmental receipts
Departmental receipts
2016/2017 2015/2016
Estimate
Actual amount
collected (Over)/under-
collection Estimate
Actual amount
collected (Over)/under-
collection R’000 R’000 R’000 R’000 R’000 R’000
Sale of goods and services other
than capital assets 1 549 1 563 (14) 1 033 1 115 (82) Transfers received - 30 (30) - - - Interest, dividends and rent on land 48 110 (62) 80 124 (44) Sale of capital assets 1 050 1 039 11 - - Financial transactions in assets and
liabilities 560 5 838 (5 278) 1 811 8 816 (7 005) Total 3 207 8 580 (5 373) 2 924 10 055 (7 131)
The department levies fees for parking, replacement of lost access cards, commission on deductions for garnishee orders, and a penalty for illegal parking. The fees charged are paid into the revenue fund. The replacement-of-access-card fee is based on the average cost of printing a colour photo, logo and details of the employee on the card, while the parking fee is aligned to the Department of Public Works (DPW) parking guidelines. The commission for garnishee order deductions is levied at 5% of the deduction. The department disseminates some of its statistical products through the website (www.statssa.gov.za) at no cost to users. The department further disseminates data through its User Information Services and information units at provincial offices. Actual cost of production is recovered from users of statistical products, where user-specific information is requested. The department budgets for departmental receipts using historical collection trends. The overcollection of revenue in the Sale of goods and services other than capital assets relates to an increase in the sale of departmental publications related to the Community Survey 2016. The amount reflected in Transfers received relates to a cash amount received for a SITA ICT award which was not budgeted for. The amounts in Interest, dividends and rent on land relate to interest earned on bank accounts and debtors. The overcollection can be attributed to an increase in the interest rate. The amount in Sale of capital assets was generated by the sale of machinery and equipment to staff due to the relocation to the new PPP building. Amounts in Financial transactions in assets and liabilities relate to recoverable revenue and the recovery of previous years’ expenditure not disallowed as receivables, and differ from the estimated amount due to the challenge in reasonably estimating how many, and if any, recoveries will be made. This year, the department received credit notes for large amounts in respect of previous years’ vehicle expenditure.

14
2.2 Programme expenditure
Programme name
2016/2017 2015/2016
Final appropriation
Actual expenditure
(Over)/under-expenditure
Final appropriation
Actual expenditure
(Over)/under-expenditure
R’000 R’000 R’000 R’000 R’000 R’000 1. Administration 707 647 671 188 36 459 849 840 800 124 49 716 2. Economic Statistics 233 312 233 312 - 218 651 218 651 - 3. Population and Social Statistics 119 146 114 498 4 648 154 385 161 188 (6 803) 4. Methodology, Standards and
Research 70 202 70 202 -- 58 711 58 149 562 5. Statistical Support and
Informatics 247 883 247 883 - 226 418 220 177 6 241 6. Statistical Collection and
Outreach 630 088 630 088 - 575 785 575 785 - 7. Survey Operations 529 830 494 034 35 796 239 466 239 466 - Total 2 538 108 2 461 205 76 903 2 323 256 2 273 540 49 716 The final appropriation after virements are applied
Programme 1: Administration spent R671,188 million, which represents 94,8% of the allocated budget. Programme 2: Economic Statistics spent R233,312 million, which represents 100% of the allocated budget. Programme 3: Population and Social Statistics spent R114,498 million, which represents 96,1% of the allocated budget. Programme 4: Methodology, Standards and Research spent R70,202 million, which represents 100% of the allocated budget. Programme 5: Statistical Support and Informatics spent R247,883 million, which represents 100% of the allocated budget. Programme 6: Statistical Collection and Outreach spent R630,088 million, which represents 100% of the allocated budget. Programme 7: Survey Operations spent R494 034 million, which represents 93,2% of the allocated budget.
The department’s budget allocation for its 2016/17 financial activities was R2,538 billion. Actual expenditure as at 31 March 2017 amounted to R2,461 billion, representing 97,0% of the total allocated budget. The underspending is on the capital contribution towards the construction, and unitary fee payments for the Head Office building project and the continuation of the Community Survey 2016 dissemination. A rollover will be requested in the 2017/18 financial year. Savings of R7,412 million were realised on Compensation of Employees (CoE) due to anticipated budget cuts on the CoE budget in the ensuing year. This amount forms part of the funds to be surrendered to National Treasury.

15
2.3 Virement
Virements between programmes
In order to balance budgeting disparities, the following virements were applied: Programme 1 (Administration): The programme underspent by R37,006 million due to vacancies, goods and services as a result of austerity measures. Savings amounting to R6,774 million were transferred to Programme 2 (Economic Statistics) to defray overspending on compensation of employees; R1,726 million to Programme 7 (Survey Operations) to defray overspending on compensation of employees, and R28,506 million to Programme 6 (Statistical Collection and Outreach) to defray overspending related to the appointment of contract staff to collect data for the Quarterly Labour Force Survey and the Continuous Data Collection in the Gauteng Provincial Office due to the implementation of the new Master Sample and underfunded leased vehicles costs. Programme 2 (Economic Statistics): The net effect of the overspending on Programme 2 is R4,539 million. The programme exceeded its compensation of employees allocation by R6,774 million due to the payment of general salary increases, which were higher than anticipated, whilst savings of R2,235 million were realised on goods and services as a result of austerity measures. Savings on goods and services may not be utilised to defray overspending on compensation of employees. Thus, the savings on goods and services on the cluster were transferred to Programme 6 (Statistical Collection and Outreach) to defray overspending on goods and services due to underfunded leased vehicle costs. Savings on compensation of employees (R6,774 million) realised in Programme 1 (Administration) were transferred to this programme to defray the overspending. Programme 3 (Population and Social Statistics): The programme underspent by R10,342 million due to vacancies and goods and services as a result of austerity measures. Savings were transferred to Programme 6 (Statistical Collection and Outreach) to defray expenditure as a result of underfunded leased vehicle costs. Programme 4 (Methodology, Standards and Research): Savings amounting to R3,220 million were realised on this programme mainly due to vacancies and goods and services as a result of austerity measures. Savings were transferred to Programme 6 (Statistical Collection and Outreach) to defray the overspending as a result of the underfunded leased vehicle costs. Programme 5 (Statistical Support and Informatics): Savings amounting to R9,161 million were realised on this programme mainly due to vacancies and goods and services as a result of austerity measures. Savings were transferred to Programme 6 (Statistical Collection and Outreach) to defray the deficit on compensation of employees and leased vehicles costs. Programme 6 (Statistical Collection and Outreach): The programme exceeded its allocation by R58,706 million due to the appointment of contract staff to collect data for the Quarterly Labour Force Survey and Continuous Data Collection in the Gauteng Provincial Office as a result of the implementation of the new Master Sample and underfunded leased vehicles costs. Savings realised from Programme 1 (Administration) R28,506 million, Programme 2 (Economic Statistics) R2,235 million, Programme 3 (Population and Social Statistics) R10,342 million, Programme 4 (Methodology, Standards and Research) R3,220 million, Programme 5 (Statistical Support and Informatics) R9,161 million, and Programme 7 (Survey Operations) R5,242 million were transferred to defray the overspending in this programme. Programme 7 (Survey Operations): Net savings of R3,516 million were realised on this programme. This programme overspent on compensation of employees by R1,726 million. A saving of R5,242 million on goods and services was realised mainly as a result of austerity measures. The saving was transferred to Programme 6 (Statistical Collection and Outreach) to defray the overspending.

16
Reason for the virement
Virements were applied to augment the unfunded activities in the Economic Statistics and Statistical Collection and Outreach clusters. The unfunded activities relate to general salary increases that were higher than anticipated, appointment of contract staff to collect data for the Quarterly Labour Force Survey and Continuous Data Collection in the Gauteng Provincial Office due to the implementation of the new Master Sample and underfunded leased vehicle costs.
Approval for virement
In terms of the current Public Finance Management Act (PFMA) and National Treasury Regulations (NTR) delegations, the Chief Financial Officer (CFO) has been delegated to approve the virement of funds between programmes. National Treasury granted the department approval to utilise savings from payment for capital assets to defray current expenditure.
2.4 Fruitless and wasteful expenditure
The department had ninety (90) cases of fruitless and wasteful expenditure to the value of R11,823 million registered and under investigation as at the beginning of the 2016/17 financial year. Fifty-seven (57) new cases totalling R239 thousand were registered, thirty-one (31) cases totalling R118 thousand were condoned, whilst twelve (12) cases totalling R22 thousand were approved for recovery from responsible officials. The closing balance for registered cases still under investigation is represented by one hundred and four (104) to the value of R11 922 million, of which 96% are travel related, i.e. late cancellation fees, etc. Recommendations have been made and processes improved to address the root causes of the fruitless and wasteful expenditure, with a view of minimising future occurrences.
2.5 Irregular expenditure
The department had nineteen (19) cases to the value of R7,790 million that were brought forward to the year under review. One case relating to a prior period error was registered to the value of R1,340 million, bringing the opening balance to an adjusted opening balance of R9,130 million. During the year, thirteen (13) new cases to the value of R444 thousand were registered, which relate to non-compliance with supply chain management procedures, six (6) cases to the value of R79 thousand were condoned, and one (1) case to the value of R6 thousand was approved for recovery during the year. The irregular expenditure register closed with twenty-six (26) cases to the value of R9,487 million. All cases investigated are followed up with recommendations to address any internal control weaknesses, and recommendations for corrective or disciplinary action were made where deemed necessary.
2.6 Unauthorised expenditure
The Living Conditions Survey (LCS) used to update the Consumer Price Index (CPI) has not been funded for a number of years. The department used savings realised from vacancies and cost-cutting measures to fund the project. The Population and Social Statistics programme exceeded its allocated funds by R16,306 million during the 2015/16 financial year due to the LCS not being part of the baseline allocation. Savings of R9,503 million were transferred to this programme to defray the deficit. The overexpenditure of R6,803 million could not be defrayed due to the limitations of section 43 of the Public Finance Management Act (Act No. 29 of 1999) and resulted in unauthorised expenditure of R6,803 million. The unauthorised expenditure was reported to National Treasury, where it was further reported to Parliament, and the R6,803 million was surrendered to the National Treasury. The department is awaiting the outcome on whether the unauthorised expenditure is approved or disapproved.

17
In the current financial year there was no unauthorised expenditure.
3. Future plans of Statistics South Africa
The key priorities for 2017/18 are outlined below:
• Driving legislative reform
• Getting the basic statistics right
• Developing an integrated indicator framework
• Integrating, innovating and modernising the statistics value chain
• Restructuring and rationalising
• Coordinating statistical production, creating new partnerships and designating statistics as official
• Developing new value-added products
4. Public Private Partnerships
The department entered into a Public Private Partnership (PPP) agreement with Dipalopalo Concessions (PTY) Ltd on 1 April 2014 for the construction of a new Head Office building for the department. Financial close was achieved in April 2014 and excavations commenced on 20 May 2014. The construction of the building lasted for a period of 27 months. Service commencement as per contract was supposed to be achieved on 1 June 2016; however, there were delays with the construction phase. Stats SA and the Private Party had to work together to achieve completion by signing a number of Records of Agreements (RoAs) which were aligned to the snagging period as per the PPP contract. The Independent Certifier (IC) only certified the building as complete on 28 August 2016. Service commencement began on 29 August 2016 and the building was officially opened by the Minister in the Presidency, Honourable Minister JT Radebe on 12 December 2016. National Treasury approved the rollover of an amount of R49,006 million, capital contribution, from the 2015/16 to the 2016/17 financial year for the completion of the construction. Since the service commencement period start date of 29 August 2016, a total of R110,465 million has been paid to the Private Party in respect of unitary fees.
5. Discontinued activities
Not applicable
6. New or proposed activities
• Developing an integrated indicator framework
• Integrating, innovating and modernising the statistics value chain
• Restructuring and rationalising

18
7. Supply Chain Management
The department did not have any requests for unsolicited bids in the financial year 2016/17. The department has an established system of supply chain management with functions covering demand management, acquisition management, logistics management, and contracts management supported by departmental policies, including practice notes and standard operating procedures. The challenge currently faced by the department is that of service providers who misrepresent information relating to the declaration of their interest on the SBD4 form when procuring with the department. At this stage, the department does not have the tool to validate the authenticity of the declarations of interest made by service providers. This is a transversal challenge. Remedial action put in place is that all requests for quotation are accompanied by an SBD4 form, which compels service providers to declare their interest, and where misrepresentation is found on the part of service providers, appropriate action is taken against such.
8. Cost containment measures
The department established the Finance Control Committee in 2012/13 which looks at the reasonability of procurement request and to enforce the austerity measures put in place by the department. The department implemented cost containment measures for travel management, and the circular was issued in November 2016. The department continues implementing the consultancy reduction plan to reduce the dependency in the usage of consultants. The department only utilises consultants on areas which it does not have adequate resources or skills. Over and above, National Treasury negotiated a deal with South African Airways which the department has started implementing during the reporting period.
9. Gifts and donations received in kind from non-related parties
Stats SA received sponsorship in kind valued at R815 thousand from MTN for the UNWDF conference that was held at the CTICC in January 2017.
10. Asset management
The department maintains a complete and accurate asset register, which is fully compliant with the minimum requirements as set by National Treasury. Tangible and intangible assets to the value of R30,048 million were acquired during the 2016/17 financial year. The acquisition value is high as compared to the previous year, due to the computer refresh that took place during the year. However, furniture purchases remained minimal, because of the relocation to the new building. Intangible assets to the value of R1,792 million were acquired through the advance received from the Department of Home Affairs for the digitisation of the Department of Home Affairs civil records.
11. Exemptions and deviations received from National Treasury
No exemptions were received from National Treasury. Ten (10) cases of deviations above R1 million to the value of R78,406 million were reported to the National Treasury and the Auditor-General South Africa (AGSA), as prescribed by National Treasury Practice Note 6 of 2007/08, and these are mainly ICT related due to IT infrastructure requirements in the department’s new Head Office building that were not provided for by the PPP project.

19
The main reasons for the deviations were:
• Renewal of contracts to ensure continuity of service;
• Single-source quality selection; and
• Sole suppliers of goods and services.
12. Events after the reporting date
Below are adjusting events after the reporting date: • During the subsequent events process, the operating leases expenditure note 23.1 was adjusted from
R228,745 million to R219,800 million. This is due to the amended lease agreements for five (5) buildings occupied by Stats SA that were received during June 2017. The amendment was related to reduced annual escalation rates.
13. Others
13.1 Progress on damages and losses incurred
Statistics South Africa collects data for various surveys. During fieldwork, hired vehicles are utilised by fieldworkers to conduct their daily work. During fieldwork, these cars encounter minor damages that require repairs. All such cases are investigated to determine negligence, and whether the drivers have lost state cover or not. The department started the year with 1 238 damages and losses cases to the value of R18,06 million emanating mainly from accidents involving hired vehicles. A total of 2 041 new cases to the value of R8,074 million were registered during the financial year. Investigations were conducted on some of the cases by the end of the financial year, resulting in 1 197cases to the value of R5,623 million being written off, utilising available savings.
13.2 Inter-departmental projects/contract work
13.2.1 South Africa Demographic and Health Survey (SADHS)
The National Department of Health (NDoH) entered into an agreement with Stats SA and the South African Medical Research Council (SAMRC) to conduct a demographic and health survey in all nine provinces. An amount of R18,858 million was brought forward from the 2015/16 financial year and a further R38,264 million was received from NDoH during the financial year. The department incurred expenditure amounting to R56,583 million during the financial year. The remaining amount of R539 thousand will be carried forward to the next financial year, and the project is expected to be concluded during the 2017/18 financial year.

20
13.2.2 National Household Travel Survey (NHTS)
The National Department of Transport (NDoT) entered into an agreement with the department to collect and process travel data countrywide. An amount of R4,272 million was brought forward from the 2015/16 financial year and the department incurred expenditure amounting to R2,224 million during the financial year. The remaining amount of R2,048 million will be carried forward to the 2017/18 financial year for ongoing activities.
13.2.3 East London Industrial Development Zone (ELIDZ)
The East London Industrial Development Zone (ELIDZ) entered into an agreement to conduct a census of the tenants in the zone. An amount of R406 thousand was received during the 2016/17 financial year and the department incurred expenditure amounting to R207 thousand during the financial year. The remaining amount of R199 thousand will be carried forward, and the project is expected to be concluded during the 2017/18 financial year.
13.2.4 Mpumalanga Employment and Business Survey (MEBS)
The Mpumalanga Department of Economic Development and Tourism (MDEDT) entered into an agreement with the department to conduct an employment and business survey in the province. An amount of R2,015 million was brought forward from the 2015/16 financial year for ongoing activities. The department incurred expenditure amounting to R723 thousand during the financial year. The remaining amount of R1,292 million will be carried forward, and the project is expected to be concluded during the 2017/18 financial year.
13.2.5 Department of Trade and Industry Special Economic Zones (SEZs) Project
The Department of Trade and Industry (DTI) entered into an agreement with the department to conduct a survey covering the tenants located in special economic zones (SEZs). An amount of R202 thousand was brought forward from the 2015/16 financial year for ongoing activities. The department incurred expenditure amounting to R68 thousand during the financial year. The remaining amount of R134 thousand will be carried forward, and the project is expected to be concluded during the 2017/18 financial year.
13.2.6 Department of Home Affairs
The Department of Home Affairs (DHA) entered into an agreement with the department to scan and index birth registrations and other documents. An amount of R10 million was received during October 2016, and expenditure amounting to R4,604 million was incurred during the financial year. The remaining amount of R5,396 million will be carried forward, and the project is expected to be concluded during the 2017/18 financial year.

21
13.3 Investigations
An investigation was undertaken by the Office of the Accountant-General on the procurement of services during Census 2011 for the amount of R35, 8 million. Whilst the report has been finalised, the Office of the Accountant-General has been engaged to seek clarity regarding the report’s recommendations.
14. Approval
The annual financial statements set out on pages 145 to 234 have been duly approved by the Accounting Officer. PJ Lehohla Statistician-General (Accounting Officer)

22
5. Statement of responsibility and confirmation of accuracy for the annual report
To the best of my knowledge and belief, I confirm the following: • All information and amounts disclosed throughout the annual report are consistent. • The annual report is complete, accurate and is free from any omissions. • The annual report has been prepared in accordance with the guidelines on the annual report as issued by
National Treasury. • The Annual Financial Statements (Section 5) have been prepared in accordance with the modified cash
standard and the relevant frameworks and guidelines issued by the National Treasury. • The Accounting Officer is responsible for the preparation of the annual financial statements and for the
judgments made in this information. • The Accounting Officer is responsible for establishing and implementing a system of internal control that has
been designed to provide reasonable assurance as to the integrity and reliability of the performance information, the human resources information and the annual financial statements.
External auditors are engaged to express an independent opinion on the annual financial statements. In my opinion, the annual report fairly reflects the operations, the performance information, the human resources information and the financial affairs of the department for the financial year ended 31 March 2017. Yours faithfully PJ Lehohla Statistician-General


25
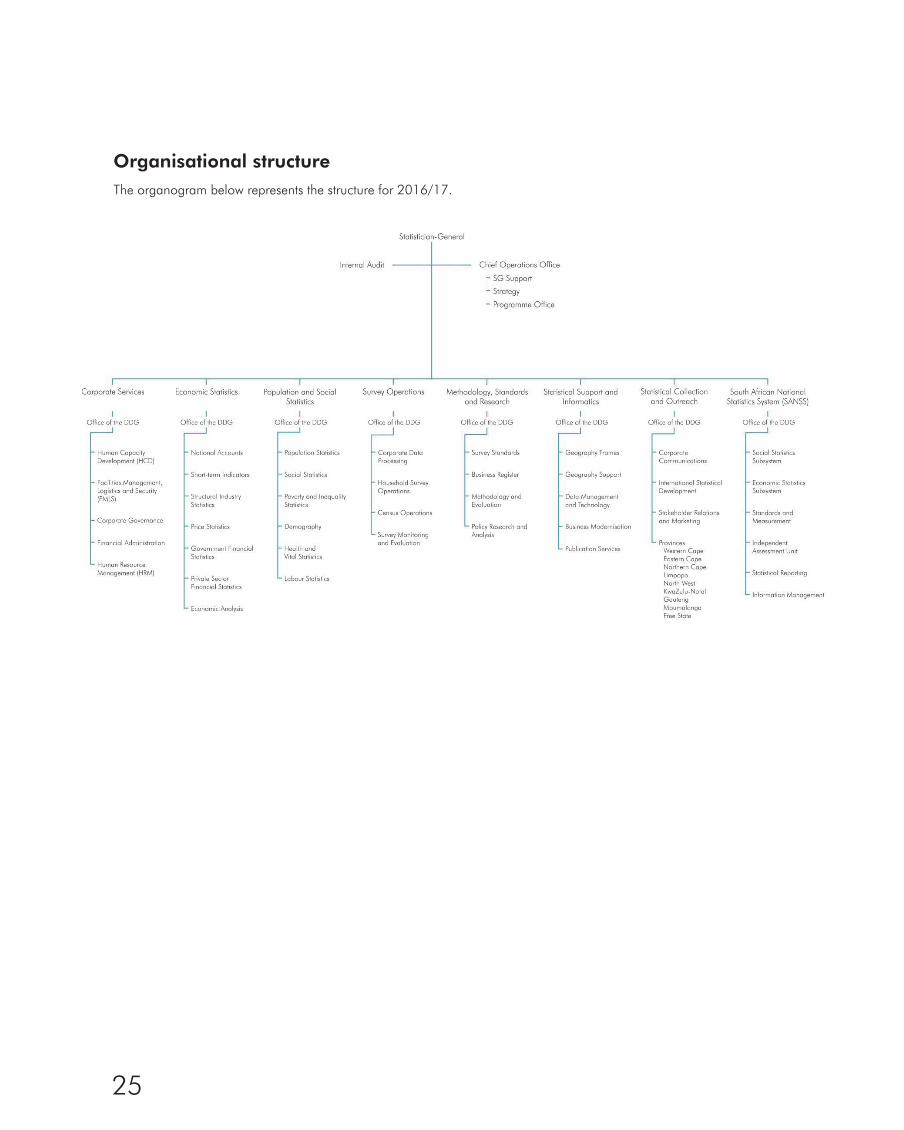
Organisational structure
The organogram below represents the structure for 2016/17.


28
Qualifications: Deputy Directors-General
Programme Post Name Qualification
Programme 1 Deputy Director-General: Corporate
Services Ms Akhtari Henning • BCom (Accounting)
• Articles of Clerkship • Harvard Advanced Management Programme
Programme 1 Acting Chief Operations Officer Ms Annette Myburgh • BCom (Statistics, Mathematics, Mathematical
Economics, Accounting and Econometrics) • BComHons (Econometrics, Statistics and
Mathematical Economics) • MCom (Econometrics) • MBA • Post-graduate Diploma in Education
Programme 1 Acting Deputy Director-General: South
African National Statistical System Ms Yandiswa Mpetsheni • BA (Geography)
• BAHons (Geography) • Higher Education Diploma • MPhil (Social Research Methods) • Advanced Management Programme
Certificate Programme 2 Deputy Director-General: Economic
Statistics Mr Joe de Beer • BComHons (Economics)
• Nepad African Leadership Development (Hons)
Programme 3 Deputy Director-General: Population and
Social Statistics Dr Kefiloe Masiteng • BSc (Botany and Zoology)
• BScHons (Botany) • MSc (Public Health) • DPhil
Programme 4 Deputy Director-General: Methodology,
Standards and Research Ms Nthabiseng Makhatha • BSc (Statistics)
• BScHons (Statistics) • Nepad African Leadership Development
(Hons) • MPhil (Urban and Regional Science)
Programme 5 Deputy Director-General: Statistical
Support and Informatics Mr Ashwell Jenneker • BSc (Mathematics and Mathematical Statistics)
• BScHons (Mathematics) • Higher Education Diploma • Nepad African Leadership Development
(Hons) • MPhil (Urban and Regional science)
Programme 6 Deputy Director-General: Statistical
Collection and Outreach Mr Risenga Maluleke • BSc (Mathematical Statistics)
• MPhil (Urban and Regional Science) • Senior Executive Programme (Hons) • Nepad African Leadership Development
(Hons) • Harvard Advanced Management Programme
Programme 7 Deputy Director-General: Survey
Operations Vacant


Section 2: Performance information

32
1. Auditor-General’s report: Report on the audit of the annual performance report
Refer to paragraphs 10 to 16 of the Auditor-General report on page 141.
2. Overview of departmental performance
The 2016/17 financial year represents the second year of implementing the 2015–2020 Strategic Plan. This document reports on the performance of the organisation against the 813 targets set in the 2016/17 Work Programme which are aligned to the overall strategic direction. Stats SA has achieved 87% of its targets as scheduled in the Work Programme, of which 5% were achieved earlier than scheduled and 4% were achieved later than scheduled. 13% of the targets were not achieved.
2.1 Service delivery environment
During the 2016/17 financial year, Stats SA increased its products and service offerings as follows: The CS 2016 is a large-scale household survey undertaken to collect demographic and socioeconomic data. Stats SA trained more than 11 000 contract staff who were deployed to collect information from more than 1,3 million households throughout the country from 7 March to 22 April 2016. The CS 2016 used the Computer-assisted Personal Interview (CAPI) methodology, where data collection was done digitally via electronic devices, rather than the traditional paper method. The cost structure has been reduced from an average cost of R2 000 per household for a paper-based survey to one that costs approximately R200. This is a tenfold reduction in cost because of the use of the new technology which also ensures improved data quality through built-in controls in the electronic questionnaire. The use of geographic navigation capabilities ensured that fieldworkers enumerated houses that had been selected. In addition, using CAPI greatly reduced the turnaround time to release the results. CS 2016 results were released at the end of June 2016, within two months of completion of data collection, and provided objective, accurate and up-to-date data on the population count, the number of households, and service delivery – all at municipal level. The new methodologies deployed in the CS enabled Stats SA to deliver better, faster and more cost-effectively. In June 2016, the seventy-year practice of the production of Gross Domestic Product (GDP) estimates in two separate institutions ended. The Governor of the Reserve Bank handed the responsibility for the compilation of the expenditure side of the Gross Domestic Product (GDPe) to Stats SA. Historically, Stats SA published GDP production (GDPp) figures only, measuring the supply side of the economy. GDPe is a measure of the demand side of the economy (the amount of money that is used to buy the goods and services that are produced). While the reference period has changed from approximately 60 days to 67 days after the reference quarter, users now have a complete understanding of all elements of the GDP and its growth in one publication. Stats SA, in collaboration with the South African Medical Research Council (SAMRC), conducted the South Africa Demographic and Health Survey (SADHS) in 2016 on behalf of the National Department of Health. The survey aimed to provide a better understanding of the health status of the population in South Africa. Key topics included child health, reproductive health, adult health, and nutrition. The information collected from approximately 15 000 households across the country will assist the Department of Health to plan and prioritise health programmes and service delivery. The survey also provided an opportunity for household members to understand their individual health status. An intensive five-week training programme covered the methodology of the survey, completing the questionnaire, an overview of the CAPI as well as how to use the digital devices (tablets). The new Consumer Price Index (CPI) weights were released in January 2017. The weights are based on the Living Conditions Survey (LCS) conducted during 2014/15. The LCS determines what households spend their money on and CPI uses this information to update the basket of goods and services that will be priced to produce the inflation figure. The first inflation figure calculated from the new weights, for January 2017 was

33
released in February. In addition to new products being introduced into the basket, operational and methodological improvements have been implemented to improve the quality of the data. Although international best practice prescribes a 5-year reweighting period for CPI, Stats SA has published a reweighted CPI within 4 years. 2.2 Service delivery improvement plan
The tables below highlight the achievements against targets in the service delivery improvement plan.
Main services provided and standards
Main service Beneficiaries Batho Pele principle
Current standard of service as in 2015/16
Desired standard of service
Actual achievement against standards
Produce economic, social and population statistics
EXTERNAL CLIENTS • National, provincial and
local government • The public • The media • The private sector • Research and educational
institutions • Parliamentarians • Non-governmental
organisations • Constitutional institutions
and public entities • International bodies and
statistics agencies
Quantity Simple requests 94,8% enquiries handled within 15 minutes
95% 95,6%
Normal requests 98,3% enquiries handled within 24 hours
90% 96,6%
Special requests 95,2% enquiries handled within 5 days
90% 98,0%
Subject matter requests 93,4% enquiries handled within 5 days
90% 100,0%
Quality Compiled 1 quality
statement for GHS. A quality statement for DTS is in progress
2 assessments against SASQAF
Conducted QLFS assessment
Economic surveys: • STI and LSS: 90,4% • GFS: 99,0% • PPI: 99,3% Population and social surveys: • QES: 91,1% • QLFS: 90,1%
Publish surveys with an average response rate of 85%
Economic surveys: • STI and LSS: 90,0% • GFS: 97,0% • PPI: 93,0% Population and social surveys: • QES: 89,2% • QLFS: 92,8%

34
Batho Pele arrangements with stakeholders
Main service Beneficiaries Batho Pele principle
Current standard of service as in 2015/16
Desired standard of service
Actual achievement against standards
Provide statistical information
EXTERNAL CLIENTS • National, provincial and
local government • The public • The media • The private sector • Research and educational
institutions • Parliamentarians • Non-governmental
organisations • Constitutional institutions
and public entities • International bodies and
statistics agencies
Consultation Conducted stakeholder workshops: 37
10 Conducted 26 stakeholder workshops and consultations. Increased workshops as a result of new survey requirements
Conducted annual user satisfaction survey
1 report Conducted the User Satisfaction Survey during February 2017 and the report was signed in March 2017
Access Visitor sessions to website:
955 929 1 000 000 1 625 473 visitor sessions
to the website increased due to CS 2016 results
Publications downloaded from the website: 115 209
150 000 260 456 downloaded publications from the website due to CS 2016 results
Developed Roambi applications for 206 series
5 series 206 series updated
Personal visits in Head Office and provinces: 1 065
1 500 2 023 personal visits in Head Office and provinces
Courtesy 24 rural areas visited in 9
provinces Visit 9 rural areas for dissemination of statistics
Visited 51 municipalities (mainly rural) to train users on SuperCross as a dissemination tool for CS 2016
No training for frontline staff (reception) was reported
Train frontline staff (reception) at national and provincial levels
No training for frontline staff (reception) was reported
Openness and transparency
All statistical releases were published with metadata
Publish statistical releases with metadata
Metadata for all statistical releases is available
Information Statistical products available
on the website were expanded through published articles
Expand statistical products available on the website: - Articles - GDP
expenditure approach
- CS results at municipal level
- IES
Statistical products expanded through: - 61 fact sheets - 15 Newsletters on
statistical products - GDP expenditure
approach published in June 2016
- CS results released at municipal level
- IES/LCS results published in January 2016
- Reweighted CPI published in February 2016

35
Batho Pele arrangements with stakeholders (concluded)
Main service Beneficiaries Batho Pele principle
Current standard of service as in 2015/16
Desired standard of service
Actual achievement against standards
Provide statistical information
EXTERNAL CLIENTS • National, provincial and
local government • The public • The media • The private sector • Research and educational
institutions • Parliamentarians • Non-governmental
organisations • Constitutional institutions
and public entities • International bodies and
statistics agencies
Redress Held 92 training sessions and provided statistical support to 6 SANSS partners (compiled 5 assessments/data inventory reports)
61 (training, support and assessments)
• Conducted 49 training sessions
• Provided statistical support to 12 partners
Value for money
Published 264 statistical releases. Visitor and website sessions were not measured due to system constraints
Increased use of statistical information through official statistical releases published and downloads from the website
Published 269 statistical releases
Time Published 18 (7,0%)
releases later than scheduled due to data quality challenges and internal processes
Statistical information according to the release schedule
3 (1,0%) releases published earlier due to improved methodologies and 8 (3,0%) releases published later than scheduled due to the dependencies and availability of the SG
Human resources
Staff complement of 3 197 (89,5%)
3 250 3 128 (89%)
Costs Total budget:
R2 274 billion (98,0%) R2 323 billion R2 448 billion (96%)
Service delivery information tool
Current information tool Desired information tool Actual achievements Client Relationship Management (CRM) Record all user enquiries 100% of user requests were logged onto the CRM system iPad applications Expand Roambi applications Roambi applications were expanded to include releases on
economic and social statistics
Complaints mechanism
Current/actual complaints mechanism
Desired complaints mechanism Actual achievements
Electronic complaints mechanism Improve complaints mechanism Users can submit a complaint, a request or provide feedback on
the Stats SA website: http://www.statssa.gov.za or send an email to: [email protected]
Manual complaints mechanism Improve complaints mechanism Users can submit a complaint, a request or provide feedback in
writing to any Stats SA office nationally


37
2.3 Organisational environment
Stats SA has a total staff complement of 3 511, of which 3 128 (89%) are filled, comprising 46,5% male and 53,5% female staff members. 87,0% of employees are black African, 6% white, 5% coloured and 2% Indian. Filled SMS posts constitute 59,4% males and 40,6% females. 1,2% of employees constitute staff members with disabilities. The vacancy rate at 31 March 2016 was 11%. Stats SA’s organisational structure consists of eight clusters. An acting Deputy Director-General was appointed for the SANSS cluster, as well as an acting Chief Operations Officer in the Office of the Statistician-General. The DDG post for the Survey Operations cluster is currently vacant. In March 2014, Stats SA signed a Public Private Partnership (PPP) Agreement with Dipalopalo Concessions for the construction and facilities management of its new Head Office premises. The construction of the building commenced in May 2014, and Stats SA relocated to its new premises on 29 August 2016. ISIbalo House was officially opened by Minister Jeff Radebe on 12 December 2016.
2.4 Key policy developments and legislative changes
The activities of Stats SA are regulated by the Statistics Act (Act No. 6 of 1999). Amendments to the Act are necessitated by the department’s strategic intent to lead the development and coordination of the national statistical system in South Africa. The department is in the process of revising the statistics legislation to drive statistical reform – particularly statistical coordination. Coordination between statistical agencies is essential for consistency and efficiency in the statistical system. The planned legislative reform will address administrative records for improved planning and evaluation; creating a state-wide service of statisticians; facilitating the implementation of the Spatial Data Infrastructure Act as an integral part of planning; and implementing statistical reforms through data revolution. Other amendments to the Statistics Act include ensuring that there is administrative and legislative consistency in accountability, and changing the execution of a population census from a five-yearly to a ten-yearly cycle. Stats SA has concluded its stakeholder consultation and will commence with crafting revisions to the Act in 2017/18.


42
Key achievements against strategic outcomes
3.1.1 Informed nation
Stats SA's primary purpose is to publish statistics that inform socioeconomic planning, monitoring and decision-making by providing accurate, relevant and timely economic, population and social statistics through the application of internationally recognised practices by publishing monthly, quarterly, annual and periodic statistical information.
Expand the statistical information base: Stats SA informed socioeconomic planning, monitoring and decision-making by providing accurate, relevant and timely economic and population and social statistics. Releases published covered national accounts estimates, business cycle indicators, structural industry statistics, private sector and government financial statistics, statistics on the labour market, agriculture, life circumstances, service delivery, poverty and inequality, population dynamics and safety and security. A total of 269 releases were published. A rebased and reweighted CPI was published in February 2017. In addition to new products being introduced into the basket, operational and methodological improvements have been implemented to improve the quality of the data. Although international best practice prescribes a 5-year reweighting period for CPI, Stats SA has published a reweighted CPI within 4 years. Research in the Economic Statistics Branch focused on improving short-term indicators through the implementation of weights for the manufacturing and mining indices, base year changes for electricity and building statistics, and seasonal adjustment for tourist accommodation and food and beverages. Improvement initiatives in the structural industry statistics area included discussion documents on forestry and fishing, and private sector financial statistics researched the feasibility of a capital expenditure survey. National Accounts research focused on improving data sources, and expanding the use of national accounts through the development of a satellite account. The Population and Social Statistics Branch focused on improving transport, household service delivery and crime statistics. Initiatives to improve health and vital statistics included research on alternative sources of data for mortality and the National Population Register. The expanding of labour market statistics was achieved through a Survey of the Activities of Young People (SAYP) and thematic reports on improving demographic statistics included demographic indicators and adolescent fertility. The key findings for the report Quest for Nodal Development: Evidence from Census 2001 and Census 2011 were published in May 2016. The report comes as a need to restructure South Africa economically, socially and spatially in order to address the imbalances and inequalities that were caused by the apartheid system, specifically in rural and urban areas. The report was two-fold in that it provided a detailed analysis of the state of citizens living in nodes over a period of ten years (2001–2011) and a comparison of the development of nodes relative to the areas that were not selected as nodes in the same time frame. Develop new and innovative statistical products and services: The strategic intent behind integrative research and analysis is to develop new and innovative statistical products to respond to user demand. To this end, research was conducted on specific aspects of selected municipalities, government’s socioeconomic planning, spatial analysis and the use of external administrative data sources for poverty and inequality statistics. Revolutionise data systems: Stats SA co-hosted the first ever United Nations World Data Forum (UNWDF) which was held in Cape Town in January 2017. Experts on global data met to find ways to strike a balance between public good and privacy. The achievements of the forum included building a broad consensus on how to harness the power of data for sustainable development, and boost the collaboration and resources needed to carry the work forward. The singular focus was an attempt towards achieving standard measurement tools to monitor the Sustainable Development Goals (SDGs).

43
3.1.2 Trusted statistics
Statistics are essential for sustainable economic, environmental and social development. Public trust in official statistics is anchored in professional independence and impartiality of statisticians, their use of scientific and transparent methods and equal access to official statistical information for all. Institutionalise quality management: Outputs related to the institutionalisation of quality management included a proposal on a quality management system and evaluation reports on CS 2016, SADHS, DTS and QLFS. Research to improve monitoring and evaluation was done through conducting verification of out-of-scope cases for surveys. Innovate the statistics value chain for better efficiency: Innovation of the statistics value chain commenced with conducting research to improve methodological systems and processes. Other initiatives included the implementation of small-area estimations, a quality assessment of the master sample, the design of a methodologist capacity building programme and seasonal adjustment methodological notes for short-term indicator surveys. Improvements to household surveys included the implementation of a quality assurance tool, the development of a data collection strategy and reports on processing CS 2016 data using new technologies and collaboration and partnering in the design of a digital data collection system. Data collection for household surveys is a core activity of provincial offices. Household surveys concluded included the QLFS with an average response rate of 92,4%, the GHS with an average response rate of 92,1%, the DTS with an average response rate of 82,5% and the VOCS with an average response rate of 92,9%. Adopt international statistical standards and classifications: The adoption of international statistical standards and classifications to improve comparability, methodological soundness and accuracy of statistical information continued with the development of standards on data confidentiality, measuring and documenting sampling errors, statistical data collection and maintenance of the business frame, and reviewing of standards on measuring and reporting response rates and master sample maintenance. Initiatives to improve standards development included the implementation of a standards awareness programme for provinces, the compilation of a standards registry, and the identification of priority standards in SANSS. At provincial level, improvement initiatives included the implementation of quality improvements to surveys and the development of a quality management framework. Increase stakeholder focus, communication and marketing: Increasing stakeholder engagement and use of statistics to better know and understand the needs of stakeholder groups and creating public awareness to raise the profile of statistics remained a priority for Stats SA in 2016/17. Initiatives to improve internal and external communication included extensive communication campaigns for the CS 2016 and the relocation project, the development of user-friendly electronic products (infographics, informational and animated videos and audio clips), and improvements to internal communication channels and tools (lift screens, news flashes and pause area screens). A media engagement workshop was held at ISIbalo House in March 2017 to equip community media journalists with the knowledge and tools to report statistical information more accurately to the communities they serve. The workshop, which is the second in a series of engagements intended to encourage the media to make use of Stats SA data, was attended by reporters from grassroots media outlets, Caxton Community News, the Midrand Reporter and Tshwane Capital. At provincial level, a total of 26 workshops were conducted with specific focus on CS 2016 launches and dissemination as well as SDG consultations. Improvement initiatives included the implementation of communications, advocacy and publicity plans. Designate statistics as official: Initiatives to improve independent quality assessments included the compilation of practice guidelines for independent assessments and a SASQAF roll-out strategy and plan. One assessment was conducted for the Quarterly Labour Force Survey.

44
3.1.3 Partners in statistics
Coordination in statistical development and strengthening partnerships in statistical systems cannot be overemphasised. The United Nations Fundamental Principles of Official Statistics provides, inter alia, that coordination among statistical agencies within countries is essential to achieve consistency and efficiency in the statistical system. In South Africa, statistical coordination among organs of state is provided for in section 14 of the Statistics Act (Act No. 6 of 1999). Strengthen collaboration to build statistical sampling frames: Stats SA depends on sound sampling frames to ensure the production of accurate and reliable statistical information. The provision of an updated spatial information frame for the collection of household statistics was done through quality assurance of the Spatial Information Frame in 64 municipalities and demarcation of enumerator areas in 2 provinces. A complete dwelling frame was published at metro, city, and regional service centre levels. Different geospatial technologies were used during CS 2016 to develop applications that support specific CS work flow activities. These include modules for updating the dwelling frame, creating of fieldworker units using the latest satellite imagery, spatially enabling the human resource database to applicants places of residence thereby allowing targeted recruitment, providing real time dashboard reports on fieldworker progress and a navigation application which optimized the efficiency of field collection by listing the work assignments in terms of shortest distance to the sampled points. At provincial level, the verifying and updating of the spatial frame was a priority activity, and over 50% of the spatial frame was updated. Partnerships on the Spatial Information Frame were established in three provinces. Activities to ensure the provision of an updated sample frame for the collection of economic statistics included the completion of 99% of large business surveys, the compiling of reports on quality indicators, and providing quarterly snapshots and frames to the survey areas. Initiatives for the improvement of the sampling frame included reports on register-based statistics and revised business rules, and a review of the BSF quality management framework. Lead the development and coordination of the national statistical system in South Africa: The coordination process for the production of statistics for the economic and social statistics subsystems has commenced. A clearance protocol was developed and SASQAF Lite was applied to two data sources. The facilitating of information-sharing amongst SANSS partners is underway with the signing of two agreements with the SAPS and the Department of Social Development, the development of a blueprint for a SANSS-wide data repository, and expanding the use of the E-data transfer tool and a dissemination tool amongst SANSS members. National reporting requirements were met with the compilation of an SDG report. Technical support was provided to six departments. A handbook on diagnostic assessments was published and three diagnostic assessments were conducted. At provincial level, statistical support was provided to 12 partners and a data inventory was conducted in one department. Provincial statistical coordination structures were established in four provinces and the statistical capability and infrastructure of seven departments were assessed. Provincial statistical coordination structures were established in four departments and the mining of data sources was done in three provinces. The Eastern Cape Provincial Cabinet and stakeholders from business and civil society gathered at the East London Industrial Development Zone (ELIDZ) on 3 March for the official release of the ELIDZ census results conducted by Stats SA during the 2015/16 financial year. In 2013, ELIDZ had approached Stats SA to conduct a ‘census’ on financial information, ratio of exports and imports as well as level of employment at ELIDZ. Since then, ELIDZ has worked closely with Stats SA to monitor economic growth of the industrial zone.

45
Strengthen international cooperation and participation in statistics: Initiatives to improve international collaboration and statistical development in Africa included the compilation of an international statistical best practice benchmarking framework, guidelines for bilateral and multilateral collaboration, and a report on the 12th ASSD. An African peer support framework, and reports on establishing African centres of operational excellence and support in the evaluation of the Civil Registration and Vital Statistics (CRVS) programme were compiled. Stats SA, in collaboration with the United Nations (UN) Statistics Division and UN Women, undertook a joint venture to conduct the Evidence and Data on Gender Equality pilot project (EDGE) in KwaZulu-Natal (KZN). South Africa is one of six pilot countries that have been selected to test and refine collection of data that shed light on a suite of variables from a gender perspective. Data collection for the EDGE project was done through the Computer-assisted Personal Interview (CAPI) method. The EDGE pilot project focused mainly on asset ownership, employment and demographics. Training for the EDGE project commenced in July and data collection was conducted between August and September 2016. The sample focused on approximately 2 000 households covering all settlement types.
During 2016/17, Stats SA hosted international delegations from various countries: • Statistics Botswana (SB) in April 2016. The purpose of the study tour was to share experiences on areas
concerning communication, editing, graphic design, documentation and dissemination processes. • Lesotho Bureau of Statistics (LBS) in July 2016. The purpose of the study tour was to share experiences and
learn new techniques of conducting a Post-enumeration Survey (PES) using a computer-assisted program. • Namibia Statistics Agency (NSA) in July 2016. Assistance was requested with the development of their new 5
year strategy. The capacity building workshop focused on the strategic management model. The working relationship between the two statistical offices culminated in an exchange of lessons and experiences and drafting of memoranda of understanding on pertinent areas of collaboration.
• Kenya National Bureau of Statistics (KNBS) in June 2016. The purpose of the visit was to benchmark South
Africa against the Data Quality and Assessment Framework (DQAF) after the delegation identified South Africa as one of the countries to implement the International Monetary Fund (IMF) DQA. Strong ties exist between Stats SA and the KNBS, particularly in the area of National Accounts, after having experts from South Africa leading the recent peer review carried out in Kenya.
• The Federal Republic of Somalia and Statistics Sweden in October 2016. The purpose of the visit was to
discuss a Memorandum of Understanding (MoU) on the role of Stats SA in the cooperation project between Somalia Statistics Authorities and Statistics Sweden and to outline their need for technical statistical support and training from Stats SA, specifically on Economic Statistics and preparation for their first census which will be conducted between 2018 and 2020.
• Statistics Botswana in October 2016. The objective of the visit was to benchmark Corporate Services
processes and systems in the areas of Human Resources Management, Finance, Procurement and Internal Audit.
• Shanghai Municipal Bureau of Statistics (SMBS) in November 2016. The delegation benchmarked processes
and systems in statistical indicator frameworks, national accounts, legislative reforms, measurements of municipalities’ performances and sample size.
• Mozambique National Institute of Statistics (INE) in February 2017. The purpose of the visit was to gather
experience and knowledge on how to produce relevant statistics at small area level, how to strengthen their National Statistical System and to obtain information about Stats SA’s training offerings.

46
• Namibia Statistics Agency (NSA) in February 2017. The purpose of the visit was to gain knowledge about the systems of recording and coding causes of death and the implementation of ICD-10 coding in general. Stats SA has a memorandum of understanding with the NSA to collaborate and advance common goals in the areas of skills and capacity development, statistical production, coordination of national statistics systems, strategy formulation and implementation, enhancing the profession of statistics and exchange of experts. A team of two from Stats SA went to Namibia to conduct ICD-10 training to ensure a seamless migration and assist with enhancing the production of vital statistics in the country.
• Somalia Statistics Agency in March 2017. The visit stems from previous visits made to Stats SA to collaborate
on statistical matters and on statistical development assistance to be given to Somalia as a country emerging from conflict, and one of the countries which could not participate in the 2010 Round of Population and Housing Censuses (RPHC). The Consumer Price Index (CPI) and Gross Domestic Product (GDP) were identified as priority training areas. The delegation is the first of four delegations to be hosted between March and July for on-the-job training on CPI and GDP.
It was an auspicious moment as participants from different parts of Africa and beyond converged in Tunis, Tunisia in November 2016 for the 12th session of the Africa Symposia on Statistical Development (ASSD). The first of a five-year series that will focus on economic statistics, particularly national accounts, the 12th ASSD was themed “Strengthening basic economic statistics for the compilation of national accounts in Africa”. The theme draws from a need to address the challenge to provide quality statistics to planners and policymakers. The Government of Tunisia, through the Institute of National Statistics, had the privilege of hosting the 12th edition of the ASSD at this moment of transition from Civil Registration and Vital Statistics (CRVS) to National Accounts, which will continue until 2020. The national accounts phase happens parallel to preparations for the 2020 Round of Population and Housing Censuses, which should see an increased use of Information and Communication Technology. Stats SA hosted an enthusiastic group of delegates from different statistical institutions, universities and representatives for persons with disabilities from around the world for the 16th annual meeting of the Washington Group on Disability Statistics in December 2016. This comes after South Africa celebrated National Disability Rights Awareness Month and International Day of Persons with Disabilities between 3 November and 3 December 2016. The Washington Group on Disability Statistics (WG) is a UN City Group established under the United Nations Statistical Commission to address the urgent need for cross-nationally comparable population-based measures of disability. Stats SA hosted Dr Tamer Tandogan who was commissioned by the African Development Bank in March 2017 to undertake a baseline study on industrial statistics compilation capacities in the tripartite member/partner states, and to support the formulation of industrial statistics strategies, roadmaps and capacity building programmes. South Africa is one of the 16 countries selected to be part of the study.
3.1.4 A capable organisation
A capable organisation encourages better decision-making and the efficient use of resources, and strengthens accountability for the stewardship of those resources. It is characterised by robust scrutiny, which provides important pressures for improving organisational performance and tackling corruption. A capable organisation improves management, which in turn leads to more effective implementation of the chosen interventions, better service delivery, and, ultimately, better outcomes. Drive legislative reform: Stats SA commenced with the consultation process on legislative changes in 2015/16 with representatives from civil society organisations, organs of state, research institutions, academic institutions and members of the Statistics Council, among others. Key areas that will drive the legislative reform process include implementing statistical geography, strengthening the coordination mechanism and compliance, addressing the data revolution, creating a state-wide statistical service, and institutional arrangements and protocols to support coordination. A series of consultations on the proposed changes took place across the country with specific national government departments and special interest groups. Provincial stakeholders were invited to give their input on suggested changes to the Statistics Act, which will enable the organisation to

47
streamline its work in coordinating statistical production in the country. Stats SA also visited the national statistics agencies in Mexico, France, England and the Philippines to benchmark against their statistical legislations. Enhance corporate governance and administration: Stats SA received a clean audit award in respect of the 2015/16 financial year, for the third consecutive year from the Auditor-General (AGSA). A clean audit award recognises government entities that submitted annual financial statements, which amongst other factors, were free from material misstatements. Stats SA and the Statistician-General, Dr Pali Lehohla, were among the finalists at the National Batho Pele Excellence Awards, which are held annually to recognise excellence in the public service. The categories included Public Service Lifetime Achiever, Best Frontline Public Service Employee of the Year, Best Director-General of the Year, Best Functioning National Department of the Year, and Best Functioning Provincial Department of the Year. The SG collected the runner-up award in the Best Functioning National Department of the Year. Strategic and operational planning and reporting activities were conducted in line with legislative requirements. The strategic direction was communicated to staff and the management information repository was enhanced. Internal audits were conducted in line with the risk management register. Governance, legal, risk management, fraud prevention, investigations and compliance services were provided. Become the employer of choice: Stats SA has an HIV and AIDS Programme in place with the objective of investing resources and effort in information, awareness and education campaigns that are aimed at combating the spread of HIV and TB in order to reduce the negative impact of HIV and AIDS. The AIDS programme has been expanded to schools with the intention of creating awareness among the youth on issues related to HIV, sexuality, and peer group pressure. The organisation has developed an Employee Health and Wellness Programme (EHW) and has recently approved the Employee Health and Wellness Policy. The purpose of this policy is to provide programmes and interventions that will enhance the wellness of employees in order to improve the work morale, job satisfaction, staff retention, motivation and the overall performance of staff members, and is applicable to all staff members regardless of their contract of employment. Stats SA’s relocation to new premises has created the opportunity to expand its wellness programme. Physical activities that include aerobics, golf, netball, volleyball, soccer, athletics and cycling are part of this programme. Invest in ICT to align to organisational growth: The relocation of Stats SA to its new premises required the upgrading of IT infrastructure and the challenges of consolidating three separate data centres into one, and ensuring minimal disruption to work during the relocation period. IT services were connected and switched on few days before staff moved in. On opening day, staff immediately had access to their end-user devices (personal computers, laptops, printers, and telephones) and the network.
3.1.5 Statistical leadership
The success or failure of Stats SA and the national statistics system is largely dependent on the effectiveness of its leadership. Leadership has been the single most critical ingredient and agent of change in Statistics South Africa, and its enhancement can guarantee continuous improvement and managed succession in statistical development. Statistical leadership and management: One of Stats SA’s priorities is to ensure that all employees are equipped with the right skills and knowledge to meet the long-term goals of the organisation. Stats SA celebrated the achievements of eleven CRUISE (Centre for Regional and Urban Innovation Statistical Exploration) graduates who were awarded Master’s Degrees in MPhil: Urban and Regional Science by the University of Stellenbosch at a graduation ceremony held on 15 March 2017. CRUISE was founded in 2009 in a collaboration between Statistics South Africa and the Department of Geography and Environmental Studies at the University of Stellenbosch.

48
Statistical capability and competence: The 5th ISIbalo Conference of African Young Statisticians was held in June 2016. As young statisticians from seventeen African countries gathered in Pretoria, the collective challenge put to them was to lead Africa in an emerging data revolution, and to embrace transformation and innovation in data platforms to produce better data for better development outcomes, as statistics rapidly becomes a currency for the improvement of policy planning and decision-making by policymakers and politicians. The KZN Provincial Office hosted a 3rd Provincial ISIbalo Symposium in October 2016. The Symposium is a Stats SA initiative aimed at bringing knowledge specialists and experts together to discuss issues of provincial importance and suggest solutions. It is a partnership event between Stats SA and the KZN Premier’s Office. The thematic focus of the papers for the 2016 ISIbalo Symposium was ‘Promoting the education agenda towards eradicating poverty and unemployment in KwaZulu-Natal’. Sixteen young statisticians were selected to participate in many dry runs, building up to the 28th International Population Conference in Cape Town in October 2017. The symposia established a platform to create awareness about the International Population Conference (IPC) 2017 which will be hosted in Cape Town from 29 October to 4 November 2017. Stats SA hosted Grade 12 Economics learners from Ruabohlale Secondary School in Soshanguve for a one-day career development workshop in March 2017. The workshop was initiated to address the low output of statistics qualifications produced by universities in South Africa. Learners displayed interest as they were taken through a series of presentations that included the calculations of economics statistics such as the GDP and the CPI. Learners were also given an opportunity to explore career paths within economics statistics that they could venture into, as well as the skills and qualification requirements. A total of 272 bursaries were awarded to employees, learners at local universities and foreign study students, and 1 390 staff were trained during the year. 49 training sessions were conducted in the provinces consisting of Maths4Stats, SuperCross, and SASQAF training. Build a united and diverse organisation: Stats SA is an organisation where all employees are valued and have an equal chance to succeed, thereby increasing the organisational capability to achieve the mandate. In striving to become an employer of choice, Stats SA is committed to building a united and diverse workforce. Diversity management is about recognising, celebrating and utilising our differences and similarities for the benefit of Stats SA, our stakeholders and our workforce, based on the core values of Stats SA. A diversity management and values programme was developed to integrate and guide diversity management initiatives based on the set of organisational values defined, as well as the development of appropriate measures to document the achievement of set goals. Personal empowerment and organisational growth is the outcome of this process.


52
4. Performance information by programme
4.1 Programme 1: Administration
Programme 1 consists of three components, namely the Office of the Statistician-General, the Corporate Services and the South African National Statistics System (SANSS) clusters. Purpose: Provide strategic leadership, management and support services to the department, and capacity building. Drive statistical coordination among organs of state. Objectives: • Provide direction and leadership through driving strategic and operational planning and monitoring
processes, as well as reporting monthly, quarterly and annually on organisational performance. • Lead the development and coordination of the statistical production system among organs of state in line
with the purpose of official statistics and statistical principles on an ongoing basis. • Provide corporate support services on an ongoing basis by:
o improving human resource and financial management systems and processes;
o creating a conducive working environment;
o enhancing qualifications, skills and capabilities; and
o promoting good governance.
Linking programmes with strategic outcomes and objectives:
53
4.1.1 Programme 1: Administration (Office of the Statistician-General)
Programme Management for the Office of the Statistician-General provides strategic direction and leadership to the organisation on statistical development. Key activities in 2016/17 included administering the Statistics Act, setting and monitoring the strategic direction of the organisation, leading and managing the implementation of the Work Programme supported by the Executive Committee, and participating in international statistical development activities.
Overall programme performance
Programme 1 (Office of the SG) has achieved 86% of its targets as scheduled in the Work Programme and 14% were not achieved. This programme’s performance has contributed to providing strategic direction to the organisation, planning and monitoring its performance, leading the development and coordination of the national statistics system and to enhancing corporate governance and administration. Achievements and constraints are reported in the subprogrammes below.
Performance per subprogramme:
a) Programme Office oversees operational planning and reporting in the organisation, provides coordinated and integrated management information, and builds project management capability. Key outputs for 2016/17 included support to eight clusters in operational planning and reporting, empowering of 7 projects in accordance with Stats SA's project management framework, monthly progress reports on the operational performance of the organisation to Exco and Senior Management Staff (SMS) and a report on enhancing the management information repository.
b) Strategy is responsible for driving and facilitating organisational strategy development, strategic planning,
organisational strategic reporting and monitoring processes, and the change agenda. Key outputs for 2016/17 included the SDIP annual report, Stats SA’s quarterly and annual reports, the 2017/18 Work Programme, the development of an evaluation framework and a report on the strategy in action programme. Change management outputs included the development of a diversity and values programmes and change management support to the relocation project. An assessment report on talent management was not compiled due to human resource constraints.
c) Internal Audit provides an independent audit service to the department and promotes good governance
through assessing risk management, internal control systems and governance processes. Key outputs for 2016/17 included 47 audit reports, the development of quality assurance and a combined assurance framework, and a report on conducting the CS 2016 audit. A report on external quality assurance was reprioritised for 2017/18.
d) The South African National Statistics System branch coordinates the statistical production system
among organs of state. Key outputs for 2016/17 included a SASQAF quality statement; a practice guideline and handbook for independent quality assessments; reports on the implementation of a SASQAF roll-out strategy and plan; the implementation of a clearance protocol; and the application of SASQAF Lite on data from two departments. Two service level agreements on data sharing were signed and three reports on improving information management in the SANSS were compiled. A report on SDG indicators, a handbook on diagnostic assessments, six reports on technical support provided and three reports on diagnostic assessments were compiled. In addition, the SANSS Branch was responsible for organising of the first ever UN World Data Forum hosted by South Africa in Cape Town in January 2017. A national strategy for the development of statistics was not completed. Consultations around the amendments of the Statistics Act, 1999 is ongoing. The legislative reform will be the enabling vehicle necessary for the development of the National Statistical Development Strategy (NSDS) amongst organs of state. Strategies and plans for the economic and social statistics subsystems will be developed once the NSDS has been finalised. Documents for the legislative reform process were not compiled as scheduled. Consultations with international statistical agencies have commenced and work will continue in 2017/18.

54
4.1.2 Programme 1: Administration (Corporate Services)
Corporate Services provides human resources, facilities management and capacity building services, and promotes good governance. Programme Management for Corporate Services provides strategic direction and leadership. Key activities in 2016/17 included leading strategic initiatives such as the New Building Project and monitoring the implementation of the corporate services strategy.
Overall cluster performance
The programme achieved 62% of its targets as scheduled in the Work Programme, of which 6% were achieved earlier than scheduled and 2% were achieved later than scheduled. 38% of targets were not achieved. A key project that was delivered in 2016/17 was the relocation of Stats SA to its new premises. This programme’s performance has contributed to enhancing corporate governance and administration and investing in a sustainable and responsive statistical infrastructure.
Performance per subprogramme:
a) Financial Administration provides financial, asset and procurement support services to the department. Key outputs for 2016/17 included the submission of the departmental MTEF, ENE, AENE and financial statements to the National Treasury, support to the CS 2016 through the timeous payment of 11 502 fieldworkers, the implementation of an asset disposal strategy as the department moved to its new headquarters in Salvokop, and the procurement of 78% of goods and services from BEE institutions.
Support was provided to the United Nations World Data Forum (UNWDF) without the appointment of the Professional Conference Organisers as compared to previously hosted international conferences, which resulted in significant savings for the department (the CTICC conference venue was estimated at R8 million based on the prevailing prices; however, through negotiations the cost of the conference was R6,122 million). Additional savings were secured with hotel bookings where special rates were negotiated for delegates attending the conferences.
99,9% of valid invoices received were paid within 30 days of receipt. Training and assistance was provided to Statistics Namibia, the Government Communication Information Services, and the Departments of Science and Technology and Arts and Culture in the roll-out of the Invoice Tracking System (ITS) that was developed by Stats SA. The system was further demonstrated to over 30 government departments at sessions facilitated by National Treasury.
An audit progress monitoring system was not developed due to stakeholder consultation.
b) Human Resource Management and Development provides human resource management services to the organisation and facilitates the development and implementation of a people development programme to enhance the skills and competencies of staff. Key outputs for 2016/17 included the resolving of 83% of grievance cases within 30 days and 77% of disciplinary cases within 60 days, the implementation of e-recruitment for the appointment of contract staff, the placement of staff affected by the relocation of Stats SA and the revision of standard operating procedures. 75% of vacant posts were filled within 12 months of becoming vacant due to budget cuts. 42% of performance contracts and 39% of performance evaluations were finalised by the end of June 2016. The finalisation of plans and evaluations were delayed due to the preparation for the move to the new building. As at the end of March 2017, 94% of performance contracts and 99,5% of performance evaluations were finalised.
An HRD implementation plan and Workplace Skills Plan were submitted to DPSA and PSETA. Bursaries were awarded to employees, learners at local universities and foreign study students. 1 390 staff members were trained during the year, 11 staff graduated from the CRUISE course and a statistical leadership and

55
management programme was developed. A scarce skills matrix and strategy is in the process of being developed. The document will only be finalised in 2018/19 due to the organisational transition from PAPI to CAPI which will affect the strategy. Documents on generic career pathways and the pool of talent were not compiled due to human resource constraints. CRUISE participation was not expanded to municipalities. The target will be discontinued due to human resource constraints. The appointment of interns was delayed due to internal processes. It will be finalised in Q1 of 2017/18. The assessment of the course content and curriculum of tertiary partners, the enrolment of students in the 1-year certificate course in official statistics and initiatives to enhance capacity building in Stats SA did not commence due to human resource constraints.
c) Facilities Management, Logistics and Security is responsible for providing a secure and healthy working
environment for staff, and an effective and efficient logistical service that is timely and cost-effective to support operations in the organisation. Key outputs for 2016/17 included relocating Stats SA to new premises, reports on Security and OHSA compliance, records and registry services implemented, the post-relocation programme roll-out and logistical services provided to CS 2016. Stats SA was declared a National Key Point (NKP) by the SAPS. Guidelines for the implementation of security classification was sent to the State Security Agency.
d) Corporate Governance is responsible for the provision of efficient risk management, an efficient process
for the development, review and implementation of organisational policies, and legal advisory services to the department. In addition, the ethics function resides within Corporate Governance with the responsibility for implementing the relevant sections of the Public Service Regulations, 2016. Key outputs for 2016/17 included quarterly corporate governance reports tabled at the various governance structures detailing the risk management, fraud and compliance investigations, governance, internal policies and legal advisory activities undertaken. Improvement initiatives included reviews of the compliance plan and governance programme and a report on strengthening the risk identification and assessment process in Stats SA.
Strategy to overcome areas of underperformance
• Finalise the Draft Amendment Bill to commence with the NSDS;
• Fast-track the filling of the post of Chief Director: Human Resource Management.
Changes to planned targets: Not applicable Linking performance with budgets
Summary of payments by subprogramme: Administration
2016/2017 2015/2016
Subprogramme
Final appropriation
R’000
Actual expenditure
R’000
(Over)/under-expenditure
R’000
Final appropriation
R’000
Actual expenditure
R’000
(Over)/under-expenditure
R’000 Departmental Management 35 230 35 230 - 38 687 38 687 - Corporate Services 165 844 163 829 2 015 166 383 165 673 710 Financial Administration 76 052 74 369 1 683 68 672 68 672 - Internal Audit 12 847 12 847 - 11 103 11 103 - National Statistics System 29 812 29 812 - 21 691 21 691 - Office Accommodation 387 862 355 101 32 761 543 304 494 298 49 006 707 647 671 188 36 459 849 840 800 124 49 716

56
The programme has spent R671,188 million of the allocated funds. Of the total expenditure to date, an amount of R228,720 million was spent on compensation of employees, whilst an amount of R259,573 million was spent on goods and services. The amount spent on goods and services includes an amount of R127,963 million that was spent on operating leases and R58,612 million spent on property payments. An amount of R155,911 million was spent on building and other fixed structures relating to the new building. All of the aforementioned are the main cost drivers for the programme. The programme spent 94,8% of its allocated budget.


58
4.2 Programme 2: Economic Statistics
Purpose: Produce economic statistics to inform evidence-based economic development and transformation in line with internationally recognised practices. Objectives and measures: Expand the economic statistics information base by increasing the depth, breadth and geographic spread for evidence-based planning, monitoring and decision-making for use by both the public and private sectors by: • publishing monthly, quarterly, annual and periodic statistical releases on industry, trade and financial
statistics in the private and public sectors; • publishing monthly statistical releases on the consumer price and producer price indices; • publishing quarterly and annual GDP estimates providing information on 10 industries of the economy; • developing new and innovative products to respond to user demands over the medium term; and • improving the measurement of economic indicators through the application of internationally recognised
standards and practices over the medium term.
Linking programmes with strategic outcomes and objectives:
Programme Management for Economic Statistics provides strategic direction and leadership in this programme. Key activities in 2016/17 included signing-off of statistical releases and reports, the updating and monitoring of the implementation of the economic statistics strategy, and maintaining relations with key partners in the National Statistics System.
Overall cluster performance
The programme has achieved 98% of its annual targets as scheduled in the Work Programme, of which 2% were achieved earlier than scheduled. 2% of targets were not achieved. Key outputs in 2016/17 included monthly, quarterly and annual releases in line with the international Special Data Dissemination Standards. This programme informed economic planning, monitoring and decision-making by providing accurate, relevant and timely statistical information on the level of economic activity in relation to the primary, secondary and tertiary sectors of the economy, financial information on private sector businesses and government, and information on sustainable resource use and management.

59
Performance per subprogramme:
a) Short-term Indicators provides information on turnover and volumes in various industries in the economy through the publication of monthly, quarterly and annual statistical releases. Key outputs for 2016/17 included two annual releases on Selected building plans passed and completed, and Buildings completed per annum, quarterly releases on Manufacturing: utilisation of production capacity by large enterprises, and 12 monthly releases consisting of Mining: production and sales, Manufacturing: production and sales, Generation and consumption of electricity, Building plans passed and completed, Retail trade sales, Motor trade sales, Wholesale trade sales, Food and beverages, Tourist accommodation, Transport, Liquidations and insolvencies, and Civil cases for debt. Initiatives to improve industry statistics included the implementation of weights for the manufacturing and mining indices, base year changes for electricity and building statistics, seasonal adjustment for tourist accommodation and food and beverages, and weights for deflators for retail statistics.
b) Structural Industry Statistics provides periodic information on the income and expenditure structure of industries by publishing periodic statistical information. Key outputs for 2016/17 included an annual report on the agricultural industry and three periodic releases on the mining, manufacturing and construction industries. Research initiatives included discussion documents on forestry and fisheries.
c) Government Finance Statistics tracks government revenue and spending and the financial performance
of government. Key outputs for 2016/17 included quarterly releases on financial statistics of municipalities, nine annual releases on financial and non-financial statistics of municipalities and other government spending, and three reports on improving government financial statistics.
d) Private Sector Financial Statistics tracks the financial performance of private sector organisations. Key
outputs for 2016/17 included five releases on private sector income, expenditure and selected balance sheet indicators and two reports on improving private sector financial statistics.
e) National Accounts produces GDP data and other integrative statistical products. Key outputs for 2016/17
included quarterly GDP estimates, a report on Supply and use tables and a research report on improving national accounts statistics.
f) Economic Analysis integrates and analyses information from various internal and external data sources.
Key outputs for 2016/17 included quarterly flash estimates of GDP, two integrative economic reports, two research reports on improving economic statistics, the development of a Growth Accounting Framework System and the compilation of an EEA compendium. A discussion document on the non-profit sector was compiled. The document was not published as a report as scheduled due to data quality and accessibility challenges. Position papers on a research and development satellite account and integrated economic accounts were compiled. The documents were not published as discussion documents as scheduled since the exercise that commenced in 2016/17 was a feasibility study to establish the possibility of publishing discussion documents. The study showed gaps in the required data sources and a decision was taken to publish the research results as internal position papers.
g) Price Statistics provides information on the level of inflation by producing the consumer price index and various producer price indices. Key outputs for 2016/17 included monthly CPI and PPI and a rebased and reweighted CPI. Two reports on improving PPI were not compiled as scheduled due to human resource constraints and data accessibility challenges.

60
Strategy to overcome areas of underperformance: Not applicable Changes to planned targets: Not applicable Linking performance with budgets
Summary of payments by subprogramme: Economic Statistics
2016/2017 2015/2016
Subprogramme
Final appropriation
R’000
Actual expenditure
R’000
(Over)/under-expenditure
R’000
Final appropriation
R’000
Actual expenditure
R’000
(Over)/under-expenditure
R’000 Programme Management for
Economic Statistics 4 594 4 594 - 3 941 3 941 - Short-term Indicators 30 861 30 861 - 28 908 28 908 - Structural Industry Statistics 40 823 40 823 - 39 404 39 404 - Price Statistics 73 503 73 503 - 68 763 68 763 - Private Sector Finance Statistics 32 655 32 655 - 29 647 29 647 - Government Finance Statistics 18 155 18 155 - 17 326 17 326 - National Accounts 20 067 20 067 - 10 805 10 805 - Economic Analysis 12 654 12 654 - 19 857 19 857 - 233 312 233 312 - 218 651 218 651 -
The programme has spent R233,312 million of the allocated funds. Of the total expenditure, an amount of R210,384 million was spent on compensation of employees, whilst an amount of R21,225 million was spent on goods and services items such as consultants (R8,064 million), travel and subsistence (R7,241 million) and operating payments (R2,453 million). The programme spent 100% of its allocated budget.


63
4.3 Programme 3: Population and Social Statistics
Purpose: Produce population and social statistics to inform evidence-based socioeconomic development and transformation in line with internationally recognised practices. Objectives and measures Expand the population and social statistics information base by increasing the depth, breadth and geographic spread for evidence-based planning, monitoring and decision-making for use by both the public and private sectors by: • publishing quarterly and annual statistical information on the labour market, and on employment and
earnings in the formal and informal sectors; • publishing monthly and annual statistical information on vital registrations based on administrative sources; • publishing annual and periodic statistical information on poverty levels, living conditions and service delivery,
as well as population dynamics and demographic trends; • developing new innovative products to respond to user demands over the medium term; and • improving the measurement of social indicators through the application of internationally recognised
standards and practices over the medium term.
Linking programmes with strategic outcomes and objectives
Programme Management for Population and Social Statistics provides strategic direction and leadership for the programme. Key activities in 2016/17 included signing-off of statistical releases and reports, oversight of the implementation of the population and social statistics strategy, and maintaining relations with key partners in the National Statistics System.
Overall cluster performance
The cluster has achieved 74% of its targets as scheduled in the Work Programme, of which 6% were achieved earlier than scheduled and 19% were achieved later than scheduled. 26% of targets were not achieved. Challenges included late and/or incomplete data received from other departments, and human resource constraints. This programme published the CS 2016 results and contributed to informing social and economic development planning, monitoring and decision-making by providing relevant, timely and accurate statistical information on living conditions, population dynamics, vital events, employment, crime and poverty levels.
Performance per subprogramme:
a) Poverty and Inequality Statistics provides information on poverty levels and income and expenditure trends in South Africa. Key outputs for 2016/17 included statistical releases on poverty and expenditure patterns in South Africa and a research document on the use of administrative/external data sources for the poverty and inequality statistics agenda.

64
b) Labour Statistics provides information on employment levels in the formal, non-agriculture sector and labour market trends in South Africa. Key outputs for 2016/17 included three quarterly releases on employment and earnings, quarterly releases on labour market information, an annual report on labour market dynamics in South Africa, and a report on the survey of young people. A quarterly release on employment and earnings was postponed for publication in April to allow for linking of the historical series. Two reports on expanding labour market statistics were not compiled due to a change in questionnaire design, human resource constraints and the editing and imputation process.
c) Demographic Analysis collates and analyses data from censuses and other surveys, as well as
administrative data to compile mid-year population estimates and generate a knowledge base on social and population themes. Key outputs for 2016/17 included an annual report on projected population estimates and two thematic reports on demographic indicators and adolescent fertility.
d) Health and Vital Statistics publishes statistics on births, deaths, marriages, divorces and tourism and migration based on administrative records. Key outputs for 2016/17 included monthly releases on tourism and migration, annual publications on international tourism, recorded live births, and mortality and causes of death. A research report on improving health and vital statistics was compiled. The document was signed in April 2017. Annual publications on marriages and divorces, documented immigrants, and perinatal deaths were not published due to data accessibility challenges and quality assurance processes. A research report on international tourism and a CRVS strategic plan were not compiled as scheduled due to human resource constraints and stakeholder consultation. The CRVS country assessment report was compiled during 2016/17.
e) Population Statistics publishes population estimates collected through population censuses and surveys. Key outputs for 2016/17 included the CS 2016 release; metadata; a quality statement; and the compilation of three scientific research papers on population statistics. Discussion documents on the assessment of data quality on emerging population and spatial issues and CS 2016 data quality were not compiled due to the reprioritisation of activities and dependency on municipal boundaries data.
f) Social Statistics provides information on living conditions, domestic tourism and crime through household
surveys. Key outputs for 2016/17 included an annual report on domestic tourism, an annual release on social and household service delivery statistics, a report on development indicators, two reports on vulnerable groups, a report on gender, and an annual release on victims of crime. Research initiatives included two reports on improving social and household service delivery statistics, and reports on improving crime, education and governance statistics. A biannual report on domestic tourism and a comparative analysis of Stats SA and South African Tourism (SAT) estimates were not done due to delays with the annual domestic tourism report. A research report on providing technical support to improve the RTMC was compiled. The document was signed in April 2017. A research report on the NHTS pilot for digital data collection was not compiled due to funding constraints, and a thematic report on housebreaking was not compiled due to delays with the VOCS release.
Strategy to overcome areas of underperformance
Late publications were mainly due to concerns by Stats SA relating to the quality of administrative data received from Home Affairs. Stats SA continues to collaborate and support the Department of Home Affairs to improve the quality of administrative records. The CRVS country strategic plan will outline agreed objectives to improve civil registration and vital statistics in South Africa.
Changes to planned targets: Not applicable.

65
Linking performance with budgets
Summary of payments by subprogramme: Population and Social Statistics
2016/2017 2015/2016
Subprogramme
Final appropriation
R’000
Actual expenditure
R’000
(Over)/under-expenditure
R’000
Final appropriation
R’000
Actual expenditure
R’000
(Over)/under-expenditure
R’000 Programme Management for
Population and Social Statistics 3 303 3 303 - 4 792 4 792 - Population Statistics 11 961 11 961 - 7 098 7 098 - Health and Vital Statistics 10 939 10 939 - 10 765 10 765 - Social Statistics 17 555 17 555 - 15 788 15 788 - Demographic Analysis 12 348 12 348 - 13 664 13 664 - Labour Statistics 40 245 37 299 2 946 36 602 36 602 - Poverty and Inequality Statistics 22 795 21 093 1 702 65 676 72 479 (6 803) 119 146 114 498 4 648 154 385 161 188 (6 803)
The programme has spent R114,498 million of the allocated funds. Of the total expenditure, an amount of R101,460 million was spent on compensation of employees, whilst an amount of R11,618 million was spent on goods and services items such as travel and subsistence (R3,473 million) and operating payments (R5,696 million). The programme spent 96,1% of its allocated budget.
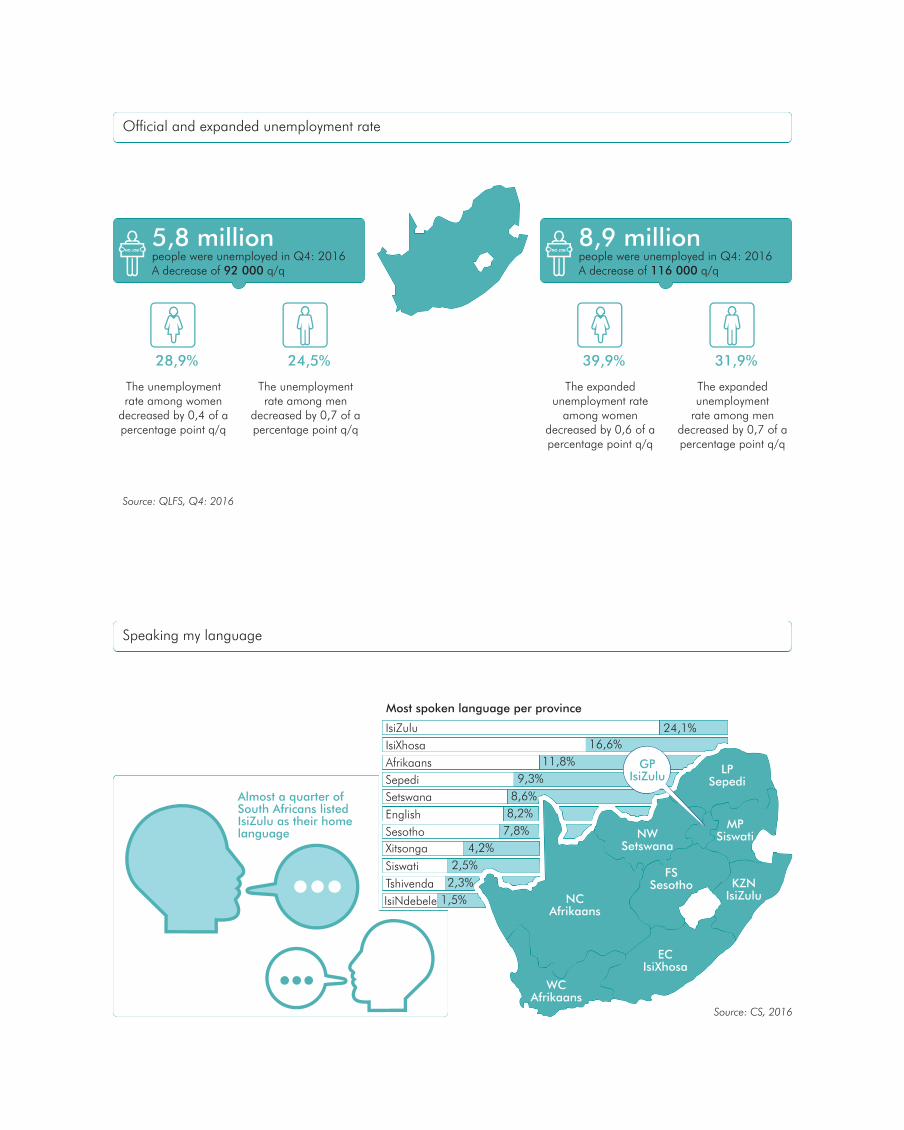


68
4.4 Programme 4: Methodology, Standards and Research
Purpose: Provide expertise on quality, methodology, statistical standards and practices for official statistics in line with international best practice. Build and maintain a business sampling frame. Conduct policy research and analysis on emerging policy matters. Objectives and measures • Improve the comparability and accuracy of statistical information by annually reviewing and evaluating
methodological compliance in survey areas, and applying appropriate quality criteria, standards, classifications and procedures to the statistical value chain.
• Ensure accurate and reliable statistical information for users by the regular use of a sound business sampling
frame to draw annual samples for all economic surveys. • Provide statistical support and advice to policymakers by annually conducting policy research and analysis
on emerging policy matters and producing annual research papers on the economy and society.
Linking programmes with strategic outcomes and objectives
Programme Management for Methodology, Standards and Research provides strategic direction and leadership for the programme. Key activities in 2016/17 included providing strategic guidance on statistical methodology and monitoring the implementation of the Work Programme.
Overall cluster performance
The cluster achieved 89% of its targets as scheduled of which 2% were achieved earlier than scheduled and 2% were achieved later than scheduled. 11% of targets were not achieved. The programme contributed to improving the credibility, comparability and accuracy of statistical information by applying appropriate quality criteria, standards, classifications and procedures, providing methodological and system support services, developing standards, researching current and international best practice, and ensuring an updated sample frame for the collection of economic statistics.

69
Performance per subprogramme:
a) Methodology and Evaluation provides technical expertise on methodologies for producing official statistics and conducting reviews of surveys. Key outputs for 2016/17 included 100% methodological support to stakeholders, a proposal on a quality management system, an evaluation report on CS 2016 and eight research reports on improving methodological practice and systems.
b) Survey Standards develops standards, classifications, and definitions for surveys undertaken by the department. Key outputs for 2016/17 included developing/reviewing six statistical standards and the compilation of three reports on improving standards development. Additional standards for the management of systematic errors, data capturing, and data coding were developed during the year. Standards on international classifications of activities for Time-use, Crime for statistical purposes and Status in employment were not finalised due to a need for broader stakeholder consultation.
c) Business Register maintains and improves the sampling frame for economic statistics. Key outputs for
2016/17 included updating and maintaining the Business Register for economic statistics, completing 99% of surveys of large businesses, providing quarterly snapshots and financial sampling frames based on the Business Register, and compiling six reports on improving the functionality of the business register.
d) Policy Research and Analysis provides integrative technical support and advisory services for policy
planners and development practitioners, and participates in knowledge research and innovation on key development themes. Key outputs for 2016/17 included two research reports on spatial analysis and four research reports on government's socioeconomic planning. Research reports on socioeconomic, demographic and developmental issues were not compiled due to human resource constraints.
Strategy to overcome areas of underperformance
Not applicable.
Changes to planned targets
Not applicable. Additional activities during the past financial year included: SADC selected economic and social indicators – 2015; International Comparison Program (ICP) Africa; World Health Organization, ZAF population projections; African Development Bank: ICP Africa; and Produce local municipality GDP estimates using Zipf's rule, transform these to 2005 Purchasing Power Parity.
Linking performance with budgets
Summary of payments by subprogramme: Methodology, Standards and Research
2016/2017 2015/2016
Subprogramme
Final appropriation
R’000
Actual expenditure
R’000
(Over)/under-expenditure
R’000
Final appropriation
R’000
Actual expenditure
R’000
(Over)/under-expenditure
R’000 Programme Management for
Methodology, Standards and Research 4 283 4 283 - 2 165 2 165 -
Policy Research and Analysis 6 163 6 163 - 5 490 5 490 - Methodology and Evaluation 18 701 18 701 - 14 400 13 838 562 Survey Standards 7 355 7 355 - 5 397 5 397 - Business Register 33 700 33 700 - 31 259 31 259 - 70 202 70 202 - 58 711 58 149 562

70
The programme has spent R70,202 million of the allocated funds. Of the total expenditure, an amount of R67,150 million was spent on compensation of employees, whilst an amount of R2,264 million was spent on goods and services. The main operational cost drivers are travel and subsistence (R1,152 million), operating payments (R392 thousand) and machinery and equipment (R534 thousand). The programme spent 100% of its allocated budget.


73
4.5 Programme 5: Statistical Support and Informatics
Purpose: Enable service delivery programmes by using technology in the production and use of official statistics. Inform policy through the use of statistical geography. Build and maintain a spatial information frame. Objectives and measures • Collaborate with partners to build and maintain a reliable sampling frame for household surveys by updating
the spatial information frame annually. • Modernise business processes by applying emerging technologies in the data collection, processing and
dissemination of statistics. • Support the department's production of official statistics by upgrading and maintaining ICT infrastructure,
and ensuring 90% of network availability for users at all times over the medium term.
Linking programmes with strategic outcomes and objectives
Programme Management for Statistical Support and Informatics provides strategic direction and leadership for the programme. Key activities in 2016/17 included implementing a geospatial strategy for Statistics South Africa, driving the development of an IT governance framework, monitoring the implementation of the Work Programme, and maintaining relations with key partners in the National Statistics System.
Overall cluster performance
The cluster achieved 50% of its targets as scheduled and 50% were not achieved. The programme contributed to improving the measurement of the economy and society by providing and maintaining a frame for accurate sampling of household surveys and a complete and up-to-date database of dwellings for planning and conducting of surveys and censuses. The programme provided editing, publishing and distribution services. A key deliverable during the financial year was a secure and operable IT environment with the relocation of Stats SA to a new building.

74
Performance per subprogramme:
a) Geography Frames and Services provides a sampling frame for household surveys and censuses and a mapping and information service to the department and other users. Key outputs for 2016/17 included the quality assurance and integrating of 64 municipalities, demarcation and maintenance of EA layers in 2 provinces, and the publishing of the complete dwelling frame at metro, city and regional service centre levels. Initiatives to improve the Spatial Information Frame were not realised due to skills constraints and dependency on external procurement processes.
b) Data Management and Technology provides technological infrastructure for the department and supports data management across statistical series. During 2016/17, targets for ICT were reviewed and the targets scheduled in the Work Programme were therefore not achieved. Key outputs for 2016/17 included the building of a new data centre at the new premises and the development of a disaster recovery infrastructure.
c) Publication Services provides editing, publishing and distribution services to survey areas and all areas of
the department that produce reports, correspondence, policy documentation and manuals. Key outputs for 2016/17 included the compilation of multidisciplinary publications and the development of 206 electronic datasets for statistical data. Research reports on a data repository and alternative data delivery channels were not compiled due to a change in the operating procedures and human resource constraints.
d) Business Modernisation improves data and information management across the department, modernising the way business is conducted and supported by technology, and develops systems applications. Key outputs for 2016/17 included the development of 100% solutions in line with stakeholder needs and the implementation of an enterprise architecture programme.
Strategy to overcome areas of underperformance:
Server management: A new server management operating model will be rolled out in four phases.
Changes to planned targets
During 2016/17, targets for ICT were reviewed and the targets scheduled in the Work Programme were therefore not achieved. Key outputs for 2016/17 included the building of a new data centre at the new premises and the development of a disaster recovery infrastructure.
Linking performance with budgets
Summary of payments by subprogramme: Statistical Support and Informatics
2016/2017 2015/2016
Subprogramme
Final appropriation
R’000
Actual expenditure
R’000
(Over)/under-expenditure
R’000
Final appropriation
R’000
Actual expenditure
R’000
(Over)/under-expenditure
R’000 Programme Management for
Statistical Support and Informatics 4 109 4 109 - 3 623 3 623 - Geography Services 18 530 18 530 - 19 222 15 554 3 668 Geography Frames 22 243 22 243 - 20 003 19 534 469 Publication Services 20 163 20 163 - 22 226 22 226 - Data Management and Technology 135 095 135 095 - 115 614 115 614 - Business Modernisation 47 743 47 743 - 45 730 43 626 2 104 247 883 247 883 - 226 418 220 177 6 241

75
The programme has spent R247,883 million of the allocated funds. Of the total expenditure, an amount of R126,189 million was spent on compensation of employees, whilst an amount of R94,130 million was spent on goods and services, which includes the payment of computer services (R80,785 million) and contractors (R3,643 million). Other operating expenditure include machinery and equipment (R25,060 million). The programme spent 100% of its allocated budget.


79
4.6 Programme 6: Statistical Collection and Outreach
Purpose: Provide data collection and dissemination services to inform policy processes and decision-making. Engage stakeholders through platforms and provide effective communication services. Promote statistical development and cooperation in South Africa, Africa and the world. Objectives and measures • Increase awareness and the use of official statistics by government and the public on an ongoing basis by
reaching out to stakeholders and responding to user enquiries; educating users; improving the accessibility and ease of use of statistical information; and conducting publicity campaigns.
• Manage external and internal communications on statistical matters by issuing daily, weekly and monthly
information updates through the media on an ongoing basis. • Provide integrated data collection services and disseminate quality statistics to provincial and local
stakeholders and the public, by ensuring an average annual data collection rate of 85%. • Ensure alignment with international standards, best practice and statistical skills development by increasing
participation, sharing and learning in international statistical initiatives on an ongoing basis.
Linking programmes with strategic outcomes and objectives

80
Programme Management for Statistical Collection and Outreach provides strategic direction and leadership for the programme. Key activities include oversight of the provincial and district offices, leading strategic communications and stakeholder relations, representing the organisation on international forums, and maintaining relations with key partners in the National Statistics System.
Overall cluster performance
The cluster achieved 88% of its targets as scheduled, of which 8% were achieved earlier than scheduled and 4% were achieved later than scheduled. 12% were not achieved. This programme contributed to increasing awareness and marketing, and communicating and disseminating official statistics to relevant stakeholders through effective stakeholder management, internal communications, and public and media relations. The programme contributed to expanding the statistical information database through integrated fieldwork, continuous data collection, stakeholder management, increased collaboration and strengthening partnerships within the SANSS, promoting the harmonisation of statistics in Africa, strengthening statistical capacity on the continent, promoting international statistical best practice and building international partnerships.
Performance per subprogramme:
a) Corporate Communications manages external and internal communications in the department. Key outputs for 2016/17 included the compilation of 53 editions of Pulse and 2 reports on analysis of media perception. Improvement outputs included rolling out the CS 2016 communication campaign, a communication product for municipalities, user-friendly products developed, relocation communication campaign and new communication channels and tools for employee engagement. The establishment of a knowledge management environment was not done due to human resource constraints.
b) Stakeholder Relations and Marketing maintains relations with stakeholders across the country. Key outputs for 2016/17 included reports on visitor sessions, website downloads, and user enquiries. A user satisfaction survey was conducted and a report was compiled. Dissemination of CS 2016 products was done at national, provincial and municipal levels. The integration of survey data and geography for special needs of users, the improvement of access to public data files and initiatives to improve SRM services were not done due to human resource constraints.
c) International Statistical Development and Cooperation manages relations with international statistical agencies, promotes statistical development in Africa, builds partnerships and promotes the development of capacity for young statisticians on the African continent. Key outputs for 2016/17 included reports on Stats SA’s participation in international programmes, frameworks for international statistical best practice benchmarking and African peer support, guidelines for bilateral and multilateral collaboration, reports on the implementation of frameworks for the international programme, the 12th ASSD, Stats SA’s support in establishing African Centres of Operational Excellence, and support to the APAI-CRVS Programme.
d) Provincial and District Offices provides integrated data collection and dissemination services, and promotes the use and coordination of official statistics to provincial and local stakeholders. Key outputs for 2016/17 included reports on data collection, stakeholder workshops, conducting CS 2016 and dissemination of results, provincial fact sheets, the implementation of quality improvements in surveys, communication, advocacy and publicity plans, updating of the spatial frame, support to SANSS partners and capacity building. The establishment of partnerships with organs of state was not done in six provinces due to human resource constraints, stakeholder consultation and lengthy signing processes. Provincial statistical coordination structures were not established and the mining of data sources were not done in four provinces due to HR and skills constraints.

81
Strategy to overcome areas of underperformance
The following areas will be addressed in this cluster:
• Digital data collection strategy will be rolled out to all surveys;
• Provincial activities, performance indicators and targets have been reviewed for 2017/18 financial year; and
• Integrated stakeholder management and communication strategy will be developed to guide stakeholder interaction in the future.
Changes to planned targets
There were no changes to planned targets.
Linking performance with budgets
Summary of payments by subprogramme: Statistical Collection and Outreach
2016/2017 2015/2016
Subprogramme
Final appropriation
R’000
Actual expenditure
R’000
(Over)/under-expenditure
R’000
Final appropriation
R’000
Actual expenditure
R’000
(Over)/under-expenditure
R’000 Programme Management for
Statistical Collection and Outreach 8 421 8 421 - 8 253 8 253 -
International Statistical Development and Cooperation 6 967 6967 - 8 595 8 595 -
Provincial and District Offices 578 706 578 706 - 525 369 525 369 - Stakeholder Relations and Marketing 20 224 20 224 - 19 204 19 204 - Corporate Communications 15 770 15 770 - 14 364 14 364 - 630 088 630 088 - 575 785 575 785 -
The programme spent R630,088 million of the allocated funds. Of the total expenditure, an amount of R493,921 million was spent on compensation of employees, whilst an amount of R118,970 million was spent on goods and services items such as communication (R15,172 million), fleet services (R19,188 million), operating leases (R55,176 million) and travel and subsistence (R19,643 million), mainly due to surveys such as the Quarterly Labour Force Survey, General Household Survey, Domestic Tourism Survey, Victims of Crime Survey, and the Master Sample Survey. The programme spent 100% of its allocated budget.


84
4.7 Programme 7: Survey Operations
Purpose: Coordinate survey operations for household surveys and provide processing services to produce official statistics. Conduct independent household survey monitoring and evaluation activities. Objectives and measures: • Expand the statistical information base for use by government, the private sector and the general public by
conducting a population census every 10 years as well as large-scale population surveys between censuses. • Ensure the efficiency and effectiveness of survey operations conducted by the department by coordinating
household survey operations with an average collection rate of 85% on an annual basis. • Improve the quality and timeliness of the editing and processing of statistical data by standardising the use of
ICT within the department on an ongoing basis. • Conduct independent household survey monitoring and evaluation activities.
Linking programmes with strategic outcomes and objectives
Programme Management for Survey Operations provides strategic direction and leadership to the programme. Key activities included driving the timely processing of data, monitoring targets in the Work Programme, and maintaining relations with key partners in the National Statistics System.
Overall cluster performance
The cluster achieved 83% of its targets in the Work Programme of which 3% were achieved earlier than scheduled and 27% were achieved later than scheduled. 17% of targets were not achieved. This programme contributes to informing social and economic development, planning, monitoring and decision-making, and to increasing the efficiency and effectiveness of survey operations.
Performance per subprogramme:
a) Census and Community Survey Operations conducts periodic population censuses and large-scale population surveys. Key outputs for 2016/17 included data collection for the CS 2016 and SADHS. A report on collaboration and partnering in design of innovative data collection methodologies was not completed. Collaboration and partnering efforts have been amalgamated under the Transition Project (Papi to Capi).
b) Household Survey Operations coordinates and integrates collection activities across household surveys.
Key outputs for 2016/17 included the checking of questionnaires for quality, reports on the maintenance of the master sample, survey operations training, and three reports on improving household survey operations.
c) Corporate Data Processing manages the editing and processing of data. Key outputs for 2016/17
included reports on processing and editing of questionnaires, the CS 2016 final dataset, maintenance of the master sample, and a report on improving data processing. A research report on the piloting of digital data collection for household surveys was postponed to 2018.

85
d) Survey Coordination, Monitoring and Evaluation monitors the quality of field operations of household surveys and censuses and conducts independent evaluations. Key outputs for 2016/17 included reports on monitoring and evaluation of CS 2016, SADHS, DTS and QLFS. A research report on conducting verification of out-of-scope cases was compiled.
Strategy to overcome areas of underperformance
No concerns of underperformance were reported. New and improved collection methodologies will be rolled out over the medium term in order to improve the effectiveness and efficiency of survey operations.
Changes to planned targets
There were no changes to planned targets.
Linking performance with budgets
Summary of payments by subprogramme: Survey Operations
2016/2017 2015/2016
Subprogramme
Final appropriation
R’000
Actual expenditure
R’000
(Over)/under-expenditure
R’000
Final appropriation
R’000
Actual expenditure
R’000
(Over)/under-expenditure
R’000 Programme Management for Survey
Operations 10 102 10 102 - 12 867 12 867 - Census and Community Survey
Operations 404 174 368 378 35 796 111 112 111 112 - Household Survey Operations 24 015 24 015 - 28 587 28 587 - Corporate Data Processing 74 869 74 869 - 69 603 69 603 - Survey Coordination, Monitoring
and Evaluation 16 670 16 670 - 17 297 17 297 - 529 830 494 034 35 796 239 466 239 466 -
The programme spent R494,034 million of the allocated funds. Of the total expenditure, an amount of R143,943 million was spent on compensation of employees, whilst an amount of R342,155 million was spent on goods and services items such as minor assets (R31,927 million) relating to tablets procured for data collection, agency and support services (R129,927 million) relating to the payment of fieldworkers, and travel and subsistence (R130,557 million), mainly due to the Community Survey 2016. The programme spent 93,2% of its allocated budget.


87
5. Selected performance indicators as per Estimates of National Expenditure
Indicators Cluster Projected Actual Number of quarterly and annual GDP estimates releases per year Economic Statistics 4 4 Number of releases on industry and trade statistics per year Economic Statistics 150 150 Number of releases on financial statistics per year Economic Statistics 17 17 Number of price index releases per year Economic Statistics 48 48 Number of releases on labour market dynamics per year1 Economic Statistics 8 7 Number of releases on living circumstances, service delivery and poverty
Population and Social Statistics 4 4
Number of releases on the changing profile of the population per year2 Population and Social Statistics 17 16
1 QES in Q4 delayed to Q1 of 2017/18. 2 Two additional tourism and migration releases were published in Q1 and Q4. Annual releases on documented immigrants, marriages and divorces and perinatal deaths were not published as scheduled. Revised dates: Q1 of 2017/18.

88
6. Transfer payments
6.1 Transfer payments made for the period 1 April 2016 to 31 March 2017
Name of transferee Type of organisation
Purpose for which funds were used
Did the department comply with s38(1)(j) of the PFMA
Amount transferred (R’000)
Amount spent by the entity (R’000)
Reasons why funds were unspent by the entity
University of Cape Town University Capacity building in
the use of statistics Yes 1 000 1 000
University of Witwatersrand University To promote
collaboration among academia to build research and analytical skills capacity
Yes 500 500
University of Stellenbosch University To conduct basic
and operational research in the fields of regional and urban spatial development analysis, planning, policy formulation, and management and building capacity within the public and private sectors in the same fields
Yes 6 000 6 000
Population Association of Southern Africa (PASA)
Association To promote collaboration in the field of demography
Yes 200 200

89
6.2 Transfer payments budgeted for the period 1 April 2016 to 31 March 2017, but no transfer payments were made
Name of transferee Type of organisation
Purpose for which funds were used
Amount budgeted (R’000)
Amount transferred (R’000)
Reasons why funds were not transferred
South African Statistical Association (SASA)
Association For statistical skills development plan
123 90 SASA did not request the budgeted amount due to unspent funds from their side in the previous financial year
South African Broadcasting Corporation (SABC)
Corporation Television licence renewals
15 9 Not all funds were transferred, due to the disposal of old television sets utilised at the old Head Office building. The new building provided for new television sets of which the licences are payable in the 2017/18 financial year
University of Stellenbosch University To conduct basic and
operational research in the fields of regional and urban spatial development analysis, planning, policy formulation and management, and building capacity within the public and private sectors in the same fields
6 691 6 000 The allocation for transfer to the University of Stellenbosch was based on the assumption that the amount will escalate annually. However, the department received an invoice of R6 million and made a payment based on the received invoice
Stats SA entered into an agreement with the Southern Africa Labour and Development Research Unit (SALDRU) within the School of Economics at the University of Cape Town for a joint venture and collaboration towards building capacity in the use of statistics for empirically-based policy analysis. Stats SA obtained approval to transfer R1 million to the University of Cape Town. Benefits to Stats SA are that the focus will be on three crucial areas where further work could greatly improve the capacity of countries in Africa. The three areas relate to the design of questionnaires, data collection, and the ability to analyse data for the purpose of evidence-based decision-making and policy development. Stats SA entered into an agreement with the University of Stellenbosch. Stats SA has offered to establish the Chair to be known as Statistics South Africa Chair of Regional and Urban Analysis and an associated Centre for Regional and Urban Statistical Exploration. Stats SA obtained approval and transferred R6 million to the University. Benefits to Stats SA are that basic and operational research will be conducted in the field of regional and urban spatial development analysis, planning, policy formulation, and capacity building within government. Stats SA entered into an agreement with the University of the Witwatersrand to promote academic collaborations with each other for the purpose of building capacity for research analytical skills. Stats SA obtained approval and transferred R500 thousand to the University. Stats SA entered into an agreement with the South African Statistical Association (SASA) for a joint venture and collaboration towards statistical capacity building in support of the national statistical system in South Africa. Financial support amounting to R123 thousand was provided; however only R90 thousand was actually transferred as explained above. Benefits to Stats SA are that the statistical skills development plan will address the capacity building within the National Statistics System, and improve the foundation of statistical literacy at schools.

90
Stats SA is a key partner of the Population Association of Southern Africa (PASA) along with various academic and research institutions that have vested interest in demographers. Stats SA obtained approval and transferred R200 thousand to provide support in their activities. Stats SA obtained approval for a transfer payment of R15 thousand to the South African Broadcasting Corporation (SABC) for television licence renewals; however only R9 thousand was actually transferred as explained in Table 6.2.

91
7. Donor funds
Stats SA received donor funds from the African Development Bank and the United Nations Department of Economics and Social Affairs (DESA) Donor fund Details Name of donor African Development Bank (AfDB) Full amount of the funding R8,253 million Period of the commitment April 2014 to March 2017 Purpose of the funding International Statistical Development and Cooperation 2015 Expected outputs Reviewed SHaSA Strategy, Agenda 2063 Indicators and Improved CRVS in Africa Actual outputs achieved Consultant’s report on advancement of Africa Programme on Acceleration and Improvement of Civil Registration
and Vital Statistics (APAI-CRVS) in Africa Amount received in current period (R’000) An amount of R1,285 million was carried forward from the 2015/16 financial year. The amount received in the
reporting period differs from the closing balance for 2015/16 as a result of an adjustment of R1 thousand by NT, due to only R1,285 million being surrendered to the RDP instead of R1,286 million
Amount spent by the department (R’000) R1,276 million Reasons for the funds unspent Funds were spent as per Project Plan, the surplus for R9,073.13 could not be spent as set target for the project
were already achieved Monitoring mechanism by the donor Project Performance and Expenditure Reports Donor fund Details Name of donor United Nations, Department of Economics and Social Affairs (DESA) Full amount of the funding R3,948 million Period of the commitment May to November 2016 Purpose of the funding To collect data on measuring individual levels of asset ownership and entrepreneurship from a gender perspective
and accelerate existing efforts to generate comparable indicators on health, education, entrepreneurship and asset ownership
Expected outputs Conduct a pilot using the UN Women EDGE pilot survey questionnaire, analyse the results, produce statistical
tables as well as a report of the general execution of the project Actual outputs achieved The Pilot survey was conducted, a report as well as statistical tables were produced Amount received in current period (R’000) R3,948 million Amount spent by the department (R’000) R3,071 million Reasons for the funds unspent Certain items budgeted for (such as tablets) were not procured, because Stats SA could use the devices used for
CS 2016. Savings were also achieved by procuring cheaper training venues and securing better car rental rates than anticipated
Monitoring mechanism by the donor Monthly expenditure reports had to be submitted to the donor

92
8. Capital investment, maintenance and asset management plan
Assets to the value of R85,394 million have been written off as a result of relocation to the new Stats SA Head Office building which came furnished. The disposal related transfers, losses, theft and scrapping. See table below for the breakdown of categories:
Write-offs: 2016/17 Category R’000 Computer equipment 27 897 Furniture and office equipment 63 730 Other machinery and equipment 1 995 Total 93 622
An asset register is maintained on the Barcoded Asset Audit (BAUD) system. Assets in a good and normal condition account for 90% of total assets, whilst 7% are in a poor but usable condition, and 3% are in scrap condition.


Section 3: Governance

96
1. Introduction
Stats SA continues to be committed to the highest standards of governance, which is fundamental to the management of public finances and resources through coordinated governance structures to effectively, efficiently and economically utilise state resources. Internal Audit provides continuous assurance on overall governance and administration, and engagement is ongoing to ensure that the combined assurance model to maximise risk and governance oversight and control efficiencies will commence roll-out in the next financial year. The Finance Control Committee (FCC) continues to ensure fiscal discipline through the approval and monitoring of expenditure.
2. Risk management
Stats SA is committed to maintaining an effective, efficient and transparent system of risk management as outlined in the reviewed risk management policy and strategy, which supports the achievement of the department’s strategic and operational objectives. Risk assessments have been conducted at both strategic and operational levels, including the consideration of possible emerging risks. The Risk Management Steering Committee (RMSC) advises Exco on the overall system of risk management and raises its concerns where strategic risks are not being fully mitigated. The Audit Committee thereafter reviews, monitors and engages management on the risk management reports tabled on a quarterly basis. Where certain strategic risks could not be fully mitigated during the financial year, Stats SA has commenced with engaging relevant stakeholders to prevent these risks from materialising in future.
3. Fraud and corruption
Stats SA has an approved fraud prevention strategy and plan that reinforces zero tolerance towards fraud, corruption and any acts of dishonesty. Employees are encouraged to report alleged incidents of fraud and corruption through various methods highlighted in the various awareness campaigns. The Directorate: Fraud and Compliance Investigations within the Chief Directorate: Corporate Governance carries the mandate to conduct all investigations within the department. This entails investigations into losses and damages, fraud and corruption, fruitless and wasteful expenditure, irregular expenditure and third-party claims against the State. Awareness sessions with regard to the new Public Service Regulations 2016, outside remunerative work, financial disclosures, and fraud were conducted during the financial year by means of emails to employees, circulars and internal newsletter articles, etc.
4. Minimising conflict of interest
The department has implemented a specific request form and comparative schedule that requires users and SCM practitioners to declare whether or not they have interests in a particular company. This is additional to the Standard Bidding documentation that requires the service provider to declare their interest in and knowledge of departmental officials that are or could be involved in the respective procurement process. The Bid Specification, Bid Evaluation and Bid Adjudication committees declare their interests prior to any evaluation or adjudication of a bid process. Where an interest exists, the respective members are expected to recuse themselves from the process. The members of the Bid Adjudication Committee and SCM practitioners are required to sign the respective codes of conduct additional to the Code of Conduct for Public Servants that further advises on the process of declaring interests. In cases where undeclared conflict is established, disciplinary procedures are instituted.

97
5. Code of Conduct
The Code of Conduct forms part of Stats SA’s internal induction programme and of the official Public Service Induction Programme. Every employee receives a copy thereof at acceptance of employment and thereby binds him- or herself thereto. Stats SA follows the process as outlined in the Disciplinary Code and Procedures as per Resolution 01 of 2003 in occurrences of breach of the Code of Conduct. The said Disciplinary Code and Procedures provide for a formal or informal process to be followed, depending on the nature and seriousness of the non-compliance. Additional to the Code, employees of Stats SA are also bound by section 17 of the Statistics Act, to maintain confidential personal or business information to which they have access. Any contravention thereof will be addressed through the disciplinary procedures as mentioned above.
6. Health, safety and environmental issues
Stats SA relocated to its new premises in August 2016. The new building is compliant with the Occupational Health and Safety Act. Stats SA and Dipalopalo Concession has finalised the appointment of health and safety representatives. Training of the representatives will be done in 2017/18.
7. Portfolio committee
Composition of Portfolio Committee on Performance Monitoring and Evaluation
ANC DA EFF IFP UDM COPE ACDP
Dr M Khoza (Chairperson) Mr Y Cassim Ms N Mente Mr M Hlengwa Mr N Kwankwa Mr S Mncwabe Mr M Galo Mr M Booi Ms Z Jongbloed Ms M Mokause Mr M Dirks Mr S Motau Ms Z Dubazana Ms D Van Der Walt Ms R Lesoma Ms W Newhoudt-Druchen Mr M Ntombela
Dates of meetings
Stats SA and the Portfolio Committee on Performance Monitoring and Evaluation met twice during the year on the following matters:
• 20 April 2016: Briefing on the annual Work Programme
• 13 October 2016: Briefing on the Annual Report.

98
Recommendations by the Portfolio Committee
Based on the deliberations of the annual Work Programme with Statistics South Africa, the committee recorded the following recommendations: Recommendations of the Committee are, amongst others, the following: a) Statistics South Africa must fast-track amending the Statistics Act (1999) to drive statistical reform, in order to
inform infrastructure planning; and b) Stats SA must continuously track public sector spending and provide government and legislatures with the
financial outlook of the state.
Based on the deliberations of the Annual Report with Statistics South Africa, the Committee recorded the following recommendations: Legislative and policy matters: Statistics South Africa should fast-track amending the Statistics Act (1999) to drive statistical reform in order to inform infrastructure planning. The amendments to the Act should firmly respond to the evolving environment and effect alignment with the objectives of the National Development Plan. Statistics South Africa, in concurrence with the Ministry for Planning, Monitoring and Evaluation, must ensure amendments to legislation enhance better statistical coordination between organs of state. The amendments should incorporate measures for consequence management to enforce utilisation of statistical information. Stats SA must provide the Committee with the road map on the amendments of the Act, before the end of the financial year. Administrative matters: The Minister for the Department of Planning, Monitoring and Evaluation (DPME) and the National Treasury should ensure that Statistics South Africa remain the only institution entrusted to produce reliable, relevant and quality statistical information in the country. The Minister of the DPME and the National Treasury are therefore required to communicate with all government departments including Offices of the Premier who are planning to conduct their own independent statistical surveys to collaborate with Statistics South Africa in commissioning such, without any outsourcing. These efforts will minimise duplication and unreliable statistical information, and will bring about a saving in scarce resources, as Stats SA has the capacity to conduct surveys. In light with the Constitutional Court ruling on the Independent Electoral Commission concerning the residential addresses for voters, the Ministers of the Department of Planning, Monitoring and Evaluation, the Department of Home Affairs, and the Department of Cooperative Governance and Traditional Affairs should ensure that funding is allocated to Statistics South Africa so as to carry out this crucial resolution timeously. The National Treasury should assist Statistics South Africa with funding for planned projects such as the Living Conditions Survey and the Consumer Price Index. Government departments must ensure that transferring of the task to Statistics South Africa has to be followed by financial resources from their original budget votes. The principle of “budget follows functions” should be adhered to by departments. The State Information Technology Agency (SITA) and the Department of Public Service and Administration must attend as a matter of urgency to the ageing ICT infrastructure of Statistics South Africa.
Conclusion
South Africa currently relies on Statistics South Africa to measure progress on implementing the National Development Plan and meeting the Sustainable Development Goals (SDGs). Therefore, Statistics South Africa plays an important role in South Africa’s drive to development and greater growth rates. This is evident through the organisation’s continued improvements in the management of the institution and its products. The

99
Governance Cluster of Parliament is complimented for its contribution towards the Budgetary Review and Recommendation (BRR) Report, and also the support staff for the drafting of same.
8. SCOPA resolutions
Not applicable.
9. Prior modifications to audit report
There were no matters of non-compliance reported by the AGSA during the audit of the 2015/16 financial year.
10. Internal Control
The purpose of Internal Control is to address risks and provide reasonable assurance that, in pursuit of the vision, mission and objectives, the following are achieved:
• Executing orderly, ethical, economical, efficient and effective operations;
• Fulfilling accountability obligations;
• Complying with applicable laws and regulations; and
• Safeguarding resources against loss, misuse and damage. An effective internal control system is a fundamental success factor in meeting the objectives of the department. The mandate of the Internal Control component is to monitor the implementation of the internal controls that are built into the policies, procedures, practice notes and legal prescripts that govern the organisation, and to identify any weaknesses that are either inherent in the system or the result of ignorance or neglect to adhere to these controls. During 2016/17, the component exercised its mandate through: • Conducting internal control inspection visits in order to address any non-compliance with internal control
procedures, to identify internal control weaknesses, to recommend improvements, and to follow up on the implementation thereof;
• The validation of financial document parcels/batches to ensure that processes and procedures were followed
in order to address any non-compliance with policies and internal control procedures, to identify internal control weaknesses, to recommend improvements, and to follow up on the implementation thereof; and
• Maintaining the register of fruitless and wasteful expenditure and irregular expenditure, as well as reporting
on progress.
11. Internal Audit and Audit Committee
11.1 Internal Audit
In terms of the Public Finance Management Act (Act No. 1 of 1999) (PFMA), the Institute of Internal Auditors standards and the Internal Audit Charter, the scope of Internal Audit focuses mainly on determining whether Stats SA’s risk management, internal control and governance processes, designed by management in compliance with section 38(1)(a) of the PFMA, are adequate and functioning in a manner that ensures that set objectives are met.

100
For the year under review, Internal Audit fulfilled the audit activities in terms of the internal audit coverage plan approved by the Audit Committee. This was achieved by: • Auditing of control systems and submission of internal audit reports identifying weaknesses and
recommending improvements within the organisation, including provincial offices; • Conducting of follow-up audits to determine whether areas of improvement as recommended by the
Auditor-General South Africa (AGSA) and Internal Audit have been implemented; and • Providing advisory and consulting services at various forums, e.g. committees, etc. Internal Audit also fulfilled its responsibility to the Audit Committee by providing support and reporting on the organisation’s control environment deficiencies as reported to management.
11.2 Audit Committee
The control environment is based on policies and procedures that are developed and periodically reviewed to ensure that Stats SA meets its responsibilities in an effective and efficient manner, complies with relevant legislation, and manages known and identified risks to the organisation. The Audit Committee of Stats SA is established in terms of sections 76(4)(d) and 77 of the Public Finance Management Act, 1999 (PFMA) and performs its duties in terms of a written terms of reference (the Audit Committee Charter). The status of the Audit Committee is an independent advisory committee comprising four members. Its role is to independently monitor activities within Stats SA, and to report and make recommendations to the Accounting Officer.
Name Qualifications Date appointed Date reappointed No. of meetings attended
Ms RA van Wyk (Chairperson) MBA, CA (SA) 25/05/2009 25/05/2015 4 Mr RA Tshimole B Com 12/10/2012 25/05/2015 4 Ms S Khan CA (SA), CIA, CISA 01/10/2014 4 Adv JL Thubakgale LLM, EDP, MBA 01/03/2016 3
During the financial year, the Audit Committee met four times and performed, amongst other activities, the following key responsibilities: • Approved the strategic and coverage plans of Internal Audit and reviewed their performance during the year; • Reviewed the strategic plan of the Auditor-General South Africa for the financial year ended 31 March 2017
and their audit report to Statistics South Africa for the financial year ended 31 March 2017; • Reviewed in-year management reporting relating to financial management, risk management and
performance management; • Reviewed the Annual Financial Statements for the financial year ended 31 March 2017; and • Reviewed the improvements implemented by management to address control weaknesses reported by
Internal Audit and the AGSA.

101
12. Report of the Audit Committee of Statistics South Africa for the financial year ended 31 March 2017
The Audit Committee of Statistics South Africa is pleased to present its report for the financial year ended 31 March 2017.
Audit Committee responsibility
The Audit Committee reports that it has complied with its responsibilities arising from section 38(1)(a)(ii) of the Public Finance Management Act and Treasury Regulation 3.1.13. The Audit Committee also reports that it has adopted appropriate formal terms of reference as its Audit Committee Charter, has regulated its affairs in compliance with this charter and has discharged all its responsibilities as contained therein.
The effectiveness of internal control
Our review of the findings of the audit work by Internal Audit which was based on the risk assessments conducted, as well as the audit work done by the Auditor-General South Africa (AGSA), revealed certain weaknesses that were raised with Statistics South Africa (Stats SA). The following Internal Audit work was completed during the year under review: • Adequacy and effectiveness audits on various internal control and governance processes in Head Office and
a sample of provincial and district offices; • Reviews of the Annual Financial Statements for the financial year ended 31 March 2017 and the quarterly
interim financial statements for the financial year ended 31 March 2017; • Reviews of the quarterly performance information reports for the financial year ended 31 March 2017; • Follow-up audits on previous audits to evaluate the effective implementation of Internal Audit
recommendations that management had agreed to implement; • Advisory services; and • Follow-up on implementation of previous years’ audit recommendations by the AGSA.
The following were areas of concern: • Certain areas affecting the IT environment. We acknowledge that management has actively addressed many
of the previous weaknesses to ensure there is a stable IT infrastructure and environment; As IT plays an ever increasing role within the core business of Stats SA, it is important that management continues improving the stability, capacity and security of the IT infrastructure.
• It is pleasing to note that there is a considerable reduction in the number of repeat findings on control
weaknesses. We encourage management to strengthen controls where necessary to try reduce those weaknesses still reported.
In-year management and monthly/quarterly reporting
Stats SA has prepared monthly and quarterly reporting to the Treasury as is required by the PFMA.

102
Evaluation of financial statements
We have reviewed the annual financial statements prepared by Stats SA.
Auditor-General’s report
We continuously review Stats SA’s implementation plan for addressing audit issues raised in the previous years and we are satisfied that all matters are receiving attention. We are pleased to note that, compared to previous financial years, there has been continued reduction in the number of repeat and new audit findings reported by the AGSA. We will continue to monitor the implementation of corrective measures in this regard, to ensure that these are implemented. The Audit Committee concurs with and accepts the conclusions of the AGSA on the annual financial statements and is of the opinion that the audited annual financial statements be accepted and read together with the report of the AGSA.
Conclusion
We are pleased to note that Stats SA has achieved a clean audit for the fourth consecutive year and congratulate management on their commitment to strong governance within the organisation. Ms R van Wyk Chairperson of the Audit Committee Statistics South Africa 31 July 2017


Section 4: Human resource information

106
1. Human Resource Management
The information contained in this part of the annual report has been prescribed by the Minister: Public Service and Administration for all departments in the public service.
2. Introduction
The status of human resources in the department
Human capital is the most valuable asset in Stats SA. In order to achieve its organisational strategic objectives, Stats SA needs employees with the necessary skills and competencies. Thus, great emphasis is placed on capacity building programmes for employees at all levels. The organisation has made considerable progress in developing leadership and management skills. The priority for this organisation in the medium term is to implement a Talent Management Strategy that looks at issues of career management, succession planning and training and development. The emphasis of training is also looking at developing statistical capacity in the country. The role of Human Resource Management and Development is to ensure the provision and retention of skilled employees. Employees are developed to attain the organisation’s strategic objectives through a performance management framework. The organisation creates a conducive environment through a vibrant Employee Health and Assistance Programme and through Labour Relations Management.
Human resource priorities for the year under review and the impact of these priorities
• The implementation of the approved organisational structure over the medium term;
• Talent management to ensure retention and succession planning;
• Alignment of training with organisational strategic objectives;
• Special focus on spatial statistics through programmes like the Centre for Regional and Urban Innovation and Statistical Exploration (CRUISE);
• Repositioning of the internship programme as an integral part of our recruitment strategy; and
• Expansion of intake for the National Certificate in Official Statistics (NCOS) to address the statistical skills shortage in the National Statistics System.
Workforce planning and key strategies to attract and recruit a skilled and capable workforce
Besides the normal advertising of vacancies, should funds be available, as a requirement by the regulatory framework, the internship programme is used as a vehicle to recruit, especially for lower-level positions. For retention, specifically on positions that are difficult to recruit, candidates are headhunted and a Counter-offer Policy is in place. In addition to the above, the organisation has taken a strategic decision to explore and implement a Talent Management Strategy that contains the following pillars:
• Recruitment and resourcing;
• Training and development;
• Performance management;
• Career management; and
• Succession planning.

107
Employee Performance Management
Performance management includes activities which ensure that the strategic and operational goals of Stats SA are consistently being met in an effective and efficient manner. In Stats SA, performance management consists of three primary elements: measurement, feedback and positive reinforcement. Benefits may include direct financial gain, depending on the availability of funds, for those employees who consistently performed above the norm and encouraging employee engagement to assist in establishing a motivated work force and improved management control.
Employee Health and Wellness Programmes
The following employee health and wellness programmes are in place to promote productivity in the work place:
• Disability sensitisation and awareness;
• Disability module for fieldworkers;
• Gender mainstreaming;
• Implementation of harassment policy and procedures;
• Men and women's programmes;
• 24-hour counselling and professional support;
• HIV and TB management programme;
• Scholar programme; and
• Fitness programme.
Achievements
• Enhanced capacity building programmes; and
• Enhanced collaboration with institutions of higher learning through a memorandum of understanding (MoU).
Challenges faced by the department
• Compliance to governance prescripts;
• Achievement of employment equity targets; and
• Measuring the impact of training.
Future HR plans/goals
• Implementation of the Talent Management Strategy;
• Support to SANSS partners through capacity building and partnering with other higher education institutions, including the National School of Government (NSG); and
• Support to large sample surveys.

108
3. Human Resources oversight statistics
3.1 Personnel related expenditure
Table 3.1.1 – Personnel expenditure by programme for the period 1 April 2016 to 31 March 2017
Programme
Total expenditure
R’000
Personnel expenditure
R’000
Training expenditure
R’000
Professional and special
services R’000
Personnel cost as %
of total expenditure
Average personnel
cost per employee
R’000 Programme 1: Administration 671 188 228 720 2 273 4 749 34,1 15 Programme 2: Economic Statistics 233 312 210 384 456 8 064 90,2 14 Programme 3: Population and Social Statistics 114 498 101 460 566 23 88,6 7 Programme 4: Methodology, Standards and
Research 70 202 67 150 291 - 95,7 4 Programme 5: Statistical Support and Informatics 247 883 126 189 883 - 50,9 8 Programme 6: Statistical Collection and Outreach 630 088 493 921 263 572 78,4 32 Programme 7: Survey Operations 494 034 143 943 350 9 303 29,1 9 Total 2 461 205 1 371 767 5 082 22 711 55,7 90
Table 3.1.2 – Personnel costs by salary band for the period 1 April 2016 to 31 March 2017
Salary band
Personnel expenditure
R’000
% of total personnel
cost
Average personnel
cost per employee
R’000 Levels 3–5 (permanent staff) 54 807 4 327 Levels 3–5 (temporary staff) 73 371 5 60 Levels 6–8 (permanent staff) 424 890 31 254 Levels 6–8 (temporary staff) 12 314 1 202 Levels 9–12 (permanent staff) 563 399 41 552 Levels 9–12 (temporary staff) 2 081 - 520 Levels 13–16 (permanent staff) 240 905 18 991 Levels 13–16 (temporary staff) - - - Total 1 371 767 100 90

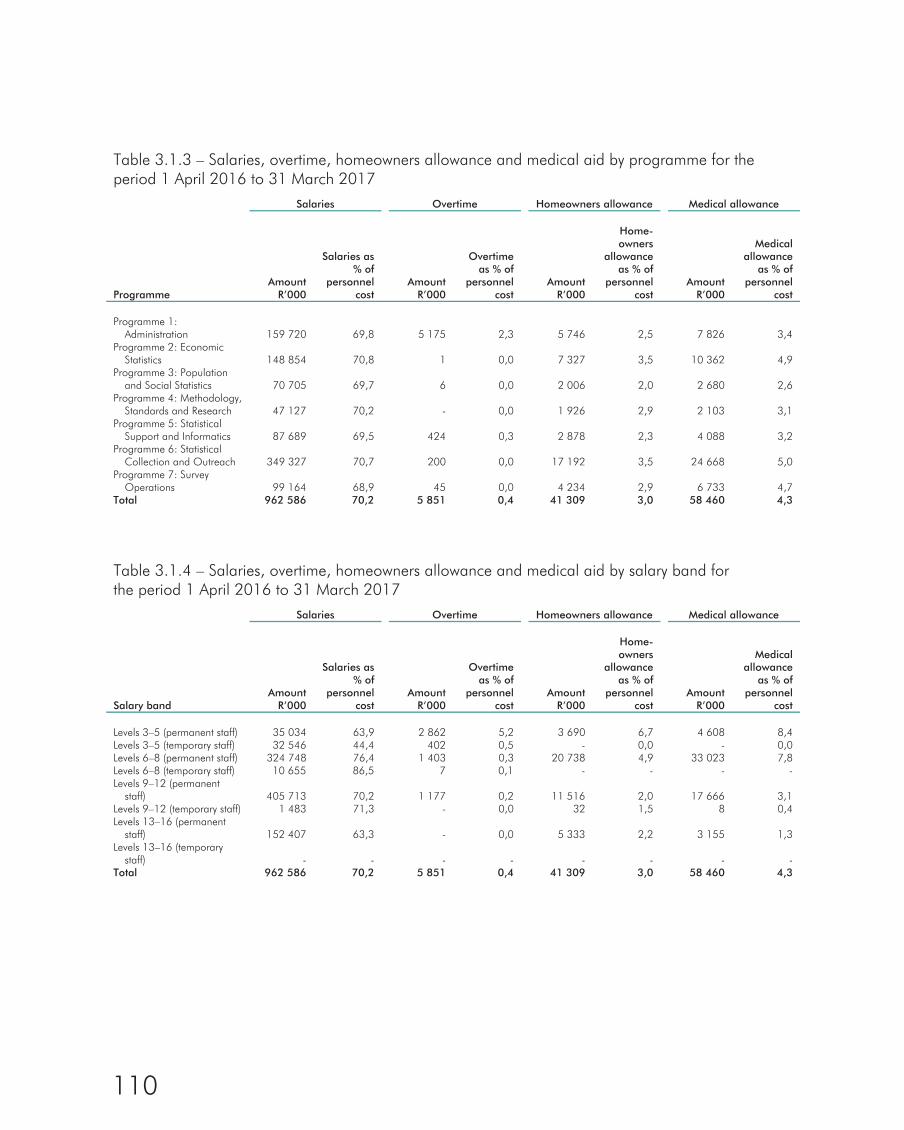
110
Table 3.1.3 – Salaries, overtime, homeowners allowance and medical aid by programme for the period 1 April 2016 to 31 March 2017
Salaries Overtime Homeowners allowance Medical allowance
Programme Amount
R’000
Salaries as % of
personnel cost
Amount R’000
Overtime as % of
personnel cost
Amount R’000
Home- owners
allowance as % of
personnel cost
Amount R’000
Medical allowance
as % of personnel
cost
Programme 1: Administration 159 720 69,8 5 175 2,3 5 746 2,5 7 826 3,4
Programme 2: Economic Statistics 148 854 70,8 1 0,0 7 327 3,5 10 362 4,9
Programme 3: Population and Social Statistics 70 705 69,7 6 0,0 2 006 2,0 2 680 2,6
Programme 4: Methodology, Standards and Research 47 127 70,2 - 0,0 1 926 2,9 2 103 3,1
Programme 5: Statistical Support and Informatics 87 689 69,5 424 0,3 2 878 2,3 4 088 3,2
Programme 6: Statistical Collection and Outreach 349 327 70,7 200 0,0 17 192 3,5 24 668 5,0
Programme 7: Survey Operations 99 164 68,9 45 0,0 4 234 2,9 6 733 4,7
Total 962 586 70,2 5 851 0,4 41 309 3,0 58 460 4,3
Table 3.1.4 – Salaries, overtime, homeowners allowance and medical aid by salary band for the period 1 April 2016 to 31 March 2017
Salaries Overtime Homeowners allowance Medical allowance
Salary band Amount
R’000
Salaries as % of
personnel cost
Amount R’000
Overtime as % of
personnel cost
Amount R’000
Home- owners
allowance as % of
personnel cost
Amount R’000
Medical allowance
as % of personnel
cost Levels 3–5 (permanent staff) 35 034 63,9 2 862 5,2 3 690 6,7 4 608 8,4 Levels 3–5 (temporary staff) 32 546 44,4 402 0,5 - 0,0 - 0,0 Levels 6–8 (permanent staff) 324 748 76,4 1 403 0,3 20 738 4,9 33 023 7,8 Levels 6–8 (temporary staff) 10 655 86,5 7 0,1 - - - - Levels 9–12 (permanent
staff) 405 713 70,2 1 177 0,2 11 516 2,0 17 666 3,1 Levels 9–12 (temporary staff) 1 483 71,3 - 0,0 32 1,5 8 0,4 Levels 13–16 (permanent
staff) 152 407 63,3 - 0,0 5 333 2,2 3 155 1,3 Levels 13–16 (temporary
staff) - - - - - - - - Total 962 586 70,2 5 851 0,4 41 309 3,0 58 460 4,3

111
3.2 Employment and vacancies
Table 3.2.1 – Employment and vacancies by programme as on 31 March 2017
Permanent posts Contract
posts
Programme Number of
posts Number of posts filled
Vacancy rate
Number of
contract posts filled
Number of posts filled
additional to establishment
Programme 1: Administration 619 490 21 70 0 Programme 2: Economic Statistics 584 533 9 0 0 Programme 3: Population and Social Statistics 209 185 11 5 0 Programme 4: Methodology, Standards and
Research 131 113 14
0 0 Programme 5: Statistical Support and Informatics 261 219 16 0 0 Programme 6: Statistical Collection and Outreach 1 351 1 259 7 62 0 Programme 7: Survey Operations 356 329 8 23 0 Total 3 511 3 128 11 160 0 Note: * The table includes interns appointed against the approved establishment.
Table 3.2.2 – Employment and vacancies by salary band as on 31 March 2017
Permanent posts Contract
posts
Salary band Number of
posts Number of posts filled
Vacancy rate
Number of
contract posts filled
Number of posts filled
additional to establishment
Levels 1–2 88 87 1 31 0 Levels 3–5 259 216 17 27 0 Levels 6–8 1 738 1 614 7 99 0 Levels 9–12 1 161 984 15 2 0 Levels 13–16 265 227 14 1 0 Total 3 511 3 128 11 160 0 Note: * Although some of the SMS posts reflect as being filled, they are filled with lower levels, due to operational reasons. * Two salary level 12 posts, one salary level 11 post and one salary level 1 post are sitting against salary level 13 posts. * The table includes interns appointed against the approved establishment.


113
Table 3.2.3 – Employment and vacancies by critical occupation as on 31 March 2017
Permanent posts Contract
posts
Critical occupation Number of
posts Number of posts filled
Vacancy rate
Number of
contract posts filled
Number of posts filled
additional to establishment
IT Specialists 278 237 41 0 0 Economists 62 54 8 0 0 Statisticians and related professionals 501 430 71 1 0 Graphic Designers 6 6 0 0 0 Total 847 727 14 1 0 Note: * The number of critical posts changed due to updating of job titles in 2016. * Clerical staff associated with Statisticians are not included. * The one contract post is vacant and has been abolished as from 1 April 2017.
3.3 Filling of SMS posts
Table 3.3.1 – SMS post information as on 31 March 2017
SMS level
Total number of
funded SMS posts
Total number of SMS posts
filled % of SMS
posts filled
Total number of SMS posts
vacant % of SMS
posts vacant Director-General/Head of Department 1 1 100 0 0 Salary level 16 0 0 0 0 0 Salary level 15 9 6 67 3 33 Salary level 14 57 49 86 8 16 Salary level 13 198 171 86 27 16 Total 265 227 86 38 14 Note: * Although some of the SMS posts reflect as being filled, they are filled with lower levels, due to operational reasons. * Two salary level 12 posts, one salary level 11 post and one salary level 1 post are sitting against salary level 13 posts.
Table 3.3.2 – SMS post information as on 30 September 2016
SMS level
Total number of
funded SMS posts
Total number of SMS posts
filled % of SMS
posts filled
Total number of SMS posts
vacant % of SMS
posts vacant Director-General/Head of Department 1 1 100 0 0 Salary level 16 0 0 0 0 0 Salary level 15 9 6 67 3 33 Salary level 14 57 49 86 8 14 Salary level 13 198 174 88 24 12 Total 265 230 87 35 13 Note: * Although some of the SMS posts reflect as being filled, they are filled with lower levels, due to operational reasons. * Two salary level 12 posts, one salary level 11 post and one salary level 1 post are sitting against salary level 13 posts.

114
Table 3.3.3 – Advertising and filling of SMS posts for the period 1 April 2016 to 31 March 2017
SMS level
Number of vacancies per level advertised in 6 months of becoming
vacant
Number of vacancies per level filled in
6 months of becoming vacant
Number of vacancies per level not filled in
6 months but filled in 12 months
Director-General/Head of Department 0 0 0 Salary level 16 0 0 0 Salary level 15 0 0 0 Salary level 14 6 0 1 Salary level 13 8 1 0 Total 14 1 1
Table 3.3.4 – Reasons for not having complied with the filling of funded SMS posts – advertised within 6 months and filled within 12 months after becoming vacant for the period 1 April 2016 to 31 March 2017
Reasons for vacancies not filled within six months Filling of posts in Stats SA has been put on hold in 2016 due to budget cuts by National Treasury Reasons for vacancies not filled within twelve months Some positions were re-advertised as the first recruitment process did not yield positive results
Table 3.3.5 – Disciplinary steps taken for not complying with the prescribed timeframes for filling SMS posts within 12 months for the period 1 April 2016 to 31 March 2017
Reasons for vacancies not advertised within six months None Reasons for vacancies not filled within six months None

115
3.4 Job evaluation
Table 3.4.1 – Job evaluation by salary band for the period 1 April 2016 to 31 March 2017
Posts upgraded Posts downgraded
Salary band
Number of permanent
posts
Number of posts
evaluated
% of posts evaluated by salary band
Number of posts
upgraded
% of upgraded
posts evaluated
Number of
posts downgraded
% of downgraded
posts evaluated
Levels 1–2 88 0 0,0 0 0,0 0 0,0 Levels 3–5 259 0 0,0 0 0,0 0 0,0 Levels 6–8 1 738 0 0,0 0 0,0 0 0,0 Levels 9–12 1 161 0 0,0 0 0,0 0 0,0 SMS Band A 198 0 0,0 0 0,0 0 0,0 SMS Band B 57 0 0,0 0 0,0 0 0,0 SMS Band C 9 0 0,0 0 0,0 0 0,0 SMS Band D 1 0 0,0 0 0,0 0 0,0 Total 3 511 0 0,0 0 0,0 0 0,0 Note: * Due to budget cuts by National Treasury, job evaluations were not done.
Table 3.4.2 – Profile of employees whose positions were upgraded due to their posts being upgraded for the period 1 April 2016 to 31 March 2017
Beneficiaries African Indian Coloured White Total Female 0 0 0 0 0 Male 0 0 0 0 0 Total 0 0 0 0 0 Employees with a disability 0 0 0 0 0 Note: * Due to budget cuts by National Treasury, job evaluations were not done and no upgrades were implemented.
Table 3.4.3 – Employees with salary level higher than those determined by job evaluation by occupation for the period 1 April 2016 to 31 March 2017 (in terms of PSR 1.V.C.3)
Occupation Number of employees
Job evaluation level
Remuneration level
Reason for deviation
Professionals 1 11 12 Headhunting Total number of employees whose salaries exceeded the level determined by job
evaluation in 2016/17 1 Percentage of total employment 0,03

116
Table 3.4.4 – Profile of employees who have salary levels higher than those determined by job evaluation for the period 1 April 2016 to 31 March 2017 (in terms of PSR 1.V.C.3)
Beneficiaries African Indian Coloured White Total Female 1 0 0 0 1 Male 0 0 0 0 0 Total 1 0 0 0 1 Employees with a disability 0 0 0 0 0
3.5 Employment changes
Table 3.5.1 – Annual turnover rates by salary band for the period 1 April 2016 to 31 March 2017
Salary band
Number of employees per
band as at 1 April 2016
Appointments and transfers
into the department
Terminations and transfers
out of the department Turnover rate
Permanent staff Levels 1–2 156 1 1 0,6 Levels 3–5 212 5 12 5,5 Levels 6–8 1 609 42 39 2,4 Levels 9–12 989 12 44 4,4 SMS Band A 170 5 7 4,0 SMS Band B 52 1 5 9,4 SMS Band C 6 0 0 0,0 SMS Band D 1 0 0 0,0 Total 3 195 66 108 3,3 Temporary staff Levels 1–2 15 694 676 16 370 100,0 Levels 3–5 70 4 74 100,0 Levels 6–8 11 0 11 100,0 Levels 9–12 1 0 1 100,0 SMS Band A 0 1 1 100,0 SMS Band B 0 0 0 0,0 SMS Band C 0 0 0 0,0 SMS Band D 0 0 0 0,0 Total 15 776 681 16 457 100,0

117
Table 3.5.2 – Annual turnover rates by critical occupation for the period 1 April 2016 to 31 March 2017
Occupation
Number of employees per occupation as
at 1 April 2016
Appointments and transfers
into the department
Terminations and transfers
out of the department Turnover rate
IT Specialists (permanent staff) 278 9 8 2,8 IT Specialists (temporary staff) 0 0 0 0,0 Economists (permanent staff) 62 1 5 7,9 Economists (temporary staff) 0 0 0 0,0 Statisticians and related professionals (permanent staff) 501 6 24 4,7 Statisticians and related professionals (temporary staff) 1 0 0 0,0 Graphic Designers 6 0 1 16,7 Total 848 16 38 4,4 Note: * Statisticians and related professionals include Survey Statisticians, Statistical Advisors, Methodologists, and Demographers. * Clerical staff associated with Statisticians are not included. * The one contract post is vacant and has been abolished as from 1 April 2017. * IT Specialists (including Geography related posts). * Number of critical posts changed due to continuous updating of job titles.
Table 3.5.3 – Reasons why staff are leaving the department for the period 1 April 2016 to 31 March 2017
Termination type Number % of total
resignations % of total
employment Permanent staff Death 12 11,1 0,4 Resignation 47 43,5 1,4 Dismissal – operational changes 0 0,0 0,0 Dismissal – misconduct 0 0,0 0,0 Dismissal – inefficiency 0 0,0 0,0 Discharged due to ill health 0 0,0 0,0 Retirement 17 15,7 0,5 Transfer out of Department 32 29,6 1,0 Total 108 100,0 3,8 Temporary staff Death 2 0,0 0,0 Resignation 236 1,4 1,4 Discharged due to ill health 2 0,0 0,0 Dismissal – misconduct 2 0,0 0,0 Retirement 1 0,0 0,0 Expiry of contract 16 214 98,5 98,5 Total 16 457 100,0 100,0

118
Table 3.5.4 – Promotions by critical occupation for the period 1 April 2016 to 31 March 2017
Occupation
Employees as at 1 April
2016
Promotion to another
salary level
Salary level promotion
as % of employees
by occupation
Progression to another
notch within salary level
Notch progression
as % of employees
by occupation
IT Specialists (permanent staff) 278 14 5,0 202 72,7 IT Specialists (temporary staff) 0 0 0,0 0 0,0 Economists (permanent staff) 62 5 8,1 40 64,5 Statisticians and related professionals (permanent
staff) 501 28 5,6 497 99,2 Statisticians and related professionals (temporary
staff) 1 0 0,0 0 0,0 Graphic Designers 6 0 0,0 5 83,3 Total 848 47 5,5 744 87,7 Note: * Pay progression is linked to performance appraisal for the period of 2015/16. * Statisticians and related professionals include Survey Statisticians, Statistical Advisors, Methodologists, and Demographers. * Clerical staff associated with Statisticians are not included. * IT Specialists (including Geography related posts). * Number of critical posts changed due to continuous updating of job titles.
Table 3.5.5 – Promotions by salary band for the period 1 April 2016 to 31 March 2017
Salary band
Employees as at 1 April
2016
Promotion to another
salary level
Salary level promotion
as % of employees
by salary level
Progression to another
notch within salary level
Notch progression
as % of employees
by salary band
Levels 1–2 (temporary staff) 101 55 54,5 0 0,0 Levels 3–5 (permanent staff) 368 9 2,4 185 50,3 Levels 3–5 (temporary staff) 17 0 0,0 0 0,0 Levels 6–8 (permanent staff) 1 609 27 1,7 1 409 87,6 Levels 6–8 (temporary staff) 1 0 0,0 0 0,0 Levels 9–12 (permanent staff) 989 15 1,5 849 85,8 Levels 9–12 (temporary staff) 2 0 0,0 0 0,0 SMS levels 13–16 (permanent staff) 229 3 0,0 191 83,4 SMS levels 13–16 (temporary staff) 0 0 0,0 0 0,0 Total 3 316 109 3,3 2 634 79,4 Note: * Pay progression is linked to performance appraisal for the period of 2015/16.
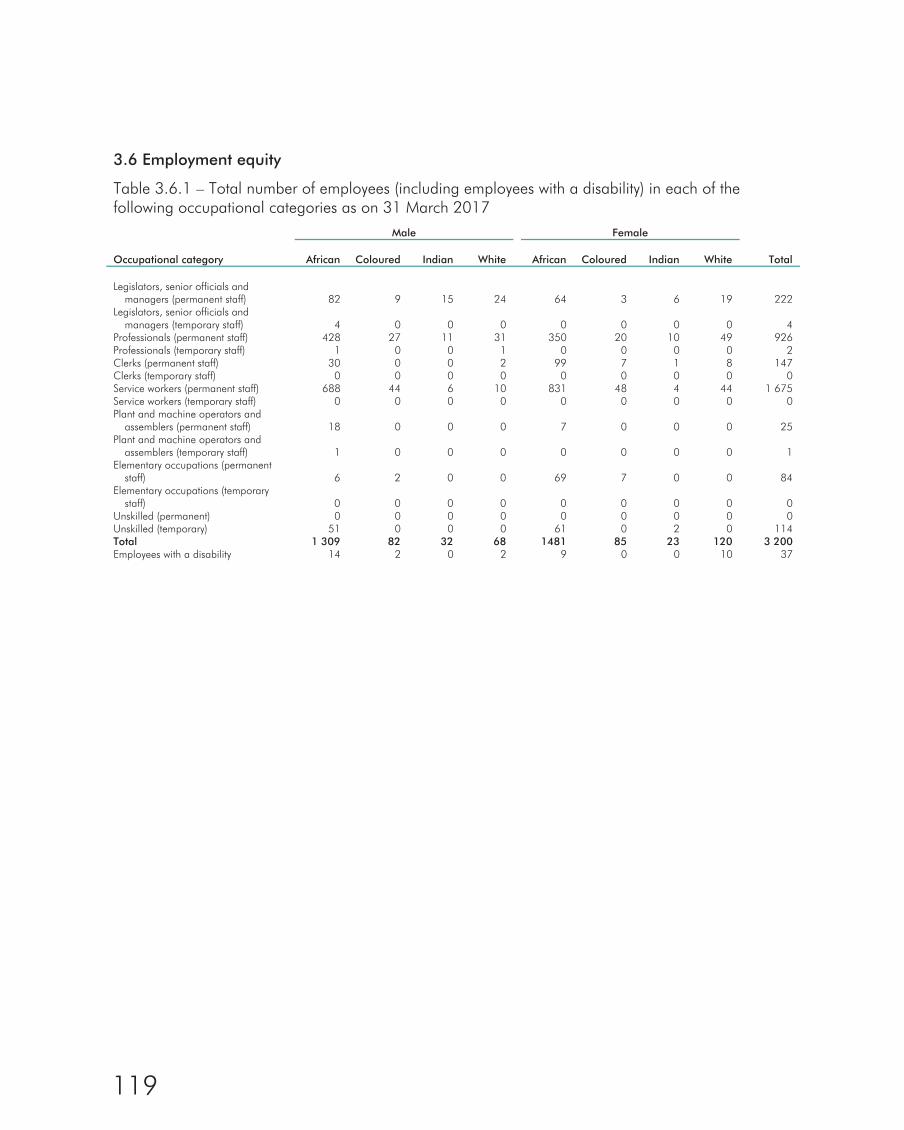
119
3.6 Employment equity
Table 3.6.1 – Total number of employees (including employees with a disability) in each of the following occupational categories as on 31 March 2017
Male Female Occupational category African Coloured Indian White African Coloured Indian White Total Legislators, senior officials and
managers (permanent staff) 82 9 15 24 64 3 6 19 222 Legislators, senior officials and
managers (temporary staff) 4 0 0 0 0 0 0 0 4 Professionals (permanent staff) 428 27 11 31 350 20 10 49 926 Professionals (temporary staff) 1 0 0 1 0 0 0 0 2 Clerks (permanent staff) 30 0 0 2 99 7 1 8 147 Clerks (temporary staff) 0 0 0 0 0 0 0 0 0 Service workers (permanent staff) 688 44 6 10 831 48 4 44 1 675 Service workers (temporary staff) 0 0 0 0 0 0 0 0 0 Plant and machine operators and
assemblers (permanent staff) 18 0 0 0 7 0 0 0 25 Plant and machine operators and
assemblers (temporary staff) 1 0 0 0
0
0
0
0 1 Elementary occupations (permanent
staff) 6 2 0 0
69
7
0
0 84 Elementary occupations (temporary
staff) 0 0 0 0
0
0
0
0 0 Unskilled (permanent) 0 0 0 0 0 0 0 0 0 Unskilled (temporary) 51 0 0 0 61 0 2 0 114 Total 1 309 82 32 68 1481 85 23 120 3 200 Employees with a disability 14 2 0 2 9 0 0 10 37

120
Table 3.6.2 – Total number of employees (including employees with a disability) in each of the following occupational bands as on 31 March 2017
Male Female Occupational level African Coloured Indian White African Coloured Indian White Total Top management (permanent staff) 1 1 0 1 1 0 1 1 6 Top management (temporary staff) 1 0 0 0 0 0 0 0 1 Senior management (permanent staff) 81 8 15 23 62 3 5 18 215 Senior management (temporary staff) 2 0 0 0 0 0 0 0 2 Professionally qualified and
experienced specialists and mid-management (permanent staff) 213 16 9 23 149 7 8 33 458
Professionally qualified and experienced specialists and mid-management (temporary staff) 1 0 0 1 0 0 0 0 2
Skilled technical and academically qualified workers, junior management, supervisors, foremen (permanent staff) 859 54 8 20 1 039 61 6 67 2 114
Skilled technical and academically qualified workers, junior management, supervisors, foremen (temporary staff) 0 0 0 0 0 0 0 0 0
Semi-skilled and discretionary decision-making (permanent staff) 92 1 0 0 96 7 1 1 198
Semi-skilled and discretionary decision-making (temporary staff) 1 0 0 0 0 0 0 0 1
Unskilled (permanent staff) 6 2 0 0 73 7 0 0 88 Unskilled (temporary staff) 52 0 0 0 61 0 2 0 115 Total 1 309 82 32 68 1 481 85 23 120 3 200 Employees with a disability 14 2 0 2 9 0 0 10 37


122
Table 3.6.3 – Recruitment for the period 1 April 2016 to 31 March 2017
Male Female
Occupational level African Coloured Indian White African Coloured Indian White Total
Top management (permanent staff) 1 0 0 0 0 0 0 0 1 Top management (temporary staff) 0 0 0 0 0 0 0 0 0 Senior management (permanent staff) 5 0 0 0 1 0 0 0 6 Senior management (temporary staff) 1 0 0 0 0 0 0 0 1 Professionally qualified and
experienced specialists and mid-management (permanent staff) 8 0 0 0 4 0 0 0 12
Professionally qualified and experienced specialists and mid-management (temporary staff) 0 0 0 0 0 0 0 0 0
Skilled technical and academically qualified workers, junior management, supervisors, foremen (permanent staff) 18 0 0 1 21 1 0 1 42
Skilled technical and academically qualified workers, junior management, supervisors, foremen (temporary staff) 0 0 0 0 0 0 0 0 0
Semi-skilled and discretionary decision-making (permanent staff) 4 0 0 0 1 0 0 0 5
Semi-skilled and discretionary decision-making (temporary staff) 214 13 0 1 433 19 0 0 680
Unskilled and defined decision-making (permanent staff) 0 0 0 0 1 0 0 0 1
Unskilled and defined decision-making (temporary staff) 0 0 0 0 0 0 0 0 0
Total 251 13 0 2 461 20 0 1 748 Employees with a disability 0 0 0 0 0 0 0 0 0
Table 3.6.4 – Promotions for the period 1 April 2016 to 31 March 2017
Male Female Occupational level African Coloured Indian White African Coloured Indian White Total Top management (permanent staff) 0 0 0 0 0 0 0 0 0 Senior management (permanent staff) 3 0 0 1 1 0 0 0 5 Professionally qualified and
experienced specialists and mid-management (permanent staff) 18 0 0 0 22 0 1 0 41
Professionally qualified and experienced specialists and mid-management (temporary staff) 0 0 0 0 0 0 0 0 0
Skilled technical and academically qualified workers, junior management, supervisors, foremen (permanent staff) 9 0 0 0 18 0 0 0 27
Skilled technical and academically qualified workers, junior management, supervisors, foremen (temporary staff) 17 0 0 0 33 0 0 0 50
Semi-skilled and discretionary decision-making (permanent staff) 3 0 0 0 2 0 0 0 5
Semi-skilled and discretionary decision-making (temporary staff) 0 0 0 0 0 0 0 0 0
Unskilled and defined decision-making (temporary staff) 0 0 0 0 3 0 0 0 3
Total 50 0 0 1 79 0 1 0 131 Employees with a disability 0 0 0 0 0 0 0 0 0

123
Table 3.6.5 – Terminations for the period 1 April 2016 to 31 March 2017
Male Female Occupational level African Coloured Indian White African Coloured Indian White Total Top management (permanent staff) 1 0 0 0 0 0 0 0 1 Top management (temporary staff) 0 0 0 0 0 0 0 0 0 Senior management (permanent staff) 7 0 0 1 2 0 0 2 12 Senior management (temporary staff) 0 0 0 0 0 0 0 0 0 Professionally qualified and
experienced specialists and mid-management (permanent staff) 20 0 0 1 20 0 0 3 44
Professionally qualified and experienced specialists and mid-management (temporary staff) 0 0 0 0 0 0 0 0 0
Skilled technical and academically qualified workers, junior management, supervisors, foremen (permanent staff) 18 1 0 1 16 0 0 3 39
Skilled technical and academically qualified workers, junior management, supervisors, foremen (temporary staff) 57 2 0 0 25 2 0 0 86
Semi-skilled and discretionary decision-making (permanent staff) 8 0 0 0 4 0 0 0 12
Semi-skilled and discretionary decision-making (temporary staff) 5 011 480 8 26 10 123 677 6 39 16 370
Unskilled and defined decision-making (permanent) 0 0 0 0 0 0 0 0 0
Unskilled and defined decision-making (temporary staff) 0 0 0 0 0 0 0 0 0
Total 5 122 483 8 29 10 190 679 6 47 16 564 Employees with a disability 0 0 0 0 1 0 0 0 1 Note: * The table excludes interns as they do not fall under a specific occupational level.
Table 3.6.6 – Disciplinary action for the period 1 April 2016 to 31 March 2017
Male Female Disciplinary action African Coloured Indian White African Coloured Indian White Total Total 18 2 0 1 9 2 0 0 32
Table 3.6.7 – Skills development for the period 1 April 2016 to 31 March 2017
Male Female
Occupational category African Coloured Indian White African Coloured Indian White Total Legislators, senior officials and
managers 16 4 4 5 24 0 2 2 57 Professionals 104 11 2 5 138 8 3 11 282 Clerks 99 4 0 0 108 1 2 1 215 Service and sales workers 92 4 0 0 156 20 0 5 277 Machine operators and drivers 120 14 1 1 166 19 0 2 323 Elementary occupations 14 5 0 0 187 30 0 0 236 Total 445 42 7 11 779 78 7 21 1 390 Employees with a disability 2 0 0 0 2 0 0 0 4

124
3.7 Signing of performance agreements by SMS members
Table 3.7.1 – Signing of performance agreements by SMS members as on 31 May 2016
SMS level
Total number of funded SMS
posts per level
Total number of SMS members
per level
Total number of signed
performance agreements per
level
Signed performance
agreements as % of total
number of SMS members
Director-General/Head of Department (HOD) 1 1 0 0 Salary level 16, but not HOD 0 0 0 0 Salary level 15 8 6 6 100 Salary level 14 56 50 49 98 Salary level 13 200 169 168 99 Total 265 226 223 99
Table 3.7.2 – Reasons for not having concluded performance agreements for all SMS members as on 31 May 2016
The preparations to relocate to ISIbalo House delayed the submission of performance agreements for some Senior Managers
Table 3.7.3 – Disciplinary steps taken against SMS members for not having concluded Performance Agreements as on 31 May 2016
None. SMS members who had not concluded their performance agreements by 31/05/2017 showed good cause for not meeting the deadline.
3.8 Performance rewards
Table 3.8.1 – Performance rewards by race, gender and disability for the period 1 April 2015 to 31 March 20163
3 Performance rewards are linked to the 2015/16 performance cycle.
Number of beneficiaries
Total number of employees in
group % of total in
group Total cost
R’000
Average cost per employee
R’000 African, female 1 440 891 61,9 8 143 9 African, male 1 266 752 59,4 8 228 11 Indian, female 21 17 81,0 338 20 Indian, male 32 22 68,8 419 19 Coloured, female 84 50 59,5 491 10 Coloured, male 83 45 54,2 564 13 White, female 117 96 82,1 1 398 15 White, male 68 39 57,4 830 21 Employees with a disability 38 17 44,7 185 11 Total 3 149 1 929 61,3 20 597 11

125
Table 3.8.2 – Performance rewards by salary band for personnel below Senior Management Service for the period 1 April 2015 to 31 March 2016
Salary band
Total number of
beneficiaries Number of employees % of total
Total cost R’000
Average cost per employee
R’000
Total cost as % of total personnel
expenditure Levels 1–2 49 102 48,0 117 2 0,1 Levels 3–5 116 214 54,2 434 4 0,1 Levels 6–8 942 1 611 58,5 5 954 6 0,1 Levels 9–12 698 991 70,4 10 463 15 0,1 Total 1 805 2 918 61,9 16 968 9 0,1
Table 3.8.3 – Performance rewards by critical occupation for the period 1 April 2015 to 31 March 2016
Critical occupation
Total number of
beneficiaries Number of employees % of total
Total cost R’000
Average cost per employee
R’000 Economists 44 52 84,6 685 16 IT Specialists 104 181 57,5 1 226 12 Statisticians 296 708 41,8 4 074 14 Graphic Designers 4 6 66,7 69 17 Total 448 947 47,3 6 054 14
Table 3.8.4 – Performance-related rewards (cash bonus) by salary band for Senior Management Service for the period 1 April 2015 to 31 March 2016
SMS band Number of
beneficiaries Total
employment % of total
within band Total cost
R’000
Average cost per employee
R’000 Band A 173 91 52,6 2 490 27 Band B 51 28 54,9 878 31 Band C 6 5 83,3 261 52 Band D 1 0 0,0 0 0 Total 231 124 53,7 3 629 29


127
3.9 Foreign workers
Table 3.9.1 – Foreign workers by salary band for the period 1 April 2016 to 31 March 2017
1 April 2016 31 March 2017 Change Salary band Number % of total Number % of total Number % changed Levels 1–2 (temporary staff) 1 9,1 0 0,0 1 100,0 Levels 3–5 (permanent staff) 0 0,0 0 0,0 0 0,0 Levels 3–5 (temporary staff) 0 0,0 0 0,0 0 0,0 Levels 6–8 (permanent staff) 2 18,2 2 22,2 0 0,0 Levels 6–8 (temporary staff) 0 0,0 0 0,0 0 0,0 Levels 9–12 (permanent staff) 3 27,3 3 33,3 0 0,0 Levels 9–12 (temporary staff) 0 0,0 0 0,0 0 0,0 SMS levels 13–16 (permanent staff) 5 45,5 4 44,4 1 20,0 SMS levels 13–16 (temporary staff) 0 0,0 0 0,0 0 0,0 Total 11 100,0 9 100,0 2 18,2 Note: * Changes to salary levels 13–16 due to one Level 13 resignation and changes to salary levels 1–2 due to one Level 1 Intern resignation.
Table 3.9.2 – Foreign workers by major occupation for the period 1 April 2016 to 31 March 2017
1 April 2016 31 March 2017 Change Major occupation Number % of total Number % of total Number % changed Administrative office workers 3 27,3 2 22,2 1 33,3 Information technology personnel 0 0,0 0 0,0 0 0,0 Professionals and managers 8 72,7 7 77,8 1 12,5 Total 11 100,0 9 100,0 2 18,2
3.10 Leave utilisation
Table 3.10.1 – Sick leave for the period 1 January 2016 to 31 December 2016
Salary band Total days
Number of sick leave
taken with medical
certification
% of days with
medical certification
Number of employees using sick leave with
medical certification
% of total employees using sick
leave
Number of employees using sick
leave
Average days per
employee
Estimated cost
R’000 Levels 1–2 (permanent staff) 674 560 83,1 45 2,5 72 9 299 Levels 1–2 (contract staff) 631 324 51,3 75 7,0 202 3 239 Levels 3–5 (permanent staff) 1 688 1 212 71,8 80 6,5 189 9 1 186 Levels 3–5 (temporary staff) 74 42 56,8 8 0,7 21 4 46 Levels 6–8 (permanent staff) 13 423 10 122 75,4 646 48,3 1 396 10 14 787 Levels 6–8 (temporary staff) 8 5 62,5 2 0,2 5 2 7 Levels 9–12 (permanent staff) 7 108 5 401 76,0 422 29,1 842 8 15 546 Levels 9–12 (temporary staff) 12 12 100,0 2 0,1 2 6 34 SMS levels 13–16 (permanent
staff) 935 664 71,0 78 5,6 163 6 3 581 SMS levels 13–16 (temporary
staff) 0 0 0,0 0 0,0 0 0 0 Total 24 553 18 342 74,7 1 358 100,0 2 892 8 35 728


129
Table 3.10.2 – Disability leave (temporary and permanent) for the period 1 January 2016 to 31 December 2016
Salary band Total days
% of days with
medical certification
Number of employees
using disability
leave
% of total employees
using disability
leave
Average days per
employee
Estimated cost
R’000 Levels 1–2 94 100,0 2 4,5 47 42 Levels 3–5 0 0,0 0 0,0 0 0 Levels 6–8 702 100,0 26 59,1 27 726 Levels 9–12 467 100,0 15 34,1 31 1 015 SMS levels 13–16 0 0,0 0 0,0 0 0 Contract (1–2) 5 100,0 1 2,3 5 2 Contract (3–5) 0 0,0 0 0,0 0 0 Contract (9–12) 0 0,0 0 0,0 0 0 Total 1 268 100,0 44 100,0 29 1 785
Table 3.10.3 – Annual leave for the period 1 January 2016 to 31 December 2016
Salary band Total days
taken
Average number of
days per employee
Number of employees
who took leave
Levels 1–2 (permanent staff) 1 382 16 87 Levels 1–2 (temporary staff) 2 164 8 276 Levels 3–5 (permanent staff) 3 703 17 215 Levels 3–5 (temporary staff) 190 9 21 Levels 6–8 (permanent staff) 28 748 18 1 624 Levels 6–8 (temporary staff) 21 3 8 Levels 9–12 (permanent staff) 19 162 19 999 Levels 9–12 (temporary staff) 44 11 4 SMS levels 13–16 (permanent staff) 4 829 21 227 SMS levels 13–16 (temporary staff) 52 26 2 Total 60 295 17 3 463
Table 3.10.4 – Capped leave for the period 1 January 2016 to 31 December 2016
Salary band Total days of
capped leave taken
Number of employees who utilised capped
leave
Average number of days taken per
employee
Average capped leave per
employee as at 31 December 2016
Levels 3–5 51 3 17 3 Levels 6–8 65 3 22 3 Levels 9–12 229 2 115 2 SMS levels 13–16 370 5 74 5 Contract levels (3–16) 0 0 0 1 Total 715 13 55 13

130
Table 3.10.5 – Leave payouts for the period 1 April 2016 to 31 March 2017
Total amount R’000
Number of employees
Average payment per
employee (R)
Leave payouts for 2016/17 due to non-utilisation of leave for previous cycle 0 0 0 Capped leave payouts on termination of service for 2016/17 1 682 13 129 371 Current leave payouts on termination of service for 2016/17 1 569 57 275 526 Total 3 251 70 46 440
3.11 HIV/AIDS and health promotion programmes
Table 3.11.1 – Steps taken to reduce the risk of occupational exposure
Units/categories of employees identified to be at high risk of contracting HIV and related diseases (if any)
Key steps taken to reduce the risk
Fieldworkers are at risk of physical abuse such as rape which could expose them to HIV infection
A training module was developed for fieldworkers to mitigate this risk

131
3.11.2 – Details of health promotion and HIV/AIDS programmes
The following programmes are in place: Condom distribution 24-hour counselling service Voluntary HIV counselling and testing HIV, TB and STI awareness Promotion of medical male circumcision Youth and sexuality
Question Yes/ No Details, if yes 1. Has the department designated a member of the SMS to
implement the provisions contained in Part VI(E) of Chapter 1 of the Public Service Regulations, 2016? If so, provide the name and position of the particular SMS member
YES Ms Xoli Kunene, Director: Employee Relations
2. Does the department have a dedicated unit or have you
designated specific staff members to promote the health and well-being of your employees? If so, indicate the number of employees who are involved in this task and the annual budget that is available for this purpose
YES There is an Employee Health and Wellness Unit which comprises 4 full-time EHW Professionals. In addition to the above, a private health and wellness company provides 24-hour counselling to staff members and their dependants. The annual budget is R2 135 000
3. Has the department introduced an Employee Assistance or
Health Promotion Programme for your employees? If so, indicate the key elements/services of the programme
YES 24-hour counselling and professional support, health and wellness programmes, HIV/AIDS programme, stress management programmes, retirement planning and life skills training
4. Has the department established (a) committee(s) as contemplated
in Part VI E.5(e) of Chapter 1 of the Public Service Regulations, 2016? If so, please provide the names of the members of the committee and the stakeholders that they represent
YES There is an HIV/AIDS Committee representing various clusters. It comprises the following members: Ms N Baholo, Ms E Mkhabela, Ms G Makgato, Mr J Manganyi, Ms O More, Mr J Masangu, Ms C Malinga, Ms D Ramatlhape
5. Has the department reviewed the employment policies and
practices of your department to ensure these do not unfairly discriminate against employees on the basis of their HIV status? If so, list the employment policies/ practices so reviewed
YES The bereavement and EAP policies have been reviewed in line with the DPSA Employee Health and the HIV/AIDS and TB Management Frameworks
6. Has the department introduced measures to protect HIV from
discrimination? If so, list the key elements of these measures YES The HIV and AIDS programme comprises the following preventive
measures: Counselling and support as well as HIV campaigns, and the implementation of the HIV and AIDS policy which addresses issues of discrimination and stigma associated with HIV. There is also an HIV Programme for teenagers which addresses HIV, Sexuality and Peer Group Pressure
7. Does the department encourage its employees to undergo
voluntary counselling and testing (VCT)? If so, list the results that you have achieved
YES 4 voluntary HIV Counselling and Testing (HCT) sessions were conducted and 215 staff members participated in the HCT programme
8. Has the department developed measures/indicators to monitor
and evaluate the impact of your health promotion programme? If so, list these measures/indicators
YES Measures/Indicators: • 304 employees used the health promotion service • 290 employees participated in the campaigns • 61 000 condoms distributed. 215 employees voluntarily tested
for HIV
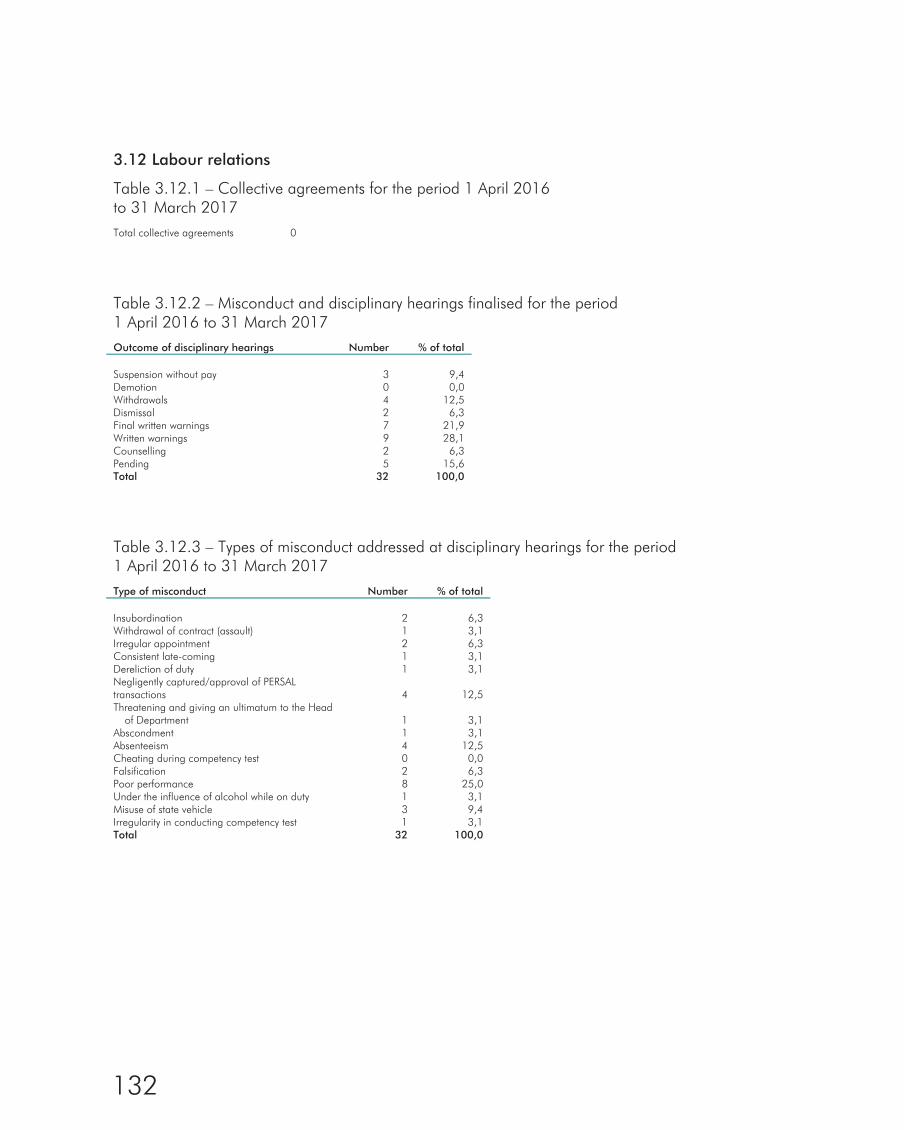
132
3.12 Labour relations
Table 3.12.1 – Collective agreements for the period 1 April 2016 to 31 March 2017
Total collective agreements 0
Table 3.12.2 – Misconduct and disciplinary hearings finalised for the period 1 April 2016 to 31 March 2017
Outcome of disciplinary hearings Number % of total Suspension without pay 3 9,4 Demotion 0 0,0 Withdrawals 4 12,5 Dismissal 2 6,3 Final written warnings 7 21,9 Written warnings 9 28,1 Counselling 2 6,3 Pending 5 15,6 Total 32 100,0
Table 3.12.3 – Types of misconduct addressed at disciplinary hearings for the period 1 April 2016 to 31 March 2017
Type of misconduct Number % of total Insubordination 2 6,3 Withdrawal of contract (assault) 1 3,1 Irregular appointment 2 6,3 Consistent late-coming 1 3,1 Dereliction of duty 1 3,1 Negligently captured/approval of PERSAL transactions 4 12,5 Threatening and giving an ultimatum to the Head
of Department 1 3,1 Abscondment 1 3,1 Absenteeism 4 12,5 Cheating during competency test 0 0,0 Falsification 2 6,3 Poor performance 8 25,0 Under the influence of alcohol while on duty 1 3,1 Misuse of state vehicle 3 9,4 Irregularity in conducting competency test 1 3,1 Total 32 100,0

133
Table 3.12.4 – Grievances lodged for the period 1 April 2016 to 31 March 2017
Grievances lodged Number % of total Number of grievances resolved 50 92,6 Number of grievances not resolved 4 7,4 Total number of grievances lodged 54 100,0
Table 3.12.5 – Disputes lodged with councils for the period 1 April 2016 to 31 March 2017
Disputes lodged Number % of total Disputes in favour of the employee 3 11,1 Disputes in favour of the employer 6 22,2 Cases withdrawn 3 11,1 Settlement 3 11,1 Cases pending 12 44,4 Total 27 100,0
Table 3.12.6 – Strike actions for the period 1 April 2016 to 31 March 20174
Strike actions Total Total number of working days lost 1 Total cost of working days lost 3 001 Amount recovered as a result of no work no pay 3 001
Table 3.12.7 – Precautionary suspensions for the period 1 April 2016 to 31 March 2017
Precautionary suspensions Total Number of people suspended 4 Number of people whose suspension exceeded 30 days 4 Total number of days suspended 435 Average number of days suspended 109 Total cost of suspensions 789 210
4 5 officials were on strike on 22 February 2017 for 5,67 hours in total.

134
3.13 Skills development
Table 3.13.1 – Training needs identified for the period 1 April 2016 to 31 March 2017
Training needs identified at start of reporting period
Occupational category Gender
Number of employees as
at 1 April 2016 (permanent
and contract) Learnerships
(Pilot)
Skills programmes
and other short courses
Other forms of training Total
Legislators, senior officials and Female 94 0 30 0 30
managers Male 134 0 26 0 26 Professionals Female 483 0 190 0 190
Male 503 0 170 0 170 Clerks Female 306 0 140 0 140
Male 210 0 120 0 120 Plant and machine operators and Female 665 0 220 0 220
assemblers Male 572 0 190 0 190 Service and sales workers Female 71 0 120 0 120
Male 60 0 80 0 80 Elementary occupations Female 90 0 50 0 50
Male 12 0 20 0 20 Gender subtotals Female 1 709 0 750 0 750
Male 1 491 0 606 0 606 Total 3 200 0 1 356 0 1 356
Note: * The table excludes interns as they do not fall under a specific occupational level.
Table 3.13.2 – Training provided for the period 1 April 2016 to 31 March 2017
Training provided within the reporting period
Occupational level Gender
Number of employees as
at 1 April 2016 (permanent
and contract) Learnerships
Skills programmes
and other short courses
Other forms of training Total
Legislators, senior officials and Female 94 0 35 0 35
managers Male 135 0 31 0 31 Professionals 9–12 Female 484 0 185 0 185
Male 507 0 165 0 165 Clerks 7–8 Female 313 0 132 0 132
Male 222 0 115 0 115 Plant and machine operators and Female 621 0 160 0 160
assemblers Male 530 0 176 0 176 Service and sales workers Female 84 0 163 0 163
Male 62 0 94 0 94 Elementary occupations Female 169 0 105 0 105
Male 95 0 29 0 29 Gender subtotals Female 1 765 0 780 0 780
Male 1 551 0 610 0 610 Total 3 316 0 1 390 0 1 390
Note: * The table excludes interns as they do not fall under a specific occupational level.


136
3.14 Injury on duty
Table 3.14.1 – Injury on duty for the period 1 April 2016 to 31 March 2017
Nature of injury on duty Number % of total Required basic medical attention only 15 83,3 Temporary total disablement 1 5,6 Permanent disablement 1 5,6 Fatal 1 5,6 Total 18 100,0
3.15 Utilisation of consultants
Table 3.15.1 – Report on consultant appointments using appropriated funds for the period 1 April 2016 to 31 March 2017
Project title Number of companies
Total number of
consultants that worked
on the project
Contract value R’000
Amount paid
R’000 Implement National Accounts Capacity Development
Project 4 4 9 366 8 064 Overall evaluation on the acceptance and validity of
results of Community Survey 2016 1 1 449 394 To develop and implement data visualisation instrument
to communicate Community Survey 2016 results 6 6 6 096 4 423 Procurement of the Stats SA Head Office building 5 10 6 514 4 593 Total 16 21 22 425 17 474
Table 3.15.2 – Analysis of consultant appointments using appropriated funds, in terms of Historically Disadvantaged Individuals (HDIs) for the period 1 April 2016 to 31 March 2017
Project title % ownership by
HDI groups % management
by HDI group
Number of consultants
from HDI groups that
worked on the project
Implement National Accounts Capacity Development
Project 0 0 0 To develop and implement data visualisation instrument
to communicate Community Survey 2016 results 0 0 0 Procurement process of the new building 40 100 6

137
Table 3.15.3 – Report on consultant appointments using donor funds for the period 1 April 2016 to 31 March 2017
Project title
Total number of consultants that worked on the
project Contract value
R’000
Amount paid
R’000 African Development Bank statistics capacity building
grant in region member countries overall acceptance of the 2016 Community Survey 1 597 597
Appointment of translators 2 64 64 Total 3 661 661
Table 3.15.4 – Analysis of consultant appointments using donor funds in terms of HDIs for the period 1 April 2016 to 31 March 2017
Project title % ownership by
HDI groups % management
by HDI group
Number of consultants
from HDI groups that
worked on the project
African Development Bank statistics capacity building
grant in region member countries overall acceptance of the 2016 Community Survey 0,0 0,0 0
Appointment of translators 0,0 0,0 0 Total 0,0 0,0 0
3.16 Employee initiated severance packages
Table 3.16.1 – Employee severance packages for the period 1 April 2016 to 31 March 2017
Nature of injury on duty Number % of total Levels 3–5 (permanent staff) 0 0,0 Levels 6–8 (permanent staff) 0 0,0 Levels 9–12 (permanent staff) 0 0,0 SMS levels 13–16 (permanent staff) 0 0,0 Total 0 0,0


Section 5: Financial information

Statistics South Africa – Vote 12
140
Report of the auditor-general to Parliament on Vote No. 12: Statistics South Africa
Report on the audit of the financial statements
Unqualified opinion
1. I have audited the financial statements of Statistics South Africa set out on pages 145 to 227 which comprise the appropriation statement, the statement of financial position as at 31 March 2017, and the statement of financial performance, statement of changes in net assets, and cash flow statement for the year then ended, as well as the notes to the financial statements, including a summary of significant accounting policies.
2. In my opinion, the financial statements present fairly, in all material respects, the financial position of Statistics South Africa as at 31 March 2017, and its financial performance and cash flows for the year then ended in accordance with Modified Cash Standard (MCS) and the requirements of the Public Finance Management Act of South Africa, 1999 (Act No. 1 of 1999) (PFMA).
Basis for opinion
3. I conducted my audit in accordance with the International Standards on Auditing (ISAs). My responsibilities under those standards are further described in the auditor-general’s responsibilities for the audit of the financial statements section of my report.
4. I am independent of the department in accordance with the International Ethics Standards Board for
Accountants’ Code of ethics for professional accountants (IESBA code) together with the ethical requirements that are relevant to my audit in South Africa. I have fulfilled my other ethical responsibilities in accordance with these requirements and the IESBA code.
5. I believe that the audit evidence I have obtained is sufficient and appropriate to provide a basis for my
opinion.
Responsibilities of accounting officer for the financial statements
6. The accounting officer is responsible for the preparation and fair presentation of the financial statements in accordance with Modified Cash Standard (MCS) and the requirements of the Public Finance Management Act of South Africa, 1999 (Act No. 1 of 1999) (PFMA), and for such internal control as the accounting officer determines is necessary to enable the preparation of financial statements that are free from material misstatement, whether due to fraud or error.
7. In preparing the financial statements, the accounting officer is responsible for assessing Statistics South
Africa’s ability to continue as a going concern, disclosing, as applicable, matters relating to going concern and using the going concern basis of accounting unless the accounting officer either intends to liquidate the department or to cease operations, or has no realistic alternative but to do so.
Auditor-general’s responsibilities for the audit of the financial statements
8. My objectives are to obtain reasonable assurance about whether the financial statements as a whole are free from material misstatement, whether due to fraud or error, and to issue an auditor’s report that includes my opinion. Reasonable assurance is a high level of assurance, but is not a guarantee that an audit conducted in accordance with ISAs will always detect a material misstatement when it exists. Misstatements can arise from fraud or error and are considered material if, individually or in the aggregate, they could reasonably be expected to influence the economic decisions of users taken on the basis of these financial statements.

Statistics South Africa – Vote 12
141
9. A further description of my responsibilities for the audit of the financial statements is included in the
annexure to the auditor’s report.
Report on the audit of the annual performance report
Introduction and scope
10. In accordance with the Public Audit Act of South Africa, 2004 (Act No. 25 of 2004) (PAA) and the general notice issued in terms thereof I have a responsibility to report material findings on the reported performance information against predetermined objectives for selected strategic outcome presented in the annual performance report. I performed procedures to identify findings but not to gather evidence to express assurance.
11. My procedures address the reported performance information, which must be based on the approved
performance planning documents of the department. I have not evaluated the completeness and appropriateness of the performance indicators/measures included in the planning documents. My procedures also did not extend to any disclosures or assertions relating to planned performance strategies and information in respect of future periods that may be included as part of the reported performance information. Accordingly, my findings do not extend to these matters.
12. I evaluated the usefulness and reliability of the reported performance information in accordance with the
criteria developed from the performance management and reporting framework, as defined in the general notice, for the following selected strategic outcome presented in the annual performance report of the department for the year ended 31 March 2017:
Strategic outcome Pages in the annual performance report
Strategic outcome 1: An informed nation 58 – 65
13. I performed procedures to determine whether the reported performance information was properly presented
and whether performance was consistent with the approved performance planning documents. I performed further procedures to determine whether the indicators and related targets were measurable and relevant, and assessed the reliability of the reported performance information to determine whether it was valid, accurate and complete.
14. I did not identify any material findings on the usefulness and reliability of the reported performance
information for the following strategic outcome:
• An informed nation
Other matter
15. I draw attention to the matter below:
Achievement of planned targets
16. Refer to the annual performance report on page 32 to 65 for information on the achievement of planned targets for the year and explanations provided for the under/overachievement of a number of targets.

Statistics South Africa – Vote 12
142
Report on audit of compliance with legislation
Introduction and scope
17. In accordance with the PAA and the general notice issued in terms thereof I have a responsibility to report material findings on the compliance of the department with specific matters in key legislation. I performed procedures to identify findings but not to gather evidence to express assurance.
18. I did not identify any instances of material non-compliance with selected specific requirements of applicable
legislation, as set out in the general notice issued in terms of the PAA.
Other information
19. Statistics South Africa’s accounting officer is responsible for the other information. The other information comprises the information included in the annual report which includes the management report for the year, overview of the departmental performance; governance, human resource management, information on transfers and subsidies, a report on the use of foreign aid assistance and information on the management of Private Public Partnership (PPP) agreements as required by the department annual report guide and the audit committee report required by the PFMA. The other information does not include the financial statements, the auditor’s report thereon and the selected strategic outcome presented in the annual performance report that have been specifically reported on in the auditor’s report.
20. My opinion on the financial statements and findings on the reported performance information and
compliance with legislation do not cover the other information and I do not express an audit opinion or any form of assurance conclusion thereon.
21. In connection with my audit, my responsibility is to read the other information and, in doing so, consider
whether the other information is materially inconsistent with the financial statements and the selected strategic objectives presented in the annual performance report, or my knowledge obtained in the audit, or otherwise appears to be materially misstated. If, based on the work I have performed on the other information obtained prior to the date of this auditor’s report, I conclude that there is a material misstatement of this other information, I am required to report that fact.
22. I have not yet received the annual report. When I do receive this information, if I conclude that there is a
material misstatement therein, I am required to communicate the matter to those charged with governance and request that the other information be corrected. If the other information is not corrected I may have to re-issue my auditor’s report amended as appropriate.
Internal control deficiencies
23. I considered internal control relevant to my audit of the financial statements, reported performance information and compliance with applicable legislation; however, my objective was not to express any form of assurance thereon. I did not identify any significant deficiencies in internal control.
Other reports
24. I draw attention to the following investigation conducted by the office of the Accountant General that could potentially have an impact on the department’s financial statements and compliance with applicable legislation matters. The reports noted do not form part of my opinion on the financial statements or my findings on the reported performance information or compliance with legislation.

Statistics South Africa – Vote 12
143
25. At the date of this report, a long overdue investigation on SCM processes followed to award a bid for an amount of R35,77 million which was disclosed in the 2011-12 financial statements for payments for goods and services has been carried out by the office of the Accountant General (OAG). A final report was issued by the OAG; however this was not accepted by the accounting officer as certain recommendations and required actions were deemed to be inconclusive by the accounting officer. The accounting officer has sought further clarity on the report from the OAG.
Pretoria 31 July 2017

Statistics South Africa – Vote 12
144
Annexure – Auditor-general’s responsibility for the audit
1. As part of an audit in accordance with the ISAs, I exercise professional judgement and maintain professional scepticism throughout my audit of the financial statements, and the procedures performed on reported performance information for selected strategic outcome and on the department’s compliance with respect to the selected subject matters.
Financial statements
2. In addition to my responsibility for the audit of the financial statements as described in the auditor’s report, I also:
• identify and assess the risks of material misstatement of the financial statements whether due to fraud or
error, design and perform audit procedures responsive to those risks, and obtain audit evidence that is sufficient and appropriate to provide a basis for my opinion. The risk of not detecting a material misstatement resulting from fraud is higher than for one resulting from error, as fraud may involve collusion, forgery, intentional omissions, misrepresentations, or the override of internal control.
• obtain an understanding of internal control relevant to the audit in order to design audit procedures that
are appropriate in the circumstances, but not for the purpose of expressing an opinion on the effectiveness of the department’s internal control.
• evaluate the appropriateness of accounting policies used and the reasonableness of accounting
estimates and related disclosures made by accounting officer. • conclude on the appropriateness of the accounting officer’s use of the going concern basis of
accounting in the preparation of the financial statements. I also conclude, based on the audit evidence obtained, whether a material uncertainty exists related to events or conditions that may cast significant doubt on Statistics South Africa’s ability to continue as a going concern. If I conclude that a material uncertainty exists, I am required to draw attention in my auditor’s report to the related disclosures in the financial statements about the material uncertainty or, if such disclosures are inadequate, to modify the opinion on the financial statements. My conclusions are based on the information available to me at the date of the auditor’s report. However, future events or conditions may cause the department to cease to continue as a going concern.
• evaluate the overall presentation, structure and content of the financial statements, including the
disclosures, and whether the financial statements represent the underlying transactions and events in a manner that achieves fair presentation.
Communication with those charged with governance
3. I communicated with the accounting officer regarding, among other matters, the planned scope and timing of the audit and significant audit findings, including any significant deficiencies in internal control that I identify during my audit.
4. I also confirm to the accounting officer that I have complied with relevant ethical requirements regarding
independence, and communicate all relationships and other matters that may reasonably be thought to have a bearing on my independence and here applicable, related safeguards.

Statistics South Africa – Vote 12
145
Appropriation Statement for the year ended 31 March 2017
Appropriation per programme 2016/17 2015/16
Adjusted
appropriation Shifting of
funds VirementFinal
appropriationActual
expenditure Variance
Expenditureas % of
final appropriation
Finalappropriation
Actualexpenditure
Programme R'000 R'000 R'000 R'000 R'000 R'000 % R'000 R'000 1. Administration 744 653 - (37 006) 707 647 671 188 36 459 94,8% 849 840 800 1242. Economic Statistics 228 773 - 4 539 233 312 233 312 - 100,0% 218 651 218 6513. Population and Social
Statistics 129 488 - (10 342) 119 146 114 498 4 648 96,1% 154 385 161 1884. Methodology, Standards and
Research 73 422 - (3 220) 70 202 70 202 - 100,0% 58 711 58 1495. Statistical Support and
Informatics 257 044 - (9 161) 247 883 247 883 - 100,0% 226 418 220 1776. Statistical Collection and
Outreach 571 382 - 58 706 630 088 630 088 - 100,0% 575 785 575 7857. Survey Operations 533 346 - (3 516) 529 830 494 034 35 796 93,2% 239 466 239 466 Total 2 538 108 - - 2 538 108 2 461 205 76 903 97,0% 2 323 256 2 273 540
Reconciliation with statement of financial performance Departmental receipts 8 580 10 055Aid assistance 5 234 5 309Actual amounts per statement of financial performance (total revenue) 2 551 922 2 338 620
Aid assistance 4 348 3 981Actual amounts per statement of financial performance (total expenditure) 2 465 553 2 277 521

Statistics South Africa – Vote 12
146
Appropriation per economic classification 2016/17 2015/16
Adjusted
appropriation Shifting of
funds Virement Final
appropriation Actual
expenditure Variance
Expenditure as % of final
appropriationFinal
appropriation Actual
expenditure Economic classification R'000 R'000 R'000 R'000 R'000 R'000 % R'000 R'000 Current payments 2 235 704 (2 107) 28 637 2 262 234 2 221 702 40 532 98,2 1 943 937 1 943 937
Compensation of employees 1 408 390 - - 1 408 390 1 371 767 36 623 97,4 1 288 374 1 288 374Salaries and wages 1 232 562 168 (3 362) 1 229 368 1192 745 36 623 97,0 1 120 768 1 120 768Social contributions 175 828 (168) 3 362 179 022 179 022 - 100,0 167 606 167 606
Goods and services 827 314 (2 107) 28 637 853 844 849 935 3 909 99,5 655 535 655 535Administrative fees 1 100 (277) (55) 768 768 - 100,0 589 589Advertising 9 513 101 680 10 294 10 294 - 100,0 6 870 6 870Minor assets 43 217 (5 815) (4 867) 32 535 32 535 - 100,0 2 178 2 178Audit costs: External 6 626 - (1 012) 5 614 5 614 - 100,0 7 168 7 168Bursaries: Employees 5 874 (327) (3 014) 2 533 2 533 - 100,0 2 109 2 109Catering: Departmental
activities 7 358 (141) (2 777) 4 440 4 440 - 100,0 13 344 13 344Communication (G&S) 36 376 (1 937) 208 34 647 34 647 - 100,0 25 831 25 831Computer services 88 839 1 024 (2 571) 87 292 87 292 - 100,0 72 869 72 869Consultants: Business and
advisory services 30 902 (1 998) (6 193) 22 711 22 711 - 100,0 18 673 18 673Infrastructure and planning
services 889 (886) (3) - - - -Legal services 2 805 (60) 10 806 13 551 13 551 - 100,0 2 818 2 818Contractors 11 881 1 608 (4 302) 9 187 9 187 - 100,0 8 424 8 424Agency and support/
outsourced services 100 998 463 29 449 130 910 130 910 - 100,0 9 707 9 707Entertainment 96 1 (69) 28 28 - 100,0 62 62Fleet services (including
government motor transport) 26 891 (2 963) 372 24 300 24 300 - 100,0 30 007 30 007
Consumable supplies 4 232 799 (1 505) 3 526 3 526 - 100,0 3 604 3 604Consumable: Stationery,
printing and office supplies 12 573 (1 822) (6 446) 4 305 4 305 - 100,0 10 134 10 134
Operating leases 146 294 (135) 36 980 183 139 183 139 100,0 211 229 211 229Property payments 49 103 (560) 11 687 60 230 59 371 859 98,6 69 443 69 443Travel and subsistence 194 541 11 242 (16 350) 189 433 186 383 3 050 98,4 131 783 131 783Training and development 11 277 (12) (6 183) 5 082 5 082 - 100,0 2 795 2 795Operating payments 25 551 (3 744) (1 903) 19 904 19 904 - 100,0 16 693 16 693Venues and facilities 9 875 2 848 (4 831) 7 892 7 892 - 100,0 8 330 8 330Rental and hiring 503 484 536 1 523 1 523 - 100,0 875 875
Interest and rent on land - - - - - - - 28 28Interest (incl. interest on
unitary payments (PPP)) - - - - - - - 28 28
Transfers and subsidies 16 673 184 453 17 310 13 091 4 219 75,6 15 705 14 995Departmental agencies and
accounts 15 - - 15 9 6 60,0 15 15Departmental agencies
(non-business entities) 15 - - 15 9 6 60,0 15 15Higher education institutions 8 191 - - 8 191 7 500 691 91,6 8 310 7 600Public corporations and
private enterprises - - 185 185 185 - 100,0 77 77Private enterprises - - 185 185 185 - 100,0 77 77
Other transfers to private enterprises - - 185 185 185 - 100,0 77 77
Non-profit institutions 323 - - 323 290 33 89,8 438 438Households 8 144 184 268 8 596 5 107 3 489 59,4 6 865 6 865
Social benefits 5 367 184 1 741 7 292 3 803 3 489 52,2 4 431 4 431Other transfers to
households 2 777 - (1 473) 1 304 1 304 - 100,0 2 434 2 434
Payments for capital assets 285 731 1 923 (35 300) 252 354 220 202 32 152 87,3 362 385 313 379Buildings and other fixed
structures 230 360 - (43 200) 187 160 155 911 31 249 83,3 304 271 255 265Buildings 230 360 - (43 200) 187 160 155 911 31 249 83,3 304 271 255 265
Machinery and equipment 52 344 1 344 8 551 62 239 61 586 653 99,0 54 633 54 633Transport equipment 9 914 - (1 768) 8 146 8 146 - 100,0 11 367 11 367Other machinery and
equipment 42 430 1 344 10 319 54 093 53 440 653 98,8 43 266 43 266Software and other intangible
assets 3 027 579 (651) 2 955 2 705 250 91,5 3 481 3 481 - - - - - - - - -
Payment for financial assets - - - - - - - - -Payment for financial assets - - 6 210 6 210 6 210 - 100,0 1 229 1 229
Total 2 538 108 - - 2 538 108 2 461 205 76 903 97,0 2 323 256 2 273 540

Statistics South Africa – Vote 12
147
Programme 1 – Administration 2016/17 2015/16
Adjusted
appropriation Shifting of
funds Virement Final
appropriation Actual
expenditure Variance
Expenditure as % of final
appropriationFinal
appropriation Actual
expenditure Subprogramme R'000 R'000 R'000 R'000 R'000 R'000 % R'000 R'000 1. Departmental Management 39 311 - (4 081) 35 230 35 230 - 100,0% 38 687 38 6872. Corporate Services 183 782 - (17 938) 165 844 163 829 2 015 98,8% 166 383 165 6733. Financial Administration 83 072 - (7 020) 76 052 74 369 1 683 97,8% 68 672 68 6724. Internal Audit 13 178 - (331) 12 847 12 847 - 100,0% 11 103 11 1035. National Statistics System 32 261 - (2 449) 29 812 29 812 - 100,0% 21 691 21 6916. Office Accommodation 393 049 - (5 187) 387 862 355 101 32 761 91,6% 543 304 494 298 Total 744 653 - (37 006) 707 647 671 188 36 459 94,8% 849 840 800 124

Statistics South Africa – Vote 12
148
Programme 1 – Administration (concluded) 2016/17 2015/16
Adjusted
appropriation Shifting of
funds Virement Final
appropriation Actual
expenditure Variance
Expenditure as % of final
appropriationFinal
appropriation Actual
expenditure Economic classification R'000 R'000 R'000 R'000 R'000 R'000 % R'000 R'000 Current payments 491 581 (549) 1 088 492 120 488 293 3 827 99,2 525 747 525 747
Compensation of employees 252 506 - (20 818) 231 688 228 720 2 968 98,7 224 711 224 711Salaries and wages 220 153 - (15 416) 204 737 201 769 2 968 98,6 197 619 197 619Social contributions 32 353 - (5 402) 26 951 26 951 - 100,0 27 092 27 092
Goods and services 239 075 (549) 21 906 260 432 259 573 859 99,7 301 036 301 036Administrative fees 627 - (33) 594 594 - 100,0 548 548Advertising 2 655 1 249 (253) 3 651 3 651 - 100,0 3 051 3 051Minor assets 627 79 (650) 56 56 - 100,0 146 146Audit costs: External 6 573 - (959) 5 614 5 614 - 100,0 7 168 7 168Bursaries: Employees 803 - (444) 359 359 - 100,0 448 448Catering: Departmental
activities 1 881 97 (149) 1 829 1 829 - 100,0 1 246 1 246Communication (G&S) 3 860 (268) (1 806) 1 786 1 786 - 100,0 2 233 2 233Computer services 2 391 17 (104) 2 304 2 304 - 100,0 2 294 2 294Consultants: Business and
advisory services 12 022 (4 169) (3 104) 4 749 4 749 - 100,0 7 412 7 412Infrastructure and planning
services 386 (386) - - - - - - -Legal services 2 805 (60) 10 806 13 551 13 551 - 100,0 2 818 2 818Contractors 4 327 (20) (408) 3 899 3 899 - 100,0 1 929 1 929Agency and support/
outsourced services - 308 (107) 201 201 - 100,0 16 16Entertainment 61 5 (43) 23 23 - 100,0 52 52Fleet services (including
government motor transport) 3 239 (1) (515) 2 723 2 723 - 100,0 2 815 2 815
Consumable supplies 992 (65) 48 975 975 - 100,0 473 473Consumable: Stationery,
printing and office supplies 3 434 88 (2 753) 769 769 - 100,0 1 406 1 406
Operating leases 113 142 - 14 821 127 963 127 963 - 100,0 166 972 166 972Property payments 48 689 (450) 11 232 59 471 58 612 859 98,6 69 340 69 340Travel and subsistence 20 615 2 463 (1 591) 21 487 21 487 - 100,0 25 014 25 014Training and development 4 481 1 092 (3 300) 2 273 2 273 - 100,0 1 238 1 238Operating payments 3 221 (63) 1 792 4 950 4 950 - 100,0 2 134 2 134Venues and facilities 2 194 (425) (1 465) 304 304 - 100,0 2 273 2 273Rental and hiring 50 (40) 891 901 901 - 100,0 10 10
Interest and rent on land - - - - - - - - -Interest (incl. interest on
unitary payments (PPP)) - - - - - - - - -
Transfers and subsidies 11 105 - (1 103) 10 002 9 272 730 92,7 12 112 11 402Departmental agencies and
accounts 14 - (8) 6 - 6 - 4 4Departmental agencies
(non-business entities) 14 - (8) 6 - 6 - 4 4Higher education institutions 8 191 - - 8 191 7 500 691 91,6 8 210 7 500Public corporations and
private enterprises - - 135 135 135 - 100,0 - -Private enterprises - - 135 135 135 - 100,0 - -
Other transfers to private enterprises - - 135 135 135 - 100,0 - -
Non-profit institutions 123 - - 123 90 33 73,2 238 238Households 2 777 (1 230) 1 547 1 547 - 100,0 3 660 3 660
Social benefits - - 299 299 299 - 100,0 1 369 1 369Other transfers to
households 2 777 - (1 529) 1 248 1 248 - 100,0 2 291 2 291
Payments for capital assets 241 967 549 (43 201) 199 315 167 413 31 902 84,0 311 981 262 975Buildings and other fixed
structures 230 360 - (43 200) 187 160 155 911 31 249 83,3 304 271 255 265Buildings 230 360 - (43 200) 187 160 155 911 31 249 83,3 304 271 255 265
Machinery and equipment 11 423 529 203 12 155 11 502 653 94,6 7 554 7 554Transport equipment 3 914 - (2 945) 969 969 - 100,0 2 530 2 530Other machinery and
equipment 7 509 529 3 148 11 186 10 533 653 94,2 5 024 5 024Software and other intangible
assets 184 20 (204) - - - - 156 156 - - - - - - - -
Payment for financial assets - - - - - - - - -Payment for financial assets - - 6 210 6 210 6 210 - 100,0 - -
Total 744 653 - (37 006) 707 647 671 188 36 459 94,8 849 840 800 124

Statistics South Africa – Vote 12
149
Subprogramme 1.1 – Departmental Management 2016/17 2015/16
Adjusted
appropriation Shifting of
funds VirementFinal
appropriationActual
expenditure Variance
Expenditureas % of
final appropriation
Finalappropriation
Actualexpenditure
Economic classification R'000 R'000 R'000 R'000 R'000 R'000 % R'000 R'000 Current payments 38 374 - (3 855) 34 519 34 519 - 100,0 37 045 37 045
Compensation of employees 28 097 - (1 270) 26 827 26 827 - 100,0 23 013 23 013Goods and services 10 277 - (2 585) 7 692 7 692 - 100,0 14 032 14 032Interest and rent on land - - - - - - - - - -
Transfers and subsidies - - 76 76 76 - 100,0 736 736Departmental agencies and
accounts - - - - - - - 2 2Higher education institutions - - - - - - - - -Public corporations and
private enterprises - - - - - - - - -Non-profit institutions - - - - - - - - -Households - - 76 76 76 - 100,0 734 734
Payments for capital assets 937 - (302) 635 635 - 100,0 906 906Buildings and other fixed
structures - - - - - - - -Machinery and equipment 937 (20) (282) 635 635 - 100,0 750 750Software and other intangible
assets - 20 (20) - - - 100,0 156 156
Payments for financial assets - - - - - - - - -Payments for financial assets - - - - - - - - -
Total 39 311 - (4 081) 35 230 35 230 - 100,0 38 687 38 687
Subprogramme 1.2 – Corporate Services 2016/17 2015/16
Adjusted
appropriation Shifting of
funds VirementFinal
appropriationActual
expenditure Variance
Expenditureas % of
final appropriation
Finalappropriation
Actualexpenditure
Economic classification R'000 R'000 R'000 R'000 R'000 R'000 % R'000 R'000 Current payments 167 115 (108) (13 396) 153 611 152 326 1 285 99,2 150 669 150 669
Compensation of employees 125 730 - (15 056) 110 674 109 389 1 285 98,8 117 503 117 503Goods and services 41 385 (108) 1 660 42 937 42 937 - 100,0 33 166 33 166Interest and rent on land - - - - - - - - -
Transfers and subsidies 11 105 - (1 322) 9 783 9 053 730 92,5 11 215 10 505Departmental agencies and
accounts 14 - (8) 6 - 6 - 2 2Higher education institutions 8 191 - - 8 191 7 500 691 91,6 8 210 7 500Public corporations and
private enterprises - - 135 135 135 - 100,0 - -Non-profit institutions 123 - - 123 90 33 73,2 238 238Households 2 777 - (1 449) 1 328 1 328 - 100,0 2 765 2 765
Payments for capital assets 5 562 108 (3 220) 2 450 2 450 - 100,0 4 499 4 499Buildings and other fixed
structures - - - - - - - - -Machinery and equipment 5 562 108 (3 220) 2 450 2 450 - 100,0 4 499 4 499Software and other intangible
assets - - - - - - - - -
Payments for financial assets - - - - - - - - -
Total 183 782 - (17 938) 165 844 163 829 2 015 98,8 166 383 165 673

Statistics South Africa – Vote 12
150
Subprogramme 1.3 – Financial Administration 2016/17 2015/16
Adjusted
appropriation Shifting of
funds VirementFinal
appropriationActual
expenditure Variance
Expenditureas % of
final appropriation
Finalappropriation
Actualexpenditure
Economic classification R'000 R'000 R'000 R'000 R'000 R'000 % R'000 R'000 Current payments 80 318 (101) (4 757) 75 460 73 777 1 683 97,8 67 941 67 941
Compensation of employees 66 437 - (1 458) 64 979 63 296 1 683 97,4 59 684 59 684Goods and services 13 881 (101) (3 299) 10 481 10 481 - 100,0 8 257 8 257Interest and rent on land - - - - - - - - -
Transfers and subsidies - - 143 143 143 - 100,0 158 158Departmental agencies and
accounts - - - - - - - - -Higher education institutions - - - - - - - - -Public corporations and
private enterprises - - - - - - - - -Non-profit institutions - - - - - - - - -Households - - 143 143 143 - 100,0 158 158
Payments for capital assets 2 754 101 (2 406) 449 449 - 100,0 573 573Buildings and other fixed
structures - - - - - - - - -Machinery and equipment 2 754 101 (2 406) 449 449 - 100,0 573 573Software and other intangible
assets - - - - - - - - -
Payments for financial assets - - - - - - - - -
Total 83 072 - (7 020) 76 052 74 369 1 683 97,8 68 672 68 672
Subprogramme 1.4 – Internal Audit 2016/17 2015/16
Adjusted
appropriation Shifting of
funds VirementFinal
appropriationActual
expenditure Variance
Expenditureas % of
final appropriation
Finalappropriation
Actualexpenditure
Economic classification R'000 R'000 R'000 R'000 R'000 R'000 % R'000 R'000 Current payments 13 067 (60) (307) 12 700 12 700 - 100,0 10 950 10 950
Compensation of employees 11 167 - 51 11 218 11 218 - 100,0 9 434 9 434Goods and services 1 900 (60) (358) 1 482 1 482 - 100,0 1 516 1 516Interest and rent on land - - - - - - - - -
Transfers and subsidies - - - - - - - - -Departmental agencies and
accounts - - - - - - - - -Higher education institutions - - - - - - - - -Public corporations and
private enterprises - - - - - - - - -Non-profit institutions - - - - - - - - -Households - - - - - - - - -
Payments for capital assets 111 60 (24) 147 147 - 100,0 153 153Buildings and other fixed
structures - - - - - - -Machinery and equipment 111 60 (24) 147 147 - 100,0 153 153Software and other intangible
assets - - - - - - - - -
Payments for financial assets - - - - - - - - -
Total 13 178 - (331) 12 847 12 847 - 100,0 11 103 11 103

Statistics South Africa – Vote 12
151
Subprogramme 1.5 – National Statistics System 2016/17 2015/16
Adjusted
appropriation Shifting of
funds VirementFinal
appropriationActual
expenditure Variance
Expenditureas % of
final appropriation
Finalappropriation
Actualexpenditure
Economic classification R'000 R'000 R'000 R'000 R'000 R'000 % R'000 R'000 Current payments 31 318 (280) (8 025) 23 013 23 013 - 100,0 21 063 21 063
Compensation of employees 21 075 - (3 085) 17 990 17 990 - 100,0 15 077 15 077Goods and services 10 243 (280) (4 940) 5 023 5 023 - 100,0 5 986 5 986Interest and rent on land - - - - - - - - -
Transfers and subsidies - - - - - - - 3 3Departmental agencies and
accounts - - - - - - - - -Higher education institutions - - - - - - - - -Public corporations and
private enterprises - - - - - - - - -Non-profit institutions - - - - - - - - -Households - - - - - - 100,0 3 3
Payments for capital assets 943 280 (634) 589 589 - 100,0 625 625Buildings and other fixed
structures - - - - - - - - -Machinery and equipment 759 280 (450) 589 589 - 100,0 625 625Intangible assets - - - - - - - - -Software and other intangible
assets 184 - (184) - - - - - -
Payments for financial assets - - 6 210 6 210 6 210 - 100,0 - -
Total 32 261 - (2 449) 29 812 29 812 - 100,0 21 691 21 691
Subprogramme 1.6 – Office Accommodation 2016/17 2015/16
Adjusted
appropriation Shifting of
funds VirementFinal
appropriationActual
expenditure Variance
Expenditureas % of
final appropriation
Finalappropriation
Actualexpenditure
Economic classification R'000 R'000 R'000 R'000 R'000 R'000 % R'000 R'000 Current payments 161 389 - 31 428 192 817 191 958 859 99,6 238 079 238 079
Compensation of employees - - - - - - - - -Goods and services 161 389 - 31 428 192 817 191 958 859 99,6 238 079 238 079Interest and rent on land - - - - - - - - -
Transfers and subsidies - - - - - - - - -Departmental agencies and
accounts - - - - - - - - -Higher education institutions - - - - - - - - -Public corporations and
private enterprises - - - - - - - - -Non-profit institutions - - - - - - - - -Households - - - - - - - - -
Payments for capital assets 231 660 - (36 615) 195 045 163 143 31 902 83,6 305 225 256 219Buildings and other fixed
structures 230 360 (43 200) 187 160 155 911 31 249 83,3 304 271 255 265Machinery and equipment 1 300 - 6 585 7 885 7 232 653 91,7 954 954Software and other intangible
assets - - - - - - - - - - -
Payments for financial assets - - - - - - - - -Payments for financial assets - - - - - - - - -
Total 393 049 - (5 187) 387 862 355 101 32 761 91,6 543 304 494 298

Statistics South Africa – Vote 12
152
Programme 2 – Economic Statistics 2016/17 2015/16
Adjusted
appropriation Shifting of
funds Virement Final
appropriation Actual
expenditure Variance
Expenditure as % of final
appropriationFinal
appropriation Actual
expenditure Subprogramme R'000 R'000 R'000 R'000 R'000 R'000 % R'000 R'000 1. Programme Management for
Economic Statistics 5 812 - (1 218) 4 594 4 594 - 100,0 3 941 3 9412. Short-term Indicators 31 253 - (392) 30 861 30 861 - 100,0 28 908 28 9083. Structural Industry Statistics 41 647 - (824) 40 823 40 823 - 100,0 39 404 39 4044. Price Statistics 70 968 - 2 535 73 503 73 503 - 100,0 68 763 68 763 5. Private Sector Finance
Statistics 31 555 - 1 100 32 655 32 655 - 100,0 29 647 29 647 6. Government Finance Statistics 17 929 - 226 18 155 18 155 - 100,0 17 326 17 3267. National Accounts 20 827 - (760) 20 067 20 067 - 100,0 10 805 10 8058. Economic Analysis 8 782 - 3 872 12 654 12 654 - 100,0 19 857 19 857 Total 228 773 - 4 539 233 312 233 312 - 100,0 218 651 218 651

Statistics South Africa – Vote 12
153
Programme 2 – Economic Statistics (concluded) 2016/17 2015/16
Adjusted
appropriation Shifting of
funds Virement Final
appropriation Actual
expenditure Variance
Expenditure as % of final
appropriationFinal
appropriation Actual
expenditure Economic classification R'000 R'000 R'000 R'000 R'000 R'000 % R'000 R'000 Current payments 227 290 (199) 4 518 231 609 231 609 - 100,0 217 066 217 066
Compensation of employees 203 610 - 6 774 210 384 210 384 - 100,0 194 543 194 543Salaries and wages 174 057 - 6 566 180 623 180 623 - 100,0 166 876 166 876Social contributions 29 553 - 208 29 761 29 761 - 100,0 27 667 27 667
Goods and services 23 680 (199) (2 256) 21 225 21 225 - 100,0 22 523 22 523Administrative fees 29 42 1 72 72 - 100,0 - -Advertising 23 2 (25) - - - - 12 12Minor assets 45 (11) 9 43 43 - 100,0 44 44Audit costs: External - - - - - - - - -Bursaries: Employees 1 855 (220) (1 156) 479 479 - 100,0 308 308Catering: Departmental
activities 104 30 (91) 43 43 - 100,0 31 31Communication (G&S) 3 659 (555) (1 385) 1 719 1 719 100,0 2 880 2 880Computer services 15 (6) (1) 8 8 - 100,0 7 7Consultants: Business and
advisory services 8 050 (50) 64 8 064 8 064 - 100,0 8 508 8 508Infrastructure and planning
services - - - - - - - - -Legal services - - - - - - - - -Contractors 21 2 (23) - - - 100,0 53 53Agency and support/
outsourced services 109 1 - 110 110 - 100,0 104 104Entertainment 4 (2) (2) - - - - - -Fleet services (including
government motor transport) - - - - - - - 5 5
Consumable supplies 101 (26) 82 157 157 - 100,0 84 84Consumable: Stationery,
printing and office supplies 1 174 (390) (437) 347 347 - 100,0 1 897 1 897
Operating leases - - - - - - - - -Property payments - - - - - - - - -Travel and subsistence 7 234 856 (849) 7 241 7 241 - 100,0 7 611 7 611Training and development 583 113 (240) 456 456 - 100,0 419 419Operating payments 611 37 1 805 2 453 2 453 - 100,0 452 452Venues and facilities 63 (22) (8) 33 33 - 100,0 108 108Rental and hiring - - - - - - - - -
Interest and rent on land - - - - - - - - -Interest (incl. interest on
unitary payments (PPP)) - - - - - - - - -
Transfers and subsidies 39 - 371 410 410 - 100,0 134 134Departmental agencies and
accounts 1 - (1) - - - - 2 2Departmental agencies
(non-business entities) 1 - (1) - - - - 2 2Higher education institutions - - - - - - - - -Public corporations and
private enterprises - - - - - - - - -Private enterprises - - - - - - - - -
Other transfers to private enterprises - - - - - - - - -
Non-profit institutions - - - - - - - - -Households 38 - 372 410 410 - 100,0 132 132
Social benefits 38 - 372 410 410 - 100,0 132 132Other transfers to
households - - - - - - - - -
Payments for capital assets 1 444 199 (350) 1 293 1 293 - 100,0 1 451 1 451Buildings and other fixed
structures - - - - - - - -Buildings - - - - - - - -
Machinery and equipment 1 444 199 (350) 1 293 1 293 - 100,0 1 451 1 451Transport equipment - - - - - - - -Other machinery and
equipment 1 444 199 (350) 1 293 1 293 - 100,0 1 451 1 451Software and other intangible
assets - - - - - - - -
Payment for financial assets - - - - - - - -Payment for financial assets - - - - - - - -
Total 228 773 - 4 539 233 312 233 312 - 100,0 218 651 218 651

Statistics South Africa – Vote 12
154
Subprogramme 2.1 – Programme Management for Economic Statistics 2016/17 2015/16
Adjusted
appropriation Shifting of
funds VirementFinal
appropriationActual
expenditure Variance
Expenditureas % of
final appropriation
Finalappropriation
Actualexpenditure
Economic classification R'000 R'000 R'000 R'000 R'000 R'000 % R'000 R'000 Current payments 5 758 - (1 220) 4 538 4 538 - 100,0 3 892 3 892
Compensation of employees 2 911 - 48 2 959 2 959 - 100,0 2 798 2 798Goods and services 2 847 - (1 268) 1 579 1 579 - 100,0 1 094 1 094Interest and rent on land - - - - - - - - -
Transfers and subsidies 1 - (1) - - - - 2 2Departmental agencies and
accounts 1 - (1) - - - - 2 2Higher education institutions - - - - - - - - -Public corporations and
private enterprises - - - - - - - - -Non-profit institutions - - - - - - - - -Households - - - - - - - - -
Payments for capital assets 53 - 3 56 56 - 100,0 47 47Buildings and other fixed
structures - - - - - - - - -Machinery and equipment 53 - 3 56 56 - 100,0 47 47Software and other intangible
assets - - - - - - - - -
Payments for financial assets - - - - - - - - -Payments for financial assets - - - - - - - - -
Total 5 812 - (1 218) 4 594 4 594 - 100,0 3 941 3 941
Subprogramme 2.2 – Short-term Indicators 2016/17 2015/16
Adjusted
appropriation Shifting of
funds VirementFinal
appropriationActual
expenditure Variance
Expenditureas % of
final appropriation
Finalappropriation
Actualexpenditure
Economic classification R'000 R'000 R'000 R'000 R'000 R'000 % R'000 R'000 Current payments 31 134 - (340) 30 794 30 794 - 100,0 28 782 28 782
Compensation of employees 30 299 - (184) 30 115 30 115 - 100,0 28 219 28 219Goods and services 835 - (156) 679 679 - 100,0 563 563Interest and rent on land - - - - - - - - -
Transfers and subsidies 25 - (19) 6 6 - 100,0 27 27Departmental agencies and
accounts - - - - - - - - -Higher education institutions - - - - - - - - -Public corporations and
private enterprises - - - - - - - - -Non-profit institutions - - - - - - - - -Households 25 - (19) 6 6 - 100,0 27 27
Payments for capital assets 94 - (33) 61 61 - 100,0 99 99Buildings and other fixed
structures - - - - - - - - -Machinery and equipment 94 - (33) 61 61 - 100,0 99 99Software and other intangible
assets - - - - - - - - -
Payments for financial assets - - - - - - - - -Payments for financial assets - - - - - - - - -
Total 31 253 - (392) 30 861 30 861 - 100,0 28 908 28 908

Statistics South Africa – Vote 12
155
Subprogramme 2.3 – Structural Industry Statistics 2016/17 2015/16
Adjusted
appropriation Shifting of
funds VirementFinal
appropriationActual
expenditure Variance
Expenditureas % of
final appropriation
Finalappropriation
Actualexpenditure
Economic classification R'000 R'000 R'000 R'000 R'000 R'000 % R'000 R'000 Current payments 41 495 - (797) 40 698 40 698 - 100,0 39 250 39 250
Compensation of employees 37 932 - (549) 37 383 37 383 - 100,0 35 266 35 266Goods and services 3 563 - (248) 3 315 3 315 - 100,0 3 984 3 984Interest and rent on land - - - - - - - - -
Transfers and subsidies 13 - 31 44 44 - 100,0 11 11Departmental agencies and
accounts - - - - - - - - -Higher education institutions - - - - - - - - -Public corporations and
private enterprises - - - - - - - - -Non-profit institutions - - - - - - - - -Households 13 - 31 44 44 - 100,0 11 11
Payments for capital assets 139 - (58) 81 81 - 100,0 143 143Buildings and other fixed
structures - - - - - - - - -Machinery and equipment 139 - (58) 81 81 - 100,0 143 143Software and other intangible
assets - - - - - - - - -
Payments for financial assets - - - - - - - - -Payments for financial assets - - - - - - - - -
Total 41 647 - (824) 40 823 40 823 - 100,0 39 404 39 404
Subprogramme 2.4 – Price Statistics 2016/17 2015/16
Adjusted
appropriation Shifting of
funds VirementFinal
appropriationActual
expenditure Variance
Expenditureas % of
final appropriation
Finalappropriation
Actualexpenditure
Economic classification R'000 R'000 R'000 R'000 R'000 R'000 % R'000 R'000 Current payments 70 408 - 2 312 72 720 72 720 - 100,0 68 114 68 114
Compensation of employees 67 098 - 2 573 69 671 69 671 - 100,0 64 440 64 440Goods and services 3 310 - (261) 3 049 3 049 - 100,0 3 674 3 674Interest and rent on land - - - - - - - - -
Transfers and subsidies - - 336 336 336 - 100,0 73 73Departmental agencies and
accounts - - - - - - - - -Higher education institutions - - - - - - - - -Public corporations and
private enterprises - - - - - - - - -Non-profit institutions - - - - - - - - -Households - - 336 336 336 - 100,0 73 73
Payments for capital assets 560 - (113) 447 447 - 100,0 576 576Buildings and other fixed
structures - - - - - - - - -Machinery and equipment 560 - (113) 447 447 - 100,0 576 576Software and other intangible
assets - - - - - - - - -
Payments for financial assets - - - - - - - - -Payments for financial assets - - - - - - - - -
Total 70 968 - 2 535 73 503 73 503 - 100,0 68 763 68 763

Statistics South Africa – Vote 12
156
Subprogramme 2.5 – Private Sector Finance Statistics 2016/17 2015/16
Adjusted
appropriation Shifting of
funds VirementFinal
appropriationActual
expenditure Variance
Expenditureas % of
final appropriation
Finalappropriation
Actualexpenditure
Economic classification R'000 R'000 R'000 R'000 R'000 R'000 % R'000 R'000 Current payments 31 357 - 1 166 32 523 32 523 - 100,0 29 530 29 530
Compensation of employees 29 113 - 1 337 30 450 30 450 - 100,0 27 493 27 493Goods and services 2 244 - (171) 2 073 2 073 - 100,0 2 037 2 037Interest and rent on land - - - - - - - - -
Transfers and subsidies - - - - - - - - -Departmental agencies and
accounts - - - - - - - - -Higher education institutions - - - - - - - - -Public corporations and
private enterprises - - - - - - - - -Non-profit institutions - - - - - - - - -Households - - - - - - - - -
Payments for capital assets 198 - (66) 132 132 - 100,0 117 117Buildings and other fixed
structures - - - - - - - - -Machinery and equipment 198 - (66) 132 132 - 100,0 117 117Software and other intangible
assets - - - - - - - - -
Payments for financial assets - - - - - - - - -Payments for financial assets - - - - - - - - -
Total 31 555 - 1 100 32 655 32 655 - 100,0 29 647 29 647
Subprogramme 2.6 – Government Finance Statistics 2016/17 2015/16
Adjusted
appropriation Shifting of
funds VirementFinal
appropriationActual
expenditure Variance
Expenditureas % of
final appropriation
Finalappropriation
Actualexpenditure
Economic classification R'000 R'000 R'000 R'000 R'000 R'000 % R'000 R'000 Current payments 17 783 - 259 18 042 18 042 - 100,0 17 202 17 202
Compensation of employees 16 562 - 45 16 607 16 607 - 100,0 15 462 15 462Goods and services 1 221 - 214 1 435 1 435 - 100,0 1 740 1 740Interest and rent on land - - - - - - - - -
Transfers and subsidies - - - - - - - - -Departmental agencies and
accounts - - - - - - - - -Higher education institutions - - - - - - - - -Public corporations and
private enterprises - - - - - - - - -Non-profit institutions - - - - - - - - -Households - - - - - - - - -
Payments for capital assets 146 - (33) 113 113 - 100,0 124 124Buildings and other fixed
structures - - - - - - -Machinery and equipment 146 - (33) 113 113 - 100,0 124 124Software and other intangible
assets - - - - - - - - -
Payments for financial assets - - - - - - - - -Payments for financial assets - - - - - - - - -
Total 17 929 - 226 18 155 18 155 - 100,0 17 326 17 326

Statistics South Africa – Vote 12
157
Subprogramme 2.7 – National Accounts 2016/17 2015/16
Adjusted
appropriation Shifting of
funds VirementFinal
appropriationActual
expenditure Variance
Expenditureas % of
final appropriation
Finalappropriation
Actualexpenditure
Economic classification R'000 R'000 R'000 R'000 R'000 R'000 % R'000 R'000 Current payments 20 679 (199) (653) 19 827 19 827 - 100,0 10 557 10 557
Compensation of employees 11 741 - (530) 11 211 11 211 - 100,0 10 046 10 046Goods and services 8 938 (199) (123) 8 616 8 616 - 100,0 511 511Interest and rent on land - - - - - - - - -
Transfers and subsidies - - - - - - -Departmental agencies and
accounts - - - - - - - - -Higher education institutions - - - - - - - - -Public corporations and
private enterprises - - - - - - - - -Non-profit institutions - - - - - - - - -Households - - - - - - - - -
Payments for capital assets 148 199 (107) 240 240 - 100,0 248 248Buildings and other fixed
structures - - - - - - - - -Machinery and equipment 148 199 (107) 240 240 - 100,0 248 248Software and other intangible
assets - - - - - - - - - - -
Payments for financial assets - - - - - - - - -Payments for financial assets - - - - - - - - -
Total 20 827 - (760) 20 067 20 067 - 100,0 10 805 10 805
Subprogramme 2.8 – Economic Analysis 2016/17 2015/16
Adjusted
appropriation Shifting of
funds VirementFinal
appropriationActual
expenditure Variance
Expenditureas % of
final appropriation
Finalappropriation
Actualexpenditure
Economic classification R'000 R'000 R'000 R'000 R'000 R'000 % R'000 R'000 Current payments 8 676 - 3 791 12 467 12 467 - 100,0 19 739 19 739
Compensation of employees 7 954 - 4 034 11 988 11 988 - 100,0 10 819 10 819Goods and services 722 - (243) 479 479 - 100,0 8 920 8 920Interest and rent on land - - - - - - - - -
Transfers and subsidies - - 24 24 24 - 100,0 21 21Departmental agencies and
accounts - - - - - - - - -Higher education institutions - - - - - - - - -Public corporations and
private enterprises - - - - - - - - -Non-profit institutions - - - - - - - - -Households - - 24 24 24 - 100,0 21 21
Payments for capital assets 106 - 57 163 163 - 100,0 97 97Buildings and other fixed
structures - - - - - - - - -Machinery and equipment 106 - 57 163 163 - 100,0 97 97Software and other intangible
assets - - - - - - - - -
Payments for financial assets - - - - - - - - -Payments for financial assets - - - - - - - - -
Total 8 782 - 3 872 12 654 12 654 - 100,0 19 857 19 857

Statistics South Africa – Vote 12
158
Programme 3 – Population and Social Statistics 2016/17 2015/16
Adjusted
appropriation Shifting of
funds Virement Final
appropriation Actual
expenditure Variance
Expenditure as % of final
appropriationFinal
appropriation Actual
expenditure Subprogramme R'000 R'000 R'000 R'000 R'000 R'000 % R'000 R'000 1. Programme Management for
Population and Social Statistics 4 414 - (1 111) 3 303 3 303 - 100,0 4 792 4 792
2. Population Statistics 11 856 - 105 11 961 11 961 - 100,0 7 098 7 0983. Health and Vital Statistics 12 115 - (1 176) 10 939 10 939 - 100,0 10 765 10 7654. Social Statistics 14 954 - 2 601 17 555 17 555 - 100,0 15 788 15 7885. Demographic Analysis 15 975 - (3 627) 12 348 12 348 - 100,0 13 664 13 6646. Labour Statistics 42 071 - (1 826) 40 245 37 299 2 946 92,7 36 602 36 6027. Poverty and Inequality
Statistics 28 103 - (5 308) 22 795 21 093 1 702 92,5 65 676 72 479 Total 129 488 - (10 342) 119 146 114 498 4 648 96,1 154 385 161 188

Statistics South Africa – Vote 12
159
Programme 3 – Population and Social Statistics (concluded) 2016/17 2015/16
Adjusted
appropriation Shifting of
funds Virement Final
appropriation Actual
expenditure Variance
Expenditure as % of final
appropriationFinal
appropriation Actual
expenditure Economic classification R'000 R'000 R'000 R'000 R'000 R'000 % R'000 R'000 Current payments 127 652 (157) (9 769) 117 726 113 078 4 648 96,1 151 175 157 978
Compensation of employees 105 904 - - 105 904 101 460 4 444 95,8 107 425 114 228Salaries and wages 94 647 38 (232) 94 453 90 009 4 444 95,3 96 532 103 335Social contributions 11 257 (38) 232 11 451 11 451 - 100,0 10 893 10 893
Goods and services 21 748 (157) (9 769) 11 822 11 618 204 98,3 43 722 43 722Administrative fees 12 - (12) - - - - 30 30Advertising 207 27 (234) - - - - 15 15Minor assets 147 (78) (68) 1 1 - 100,0 128 128Audit costs: External - - - - - - - - -Bursaries: Employees 415 - (234) 181 181 - 100,0 191 191Catering: Departmental
activities 283 41 (277) 47 47 - 100,0 336 336Communication (G&S) 1 399 42 (657) 784 784 - 100,0 546 546Computer services 90 - (20) 70 70 - 100,0 124 124Consultants: Business and
advisory services 2 337 (241) (2 073) 23 23 - 100,0 2 009 2 009Infrastructure and planning
services - - - - - - - - -Legal services - - - - - - - - -Contractors 10 - (10) - - - - 12 12Agency and support/
outsourced services 66 1 (16) 51 51 - 100,0 138 138Entertainment 2 - (2) - - - - - -Fleet services (including
government motor transport) 74 27 (16) 85 85 - 100,0 6 512 6 512
Consumable supplies 231 (6) (142) 83 83 - 100,0 81 81Consumable: Stationery,
printing and office supplies 1 082 14 (605) 491 491 - 100,0 1 744 1744
Operating leases - - - - - - - - -Property payments - - - - - - - - -Travel and subsistence 6 415 461 (3 199) 3 677 3 473 204 94,5 27 049 27 049Training and development 774 (140) (68) 566 566 - 100,0 313 313Operating payments 6 317 12 (633) 5 696 5 696 - - 4 347 4 347Venues and facilities 1 887 (317) (1 503) 67 67 - 100,0 147 147Rental and hiring - - - - - - - - -
Interest and rent on land - - - - - - - 28 28Interest (incl. interest on
unitary payments (PPP)) - - - - - - - 28 28
Transfers and subsidies 225 55 200 480 480 - 100,0 1 965 1 965Departmental agencies and
accounts - - - - - - - 1 1Departmental agencies
(non-business entities) - - - - - - - 1 1Higher education institutions - - - - - - - - -Public corporations and
private enterprises - - 20 20 20 - 100,0 - -Private enterprises - - 20 20 20 - 100,0 - -
Other transfers to private enterprises - - 20 20 20 - 100,0 - -
Non-profit institutions 200 - - 200 200 - 100,0 200 200Households 25 55 180 260 260 - 100,0 1 764 1 764
Social benefits 25 55 180 260 260 - 100,0 1 736 1 736Other transfers to
households - - - - - - - 28 28
Payments for capital assets 1 611 102 (773) 940 940 - 100,0 1 245 1 245
Buildings and other fixed structures - - - - - - - - -Buildings - - - - - - - - -
Machinery and equipment 1 511 92 (773) 830 830 - 100,0 1 181 1 181Transport equipment - - - - - - - - -Other machinery and
equipment 1 511 92 (773) 830 830 - 100,0 1 181 1 181Software and other intangible
assets 100 10 - 110 110 - 100,0 64 64
Payment for financial assets - - - - - - - - -Payment for financial assets - - - - - - - - -
Total 129 488 - (10 342) 119 146 114 498 4 648 96,1 154 385 161 188

Statistics South Africa – Vote 12
160
Subprogramme 3.1 – Programme Management for Population and Social Statistics 2016/17 2015/16
Adjusted
appropriation Shifting of
funds VirementFinal
appropriationActual
expenditure Variance
Expenditureas % of
final appropriation
Finalappropriation
Actualexpenditure
Economic classification R'000 R'000 R'000 R'000 R'000 R'000 % R'000 R'000 Current payments 4 334 - (1 179) 3 155 3 155 - 100,0 4 647 4 647
Compensation of employees 2 577 - (423) 2 154 2 154 - 100,0 3 524 3 524Goods and services 1 757 - (756) 1 001 1 001 - 100,0 1 123 1 123Interest and rent on land - - - - - - - - -
Transfers and subsidies - - - - - - - 1 1Departmental agencies and
accounts - - - - - - - 1 1Higher education institutions - - - - - - - - -Public corporations and
private enterprises - - - - - - - - -Non-profit institutions - - - - - - - - -Households - - - - - - - - -
Payments for capital assets 80 - 68 148 148 - 100,0 144 144Buildings and other fixed
structures - - - - - - - - -Machinery and equipment 80 - 68 148 148 - 100,0 144 144Software and other intangible
assets - - - - - - - - -
Payments for financial assets - - - - - - - - -Payments for financial assets - - - - - - - - -
Total 4 414 - (1 111) 3 303 3 303 - 100,0 4 792 4 792
Subprogramme 3.2 – Population Statistics 2016/17 2015/16
Adjusted
appropriation Shifting of
funds VirementFinal
appropriationActual
expenditure Variance
Expenditureas % of
final appropriation
Finalappropriation
Actualexpenditure
Economic classification R'000 R'000 R'000 R'000 R'000 R'000 % R'000 R'000 Current payments 11 698 (40) 245 11 903 11 903 - 100,0 6 904 6 904
Compensation of employees 10 970 - 513 11 483 11 483 - 100,0 5 852 5 852Goods and services 728 (40) (268) 420 420 - 100,0 1 052 1 052Interest and rent on land - - - - - - - - -
Transfers and subsidies - - 47 47 47 - 100,0 45 45Departmental agencies and
accounts - - - - - - - - -Higher education institutions - - - - - - - - -Public corporations and
private enterprises - - - - - - - - -Non-profit institutions - - - - - - - - -Households - - 47 47 47 - 100,0 45 45
Payments for capital assets 158 40 (187) 11 11 - 100,0 149 149Buildings and other fixed
structures - - - - - - - - -Machinery and equipment 158 40 (187) 11 11 - 100,0 149 149Software and other intangible
assets - - - - - - - - -
Payments for financial assets - - - - - - - - -Payments for financial assets - - - - - - - - -
Total 11 856 - 105 11 961 11 961 - 100,0 7 098 7 098

Statistics South Africa – Vote 12
161
Subprogramme 3.3 – Health and Vital Statistics 2016/17 2015/16
Adjusted
appropriation Shifting of
funds VirementFinal
appropriationActual
expenditure Variance
Expenditureas % of
final appropriation
Finalappropriation
Actualexpenditure
Economic classification R'000 R'000 R'000 R'000 R'000 R'000 % R'000 R'000 Current payments 11 946 (62) (1 122) 10 762 10 762 - 100,0 10 625 10 625
Compensation of employees 10 666 - (498) 10 168 10 168 - 100,0 9 763 9 763Goods and services 1 280 (62) (624) 594 594 - 100,0 862 862Interest and rent on land - - - - - - - - -
Transfers and subsidies 1 - 96 97 97 - 100,0 1 1Departmental agencies and
accounts - - - - - - - - -Higher education institutions - - - - - - - - -Public corporations and
private enterprises - - - - - - - - -Non-profit institutions - - - - - - - - -Households 1 - 96 97 97 - 100,0 1 1
Payments for capital assets 168 62 (150) 80 80 - 100,0 139 139Buildings and other fixed
structures - - - - - - - - -Machinery and equipment 168 62 (150) 80 80 - 100,0 139 139Software and other intangible
assets - - - - - - - - -
Payments for financial assets - - - - - - - - -Payments for financial assets - - - - - - - - -
Total 12 115 - (1 176) 10 939 10 939 - 100,0 10 765 10 765
Subprogramme 3.4 – Social Statistics 2016/17 2015/16
Adjusted
appropriation Shifting of
funds VirementFinal
appropriationActual
expenditure Variance
Expenditureas % of
final appropriation
Finalappropriation
Actualexpenditure
Economic classification R'000 R'000 R'000 R'000 R'000 R'000 % R'000 R'000 Current payments 14 690 (5) 2 638 17 323 17 323 - 100,0 15 605 15 605
Compensation of employees 10 487 - 3 119 13 606 13 606 - 100,0 12 613 12 613Goods and services 4 203 (5) (481) 3 717 3 717 - 100,0 2 992 2 992Interest and rent on land - - - - - - - - -
Transfers and subsidies - 5 5 10 10 - 100,0 2 2Departmental agencies and
accounts - - - - - - - - -Higher education institutions - - - - - - - - -Public corporations and
private enterprises - - - - - - - - -Non-profit institutions - - - - - - - - -Households - 5 5 10 10 - 100,0 2 2
Payments for capital assets 264 - (42) 222 222 - 100,0 181 181Buildings and other fixed
structures - - - - - - - - -Machinery and equipment 264 - (42) 222 222 - 100,0 181 181Software and other intangible
assets - - - - - - - - -
Payments for financial assets - - - - - - - - -Payments for financial assets - - - - - - - - -
Total 14 954 - 2 601 17 555 17 555 - 100,0 15 788 15 788

Statistics South Africa – Vote 12
162
Subprogramme 3.5 – Demographic Analysis 2016/17 2015/16
Adjusted
appropriation Shifting of
funds VirementFinal
appropriationActual
expenditure Variance
Expenditureas % of
final appropriation
Finalappropriation
Actualexpenditure
Economic classification R'000 R'000 R'000 R'000 R'000 R'000 % R'000 R'000 Current payments 15 420 - (3 514) 11 906 11 906 - 100,0 13 165 13 165
Compensation of employees 13 378 - (1 846) 11 532 11 532 - 100,0 11 789 11 789Goods and services 2 042 - (1 668) 374 374 - 100,0 1 376 1 376Interest and rent on land - - - - - - - - -
Transfers and subsidies 200 - - 200 200 - 100,0 215 215Departmental agencies and
accounts - - - - - - - - -Higher education institutions - - - - - - - - -Public corporations and
private enterprises - - - - - - - - -Non-profit institutions 200 - - 200 200 - 100,0 200 200Households - - - - - - - 15 15
Payments for capital assets 355 - (113) 242 242 - 100,0 284 284Buildings and other fixed
structures - - - - - - - - -Machinery and equipment 255 (10) (113) 132 132 - 100,0 220 220Software and other intangible
assets 100 10 - 110 110 - 100,0 64 64
Payments for financial assets - - - - - - - - -Payments for financial assets - - - - - - - - -
Total 15 975 - (3 627) 12 348 12 348 - 100,0 13 664 13 664
Subprogramme 3.6 – Labour Statistics 2016/17 2015/16
Adjusted
appropriation Shifting of
funds VirementFinal
appropriationActual
expenditure Variance
Expenditureas % of
final appropriation
Finalappropriation
Actualexpenditure
Economic classification R'000 R'000 R'000 R'000 R'000 R'000 % R'000 R'000 Current payments 41 652 (50) (1 622) 39 980 37 034 2 946 92,6 36 345 36 345
Compensation of employees 37 034 - (865) 36 169 33 427 2 742 92,4 31 694 31 694Goods and services 4 618 (50) (757) 3 811 3 607 204 94,6 4 651 4 651Interest and rent on land - - - - - - - - - - - - - -
Transfers and subsidies 15 50 32 97 97 - 100,0 - -Departmental agencies and
accounts - - - - - - - --
Higher education institutions - - - - - - - - -Public corporations and
private enterprises - - - - - - - --
Non-profit institutions - - - - - - - - -Households 15 50 32 97 97 - 100,0 - - - - - - -
Payments for capital assets 404 - (236) 168 168 - 100,0 257 257Buildings and other fixed
structures - - - - -Machinery and equipment 404 - (236) 168 168 - 100,0 257 257Software and other intangible
assets - - - - - - - - -
Payments for financial assets - - - - - - - - -Payments for financial assets - - - - - - - - -
Total 42 071 - (1 826) 40 245 37 299 2 946 92,7 36 602 36 602

Statistics South Africa – Vote 12
163
Subprogramme 3.7 – Poverty and Inequality Statistics 2016/17 2015/16
Adjusted
appropriation Shifting of
funds VirementFinal
appropriationActual
expenditure Variance
Expenditureas % of
final appropriation
Finalappropriation
Actualexpenditure
Economic classification R'000 R'000 R'000 R'000 R'000 R'000 % R'000 R'000 Current payments 27 912 - (5 215) 22 697 20 995 1 702 92,5 63 884 70 687
Compensation of employees 20 792 - - 20 792 19 090 1 702 91,8 32 190 38 993Goods and services 7 120 - (5 215) 1 905 1 905 - 100,0 31 666 31 666 Interest and rent on land - - - - - - - 28 28
Transfers and subsidies 9 - 20 29 29 - 100,0 1 701 1 701Departmental agencies and
accounts - - - - - - - - -Higher education institutions - - - - - - - - -Public corporations and
private enterprises - - 20 20 20 - 100,0 - -Non-profit institutions - - - - - - - - -Households 9 - - 9 9 - 100,0 1 701 1 701
Payments for capital assets 182 - (113) 69 69 - 100,0 91 91Buildings and other fixed
structures - - - - - - - - -Machinery and equipment 182 - (113) 69 69 - 100,0 91 91Software and other intangible
assets - - - - - - - - -
Payments for financial assets - - - - - - - - -Payments for financial assets - - - - - - - - -
Total 28 103 - (5 308) 22 795 21 093 1 702 92,5 65 676 72 479

Statistics South Africa – Vote 12
164
Programme 4 – Methodology, Standards and Research 2016/17 2015/16
Adjusted
appropriation Shifting of
funds Virement Final
appropriation Actual
expenditure Variance
Expenditure as % of final
appropriationFinal
appropriation Actual
expenditure Subprogramme R'000 R'000 R'000 R'000 R'000 R'000 % R'000 R'000 1. Programme Management for
Methodology, Standards and Research 4 741 - (458) 4 283 4 283 - 100,0 2 165 2 165
2. Policy Research and Analysis 7 067 - (904) 6 163 6 163 - 100,0 5 490 5 4903. Methodology and Evaluation 19 647 - (946) 18 701 18 701 - 100,0 14 400 13 8384. Survey Standards 7 591 - (236) 7 355 7 355 - 100,0 5 397 5 3975. Business Register 34 376 - (676) 33 700 33 700 - 100,0 31 259 31 259 Total 73 422 - (3 220) 70 202 70 202 - 100,0 58 711 58 149

Statistics South Africa – Vote 12
165
Programme 4 – Methodology, Standards and Research (concluded) 2016/17 2015/16
Adjusted
appropriation Shifting of
funds Virement Final
appropriation Actual
expenditure Variance
Expenditure as % of final
appropriationFinal
appropriation Actual
expenditure Economic classification R'000 R'000 R'000 R'000 R'000 R'000 % R'000 R'000 Current payments 72 537 (106) (3 017) 69 414 69 414 - 100,0 56 951 56 389
Compensation of employees 69 207 - (2 057) 67 150 67 150 - 100,0 55 422 54 860 Salaries and wages 60 576 (1) (1 663) 58 912 58 912 - 100,0 48 428 47 866Social contributions 8 631 1 (394) 8 238 8 238 - 100,0 6 994 6 994
Goods and services 3 330 (106) (960) 2 264 2 264 - 100,0 1 529 1 529Administrative fees 50 (40) 10 20 20 - - - -Advertising 45 34 (44) 35 35 - - - -Minor assets 24 35 (45) 14 14 - 100,0 1 1Audit costs: External - - - - - - - - -Bursaries: Employees 175 - (134) 41 41 - 100,0 58 58Catering: Departmental
activities 121 (42) (79) - - - - 3 3Communication (G&S) 606 (174) (185) 247 247 - 100,0 353 353Computer services - - - - - - - - -Consultants: Business and
advisory services 445 (341) (104) - - - - - -Infrastructure and planning
services - - - - - - - - -Legal services - - - - - - - - -Contractors 4 5 (8) 1 1 - 100,0 13 13Agency and support/
outsourced services - - - - - - - - -Entertainment 12 - (11) 1 1 - 100,0 - -Fleet services (including
government motor transport) - - - - - - - - -
Consumable supplies 38 (3) 12 47 47 - 100,0 22 22Consumable: Stationery,
printing and office supplies 270 (117) (130) 23 23 - 100,0 198 198
Operating leases - - - - - - - - -Property payments - - - - - - - - -Travel and subsistence 1 155 486 (489) 1 152 1 152 - 100,0 737 737Training and development 299 - (8) 291 291 - 100,0 129 129Operating payments 86 51 255 392 392 - 100,0 15 15Venues and facilities - - - - - - - - -Rental and hiring - - - - - - - - -
Interest and rent on land - - - - - - - - -Interest (incl. interest on
unitary payments (PPP)) - - - - - - - - -
Transfers and subsidies 385 - (131) 254 254 - 100,0 34 34Departmental agencies and
accounts - - - - - - - 1 1Departmental agencies
(non-business entities) - - - - - - - 1 1Higher education institutions - - - - - - - - -Public corporations and
private enterprises - - - - - - - - -Private enterprises - - - - - - - - -
Other transfers to private enterprises - - - - - - - - -
Non-profit institutions - - - - - - - - -Households 385 - (131) 254 254 - 100,0 33 33
Social benefits 385 - (131) 254 254 - 100,0 33 33Other transfers to
households - - - - - - - - -
Payments for capital assets 500 106 (72) 534 534 - 100,0 497 497Buildings and other fixed
structures - - - - - - - - -Buildings - - - - - - - - -
Machinery and equipment 500 106 (72) 534 534 - 100,0 476 476Transport equipment - - - - - - - - -Other machinery and
equipment 500 106 (72) 534 534 - 100,0 476 476Software and other intangible
assets - - - - - - - 21 21
Payment for financial assets - - - - - - - 1 229 1 229Payment for financial assets - - - - - - - 1 229 1 229
Total 73 422 - (3 220) 70 202 70 202 - 100,0 58 711 58 149

Statistics South Africa – Vote 12
166
Subprogramme 4.1 – Programme Management for Methodology, Standards and Research 2016/17 2015/16
Adjusted
appropriation Shifting of
funds VirementFinal
appropriationActual
expenditure Variance
Expenditureas % of
final appropriation
Finalappropriation
Actualexpenditure
Economic classification R'000 R'000 R'000 R'000 R'000 R'000 % R'000 R'000 Current payments 4 698 (27) (438) 4 233 4 233 - 100,0 2 105 2 105
Compensation of employees 3 601 - (113) 3 488 3 488 - 100,0 1 694 1 694Goods and services 1 097 (27) (325) 745 745 - 100,0 411 411Interest and rent on land - - - - - - - - - - -
Transfers and subsidies - - - - - - - 1 1Departmental agencies and
accounts - - - - - - - 1 1Higher education institutions - - - - - - - - -Public corporations and
private enterprises - - - - - - - - -Non-profit institutions - - - - - - - - -Households - - - - - - - - -
Payments for capital assets 43 27 (20) 50 50 - 100,0 58 58Buildings and other fixed
structures - - - - - - - - -Machinery and equipment 43 27 (20) 50 50 - 100,0 58 58Software and other intangible
assets - - - - - - - - -
Payments for financial assets - - - - - - - 1 1Payments for financial assets - - - - - - - 1 1
Total 4 741 - (458) 4 283 4 283 - 100,0 2 165 2 165
Subprogramme 4.2 – Policy Research and Analysis 2016/17 2015/16
Adjusted
appropriation Shifting of
funds VirementFinal
appropriationActual
expenditure Variance
Expenditureas % of
final appropriation
Finalappropriation
Actualexpenditure
Economic classification R'000 R'000 R'000 R'000 R'000 R'000 % R'000 R'000 Current payments 7 017 (79) (865) 6 073 6 073 - 100,0 5 336 5 336
Compensation of employees 6 513 - (603) 5 910 5 910 - 100,0 5 102 5 102Goods and services 504 (79) (262) 163 163 - 100,0 234 234Interest and rent on land - - - - - - - - -
Transfers and subsidies - - - - - - - - -Departmental agencies and
accounts - - - - - - - - -Higher education institutions - - - - - - - - -Public corporations and
private enterprises - - - - - - - - -Non-profit institutions - - - - - - - - -Households - - - - - - - - -
Payments for capital assets 50 79 (39) 90 90 - 100,0 154 154Buildings and other fixed
structures - - - - - - - - -Machinery and equipment 50 79 (39) 90 90 - 100,0 133 133Software and other intangible
assets - - - - - - - 21 21
Payments for financial assets - - - - - - - - -Payments for financial assets - - - - - - - - -
Total 7 067 - (904) 6 163 6 163 - 100,0 5 490 5 490

Statistics South Africa – Vote 12
167
Subprogramme 4.3 – Methodology and Evaluation 2016/17 2015/16
Adjusted
appropriation Shifting of
funds VirementFinal
appropriationActual
expenditure Variance
Expenditureas % of
final appropriation
Finalappropriation
Actualexpenditure
Economic classification R'000 R'000 R'000 R'000 R'000 R'000 % R'000 R'000 Current payments 19 443 - (908) 18 535 18 535 - 100,0 13 736 13 174
Compensation of employees 18 873 - (908) 17 965 17 965 - 100,0 13 490 12 928Goods and services 570 - - 570 570 - 100,0 246 246Interest and rent on land - - - - - - - - - -
Transfers and subsidies 50 - (27) 23 23 - 100,0 - -Departmental agencies and
accounts - - - - - - - - -Higher education institutions - - - - - - - - -Public corporations and
private enterprises - - - - - - - - -Non-profit institutions - - - - - - - - -Households 50 - (27) 23 23 - 100,0 - -
Payments for capital assets 154 - (11) 143 143 - 100,0 118 118Buildings and other fixed
structures - - - - - - - - -Machinery and equipment 154 - (11) 143 143 - 100,0 118 118Software and other intangible
assets - - - - - - - - -
Payments for financial assets - - - - - - - 546 546
Total 19 647 - (946) 18 701 18 701 - 100,0 14 400 13 838
Subprogramme 4.4 – Survey Standards 2016/17 2015/16
Adjusted
appropriation Shifting of
funds VirementFinal
appropriationActual
expenditure Variance
Expenditureas % of
final appropriation
Finalappropriation
Actualexpenditure
Economic classification R'000 R'000 R'000 R'000 R'000 R'000 % R'000 R'000 Current payments 7 478 - (279) 7 199 7 199 - 100,0 4 636 4 636
Compensation of employees 6 991 - (15) 6 976 6 976 - 100,0 4 587 4 587Goods and services 487 - (264) 223 223 - 100,0 49 49Interest and rent on land - - - - - - - - -
Transfers and subsidies - - - - - - - - -Departmental agencies and
accounts - - - - - - - - -Higher education institutions - - - - - - - - -Public corporations and
private enterprises - - - - - - - - -Non-profit institutions - - - - - - - - -Households - - - - - - - - -
Payments for capital assets 113 - 43 156 156 - 100,0 79 79Buildings and other fixed
structures - - - - - - - - -Machinery and equipment 113 - 43 156 156 - 100,0 79 79Software and other intangible
assets - - - - - - - - -
Payments for financial assets - - - - - - - 682 682
Total 7 591 - (236) 7 355 7 355 - 100,0 5 397 5 397

Statistics South Africa – Vote 12
168
Subprogramme 4.5 – Business Register 2016/17 2015/16
Adjusted
appropriation Shifting of
funds VirementFinal
appropriationActual
expenditure Variance
Expenditureas % of
final appropriation
Finalappropriation
Actualexpenditure
Economic classification R'000 R'000 R'000 R'000 R'000 R'000 % R'000 R'000 Current payments 33 901 - (527) 33 374 33 374 - 100,0 31 138 31 138
Compensation of employees 33 229 - (418) 32 811 32 811 - 100,0 30 549 30 549Goods and services 672 - (109) 563 563 - 100,0 589 589Interest and rent on land - - - - - - - - -
Transfers and subsidies 335 - (104) 231 231 - 100,0 33 33Departmental agencies and
accounts - - - - - - - - -Higher education institutions - - - - - - - - -Public corporations and
private enterprises - - - - - - - - -Non-profit institutions - - - - - - - - -Households 335 - (104) 231 231 - 100,0 33 33
Payments for capital assets 140 - (45) 95 95 - 100,0 88 88Buildings and other fixed
structures - - - - - - - - -Machinery and equipment 140 - (45) 95 95 - 100,0 88 88Software and other intangible
assets - - - - - - - - -
Payments for financial assets - - - - - - - - -Payments for financial assets - - - - - - - - -
Total 34 376 - (676) 33 700 33 700 - 100,0 31 259 31 259

Statistics South Africa – Vote 12
169
Programme 5 – Statistical Support and Informatics 2016/17 2015/16
Adjusted
appropriation Shifting of
funds Virement Final
appropriation Actual
expenditure Variance
Expenditure as % of final
appropriationFinal
appropriation Actual
expenditure Subprogramme R'000 R'000 R'000 R'000 R'000 R'000 % R'000 R'000 1. Programme Management for
Statistical Support and Informatics 4 177 - (68) 4 109 4 109 - 100,0 3 623 3 623
2. Geographic Services 26 878 309 (8 657) 18 530 18 530 - 100,0 19 222 15 5543. Geographic Frames 25 854 (309) (3 302) 22 243 22 243 - 100,0 20 003 19 5344. Publication Services 26 048 - (5 885) 20 163 20 163 - 100,0 22 226 22 2265. Data Management and
Technology 124 064 - 11 031 135 095 135 095 - 100,0 115 614 115 6146. Business Modernisation 50 023 - (2 280) 47 743 47 743 - 100,0 45 730 43 626 Total 257 044 - (9 161) 247 883 247 883 - 100,0 226 418 220 177

Statistics South Africa – Vote 12
170
Programme 5 – Statistical Support and Informatics (concluded) 2016/17 2015/16
Adjusted
appropriation Shifting of
funds Virement Final
appropriation Actual
expenditure Variance
Expenditure as % of final
appropriationFinal
appropriation Actual
expenditure Economic classification R'000 R'000 R'000 R'000 R'000 R'000 % R'000 R'000 Current payments 237 669 (513) (16 837) 220 319 220 319 - 100,0 205 637 199 396
Compensation of employees 138 171 - (11 982) 126 189 126 189 - 100,0 121 590 115 349Salaries and wages 121 077 93 (10 385) 110 785 110 785 - 100,0 107 721 101 480Social contributions 17 094 (93) (1 597) 15 404 15 404 - 100,0 13 869 13 869
Goods and services 99 498 (513) (4 855) 94 130 94 130 - 100,0 84 047 84 047Administrative fees 112 (44) (67) 1 1 - 100,0 4 4Advertising 7 - (7) - - - 100,0 43 43Minor assets 419 137 (158) 398 398 - 100,0 195 195Audit costs: External 53 - (53) - - - - - -Bursaries: Employees 242 - (124) 118 118 - 100,0 79 79Catering: Departmental
activities 50 15 (48) 17 17 - 100,0 28 28Communication (G&S) 4 725 17 (972) 3 770 3 770 - 100,0 4 417 4 417Computer services 81 218 (1 289) 856 80 785 80 785 - 100,0 68 220 68 220Consultants: Business and
advisory services 454 - (454) - - - - 96 96Infrastructure and planning
services 503 (500) (3) - - - - - -Legal services - - - - - - - - -Contractors 4 137 1 061 (1 555) 3 643 3 643 - 100,0 5 195 5 195Agency and support/
outsourced services - - - - - - - - -Entertainment - 1 (1) - - - - 3 3Fleet services (including
government motor transport) - - - - - - - - -
Inventory: Other supplies - - - - - - - - -Consumable supplies 651 (17) (501) 133 133 - 100,0 324 324Consumable: Stationery,
printing and office supplies 387 (195) (150) 42 42 - 100,0 536 536
Operating leases - - - - - - - - -Property payments - - - - - - - 24 24Travel and subsistence 3 743 136 (1 049) 2 830 2 830 - 100,0 1 285 1 285Training and development 947 - (64) 883 883 - 100,0 427 427Operating payments 1 772 189 (504) 1 457 1 457 - 100,0 3 088 3 088Venues and facilities 78 (24) (1) 53 53 - 100,0 83 83Rental and hiring - - - - - - - - -
Interest and rent on land - - - - - - - - -Interest (incl. interest on
unitary payments (PPP)) - - - - - - - - - -
Transfers and subsidies 28 129 15 172 172 - 100,0 333 333Departmental agencies and
accounts - - - - - - - 1 1Departmental agencies
(non-business entities) - - - - - - - 1 1Higher education institutions - - - - - - - 100 100Public corporations and
private enterprises - - - - - - - - -Private enterprises - - - - - - - - -
Other transfers to private enterprises - - - - - - - - -
Non-profit institutions - - - - - - - - -Households 28 129 15 172 172 - 100,0 232 232
Social benefits 28 129 (1) 156 156 - 100,0 232 232Other transfers to
households - - 16 16 16 - 100,0 - -
Payments for capital assets 19 347 384 7 661 27 392 27 392 - 100,0 20 448 20 448Buildings and other fixed
structures - - - - - - - - -Buildings - - - - - - - - -
Machinery and equipment 17 094 (165) 8 131 25 060 25 060 - 100,0 17 208 17 208Transport equipment - - - - - - - - -Other machinery and
equipment 17 094 (165) 8 131 25 060 25 060 - 100,0 17 208 17 208Software and other intangible
assets 2 253 549 (470) 2 332 2 332 - 100,0 3 240 3 240 -
Payment for financial assets - - - - - - - - - Total 257 044 - (9 161) 247 883 247 883 - 100,0 226 418 220 177
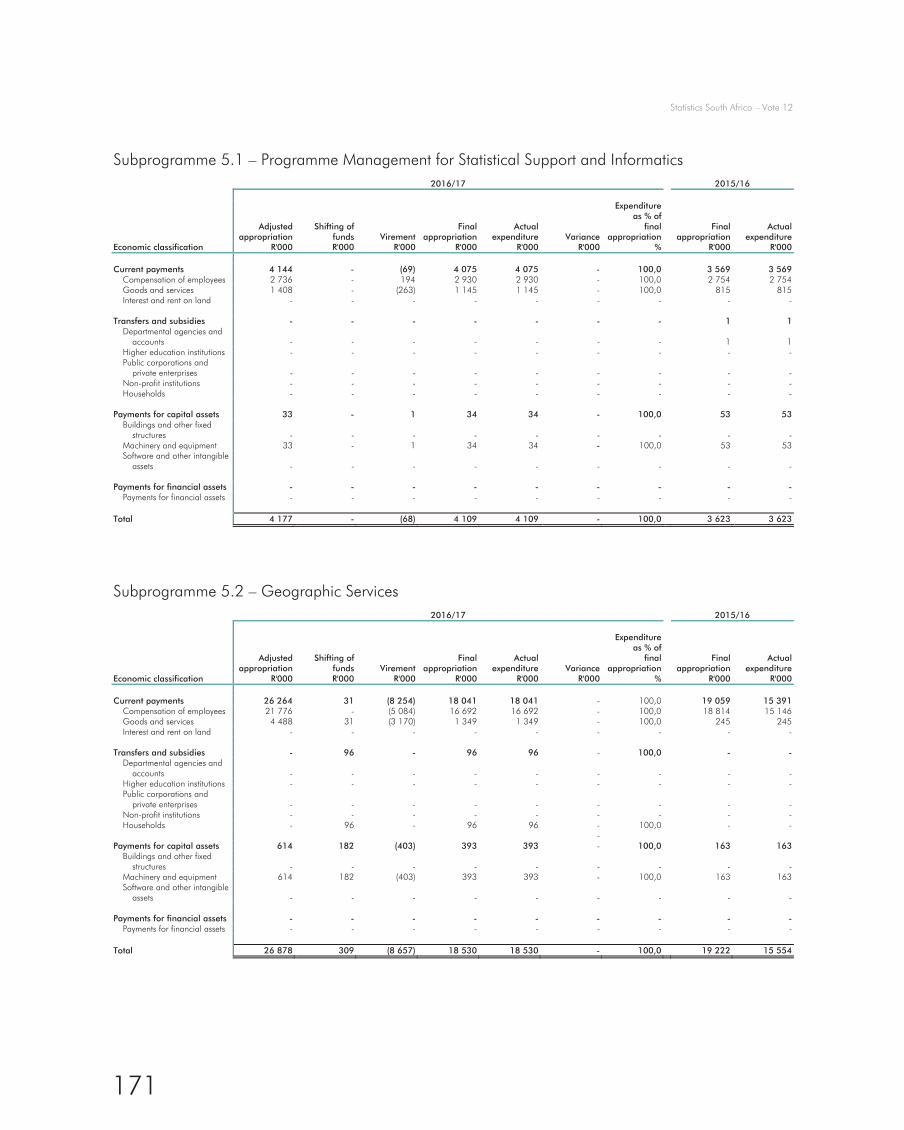
Statistics South Africa – Vote 12
171
Subprogramme 5.1 – Programme Management for Statistical Support and Informatics 2016/17 2015/16
Adjusted
appropriation Shifting of
funds VirementFinal
appropriationActual
expenditure Variance
Expenditureas % of
final appropriation
Finalappropriation
Actualexpenditure
Economic classification R'000 R'000 R'000 R'000 R'000 R'000 % R'000 R'000 Current payments 4 144 - (69) 4 075 4 075 - 100,0 3 569 3 569
Compensation of employees 2 736 - 194 2 930 2 930 - 100,0 2 754 2 754Goods and services 1 408 - (263) 1 145 1 145 - 100,0 815 815Interest and rent on land - - - - - - - - -
Transfers and subsidies - - - - - - - 1 1Departmental agencies and
accounts - - - - - - - 1 1Higher education institutions - - - - - - - - -Public corporations and
private enterprises - - - - - - - - -Non-profit institutions - - - - - - - - -Households - - - - - - - - -
Payments for capital assets 33 - 1 34 34 - 100,0 53 53Buildings and other fixed
structures - - - - - - - - -Machinery and equipment 33 - 1 34 34 - 100,0 53 53Software and other intangible
assets - - - - - - - - -
Payments for financial assets - - - - - - - - -Payments for financial assets - - - - - - - - -
Total 4 177 - (68) 4 109 4 109 - 100,0 3 623 3 623
Subprogramme 5.2 – Geographic Services 2016/17 2015/16
Adjusted
appropriation Shifting of
funds VirementFinal
appropriationActual
expenditure Variance
Expenditureas % of
final appropriation
Finalappropriation
Actualexpenditure
Economic classification R'000 R'000 R'000 R'000 R'000 R'000 % R'000 R'000 Current payments 26 264 31 (8 254) 18 041 18 041 - 100,0 19 059 15 391
Compensation of employees 21 776 - (5 084) 16 692 16 692 - 100,0 18 814 15 146Goods and services 4 488 31 (3 170) 1 349 1 349 - 100,0 245 245Interest and rent on land - - - - - - - - -
Transfers and subsidies - 96 - 96 96 - 100,0 - -Departmental agencies and
accounts - - - - - - - - -Higher education institutions - - - - - - - - -Public corporations and
private enterprises - - - - - - - - -Non-profit institutions - - - - - - - - -Households - 96 - 96 96 - 100,0 - - -
Payments for capital assets 614 182 (403) 393 393 - 100,0 163 163Buildings and other fixed
structures - - - - - - - - -Machinery and equipment 614 182 (403) 393 393 - 100,0 163 163Software and other intangible
assets - - - - - - - - -
Payments for financial assets - - - - - - - - -Payments for financial assets - - - - - - - - -
Total 26 878 309 (8 657) 18 530 18 530 - 100,0 19 222 15 554

Statistics South Africa – Vote 12
172
Subprogramme 5.3 – Geographic Frames 2016/17 2015/16
Adjusted
appropriation Shifting of
funds VirementFinal
appropriationActual
expenditure Variance
Expenditureas % of
final appropriation
Finalappropriation
Actualexpenditure
Economic classification R'000 R'000 R'000 R'000 R'000 R'000 % R'000 R'000 Current payments 25 207 (253) (3 045) 21 909 21 909 - 100,0 19 660 19 191
Compensation of employees 22 792 - (2 454) 20 338 20 338 - 100,0 18 624 18 155Goods and services 2 415 (253) (591) 1 571 1 571 - 100,0 1 036 1 036Interest and rent on land - - - - - - - - -
Transfers and subsidies 10 - (1) 9 9 - 100,0 100 100Departmental agencies and
accounts - - - - - - - - -Higher education institutions - - - - - - - - -Public corporations and
private enterprises - - - - - - - - -Non-profit institutions - - - - - - - - -Households 10 - (1) 9 9 - 100,0 - -
Payments for capital assets 637 (56) (256) 325 325 - 100,0 243 243Buildings and other fixed
structures - - - - - - - - -Machinery and equipment 637 (56) (256) 325 325 - 100,0 243 243Software and other intangible
assets - - - - - - - - -
Payments for financial assets - - - - - - - - -Payments for financial assets - - - - - - - - -
Total 25 854 (309) (3 302) 22 243 22 243 - 100,0 20 003 19 534
Subprogramme 5.4 – Publication Services 2016/17 2015/16
Adjusted
appropriation Shifting of
funds VirementFinal
appropriationActual
expenditure Variance
Expenditureas % of
final appropriation
Finalappropriation
Actualexpenditure
Economic classification R'000 R'000 R'000 R'000 R'000 R'000 % R'000 R'000 Current payments 20 771 (33) (1 159) 19 579 19 579 - 100,0 20 643 20 643
Compensation of employees 18 168 - (392) 17 776 17 776 - 100,0 16 779 16 779Goods and services 2 603 (33) (767) 1 803 1 803 - 100,0 3 864 3 864Interest and rent on land - - - - - - - - -
Transfers and subsidies - 33 - 33 33 - 100,0 - -Departmental agencies and
accounts - - - - - - - - -Higher education institutions - - - - - - - - -Public corporations and
private enterprises - - - - - - - - -Non-profit institutions - - - - - - - - -Households - 33 - 33 33 - 100,0 - -
Payments for capital assets 5 277 - (4 726) 551 551 - 100,0 1 583 1 583Buildings and other fixed
structures - - - - - - - - -Machinery and equipment 5 277 - (4 726) 551 551 - 100,0 1 583 1 583Software and other intangible
assets - - - - - - - - -
Payments for financial assets - - - - - - - - -Payments for financial assets - - - - - - - - -
Total 26 048 - (5 885) 20 163 20 163 - 100,0 22 226 22 226

Statistics South Africa – Vote 12
173
Subprogramme 5.5 – Data Management and Technology 2016/17 2015/16
Adjusted
appropriation Shifting of
funds VirementFinal
appropriationActual
expenditure Variance
Expenditureas % of
finalappropriation
Finalappropriation
Actualexpenditure
Economic classification R'000 R'000 R'000 R'000 R'000 R'000 % R'000 R'000 Current payments 112 221 (74) (2 352) 109 795 109 795 - 100,0 98 632 98 632
Compensation of employees 26 018 - (3 071) 22 947 22 947 - 100,0 21 661 21 661Goods and services 86 203 (74) 719 86 848 86 848 - 100,0 76 971 76 971Interest and rent on land - - - - - - - - -
Transfers and subsidies - - 16 16 16 - 100,0 22 22Departmental agencies and
accounts - - - - - - - - -Higher education institutions - - - - - - - - -Public corporations and
private enterprises - - - - - - - - -Non-profit institutions - - - - - - - - -Households - - 16 16 16 - 100,0 22 22
Payments for capital assets 11 843 74 13 367 25 284 25 284 - 100,0 16 960 16 960Buildings and other fixed
structures - - - - - - - - -Machinery and equipment 9 922 (520) 13 550 22 952 22 952 - 100,0 14 068 14 068Software and other intangible
assets 1 921 594 (183) 2 332 2 332 - 100,0 2 892 2 892
Payments for financial assets - - - - - - - - -Payments for financial assets - - - - - - - - -
Total 124 064 - 11 031 135 095 135 095 - 100,0 115 614 115 614
Subprogramme 5.6 – Business Modernisation 2016/17 2015/16
Adjusted
appropriation Shifting of
funds VirementFinal
appropriationActual
expenditure Variance
Expenditureas % of
final appropriation
Finalappropriation
Actualexpenditure
Economic classification R'000 R'000 R'000 R'000 R'000 R'000 % R'000 R'000 Current payments 49 062 (184) (1 958) 46 920 46 920 - 100,0 44 074 41 970
Compensation of employees 46 681 - (1 175) 45 506 45 506 - 100,0 42 958 40 854Goods and services 2 381 (184) (783) 1 414 1 414 - 100,0 1 116 1 116Interest and rent on land - - - - - - - - -
Transfers and subsidies 18 - - 18 18 - 100,0 210 210Departmental agencies and
accounts - - - - - - - - -Higher education institutions - - - - - - - - -Public corporations and
private enterprises - - - - - - - - -Non-profit institutions - - - - - - - - -Households 18 - - 18 18 - 100,0 210 210
Payments for capital assets 943 184 (322) 805 805 - 100,0 1 446 1 446Buildings and other fixed
structures - - - - - - - - -Machinery and equipment 611 229 (35) 805 805 - 100,0 1 098 1 098Software and other intangible
assets 332 (45) (287) - - - - 348 348
Payments for financial assets - - - - - - - - -Payments for financial assets - - - - - - - - -
Total 50 023 - (2 280) 47 743 47 743 - 100,0 45 730 43 626

Statistics South Africa – Vote 12
174
Programme 6 – Statistical Collection and Outreach 2016/17 2015/16
Adjusted
appropriation Shifting of
funds Virement Final
appropriation Actual
expenditure Variance
Expenditure as % of final
appropriationFinal
appropriation Actual
expenditure Subprogramme R'000 R'000 R'000 R'000 R'000 R'000 % R'000 R'000 1. Programme Management for
Statistical Collection and Outreach 8 187 94 140 8 421 8 421 - 100,0 8 253 8 253
2. International Statistical Development and Cooperation 11 041 - (4 074) 6 967 6 967 - 100,0 8 595 8 595
3. Provincial and District Offices 515 186 - 63 520 578 706 578 706 - 100,0 525 369 525 369 4. Stakeholders Relations and
Marketing 20 142 - 82 20 224 20 224 - 100,0 19 204 19 2045. Corporate Communications 16 826 (94) (962) 15 770 15 770 - 100,0 14 364 14 364 Total 571 382 - 58 706 630 088 630 088 - 100,0 575 785 575 785

Statistics South Africa – Vote 12
175
Programme 6 – Statistical Collection and Outreach (concluded) 2016/17 2015/16
Adjusted
appropriation Shifting of
funds Virement Final
appropriation Actual
expenditure Variance
Expenditure as % of final
appropriationFinal
appropriation Actual
expenditure Economic classification R'000 R'000 R'000 R'000 R'000 R'000 % R'000 R'000 Current payments 557 146 - 55 745 612 891 612 891 - 100,0 555 615 555 615
Compensation of employees 467 564 - 26 357 493 921 493 921 - 100,0 447 690 447 690Salaries and wages 407 254 38 18 160 425 452 425 452 - 100,0 383 714 383 714Social contributions 60 310 (38) 8 197 68 469 68 469 - 100,0 63 976 63 976
Goods and services 89 582 - 29 388 118 970 118 970 - 100,0 107 925 107 925Administrative fees 10 - 47 57 57 - 100,0 7 7Advertising 415 (388) 519 546 546 - 100,0 1 304 1 304Minor assets 168 24 (96) 96 96 - 100,0 51 51Audit costs: External - - - - - - - - -Bursaries: Employees 1 945 (107) (689) 1 149 1 149 - 100,0 603 603Catering: Departmental
activities 886 (7) (472) 407 407 - 100,0 508 508Communication (G&S) 9 762 (10) 5 420 15 172 15 172 - 100,0 13 056 13 056Computer services 114 - (32) 82 82 - 100,0 61 61Consultants: Business and
advisory services 1 123 (458) (93) 572 572 - 100,0 648 648Infrastructure and planning
services - - - - - - - - -Legal services - - - - - - - - -Contractors 387 111 (122) 376` 376 - 100,0 311 311Agency and support/
outsourced services 119 148 354 621 621 - 100,0 315 315Entertainment 11 (3) (4) 4 4 - 100,0 7 7Fleet services (including
government motor transport) 15 535 (226) 3 879 19 188 19 188 - 100,0 19 480 19 480
Consumable supplies 1 136 55 (268) 923 923 - 100,0 871 871Consumable: Stationery,
printing and office supplies 2 054 (265) (197) 1 592 1 592 - 100,0 2 858 2 858
Operating leases 33 152 (135) 22 159 55 176 55 176 - 100,0 44 257 44 257Property payments 354 (110) 510 754 754 - 100,0 77 77Travel and subsistence 15 067 2 355 2 221 19 643 19 643 - 100,0 21 378 21 378Training and development 2 937 (964) (1 710) 263 263 - 100,0 156 156Operating payments 3 189 25 (1 103) 2 111 2 111 - 100,0 1 605 1 605Venues and facilities 1 201 (44) (950) 207 207 - 100,0 207 207Rental and hiring 17 (1) 15 31 31 - 100,0 165 165
Interest and rent on land - - - - - - - - -Interest (incl. interest on
unitary payments (PPP)) - - - - - - - - -
Transfers and subsidies 152 - 999 1 151 1 151 - 100,0 757 757Departmental agencies and
accounts - - 9 9 9 - 100,0 6 6Departmental agencies
(non-business entities) - - 9 9 9 - 100,0 6 6Higher education institutions - - - - - - - - -Public corporations and
private enterprises - - 30 30 30 - 100,0 23 23Private enterprises - - - - - - - - -
Other transfers to private enterprises - - 30 30 30 - 100,0 23 23
Non-profit institutions - - - - - - - - -Households 152 - 960 1 112 1 112 - 100,0 728 728
Social benefits 152 - 950 1 102 1 102 - 100,0 680 680Other transfers to
households - - 10 10 10 - 100,0 48 48
Payments for capital assets 14 084 - 1 962 16 046 16 046 - 100,0 19 413 19 413Buildings and other fixed
structures - - - - - - - - -Buildings - - - - - - - - -
Machinery and equipment 14 084 - 1 930 16 014 16 014 - 100,0 19 413 19 413Transport equipment 6 000 - 1 177 7 177 7 177 - 100,0 8 837 8 837Other machinery and
equipment 8 084 - 753 8 837 8 837 - 100,0 10 576 10 576Software and other intangible
assets - - 32 32 32 - 100,0 - -
Payment for financial assets - - - - - - - - -Payment for financial assets - - - - - - - - -
Total 571 382 - 58 706 630 088 630 088 - 100,0 575 785 575 785

Statistics South Africa – Vote 12
176
Subprogramme 6.1 – Programme Management for Statistical Collection and Outreach 2016/17 2015/16
Adjusted
appropriation Shifting of
funds VirementFinal
appropriationActual
expenditure Variance
Expenditureas % of
final appropriation
Finalappropriation
Actualexpenditure
Economic classification R'000 R'000 R'000 R'000 R'000 R'000 % R'000 R'000 Current payments 8 063 94 (105) 8 052 8 052 - 100,0 7 943 7 943
Compensation of employees 5 185 - (395) 4 790 4 790 - 100,0 4 550 4 550Goods and services 2 878 94 290 3 262 3 262 - 100,0 3 393 3 393Interest and rent on land - - - - - - - - -
Transfers and subsidies - - 10 10 10 - 100,0 - -Departmental agencies and
accounts - - - - - - - - -Higher education institutions - - - - - - - - -Public corporations and
private enterprises - - - - - - - - -Non-profit institutions - - - - - - - - -Households - - 10 10 10 - 100,0 - -
Payments for capital assets 124 - 235 359 359 - 100,0 310 310Buildings and other fixed
structures - - - - - - - - -Machinery and equipment 124 - 235 359 359 - 100,0 310 310Software and other intangible
assets - - - - - - - - -
Payments for financial assets - - - - - - - - -Payments for financial assets - - - - - - - - -
Total 8 187 94 140 8 421 8 421 - 100,0 8 253 8 253
Subprogramme 6.2 – International Statistical Development and Cooperation 2016/17 2015/16
Adjusted
appropriation Shifting of
funds VirementFinal
appropriationActual
expenditure Variance
Expenditureas % of
final appropriation
Finalappropriation
Actualexpenditure
Economic classification R'000 R'000 R'000 R'000 R'000 R'000 % R'000 R'000 Current payments 10 788 - (4 055) 6 733 6 733 - 100,0 8 137 8 137
Compensation of employees 8 059 - (2 748) 5 311 5 311 - 100,0 5 886 5 886Goods and services 2 729 - (1 307) 1 422 1 422 - 100,0 2 251 2 251Interest and rent on land - - - - - - - - -
Transfers and subsidies 23 - (1) 22 22 - 100,0 - -Departmental agencies and
accounts - - - - - - - - -Higher education institutions - - - - - - - - -Public corporations and
private enterprises - - - - - - - - -Non-profit institutions - - - - - - - - -Households 23 - (1) 22 22 - 100,0 - -
Payments for capital assets 230 - (18) 212 212 - 100,0 458 458Buildings and other fixed
structures - - - - - - - - -Machinery and equipment 230 - (18) 212 212 - 100,0 458 458Software and other intangible
assets - - - - - - - - -
Payments for financial assets - - - - - - - - -Payments for financial assets - - - - - - - - -
Total 11 041 - (4 074) 6 967 6 967 - 100,0 8 595 8 595

Statistics South Africa – Vote 12
177
Subprogramme 6.3 – Provincial and District Offices 2016/17 2015/16
Adjusted
appropriation Shifting of
funds VirementFinal
appropriationActual
expenditure Variance
Expenditureas % of
final appropriation
Finalappropriation
Actualexpenditure
Economic classification R'000 R'000 R'000 R'000 R'000 R'000 % R'000 R'000 Current payments 502 306 - 60 326 562 632 562 632 - 100,0 506 546 506 546
Compensation of employees 421 350 - 29 787 451 137 451 137 - 100,0 408 204 408 204Goods and services 80 956 - 30 539 111 495 111 495 - 100,0 98 342 98 342Interest and rent on land - - - - - - - - - -
Transfers and subsidies 27 - 1 070 1 097 1 097 - 100,0 715 715Departmental agencies and
accounts - - 1 1 1 - 100,0 4 4Higher education institutions - - - - - - - - -Public corporations and
private enterprises - - 30 30 30 - 100,0 23 23Non-profit institutions - - - - - - - - -Households 27 - 1 039 1 066 1 066 - 100,0 688 688
Payments for capital assets 12 853 - 2 124 14 977 14 977 - 100,0 18 108 18 108Buildings and other fixed
structures - - - - - - - - -Machinery and equipment 12 853 - 2 124 14 977 14 977 - 100,0 18 108 18 108Software and other intangible
assets - - - - - - - - -
Payments for financial assets - - - - - - - - -Payments for financial assets - - - - - - - - -
Total 515 186 - 63 520 578 706 578 706 - 100,0 525 369 525 369
Subprogramme 6.4 – Stakeholder Relations and Marketing 2016/17 2015/16
Adjusted
appropriation Shifting of
funds VirementFinal
appropriationActual
expenditure Variance
Expenditureas % of
final appropriation
Finalappropriation
Actualexpenditure
Economic classification R'000 R'000 R'000 R'000 R'000 R'000 % R'000 R'000 Current payments 19 961 - 179 20 140 20 140 - 100,0 19 027 19 027
Compensation of employees 19 221 - 421 19 642 19 642 - 100,0 17 836 17 836Goods and services 740 - (242) 498 498 - 100,0 1 191 1 191Interest and rent on land - - - - - - - - -
Transfers and subsidies 11 - (1) 10 10 - 100,0 15 15Departmental agencies and
accounts - - - - - - - - -Higher education institutions - - - - - - - - -Public corporations and
private enterprises - - - - - - - - -Non-profit institutions - - - - - - - - -Households 11 - (1) 10 10 - 100,0 15 15
Payments for capital assets 170 - (96) 74 74 - 100,0 162 162Buildings and other fixed
structures - - - - - - - - -Machinery and equipment 170 - (96) 74 74 - 100,0 162 162Software and other intangible
assets - - - - - - - - -
Payments for financial assets - - - - - - - - -Payments for financial assets - - - - - - - - -
Total 20 142 - 82 20 224 20 224 - 100,0 19 204 19 204

Statistics South Africa – Vote 12
178
Subprogramme 6.5 – Corporate Communications 2016/17 2015/16
Adjusted
appropriation Shifting of
funds VirementFinal
appropriationActual
expenditure Variance
Expenditureas % of
final appropriation
Finalappropriation
Actualexpenditure
Economic classification R'000 R'000 R'000 R'000 R'000 R'000 % R'000 R'000 Current payments 16 028 (94) (600) 15 334 15 334 - 100,0 13 962 13 962
Compensation of employees 13 749 - (708) 13 041 13 041 - 100,0 11 214 11 214Goods and services 2 279 (94) 108 2 293 2 293 - 100,0 2 748 2 748Interest and rent on land - - - - - - - - -
Transfers and subsidies 91 - (79) 12 12 - 100,0 27 27Departmental agencies and
accounts - - 8 8 8 - 100,0 2 2Higher education institutions - - - - - - - - -Public corporations and
private enterprises - - - - - - - - -Non-profit institutions - - - - - - - - -Households 91 - (87) 4 4 - 100,0 25 25
Payments for capital assets 707 - (283) 424 424 - 100,0 375 375Buildings and other fixed
structures - - - - - - - - -Machinery and equipment 707 - (315) 392 392 - 100,0 375 375Software and other intangible
assets - - 32 32 32 - 100,0 - -
Payments for financial assets - - - - - - - - -Payments for financial assets - - - - - - - - -
Total 16 826 (94) (962) 15 770 15 770 - 100,0 14 364 14 364

Statistics South Africa – Vote 12
179
Programme 7 – Survey Operations 2016/17 2015/16
Adjusted
appropriation Shifting of
funds Virement Final
appropriation Actual
expenditure Variance
Expenditure as % of final
appropriationFinal
appropriation Actual
expenditure Subprogramme R'000 R'000 R'000 R'000 R'000 R'000 % R'000 R'000 1. Programme Management for
Survey Operations 14 491 (484) (3 905) 10 102 10 102 - 100,0 12 867 12 8672. Census and Community
Survey Operations 407 948 (503) (3 271) 404 174 368 378 35 796 91,1 111 112 111 1123. Household Survey Operations 22 811 484 720 24 015 24 015 - 100,0 28 587 28 5874. Corporate Data Processing 69 578 - 5 291 74 869 74 869 - 100,0 69 603 69 6035. Survey Coordination,
Monitoring and Evaluation 18 518 503 (2 351) 16 670 16 670 - 100,0 17 297 17 297 Total 533 346 - (3 516) 529 830 494 034 35 796 93,2 239 466 239 466

Statistics South Africa – Vote 12
180
Programme 7 – Survey Operations (concluded) 2016/17 2014/15
Adjusted
appropriation Shifting of
funds Virement Final
appropriation Actual
expenditure Variance
Expenditure as % of final
appropriationFinal
appropriation Actual
expenditure Economic classification R'000 R'000 R'000 R'000 R'000 R'000 % R'000 R'000 Current payments 521 829 (583) (3 091) 518 155 486 098 32 057 93,8 231 746 231 746
Compensation of employees 171 428 - 1 726 173 154 143 943 29 211 83,1 136 993 136 993Salaries and wages 154 798 - (392) 154 406 125 195 29 211 81,1 119 878 119 878Social contributions 16 630 - 2 118 18 748 18 748 - 100,0 17 115 17 115
Goods and services 350 401 (583) (4 817) 345 001 342 155 2 846 99,2 94 753 94 753Administrative fees 260 (235) (1) 24 24 - 100,0 - -Advertising 6 161 (823) 724 6 062 6 062 - 100,0 2 445 2 445Minor assets 41 787 (6 001) (3 859) 31 927 31 927 - 100,0 1 613 1 613Audit costs: External - - - - - - - - -Bursaries: Employees 439 - (233) 206 206 - 100,0 422 422Catering: Departmental
activities 4 033 (275) (1 661) 2 097 2 097 - 100,0 11 192 11 192Communication (G&S) 12 365 (989) (207) 11 169 11 169 - 100,0 2 346 2 346Computer services 5 011 2 302 (3 270) 4 043 4 043 - 100,0 2 163 2 163Consultants: Business and
advisory services 6 471 3 261 (429) 9 303 9 303 - 100,0 - -Infrastructure and planning
services - - - - - - - - -Legal services - - - - - - - - -Contractors 2 995 449 (2 176) 1 268 1 268 - 100,0 911 911Agency and support/
outsourced services 100 704 5 29 218 129 927 129 927 - 100,0 9 134 9 134Entertainment 6 - (6) - - - - - -Fleet services (including
government motor transport) 8 043 (2 763) (2 976) 2 304 2 304 - 100,0 1 195 1 195
Consumable supplies 1 083 861 (736) 1 208 1 208 - 100,0 1 749 1 749Consumable: Stationery,
printing and office supplies 4 172 (957) (2 174) 1 041 1 041 - 100,0 1 495 1 495
Operating leases - - - - - - - - -Property payments 60 - (55) 5 5 - 100,0 2 2Travel and subsistence 140 312 4 485 (11 394) 133 403 130 557 2 846 97,9 48 709 48 709Training and development 1 256 (113) (793) 350 350 - 100,0 113 113Operating payments 10 355 (3 995) (3 515) 2 845 2 845 - 100,0 5 052 5 052Venues and facilities 4 452 3 680 (904) 7 228 7 228 - 100,0 5 512 5 512Rental and hiring 436 525 (370) 591 591 - 100,0 700 700
Interest and rent on land - - - - - - - - -Interest (incl. interest on
unitary payments (PPP)) - - - - - - - - -
Transfers and subsidies 4 739 - 102 4 841 1 352 3 489 27,9 370 370Departmental agencies and
accounts - - - - - - - - -Departmental agencies
(non-business entities) - - - - - - - - -Higher education institutions - - - - - - - - -Public corporations and
private enterprises - - - - - - - 54 54Private enterprises - - - - - - - 54 54
Other transfers to private enterprises - - - - - - - 54 54
Non-profit institutions - - - - - - - - -Households 4 739 - 102 4 841 1 352 3 489 27,9 316 316
Social benefits 4 739 - 72 4 811 1 322 3 489 27,5 249 249Other transfers to
households - - 30 30 30 - 100,0 67 67
Payments for capital assets 6 778 583 (527) 6 834 6 584 250 96,3 7 350 7 350Buildings and other fixed
structures - - - - - - - - -Buildings - - - - - - - - -
Machinery and equipment 6 288 583 (518) 6 353 6 353 - 100,0 7 350 7 350Transport equipment - - - - - - - - -Other machinery and
equipment 6 288 583 (518) 6 353 6 353 - 100,0 7 350 7 350Software and other intangible
assets 490 - (9) 481 231 250 48,0 - -
Payment for financial assets - - - - - - - - -Payment for financial assets - - - - - - - - -
Total 533 346 - (3 516) 529 830 494 034 35 796 93,2 239 466 239 466

Statistics South Africa – Vote 12
181
Subprogramme 7.1 – Programme Management for Survey Operations 2016/17 2015/16
Adjusted
appropriation Shifting of
funds VirementFinal
appropriationActual
expenditure Variance
Expenditureas % of
final appropriation
Finalappropriation
Actualexpenditure
Economic classification R'000 R'000 R'000 R'000 R'000 R'000 % R'000 R'000 Current payments 14 095 (484) (4 096) 9 515 9 515 - 100,0 12 807 12 807
Compensation of employees 11 723 - (2 776) 8 947 8 947 - 100,0 10 649 10 649Goods and services 2 372 (484) (1 320) 568 568 - 100,0 2 158 2 158Interest and rent on land - - - - - - - - -
Transfers and subsidies - - 532 532 532 - 100,0 - -Departmental agencies and
accounts - - - - - - - - -Higher education institutions - - - - - - - - -Public corporations and
private enterprises - - - - - - - - -Non-profit institutions - - - - - - - - -Households - - 532 532 532 - 100,0 - -
Payments for capital assets 396 - (341) 55 55 - 100,0 60 60Buildings and other fixed
structures - - - - - - - - -Machinery and equipment 396 - (341) 55 55 - 100,0 60 60Software and other intangible
assets - - - - - - - - -
Payments for financial assets - - - - - - - - -Payments for financial assets - - - - - - - - -
Total 14 491 (484) (3 905) 10 102 10 102 - 100,0 12 867 12 867
Subprogramme 7.2 – Census and Community Survey Operations 2016/17 2015/16
Adjusted
appropriation Shifting of
funds VirementFinal
appropriationActual
expenditure Variance
Expenditureas % of
final appropriation
Finalappropriation
Actualexpenditure
Economic classification R'000 R'000 R'000 R'000 R'000 R'000 % R'000 R'000 Current payments 398 967 (1 086) (3 571) 394 310 362 253 32 057 91,9 105 158 105 158
Compensation of employees 59 491 - 468 59 959 30 748 29 211 51,3 27 092 27 092Goods and services 339 476 (1 086) (4 039) 334 351 331 505 2 846 99,1 78 066 78 066Interest and rent on land - - - - - - - - -
Transfers and subsidies 4 266 - (51) 4 215 726 3 489 17,2 140 140Departmental agencies and
accounts - - - - - - - - -Higher education institutions - - - - - - - - -Public corporations and
private enterprises - - - - - - - 54 54Non-profit institutions - - - - - - - - -Households 4 266 - (51) 4 215 726 3 489 17,2 86 86
Payments for capital assets 4 715 583 351 5 649 5 399 250 95,6 5 814 5 814Buildings and other fixed
structures - - - - - - - - -Machinery and equipment 4 465 583 351 5 399 5 399 - 100,0 5 814 5 814Software and other intangible
assets 250 - - 250 - 250 - - -
Payments for financial assets - - - - - - - - -Payments for financial assets - - - - - - - - -
Total 407 948 (503) (3 271) 404 174 368 378 35 796 91,1 111 112 111 112

Statistics South Africa – Vote 12
182
Subprogramme 7.3 – Household Survey Operations 2016/17 2015/16
Adjusted
appropriation Shifting of
funds VirementFinal
appropriationActual
expenditure Variance
Expenditureas % of
final appropriation
Finalappropriation
Actualexpenditure
Economic classification R'000 R'000 R'000 R'000 R'000 R'000 % R'000 R'000 Current payments 21 998 484 1 145 23 627 23 627 - 100,0 27 706 27 706
Compensation of employees 16 451 - 119 16 570 16 570 - 100,0 16 183 16 183Goods and services 5 547 484 1 026 7 057 7 057 - 100,0 11 523 11 523Interest and rent on land - - - - - - - - -
Transfers and subsidies 381 - (287) 94 94 - 100,0 171 171Departmental agencies and
accounts - - - - - - - - -Higher education institutions - - - - - - - - -Public corporations and
private enterprises - - - - - - - - -Non-profit institutions - - - - - - - - -Households 381 - (287) 94 94 - 100,0 171 171
Payments for capital assets 432 - (138) 294 294 - 100,0 710 710Buildings and other fixed
structures - - - - - - - - -Machinery and equipment 432 - (138) 294 294 - 100,0 710 710Software and other intangible
assets - - - - - - - - -
Payments for financial assets - - - - - - - - -Payments for financial assets - - - - - - - - -
Total 22 811 484 720 24 015 24 015 - 100,0 28 587 28 587
Subprogramme 7.4 – Corporate Data Processing 2016/17 2015/16
Adjusted
appropriation Shifting of
funds VirementFinal
appropriationActual
expenditure Variance
Expenditureas % of
final appropriation
Finalappropriation
Actualexpenditure
Economic classification R'000 R'000 R'000 R'000 R'000 R'000 % R'000 R'000 Current payments 69 056 - 5 311 74 367 74 367 - 100,0 69 135 69 135
Compensation of employees 66 900 - 5 914 72 814 72 814 - 100,0 66 581 66 581Goods and services 2 156 - (603) 1 553 1 553 - 100,0 2 554 2 554Interest and rent on land - - - - - -
Transfers and subsidies - - - - - - - 57 57Departmental agencies and
accounts - - - - - - - - -Higher education institutions - - - - - - - - -Public corporations and
private enterprises - - - - - - - - -Non-profit institutions - - - - - - - - -Households - - - - - - - 57 57
Payments for capital assets 522 - (20) 502 502 - 100,0 411 411Buildings and other fixed
structures - - - - - - - - -Machinery and equipment 282 - (11) 271 271 - 100,0 411 411Software and other intangible
assets 240 - (9) 231 231 - 100,0 - -
Payments for financial assets - - - - - - - - -Payments for financial assets - - - - - - - - -
Total 69 578 - 5 291 74 869 74 869 100,0 69 603 69 603

Statistics South Africa – Vote 12
183
Subprogramme 7.5 – Survey Coordination, Monitoring and Evaluation 2016/17 2015/16
Adjusted
appropriation Shifting of
funds VirementFinal
appropriationActual
expenditure Variance
Expenditureas % of
final appropriation
Finalappropriation
Actualexpenditure
Economic classification R'000 R'000 R'000 R'000 R'000 R'000 % R'000 R'000 Current payments 17 713 503 (1 880) 16 336 16 336 - 100,0 16 940 16 940
Compensation of employees 16 863 - (1 999) 14 864 14 864 - 100,0 16 488 16 488Goods and services 850 503 119 1 472 1 472 - 100,0 452 452Interest and rent on land - - - - - - - - -
Transfers and subsidies 92 - (92) - - - - 2 2Departmental agencies and
accounts - - - - - - - - -Higher education institutions - - - - - - - - -Public corporations and
private enterprises - - - - - - - - -Non-profit institutions - - - - - - - - -Households 92 (92) - - - - 2 2
Payments for capital assets 713 - (379) 334 334 - 100,0 355 355Buildings and other fixed
structures - - - - - - - - -Machinery and equipment 713 - (379) 334 334 - 100,0 355 355Software and other intangible
assets - - - - - - - - -
Payments for financial assets - - - - - - - - -Payments for financial assets - - - - - - - - -
Total 18 518 503 (2 351) 16 670 16 670 - 100,0 17 297 17 297

Statistics South Africa – Vote 12
184
Notes to the appropriation statement for the year ended 31 March 2017
1. Details of transfers and subsidies as per Appropriation Act (after virement): Details of these transactions can be viewed in the note on Transfers and subsidies, disclosure notes and Annexure 1 (A-E) to the annual financial statements.
2. Details of specifically and exclusively appropriated amounts voted (after virement): Details of these transactions can be viewed in note 1 (Annual appropriation) to the annual financial statements.
3. Details on payments for financial assets: Details of these transactions per programme can be viewed in the note on Payments for financial assets to the Annual Financial Statements.
4. Explanations of material variances from amounts voted (after virement):
Final
appropriation Actual
expenditure Variance
Variance as a % of final
appropriation4.1 Per programme R’000 R’000 R’000 % Administration The under spending relates to vacant funded posts, capital
contribution portion and unitary fee payments that were retained as a result of incomplete finishes to the new building.
707 647 671 188 36 459 5,2%
Economic Statistics 233 312 233 312 - 0,0% Population and Social Statistics
The underspending is due to vacant funded posts. 119 146 114 498 4 648 3,9%
Methodology, Research and Standards
70 202 70 202 - 0,0%
Statistical Support and Informatics
247 883 247 883 - 0,0%
Statistical Collection and Outreach
630 088 630 088 - 0,0%
Survey Operations The underspending is mainly due to non-completion of the
Community Survey 2016 dissemination. 529 830 494 034 35 796 6,8%

Statistics South Africa – Vote 12
185
Final
appropriation Actual
expenditure Variance
Variance as a % of final
appropriation4.2 Per economic classification R’000 R’000 R’000 % Current payments
Compensation of employees 1 408 390 1 371 767 36 623 2,6Goods and services 853 844 849 935 3 909 0,5Interest and rent on land - - - -
Transfers and subsidies
Departmental agencies and accounts 15 9 6 40,0Higher education institutions 8 191 7 500 691 8,4Public corporations and private enterprises 185 185 - -Non-profit institutions 323 290 33 10,2Households 8 596 5 107 3 489 40,6
Payments for capital assets
Buildings and other fixed structures 187 160 155 911 31 249 16,7Machinery and equipment 62 239 61 586 653 1,0Software and other intangible assets 2 955 2 705 250 8,5
Payments for financial assets
Payments for financial assets 6 210 6 210 - -
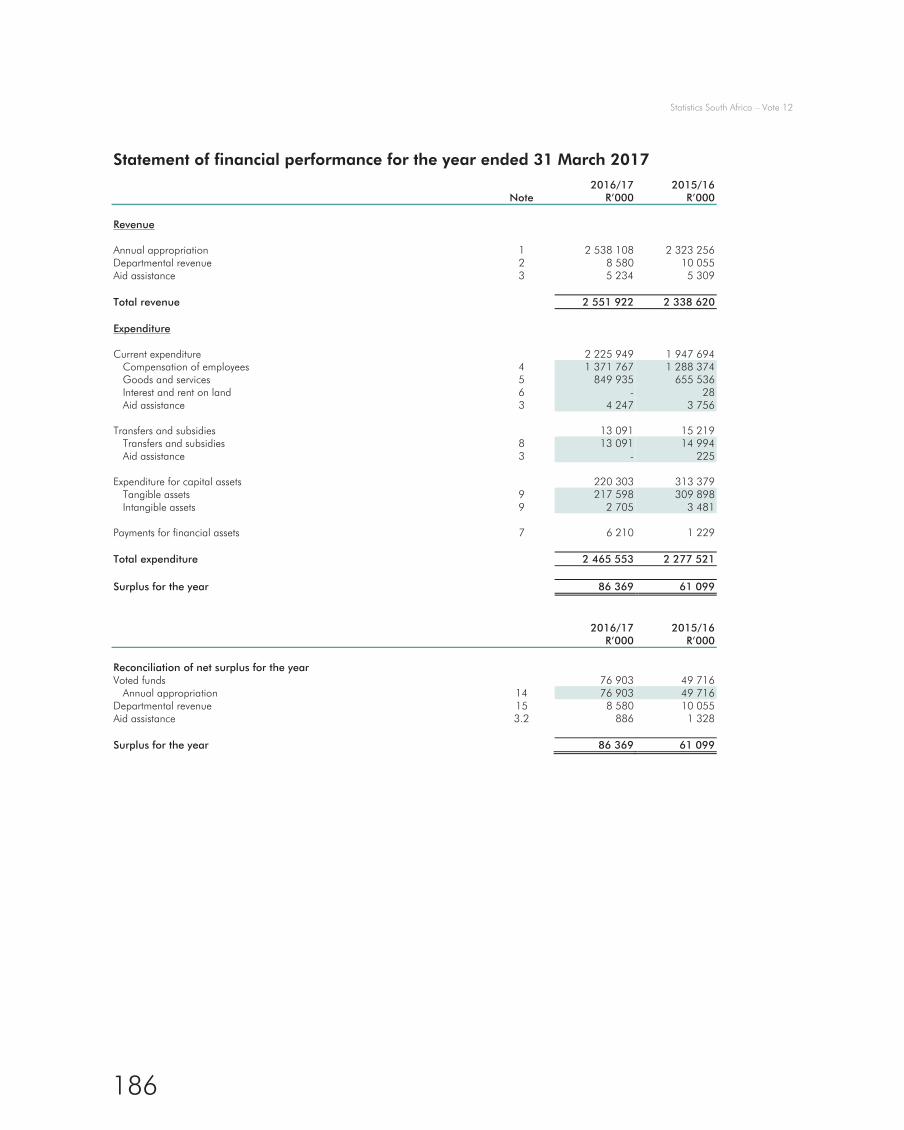
Statistics South Africa – Vote 12
186
Statement of financial performance for the year ended 31 March 2017
2016/17 2015/16 Note R’000 R’000 Revenue Annual appropriation 1 2 538 108 2 323 256Departmental revenue 2 8 580 10 055Aid assistance 3 5 234 5 309 Total revenue 2 551 922 2 338 620 Expenditure Current expenditure 2 225 949 1 947 694
Compensation of employees 4 1 371 767 1 288 374Goods and services 5 849 935 655 536Interest and rent on land 6 - 28 Aid assistance 3 4 247 3 756
Transfers and subsidies 13 091 15 219
Transfers and subsidies 8 13 091 14 994Aid assistance 3 - 225
Expenditure for capital assets 220 303 313 379
Tangible assets 9 217 598 309 898Intangible assets 9 2 705 3 481
Payments for financial assets 7 6 210 1 229 Total expenditure 2 465 553 2 277 521 Surplus for the year 86 369 61 099 2016/17 2015/16 R’000 R’000 Reconciliation of net surplus for the year Voted funds 76 903 49 716
Annual appropriation 14 76 903 49 716Departmental revenue 15 8 580 10 055Aid assistance 3.2 886 1 328 Surplus for the year 86 369 61 099

Statistics South Africa – Vote 12
187
Statement of financial position as at 31 March 2017
2016/17 2015/16 Note R'000 R'000 Assets Current assets 91 290 86 476
Unauthorised expenditure 10 6 803 6 803Cash and cash equivalents 11 43 517 39 599Prepayments and advances 12 147 312Receivables 13 40 823 39 762
Non-current assets 249 118
Receivables 13 249 118 Total assets 91 539 86 594 Liabilities Current liabilities 88 066 84 382
Voted funds to be surrendered to the Revenue Fund 14 76 903 56 519Departmental revenue to be surrendered to the Revenue Fund 15 70 254Payables 16 10 207 26 323Aid assistance repayable 3 886 1 286
Total liabilities 88 066 84 382 Net assets 3 473 2 212 2016/17 2015/16 R'000 R'000 Represented by
Recoverable revenue 3 473 2 212 Total 3 473 2 212

Statistics South Africa – Vote 12
188
Statement of changes in net assets for the year ended 31 March 2017
2016/17 2015/16 R'000 R'000 Recoverable revenue Opening balance 2 212 1 705 Transfers 1 261 507
Debts revised 670 740Debts recovered (included in departmental receipts) (247) (360)Debts raised 838 127
Closing balance 3 473 2 212

Statistics South Africa – Vote 12
189
Cash flow statement for the year ended 31 March 2017
2016/17 2015/16 Note R'000 R'000 Cash flows from operating activities Receipts 2 550 883 2 338 620
Annual appropriated funds received 1 2 538 108 2 323 256Departmental revenue received 2 7 431 9 931Interest received 2.2 110 124Aid assistance received 3 5 234 5 309
Net (increase)/decrease in working capital (17 143) (1 978)Surrendered to Revenue Fund (65 283) (96 157)Surrendered to RDP Fund/donor (1 286) (3 239)Current payments (2 225 949) (1 940 863)Interest paid 6 - (28)Payments for financial assets (6 210) (1 229)Transfers and subsidies paid (13 091) (15 219) Net cash flow available from operating activities 17 221 921 279 907 Cash flows from investing activities Payments for capital assets 9 (220 303) (313 379)Proceeds from sale of capital assets 2.3 1 039 - Net cash flows from investing activities (219 264) (313 379) Cash flows from financing activities Increase in net assets 1 261 507 Net cash flows from financing activities 1 261 507 Net decrease in cash and cash equivalents 3 918 (32 965)
Cash and cash equivalents at beginning of period 39 599 72 564 Unrealised gains and losses within cash and cash equivalents - - Cash and cash equivalents at end of period 18 43 517 39 599
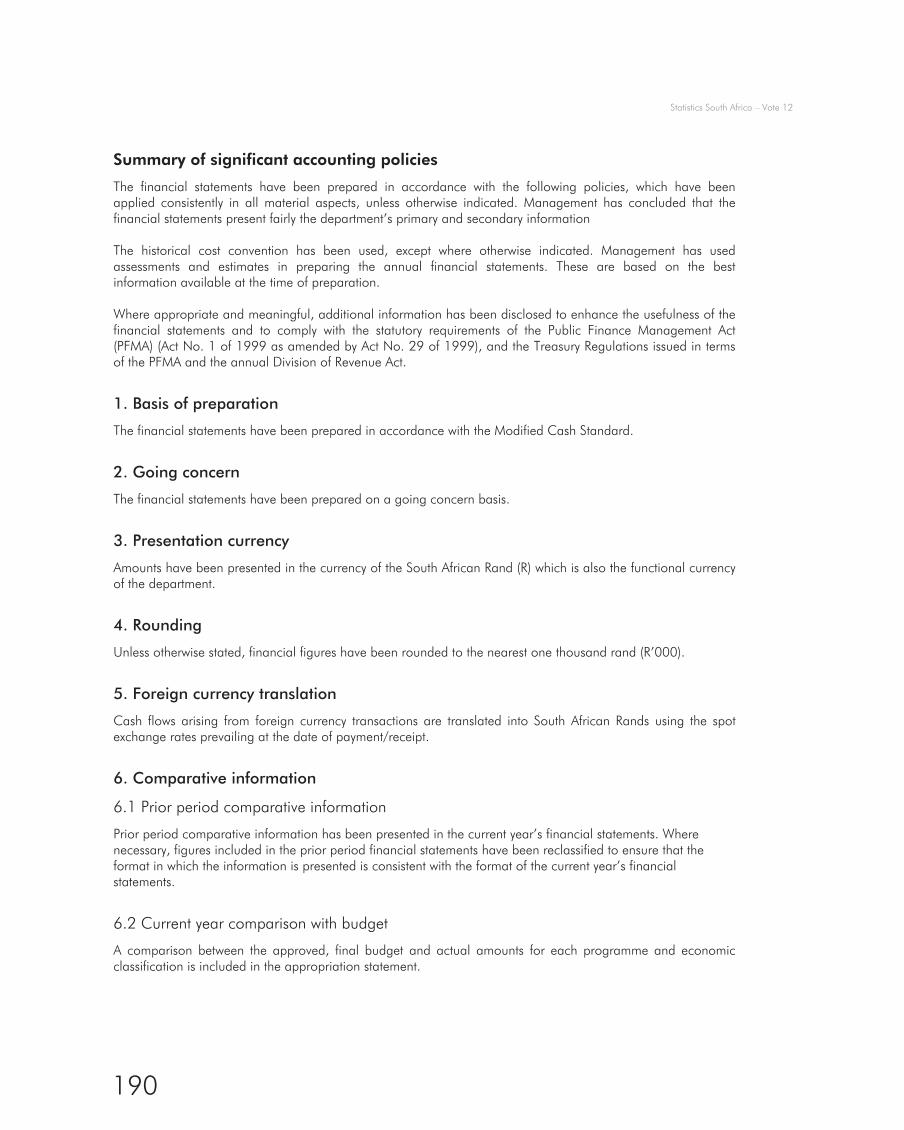
Statistics South Africa – Vote 12
190
Summary of significant accounting policies
The financial statements have been prepared in accordance with the following policies, which have been applied consistently in all material aspects, unless otherwise indicated. Management has concluded that the financial statements present fairly the department’s primary and secondary information The historical cost convention has been used, except where otherwise indicated. Management has used assessments and estimates in preparing the annual financial statements. These are based on the best information available at the time of preparation. Where appropriate and meaningful, additional information has been disclosed to enhance the usefulness of the financial statements and to comply with the statutory requirements of the Public Finance Management Act (PFMA) (Act No. 1 of 1999 as amended by Act No. 29 of 1999), and the Treasury Regulations issued in terms of the PFMA and the annual Division of Revenue Act.
1. Basis of preparation
The financial statements have been prepared in accordance with the Modified Cash Standard.
2. Going concern
The financial statements have been prepared on a going concern basis.
3. Presentation currency
Amounts have been presented in the currency of the South African Rand (R) which is also the functional currency of the department.
4. Rounding
Unless otherwise stated, financial figures have been rounded to the nearest one thousand rand (R’000).
5. Foreign currency translation
Cash flows arising from foreign currency transactions are translated into South African Rands using the spot exchange rates prevailing at the date of payment/receipt.
6. Comparative information
6.1 Prior period comparative information
Prior period comparative information has been presented in the current year’s financial statements. Where necessary, figures included in the prior period financial statements have been reclassified to ensure that the format in which the information is presented is consistent with the format of the current year’s financial statements.
6.2 Current year comparison with budget
A comparison between the approved, final budget and actual amounts for each programme and economic classification is included in the appropriation statement.

Statistics South Africa – Vote 12
191
7. Revenue
7.1 Appropriated funds
Appropriated funds comprise departmental allocations as well as direct charges against the revenue fund, i.e. statutory appropriation. Appropriated funds are recognised in the statement of financial performance on the date the appropriation becomes effective. Adjustments made in terms of the adjustments budget process are recognised in the statement of financial performance on the date the adjustments become effective. The net amount of any appropriated funds due to/from the relevant revenue fund at the reporting date is recognised as a payable/receivable in the statement of financial position.
7.2 Departmental revenue
Departmental revenue is recognised in the statement of financial performance when received and is subsequently paid into the relevant revenue fund, unless stated otherwise. Any amount owing to the relevant revenue fund at the reporting date is recognised as a payable in the statement of financial position.
7.3 Accrued departmental revenue
Accruals in respect of departmental revenue (excluding tax revenue) are recorded in the notes to the financial statements when:
• it is probable that the economic benefits or service potential associated with the transaction will flow to the department; and
• the amount of revenue can be measured reliably. The accrued revenue is measured at the fair value of the consideration receivable. Accrued tax revenue (and related interest and / penalties) is measured at amounts receivable from collecting agents. Write-offs are made according to the department’s debt write-off policy.
8. Expenditure
8.1 Compensation of employees
8.1.1 Salaries and wages
Salaries and wages are recognised in the statement of financial performance on the date of payment. Compensation paid to key management personnel, including their family members where relevant, is included in the notes to the financial statements.

Statistics South Africa – Vote 12
192
8.1.2 Social contributions
Social contributions made by the department in respect of current employees are recognised in the statement of financial performance on the date of payment. Social contributions made by the department in respect of ex-employees are classified as transfers to households in the statement of financial performance on the date of payment.
8.2 Other expenditure
Other expenditure (such as goods and services, transfers and subsidies and payments for capital assets) is recognised in the statement of financial performance on the date of payment. The expense is classified as a capital expense if the total consideration paid is more than the capitalisation threshold.
8.3 Payments for financial assets
Debts are written off when identified as irrecoverable. Debts written off are limited to the amount of savings and/or underspending of appropriated funds. The write-off occurs at year-end or when funds are available. No provision is made for irrecoverable amounts but an estimate is included in the notes to the financial statements amounts. All other losses are recognised when authorisation has been granted for the recognition thereof.
8.4 Accruals and payables not recognised
Accruals and payables not recognised are recorded in the notes to the financial statements when the goods are received or, in the case of services, when they are rendered to the department or in the case of transfers and subsidies when they are due and payable. Accruals and payables not recognised are measured at cost.
8.5 Leases
8.5.1 Operating leases
Operating lease payments made during the reporting period are recognised as current expenditure in the statement of financial performance on the date of payment. The operating lease commitments are recorded in the notes to the financial statements.
8.5.2 Finance leases
Finance lease payments made during the reporting period are recognised as capital expenditure in the statement of financial performance on the date of payment. The finance lease commitments are recorded in the notes to the financial statements and are not apportioned between the capital and interest portions. Finance lease assets acquired at the end of the lease term are recorded and measured at the lower of:
• cost, being the fair value of the asset; or
• the sum of the minimum lease payments made, including any payments made to acquire ownership at the end of the lease term, excluding interest.

Statistics South Africa – Vote 12
193
9. Aid assistance
9.1 Aid assistance received
Aid assistance received in cash is recognised in the statement of financial performance when received. In-kind aid assistance is recorded in the notes to the financial statements on the date of receipt and is measured at fair value. Aid assistance not spent for the intended purpose and any unutilised funds from aid assistance that are required to be refunded to the donor are recognised as a payable in the statement of financial position.
9.2 Aid assistance paid
Aid assistance paid is recognised in the statement of financial performance on the date of payment. Aid assistance payments made prior to the receipt of funds are recognised as a receivable in the statement of financial position.
10. Cash and cash equivalents
Cash and cash equivalents are stated at cost in the statement of financial position. Bank overdrafts are shown separately on the face of the statement of financial position as a current liability. For the purposes of the cash flow statement, cash and cash equivalents comprise cash on hand, deposits held, other short-term highly liquid investments and bank overdrafts.
11. Prepayments and advances
Prepayments and advances are recognised in the statement of financial position when the department receives or disburses the cash. Prepayments and advances are initially and subsequently measured at cost. The department expenses prepayments for certain conference and training related registrations as well as software licence renewals.
12. Loans and receivables
Loans and receivables are recognised in the statement of financial position at cost plus accrued interest, where interest is charged, less amounts already settled or written off. Write offs are made according to the departments write off policy.
13. Investments
Investments are recognised in the statement of financial position at cost.

Statistics South Africa – Vote 12
194
14. Financial assets
14.1 Financial assets (not covered elsewhere)
A financial asset is recognised initially at its cost plus transaction costs that are directly attributable to the acquisition or issue of the financial asset. At the reporting date, a department shall measure its financial assets at cost, less amounts already settled or written off, except for recognised loans and receivables, which are measured at cost plus accrued interest, where interest is charged, less amounts already settled or written off.
14.2 Impairment of assets
Where there is an indication of impairment of a financial asset, an estimation of the reduction in the recorded carrying value, to reflect the best estimate of the amount of the future economic benefits expected to be received from that asset, is recorded in the notes to the financial statements.
15. Payables
Payables are recognised in the statement of financial position at cost.
16. Capital assets
16.1 Movable capital assets
Movable capital assets are initially recorded in the notes to the financial statements at cost. Movable capital assets acquired through a non-exchange transaction are measured at fair value as at the date of acquisition. Where the cost of movable capital assets cannot be determined reliably, the movable capital assets are measured at fair value, and where fair value cannot be determined, the movable assets are measured at R1. All assets acquired prior to 1 April 2002 (or a later date as approved by the Office of the Accountant-General [OAG]) are recorded at R1. Movable capital assets are subsequently carried at cost and are not subject to depreciation or impairment. Subsequent expenditure that is of a capital nature is added to the cost of the asset at the end of the capital project unless the movable asset is recorded by another department/entity in which case the completed project costs are transferred to that department.
16.2 Intangible assets
Intangible assets are initially recorded in the notes to the financial statements at cost. Intangible assets acquired through a non-exchange transaction are measured at fair value as at the date of acquisition. Internally generated intangible assets are recorded in the notes to the financial statements when the department commences the development phase of the project. Where the cost of intangible assets cannot be determined reliably, the intangible capital assets are measured at fair value, and where fair value cannot be determined, the intangible assets are measured at R1. All assets acquired prior to 1 April 2002 (or a later date as approved by the OAG) are recorded at R1. Intangible assets are subsequently carried at cost and are not subject to depreciation or impairment.

Statistics South Africa – Vote 12
195
Subsequent expenditure that is of a capital nature is added to the cost of the asset at the end of the capital project unless the intangible asset is recorded by another department/entity in which case the completed project costs are transferred to that department.
17. Provisions and contingents
17.1 Provisions
Provisions are recorded in the notes to the financial statements when there is a present legal or constructive obligation to forfeit economic benefits as a result of events in the past and it is probable that an outflow of resources embodying economic benefits or service potential will be required to settle the obligation and a reliable estimate of the obligation can be made. The provision is measured as the best estimate of the funds required to settle the present obligation at the reporting date.
17.2 Contingent liabilities
Contingent liabilities are recorded in the notes to the financial statements when there is a possible obligation that arises from past events, and whose existence will be confirmed only by the occurrence or non-occurrence of one or more uncertain future events not within the control of the department or when there is a present obligation that is not recognised because it is not probable that an outflow of resources will be required to settle the obligation or the amount of the obligation cannot be measured reliably.
17.3 Contingent assets
Contingent assets are recorded in the notes to the financial statements when a possible asset arises from past events, and whose existence will be confirmed by the occurrence or non-occurrence of one or more uncertain future events not within the control of the department.
17.4 Commitments
Commitments, other than for transfers and subsidies, are recorded at cost in the notes to the financial statements when there is a contractual arrangement or an approval by management in a manner that raises a valid expectation that the department will discharge its responsibilities thereby incurring future expenditure that will result in the outflow of cash.
18. Unauthorised expenditure
Unauthorised expenditure is recognised in the statement of financial position until such time as the expenditure is either:
• approved by Parliament with funding and the related funds are received; or
• approved by Parliament without funding and is written off against the appropriation in the statement of financial performance; or
• transferred to receivables for recovery. Unauthorised expenditure is measured at the amount of the confirmed unauthorised expenditure.

Statistics South Africa – Vote 12
196
19. Fruitless and wasteful expenditure
Fruitless and wasteful expenditure is recorded in the notes to the financial statements when confirmed. The amount recorded is equal to the total value of the fruitless and/or wasteful expenditure incurred. Fruitless and wasteful expenditure is removed from the notes to the financial statements when it is resolved or transferred to receivables for recovery. Fruitless and wasteful expenditure receivables are measured at the amount that is expected to be recoverable and are de-recognised when settled or subsequently written off as irrecoverable.
20. Irregular expenditure
Irregular expenditure is recorded in the notes to the financial statements when confirmed. The amount recorded is equal to the total value of the irregular expenditure incurred unless it is impracticable to determine, in which case reasons thereof are provided in the note. Irregular expenditure is removed from the note when it is either condoned by the relevant authority, transferred to receivables for recovery or not condoned and is not recoverable. Irregular expenditure receivables are measured at the amount that is expected to be recoverable and are de-recognised when settled or subsequently written off as irrecoverable. 21. Changes in accounting policies, accounting estimates and errors
Changes in accounting policies that are effected by management have been applied retrospectively in accordance with MCS requirements, except to the extent that it is impracticable to determine the period-specific effects or the cumulative effect of the change in policy. In such instances the department shall restate the opening balances of assets, liabilities and net assets for the earliest period for which retrospective restatement is practicable. Changes in accounting estimates are applied prospectively in accordance with MCS requirements. Correction of errors is applied retrospectively in the period in which the error has occurred in accordance with MCS requirements, except to the extent that it is impracticable to determine the period-specific effects or the cumulative effect of the error. In such cases the department shall restate the opening balances of assets, liabilities and net assets for the earliest period for which retrospective restatement is practicable.
22. Events after the reporting date
Events after the reporting date that are classified as adjusting events have been accounted for in the financial statements. The events after the reporting date that are classified as non-adjusting events after the reporting date have been disclosed in the notes to the financial statements.
23. Departures from Modified Cash Standards (MCS) requirements
The financial statements present fairly the department’s primary and secondary information. The department has complied with the requirement of the MCS.
24. Recoverable revenue
Amounts are recognised as recoverable revenue when a payment made in a previous financial year becomes recoverable from a debtor in the current financial year. Amounts are either transferred to the National/Provincial Revenue Fund when recovered or are transferred to the statement of financial performance when written off.
Statistics South Africa – Vote 12
197
25. Related party transactions
A related party transaction is a transfer of resources, services or obligations between the reporting entity and a related party. Related party transactions within the Minister’s portfolio are recorded in the notes to the financial statements when the transaction is not at arm’s length. Key management personnel are those persons having the authority and responsibility for planning, directing and controlling the activities of the department. The number of individuals and their full compensation is recorded in the notes to the financial statements.
26. Inventories
At the date of acquisition, inventories are recorded at cost price in the notes to the financial statements. Where inventories are acquired as part of a non-exchange transaction, the cost of inventory is its fair value at the date of acquisition. Inventories are subsequently measured at the lower of cost and net realisable value or the lower of cost and current replacement value. Subsequent measurement of the cost of inventory is determined on the weighted average basis.
27. Public Private Partnerships
Public Private Partnerships are accounted for based on the nature and or the substance of the partnership. The transaction is accounted for in accordance with the relevant accounting policies. A summary of the significant terms of the PPP agreement, the parties to the agreement, and the date of commencement thereof together with the description and nature of the concession fees received, the unitary fees paid, rights and obligations of the department are recorded in the notes to the financial statements.
28. Employee benefits
Short-term employee benefits that give rise to a present legal or constructive obligation are disclosed in the notes to the financial statements. These amounts are not recognised in the statement of financial performance or the statement of financial position. The value of each major class of employee benefit obligation (accruals, payables not recognised and provisions) is disclosed in the Employee Benefits note.

Statistics South Africa – Vote 12
198
Notes to the annual financial statements for the year ended 31 March 2017
1. Annual appropriation
Included are funds appropriated in terms of the Appropriation Act (and the Adjustments Appropriation Act) for national departments (voted funds).
2016/17 2015/16
Final
appropriationActual funds
received
Funds not requested/
not received
Final
appropriationAppropriation
receivedProgramme R’000 R’000 R’000 R’000 R’000 Administration 707 647 744 653 (37 006) 849 840 853 833Economic Statistics 233 312 228 773 4 539 218 651 215 868Population and Social Statistics 119 146 129 488 (10 342) 154 385 144 882Methodology, Standards and Research 70 202 73 422 (3 220) 58 711 64 587Statistical Support and Informatics 247 883 257 044 (9 161) 226 418 246 106Statistical Collection and Outreach 630 088 571 382 58 706 575 785 556 828Survey Operations 529 830 533 346 (3 516) 239 466 241 152Total 2 538 108 2 538 108 - 2 323 256 2 323 256
The department requested all the appropriated funds as per its cash flow projections. Surpluses were realised due to the retained capital contribution relating to the incomplete new building finishes, a 15% deducted from unitary fee payments for all incomplete items in the new building, 50% balance for the SMS members’ furniture and to continue with the dissemination of the 2016 Community Survey results. Rollover was requested for the following: Programme 1: Rollover of R31,249 million has been requested in respect of the unspent capital contribution towards the new building in 2016/17 and a 15% deduction from the unitary fee payments. Programme 7: Rollover of R35,796 million unspent for the dissemination of the 2016 Community Survey results.
2. Departmental revenue
2016/17 2015/16 Note R’000 R’000 Sales of goods and services other than capital assets 2.1 1 563 1 115Interest, dividends and rent on land 2.2 110 124Sales of capital assets 2.3 1 039 -Transactions in financial assets and liabilities 2.4 5 838 8 816Transfers received 30 -Total departmental revenue 8 580 10 055
2.1 Sales of goods and services other than capital assets
2016/17 2015/16 R’000 R’000 Sales of goods and services produced by the department 826 938
Sales by market establishment 142 277Other sales 684 661
Sales of scrap, waste and other used current goods 737 177Total 1 563 1 115
The increase in the sales of scrap and waste is attributed to the disposal of old records.

Statistics South Africa – Vote 12
199
2.2 Interest, dividends and rent on land
2016/17 2015/16 R’000 R’000 Interest 110 124Total 110 124
There was a decrease in interest recovered from debtors on outstanding accounts.
2.3 Sale of capital assets
2016/17 2015/16 R’000 R’000 Tangible assets - -
Machinery and equipment 1 039 -Total 1 039 -
Revenue generated from the sales of capital assets is attributed to sales of assets due to moving to the new Stats SA Head Office building which came with furniture for non-SMS members and equipment.
2.4 Transactions in financial assets and liabilities
2016/17 2015/16 R’000 R’000 Receivables 162 258Other receipts including recoverable revenue 5 676 8 558Total 5 838 8 816
Other receipts including recoverable revenue relate to the recovery of previous years’ expenditure not disallowed as receivables. These amounts fluctuate from year to year.
2.5 Transfers received
2016/17 2015/16 R’000 R’000 Other governmental units 30 -Total 30 -
A cash amount of R30 thousand was received for a SITA ICT award.

Statistics South Africa – Vote 12
200
3. Aid assistance
2016/17 2015/16 R’000 R’000 Opening balance 1 286 3 197Transferred from statement of financial performance 886 1 328Paid during the year (1 286) (3 239) Closing balance 886 1 286
Aid assistance received was R5,234 million, whilst R4,348 million was spent leaving a surplus of R886 thousand transferred from statement of financial performance. No aid assistance was received from local sources. An amount of R101 thousand for cellphone finance leases for aid assistance has been included under expenditure for capital assets for voted funds in the PER due to AFS template limitation, however note 9.1 the split has been reflected for the different types.
3.1 Analysis of balance by source
2016/17 2015/16 R’000 R’000 Aid assistance from RDP 886 1 286Closing balance 886 1 286
3.2 Analysis of balance
2016/17 2015/16 R’000 R’000 Aid assistance repayable 886 1 286Closing balance 886 1 286
4. Compensation of employees
4.1 Salaries and wages
2016/17 2015/16 R’000 R’000 Basic salary 962 587 904 538Performance award 20 547 18 826Service-based 1 510 1 105Compensative/circumstantial 5 851 6 023Periodic payments 1 115 1 014Other non-pensionable allowances 201 134 189 262Total 1 192 744 1 120 768

Statistics South Africa – Vote 12
201
4.2 Social contributions
2016/17 2015/16 R’000 R’000 Employer contributions Pension 120 314 112 744Medical 58 460 54 600Bargaining councils 249 262Total 179 023 167 606 Total compensation of employees 1 371 767 1 288 374 Average number of employees 3 320 3 730 The increase in compensation of employees is attributed to the general salary increases. The decrease in average number of employees in 2016/17 is due to the Living Conditions Survey and the Community Survey 2016 projects for which the employee number was included in the 2015/16 figures.
5. Goods and services
2016/17 2015/16 Note R’000 R’000 Administrative fees 768 590Advertising 10 294 6 870Minor assets 5.1 32 535 2 177Bursaries (employees) 2 533 2 109Catering 4 440 13 344Communication 34 647 25 832Computer services 5.2 87 292 72 870Consultants: Business and advisory services 22 711 18 673Infrastructure and planning services - -Legal services 13 551 2 818Contractors 9 186 8 424Agency and support/outsourced services 130 910 9 707Entertainment 27 62Audit cost – external 5.3 5 614 7 168Fleet services 24 300 30 007Consumables 5.4 7 832 13 737Operating leases 183 139 211 228Property payments 5.5 59 371 69 444Rental and hiring 1 523 875Travel and subsistence 5.6 186 385 131 784Venues and facilities 7 891 8 329Training and development 5 082 2 795Other operating expenditure 5.7 19 904 16 693Total goods and services 849 935 655 536
The significant increase on agency and support / outsourced services and minor assets is attributed to payments made to the 2016 Community Survey (CS) fieldworkers and gadgets acquired for the 2016 CS digital data collection respectively. Other significant increases on advertising, communication, travel and subsistence, are also attributed to the 2016 CS project during the reporting period. The increase in rental and hiring costs is due to hiring of tables and chairs at training venues for the Community Survey 2016. The increase in consultants: business and advisory services is attributed to the use of consultants for the New Building Project which was still in the construction phase during the period under review. The decrease in operating leases is due to the reduction in payment of office buildings leases for the Stats SA Head Office buildings attributed to vacating the old Head Office buildings to the new building. The decrease in catering and operating leases is attributed to the efficiencies brought about by the new building.

Statistics South Africa – Vote 12
202
5.1 Minor assets
2016/17 2015/16 R’000 R’000 Tangible assets 32 484 2 135
Machinery and equipment 32 484 2 135Intangible assets 51 42
Software 51 42Total 32 535 2 177
The increase in minor tangible assets is due to the procurement of gadgets procured due to the new digital data collection for the Community Survey 2016.
5.2 Computer services
2016/17 2015/16 R’000 SITA computer services 27 201 19 485External computer service providers 60 091 53 385Total 87 292 72 870
The increase in computer services is attributed to the increase in transactions on transversal systems due to the Community Survey 2016.
5.3 Audit cost – external
2016/17 2015/16 R’000 R’000 Regularity audits 5 452 6 120Investigations - 455Computer audits 162 593Total 5 614 7 168
The decrease in external audit costs is due to improved quality on the submitted financial statements, associated disclosure information, and key controls.
5.4 Consumables
2016/17 2015/16 R’000 R’000
Consumable supplies 3 526 3 603
Uniform and clothing 694 892Household supplies 2 006 1 807Communication accessories 14 2IT consumables 487 346Other consumables 325 556
Stationery, printing and office supplies 4 306 10 134Total 7 832 13 737
The decrease in consumables is attributed to the decrease in the use of stationery, printing, and office supplies due to the new digital data collection method replacing printed questionnaires.

Statistics South Africa – Vote 12
203
5.5 Property payments
2016/17 2015/16 R’000 R’000 Municipal services 30 457 38 412Property maintenance and repairs 28 914 31 032Total 59 371 69 444
The decrease in municipal services is attributed to Stats SA vacating its old Head Office buildings and moving to the new building, as well as the scaling down of non-essential maintenance in the old building.
5.6 Travel and subsistence
2016/17 2015/16 R’000 R’000 Local 172 820 117 735Foreign 13 565 14 049Total 186 385 131 784
The increase in travel and subsistence is attributed to the Community Survey 2016.
5.7 Other operating expenditure
2016/17 2015/16 R’000 R’000 Professional bodies, membership and subscription fees 1 063 33Resettlement costs 497 992Other 18 344 15 668Total 19 904 16 693
The expenditure under the category other is for courier and delivery services, freight services, and printing and publication services. The increase on this item is attributed to the increase in courier and publication services due to the Community Survey 2016 in the main.
6. Interest and rent on land
2016/17 2015/16 Note R’000 R’000 Interest paid - 28Total - 28

Statistics South Africa – Vote 12
204
7. Payments for financial assets
2016/17 2015/16 Note R’000 R’000 Other material losses written off 7.1 5 624 849Debts written off 7.2 586 380Total payments for financial assets 6 210 1 229
7.1 Other material losses written off
2016/17 2015/16 R’000 R’000
Damages and losses 5 624 849Total 5 624 849
The material cases written off, relate to damages to hired vehicles utilised during surveys.
7.2 Debts written off
2016/17 2015/16 R’000 R’000
Uneconomical/irrecoverable/prescribed debts 586 380Total 586 380
8. Transfers and subsidies
2016/17 2015/16 Note R’000 R’000 Departmental agencies and accounts Annexure 1A 9 15Higher education institutions Annexure 1B 7 500 7 600Public corporations and private enterprises Annexure 1C 185 77Non-profit institutions Annexure 1D 290 437Households Annexure 1E 5 107 6 865Total transfers and subsidies 13 091 14 994 Unspent funds transferred to the above beneficiaries -- -
Provinces and municipalities - -Departmental agencies and accounts - -
The decrease in payments to households is due to a decrease in leave gratuities to ex-employees and bursary allocations to non-employees. The decrease in transfer payment to non-profit institutions is attributed to the South African Statistical Association (SASA) not requesting the entire budgeted amount due to unspent funds from their side in the 2015/16 financial year. A once off transfer to the University of Pretoria in the 2015/16 financial year contributed to the reduction of transfers to higher education institutions.

Statistics South Africa – Vote 12
205
9. Expenditure for capital assets
2016/17 2015/16 Note R’000 R’000 Tangible assets 217 598 309 898
Buildings and other fixed structures 32.1 155 911 255 265Machinery and equipment 30.1 61 687 54 633
Intangible assets 2 705 3 481
Software 31.1 2 705 3 481
Total expenditure for capital assets 220 303 313 379
Included in the expenditure for buildings and other fixed structures is R110,465 million for the unitary fee payments and R45,465 million for capital contribution towards the completion of construction of the new building paid in the reporting period. The increase in expenditure for machinery and equipment is attributed to new servers procured to store data collected and processed during Community Survey 2016. In addition the storage area network refresh/maintenance project conducted once every five years also contributed to the increase in expenditure.
9.1 Analysis of funds utilised to acquire capital assets – 2016/17
Voted funds Aid assistance Total R’000 R’000 R’000 Tangible assets 217 497 101 217 598
Buildings and other fixed structures 155 911 - 155 911Machinery and equipment 61 586 101 61 687
Intangible assets 2 705 - 2 705
Software 2 705 - 2 705
Total 220 202 101 220 303
9.2 Analysis of funds utilised to acquire capital assets – 2015/16
Voted funds Aid assistance Total R’000 R’000 R’000 Tangible assets 309 898 - 309 898
Buildings and other fixed structures 255 265 - 255 265Machinery and equipment 54 633 - 54 633
Intangible assets 3 481 - 3 481
Software 3 481 - 3 481 Total 313 379 - 313 379

Statistics South Africa – Vote 12
206
9.3 Finance lease expenditure included in expenditure for capital assets
2016/17 2015/16 R’000 R’000 Tangible assets 138 170 33 312
Buildings and other fixed assets 110 465 -Machinery and equipment 27 705 33 312
Intangible assets - -Total 138 170 33 312
In terms of the PPP contract for Stats SA building, the unitary fee payment related to the new building increases from 1 April based on the annual CPI. Stats SA occupied its new building on 29 August 2016.
10. Unauthorised expenditure
10.1 Reconciliation of unauthorised expenditure
2016/17 2015/16 Note R’000 R’000 Opening balance Prior period error
6 803 1 340(1 340)
Unauthorised expenditure - discovered in current year - 6 803Closing balance 6 803 6 803
The Living Conditions Survey (LCS) used to update the Consumer Price Index (CPI) has not been funded for a number of years. The department used savings realised from vacancies and cost cutting measures to fund this priority project. The Population and Social Statistics programme exceeded its allocated funds by R16,306 million during the 2015/16 financial year due to the LCS not being part of the baseline allocation. Savings of R9,503 million were transferred to this programme to defray the deficit. The over expenditure of R6,803 million could not be defrayed due to limitations of section 43 of the Public Finance Management Act, 29 of 1999 and resulted in unauthorised expenditure. Stats SA is still awaiting approval of the unauthorised expenditure.
10.2 Analysis of unauthorised expenditure awaiting authorisation per economic classification
2016/17 2015/16 Note R’000 R’000 Current 6 803 6 803Capital - -Transfers and subsidies - -Total 6 803 6 803
10.3 Analysis of unauthorised expenditure awaiting authorisation per type
2016/17 2015/16 Note R’000 R’000 Unauthorised expenditure relating to overspending of the vote or a main division within a vote 6 803 6 803Total 6 803 6 803

Statistics South Africa – Vote 12
207
10.4 Details of unauthorised expenditure – current year
2016/17Incident Disciplinary steps taken/criminal proceedings R’000 -Total -
10.5 Prior period error
2015/16 Note R’000 Nature of prior period error Relating to 2014/15 (affecting the opening balance) (1 340)
This was due to the utilisation of savings from transfers to goods and services without obtaining approval prior to implementation resulting in non-compliance with the PFMA. This was classified as unauthorised expenditure during the 2015/16 AFS, and was adjusted to irregular expenditure as it materially related to the latter during 2016/17. (1 340)
Total (1 340)
11. Cash and cash equivalents
2016/17 2015/16 R’000 R’000 Consolidated Paymaster General Account 43 233 38 766Cash on hand 284 284Investments (domestic) - 549Total cash and cash equivalents 43 517 39 599
The consolidated PMG account reflects a positive bank balance which includes remaining cash at the reporting date for foreign aid assistance, and contract / inter-departmental projects. The department has to surrender a surplus of R76,903 million due to unspent funds relating to the capital contribution, 15% deductions made from the unitary fee payments and unused funds required for the continuation of disseminating the 2016 Community Survey results. A rollover was requested from National Treasury. The decrease in domestic investments is due to the finalisation of the Community Survey 2016 fieldwork during the reporting period.
12. Prepayments and advances
2016/17 2015/16 Note R’000 R’000 Travel and subsistence 147 312Prepayments (Not expensed) 12.2 - -Advances paid (Not expensed) 12.1 - -Total prepayments and advances 147 312

Statistics South Africa – Vote 12
208
12.1 Advances paid (not expensed)
2016/17 2015/16 Note R’000 R’000 Other institutions - -Total - -
12.2 Prepayments (not expensed)
2016/17 2015/16 Note R’000 R’000 Goods and services - -Interest and rent on land - -Transfers and subsidies - -Capital assets - -Other - -Total - -
12.3 Prepayments (expensed)
2016/17 2015/16 Note R’000 R’000 Goods and services 16 828 36 615Interest and rent on land - -Transfers and subsidies - -Capital assets - -Other - -Total 16 828 36 615
This note has been introduced for the first time in the 2015/16 financial year. The department had budgeted for these items in the 2016/17 financial year and all licence fees are prescribed in the relevant contracts with various service providers. Payments are due by the end of March for continuity of services from 1 April each year, therefore these prepayments are regarded as expenditure in the year of payment processing.
12.4 Advances paid (expensed)
2016/17 2015/16 Note R’000 R’000 National departments - -Provincial departments - -Public entities - -Other entities - -Total - -

Statistics South Africa – Vote 12
209
13. Receivables
2016/17 2015/16
Current Non-Current Total Current Non-Current Total
Note R’000 R’000 R’000 R’000 R’000 R’000
Claims recoverable 13.1 8 671 - 8 671 10 976 - 10 976Recoverable expenditure 13.2 29 348 - 29 348 25 991 - 25 991Staff debt 13.3 2 795 249 3 044 2 794 118 2 912Fruitless and wasteful
expenditure 13.4 9 - 9 1 - 1Total receivables 40 823 249 41 072 39 762 118 39 880
In the statement of financial position, receivables less than one year are disclosed under current assets and amounts older than a year are disclosed under non-current assets. 13.1 Claims recoverable
2016/17 2015/16 Note R’000 R’000
National departments Annexure 3 8 516 10 880Provincial departments Annexure 3 59 -Public entities Annexure 3 96 96Total 8 671 10 976
13.2 Recoverable expenditure
2016/17 2015/16 R’000 R’000
Disallowance: Damages and losses 20 416 18 060Disallowance: Miscellaneous 287 -Disallowance: Fraud 126 128Debts emanating from service providers 8 519 7 803Total 29 348 25 991
With regard to debts emanating from service providers, an amount of R7,654 million is owed by one service provider. This case is being pursued through the legal process. The impairment related to damages and losses and fraud amounts to R11,722 million.
13.3 Staff debt
2016/17 2015/16 R’000 R’000
Debt account 2 951 2 912Salary tax debt account 28 -Salary reversal control account 65 -Total 3 044 2 912
The impairment related to the debt account for staff debts amounts to R86 thousand.

Statistics South Africa – Vote 12
210
13.4 Fruitless and wasteful expenditure
2016/17 2015/16 Note R’000 R’000
Opening balance 1 -Less amounts recovered (14) (13)Less amounts written off - -Transfers from note 25 Fruitless and Wasteful expenditure 25 22 14Total 9 1
13.5 Impairment of receivables
2016/17 2015/16 R’000 R’000 Estimate of impairment of receivables 11 808 12 320Total 11 808 12 320
The impairment of receivables is comprised of R86 thousand for staff debts, and R11,722 million for damages and losses.
14. Voted funds to be surrendered to the Revenue Fund
2016/17 2015/16 Note R’000 R’000 Opening balance 56 519 87 419Prior period error - (1 340)As restated 56 519 86 079Transfer from statement of financial performance 76 903 49 716Add: Unauthorised expenditure 10 - 6 803Paid during the year (56 519) (86 079)Closing balance 76 903 56 519
An amount of R1,340 million budgeted for transfers that was shifted to goods and services without proper approval in 2014/15, was disclosed as unauthorised expenditure in 2015/16. This was subsequently reclassified as irregular expenditure as it materially met that definition. This amount is included in the irregular expenditure note.
14.1 Prior period error
2015/16 Note R’000 Nature of prior period error 14 Relating to 2015/16 ( affecting the opening balance) (1 340)
Unauthorised expenditure reversed (1 340)Total (1 340)

Statistics South Africa – Vote 12
211
15. Departmental revenue to be surrendered to the Revenue Fund
2016/17 2015/16 R’000 R’000 Opening balance 254 277Transfer from statement of financial performance 8 580 10 055Paid during the year (8 764) (10 078)Closing balance 70 254
16. Payables – current
2016/17 2015/16 Note R’000 R’000 Advances received 16.1 9 643 25 538Clearing accounts 16.2 564 785Total current payables 10 207 26 323
16.1 Advances received
2016/17 2015/16 Note R’000 R’000 National departments Annexure 5 8 117 23 332Provincial departments Annexure 5 1 292 2 015Public entities Annexure 5 199 191Other institutions 35 -Total 9 643 25 538
The decrease in advances received is mainly attributed to the finalisation of the SA Demographic and Health Survey which Stats SA conducted on behalf of the Department of Health. A new advance of R5, 396 million was received from the Department of Home Affairs for the digitisation of civil records.
16.2 Clearing accounts
2016/17 2015/16 R’000 R’000 Salary income tax deductions account 346 613Salary pension deductions account 53 8Salary bargaining council deductions account - 1Salary reversal control account - 163Salary government employee housing account 165 -Total 564 785

Statistics South Africa – Vote 12
212
17. Net cash flow available from operating activities
2016/17 2015/16 R’000 R’000 Net surplus as per statement of financial performance 86 369 61 099Add back non cash/cash movements not deemed operating activities 135 552 218 808
(Increase)/decrease in receivables – current (1 192) (2 603)Decrease in prepayments and advances 165 128Increase/(decrease) in payables – current (16 116) 7 300Proceeds from sale of capital assets (1 039) -Expenditure on capital assets 220 303 313 379Surrenders to Revenue Fund (65 283) (96 157)Surrenders to RDP Fund/donor (1 286) (3 239)
Net cash flow generated by operating activities 221 921 279 907
18. Reconciliation of cash and cash equivalents for cash flow purposes
2016/17 2015/16 R’000 R’000 Consolidated Paymaster-General account 43 233 38 766 Cash on hand 284 284 Cash with commercial banks (Local) - 549 Total 43 517 39 599
19. Contingent liabilities
2016/17 2015/16Liable to Nature Note R’000 R’000 Housing loan guarantees Employees Annexure 2A - 86Claims against the department Annexure 2B 6 843 6 406Other Annexure 2B 23 204 1 054Total contingent liabilities 30 047 7 546
The increase in contingent liabilities is due to new cases that have been registered during the 2016/17 financial year. R20,454 million of the increase is attributed to disputes related to the PPP unitary fee payments. All claims referred for legal processes in determining the extent that the state should accept liability or not, have uncertainty regarding settlement amounts and the timing of these outflows until an agreement is reached between parties. The levels of uncertainty of cases reflected in Annexure 2B are as follows: R’000 Low level of uncertainty 1 516 Medium level of uncertainty 25 214 High level of uncertainty 3 317

Statistics South Africa – Vote 12
213
20. Commitments
2016/17 2015/16 R’000 R’000 Current expenditure Approved and contracted 45 606 79 359Approved but not yet contracted 60 608 6 429 106 214 85 788 Capital expenditure Approved and contracted 9 824 2 177 9 824 2 177 Total commitments 116 038 87 965
The above amounts include commitments totalling R46,128 million that are for a period longer than a year.
21. Accruals and payables not recognised
21.1 Accruals
2016/17 2015/16 30 Days 30+ Days Total TotalListed by economic classification R’000 R’000 R’000 R’000 Goods and services 20 524 7 581 28 105 132 215Transfers and subsidies - - - -Capital assets - - - -Total accruals 20 524 7 581 28 105 132 215
2016/17 2015/16Listed by programme level R’000 R’000 Administration 18 618 48 361Economic Statistics 1 135 1 217Population and Social Statistics 1 174 1 470Methodology, Standards and Research 39 13Statistical Support and Informatics 2 336 3 088 Statistical Collection and Outreach 2 047 2 285Survey Operations 2 285 71 512Recoverable expenditure 471 4 269Total 28 105 132 215
Material accruals in administration relates to buildings rental and private party partnership additional cost and pass through costs invoices. The decrease in accruals is attributed to the Community Survey 2016 invoices that remained unpaid at the end of 2015/16 and paid during 2016/17.

Statistics South Africa – Vote 12
214
21.2 Payables not recognised
2016/17 2015/16 30 Days 30+ Days Total TotalListed by economic classification R’000 R’000 R’000 R’000 Goods and services 76 047 2 869 78 916 72 063Transfers and subsidies - - - -Capital assets 91 - 91 -Total accruals 76 138 2 869 79 007 72 063
The increase in payables not recognised is attributed to the payable Property Management Trading Entity for leased property invoices in the main.
2016/17 2015/16Listed by programme level R’000 R’000 Administration 78 536 63 732Economic Statistics 28 1 031Population and Social Statistics 29 293Methodology, Standards and Research 5 3Statistical Support and Informatics 55 1 284Statistical Collection and Outreach 182 626Survey Operations 153 4 876Recoverable expenditure 19 218Total 79 007 72 063
Material payables in administration relates to property payments that remained unpaid at the end of the reporting period.
22. Employee benefits
2016/17 2015/16 R’000 R’000 Leave entitlement 63 249 48 396Service bonus (thirteenth cheque) 36 987 35 026Capped leave commitments 20 658 20 976Other 782 7 873Total 121 676 112 271
A negative amount of R681 thousand was offset against leave entitlement. The amount is as a result of pro-rata calculation of leave taken by employees as at 31 March 2017. If an employee takes more leave than what was entitled, it results in a negative leave balance which is automatically balanced off during the leave period. The category other includes an amount of R693 thousand for long service awards payable in the ensuing year, whilst R89 thousand relates to accruals for 2016/17.

Statistics South Africa – Vote 12
215
23. Lease commitments
23.1 Operating leases expenditure
Buildings and other fixed structures
Machinery and equipment Total
R’000 R’000 R’000 2016/17 Not later than one year 77 319 23 785 101 104Later than one year and not later than five years 118 696 - 118 696Later than five years - - -Total lease commitments 196 015 23 785 219 800
2015/16 Not later than one year 156 517 39 883 196 400Later than one year and not later than five years 122 825 - 122 825Later than one year and not later than five years 1 415 - 1 415Total lease commitments 280 757 39 883 320 640
Buildings are leased for periods ranging from 12 to 120 months. Annual rental escalation ranges from 5 to 10 %. The building lease agreements entered into with landlords have clauses that prohibit the department from subletting leased properties. The decrease in the operating lease commitments is due to the extended Phakisaworld contract expiring in a few months. The leases for machinery and equipment are for vehicles from the Government Garage and Phakisaworld Fleet Solutions which are leased on a month-to-month basis. The Phakisaworld commitments are raised for the remaining duration of 5 months of the contract extension. The department, however will require vehicles beyond this period. If commitments were estimated for a period of 24 months, the department would have commitments of R112,296 million based on the current rates of the Phakisaworld contract.
23.2 Finance leases expenditure Buildings and
other fixed structures
Machinery and equipment Total
R’000 R’000 R’000 2016/17 Not later than one year - 4 129 4 129Later than one year and not later than five years - 3 700 3 700Total lease commitments - 7 829 7 829 2015/16 Not later than one year - 9 743 9 743Later than one year and not later than five years - 1 672 1 672Total lease commitments - 11 415 11 415
The finance lease commitments relating to machinery and equipment include leased photocopiers and cellular phones. The decrease on finance leases is attributed to the end of the Vodacom finance lease cellular phone contract. This note excludes leases relating to Public Private Partnership as they are separately disclosed in note number 28. The current RT15 transversal cellular phone contracts are on an enterprise bundle method, with Vodacom on a 24-months contract, however the remaining few disclosed on this note are individual contracts that are ending in 2017/18. Photocopy machines are leased from various suppliers in terms of the transversal government contracts. The lease period is 36 months with an option to renew. The contracts with service providers prohibit the department from sub-leasing finance leased assets.

Statistics South Africa – Vote 12
216
24. Irregular expenditure
24.1 Reconciliation of irregular expenditure
2016/17 2015/16 Note R’000 R’000 Opening balance 9 130 7 601Prior period error 1 340As restated 9 130 8 941Add: Irregular expenditure – relating to current year 24.2 444 222Less: Prior year amounts condoned 24.3 (79) (31)Less: Current year amounts condoned 24.3 - (2)Less: Amounts not condoned and recoverable 24.4 (6) -Less: Amounts not recoverable and not condoned 24.5 (2) -Closing balance 9 487 9 130 Analysis of awaiting condonation per age classification Current year 444 220Prior years 9 043 8 910Total 9 487 9 130
24.2 Details of irregular expenditure – current year
2016/17Incident Disciplinary steps taken/criminal proceedings R’000 Non-compliance to HR prescripts Corrective action recommended 1Non-compliance to SCM prescripts Corrective action recommended 394Non-compliance to Fleet Management prescripts Corrective action recommended 49Total 444
24.3 Details of irregular expenditure condoned
2016/17Incident Condoned by (condoning authority) R’000 Non-compliance to cost containment practice note 1/2014 Condoned by the Chief Financial Officer 2Non-compliance to HRM policy Condoned by the Chief Financial Officer 30Non-compliance to SCM prescripts Condoned by the Chief Financial Officer 2Non-compliance to Petty Cash prescripts Condoned by the Chief Financial Officer 45Total 79
24.4 Details of irregular expenditure recoverable (not condoned)
2016/17Incident Condoned by (condoning authority) R’000 Non-compliance to HRM policy Chief Financial Officer 6Total 6

Statistics South Africa – Vote 12
217
24.5 Details of irregular expenditure not recoverable (not condoned)
2016/17Incident R’000 Case discovered not to be irregular expenditure upon conclusion of investigation 2 Total 2
24.6 Details of irregular expenditure under investigation (not included in the main note)
2016/17Incident R’000 Non-compliance with SCM and travel policy 212Non-compliance to Property Management Trading Entity requirements 856Total 1 068
24.7 Prior period error
2015/16 Note R’000 Nature of prior period error Relating to 2014/15 (affecting the opening balance) 1 340Irregular expenditure omitted in 2014/15 AFS. 1 340Total 1 340
25. Fruitless and wasteful expenditure
25.1 Reconciliation of fruitless and wasteful expenditure
2016/17 2015/16 Note R’000 R’000 Opening balance 11 823 11 405Fruitless and wasteful expenditure – relating to current year 239 472Less: Amounts resolved (118) (40)Less: Amounts transferred to receivables for recovery 13.4 (22) (14)Closing balance 11 922 11 823
25.2 Analysis of awaiting resolution per economic classification
2016/17 2015/16 R’000 R’000 Current 11 922 11 823Capital - -Transfers and subsidies - -Total 11 922 11 823

Statistics South Africa – Vote 12
218
25.3 Analysis of current year’s fruitless and wasteful expenditure
2016/17Incident Disciplinary steps taken/criminal proceedings R’000 Cancellation Charges Corrective action recommended 80No shows Corrective action recommended 126Incidental Corrective action recommended 5Penalty fees and interest Corrective action recommended 28Total 239
Included in the incidental case is a travel related payment made for an employee without proper approval.
26. Related party transactions
2016/17 R’000 In kind goods and services provided/received Machinery and equipment donated to other National Departments: Department of Rural Development & Land Reform 4 495Department of Higher Education & Training 3 188Total 7 683
Stats SA reports to the Minister in the Presidency: Planning, Performance Monitoring and Evaluation. Other national departments falling under the Minister are listed below: • Department of Performance Monitoring and Evaluation • The Presidency Stats SA donated its Head Office machinery and equipment to the DRDLR and DHET. All other transactions during the review period with related parties were undertaken at arm's length.
27. Key management personnel
No. of 2016/17 2015/16 individuals R’000 R’000 Officials Levels 15 to 16 8 12 936 12 503Level 14 54 62 786 60 061Family members of key management personnel 11 5 110 5 289Total 80 832 77 853
The Chief Financial Officer has been included under level 14. Chief Directors on personal notches (higher than level 14) have also been included under level 14. The decrease in family members of key management personnel is attributed to one of the chief directors exiting services of Stats SA, thereby termination of the related party.

Statistics South Africa – Vote 12
219
28. Public Private Partnership
2016/17 2015/16 R’000 R’000 Unitary fee paid Fixed component 156 120 256 030Indexed component 16 733 -Total 172 853 256 030
Analysis of indexed component Goods and Services 16 733 -Total 16 733 -
2016/17 2015/16 R’000 R’000 Other Other obligations - 49 284Total - 49 284
Stats SA entered into a Public Private Partnership (PPP) agreement with Dipalopalo Concessions (Pty) Ltd on 1 April 2014 and the service commencement date was 29 August 2016. In terms of the PPP Agreement Schedule 14 (3.1.2) the unitary payment as at the signature date is R141 250 986 (excl. VAT) index linked as at financial clause and which amount shall thereafter be escalated on an annual basis in accordance with the provision of Clause 3.2.1 but shall only be payable in the amounts contemplated in Clause 6 - Gross monthly instalments and with effect from the service commencement date. The parties that form Dipalopalo Consortium are Wilson Bayly Holmes Ovcon Limited (WBHO), Servest, Royal Bafokeng Holdings, Fikile Concessions (Pty) Ltd, Vulindlela Holdings (Pty) Ltd and Crowie Concessions. The construction contract was R1,4 billion of which Stats SA made a contribution of R618,9 million towards the construction cost of the building to reduce the unitary payment. The unitary payment of approximately R141 million per year (plus VAT), increasing with CPI on an annual basis (base date August 2010), is payable by Stats SA during the project term of 26 years. PPP project has accrued expenses as follows: Indexation costs of R6 937 million consisting of pass through costs of R3 598 million and additional costs of R3 339 million.
29. Provisions
2016/17 2015/16 R’000 R’000 Claims under investigation 8 665 6 096Total 8 665 6 096
The claims under investigation relate mainly to damages to and losses of hired vehicles. The total provision for doubtful debtors in respect of damages and losses is 97,96%. The provision percentage allocated for write-off of expenditure in the damages and losses account is based on the history of recoverability of cases per category of provisions provided:
100,0% for cases under investigation 87,72% for cases to be recovered from drivers 98,32% for cases to be recovered from third parties The certainty and timing of outflow of funds are based on these categories of provisions subject to finalisation of investigations and the availability of savings to write off cases.

Statistics South Africa – Vote 12
220
29.1 Reconciliation of movement in provisions – 2016/17
ProvisionsTotal
provisions R’000 R’000 Opening balance 6 096 6 096Increase in provisions 2 569 2569Closing balance 8 665 8 665
Reconciliation of movement in provisions – 2015/16
ProvisionsTotal
provisions R’000 R’000 Opening balance 7 208 7 208Decrease in provisions (1 112) (1 112)Closing balance 6 096 6 096
Provisions relates to claims under investigation.
30. Movable tangible capital assets
Movement in movable tangible capital assets per asset register for the year ended 31 March 2017
Opening balance
Value adjustments Additions Disposals
Closing balance
R’000 R’000 R’000 R’000 R’000
Machinery and equipment Transport assets - - - - -Computer equipment 241 454 - 25 658 (27 036) 240 076Furniture and office equipment 88 868 - 251 (44 260) 44 859Other machinery and equipment 15 967 - 763 (646) 16 084 346 289 - 26 672 (71 942) 301 019 Capital work in progress - - - - - Total movable tangible capital assets 346 289 26 672 (71 942) 301 019
Movable tangible capital assets under investigation Value Number R’000 Included in the above total of the movable tangible capital assets per the asset register are assets that are under investigation:
Machinery and equipment 1 844 51 969 These assets are under investigation because they were not found during asset verification. Appropriate actions based on the outcome of the investigation are implemented.

Statistics South Africa – Vote 12
221
30.1 Additions
Additions to movable tangible capital assets per asset register for the year ended 31 March 2017
Cash Non-cash
(Capital work in progress - current costs and finance
lease payments)
Received current, not
paid(paid current
year, received prior year) Total
R’000 R’000 R’000 R’000 R’000 Machinery and equipment Transport assets 8 146 - (8 146) - -Computer equipment 26 423 - (790) 25 25 658Furniture and office equipment 26 173 - (26 023) 101 251Other machinery and equipment 844 - (81) - 763Total additions to movable tangible capital assets 61 586 - (35 040) 126 26 672
30.2 Disposals
Disposals of movable tangible capital assets per asset register for the year ended 31 March 2017
Sold for cashNon-cash disposals Total disposals
Cash received Actual
R’000 R’000 R’000 R’000
Machinery and equipment Transport assets - - - -Computer equipment - 27 036 27 036 -Furniture and office equipment 2 773 41 487 44 260 428Other machinery and equipment 74 572 646 13Total disposal of movable tangible capital assets 2 847 69 095 71 942 441
30.3 Movement for 2015/16
Movement in movable tangible capital assets per asset register for the year ended 31 March 2016
Opening balance
Value adjustments Additions Disposals
Closing balance
R’000 R’000 R’000 R’000 R’000
Machinery and equipment Transport assets - - - - -Computer equipment 240 005 133 19 299 17 983 241 454Furniture and office equipment 92 408 (2) 738 4 276 88 868Other machinery and equipment 14 008 (12) 2 104 133 15 967 346 421 119 22 141 22 392 346 289 Capital work in progress - - - - - Total movable tangible capital assets 346 421 119 22 141 22 392 346 289

Statistics South Africa – Vote 12
222
30.3.1 Prior period error
2015/16 Note R’000 Nature of prior period error Relating to 2014/15
Decrease in disposal of computer equipment 133Increase in disposal of other machinery and equipment (12)Increase in disposal furniture and office equipment (2)
Total 119
The prior period errors relates to assets which were previously reported as lost but were subsequently found during the 2016/17 assets verification and re-instated.
30.4 Minor assets
Movement in minor assets per asset register for the year ended 31 March 2017
Intangible
assets Machinery and
equipment Total R’000 R’000 R’000
Opening balance 48 79 411 79 459Value adjustments Additions 8 391 399Disposals - 21 678 21 678Total minor assets 56 58 124 58 180
Intangible
assets Machinery and
equipment Total
Number of R1 minor assets 27 2 863 2 890Number of minor assets at cost 27 38 814 38 841Total number of minor assets 54 41 677 41 731
Minor capital assets under investigation Value Number R’000 Included in the above total of the minor assets per the asset register are assets that are under investigation:
Machinery and equipment 1 035 1 449 These assets are under investigation because they were not found during asset verification. Appropriate actions based on the outcome of the investigation are implemented.

Statistics South Africa – Vote 12
223
Movement in minor assets per asset register for the year ended 31 March 2016
Intangible
assets Machinery and
equipment Total R’000 R’000 R’000
Opening balance 36 52 573 52 609Prior period error - (29) (29)Additions 12 33 043 33 055Disposals - 6 176 6 176Total minor assets 48 79 411 79 459
Intangible
assets Machinery and
equipment Total
Number of R1 minor assets 27 5 335 5 362Number of minor assets at cost 24 51 064 51 088Total number of minor assets 51 56 399 56 450
30.4.1 Prior period error
2015/16 Note R’000 Nature of period error Relating to 2014/15 (29)
Decrease in office equipment (29)Relating to 2015/16 (10 699)
Decrease in purchase cost of computer hardware (10 699)Total (10 728)
An invoice for devices acquired during CS data collection was received in the current financial year. Subsequent to that the cost of devices acquired was adjusted by R10,699 million.
30.5 Movable assets written off
Movable assets written off for the year ended 31 March 2017
Intangible
assets Machinery and
equipment Total R’000 R’000 R’000
Assets written off - 93 620 93 620Total movable assets written off - 93 620 93 620
Movable assets written off for the year ended 31 March 2016
Intangible
assets Machinery and
equipment Total R’000 R’000 R’000
Assets written off - 28 569 28 569Total movable assets written off - 28 569 28 569

Statistics South Africa – Vote 12
224
30.6 S42 Movable capital assets
Major assets subjected to transfer in terms of S42 of the PFMA – 31 March 2017
Intangible
assets Machinery and
equipment Total R’000 R’000 R’000
No of assets - 3 906 3 906Value of the assets (R’000) - 69 095 69 095
Minor assets subjected to transfer in terms of S42 of the PFMA – 31 March 2017
Intangible
assets Machinery and
equipment Total R’000 R’000 R’000
No of assets - 12 146 12 146Value of the assets (R’000) - 17 737 17 737
31. Intangible capital assets
Movement in intangible capital assets per asset register for the year ended 31 March 2017
Opening balanceValue
adjustments Additions Disposals Closing balanceR’000 R’000 R’000 R’000 R’000
Software 44 820 - 5 167 - 49 987Capital work in progress 671 - 730 671 730Total intangible capital assets 45 491 - 5 897 671 50 717
Disposals in Work In Progress represents the capital assets which were completed and updated in the asset register as per annexure 4.
31.1 Additions
Additions to intangible capital assets per asset register for the year ended 31 March 2017
Cash Non-Cash
(Development work in
progress – current costs)
Received current year,
not paid(paid current
year, received prior year) Total
R’000 R’000 R’000 R’000 R’000 Software 2 705 2 462 - - 5 167Total additions to intangible capital assets 2 705 2 462 - - 5 167

Statistics South Africa – Vote 12
225
31.2 Disposals
Disposals of intangible capital assets per asset register for the year ended 31 March 2017
Sold for cashNon-cash disposals Total disposals
Cash received Actual
R’000 R’000 R’000 R’000
Software - - - -Total disposals of intangible capital assets - - - -
31.3 Movement for 2015/16
Movement in intangible capital assets per asset register for the year ended 31 March 2017
Opening balanceValue
adjustments Additions Disposals Closing balanceR’000 R’000 R’000 R’000 R’000
Software 41 011 - 3 809 - 44 820Capital work in progress - - - - -Total intangible capital assets 41 011 - 3 809 - 44 820
32. Immovable tangible capital assets
Movement in immovable tangible capital assets per asset register for the year ended 31 March 2017
Opening balance
Value adjustments Additions Disposals
Closing balance
R’000 R’000 R’000 R’000
Buildings and other fixed structures Other fixed structures - - - - -Total immovable tangible capital assets - - - - -
32.1 Additions
Additions to immovable tangible capital assets per asset register for the year ended 31 March 2017
Cash Non-cash
(Capital work in progress - current costs and finance
lease payments)
Received current, not
paid(paid current
year, received prior year) Total
R’000 R’000 R’000 R’000 R’000 Buildings and other fixed structures Other fixed structures 155 911 - (155 911) - -Total additions to immovable tangible capital assets 155 911 - (155 911) - -

Statistics South Africa – Vote 12
226
32.2 Disposals
Disposals of immovable tangible capital assets per asset register for the year ended 31 March 2017
Sold for cashNon-cash disposals Total disposals
Cash received actual
R’000 R’000 R’000 R’000
Buildings and other fixed structures Other fixed structures - - - -Total disposal of immovable tangible capital assets - - - -
33. Prior period errors
33.1 Correction of prior period errors
2015/16 Note R’000 Revenue -Net effect -
2015/16 Note R’000 Expenditure -Net effect -
2015/16 Note R’000 Assets Note 10 Reversal of unauthorised expenditure 2014/15 AFS) POS (1 340)Note 30.3.1 Decrease in disposal of computer equipment(2014/15) 30.3.1 133Increase in disposal of other machinery and equipment (2014/15) 30.3.1 (12)Increase in disposal of furniture and office equipment (2014/15) 30.3.1 (2)Note 30.4.1 Decrease in office equipment (2014/15) 30.4.1 (29)Decrease in computer hardware purchase cost – CS devices(2015/16) 30.4.1 (10 699)Net effect (11 949)
2015/16 Note R’000 Liabilities Note 14 Decrease in voted funds to be surrendered due to reversal of unauthorised expenditure
2014/15 AFS 22 (1 340)Net effect (1 340)

Statistics South Africa – Vote 12
227
2015/16 Note R’000 Other Note 24 Irregular expenditure omitted in 2014/15 AFS 22 1 340Note 27 Expenditure of family member of a key management personnel omitted in 2015/16 388Note 19 Contingent liabilities: An error of omission on settled claim (2015/16) (4)Net effect 1 724

Statistics South Africa – Vote 12
228
Annexures to the annual financial statements for the year ended 31 March 2017
Annexure 1A: Statement of transfers to departmental agencies and accounts for the year ended 31 March 2016
2016/17 2015/16
Transfer allocation Transfer
Adjusted appropriation Rollovers Adjustments
Total available
Actual transfer
Percentage of available
funds transferred
Appropriation Act
Actual transfer
Department/agency/account R'000 R'000 R'000 R'000 R'000 % R'000 R'000 Transfers South African Broadcasting Corporation 15 - - 15 9 60,0 15 15Total 15 - - 15 9 60,0 15 15
The reason that not all funds were transferred, is due to the disposal of television sets utilised in the old Head Office building. The new building provided for new television sets whose licences are payable in the 2017/18 financial year.
Annexure 1B: Statement of transfers to higher education institutions for the year ended 31 March 2017
Name of higher education institution
2016/17 2015/16
Transfer allocation Transfer
Adjusted appropriation Rollovers Adjustments
Total available
Actual transfer
Amount not transferred
Percentage of available
funds not transferred
Appropriation Act
Actual transfer
R'000 R'000 R'000 R'000 R'000 R'000 % R'000 R'000 Transfers University of Stellenbosch 6 691 - - 6 691 6 000 691 12 6 710 6 000University of Cape Town 1 000 - - 1 000 1 000 - - 1 000 1 000University of Pretoria - - - - - - - 100 100University of the
Witwatersrand 500 - - 500 500 - - 500 500Total 8 191 - - 8 191 7 500 691 12 8 310 7600
The allocation for transfer to the University of Stellenbosch was based on the contract that the amount will escalate annually. However, the department received an invoice of R6 million and made a payment based on the invoice received.

Statistics South Africa – Vote 12
229
Annexure 1C: Statement of transfers/subsidies to public corporations and private enterprises for the year ended 31 March 2017
Name of public corporation/private enterprise
2016/17 2015/16
Transfer allocation Transfer
Adjusted appropriation Rollovers Adjustments
Total available
Actual transfer
Percentage of available
funds transferred Current
Appropriation Act
Actual transfer
R'000 R'000 R'000 R'000 R'000 % R'000 R'000 R'000 Private enterprises Claims against the state-
private entity - - - - 185 - 185 77 77Total - - - - 185 - 185 77 77
Annexure 1D: Statement of transfers to non-profit institutions for the year ended 31 March 2017
Non-profit institutions
2016/17 2015/16
Transfer allocation Transfer
Adjusted appropriation Rollovers Adjustments
Total available
Actual transfer
Percentage of available
funds transferred
Appropriation Act
Actual transfer
R'000 R'000 R'000 R'000 R'000 % R'000 R'000 Transfers Sponsorship to SASA for annual
conference 123 - - 123 90 73,0 237 237Sponsorship to PASA for annual
conference 200 - - 200 200 100,0 200 200Total 323 - - 323 290 89,8 437 437
Annexure 1E: Statement of transfers to households for the year ended 31 March 2017
Households
2016/17 2015/16
Transfer allocation Transfer
Adjusted appropriation Rollovers Adjustments
Total available
Actual transfer
Percentage of available
funds transferred
Appropriation Act
Actual transfer
R'000 R'000 R'000 R'000 R'000 % R'000 R'000 Transfers Leave gratuity 5 138 - 2 019 7 157 3 803 53,0 4 430 4 430Bursaries to non-employees 2 777 - 592 3 369 1 248 37,0 2 253 2 253Claims against the state - - - - - - 87 87Injury on duty 229 - (167) 62 - - - -Payments as an act of grace - - 57 57 56 98,0 95 95Total 8 144 - 2 501 10 645 5 107 47,1 6 865 6 865

Statistics South Africa – Vote 12
230
Annexure 1F: Statement of gifts, donations and sponsorship received
2016/17 2015/16Name of organisation Nature of gift, donation or sponsorship R’000 R'000 Received in cash - - - - Received in kind MTN Sponsorship towards United Nations World Data Forum
Conference – UNWDF (transport and gala dinner) 815 -Total 815 -
Annexure 1G: Statement of aid assistance received for the year ended 31 March 2017
Opening balance Revenue Expenditure
Paid back on / by 31 March
Closing balance
Name of donor Purpose R'000 R'000 R'000 R’000 R'000 Received in cash Foreign: RDP United Nations, Department of Economics and Social Affairs (DESA)
To undertake the Evidence and Data for GenderEquality Project with an objective to accelerate existing efforts to generate comparable gender indicators on health, education employment, entrepreneurship and asset ownership - 3 948 (3 071) - 877
African Development Bank To undertake a statistical capacity programme
with an objective to (i) strengthen statistical capacity building in the country through training and institution building and (ii) to improve poverty monitoring, economic and social policy evaluation and decision-making through enhancement of data 1 286 1 285 (1 276) (1 286) 9
Total 1 286 5 233 (4 347) (1 286) 886

Statistics South Africa – Vote 12
231
Annexure 2A: Statement of financial guarantees issued as at 31 March 2017 (Local)
Guarantor institution
Original guaranteed
capital amount
Opening balance
1 April 2016
Guarantees drawdowns during the
year
Guarantees repayments/
cancelled/ reduced/ released
during the year Revaluations
Closing balance
31 March 2017
Guaranteed interest for year ended
31 March 2017
Realised losses not
recoverable i.e. claims
paid outR’000 R’000 R’000 R’000 R’000 R’000 R’000 R’000
Housing Standard Bank - 86 - (86) - - - -Total - 86 - (86) - - - -
Annexure 2B: Statement of contingent liabilities as at 31 March 2017
Nature of liability
Opening balance
1 April 2016
Liabilities incurred during
the year
Liabilities paid/cancelled/reduced during
the year Liabilities
recoverable
Closing balance
31 March 2017R’000 R’000 R’000 R’000 R’000
Claims against the department The Workforce Group (Pty) Ltd 1 494 - - - 1 494Claims relating to labour relations 1 866 571 (134) - 2 303Claim against the Department of Public Works 3 046 - - - 3 046Subtotal 6 406 571 (134) - 6 843 Other Claims from third parties as a result of vehicle accidents
involving the department’s employees 1 054 3 127 1 431 - 2 750Amounts withheld from Dipalopalo (under dispute) - 20 454 - - 20 454Subtotal 1 054 23 581 1 431 - 23 204 Total 7 460 24 152 1 565 - 30 047
Nature of liabilities recoverable
Details of liability and recoverability
Movement during the year
Closing balance
31 March 2017R’000 R’000 R’000
Claims against the department 6 406 437 6 843Third party claims 1 054 1 696 2 750PPP Dipalopalo amounts under dispute - 20 454 20 454Total 7 460 22 587 30 047

Statistics South Africa – Vote 12
232
Annexure 3: Claims recoverable
Government entity
Confirmed balance outstanding
Unconfirmed balance outstanding Total
Cash in transit at year-end 2015/16
31/03/2017 31/03/2016 31/03/2017 31/03/2016 31/03/2017 31/03/2016
Amounts received within 6 working
days after year-end
AmountR’000 R’000 R’000 R’000 R’000 R’000 R’000
Department Department of Public Service
and Administration - - 416 - 416 - - -Department of Labour - - 105 - 105 - - -Department of Higher
Education and Training - - 30 - 30 - - -Department of Transport - - 4 - 4 - - -Department of Agricultural,
Forestry and Fisheries - - 17 - 17 - - -Public Administration
Leadership and Management Academy - - - 58 - 58 - -
Department of Public Works - - 10 - 10 - - -Department of Planning,
Monitoring and Evaluation - - - 26 - 26 - -Department of Human
Settlements - - 17 - 17 - - -Government
Communication and Information Systems - - 7 761 10 796 7761 10 796 - -
National Prosecuting Authority - - 15 - 15 - - -
Office of the Chief Justice - - 29 - 29 - - -Department of E-
Government (Gauteng) - - 52 - 52 - - -South African Police Services - - 38 - 38 - -Department of Health
(Gauteng) - - 7 - 7 - - -Civilian Secretariat for Police Service - - 74 - 74 - - -Subtotal - - 8 575 10 880 8 575 10 880 - - Other government entities South African Revenue
Service - - 96 96 96 96 - -Subtotal - - 96 96 96 96 - - Total - - 8 671 10 976 8 671 10 976 - -

Statistics South Africa – Vote 12
233
Annexure 4: Movement in capital work in progress
Movement for capital work in progress for the year ended 31 March 2017
Openingbalance
Current year capital WIP
Completed Assets
Closing balance
R’000 R’000 R’000 R’000
Machinery and equipment Transport assets - - - -Computer equipment - - - -Furniture and office equipment - - - -Other machinery and equipment - - - -Subtotal - - - - Buildings and other fixed structures Other fixed structures - - - -Subtotal - - - - Computer Software Computer Software 671 730 (671) 730Subtotal 671 730 (671) 730 Total 671 730 (671) 730
Movement for capital work in progress for the year ended 31 March 2016
Opening balance
Prior period error
Current year capital WIP
Completed Assets
Closing balance
R’000 R’000 R’000 R’000 R’000 Machinery and equipment Transport assets - - - - -Computer equipment - - - - -Furniture and office equipment - - - - -Other machinery and equipment - - - - -Subtotal - - - - - Buildings and other fixed structures Other fixed structures - - - - -Subtotal - - - - - Software Software - - - - -Subtotal - - - - - Total - - - - -

Statistics South Africa – Vote 12
234
Annexure 5: Inter-entity advances received
Entity
Confirmed balance outstanding
Unconfirmed balance outstanding Total
31/03/2017 31/03/2016 31/03/2017 31/03/2016 31/03/2017 31/03/2016
R’000 R’000 R’000 R’000 R’000 R’000 National departments Current Department of Trade and Industry - - 134 202 134 202Department of Transport - - 2 048 4 272 2 048 4 272Department of Health - - 539 18 858 539 18 858Department of Home Affairs - - 5 396 - 5 396 -Subtotal - - 8 117 23 332 8 117 23 332 Non-current Subtotal - - - - - - Provincial departments Current Mpumalanga Department of Economic Development and
Tourism - - 1 292 2 015 1 292 2 015Eastern Cape Department of Education - - - - - -Subtotal - - 1 292 2 015 1 292 2 015 Non-current Subtotal - - - - - - Public entities Current East London Industrial Development Zone - - 199 - 199 -Road Traffic Management Corporation - - - 191 - 191Subtotal - - 199 191 199 191 Non-current Subtotal - - - - - - Other institutions Current United Nations - - 35 - 35 -Subtotal - - 35 - 35 - Non-current Subtotal - - 35 - 35 - Total - - 9 643 25 538 9 643 25 538

235
Qualifications: Chief Directors
Name Qualification Institution 1. Mr Harry Thema
BSc (Mathematical Statistics and Computer Science)
University of Limpopo
BScHons (Mathematical Statistics) University of Limpopo MPhil (Urban and Regional Science) University of Stellenbosch 2. Mr Desmond Booysen BSc (Mathematics and Physics) University of the Western Cape BCom (Economics and Statistics) University of South Africa BComHons (Statistics) University of the Western Cape MCom (Statistics) University of the Western Cape MPhil (Urban and Regional Science) University of Stellenbosch Diploma in Tertiary Education University of South Africa 3. Mr Naas du Plessis BCom (Accounting) University of Pretoria BComHons (Accounting) University of South Africa Associate of the Institute of Municipal
Finance Officers Institute of Municipal Finance Officers
Certificate in Forensic Investigation University of Pretoria 4. Ms Celia de Klerk National Diploma: Organisation and
Management Pretoria Technikon
Diploma: Quality Management University of South Africa 5. Mr Mmamarema Mohale BCompt University of South Africa MBL (Masters in Business Leadership) University of South Africa CCSA (Certificate in Control Self-
Assessment) Institute of Internal Auditors
6. Dr Miranda Mafafo BSc (Mathematics and Geography) University of Swaziland MA (Development Geography) Queens University at Kingston,
Canada PhD (Development Geography) University of the Witwatersrand Nepad African Leadership Development University of the Witwatersrand
Business School 7. Ms Annegret Mphahlele Diploma (SCM) Betriebsberufsschule Henningsdorf,
Germany Diploma (Pedagogy and Psychology) Institut für Heimerzieherausbildung,
Germany 8. Mr Bruce Jooste BCom (Accounting/Auditing) Nelson Mandela Metropolitan
University Articles of Clerkship Public Accountants and Auditors
Board (PAAB) Professional Accountant (SA) South African Institute of
Professional Accountants (SAIPA) Professional Tax Practitioner South African Institute of
Professional Accountants (SAIPA) ICASA Executive Development Programme Gordon Institute of Business Science
(GIBS), University of Pretoria

236
Name Qualification Institution 9. Mr Bheki Mathunjwa BTech (Business Administration) Tshwane University of Technology BComHons (Strategic Management) University of Johannesburg National Diploma: Cost and Management
Accounting Technikon Witwatersrand (University of Johannesburg)
African Leadership Programme University of the Witwatersrand Business School
10. Mr Dumisa Jele Senior Certificate - 11. Mr Thulani Ntshangase BAdmin University of Durban-Westville MA (Management) University of the Witwatersrand 12. Mr Gerhardt Bouwer BCom (Econometrics) University of Pretoria BComHons (Economics) University of Pretoria 13. Ms Gerda Bruwer BSc (Mathematics and Mathematical
Statistics University of Potchefstroom
Higher Education Diploma University of South Africa Programme in Economics and Public
Finance University of South Africa
14. Mr Itani Magwaba BSc (Mathematical Statistics and Applied
Mathematics) Rhodes University
BScHons (Statistics) University of Cape Town Master of Statistics Makerere University of Kampala,
Uganda Nepad African Leadership Development
(Hons) University of the Witwatersrand Business School
15. Dr Patrick Naidoo BCom (Economics) University of South Africa BComHons (Economics) University of South Africa MCom (Economics) University of Pretoria PhD (Economics) Vista University MPhil (Urban Studies) University of Stellenbosch 16. Mr Patrick Kelly BA (History and Geography) University of the Witwatersrand BAHons (Geography) University of the Witwatersrand Diploma for Graduates in Economics University of London, UK Post-graduate Diploma in Public
Management University of the Witwatersrand
MPhil (Urban and Regional Science) University of Stellenbosch Master of Business Leadership University of South Africa 17. Mr Michael Manamela BCom (Economics and Management) University of the Western Cape BComHons (Economics) University of the Western Cape MCom (Economics) University of the Western Cape Nepad African Leadership Development
(Hons) University of the Witwatersrand Business School

237
Name Qualification Institution 18. Dr Sagaren Pillay BSc (Mathematics and Mathematical
Statistics) University of KwaZulu-Natal
PDer (Math. Modelling of Derivatives) University of South Africa MBA (Finance) Regent Business School Doctor of Business Admin Durban University of Technology SAS Certification SAS Institute International 19. Ms Nozipho Shabalala BA (Social Sciences) University of Zululand BAHons (Sociology) University of Zululand MPhil (Urban and Regional Science) University of Stellenbosch 20. Dr Christine Khoza BA Degree University of Pretoria, South Africa MA Degree (Demography) Makerere University, Uganda MPhil (Urban and Regional Studies) Stellenbosch University, South Africa PhD (Demography) The Australian National University,
Australia 21. Mr Peter Buwembo Bachelor of Statistics (Hons) Makerere University, Uganda BAHons (Demography) University of Pretoria MSocSci (Sociology) University of Pretoria MPhil (Urban and Regional Science) University of Stellenbosch 22. Dr Sandile Simelane BA (Economics) University of Swaziland 23. Dr Isabel Schmidt BA (Anthropology and Development
Administration) University of South Africa
BSc (Mathematical Statistics and Human Physiology)
University of Potchefstroom
BScHons (Human Nutrition) University of Potchefstroom MSc (Human Nutrition) University of Potchefstroom MPhil (Urban and Regional Studies) University of Stellenbosch PhD (International Development) Deakin University, Australia 24. Mr Diego Iturralde BA (Sociology and English) University of Pretoria BAHons (Sociology and English) University of Pretoria MA (Sociology) University of Pretoria Post-graduate Diploma (Demography and
Population Science) University of the Witwatersrand
Post-graduate Diploma (Migration and Advanced Demographic Methods)
University of the Witwatersrand
25. Mr Calvin Molongoana BJuris University of Limpopo Diploma in Project Management Damelin 26. Mr Muhammed Mulla BCom (Business Information Systems and
Business Administration) University of Natal
Post-graduate Higher Diploma in Accounting University of Natal Certified Internal Auditor (CIA) Institute of Internal Auditors 27. Mr Luqmaan Omar Senior Certificate -

238
Name Qualification Institution 28. Ms Gwen Lehloenya BCom (Economics and Management) University of North-West BComHons (Applied Economics) University of North-West MA (Development Economics) William’s College, USA MA (Demography) University of Pennsylvania, USA Post-graduate Diploma in Education University of North-West Certificate in Survey and Data Management University of Pretoria (Statomet) 29. Mr Moses Mnyaka BSc (Applied Mathematics and Mathematical
Statistics) University of Fort Hare
BScHons (Applied Maths) University of Fort Hare Higher Education Diploma (HED) University of Fort Hare MPhil (Urban and Regional Studies) University of Stellenbosch 30. Mr Joseph Lukhwareni BSc (Mathematics and Statistics) University of Venda BScHons (Mathematical Statistics) University of the Witwatersrand MSc (Mathematical Statistics) University of the Witwatersrand 31. Ms Marietha Gouws BCom (Economics) University of Potchefstroom BComHons (Economics) University of Potchefstroom MCom (Economics) University of Potchefstroom Higher Education Diploma University of Potchefstroom 32. Dr George Djolov PhD (Business Management and
Administration) University of Stellenbosch
MCom (Industrial Economics) University of the Witwatersrand BComHons (Business Economics) University of the Witwatersrand BCom (General) University of the Witwatersrand 33. Ms Sharthi Laldaparsad BSc (Mathematical Statistics) University of KwaZulu-Natal BScHons (Mathematical Statistics) University of Pretoria Post-graduate Diploma in GIS University of Pretoria and University
of Manchester, UK MSc (Mathematical Statistics) University of the Witwatersrand MBA University of Pretoria MPhil (Urban and Regional Science) University of Stellenbosch BCom (Economics) University of South Africa 34. Dr Hlabi Morudu BA (Economics) University of Lesotho, Lesotho MA (Economics) University of Notre Dame, USA MPhil (Urban and Regional Science) University of Stellenbosch PhD (Economics) University of Notre Dame, USA 35. Dr Mbulaheni Nthangeni BSc (Mathematical Statistics) University of Limpopo BScHons (Operations Research) University of Limpopo MSc (Operations Research) University of South Africa MSc (Industrial and Systems Engineering) University of Florida, USA PhD (Research and Evaluation Methodology) University of Florida, USA African Leadership Programme (Hons) University of the Witwatersrand
Business School 36. Mr Lawrence Modise BA (Geography and Psychology) University of KwaZulu-Natal BAHons (Geography) University of KwaZulu-Natal MSc (Geo-Information for Development) University of Durham, UK

239
Name Qualification Institution 37. Mr Luxolo Lengs MEng (Electrical and Computer Engineering) Cornell University, USA MBA Gordon Institute of Business
Science, University of Pretoria 38. Mr Rafique Begg Senior Certificate - 39. Mr Motale Phirwa BSc (Mathematics and Physics) National University of Lesotho,
Lesotho 40. Dr Arulsivanathan Naidoo BCom (Statistics) University of KwaZulu-Natal BComHons (Statistics) University of KwaZulu-Natal MCom (Statistics) University of KwaZulu-Natal MPhil (Urban and Regional Science) University of Stellenbosch DCom University of Pretoria 41. Ms Nwabisa Maya (Acting) BA ( Business Administration) Potchefstroom University Post-graduate Diploma (Business
Administration ) University of Kwa-Zulu Natal
Diploma in Business Administration Damelin 42. Mr Trevor Oosterwyk BA (History and Psychology) University of the Western Cape BAHons (History) University of the Western Cape MA (Development Communication) Malmo University, Switzerland Post-graduate Diploma in Management University of Witwatersrand 43. Mr Phillip Lesame BSc (Pedagogics) Education University of the North BSc (NDP) (Mathematics and Statistics) Medical University of South Africa BScHons (Statistics) Medical University of South Africa MA (Statistics) Makerere University, Uganda 44. Ms Ntebaleng Chobokoane BA (Demography and Sociology) National University of Lesotho,
Lesotho MA (Social Demography) University of Pretoria MPhil (Urban and Regional Science) University of Stellenbosch 45. Dr Mahlape Mohale MBChB University of Nairobi, Kenya Post-graduate Diploma in Health
Management University of Cape Town
MBA University of the Witwatersrand MSc Finance (Economic Policy) University of London, UK MPhil (Urban and Regional Science) University of Stellenbosch 46. Ms Helen North BSocSci (Geography and Psychology) University of Natal BSocSciHons (Geography) University of Natal MSc (Geographic Information Science) University of London MPhil (Urban and Regional Science) University of Stellenbosch 47. Mr Robert Thenga (Acting) BSc (Science) University of Venda University Education Diploma University of Venda BScHons (Science) University of Cape Town MBA Regent Business School
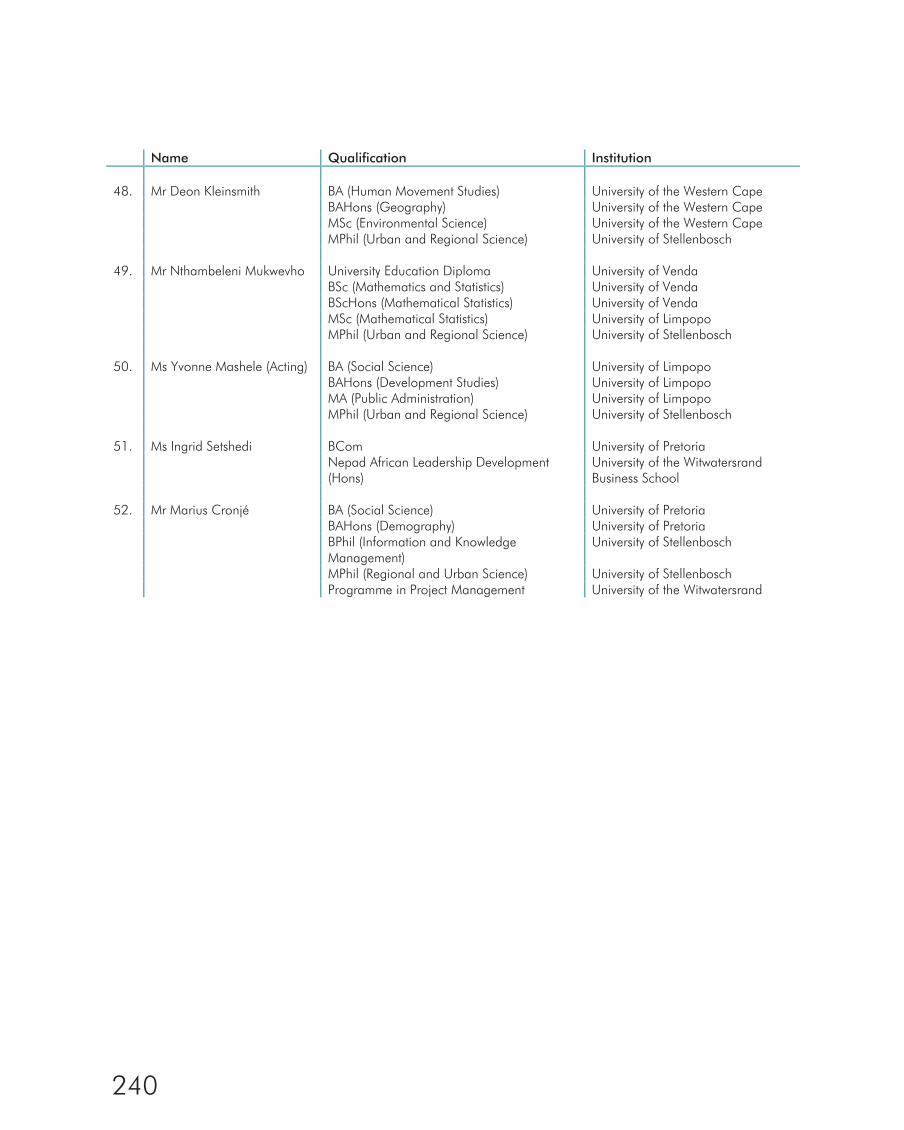
240
Name Qualification Institution 48. Mr Deon Kleinsmith BA (Human Movement Studies) University of the Western Cape BAHons (Geography) University of the Western Cape MSc (Environmental Science) University of the Western Cape MPhil (Urban and Regional Science) University of Stellenbosch 49. Mr Nthambeleni Mukwevho University Education Diploma University of Venda BSc (Mathematics and Statistics) University of Venda BScHons (Mathematical Statistics) University of Venda MSc (Mathematical Statistics) University of Limpopo MPhil (Urban and Regional Science) University of Stellenbosch 50. Ms Yvonne Mashele (Acting) BA (Social Science) University of Limpopo BAHons (Development Studies) University of Limpopo MA (Public Administration) University of Limpopo MPhil (Urban and Regional Science) University of Stellenbosch 51. Ms Ingrid Setshedi BCom University of Pretoria Nepad African Leadership Development
(Hons) University of the Witwatersrand Business School
52. Mr Marius Cronjé BA (Social Science) University of Pretoria BAHons (Demography) University of Pretoria BPhil (Information and Knowledge
Management) University of Stellenbosch
MPhil (Regional and Urban Science) University of Stellenbosch Programme in Project Management University of the Witwatersrand

241
List of abbreviations and acronyms
AENE Adjustment Estimates of National Expenditure
AfDB African Development Bank
AGSA Auditor-General South Africa
AIDS Acquired Immune Deficiency Syndrome
APAI Africa Programme on Accelerated Improvement
APAI-CRVS Africa Programme on Accelerated Improvement of Civil Registration and Vital Statistics
ASSD Africa Symposium on Statistical Development
BAUD Barcoded Asset Audit
BEE Black Economic Empowerment
BRR Budgetary Review and Recommendation
CAPI Computer-Assisted Personal Interview
CDC Continuous Data Collection
CFO Chief Financial Officer
Cogta Cooperative Governance and Traditional Affairs
CPI Consumer Price Index
CRM Client Relationship Management
CRUISE Centre for Regional and Urban Innovation Statistical Exploration
CRVS Civil Registration and Vital Statistics
CS Community Survey
CTICC Cape Town International Convention Centre
DCoG Department: Cooperative Governance
DDG Deputy Director-General
DESA Department of Economics and Social Affairs
DHA Department of Home Affairs
DPME Department of Planning, Monitoring and Evaluation
DPSA Department of Public Service and Administration
DPW Department of Public Works
DSD Department of Social Development
DTI Department of Trade and Industry
DTS Domestic Tourism Survey
EDGE Evidence and Data on Gender Equality
EEA Environmental Economic Accounts
EHW Employee Health and Wellness
ELIDZ East London Industrial Development Zone
ENE Estimates of National Expenditure
242
EPWP Expanded Public Works Programme
FCC Finance Control Committee
GAF Growth Accounting Framework
GDP Gross Domestic Product
GDPe Gross Domestic Product (expenditure)
GDPp Gross Domestic Product (production)
GFS Government Finance Statistics
GHS General Household Survey
HCT HIV Counselling and Testing
HDIs Historically Disadvantaged Individuals
HIV Human Immunodeficiency Virus
IC Independent Certifier
ICATUS International Classification of Activities for Time-Use Statistics
ICCS International Classification of Crime for Statistical Purposes
ICSE International Classification of Status in Employment
ICT Information Communication Technology
IDP Integrated Development Plan
INE Mozambique National Institute of Statistics
IPC International Population Conference
IT Information Technology
KNBS Kenya National Bureau of Statistics
KZN KwaZulu-Natal
LBS Lesotho Bureau of Statistics
LCS Living Conditions Survey
LSS Large Sample Survey
MDEDT Mpumalanga Department of Economic Development and Tourism
MEBS Mpumalanga Employment and Business Survey
MoU Memorandum of Understanding
MTEF Medium Term Expenditure Framework
NCOS National Certificate in Official Statistics
NDoH National Department of Health
NDoT National Department of Transport
NDP National Development Plan
NHTS National Household Travel Survey
NPR National Population Register
NSA Namibia Statistics Agency
NSDG National Statistical Development Strategy

243
NSG National School of Government
NTR National Treasury Regulations
OHSA Occupational Health and Safety Act
OoSG Office of the Statistician-General
PAPI Paper-Assisted Personal Interview
PASA Population Association of Southern Africa
PES Post-enumeration Survey
PFMA Public Finance Management Act
PPI Production Price Index
PPP Public Private Partnership
PSETA Public Service Sector Education and Training Authority
PSR Public Service Regulation
QES Quarterly Employment Statistics
QFSM Quarterly Financial Statistics of Municipalities
QLFS Quarterly Labour Force Survey
QMS Quality Management System
RMSC Risk Management Steering Committee
RoA Record of Agreement
RPHC Round of Population and Housing Censuses
RSC Regional Service Centre
RTMC Road Traffic Management Corporation
SABC South African Broadcasting Corporation
SABS South African Bureau of Standards
SAC Standards Approval Committee
SADHS South Africa Demographic and Health Survey
SAE Small-area estimation
SALDRU Southern Africa Labour and Development Research Unit
SAM Social Accounting Matrix
SAMRC South African Medical Research Council
SANSS South African National Statistics System
SAPS South African Police Service
SARB South African Reserve Bank
SARS South African Revenue Service
SASA South African Statistical Association
SASQAF South African Statistical Quality Assessment Framework
SAT South African Tourism
SAYP Survey of Activities of Young People

244
SB Statistics Botswana
SDGs Sustainable Development Goals
SESE Survey of Employers and the Self-employed
SEZs Special Economic Zones
SG Statistician-General
SHaSA Strategy for the Harmonisation of Statistics in Africa
SITA State Information Technology Agency
SMBS Shanghai Municipal Bureau of Statistics
SMS Senior Management Staff
SOP Standard Operating Procedure
SSA State Security Agency
Stats SA Statistics South Africa
STI Sexually Transmitted Infection
SWTS School to Work Transition Survey
TB Tuberculosis
TFP Total factor productivity
TUS Time Use Survey
UNWDF United Nations World Data Forum
VCT Voluntary counselling and testing
VOCS Victims of Crime Survey
WG Washington Group on Disability Statistics
WHO World Health Organization