Statistics of Giant Radio Halos from Electron Reacceleration Models
19
Mon. Not. R. Astron. Soc. 369, 1577–1595 (2006) doi:10.1111/j.1365-2966.2006.10423.x Statistics of giant radio haloes from electron reacceleration models R. Cassano, 1,2 G. Brunetti 2 and G. Setti 1, 2 1 Dipartimento di Astronomia,Universita’ di Bologna, via Ranzani 1, I-40127 Bologna, Italy 2 Istituto di Radioastronomia – INAF, via Gobetti 101, I–40129 Bologna, Italy Accepted 2006 April 4. Received 2006 April 3; in original form 2005 December 5 ABSTRACT The most important evidence of non-thermal phenomena in galaxy clusters comes from gi- ant radio haloes (GRHs), spectacular synchrotron radio sources extended over Mpc scales, detected in the central regions of a growing number of massive galaxy clusters. A promising possibility to explain these sources is given by in situ stochastic reacceleration of relativistic electrons by turbulence generated in the cluster volume during merger events. Cassano and Brunetti have recently shown that the expected fraction of clusters with radio haloes and the in- crease of such a fraction with cluster mass can be reconciled with present observations provided that a fraction of 20–30 per cent of the turbulence in clusters is in the form of compressible modes. In this work, we extend the above-mentioned analysis by including a scaling of the magnetic field strength with cluster mass. We show that, in the framework of the reacceleration model, the observed correlations between the synchrotron radio power of a sample of 17 GRHs and the X-ray properties of the hosting clusters are consistent with, and actually predicted by a magnetic field dependence on the virial mass of the form B ∝ M b v , with b 0.5 and typical μG strengths of the average B intensity. The occurrence of GRHs as a function of both cluster mass and redshift is obtained: the evolution of such a probability depends on the interplay between synchrotron and inverse Compton losses in the emitting volume, and it is maximized in clusters for which the two losses are comparable. The most relevant findings are that the predicted luminosity functions of GRHs are peaked around a power P 1.4 GHz ∼ 10 24 W Hz −1 , and severely cut off at low radio powers due to the decrease of the electron reacceleration in smaller galaxy clusters, and that the occurrence of GRHs at 1.4 GHz beyond a redshift z ∼ 0.7 appears to be negligible. As a related check, we also show that the predicted integral radio source counts within a limited volume (z 0.2) are consistent with present observational constraints. Extending the source counts beyond z = 0.2, we estimate that the total number of GRHs to be discovered at ∼ mJy radio fluxes could be ∼100 at 1.4 GHz. Finally, the occurrence of GRHs and their number counts at 150 MHz are estimated in view of the forthcoming operation of low-frequency observatories (LOFAR, LWA) and compared with those at higher radio frequencies. Key words: acceleration of particles – radiation mechanisms: non-thermal – turbulence – galaxies: clusters: general – radio continuum: general – X-rays: general. 1 INTRODUCTION The intracluster medium (ICM) is a mixture of thermal and non- thermal components and a precise physical description of the ICM also requires adequate knowledge of the role of non-thermal components. The most detailed evidence for non-thermal phenomena comes from the radio observations. A number of clusters of galaxies are E-mail: [email protected] known to contain wide diffuse synchrotron sources (radio haloes and relics) which have no obvious connection with the individual cluster galaxies, but are rather associated to the ICM (e.g. Giovannini & Feretti 2000; Kempner & Sarazin 2001; see Giovannini & Feretti 2002 for a review). The synchrotron emission of such sources re- quires a population of GeV relativistic electrons (and/or positrons) and cluster magnetic fields on μG levels. Evidence for relativis- tic electrons (and positrons) in the ICM may also come from the detection of a hard X-ray (HXR) excess emission in the case of a few galaxy clusters (e.g. Rephaeli & Gruber 2003; Fusco-Femiano C 2006 The Authors. Journal compilation C 2006 RAS
-
Upload
independent -
Category
Documents
-
view
0 -
download
0
Transcript of Statistics of Giant Radio Halos from Electron Reacceleration Models
Mon. Not. R. Astron. Soc. 369, 1577–1595 (2006) doi:10.1111/j.1365-2966.2006.10423.x
Statistics of giant radio haloes from electron reacceleration models
R. Cassano,1,2� G. Brunetti2 and G. Setti1,2
1Dipartimento di Astronomia,Universita’ di Bologna, via Ranzani 1, I-40127 Bologna, Italy2Istituto di Radioastronomia – INAF, via Gobetti 101, I–40129 Bologna, Italy
Accepted 2006 April 4. Received 2006 April 3; in original form 2005 December 5
ABSTRACT
The most important evidence of non-thermal phenomena in galaxy clusters comes from gi-ant radio haloes (GRHs), spectacular synchrotron radio sources extended over �Mpc scales,detected in the central regions of a growing number of massive galaxy clusters. A promisingpossibility to explain these sources is given by in situ stochastic reacceleration of relativisticelectrons by turbulence generated in the cluster volume during merger events. Cassano andBrunetti have recently shown that the expected fraction of clusters with radio haloes and the in-crease of such a fraction with cluster mass can be reconciled with present observations providedthat a fraction of 20–30 per cent of the turbulence in clusters is in the form of compressiblemodes.
In this work, we extend the above-mentioned analysis by including a scaling of the magneticfield strength with cluster mass. We show that, in the framework of the reacceleration model,the observed correlations between the synchrotron radio power of a sample of 17 GRHs andthe X-ray properties of the hosting clusters are consistent with, and actually predicted by amagnetic field dependence on the virial mass of the form B ∝ Mb
v, with b � 0.5 and typicalμG strengths of the average B intensity. The occurrence of GRHs as a function of both clustermass and redshift is obtained: the evolution of such a probability depends on the interplaybetween synchrotron and inverse Compton losses in the emitting volume, and it is maximizedin clusters for which the two losses are comparable.
The most relevant findings are that the predicted luminosity functions of GRHs are peakedaround a power P1.4 GHz ∼ 1024 W Hz−1, and severely cut off at low radio powers due to thedecrease of the electron reacceleration in smaller galaxy clusters, and that the occurrence ofGRHs at 1.4 GHz beyond a redshift z ∼ 0.7 appears to be negligible. As a related check, wealso show that the predicted integral radio source counts within a limited volume (z � 0.2)are consistent with present observational constraints. Extending the source counts beyond z =0.2, we estimate that the total number of GRHs to be discovered at ∼ mJy radio fluxes couldbe ∼100 at 1.4 GHz. Finally, the occurrence of GRHs and their number counts at 150 MHzare estimated in view of the forthcoming operation of low-frequency observatories (LOFAR,LWA) and compared with those at higher radio frequencies.
Key words: acceleration of particles – radiation mechanisms: non-thermal – turbulence –galaxies: clusters: general – radio continuum: general – X-rays: general.
1 I N T RO D U C T I O N
The intracluster medium (ICM) is a mixture of thermal and non-thermal components and a precise physical description of theICM also requires adequate knowledge of the role of non-thermalcomponents.
The most detailed evidence for non-thermal phenomena comesfrom the radio observations. A number of clusters of galaxies are
�E-mail: [email protected]
known to contain wide diffuse synchrotron sources (radio haloes andrelics) which have no obvious connection with the individual clustergalaxies, but are rather associated to the ICM (e.g. Giovannini &Feretti 2000; Kempner & Sarazin 2001; see Giovannini & Feretti2002 for a review). The synchrotron emission of such sources re-quires a population of GeV relativistic electrons (and/or positrons)and cluster magnetic fields on μG levels. Evidence for relativis-tic electrons (and positrons) in the ICM may also come from thedetection of a hard X-ray (HXR) excess emission in the case of afew galaxy clusters (e.g. Rephaeli & Gruber 2003; Fusco-Femiano
C© 2006 The Authors. Journal compilation C© 2006 RAS
1578 R. Cassano, G. Brunetti and G. Setti
et al. 2004), and possibly from extreme ultraviolet (EUV) excessemission (e.g. Kaastra et al. 2003; Bowyer et al. 2004). It is also be-lieved that the amount of the energy budget of high-energy protonsin the ICM might be significant, due to the confinement of cosmicrays over cosmological time-scales (Volk, Aharonian & Breitschw-erdt 1996; Berezinsky, Blasi & Ptuskin 1997; Enßlin et al. 1997).Nevertheless, the gamma radiation that would allow to infer thefraction of relativistic hadrons in clusters has not been detected asyet (Reimer et al. 2003, see Pfrommer & Enßlin 2004 for upper limiton this fraction).
Shock waves are unavoidably formed during merger events; theymay efficiently accelerate relativistic particles contributing to theinjection of relativistic hadrons and of relativistic emitting elec-trons in the ICM (e.g. Gabici & Balsi 2003; Ryu et al. 2003).However, the accelerated electrons have a short path-length dueto inverse Compton (IC) losses and thus they can travel a shortdistance away from the shock front, emitting synchrotron radia-tion concentrated around the shock rim (e.g. Miniati et al. 2001).Radio Relics, which are polarized and elongated radio sources lo-cated in the cluster peripheral regions, may indeed be associatedto these shock waves, as a result of Fermi-I diffusive shock accel-eration of ICM electrons (Enßlin et al. 1998; Roettiger, Burns &Stone 1999), or of adiabatic energization of relativistic electronsconfined in fossil radio plasma, released in the past by active radiogalaxies (Enßlin & Gopal-Krishna 2001; Hoeft, Brggen & Yepes2004).
The most spectacular evidence of diffuse synchrotron emissionin galaxy clusters is that associated to giant radio haloes (GRHs),Mpc-size radio sources which permeate the cluster volume similarlyto the X-ray emitting gas. In this respect, two main possibilitieshave been investigated in some detail to explain that GeV elec-trons (and/or positrons) are present and able to radiate on distancescales larger than their typical loss lengths: (i) the so-called reac-celeration models, whereby relativistic electrons (and positrons)injected in the ICM by a variety of processes active during thelife of galaxy clusters are continuously re-energized in situ dur-ing the lifetime of the observed radio haloes (which is estimatedto be ∼1 Gyr, Kuo, Hwang & Ip 2004) and (ii) the secondaryelectron models, whereby electrons are secondary products of thehadronic interactions of cosmic rays with the ICM, as first pro-posed by Dennison (1980). Although the origin of the emitting par-ticles in radio haloes is still a matter of debate (e.g. Enßlin 2004),the above two models for the production of the radiating electrons(and positrons) have a substantial predictive power, which can beused to discriminate among such models by comparing their pre-dictions with observations. Although future observations remaincrucial to achieve a firm conclusion, at least as far as the fewwell-studied clusters and the analysis of statistical samples are con-cerned, present data seem to suggest the presence of in situ particle-reacceleration mechanisms active in the ICM (e.g. Brunetti 2003,2004; Blasi 2004; Feretti et al. 2004; Hwang 2004; Reimer et al.2004).
Radio observations of galaxy clusters indicate that the detec-tion rate of radio haloes shows an abrupt increase with increas-ing the X-ray luminosity of the host clusters. In particular, about30–35 per cent of the galaxy clusters with X-ray luminositylarger than 1045 erg s−1 show diffuse non-thermal radio emission(Giovannini & Feretti 2002); these clusters have also high tem-perature (kT > 7 keV) and large mass (�2 × 10¹⁵ M�). Further-more, GRHs are always found in merging clusters (e.g. Buote 2001;Schuecker et al. 2001). Although the physics of particle accelera-tion due to turbulence generated in merging clusters has been in-
vestigated in some detail (e.g. Schlickeiser, Sievers & Thiemann1987; Petrosian 2001; Fujita, Takizawa & Sarazin 2003; Brunettiet al. 2004; Brunetti & Blasi 2005) and the model expectationsseem to reproduce the observed radio features and possibly also theHXRs (e.g. Brunetti et al. 2001; Kuo, Hwang & Ip 2003; Brunetti2004; Hwang 2004), a theoretical investigation of the statisticalproperties of the Mpc diffuse emission in galaxy clusters in theframework of these models has not been carried out extensivelyas yet. In particular, the fact that GRHs are always associated tomassive galaxy clusters and the presence of a trend between theirradio power and the mass (temperature, X-ray luminosity) of theparent clusters may be powerful tools to test and constrain presentmodels.
In this paper, Cassano & Brunetti (2005, hereafter CB05) havemodelled the statistical properties of GRHs in the framework of themerger-induced in situ particle acceleration scenario. By adoptingthe semi-analytic Press & Schecter (1974, PS74) theory to followthe cosmic evolution and formation of a large synthetic popula-tion of galaxy clusters, it was assumed that the energy injected inthe form of magnetosonic (MS) waves during merging events inclusters is a fraction, η t, of the PdV work done by the infallingsubclusters in passing through the most massive one. Then the pro-cesses of stochastic acceleration of the relativistic electrons by thesewaves, and the ensuing synchrotron emission properties, have beenworked out under the assumption that the magnetic field intensities,ICM temperatures and particle densities (both thermal and non-thermal) have constant volume-averaged values (within 1 Mpc3).The main findings of these calculations is that GRHs are natu-rally expected only in the more-massive clusters, and the expectedfraction of clusters with radio haloes (at redshifts z � 0.2) can bereconciled with the observed one under viable assumptions (η t �0.24–0.34). Specifically, the probability to form GRHs in the syn-thetic cluster population was found to be of the order of 20–30 percent in the more-massive galaxy clusters (M > 2 × 10¹⁵ M�),2–5 per cent in M ∼ 1015 M� clusters, and negligible in less-massive systems. Such increase of the probability with the clustermass is essentially due to the increase of both the energy density ofturbulence and the turbulence injection volume with cluster mass(see CB05).
This paper is a natural extension of the CB05 work, the mostimportant difference being that here we adopt a scaling law betweenthe rms magnetic field strength (averaged in the synchrotron emittingvolume) and the virial mass of the parent clusters, B ∝ Mb. We carryout a detailed comparison between statistical data of GRHs currentlyavailable and model expectations as derived by adopting the CB05procedures.
In Section 2, we collect radio and X-ray data for well-knownGRHs from the literature and derive radio–X-ray correlations. InSection 3, we investigate the possibility to match the observedradio–X-ray correlations for GRHs with electron acceleration mod-els. This comparison provides stringent constraints on the physicalparameters in the ICM, in particular for the magnetic field in galaxyclusters. In Section 4, we derive the expected probability to formGRHs as a function of Mv and z. This is done by adopting the samevalues of the physical parameters which allows to account for theobserved radio–X-ray correlations. In Sections 5 and 6, we finallycalculate the expected luminosity functions and number counts ofGRHs.
As in CB05, we focus our attention on GRHs only (linear size∼1 h−1
50 Mpc). The adopted cosmology is: � cold dark matter(�CDM; H0 = 70 Km s−1 Mpc−1, �m,0 = 0.3, �� = 0.7 andσ 8 = 0.9).
C© 2006 The Authors. Journal compilation C© 2006 RAS, MNRAS 369, 1577–1595
Statistics of GRHs from reacceleration models 1579
Table 1. Radio and X-ray properties of cluster with GRHs (linear size ∼ 1 h−150 Mpc) in a �CDM cosmology. Column (1): cluster name. Column (2): cluster
redshift. Column (3): cluster temperature given in keV. Column (4): X-ray luminosity in the energy range 0.1–2.4 keV in unit of h−270 1044 erg s−1. Column (5):
bolometric X-ray luminosity in the energy range 0.01–40 keV in unit of h−270 1044 erg s−1. Column (6): radio power at 1.4 GHz in unit of h−2
70 1024 W Hz−1.Column (7): large linear size (LLS) of the radio halo is in h−1
70 kpc. References for the temperature data in brackets: (Z04) Zhang et al. (2004) (XMM); (W00)White (2000) (ASCA); (M96) Markevitch (1996) (ASCA); (m) mean value between Mushotzky & Scharf (1997) (ASCA) and Govoni et al. (2004) (Chandra);(e) Ebeling et al. (1996) (from LX–T relation); (D93) David et al. (1993) (Einstein MPC plus EXOSAT plus Ginga); (M98) Markevitch et al. (1998) (ASCA);(m1) mean value between Z04 and Pierre et al. (1999) (ASCA data); (H93) Hughes et al. (1993) (Ginga). References for the X-ray luminosities in brackets:(B04) Bohringer et al. (2004), (E98) Ebeling et al. (1998), (E96) Ebeling et al. (1996), (T96) Tsuru et al. (1996). References for the radio data in brackets:(L00) Liang et al. (2000) (ATCA) (F00) Feretti (2000), (B03) Bacchi et al. (2003), (GF00) Giovannini & Feretti (2000), (V03) Venturi et al. (2003), (GFG01)Govoni et al. (2001), (G05) Govoni et al. (2005), (FF03) Feretti et al. (2001), (m2) mean value between Kim et al. (1990) and Deiss et al. (1997).
Cluster z T LX Lbol P1.4 LLSname (keV) (1044 erg s−1) (1044 erg s−1) (1024 W Hz−1) (Mpc h−1
70 )
1E50657−558 0.2994 13.59+0.71−0.58 (Z04) 23.322 ± 1.84 (B04) 88.619 ± 7.00 28.21 ± 1.97 (L00) 1.43
A2163 0.2030 13.29+0.64−0.64 (W00) 23.435 ± 1.50 (B04) 82.021 ± 5.24 18.44 ± 0.24 (FF01) 1.86
A2744 0.3080 8.65+0.43−0.29 (Z04) 13.061 ± 2.44 (B04) 37.315 ± 6.97 17.16 ± 1.71 (GFG01) 1.64
A2219 0.2280 9.52+0.55−0.40 (W00) 12.732 ± 0.98 (E98) 40.293 ± 4.34 12.23 ± 0.59 (B03) 1.56
CL0016+16 0.5545 9.13+0.24−0.22 (W00) 18.829 ± 1.88 (T96) 51.626 ± 5.16 6.74 ± 0.67 (GF00) 0.79
A1914 0.1712 10.53+0.51−0.50 (W00) 10.710 ± 1.02 (E96) 33.738 ± 3.21 5.21 ± 0.24 (B03) 1.18
A665 0.1816 8.40+1.0−1.0 (M96) 9.836 ± 0.98 (E98) 25.130 ± 3.92 3.98 ± 0.39 (GF00) 1.69
A520 0.2010 7.84+0.52−0.52 (m) 8.830 ± 0.79 (E98) 22.841 ± 5.14 3.91 ± 0.39 (GFG01) 1.00
A2254 0.1780 7.50+0.0−0.0 (e) 4.319 ± 0.26 (E96) 11.076 ± 0.66 2.94 ± 0.29 (GFG01) 0.86
A2256 0.0581 6.90+0.11−0.11 (W00) 3.814 ± 0.16 (E96) 9.535 ± 0.42 0.24 ± 0.02 (F00) 0.85
A773 0.2170 8.39+0.42−0.42 (m) 8.097 ± 0.65 (E98) 21.728 ± 3.62 1.73 ± 0.17 (GFG01) 1.14
A545 0.1530 5.50+6.20−1.10 (D93) 5.732 ± 0.50 (B04) 12.608 ± 1.10 1.48 ± 0.06 (B03) 0.82
A2319 0.0559 8.84+0.29−0.24 (M98) 7.403 ± 0.41 (E96) 20.730 ± 1.14 1.12 ± 0.11 (F00) 1.01
A1300 0.3071 9.42+0.26−0.25 (m1) 14.114 ± 2.08 (B04) 33.870 ± 4.98 6.09 ± 0.61 (F00) 0.86
A1656 0.0231 8.21+0.16−0.16 (H93) 3.772 ± 0.10 (E96) 10.182 ± 0.26 0.72+0.07
−0.04 (m2) 0.78
A2255 0.0808 6.87+0.20−0.20 (W00) 2.646 ± 0.12 (E96) 6.611 ± 0.30 0.89 ± 0.05 (G04) 0.88
A754 0.0535 9.38+0.27−0.27 (W00) 4.314 ± 0.33 (E96) 12.946 ± 0.98 1.08 ± 0.06 (B03) 0.96
2 O B S E RV E D C O R R E L AT I O N S
In this section, we discuss the observed correlations between theX-ray and the radio properties of clusters hosting GRHs. We collectgalaxy clusters with known GRHs from the literature obtaining atotal sample of 17 clusters. In Table 1, we report the radio and X-rayproperties of this sample in a �CDM cosmology. In order to havethe best estimate of the X-ray temperatures, we select results fromXMM–Newton observations when available, otherwise we use ASCAresults or combine ASCA and Chandra information. We investigatethe correlations between the X-ray and the radio properties of theselected clusters by making use of a linear regression fit in log–logspace following the procedures given in Akritas & Bershady (1996).This method allows for intrinsic scatter and errors in both variables.
2.1 Radio power–X-ray luminosity correlation
The presence of a correlation between the radio powers and theX-ray luminosities is well known (Liang et al. 2000; Feretti 2000,2003; Enßlin & Rottgering 2002).
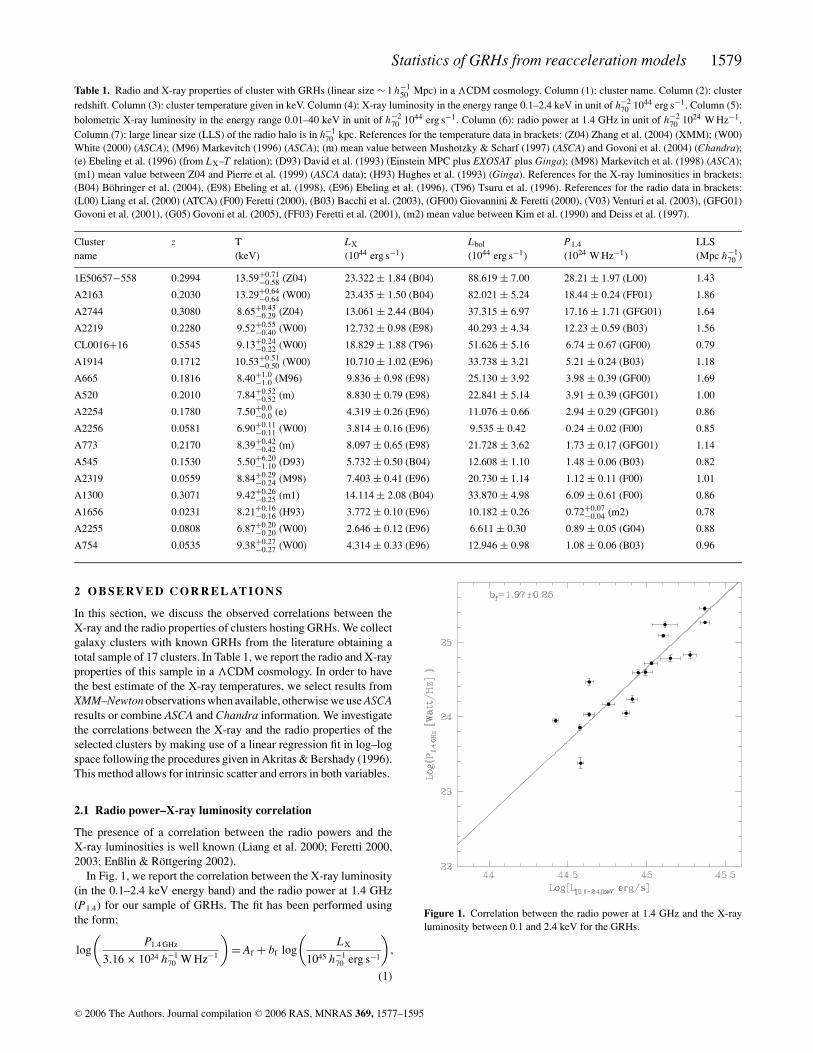
In Fig. 1, we report the correlation between the X-ray luminosity(in the 0.1–2.4 keV energy band) and the radio power at 1.4 GHz(P1.4) for our sample of GRHs. The fit has been performed usingthe form:
log
(P1.4 GHz
3.16 × 1024 h−170 W Hz−1
)= Af + bf log
(LX
1045 h−170 erg s−1
),
(1)
Figure 1. Correlation between the radio power at 1.4 GHz and the X-rayluminosity between 0.1 and 2.4 keV for the GRHs.
C© 2006 The Authors. Journal compilation C© 2006 RAS, MNRAS 369, 1577–1595
1580 R. Cassano, G. Brunetti and G. Setti
where the best-fitting parameters are: Af = 0.159 ± 0.060 and bf =1.97 ± 0.25.
Our findings are consistent with those of Enßlin & Rottgering(2002), who used 14 clusters with radio haloes and found a corre-lation of the form P 1.4 GHz ∝ L1.94
X . Using 16 clusters with GRHs,Feretti (2003) found a correlation between the X-ray bolometricluminosity and the radio power at 1.4 GHz of the form P 1.4 GHz ∝(Lbol
X )1.8±0.2. A consistent result is obtained with the data in Table 1(P 1.4 GHz ∝ (Lbol
X )1.74±0.21).Although the trend in Fig. 1 appears quite stringent, one may won-
der whether it could be affected by observational biases. It should bepointed out that most GRHs have been discovered by follow-ups ofradio halo candidates mostly identified from the NRAO VLA SkySurvey (NVSS, Condon et al. 1998).
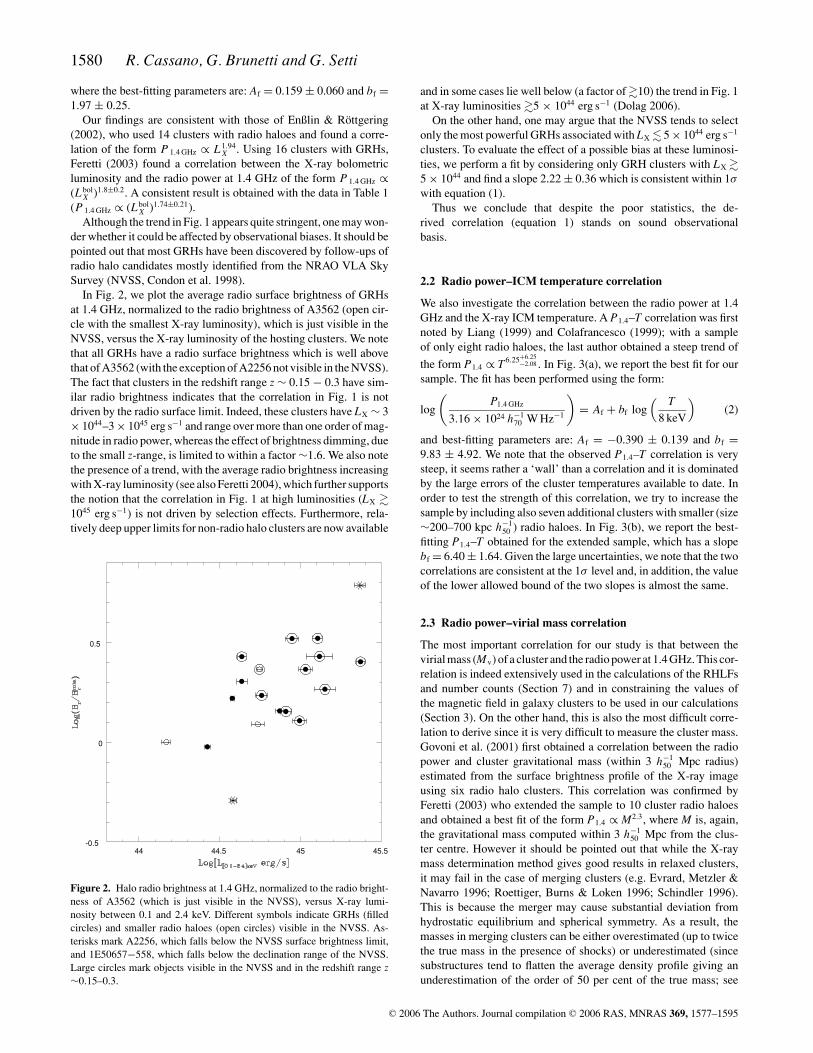
In Fig. 2, we plot the average radio surface brightness of GRHsat 1.4 GHz, normalized to the radio brightness of A3562 (open cir-cle with the smallest X-ray luminosity), which is just visible in theNVSS, versus the X-ray luminosity of the hosting clusters. We notethat all GRHs have a radio surface brightness which is well abovethat of A3562 (with the exception of A2256 not visible in the NVSS).The fact that clusters in the redshift range z ∼ 0.15 − 0.3 have sim-ilar radio brightness indicates that the correlation in Fig. 1 is notdriven by the radio surface limit. Indeed, these clusters have LX ∼ 3× 1044–3 × 1045 erg s−1 and range over more than one order of mag-nitude in radio power, whereas the effect of brightness dimming, dueto the small z-range, is limited to within a factor ∼1.6. We also notethe presence of a trend, with the average radio brightness increasingwith X-ray luminosity (see also Feretti 2004), which further supportsthe notion that the correlation in Fig. 1 at high luminosities (LX �1045 erg s−1) is not driven by selection effects. Furthermore, rela-tively deep upper limits for non-radio halo clusters are now available
44 44.5 45 45.5-0.5
0
0.5
Figure 2. Halo radio brightness at 1.4 GHz, normalized to the radio bright-ness of A3562 (which is just visible in the NVSS), versus X-ray lumi-nosity between 0.1 and 2.4 keV. Different symbols indicate GRHs (filledcircles) and smaller radio haloes (open circles) visible in the NVSS. As-terisks mark A2256, which falls below the NVSS surface brightness limit,and 1E50657−558, which falls below the declination range of the NVSS.Large circles mark objects visible in the NVSS and in the redshift range z∼0.15–0.3.
and in some cases lie well below (a factor of �10) the trend in Fig. 1at X-ray luminosities �5 × 1044 erg s−1 (Dolag 2006).
On the other hand, one may argue that the NVSS tends to selectonly the most powerful GRHs associated with LX � 5 × 1044 erg s−1
clusters. To evaluate the effect of a possible bias at these luminosi-ties, we perform a fit by considering only GRH clusters with LX �5 × 1044 and find a slope 2.22 ± 0.36 which is consistent within 1σ
with equation (1).Thus we conclude that despite the poor statistics, the de-
rived correlation (equation 1) stands on sound observationalbasis.
2.2 Radio power–ICM temperature correlation
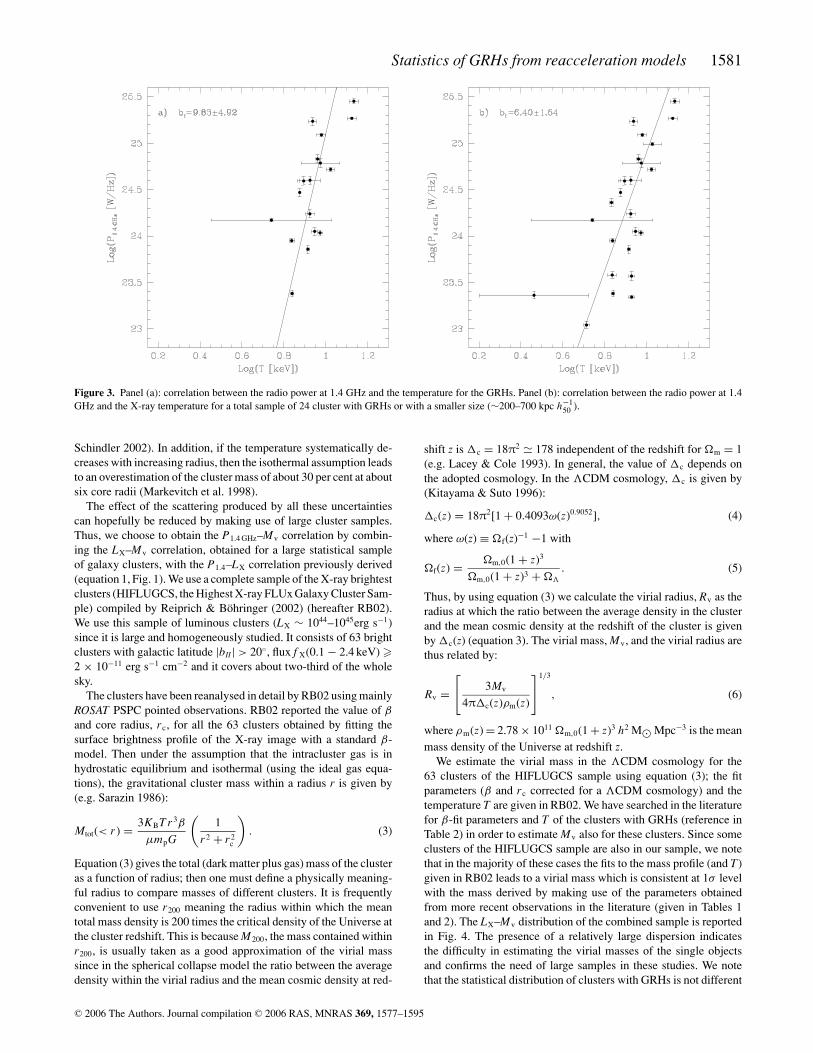
We also investigate the correlation between the radio power at 1.4GHz and the X-ray ICM temperature. A P1.4–T correlation was firstnoted by Liang (1999) and Colafrancesco (1999); with a sampleof only eight radio haloes, the last author obtained a steep trend of
the form P1.4 ∝ T6.25+6.25−2.08 . In Fig. 3(a), we report the best fit for our
sample. The fit has been performed using the form:
log
(P1.4 GHz
3.16 × 1024 h−170 W Hz−1
)= Af + bf log
( T8 keV
)(2)
and best-fitting parameters are: Af = −0.390 ± 0.139 and bf =9.83 ± 4.92. We note that the observed P1.4–T correlation is verysteep, it seems rather a ‘wall’ than a correlation and it is dominatedby the large errors of the cluster temperatures available to date. Inorder to test the strength of this correlation, we try to increase thesample by including also seven additional clusters with smaller (size∼200–700 kpc h−1
50 ) radio haloes. In Fig. 3(b), we report the best-fitting P1.4–T obtained for the extended sample, which has a slopebf = 6.40 ± 1.64. Given the large uncertainties, we note that the twocorrelations are consistent at the 1σ level and, in addition, the valueof the lower allowed bound of the two slopes is almost the same.
2.3 Radio power–virial mass correlation
The most important correlation for our study is that between thevirial mass (Mv) of a cluster and the radio power at 1.4 GHz. This cor-relation is indeed extensively used in the calculations of the RHLFsand number counts (Section 7) and in constraining the values ofthe magnetic field in galaxy clusters to be used in our calculations(Section 3). On the other hand, this is also the most difficult corre-lation to derive since it is very difficult to measure the cluster mass.Govoni et al. (2001) first obtained a correlation between the radiopower and cluster gravitational mass (within 3 h−1
50 Mpc radius)estimated from the surface brightness profile of the X-ray imageusing six radio halo clusters. This correlation was confirmed byFeretti (2003) who extended the sample to 10 cluster radio haloesand obtained a best fit of the form P1.4 ∝ M2.3, where M is, again,the gravitational mass computed within 3 h−1
50 Mpc from the clus-ter centre. However it should be pointed out that while the X-raymass determination method gives good results in relaxed clusters,it may fail in the case of merging clusters (e.g. Evrard, Metzler &Navarro 1996; Roettiger, Burns & Loken 1996; Schindler 1996).This is because the merger may cause substantial deviation fromhydrostatic equilibrium and spherical symmetry. As a result, themasses in merging clusters can be either overestimated (up to twicethe true mass in the presence of shocks) or underestimated (sincesubstructures tend to flatten the average density profile giving anunderestimation of the order of 50 per cent of the true mass; see
C© 2006 The Authors. Journal compilation C© 2006 RAS, MNRAS 369, 1577–1595
Statistics of GRHs from reacceleration models 1581
Figure 3. Panel (a): correlation between the radio power at 1.4 GHz and the temperature for the GRHs. Panel (b): correlation between the radio power at 1.4GHz and the X-ray temperature for a total sample of 24 cluster with GRHs or with a smaller size (∼200–700 kpc h−1
50 ).
Schindler 2002). In addition, if the temperature systematically de-creases with increasing radius, then the isothermal assumption leadsto an overestimation of the cluster mass of about 30 per cent at aboutsix core radii (Markevitch et al. 1998).
The effect of the scattering produced by all these uncertaintiescan hopefully be reduced by making use of large cluster samples.Thus, we choose to obtain the P1.4 GHz–Mv correlation by combin-ing the LX–Mv correlation, obtained for a large statistical sampleof galaxy clusters, with the P1.4–LX correlation previously derived(equation 1, Fig. 1). We use a complete sample of the X-ray brightestclusters (HIFLUGCS, the Highest X-ray FLUx Galaxy Cluster Sam-ple) compiled by Reiprich & Bohringer (2002) (hereafter RB02).We use this sample of luminous clusters (LX ∼ 1044–1045erg s−1)since it is large and homogeneously studied. It consists of 63 brightclusters with galactic latitude |bII | > 20◦, flux f X(0.1 − 2.4 keV) �2 × 10⁻¹¹ erg s−1 cm−2 and it covers about two-third of the wholesky.
The clusters have been reanalysed in detail by RB02 using mainlyROSAT PSPC pointed observations. RB02 reported the value of β
and core radius, rc, for all the 63 clusters obtained by fitting thesurface brightness profile of the X-ray image with a standard β-model. Then under the assumption that the intracluster gas is inhydrostatic equilibrium and isothermal (using the ideal gas equa-tions), the gravitational cluster mass within a radius r is given by(e.g. Sarazin 1986):
Mtot(< r ) = 3KBT r 3β
μmpG
(1
r 2 + r 2c
). (3)
Equation (3) gives the total (dark matter plus gas) mass of the clusteras a function of radius; then one must define a physically meaning-ful radius to compare masses of different clusters. It is frequentlyconvenient to use r200 meaning the radius within which the meantotal mass density is 200 times the critical density of the Universe atthe cluster redshift. This is because M200, the mass contained withinr200, is usually taken as a good approximation of the virial masssince in the spherical collapse model the ratio between the averagedensity within the virial radius and the mean cosmic density at red-
shift z is �c = 18π2 � 178 independent of the redshift for �m = 1(e.g. Lacey & Cole 1993). In general, the value of �c depends onthe adopted cosmology. In the �CDM cosmology, �c is given by(Kitayama & Suto 1996):
�c(z) = 18π2[1 + 0.4093ω(z)0.9052], (4)
where ω(z) ≡ �f(z)−1 −1 with
�f(z) = �m,0(1 + z)3
�m,0(1 + z)3 + ��
. (5)
Thus, by using equation (3) we calculate the virial radius, Rv as theradius at which the ratio between the average density in the clusterand the mean cosmic density at the redshift of the cluster is givenby �c(z) (equation 3). The virial mass, Mv, and the virial radius arethus related by:
Rv =[
3Mv
4π�c(z)ρm(z)
]1/3
, (6)
where ρm(z) = 2.78 × 10¹¹ �m,0(1 + z)3 h2 M� Mpc−3 is the meanmass density of the Universe at redshift z.
We estimate the virial mass in the �CDM cosmology for the63 clusters of the HIFLUGCS sample using equation (3); the fitparameters (β and rc corrected for a �CDM cosmology) and thetemperature T are given in RB02. We have searched in the literaturefor β-fit parameters and T of the clusters with GRHs (reference inTable 2) in order to estimate Mv also for these clusters. Since someclusters of the HIFLUGCS sample are also in our sample, we notethat in the majority of these cases the fits to the mass profile (and T)given in RB02 leads to a virial mass which is consistent at 1σ levelwith the mass derived by making use of the parameters obtainedfrom more recent observations in the literature (given in Tables 1and 2). The LX–Mv distribution of the combined sample is reportedin Fig. 4. The presence of a relatively large dispersion indicatesthe difficulty in estimating the virial masses of the single objectsand confirms the need of large samples in these studies. We notethat the statistical distribution of clusters with GRHs is not different
C© 2006 The Authors. Journal compilation C© 2006 RAS, MNRAS 369, 1577–1595
1582 R. Cassano, G. Brunetti and G. Setti
Table 2. Parameters of the β-fit and cluster mass estimated for the 16 galaxy clusters with GRHs for which β-fits are avaiable. Column (1): cluster name.Column (2): β-parameter value with 1σ error. Column (3): core radius in units of h−1
70 kpc and corresponding uncertainty. Column (4): virial mass and isuncertainty in units of h−1
70 1015 M�. Column (5): virial radius in units of h−170 kpc. Column (6): mass estimated inside the core radius in units of h−1
70 1013 M�.References for the (data) source in brackets: (a) Markevitch et al. (2002) (Chandra); (b) RB02 (ROSAT for β-fit and T as in Table 1); (c) Govoni et al. (2001)(ROSAT); (d) Ettori & Fabian (1999) (ROSAT); (e) Ettori et al. (2004) (Chandra); (g) Lemonon et al. (1997) (ROSAT).
Cluster β rc Mv Rv Mc
name (kpc h−170 ) (1015 M�) (kpc h−1
70 ) (1013 M�)
1E50657−558 (a) 0.70 ± 0.07 179 ± 18 3.43 ± 0.38 3301 9.50 ± 1.40A2163 (b) 0.80 ± 0.03 371 ± 21 4.32 ± 0.26 3766 22.00 ± 1.84A2744 (c) 1.00 ± 0.08 458 ± 46 2.87 ± 0.26 3096 22.10 ± 2.96A2219 (d) 0.79 ± 0.08 343 ± 34 2.52 ± 0.28 3104 14.40 ± 2.16CL0016+16 (e) 0.68 ± 0.01 237 ± 80 1.47 ± 0.05 2166 8.27 ± 0.38A1914 (b) 0.75 ± 0.02 165 ± 80 2.90 ± 0.15 3356 7.28 ± 0.51A665 (d) 0.74 ± 0.07 350 ± 35 1.97 ± 0.30 2933 12.10 ± 2.20A520 (c) 0.87 ± 0.08 382 ± 50 2.22 ± 0.25 3018 14.50 ± 2.51A2256 (b) 0.91 ± 0.05 419 ± 28 2.23 ± 0.13 3281 14.70 ± 1.28A773 (c) 0.63 ± 0.07 160 ± 27 1.52 ± 0.19 2636 4.72 ± 0.98A545 (d) 0.82 ± 0.08 286 ± 29 1.25 ± 0.84 2562 7.20 ± 4.89A2319 (b) 0.59 ± 0.01 204 ± 10 1.71 ± 0.07 3009 5.95 ± 0.38A1300 (g) 0.64 ± 0.01 171 ± 80 1.71 ± 0.06 2609 5.76 ± 0.33A1656 (b) 0.65 ± 0.02 246 ± 15 1.83 ± 0.07 3136 7.38 ± 0.53A2255 (b) 0.80 ± 0.05 419 ± 28 1.76 ± 0.12 2996 12.80 ± 1.22A754 (b) 0.70 ± 0.03 171 ± 12 2.42 ± 0.11 3379 6.25 ± 0.52
from that of the HIFLUGCS sample. On the other hand, we notethat clusters with known GRHs span a range in mass comparableto the mass dispersion in the HIFLUGCS sample which is due tothe different dynamical status of clusters in the sample and to theuncertainties in the measurements. This further strengthens the needof the approach followed in this section, since a LX (or P1.4)–Mv fitbased on GRHs alone would be affected by large uncertainties.
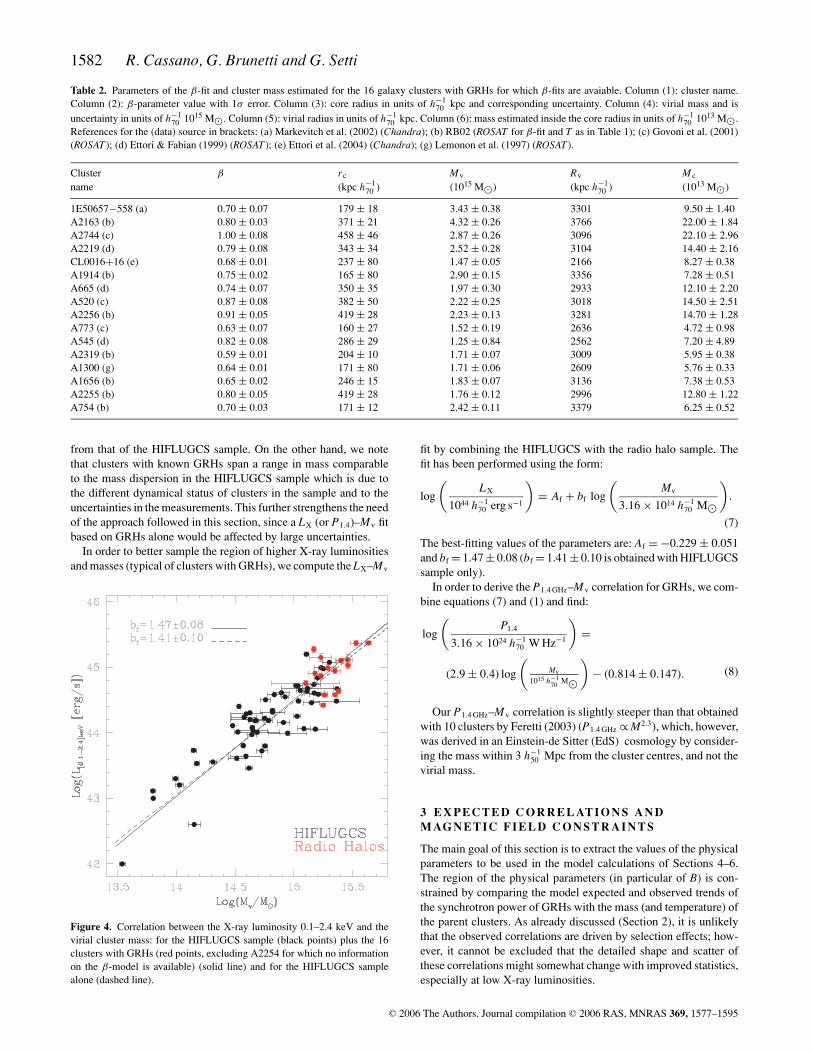
In order to better sample the region of higher X-ray luminositiesand masses (typical of clusters with GRHs), we compute the LX–Mv
Figure 4. Correlation between the X-ray luminosity 0.1–2.4 keV and thevirial cluster mass: for the HIFLUGCS sample (black points) plus the 16clusters with GRHs (red points, excluding A2254 for which no informationon the β-model is available) (solid line) and for the HIFLUGCS samplealone (dashed line).
fit by combining the HIFLUGCS with the radio halo sample. Thefit has been performed using the form:
log
(LX
1044 h−170 erg s−1
)= Af + bf log
(Mv
3.16 × 10¹⁴ h−170 M�
).
(7)
The best-fitting values of the parameters are: Af = −0.229 ± 0.051and bf = 1.47 ± 0.08 (bf = 1.41 ± 0.10 is obtained with HIFLUGCSsample only).
In order to derive the P1.4 GHz–Mv correlation for GRHs, we com-bine equations (7) and (1) and find:
log
(P1.4
3.16 × 1024 h−170 W Hz−1
)=
(2.9 ± 0.4) log
(Mv
1015 h−170 M�
)− (0.814 ± 0.147). (8)
Our P1.4 GHz–Mv correlation is slightly steeper than that obtainedwith 10 clusters by Feretti (2003) (P1.4 GHz ∝ M2.3), which, however,was derived in an Einstein-de Sitter (EdS) cosmology by consider-ing the mass within 3 h−1
50 Mpc from the cluster centres, and not thevirial mass.
3 E X P E C T E D C O R R E L AT I O N S A N D
M AG N E T I C F I E L D C O N S T R A I N T S
The main goal of this section is to extract the values of the physicalparameters to be used in the model calculations of Sections 4–6.The region of the physical parameters (in particular of B) is con-strained by comparing the model expected and observed trends ofthe synchrotron power of GRHs with the mass (and temperature) ofthe parent clusters. As already discussed (Section 2), it is unlikelythat the observed correlations are driven by selection effects; how-ever, it cannot be excluded that the detailed shape and scatter ofthese correlations might somewhat change with improved statistics,especially at low X-ray luminosities.
C© 2006 The Authors. Journal compilation C© 2006 RAS, MNRAS 369, 1577–1595
Statistics of GRHs from reacceleration models 1583
3.1 Radio power–cluster mass correlation
Cassano & Brunetti (2005) derived an expected trend between thebolometric radio power, PR, and the virial cluster’s mass and/ortemperature. In the case of the GRHs, the mergers which mainlycontribute to the injection of turbulence in the ICM are those withrs � RH, rs being the stripping radius of the infalling subcluster (seesection 6 in CB05). It can be shown that, as a first approximation,the expected scaling PR–Mv is given by:
PR ∝ M2−�v B2 ne(
B2 + B2cmb
)2 , (9)
where B is the rms magnetic field strength in the radio halo vol-ume (particle pitch angle isotropitazion is assumed), Bcmb = 3.2(1 + z)2 μG is the equivalent magnetic field strength of the cosmicmicrowave background (CMB) and ne is the number density of rel-ativistic electrons in the volume of the GRH. The parameter � isdefined by T ∝ M�; we consider � � 2/3 (virial scaling) and � �0.56 (e.g. Nevalainen, Markevitch & Forman 2000).
In this paper, we release the assumption adopted in CB05 of amagnetic field independent of cluster mass and assume that the rmsfield in the emitting volume scales as B = B〈M〉(M/〈M〉)b, with b >
0 and B〈M〉 the value of the rms magnetic field associated to a clusterwith mass equal to the mean mass 〈M〉 of the clusters sample. Ascaling of the magnetic field intensity with the cluster mass is indeedfound in numerical cosmological magnetohydrodynamics (MHD)simulations (e.g. Dolag, Bartelmann & Lesch 2002; Dolag et al.2004). Dolag et al. (2002) found a scaling B ∝ T2 that would meanB ∝ M1.33 assuming the virial scaling or B ∝ M1.12 for � � 0.56.
We assume that the number density of the relativistic electrons ingalaxy clusters, ne, does not depend on cluster mass. This is becausethere is no straightforward physical reason to believe that this valueshould scale systematically with Mv, and since only a relatively fastscaling of ne with mass would significantly affect the radio power–mass trend (equation 9). It is indeed more likely that ne may changefrom cluster to cluster, but that the major effect would simply be todrive some scattering on the PR–Mv trend (equation 9).
Given these assumptions equation (9) becomes:
PR ∝ M2−�v B2
〈M〉(Mv/〈M〉)2b[B2
〈M〉(Mv/〈M〉)2 b + B2cmb
]2 , (10)
which has two asymptotic behaviours: P R ∝ M2−�+2bv for B〈M〉 �
Bcmb and P R ∝ M2−�−2bv for B〈M〉 � Bcmb. The observed correlations
derived in Section 2 involve the monochromatic radio power at 1.4GHz. How this monochromatic radio power can be scaled to PR
depends on the spectrum of radio haloes. In the context of particleacceleration models (e.g. Brunetti et al. 2001; Ohno, Takizawa &Shibata 2002; Kuo et al. 2003), the spectrum of radio haloes is givenby the superposition of spectra emitted from regions in the emittingvolume with different magnetic field strengths. It is expected toreach a peak at ν b and then gradually drop as a power law whichshould further steepen at higher frequencies. The break frequencycan be expressed as a function of the cluster mass and of the rmsfield B in the emitting volume (CB05):
νb ∝ M2−� B η2t(
B2 + B2cmb
)2 , (11)
If we adopt a power-law spectrum extending from the frequencyof the peak to a few GHz, P(ν) ∝ ν−a, PR and the monochromaticradio power at a fixed frequency ν o(ν o � ν b) scale as P(ν o)/PR ∝
(ν b/ν o)a−1. This depends on the cluster mass (equation 11):
P(νo)
PR∝ Mv
(a−1)(2−�+b)[B2
〈M〉(Mv/〈M〉)2b + B2cmb
]2(a−1) , (12)
thus in the case B � Bcmb one has P(ν o)/P R ∝ (M/〈M〉)(a−1)(2−�+b),while in the case B � Bcmb one has P(ν o)/PR ∝ (M/〈M〉)(a−1)(2−�−3b),which means that for B � Bcmb the P(ν o)–M trend is steeper thanthe PR–M, while the opposite happens in the case B � Bcmb (thetwo scaling should be equal for continuity for B ∼ Bcmb). On theother hand, the trends of P(ν o)/PR with the cluster mass in massivegalaxy clusters is rather weak because the observed radio spectralindex between 327 and 1400 MHz is a ∼ 1.2 (e.g. Feretti 2003)and because B in the most massive objects is probably close toBcmb (Section 3.3, Fig. 7; Govoni & Feretti 2004). Thus, in orderto compare the model expectations with the observations, we willsafely assume the same scaling for monochromatic and total radiopower.
In order to have a prompt comparison with observations, we cal-culate the slope αM of the P1.4–M correlation between two pointsas:
αM = log(P1/P2)
log(M1/M2). (13)
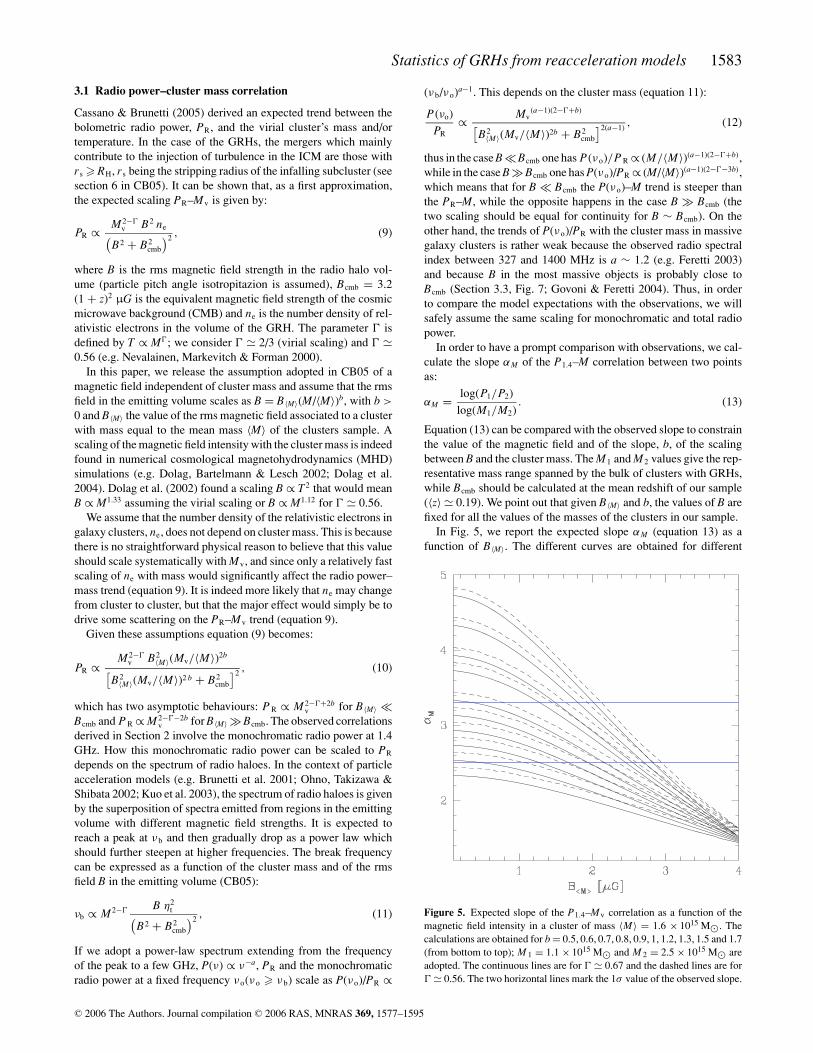
Equation (13) can be compared with the observed slope to constrainthe value of the magnetic field and of the slope, b, of the scalingbetween B and the cluster mass. The M1 and M2 values give the rep-resentative mass range spanned by the bulk of clusters with GRHs,while Bcmb should be calculated at the mean redshift of our sample(〈z〉 � 0.19). We point out that given B〈M〉 and b, the values of B arefixed for all the values of the masses of the clusters in our sample.
In Fig. 5, we report the expected slope αM (equation 13) as afunction of B〈M〉. The different curves are obtained for different
Figure 5. Expected slope of the P1.4–Mv correlation as a function of themagnetic field intensity in a cluster of mass 〈M〉 = 1.6 × 10¹⁵ M�. Thecalculations are obtained for b = 0.5, 0.6, 0.7, 0.8, 0.9, 1, 1.2, 1.3, 1.5 and 1.7(from bottom to top); M 1 = 1.1 × 10¹⁵ M� and M 2 = 2.5 × 10¹⁵ M� areadopted. The continuous lines are for � � 0.67 and the dashed lines are for� � 0.56. The two horizontal lines mark the 1σ value of the observed slope.
C© 2006 The Authors. Journal compilation C© 2006 RAS, MNRAS 369, 1577–1595
1584 R. Cassano, G. Brunetti and G. Setti
scaling laws of the magnetic field with the cluster mass (b = 0.5–1.7, see caption). Dashed lines refer to � � 0.56 and solid lines tothe virial case. The two blue horizontal lines (Fig. 5) indicate therange of the observed slope (αM = 2.9 ± 0.4).
Fig. 5 shows that there are values of B〈M〉 and b for which the ex-pected slope is consistent with the observed one. As a first result, wefind that with increasing b the values of B〈M〉 should increase in orderto match the observations (e.g. b ∼ 0.6 requires B〈M〉 ∼ 0.2 − 1.4 μGwhile b ∼ 1.7 requires B〈M〉 ∼ 2–3 μG). Finally, the asymptotic be-haviour of equation (10), combined with the observed correlation(equation 8) allows to immediately constrain b: for B〈M〉 � Bcmb
one has 0.58(0.53) < b < 0.98(0.93) for the virial (non-virial) case,whereas in the case of B〈M〉 � Bcmb the model expectations cannotbe reconciled with the observations.
3.2 Radio power–cluster temperature correlation
Since the temperature is related to the cluster mass, the radio power–mass correlation also implies a correlation between synchrotronradio power and cluster temperature. Thus, in order to maximize theobservational constraints, an analysis similar to that of Section 3.1can also be done for the radio power–temperature correlation (PR–T). Combining equation (10) with the M–T scaling law (T ∝ M2/3
for the virial case and T ∝ M0.56), one has:
PR ∝ T (2/�)−1 B2〈M〉 (T /〈T 〉)2 bT[
B2〈M〉(T /〈T 〉)2 bT + B2
cmb
]2 , (14)
where bT = b/� with � � 2/3 (virial case) or � � 0.56 (non-virialcase). The asymptotic behaviours of equation (14) are given by PR ∝T2/�−1+2bT (B〈M〉 � Bcmb) and P R ∝ M2�−1−2bT
v (B〈M〉 � B cmb).As in Section 3.1, here we can adopt the same scaling with T
for both PR and P1.4 and compare the values of the expected slopewith those of the observed one. We can calculate the slope αT of theP1.4–T correlation between two points as:
αT = log(P1/P2)
log(T1/T2), (15)
where T 1 and T 2 define the interval of temperature of our sample,〈T〉 = 8 keV is the mean temperature, and Bcmb is evaluated at 〈z〉 �0.19. In Fig. 6, we report the slope αT of the P1.4–T correlation asa function of the magnetic field strength in an average cluster, B〈M〉.The different curves are obtained for different scaling laws of thecluster magnetic fields with mass (i.e. temperature) (b = 0.5–1.7).Dashed lines are for � � 0.65 and continuous lines are for the virialcase.
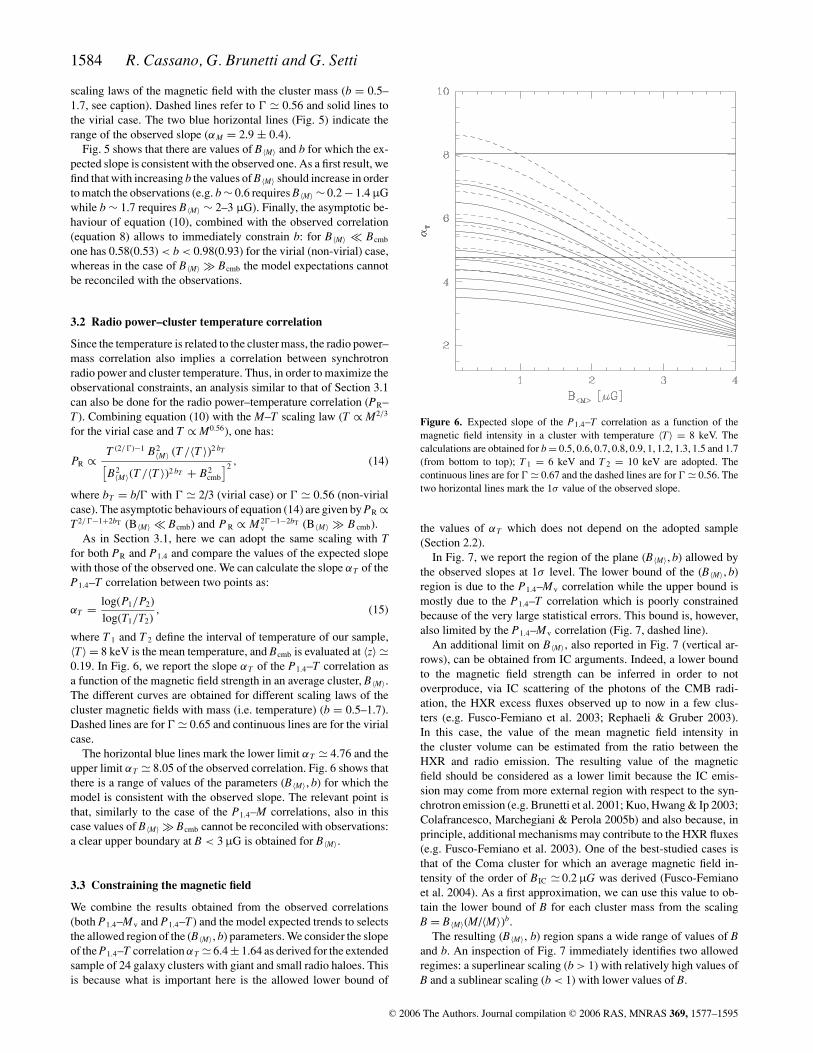
The horizontal blue lines mark the lower limit αT � 4.76 and theupper limit αT � 8.05 of the observed correlation. Fig. 6 shows thatthere is a range of values of the parameters (B〈M〉, b) for which themodel is consistent with the observed slope. The relevant point isthat, similarly to the case of the P1.4–M correlations, also in thiscase values of B〈M〉 � Bcmb cannot be reconciled with observations:a clear upper boundary at B < 3 μG is obtained for B〈M〉.
3.3 Constraining the magnetic field
We combine the results obtained from the observed correlations(both P1.4–Mv and P1.4–T) and the model expected trends to selectsthe allowed region of the (B〈M〉, b) parameters. We consider the slopeof the P1.4–T correlation αT � 6.4 ± 1.64 as derived for the extendedsample of 24 galaxy clusters with giant and small radio haloes. Thisis because what is important here is the allowed lower bound of
Figure 6. Expected slope of the P1.4–T correlation as a function of themagnetic field intensity in a cluster with temperature 〈T〉 = 8 keV. Thecalculations are obtained for b = 0.5, 0.6, 0.7, 0.8, 0.9, 1, 1.2, 1.3, 1.5 and 1.7(from bottom to top); T 1 = 6 keV and T 2 = 10 keV are adopted. Thecontinuous lines are for � � 0.67 and the dashed lines are for � � 0.56. Thetwo horizontal lines mark the 1σ value of the observed slope.
the values of αT which does not depend on the adopted sample(Section 2.2).
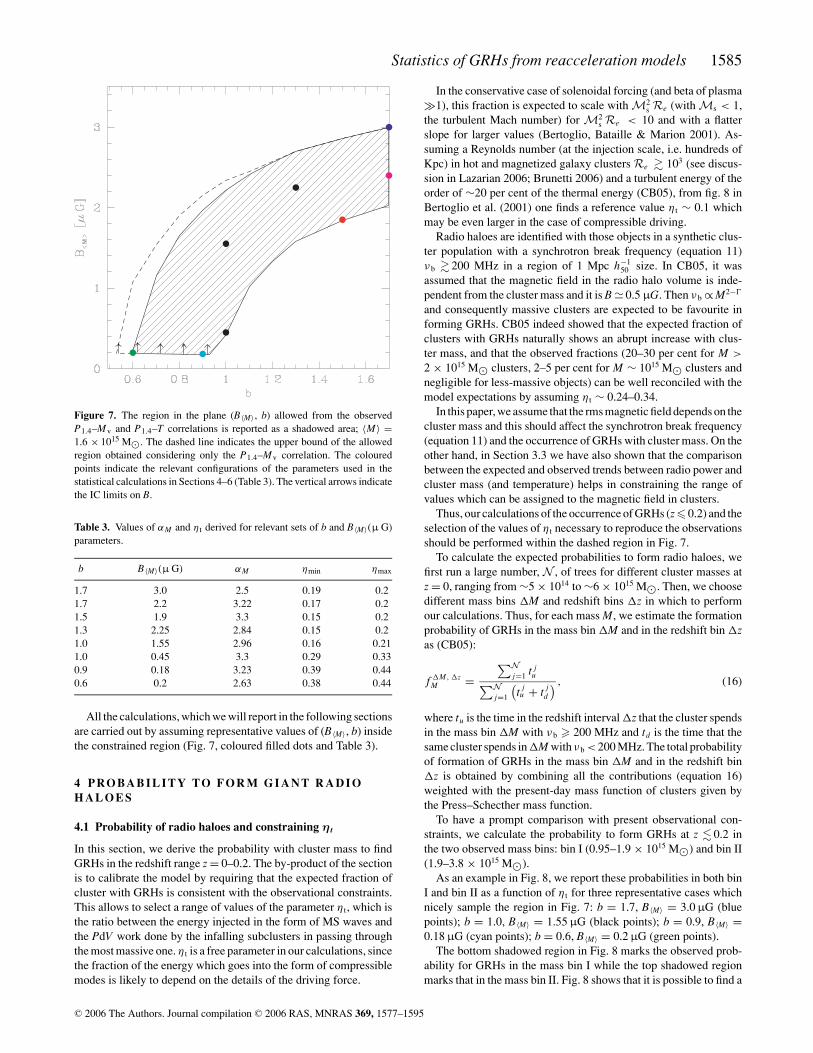
In Fig. 7, we report the region of the plane (B〈M〉, b) allowed bythe observed slopes at 1σ level. The lower bound of the (B〈M〉, b)region is due to the P1.4–Mv correlation while the upper bound ismostly due to the P1.4–T correlation which is poorly constrainedbecause of the very large statistical errors. This bound is, however,also limited by the P1.4–Mv correlation (Fig. 7, dashed line).
An additional limit on B〈M〉, also reported in Fig. 7 (vertical ar-rows), can be obtained from IC arguments. Indeed, a lower boundto the magnetic field strength can be inferred in order to notoverproduce, via IC scattering of the photons of the CMB radi-ation, the HXR excess fluxes observed up to now in a few clus-ters (e.g. Fusco-Femiano et al. 2003; Rephaeli & Gruber 2003).In this case, the value of the mean magnetic field intensity inthe cluster volume can be estimated from the ratio between theHXR and radio emission. The resulting value of the magneticfield should be considered as a lower limit because the IC emis-sion may come from more external region with respect to the syn-chrotron emission (e.g. Brunetti et al. 2001; Kuo, Hwang & Ip 2003;Colafrancesco, Marchegiani & Perola 2005b) and also because, inprinciple, additional mechanisms may contribute to the HXR fluxes(e.g. Fusco-Femiano et al. 2003). One of the best-studied cases isthat of the Coma cluster for which an average magnetic field in-tensity of the order of BIC � 0.2 μG was derived (Fusco-Femianoet al. 2004). As a first approximation, we can use this value to ob-tain the lower bound of B for each cluster mass from the scalingB = B〈M〉(M/〈M〉)b.
The resulting (B〈M〉, b) region spans a wide range of values of Band b. An inspection of Fig. 7 immediately identifies two allowedregimes: a superlinear scaling (b > 1) with relatively high values ofB and a sublinear scaling (b < 1) with lower values of B.
C© 2006 The Authors. Journal compilation C© 2006 RAS, MNRAS 369, 1577–1595
Statistics of GRHs from reacceleration models 1585
Figure 7. The region in the plane (B〈M〉, b) allowed from the observedP1.4–Mv and P1.4–T correlations is reported as a shadowed area; 〈M〉 =1.6 × 10¹⁵ M�. The dashed line indicates the upper bound of the allowedregion obtained considering only the P1.4–Mv correlation. The colouredpoints indicate the relevant configurations of the parameters used in thestatistical calculations in Sections 4–6 (Table 3). The vertical arrows indicatethe IC limits on B.
Table 3. Values of αM and η t derived for relevant sets of b and B〈M〉(μ G)parameters.
b B〈M〉(μ G) αM ηmin ηmax
1.7 3.0 2.5 0.19 0.21.7 2.2 3.22 0.17 0.21.5 1.9 3.3 0.15 0.21.3 2.25 2.84 0.15 0.21.0 1.55 2.96 0.16 0.211.0 0.45 3.3 0.29 0.330.9 0.18 3.23 0.39 0.440.6 0.2 2.63 0.38 0.44
All the calculations, which we will report in the following sectionsare carried out by assuming representative values of (B〈M〉, b) insidethe constrained region (Fig. 7, coloured filled dots and Table 3).
4 P RO BA B I L I T Y TO F O R M G I A N T R A D I O
H A L O E S
4.1 Probability of radio haloes and constraining η t
In this section, we derive the probability with cluster mass to findGRHs in the redshift range z = 0–0.2. The by-product of the sectionis to calibrate the model by requiring that the expected fraction ofcluster with GRHs is consistent with the observational constraints.This allows to select a range of values of the parameter η t, which isthe ratio between the energy injected in the form of MS waves andthe PdV work done by the infalling subclusters in passing throughthe most massive one. η t is a free parameter in our calculations, sincethe fraction of the energy which goes into the form of compressiblemodes is likely to depend on the details of the driving force.
In the conservative case of solenoidal forcing (and beta of plasma�1), this fraction is expected to scale with M2
s Re (with Ms < 1,the turbulent Mach number) for M2
s Re < 10 and with a flatterslope for larger values (Bertoglio, Bataille & Marion 2001). As-suming a Reynolds number (at the injection scale, i.e. hundreds ofKpc) in hot and magnetized galaxy clusters Re � 103 (see discus-sion in Lazarian 2006; Brunetti 2006) and a turbulent energy of theorder of ∼20 per cent of the thermal energy (CB05), from fig. 8 inBertoglio et al. (2001) one finds a reference value η t ∼ 0.1 whichmay be even larger in the case of compressible driving.
Radio haloes are identified with those objects in a synthetic clus-ter population with a synchrotron break frequency (equation 11)ν b � 200 MHz in a region of 1 Mpc h−1
50 size. In CB05, it wasassumed that the magnetic field in the radio halo volume is inde-pendent from the cluster mass and it is B � 0.5 μG. Then ν b ∝ M2−�
and consequently massive clusters are expected to be favourite informing GRHs. CB05 indeed showed that the expected fraction ofclusters with GRHs naturally shows an abrupt increase with clus-ter mass, and that the observed fractions (20–30 per cent for M >
2 × 10¹⁵ M� clusters, 2–5 per cent for M ∼ 1015 M� clusters andnegligible for less-massive objects) can be well reconciled with themodel expectations by assuming η t ∼ 0.24–0.34.
In this paper, we assume that the rms magnetic field depends on thecluster mass and this should affect the synchrotron break frequency(equation 11) and the occurrence of GRHs with cluster mass. On theother hand, in Section 3.3 we have also shown that the comparisonbetween the expected and observed trends between radio power andcluster mass (and temperature) helps in constraining the range ofvalues which can be assigned to the magnetic field in clusters.
Thus, our calculations of the occurrence of GRHs (z� 0.2) and theselection of the values of η t necessary to reproduce the observationsshould be performed within the dashed region in Fig. 7.
To calculate the expected probabilities to form radio haloes, wefirst run a large number, N , of trees for different cluster masses atz = 0, ranging from ∼5 × 10¹⁴ to ∼6 × 10¹⁵ M�. Then, we choosedifferent mass bins �M and redshift bins �z in which to performour calculations. Thus, for each mass M, we estimate the formationprobability of GRHs in the mass bin �M and in the redshift bin �zas (CB05):
f �M, �zM =
∑Nj=1 t j
u∑Nj=1
(t ju + t j
d
) , (16)
where tu is the time in the redshift interval �z that the cluster spendsin the mass bin �M with ν b � 200 MHz and td is the time that thesame cluster spends in�M with ν b <200 MHz. The total probabilityof formation of GRHs in the mass bin �M and in the redshift bin�z is obtained by combining all the contributions (equation 16)weighted with the present-day mass function of clusters given bythe Press–Schecther mass function.
To have a prompt comparison with present observational con-straints, we calculate the probability to form GRHs at z � 0.2 inthe two observed mass bins: bin I (0.95–1.9 × 10¹⁵ M�) and bin II(1.9–3.8 × 10¹⁵ M�).
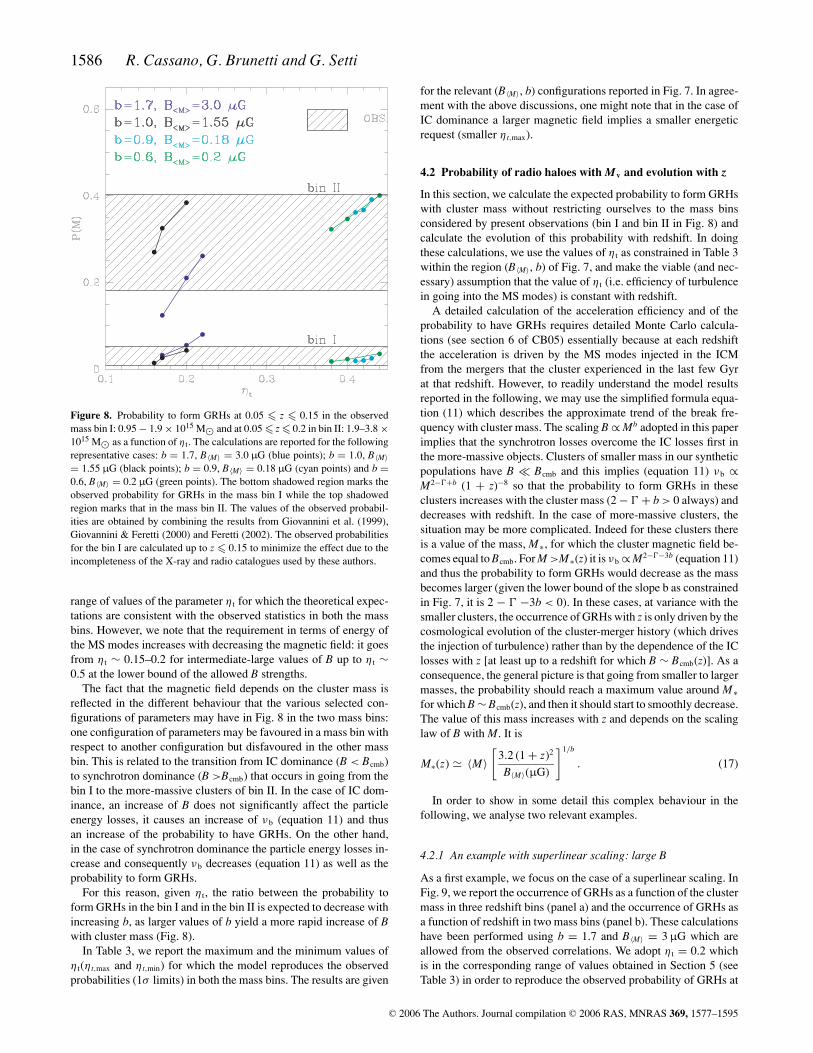
As an example in Fig. 8, we report these probabilities in both binI and bin II as a function of η t for three representative cases whichnicely sample the region in Fig. 7: b = 1.7, B〈M〉 = 3.0 μG (bluepoints); b = 1.0, B〈M〉 = 1.55 μG (black points); b = 0.9, B〈M〉 =0.18 μG (cyan points); b = 0.6, B〈M〉 = 0.2 μG (green points).
The bottom shadowed region in Fig. 8 marks the observed prob-ability for GRHs in the mass bin I while the top shadowed regionmarks that in the mass bin II. Fig. 8 shows that it is possible to find a
C© 2006 The Authors. Journal compilation C© 2006 RAS, MNRAS 369, 1577–1595
1586 R. Cassano, G. Brunetti and G. Setti
Figure 8. Probability to form GRHs at 0.05 � z � 0.15 in the observedmass bin I: 0.95 − 1.9 × 10¹⁵ M� and at 0.05 � z � 0.2 in bin II: 1.9–3.8 ×10¹⁵ M� as a function of η t. The calculations are reported for the followingrepresentative cases: b = 1.7, B〈M〉 = 3.0 μG (blue points); b = 1.0, B〈M〉= 1.55 μG (black points); b = 0.9, B〈M〉 = 0.18 μG (cyan points) and b =0.6, B〈M〉 = 0.2 μG (green points). The bottom shadowed region marks theobserved probability for GRHs in the mass bin I while the top shadowedregion marks that in the mass bin II. The values of the observed probabil-ities are obtained by combining the results from Giovannini et al. (1999),Giovannini & Feretti (2000) and Feretti (2002). The observed probabilitiesfor the bin I are calculated up to z � 0.15 to minimize the effect due to theincompleteness of the X-ray and radio catalogues used by these authors.
range of values of the parameter η t for which the theoretical expec-tations are consistent with the observed statistics in both the massbins. However, we note that the requirement in terms of energy ofthe MS modes increases with decreasing the magnetic field: it goesfrom η t ∼ 0.15–0.2 for intermediate-large values of B up to η t ∼0.5 at the lower bound of the allowed B strengths.
The fact that the magnetic field depends on the cluster mass isreflected in the different behaviour that the various selected con-figurations of parameters may have in Fig. 8 in the two mass bins:one configuration of parameters may be favoured in a mass bin withrespect to another configuration but disfavoured in the other massbin. This is related to the transition from IC dominance (B < Bcmb)to synchrotron dominance (B >Bcmb) that occurs in going from thebin I to the more-massive clusters of bin II. In the case of IC dom-inance, an increase of B does not significantly affect the particleenergy losses, it causes an increase of ν b (equation 11) and thusan increase of the probability to have GRHs. On the other hand,in the case of synchrotron dominance the particle energy losses in-crease and consequently ν b decreases (equation 11) as well as theprobability to form GRHs.
For this reason, given η t, the ratio between the probability toform GRHs in the bin I and in the bin II is expected to decrease withincreasing b, as larger values of b yield a more rapid increase of Bwith cluster mass (Fig. 8).
In Table 3, we report the maximum and the minimum values ofη t(η t,max and η t,min) for which the model reproduces the observedprobabilities (1σ limits) in both the mass bins. The results are given
for the relevant (B〈M〉, b) configurations reported in Fig. 7. In agree-ment with the above discussions, one might note that in the case ofIC dominance a larger magnetic field implies a smaller energeticrequest (smaller η t,max).
4.2 Probability of radio haloes with Mv and evolution with z
In this section, we calculate the expected probability to form GRHswith cluster mass without restricting ourselves to the mass binsconsidered by present observations (bin I and bin II in Fig. 8) andcalculate the evolution of this probability with redshift. In doingthese calculations, we use the values of η t as constrained in Table 3within the region (B〈M〉, b) of Fig. 7, and make the viable (and nec-essary) assumption that the value of η t (i.e. efficiency of turbulencein going into the MS modes) is constant with redshift.
A detailed calculation of the acceleration efficiency and of theprobability to have GRHs requires detailed Monte Carlo calcula-tions (see section 6 of CB05) essentially because at each redshiftthe acceleration is driven by the MS modes injected in the ICMfrom the mergers that the cluster experienced in the last few Gyrat that redshift. However, to readily understand the model resultsreported in the following, we may use the simplified formula equa-tion (11) which describes the approximate trend of the break fre-quency with cluster mass. The scaling B ∝ Mb adopted in this paperimplies that the synchrotron losses overcome the IC losses first inthe more-massive objects. Clusters of smaller mass in our syntheticpopulations have B � Bcmb and this implies (equation 11) ν b ∝M2−�+b (1 + z)−8 so that the probability to form GRHs in theseclusters increases with the cluster mass (2 − � + b > 0 always) anddecreases with redshift. In the case of more-massive clusters, thesituation may be more complicated. Indeed for these clusters thereis a value of the mass, M∗, for which the cluster magnetic field be-comes equal to Bcmb. For M >M∗(z) it is ν b ∝ M2−�−3b (equation 11)and thus the probability to form GRHs would decrease as the massbecomes larger (given the lower bound of the slope b as constrainedin Fig. 7, it is 2 − � −3b < 0). In these cases, at variance with thesmaller clusters, the occurrence of GRHs with z is only driven by thecosmological evolution of the cluster-merger history (which drivesthe injection of turbulence) rather than by the dependence of the IClosses with z [at least up to a redshift for which B ∼ Bcmb(z)]. As aconsequence, the general picture is that going from smaller to largermasses, the probability should reach a maximum value around M∗for which B ∼ Bcmb(z), and then it should start to smoothly decrease.The value of this mass increases with z and depends on the scalinglaw of B with M. It is
M∗(z) � 〈M〉[
3.2 (1 + z)2
B〈M〉(μG)
]1/b
. (17)
In order to show in some detail this complex behaviour in thefollowing, we analyse two relevant examples.
4.2.1 An example with superlinear scaling: large B
As a first example, we focus on the case of a superlinear scaling. InFig. 9, we report the occurrence of GRHs as a function of the clustermass in three redshift bins (panel a) and the occurrence of GRHs asa function of redshift in two mass bins (panel b). These calculationshave been performed using b = 1.7 and B〈M〉 = 3 μG which areallowed from the observed correlations. We adopt η t = 0.2 whichis in the corresponding range of values obtained in Section 5 (seeTable 3) in order to reproduce the observed probability of GRHs at
C© 2006 The Authors. Journal compilation C© 2006 RAS, MNRAS 369, 1577–1595
Statistics of GRHs from reacceleration models 1587
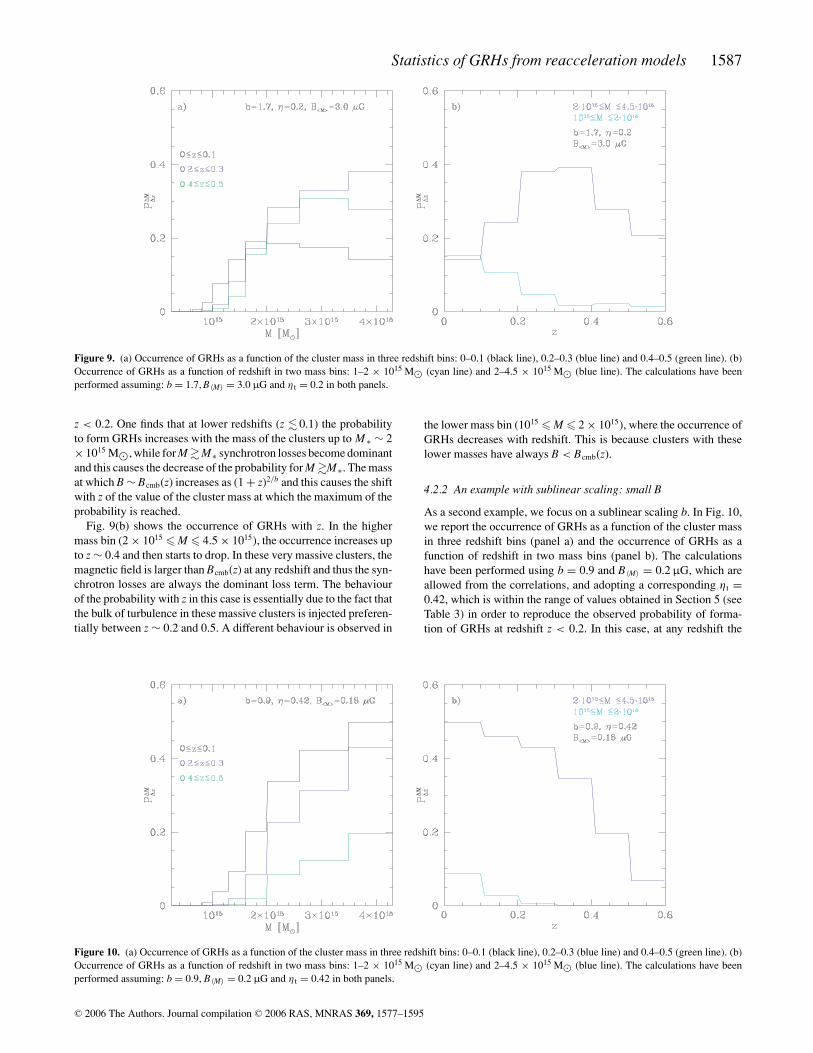
Figure 9. (a) Occurrence of GRHs as a function of the cluster mass in three redshift bins: 0–0.1 (black line), 0.2–0.3 (blue line) and 0.4–0.5 (green line). (b)Occurrence of GRHs as a function of redshift in two mass bins: 1–2 × 10¹⁵ M� (cyan line) and 2–4.5 × 10¹⁵ M� (blue line). The calculations have beenperformed assuming: b = 1.7, B〈M〉 = 3.0 μG and η t = 0.2 in both panels.
z < 0.2. One finds that at lower redshifts (z � 0.1) the probabilityto form GRHs increases with the mass of the clusters up to M ∗ ∼ 2× 10¹⁵ M�, while for M � M∗ synchrotron losses become dominantand this causes the decrease of the probability for M �M∗. The massat which B ∼ Bcmb(z) increases as (1 + z)2/b and this causes the shiftwith z of the value of the cluster mass at which the maximum of theprobability is reached.
Fig. 9(b) shows the occurrence of GRHs with z. In the highermass bin (2 × 10¹⁵ � M � 4.5 × 10¹⁵), the occurrence increases upto z ∼ 0.4 and then starts to drop. In these very massive clusters, themagnetic field is larger than Bcmb(z) at any redshift and thus the syn-chrotron losses are always the dominant loss term. The behaviourof the probability with z in this case is essentially due to the fact thatthe bulk of turbulence in these massive clusters is injected preferen-tially between z ∼ 0.2 and 0.5. A different behaviour is observed in
Figure 10. (a) Occurrence of GRHs as a function of the cluster mass in three redshift bins: 0–0.1 (black line), 0.2–0.3 (blue line) and 0.4–0.5 (green line). (b)Occurrence of GRHs as a function of redshift in two mass bins: 1–2 × 10¹⁵ M� (cyan line) and 2–4.5 × 10¹⁵ M� (blue line). The calculations have beenperformed assuming: b = 0.9, B〈M〉 = 0.2 μG and η t = 0.42 in both panels.
the lower mass bin (1015 � M � 2 × 10¹⁵), where the occurrence ofGRHs decreases with redshift. This is because clusters with theselower masses have always B < Bcmb(z).
4.2.2 An example with sublinear scaling: small B
As a second example, we focus on a sublinear scaling b. In Fig. 10,we report the occurrence of GRHs as a function of the cluster massin three redshift bins (panel a) and the occurrence of GRHs as afunction of redshift in two mass bins (panel b). The calculationshave been performed using b = 0.9 and B〈M〉 = 0.2 μG, which areallowed from the correlations, and adopting a corresponding η t =0.42, which is within the range of values obtained in Section 5 (seeTable 3) in order to reproduce the observed probability of forma-tion of GRHs at redshift z < 0.2. In this case, at any redshift the
C© 2006 The Authors. Journal compilation C© 2006 RAS, MNRAS 369, 1577–1595
1588 R. Cassano, G. Brunetti and G. Setti
probability to form GRHs increases with the mass of the clusters. In-deed, the magnetic field in these clusters is always B � Bcmb(z) (forall redshifts and masses) and the IC losses are always the dominantloss term. In addition, as expected, in both the considered mass binsthe probability to form GRHs decreases as a function of redshift,due to the increase of the IC losses (Fig. 10, panel b).
5 L U M I N O S I T Y F U N C T I O N S O F G I A N T
R A D I O H A L O E S
In this section, we derive the expected luminosity functions of giantradio haloes (RHLFs). Calculations for the RHLFs are carried outwithin the (B〈M〉, b) region of Fig. 7 by adopting the correspondingvalues of η t which allow to match the GRH occurrence at z < 0.2.First, we use the probability P�M
�z to form GRHs with the clustermass to estimate the mass functions of GRHs (dN H(z)/d M d V):
dNH(z)
dM dV= dNcl(z)
dM dV× P�M
�z = nPS × P�M�z , (18)
where nPS = nPS(M, z) is the Press–Schechter mass function whosenormalization depends essentially by σ 8 (present-day rms densityfluctuation on a scale of 8 h−1 Mpc) and �m,o; we use σ 8 = 0.9 in a�m,o = 0.3 Universe. We stress that we use nPS since our model isbased on the Press–Schechter formalism.
The RHLF is thus given by:
dNH(z)
dV dP1.4= dNH(z)/dM dV
dP1.4/dM. (19)
d P1.4/d M depends on the adopted (B〈M〉, b), since each allowed con-figuration in Fig. 7 selects a value of the slope of P1.4–Mv (e.g. Ta-ble 3) which is consistent (at 1σ ) with the value of the observedslope obtained with present observations (αM = 2.9 ± 0.4; see Sec-tion 3). In particular from Fig. 5 one has that, for a given b, largervalues of the magnetic field select smaller values of the slope of theP1.4–Mv correlation (and vice versa).
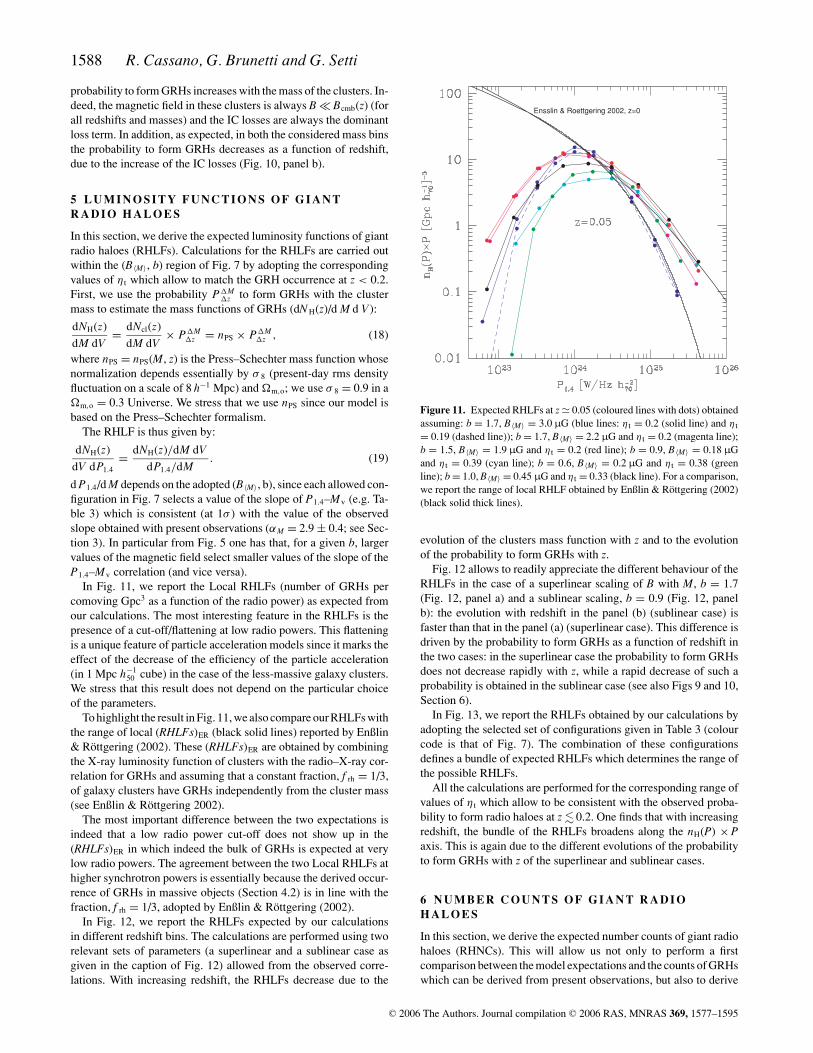
In Fig. 11, we report the Local RHLFs (number of GRHs percomoving Gpc3 as a function of the radio power) as expected fromour calculations. The most interesting feature in the RHLFs is thepresence of a cut-off/flattening at low radio powers. This flatteningis a unique feature of particle acceleration models since it marks theeffect of the decrease of the efficiency of the particle acceleration(in 1 Mpc h−1
50 cube) in the case of the less-massive galaxy clusters.We stress that this result does not depend on the particular choiceof the parameters.
To highlight the result in Fig. 11, we also compare our RHLFs withthe range of local (RHLFs)ER (black solid lines) reported by Enßlin& Rottgering (2002). These (RHLFs)ER are obtained by combiningthe X-ray luminosity function of clusters with the radio–X-ray cor-relation for GRHs and assuming that a constant fraction, f rh = 1/3,of galaxy clusters have GRHs independently from the cluster mass(see Enßlin & Rottgering 2002).
The most important difference between the two expectations isindeed that a low radio power cut-off does not show up in the(RHLFs)ER in which indeed the bulk of GRHs is expected at verylow radio powers. The agreement between the two Local RHLFs athigher synchrotron powers is essentially because the derived occur-rence of GRHs in massive objects (Section 4.2) is in line with thefraction, f rh = 1/3, adopted by Enßlin & Rottgering (2002).
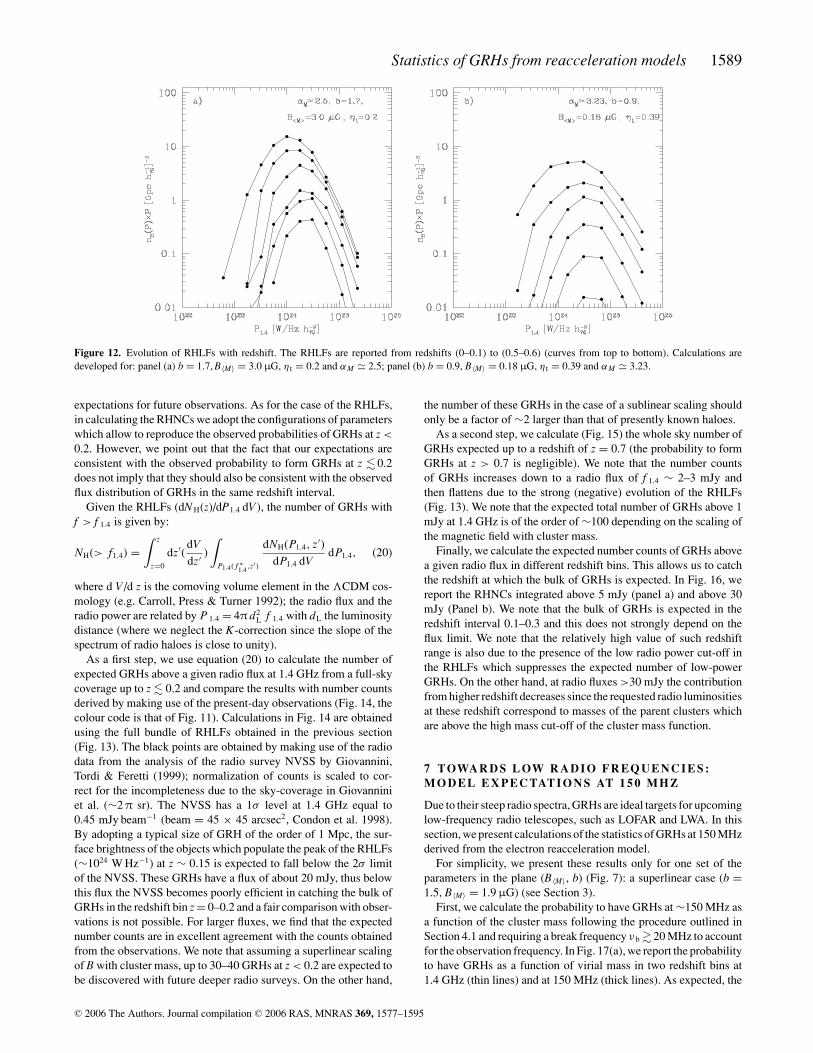
In Fig. 12, we report the RHLFs expected by our calculationsin different redshift bins. The calculations are performed using tworelevant sets of parameters (a superlinear and a sublinear case asgiven in the caption of Fig. 12) allowed from the observed corre-lations. With increasing redshift, the RHLFs decrease due to the
Ensslin & Roettgering 2002, z=0
Figure 11. Expected RHLFs at z � 0.05 (coloured lines with dots) obtainedassuming: b = 1.7, B〈M〉 = 3.0 μG (blue lines: η t = 0.2 (solid line) and η t
= 0.19 (dashed line)); b = 1.7, B〈M〉 = 2.2 μG and η t = 0.2 (magenta line);b = 1.5, B〈M〉 = 1.9 μG and η t = 0.2 (red line); b = 0.9, B〈M〉 = 0.18 μGand η t = 0.39 (cyan line); b = 0.6, B〈M〉 = 0.2 μG and η t = 0.38 (greenline); b = 1.0, B〈M〉 = 0.45 μG and η t = 0.33 (black line). For a comparison,we report the range of local RHLF obtained by Enßlin & Rottgering (2002)(black solid thick lines).
evolution of the clusters mass function with z and to the evolutionof the probability to form GRHs with z.
Fig. 12 allows to readily appreciate the different behaviour of theRHLFs in the case of a superlinear scaling of B with M, b = 1.7(Fig. 12, panel a) and a sublinear scaling, b = 0.9 (Fig. 12, panelb): the evolution with redshift in the panel (b) (sublinear case) isfaster than that in the panel (a) (superlinear case). This difference isdriven by the probability to form GRHs as a function of redshift inthe two cases: in the superlinear case the probability to form GRHsdoes not decrease rapidly with z, while a rapid decrease of such aprobability is obtained in the sublinear case (see also Figs 9 and 10,Section 6).
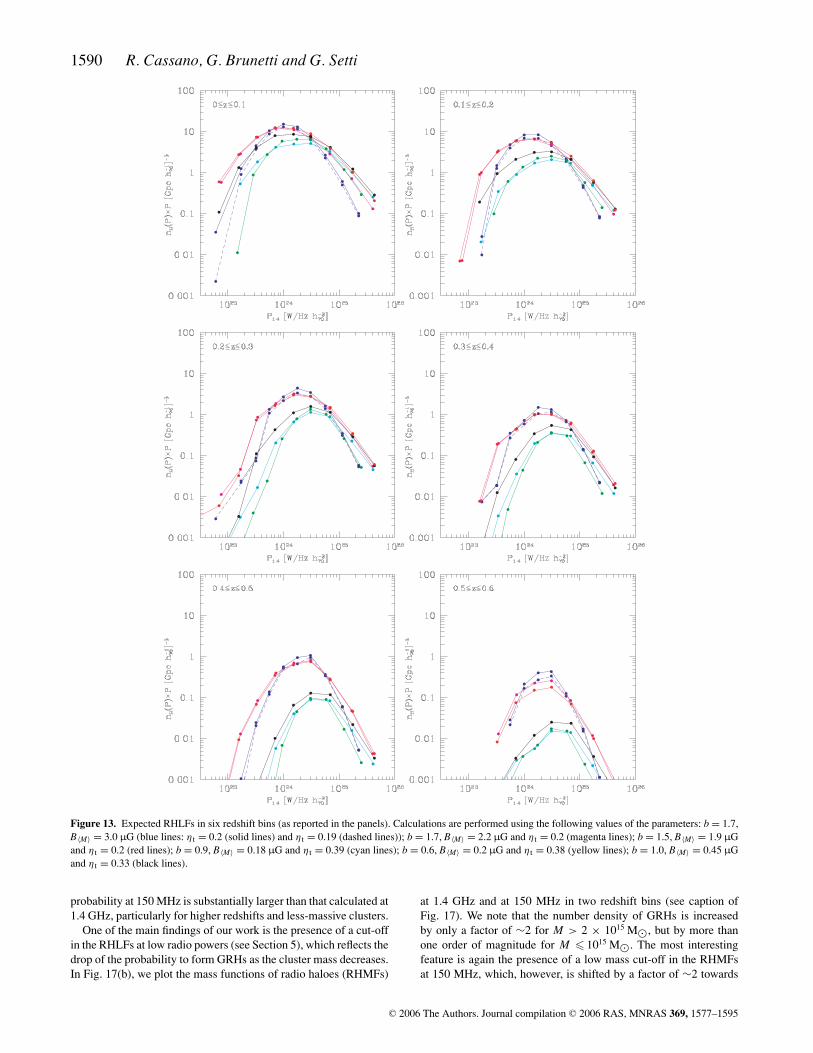
In Fig. 13, we report the RHLFs obtained by our calculations byadopting the selected set of configurations given in Table 3 (colourcode is that of Fig. 7). The combination of these configurationsdefines a bundle of expected RHLFs which determines the range ofthe possible RHLFs.
All the calculations are performed for the corresponding range ofvalues of η t which allow to be consistent with the observed proba-bility to form radio haloes at z � 0.2. One finds that with increasingredshift, the bundle of the RHLFs broadens along the nH(P) × Paxis. This is again due to the different evolutions of the probabilityto form GRHs with z of the superlinear and sublinear cases.
6 N U M B E R C O U N T S O F G I A N T R A D I O
H A L O E S
In this section, we derive the expected number counts of giant radiohaloes (RHNCs). This will allow us not only to perform a firstcomparison between the model expectations and the counts of GRHswhich can be derived from present observations, but also to derive
C© 2006 The Authors. Journal compilation C© 2006 RAS, MNRAS 369, 1577–1595
Statistics of GRHs from reacceleration models 1589
Figure 12. Evolution of RHLFs with redshift. The RHLFs are reported from redshifts (0–0.1) to (0.5–0.6) (curves from top to bottom). Calculations aredeveloped for: panel (a) b = 1.7, B〈M〉 = 3.0 μG, η t = 0.2 and αM � 2.5; panel (b) b = 0.9, B〈M〉 = 0.18 μG, η t = 0.39 and αM � 3.23.
expectations for future observations. As for the case of the RHLFs,in calculating the RHNCs we adopt the configurations of parameterswhich allow to reproduce the observed probabilities of GRHs at z <
0.2. However, we point out that the fact that our expectations areconsistent with the observed probability to form GRHs at z � 0.2does not imply that they should also be consistent with the observedflux distribution of GRHs in the same redshift interval.
Given the RHLFs (dN H(z)/dP1.4 dV), the number of GRHs withf > f 1.4 is given by:
NH(> f1.4) =∫ z
z=0
dz′(dVdz′ )
∫P1.4( f ∗
1.4,z′)
dNH(P1.4, z′)dP1.4 dV
dP1.4, (20)
where d V/d z is the comoving volume element in the �CDM cos-mology (e.g. Carroll, Press & Turner 1992); the radio flux and theradio power are related by P 1.4 = 4π d2
L f 1.4 with dL the luminositydistance (where we neglect the K-correction since the slope of thespectrum of radio haloes is close to unity).
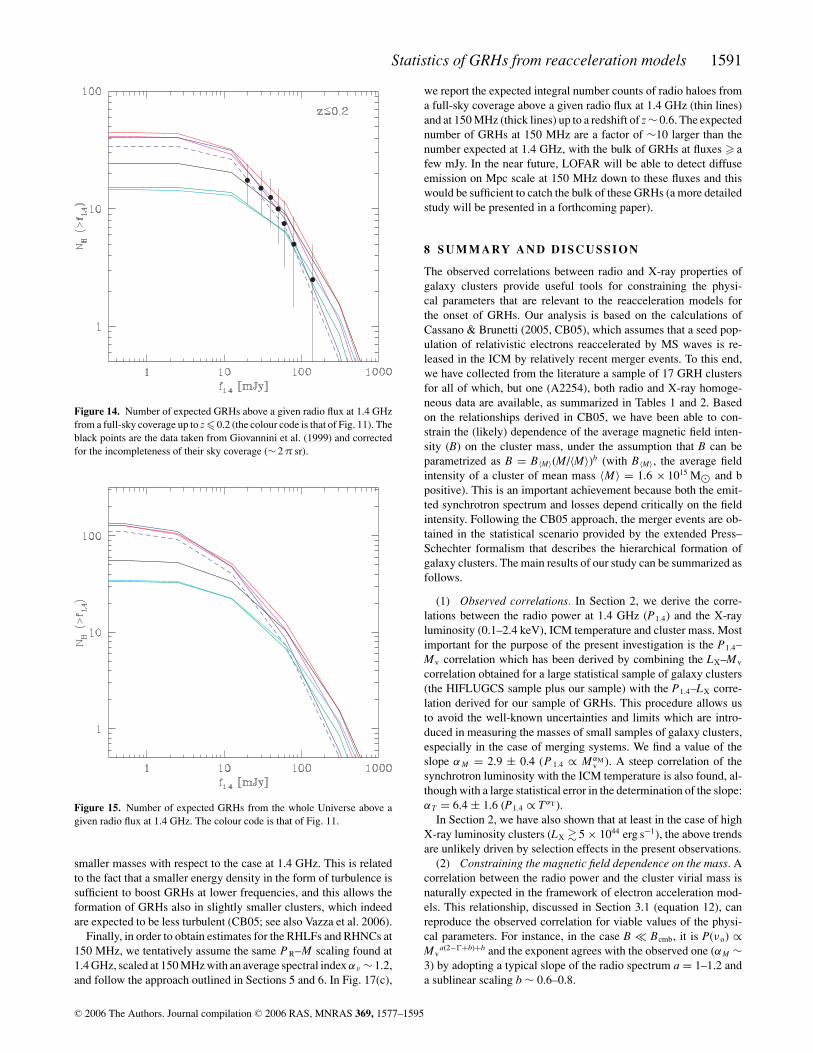
As a first step, we use equation (20) to calculate the number ofexpected GRHs above a given radio flux at 1.4 GHz from a full-skycoverage up to z � 0.2 and compare the results with number countsderived by making use of the present-day observations (Fig. 14, thecolour code is that of Fig. 11). Calculations in Fig. 14 are obtainedusing the full bundle of RHLFs obtained in the previous section(Fig. 13). The black points are obtained by making use of the radiodata from the analysis of the radio survey NVSS by Giovannini,Tordi & Feretti (1999); normalization of counts is scaled to cor-rect for the incompleteness due to the sky-coverage in Giovanniniet al. (∼2 π sr). The NVSS has a 1σ level at 1.4 GHz equal to0.45 mJy beam−1 (beam = 45 × 45 arcsec2, Condon et al. 1998).By adopting a typical size of GRH of the order of 1 Mpc, the sur-face brightness of the objects which populate the peak of the RHLFs(∼1024 W Hz−1) at z ∼ 0.15 is expected to fall below the 2σ limitof the NVSS. These GRHs have a flux of about 20 mJy, thus belowthis flux the NVSS becomes poorly efficient in catching the bulk ofGRHs in the redshift bin z = 0–0.2 and a fair comparison with obser-vations is not possible. For larger fluxes, we find that the expectednumber counts are in excellent agreement with the counts obtainedfrom the observations. We note that assuming a superlinear scalingof B with cluster mass, up to 30–40 GRHs at z < 0.2 are expected tobe discovered with future deeper radio surveys. On the other hand,
the number of these GRHs in the case of a sublinear scaling shouldonly be a factor of ∼2 larger than that of presently known haloes.
As a second step, we calculate (Fig. 15) the whole sky number ofGRHs expected up to a redshift of z = 0.7 (the probability to formGRHs at z > 0.7 is negligible). We note that the number countsof GRHs increases down to a radio flux of f 1.4 ∼ 2–3 mJy andthen flattens due to the strong (negative) evolution of the RHLFs(Fig. 13). We note that the expected total number of GRHs above 1mJy at 1.4 GHz is of the order of ∼100 depending on the scaling ofthe magnetic field with cluster mass.
Finally, we calculate the expected number counts of GRHs abovea given radio flux in different redshift bins. This allows us to catchthe redshift at which the bulk of GRHs is expected. In Fig. 16, wereport the RHNCs integrated above 5 mJy (panel a) and above 30mJy (Panel b). We note that the bulk of GRHs is expected in theredshift interval 0.1–0.3 and this does not strongly depend on theflux limit. We note that the relatively high value of such redshiftrange is also due to the presence of the low radio power cut-off inthe RHLFs which suppresses the expected number of low-powerGRHs. On the other hand, at radio fluxes >30 mJy the contributionfrom higher redshift decreases since the requested radio luminositiesat these redshift correspond to masses of the parent clusters whichare above the high mass cut-off of the cluster mass function.
7 TOWA R D S L OW R A D I O F R E QU E N C I E S :
M O D E L E X P E C TAT I O N S AT 1 5 0 M H Z
Due to their steep radio spectra, GRHs are ideal targets for upcominglow-frequency radio telescopes, such as LOFAR and LWA. In thissection, we present calculations of the statistics of GRHs at 150 MHzderived from the electron reacceleration model.
For simplicity, we present these results only for one set of theparameters in the plane (B〈M〉, b) (Fig. 7): a superlinear case (b =1.5, B〈M〉 = 1.9 μG) (see Section 3).
First, we calculate the probability to have GRHs at ∼150 MHz asa function of the cluster mass following the procedure outlined inSection 4.1 and requiring a break frequency ν b � 20 MHz to accountfor the observation frequency. In Fig. 17(a), we report the probabilityto have GRHs as a function of virial mass in two redshift bins at1.4 GHz (thin lines) and at 150 MHz (thick lines). As expected, the
C© 2006 The Authors. Journal compilation C© 2006 RAS, MNRAS 369, 1577–1595
1590 R. Cassano, G. Brunetti and G. Setti
Figure 13. Expected RHLFs in six redshift bins (as reported in the panels). Calculations are performed using the following values of the parameters: b = 1.7,B〈M〉 = 3.0 μG (blue lines: η t = 0.2 (solid lines) and η t = 0.19 (dashed lines)); b = 1.7, B〈M〉 = 2.2 μG and η t = 0.2 (magenta lines); b = 1.5, B〈M〉 = 1.9 μGand η t = 0.2 (red lines); b = 0.9, B〈M〉 = 0.18 μG and η t = 0.39 (cyan lines); b = 0.6, B〈M〉 = 0.2 μG and η t = 0.38 (yellow lines); b = 1.0, B〈M〉 = 0.45 μGand η t = 0.33 (black lines).
probability at 150 MHz is substantially larger than that calculated at1.4 GHz, particularly for higher redshifts and less-massive clusters.
One of the main findings of our work is the presence of a cut-offin the RHLFs at low radio powers (see Section 5), which reflects thedrop of the probability to form GRHs as the cluster mass decreases.In Fig. 17(b), we plot the mass functions of radio haloes (RHMFs)
at 1.4 GHz and at 150 MHz in two redshift bins (see caption ofFig. 17). We note that the number density of GRHs is increasedby only a factor of ∼2 for M > 2 × 10¹⁵ M�, but by more thanone order of magnitude for M � 1015 M�. The most interestingfeature is again the presence of a low mass cut-off in the RHMFsat 150 MHz, which, however, is shifted by a factor of ∼2 towards
C© 2006 The Authors. Journal compilation C© 2006 RAS, MNRAS 369, 1577–1595
Statistics of GRHs from reacceleration models 1591
Figure 14. Number of expected GRHs above a given radio flux at 1.4 GHzfrom a full-sky coverage up to z �0.2 (the colour code is that of Fig. 11). Theblack points are the data taken from Giovannini et al. (1999) and correctedfor the incompleteness of their sky coverage (∼ 2 π sr).
Figure 15. Number of expected GRHs from the whole Universe above agiven radio flux at 1.4 GHz. The colour code is that of Fig. 11.
smaller masses with respect to the case at 1.4 GHz. This is relatedto the fact that a smaller energy density in the form of turbulence issufficient to boost GRHs at lower frequencies, and this allows theformation of GRHs also in slightly smaller clusters, which indeedare expected to be less turbulent (CB05; see also Vazza et al. 2006).
Finally, in order to obtain estimates for the RHLFs and RHNCs at150 MHz, we tentatively assume the same P R–M scaling found at1.4 GHz, scaled at 150 MHz with an average spectral index αν ∼ 1.2,and follow the approach outlined in Sections 5 and 6. In Fig. 17(c),
we report the expected integral number counts of radio haloes froma full-sky coverage above a given radio flux at 1.4 GHz (thin lines)and at 150 MHz (thick lines) up to a redshift of z ∼ 0.6. The expectednumber of GRHs at 150 MHz are a factor of ∼10 larger than thenumber expected at 1.4 GHz, with the bulk of GRHs at fluxes � afew mJy. In the near future, LOFAR will be able to detect diffuseemission on Mpc scale at 150 MHz down to these fluxes and thiswould be sufficient to catch the bulk of these GRHs (a more detailedstudy will be presented in a forthcoming paper).
8 S U M M A RY A N D D I S C U S S I O N
The observed correlations between radio and X-ray properties ofgalaxy clusters provide useful tools for constraining the physi-cal parameters that are relevant to the reacceleration models forthe onset of GRHs. Our analysis is based on the calculations ofCassano & Brunetti (2005, CB05), which assumes that a seed pop-ulation of relativistic electrons reaccelerated by MS waves is re-leased in the ICM by relatively recent merger events. To this end,we have collected from the literature a sample of 17 GRH clustersfor all of which, but one (A2254), both radio and X-ray homoge-neous data are available, as summarized in Tables 1 and 2. Basedon the relationships derived in CB05, we have been able to con-strain the (likely) dependence of the average magnetic field inten-sity (B) on the cluster mass, under the assumption that B can beparametrized as B = B〈M〉(M/〈M〉)b (with B〈M〉, the average fieldintensity of a cluster of mean mass 〈M〉 = 1.6 × 10¹⁵ M� and bpositive). This is an important achievement because both the emit-ted synchrotron spectrum and losses depend critically on the fieldintensity. Following the CB05 approach, the merger events are ob-tained in the statistical scenario provided by the extended Press–Schechter formalism that describes the hierarchical formation ofgalaxy clusters. The main results of our study can be summarized asfollows.
(1) Observed correlations. In Section 2, we derive the corre-lations between the radio power at 1.4 GHz (P1.4) and the X-rayluminosity (0.1–2.4 keV), ICM temperature and cluster mass. Mostimportant for the purpose of the present investigation is the P1.4–Mv correlation which has been derived by combining the LX–Mv
correlation obtained for a large statistical sample of galaxy clusters(the HIFLUGCS sample plus our sample) with the P1.4–LX corre-lation derived for our sample of GRHs. This procedure allows usto avoid the well-known uncertainties and limits which are intro-duced in measuring the masses of small samples of galaxy clusters,especially in the case of merging systems. We find a value of theslope α M = 2.9 ± 0.4 (P 1.4 ∝ MαM
v ). A steep correlation of thesynchrotron luminosity with the ICM temperature is also found, al-though with a large statistical error in the determination of the slope:αT = 6.4 ± 1.6 (P1.4 ∝ TαT ).
In Section 2, we have also shown that at least in the case of highX-ray luminosity clusters (LX � 5 × 1044 erg s−1), the above trendsare unlikely driven by selection effects in the present observations.
(2) Constraining the magnetic field dependence on the mass. Acorrelation between the radio power and the cluster virial mass isnaturally expected in the framework of electron acceleration mod-els. This relationship, discussed in Section 3.1 (equation 12), canreproduce the observed correlation for viable values of the physi-cal parameters. For instance, in the case B � Bcmb, it is P(ν o) ∝Mv
a(2−�+b)+b and the exponent agrees with the observed one (αM ∼3) by adopting a typical slope of the radio spectrum a = 1–1.2 anda sublinear scaling b ∼ 0.6–0.8.
C© 2006 The Authors. Journal compilation C© 2006 RAS, MNRAS 369, 1577–1595
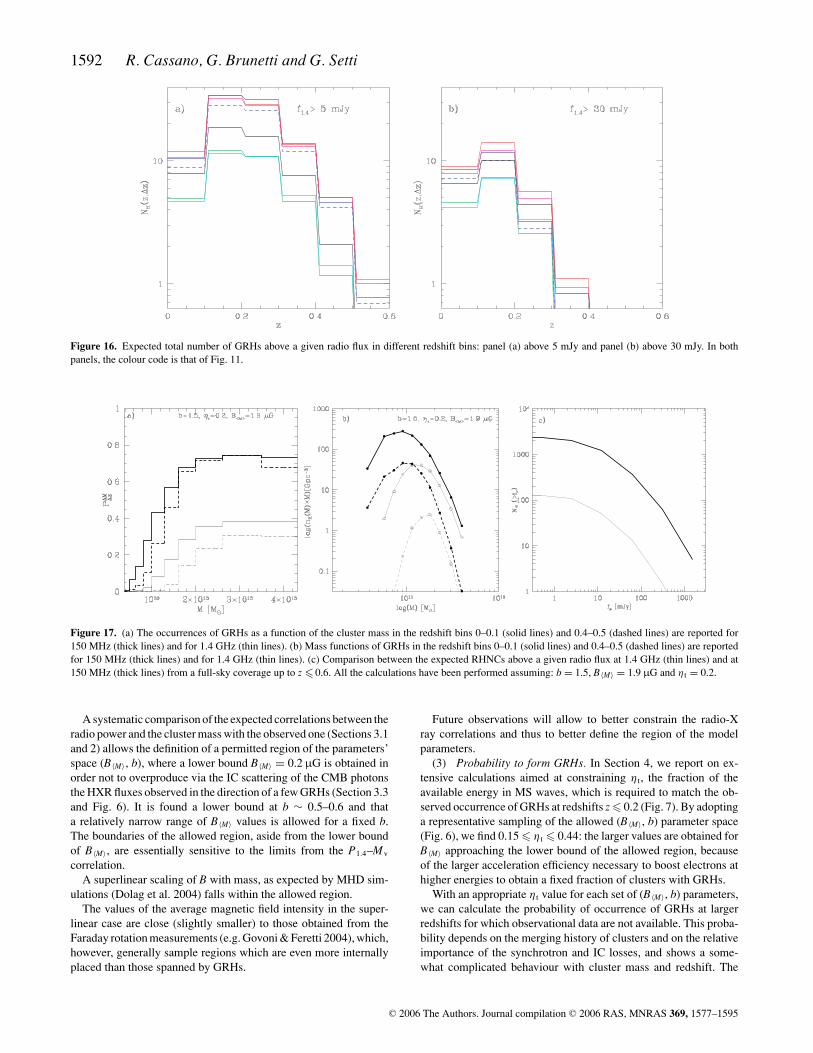
1592 R. Cassano, G. Brunetti and G. Setti
Figure 16. Expected total number of GRHs above a given radio flux in different redshift bins: panel (a) above 5 mJy and panel (b) above 30 mJy. In bothpanels, the colour code is that of Fig. 11.
Figure 17. (a) The occurrences of GRHs as a function of the cluster mass in the redshift bins 0–0.1 (solid lines) and 0.4–0.5 (dashed lines) are reported for150 MHz (thick lines) and for 1.4 GHz (thin lines). (b) Mass functions of GRHs in the redshift bins 0–0.1 (solid lines) and 0.4–0.5 (dashed lines) are reportedfor 150 MHz (thick lines) and for 1.4 GHz (thin lines). (c) Comparison between the expected RHNCs above a given radio flux at 1.4 GHz (thin lines) and at150 MHz (thick lines) from a full-sky coverage up to z �0.6. All the calculations have been performed assuming: b = 1.5, B〈M〉 = 1.9 μG and η t = 0.2.
A systematic comparison of the expected correlations between theradio power and the cluster mass with the observed one (Sections 3.1and 2) allows the definition of a permitted region of the parameters’space (B〈M〉, b), where a lower bound B〈M〉 = 0.2 μG is obtained inorder not to overproduce via the IC scattering of the CMB photonsthe HXR fluxes observed in the direction of a few GRHs (Section 3.3and Fig. 6). It is found a lower bound at b ∼ 0.5–0.6 and thata relatively narrow range of B〈M〉 values is allowed for a fixed b.The boundaries of the allowed region, aside from the lower boundof B〈M〉, are essentially sensitive to the limits from the P1.4–Mv
correlation.A superlinear scaling of B with mass, as expected by MHD sim-
ulations (Dolag et al. 2004) falls within the allowed region.The values of the average magnetic field intensity in the super-
linear case are close (slightly smaller) to those obtained from theFaraday rotation measurements (e.g. Govoni & Feretti 2004), which,however, generally sample regions which are even more internallyplaced than those spanned by GRHs.
Future observations will allow to better constrain the radio-Xray correlations and thus to better define the region of the modelparameters.
(3) Probability to form GRHs. In Section 4, we report on ex-tensive calculations aimed at constraining η t, the fraction of theavailable energy in MS waves, which is required to match the ob-served occurrence of GRHs at redshifts z � 0.2 (Fig. 7). By adoptinga representative sampling of the allowed (B〈M〉, b) parameter space(Fig. 6), we find 0.15 � η t � 0.44: the larger values are obtained forB〈M〉 approaching the lower bound of the allowed region, becauseof the larger acceleration efficiency necessary to boost electrons athigher energies to obtain a fixed fraction of clusters with GRHs.
With an appropriate η t value for each set of (B〈M〉, b) parameters,we can calculate the probability of occurrence of GRHs at largerredshifts for which observational data are not available. This proba-bility depends on the merging history of clusters and on the relativeimportance of the synchrotron and IC losses, and shows a some-what complicated behaviour with cluster mass and redshift. The
C© 2006 The Authors. Journal compilation C© 2006 RAS, MNRAS 369, 1577–1595
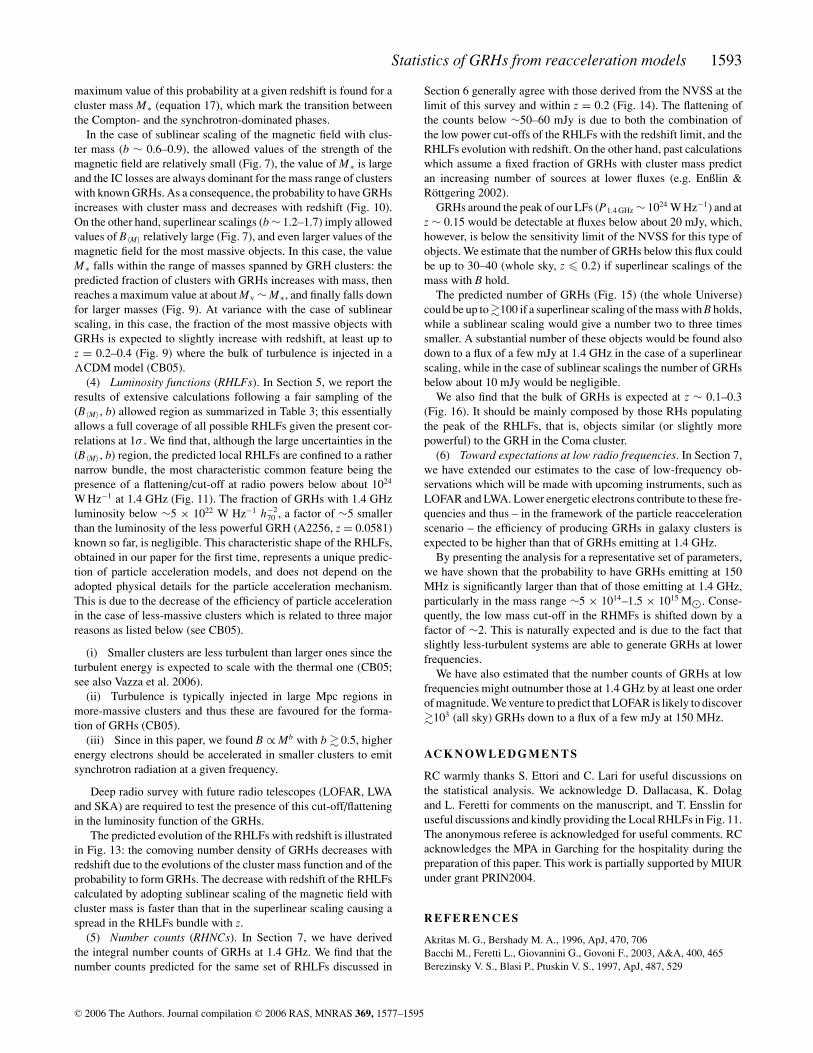
Statistics of GRHs from reacceleration models 1593
maximum value of this probability at a given redshift is found for acluster mass M∗ (equation 17), which mark the transition betweenthe Compton- and the synchrotron-dominated phases.
In the case of sublinear scaling of the magnetic field with clus-ter mass (b ∼ 0.6–0.9), the allowed values of the strength of themagnetic field are relatively small (Fig. 7), the value of M∗ is largeand the IC losses are always dominant for the mass range of clusterswith known GRHs. As a consequence, the probability to have GRHsincreases with cluster mass and decreases with redshift (Fig. 10).On the other hand, superlinear scalings (b ∼ 1.2–1.7) imply allowedvalues of B〈M〉 relatively large (Fig. 7), and even larger values of themagnetic field for the most massive objects. In this case, the valueM∗ falls within the range of masses spanned by GRH clusters: thepredicted fraction of clusters with GRHs increases with mass, thenreaches a maximum value at about Mv ∼ M∗, and finally falls downfor larger masses (Fig. 9). At variance with the case of sublinearscaling, in this case, the fraction of the most massive objects withGRHs is expected to slightly increase with redshift, at least up toz = 0.2–0.4 (Fig. 9) where the bulk of turbulence is injected in a�CDM model (CB05).
(4) Luminosity functions (RHLFs). In Section 5, we report theresults of extensive calculations following a fair sampling of the(B〈M〉, b) allowed region as summarized in Table 3; this essentiallyallows a full coverage of all possible RHLFs given the present cor-relations at 1σ . We find that, although the large uncertainties in the(B〈M〉, b) region, the predicted local RHLFs are confined to a rathernarrow bundle, the most characteristic common feature being thepresence of a flattening/cut-off at radio powers below about 1024
W Hz−1 at 1.4 GHz (Fig. 11). The fraction of GRHs with 1.4 GHzluminosity below ∼5 × 10²² W Hz−1 h−2
70 , a factor of ∼5 smallerthan the luminosity of the less powerful GRH (A2256, z = 0.0581)known so far, is negligible. This characteristic shape of the RHLFs,obtained in our paper for the first time, represents a unique predic-tion of particle acceleration models, and does not depend on theadopted physical details for the particle acceleration mechanism.This is due to the decrease of the efficiency of particle accelerationin the case of less-massive clusters which is related to three majorreasons as listed below (see CB05).
(i) Smaller clusters are less turbulent than larger ones since theturbulent energy is expected to scale with the thermal one (CB05;see also Vazza et al. 2006).
(ii) Turbulence is typically injected in large Mpc regions inmore-massive clusters and thus these are favoured for the forma-tion of GRHs (CB05).
(iii) Since in this paper, we found B ∝ Mb with b � 0.5, higherenergy electrons should be accelerated in smaller clusters to emitsynchrotron radiation at a given frequency.
Deep radio survey with future radio telescopes (LOFAR, LWAand SKA) are required to test the presence of this cut-off/flatteningin the luminosity function of the GRHs.
The predicted evolution of the RHLFs with redshift is illustratedin Fig. 13: the comoving number density of GRHs decreases withredshift due to the evolutions of the cluster mass function and of theprobability to form GRHs. The decrease with redshift of the RHLFscalculated by adopting sublinear scaling of the magnetic field withcluster mass is faster than that in the superlinear scaling causing aspread in the RHLFs bundle with z.
(5) Number counts (RHNCs). In Section 7, we have derivedthe integral number counts of GRHs at 1.4 GHz. We find that thenumber counts predicted for the same set of RHLFs discussed in
Section 6 generally agree with those derived from the NVSS at thelimit of this survey and within z = 0.2 (Fig. 14). The flattening ofthe counts below ∼50–60 mJy is due to both the combination ofthe low power cut-offs of the RHLFs with the redshift limit, and theRHLFs evolution with redshift. On the other hand, past calculationswhich assume a fixed fraction of GRHs with cluster mass predictan increasing number of sources at lower fluxes (e.g. Enßlin &Rottgering 2002).
GRHs around the peak of our LFs (P1.4 GHz ∼ 1024 W Hz−1) and atz ∼ 0.15 would be detectable at fluxes below about 20 mJy, which,however, is below the sensitivity limit of the NVSS for this type ofobjects. We estimate that the number of GRHs below this flux couldbe up to 30–40 (whole sky, z � 0.2) if superlinear scalings of themass with B hold.
The predicted number of GRHs (Fig. 15) (the whole Universe)could be up to �100 if a superlinear scaling of the mass with B holds,while a sublinear scaling would give a number two to three timessmaller. A substantial number of these objects would be found alsodown to a flux of a few mJy at 1.4 GHz in the case of a superlinearscaling, while in the case of sublinear scalings the number of GRHsbelow about 10 mJy would be negligible.
We also find that the bulk of GRHs is expected at z ∼ 0.1–0.3(Fig. 16). It should be mainly composed by those RHs populatingthe peak of the RHLFs, that is, objects similar (or slightly morepowerful) to the GRH in the Coma cluster.
(6) Toward expectations at low radio frequencies. In Section 7,we have extended our estimates to the case of low-frequency ob-servations which will be made with upcoming instruments, such asLOFAR and LWA. Lower energetic electrons contribute to these fre-quencies and thus – in the framework of the particle reaccelerationscenario – the efficiency of producing GRHs in galaxy clusters isexpected to be higher than that of GRHs emitting at 1.4 GHz.
By presenting the analysis for a representative set of parameters,we have shown that the probability to have GRHs emitting at 150MHz is significantly larger than that of those emitting at 1.4 GHz,particularly in the mass range ∼5 × 10¹⁴–1.5 × 10¹⁵ M�. Conse-quently, the low mass cut-off in the RHMFs is shifted down by afactor of ∼2. This is naturally expected and is due to the fact thatslightly less-turbulent systems are able to generate GRHs at lowerfrequencies.
We have also estimated that the number counts of GRHs at lowfrequencies might outnumber those at 1.4 GHz by at least one orderof magnitude. We venture to predict that LOFAR is likely to discover�103 (all sky) GRHs down to a flux of a few mJy at 150 MHz.
AC K N OW L E D G M E N T S
RC warmly thanks S. Ettori and C. Lari for useful discussions onthe statistical analysis. We acknowledge D. Dallacasa, K. Dolagand L. Feretti for comments on the manuscript, and T. Ensslin foruseful discussions and kindly providing the Local RHLFs in Fig. 11.The anonymous referee is acknowledged for useful comments. RCacknowledges the MPA in Garching for the hospitality during thepreparation of this paper. This work is partially supported by MIURunder grant PRIN2004.
R E F E R E N C E S
Akritas M. G., Bershady M. A., 1996, ApJ, 470, 706Bacchi M., Feretti L., Giovannini G., Govoni F., 2003, A&A, 400, 465Berezinsky V. S., Blasi P., Ptuskin V. S., 1997, ApJ, 487, 529
C© 2006 The Authors. Journal compilation C© 2006 RAS, MNRAS 369, 1577–1595
1594 R. Cassano, G. Brunetti and G. Setti
Bertoglio J.-P., Bataille F., Marion J.-D., 2001, Phys. Fluids, 13, 290Blasi P., 2004, JKAS, 37, 483Bohringer H. et al., 2004, A&A, 425, 367Bowyer S., Korpela E. J., Lampton M., Jones T. W., 2004, ApJ, 605, 168Brunetti G., 2003, in Bowyer S., Hwang C.-Y., eds, ASP Conf. Ser., Vol.
301, Matter and Energy in Clusters of Galaxies. Astron. Soc. Pac., SanFrancisco, p. 349
Brunetti G., 2004, JKAS, 37, 493Brunetti G., 2006, Astronomische Nachrichten 327, No. 5/6, 615, Proceed-
ings of ‘The Origin and Evolution of Cosmic Magnetism’, 29 August–2September 2005, Bologna, Italy
Brunetti G., Blasi P., 2005, MNRAS, 363, 1173Brunetti G., Setti G., Feretti L., Giovannini G., 2001, MNRAS, 320, 365Brunetti G., Blasi P., Cassano R., Gabici S., 2004, MNRAS, 350, 1174Buote D. A., 2001, ApJ, 553, 15Carroll S. M., Press W. H., Turner E. L., 1992, ARA&A, 30, 499Cassano R., Brunetti G., 2005, MNRAS, 357, 1313 (CB05)Colafrancesco S., 1999, in Bohringer H., Feretti L., Schuecker P., eds,
Proceedings of the Workshop. . .Ringberg Castle, Germany, April 19–23, 1999, Diffuse Thermal and Relativistic Plasma in Galaxy Clusters.Max-Planck-Institut fur Extraterrestrische Physik, Garching, Germany,p. 269
Colafrancesco S., Marchegiani P., Perola G. C., 2005, ApJ, 449, 1Condon J. J., Cotton W. D., Greisen E. W., Yin Q. F., Perley R. A., Taylor
G. B., Broderick J. J., 1998, AJ, 115, 1693David L. P., Slyz A., Jones C., Forman W., Vrtilek S. D., Arnaud K. A.,
1993, ApJ, 412, 479Dennison B., 1980, ApJ, 239Deiss B. M., Reich W., Lesch H., Wielebinski R., 1997, A&A, 321, 55Dolag K., 2006, Astron. Nachr., 327, 575Dolag K., Bartelmann M., Lesch H., 2002, A&A, 387, 383Dolag K., Grasso D., Springel V., Tkachev I., 2004, JKAS, 37, 427Ebeling H., Voges W., Bohringer H., Edge A. C., Huchra J. P., Briel U. G.,
1996, MNRAS, 281, 799Ebeling H., Edge A. C., Bohringer H., Allen S. W., Crawford C. S., Fabian
A. C., Voges W., Huchra J. P., 1998, MNRAS, 301, 881Enßlin T. A., 2004, JKAS, 37, 439Enßlin T. A., Biermann P. L., Kronberg P. P., Wu X.-P., 1997, ApJ, 477,
560Enßlin T. A., Biermann P. L., Klein U., Kohle S., 1998, A&A, 332, 395Enßlin T. A., Gopal-Krishna, 2001, A&A, 366, 26Enßlin T. A., Rottgering H., 2002, A&A, 396, 83Ettori S., Fabian A. C., 1999, MNRAS, 305, 834Ettori S., Tozzi P., Borgani S., Rosati P., 2004, A&A, 417, 13Evrard A. E., Metzler C. A., Navarro J. F., 1996, ApJ, 469, 494Feretti L., 2000, Invited review at IAU 1999, The Universe at Low Radio
Frequencies. Pune, India, 1999Feretti L., 2002, in Pramesh Rao A., Swarup G., Gopal-Krishna, eds, Proc.
IAU Symp. 199, The Universe at Low Radio Frequencies. CambridgeUniv. Press, Cambridge, p. 133
Feretti L., 2003, in Bowyer S., Hwang C.-Y., eds, ASP Conf. Ser., Vol.301, Matter and Energy in Clusters of Galaxies. Astron. Soc. Pac., SanFrancisco, p. 143
Feretti L., 2004, in Sjouwerman L. O., Dyer K. K., eds, X-Ray and RadioConnections. Published electronically by NRAO, 3–6 February 2004,Santa Fe, NM, USA
Feretti L., Fusco-Femiano R., Giovannini G., Govoni F., 2001, A&A, 373,106
Feretti L., Brunetti G., Giovannini G., Kassim N., Orru E., Setti G., 2004,JKAS, 37, 315
Fusco-Femiano R., Dal Fiume D., Orlandini M., De Grandi S., Molendi S.,Feretti L., Grandi P., Giovannini G., 2003, in Bowyer S., Hwang C.-Y.,eds, ASP Conf. Ser., Vol. 301, Matter and Energy in Clusters of Galaxies.Astron. Soc. Pac., San Francisco, p. 109
Fusco-Femiano R., Orlandini M., Brunetti G., Feretti L., Giovannini G.,Grandi P., Setti G., 2004, ApJ, 602, 73
Fujita Y., Takizawa M., Sarazin C. L., 2003, ApJ, 584, 190Gabici S., Balsi P., 2003, ApJ, 583, 695
Giovannini G., Feretti L., 2000, New Astron., 5, 335Giovannini G., Feretti L., 2002, in Feretti L., Gioia I. M., Giovannini G.,
eds, Ap&SS Library Vol. 272, Merging Processes in Galaxy Clusters.Kluwer, Dordrecht, p. 197
Giovannini G., Tordi M., Feretti L., 1999, New Astron., 4, 141Govoni F., Feretti L., 2004, Int. J. Mod. Phys. D, 13, 1549Govoni F., Feretti L., Giovannini G., Boringer H., Reiprich T. H., Murgia
M., 2001, A&A, 376, 803Govoni F., Markevitch M., Vikhlinin A., VanSpeybroeck L., Feretti L., Gio-
vannini G., 2004, ApJ, 605, 695Govoni F., Murgia M., Feretti L., Giovannini G., Dallacasa D., Taylor G. B.,
2005, A&A, 430, 5Hwang C.-Y., 2004, JKAS, 37, 461Hoeft M., Brggen M., Yepes G., 2004, MNRAS, 347, 389Hogg D. W., 2000, preprint (astro-ph/9905116)Hughes J. P., Butcher J. A., Stewart G. C., Tanaka Y., 1993, ApJ, 404,
611Kaastra J. S., Lieu R., Tamura T., Paerels F. B. S., den Herder J. W., 2003,
A&A, 397, 445Kempner J. C., Sarazin C. L., 2001, ApJ, 548, 639Kim K.-T., Kronberg P. P., Dewdney P. E., Landecker T. L., 1990, ApJ, 355,
29Kitayama T., Suto Y., 1996, ApJ, 469, 480Kuo P.-H., Hwang C.-Y., Ip W.-H., 2003, ApJ, 594, 732Kuo P.-H., Hwang C.-Y., Ip W.-H., 2004, ApJ, 604, 108Lacey C., Cole S., 1993, MNRAS, 262, 627Lazarian A., 2006, Astron. Nachr., 327, 609Lemonon L., Pierre M., Hunstead R., Reid A., Mellier Y., Boehringer H.,
1997, A&A, 326, 34Liang H., 1999, in Bohringer H., Feretti L., Schuecker P., eds, Proceedings of
the Workshop. . .Ringberg Castle, Germany, April 19–23, 1999, DiffuseThermal and Relativistic plasma in Galaxy clusters. Max-Planck-Institutfur Extraterrestrische Physik, Garching, Germany, p. 33
Liang H., Hunstead R. W., Birkinshaw M., Andreani P., 2000, ApJ, 544,686
Markevitch M., 1996, ApJ, 465, 1Markevitch M., Forman W. R., Sarazin C. L., Vikhlinin A., 1998, ApJ, 503,
77Markevitch M., Gonzalez A. H., David L., Vikhlinin A., Murray S., Forman
W., Jones C., Tucker W., 2002, ApJ, 567, 27Miniati F., Jones T. W., Kang H., Ryu D., 2001, ApJ, 562, 233Mushotzky R. F., Scharf C. A., 1997, ApJ, 482, 13Nevalainen J., Markevitch M., Forman W., 2000, ApJ, 532, 694Petrosian V., 2001, ApJ, 557, 560Pfrommer C., Enßlin T. A., 2004, A&A, 413, 17Pierre M., Matsumoto H., Tsuru T., Ebeling H., Hunstead R., 1999, A&AS,
136, 173Press W. H., Schechter P., 1974, ApJ, 187, 425 (PS74)Rephaeli Y., Gruber D., 2003, ApJ, 595, 137Reimer O., Pohl M., Sreekumar P., Mattox J. R., 2003, ApJ, 588, 155Reimer A., Reimer O., Schlickeiser R., Iyudin A., 2004, A&A, 424,
773Reiprich T. H., Bohringer H., 2002, ApJ, 567, 716 (RB02)Roettiger K., Burns J. O., Loken C., 1996, ApJ, 473, 651Roettiger K., Burns J. O., Stone J. M., 1999, ApJ, 518, 603Ryu D., Kang H., Hallman E., Jones T. W., 2003, ApJ, 593, 599Sarazin C. L., 1986, Rev. Mod. Phys., 58, 1Sarazin C. L., 1999, ApJ, 520, 529Sarazin C. L., 2002, in Feretti L., Gioia I. M., Giovannini G., eds, Ap&SS
Library Vol. 272, Merging Processes in Galaxy Clusters. Kluwer,Dordrecht, p. 1
Schindler S., 1996, A&A, 305, 756Schindler S., 2002, in Feretti L., Gioia I. M., Giovannini G., eds, Ap&SS
Library Vol. 272, Merging Processes in Galaxy Clusters. Kluwer,Dordrecht, p. 229
Schlickeiser R., Sievers A., Thiemann H., 1987, A&A, 182, 21Schuecker P., Bohringer H., Reiprich T. H., Feretti L., 2001, A&A, 378,
408
C© 2006 The Authors. Journal compilation C© 2006 RAS, MNRAS 369, 1577–1595
Statistics of GRHs from reacceleration models 1595
Tsuru T., Koyama K., Hughes J. P., Arimito N., Kii T., Hattori M., 1996,in Yamashita K., Watanabe T. eds, UV and X-ray Spectroscopy of As-trophysical and Laboratory Plasmas. Universal Academy Press, Tokyo(Frontiers Science Series, no. 15), p. 375
Vazza F., Tormen G., Cassano R., Brunetti G., Dolag K., 2006, MNRAS, inpress (astro-ph/0602247)
Venturi T., Bardelli S., Dallacasa D., Brunetti G., Giacintucci S., HunsteadR. W., Morganti R., 2003, A&A, 402, 913
Volk H. J., Aharonian F. A., Breitschwerdt D., 1996, SSRv, 75, 279White D. A., 2000, MNRAS, 312, 663Zhang Y.-Y., Finoguenov A., Bringer H., Ikebe Y., Matsushita K., Schuecker
P., 2004, A&A, 413, 49
This paper has been typeset from a TEX/LATEX file prepared by the author.
C© 2006 The Authors. Journal compilation C© 2006 RAS, MNRAS 369, 1577–1595


![Animal husbandry and mollusc gathering [in the Hellenistic town of New Halos]](https://static.fdokumen.com/doc/165x107/632b357dba70062a77056249/animal-husbandry-and-mollusc-gathering-in-the-hellenistic-town-of-new-halos.jpg)

