STATISTICAL OUTLINE OF GUJARAT - National Institute of ...
286
STATISTICAL OUTLINE OF GUJARAT 1980 NIEPA DC D00133 BUREAU OF ECONOMICS AND STATISTICS GOVERNMENT OF GUJARAT GANDHINAGAR
-
Upload
khangminh22 -
Category
Documents
-
view
0 -
download
0
Transcript of STATISTICAL OUTLINE OF GUJARAT - National Institute of ...
S T A T I S T I C A L O U T L I N E O F G U J A R A T
1980
NIEPA DC
D00133
BUREAU OF ECONOMICS AND STATISTICS GOVERNMENT OF GUJARAT
GANDHINAGAR

S l6 .■WT i ^ -ypteius Unit, K aion . I,:s;i.ute of Educatioml Pknmng and Aministmtian^ r . A u r b . . c o J.r3,NewDelhi.lMGi8
..............
PRIKTBD AT THE GOVERNMENT CENTRAL TRtSS, OANDIlIUNAOARj

I Administrative Set-up of Gujarat State . . . . 1II Gujarat State at a glance—Comparison with
India 2III Key Statistics of Gujarat Economy . . . . 14
1 Area and Population1.1 Area and Population by States/Union Territories-
19?1 .................................................................... 261.2 Rural and Urban Population by States-19?l . , 291.3 Number of residential houses, house holds, inhabi
ted villages and towns by States/Union Territories-1971 .................................................................... 32
1.4 Population, sex ratio, density and growth rate ofStates/Union Territories-1971 .. . . . . 36
1.5 Population, sex ratio, density and growth rate ofStates/Union Territories—1981. . . . . . . 40
1 .6 Area and Population . . . . 4 41.7 Annual estimates of population projections
of Gujarat State . . . . . . . . 451.8 Area, population, density, sex ratio and growth rate
by district—1971 . . , , . . , . 4 61.9 Population, density, sex ratio and growth rate
by district—1981 , . , . . . . . 481.10 Growth of population in Gujarat . . . . S O1.11 Distribution of villages according to population
1971 ......................................... . . . . 5 11.12 Distribution of Towns/Urban Agglomerations-1971. . 52
CONTENTS
Sr, PageNo.
(fiontd.)
0)R - 4 0 - ( i )

1 Area and Population (concld.)
1.13 Population in the cities of the State .. . . 531.14 Districtwise Population of towns . . . . 56L I 5. Distribution of population by age group 1961 and
19/1 .................................................................... 751.16 Population of scheduled castes and scheduled
tribes , . . . . . . . . . 781.17 Population classified by Languages— Mother
tongues—1971 . . . . . . .. . . 791.18 Population classified by Religion—1971 . , 821.19 Classification of workers and non-workers by indu
strial category . . . , . . . . . 831.20 Distribution of workers and non-workers by broad
age group—1971 . . , . . . . . . 84
2 National and State Domestic Product
2.1 Net domestic product by industry o f origin at current prices -A ll India
2.2 Net domestic product by industry of origin alt1970-71 prices-All India
2 .3 State domestic product by industry groups atcurrent pricJes
2 .4 State domestic product by industry groups atconstant 1970-71 prices
2 .5 Per capita net National and net State domesticproduct
CONTENTS
Sr. PageNo.
{(eontd.)
Sr. PageNo.
3 Climate
3.1 Maximum and minimum temperature-1979 . . 95
3.2 Rainfall and normal rainfall . . . . . . 96
4 Agriculture
CONTENTS
4.1 States’ share in the Agricultural production . 97
4 .2 Land Utilisation . 104
4.3 Area under principal crops . 105
4 .4 Production o f principal crops . . . 106
4 .5 Per hectare yields of principal crops . 1074 .6 Index numbers of area imder agricultural crops
in Gujarat State . 1084 .7 Index numbers o f agricultural productions in
Gujarat State . 1104 .8 Index numbers o f yields o f crops in Gujarat State . 113
4 .9 Area irrigated by source . 116
4.10 Area irrigated by some important crops . 117
4.11 Number of wells used for different purpose . 118
4.12 Agricultural implements . 119
4.13 Distribution of chemical fertilizers . 1214.14 Consumption of N , P2 O5 and K2 O . . . 122
(contd.)
111
5 Civil Supplies
5.1 Districtwise distribution o f fair price shops . . 1235.2 Districtwise storage capacity with Government . . 125
6 Animal Husbandry
6.1 Livestock population . . . . . . . . 1306.2 Miscellanous statistics relating to animal
husbandry . . . . . . . . . . 1 3 3
7 Fisheries
? .! Fisheries statistics . . . . . . . . 1 3 4
8 Forest8.1 Area under forest . . . . . . . . 1358.2 Production of major and minor forest produce . . 1368.3 Forest development . . . . . . . , 1 3 88 .4 Number of trees planted . . . . . . 142
9 Electricity
9.1 Installed capacity of electricity in Gujarat State . . 1439 .2 Generation of electricity in Gujarat State.. . . 1449.3 Sales o f electricity in Gujarat State . . . . 1459 .4 Number of places electrified in Gujarat State . . 1479.5 Statewise number of villages electrified and
irrigation pump sets/tubewells energised . . 148
CONTENTS
Sr. PageNo.
(Contd.)
iv

10 Mining
10.1 Quantity and value of mineral production 151
11 Industries
11.1 Statewise number of working factories and averagenumber of workers employed daily therein. . 154
11.2 Number o f working factories and workersemployed daily therein . . . . 156
11.3 Districtwise number of factories and averagenumber o f workers employed daily-19V9 . . 157
11.4 Number of working factories and workersemployed daily therein by industry group 159
11.5 Production of selected industries . . . . 164
11.6 Number of small scale industrial units registered inGujarat State.. . . . . . . . . 166
11.7 Annual Survey o f Industries-Census sector 168
11.8 Annual Survey of Industries-Sample sector 169
11.9 Licences issued for starting new industrial undertakings and expansion of existing unitsin Gujarat State . . . . . . 170
11.10 Districtwise licences issued for establishment ofnew industrial undertakings in Gujarat State. 171
CONTENTS
Sr. PageNo.
iContd.)

11 Industries (Concld.)
11.11 Spindlage, loomage, production of yarn and cloth and employment in textile industry in GujaratState . . . . . . . . . . 173
11.12 Irrdustrial disputes- • . . • i . ■ .; 17411.13 Industrial disputes by causes.. . . . . 17511.14 Industrial disputes by results . . 17611.1.^ Number and memberships of Trade unions 177
12 U fe Insurance
12.1 I-ife insurance statistics «= =. =. 178
13 Banking
13.1 Number of offices of commercial and cooperative banks and number of places served bythem . . . . . . . . . . 179
13.2 Deposits and bank credit of the commercial banks 18013.3 Advances of scheduled commercial banks to
priority sectors . . . . . . . . 181
14 Prices
14.1 Index numbers of wholesale prices in Indiafor major groups and groups . . . . 182
14.2 Index numbers o f wholesale prices of certainagricultural commodities in Gujarat State . . 184
CONTENTS
Sr. PageNo.
iContd.)
V I

14 Prices (Concld.)
14.3 Index numbers of retail prices of certain agricultural commodities in Gujarat State 186
14.4 Consumer price index numbers for industrialworkers 188
14.5 Consumers price in^ex numbers for urban non-manual employees . . . . . • 189
14.6 Consumer price index numbers for agriculturallabourers 190
15 Transport and Commimication
15.1 Length of railways . . . . . . 19115.2 Length of roads (Except municipal) . . 19215.3 Length of roads (Except municipal) according to
types of surface . . . . . . . • 19315.4 Number of motor vehicles on road . . 19415.5 Working of the Gujarat State Road Transport
Corporation . . . . . . •• 19515.6 Imports and exports at Gujarat Ports . . 19615.7 Coastline and number of ports in the State 19715.8 Postal statistics . . . . . . •• 19815.9 Number of broadcasting receiving licences in force
in Gujarat . . . . . . . . 199
CONTENTS
Sr. PageNo.
(Contd.)
vii

16 Public Finance
16.1 General budgetory position 20016.2 Receipts on Revenue Account 20116.3 Tax receipt on Revenue Account . . . . 20316.4 Expenditure on Revenue Account
(Development and Non-development) . . 20416.5 Expendituie on Capital Account . . . . 20616.6 Per capita income on Revenue and Capital Account 20816.7 Per capita development and non-development
expenditure . . . . . . 21016.8 Classification of the income tax payable by class
o f assessees in Gujarat . . 21216.9 Number of dealers under Sales tax Act. 21416.10 Receipts of municipal corporations and muni
cipalities . . . . . . . . 21516.11 Expenditure of municipal corporations and muni
cipalities . . . . . . . . . , 2\716.12 Small savings in Gujarat State . . . . 219
17 Employment
17.1 Employment in public and private sector . . 22017.2 Working of employment exchanges . . . . 222'17.3 Employment seekers by level of education . . 223
CONTENTS
Sr. PageNo.
(conid.)
viii

18 Housing
18.1 Classification of houses according to use-1971 . . 22818.2 Distribution of households according to rooms
occupied—1971 . . . . . . . . 23018.3 Tenements under the management of Gujarat
Housing Board . . . . . . . . 2 3 1
19 Elducation
19.1 Literates in Gujarat—1971 . . . . . . 23219.2 Literate population and percentage of Literacy
—1981 23319.3 Educational institutions . . . . . . 23619.4 Number of scholars in educational institutions . . 23719.5 Number of teachers in educational institutions . . 73819.6 Number of technical institutions, sanctioned seats
and actual admissions therein . . . . . . 23919.7 Number of newspapers and periodicals published
in different languages . . . . . . . . 24019.8 Cinema statistics . . . . . . . . 2 4 1
20 Vital, Public Health and Medical Statistics
20.1 Registered birth rate, death rate and infantmortality rate . . . . . . . . 242
20.2 Estimated live birth rate and death rate as persample registration scheme . . . . . . 243
CONTENTS
Sr. PageNo.
iContd.)
ixK~-40-(ii)

20 Vital, PiiiHc Health and Medical Statistics (conhd.)
20.3 Expectitioi of life at birth in Gujarat . . . . 24420.4 Primaiy htalth centres . . . . . . •• 24520.5 Numbtr o1 hospitals/dispensaries, beds, doctors,
nurses and patieqts treated . . . . . 246
21 Family Velfire
21.1 Rural aid Jrban family welfare centres in GujaratState . . . . . . . . . . 248
21.2 Informitioi about publicity and mass mediameasucs cf family welfare programme . . . . 250
21.3 Family Plaining Progi amme . . . . =. 25121 .4 Numbff of vasectomy, tubectomy, and I.U .C .D .
insertims ii Gujarat by district—1979-80 . . 25221.5 Family velfare contraceptives distributed . . . . 25421 .6 Births .vertJd due to various methods of family
welfare in aujarat State . . . . . . 2552 1 .7 Numbe o' couples protected due to various
method of family welfare iin Gujarat State . . 256
22 Co-operaton
22.1 Numbe, numbership and p)aid up share capitalof co-oeraive societies . . . . . . 2 5 7
22.2 Numbe?of cooperative societies in GujaratState. 258
CONTENTS
Sr. PageNo.
(Contd.)

23 Crimes and Jails
23.1 Cognizable offences including attempts indabetments under Indian Penal Code .. . . 260
23.2 Number o f police stations, out-posts etc in Gujarat 262State
23.3 Number of jails and number o f prisoner therein 263
24 Planning
24.1 Progress o f five year plans-outlay andexpenditure . . . . . . 264
24.2 Progress of the fifth five year plan .. . . 266
25 Miscellancaus
25.1 Districtwise development blocks, gram panhayats, nagar panchayats, taluka panchayats and umberof villages . . . . .. 268
25.2 Tourist centres and number of tourists 272
CONTENTS
Sr. PageNo.
(Concld.)
xi
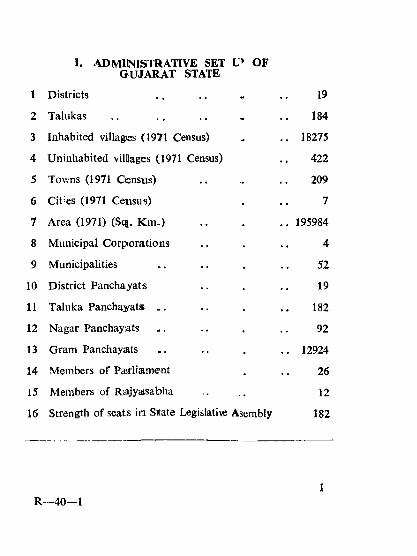
I. ADMINISTRATIVE SET OF GUJARAT STATE
1 Districts . . . . - . . 19
2 Talukas . . . . . . , . . 184
3 Inhabited villages (1971 Census) .. . . 18275
4 Uninhabited vilJages (1971 Census) . . 422
5 Towns (1971 Census) . . , . . 209
6 Cit'cs (1971 Census) . . . 7
7 Area (1971) (Sq. K m .) ................................. 195984
8 Municipal Corporations . . . . . 4
9 Municipalities . . . . . . . 52
10 District Pancha,yat:s . . . . . 19
11 Taluka Panchayats . . . . . . . 182
12 Nagar Panchayats . . . . . . , 92
13 Gram Panchayats .. . . . 12924
14 Members of Pairliament . . . 26
15 Members of Rajyasabha .. ,. 12
16 Strength of seats in State Legislative Asembly 182
R —40—1

I). GUJARAT STATE AT A GLANCE
Sr. ItemNo.
1
1 POPULATION-1971 CENSUS
1.1 (a) Rural Population
(b) Perxntage of Rural populatio>n to total population
1.2 (a) Urban Population
(b) Percentige of urban populatiom to total population
1.3 Total Population
(a) Males
(b) Females
1.4 (a) Population of Scheduled Castes and ScheduledTribes
(b) Percentige of above population to total pop*ulation
1.5 (a) Total vorkers
(b) Percentage of total workers to total population

COM PARISO N W IT H INDUA
Unit Gujaratt India Comparison with India (as percentage to India)
’000 N os. 19201 4388565 4.4
Percentage 71 .92 80.09J ••
’000 N os. T496 109094 6.9
Percentage 28 .08 19.911 . .
’000 N os. 266977 548160) 4.9
’000 Mos- 13802 284049 4.9
’000 N os- 12895 2641J11 4.9
’000 N os- 5559 1180111 4.7
Percentage 20.82 21.54 ••
’000 N os- 839:5 18037J 4.7
P5rcent:age5 3a.4;5 32.92 . .
II. GUJARAT STATE AT A GLANCE
Sr. ItemNo.
1
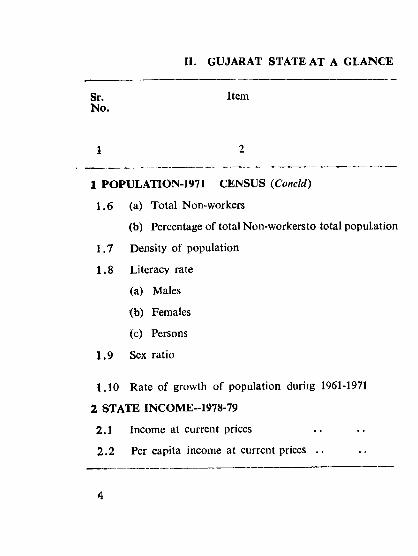
1 POPULATION-1971 CENSUS (Concld)
1.6 (a) Total Non-workers
(b) Percentage of total Non-workers to total population
1 .7 Density of population
1 .8 Literacy rate
(a) Males
(b) Females
(c) Persons
1.9 Sex ratio
1.10 Rate of growth of population duriig 1961-1971
2 STATE INCOME-1978-79
2.1 Income at current prices
2 .2 Per capita income at current prices . .

COMPARISON WITH INDIA {Contd.)
Unit Gujarat India Comparison with India (as percentage to India)
3 4 5 6
’000 Nos. 18302 367577 5 .0
Percentage 68.55 67.08
Persons per Sq.Km.
136 178 76.4
Percentage 46.11 39.45
Percentage 24.75 18.72
Percentage 35.79 29.46
Females per 1000 males 934 930
Percentage 29.39 24.80
Rs. in Crores 4741 80900 5.9
Rs. 1505 1249

U. GUJARAT STATE AT A GLANCE
Sr. No.
Item
AGRICULTURE(Average for the years 1976-77, 1977-78 and :978-79). Area under principal crops
3.1 Rice3 .2 Wheat . .3.3 Jowar . .3 .4 Bajri3 .5 All Cereals3 .6 All Pulses. .3 .7 All Cereals and Pulses3 .8 Groundnut3 .9 Cotton3.10 Tobacco
Out-turn of principal crops
3.11 Rice . .3.12 Wheat3.13 Jowar3.14 Bajri . .3.15 All Cereals3.16 All Pulses3.17 All Cereals and Pulses

COMPARISION WITH INDIA iCont4.)
Unit
3
Gujarat
4
India
5
Comparisoq with India
(as percentage to India)
6
’000 Hectares 470 39663 1.2‘000 Hectares 677 21533 3.1’000 Hectares 1031 16070 6.4’000 Hectares 1464 11063 13.2’000 Hectares 4106 103320 4 .0’000 Hectares 482 23343 2.1’000 Hectares 4588 126663 3.6’000 Hectares 1968 7203 27.3’000 Hectares 1771 7617 23.3’000 Hectares 85 449 18.9
’000 Tonnes 590 49473 1.2’000 Tonnes 1162 31913 3 .6’000 Tonnes 570 11380 5.0’000 Tonnes 1279 5367 23.8’000 Tonnes 3940 111147 3.5’000 Tonnes 189 11833 1.6’000 Tonnes 4129 122983 3.4

n . GUJARAT STATE \T A GLANCE
Sr. ItemNo.
1 2
3 AGRlCfULTURE (Concld.)(Average of 1976-77, 1977-78 and 1978-79) Out-turn o f principal crops3.18 Groundnut3.19 C otton..
3.20 Tobacco
4 ANIMAL HUSBANDRY-19724.1 Total Livestock4.2 Total Cattle4.3 Cattle
(i) Males over 3 years(ii) Females over 3 years
4 .4 Total Buffaloes4 .5 Buffaloes
(i) Males over 3 years(ii) Females over 3 years
4 .6 Total Sheep and goats4 .7 Total Horses and ponies4 .8 Other Livestock4 .9 Total Poultry4.10 Tractors4.11 Oil engines with pumps for irrigation purposes

COMPARISON WITH INDIA {Contd.)
Unit Gujarat India Comparison with India (as percentage to India)
3 4 5 6
*000 Tonnes 1828 5913 30.9’000 bales of 1891 7003 27.0170 Kg. each’000 Tonnes 148 455 32.5
’000 Nos. 15098 353379 4.3’000 Nos. 6457 178380 3.6
’000 Nos. 3065 74485 4.1’000 Nos. 1812 56404 3.2’000 Nos. 3468 57428 6.0
’000 Nos 43 8066 0.5’000 Nos. 2047 29242 7.0’000 Nos. 4932 107510 4 .6’000 Nos. 63 941 6.7’000 Nos. 178 9120 2 .0’000 Nos. 2736 138476 2 .0’00 Nos. 79 1660 4.8’000 Nos. 371 1558 23.8

II. GUJARAT STATE AT A GLANCE
Sr. ItemNo.
1
5 FOREST
5.1 Percentage of forest area to total area 1976-77
6 INDUSTRIES AND MINING
6.1 Factories
(a) Working factories-1978(b) Average daily employment-1978 . .
6.2. Results of Annual Survey of Industries 1977-78 (Ceaisus and Sample parts) (P)
(a) Productive Capital . . , .(b) Number of persons employed(c) Gross out-put (ex-factory value) . .(d) Value added by manufacture
7 ELECTRiaTY—1979-80 (?)
7.1 Electricity generated7.2 Electricity consumed7.3 Industrial consumption7.4 Percentage of industrial consumption to total con
sumption.
10

COMPARISON WITH INDIA ^Contd.)
Unit Gujarat India Comparison with India (as percentage to India)
Percentage 10 23
Nos.’000 Nos.
9836589
1239416358
7.99.3
Rs. in crores In ’000 Rs. in crores Rs. in crores
2323649
4291846
269197093
388608126
8.69.1
11.010.4
Million KWH Million KWH Million KWH Percentage
893273064720
64.60
104716782264667759,67
8.59.3
10.1
11

n . GUJARAT STATE AT A GLANCE
Sr. ItemNo.
8 JOINT STOCK COMPANIES—1978-79 (P)
8.1 Joint Stock Companies at work8.2 Paid up capital . .
9 BANKS—AS ON 30fh JUNE—1980
9.1 Banking offices of commercial banks9.2 Population per bank office
10 CO-OPERATION—1977-78
10.1 Number of societies10.2 Number of members10.3 Working capital of co-operative societies . .10.4 Advances by agricultural credit societies.
11 TRANSPORT AND COMMUNICATIONS—1977-78
11.1 (a) Total Railway Length(b) Railway Length per 100 sq. kms.
11.2 (a) Total length of surfaced roads(b) Length of surfaced roads per 100 sq. kms.
11.3 (a) Motor vehicles per 100 sq. kms. of surfaced roads.(b) Motor vehicles per 100 sq. kms. of area(c) Motor vehicles per lakh of Estimated mid-year
population (1977)
1 2

COMPARISON WITH INDIA (Concld.)
Unit
3
Gujarat
4
India
5
Comparison with India (as percentage to India)
6
Number 2546 51051 5.0Rs. in Million 5210 118780 4.4
Number 2243 32419 6.9’000 12 17
’000 Nos. 27 300 9 .0In lakhs 63 931 6.8Rs. in crores 2158 16691 12.9Rs. in crores 139 1274 10.9
’000 Kms. 5.6 60.7 9 .2Kms. 2 .9 1.9’000 Kms. 26 612 4 .2Kms. 13.3 18.6Number 1046 539Number 138 100 ••
Number 888 527
13

ni. K E l STAnSTIC S O F GUJARAT ECONOMY
STATE DOMESTIC PRODUCT A N D POPULATION
Year State D(Ome- stic Products at 1970-71 prices(Rs. in CTores)
Per Capita Domestic product at 1970-71 prices (In R s.)
Estimated Population as on1 st March (In lakhs)
1 2. 3 4
1970-71 2189 829 266
1971-72 2256 835 272
1974-75 1900 657 291
1975-76 2439 827 298
1976-77 (p) 2475 822 304
1977-78 (p) 2607 846 311
1978-79 (p) 2785 884 317
1979-80 (qO 2741 854 324
(P) = Prov/isional
(Q) = Quick Estimates
14
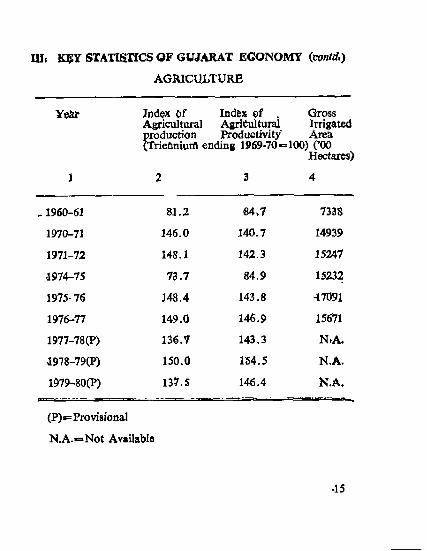
fflt K5Y STATttlTICS OF GUJARAT ECONOMY (co/i rf.)
AGRICULTURE
Year Index Of Index ©f , GrossAgricultural AgrifeultuiJd Irrigatedproduction Productivity Area(Triefimurfl ending 1969-70=100) (’00
Hectares)
1960-61 81.2 «4v7 7338
1970-71 146.0 140.7 14939
1971-72 148.1 142.3 15247
1974-75 73.7 84.9 15232
1975-76 148.4 143.8 47091
1976-77 149.0 146.9 15671
1977-78(P) 136.V 143.3 N.A.
i978-79(P) 150.0 154.5 N.A.
1$79-80(P) 13?.S 146.4 N.A.
(P)=ProviBional
N.A.«=Not Availabla
■15
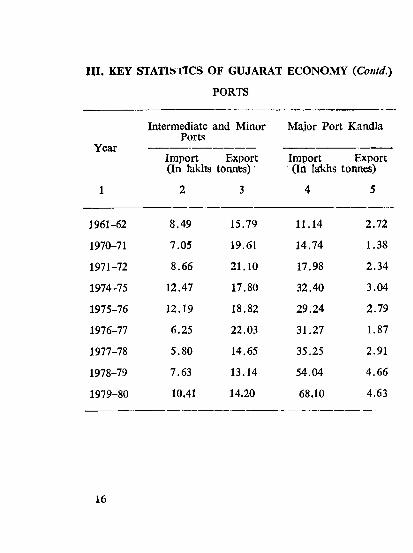
HI. KEY STATlSllC S OF GUJARAT ECONOMY {Contd.)
PORTS
Year
Intermediate and Minor Ports
Major Port Kandla
Import Export (In lakhs tonnes)'
Import Export (In laldis tonnes)
1 2 3 4 5
1961-62 8.49 15.79 11.14 2.72
1970-71 7.05 19.61 14.74 1.38
1971-72 8.66 21.10 17.98 2.34
1974-75 12.47 17.80 32.40 3.04
1975-76 12.19 18.82 29.24 2.79
1976-77 6.25 22.03 31.27 1.87
1977-78 5.80 14.65 35.25 2.91
1978-79 7.63 13.14 54.04 4.66
1979-80 10.41 14.20 68.10 4.63
1 6

ra . KEY STATISTICS OF GUJARAT ECONOMY {Contd).
BANKING
As on 31st December
Year Scheduled Deposits bank
offices (Rs. in crores)
Bank Credit
(Rs. in crores)
1 2 3 4
1962 339 150 95
1970 1008 510 302
1971 1181 579 320
1974 1525 853 534
1975 1644 984 600
1976 1848 1255 748
1977 2043 1524 824
1978 2143 1882 1028
1979 2204 2180 1190
R - 4 0 —217

m. KEY STATISTICS OF GUJARAT ECONOMY {Contd.')
LABOUR
Year Number of Strikes and Lockouts
Total number of workers affected
Number ofMandayslost
1961 88 46260 89014
1970 80 48160 324072
1971 90 31245 142090
1974 131 43774 408448
1975 61 12253 608854
1976 56 6353 43235
1977 162 31682 297304
1978(F) . . 174 33433 340767
1979(F) . . 219 45689 532605
(P)=Provisional
18

n i . KEY STATISTICS OF GUJARAT ECONOMY(Con/fif.)
EMPLOYMENT
'i ’ear No. of Registration during the
year
(In ’000)2
No. placed in employment during
the year
(In ’000)3
No. on Live register at the end of
the year
(In ’000)4
1960-61 122 13 59
1970-71 198 21 158
197H-72 195 22 179
1974-75 246 16 301
1975-76 235 14 315
197(6-77 236 16 414
1977-78 207 15 405
1978-79 222 21 418
1979-80 2^0 22 437
19
Pupils (’000)
Year Primary Secondary Higher Others TotalSecondary
1 2 3 4 5 6
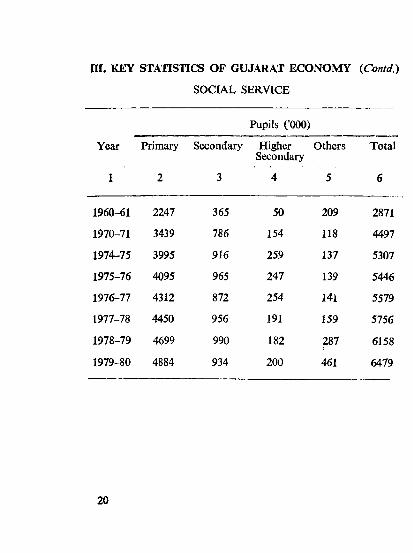
ffl. KEY STAnSTICS OF GUJARAT ECONOMY {Contd.)
SOCIAL SERVICE
1960-61 2247 365 50 209 2871
1970-71 3439 786 154 118 4497
1974-75 3995 916 259 137 5307
1975-76 4095 965 247 139 5446
1976-77 4312 872 254 141 5579
1977-78 4450 956 191 159 5756
1978-79 4699 990 182 2871
6158
1979-80 4884 934 200 461 6479
20

in . KCEY STATISTICS OF GUJARAT ECONOMY/Conr</.)
ELECTRICITY
Year InstalledCapacity(MW)
Electricity generated (In lakhs KWH)
Number of towns and villages electrified
1 2 3 4
1960-61 333 12712 823
1970-71 907 41762 4087
19711-72 904 40481 4886
1974-75 1173 55305 6024
1975-76 1361 55876 6307
1976-77 1595 63613 7108
1977-78 1711 71343 8121
1978-79 2216 79906 9464
1979-80(P) 2212* 89320 10867
(P)=Provisional* The decrease is due to slight decrease in steam Units,
(for details see Table N o. 9.1)Notte ; From 1973-74 the share of nuclear generation and
installed capacity of Tarapore Station, being a Central Government Project, has not been included.
21

n i. KEY STATISTICS OF GUJARAT ECONOMY (Contd.)
INDUSTRIES
Year Number ofWorkingFactories
Salt Production
(In ’00 Tonnes)
Cotton-cloth Production (In lakhs
Mts.)
1 2 ■3 4
1961 3840 17319 13665
1970 5544 33421 12903
1971 5817 30140 12213
1974 7597 37890 (P) 14089 (P)
1975 8040 39660 (P) 12801 (P)
1976 8861 24590 (P) 11816 (P)
1977 9508 29263 (P) 13065 (P)
1978 9836 35555 (P) 13647 (P)
1979 10611 53145 (p) 9906 (p)
(P)=Provisional
22

in. aCEY STATISTICS OF GUJARAT ECONOMY (Contd.)
TRANSPORT AND COMMUNICATION
Yeatr
1
Surfaced roads
2
Number of motor vehicles on road
3
196(0-61 . . 11930 36303
197f0-7l . . 17120 120842
1971-72 . . 18251 140938
19T4-75 . . 23040 206313
1975-76 . . 23822 228035
197^6-77 . . 25086 248491
1977-78 .. 26252 271910
197/8-79 .. 27519 308119
197/9-80 .. 29895 358109
23

m . KEY STATISTICS OF GUJARAT ECONOMY (Co/»c/</.)
PRICES
Consumer Price Index Number for Ahmadabad Centre (Base 1960=100)
Year Industrial workers Urban Non-manual employees
1 2 3
1970 175 171
1971 178 171
1974 294 259
1975 301 277
1976 276 261
1977 305 284
1978 320 298
1979 339 312
1980 368 343
24

1.1. AREA A N D POPULATION BY STATES/ UNION TERRITORIES, 1971
25
1. Area and Population
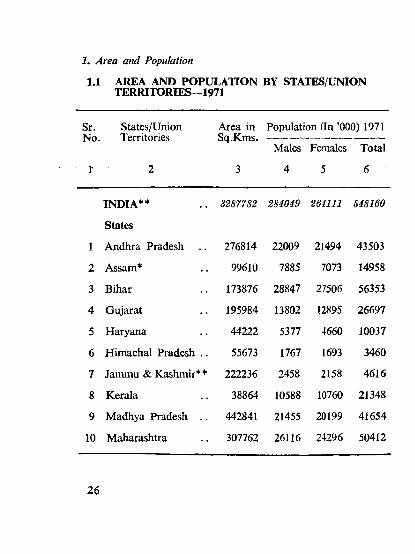
1.1 AREA AND POPULATION BY STATES/UNIONTERRITORIES—1971
Sr.No.
States/UnionTerritories
Area in Sq.Kms.
Population fin ’000) 1971
Males Females Total
t 2 3 4 5 6
INDIA** 3287782 284049 264111 548160
States
1 Andhra Pradesh 276814 22009 21494 43503
2 Assam* 99610 7885 7073 14958
3 Bihar 173876 28847 27506 56353
4 Gujarat 195984 13802 12895 26697
5 Haryana 44222 5377 4660 10037
6 Himachal Pradesh .. 55673 1767 1693 3460
7 Jammu & Kashmir** 222236 2458 2158 4616
8 Kerala 38864 10588 10760 21348
9 Madhya Pradesh .. 442841 21455 20199 41654
10 Maharashtra 307762 26116 24296 50412
26

1. Area and Population
1.1 AREA AND POPULATION BY STATES/UNIONTERRlTORIES-1971 (Contd.)
Sf. States/Union No. Territories
1
11 Manipur
12 Meghalaya
13 Karnataka
14 Nagaland
15 Orissa
16 Punjab
17 Rajasthan
18 Tamil Nadu
19 Tripura
20 Uttar Pradesh
21 West Bengal
22 Sikkim
Area in Population (in ’000) 1971Sq. K r a s .----------------------------------
Males Females Total
3 4 5 6
22356 542 531 1073
22489 521 491 1012
191773 14972 14327 29299
16527 276 240 516
155782 11041 10904 21945
50362 7267 6285 13552
342214 13484 12281 25765
130069 20828 20371 41199
10477 801 755 1556
294413 47017 41325 88342
87853 23436 20876 44312
7299 113 97 210
27

1. Area and Population
1.1 AREA AND POPULATION BY STATES/UNIONTERRITORIES-1971 iconcld.)
Sr.No.
States/UnionTerritories
Area in Sq.Kms.
Population (In 1971
’000)
Males Females Total
1 '2 3 4 5 6
Union Territories
1 Andaman and Nicobar Islands 8293 70 45 115
2 Arunachal Pradesh.. 83578 251 216 467
3 Chandigarh 114 147 110 257
4 Dadra and Nagar Haveli 491 37 37 74
5 Delhi 1485 2258 1808 40666 Goa, Daman and
Diu 3813 431 427 8587 L. M. and A.
Islands 32 16 16 328 Pondicherry 480 237 235 472
* Includes Mizo district now constituted as Union Territory of Mizoram.
** Population figures exclude population of areas under unlawful occupation of Pakistan and China where census could not be undertaken.
Source :—Census of India, 1971, General Population Tables.
28
1. Area and Population
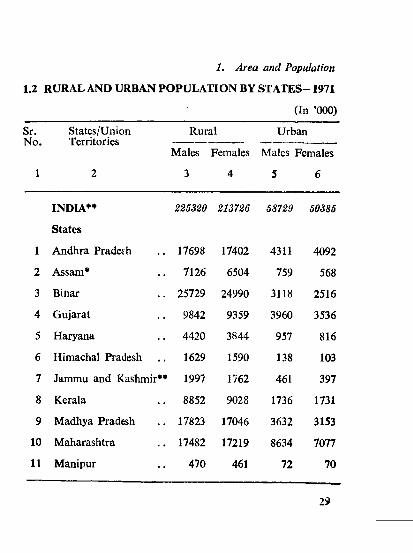
1.2 RURAL AND URBAN POPULATION BY STATES- 1971
(In ’000)
Sr.No.
States/UnionTerritories
Rural Urban
Males Females Males Females
1 2 3 4 5 6
INDU** 225320 21S726 58729 50385
States
1 Andhra Pradesli 17698 17402 4311 4092
2 Assam* 7126 6504 759 568
3 Binar 25729 24990 3118 2516
4 Gujarat 9842 9359 3960 3536
5 Haryana 4420 3844 957 816
6 Himachal Pradesh 1629 1590 138 103
7 Jammu and Kashmir** 199? 1762 461 397
8 Kerala 8852 9028 1736 1731
9 Madhya Pradesh 17823 17046 3632 3153
10 Maharashtra 17482 17219 8634 7077
11 Manipur 470 461 72 70
29

1.2 RURAL AND URBAIN POPULATION BY STATES—1971 (Contd.)
(In ’000)
1. Area and Popttlationi
5r. States/Union! o. Territories
1
Rural Urban
Males Fennales Males Females
3 4 5 6
12 Meghalaya . . 442 423 79 68
13 Karnataka . . 1J249 10927 3723 3400
14 Nagaland . . 241 224 35 16
15 Orissa . . 10041 10058 1000 845
16 Punjab . . 5534 4802 1732 1483
17 Rajasthan . . 11061 10162 2423 2120
18 Tamil Nadu . . 14439 14295 6389 6076
19 Tripura . . 717 677 84 78
20 Uttar Pradesh . . 40214 35739 6802 5586
21 West Bengal . . 17174 16171 6262 4705
22 Sikkim . . ]01 89 12 8
Union TerriJories
1 Andaman and HicobarIslands . . 5 3 36 17 9
30

1.2 RURAL A ND UIRB.AM POPULATIONBY STATES—1971 {Concld.)
(In ’000)
1. Area and Population
Sr.No.
States/U niom Territories
Rural Urban
Miles Femiles Males Females
1 2 3 4 5 6
2 Arunach;al Pradesh . . 239 211 12 5
3 Chandigarh 15 10 133 100
4 Dadra and Nagar Haveli 37 37
5 Delhi 230 189 2028 1619
6 Goa, Daman and Din 311 320 120 107
7 L. M. and A. Islands 16 16
8 Pondicherry 138 136 99 99
-♦Includes Mizo district now constituted as Union Territory of Mizorem.
♦’♦Population figures exclude population of areas under unlawful occupation of Pakistan and China where Census could not be undertaken.
Somrce .‘—Census of India, 1971, General Population Tables.
31

1.3 NUMBER OF RESIDEiSTrAL HOUSES, HOUSEHOLDS INHABITED VILLAGES AND TOWNS BY STATES/ UNION TERRITORIES -1971
1, Area and Population
Sr.No.
States/UnionTerritories
Numberof
residentialhouses
Numberof
households
Numberof
Inhabitedvillages
Numberof
towns
1 2 3 4 5 6
ALL INDIA 90779509 100470U9 575936* 3126
States
1 Andhra Pradesh . . 8041925 8871339 27221 224
2 Assam ** . 2499658 2504576 2277A 74
3 Bihar . 8376599 9837901 67566 202
4 Gujarat . 4556974 4684456 18275 216
5 Haryana . 1470426 1596825 6731 65
6 Himachal Pradesh 625512 654157 16916 36
7 Jammu and Kashmir . 666753 763499 6503 45
8 Kerala . 3418244 3543129 1268 8S
9 Madhya Pradesh 6822767 7740289 70883 2sa
33

1.3 NUMBER OF RESIDENTIAL HOUSES, HOUSEHOLbS INHABITED VILLAGES AND TOWNS BY STATES/ UNION TERRITORIES—1971 iContd.)
1. Areti and Populafioh
Sr. States/UDion No, Territories
Number Number Number NumM «*of of
rdbiden- house- tial holdshouses
3 4
of Inhabitedvillages
5
oftown
JO Maharaslftra .. 8529897 9432769 35778 289
n ManipUi' ' . . 177535 182593 194$ 8
12 MeghalAS^ 193059 206285 4583
13 Karnataka . . 4718089 5243694 26826 245
14 Nagaland .. 104055 104036 960 3
15 Orissa .. 3758551 4187454 4^92 1
16 Punjab ^ 211704> 2307174 121 8 10
L7 Rajasthan .. 4326680 4503898 33305 157
18 TamiLNadu . . 7708173 t
8593049 m p 4l?>
19 Tripura ... 24403.4. 272811 4727
33
R-—40—3
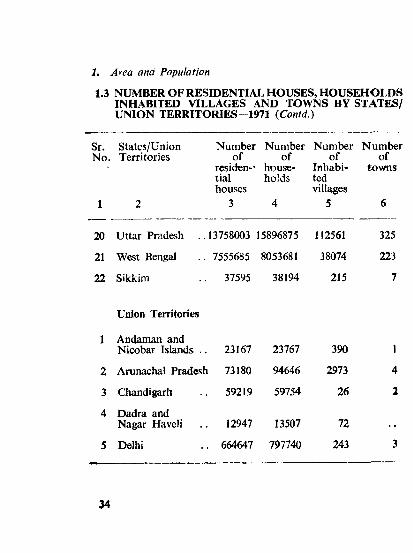
1.3 NUMBER OF RESIDENTIAL HOUSES, HOUSEHOLDS INHABITED VILLAGES AND TOWNS BY STATES/ UNION TERRITORIES—1971 {Conld.)
1. Area am Population
Sr.No.
States/UnionTerritories
Numberof
residen-’tialhouses
Numberof
households
Numberof
Inhabitedvillages
Numberof
tovwis
1 2 3 4 5 6
20 Uttar Pradesh 13758003 15896875 112561 325
21 West Bengal 7555685 8053681 38074 223
22 Sikkim
Union Territories
37595 38194 215 7
1 Andaman and Nicobar Islands .. 23167 23767 390 1
2 Arunachal Pradesh 73180 94646 2973 4
3 Chandigarh 59219 59754 26 2
4 Dadra and Nagar Haveli 12947 13507 72
5 Delhi 664647 797740 243 3
34

1.3 NUMBER OF RESIDENTIAL HOUSES, HOUSESHOLDS INHABITED VILLAGES AND TOWNS BY STATES/ UNION TERRITORIES -1971 {Concld.)
1. Area and Population
Sr.No
States/Union . Territories
Numberof
residentialhouses
Numbero f
households
Numberof
Inhabitedvillages
Numberof
towns
1 2 3 4 5 6
6 Goa, Daman and Diu . 153473 165799 409 13
7 L. M. and A.Islands 5160 5310 10
8 Pondicherry 80459 90892 333 6
♦Includes three villages of Manipur details of which are not available.
♦♦Includes Mizo district which now consitutes a Part of the Union Territory of Mizoram,
AoMfcc;—Census of India, 1971, General Population Tables.
35

1.4 POPULATION, SEX RATIO, DENSITY AND GROWTH RATE OF STATES/UNION TERRITORIES—1971
1. Area and Population
Sr. India/State/N o. Union Territory
Population(In .’000)
SexRatio(fen^ale§per1000males)
DensityofpopulationperSq.Km.
* Growth Rate 1961- 19 ll
1 2 3 4 5 6
INDIA 548160 930 177** 24.80
States
1 Andhra Pradesh . . 43503 977 157 20.90
2 Assam* . 14958 897 150 34.71
3 Bihar . 56353 954 324 21.31
4 Gujarat . 26697 934 136 29.39
5 Haryana . 10037 867 227 32.33
6 Himachal Pradesh . 3460 958 62 23.04
7 Jammu and Kashmir . 4617 878 N.A. 29.65
8 Kerala . 21347 1016 549 26.29
36

1. Area and Population
1.4 POPULATION, SEX RATIO, DENSITY AND GROWTHRATE OF STATES/UNION TERRITORIES—1971{Contd.)
Sr. India/State/No, Union Territory
Population(In’000)
SexRatio(Femalesper1000males)
DensityofpopulationperSq.Km.
GrowthRate1961-1971
1 2 3 4 5 6
9 Madhya pradesh . 41654 941 94 28.67
10 Maharashtra . 50412 930 164 27.45
11 Manipur . 1073 980 48 37.53
12 Meghalaya . 1012 942 45 31.50
13 Karnataka . 29299 957 153 24.22
14 Nagaland . 516 871 31 39.88
15 Orissa . 21945 988 141 25.05
16 Punjab . 13551 865 269 21,70
17 Rajasthan . 25766 911 75 27.83
18 Tamil Nadu . 41199 978 317 22.30
37

1. Area and Population
1.4 POPULATION, SEX RATIO, DENSITY AND GROWTHRATE O F STATES/UNION TERRITORIES—1971iContd.)
Sr. India/Staite/ No. Union
Territory
Population(In
. ’000)
SexRatio(Femalesper1000males)
Densityofpopu- ia tion . perSq.Km.
GrowthRate1961-.1971
1 2 3 4 5 6
19 Tripura , 1556 973 149 36.28
20 Uitar Pradesh S8341 879 300 19.79
21 West Bengal 44312 891 504 26.87
22 Sikkim 863 30 29.38
Union TerTitories
1 Andaman and Nicobar Islands 115 644 14 81.17
2 Arunachal Pradesh 468 861 6 38.91
3 Chandiganli 257 749 2257 114.59
4 Dadra and Nagar Ha’veli . . 74 1007 151 27.96
38

1. Area and Population.
1.4 POPULATION, SEX RATIO, DENSITY AND GROWTHRATE OF STATES/UNION TERRITORIES—1971iConcld.)
Sr. India/State/ No. Union
Territory
Population(In’000)
SexRatio(Femalesper1000males)
DensityofpopulationperSq.Km.
GiowthRate1961-1971
1 2 3 4 5 6
5 Delhi ..4066 801 2738 52.93
6 Goa, Daman and Diu . . 858 989 225 36.88
7 L.M. and A. Islands . . 32 978 994 31.95
8 Pondicherry . . 472 989 983 27.81
* Includes Mizo district which now constitutes a part of the Union Territory of Mizoram,
** Excluding Jammu and Kashmir ""as comparable figure of area and population are not available for that state. N .A .—Not Available.Source Census of India, 1971.
39

1.5 POPULATION, SEX RATIO, DENSITY AND GROWTH RATE OF STATES/UNION TERRITORIES-1981 CENSUS
(Provisional Figures)
1. Area and Population
Jr. India/State/ '«lo. Union Terri
tory
1 2
Population(In’090)
3
Sex Ratio (Females per • 1000 males)
4
Densityofpopu-iationperSq.Km.
5
GrowthRate1971-1981
6
INDIA 683810 935 221* + 24.75
States
i Andhra Pradesh 53404 975 194 +22.76
2 Assam 19903 900 254 + 36.09
3 Bihar 69823 947 402 + 23.90
4 Gujarat 33961 942 173 +27.21
5 Haryana 12851 877 291 +28.04
6 Himachal Pradesh
4238 988 76 +22.46
7 Jammu and Kashmir
5982 953 N .A. +29.57
8 Karnataka 37043 963 193 +26.43
9 Kerala 25403 1034 654 + 19.00
40

1.5 POPULATION, SEX RATIO, DENSITY AND GROWTH RATE OF STATES/UNION TERRITORIES ! 981 (Contd.)
1. Area and Population
Sr.No.
1
India/State/ Union Territory
2
(Provisional figures)
Popula- Sex tion Ratio (In (Females ‘000) per
1000 males)
3 4
DensityofpopulationperSq. Km.
5
GrowthRate1971-1981
6
10 Madhya pradesh 52132 941 118 + 25 .15
11 Maharashtra 62694 939 204 + 24.36
12 Manipur 1434 972 64 +33.65
13 Meghalaya 1328 956 59 + 31.25
14 Nagaland 773 867 47 +49.73
15 Orissa 26272 982 169 + 19.72
16 Punjab 16670 886 331 +23.01
17 Rajasthan 34103 921 100 + 32.36
18 Sikkim 316 836 44 + 50.44
19 Tamil Nadu 48297 978 371 + 17.23
41

1.5 POPULATION, SEX RATIO, DENSITY AND GROWTH RATE OF STATES/UNION TERRITORIES-1981 {Contd).
(Provisional figures)
i . Area and Population
Sr. India/State/ N o. Union Terfi- ,
tory
Popula- . tiqn
(In ‘000)
SexRatio(Femalesper1000males)
DensityofpopulationperSq. Km.
Growth Rate . 1971- 1981
1 2 3 4 5 6
20 Tripura 2060 948 196 + 32.37
21 Uttar Pradesh 110858 886 377 + 25.49
22 West Bengal 54485 911 614 + 2 2 .9 6
Union Territories
1 Andaman and Nicobar Islands
188 761 23 + 63.51
2 Anmachal Pradesh
628 870 7 + 34.34
3 Chandigarh 450 770 3948 + 74.95
4 Dadra and Nagar Haveli
104 974 211 + 39.78
42
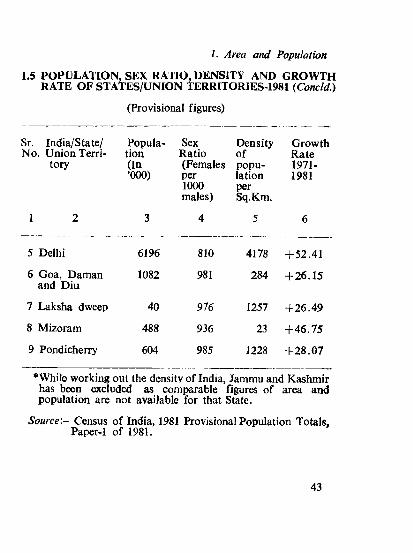
i.5 POPULATION, SEX RATIO, DENSITY AND GROWTH RATE OF STATES/UNION TERRlTORIES-1981 {Concld.)
(Provisional figures)
I. Area and Population
Sr. India/State/ No. Union Terri
tory
Population(In’000)
SexRatio(Femalesper1000males)
DensityofpopulationperSq.Km.
GrowthRate1971-1981
1 2 3 4 5 6
5 Delhi 6196 810 4178 + 52.41
6 Goa, Daman and Diu
1082 981 284 + 2 6 .1 5
7 Laksha dweep 40 976 1257 + 26 .49
8 Mizoram 488 936 23 + 4 6 .7 5
9 Pondicherry 604 985 1228 + 2 8 .0 7
* While working out the density of India, Jammu and Kaslimir has been excluded as comparable figures of area and population are not available for that State.
Source:- Census of India, 1981 Provisional Population Totals, Paper-1 of 1981.
43

1.6 AREA AND POPULATION
J. Area and Population
Sr. Item No.
1
Unit Gujarat India
1961
4
1971
5
1961
6
19'71
7
1 Area
2 Population
(a) Rural
(b) Urban
(c) Total
3 Density
4 Sex Ratio
Sq.Km. 187115 195984 3268090 3287782
In ’000
In ’000
In ’000
Person per Sq.Km.
Femalesper’OOOMales
15316
5317
20633
110
940
19201 360298 439'046
7496 78937 109114
26697 439235 548160
136
934
142
941
178
930
Source ;— Census of India, 1971.
44

1.7 ANNUAL ESTIMATES OF POPULATION PROJECTIONS OF GUJARAT STATE
(In Lakhs)
i . Area and Population
Sr. N o. Year Annual Estimates of Population as on 1st March.
1 2 3
1 1971 266
2 1972 272
3 1973 279
4 1974 285
5 1975 291
6 1976 298
7 1977 304
8 1978 311
9 1979 317
10 1980 324
11 1981 331
Soturce —Report of the Expert Committee on Population Projections, Census of India, 1971 Paper I of 1979.
45
1. Area and Population
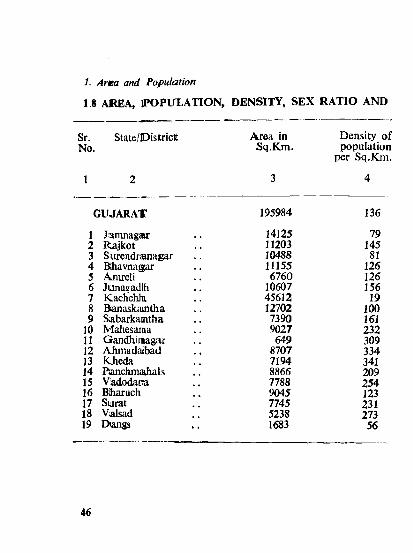
18 AREA, IPOPULATION. DENSITY, SEX RATIO AND
Sr. State/lDistrictt No.
Area in Sq.Km.
Density of population
per Sq.Km.
GUJARAT 195984 136
1 Jamnagar 14125 792 Rajkot 11203 1453 Surendranagar 10488 814 Bhavnagar 11155 1265 Ajnreli 6760 1266 Junagadlh 10607 1567 KacKchhi 45612 198 Bianaskamtha 12702 1009 Sabarkamtha 7390 161
10 Mahesaraa 9027 23211 Gandhiiaagar 649 30912 AJimadaibad 8707 33413 Kheda 7194 34114 Panchmahals 8866 20915 Vadodara 7788 25416 BJiaruch 9045 12317 Suirat 7745 23118 V alsad 5238 27319 Diangs 1683 56
46
1. Area and Population
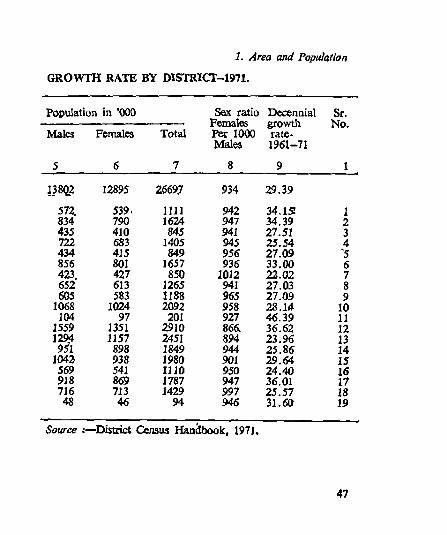
GROWTH RATE BY DlSTRICT-iy71.
Population in ’000 Sex ratio Decennial Sr.Females growth No.
Males Females Total Per 1000 rate*Males 1961-71
5 6 7 8 9 1
138<g 12895 Z6697 934 29,39
572. 539. 1111 942 34.15! 1834 790 1624 947 34.39 2435 410 845 941 27.51 3722 683 1405 945 25.54 4434 415 849 956 27.09 '5856 801 1657 936 33.00 6423, 427 850 10J2 22.02 7652 613 1265 941 27.03 8605 583 1188 965 27.09 9
1068 1024 2092 958 28.14 10104 97 201 927 46.39 11
1559 1351 2910 866. 36.62 121294 1157 2451 894 23.96 139 1 898 1849 944 25.86 14
1042 938 1980 901 29.64 15569 541 JllO 950 24.40 16918 869 1787 947 36.01 17716 713 1429 997 25.57 1848 46 94 946 31.60 19
Source District Census Handbook, 1971.
47

I. Area and Population
1.9 POPULATION, DENSITY, SEX RATIO AND
(Provisional
Sr. State/District No.
Sex ratio Females )er‘ 1000
Males
Decennial growth
Rate * '1971-81
Density of population t>er‘Sq.' KAi.
GUJARAT 942 27.21 173
1 Jamnagar 949 25.09 982 Rajkot 948 26.73 1843 Surendranagar 935 22.23 994 Bhavnagar 958 33.53 1685 Amreli 976 26.75 1596 Junagadh 955 26.68 1987 Kachchh 1000 23.51 238 Banaskantha 947 31.62 1319 Sabarkantha 977 26.14 203
10 Mahesana 971 21.61 28211 Gandhinagar 928 43.28 44312 Ahmadabad 890 31.96 44113 Kheda 915 22.67 41814 Panchmahals 958 25.14 26115 Vadodara 916 28.79 32716 Bharuch 943 16.76 14317 Surat 925 39.41 32518 Valsad 982 23.95 33819 Dangs 972 21.03 65
48
Figures )
i . Area and Population
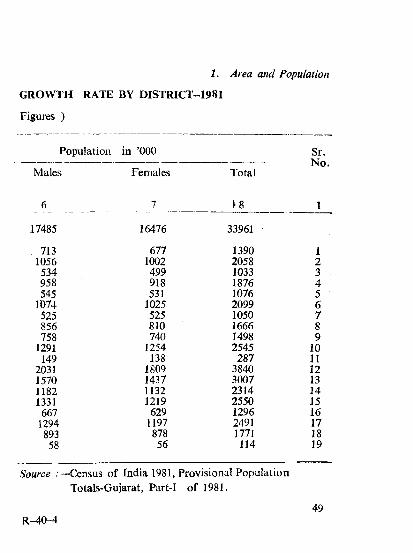
GROWTH RATE BY DISTRICT-1981
Population in ’000
Males Females Total
Sr.N o,
17485 16476 33961
713 677 1390 11056 1002 2058 2
534 499 1033 3958 918 1876 4545 531 1076 5
1074 1025 2099 6525 525 1050 7856 810 1666 8758 740 1498 9
1291 1254 2545 10149 138 287 11
2031 1809 3840 121570 1437 3007 131182 1132 2314 141331 1219 2550 15667 629 1296 16
1294 1197 2491 17893 878 1771 1858 56 114 19
Source Census of India 1981, Provisional Population Totals-Gujarat, Part-I o f 1981.
49R-40-4

1. Area and Population
1.10 GROWTH OF POPULATION IN GUJARAT
(’000)
Sr. Year Rural Urban TotalNo.
Males Females Males Females Males Females
1 2 3 4 5 6 7 8
] 1901 3622 3443 1033 997 4655 4440
2 1911 4075 3842 963 924 5038 4766
3 1921 4171 3953 1062 989 5233 4942
4 1931 4689 4446 1218 1137 5907 5583
5 1941 5342 5099 1718 1542 7060 6641
6 1951 6026 5809 2306 2122 8332 7931
7 1961 7830 7486 2804 2513 10634 9999
8 1971 9842 9359 3960 3536 13802 12895
Source : Census of India, 1971.
50
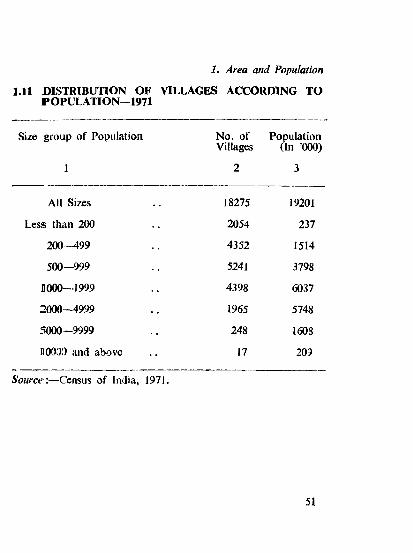
1.11 DISTRIBUTION OF VILLAGES ACCORDING TO POPULATION—1971
1. Area and Population
Size group of Population
1
No. of Villages
Population (In ’000)
All Sizes 18275 19201
Less than 200 2054 237
200—499 4352 1514
500—999 5241 3798
1000—1999 4398 6037
2000—4999 1965 5748
5000—9999 248 1608
10030 and above 17 209
Source :—Census of India, 1971.
51

112 DISTRIBUTION OF TOWNS/URBAN AGGLOMERATIONS—1971
1. Area and Population
Size Group of Population No. of Towns/Urban
Agglomerations
Population :In ’000)
1 2 3
All Sizes 216 7497
100000 and above 7 3381
50000—99999 18 1174
20000 -49999 42 1328
10000—19999 73 1053
5000—9999 71 540
Less than 5000 .. 5 21
Source: - Census of India, 1971,
52
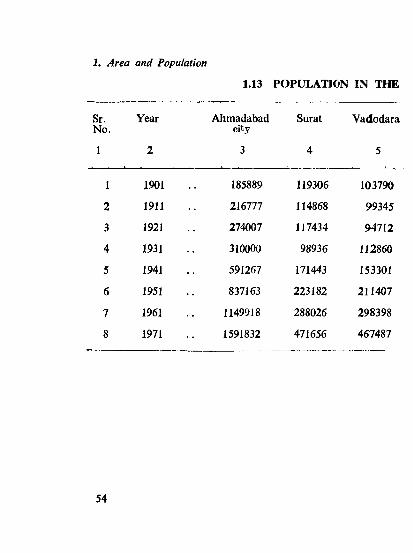
1.13 POPULATION IN THE CITIES OF THE STATE
1. Area and Population
1.13 POPLfLATION IN THE
Sr.No.
Year Ahmadabadcity
Surat Vadodara
1 2 3 4 5
1 1901 185889 119306 103790
2 1911 216777 114868 99345
3 1921 274007 117434 94712
4 1931 310000 98936 112860
5 1941 591267 171443 153301
6 1951 837163 223182 211407
7 1961 1149918 288026 298398
8 1971 1591832 471656 467487
54

1. Area and Population
CITIES OF THE STATE
Rajkot Bhavnagar Janmagar Nadiad Sr.No.
6 7 8 9 1
36151 56442 53844 31435 1
34194 60694 44887 27145 2
45845 59392 42495 31939 3
59112 75594 55056 34584 4
66353 102851 71588 46510 5
132069 137951 104419 62645 6
J94145 176473 148572 78952 7
300612 225974 214816 108269 8
Somce :— Census of India, 1971.
55

J. Area and Population
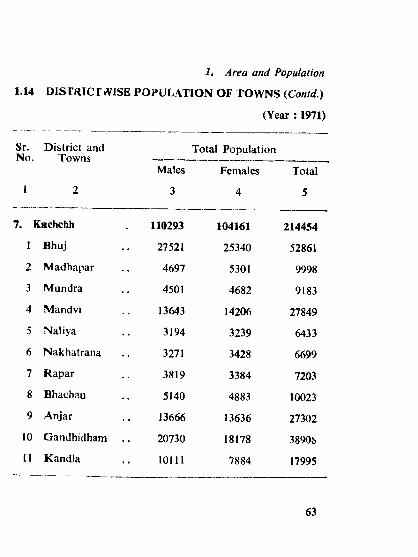
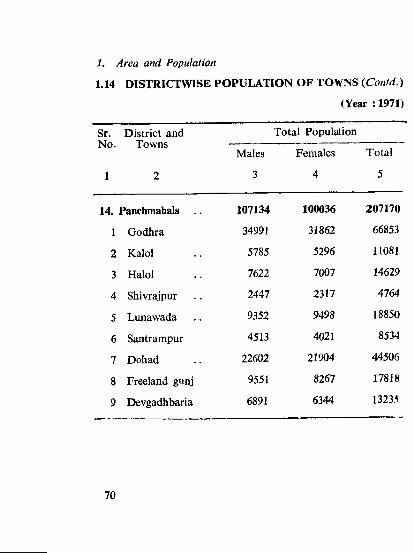
1.14 DISTRICT^VISE POPULATION OF TOW>S
(Year : 1971)
Sr. District and Total Population■Nu. lowns
Males Females Total
1 2 3 4 5
. Jamnagar 203143 189264 392407
1 Jamnagar City .. 112336 102480 2148162 Bedi 6684 6140 128243 Sikka 6897 6343 132404 Lalpur 3850 3664 75145 Jamjodhpur 8517 8068 165856 Bhanvad 6846 6663 135097 Dwarka 9185 8616 178018 Mithapur 7986 7586 155729 Okha Port 5697 4990 10687
10 Beyt 1799 1872 367111 Khambhalia 10237 9736 1997312 Salaya 6456 6561 1301713 Jodiya 4454 4823 927714 Dhrol 5740 5587 1132715 Kalavad 6459 6135 12594
56

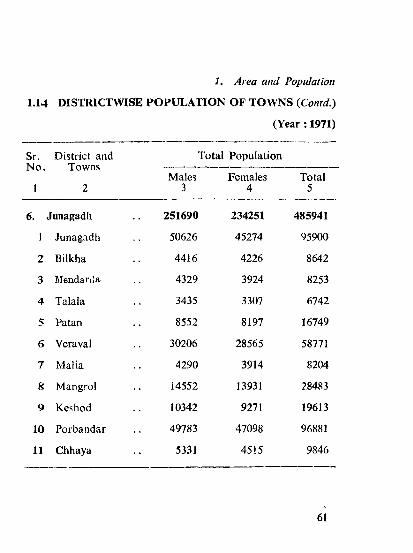
1. Area and Population
1.14 DISTRICTWISE POPULATION OF TOWNS {Contd.)
(Year : 1971)
Sr. District and N o . Towns
Total Population
Males Females
3 4
Total
5
Rajkot 321478 301758 623236
1 Rajkot City 156528 144084 300612
2 Gondal 28824 26505 55329
3 Jetpur 21427 20516 41943
4 Jetalsar 4992 4515 9507
5 Dhoraji 29770 30310 60030
6 Upleta 17707 17619 35326
7 Paddhari 2696 2624 5320
8 Morvi 31863 29113 60976
9 Tankara 2912 2760 5672
10» Wankaner 14264 13737 28001
11 Jasdan 7579 7082 14661
12 Vinchhiya 2916 2893 5809
57

1. Area and Population
1.14 DISTRICTWISE POPULATION OF TOWNS (jContd.)
(Year : 1971)
Sr. District and N o. Towns
Total Population
Males FerpalQS
3 4
TQtal.
5
3. Surendranagar 118002 110317 22»319
1 Wadhwan 15352 15232 30584
2 Surendranagar . . 34570 32097 66667
3 Limdi 13311 12286 25597
4 Sayla 463 J 4390 9021
5 Chotila 4006 38 J 8 7824
6 Thangadh 6278 5817 12095
7 Halvad 5128 5158 10286
8 Dhrangadhra . . 21542 19249 40791
9 Patdi 5114 4833 9947
10 Khara-ghoda 3116 2677 5793
11 Lakhtar 4954 4760 9714
58

1. Area and Population
1.14 DISTRICTWISE POPULATION OF TOWNS {Contd.)
(Year : 1971)
Sr. District and N o. Towns
Total Population
Males Females Total
3 4 5
4. Bhavnagar
1 BhavnagarVartej Ghogha Talaja Mahuva Savarkundla Gariadhar
8 Palitana9 Sihor
10 Unirala11 Gadhada12 Bo tad13 Paliyad14 Vallbhipur
234100
118438336330565141
2168620447
550014177957525796210
1672029504258
215514
107536315934714884
19902187685144
13178900524795752
1545928013976
449614
22597465226527
1002541588392151054427355185805058
119623217957518234
59

1. Area and Population
1.14 DISTRICTWISE POPULATION OF TOWNS {Contd.)
(Year : 1971)
Sr.No.
District and Towns
Total Population
Males Females Total. 1. , . 2 . . a 4 . . 5. .
5. Amreli 87038 81708 168746
1 Amreli 22979 20815 43794
2 Dhari 6701 6412 13113
3 Chalala 4910 4607 9517
4 Rajula 7797 7335 15132
5 Dungar 2800 2672 5472
6 Jafrabad 4422 4504 8926
7 Kodinar 8510 7776 16286
8 Vadia 4025 3806 7831
9 Bagasara 9711 9288 18999
10 Babra 5026 4726 9152
11 Lathi 5754 5561 11315
12 Damnagar 4403 4206 8609
60
i . Area and Population
1.14 DISTRICTWISE POPULATION OF TOWNS {Contd.)
(Year : 1971)
Sr. District and N o. Towns
1 2
Total Population
Males3
Females4
Total5
6. Junagadh
1 Junagadh
2 Bilkha
3 Mendarda
4 Talala
5 Patan
6 Veraval
7 Malia
8 Mangrol
9 Keshod
10 Porbandar
11 Chhaya
251690
50626
4416
4329
3435
8552
30206
4290
14552
10342
49783
5331
234251
45274
4226
3924
3307
8197
28565
3914
13931
9271
47098
4515
485941
95900
8642
8253
6742
16749
58771
8204
28483
19613
96881
9846
61

1. Area and Population
1.14 DISTRICTWISE POPULATION OF TOWNS {Contd.)
(Year : 1971)
Sr.No.
District and Towns
Total Population
Males Females Total
1 2 3 4 5
6. Junagadh (Concld.)
12 Ranavav 6455 6309 12764
13 Adityana 4398 4003 8401
14 Kutiyana 7185 6946 14131
15 Manavadar 7561 6929 14490
16 Bantvva 7742 7269 15011
17 Vanthli 7565 7281 14846
18 Shahpur 4-;97 4263 8960
19 Visavadar 5740 5284 11024
20 Una 11199 10359 21558
21 Delwada 3286 3386 6672
i l
1. Area and Population
1.14 DISrRICr*ViSE POPULATION OF TOWNS {Contd.)
(Year : 1971)
Sr. District and No. Towns
1
7. Kachchh
1 Bhuj
Madhapar
Mundra
Mandvi
Naliya
6 Nakhatrana
7 Rapar
8 Bhachau
9 Anjar
10 Gandhidham
11 Kandia
Total Population
Males Females Total
3 4 5
110293
27521
4697
4501
13643
3194
3271
3819
5140
13666
20730
10111
104161
25340
5301
4682
14206
3239
3428
3384
4883
13636
18178
7884
214454
52861
9998
9183
27849
6433
6699
7203
10023
27302
3890S
17995
63

1.14 DISTRICTWISE POPULATION OF TOWNS {Contd.)
(Year : 1971)
1. Area and Population
Sr. District and N o, • Towns'
Total Population
Males Females Total
3 4 5
Banaskantha 61658 57931 119589
1 Palanpur 21786 20328 42114
2 Kanodar 2657 2618 5275
3 Deesa 14784 13540 28324
4 Juna Deesa 2978 3044 6022
5 Radhanpur 9351 9009 18360
6 Varahi 2767 2539 5306
7 Bhabhar Nava .. 2970 2857 5827
8 Tharad 4365 3996 8361
64

1. Area and Population
1.14 DISTRl CTWISE POPULATION OF TOWNS {Contd.)
(Year : 1971)
Sr. District and No. Towns
Total Population
Males Females Total
3 4 5
9. Sabarkantba 54806 49157 103963
1 Himatnagar . . 12618 11146 23764
2 Prantij 7479 7023 14502
3 Talod 5821 5114 10935
4 Idar 7627 7006 14633
5 Khedbrahma . . 4715 4143 8858
6 Modasa 11824 10659 22483
7 Dhansura 4722 4066 8788
R -40-565

1. Area and Population
1.14 DISTRlCrW iSE POPUL4TION OF TOWNS {Contd.)
(Year : 1971)
Sr.No.
District and Towns
Total Population
Males Females Total1 2 3 4 5
10. Mahesana 201726 187149 388875
1 Mahesana 27441 24272 51713
2 Kadi 14740 13592 28332
3 Chanasma 7344 7054 14398
4 Harij 5859 5214 11073
5 Patan 33206 31313 64519
6 Sidhpur 20678 20656 41334
7 Unjha 13771 13408 27179
8 Kheralu 7140 6741 13881
9 Vadnagar 9750 9579 19329
10 Visnagar 18082 16781 34863
11 Vijapur 7946 7625 15571
12 Mansa 8353 8009 16362
13 Kalol 27416 22905 50321
66
1, Area and Population
1.14 DISTRICTWISE POPULATION OF TOWNS {Contd.)
(Year : 1971)
Sr. District and No. Towns
Total Population
Males Females
3 4
Total
5
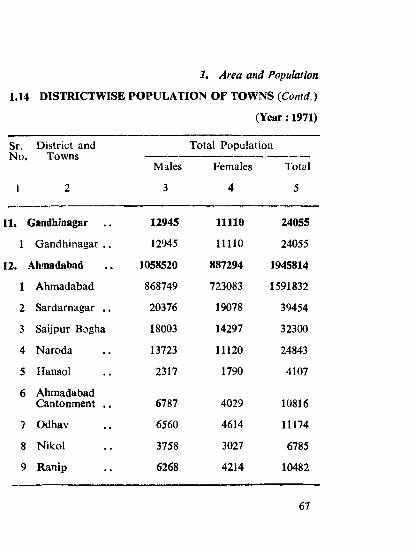
Gandhinagar 12945 11110 24055
1 Gandhinagar . . 12945 11110 24055
Ahmadabad 1058520 887294 1945814
1 Ahmadabad 868749 723083 1591832
2 Sardarnagar . . 20376 19078 39454
3 Saijpur Bogha 18003 14297 32300
4 Naroda 13723 11120 24843
5 Hansol 2317 1790 4107
6 Ahmadabad Cantonment . . 6787 4029 10816
? Odhav 6560 4614 11174
8 Nikol 3758 3027 6785
9 Ranip 6268 4214 10482
67
1. Area and Population
1.14 DISTRICTWISE POPULATION OF TOWNS {Conntd.)
(Year : 111971)
Sr.No.
District and Towns
Total Population
Males Females Tc’otal
1 2 3 4 55
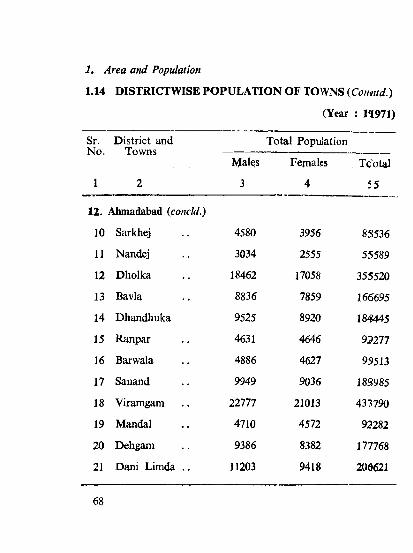
12. Ahmadabad (concld.)
10 Sarkhej 4580 3956 8S536
11 Nandej 3034 2555 55589
12 Dholka 18462 17058 355520
13 Bavla 8836 7859 166695
14 Dhandhuka 9525 8920 184445
15 Ranpar 4631 4646 92211
16 Barwala 4886 4627 95513
17 Sanand 9949 9036 18S985
18 Viramgam 22777 21013 437790
19 Mandal 4710 4572 93282
20 Dehgam 9386 8382 177768
21 Dani Limda . . 11203 9418 206621
68
1. Area and Population
1.14 DISTRICTWISE POPULATION OF TOWNS {Contd.)
(Year : 1971)
Sr. District and No. Towns
Total Population
Males
3
Females
4
Total
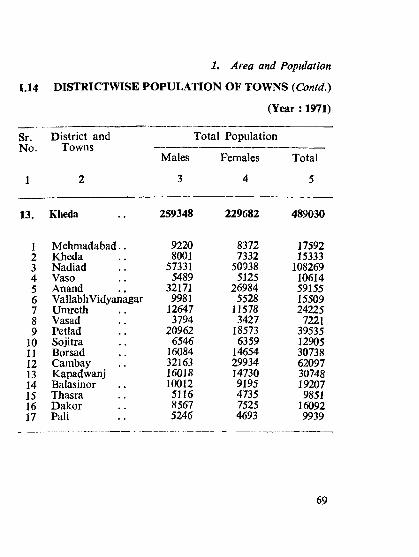
13. Kheda 259348 229682 489030
1 Mehmadabad.. 9220 8372 175922 Kheda 8001 7332 153333 Nadiad 57331 50938 1082694 Vaso 5489 5125 106145 Anand 32171 26984 591556 VallabhVidyanagar 9981 5528 155097 Umreth 12647 11578 242258 Vasad 3794 3427 72219 Petlad 20962 18573 39535
10 Sojitra 6546 6359 1290511 Borsad 16084 14654 3073812 Cambay 32163 29934 6209713 Kapadwanj 16018 14730 3074814 Balasinor 10012 9195 1920715 Thasra 5116 4735 985116 Dakor 8567 7525 1609217 Pali 5246 4693 9939
69
1. Area and Population
1.14 DISTRICTWISE POPULATION OF TOWNS {Contd.)
(Year :1971)
Sr.No.
District and Towns
Total Population
Males Females Total
1 2 3 4 5
14. Panchmahals 107134 100036 207170
1 Godhra 34991 31862 66853
2 Kalol 5785 5296 11081
3 Halol 7622 7007 14629
4 Shivrajpur 2447 2317 4764
5 Limawada 9352 9498 18850
6 Santrampur 4513 4021 8534
7 Dohad 22602 21904 44506
8 Freeland gunj 9551 8267 1781H
9 Devgadhbaria 6891 6344 13235
70

1.14 DISTRICTWISE POPULATION OF TOWNS {Contd,)
(Year : 1971)
1. Area and Population
Sr. District and N o. Towns
1 2
Total Population
Males
3
Females
4
Total
5
15. Vadodara 323751 279454 603205
1 Vadodara City 252460 215027 467487
2 Fertilizemagar 2913 2414 5327
3 Jawaharaagar 3058 2652 5710
(Gujarat Refinery)
4 Karjan 6365 5603 11968
5 Padra , . 12682 11547 24229
6 Vaghodia 4017 3534 7551
7 Dabhoi 19814 18078 37892
8 Sankheda 4149 3824 7973
9 Bodeli 3354 2875 6229
10 Bahadarpur . . 3200 2979 6179
11 Chhota U d^ur 7460 6852 14312
12 Sinor . . 4279 4069 8348
71

1. Area and Population
1.14 DISTRICTWISE POPULATION OF TOWNS {Contd.)
(Year ; 1971)
Sr. District and No. Towns
Total Population
Males Females Total
1 2 3 4 5
16. Bharuch 100203 92811 193014
1 Bharuch 47978 44273 92251
2 Palej 3402 2960 6362
3 Ankleshwar .. 13438 12782 26220
4 Hansot 3858 3778 7636
5 Jambusar 12627 11624 24251
6 Amod 5454 5071 10525
7 Rajpipla 13446 12323 25769
72

1. Area and Population
1.14 DISTRICTWISE POPULATION OF TOWNS {Contd.)
(Year : 1971)
Sr, District and No. Towns
1
Total Population
Males Females Total
3 4 5
17. Surat
1 Surat City
2 Katargam
3 Udhana
4 Olpad
5 Kathor
6 Kosamba
7 Mandvi
8 Songadh
9 Vyara
10 Bardoli
11 Ukai
320525
249902
4172
7662
3227
4328
3999
5370
3828
9695
10025
18317
282127
221754
3789
5722
3068
4198
3714
5175
3338
9215
9237
12917
602652
471656
7961
13384
6295
8526
7713
10545
7166
18910
19262
31234
73

1. Area and Population
1.14 DISTRICTWISE POPULATION OF TOWNS (Concld.)
(Year : 1971)
Sr.No.
District and Towns
Total Population
Males Females Total
1 2 3 4 5
18. Valsad 133651 122765 2564161 Valsad 28649 26317 549662 Abraraa 4333 3770 81033 Atul 2462 2032 44944 Pardi 6580 6163 127435 Vapi 7325 6563 138886 Udwada 2016 2113 41297 Umbergaon . . 4038 3730 77688 Gandevi 6172 6059 122319 Bilimora 17925 16000 33925
10 Navsari 38217 34762 7297911 Jalalpur 3726 3396 712212 Chikhli 2483 2519 500213 Bansda 3632 3476 710814 Dharampur . . 6093 5865 11958
GUJARAT 3960011 3536489 7496500
I Source :—Census of India, 1971.
74

1.15 DISTRIBUTION OF POPULATION BY AGE GROUP 1961 AND 1971

I. Area and Population
1.15 DISTRIBUTION OF POPULATION BY AGE GROUP
Sr.No.
Year Age Groups
0-14 15-59
Males Females Males , Ferrjales
1 2 3 4 5 6
1 1961 4596 4251 5553 5207
2 1971 5986 5508 7129 6668
76

1961 AND 1971
i . Area and Population
(In ’000)
Age Groups
60+ Age not specified Total
Males Females Males Females Males Females
7 8 9 10 11 12
481 539 4 2 10634 9999
686 718 1 1 13802 12895
Source :— 1. Census of India, 1961.2. Census of India, 1971.
77

1.16 POPULATION OF SCHEDULED CASTES AND SCHEDULED TRffiES
1. Area and Population
Sr.N o.
ItemPopulation (In ’OOO)
1961 1971
1 2 3 4
1 Scheduled Castes 1367 1825
2 Scheduled Tribes 2754 3734
3 Total Scheduled Castes and Scheduled Tribes 4121 5559
Source :— 1. Census of India, 1961.2. Census of India, 1971.
78

1,17 POPULATION CLASSIFIED BY LANGUAGES- MOTHER TONGUES-1971

1. Area and Population
1.17 POPULATION CLASSIFIED BY L A N G U ^E S—
Sr.No.
Mother Tongue Total Rural Urban
1 2 3 4 5
1 Gujarati 23856955 17797073 6059882
2 Urdu 579224 93877 485347
3 Kachchhi 405569 299340 106229
4 Kindi 337501 54248 283253
5 Marathi 258069 50282 207787
6 Sindhi 201894 18641 183253
7 Others 1058263 887514 170749
8 All mother tongues 26697475 19200975 7496500
80

MOTHER TONGUES—1971
Percentages to total population Sr.-----------------------------------------------------------No.Total Rural Urban
6 7 8 1
1. Area and Population
89.36 92.69 80.84 1
2.17 0.49 6.47 2
1.52 1.56 1.42 3
1.26 0.26 3.78 4
0.97 0.26 2.77 5
0.76 0.10 2.44 6
3.96 4.64 2.28 7
100.00 100.00 * 100.00 8
Source :— Census of India, 1971.
81R - 4 a - 6
1. Area and Population
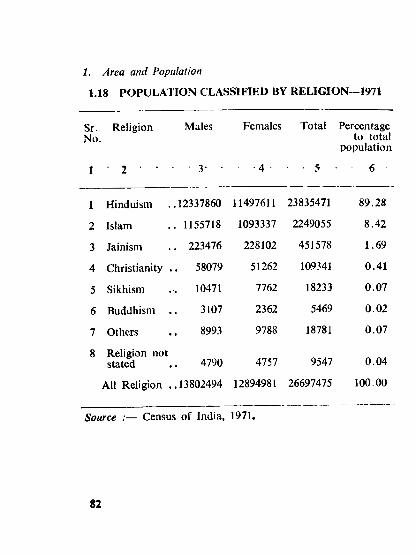
1.18 POPULATION CLASSIFIED BY RELIGION—1971
Sr.No
Religion Males Females Total Percentage to total
population
I • 2 • • • 3- • • -4 ■ - ' 5 •■ 6
1 Hinduism .12337860 11497611 23835471 89.28
2 Islam . 1155718 1093337 2249055 8.42
3 Jainism . 223476 228102 451578 1.69
4 Christianity . . 58079 51262 109341 0.41
5 Sikhism .. 10471 7762 18233 0.07
6 Buddhism . 3107 2362 5469 0.02
7 Others 8993 9788 18781 0.07
8 Religion not stated 4790 4757 9547 0.04
All Religion . .13802494 12894981 26697475 100.00
Source Census of India, 1971.
82
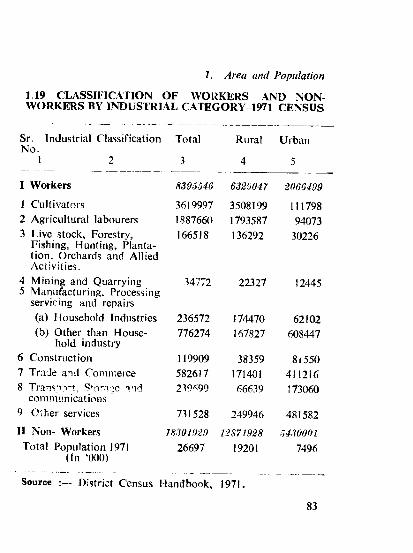
1.19 CLASSIFICATION OF WORKERS AND NONWORKERS BY INDUSTRIAL CATEGORY-1971 CENSUS
1. Area and Population
Sr. Industrial Classification Total No.
Rural Uiban
1 2 3 4 5
I Workers 8395546 6329047 20664991 Cultivators 3619997 3508199 1117982 Agricultural labourers 1887660 1793587 940733 Live stock, Forestry,
Fishing, Hunting, Plantation, Orchards and Allied Activities.
166518 136292 30226
4 Mining and Quarrying5 Manufacturing, Processing
servicing and repairs
34772 22327 12445
(a) Household Industries 2^6512 174470 62102(b) Other than House
hold industry776274 167827 608447
6 Construction 119909 38359 815507 Trade and Conin'.erce 582617 171401 4112168 TraisT.-t-t, S+o-'ije and
communications219 99 66639 173060
9 Olher services 731528 249946 481582II Non- Workers ISSOVJ'ZO V2871928 5430001
Total Population 1971 (fn ‘000)
26697 19201 7496
Source District Census Handbook, 1971.
83

1. Area and Population
1.20 DISTRIBUTION OF WORKERS AND NON-WORKERS
Age Group Total Workers
Males
2
Females
3
Total
4
0—14 372333 145728 518061
1 5 -1 9 776029 191536 967565
20 - 24 955142 180631 1135773
25—29 924054 158541 1082595
30—39 1633069 277187 1910256
4 0 -4 9 1188470 205173 1393643
50—59 755572 108293 863865
604- 467361 55820 523181
Age not stated . . 527 80 607
Total all ages 7072557 1322989 8395546
i4

1. Area and PopiMion
BY BROAD AGE GROUP -1971
Total Non-Workers
Males Females Total
5 6 7
5614350
571578
166916
35156
34312
32464
56088
218270
803
f.729937
5361906
991336
910250
783644
1291319
936343
633338
662993
863
11571992
10976256
1562914
1077166
818800
1325631
968807
689426
881263
1666
18301929
Total Population
Males Females T»>tal
8 9 10
5986683 5507634 11494317
1347607 1182872 2530479
1122058 1090881 2212.939
959210 942185 1901395
1667381 1568506 3235887
1220934 1141516 23635450
811660 741631 155?291
685631 718813 140^444
1330 943 :Z273
13802494 12894981 2669'/475
Source :—Census of India, 1971.
85

2 National and State Domestic Product
2.1 NET DOMESTIC PRODUCT BY INDUSTRY OF
Sr. Industry Group No.
1 2
1970-71
3
1 Agriculture, forestry, logging, fishing, mining and quarrying
17307
2 Manufacturing, construction, electricity, gas and water supply
6790
3 Transport, storage, communication, trade, hotels and restaurants
5454
4 Banking, insurance, estate, ownership of dwellings and commercial services
1683
5 Public administration and defence and other services
3285
6 Net domestic product 34519
86

2 National and State Domestic Product
ORIGIN AT CURRENT PRICES-ALL INDIA
(Rs. in Crores)
1976-77 1977-78 1978-79
5 64
29006
15274
12178
3816
6846
67120
33235
16898
14496
4225
7476
76330
1979-80* Sr.No.
7 1
33287
19597
15671
4661
8213
81429
33934
21828
20347
5054
9211
90374
• Quick estimatesSource :~Central statistical organisation, Government of India,
New Delhi.
87

2. National and State Domestic Product
2.2 NET DOMESTIC PRODUCT BY INDUSTRY OF
Sr.No.
1
Industry Group 1970-71
3
1 Agriculture, forestry, logging, fishing, mining 17307 and quarrying
2 Manufacturing, construction, electricity, gas 6790and water supply
3 Transport, storage, communication, trade, hotels 5454and restaurants
4 Banking, insurance, estate, ownership o f dwelli- 1683ngs and commercial services
5 Public administration and defence and other 3285services
6 Net Domestic product 34519

(Rs. in Crores)
2. National and State Domestic Product
ORIGIN AT 1970-71 PRICES-ALL INDIA
1976-77 1977-78 1978-79 1979-80 Sr.No.
4 5 6 7
18182 20156 20496 18018 1
8878 9348 10353 10068 2
7019 7784 8483 8584 3
2231 2395 2621 2668 4
4309 4496 4760 5054 5
40619 44179 46713 44392 6
♦Quick estimates,Source .—Central statistical organisation, Government of
India, New Delhi.

2.3 STATE DOMESTIC PRODUCT-BY INDUSTRY
2. National and State Domestic Product
Sr. Industry Group 1970-71No.
1 2 3
1 Agriculture, forestry, logging, fishing, mining 1071and quarrying
2 Manufacturing, construction, electricity, gas 456and water supply
3 Transport, storage, communication, trade, 380hotels and restaurants
4 Banking, insurance, estate, ownership o f dwe- 116 llings and commercial services
5 Public administration and defence and other 166services
6 Total state domestic product 2189
90

(Rs. in Crores)_ _ . __1975-76 1976-77 1977-78 1978-79 1979-80 Sr.
No.4 5 6 7 8
1529 1586 1643 1666 1817 1
893 1017 1223 1265 1397 2
717 816 925 1035 1136 3
244 273 306 332 362 4
312 367 407 443 498 5
3695 4059 4504 4741 5210 6
2. National and State Domestic Product
GROUPS-AT CURRENT PRICES
^Provisional**Quick EstimatesSource :—Bureau of Economics and Statistics, Gujarat State.
91
2. National and State Domestic Product
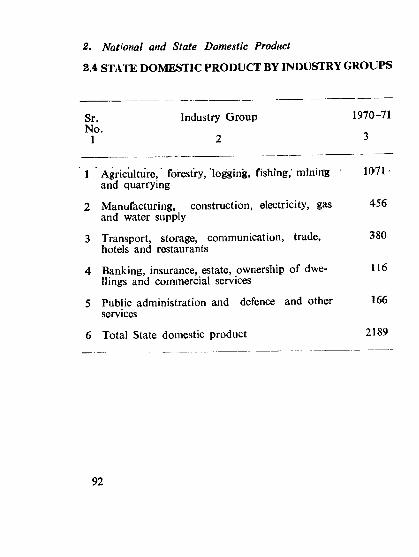
2.4 STATE DOMESTIC PRODUCT BY INDUSTRY GROUPS
Sr. Industry Group 1970-71No.
1 2 3
1 Agriculture, forestry, logging, fishing,' mining 1071 •and quarrying
2 Manufacturing, construction, electricity, gas 456and water supply
3 Transport, storage, communication, trade, 380hotels and restaurants
4 Banking, insurance, estate, ownership of dwe- 116llings and commercial services
5 Public administration and defence and other 166services
6 Total State domestic product 2189
92

(Rs. in Crores)
1975-76 1976-77* 1977-78* 1978-79* 1979-80** Sr.N o,
4 5 6 7 8
2. National and State Domestic Product
AT CONSTANT 1970-71 PRICES
1070 996 994 1073 1014 1
562 606 691 696 699 2
469 496 542 603 594 3
148 170 166 188 200 4
190 207 214 225 234 5
2439 2475 2607 2785 2741 6
* Provisional** Quick EstimatesSource Bureau of Economics and Statistics, Gujarat State.
93

2.5 PER CAPITA NET NATIONAL AND NET S lATE DOMESTIC PRODUCT
(In Rs.)
2. National and State Domestic Product
Sr. Year No.
Per Capita Net National Product
At current At prices 1970-71
prices
Per Capita Net State Domestic Product
At current prices
At1970-71prices
1 2 3 4 5 6
1 1970-71 633 633 829 829
2 1971-72 660 627 830 835
3 1974-75 1000 616 1046 657
4 1975-76 1021 662 1253 827
5 1976-77 1086 658 1349 822
6 1977-78 1210 701 1462 846
7 1978-79 1267 728 1505 884
8 1979-80 1379 678 1623 854
Source:— 1 Central statistical oganisation. Government of India, New Delhi.
2 Bureau of Economics and Statistics, Gujarat State.
94

3.1 MAXIMUM AND1979
Sr, Centre No.
3. Climate
MINIMUM TEMPERATURE
(In Centigrade)
MaximumTemperature
Month
3
Temperature
MinimumTemp>erature
Month Temperature
1 Jamnagar April 42.4 February 5.22 Rajkot April 43.4 February 8.23 Bhavnagar April 44.7 January 8.34 Amreli April 44.4 January 6.15 Porbandar April 44.0 January 9.06 Veraval May 40.7 February 10.87 Bhuj April 45.0 Januiiry 3.18 Ahmadabad June 45.0 January 8.09 Dohad April 44,4 January 7.5
10 Vadodara April 45.0 February 7 .411 Surat May 44.4 February 8.7
Source:— Meterological Centre, Ahmadabad.
Civil Aerodrome,
95

8. Climate3.2 RAINFALL AND NORMAL RAINFALL
(In milimetres)
Sr. District Centre NormalNo.
1 2 3Rainfall
4 5
1 Jamnagar Jamnagar 466.1 1205.02 Rajkot Rajkot 594.3 560.03 Surendranagar Wadhawan 487.0 474.04 Bhavnagar Bhavnagar 620.1 475.05 Amreli Amreli 515.0 855.06 Junagadh Junagadh 843.7 1650.07 Kachclih Bhuj 340.4 553.08 Banaskantha Palanpur 750.7 506.09 Sabarkantha Himatnagar 794.2 793.4
10 Mahesana Mahesana 613.0 473.011 Gandhinagar Gandhinagar N. A. 357.012 Ahmadabad Ahmadabad 782.2 702.813 Kheda Kheda 769.5 1035 114 Panchmahals Godhra 1026.5 931.015 Vadodara Vadodara 916.6 994,416 Bharuch Bharuch 876.6 530.317 Surat Surat 1071.1 1035.218 Valsad Valsad 1805.6 1932.219 Dangs Ahwa 1779.9 2695 4
(a) Up to September N .A .= N o t available
Source :—Directorate of Agriculture, Gujarat State.
96

4.1 STATES’ SHARE IN THE AGRICULTURAL PRODUCTION
R --4 ^ 7

4.1 STATES’ SHARE IN THE
i . Agriculture
Sr. N o . .
States/Union . Territories
Rice
1 2 3
A All India
B States
49472(100.00)
i Andhra Fradesh 5945(12.02)
2 Assam 2206(4.46)
3 Bihar 5252(10.62)
4 Gujarat 590(1.19)
5 Haryana 1007(2.04)
6 Himachal Pradesh 112(0.23)
7 Jammu and Kashmir 472(0.96)
98

AGRICULTURAL PRODUCTION
(Production in *000 tonnes)
4. Agriculture
Wheat TotalFoodgrains
Cotton* Groundnut Sugarcane
4 5 6 7 8
31914(100.00)
122982(100.00)
7003(100.00)
5913(100.00)
1664(100.00)
14(0.04)
8955(7.28)
275(3.93)
912(15.42)
1170(7.04)
75(0.24)
2337(1.90)
2(0.03)
•• 158(0.95)
2440(7.65)
9636(7.84)
2(0.03)
7(0.12)
444(2.67)
1162(3.64)
4129(3.37)
1891(27.00)
1829(30.93)
316(1.90)
3001(9.40)
5650(4.59)
522(7.45)
11(0.19)
770(4.63)
317(0.99)
1009(0.82)
1(0.01)
2(0.03)
6(0.04)
176(0.55)
1084(0.88)
1(0.01) ••
3(0.02)
99

4.1 STATES’ SHARE IN THE
4. Agriculture
Sr. States/Union RiceNo. Territories
1 2 ____________ ______ 3
B States
8 Karnataka 2022(4.09)
9 Kerala 1263(2.55)
10 Madhya Pradesh 3572(7.22)
11 Maharashtra 2183(4.41)
12 Manipur 289(0.58)
13 Meghalaya 129(0.26)
14 Nagaland 72(0.14)
15 Orissa 3980(8.04)
16 Punjab 2436(4.92)
1 0 0

AGRICULTURAL PRODUCTION (Contd.)
(Production in ’000 tonnes)
4. Agriculture
Wheat
4
TotalFoodgrains
5
Cotton*6
Groundnut
7
Sugarcane
8
229 6520 695 571 1114(0.72) (5.30) (9.92) (9.66) (6.71)
1284 9 16 40(1.04) (0.13) (0.27) (0.24)
2893 11082 291 270 204(9.07) (9.01) (4.16) (4.57) (1.23)
950 10057 1138 554 2477(2.98) (8.18) (16.25) (9.37) (14.91)
310 7(0.25) •• (0.04)
2 147 3 1(N) (0.12) (0.04) (N)
90 12(0.07) •• (0.07)
113 5121 6 163 273(0.36) (4.16) (0.09) (2.76) (1.64)
6767 10397 1229 139 621(21.20) (8.45) (17.55) (2.35) (3.74)
101

i . Agriculture
4.1 STATES’ SHARE IN THE
Sr. States/Union No. Territories
1 2
Rice
3
B States
17 Rajasthan 228(0.46)
18 Tamil Nadu 5342(10.80)
19 Tripura 357(0.72)
20 U ttar Pradesh 5130(10.37)
21 West Bengal 6580(13.30)
G Union Territories 305(0.62)
1 0 2

AGRICULTURAL PRODUCTION iConcld.)(Production in ‘000 Tonnes)
4. Agriculture
Wheat Total Cotton Gr.oundnut SugarcaneFood grains *
4 5 6 7 8
2594 7487 457 190 234(8.13) (6.09) (6.53) (3.21) (1.41)
1 7440 461 1027 1722(N) (6.05) (6.58) (17.37) (10.36)
9 369 2 8(0.03) (0.30) (0.03) •• (0.05)
10019 21342 15 219 6821(31.39) (17.35) (0.22) (3.70) (41.06)
1029 8027 187(3.22) (6.53) •• •• (1.13)
123 509 3 3 26(0.39) (0.42) (0.04) (0.05) (0.16)
= Negligible.* In ’000 bales of 170 kg. each.Mv/es-(l) Production figures are based on the average of
final forecast for the years 1976-77, 1977-78 and1978-79.
(2) Figures in brackets show percentage share o f the State.
Source .--Ministry of Agriculture and Irrigation, Government o f India, New Delhi.
1 0 3

i . Agriculture
4.2 LAND UTILISATION
(‘000 Hectares]
Sr.No.
Item 1970-71 1975-76 1976 77
1 1 3 4 5
1 Forest (Total) 1573 1889 19592 Barren and uncultivable
land 3080 2567 24943 Land put to non-agri-
cultural use 771 1064 10554 Culturable Waste . . 1966 2008 2(M)55 Permanent pasture and
other grazing land . . 949 853 8526 Land under miscellaneous
trees, crops and other groves not included in net area sown . . 14 4 4
7 Current fallow 349 406 543
8 Other fallows 401 378 374
9 Net area sown 9713 9647 9524
10 Total reporting area 18816 18816 18810
11 Gross cropped area 10492 10549 10404
Source Directorate of Agriculture, Gujarat State.
104

4.3
Agriculture
AREA UNDER PRINCIPAL CROPS
(In ’000 Hectares)
Sr.No.
1
Name of Crop
2
1960-61
3
1973-74
4
1978-79*
5
1979-80*
6
1 Rice 533 443 459 458
2 Wheat . . 358 538 620 680
3 Jowar 1315 1203 1017 946
4 Bajri 1435 2149 1461 1256
5 All Cereals. . 4120 4850 4034 3842
6 Tur 85 101 131 153
7 Gram 58 75 66 66
8 All Pulses.. 512 509 546 541
9 All cereals and pulses . . 4632 5359 4580 4383
10 Cotton . . 1803 1991 1759 1717
11 Groundnut.. 1982 1705 2047 2040
12 Tobacco . . 93 81 75 115
♦Based on final forecasts.Directorate o f Agriculture, Gujarat State,
105

4. Agriculture
4.4 PRODUCTION OF PRINCIPAL CROPS
(In ’000 tonnes)
Sr.No.
Name of Crop
1960-61 1973-74 1978-79* 1979-80*
1 2 3 4 5 6
1 Rice , . ‘ 292 472 534 437
2 Wheat . . 272 836 1192 1215
3 Jowar 222 530 577 557
4 Bajri 479 1487 1554 1332
5 All Cereals 1719 3706 4254 3814
6 Tur 38 40 74 88
7 Gram 19 67 59 31
8 All Pulses.. 169 186 231 194
9 All cereals and pulses . . 1888 3892 4485 4008
10 Cotton** . . 1394 1837 2101 1785
11 Groundnut.. 1214 1341 1823 1814
12 Tobacco 65 116 154 175
♦Based on final forecasts.**In ’000 bales of 170 kg. each.Source: - Directorate of Agriculture, Gujarat State.
106

4. Agriculture
4.5 PER HECTARE YIELDS OF PR IN aPA L CROPS
an Kgs.)
Sr. Name of * 1960-61 1973-74 1978-79* 1979-80*No. Crop
3 4 5 6
1 Rico 547 1065 1164 954
2 Wheat 759 1553 1924 1786
3 Jowar 168 388 568 589
4 Bajri 334 723 1064 1060
5 All Cereals.. 417 764 1055 993
6 Tur 443 402 566 573
7 Gram 331 893 894 476
8 All Pulses. . 331 365 423 358
9 All cereals and pulses . . 408 726 979 914
10 Cotton ., 139 157 203 177
11 Groundnut.. 613 789 891 846
12 Tobacco . . 700 1430 2060 1524
♦Based on final forecasts.Source ;-Directorate of Agriculture, Gujarat State.
107

4. Agriculture
4.6 INDEX NUMBERS OF AREA UNDER AGRICULTURAL CROPS IN GUJARAT STATE
(Base : Triennium ending 1969-70=100)
Sr. Name of N o. Crop
1 2
1960-61 1973-74
4
1978-79(P)
. 5.
1979-80(P)0
1 Rice . . 108.7 90.0 93 .6 93.4
2 Wheat . . 72.6 109.2 125.7 138.1
3 Jowar . . 97.4 89.0 75.3 70.0
4 Bajri . . 75.0 112.3 74.8 65.6
5 Maize . . 83.6 107.2 110.4 114.7
6 Ragi . . 124.6 81.2 83.1 82.4
7 Kodra . . 94.4 80.2 71.7 75.1
8 Barley . . 66.7 131.9 95.8 91.7
9 Total Cereals 86.1 101.3 84.3 79.9
10 Gram . . 104.8 135.3 119.9 119.8
11 Tur . . 90.3 106.9 139.8 162.6
12 Total Pulses 108.6 108.1 115.8 114.9
13 Total Foodgrains 88.1 101.9 87.1 83.3
14 Sugarcane . . 65.1 133.7 145.6 143.1
108

(Base ; Triennium ending 1969-70=100)
Sr. Name of 1960-61 1973-74 1978-79 1979-80No. Crop (P) (P)
1 2 3 4 5 6
4. Agriculture
4.6 INDEX NUMBERS OF AREA UNDER AGRICULTURAL CROPS IN GUJARAT STATE (Concld.)
15 Chillies . . 144.8 82.3 81.2 68.7
16 Potatoes . . 48.4 125.8 338.7 374.2
17 Total Food crops 88.1 102.2 87.7 83.9
18 Groundnut 108.6 111.3 110.8 108.0
19 Castor . . 119.9 145.9 186.0 229.1
20 Seasamum 85.3 95.5 81.7 72,8
21 Rape & Mustard 97.9 225.9 277.2 287.0
22 Total Oilseeds 107.3 97.8 113.4 112.1
23 Cotton . . 106.5 117.6 103.9 101.3
24 Tobacco . . 100.1 87.6 80.7 124.0
25 Total non-food crops 106.8 106.3 108.4 107.7
26 All crops . . 95.9 103.9 96.3 93.9
(P) = ProvisionalSource Dirccloratc of Agriculture, Gujarat State.
109

(Base : Triennium ending 1969-70=100)
4. Agriculture
4.7 INDEX NUMBERS OF AGRICULTURAL PRODUCTION IN GUJARAT STATE
Sr. Name of Weiglit 1960-61 1973-74 1978-7? 1979--80 No. Crop (P) (P)
1 Rice 7.32 68.8 111.3 126.0 103.1
2 Wheat . . 9.66 43.5 134 I 191.1 194.7
3 Jowar 4.87 58.6 140.1 152.8 147.5
4 Bajri 15.01 42.8 132.8 138.8 118.9
5 Maize 3.01 112.4 87.7 101.1 57.3
6 Ragi 0.52 143.8 104.4 90.1 95.6
7 Kodra 0.79 112.2 98.3 99.2 58.2
8 Barley . . 0 .04 70.4 137.8 101.2 95.1
9 Total Cereals 41.93 57.3 125.1 144.3 130.4
10 Gram 0.46 66.9 232.8 206.6 110.3
11 Tur 0.77 87.9 94.5 174.0 205,1
1 1 0

(Base : Triennium ending 1969-70=100)
i . Agriculture
4.7 INDEX NUMBERS OF AGRICULTURAL PRODUCTION IN GUJARAT STATE {Contd.)
Sr.No.
Name of Crop
Weight 1960-61 1973-74 1978-79(P)
1979-80(P)
1 2 3 4 5 6 7
12 Total Pulses 2.61 107.8 116.9 148.3 126.4
13 Total Food grains 44.54 60.3 124.9 144.6 130.2
14 Sugarcane 4.14 58.4 136.8 147.6 143.4
15 Chillies . . 0.82 147.7 74.6 68.4 64.6
16 Potatoes 0.32 16.1 293.1 592.9 906.9
17 Total Food crops 49.82 61.3 126.0 146.4 135.2
18 Groundnut 21.14 109.9 121.4 161.7 151.1
19 Castor . . 0.44 77.5 329.9 612.0 638.7
20 Seasamum 0.89 .56.4 116.5 100.9 109.9
111

(Base : Triennium ending 1969-70=100)
4. Agriculture
4.7 INDEX NUMBERS OF AGRICULTURAL PRODUCTION IN GUJARAT STATE (Concld.)
Sr.N o.
Name of Crop
Weight 1960-61 1973-74 1978.-79 19.79-80 (P) (P)
1 2 3 4 5 6 7
21 Rape and Mustard . . 0.40 75.0 265.7 324.2 315.3
22 Total Oilseeds 22.87 106.6 127.7 170.8 161.7
23 Cotton . . 23.75 100.9 115.1 136.5 113.4
24 Tobacco . . 3.56 65.3 115.8 154.7 176.1
25 Total nonfood crops 50.18 101.0 121.0 153.4 139.9
26 All crops 100.00 81.2 123.5 150.0 137.5
(P)=Provisional.Source .-Directorate of Agriculture, Gujarat State.
1 1 2

(Base : Trienniura ending 1969-70=100)
4. Agriculture
4.8 INDEX NUMBERS OF YIELDS OF CROPS INGUJARAT STATE
Sr. Name of 1960-61 1973-74 1978-79 1979-80No. Crop (P) (P)
1 Rice 63.2 123.7 134.6 110.4
2 Wheat . . 59.6 122.8 185.5 141.0
3 Jowar 60.2 157.4 202.9 110.7
4 Bajri 106.5 118.3 185.6 181.3
5 Maize 134.3 81.8 91.6 50.0
6 Ragi 115.6 128.6 108.4 116.0
7 Kodra . . 118.9 122.6 138.4 77.5
8 Barley 106.5 104.5 106.3 103.7
9 Total Cereals 66.5 123.5 171.2 163.2
10 Gram 65.2 172.1 172.3 92.1
K ^ - 8113

(Base : Triennium ending 1969-70=100)
4. Agriculture
4.8 INDEX NUMBERS OF YIELDS OF CROPS INGUJARAT STATE {Contd.)
Sr.. Naqie of . 19.60-61, 1973-74 1978-79 1^79-80No. Crop (P) (P)
1 2 3 4 5 6
11 Tur 97,6 88.4 124.5 126.1
12 Total Pulses 99.3 108.1 128.1 110.0
13 Total Foodgrain 68.4 122.6 166.0 156.3
14 Sugarcane 89.8 102.3 101.4 100.2
15 Chillies 102.3 90.5 84.2 94.0
16 Potatoes 30.6 233.0 175.1 242.4
17 Total Foodcrops 69.6 123.3 166.9 161.2
18 Groundnut 101.2 109.1 145.9 139.9
19 Castor 63.9 225.1 329.0 278.8
20 Seasamum 66.4 122.0 123.5 151.0
21 Rape and Mustard 76.9 117.6 117.0 109.9
114

(Base : Triennium ending 1969-70=100)
4. Agriculture
4.8 INDEX NUMBERS OF YIELDS OF CROPS INGUJARAT STATE {Concld.)
Sr. Name of 1960-61 1973-74 1978-79 1979-80No. Crop (P) (P)
22 Totai Oilseeds 99.3 130.5 146.1 144.2
23 Cotton . . 94.7 97.9 131.4 111.9
24 Tobacco 65.2 133.3 191.7 142.0
25 Total non-food crops 94.6 113.8 139,4 129.9
26 All crops 84.7 118.9 154.5 146.4
P=ProvisionalSource .--Directorate of Agriculture, Gujarat State.
115

4. Agriculture
4.9 AREA IRRIGATED BY SOURCE
(In ’00 Hectares)
Sr.No.
Source 1960-61 1970-71 1975-76 1976-77
1 2 3 4 5 6
1 GovernmentCanals** 652 2358 2844 3043
2 Private Canals 6 6 •• • •
3 Wells* 5677 10831 11900 12227
4 Tanks 128 372 252 321
5 Other sources : 366 141 148 80
6 Total net area irrigated E;6829 13708 15144 15671
* Including Tubewells.** Including Panchayat Canals.Source:—Directorate of Agriculture, Gujarat, State.
116

4. Agriculture
4.10 AREA IRRIGATED BY SOME IMPORTANT CROPS
(In ’00 Hectares)
Sr. Crop No.
1960-61 1970-71 1975-76 1976-77
3 4 5 6
1 Rice 665 1650 1488 1487
2 Wheat 2182 4138 3882 3893
3 lower 323 383 336 344
4 Bajri 391 693 1013 975
5 All Foodcrops 4904 9405 9555 9807
6 Cotton 1052 3552 4487 4476
7 Groundnut . . 219 219 273 333
8 Tobacco 153 376 566 704
9 All non-food crops 2434 5534 7536 7934
10 Gross area irrigated 7338 14939 17091 17741
Source :—Directorate of Agriculture, Gujarat State.
117
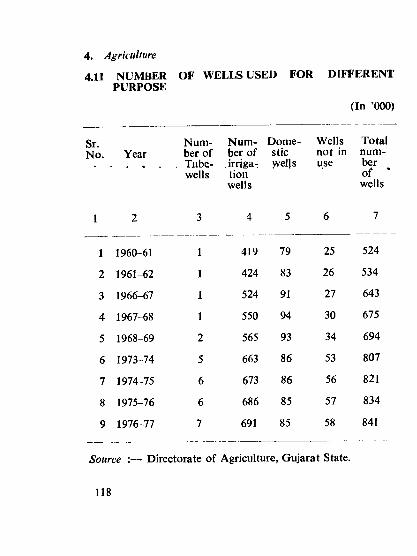
4.11 NUMBER OF WELLS USED FOR DIFFERENT PURPOSE
(In ’000)
4. Agriculture
Sr.No. Year
Num- Num- Dome- ber of ber of stic Tube- .irriga- yvells wells tion
wells
Wells Total not in num- use ber
ofwells
L 2 3 4 5 6 7
1 1960-61 1 419 79 25 524
2 1961-62 1 424 83 26 534
3 1966-67 1 524 91 27 643
4 1967-68 1 550 94 30 675
5 1968-69 2 565 93 34 694
6 1973-74 5 663 86 53 807
7 1974-75 6 673 86 56 821
8 1975-76 6 686 85 57 834
9 1976-77 7 691 85 58 841
Source :— Directorate of Agriculture, Gujarat State.
118
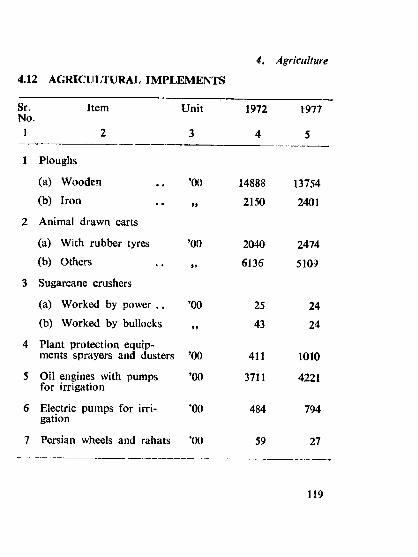
4.12 AGRICULTURAL IMPLEMENTS
4. Agriculture
Sr. Item No.
Unit 1972 1977
1 2 3 4 5
1 Ploughs
(a) Wooden ’(X) 14888 13754(b) Iron 2150 2401
2 Animal drawn carts
(a) With rubber tyres ’00 2040 2474(b) Others 6136 5109
3 Sugarcane crushers
(a) Worked by power . . ’00 25 24(b) Worked by bullocks 43 24
4 Plant protection equipments sprayers and dusters ’00 411 1010
5 Oil engines with pumps for irrigation
’00 3711 4221
6 Electric pumps for irrigation
’00 484 794
7 Persian wheels and rahats ’00 59 27
119

4» Agriculture
4.12 a g r i c u l t u r a l IMPLEMENTS {Concld.)
Sr.No.
Item Unit 1972 11977
1 2 3 4 5
8 Crawler tractors(a) Government Number 392 618(b) Private Number 1281 .'5773
9 Hand tractors or power tillers(a) Government Number 38 46(b) Private Number 1084 392
10 Four wheeled tractors
(a) Government Number 745 371(b) Private Number 7113 7725
11 Tractor operated equipments
’00 224 343
12 Power driven mechines and miscellaneous equipments ’00 121 263
13 Ghanies
(a) Five kgs. and above Number 1016 694(b) Less than Five kgs. Number 470 204
Source .-—Bureau of Econonaics and Statistics, Gujarat State.
120

4.13 DISTRIBUTION
4. Agriculture
OF CHEMICAL FERTILIZERS
(Tonnes)
Sr.No..
Item Quantity distributed in Gujarat (April-March)
1977-783
1978-794
1 Nitrogenous
1 Ammonium Sulphate (20.6%N) 94943 1220122 Ammonium Sulphate nitrate
(26 %N)3 Urea (46 %N) 259382 2718584 Calcium ammonium nitrate (25 % N) 394 14405 Calcium ammonium 594 34
nitrate (26 %N)6 Ammonium Chloride (25 %N) 952 497
II Phosphate1 Super phosphate 121872 115940
III Complex
1 Ammonium phosphate sulphate 928 35642 Ammonium nitro phosphate3 Diammonium phosphate 68055 60Si3
IV Potassic
1 Muriate of potash 20960 234822 Sulphate of potash 168 152
N== NitrogenSomrce Fertilizer Statistics.
121

4. Agriculture
4.14 CONSUMPTION OF N, P2O 5 AND K2O
(In ’000 Tonnes)
Sr. Year No.
N P2O5 K2Q Total
3 4 5 6
1 1960-61 7.39 3.52 0.16 11.07
2 1965-66 28.03 13.24 2.64 43.91
3 1975-76 110.59 32.65 6.32 149.56
4 1976-77 131.49 51.83 11.68 195.00
5 1977-78 170.33 79.00 28.06 277.39
6 1978-79 191.96 93.08 35.63 320.67
7 1979-80 224.06 114.45 39.03 377.54
Source:- Directorate of Agriculture, Gujarat State.
122

5. Civil Supplies
5.1 DISTRICT WISE DISTRIBUTION OF FAIR PRICE SHOPS
Sr. Districst No.
1 Jamnagar2 Rajkot3 Surendranagar4 Bhavnagar5 Amreli6 Junagadh7 Kachchh8 Banaskantha9 Sabarkantha
10 Mahesana11 Gandhinagar12 Ahmadabad13 Ahmadabad City14 Khoda15 Panchmahals16 Vadodara
Number of F. P. Shops
1978
3
38359728650329664540139645870767
429354823641616
1979
4
380 581 265 508 284 638 384381 426 70963
415336797628609
1980
5
40461030653736564141447748681958
468375757727728
123
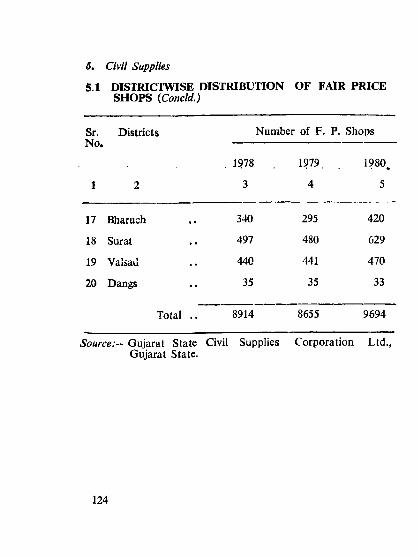
5.1 DISTRICTWISE DISTRIBUTION OF FAIR PRICE SHOPS {Concld.)
5. Civil Supplies
Sr. Districts Number of F. P. ShopsXNO*
. 1978 1979, 1980^
1 2 3 4 5
17 Bharuch 340 295 420
18 Surat 497 480 629
19 Valsad 440 441 470
20 Dangs 35 35 33
Total . . 8914 8655 9694
Source:— Gujarat State Gujarat State.
Civil Supplies Corporation Ltd.,
124

5.2 DISTRICTWISE STORAGE CAPACITY WITH GOVERNMENT
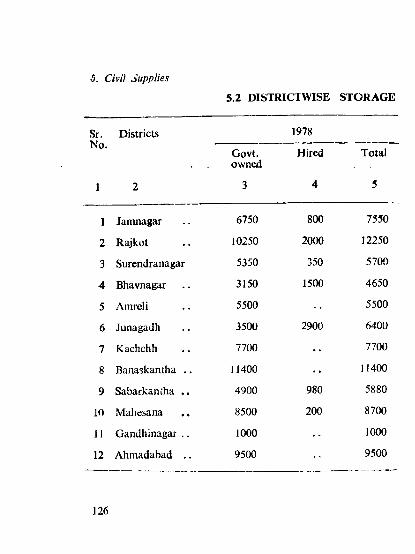
5. Civil Supplies
5.2 DISTRICTWISE STORAGE
Sr.No.
Districts 1978
Govt.owned
Hired Total
1 2 3 4 5
1 Jamnagar 6750 800 7550
2 Rajkot 10250 2000 12250
3 Surendranagar 5350 350 5700
4 Bhavnagar 3150 1500 4650
5 Amreli 5500 5500
6 Junagadh 3500 2900 6400
7 Kachchh 7700 •• 7700
8 Banaskantha . . 11400 •• 11400
9 Sabarkantha . . 49v00 980 5880
10 Mahesana 8500 200 8700
11 Gandhinagar .. 1000 •• 1000
12 Ahmadabad . . 9500 9500
126

CAPACITY WITH GOVERNMENT
5. Civil Supplies
(In tonnes)
1979 1980
Govt. Hired Total Govt, owned owned
Hired Total
10 11
6750 800 7550 6750 800 7550
10600 2000 12600 10600 1300 ‘ 11900
5650 350 6000 5650 350 6000
3150 1000 4150 4400 4400
5500 5500 6000 6000
3500 2900 6400 5850 300 6150
7700 7700 6550 900 7450
11900 11900 12000 12000
4900 920 5820 5600 280 5880
8500 8500 8500 8500
1000 . . 1000 1000 1000
9500 9500 3000 1000 4000
127

5. Civil Supplies
5.2 DISTRICTWISE STORAGE
Sr.No.
Districts 1978
Govt.owned
Hired Total
1 2 3 ■4 ‘ 5 ■
13 Ahmadabad City 25000 25000
14 Kheda 10500 10500
15 Panchmahals 7850 1200 9050
16 Vadodara 14250 450 14720
17 Bharuch 3000 3720 6720
18 Surat 22900 22900
19 Valsad 15330 15330
20 Dangs 800 •• 800
Total 177150 14100 191250
1 2 8

CAPACITY WITH GOVERNMENT {Concld.)_ __________ ________ (In tonnes)
5. Civil Supplies
Govt.owned
1979
Hired
7
1980
Total Govt.owned
Hired Total
10 11
25000 •• 25000 32000 •• 32000
10500 10500 11000 11000
7850 800 8650 8350 1850 10200
14270 450 14720 14228 450 14678
6500 . . 6500 7000 300 7300
22700 . . 22700 22700 22700
15330 15330 15330 15330
800 800 800 •• 800
181600 9220 190820 187308 7530 194838
'ource Gujarat State Civil Supplies Corporation Ltd., Gujarat State.
129R --4 0 -9

6. Animal Husbandry
6.1 LIVESTOCK POPULATION<In ’000)
Sr. Item 1966 1972 1977No.
1 2 3 4 5
1 Cattle
I Males over three years
(a) Used for breeding only 10 6 9
(b) Used for breeding and work only.. 15 19 10
(c) Used for work only 3053 3022 2844
(d) Others 23 18 13
Total 3101 3065 2876
II Females over three years
(a) Breeding
(i) In milk . • 813 9 0 834(ii) Dry & not
calved evenonce . . 949 8S4 854
130

(I n ’000)
6. Animal Husbandry
6.1 LIVESTOCK POPULATION {Contd.)
Sr. Item No.
1966 1972 1977
1 2 3 4 5
(b) working 10 5 4
(c) Others 8 10 5
Total 1780 1812 1697
III Young stock 1663 1581 1433
Total Cattle 6544 6458 6006
2 Buffaloes
I Males over three years
(a) Used for breeding only 8 8 10
(b) Used for breeding and work both . . 3 2 2
(c) Used for work only 21 29 21
(d) Others 3 4 2
T'otal 35 43 35
131

6. Animal Husbandry
6.1 LIVESTOCK POPULATION (concld.)
(In ’000)
Sr. Item No.
1 . . . 2.
1966
3
1972
4
1977
5
II Females over three years
(a) Breeding(i) In milk 1016 1095 1224(ii) Dry & not
calved even once 785 945 860
(b) working 13 3 5(c) Others 6 4 4
Total 1820 2047 2093
III Young Stock 1285 1378 1345
Total Buffaloes 3140 3468 3473
3 Sheep 1652 1722 15924 Goats 2771 3210 30845 Horses & Ponies 71 63 766 Other Livestock 160 178 175
Total Livestock 14338 15098 14406
Total poultry 2324 2736 3426
Source :—Bureau of Economics & Statistics, Gujarat State,
132

6. Animal Husbandry
6.2 MISCELLANEOUS STATISTICS RELATING TOANIMAL HUSBANDRY
Sr.No.
Item 1971-72 1979-80
1 2 3 4
1 Number of cattle breeding farms 5*4
2 Number of buffaloes breeding farms 2
3 Number of sheep breeding farms 3 2
4 Number of sheep research centres 1 1
5 Number of wool grading centres 2 2
6 Number of poultry research station 1 1**
7 Number of artificial insemination centres
14 14
8 Number of artificial insemination sub-centres
72 103
9 Number of veterinary institutions
(a) Veterinary dispensaries 216 220
(b) Veterinary aid centres 429 464
* Excludes one cattle breeding farm Junagadh which is transferred to Gujarat Agricultural University.
**Transferred to Gujarat Agricultural University.Source .--Directorate of Animal Husbandry, Gujarat State.
133

7. Fisheries
7.1 FISHERIES STATISTICS
Sr.No.
Item Unit 1978-79 1979-80
1 2 3 4 5
1 No. of Fishing Boats Number 8693 9522
2 No. of Fishing Boats (mechanised)
Number 3020*
3357
*3 No. of active Fishermen Number 48629 48629
4 Fish production ’OOOTonnes 246 223
5 No. of Fishermen’s Primary Co-operative Societies Number 162 168
6 Membership of the Fishermen’s Number Co-operative Societies
23472 26493
7 (1) Paid-up share capital of Fishermen’s Co-operative Societies
Rs. in Lakhs
13 14
(2) Contribution of Government „ 44 57
•As per 1977 Census.5oHrce;-—Commissioner of Fisheries, Gujarat State.
134

8. Forest
Jl.l AREA UNDER FOREST
(In Sq. Kms.)
Sr.No.
Class of forest 1978-79(P)
1979-80(P)
1 2 3 4
1 Reserved 12149 12698
2 Protected 1148 1105
3 Unclassed 6415 5732
4 Total 19712 19535
5 Percentage of forest area to total area
10.6 9.97
(P)=Provisional.Source:—Chief Conservator of Forests, Gujarat State.
135

8. Forest
8.2 PRODUCTION OF MAJOR AND MINOR FORESTPRODUCE
Sr.No.
Item Unit Forest produce
1978-79 (?) •'1 -
Quantity Value (In ’000 Rs.]
1 2 3 4 5
1 Roundwood ’00 cubic mts. 1606 115738
2 Sa\TO v,'ood (including of sleepers)
’00 cubic mts. 34 5103
3 Fuel wood (inclusive of wood used as charcoal)
’00 cubic mts. 2337 9309
4 Bamboos ’000 Tonnes 90 3908
5 Grass and Grazing ’000 Tonnes 27 2848
6 Gum Tonnes 94 73
7 Apta, Timru and other leaves ’000 Tonnes
10 1756
136

8.2 PRODUCTION OF MAJOR AND MINOR FOREST PRODUCE (Concld.)
8. Forest
Sr.N o.
Item Unit Forest Produce
1978-79 (P)
Quantity Value (In’ 000 Rs.)
1 2 3 4 5
8 Tanning material Tonnes 454 68
9 Oil seeds 99 1554 229
10 Drugs and edible products
99 312 175
11 Miscellaneous 99 567
Total 139774
(P)=Provisional.Source:—C bkf Conservator of Forests, Gujarat State.
137

8.3 FOREST DEVELOPMENT*
8. Forest
Sr.No.
Particulars Third Five year plans1961-66
Annual Plans
1966-69
Hectares Rs. Hectares Rs.(In ( t i (In (In’000) ’000) ’000) ’000)
1 2 3 4 5 6
1 Road side and Canal side plantations . .
2 Economic plantations . . 7 1954 7 2749
3 Plantations of Quick growing species 3 1211 9 4153
4 Soil and moisture conservations and afforestations on denuded areas 11 2667 5 2103
5 Plantations on Coastal Borders 1 1084 1 1533
6 Afforestations on Desert Borders 9 1691 6 1884
138

8.3 FOREST DEVELOPMENT* iContd.)
8, Forest
Sr. Particulars No.
Fourth Five year plans 1969-74
Draft Fifth Plans 1974-78
Hectares (In
’000)
Rs.(In’000)
Hectares (In
’000)
Rs.an’000)
1 2 7 8 9 10
1 Road side and Canal side plantations .. 1 3463 17 51797
2 Economic plantations . . 15 6721 18 12011
3 Plantations of Quick growing species 13 7400 8 6311
4 Soil and moisture conservations and afforestations on denuded areas
@7
@3919 22 16555
5 Plantations on Coastal Borders 2 2159 2 2688
6 Afforestations on Desert Borders @ @ 3 2816
139

8. Forest
8.3 FOREST DEVELOPMENT* (Contd.)
Sr. Particulars N o
Annual Plan
1978-79 1979-80(P)
........................................... JleQt- .ares(In’OOO)
R§. . a n ‘000)
Hect- . ares
(ln‘000)
Rs.a n ’000)
1 2 11 12 13 14
1 Road Side and Canal side plantations 7 24260 31 32039
2 Economic plantations 5 5346 5 6436
3 Plantations of quick growing species 2 2205 2 2342
4 Soil and moisture conservations and afforestations on denuded areas 8 6553 7 7627
5 Plantations on coastal Borders 1 1312 1 1315
6 Afforestations on Desert Borders 2 1214 1 654
140

8, Forest
8 .3 FOREST DEVELOPMENT (Concld.)
Sr. Particulars Sixth Plan 1980-85
1980-8KP)
Hectares(ln‘000)
Rs.(In‘000)
1 2 15 16
1 Road side and canal side plantations 8 84730
2 Economic Plantations 6 7363
3 Plantations of quick growing species 2 2656
4 Soil and moisture conservations and afforestations on denuded areas 6 8497
5 Plantations on coastal Borders 1 1688
6 Afforestations on Desert Borders 1 1193
(p)=Provisional * Revised(a)= Combined scheme
Source:— Chief conservator of forest, Gujarat State.
141

8. Foreft
8.4 NUMBER OF TREES PLANTED
Sr.N o.
Years
2
Number of trees planted (In lakhs)
1 1960-61 8
2 1965-66 7
3 1970-71 4
4 1971-72 5
5 1974-75 245
6 1975-76 414
7 1976-77 463
8 1977-78 423
9 1978-79 (P) 782
10 1979-80 (P) 886
11 1980-81 (P) ? i . . 914
(P )= Provisional.Source'.— Chief Conservator o f Forests, Gujarat State.
142

9.1 INSTALLED CAPACITY OF ELECTRICITY IN GUJARAt STATE
__________________________________________________ (In MW)
Year Hydro Steam Diesel Gas Nuclear Total
1 2 3 4 5 6 7
9. Electricity
1970-71 620 23 54 210 907
1971-72 620 20 54 210 904
1974-75 225 882 12 54 « 1173
1975-76 300 998 9 54 * 1361
1976-77 300 1237 4 54 * 1595
1977-78 300 1353 4 54 * 1711
1978-79 300 1859 3 54 * 2216
1979-80 (P) 300 1855 3 54 * 2212
(P) —Provisional.• The share o f nuclear installed capacity of Tarapore Station
has not be6n included being a Central Giovernnient ProjectSource :—Central Electricity Authority, Government o f India,
New Delhi.
143

9, Electricity
(In Lakh KWH)
9.2 GENERATION OF ELECTRICITY IN GUJARATSTATE
Year
1
Hydro
2
Steam
3
Diesel
4
Gas
5
Nuclear
6
Total
7
1970-71 . , 29026 84 565 12087 41762
1971-72 33083 61 1390 5947 40481
1974-75 4500 49450 6 1349 * 55305
1975-76 8300 46115 7 1454 * 55876
1976-77 12726 49856 1 1030 63613
1977-78 12923 57104 • • 1316 * 71343
1978-79 11609 67062 1 1234 ♦ 79906
1979-80(P) 12063 76498 1 758 * 89320
(P)=Provisional* The share of nuclear generation of Tarapore station has
not been included being a Central Government Project.Source :—Central Electricity Authority, Government of India,
New Delhi.
144

9. Electricity
9.3 SALES OF ELECTRICITY IN GUJARAT STATE
(In Lakh KWH)
Year
1
Domestic Commer- Indust- Publiccial rial lighting
1970-71 2432 1082 24011 558
1971-72 2590 1133 25819 377
1974-75 3725 1635 30553 469
1975-76 4153 1712 33478 518
1976-77 4667 2217 35554 570
1977-78 5197 2550 39228 620
1978-79 5758 2865 44863 651
1979 -80 (P) 6122 2928 47200 710
R-40-10 1 4 5

9. Electricity
9.3 SALES OF(Concld.)
ELECTRICITY IN GUJARAT STATE
(In Lakh KWH)
Year Agricultural
\Vaterworks
^vliscell-aneou8
Total
1 6 7 8 9
1970-71 4050 952 133 33218
1971-72 4212 1064 150 35345
1974-75 10087 1271 187 47927
1975-76 8690 1359 211 50121
1976-77 9231 1465 1298 55002
1977-78 10203 1536 1455 60789
1978-79 11110 1706 1561 68515
1979-80 (?) 12467 1864 1764 73055
(P )= Provisional Source:- Central Electricity Authority, New Delhi.
146
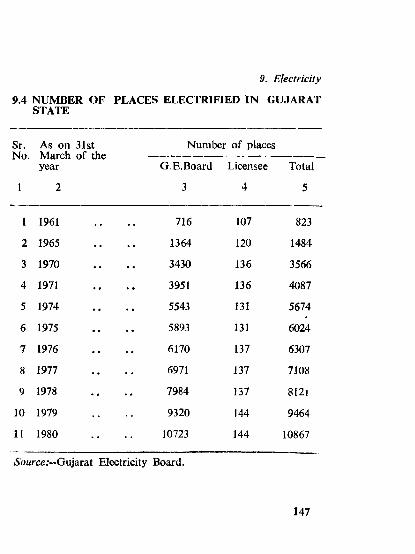
9.4 NUMBER OF PLACES ELECTRIFIED IN GUJARAT STATE
9. Electricity
Sr. As on 31st No. March of the
year
I
Number of places
G.E. Board Licensee Total
3 4 5
1 1961
2 1965
3 1970
4 1971
5 1974
6 1975
7 1976
8 1977
9 1978
10 1979
11 1980
716 107 823
1364 120 1484
3430 136 3566
3951 136 4087
5543 131 5674
5893 131 6024
6170 137 6307
691\ 137 7108
7984 137 8121
9320 144 9464
10723 144 10867
Source:—GnidLTdX Electricity Board.
147

9. Electricity
9.5. STATEWISE NUMBER OF VILLAGES ELECTRIFIEDAND IRRIGATION PUMP SETS/TUBEWELLSENERGISED
Sr. State/Union No. of villages* No. of pump sets/ No. Terrkories tubewclls.
1978-79 1979-80 1978-79 1979-80
1 2 3 4 5 6
All India 233042 250112 3599328 3949120
i Andhra Piadesh 15490® 16467© 359003® 387731(
2 Assam 3001 4226 1250 1678
3 Bihar 18973® 19715® 143615 151985
4 Gujarat 9464 10867 177798 202853
5 Haryana 6731 6731 181232 203367
6 HimachalPradesh 8329 8921 1548 1633
7 Jammu and Kashmir 4428 4552® 902 983
8 Kerala 1248 1268 66240 77863
9 MadhyaPradesh
19350 22050 244853 279431
10 Maharashtra 23384 25457 537295 597474
148

9. Electricity
9.5 STATEWISE NUMBER OF VILLAGES ELECTRIFIEDAND IRRIGATION PUM P SETS/TUBE WELLSENERGISED {Contd.)
Sr. State/Union N o. Territories
I
No. of villages*
1978-79 1979-80
3 4
No. of pump sets/ tubewells
1978-79 1979-80
5 6
11 Manipur
12 Meghalaya
13 Karnataka
14 Nagaland
15 Orissa
16 Punjab
17 Rajasthan
18 Tamil Nadu
19 Tripura
20 Uttar Pradesh
21 West Bengal
22 Sikkim
274 322
474 546
15736 16266
270 320
15568 17231
12126** 12126**
12335 13842
15525 15550
566 766
36223 38577
12163 12863
48 53
10
47 47
277482 190308
1
9266 12958
233218 262267
155794 183926
843046 887227
184 248
324194 361750
22426 24068
149

9. Electricity
9.5 STATEWISE NUMBER OF VILLAGES ELECTRIFIEDAND IRRIGATION PUMP SETS/TUBEWELLSENERGISED (Conoid.)
Sr. State/Union No. of Villages* No. Territories
No of pump sets/ tubewells
•1978-79 1979^0 1-978-79 1979-80
1 2 3 4 5 6
Union Territories
1 Andaman and Nicobar Islands
71 89 1 J
2 Aranachal Pradesh 230 263
3 Chandigarh 26 26 504 4954 Dadra and
Nagar Havel i 52 52 202 22]5 Delhi 243 243 10084 111176 Goa. Daman
and Diu 351 355 1590 17577 L.M. and A.
Islands 9 98 Pondicherry 333 333 7553 77209 Mizoram 21 26
@=Provisional.*As per 1971 Census.
*♦62 Villages have been declared as uninhabited. Source .'--Central Electricity Authority, New Delhi.
150

10. Mining
10.1 QUANTITY AND VALUE OF MINERAL PRODUCTION
Sr.No.
Item 1978
Quantity
2 3
Value
4
(Quantity in Tonnes) (Value in ‘000 Rs.)
1979
Quantity Value
5 6
1 Agate 2897 670 2893 497
2 Bauxite 230728 6758 253052 8060
3 Calcite 1428 27 2152 70
4 Chalk 76030 3534 81396 4095
5 Clay (others)
(1) Plastic clay 20426 118 19433 116
(2) Pipes clay 4626 27 3185 19
6 Lignite (’000 Tonnes) 135 7391 214 11813
7 Dolomite 195789 1872 237503 2603
8 Feldspar 139 6 29 1
9 Fireclay 259928 1505 247315 1471
151
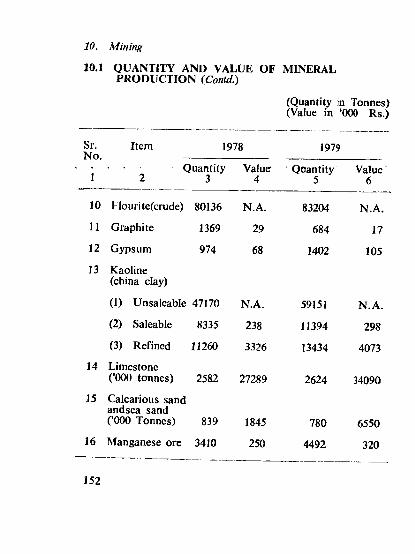
10.1 QUANTITY AND VALUE OF MINERAL PRODUCTION {Conld.)
10. Mining
(Quantity in Tonnes) (Value in ‘000 Rs.)
Sr.N o
Item 1978 1979
1• • Quantity
2 3Value
4■ QDantity
5Value
6
10 Flourite(crude) 80136 N.A. 83204 N.A.
11 Graphite 1369 29 684 17
12 Gypsum 974 68 1402 105
13 Kaoline (china clay)
(1) Unsaleable 47170 N.A. 59151 N .A .
(2) Saleable 8335 238 11394 298
(3) Refined 11260 3326 13434 4073
14 Limestone (’000 tonnes) 2582 27289 2624 34090
15 Calcarious sand andsea sand (’000 Tonnes) 839 1845 780 6550
16 Manganese ore 3410 250 4492 320
152

10. Alining
10.1 QUANTITY AND VALUE OF MINERALPRODUCTION iConcld.)
(Quantity in Tonnes) (Value in ‘000 Rs.)
Sr. Item No.
1978 1979
Quantity Value Quantity Value
1 2 3 4 5 6
17 Ochre 190 11 720 23
18 Petroleum (crude) (’000 Tonnes) 4227 1313752 3869 1202485
19 Natural gas (utilise) 720* 38160 646* 34238
20 Quartz 45689 365 52659 396
21 Silica sand and glass sand 90921 1388 138371 2381
22 Molding sand 6311 82 6774 95
23 Steatite(Shop Stone) 138 8
♦Million Cubic metres.N .A .= N ot Available..SoHrce.'-Directorate of Geology and Mining, Gujarat State.
153

11. Industries
11.1 STATEWISE NUMBER OF WORKING FACTORIESAND AVERAGE NUMBER OF WORKERSEMPLOYED DAILY THEREIN
Sr.No.
State/UnionTerritories
1978rP)
Number of Average number working of workers emp-factpries Ipyed daily in
working factories (In ’000)**
3 4
INDIA 123941 6358
1 Andhra Pradesh . . 13415 4902 Assam 1447 853 Bihar 29043 3694 Gujarat 9838 5895 Haryana 2191 1396 Himachal Pradesh 494 157 Jammu & Kashmir 396 198 Karnataka 5433* 344*9 Kerala 7794 274
10 Madhya Pradesh . . 5254 32611 Maharashtra 13250 116012 Manipur 124* 2*13 Meghalaya 54 314 Orissa 1211 8315 Punjab 6017 169
154

"Sn State/Union 1978(F)No. Territories
11. Industries
11.1 STATEWISE NUMBER OF WORKING FACTORIESAND AVERAGE NUMBER OF WORKERSEMPLOYED DAILY THEREIN (Concld.)
Number ofworkingfactories
Average number of workers employed daily in working factories
(In ’000)**4
16 Rajasthan 4904 13817 Tamil Nadu 8170 60018 Tripura 70 319 Uttar Pradesh 5243* 512*20 West Bengal 5990 87021 Andaman and Nicobar
Islands 24 522 Chandigarh 175* 9*23 Dadra and
Nagar Haveli 10 124 Delhi 2708* 129*25 Goa, Daman and Diu 170 1026 Pondicherry 496 14
(P) = Provisional.* Estimated.** As fisures are given in thousand total will not tally. Source .--[ndian Labour Journal, Govt, of India, Simla.
155

11. Indusines
11.2 NUMBER OF WORKING FACTORIES ANO WORKERS EMPLOYED DAILY THEREIN
Sr.No.
Year Number of work- Average number ing factories of workers era*
ployed daily ifl workiEg factories
1 2 3 4
1 1960 3649 329694
2 1965 4534 413782
3 1970 5544 437554
4 1971 5817 445385
5 1974 7597 523279
6 1975 8040 527225
7 1976 8861 54)587
8 1977 9508 565110
9 1978 9836 588594
10 1979 10611 639104
Source .--Chief Inspector of Factories, Gujarat Stite.
156

11. Industries
11.3 DISTRICTWISE NUMBER OF FACTORIES ANDAVERAGE NUMBER OF WORKERS EMPLOYEDDAILY-1979
Sr.No.
District Registered Factories
Working* Ceased working
Average ■ number of
Total workers in working factories
1 Jamnagar 521 53 576 18266
2 Rajkot 1066 110 1183 32126
3 Surendranagar 357 48 408 18503
4 Bhavnagar 510 52 65 19409
5 Amreli 88 7 77 4393
€ Junagadh 356 34 393 23208
7 KachchJi 109 24 134 5743
S Banasicantha 33 3 38 1129
9 Sabarkantha 88 7 96 7691
10 Mahesana 250 33 285 18584
11 Gandhinagar 34 1 35 3136
157

11. Industries
11.3 DISTRICTWISE NUMBER OF FACTORIES ANDAVERAGE NUMBER OF WORKERS EMPLOYEDDAILY-1V79 {Concld.)
Sr. District N o. ■ •
Registered Factories
Working* Ceased working
Average — ^—• niamber Total of workers
in working factories
1 2 3 4 5 6
12 Ahmadabad 3058 239 3305 248380
13 Kheda 659 53 712 42132
14 Panchmahals 174 27 203 8426
15 Vadodara 1264 115 1382 85889
16 Bharuch 169 36 206 12692
17 Surat 1033 257 1294 52779
18 Valsad 840 131 973 36498
19 Dangs 2 — 2 120
Total 10611 1230 11887 639104
* Working factories do not include factories exempted from submitting returns.
Source ;--Chief Inspector of Factories, Gujarat State
158

11, Industries
11.4 NUMBER OF WORKING FACTORIES AND WORKERS EMPLOYED DAII.Y THEREIN BY INDUSTRY GROUP
Sr.No.
Industry group At the and of 1979
No. ofworkingfactories
A'.eragenumber ofworkersemployeddaily inworkingfactories
1 2 3 4
1 Agricultural production not elsewhere classified 1 34
2 Other mining 8 100
3 Food products 1057 57080
4 Beverages, tobacco and tobacco products 300 10858
5 Cotton textiles 1327 253628
6 Wool, silk and synthetic fibre textiles 554 34690
7 Jute, hemp and mcsta textiles 3 20
159

11.4 NUMBER OF WORKING FACTORIES AND WORKERS EMPLOYED DAILY THEREIN BY INDUSTRY GROUP {Contd.)
11. Industries
Sr.No.
Industry group At the end of 1979
No. ofworkingfactories
Average number of workers employed daily in working factories
4
8 Textile products (including wearing apperal other than footwear) 186 7480
9 Wood and wood products, furniture and fixtures 612 7369
10 Paper and paper products and printing publicity and allied industries 367 15856
11 Leather and leather and fur products (except repair) 46 687
12 Rubber, plastic, petroleum and coal products 431 16436
13 Chemical and chemical products (except products of petroleum and coal) 1047 56417
160
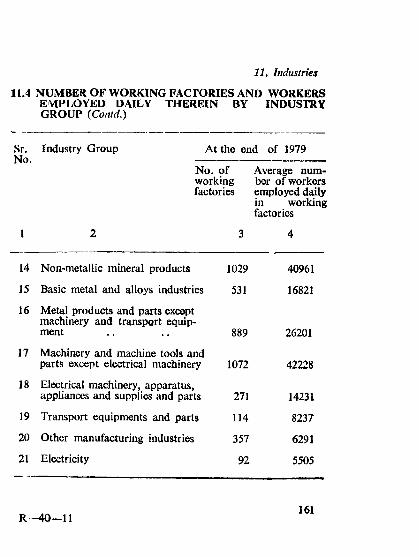
11. Industries
11.4 NUMBER OF WORKING FACrORIES AND WORKERSEMPLOYED DAILY THEREIN GROUP (Contd.)
BY INDUSTRY
Sr.No.
Industry Group At the end of 1979
No. ofworkingfactories
Average number of workers employed daily in working factories
1 2 3 4
14 Non-metaliic mineral products 1029 40961
15 Basic metal and alloys industries 531 16821
16 Metal products and parts except machinery and transport equipment 889 26201
17 Machinery and machine tools and parts except electrical machinery 1072 42228
18 Electrical machinery, apparatus, appliances and supplies and parts 271 14231
19 Transport equipments and parts 114 8237
20 Other manufacturing industries 357 6291
21 Electricity 92 5505
R -4 0 —11161

11.4 NUMfBER OF WORKING FACTORIES AND WORKERS EMPIwOYED DAILY THEREIN BY INDUSTRY GROUP(Contdl.)
11. Industtries
Sr.No.
1
Industry Group At the end o f 1979
N o. of Average nilnv working ber o f '^ork- factories ers employed'
daily in working factories
3 4
22 Ga;s and steam . . . . 3 46
23 Waiter works and supply . . . . 13 407
24 Acttivities allied to construction . . 2 19
25 Whiolesale trade in fuel, light,chejmicals,, perfumery, ceramicsand glass . . . . . . 2 19
26 Whiolesale trade in wood, p ^ er ,othier fabrics and skin andineidible oils . . . . . . 1 12
27 Laind transport . . . . . . 4 130
28 Seirvices incidental to transport . . 2 100
29 Storage and warehousing . . . . 9 80
30 Re:al estate andBuisiness Services 1 29
M2

11. Industries
11.4 NUMBER OF WORKING FACTORIES ANDWORKERS EMPLOYED DAILY THEREIN BYINDUSTRY GROUP {Concld.)
Sr.No.
Industry Group At the end of 1979
No. ofworkingfactories
Average number of
workers employed
daily in working factories
1 2 3 4
31 Public administration anddefence services . . 3 165
32 Sanitary services . . 6 38833 Education, scientific and
research services . . 4 27834 Community services . . 1 2235 Personal services . . 6 4436 Repair services 252 1604037 Services not elsewhere classified 7 17938 Activities not adequately defined • •39 Recreational and cultural
services . . 1 16
Total 10611 639104
Source :— Chief Inspector of Factories, Gujarat State.
163

11. Industries
11.5 PRODUCTION OF SELECTED INDUSTRIES
Sr.No.
Industry Unit 1978(P)
1979(P)
1 2 3 4 5
1 Cotton textile (Mill Sector)
1.1 Yarn Lakh Kgs. 1974 1545
1.2 Cloth Lakh Mts. 13647 9906
2 Caustic Soda . . ’(X) Tonnes 741 881
3 Salt . * 99 35555 53145
4 Vegetable oil Products „ (Vanspati)
509 521
5 Sulphuric acid . . tf 2236 2016
6 Superphosphate*.. $» 155 993
7 Refractories 9*117 108
8 Sanitary wares . . 99 58 N.A.
♦Production relates to P O contents throughoutt.m J
(P)=Pro visional.N .A .= N o t available.
164

11. Industries
11.5 PRIODUCTION OF SELECTED lNDUSTRlES(Co«cW.)
Sr.No.
Industry Unit 1978(P)
1979(P)
1 2 3 4 5
9 Stcone wares
9.11 Pipes ’00 Tonnes 44 45
9.22, Other kinds >1 19 18
10 Cejraent ’000 Tonnes 2036 1831
11 Flcour milling and griinding 99 50 52
12 Pojwer driven pumps ’000 No. 77 64
13 Biccycle spare parts ’000 Rs. 9888 N.A.
Source .-“ (I) Central Statistical Organisation, Calcutta.(2) Commissioner of Industries, Gujarat State.(3) Conunissioner of Textile, Bombay.
165
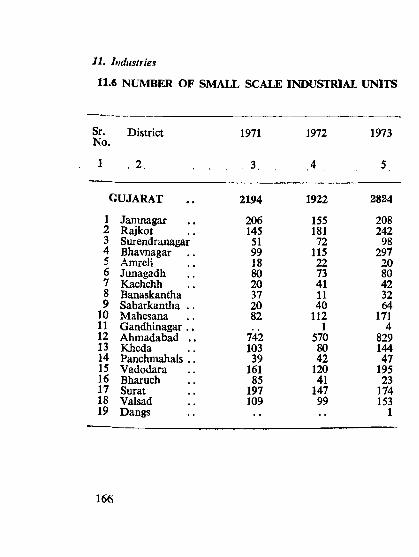
11. Industries
11.6 NUMBER OF SMALL SCALE INDUSTRIAL UNITS
Sr.No.
1
District
. 2 .
1971
. 3. .
1972
.4
1973
5
GUJARAT 2194 1922 2824
1 Jamnagar 206 155 2082 Rajkot 145 181 2423 Surendranagar 51 72 984 Bhavnagar 99 115 2975 Amreli . . 18 22 206 Jiinagadh 80 73 807 Kachchh 20 41 428 Banaskantha 37 11 329 Sabarkantlia .. 20 40 64
10 Maliesana 82 112 17111 Gandhinagar . . 1 412 Ahmadabad . . 742 570 82913 K h^a 103 80 14414 Panchmahals .. 39 42 4715 Vadodara 161 120 19516 Bharuch 85 41 2317 Sxirat 197 147 17418 Valsad 109 99 15319 Dangs 1
166

11. Industries
REGISTERED IN GUJARAT STATE
1974 1975 1976 1977 1978 1979
6 7 8 9 10 n
i m 2686 2042 1902 2968 3713
198 71 74 104 236 339343 351 293 194 293 39766 124 99 105 139 167
222 149 90 91 118 16421 9 17 27 24 3772 80 43 44 97 9830 34 24 34 31 15751 49 11 9 50 4481 62 19 63 85 91
162 93 115 91 128 1992 2 1 1 1 7
659 640 588 493 644 828303 132 92 76 156 18837 48 33 37 65 68
226 224 108 163 234 23450 55 67 52 71 109
322 414 248 186 419 383127 149 120 132 176 203
I . . . . . . 1
Source .-Commissioner of Industries, Gujarat State.
167

11.7 ANNUAL SURVEY OF INDUSTRIES-CENSUS SECTOR
11. Industries
Sr. Item No.
1 2
Unit
3
1977-78
4
1978-7 9
5
1 Factories No. 1559 1776
2 Productive Capital Rs. in crores
2023 3056
3 Fixed Capital >> 1550 1968
4 Working Capital >> 473 1088
5 Workers employed in’OOO 382 453
6 Other persons employed >9 85 68
7 Wages, Salaries and other benefits Rs.in
crores289 303
8 Total value of inputs „ 2436 3002
9 Depreciation 102 131
10 Ex-factory value of output
>> 3266 3884
11 Value added by Manufacture 728 751
Source .---Bureau of Economics and Statistics, Gujarat State.
168

H .8 ANNUAL SECTOR
11. Industries
SURVEY OF INDUSTRIES-SAMPLE
Sr. Item Unit 1977-78*@
1978-79No.
1 2 3 4 5
1 Factories N o. 8096 78952 Productive Capital Rs. in 284 321
crores3 Fixed Capital 99 160 1764 Working Capital
in ’( ^124 145
5 Workers employed 13316 Other persons I
employed r( 205**7 Wages, Salaries and Rs. in 37J
other benefits crores 63 528 Total value of inputs 99 838 9319 Depreciation 99 14 21
10 Ex-factory value ofoutput 99 956 1086
11 Value added bymanufacture >• 104 134
♦Estimates are based on Factory sector results for the year 1977-78 compiled by Central Statistical Organisation and census sector results for the same year compiled by Bureau.
**Indicates total no. o f employees.©Estimates prepared by Bureau.Source .-Bureau o f Economics and Statistics, Gujarat State.
169

11.9 LICENCES ISSUED FOR STARTING NEW INDUSTRIAL UNDERTAKINGS AND EXPANSION OF EXISTING UNITS IN GUJARAT STATE
11. Industries
Sr.No.
1
Item
2
Unit
3
1977-78
4
1978-79
5
1979-80
6
1 Licences issued No. 44 44 53
2 Total investment in plant and machinery
Rs. in Lakhs 2732 9695 8486
3 Employmentpotential No. 7106 4959 8469
Source Commissioner o f Industries, Gujarat State.
170

11.10 DISTRICTWISE LICENCES ISSUED FOR ESTABLISHMENT# OF NEW INDUSTRIAL UNDERTAKINGS IN GUJARAT STATE
11. Industries
Sr. District No.
Licences issued
1977
3
1978
4
1979
5
1 Jamnagar 1 •• 2
2 Rajkot 1 3
3 Surendranagar •• 3 3
4 Bhavnagar
5 Amreli . . 1 2
6 Junagadh 1 1 2
7 Kachchh 1
8 Banaskantha 1 1
9 Sabarkantha 2 2
10 Mahesana 2 2 1
11 Gandhinagar •• ••
171

11.10 DISTRICTWISE LICENCES ISSUED FOR ESTABLISHMENT OF NEW INDUSTRIAI. UNDERTA-
11. Industries
KINGS IN GUJARAT STATE (Concld.)
Sr. District N o.
1 2
Licences issued
1977
3
1978
4
1979
5
12 Ahmadabad 10 10 3
13 Kheda 5 3 7
14 Panchmahals 2 3 4
15 Vadodara 21 13 16
16 Bharuch 9 5 26
17 Surat 1 1 5
18 Valsad 13 8 16
19 Dangs • . ••
20 Unspecified places 11 8 11
Total 80 60 103
Note ;—Licences issued for free trade zone Kandlaare not included.
Source :—Commissioner o f Industries, Gujarat State.
172

11.11 SPINDLAGE, LOOMAGE, PRODUCTION OF YARN AND CLOTH AND EMPLOYMENT IN TEXTILE INDUSTRY IN GUJARAT STATE
11. Industries
Sr.N o .
Item Unit 1978-79 1979-80
3 4 5
1 Spindles (Rings and Mules) installed (As on 1st January)
Composite Mills In ’000 3518 3554
Spinning Mills 99 364 375
2 Looms installed (As on 1st January) it
63 63
3 Yam production (Monthly average) Composite Mills In ‘000
Kgs.9376 11917
Spinning Mills »> 1983 2233
4 Cloth production (Monthly average)
In ‘000 Metres
78983 90512
5 Average number of workers employedAhmadabad City In ’000 139 195Rest of Gujarat »» 51 53
Source .--Office of the Textile Commissioner, Bombay.173

11. Industries
11.12 INDUSTRIAL DISPUTES
Sr.No.
Year Number of disputes
Number ofworkersinvolved
Numbe ofmandayslost
1 2 ' • ■ 3 4 5
1 1961 83 46260 89014
2 1966 69 14401 157139
3 1970 80 48160 324072
4 1975 61 10616 177618
5 1976 56 6353 43235
6 1977 162 31682 297304
7 1978 174 33147 341108
8 1979 219 48378 533406
9 1980(P) 223 73007 1064380
(P) = Provisional
Source .'-Office of the Commissioner of Labour, Gujarat State.
174

IL Industries
11.13 INDUSTRIAL DISPUTES BY CAUSES
Sr.N o.
1
Causes
2
1976
3
1977
4
1978
5
1979
6
1 Wages and allowances
18 55 46 62
2 Bonus .. 22 30 35
3 Personnel and retrenchment • • • • • •
4 Leave and hours of work 14 12 1 4
5 Indiscipline and violance • • • • • •
6 Others 24 73 97 118
Total 56 162 174 219
Source:—Office of the Commissioner of Labour, Gujarat State.
175
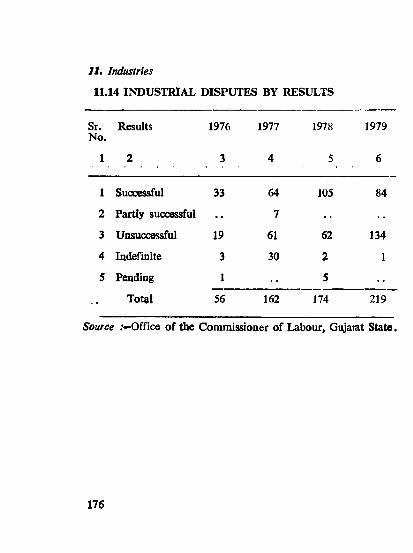
J l. Industries
11.14 INDUSTRIAL DISPUTES BY RESULTS
Sr.No.
Results 1976 1977 1978 1979
1 2 3 4 5 6
1 Successful 33 64 105 84
2 Partly successful 7
3 Unsuccessful 19 61 62 134
4 Indefinite 3 30 2 1
5 Pending 1 5
- Total 56 162 174 219
Source ;-Office of the Commissioner of Labour, Gujarat State.
176
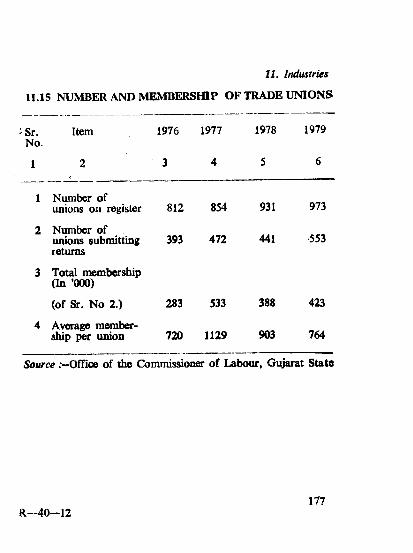
11. Industries
11.15 NUMBER AND MEMBERSHIP OF TRADE UNIONS
tSr. Item 1976 1977 1978 1979No.
1 2 3 4 5 6
1 Number ofunions on register 812 854 931 973
2 Number of ,unions submitting 393 472 441 553returns
3 Total membership (In ’000)
(of Sr. No 2.) 283 533 388 423
4 Average membership per union 720 1129 903 764
Source ;-Offioe of the Commissioner of Labour, Gujarat State
177R—4 0 -1 2

12 Life Insurance
12.1 LIFE INSURANCE STATISTICS
Sr.No.
Period Number of Sum assured policies issued during the during the period period
(Rs.in crores)
3 4
1 1965-66 . . 106308 51.79
2 1970-71 .. 147157 123.26
3 1971-72 . . 173695 164.15
4 1974-75 . . 142218 211.06
5 1975-76 . . 170208 163.25
6 1976-77 .. 182280 168.10
7 1977-78 .. 152791 153.56
8 1978-79 .. 137003 153.45
9 1979-80 171446 211.18
Source -.—Life Insurance Corporation of India.
178

13.1 NUMBER OF OFFICES OF COMMERCIAL AND CO-OPERATIVE BANKS AND NUMBER OF PLACES SERVED BY THEM
Commercial : As on 31st December.
Co-op^ratiMe : As on 3Ist March.
13. Banking
Sr. Item 1977 1978 1979No.
1 2 3 4 5
1 Number of <M5ces
(A) Commercial . . 2043 2143 2204
(B) Co-operative . . 1002 1062 1108
2 Number of places
(A) Commercial . . 917 1086 1127
(B) Co-operative . . 644 654 818
Source (1) Reserve Bank of India.(2) Statistical Tables relating to Banks in India
Published by Reserve Bank of India.
179
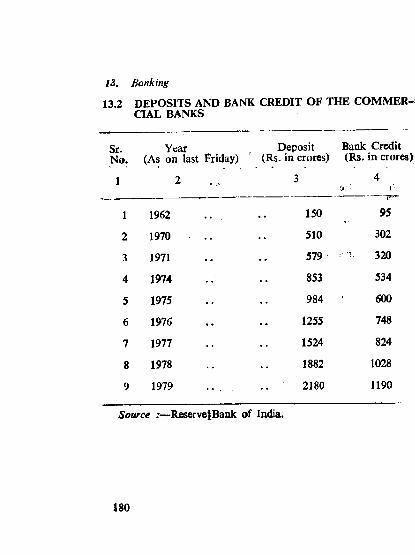
13.2 DEPOSITS AND BANK CREDIT OF THE COMMER- a A L BANKS
13. Banking
Sr.No.
Year , (As on last Friday)
Deposit ' (Rs. in crores)
Bank Credit (Rs. in crore
1 2 3 4'r.'
1 1962 150 95
2 1970 510 302
3 1971 579 320
4 1974 853 534
5 1975 984 600
6 1976 1255 748
7 1977 1524 824
8 1978 1882 1028
9 1979 2180 1190
Source :—ReserveiBank of India.
180
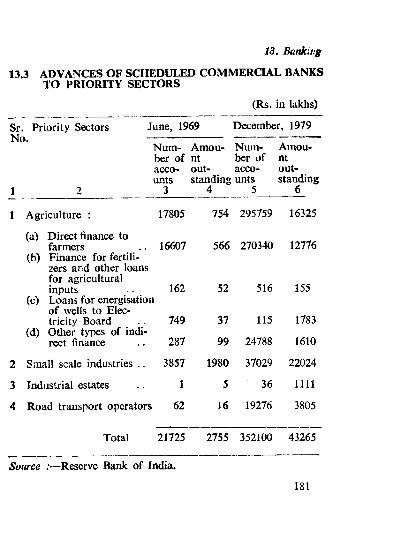
13.3 ADVANCES OF SCHEDULED COMMERCIAL BANKS TO PRIORITY SECTORS
(Rs. in lakhs)
13. Banking
Sr. Priority Sectors No.
June, 1969 December, 1979
Num- Amou- Nuin- Amou-ber of nt ber of ntacco- out- acco- out-unts standing unts standing
3 4 5 6
1 Agriculture :
(a> Direct finance to
17805 754 295759 16325
farmers (b) Finance for fertili
zers and other loans for agricultural
16607 566 270340 12776
inputs(c) Loans for energisation
of wells to Elec
162 52 516 155
tricity Board (d) Otiier types of indi
749 37 115 1783
rect finance 287 99 24788 1610
2 Small scale industries .. 3857 1980 37029 22024
3 Industrial estates 1 5 36 nil
4 Road transport operators 62 16 19276 3805
Total 21725 2755 352100 43265
Source :—Reserve Baiik of India.
181
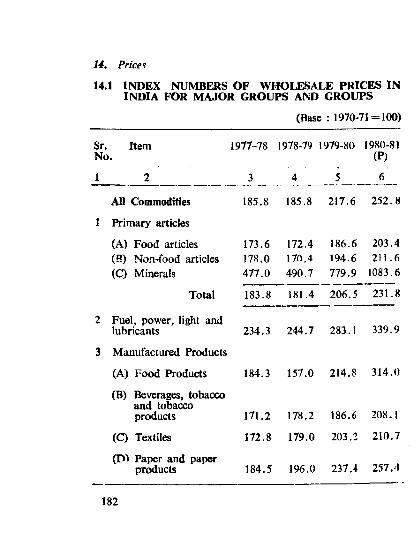
14.1 INDEX NUMBERS OF WHOLESALE PRICES IN INDIA FOR MAJOR GROUPS AND GROUPS
(Base : 1970-71=100)
14. Prices
Sr. Item No.
1977-78 1978-79 1979-80 1980-81(P)
1 2 3 4 5 6
All Commodities 185.8 185.8 217.6 252.8
1 Primary articles
(A) Food articles 173.6 172.4 186.6 203.4(B) Non-food articles 178.0 170.4 194.6 211.6(C) Minerals 477.0 490.7 779.9 1083.6
Total 183.8 181.4 206.5 231.8
2 Fuel, power, light and lubricants 234.3 244.7 283.1 339.9
3 Manufactured Products
(A) Food Products 184.3 157.0 214.8 314.0
(B) Beverages, tobacco and tobacco products 171.2 178.2 186,6 208.1
(Q Textiles 172.8 179.0 203.2 210.7
(P'k Paper and paper products 184.5 196.0 237.4 257.4
182
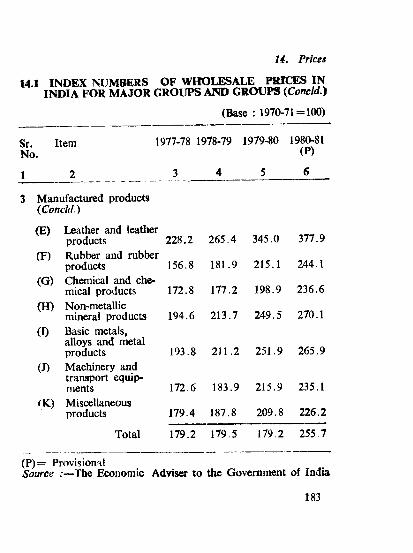
(Base : 1970-71 = 100)
U . Prices
14.1 INDEX NUMBERS OF WHOLESALE M C E S ININDIA FOR MAJOR GROUPS AND GROUPS {Concld.)
Sr. Item 1977-78 1978-79 1979-80 1980-81No. (P)
1 2 3 4 5 6
3 Manufactured products (Concld.)
(E) Leather and leather products 228.2 265.4 345.0 377.9
(F) Rubber and rubber products 156.8 181.9 215.1 244.1
(G) Chemical and chemical products 172.8 177.2 198.9 236.6
(H) Non-metallic mineral products 194.6 213.7 249.5 270.1
(I) Basic metals, alloys and metal products 193.8 2)1.2 251.9 265.9
(J) Machinery and transport equipments 172.6 183.9 215.9 235.1
(K) Miscellaneousproducts 179.4 187.8 209.8 226.2
Total 179.2 179.5 179.2 255.7
(P )= ProvisionalSource :—The Economic Adviser to the Government of India
183
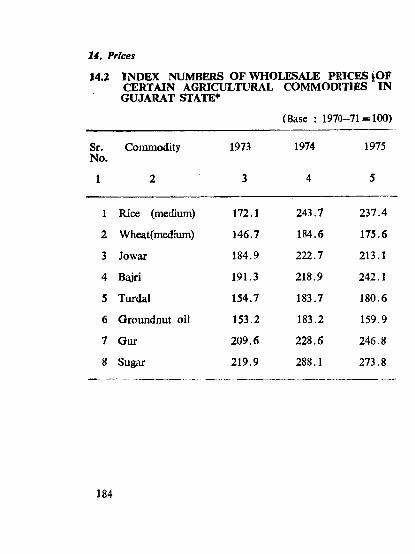
(Base : 1970-71 = 100)
14. Prices
14.2 INDEX NUMBERS OF WHOLESALE PRICES ^OFCERTAIN AGRICLfLTURAL COMMODITIES INGUJARAT STATE*
Sr. Commodity No.
1973
3
1974
4
1975
5
1 Rice (medium) 172.1 243.7 237.4
2 Wheat(medium) 146.7 184.6 175.6
3 Jowar 184.9 222.7 213.1
4 Bajri 191.3 218.9 242.1
5 Turdai 154.7 183.7 180.6
6 Groundnut oil 153.2 183.2 159.9
7 Gur 209.6 228.6 246.8
8 Sugar 219.9 288.1 273.8
184

(Base : 1970-71=100)
l i . Prices
14.2 INDEX NUMBERS OF WHOLESALE OFCERTAIN AGRICULTURAL COMMODITIES INGUJARAT STATE*
1976 1977 1978 1979 • 1980
6 7 8 9 10
137.3 146.3 141.9 139.7 159.6
137.8 147.9 152.4 150.5 169.6
146.0 158.7 157.8 151.8 173.7
149.7 177.3 179.3 159.7 198.0
129.0 223.8 278.5 264.1 266.4
97.2 149.9 152.5 184.9 205.0
221.1 218.8 170.5 216.2 366.8
276.2 248.5 185.2 161.4 409.7
(P)== Provisional . , , *•♦Based on prices prevailing at all District Head Quarters oi
Gujarat except Dangs and Gandhinagar districts.Source .--Bureau of Economics and Statistics, Gujarat State
185

14. Prices
14.3 INDEX NUMBERS OF RETAIL PRICES OFGUJARAT
Sr. Commodity 1973 1974 1975No. . . . . . . . .1 2 3 4 5
1 Rice (medium) 170.2 238.5 233.0
2 Wheat(medium) 143.7 178.8 171.1
3 Jowar 180.1 216.7 207.2
4 Bajri 184.1 211.3 234.5
5 Turdal 154.7 175.0 180.1
6 Groundnut oil 153.6 174,3 160.2
7 Gur 200.0 206.8 21«.9
8 Sugar 222.4 271.9 276.7
186

CERTAIN AGRICUI.TURAL COMMODITIES IN STATE*
(Base : 1970-71=100)
1976 1977 1978 1979 1980(P)
6 7 8 9 10
14. Prices
136.5 146.8 142.2 140.3 159.0
134.8 145.9 150.4 148.8 167.2
144.9 157.0 156.9 151.8 172.4
147.2 173.0 175.7 158.5 194.8
129.7 219.8 272.9 261.2 263.0
98.0 150.3 152.5 183.6 205.2
206.4 208.5 168.9 205.5 346.5
278.6 252.1 190.4 167.2 416.3
(P)=Provistonal*Based on prices prevailing at all District Head Quarters of Gujarat except Dangs and Gandhinagar Districts.
Source .'-Bureau of Economics and Statistics, Gujarat State,
187

14.4 CONSUMER PRICE INDEX NUMBEIS pfOR INDUSTRIAL WORKERS
(Bae :: 1960=100)
14. Prices
Sr.No.
1
Year
2• ‘ .
Gnerral Index
Aknalabad
3 ’
Bhavaagar
'4
1 1961 1021 102
2 1965 129 132
3 1970 175 185
4 1971 178 191
5 1974 294 314
6 1975 301 326
7 1976 276 296
8 1977 305 317
9 1978 320 340
10 1979 339 359
11 1980 368 398
Source .--Labour Bureau, Government India, Simla.
188

l i . Prices
14.5 CONSUMER PRICE INDEX NUMBERS FOR URBAN NON-MANUAL EMPLOYEES
(Base : 1960=100)
Sr.N o.
Year Ahmadabad Rajkot
1 2 3 4
1 1961 . . 102 104
2 1965 . . 129 124
3 1970 . . 171 174
4 1971 . . 171 173
5 1974 . . 259 265
6 1975 . . 277 279
7 1976 . . 261 262
8 1977 . . 284 285
9 1978 . . 298 293
10 1979 . . 312 313
11 1980 . . 343 363
5o«r/cg;~Central Statistical Organisation, Government of India.
189

(Base : 1960 = 100)
14. Prices
14.6 CONSUMER PRICE INDEX NUMBERS FORAGRICULTURAL LABOURERS
Sr.N o,
♦Year%
Index Numbers
1 2 3
1 1966-67 153
2 1970-71 173
3 1971-72 183
4 1972-73 225
5 1973-74 246
6 1974-75 319
7 1975-76 . . 291
8 1976-77 266
9 1977-78 285
10 1978-79 287
11 1979-80 •• 321
♦Agricultural Year-July to June Source :—Indian Labour Statistics.
ISO
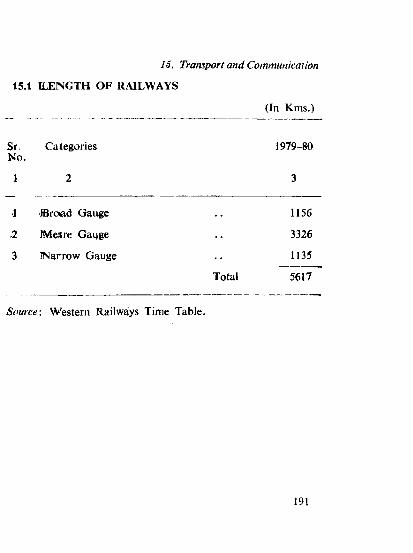
(In Kms.)
15. Transport and Communication
15.1 ILENGTH OF RAILWAYS
Sr. Categories 1979-80No.
1 2 3
•J iBro.ad Gauge . . 1156
.2 fMeire Gauge . . 3326
3 INarrow Gauge . . 1135
Total 5617
Source:-Western Railways Time Table.
191

15. Transport and Communication
15.2 LENGTH OF ROADS (EXCEPT MUNICIPAL)~
(In Krns.)
Sr. Categories As on 31st March
.1961 1970 1978 . 1979 1980
1 2 3 4 5 6 7
1 National highways 1005 1056 1383 i f 1425 ...1435
2 State highways 4025 8003 9027 9058 9097
3 Major District Roads 6086 6599 9830 10043 10542
4 Other District Roads 7008 8532 9639 9834 10571
5 Village Roads 4505 9143 12480 12896 13463
Total 22629 33333 42359 43256 45108
iS'owrce-Buildings and Communications Department, Government of Gujarat.
192

15. Transport and Communication
15.3 LENGTH OF ROADS (EXCEPT MUNICIPAL) ACCORDING TO TYPES OF SURFACE
(In Kras.)
Sr. Categories No.
As on 31st March
1961 1970 1978 1979 1980
3 4 5 6 7
2 Black tapped
3 Water bound macadam
4 Total surfaced roads
5 Total unsurfaced roads
Total
1080 989 584 489 418
4434 9982 18293 19510 21110
6416 5406 7375 7520 8367
11930 16377 26252 27519 29895
10699 16956 16107 15737 15213
22629 33333 42359 43256 45108
Source:—Buildings and Communications Department, Government of Gujarat.
R - 4 0 —13 193

15. Transport and Comnmmcation
15.4 NUMBER OF MOTOR VEHICLES ON ROAD
Sr. Class of As on 31st Marchl ^ U . VC1IIV-1C>
1960* 1975 1979 1980
1 • -2 3 4 • 5 6-
1 Motor Cycles 5698 95466 170929 2(X)114
2 Motor Car 12874 39283 41038 49858
3 Taxi Cabs 706 1570 1449 1947
4 Auto-rickshaws 1021 10757 20467 22628
5 Stage-Carriages 2229 6275 7681 7825
6 Lorries 10258 22877 34733 38983
7 Trailers 1272 13016 12052 14838
8 Tractors 2056 16187 18405 20669
9 Others 189 882 1365 1247
Total 36303 206313 308119 358109
*As on 31st December
Source :—Directorate of Transport, Gujarat State.
194

15.5: WORKING OF THE GUJARAT STATE ROAD TRANSPORT CORPORATION
15. Transport and Communication
Sr.No.
Item Period
1978-79 1979-80
3 4
1 Number of routes operated at the end 9472 10437of the period..
2 Route Kms. at the end of the period(In ’000) 472 521
3 Average number of vehicles on road 4557 49254 Fleet held by the corporation at the
end of the period (excluding vehiclesawaiting scrapping) . . 5944 6404
5 Average daily traffic earnings(‘OOORs.) 2889 3295^ Average number of passengers trave
lled per day (In ’000) 2909 31247 Total effective kms. operated (Inlakhs) 4763 52538 Total earnings (including miscellaneous
receipts) (Rs. in lakhs) 10936 125579 Gross revenue expenditure*
(Rs. in lakhs) 9742 1121710 Total revenue expenditure(Rs. in lakhs) 11317 1309711 Fixed capital expenditure at the end
of the period (Rs. in lakhs) 9651 11292
♦Excluding provisions, depreciation and interest. Source :—Gujaral State Road Transptirt Corporation,
Ahmadabad.
1 9 5

15. Transport and Communication
15.6 IMPORTS AND EXPORTS AT GUJARAT PORTS
(Lakh tonnes)
Sr. year No.
Intermediate and minor ports
Imports Exports
3 4
Major Port Kandla
Imports Exports
5 6
1 •1961—62 8.49 15.79 11.14 2.782 1970—71 7.05 19.61 14.74 J.233 1971—72 8.66 21.10 17.98 2.344 1974—75 12.47 17.80 32.40 3.045 a 975—76 12.19 18.82 29,24 2.796 1976—77 6.25 22.03 31.27 1.877 .1977—78 5.80 14.65 35.25 2.918 1978—79 7.63 13.14 54.04 4.669 1979—80 10.41 14.20 68.10 4.63
(2) Kandla Port Trust.

(As on 31st March 1980)
Sr. Name of Length of Number of ports in the districtNo. the meri- its C o a s t -------------------------- ;--------Zr~7~
time dis- line Major Inter- Mmor Totaltrict of (in kms.) mediateGujarat _
1 2 3 4 5 6 7
15. Transport and Communication.
15.7 COASTLINE AND NUMBEj QF PO^J$ BS STA^E
1 Kachchh 320 1 1 3 5
2 Rajkot 20 • • 1 •• 1
3 Jamnagar 270 •• 4 4 8
4 Junagadh 205 • • 2 4 6
5 Amreli 50 • • 3 3
6 Bhavnagar 120 •• 1 3 4
7 Kheda 40 • • 1 1
8 Bharuch 100 1 1 2
9 Surat 65 • • 1 1 2
10 Valsad 70 •• 8 8
Total 1260 1 11 28 40
Note The remaining 9 districts are without ports. Source :—Directorate of Ports, Gujarat State.
197

15. Transport and Communication
15.8 POSTAL STATISTICS
Sr. Item 1960-61 1974-75 1978-79 1979-80N o.
1 2 3 4 5 6
1 Post offices* ■ 3494 '7205 ’ ’ 554 83" 2
2 Telegraph offices 392 708 1322 1400
Telephone connections 18332 117391 172727 185552
Source :—Post Master General, Ahniadabad.
198

15. Transport and Communication
15.9 NUMBER OF BROADCASTING RECEIVINGLICENCES IN FORCE IN GUJARAT
Sr. Type No.
1961 1977 1978 1979
1 2 3 4 5 6
1 Domestic 206732 1269676 1279264 1374206
2 Cheap 2096 291076 296171 320480
3 Community 6347 6381 7957 2328
4 Schools 816 640 721 591
5 Hospitals — 51 117 74
6 Commercial 6651* 17685 18924 19043
6.1 Urban — 12368 12881 13476
6.2 Rural — 2100 2251 1955
6.3 Low Cost — 3217 3792 36127 Possession
7.1 Demonstrations 158 162 637 428
7.2 Dealer 1319 3905 365i 4038
7.3 Non-dealer — 112 132 149
* The classification of Commercial is not available. Source Post Master General, Ahmadabad.
199

16. Public Finance
16.1 GENERAL BUDGETORY POSITION
(Rs. in lakhs)
Sr.No.
Item
2
1979-80 1980-81 1981-82(Actuals) (Revised (Budget
Estimates) Estimates)3 4 5
1 Revenue Account
A. Revenue receiptB. Revenue expendi
ture.C. Surplus(+) or
Deficxt(—)
2 Capiial Accouiit
A. Capiial receipt
B. Capital expenditure.
C. Surplus(+)or deficit(—)
3 Contingency Fund(Net)
8365574425
10245492923
10864297569
(+ )9 2 3 0 (+ ) 9531 ( + ) 11073
19436
37624
(-)18188
(+ ) 335
34586
52^22
29585
49357
(-) 18236 (-) 19772
4 Public Account(Net) (+ )2810
Over all surplus(+) (-)5813 or Deficit(—)
(+ ) 8331
(-) 374
(+ ) 4897
(-) 3802
Source :—^Finance Department, Government o f Gujarat.
200

16. Public Finance
16.2 RECEIPTS ON REVENUE ACCOUNT
(Rs. in lakhs)
Sr. Item 1979-80 1980-81 1981-82N o. (Actuals) (Revised
estimates)(Budget
estimates^
1 2 3 4 5
1 Tax Revenue 62220 72504 78827
A . Share in central taxes 17333 18062 20050
1. Income tax 5154 5424 5846
2. Estate duty 102 92 102
3. Union excise duties 12077 12546 14102
B. State taxes 44887 54442 58777
1. Land revenue 880 800 830
2. Stamp and registration fees
2580 2900 2925
3. State excise 316 335 405
4. Sales tax 28937 37000 39703
5. Taxes on vehicles 2000 2220 2464
6. Taxes on goods and passengers
3271 3863 4544
201

16. Public Finanec
16.2 RECEIPTS ON REVENUE ACCOUNT {Concld.)
(Rs. in lakhs)
Sr. Item No.
1 2
1979-80(Actuals)
3
1980-81(Revised
estimates)4
1981-82(Budget
estimates)5-
B. State Taxes (Concld.)
7. Taxes and duties on electricity 3446 3756 4154
8. Entertainment tax 1844 1993 2153
9. Other taxes on income and expenditure 726 805 800
10. Other taxes and duties 887 770 799
2 Non-tax Revenue 15259 20830 20189
A. Interest receipts 7033 10745 9163
B. Dividends and profits 285 590 547
C. Grants-in-aid and Contribution
6176 9120 9626
D . Other non-tax revenue 7941 9495 10479
3 Total receipt on revenue account 83655 102454 108642
Source :—Finance Department Government of Gujarat.
202

16. Public Finance
16.3 TAX RECEIPT ON REVENUE ACCOUNT
(Rs. in lakhs)
Year
1
1961-62
1965-66
1970-71
1975-76
1976-77
1977-78
1978-79
1979-80( Actual)
1980-81(Revised estimates)
1981-82 TBusget estimates)
Incometax
_ 2__
914
589
1852
4074
3620
3749
3922
5154
5424
5846
Taxes on Taxes on Total property commodi- tax and ties and receiptcapital services transactions
3 4 5
711
1117
1623
2263
2456
3182
3570
4288
4597
4657
2885
5041
11112
25577
32446
35285
39473
52778
62483
68324
4510
6747
14587
31914
38522
42216
46965
62220
72504
78827
Source :—Finance Department, Government of Gujarat.
20y

16. Public Fimnce
16.4 EXPENDITURE O N REVENUE ACCOUNT
(Development and Non-Development)
Sr. Item No.
1979-80(Actuals)
1980-81(Revised
estimates)
1981-82(Budgetestimates)
1 2 3 4 5
1 Development Expenditure (A +B )
53441 67495 72521
A. Social and Community Services. 32751 36504 36661
B. Economic Services 20690 30991 35860
1. General economic services
1344 1753 1897
2. Agriculture and alliedservices 10061 14949 16013
3. Industries and minerals 1606 1924 1921
4. Water and power development 5214 8500 8857
5, Transport and communications 2465 3865 7172
204
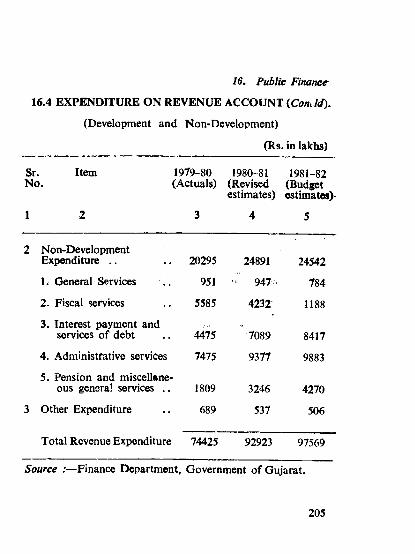
Public Finance
16.4 EXPENDITURE ON REVENUE ACCOUNT (ConJd).
(Development and Non-Development)
(Rs. in lakhs)
Sr. ItemN o. 1
1979-80(Actuals)
1980-81(Revisedestimates)
1981-82(Budgetestimates>
1 2 3 4 5
2 Non-Development Expenditure , . 20295 24891 24542
1. General Services 951 947; 784
2. Fiscal services 5585 4232- 1188
3. Interest payment and services o f debt 4475 7089 8417
4. Administrative services 7475 9377 9883
5. Pension and miscellaneous general services . . 1809 3246 4270
3 Other Expenditure 689 537 506
Total Revenue Expenditure 74425 92923 97569
Source :—Finance Department, Government o f Gujarat.
205

16. Public Finance
16.5 EXPENDITURE ON CAPITAL ACCOUNT
(Rs. in lakhs)
Sr.No.
Item 1979-80(Attunls)
1980-81(Revisedestirnates)
1981-82(Budget.estimates)
1 3 4 5
1 Developine/it Expenditure 30510 32807 34437
A. Social and Community Services .. . . 3406 3651 3130
1. Education, art and culture . . 225 117 86
2. Medical, family planning, public health, sanitation and water supply 1212 1259 1183
3. Housing 592 1142 751
4. Others 1377 1133 1110
B, Economic services 27104 29156 31307
I. General Economic services 3537 3107 1132
2. Agriculture andallied services 1965 2094 2419
206

16, Public Finance
16.5 EXPENDITURE ON CAPITAL ACCOUNT (Concld.)
(Rs. in lakhs)
Sr. Item 'Jo.
1979-80(Actuals)
1980-81(Revised
estimates)
1981-82(Budget
estimates)
I 2 3 4 5
1 Development Expenditure {Concld.)
B. Economic services3. Industries and
minerals 3318 1968 23744. Water and power
development .. 16246 19058 241775. Transport and
communications 2038 2929 12052. Non-Development
Expenditure 7114 20015 14920
A, General services 6 10 NB. Public debt . . 3245 6355 10214C. Loans and advan
ces by the State Government . . 3862 13649 4705
D. Other expenditure 1 1 ITotal Capital Expenditure (1 + 2) 37624 52822 49357
Source :—Finance Department, Government of Gujarat.
207

16.6 PER CAPITA INCOME ON REVENUE AND CAPITAL ACCOUNT
(In Rs.)
16. Public Finance
Sr. Item 1979-80 1980-81 1981-82N o. (Accounts) (Revised (Budget
estimates) estimates2 3 4 5
Receipts on Revenue Account 263.90 316.22 328.22
1 Tax Revenue . . 196.28 223.78 238.15
(a) Share in Central taxes
54.68 55.75 60.57
(b) Land Revenue 2.78 2.47 2.51
(c) Stamp and Registration fees
8.14 8.95 8.84
(d) State Excise 1.00 1.03 1.22
(e) Sales Tax 91.28 114.19 119.95
(0 Taxes on Vehicles 6.31 6.85 7.44
(g) Taxes on Goods and Passengers
10.32 11.92 13.73
(h) Taxes and Duties on Electricity 10.87 11.59 12.55
(i) Entertainment Tax 5.82 6.15 6.50
U) Other taxes and duties 5.09 4.86 4.83
208

16.6 PER CAPITA INCOME ON REVENUE AND CAPITAL ACCOUNT iConcld.)
(In Rs.)
16. Public Finance
Sr. Item 1979-80 1980-81 1981-82No. (Accounts) (Revised (Budget
estimates) estimates)
1 2___________________3 4__________ 5___
A Receipt on revenue Account
2 Non-Tax Revenue 48.14 64.29 60.99
B Receipt on CapitalAccount 61,31 106.75 89.38
(a) Internal Debt of the state Government
9.97 17.03 27.72
(b) Loans and advances from the Central Government 42.41 49.55 45.90
(c) Other Receipts 8.93 40.16 15.76
[: Total (A +B ) 325.21 422.97 417.60
Source :—Finance Department, Government of Gujarat.
R _ 4 0 _ 1 4 209
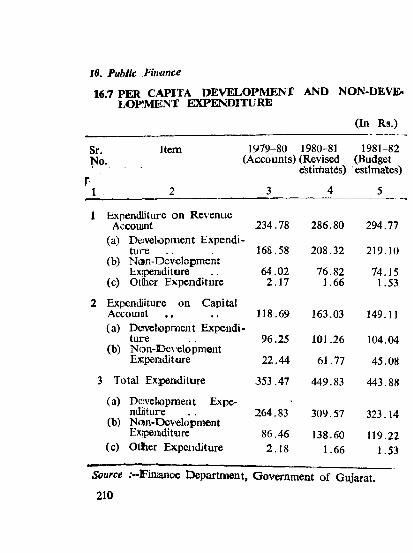
16.7 PER CAPITA DEVELOPMENT AND NON-DEVE- LOP!MENT EXPENDITURE
(In Rs.)
16. Pubiic Fin<ance
Sr. Item No.
F1 2
1979-80 1980-81 1981-82 (Accounts) (Revised (Budget
estiriiat6s) estimates)
3 4 5
1 Expendliture on Revenue Accoumt 234.78 286.80 294.77
(a) Develtopment Expendi ture 168.58 208.32 219.10
(b) Non-Dcv>clopment Experuditure 64.02 76.82 74.15
(c) Otlher Expenditure 2.17 1.66 1.53
2 Expendiiture on Capital Accournt 118.69 163.03 149.11(a) Desveltopmeut Expendi
ture 96.25 101.26 104.04(b) Non-Development
Experaditxire 22.44 61.77 45.08
3 Total Expenditure 353.47 449.83 443.88
(a) Develtopment Expendiiture 264.83 309.57 323.14
(b) No)n-Development Exiperaditwre 86.46 138.60 119.22
(c) Otlher Expenditure 2.18 1.66 1.53
Source .--Finianoe Department, Government o f Giyarat.
210

J 6.8 CLASSIFICATION OF THE INCOME TAX PAYABLE BY CLASS OF ASSESSEES IN GUJARAT
211

16. Public Finance
16.8 CLASSIFICATION OF THE INCOME TAX PAYABLE
Sr. Class of assesseesNo.
1 Individuals ..
2 Hindu undivided families
3 Unregistered firms and other associations of persons
4 Registered firms
5 Companies and other concerns assessable at Company Rate
6 All Classes . .
2 1 2

16. Public Finance
BY CLASS OF ASSESSEES IN GUJARAT
Year
1960-61 1977-78
Number Total Total Number Totalof income tax of income
assessees assessed payable* assessees assessed (Rs. in (Rs. in (Rs. inlakhs) lakhs) lakhs)
Totaltaxpayable* (Rs. in lakhs)
8
66290 6199 709 208323 34374 5323
7617 975 123 13456 2874 727
1872 210 29 2545 951 510
2146 1646 48 59433 26365 2530
403 705 339 713 5672 3400
78328 9735 1253 284470 70236 12490
* The figures are inclusive of income tax, super tax and surcharge.
Statistical Abstract of the Indian Union published by the Central Statistical Organisation, New, Delhi.
213
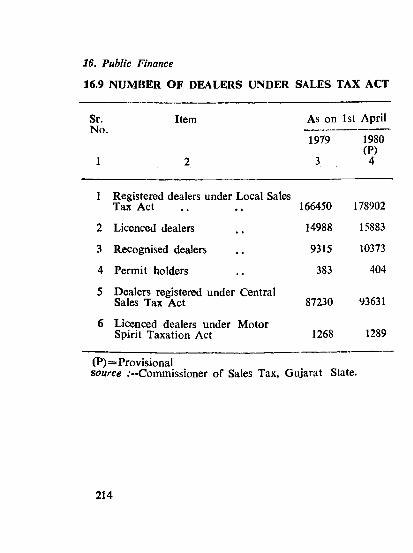
16. Public Finance
16.9 NUMBER OF DEALERS UNDER SALES TAX ACT
Sr.No.
Item As on 1st April
1979
3
1980(P)
4
1 Registered dealers under Local Sales Tax Act 166450 178902
2 Licenced dealers 14988 15883
3 Recognised dealers 9315 10373
4 Permit holders 383 404
5 Dealers registered under Central Sales Tax Act 87230 93631
6 Licenced dealers under Motor Spirit Taxation Act 1268 1289
(P)=Provisionalsource .'--Commissioner of Sales Tax, Gujarat State.
214

16, Public Finance
16.10 RECEIPTS OF M U N iaP A L CORPORATIONS ANDMUNICIPALITIES
(Rs. in lakhs)
Sr. Head No.
1977-78 1978-79 (?)
MunicipalCorporations
Municipalities
MunicipalCorporations
• Municipalities
1 2 3 4 5 6
Municipal Taxes and Rates 3943 1442 4730 1625
(1) Taxes 3455 1248 4245 1398
(2) Rates 488 194 485 227
) Other Receipts 2382 1049 2523 1175
(1) Markets and Slaughter houses 9 14 10 16
(2) Rents and fees 249 122 262 126
(3) Grants . . 691 512 755 651
(4) Income fiura Commercial enterprises 1114 208 1103 191
(5) Other receipts . 319 193 393 191
215

16. Public Finance
16.10 RECEIPTS OF M U N iaP A L CORPORATIONS ANDM U N iaPA L lT IE S (Concld.)
(Rs. in lakhs)
Sr. Head NO:
1977-78 1978-79 (P)
Munfci-palCorporations
Municipalities
Muilici-palCorporations
Municipalities
1 2 3 4 5 6
C Debts etc. . 5054 1107 6715 1219
(1) Loans . . . . 1909 252 2159 287
(2) Other receipts . . 3145 855 4556 932
D Opening Balance . . 2547 394 3191 405
E Grand Total . . . . 13926 3992 17159 4424
(P)=Provisional.
Source :—Municipal Corporations/Municipalities.
216

(Rs. in lakhs)
16. Public Finance
16.11 EXPENDITURE OF MUNICIPAL CORPORATIONSAND MUNICIPALITIES
Sr.No.
Head 1977-78 1978-79 (P)
MunicipalCorporations
Municipalities
Municipalcorporations
Municipalities
1 2 3 4 5 6
A Current Expenditure . . 5714 2322 6623 2520
(1) Public lighting . . 85 75 117 87
(2) Water supply, drainge conservancy and sanitary services 827 627 1016 759
(3) Hospitals, dispensaries etc. 239 87 316 96
(4) Public institutions and grants 1061 298 1112 348
(5) Miscellaneous including interest 2327 1014 2841 1021
(6) Commercial Enterprises 1175 221 1221 209
217

i6 . Public Finance
(Rs. in lakhs)
16.11 EXPENDITURE OF MUNICIPAL CORPORATIONAND MUNICIPALITIES (ConcW.)
Sr.N o.
1
Head 1977-78 1978-79 (P)
2
MunicipalCorporations
3
Municipalities
4
Municipalcorporations
5
Municipalities
6
B Capital Expenditure 1162 238 1503 263
(1) Roads and bridges 238 85 298 79(2) Buildings and
other constructions 880 118 1137 153(3) Other Capital expen
diture 37 15 55 21(4) Enterprises 7 20 13 10
C Loans and Extraordinary Expenditure 8359 1027 5120 1110
(1) Sinking funds etc. 1416 222 2230 70(2) Repayment of loans 253 78 292 128(3) Other miscellaneous 2190 727 2598 912
D Closing Balance 3191 405 3913 531
E Grand Total . . 13926 3992 17159 4424
(P)=Provisional.Source :—Municipal Corporations/Municipalities.
218

16. Public Finance
16.12 SMALL SAVINGS IN GUJARAT STATE
(Rs. in ’000)
Sr.No.
Security 1978-79 1979-80
GrossCollection
NetCollection
GrossCollection
NetCollection
1 2 3 4 5 6
1 Post Office Savings Bank deposits
42J529 (-) 107100 578030 120877
2 Cumulative time deposits 39188 22207 52965 34693
3 Post Office recurring deposits 79557 35811 99569 54233
4 Post Office time deposits 326810 178570 378257 244008
5 National Saving Certificates-II issue 27283 2152 16441 (-) 5872
6 National Saving Certificates-lII issue 4691 2879 22174 947
7 National Saving Certificates-IV issue 47363 22377 32941 8517
8 National Saving Certificates-V issue 267112 264602 348760 344428
9 Others 13421 (->40095 8036 403993
Total 1226954 381403 1517273 1205874
Source .'--National Savings Commissioner, Nagpur.
219

17.1 EMPLOYMENT IN PUBLIC AND PRIVATE SECTOR
(In ’000)
Sr. Category Number of personsN o. employed as on
30th June
17. Employment
19^9 1980
1 2 3 4
A By Branch of the Public Sector
1 Central Government 126 127
2 State Government 171 187
3 Quasi-Government 179 189
4 Local Bodies 230 234
B Private Sector 555 573
Total A and B 1261 1310
C Employment in public and private sector by Industrial classification
1 Agriculture, hunting, forestry and fishing 14 17
2 Mining and quarrying 15 16
3 Manufacturing 482 502
220
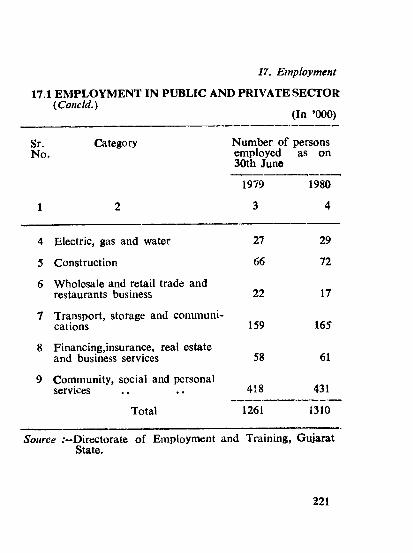
17. Employment
17.1 EMPLOYMENT IN PUBLIC AND PRIVATE SECTOR{Concld.)
(In ’000)
Sr.No.
Category Number o f persons employed as on 30th June
1979 1980
1 2 3 4
4 Electric, gas and water 27 29
5 Construction 66 72
6 Wholesale and retail trade and restaurants business 22 17
7 Transport, storage and communications 159 165
8 Financing,insurance, real estate and business services 58 61
9 Community, social and personal services 418 431
Total 1261 1310
Source .'-Dirtictorate o f Employment and Training, Gujarat State.
221

17. Employment
17.2 WORKING
Sr.No.
Year
OF EMPLOYMENT EXCHANGES
(In ’000)
N o. of registration during the year
No. placed in employment during
the year
No. on Live register
■ at the end of
the year
N o. of vacancies notified dliririg ■ the year
10
1960-61
1965-66
1970-71
1971-72
1974-75
1975-76
1976-77
1977-78
1978-79
1979-80
122
156
198
195
246
235
236
207
222
240
13
19
21
22
16
14
16
15
21
22
59
84
158
179
301
315
414
405
418
437
22
38
41
39
30
26
33
32
45
49
Source :—Directorate of Employment and I'raining, Gujarat State.
222
17.3 EMPLOYMENT SEEKERS BY LEVEL OF EDUCATION
223

17. Employment
17.3 EMPLOYMENT SEEKERS BY
Sr.No.
Level of Education 1971
1 2 3
1 s.s.c. 61525
2 Inter 5980
3 Diploma 1830
4 Graduates 14099
(a) Arts 5651
(b) Science . . 4107
(c) Commerce 3438
(d) Others . . 903
5 Engineering Graduates . . 820
(a) Civil 68
(b) Mechanical 362
(c) Electrical . . 281
(d) Others 109
224

1 EVEL OF EDUCATION
17, Employment
1975
4
1976
5
1977
6
1978
7
1979
8
128395 157265 162845 176135 184934
9286 11363 13323 15347 18395
2290 3875 4282 4640 3960
32840 39294 41711 44279 42542
10527 13069 14510 15753 15576
6432 6891 6676 5967 4542
12489 14531 15166 15905 14370
3392 4803 5359 6654 8054
1041 1248 1371 1119 896
414 619 738 466 241
255 ' 306 265 361 293
213 144 184 134 146
159 179 184 158 216
R -4 0 —15225

]7. Employment
17.3 EMPLOYMENT SEEKERS
Sr. Level of Education N o.
• 1971
1 2 3
6 Post Graduates 1246
(a) Arts 557
(b) Science 517
(c) Commerce 69
(d) Others 103
7 Engineering Post Graduate:
(1) Total educated unemployed 85500
(2) Total uneducated unenployed . . ‘■■88379
Grand Total ( l)+ (2 ) > '173879
226

77, Employment
LEYJEIy OF EpUCATION iConcld.)
1975 1976 1977 1978 • 1979
4 5 6 7 8
2235 2986 2831 2774 2798
1204 1171 1222 1281t »1 '
850 989 812 681 679
355 624 610 574 565
146 169 238 297 273
1 13 9 7 7
176088 216044 226372 244301 253528,-f.! A • , I., j
144692 169254 166326 158760 173358
320780 385298 392698 403061 426886
Source Directorate of Employment and Training, Gujarat State.
227

18.1 CLASSIFICATION OF HOUSES ACCORDING TO USE-1971*
18. Housing
(Figures in ’00)
Sr.No.
Item Rural Urban Total
1 2 3 4 5
1 Total number of census houses 47231 18669 65900
2 Census houses vacant at the time of house listing 4674 2087 6761
3 Occupied census houses used as 42557 16582 59139
3.1 Residence 31160 12664 43824
3.2 Shop-cum-residence . . 303 79 382
3.3 Workshop-cum-residence including household industry . . 549 218 767
3.4 Hotels, sarais, dharam- shalas, tourist houses and inspection houses 54 36 90
3.5 Shop excluding eating houses 750 1011 1761
3.6 Business houses and oflSces 178 225 403
228

18.1 CLASSIFICATION OF HOUSES ACCORDING TO USE-1971* (Concld.)
(Figures in ’00)
18. Housing
Sr.N o.
Item Rural Urban Total
1 2 3 4 5
3.7 Factories, workshops and worksheds 429 693 1122
3.8 Restaurants, sweetmeat shops and eating places 67 105 172
3.9 Places of entertainments and community gathering (Panchayatghar) excluding places of workshop 6 16 22
3.10 Places of worship e.g. Temple, Church, Mosque, Gurudwara etc. 634 165 799
3.11 Others . . 8427 1370 9797
♦Based on 20 percent sample. Source :—Census of India, 1971.
229
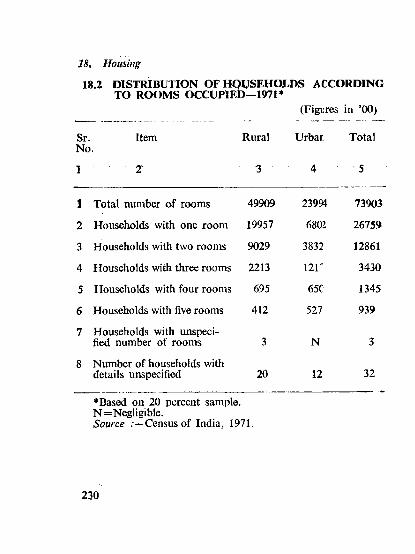
18.2 DISTRIBUTION OF HQUSEHOLDS ACCORDING TO ROOMS OCCUPIED—1971*
(Figures in ’00)
Sr. Item Rural Urbar TotalNo.
18. Housing
1 • ■ 2 3 4 5
1 Total number of rooms 49909 23994 73903
2 Households with one room 19957 6802 26759
3 Households with two rooms 9029 3832 12861
4 Households with three rooms 2213 121' 3430
5 Households with four rooms 695 65C 1345
6 Households with five rooms 412 527 939
7 Households with unspecified number of rooms 3 N 3
8 Number of households with details unspecified 20 12 32
♦Based on 20 percent sample.N =Negligible.Source Census of India, 1971,
230
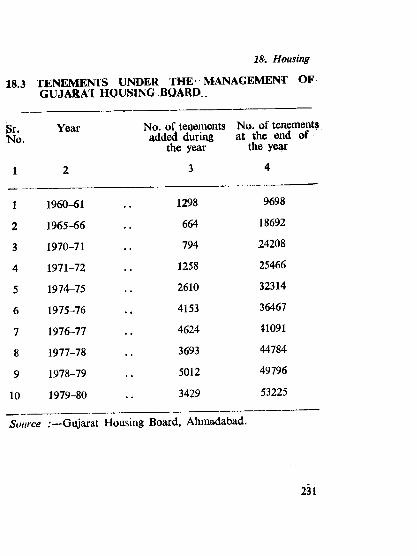
18. Housing
18 3 TENEMENIS UNDER THE < MANAGEMENT OF GUJARAT HOUSING BOARD .
Sr.No.
Year No. of teijements No. of tenements added during at the end of
the year the year
1 1960-61 1298 9698
2 1965-66 664 18692
3 1970-71 794 24208
4 1971-72 1258 25466
5 1974-75 2610 32314
6 1975-76 4153 36467
7 1976-77 4624 41091
8 1977-78 3693 44784
9 1978-79 5012 49796
10 1979-80 3429 53225
Source .-—Gujarat Housing Board, Ahmadabad.
231
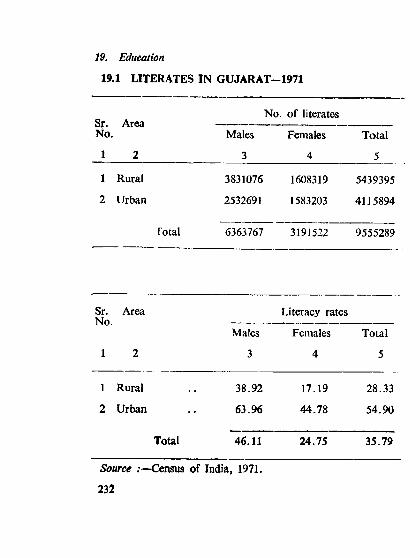
19. Education
19.1 LITERATES IN GUJARAT—1971
Sr.No.
AreaNo. of literates
Males Females Total
1 2 3 4 5
1 Rural 3831076 1608319 5439395
2 Urban 2532691 1583203 4115894
Total 6363767 3191522 9555289
Sr.No.
Area Literacy rates
Males Females Total
1 2 3 4 5
1 Rural 38.92 17.19 28.33
2 Urban •• 63.96 44.78 54.90
Total 46.11 24.75 35.79
Source .'—Census of India, 1971.
232
19.2 LITERATE POPULATION AND PERCENTAGE
OF LITERACY-1981
233

192 LITERATE PO>Pl>XATlON AND PERCENTAGE
(Provisional
1. Area and Populatioin
Sr.No.
State / District
Total Population 1981 (In ’000)
Persons.3
Males.4
Females5
Gujarat StiUe 33961 17485 164761 Jamnagar 1390 713 6772 Rajkot 2058 1056 10023 Surendranagar 1033 534 4994 Bhavnagar 1876 958 9185 Amreli 1076 545 5316 Junagadh 2099 1074 10257 Kachchh 1050 525 5258 Banaskantha 1666 856 8109 Sabarkantha 1498 758 740
10 Mahesana 2545 1291 125411 Gandhinagar 287 149 13812 Ahmadabad 3840 2031 180913 Kheda 3007 1570 143714 Panchnialials 2314 1182 113215 Vadodara 2550 1331 121916 Bharuch 1296 667 62917 Surat 2491 1294 119718 Valsad 1771 893 87819 The Dangs 114 58 56
234
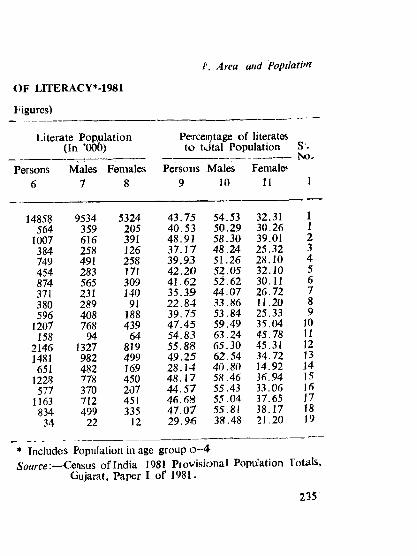
Area and Popilatun
I'igures)
OF LITERACY*-1981
Literate Pop,ulation (In ’000)
Persons Males Females6 7 8
Perceintage of literates to tdtal Population S .
---------------------------------No,Persons Males
9 10Females
11 1
14858 9534 5324 43.75 54.53 32.31 1564 359 205 40.53 50.29 30.26 1
1007 616 391 48.91 58.30 39.01 2384 258 126 37.17 48,24 25.32 3749 491 258 39.93 51.26 28.10 4454 283 171 42.20 52.05 32.10 5874 565 309 41.62 52.62 30.11 6371 231 140 35.39 44.07 26.72 7380 289 91 22.84 33.86 11.20 8596 408 188 39.75 53.84 25.33 9
1207 768 439 47.45 59.49 35.04 JO158 94 64 54.83 63.24 45.78 11
2146 1327 819 55.88 65.30 45.31 121481 982 499 49.25 62.54 34.72 13651 482 169 28.14 40,80 14.92 14
1228 m 450 48.17 58.46 36.94 15577 370 207 44.57 55.43 33.06 16
1163 712 451 46 .6S 55.04 37.65 17834 499 335 47.07 55.81 38.17 18
34 22 12 29.96 38.48 21,20 19
* Include:s Population in age group 0--4Source:—C tnm s of India 1981 Provisional Population Totals^
Gujarat, Paper I of 1981.
2.35

19. Education
19.3 EDUCATIONAL INSTITUTIONS
Sr.N o.
Category 1960-61 1977-78 1978-79 1979-80(P)
1 2 3 4 5 6
1 Primary 18512 22845 23640 24000
2 Secondary 1099 2854 2916 3116
3 Higher 101 365* 368* 370*
4 Others 7965 2694 5734 11800
Total 27677 28758 32658 39286
♦Including University Teaching Departments.<■?) = ProvisionalSource :—Directorate of Education, Gujarat State.
236

19.4 NUMBER OF SCHOI.ARS IN EDUCATIONAL INSTITUTIONS
(In ’000)
19. Educaiton
Sr. Category No.
1960-61 1977-78 1978-79 1979-80(P)
1 2 3 4 5 6
1 Primary 2247 4450 4699 4884
2 Secondary 365 956 990 934
3 Higher 50 191 182 200
4 Others 209 159 287 461
Total 2871 5756 6158 6479
(P)=ProvisionalSource .—Directorate o f Edaoation, Gujarat State
23T

19.5 NUMBER OF TEACHERS IN EDUCATIONAL IN SH tU T tO N S
19. Education
Sr. Category 1960-61 1977-78 1978-79 1979-80No.
1 2 3 4 5
(P)
6
5 Primary 58762 114861 121838 125400
2 Secondary 14159 36291 37498 35600
-8 Higher 2947 7415 7751 7833
-4 Others 5910 6516 6770
Tfttal 75868 164477 173403 -475603
(P)=ProvisiQnal.Source .-—Directorate of Education, Gujarat State.
238

19.6 NUMBER OF TECHNICAL INSTITUTIONS, SANCTIONED SEATS AND ACTUAL ADMISSIONS THEREIN
19. Education
Sr. Category No.
1960-61 1978-79* 1979-80*
1 2 3 4 5
1 Technical institutions
A Degree 5 9** , ,9**
B Diploma 13 20** i.,20**
2 N o.fof sanctioned seats
A Degree 1069 2046 52213
B Diploma 1635 3455 3915
3 Actual admissions
A Degree 1098 2290 2210
B Diploma 1739 3950 4581
♦Including L. M. College of Pharmacy, Ahmadabad and M. N. College of Pharmacy, Khambhat.
** Revised
Source -Directorate of I’echnical Education, Gujarat State.
239

19.7 NUMBER OF NEWSPAPERS AND PERIODICALS PUBLISHED IN DIFFERENT LANGUAGES-1980
19. Education
Sr. Classification LanguagesJNO.
1 2
English Gujarati
3 4
Hindi
5
Others
6
Total
7
1 Daily 3 36 39
2 Weekly 1 170 1 6 178
3 Fortnightly . . 2 92 1 3 98
4 Monthly 28 485 13 3 529
5 Others 24 45 3 2 74
Total 58 828 18 14 918
Source :—Directorate of Information, Gujarat State.
240
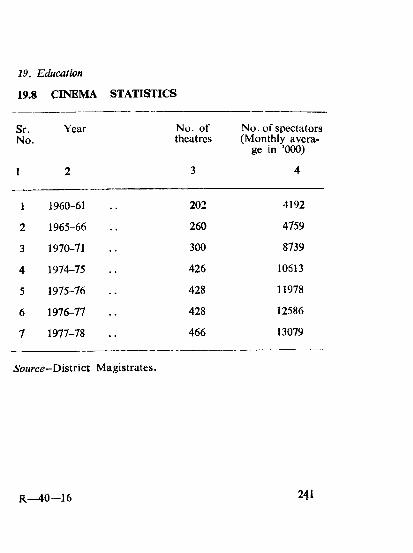
19. Education
19.8 CINEMA STATISTICS
Sr.No.
Year No. of theatres
No. of spectators (Monthly avera
ge in ’000)
1 1960-61 202 4192
2 1965-66 260 4759
3 1970-71 300 8739
4 1974-75 426 10613
5 1975-76 428 11978
6 1976-77 428 12586
7 1977-78 466 13079
Source-D istrict Magistrates.
R _40—16 24i

io. Vital, Public Health and Medical statistics
20.1 BIRTH RATE, DEATH RATE AND INFANT M OETALlTy ILATE
Estimated by Chandrasekaran and C)anaing method
Sf.No. Year Birth
RateDeathRate
Infantmortality
Rate
1 2 3 4 5
1 1970 41.2 18.1 156.4
2 1971 41.0 17.1 145.1
3 1974 38.4 13.0 109.2
4 1975 37.2 15.9 153.9
5 1976 (P) 36.9 15.6 N.A.
6 1977 (P) 35.9 15.4 N.A.
7 1978 (P) 35,8 12.7 N.A.
8 1979 (P) 35.1 13.6 N .A .
(P) a* Provisional.N .A .=N ot available.Note :—^Estimates are biased on the information collected on
sample basis umdeir the Sample Registration Scheme Source :—State Bureau o f Health Intelligence, Health J^rvicos
fHealth Scctiion)., Gujarat State.
242

20.2 ESTIMATED LIVE BIRTH RATE AND DEATH RATE AS PER SAMPLE REGISTRATION SCHEME
20. Vital, Public Health and Medical Statistics
Sr.No.
Year Estimated by Chandrasekaran and Darning method
Live Birth Rate
Rural Urban
3 4
Death Rate
Rural Urban
5 6
1 1970 42.9 35.3 19.0 14.8
2 1971 42.2 36.1 18.1 13.1
3 1974 40.3 33.8 14.2 10.2
4 1975 39.4 31.8 17.2 12.2
5 1976 38.6 32.4 17.2 11.1
6 1977 37.8 31.2 16.5 11.9
7 1978 37.4 31.0 13.8 9 .4
8 1979 (P) 36.4 31.7 14.4 11.4
(P)=Provisional.Source:— Directorate of Health (Health Section),
Gujarat State.
243
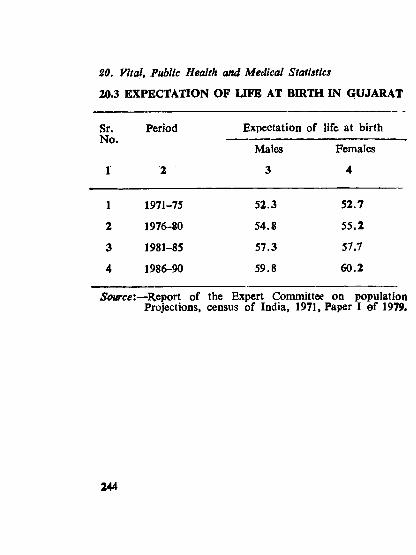
20. Vital, Public Health and Medical Statistics
20.3 EXPECTATION OF U F E AT BIRTH IN GUJARAT
Sr.N o.
Period Expectation of life at birth
Males Females
1 2 3 4
1 1971-75 52.3 52.7
2 1976-80 54.8 55.2
3 1981-85 57.3 57.7
4 1986-90 59.8 60.2
Source'.—^Report of the Expert Committee on population Projections, census of India, 1971, Paper I o f 1979,
244
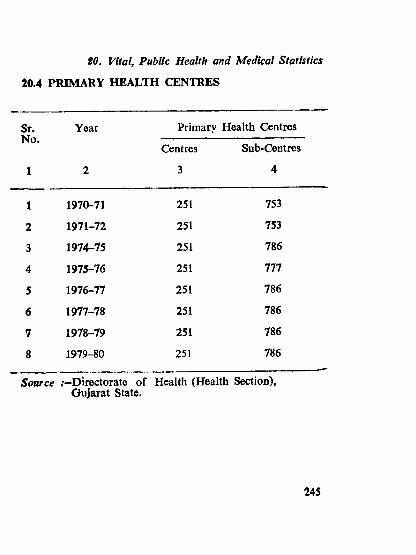
to. Vital, Public Health and Medical Statistics
10.4 PRIMARY HEALTH CENTRES
Sr.No.
Year Primarv Health Centres
Centres
3
Sub-Centres
4
1 1970-71 251 753
2 1971-72 251 753
3 1974-75 251 786
4 1975-76 251 777
5 1976-77 251 786
6 1977-78 251 786
7 1978-79 251 786
8 1979-80 251 786
Source .---Directorate o f Health (Health Section), Gujarat State.
245

20. Vital, Public Health and Medical Statistics
20.5 NUMBER OF HOSPITALS, DISPENSARIES, BEDS,
Sr. Item 1971No.
1 2 3
1 N o. of hospitals and dispensaries 1507
2 N o. o f beds , . 14373
3 N o. o f doctors 1888
4 N o. of nurses 3170
5 N o. of patients treated (In lakhs)
5.1. Indoor 5.34
5.2. Outdoor 73.91
5.3. Total 79.25
( ? ) = Provisional (E)=s EstimatedNote:-(X) The information shown against item No. 1 relates
and local bodies, private aided and private non(2) For item N o. 2, 3 and 4 the data pertains to(3) For item N o. 5 the data pertains to Government
Source Directorate o f Health Services, (Health Section),
246

20. Vital, Public Health and Medical Statistics
DOCTORS, NURSES AND PATIENTS TREATED
1972 1976 1977 1978 1979(P) (P) (P) (P)
4 5 6 7 8
1511 1543 1547 1550 1550
19680 19881 19881 19881(E) 1988UE,
2029 2199 2199 2216 2216(E)
3589 5268 5328 5328(E) 5328(E)
5.09 5.93 6.28 7.44 I .S l
79.49 105.67 108.16 130.09 143.16
84.58 111.60 114.44 137.53 150.05
to Government, Oovernmaiit aided like municipal aided, subsidised and railway institutions.Government aided institutions.institutions.Gujarat State.
247

Jfi. Family Welfare
21.1 RURAL AND URBAN FAMILY WELFARE CENTRES
Sr. State/ No. of N o. of N o.of Sub-No. District P.H.C. R.F.W.
Centres P.H.C. F.W.C
1 . 2. 3. • 4 5 • 6
GUJARAT 251 251 786 1714*
1 Jamnagar 10 10 30 632 Rajkot 14 14 42 853 Surendranagar 10 10 30 474 Bhavnagar 14 14 44 815 Amreli 11 11 33 546 Junagadh 16 16 49 997 Kachchh 9 9 26 578 Banaskantha 12 12 38 1049 Sabarkantha 13 13 36 104
10 Mahesana 19 19 64 15511 Gandhinagar 2 2 5 1812 Ahmadabad 10 10 35 8613 Kheda 19 19 63 18414 Panchmahals 23 23 73 15115 Vadodara 16 16 54 13116 Bharuch 14 14 46 7817 Surat 19 1^ 57 10318 Valsad 18 18 55 10619 Dangs 2 2 6 8
248

2 l. Family Welfare
IN GUJARAT STATE(As on 31st March, 1980)
Centres No. of Urban Family Welfare Centres
Total State Gover- Local Voluntary Totalnment body Organisation urban
centres7 8 9 10 11
2500 60 31 67 158
93 5 1 4 10127 6 1 6 1377 4 1 5
125 5 i 4 1087 2 2
148 4 i ' 2 783 1 2 3
142 3 3140 2 *2 i 5219 4 3 1 8
23 1 1121 5 io 23 38247 4 1 4 9224 3 4 7185 4 i 8 13124 2 2 1 5160 2 5 6 13161 2 1 2 5
14 1 1
♦Includes sub-centres under the Minimum Need Programme and Multipurpose health working project also.Source ;-Directorate o f Public Health (Health section),
Gujarat State.
249

21.2 INFORMATION ABOUT PUBLICITY ^ND MASS MEDIA MEASURES OF FAMILY WELFARE PROGRAMME
21. Family Welfare
Sr.No.
Item 1976-77 1977-78 1978-7) 1979-80
1 . .2 . , 3 4 . . . 5. 6
I Film shows 3580 4230 3965 3549
2 Dramas 424 586 446 314
3 Meetings 44874 41729 75246 64161
4 ExIiiblLious 3612 5519 6375 5994
5 OrientationCamps 1100 2937 3057 2058
6 Personsattended 43682 64799 95713 Ii75029
Source .'-Directorate of Health, Gujarat State.
250

21. Family Welfare
21.3 FAMILY PLANNING PROGRAMME
(In ’000)
Sr.N o.
Year Sterilisation I.U .C.DInser-
Vasectomy Tubectomv Total tions
3 4 5 6
1 1970-71 44 50 94 9
2 1971-72 248 46 294 9
3 1974-75 87 67 154 24
4 1975-76 80 73 153 23
5 1976-77 206 111 317 28
6 1977-78 26 86 112 30
7 1978-79 54 143 197 35
8 1979-80 53 167 220 38
Source Directorate of Health, Gujarat State.
251

(In ’00)
Sr. State/District Starilisation I.U .C.D .N o . -------------------------------------------Insertions
Vasectomy Tubectomy Total
1 2 3 4 5 6
21. Family Welfare
21.4 NUMBER OF VASECTOMY, TUBECTOMY ANDI.U.C.D. INSERTIONS IN GUJARAT BYDISTRICT-1979-80
GUJARAT 532 1670 2202 378
1 Jamnagar 2 63 65 14
2 Rajkot 7 100 107 25
3 Surendranagar 3 53 56 11
4 Bhavnagar 15 99 114 16
5 Amreli 3 64 67 13
6 Junagadh 17 109 126 16
7 Kachchh 2 54 56 6
8 Banaskantha 6 68 74 14
9 Sabarkantha 18 102 120 16
252
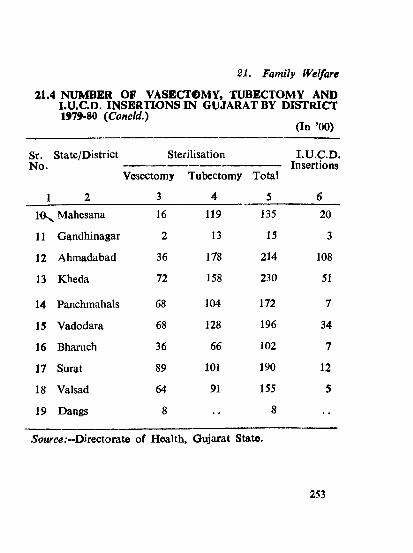
21.4 NUMBER OF VASECTOMY, TUBECTOMY AND I.U.C.D. INSERTIONS IN GUJARAT BY DISTRICT 1979-80 iConeld.)
(In ’00)
Sr. State/District Sterilisation I.U .C.D .N o. ---------------------------------------------Insertions
Vesectomy Tubectomy Total
1 2 3 4 5 6
21. Family Welfare
Mahesana 16 119 135 20
11 Gandhinagar 2 13 15 3
12 Ahmadabad 36 178 214 108
13 Kheda 72 158 230 51
14 Panchmahals 68 104 172 7
15 Vadodara 68 128 196 34
16 Bharuch 36 66 102 7
17 Surat 89 101 190 12
18 Valsad 64 91 155 5
19 Dangs 8 8
5{7Mrce;--Directorate of Health, Gujarat State.
253

21. Family Welfare
21.5 FAMILY WELFARE BUTED
CONTRACEPTIVES DISTRI-
Sr. Year No.
Condoms Foamtablets
Diapharam Jelly(Dozen)
1 2 3 4 5 6 *
1 1961-62 .. 674496 2S06400 4812 22752
2 1965-66 . . 1977696 131484 3156 20064
3 1974-75 . . 8536883 982 135 1190
4 1975-76 ..14265545 38 79 97
5 1976-77 ..16860073 24 18
6 1977-78 ..11462484 25 43
7 1978-79 ..13970439 6 24
8 i979-80 ..12844880 ••
Soiree .-—Directorate o f Heatlth, Gujarat State.

21.6 BIRTHS AVEKTIED. DUE TO VARIOHJS METHOJS OF FAMILY W ELR\RE IN GUJARAT STTATE
21. Fcmnily Welp‘
Sr.N o .
Year Birth Avorteid (In ’000
Steriliisation I.U .D . C.C.mseirs TotJ
3 4 5 e
1 1970-71 . . 8!9.5 12.1 HO. 65 1122
2 1971-72 . . 11(0.5 10.2 14.6; 1353
3 1974-75 . . 1,80.4 9.5 1 4 .4i- 204.5
4 1975-76 . . 202.6 11.3 22.1 236.1
5 1976-77 . . 22(6.4 12.7 30.8 269.)
6 1977-78 . . 279.2 14.5 30.8: 324 .i
7 1978-79 . . 284.0 16.3 27.4^ 3277
8 1979-80 . . 307.1 18.6 32.® 3585
S’Ource-DircctoreitG o f Health Services (Health’. Section. Gujarat State.
35

21.7 NUMBER OF COUPLES PROTECTED DUE TO VARIOUS METHODS OF FAMILY WELFARE IN GUJARAT STATE
(In ‘000)
21. Family Welfare
Sr.N o.
Year Estimated couples in the reproductive age group*
Couples currently protected due to
sterilisation
I.U .D . C.C.users
Total
I 2 3 4 5 6 7
1 1970-71 .. 4374 444 54 77 575
2 1971-72 .. 4644 709 47 127 883
3 1974-75 . . 4953 900 55 118 1073
4 1975-76 . . 5057 1004 61 185 1250
5 1976-77 . . 5160 1263 69 200 1532
6 1977-78 .. 5264 1308 78 155 1541
7 1978-79 . . 5382 1436 89 205 1730
8 1979-80 . . 5487 1579 99 187 1864
* Estimates based on 1971 Census.Source Directorate of Health Service (Health Section),
Gujarat State.
256

22.1 NUMBER, MEMBERSHIP AND PAID UP SHARE CAPITAL OF CO-OPERATIVE SOCIETIES
(1978-79) (?)
22. Co-operation
Sr. Item xr.-.
Type of Society
1 2
Agricultural
3
Non-Agricul-tural
4
LandDevelopmentBank
5
Central ■ Bank
6
1 Number of Society 15415 12948 4 19
2 Membership (In ’000)
3166 2332 852 102
3 Share Capital (Rs. in lakhs)
8951 6673 1102 4217
4 Working Capital (Rs. in lakhs)
72352 92654 15486 66466
5 Loan (Rs. in lakhs)
(a) Advances 18120 46976 303 60914
(b) Recoveries 14404 41616 1554 57130
(c) Outstanding 26961 48076 7557 47077
(P)=ProvisionalSource:—Commissioner of Co-operation and Registrar of
Co-operative Societies, Gujarat State.
R-40-17257
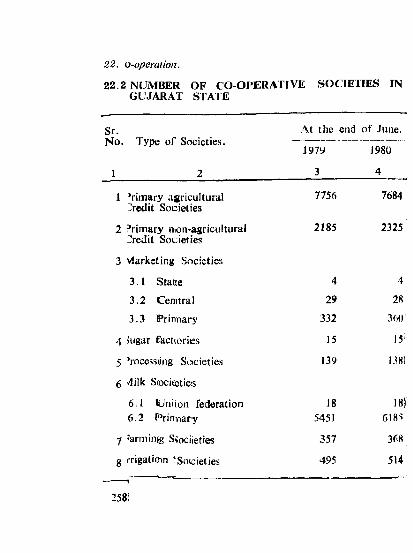
22. o-opemtion.
22.2 NUMBER OF CO-OPERATIVE SOCIETIES INGUJARAT STATE
Sr. At the end of June.N o. Type o f Societies. -----------------------------
1979 1980
_J_______________ 2_____________________3__________ 4
1 ’rimary agricultural 7756 7684>cdit Societies
2 Primary nion-agricultural 2185 2325Tredit Societies
3 vfarketing Societies
3.1 Statte 4
3.2 Cenitral 29
3.3 Primiary 332
4 Jugar factories 15
5 ’rocessiing Societies i39
6 vlilic S(ocieotie!S
6.1 lUniion federation 186.2 P’rifTnary 5451
-j 'arminjg S^ociieties 357
g frigatid)n ISo(cieties 495
258i

212. C o -o p ^ a t i in
22.2 NUMBER OF CO-OPERATIVE SlOCIETIE» GUJTARATT s t a t e (Comvld.)
Sr. Ty pe of Soicietties the end of JuieNo.
9 Consuimer Stores
J979' 1981
1 2 3 4
9.1 Wholes;ale 25 259.2 Primary 1012 9)5
10 Fisheries Societies 162 167
n Housing S(x:ieties 7240 79)3
12 Labour Contract Societies 836 937
13 Forest Labourer’s Societies 152 148
14 Transpo^rt Labourer’s Societies 8 17
15 Other non-agricultural and non-Cre.iit Societies.
255 263
16 Other So::ietie'3 595 657
17 Industrial Societies 1319 1417
Total 3385 330168
Source :— Com'Ti!ssiioner of Co-op:ration aad Regi'Stra’ar of Co-op*eratives Sosietiei, Gujaat Stae.
259

23.1 COGNIZABLE OFFENCES INCLUDING ATTEMPTS AND ABETMENTS UNDER INDIAN PENAL CODE
Year : 1979-80)
23. Crimes and Jails
Sr.No
Offences No. of offences
1 2 3
1 Rioting . . 1251
2 Offences relating to coins —
3 Offences relating to currency or bank rotes 13
4 Murder . . 898
5 Culpable homicide not amounting to rrurder . . 265
6 Administering of stupefying drugs . . 5
7 Kidnapping and abduction . . 482
8 Decoity and preparation and assembly br c^coity 124
9 Robbery . . 822
10 House breaking . . 5199
11 Cheating . . 887
12 Breach of trust . . 1437
260

23.1 COGNIZABLE OFFENCES INCLUDING ATTEMPTS AN D ABETMENTS UNDER INDIAN PENAL CODE
23. Crimes and jails
UConcld).(Year :: 1979-80)
Sr.No.
Offences No. of offences
1 2 3 _
13 Th(efts of—
(a) Copper wire .. 447
(b) Cattle 896
(c) Cycles . . 3294
(d) Motor vehicles and accessories . . . . 831
(e) Fire arms . . 3
(f) Explosives —
(g) Other thefts . . 15027
14 Otiher Crimes . . 30252
Total . . 62133
Source :—Inspector General of Police, Gujarat State.
261

23. Crimes and Jails
23.2 NUMBER OF POLICE STATIONS, OUTPOSTS ETCIN GUJARAT STATE
Sr.N o.
Item 1979 1980
1 2 3 4
1 Police range . . 3 3
2 Police districts 22 22
3 Police subdivision 54 56
4 Police circle 80 89
5 Police station 385 395
6 Police chawki 264 277
7 Outpost 529 531
Source :—Inspector General of Police, Gujarat Slate.
262

23. Crimes and Jails
23.3 NUMBER OF JAILS AND NUMBER OF PRISONERSTHEREIN
Sr.No.
1
Item Year
21978-79 1979-80
3 4
] Number o f Jails 21 21
2 Number o f authorised accommodations 5054 5054
3 Number o f prisoners at commencement o f the year 3594 3049
4 Number of prisoners received during the year 52415 52929
5 Number of prisoners discharged during the year 52960 52676
6 Number of prisoners at the end of the year 3049 3302
Source :—Inspector General of Prisons, Gujarat State.
263

24. Planning
24.1 PROGRESS OF FIVE YEAR PLANS—OUTLAYS
Sr.No.
Sector Second Plan J 956-61
Outlay Expenditure
1 2 3 4
1 Agricultural programme 1709 1709
2 Community development, Panchayats and Co-operation 1879 2021
3 Irrigation and Power 5741 5108
4 Industry and Mining 476 394
5 Transport 1686 2720
6 Social Services 2804 2933
7 Miscellaneous 298 116
8 Special Programmes
Total 14593 15001
264

AND EXPENDITURE
24. Planning
(Rs. in lakhs)
Third Plan 1961-66 Annual Plan 1966-69 Fourth Plan 1969-74
Outlay* Expenditure
Outlay Expenditure
Outlay Expenditure
5 6 7 8 9 10
3775 3352 4156 4143 7022 6385
1894 1351 809 704 1001 1042
9842 11165 8227 9013 22000 29147
779 1021 1443 1291 2000 1986
2482 2321 1961 2316 3550 4565
4777 4739 2641 2817 6414 7861
101 70 990 779 3535 3516
. . . . •• •• ••
23650 24019 20227 21063 45522 54502
♦Revised.Source :—Development Programmes.
265

2 i. Planning
24.2 PROGRESS OF THE
Sr.N o.
Sector Fifth plan Fifth plan1974-79 outlay foroutlay Four year
1974-78
1 Agriculture aod allied Services 17764 13007
2 Co-operation 2136 1576
3 Water Development (Irrigation) 26939 22457
4 Power Development 38027 27558
5 Industries and minerals 4920 4204
6 Transport and Communication 9645 7127
7 Social and Community Services 17370 12534
8 Economic Services 245 231
Total 117046 88694
266

2 i. Planning
FIFTH FIVE YEAR PLAN(Rs. in lakhs)
Fifth plan Expenditure for
Four Year
Annual plan 1978-79
Annual plan 1979-80
Revisedoutlay
Expenditure
Revised Expend i- outlay ture
5 6 7 8 9
13114 5034 4994 5928 6668
1345 533 576 450 372
24083 8365 9337 9900 11708
29593 9225 9052 9250 9109
5337 1295 1948 2862 4151
11344 2760 3667 4500 5320
15383 6199 7811 6224 8246
289 89 60 86 43
100488 33500 37445 39200 45617
Source -Development Programmes.
267

25.1 DISTRICTWISE DEVELOPMENT BLOCKS, PANCHAYATS AND NUMBER
25. Miscellaneous
Sr. District N O .
Community TribalDevelop- Development mentProjects Projects
4
1 Jamnagar 10
2 Rajkot 13
3 Surendranagar 9
4 Bhavnagar 12
5 Amreli 10
6 Junagadh 15
7 Kachchh 9
8 Banaskantha . . 11
9 Sabarkantha . . 9
10 Mahesana 11
11 Gandhinagar 1
268
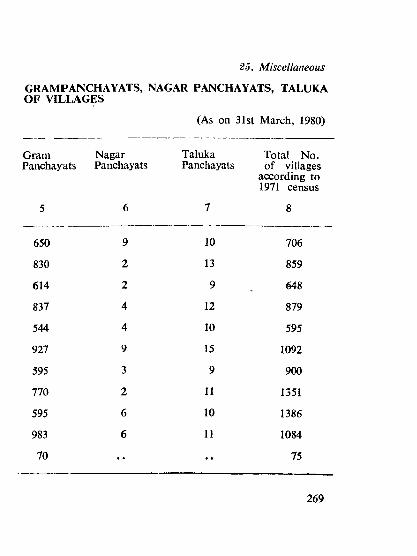
GRAMPANCHAYATS, NAGAR PANCHAYATS, TALUKA OF VILLAGES
(As on 31st March, 1980)
25. Miscellaneous
Gram Nagar TalukaPanchayats Panchayats Panchayats
Total No. of villages
acx^ording to 1971 census
650 9 10 706
830 2 13 859
614 2 9 648
837 4 12 879
544 4 10 595
927 9 15 1092
595 3 9 900
770 2 11 1351
595 6 10 1386
983 6 11 1084
70 75
269

2-5. Mi.iellaieous
25.1 DfSTRICTWISE DEVELOPMENT BLOCKS, PANCHAYATS AND NUMBER
Sr. Oisirict Community TribalNo. Develop Develop
ment mentProject Project
1 2 3 4
12 Ahmdabid .. 7
13 Khetf 10
14 Pancmalials .. 9 13
15 Vad(^ara 9 5
16 Bhar^h 7 7
17 Sura' 6 12
18 Valsf 6 10
19 Danf 2
Total 164 53
270

25. Jiscellaneous
GRAMPANCHAYATS, NAGAR PANCHATAl, TALUKA OF VILLAGES {.ConcM.))
(As on 51stMarch 1980)
Gram NagarPane hay ts Panchay ats.
Taluka otal No.Panchayats f Villages
x:ording to 71 census
627
851
961
862
687
802
650
69
16
6
5
2
4
4
7
10
11
12
II
13
674
957
1903
1677
1137
1218
823
311
12924 92 182 18275
Source:— Development Gomimissioner, Gujaiat fate.
271

25. Miscelhneous
25.2 TOUtfST CKNTRES AND NUMBER OF TOURISTS
Sr.No.
Tourist Centre N o. olf tourists
1979-803
1 Chorwd 145822 Tulshiayam .. 40763 Ubharj 191544 Tithal 39555 Shukaltirth .. 18696 Pavagah 145147 Saputai 294278 Porbanar 60629 Nai Saovar 7690
10 Dwark; 523411 Lothal 2112 AsharnAtithi Grih 193313 Verava 424714 Hajira 416915 BaUrai 1608
Totall 118551
Note :—L’orniati(on relates to those tourists who have tacn thte iadv antagc o f gest houses under the mnagsmeent o f the corporation.
Source :—lurism Corporation off Gujarat, Gujarat State
272PRINTED AT OO'VE^NM e NT CENTTRAL PRESS, OANDfflNi^GAR,

DC;;.i^te
sTjvTiis'iricAL o^t :l i n e
It lo x
ERRATA
........OF G u y : c r r M 9 8 e . ^ 4 y ^ /
V A *
Page Stateemient/CoB. No./Uvine No.
Elea*
3
For
4
15 III Col. 4 I.ine-6 1177.1 15671
33 Statememt 1.3 Col. 6 L ine-7 li8 10
140 Statememt 8 .3 Col. 14 L ine-6 6*4 664
146 Statememt 9 .3 Col. 8 Line-7 16»2 leei
167 Statememt 11..3 Col. 5 Line-4 6 5 «6
157 Statememt 11.3 Col. 5 Line-5 }7 77
167 Statememt 11.6 Col. 6 Line-14 . . 1 3 303
196 Statememt 15.6 Col. 6 Line-1 2.':2 2.78
196 Statememt 15.6 Col. 6 Line-2 l..<8 1.23
203 Statememt 16 .J Col. 1 Last Line Budlget Busgel
254 Statememt 21.5 Col. 3 Line-3 851(6883 8636883
NIEPA DC
D00133