STATISTICAL CHARACTERISTICS OF TROPICAL RAIN RATE AND RAIN INTENSITY FROM RADAR AND RAIN GAUGE...
12
International Journal of Physics, Vol. 4, No. 1, January-June 2011 pp. 53-64 STATISTICAL CHARACTERISTICS OF TROPICAL RAIN RATE AND RAIN INTENSITY FROM RADAR AND RAIN GAUGE MEASUREMENTS A. B. Bhattacharya 1* , D. K. Tripathi 1,2 , T. Das 1 & A. Nag 1,3 1 Department of Physics, University of Kalyani, Kalyani 741235, West Bengal, India. 2 Department of Physics, Narula Institute of Technology, Calcutta 700109, West Bengal, India 3 Department of Physics, Modern Institute of Engineering & Technology, Hooghly 712123, West Bengal, India Abstract: Statistical distributions of rain rate have been examined for tropics and compared with the temperate zone using standard model and meteorological data contained in the International Radio Consultive Committee (CCIR) report. A number of mathematical functions valid within a certain range of probabilities have been implemented to model rainfall intensity statistics. Emphasis is given on the return periods of precipitation rate in the context of microwave communication. Rapid response rain gauge measurements at three locations in India are analyzed and some interesting results are presented. Keywords: Tropical rain rate, Rain Intensity, Return period of precipitation, Microwave communication 1. INTRODUCTION The time variant fading in microwave communication has resulted a closer look on fade dynamics and modeling which is intimately related to the equivalent subjects in rainfall rate and rain intensity at a particular location [1-4]. The increasing demand on information about duration of exceedances of rain rates and associated intensity has a very important impact of the statistics of durations and time intervals. Since each geographical area corresponds to its own distribution they must be selected on the basis of measurements in such a way as to be as representative as possible and to be carried out at stations of a well defined rainfall climate. The purpose of the paper is to provide statistics of rain rate and rain intensity from the available data, particularly in the tropics. For the purpose we have elaborately considered the existing models of rain rate and rain intensity with a critical analysis of the various parameters involved [5, 6]. * Corresponding author: [email protected]
Transcript of STATISTICAL CHARACTERISTICS OF TROPICAL RAIN RATE AND RAIN INTENSITY FROM RADAR AND RAIN GAUGE...

International Journal of Physics, Vol. 4, No. 1, January-June 2011 pp. 53-64
STATISTICAL CHARACTERISTICS OF TROPICAL RAINRATE AND RAIN INTENSITY FROM RADAR AND RAIN
GAUGE MEASUREMENTS
A. B. Bhattacharya1*, D. K. Tripathi1,2, T. Das1 & A. Nag1,3
1Department of Physics, University of Kalyani, Kalyani 741235, West Bengal, India.2Department of Physics, Narula Institute of Technology, Calcutta 700109, West Bengal, India
3Department of Physics, Modern Institute of Engineering & Technology,Hooghly 712123, West Bengal, India
Abstract: Statistical distributions of rain rate have been examined for tropics andcompared with the temperate zone using standard model and meteorological datacontained in the International Radio Consultive Committee (CCIR) report. A numberof mathematical functions valid within a certain range of probabilities have beenimplemented to model rainfall intensity statistics. Emphasis is given on the returnperiods of precipitation rate in the context of microwave communication. Rapidresponse rain gauge measurements at three locations in India are analyzed and someinteresting results are presented.
Keywords: Tropical rain rate, Rain Intensity, Return period of precipitation, Microwavecommunication
1. INTRODUCTION
The time variant fading in microwave communication has resulted a closer look on fadedynamics and modeling which is intimately related to the equivalent subjects in rainfallrate and rain intensity at a particular location [1-4]. The increasing demand on informationabout duration of exceedances of rain rates and associated intensity has a very importantimpact of the statistics of durations and time intervals. Since each geographical areacorresponds to its own distribution they must be selected on the basis of measurements insuch a way as to be as representative as possible and to be carried out at stations of a welldefined rainfall climate. The purpose of the paper is to provide statistics of rain rate andrain intensity from the available data, particularly in the tropics. For the purpose we haveelaborately considered the existing models of rain rate and rain intensity with a criticalanalysis of the various parameters involved [5, 6].
*Corresponding author: [email protected]

54 International Journal of Physics
2. STATISTICAL MODEL FOR RAIN RATES
For the statistical distribution of rain rate some models have been proposed under differentclimatic conditions. Out of those the long-normal distribution is a good approximation forthe low rain rates but overestimates largely the high rain rates corresponding to very lowtime percentages. The gamma distribution is better for rain rates > 15 mm h-1, in temperatureclimates. But the data from tropical regions reveal that the gamma distribution in thesezones itself overestimates the high rain rates. For the low rain rates the curvature beingupward while it is downward for the high rain rates. It would be desirable to have statisticalmodel valid in any climate. One can consider that in any climate the curve representing Rversus log P has an inflexion and the rain rate is always smaller than a maximum value RMwhich is dependent on the rain climate. Accordingly, a function can be chosen convenientlyto prevent the introduction of a parameter representing the percentage of time without rain.
The function1
ex
, which starts slowly from zero, is appropriate from this point of view.
The model is then represented by the equation
exp –
ln M
PR
R
β
α =
(1)
P in equation (1) being the probability that the value R be exceeded; α and β are twopositive parameters.
There is no mathematical restriction on the values. The usual values of α, β and RM arefound in the following ranges: α: 5 to 50, β: 0.5 to 1, RM: 250 to 5000 mm h-1
The equation (1) can then be rewritten as,1
exp – –lnMR R
P
βα = (2)
Choosing different values of α, β, R and RM we have calculated the probability P againstthe rain rate. The curves so obtained by using the model are plotted in Figure 1. It appearsfrom the figure that for tropical climate the value of the exponent β is appropriate to a valueof 0.5 as we have used for the present computation. However, for temperate climates βshould be taken as 1 as reported by others using the same model [7].
3. Statistical Model of Rainfall Intensity
The log-normal law can provide a correct representation of low rain intensities, butoverestimates the high intensities corresponding to low time percentages. On the otherhand the gamma law is appreciable to reflect rainfall intensities above about 12 to 20 mm h-1 intemperature climates but is unsuitable for low rainfall intensities [2, 8-10].

Statistical Characteristics of Tropical Rain Rate and Rain Intensity from Radar… 55
A mathematical function can be so selected that a point of inflexion is obtained in thegraphical representation in the coordinates R/log P. This function should be a probabilitylaw and it would be useful if the function could be inverted for either R versus P or P versusR. There are models which meet either all or some of these conditions. One very appropriatemodel applicable to all climates is represented by the relation (Boithias model),
exp –
ln M
aP
R
R
β
=
(3)
Inverting the relation (3) we get,
1
exp – –lnMR R
P
β α=
(4)
This relation is based on three parameters: RM, α, and β, where RM represents the maximumrainfall intensity for P tending towards zero. The coordinates of the point of inflexion canbe expressed as,
1
exp –iPβ
β = α β +1 (5)
Figure 1: Comparison between the Measurement and the Model

56 International Journal of Physics
1exp –i MR R
+ β= β (6)
No mathematical restriction is there on the three parameters and P always lies between 0and 1.
In practice for a tropical country the exponent â may be selected equal to 1 and therelation comes to the form:
ln lnM
RP
R= α (7)
and then the coordinates of the point of inflexion are
exp –2iPα =
(8)
Ri = 0.135 RM (9)
If the maximum rain rate RM and probability at point of inflexion Pi are adopted, weget,
ln .ln 2ln i
M
RP P
R= (10)
Again if we take the parameters RM and P (1) (probability that 1 mm h-1 will be exceeded),we have the expression
ln 1 – ln 2 ln (1)M
RP P
R
=
(11)
3.1. Determination of the Parameters RM, ααααα and βββββ
To represent a statistical distribution the determination of the parameters of a function mayhave different objectives:
(i) to obtain these parameters for each experimental distribution to check that therepresentation is possible in all cases using the function and
(ii) to utilize these parameters at a given point on the earth, where no measurement isavailable.
We shall consider the first point taking the value of β as 1 for most distributions. Thisintroduces a degree of simplification, as the function will then depend only on two parametersRM and α. These two parameters are determined by the measurement point R1, P1and R2,P2, as for example, the rainfall intensities for 0.01% and 0.1% of time. We can write,
2 2 1 1
2
1
ln ln – ln lnln
lnM
P P P RR
P
P
=(12)

Statistical Characteristics of Tropical Rain Rate and Rain Intensity from Radar… 57
1 2 1
2 2
1
ln lnln
ln
P P RP RP
α =(13)
By equations (12) and (13) we get,
2 1
1 2
1
2
ln ln
ln ln ln
ln
M
R R
R P PR
R
=α
(14)
The function itself may then be written as,
1
1 2 2 1 2
1 1ln – ln ln
ln ln
RR RP ln
P R P R R
=
(15)
Due to rainfall variability it is preferable to find the parameters on the largestpossible number of Ri, Pi pairs [11]. For the purpose, we can present graphically,in a simple way, by plotting log R versus 1/log P. The straight line for the adjustmentof the points so found may provide both RM (ordinate at origin) and α (slope of thestraight line).
4. RM AND ααααα AS CALCULATED FROM CCIR RAINFALL DATA
Table 1 reveals the values of RM , α and log RM/α calculated from available rainfall data ofthe CCIR data bank. The adjustment was optimized in the interval 1%, .001% (10-5 < P < 10-2).The table shows that the values of RM and α vary within wide limits, even in the sameclimatic region. On the contrary the quantity log RM/α changes not much and appears tocharacterize the climatic region. It is around 0.3 in India as evident from the table. Forβ = 1, the quantity log RM/α is directly related to the probability that the rainfall will beabove 1 mm h-1 in the region chosen. We have,
ln 1–
ln (1)MR
P=
α(16)
This model of rainfall intensity is applicable to all rainfall climates throughout the worldand can serve from the standpoint of both radio meteorology and applications connectedwith the forecasting of the various effects of rainfall [12-15].
5. RETURN PERIODS OF PRECIPITATION RATE
In an analysis of return periods for precipitation rate detailed statistical study is made of thethree types of intervals between rain rate exceedances: (a) return time intervals Ii to theexceedance of a given R irrespective of whether it happens within the current event or atsome future one, (b) intra exceedance Ia or return period to the exceedance of a given Rwithin the same rain event and (c) inter exceedance Ie or return period to the exceedance of

58 International Journal of Physics
Table 1Determination of the Parameters RM and ααααα
(Value of βββββ for Station Number 1, 2 and 3 are taken as 2 and for the Rest Stations as 1)
Station Number Observing Station RM αlog MR
α β
1 Padang 270 7.14 0.78 22 Miami 420 10.50 0.58 23 Brazzaville 470 11.40 0.54 24 Osaka 540 21.20 0.30 15 Darwin 570 25.70 0.30 16 Douala 600 14.80 0.43 17 Belem 640 16.40 0.39 18 Papua-New Guinea 730 19.80 0.33 19 Innisfail 745 14.80 0.45 110 Manaus 750 18.00 0.37 111 Kjeller 810 27.80 0.24 112 Rio de janeiro 950 22.00 0.31 113 New Delhi 950 21.80 0.31 114 Yamaguchi 1220 24.40 0.29 115 Ogasawara 1350 28.10 0.26 116 Darmstadt 1400 38.10 0.19 1
Figure 2: Statistical Distributions of Rainfall Intensity (The Typical Distributions According toCCIR Report 563 are Represented as A to Q in the Figure)

Statistical Characteristics of Tropical Rain Rate and Rain Intensity from Radar… 59
R at the following rain event. Figure 3 illustrates durations D(R) of exceedance of a thresholdR. The intervals can be analyzed in terms of annual averages <Ni>, <Ne>, <Na>, mean <Ii>,<Ie>, <Ia> and standard deviations σi, σe, σa. Long term statistics of precipitation rate returnperiods in the context of microwave communication was reported by Burgueno et al [16].Their reported annual mean intervals are illustrated in Figure 4. The figure shows that boththe annual average number of events and the mean can be well fitted by
number of events log N = aR + b (17)
mean < 1 >, < D > = aRb (18)
The coefficients a and b are summarized in Table 2.
Figure 3: An Illustration of the Concept of Intra Exceedance Ia (…), Duration of anExceedance D (–) and Inter Exceedance Ie (-.-.-.)
Figure 4: Average Duration of Return Periods (-) best fit. Inter <Ie> (a), Intra <Ia>(b), Interval <Ii> (c), and Duration of Exceedance <D> (d)

60 International Journal of Physics
Table 2Coefficients a and b for the Best fit Modeling (Equation 17, 18)
a b
<Ne>,<Ie> -1.430X10⁻², 247.66 1.408, +7.21X10⁻²
<Na>,<Ia> -1.050X10⁻², 9.73 1.829, -0.184 (~ -1/5)
<Ni>,<Ii> -1.105X10⁻², 221.70 1.952, -0.313 (~ -1/3)
<N>,<D> -8.960X10⁻³, 12.23 2.012, -0.469 (~ -1/2)
It appears from Table 2 that the intra exceedances Ia are longer and have greater dispersionσa than the duration of single exceedances D. Further, it is noted that as the rate R increases,the duration < D > decreases more rapidly than the return intervals and the ratio rangesbetween 1.8 and 3 as R increases from 10 to 100 mm h-1. It can be seen that
0.28510.795a R
D
< > =< > (19)
0.5411
20.25e RD
< >=
< > (20)
These results can be implemented to derive the <I>’s from the knowledge of <D>’s.
The statistical analysis of both intra and inter exceedances has been seen to be lognormal though the analysis of the overall set of return periods, intra and inter exceedances(known as the intervals Ii) exhibits a distribution showing 2 ranges of different slopeconsistent with the two types of distributions. As a result no universal distribution of return
periods i
i
IP R
I
< >
existed [16]. The distribution of the normalized variable xa(R) = when
plotted in log normal probability it appears like Figure 5(a) while the cumulative distribution,when all the observational data are taken into consideration, looks like Figure 5(b).
Figure 5: Normalized Distribution of Intra Exceedances (a) and the Distribution of the OverallReturn Period i.e. Inter and Intra Exceedances (b) for the Range 10 – 200 mm h-1

Statistical Characteristics of Tropical Rain Rate and Rain Intensity from Radar… 61
6. RAIN RATES IN THE TROPICS MEASURED BY RAIN GAUGES
The prediction of rain attenuation involving rain rate and rain drop size distribution isequally important since the size and shape of the drops may introduce scattering ofelectromagnetic waves. In fact, the prediction of rain attenuation and rain drop sizedistribution has high uncertainty owing to variation of non spherical rain drops atdifferent locations and associated variations of the rainfall characteristics. In this sectionwe have critically examined the published data obtained by using three rapid response raingauges with 10 s integration time [17]. The stations we have chosen are at three widelydifferent locations in India, viz., Kolkata (22.39o N, 88.27o E), Delhi (28.32oN, 77.12oE),and Mumbai (19.04oN, 72.06oE). In the observational part, the rain water was collected instandard funnel and was converted into equal size drops maintained by a capillary tubewith 3 mm in diameter. The number of drops collected in every 10 seconds wascounted electronically and thereafter converted into corresponding rain rates in mm h-1.Figure 6 reveals the characteristic variations of the rain rates as measured by raingauges including the non-rainy months. It appears from the figure that out of thethree stations the rain rate over Delhi is lowest and highest at Mumbai. As the rainfall datareported by the India Meteorological Department (IMD) on a monthly basis includesthe non rainy period also, it becomes difficult to get an instantaneous rain rate. Themonthly total rainfall reported by the IMD can be converted into mm h-1 by dividing thetotal reported rainfall in mm divided by 720 (24 by 30 hours) Values so obtained are presentedin Table 3.
Figure 6: Rain Rates by Rain Gauges at Three Locations in the Tropics
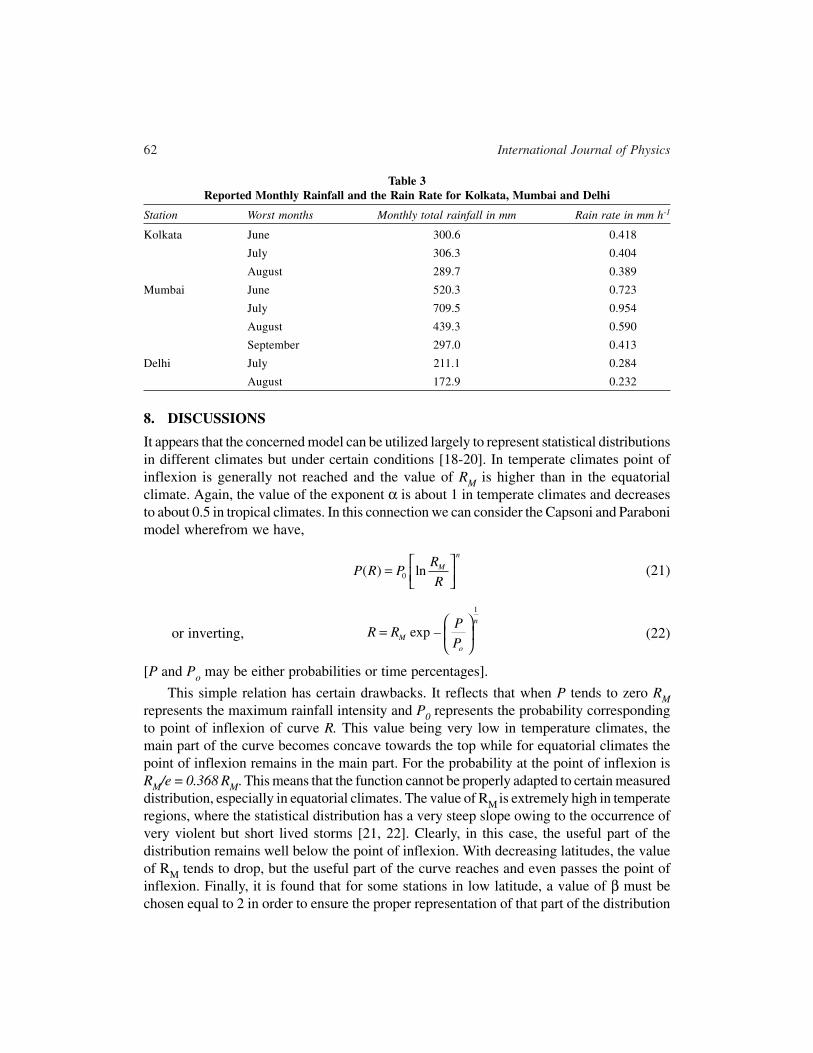
62 International Journal of Physics
Table 3Reported Monthly Rainfall and the Rain Rate for Kolkata, Mumbai and Delhi
Station Worst months Monthly total rainfall in mm Rain rate in mm h-1
Kolkata June 300.6 0.418
July 306.3 0.404
August 289.7 0.389
Mumbai June 520.3 0.723
July 709.5 0.954
August 439.3 0.590
September 297.0 0.413
Delhi July 211.1 0.284
August 172.9 0.232
8. DISCUSSIONS
It appears that the concerned model can be utilized largely to represent statistical distributionsin different climates but under certain conditions [18-20]. In temperate climates point ofinflexion is generally not reached and the value of RM is higher than in the equatorialclimate. Again, the value of the exponent α is about 1 in temperate climates and decreasesto about 0.5 in tropical climates. In this connection we can consider the Capsoni and Parabonimodel wherefrom we have,
0( ) lnn
MRP R P
R =
(21)
or inverting,
1
exp –n
M
o
PR R
P
=
(22)
[P and Po may be either probabilities or time percentages].
This simple relation has certain drawbacks. It reflects that when P tends to zero RMrepresents the maximum rainfall intensity and P0 represents the probability correspondingto point of inflexion of curve R. This value being very low in temperature climates, themain part of the curve becomes concave towards the top while for equatorial climates thepoint of inflexion remains in the main part. For the probability at the point of inflexion isRM/e = 0.368 RM. This means that the function cannot be properly adapted to certain measureddistribution, especially in equatorial climates. The value of RM is extremely high in temperateregions, where the statistical distribution has a very steep slope owing to the occurrence ofvery violent but short lived storms [21, 22]. Clearly, in this case, the useful part of thedistribution remains well below the point of inflexion. With decreasing latitudes, the valueof RM tends to drop, but the useful part of the curve reaches and even passes the point ofinflexion. Finally, it is found that for some stations in low latitude, a value of β must bechosen equal to 2 in order to ensure the proper representation of that part of the distribution

Statistical Characteristics of Tropical Rain Rate and Rain Intensity from Radar… 63
which corresponds to high time percentages. However, the value of β = 1 is suitable forrepresenting almost all measured distributions. It would not seem necessary to useintermediate values of β between 1 and 2 owing to the variability of rain fall distributions[23, 24].
Acknowledgement
We are grateful to the Council of Scientific and Industrial Research for financial support inthis work (Project No. 03(1153)/10/EMR-II, dated 26.04.2010).
References
[1] Bhattacharya, R., Mali, P., Guha, R., Barman, S. D., Bhattacharya, A. B. (2007), Variability ofMillimetrewave Rain Attenuation and Rain Rate Prediction: A Survey, Indian Journal of Radio andSpace Physics, 36, 325-344.
[2] Moupfouma, F., Reffye, D. (1991), Model for Rainfall Rate Distribution. Electron Lett., 26, 1021.
[3] Burgueno, A., Vilar, R., Puigeerver, M. (1990), Long Term Statistics of Precipitation Rate ReturnPeriods in the Context of Microwave Communication. Private Communication, 297-301.
[4] Arnold, H. W., Cox, D. C., Hoffman, H. H. (1982), Fade Duration and Interfade Interval StatisticsMeasured on a 19 GHz Earth Space path. IEEE Trans. on Comm., 30, 265-269.
[5] Kumar, P. N. (1985), Fade Duration Statistics from COMSTAR 20/30 GHz Beacon MeasurementProgram”, Comstat Tech. Rev., 15, 71-87.
[6] Capsoni, C., Paraboni, A. (1990), A Multipurpose Model for the Structure of Precipitation: StatisticalAssessment Against Radar Data. URSI Symposium. Rio de Janeiro.
[7] Matricciani, E., Mauri, M. (1986), Rain Attenuation Successive Fade Durations and Time IntervalsBetween Fade in a Satellite Earth Link. Elect. Lett., 22, 656-657.
[8] Harden, B. N., Norbury, J. R., White, W. J. K. (1977), Measurements of Rainfall for Studies ofMillimetric radio Attenuation. Microwave, Opt. and Acoustics, 1, 197-202.
[9] Ajayi, G. O., Ofoche, E. B. C. (1984), Some Tropical Rainfall Rate Characteristics at Ile-Ife forMicrowave and Millimeter Wave Applications. Jour. Climate and Appl. Meteor., 23, 562-567.
[10] Villar, E., Burgueno, A., Puigcerver, M., Austin, J. (1988), Analysis of Joint Rainfall Rate andDuration statistics: Microwave Systems Design Implications. IEEE Trans. on Comm., 36, 650-651.
[11] Burgueno, A., Austin, J., Villar, E., Puigcerver, M. (1987), Analysis of Moderate and Intense RainfallRates Continuously Recorded over Half a Century and Influence on Microwave CommunicationsOlanning and Rain Rate Data Acquisition. IEEE Trans. on Comm., 35, 382-395.
[12] CCIR, Propagation in Non-ionized Media. Report No. 72-1. 1978.
[13] Flavin, R. K. (1981), Rain Attenuation Considerations for Satellite Paths in Telecommunication,Australia Research Laboratory. Report No. 7505.
[14] Goldhirsh, J., Gebo, N. E., Rowland, J. R. (1989), Variability of Slant Path Attenuation Statistics inthe Mid Atlantic Coast Region of the United States K
u Band. International Conference on Antennas
and Propagation.
[15] Matricciani, E. (1993), Predictions of Rain Attenuation in a Slant Paths in Equatorial Areas:Application of Two Layer Rain Model. Electronics Letters. 29, 72-73.

64 International Journal of Physics
[16] Sarkar, S. K., Mondal. N.C., Bhattacharya, A.B., Bhattacharya, R. (1998), Some Studies onAttenuation and Atmospheric Water Vapour Measurements in India. Int. J. Remote Sensing, 19,473-480.
[17] Oguchi, T., Hosoya, Y. (1974), Scattering Properties of Oblate Raindrop and Cross Polarization ofRadio Wave Due to Rain (pt. 2) Calculations at Microwave and Millimeter Wave Region. Journalof Radio Research Laboratories, 21, 191-259.
[18] Cox, D. C.; Arnold, H. W. (1982), Results from the 19 and 28 GHz COMSTAR Satellite PropagationExperiments at Crawford Hill. Proc. IEEE, 70, 458-488.
[19] Olsen, R. L., Rogers, D. V, Hodge, D. B. (1978), The Relation aRb in the Calculation of RainAttenuation, IEEE Transactions on Antenna and Propagation, 26, 318-329.
[20] Prasad, M. V. S. N., Sarkar, S. K., Mangal, S. Reddy, B. M. (1994), Comparision of Rain AttenuationPrediction Methods for Earth-space Paths Over Northern India. Indian Journal of Radio and SpacePhysics, 23, 135-141.
[21] Sarkar, S . K., Prasad, M. V. S. N., Dutta, H. N., Reddy, B. M. (1992), Rainrate Characteristics Overa Tropical Stations in Northern India. Indian Journal of Physics, 66, 257-262.
[22] Timothy, K. I., Sharma, S., Barbara, A. K., Devi, M. (1994), Rain Attenuation Characteristics: AnObservational Study Over LOS Microwave Link at 11 GHz. Indian Journal of Radio and SpacePhysics, 23, 130-134.
[23] Hall, M. P. M. (1979), Effects of the Troposphere on Ardio Communication. IEE ElectromagneticWave Series & Peter Peregrinus LTD.
[24] Mali, P., Sarkar, S. K., Das, J. (2003), Rain Drop Size Distribution from Radar ReflectivityMeasurements. Indian Journal of Radio and Space Physics, 32, 296-300.