An Efficient Optimized Fuzzy Inference System based Intrusion ...
Upload
independentCategory
view
2download
0
E L S E V I E R Fuzzy Sets and Systems 102 (1999) 157 173
FUZZY sets and systems
Statistical analysis of the main parameters in the fuzzy inference process
I. Rojas*, J. Ortega, F.J. Pelayo, A. Prieto Departamento de Electr6nica y Tecnologla de Computadores, Universidad de Granada 18071-Granada, Spain
Received March 1997
Abstract
As there are many possibilities to select the set of basic operators used in the fuzzy inference process, the search for the fuzzy operators that are most suitable for the different steps of a fuzzy system, their characterization and evaluation, can be included among the most important topics in the field of fuzzy logic. A better insight into the performances of the alternative operators would make it easier to develop a fuzzy application. In the present paper, the relevancy and relative importance of the operators involved in the fuzzy inference process are investigated by using a powerful statistical tool, the ANalysis Of the VAriance (ANOVA) [8]. The results obtained show that the defuzzifier and the T-norm operator are the most relevant factors in the fuzzy inference process. Moreover, this statistical analysis is able to establish a classification of the defuzzifiers and T-norms, according to their intrinsic characteristics. The conclusions here obtained justify the present interest, observed in many current papers, in studying both operators [6, 22-24, 33, 64, 67]. Futhermore, our results are confirmed by some experiments dealing with a real control application. @, 1999 Elsevier Science B.V. All rights reserved.
Keywords: Fuzzy operators; Fuzzy implication operator; Fuzzy logic controllers; Statistical analysis of fuzzy operators
1. Introduction
Since Zadeh [68] introduced the theory of fuzzy sets, and the Minimum, the Maximum and the Complement as the operators on fuzzy sets, many alternative operators have been proposed in the specialized literature. Thus, providing a set of logi- cal connectives for fuzzy sets constitutes a central issue in theoretical research and in the development of practical applications. There exist many possibil-
*Corresponding author. E-mail: [email protected].
ities to select the set of basic operations in the fuzzy inference process. Thus, there are several alterna- tives for the defuzzifier, to define the fuzzy implica- tion operators, and to select the conjunction and disjunction operators, the set of membership func- tions to be used in the definition of the linguistic variables, and so on. For example, in [-47], 215 dif- ferent configurations with the usual fuzzy primi- tives are considered.
As is shown in papers dealing with real applica- tions, the designer has to select the operator to be used in each phase, and this decision is usually taken in terms of the most common operations
0165-0114/99/$ - see front matter © 1999 Elsevier Science B.V. All rights reserved. PII: S01 65-01 14(97)001 53-X

158 L Rojas et al. /Fuzzy Sets and Systems 102 (1999) 157 173
performed. Nevertheless, it is very important to know which stages have the greatest influence on the behaviour and performance of the controller. Therefore, the designer should pay more attention to the phase in which the selection of the operator is most statistically significant. In this way, it would be possible to obviate a detailed analysis of differ- ent configurations that lead to systems with very similar performance. Consequently, the goal of this paper is to get a better insight into which are the most relevant blocks in a fuzzy system, in order to establish the elemental operations whose alterna- tives should be carefully studied when a real ap- plication is developed.
To do this, an appropriate statistical tool has been used: the multifactorial analysis of the vari- ance [13, 51], which consists of a set of statistical techniques that allow the analysis and comparison of experiments, by describing the interactions and interrelations between either the quantitative or qualitative variables (called factors in this context) of the system. In order to perform this analysis, the most relevant variables in the fuzzy inference pro- cess have been taken as the main factors. Thus, the membership functions, the type (crisp/fuzzy) of inputs to the system, the T-norm operator, the T-conorm operator, the defuzzifier, and the fuzzy implication function have been considered.
First, an analysis was performed in order to determine the most important factors affecting the output variable. Once these factors have been iden- tified, a more detailed study was completed by analysing the behaviour of the fuzzy system for a high number of alternative operators (levels in the terminology of ANOVA) corresponding to those main factors.
The paper has been structured into six main sections. After this brief introduction, Section 2 briefly reviews previous papers dealing with the alternatives to defining the blocks of the fuzzy infer- ence process. This section also serves as an intro- duction to the terminology and notation used in the paper. Section 3 gives some details about ANOVA. This is the tool used in the paper to perform the statistical analysis of the fuzzy infer- ence process, which is given in Section 4. Then, Section 5 shows an application to a real problem and, finally Section 6 gives the conclusions of the paper.
2. Functional blocks in a fuzzy inference process
In this section, the main elements of a fuzzy system and the terminology used are briefly intro- duced. Previous studies of the alternatives to defin- ing the blocks of a fuzzy system are also considered.
Fuzzy controllers implement groups of fuzzy control rules in the form "IF-THEN", such as: IF X is A THEN Y is B, where A and B are fuzzy variables (linguistic variables such as slow, big, high, etc.) described by membership functions in universes of discourse U and V, respectively, where the variables X and Y take their values. A fuzzy rule is represented by means of a fuzzy relation R from set U to set V (or between U and V), that represents the correlation between A and B as follows:
R: U × V ~ [0, 1] :(u, v) --, I ( f ia(U) , fiB(V)),
V(u, v) e U x V (1)
where fA and fib are the membership functions of A and B, and I is the implication operator which is defined in terms of the so called T-norm and T- conorm operators. In this way, the elements in the fuzzy inference process are the fuzzy implication operator, I, the form of the membership functions, the T-norm and T-conorm operators, the defuzzifi- cation method, and the kind of input signal (crisp/fuzzy) fed to the controller. The motivation of the present statistical study comes from the great variety of alternatives that a designer has to take into account when developing a fuzzy system. Thus, instead of the existing intuitive knowledge, it is necessary to have a more precise understanding of the significance of the different alternatives.
2.1. Selection of the implication function
The fuzzy implication operator is a mathematical operator that translates a fuzzy conditional prop- osition into a fuzzy relation from U to V. Many theoretical and experimental studies have been car- ried out to get a better understanding of the func- tionality of the operations involved in the fuzzy inference process. There are many ways in which a fuzzy implication can be defined. Analysing the extense bibliography on this subject, it is clear that

I. Rojas et al. / Fuzzy Sets and Systems 102 (1999) 157 173 159
the selection of the ideal fuzzy implication operator is a fundamental issue for designing the inference module in a fuzzy controller [2, 9-12, 23, 24, 37, 61]. The variety of implication operators recently proposed and investigated in the specialized litera- ture implies an additional problem. The designer is faced with the selection of the implication oper- ator providing the best performance for a given application.
Table 1 lists the implication functions most com- monly cited in the bibliography. It also includes a function that, even while not fulfilling the require- ments to be an implication function [-58], have been widely employed in this context (Mamdani implica- tion function).
Table 2 summarizes the conclusions given by various authors about the performance or quality of different fuzzy implication operators. The " + " sign means the authors consider the fuzzy implica- tion operator to be the most suitable, while the " - " sign indicates the opposite. As can be seen, there is some controversy over which is the best implication function, and there are some implica- tion functions considered to be the best by some authors and the worst by others.
As shown in the bibliography [,9-12, 23, 25, 37, 49, 54, 61], to date no fuzzy implication operator
has been found that verifies all the properties desir- able for the fuzzy inference process [53]. Some studies attempted to improve the functionality of known operators, using T-norms and T-conorms which are different from the classical minimum and maximum operators. For example, Piskunov [53] concludes that the Mamdani fuzzy implication has best properties when the Mizumoto operator is used as the composition operator. In this way, the search for the ideal implication operator is, for the moment, an open question [-62].
Moreover, the studies carried out on the implica- tion operators in Table 1 do not include an analysis of the influence of the T-norm and T-conorm oper- ators involved in their definition. For example, in [,11], the maximum and minimum operators were used as the conjunction and intersection operators, respectively. Therefore, the generality of the results analysed is not only restricted to the examples under consideration, but also to the specific oper- ators employed in the definition of the implication operator, and in the fuzzy inference. Furthermore, in the research work carried out to date, con- clusions have been obtained from the analysis of a particular fuzzy system. In the statistical analysis here presented, several fuzzy systems are analysed, and conclusions are drawn regarding the whole set.
Table 1 Fuzzy implication operators
G6del
Lukasiewicz
Mamdani
Stochastic
Kleene Dienes
Sharp
Zadeh
CAO
f f u v[Fta(u ) ~ { 1 if/~a(u) ~</~B(v) Rg = ~tB(v)]/(u, v) where pA(U) ~ #B(V) = /~B(V) otherwise
×
R, = ffv×v [1 A(1 -/~a(u) + pB(V))]/(U,V)
Rm = fro× v IliA(u) /k #n(V)]/(U, V)
R s t = f l y ×v [1 A ( l - - UA(/A) + /1 a (U)X /AB(1)))]/(U , U)
Rb = f ly ~[(1 - ~A (U)) V ~B(V)] /(U, V)
ffwv[ttA(U)~ttB(v)] {loif#a(U)<~ttB(V) R~ = /(u, v) where #A(U) ~ lts(V) = otherwise
= [(, . a , u , , v o,
RcAo = fft,×v [0 V (#a(l~) ~- UB(U) -- 1)]/(u,v)

160 I. Rojas et al. / Fuzzy Sets and Systems 102 (1999) 157-173
Table 2 Qualification of the fuzzy implication operator, according to different authors
Reference FUK-80 KIS-85 MIZ-87 CAO-89 PIS-92 F.Implication MIZ-82 [36, 37] [50] [9, 10] [53]
[25, 49]
CAR-93 [12]
WAL-94 [57]
FOD-95 [23]
Sharp Mamdani Lukasiewicz G6del CAO Stochastic Gaines Other non-standard
implication
+ + - - + + - -
- - + +
2.2. Alternatives to select the other main parameters o f a fuzzy controller
As shown above, it is possible to select among several alternatives to define each functional block in a fuzzy controller. Together with the implication function, the most relevant elements in the fuzzy inference are the membership functions, the T- norm and T-conorm operators, the defuzzification method, and the type of inputs to the controller.
Various membership functions (triangular, trap- ezoidal, gaussian, etc.) can be used to represent a linguistic value. Some authors [3, 40, 63] consider the gaussian functions to be the ideal way to char- acterize linguistic values. However, others use triangular or trapezoidal functions [7, 56], while Pedrycz [52] argued that the partitioning of the variable domain which is done by trapezoidal func- tions optimizes a given entropy function defined for fuzzy sets. Some authors [17, 34] propose other, more complex, functions. In [44, 61] the behaviour of a specific fuzzy system using different member- ship functions is analysed.
With respect to the T-norm and T-conorm oper- ators, tens of mathematical functions, to each more complex and difficult to implement than the next, have been proposed [6, 16, 28, 35, 65], and their mathematical properties studied [-1, 5, 21, 23, 60]. Also, parametrical operators [29, 48, 59, 66] have been frequently used.
During the last few years a great diversity of papers focussed on the use of different types of defuzzifier and on the analysis of the properties of new defuzzification methods have also appeared I-6, 26, 30, 45, 55, 64, 69]. For example, Yager [66] introduces a parameterized family of defuzzifica- tion operators, called Semi Linear DEfuzzification (SLIDE).
The theorical considerations and the practical applications of fuzzy control usually deal with crisp input signals fed to the controller. How- ever, this represents a simplification of the real situation in a fuzzy control system. It is important to take into account the negative effects that appear when information from sensors is corrupted by noise. Thus, it would be more correct to model these inputs by using fuzzy sets, even at the expense of increased computa- tional complexity, or a more difficult hardware implementation.
When the goal is to reach an efficient electronic implementation of the fuzzy controller, it is essen- tial to know the influence of the operators on the behaviour of the system before implementing it, and to determine the blocks imposing the strongest design constraints to obtain the required per- formance level. The statistical study below deter- mines which operations in the fuzzy inference process have more influence on the output of the system.

L Rojas et al. / Fuzzy Sets and Systems 102 (1999) 157-173 161
3. Brief description of the application of ANOVA to fuzzy logic
The theory and methodology of the analysis of variance (commonly referred to as ANOVA) was developed mainly by R.A. Fisher during the 1920s [19, 20]. It consists of a set of techniques taken from statistics that allows us to analyse and compare experiments in which a quantitative and unidimensional response is described as a function of other variables, quantitative or qualitative, which are termed factors [8, 13, 14,46]. In its simplest form, ANOVA is a method to estimate the way in which several populations, often assumed to be normally distributed, determine the output of the system. The basic assumptions to satisfactorily apply this statistics tool are [13, 15] that the ob- tained observations should (a) be mutually independent, (b) be distributed according to a normal distribu-
tion, (c) all have the same variance ~r z (this is known as
homocedasticity criterion), and (d) with averages that can be expressed as a linear
combination of certain unknown parameters. These ANOVA assumptions must be verified by
studying the residuals [-51], in order to detect the discrepancies between the experimental data and the output of the model. The assumptions of the model are fulfilled when the residuals vary in a random way. Therefore, the statistical analysis in Section 4 has been done after a preliminary inspection of the residuals, which although not described in the present paper, has shown the correctness of the applied model.
The simplest model of the analysis of the vari- ance consists of using one input variable and one output variable. This is known as one-way analysis of variance, or as model with a classification cri- terion [13]. In this case, random samples are taken from p normal distributions, all with the same vari- ance a 2, in order to compare the means of these p distributions.
Given p random variables with indices j = 1, ... ,p, it is assumed that the set Y~,x, . . . , Yj,,j constitutes a random sample of nj observations corresponding to the variable j, which has a normal distribution with mean #~ and variance ~r 2. The values of the means #1 . . . . ,#v and the variance
0 "2 a r e unknown. In a model with a classification criterion, the goal is to determine whether the equality Pl =/~2 . . . . . pp (called the null hy- pothesis) is either true or false.
To apply the analysis of the variance, the obser- vations of responses are expressed as the additive result of a series of components [51]. That is, an observation can be expressed as
Yfl(kl), f2 (k2) . . . . . fr(kr);s
= p( f l (k l ) ) + ... + p(fr(kr)) +~, (2)
where YyltkX~ ..... Irtk,);~ is the observation number s (s = 1, . . . ,ni) of the variables (or factors) f l , f 2 . . . . . fr, each in its corresponding level kl, k2, . . . , kr. In (2), e is a random variation [8, 15] which models the variations in the observation Y f l ( k l ) . . . . . frtkr);s when the factors f l , f 2 . . . . ,fr are maintained constant, by assuming those variations as to be the effect of a great number of small causes mutually indistinguishable.
When we m e a s u r e Yfl(k2) ..... fr(kv);s at the levels, kl, . . . ,kr, of the different factors, the set of measures obtained is called homogeneous if the mean values corresponding to all the levels of a given factor cannot be considered statistically different. Thus, in a set of measures it is possible to distinguish several groups according to their mu- tual homogeneity. The analysis of the variance, introduced by Fisher [20], allows us to determine whether a change in the measure of a given variable is caused by a change in the level of a factor, or is originated by a random effect. In this way, the analysis of the variance allows us to distinguish between the components which cause the vari- ations appearing in a set of statistical data, deter- mining whether the discrepancies between the means of the factors are greater than it would reasonably be expected according to the variations within these factors [8].
Applying the additive property of the sum of squares, the total sum of squares of deviations in each datum with respect to the average of all data (sometimes referred to as the total "corrected" sum of squares) is equal to the sum of: (a) St, which is the sum of the squares of the
observations extended to the levels of all the factors, and
162 L Rojas et al. /Fuzzy Sets and Systems 102 (1999) 157-173
(b) SR, which is the sum of squares within each level.
Dividing ST and SR by the appropriate number of degrees of freedom (D.F), the mean squares, ST and SR, respectively are calculated. Thus, the F- ratio can be computed as ST/SR and follows an F- Snedecor distribution that depends on the number of levels of each factor and on the number of data. If the F-ratio is bigger than the F-Snedecor distribu- tion with a sufficient high confidence level (usually 95%), the null hypothesis must be rejected [13, 15, 51], meaning that there are levels of some factors that affect the response of the system in a different way. The comparation between the F-ratio and the F-Snedecor is expressed through the significance level (Sig.Level). If this significance level is lower than 0.05 then the corresponding levels of the factor are statistically significant with a confidence level of 95%. Thus, this is the statistical parameter that we will mainly consider in Section 4 to derive our conclusion about the different factors within the fuzzy inference process.
In the first step, the analysis of the variance allows us to determine whether the null hypothesis is true or not, indicating whether or not all the effects of the different levels of each factor are mutually equivalent and the interactions of a cer- tain order are null. From this, the goal is to verify which factors produce meaningful alterations in the output when their levels change. In the case of rejection of the null hypothesis, a deeper study must be made in order to classify the levels of the most significant factors, taking into account the size of their effects, and looking for differences in the out- put produced when using a given level of those factors [8, 13, l 5, 50]. The levels of a factor that are not statistically different are called homogeneous group, and therefore the selection between the vari- ous levels belonging to a given homogeneous group has no significant repercussion on the output.
In the statistical analysis we have applied to the fuzzy inference process, the factors are the implica- tion function and the main functional blocks in a fuzzy controller: the membership functions, the T-norm and T-conorm operators, the defuzzifier, and the type of input (crisp or fuzzy) to the control- ler. The levels within each factor are the different alternatives for defining them. For example, the
minimum, the product, and the Hamacher oper- ators are the three levels considered for the T-norm factor.
4. Statistical analysis of the main parameters in the fuzzy inference
In this section a statistical study is performed in order to determine the most relevant parameters in a fuzzy inference process. First of all, Section 4.1 compares the relative significance of the fuzzy im- plication operator and the T-norm selected for the fuzzy inference process. As the statistical results show, the selection of the T-norm has an influence on the system output which is greater than the selection of the implication function. Using the Mamdani operator, Section 4.2 analyses the main functional blocks in a fuzzy controller. As the de- fuzzifier and the T-norm are the factors with the greatest influence on the design of a fuzzy system, a deeper study of these factors is carried out in Section 4.3.
4.1. Statistical analysis of the implication and T-norm operators
As indicated above, the bibliography dealing with the ideal implication function to be used in a fuzzy system is abundant and occasionally con- tradictory. In this section, an approach to the problem from a different perspective is given. The question is to determine whether the selection of the fuzzy implication operator is more important with respect to the behaviour of the fuzzy system than the operatiors (mainly T-norm) involved in the definition of the implication function and in the rest of the inference process. If the fuzzy implication function had a significant effect on the output of the system and was thus a crucial component of the inference algorithm, the interest in seeking the best implication function would be justified. If, on the other hand, there existed other operations with more important effects on the system output, it would not be necessary to make a careful selection of the implication function.
To answer this question, we have analysed both the best qualified implication in the bibliography

I. Rojas et al. / Fuzzy Sets and Systems 102 (1999) 157-173 163
and the Hamacher operator [12, 21, 27, 28, 39]. As the Hamacher operator is parametrizable, it allows us to evaluate different types of behaviour by just changing the value of the parameter.
As previously remarked, the analysis of the vari- ance has been applied to several levels (summarized in Table 3) of each of the implication operators and T-norms considered. The variable used to perform the statistical analysis is the mean square error in the output transfer function of a fuzzy controller, when the T-norm and/or the fuzzy implication are changed with respect to a reference. This reference is the combination of T-norm and implication func- tion shown in bold print in Table 3. The changes in the variable are produced when a new combination of T-norm and implication function is considered, thus changing the structure of the controller.
4.1.1. Results from ANOVA Table 4 gives the two-way variance analysis for
several examples of fuzzy systems with different numbers and types of membership functions. As can be seen from Table 4, the type of T-norm has greater statistical relevance than the type of fuzzy implication function because the higher the F-ratio or the smaller the Sig.level, the greater the rel- evance of the corresponding factor.
This conclusion is also confirmed when the mul- tiple range tables for the implication operator (Table 5) and the T-norm operator (Table 6) are analysed. Both tables show two groups or sets of levels statistically different for both factors. In this case, as there are several homogeneous groups, it is important not only to distinguish which is the most important factor but also to determine which levels within each factor are equivalent.
As can be seen in Table 5 there are two homo- geneous groups of implication operators that are not disjoint, thus there exists fuzzy implication which can be classified within the two groups. One group includes the Rm, Rg, Rst , Rb, and Ra implica- tion operators and the other contains Rg, Rst, Rb,
Ra, and Rz. The biggest difference in the mean appears between the Mamdani operator (which, indeed, should be considered as a T-norm operator and not an implication one) and the Zadeh operator.
Table 6 shows the two homogeneous groups that have been established among the T-norm oper- ators. One of the groups includes the Hamacher operators with ). = 0 and 2 = 1. Besides the Hamacher operator with 2 = 1, the other group also includes the Hamacher operators with 2 = 2 and 2 = 4, which are considerably more restrictive
Table 3 Levels for the two factors used in the statistical study
T-norm Fuzzy implication operator
Level 0 Hamacher 2 = 0.0 Level 1 Lukasiewicz: R a Level l Hamacher 2 = 2.0 Level 2 Stochastic: Rst Level 2 Hamacher 2 = 4.0 Level 3 Kleene-Dienes: Rb Level 3 Product Level 4 Mamdani: R,,
(Hamacher)~ = 1) Level 5 G6del: Rg Level 6 Zadeh: Rz
Table 4 ANOVA table for the analysis of T-norms and implication operators
Main effects Sum of squares D. F F-Ratio Sig.level
Fuzzy implication operator 4.869 5 1.335 0.302 T-norm 7.335 3 3.352 0.047

164 I. Rojas et al. / Fuzzy Sets and Systems 102 (1999) 157 173
Table 5 Multiple range test for the variable: fuzzy implication operator
Level Mean Homogeneous groups
4: Mamdani: R m 0.483 X 5: G6del: R, 0.651 X X 2: Stochastic: Rst 1.291 X X 3: Kleene-Dienes: Rb 1.363 X X 1: Lukasiewicz: R, 1.398 X X 6: Zadeh: Rz 1.781 X
Limit to establish significant differences: + 1.287
Table 6 Multiple range test for the variable: T-norm operator
Level Mean Homogeneous groups
2: Hamacher (2 = 4) 0.569 X 1: Hamacher (2 = 2) 0.947 X 3: Hamacher (2 = 1) 1.065 X X 0: Hamacher (2 = 0) 2.065 X
Limit to establish significant differences: + 1.051
95 P e r c e n t LSD I n t e r v a l s f o r F a c t o r Means
2 B
2 3
-1 8
L
L uJ
0 8
0 3
- 0 2
Leve I
iiiiiiiiii!!iiiiiiii!!!iiiiiiiiiiiiiii!iii iiiiiii!ii!i!!!iii J ......... ! ......... i ........ i ......... • ......... ........ i ......... i
I I
1 2 3 4 5 6
o f v a r i a b l e f u z z y imp l i c a t i o n
Fig. 1. Level of variable fuzzy implication operator.
95 P e r c e n t LSD I n t e r v a l s f o r F a c t o r M e a n s
than the previous operators in the sense that their responses are 1 only when both inputs are close to 1, while for other values this response quickly falls towards zero. Both T-norms are more restrictive than the product operator, and no significant differ- ences were observed between them. Finally, as can be seen in Table 6, the Hamacher operator with ,l = 1 belongs simultaneously to both groups and could be understood as an intermediate operator between the Hamacher operator with 2 = 0, and the Hamacher operators with 2 ~> 2, which are more restrictive. Figs. 1 and 2 show the mean values for each of the implication operators and T-norms used, respectively.
Thus, as may be deduced from the ANOVA results, the selection of a specific implication func- tion does not have a strong relevance on the behav- iour of the fuzzy system, being the T-norm operator employed being more statistically significant. F rom this point on, the Mamdani operator will be used as the implication operator because, as has been shown in several papers [-13,61], the use of T- norms as inference operators in fuzzy control gives better results than do fuzzy implication functions.
3
2 5
2
L
0 1 . 5 L Ill
q
0 . 5
0 i!iiiii!!i!iiiiiiiiiiiiiiiiiii!iiiiiiiiiiiiiiiiiiiiiilIiiiii!!i!!i!i!iiiii I
I
0 q 2 3
L e v e l o f v a r i a b l e T _ n o r m
Fig. 2. Level of variable T-norm operator.
4.2. Analysis of the main functional block in a fuzzy controller
This section provides a statistical analysis of the influence of the main functional blocks on the

1. Rojas et al. / Fuzzy Sets and Systems 102 (1999) 157-173 165
inference process implemented by a fuzzy control- ler. As commented, the most relevant elements in the fuzzy inference are the membership functions, the T-norm and T-conorm operators, the defuzzi- tier, and the kind of input signals (crisp/fuzzy) fed to the controller.
First of all, a three-level factorial design has been made in order to determine the factors with the greatest influence on the changes observed in the response of the systems. Once the most significant factors were detected, an analysis with more levels was completed on such factors. The methodology employed takes the following steps: • A multifactorial ANOVA is performed using as
factors the shape of the membership function, the type of defuzzifier, the T-norm operator and the T-conorm operator. The possibility of having crisp or fuzzy inputs to the controller is also considered.
• Then, the statistical results for each factor are analysed. The factors with greatest influence on the fuzzy inference are carefully examined to determine the differences and similarities be- tween the different levels of each factor.
• The effects and interactions between the different factors are also studied, eliminating with the aid of the Standarized Pareto Chart [13] the effects and interactions that have a little relevancy.
• Once the most relevant factors have been deter- mined a deeper study is performed. Thus, as we obtained that the defuzzifier and the T-norm operator are the most relevant, more defuzzifica- tion procedures and T-norm operators were ana- lysed, determining the different homogeneous groups of levels existing in each factor. Table 7 gives the different levels considered in
each factor to carry out a first multifactorial
ANOVA. The set of parameters used as reference are shown in boldface.
A brief description of each level is provided below.
Defuzzifiers: Middle o f Max ima computes the crisp output of the system as the maximum value of the final fuzzy set. When there is more than one output value, the crisp values are averaged.
Height defuzzifier obtains the final crisp output determining the peak values of the output member- ship functions and computing their sum weighted with the level of activation of each peak value. Thus it is not necessary to calculate the final fuzzy out- put. Neither the support nor the shape of the out- put membership functions are significant in the computation of the final crisp output.
Centre o f area (also termed as centre of gravity) determines the crisp output as the centre of the area of the final fuzzy output set.
T-norm and T-conorm operators:
Hamacher T-norm (x, y ) - xy x + y - xy'
Giles T-conorm (x,y) = Min(x + y, 1), (3)
Goguen T-conorm (x, y) = x + y - xy .
lnput to the fuzzy controller: Crisp and Fuzzy in- puts have been used. The fuzzy inputs have been modelled by using triangular membership func- tions, where the vertex of the triangle refers to the mean value of the sensor measurement, and the base is proportional to its standard deviation [18]. In our simulations, values of 3% and 10% of noise were applied in the different rule configurations used. These noise levels are labelled 1 and 2, respectively.
Table 7 Variables used for the statistical study
Variable Description of the level
Defuzzifier 1 Middle of maxima 2 Height defuzzification 3 Centre of area T-norm 1 Minimum 2 Hamacher 3 Product T-conorm 1 Maximum 2 Giles 3 Goguen Membership function 1 Trapezoidal 2 Gaussian 3 Triangular Input to the system 0 Crisp 1 Fuzzy 9 Very fuzzy

166 1. Rojas et al. /Fuzzy Sets and Systems 102 (1999) 157-173
Table 8 ANOVA table for the analysis of the main variables in fuzzy inference process
Main effects Sum of squares D.F F-ratio Sig.level
Membership functions 1.82 2 2.9 0.031 Defuzzifier 270.62 2 135.3 0.000 T-norm 33.82 2 16.9 0.000 T-conorm 0.38 2 0.2 0.289 Input to the system 3.7 2 1.8 0.001
4.2.1. Results of the stat&tical analysis A total of 35 fuzzy controllers have been exam-
ined using systems found in the bibliography (mainly in [-31-33]). They have different structures, characterized by different numbers of input vari- ables, membership functions, and rules. The results of the ANOVA study for the factors indicated above are shown in Table 8.
From Table 8, it is clear that the factors that present the greatest statistical significance are the defuzzifier, the T-norm operator and the member- ship function, in this order. It is important to note that the differences existing between the group of membership functions formed by triangular and gaussian functions and the group formed by trap- ezoidal functions are due to the fact in the latter the core and the support for each of the linguistic values are altered. Analyzing the different levels of each of these main factors (Tables 9-11), it is pos- sible to understand their influence on the character- istics of the output surface.
Notice (Table 8) the high significance of the type of inputs (crisp/fuzzy). This depends on the inaccur- acy of the inputs, as shown in Table 11. After a careful analysis of this factor, it is clear that when there are moderately sharp changes among the conclusions of neighbour rules (with similar linguis- tic values in the premise), the statistical relevancy of the inputs increases. If the transfer function of the controller suffers important changes in its slope this implies that, when the value of the input changes slightly, the system evolves from a situation in which a set of rules with one conclusion is domi- nant, towards another set of rules with completely different conclusions. This induces a substantial change in the output of the controller. If the inputs are fuzzy, this effect is softened, thus producing less
Table 9 Multiple range test for the variable defuzzifier
Level Mean Homogeneous groups
1: Middle of maxima 0.331 X 2: Height defuzzification 1.916 X 3: Centre of area 2.873
Limit to establish significant differences: + 0.121
Table 10 Multiple range test for the variable T-norm
Level Mean Homogeneous groups
3: Product 1.356 X 2: Hamacher 1.540 X 1: Minimum 2.224 X
Limit to establish significant differences: + 0.121
Table 11 Multiple range test for the variable input to the system
Level Mean Homogeneous groups
0: Crisp 1.581 X 1: Fuzzy 1.665 X 2: Very fuzzy 1.875 X
Limit to establish significant differences: _+ 0.121
changes in the output. However, as in most phys- ical implementations and even in the case of simulated fuzzy controllers, fuzzy inputs are not usually used [18, 29, 34, 63]; thus crisp (numerical)

I. Rojas et al. / Fuzzy Sets and Systems 102 (1999) 157-173 167
inputs are considered in the rest of the analysis. Therefore, this factor is eliminated and we proceed an experimental design of three levels over the four remaining factors. Fig. 3 shows the standardized effects, once the less important interactions have been removed. As can be seen in Fig. 3, the con- clusions obtained in the previous analysis are con- firmed, and the defuzzifier can be considered the most important factor. The defuzzifier is the factor which originates the most significant changes in the response of the system when different levels are considered.
The T-norm operator, and the interaction be- tween the type of defuzzifier and T-norm operator
P a r e t o C h a r t f o r v a r i a b l e E r r o r
C:DEFUZZ
B:T_NORM
BC
D:MFS
CD
A:T_CONORM
i-r .....................
t - m . . . . . . . . . . ............ . . . . . . . . . . . .
--- ~--6-~--~-~ .......... i ............ : ............ r-
. . . . . . . . . . . . . . . . . i . . . . . . . . . . i . . . . . . . . . . . .
/ ; , / ."
[ -i--!-:--:-Tk..-:-.,..:.i.:..:.:.-:-i--:-.--:--,--L:-:--:.:.-i
0 10 20 30 40 50
S t m n d a m d i z e d e f f e c t s
Fig. 3. Pa re to char t of the s t andar ized m a i n effects.
are the next factors in order of importance. This result was expected since, as has previously been shown, the T-norm operator has a great relevance in the construction of the fuzzy output set. This relevance is even greater when the first maximum or the last maximum are used to defuzzify the outputs.
4.2.2. Analysis of the most relevant factors: defuzzifler and T-norm
In the previous section it has been shown that the defuzzifier and the T-norm operator are the factors with the greatest repercussion on the output of a fuzzy system. This section contains a more de- tailed study. It quantitatively analyses the T-norms and defuzzification methods (shown in Table 12), in order to classify the levels of these factors into the corresponding homogeneous groups. To do this, a bifactorial ANOVA table with six levels for each factor has been used. The results are presented in Table 13.
From Table 13 it is clear that both variables are statistically significant, since variations in their levels produce important changes in the output of the fuzzy system. The levels of each factor can be grouped into several homogeneous groups, as shown in Tables 14 and 15.
The levels of the defuzzifier have been grouped into four groups with empty intersections (Table 14), which means that there are no similarities be- tween them. The first group is the middle of maxi- ma; the second group is composed by the first maximum and the last maximum; the third group includes the height defuzzification and the i-quality with ~ = 1; and the last one includes the centre of area. The defuzzifiers included in the third group
Table 12 Levels of the two factors used in the s ta t is t ical analysis.
T - n o r m Defuzzifier
Level 1 M i n i m u m - - Level 1
Level 2 P roduc t - - Level 2 Level 3 Eins te in - - Level 3
Level 4 Dubo i s 2 = 0.5 Level 4 Level 5 H a m a c h e r 2 = 2.5 Level 5
Level 6 Hamacher 2 = 4.0 Level 6
Middle of maxima Height defuzzif icat ion Cent re of a rea
Last of m a x i m a
Firs t of m a x i m a ~-qual i ty (~ = 1) [30]
168 I. Rojas et al. / Fuzzy Sets and Systems 102 (1999) 157-173
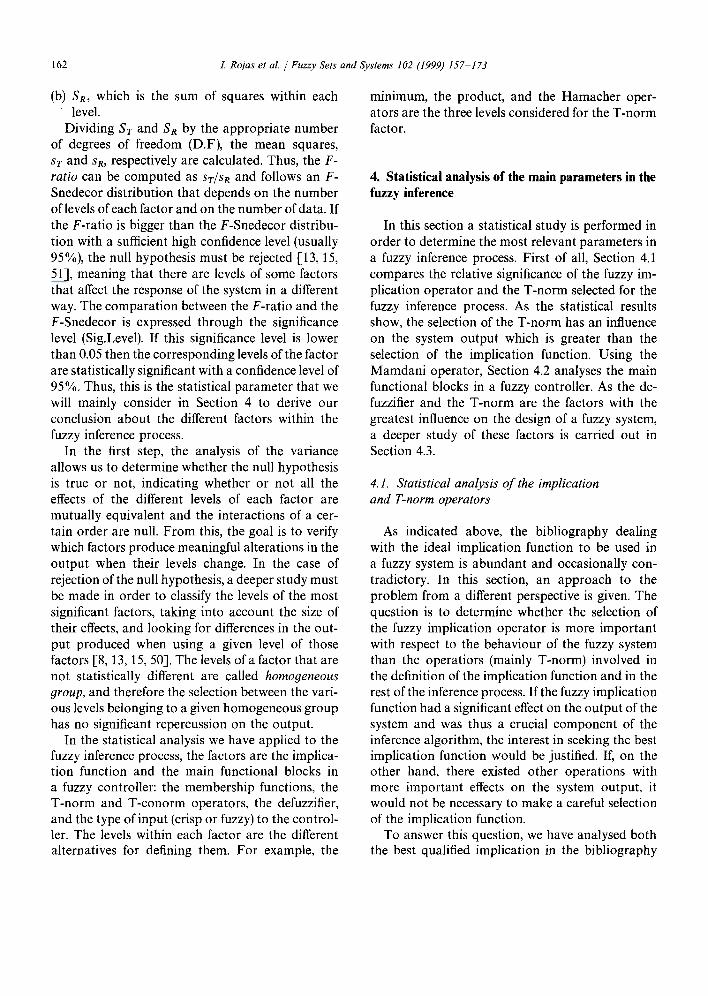
Table 13 ANOVA table for the analysis of defuzzifiers and T-norms
Main effects Sum of quares D.F F-Ratio Sig.level
Defuzzifier 17.20 5 185.0 0.000 T-norm 2.75 5 29.6 0.000
Table 14 Multiple range test analysis for the variable defuzzifier
Level Mean Homogeneous groups
1: Middle of maxima 0.000 X 4: Last of maxima 0.137 X 5: First of maxima 0.154 X 2: Height defuzzification 0.782 X 6: i-quali ty (4 = 1) 0.795 X 3: Centre of area 1.04 X
Limit to establish significant differences: + 0.09
Table 15 Multiple range test analysis for the variable T-norm
Level Mean Homogeneous groups
6: Hamacher 2 = 4 0.315 X 5: Hamacher 2 = 2.5 0.359 X 3: Einstein 0.382 X X 2: Product 0.450 X 4: Dubois 2 = 0.5 0.662 1: Min imum 0.741
Limit to establish significant differences: + 0.09
X X
are the simplest and the fastest ones, and they are well suited for an electronic implementation since they do not need a fuzzy output set to be built, thus speeding up the inference process. The various de- fuzzifiers considered appear ordered according to mode in which they function.
Table 15 shows the results for the T-norm oper- ators, giving the three homogeneous groups obtained. It is important to point out that the ANOVA analysis is capable of ordering the T-norms from more to less restrictive.
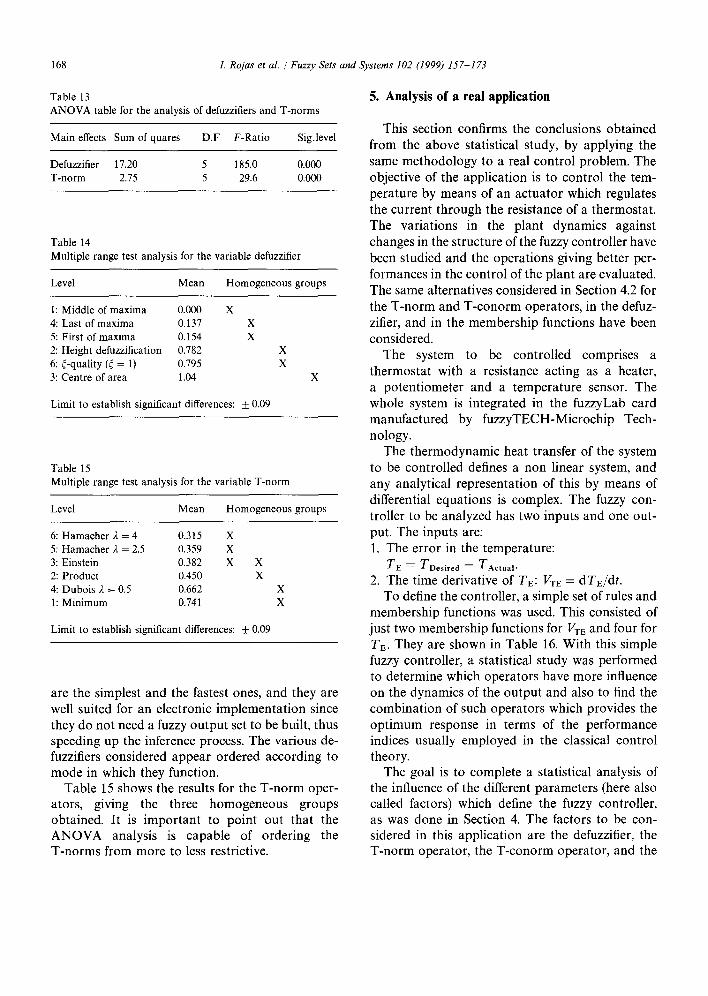
5. Analysis of a real application
This section confirms the conclusions obtained from the above statistical study, by applying the same methodology to a real control problem. The objective of the application is to control the tem- perature by means of an actuator which regulates the current through the resistance of a thermostat. The variations in the plant dynamics against changes in the structure of the fuzzy controller have been studied and the operations giving better per- formances in the control of the plant are evaluated. The same alternatives considered in Section 4.2 for the T-norm and T-conorm operators, in the defuz- zifier, and in the membership functions have been considered.
The system to be controlled comprises a thermostat with a resistance acting as a heater, a potentiometer and a temperature sensor. The whole system is integrated in the fuzzyLab card manufactured by fuzzyTECH-Microchip Tech- nology.
The thermodynamic heat transfer of the system to be controlled defines a non linear system, and any analytical representation of this by means of differential equations is complex. The fuzzy con- troller to be analyzed has two inputs and one out- put. The inputs are: 1. The error in the temperature:
TE = TDesired - - TActual.
2. The time derivative of TE: VTE = dTg/dt. To define the controller, a simple set of rules and
membership functions was used. This consisted of just two membership functions for VTE and four for TE. They are shown in Table 16. With this simple fuzzy controller, a statistical study was performed to determine which operators have more influence on the dynamics of the output and also to find the combination of such operators which provides the optimum response in terms of the performance indices usually employed in the classical control theory.
The goal is to complete a statistical analysis of the influence of the different parameters (here also called factors) which define the fuzzy controller, as was done in Section 4. The factors to be con- sidered in this application are the defuzzifier, the T-norm operator, the T-conorm operator, and the
L Rojas et al. / Fuzzy Sets and Systems 102 (1999) 157-173 169
membership functions, because these are the most relevant in this process.
As the results obtained in Section 4 were gener- ated by computer simulations of the corresponding fuzzy systems, there is no reason to repeat the experiments because there is no random element in the fuzzy inference process. However, in real- life control problems, such as the present applica- tion, a reliable statistical analysis implies repeating the experiment under the same conditions and ob- taining several measures. In our case, four measures for each possible combination of factors were taken, starting with a temperature of 40°C, and increasing it until reaching the desired temperature of 55°C.
Table 16 Rules used for the fuzzy controller
d(TE)/dt T E Hot Correct Cold Very cold
Decreasing Zero Low High Very high Increasing Zero Zero Moderate Very high
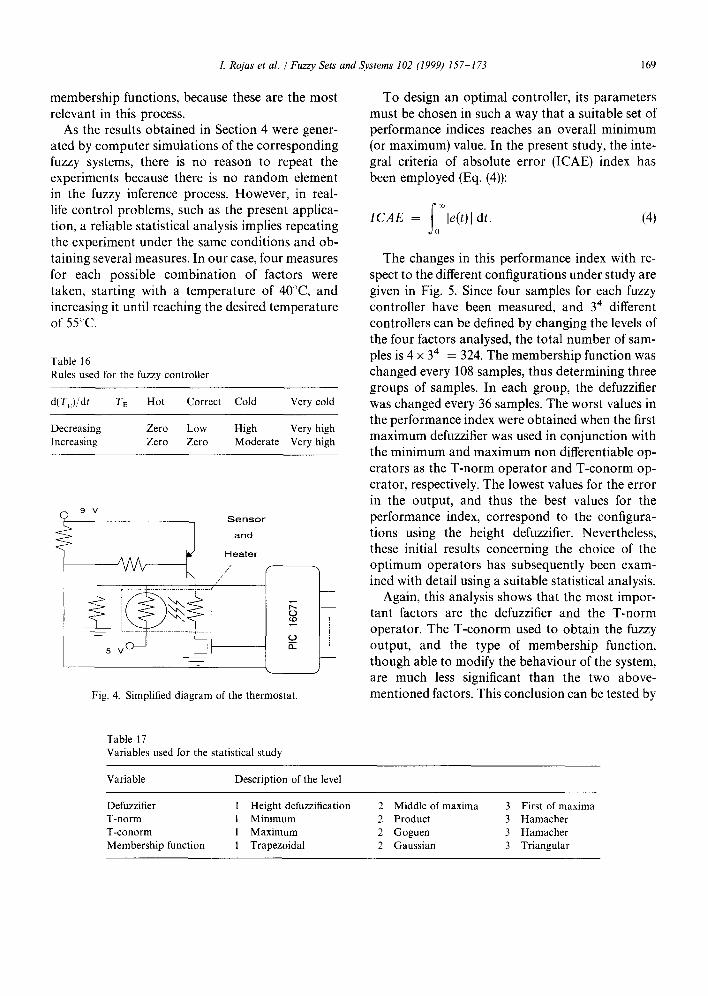
9 V S e n s o r
a n d
H e a t e r
=-5 j i o --=- I--
J
Fig. 4. Simplified diagram of the thermostat.
To design an optimal controller, its parameters must be chosen in such a way that a suitable set of performance indices reaches an overall minimum (or maximum) value. In the present study, the inte- gral criteria of absolute error (ICAE) index has been employed (Eq. (4)):
~0 ~x' ICAE = [e(t) h dt. (4)
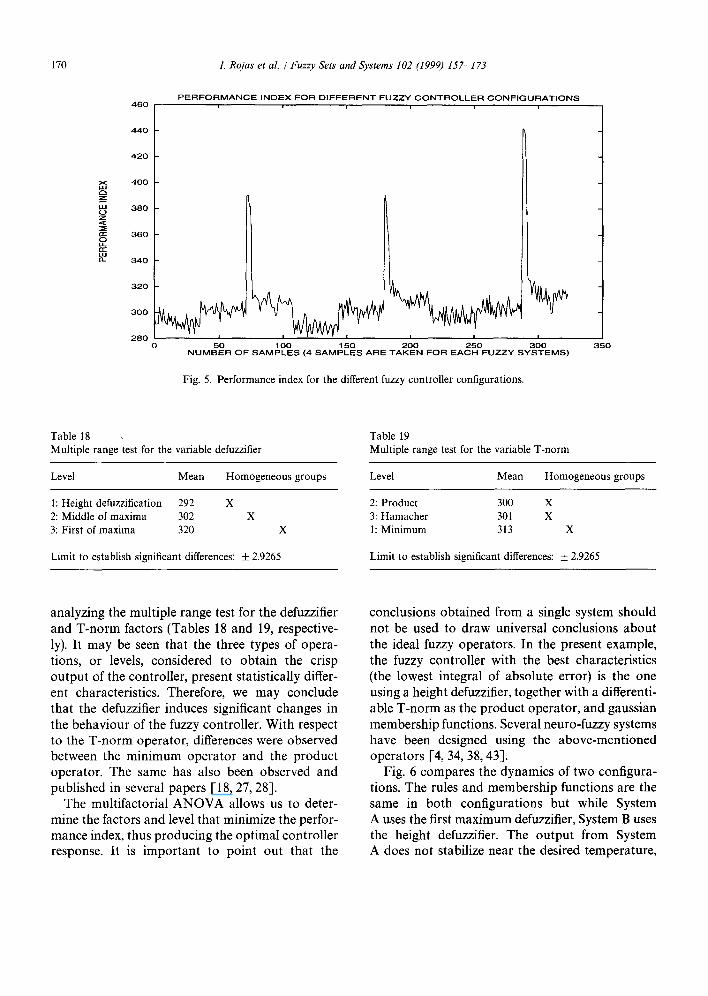
The changes in this performance index with re- spect to the different configurations under study are given in Fig. 5. Since four samples for each fuzzy controller have been measured, and 34 different controllers can be defined by changing the levels of the four factors analysed, the total number of sam- ples is 4 × 34 = 324. The membership function was changed every 108 samples, thus determining three groups of samples. In each group, the defuzzifier was changed every 36 samples. The worst values in the performance index were obtained when the first maximum defuzzifier was used in conjunction with the minimum and maximum non differentiable op- erators as the T-norm operator and T-conorm op- erator, respectively. The lowest values for the error in the output, and thus the best values for the performance index, correspond to the configura- tions using the height defuzzifier. Nevertheless, these initial results concerning the choice of the optimum operators has subsequently been exam- ined with detail using a suitable statistical analysis.
Again, this analysis shows that the most impor- tant factors are the defuzzifier and the T-norm operator. The T-conorm used to obtain the fuzzy output, and the type of membership function, though able to modify the behaviour of the system, are much less significant than the two above- mentioned factors. This conclusion can be tested by
Table 17 Variables used for the statistical study
Variable Description of the level
Defuzzifier ! Height defuzzification 2 Middle of maxima 3 First of maxima T-norm 1 Minimum 2 Product 3 Hamacher T-conorm 1 Maximum 2 Goguen 3 Hamacher Membership function 1 Trapezoidal 2 Gaussian 3 Triangular
170
4 6 0
I. Rojas et al. / Fuzzy Sets and Systems 102 (1999) 157-173
P E R F O R M A N C E I N D E X F O R D I F F E R E N T F U Z Z Y C O N T R O L L E R C O N F I G U R A T I O N S
4 4 0
4 2 0
4 0 0
3 8 0
3 6 0
3 4 0
3 2 0
3 0 0
2 8 0 i i i
0 5 0 1 0 0 1 5 0 2 0 0 2 5 0 3 0 0 N U M B E R O F S A M P L E S (4 S A M P L E S A R E T A K E N F O R E A C H F U Z Z Y S Y S T E M S )
Fig. 5. Performance index for the different fuzzy controller configurations.
3 5 0
Table 18 Multiple range test for the variable defuzzifier
Table 19 Multiple range test for the variable T-norm
Level Mean Homogeneous groups Level Mean Homogeneous groups
1: Height defuzzification 292 X 2: Product 300 X 2: Middle of maxima 302 X 3: Hamacher 301 X 3: First of maxima 320 X 1: Minimum 313 X
Limit to establish significant differences: + 2.9265 Limit to establish significant differences: + 2.9265
analyzing the multiple range test for the defuzzifier and T-norm factors (Tables 18 and 19, respective- ly). It may be seen that the three types of opera- tions, or levels, considered to obtain the crisp output of the controller, present statistically differ- ent characteristics. Therefore, we may conclude that the defuzzifier induces significant changes in the behaviour of the fuzzy controller. With respect to the T-norm operator, differences were observed between the minimum operator and the product operator. The same has also been observed and published in several papers [18, 27, 28].
The multifactorial ANOVA allows us to deter- mine the factors and level that minimize the perfor- mance index, thus producing the optimal controller response. It is important to point out that the
conclusions obtained from a single system should not be used to draw universal conclusions about the ideal fuzzy operators. In the present example, the fuzzy controller with the best characteristics (the lowest integral of absolute error) is the one using a height defuzzifier, together with a differenti- able T-norm as the product operator, and gaussian membership functions. Several neuro-fuzzy systems have been designed using the above-mentioned operators [-4, 34, 38, 43].
Fig. 6 compares the dynamics of two configura- tions. The rules and membership functions are the same in both configurations but while System A uses the first maximum defuzzifier, System B uses the height defuzzifier. The output from System A does not stabilize near the desired temperature,

L Rojas et al. / Fuzzy Sets and Systems 102 (1999) 157 173 171
58
56
54
52
50
48
46
44
RESPONSE OF THE SYSTEM TO AN INPUT STEP. DESIRED TEMPERATURE = 55 C
I SYSTEM A - - n SYSTEM B ---
~_~ ......... ',_.._: ....... ':.._;-----'".___U-"-",_ _,' ......
40 u
0 20 40 60 80 100 120 140 160 TIME (IN SECONDS)
Fig. 6. Response of two different configurations to an input step.
yielding a high error index. Furthermore, the over- shoot is higher. System B, on the other hand, has a good response to the step input, the overshoot is not so high as in the former system and the oscilla- tions around the required value are small. They have approximately the same magnitude as the precision of the temperature sensor ( + 0.5°C).
trend observed in recent papers which, indeed, focus their attention on those factors.
Moreover, the methodology based on ANOVA allows the classification of the different configura- tions (here called levels) that can be used for given factors. Thus it is possible to obtain homogeneous groups of levels with similar characteristics. For example, after applying ANOVA to the T-norms, the different types considered appear ordered according to their degree of restrictiveness. Some- thing similar is obtained with the various defuzzi- tiers considered: they appear ordered according to the mode in which they function.
It is also possible to use ANOVA to analyse the factors of a given application. This has been illus- trated in the paper by applying ANOVA to a fuzzy temperature controller, which constitutes an example of a controller for a non-linear system. The results obtained agree with those obtained in the previous general study; thus the T-norm operator, the defuzzifier, and their interaction are seen to be the most significant factors. This has been demon- strated by the behaviour of the system. The optimal behaviour of the controller also corresponds to the types of defuzzifiers, T-norms and membership functions predicted by ANOVA, concretely the height defuzzifier, the differentiable T-norms, such as the product operator, and the gaussian member- ship functions.
6. Conclusion
A statistical study of the different alternatives to specify the phases of the fuzzy inference process has been made by using the analysis of variance (ANOVA). Applying this methodology to a great variety of fuzzy systems, it is possible to extract general results about the most relevant factors de- fining the fuzzy inference process. For example, the relevance of the defuzzifier and the T-norm oper- ator in comparison with other elements such as the methodology to a great variety of fuzzy systems, it is possible to extract general results about the most relevant factors defining the fuzzy inference pro- cess. For example, the relevance of the defuzzifier and the T-norm operator in comparison with other elements such as the implication operator and the T-conorm has been shown. This agrees with the
Acknowledgements
This work has been partially supported by the CICYT, Spain Proyect TIC95-0496.
References
[1] C. Alsina, E. Trillas, L. Valverde, On some logical connect- ives for fuzzy sets theory, J. Math. Anal. Appl. 93 (1983) 15-26.
I-2] W. Bandler, L. Kohout, Fuzzy power sets and fuzzy im- plication operators, Fuzzy Sets and Systems 4 (1980) 13-30.
[3] G. Bartolini, G. Casalino, F. Davoli, M. Mastretta, R. Minciardi, E. Morten, Development of performance adaptive fuzzy controllers with applications to continuous casting plants, in: M. Sugeno (Ed.), Industrial Applications of Fuzzy Control, North Holland, Amsterdam, 1985, pp. 73 86.

172 I. Rojas et aL / Fuzzy Sets and Systems 102 (1999) 157-173
[4] H.R. Berenji, P. Khedkar, Learning and tuning fuzzy logic controllers through reinforcements, IEEE Trans. Neural Networks 3 (1993) 724-739.
[5] C. Bertoluzza, On the distributivity between T-norms and T-conorms, Proc. 2nd IEEE Internat. Conf. on Fuzzy Systems (1993) 140 146.
[6] G. Bordogna, G. Pasi, Linguistic aggregation operators of selection criteria in fuzzy information retrieval, Internat. J. Intelligent Systems 10 (1995) 233-248.
[7] J.B. Bowles, C. Pelaez, Application of fuzzy logic to reliability engineering, IEEE Proc. 83 (1995) 435-449.
[8] G.E.P. Box, W.G. Hunter, J.S. Hunter, Statistics for Experimenters. An Introduction to Design, Data Analysis and Model Building, Wiley, New York, 1978.
[9] Z. Cao, A. Kandel, Applicability of some fuzzy implication operators, Fuzzy Sets and Systems 31 (1989) 151-186.
[10] Z. Cao, A. Kandel, Investigations of the applicability of fuzzy inference, Fuzzy Sets and Systems 49 (1992) 151-169.
[11] Z. Cao, A. Kandel, L.D. Ward, Flexible implication operators in fuzzy reasoning, Proc. 19th IEEE Internat. Symp. Multiple-Valued Logic, 1989, pp. 26-29.
[12] E. Cardenas, J.C. Castillo, O. Cord6n, F. Herrera, A. Peregrin, Influence of fuzzy implication functions and defuzzification methods in fuzzy control, BUSEFAL 57 (1993) 69-79.
[13] G. Casella, R.L. Berger, Statistical Inference, Duxbury Press, 1990.
[14] W.G. Cochran, G.M. Cox, Experimental Designs, 2nd Ed., Wiley, New York, 1957.
[15] R.E. Kirk, Experimental Design: Procedures for the Behavioral Sciences, 2nd Ed., Brooks/Cole, Pacific Grove, CA, 1982.
[16] J. Dombi, A general class of fuzzy operators, the demorgan class of fuzzy operators and fuzziness measures induced by fuzzy operators, Fuzzy Sets and Systems 8 (1982) 149 163.
[17] J. Dombi, Membership function as an evaluation, Fuzzy Sets and Systems 35 (1990) 1-21.
[18] D. Driankov, H. Hellendoorn, M. Reinfrank, An Introduc- tion to Fuzzy Control, Springer, Berlin, 1993.
[19] R.A. Fisher, Theory of statistical estimation, Proc. Cam- bridge Philos. Soc. 22 (1925) 700 725.
[20] R.A. Fisher, The comparison of samples with possibly unequal variances, Anna. Eugenics 9 (1936) 174-180 (Also in R.A. Fisher, Contribution to Mathematical Statistics, Wiley, New York, 1950).
[21] J.C. Fodor, T. Keresztfalvi, A characterization of the Hamacher family of t-norms, Fuzzy Sets and Systems 65 (1994) 51-58.
[22] J.C. Fodor, T. Keresztfalvi, Nonstandard conjunctions and implications in fuzzy logic, Internat. J. Approximate Reasoning 12 (1995) 69-84.
[23] J.C. Fodor, J.L. Marichal, M. Roubens, Characterization of the ordered weighted averanging operators, IEEE Trans. Fuzzy Systems 3 (1995) 236-240.
[24] B. Friesen, V. Kreinovich, How to improve Mamdani's approach to fuzzy control, Internat. J. Intelligent Systems 10 (1995) 947 957.
[25] S. Fukami, M. Mizumoto, K. Tanaka, Some consider- ations on fuzzy conditional inference, Fuzzy Sets and Systems 4 (1980) 243-273.
[26] H. Genther, T.A. Runkler, M. Glesner, Defuzzification based on fuzzy clustering, IEEE Internat. Conf. on Fuzzy Systems (1994) 1645-1648.
[27] M.M. Gupta, J. Qi, Design of fuzzy logic controllers based on generalized T-operators, Fuzzy Sets and Systems 40 (1991) 473-489.
[28] M.M. Gupta, J. Qi, Theory ofT-norms and fuzzy inference methods, Fuzzy Sets and Systems 40 (1991) 431-450.
[29] Y. Hayashi, J.M. Keller, Z. Chen, Fuzzy neural controller with additive hybrid operators, proc. 5th IFSA World Congress, 1993, pp. 1118-1120.
[30] H. Hellendoorn, Design and development of fuzzy systems at Siemens R & D, IEEE Internat. Conf. on Fuzzy Sys- tems, 1993, pp. 1365-1370.
[31] IEEE Internat. Conf. on Fuzzy Systems, 1993. [32] IEEE Internat. Conf. on Fuzzy Systems, 1994. [33] IEEE Internat. Conf. on Fuzzy Systems, 1995. [34] J.S.R. Jang, C.T. Sun, Neuro-fuzzy modeling and control,
Proc. IEEE 83 (1995) 378-405. [35] O. Katai, M. Ida, T. Sawaragi, K. Shimamoto, S. Iwai, Fuzzy
control as self-organizing constraint-oriented problem solv- ing Proc. 5th IFSA World Congress, 1993, 887-890.
[36] J.B. Kiska, M.E. Kochanska, D.S. Sliwinska, The influence of some fuzzy implication operators on the accuracy of a fuzzy model Part I, Fuzzy Sets and Systems 15 (1985) 111-128.
[37] J.B. Kiska, M.E. Kochanska, D.S. Sliwinska, The influence of some fuzzy implication operators on the accuracy of a fuzzy model Part II, Fuzzy Sets and Systems 15 (1985) 223 240.
[38] B. Kosko, Neural Networks and Fuzzy Systems. A Dy- namical Systems Approach to Machine Intelligence, Pren- tice-Hall International Editions, Englewood Cliffs, N J, 1992.
[39] B. Kovalerchuk, V. Taliansky, Comparison of empirical and computed values of fuzzy conjunction, Fuzzy Sets and Systems 46 (1992) 49-53.
[40] V. Kreinovich, C. Quintana, L. Reznik, Gaussian member- ship functions are most adequate in representing uncer- tainty in measurements, North American Fuzzy Logic Processing Society (1992) 618-624.
[41] R. Kruse, J. Gebhardt, F. Klawonn, Foundations of Fuzzy Systems, Wiley, New York, 1994.
[42] W.A. Kwong, K.M. Passino, Dynamically focused fuzzy learning control, IEEE Trans. Systems. Man Cybernet. 26 (1996) 53 73.
[43] C.T. Lin, C.S.G. Lee, Reinforcement structure/parameter learning for neural-network-based fuzzy logic control systems, IEEE Internat. Conf. on Fuzzy Systems, 1993, pp. 88-93.
[44] A. Lotfi, A.C. Tsoi, Importance of memberhip functions: a comparative study on different learning methods for fuzzy inference systems, IEEE Internat. Conf. on Fuzzy Systems, 1994, pp. 1791-1796.

1. Rojas et al. / Fuzzy Sets and Systems 102 (1999) 157 173 173
[45] S. Mabuchi, A proposal for a defuzzification strategy by the concept of sensitivity analysis, Fuzzy Sets and Systems 55 (1993) 1 14.
[46] R. Mead, The Design of Experiments. Statistical Principles for Practical Application, Cambrigde University Press, Cambridge, 1988.
[47] J.M. Mendel, Fuzzy logic systems for engineering, IEEE Proc. 83 (1995) 345-377.
[48] T. Miyoshi, S. Tano, Y. Kato, T. Arnould, Operator tuning in fuzzy production rules using neural networks, IEEE lnternat. Conf. on Fuzzy Systems, 1993, pp. 641-646.
[49] M. Mizumoto, H-J. Zimmerrnann, Comparison of fuzzy rea- soning methods, Fuzzy Sets and Systems 8 (1982) 253-283.
[50] M. Mizumoto, Fuzzy controls under various approximate reasoning, IFSA (1987) 143 146.
[51] D.C. Montgomery, Design and Analysis of Experiments, Wiley, New York, 1984.
[52] W. Pedrycz, Why triangular membership functions? Fuzzy Sets and Systems 64 (1994) 21-30.
[53] A. Piskunov, Fuzzy implication in fuzzy systems control, Fuzzy Sets and Systems 45 (1992) 25 35.
[54] C. R6mer, A. Kandel, Applicability analysis of fuzzy infer- ence by means of generalized Dempster-Shafer theory, IEEE Trans. Fuzzy Systems 3 (1995) 448-453.
[55] T.A. Runkler, M. Glesner, Improved aggregation of fuzzy rule results using a posteriori specifity estimation, Fuzzy Systeme, Munich, 1994.
[56] M. Sugeno, T. Yasukawa, A fuzzy-logic based approach to qualitative modeling, IEEE Trans. Fuzzy Systems 1 (1993) 7 31.
[57] E. Trillas, L. Valverde, On implication and indistinguisha- bility in the setting of fuzzy logic, in: J. Kacpryzk, R.R. Yager (Eds.), 1985, pp. 198 212.
[58] I.B. Turksen, Interval-valued fuzzy sets and 'compensatory AND', Fuzzy Sets and Systems 51 (1992) 295-307.
[59] B. Van de Walle, D. Ruan, Implementing the generalised modus-ponens in a fuzzy rule-base for an atmospheric stability monitoring study, IEEE Internat. Conf. on Fuzzy Systems, 1994, pp. 1081-1086.
[60] L. Wang, Adaptive Fuzzy Systems and Control. Design and Stability Analysis, Prentice-Hall, Englewood Cliffs; NJ, 1994.
[61] B. Wei, Y. Kuo, Evaluation of fuzzy operators with mem- bership function translation approach, IEEE Internat. Conf. on Fuzzy Systems, 1994, pp. 1274 -1279.
[62] J. Weisbrod, On fuzzy implication relations, Fuzzy Sets and Systems 67 (1994) 211 219.
[63] R.R. Yager, Aggregation operators and fuzzy systems modeling, Fuzzy Sets and Systems 67 (1994) 129-145.
[64] R.R. Yager, Including probabilistic uncertainty in fuzzy logic controller modelling using Dempste~Shafer theory, IEEE Trans. System Man Cybernet. 25 (1995) 1221 1229.
[65] R.R. Yager, Quantifier guided aggregation using OWA operators, Internat. J. Intelligent Systems 11 (1996) 49 73.
[66] R.R. Yager, D.P. Filev, SLIDE: a simple adaptive defuz- zification method, IEEE Trans. on Fuzzy Systems 1 (1993) 69-78.
[67] O. Yagishita, O. Itoh, M. Sugeno, Application of fuzzy reasoning to the water purification process, in: M. Sugeno (Ed.) Industrial Applications of Fuzzy Control, North- Holland, Amsterdam, 1985, pp. 19-40.
[68] LA. Zadeh, Fuzzy sets, Inform. and Control 8 (1965) 338 353.
[69] R. Zhao, R. Govind, Defuzzification of fuzzy intervals, Fuzzy Sets and Systems 43 (1991) 45-55.
Copyright © 2022 FDOKUMEN