State of the Economy - Institute of Policy Studies of Sri Lanka
164
SRI LANKA State of the Economy 2001 INSTITUTE OF POLICY STUDIES 99, St. Michael’s Road, Colombo 3, Sri Lanka
-
Upload
khangminh22 -
Category
Documents
-
view
1 -
download
0
Transcript of State of the Economy - Institute of Policy Studies of Sri Lanka

SRI LANKA
State of the Economy
2001
INSTITUTE OF POLICY STUDIES 99, St. Michael’s Road, Colombo 3, Sri Lanka

SRI LANKA State of the Economy
October 2001
INSTITUTE OF POLICY STUDIES 99, St. Michael’s Road, Colombo 3, Sri Lanka

Copyright C October 2001 Institute of Policy Studies, Sri Lanka
National Library of Sri Lanka-Cataloguing-In-Publication Data
Sri Lanka State of the Economy 2001 / Institute of Policy Studies,- Colombo: Institute of Policy Studies, 2001.- ; ill. ; 27 c.m.
ISBN 955-9122-92-4 Price:
i. 330.95493 DDC 21
1. Sri Lanka – Economic conditions
ISBN 955-9122-92-4 Price Please address orders to: Institute of Policy Studies 99 St Michael’s Road, Colombo 3, Sri Lanka Tel: +94 1 431 368, 431 378 Fax: +94 1 431 395 Email: [email protected] Website: www.ips.lk
This report has been prepared by a team led by Ravi Yatawara under the supervision of the Executive Director of the IPS. The team consisted of Nisha Arunatilaka, Thushari De Zoysa, Tamara Dorabawila, Roshen Epparachchi, W. Hettiarachchi, Douglas Jayasekera, Tilani Jayawardhana, S. A. Karunaratne, Madhuwanthi Opatha, Shelton Wanasinghe, Dushni Weerakoon and Janaka Wijayasiri. We thank Marisha Bandaratilaka for excellent research assistance, G.D. Dayaratne for help in obtaining data, Deepika Nawavickrama for preparing the appendix tables, D. D. M. Waidyasekera for meticulous editing and Asuntha Paul for excellent formatting of this document. The views expressed in this publication are those of the research team and do not necessarily represent those of the Institute of Policy Studies. All errors remain our own.

Contents
Policy Perspectives & Performance
1. Policy perspectives 1 2. Economic performance 10
2.1 Introduction 10 2.2 Output growth Q1-2000 : Q2-2001 10 2.3 Fiscal outturn 13 2.4 Interest rates and the exchange rate 15 2.5 Inflation 16 2.6 Balance of payments 17 2.7 Capital markets 19
3. International environment 20
3.1 Global trends in the pre-shock economy 20 3.1.1 OECD economies 20 3.1.2 Emerging economies and Russia 22 3.2 The after-shock economy 22 3.3 Implications for Sri Lanka of international developments 24 3.3.1 Global outturn 24 3.3.2 Preferential liberalization initiatives 25 3.3.3 Sri Lanka’s future in the sea 27
Competition Policy and Regulation
4. Competition policy and regulation 29
4.1 Introduction 29 4.2 Competition policy in the Sri Lankan context: a developing country perspective 31 4.3 The competition regime in Sri Lanka: a comparison of the old and the new 32 4.4 Competition policy in practice-the FTC at work 1995-2000 34 4.5 Limitations of the new legislation 36
4.5.1 Limitations of the substantive law of the FTCA/CPA 36 4.5.2 Institutional limitations 37 4.5.3 Limitations specific to the CPA 38
4.6 Conclusions 39 4.A Case Study I: Privatization of Colombo gas company and competition in the LPG sector 42 4.B Case Study II: TRIPS, competition and the pharmaceutical industry 45
Leading Issues in the Economic Development Process
5. Free float of the exchange rate 53
5.1 Introduction 53 5.2 Floating the rupee: the proximate causes 54 5.3 How ‘free’ is the float? 56 5.4 Policy implications of a floating regime 59 5.5 Floating with an anchor: inflation targeting 60
6. Between bilateralism and regionalism: Focus on the Sri Lanka - Pakistan bilateral free trade agreement 63
6.1 Introduction 63 6.2 Profile of Sri Lanka-Pakistan trade 64 6.2.1 Exports 65 6.2.2 Imports 65 6.3 Impact of a bilateral FTA 69 6.4 Lessons from the Sri Lanka-India FTA – a year after 71 6.4.1 The outturn 71 6.4.2 The lessons 74 6.5 Conclusion 74
7. Governance 77 7.1 Introduction 77 7.2 Overlap of institutions 77 7.3 Effective public policy management 78

7.4 The community-governance nexus 80 7.5 Human resources 80 7.6 Conclusion 82
8. Crisis in the power sector 85 8.1 Introduction 85 8.2 Profile of electricity demand 85 8.3 The twin crises – the capacity crisis and the financial crisis 86
8.3.1 Development of electric generation capacity 86 8.3.2 Financial performance of CEB 88
8.4 Addressing the capacity crisis 90 8.5 Outlook for tariffs and rural electrification 93
8.5.1 Electricity tariffs on the rise? 93 8.5.2 Rural electrification jeopardized? 93
8.6 Conclusion 96 9. Aid and aid under-utilization 98
9.1 Introduction 98 9.2 Profile of aid in Sri Lanka 98
9.2.1 Commitments of loan and grants 99 9.2.2 Disbursements of loans and grants 100
9.3 Aid utilization problem 103 9.4 Factors limiting the utilization of aid 105 9.5 Conclusion 106
Prospects
10. Prospects 108
Appendices
Diary of Events July 2000 – June 2001 113 Appendix A: Macroeconomic Indicators 120
Appendix B: Capital Market 146
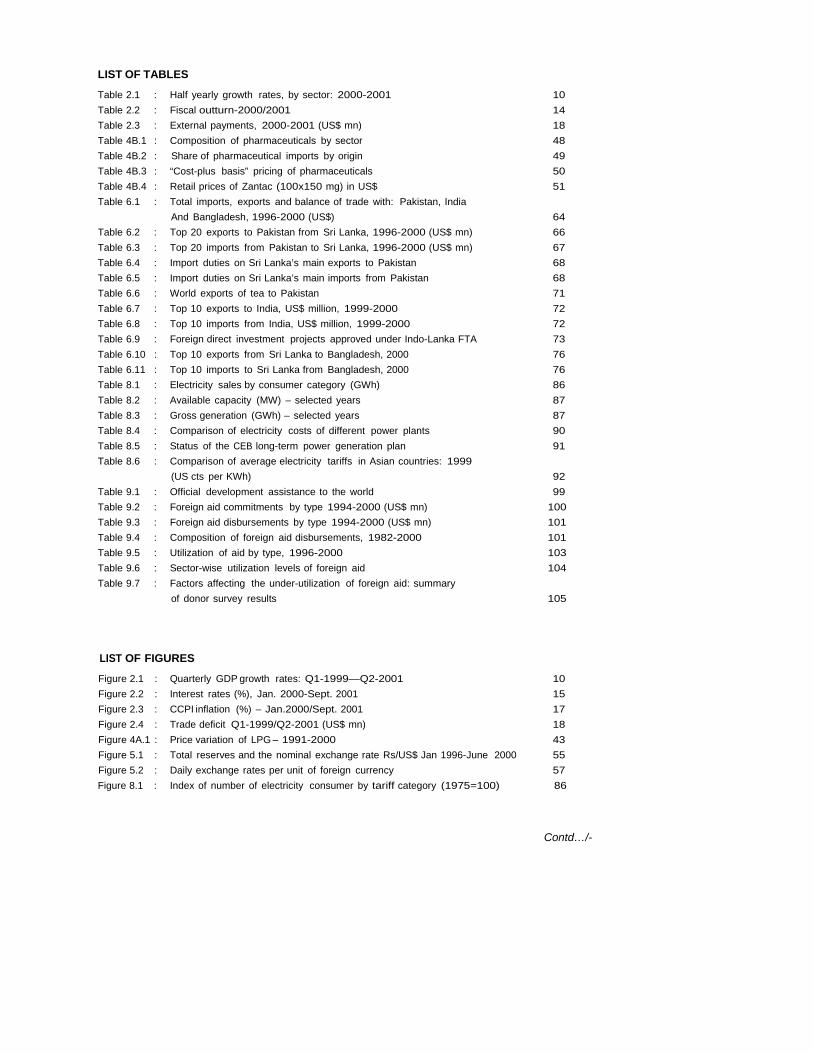
LIST OF TABLES
Table 2.1 : Half yearly growth rates, by sector: 2000-2001 10
Table 2.2 : Fiscal outturn-2000/2001 14
Table 2.3 : External payments, 2000-2001 (US$ mn) 18
Table 4B.1 : Composition of pharmaceuticals by sector 48
Table 4B.2 : Share of pharmaceutical imports by origin 49
Table 4B.3 : “Cost-plus basis” pricing of pharmaceuticals 50
Table 4B.4 : Retail prices of Zantac (100x150 mg) in US$ 51
Table 6.1 : Total imports, exports and balance of trade with: Pakistan, India
And Bangladesh, 1996-2000 (US$) 64
Table 6.2 : Top 20 exports to Pakistan from Sri Lanka, 1996-2000 (US$ mn) 66
Table 6.3 : Top 20 imports from Pakistan to Sri Lanka, 1996-2000 (US$ mn) 67
Table 6.4 : Import duties on Sri Lanka’s main exports to Pakistan 68
Table 6.5 : Import duties on Sri Lanka’s main imports from Pakistan 68
Table 6.6 : World exports of tea to Pakistan 71
Table 6.7 : Top 10 exports to India, US$ million, 1999-2000 72
Table 6.8 : Top 10 imports from India, US$ million, 1999-2000 72
Table 6.9 : Foreign direct investment projects approved under Indo-Lanka FTA 73
Table 6.10 : Top 10 exports from Sri Lanka to Bangladesh, 2000 76
Table 6.11 : Top 10 imports to Sri Lanka from Bangladesh, 2000 76
Table 8.1 : Electricity sales by consumer category (GWh) 86
Table 8.2 : Available capacity (MW) – selected years 87
Table 8.3 : Gross generation (GWh) – selected years 87
Table 8.4 : Comparison of electricity costs of different power plants 90
Table 8.5 : Status of the CEB long-term power generation plan 91
Table 8.6 : Comparison of average electricity tariffs in Asian countries: 1999
(US cts per KWh) 92
Table 9.1 : Official development assistance to the world 99
Table 9.2 : Foreign aid commitments by type 1994-2000 (US$ mn) 100
Table 9.3 : Foreign aid disbursements by type 1994-2000 (US$ mn) 101
Table 9.4 : Composition of foreign aid disbursements, 1982-2000 101
Table 9.5 : Utilization of aid by type, 1996-2000 103
Table 9.6 : Sector-wise utilization levels of foreign aid 104
Table 9.7 : Factors affecting the under-utilization of foreign aid: summary
of donor survey results 105
LIST OF FIGURES
Figure 2.1 : Quarterly GDP growth rates: Q1-1999—Q2-2001 10
Figure 2.2 : Interest rates (%), Jan. 2000-Sept. 2001 15
Figure 2.3 : CCPI inflation (%) – Jan.2000/Sept. 2001 17
Figure 2.4 : Trade deficit Q1-1999/Q2-2001 (US$ mn) 18
Figure 4A.1 : Price variation of LPG – 1991-2000 43
Figure 5.1 : Total reserves and the nominal exchange rate Rs/US$ Jan 1996-June 2000 55
Figure 5.2 : Daily exchange rates per unit of foreign currency 57
Figure 8.1 : Index of number of electricity consumer by tariff category (1975=100) 86
Contd…/-
LIST OF FIGURES
Figure 8.2 : Monsoon & total annual rainfall 91 Figure 8.3 : Average petroleum prices (US$/barrel) 91 Figure 8.4 : Steam coal prices – US$/MT 92 Figure 8.5 : All inclusive average annual power purchasing tariff (Rs.per KWh) 92 Figure 9.1 : Aid commitments by major donors in 2000 100 Figure 9.2 : Aid disbursements by major donors in 2000 100 Figure 9.3 : Net inflows of foreign aid 102 Figure 9.4 : Aid disbursements and cumulative undisbursed balances 102
LIST OF BOXES
Box 4.1 : Structural, behavioural and regulatory barriers to entry 30Box 4.2 : Anti-dumping duties, countervailing duties and competition 40Box 4B.1 : Code of intellectual property (Amendment) 47Box 5.1 : Fear of floating 58Box 6.1 : Sri Lanka-Bangladesh free trade agreement? 75Box 7.1 : Private sector policy agenda – “a way forward strategy” 82Box 7.2 : The New Zealand model 84Box 8.1 : California dreamin’ – Lessons for Lanka? 94Box 10.1 : Looking forward by looking back 110

Policy Perspectives and Performance

Policy perspectives
1. Policy perspectives
Sri Lanka faces one of the most challenging
periods of economic policy management in its
recent history. Unfortunately, it comes at a
time when governance capacity has been
severely distracted on maintaining a delicate
political coalition. The major issues facing the
nation include:
• The pursuit of stabilization and structural adjustment policies which involve a reduction in domestic demand
• Political uncertainty
• Economic fallout of the July 24 terrorist attack on the airport and air force base
• Ongoing security concerns
• A deeper than anticipated slowdown in the world (and especially the US) economy
• A power crisis
• A severe drought
• A burgeoning fiscal deficit with limited options for financing
Assisted by a buoyant global economy, the Sri
Lankan economy demonstrated considerable
resilience in 2000 in terms of income growth
(6 per cent GDP growth) and export
performance (20 per cent growth), but the
country was engulfed in a serious economic
crisis by the end of the year with weak
economic fundamentals on several fronts. In
fact, the possible emergence of such a crisis
was predicted in last year’s State of the
Economy report when it said that “Sri Lanka’s
macroeconomic situation may come under
severe strain by the closing months of 2000.”
The crisis surfaced in the form of an expanded
budget deficit, sharply increased interest
rates, acceleration of the inflation rate, a
widened current account deficit and a
precipitous depletion of foreign exchange
reserves.
Ostensibly, the crisis emerged when the
North-East conflict escalated in April/May
2000 necessitating higher defence
expenditure and the world petroleum prices
rose sharply. But these events only exposed
the underlying vulnerability of the economy
stemming from the failure to adjust
administered prices of state-supplied utility
products and services in tandem with cost
escalations, sharply increased recourse to
bank credit by the government and state
enterprises, and inadequate action to address
the main underlying cause of the imbalance in
the economy, namely the widening budget
deficit.
However, the dawn of the new millennium
2001 saw the government committed to
addressing the structural imbalances in the
economy, as signalled by its approaching the
International Monetary Fund (IMF) for support.
The free floating of the exchange rate in
January 2001 (abandoning the managed float
in place since 1977) was the first step to
suggest the government was committed to
reform and obtaining IMF support.
The March 2001 Budget also strove toward
some fiscal consolidation, to be achieved
largely through revenue enhancement rather
than major pruning of expenditure. The
principal additional revenue items are a
temporary surcharge of 40 per cent on import
1
State of the Economy 2001
tariffs, upward revision of the National
Security Levy (NSL) by 1 percentage point to
7.5 per cent and a 20 per cent surcharge on
corporate income tax. In spite of a lack of
reform of the public service, and the
management of public sector institutions,
there were a series of temporary expenditure
control measures on both recurrent and capital
expenditure, an across- the-board cut on
recurrent expenditure and a restriction on
defence related expenditure to Rs.63 billion.
These initiatives culminated in signing a 14-
month Stand-By Arrangement with the IMF in
April 2001 enabling US$253 million (SDR 200
million) to be drawn as balance of payments
support. The facility was highly front loaded
in that approximately US$131 million (50 per
cent) was available upon approval of the
Arrangement while the balance is to be drawn
in four tranches of equal magnitude (US$30
million) over a period of 14 months. The
macroeconomic and other policy initiatives
underlying the programme - the so called
conditionalities – have been set out in a
Memorandum on Economic and Financial
Policies and a Technical Memorandum of
Understanding, the implementation of which
are imperative for its successful conclusion.
The Stand-by Arrangement with the IMF is a
welcome development from the viewpoint of
improved economic management and
improving much desired investor confidence.
Besides financial support, the IMF plays a
useful role in acting as an external
commitment mechanism for authorities to
take action to promote macro stability and
structural reform. Furthermore, a programme
with the IMF could become a catalyst in
mobilizing assistance from other donor
agencies.
The main objectives of the programme are to
restore macroeconomic stability and to
reverse the depletion of foreign exchange
reserves. These are to be achieved by
reducing the fiscal imbalance, increasing
flexibility in the exchange rate system and by
eliminating massive operational losses of
public corporations. The programme envisages
upward adjustments of administered prices of
petroleum products, public transportation and
utilities with a view to eliminating operational
losses of public sector entities. Such price
adjustments are expected to contribute to
reducing public corporate sector borrowings
from the banking system quite significantly.
Further provision is there for these
corporations to adjust their prices as needed
for any change in world prices. Any over-
spending on security related expenditure is to
be offset instantaneously by further measures
such as increases in excises on cigarettes and
other items, increases in the goods and
services tax, and cuts in domestically financed
capital spending.
Among the structural reforms envisaged in the
programme are the taking of steps to move
the public service pension scheme on to an
actuarially sound basis, rationalization of the
public service, administrative restructuring of
the Ministry of Finance and the Central Bank
of Sri Lanka, labour market reforms aimed at
facilitating involuntary employee separation
and greater labour mobility, restructuring of
state owned commercial banks, a progressive
2

Policy perspectives
reduction in the dependence on the NSL with
compensating increases in the GST and
phasing out of limits on foreign direct
investment.
By requiring that the exchange rate be freely
floated prior to providing financial support, the
IMF was in effect promoting fiscal
responsibility by increasing the "currency
depreciation cost" of fiscal laxity. In a pure
float, if the authorities failed to control
domestic liquidity by sufficiently limiting
recourse to expansionary financing, they had
to be prepared to allow the exchange rate to
depreciate, lest the country be engulfed in yet
another foreign exchange crisis. However, in
practice this "depreciation cost" is muted by
some administrative controls over the
exchange market (see chapter 5 for details).
While the accelerated depletion of foreign
exchange reserves in 2000 was partly due to
an escalation of defence imports and an
increase in petroleum prices, the continued
erosion of foreign exchange reserves since
1997 was essentially a reflection of
fundamental imbalances in the real economy.
Therefore, external sector stability could be
brought about only if the fundamental
imbalances are addressed by concerted fiscal
action. The IMF perspective is that the
required adjustment will take place through a
reduction in domestic demand, especially for
consumer goods, via an increased tax burden
and lower real incomes.
The government was committed to a fiscal
deficit of 8.5 per cent of GDP and a
projected 4.5 per cent growth rate. During
the first half of the year, although the deficit
remained high (chapter 2.3), the exchange
rate market gained stability, defended by high
interest rates. There was also a modest build-
up of official reserves (of US$ 154 million
between January and June 2001) to US$
1114 million.
However, developments since then suggest
most targets are not achievable. With a 0.9
per cent GDP growth for the first half of
2001, it is not likely that the overall growth
rate will be much above 1 per cent.
Contributing factors include the direct adverse
effects of the drought on agriculture; the
impact of the terrorist attack on the tourism
and transportation sectors; and the impact of
the prolonged slowdown in the US economy,
in the aftermath of the September 11 New
York City terrorist attacks, on the export
sector. Further, the private sector faces
higher costs and loss of competitiveness due
to the power crisis, higher insurance rates on
air and sea cargo, delays in air and sea
shipments and reduced investment.
The fiscal deficit is also likely to deteriorate,
as it is unlikely that revenue targets will be
met in spite of surcharges on corporate
income and import taxes. This is due to
reduced corporate income and reduced
imports in the highly import intensive
manufacturing sector.
On the expenditure side, unanticipated
expenses include high interest payments,
relief to the tourist sector, relief aid to
drought victims, and continued military
3

State of the Economy 2001
expenditures to compensate for the losses
incurred in the terrorist attack.
However, a larger problem than the actual size
of the deficit will be the issue of its financing.
Given the political uncertainty, foreign
financing does not look forthcoming.
Negotiations for a US$200 million loan from
Deutsch Bank was continuously frustrated by
political uncertainty, and has been abandoned.
The expected privatisation proceeds are also
unlikely to materialize, and given the
unfavourable investor confidence it would be
unwise to sell assets now at cheap prices to
tide over an immediate revenue shortfall.
Domestic non- bank financing (e.g., through
the sale of Treasury bills and bonds), lead to
higher interest rates, and crowd out private
investment. In a recessionary environment,
private domestic financing is likely to be
limited, and rising associated interest rates
would only deepen a recession. The
alternative option of bank financing (i.e., the
sale of Treasury bills to the Central Bank-
effectively printing money) will have the
standard inflationary effect, eventually
pushing up nominal interest rates and
crowding out private investment.
The greatest immediate challenge ahead is the
provision of political and policy stability.
Intricate political manoeuvrings of the
government and opposition have diverted from
prioritising economic policy responses to the
multi-dimensional crises facing the economy.
The splintering of the ruling People's Alliance
(PA) coalition in July 2000 and the
subsequent proroguing of Parliament,
precipitated a period of devastating political
uncertainty. This has reduced government
capacity to rally the population around a
unified, non partisan strategy to address
urgent concerns like the impact of the July 24
terrorist attack and the ongoing power crisis.
Further, the volatile political climate has
exacerbated the situation, by severely eroding
investor confidence (both domestic and
foreign), as well as the confidence of the
donor community as reflected by the IMF
delay in releasing the most recent US$30
million tranche of the Standby Arrangement.
In this context, the one year Memorandum of
Understanding (MOU) between the PA
government and the Janatha Vimukti
Peramuna (JVP) on September 5, 2001
received a mixed reaction. In terms of
political stability, the MOU was lauded for
restoring the Parliamentary process,
eliminating a contentious and costly
referendum (albeit effected prior to the signing
of the agreement), and advancing greater
governance through the proposed 17th
amendment to the Constitution. The latter
envisions the formation of a Constitution
Council and independent commissions for the
public service, judiciary, elections and the
police.
The outlook for policy stability was less clear,
and mostly reflected the Marxist roots of the
JVP. Possibly most problematic was the
agreement for price restraints on a variety of
essential goods, including utility and transport
prices, even in the face of adverse external
price movements. These types of policies
4

Policy perspectives
that contributed to huge losses of public
corporations and hence fiscal deficits, present
a reversal of recent efforts to have the
consumer share at least part of the burden of
external shocks. Although price controls may
cushion the consumers directly, they do pay
indirectly through the economic costs of
running and financing large fiscal deficits that
result from these policies.
Other challenges will be to provide effective
relief to the tourism sector and the farming
communities hurt by drought. It is hoped that
the latter may be financed by generous
external assistance. Support for the tourism
industry needs to be devised such that it helps
both the management/capital owners and
labour in the sector. Excessive labour
demands in the midst of an economic crisis
will only exacerbate the crisis and prove
welfare-reducing for all
Other elements of the MOU such as the
reining in of the privatisation programme and
the agreement not to "enter into trade or
financial agreements that could be detrimental
to the interests of the country" posed no
policy management issues. Privatisation
initiatives do need to be delayed because the
political and economic uncertainty in the
country have led the market to severely
undervalue state-owned assets.
Secondly, there is little argument that we
should not pursue agreements that are against
the interests of the economy, ex ante. It
should lead to healthy debates on proposals
such as the Sri Lanka-Pakistan Free Trade
Agreement (see chapter 6), negotiations for
further facilities from the IMF and any other
international contracts.
The opportunity to fully witness whether the
JVP would exhibit responsible economic
management, instead of merely securing
transfers to labour and its other supporters,
disappeared with the dissolving of Parliament
on October 11 and the call for elections on
December 5, 2001. The interim period
leading to the election will perpetuate
uncertainty, and most new investment will
likely take a "wait and see" approach. If the
aftermath of the election creates further
tenuous coalitions or a slim majority, the
impact on the economy will be dire.
Since the global slowdown has reduced the
country's opportunity to export its way out of
a recession, the priority for monetary and
fiscal policy makers is to provide a stimulus
for the stagnant economy.
The Central Bank has taken active steps in the
right direction towards reinvigorating the
economy by dropping interest rates. The
downward revision of the leading indicator of
short term interest rates -the repo rate- has
accelerated. With a rate of 20 per cent at
the beginning of the year, the repo rate was
reduced modestly to reach 18.5 per cent in
June, but since then has been cut in July (to
16 per cent), August (to 15 per cent),
September (to 13 per cent) and again in
October to 12 per cent. The October
monetary stimulus package also included a
downward revision of the reserve
requirement.
5

State of the Economy 2001
Further interest rate cuts are warranted to
stimulate the economy, but monetary
management will also need to heed the higher
inflationary pressures in the economy. The
average inflation (CPPI) for the first nine
months of 2001 was 14.5 per cent - more
than double the average inflation in 2000.
In terms of fiscal policy, the scope for action
is restrained by the already high deficits and
limited options for financing. Given the heavy
reliance on non-bank domestic financing, large
deficits place upward pressure on interest
rates which stifles growth, while monetizing
the deficit has greater inflationary
consequences. Thus, it is imperative that
fresh efforts are pursued to secure foreign
financing.
Although data for the first six months of 2001
suggest the fiscal deficit is accelerating
(compared to last year), heightened new
efforts to cut expenditures or increase taxes
would be detrimental to society, and
especially the poor.
Effective fiscal policy management is not
solely about meeting overall targets. The
government could readily meet the 8.5 per
cent of GDP target by slashing capital
expenditures. However, given the stagnant
economy, capital expenditures are the items
which must be maintained, as they are most
likely to stimulate growth, support the private
sector and generate employment.
Combining fiscal responsibility and providing a
stimulus to the economy is not an easy task.
The answer lies in maintaining capital
expenditures, while cutting waste in current
expenditure.
In light of the internal and external shocks
hitting the economy, some flexibility from the
IMF in terms of targets was expected. The
post East- Asian crisis IMF is a more open,
transparent organization interested in
presenting itself as a partner of "nationally-
owned" reform efforts. Given a credible
commitment of the government to fiscal
responsibility, it was hoped that the IMF
tranches would be released by year's end.
However, the government's October 2001
fiscal stimulus package calls into question its
commitment to sound budgetary management
and undermines its previous reform efforts.
Much of the expenditure is of the standard
type coincident with elections -- wage hikes
for over a million public sector employees,
increases in allowances for pensioners and
subsidized prices of wheat flour and LP gas.
Apart from these transfers, several tax cuts
are offered - a 1 percentage point drop in the
NSL to 6.5 per cent; a withdrawal of "Save
the Nation" contributions; a removal of the
diesel tax, removal of the 1 per cent turnover
tax on the financial sector; a reduction of the
stamp duty on LCs to 1 per cent, import duty
reductions on essential raw materials and
cement, a suspension of the cess on exports
of prawns and shrimp, and an increase in the
duty rebate scheme for exporters.
The package also does provide some targeted
support for sectors severely hurt by the
drought and terrorist attacks. It includes Rs.
6
Policy perspectives
1 billion in drought relief, write-offs of loans
under Rs. 20,000 for farmers, and interest
rate subsidies and loan rescheduling for the
tourist sector.
While the policies are politically expedient
prior to elections, they represent a limited
short-term injection to an ailing economy.
The stimulus will bolster consumption and
provide some relief to business, but is unlikely
to increase investment due to the huge
uncertainties prevailing in the political
environment. The same policies at a more
stable time would have generated a greater
response. Further, there are no initiatives to
increase productive capital spending, and in
fact it is likely that there will be a reduction in
such spending.
The obvious costs of this package are the
financial costs that will translate into a larger
budget deficit, with the consequent
implications for domestic interest rates and
inflation depending on the deficit financing
methods. Less apparent is that the stimulus
comes at the expense of reversing important
reform initiatives before reaping the gains
from such reform, and further exacerbating
existing problems. For example, the sudden
duty reduction on cement has adversely
affected the domestic cement industry. It
adds to the problem of the large public wage
and pension bills, and reverses trends toward
eliminating costly subsidies of commodities.
Public service reform was also set back by the
absorption of 40,000 workers into the
permanent cadre of the public sector.
Further, the loss of credibility regarding fiscal
responsibility implies that higher interest rates
will have to be paid for any private foreign
borrowing.
Apart from these issues facing policy makers,
as repeatedly mentioned in previous State of
the Economy reports, an improved security
situation remains a priority. It is not clear to
what extent the "war on terrorism" led by the
US and its allies will affect the LTTE, and
what the LTTE's response to that would be.
There are no quick-fix solutions to this
problem and a solution requires a non-partisan
concerted effort.
The analyses presented in the upcoming
chapters of the State of the Economy 2001
focus on other issues important for short and
medium-term economic management.
• Many issues of governance (raised in chapter 7), such as the streamlining of ministries, as well as deep-rooted issues relating to overlap of institutions, personnel, and decentralization remain.
• Direct improvements in management need to be taken to improve aid utilization (chapter 9) that would generate employment and output, particularly at a time when foreign funding is scarce.
• Further, it is important to formulate a Poverty Reduction Strategy Paper (PRSP) as a prelude to applying for the IMF's Poverty Reduction and Growth Facility (PGGF) which integrates poverty reduction with macroeconomic policies. This Fund facilitates concessional lending up to a maximum of SDR 538 million (i.e., 140 per cent of Sri Lanka's IMF quota- approximately US$ 745 million) under a three year arrangement, at an annual interest rate of 0.5 per cent. Of course,
7

State of the Economy 2001
the actual size of the assistance (in cooperation with the World Bank) will depend of the extent of the balance of payments needs, the strength of the programme and the history of IMF credit use. Although the assistance is available at softer terms, it is subject to more stringent conditionalities.
• It is also the time to implement a strategy
for the power sector (chapter 8) that
incorporates short and medium term, as
well as long term aspects. The time to
gather support for a coal power plant is
now, when the results of inactivity face
the nation daily. The success of these
initiatives will require the weight of the
highest levels of leadership. The country
cannot afford the governance failures in
the power sector. The expected losses of
the Ceylon Electricity Board in 2001 of
Rs. 12 billion, is the size of last year's
entire Samurdhi welfare programme.
• Prior to resubmission of the legislation on
competition policy, a renewed look at the
importance of fostering competition in
industry over revenue goals of
privatisation, is crucial (chapter 4).
• Privatisation contracts need to be designed
with the goal of fostering a competitive
sector in the medium term, without a
simple short-term aim of maximizing
government revenue from sales revenue.
• Anti-dumping legislation needs to be
forwarded with emphasis on simplifying
the procedures and reducing the costs of
initiating cases. Foreign assistance will be
needed especially to assist small and
medium size enterprises facing unfair
competition from abroad ( Box 4.1).
• Design of international contracts,
especially for power supply, privatization
deals and of government borrowings, need
greater financial savvy and sophistication.
These must also be guarded from being
avenues for capture by domestic interests.
• On the external sector, multilateral trade
liberalization offer the greatest rewards for
consumers, as long as the appropriate
safeguards (such as legislation on anti-
dumping and countervailing duties) are in
place to protect domestic industries from
unfair competition.
• The bilateral free trade agreement (FTA)
with Pakistan is likely to be beneficial in
the short-term through greater tea exports,
and no apparent adverse long-term
consequences. However, it would be
disastrous to pursue numerous bilateral
FTAs with the aim of expanding our tea
export markets, without full consideration
of the impact on all other sectors
(particularly import competing sectors) of
the economy.
• All bilateral FTAs with members of a
regional trade arrangement, must represent
a deeper or equal level of liberalization for
all product categories compared to the
regional arrangement.
• Greater flexibility of the exchange rate will
benefit the export sector, but given
uncertainties in the economy limited
interventions by the Central Bank are
warranted (chapter 5).
Although the current government faces the
standard problems of most delicately built
coalitions, many of the issues of governance
8
Policy perspectives
are long standing and not specific to the
current government. It is important to
address these concerns so as to put in place
the machinery that can navigate the economy
in turbulent times, and steer a course for
economic take-off.
In many countries, it has been found that
times of crisis lead to reform. This is because
sectoral and partisan interests are relegated in
favour of the national interest. It is hoped Sri
Lanka will not be an exception to this rule.
Although the slowdown in the economy must
be acknowledged and addressed, it is vital to
avoid unfounded pessimism and panic. It
must be seen with a recognition of the
inherent strengths of the economy- in
particular the resilience of the private sector.
However, no private sector can thrive in a
climate of continued political flux. The
demands on government are to provide
greater stability of politics and policy to
generate a pronounced re-engagement in
commitment to the economy.
9

Figure 2.1 Quarterly GDP growth rates:
Q1-1999--Q2-2001
Source: Central Bank of Sri Lanka.
State of the Economy 2001
2. Economic performance
2.1 Introduction
The growth momentum regained since the
final quarter of 1999 continued in year 2000
resulting in an overall real output growth of 6
per cent. GDP per capita increased to US$
856 in 2000 from US $ 825 in 1999.
However, following the slight deceleration of
growth in the last two quarters of 2000,
growth plummeted in the first half of 2001.
While buoyed by the robust performance in
developed nations in 2000, the Sri Lankan
economy is hurting from the current global
slowdown. Besides the inhospitable
international environment, the economic
outturn reflects the embarkation of a
stabilization programme, a power crisis, a
debilitating drought, and lack of investor
confidence due to political uncertainty. The
terrorist attacks at Katunayake on July 24,
2001 and in New York City and Washington
D.C. on September 11, 2001 had adverse
effects on the economy, in most cases
reinforcing the unfavourable trends already in
place.
This section looks at the economic outturn
from the first quarter of 2000 to the second
quarter of 2001. The implications of the
terrorist attacks on the Sri Lankan economy,
recent developments and short-term outlook
are covered in the "Prospects" chapter. The
following sections analyze output growth by
sector, the fiscal outturn, interest rates and
exchange rates, inflation, capital markets and
the balance of payments (see also Diary of
Events).
2.2 Output growth Q1-2000: Q2-2001 The impressive 6 per cent growth in 2000
was led by a dynamic export-oriented
manufacturing sector exploiting a robust world
economy, as well as a service sector that
catered to the increased trade. However,
with a slowdown in export markets, a
debilitating drought, a power crisis and lack of
investor confidence, output growth was only
0.9 per cent in the first half of 2001.
Agriculture and the leading apparel and
Table 2.1 Half yearly growth rates,*
by sector: 2000-2001 1st half 2nd half 1st half
8.0
7.0
6.0
7.0 6.6
7.3 5.4
5.0
Agriculture, forestry
2000 2000 2001
5.0
4.0
3.0
2.0
1.0
0.0
2.8
3.3
4.0
1.3
0.4
and fishing 2.9 0.8 -2.6 Mining and quarrying 6.8 2.9 4.7 Manufacturing 11.9 7.1 0.6 Construction 8.1 1.7 5.5 Services 7.0 6.8 1.4
GDP 6.9 5.2 0.9
* Calculated as the percentage change in real output of six months, compared to the real output at the same time in the previous year.
Source: Central Bank of Sri Lanka.
10
Figure 2.1 Quarterly GDP growth rates:
Q1-1999—Q2-2001
Source: Central Bank of Sri Lanka.

Economic performance
textiles industries have been hard hit, as has
the services sector relating to trading
activities. The highest growth has come from
the construction sector (through increased
infrastructure projects) and increases in
quarrying related to this construction.
Unfortunately, these two sectors account only
for 9 per cent of total output. (a) Agriculture
The agriculture sector, including forestry and
fishing, grew marginally at 1.8 per cent in
2000, compared to the 4.5 per cent growth in
1999. The performance was mixed, with
tea, coconut and fish production growing, but
drops in rubber and paddy. In fact, tea
production increased by 7.7 per cent,
overtaking the 1999 production record of 284
million kg to reach 306 million kg in 2000.
This increase in production was a result of
favourable weather conditions, increased
fertilizer application, and increased prices in
the world market due to reduced production in
Kenya.
Coconut production also reached record levels
in 2000, with a production of 3055 million
nuts. This was mainly due to favourable
weather conditions in 1999 and 2000, and
increased fertilizer usage in 1999. Although
output expanded by 8 per cent, prices
dropped by 31 per cent driven by a recovery
in coconut production in the Philippines.
On the other hand, although rubber prices
increased by 21 per cent in 2000, production
could not sustain the 1999 increase in output
and dipped to 87 million kg- the lowest level
in a decade. The paddy sector registered
similar output levels to that of 1999, but
suffered falling prices. As a result, in
September the Government intervened in the
market through purchase by semi-government
cooperative organizations to prevent further
price declines. Licensing requirements on rice
imports were also imposed, reducing imports
to 15 thousand metric tons in 2000,
compared to 214 tons in 1999.
Battered by drought, the agriculture sector
registered a negative growth of 3.6 per cent
in the first quarter of 2001, compared to the
first quarter of 2000, and a further
contraction of 1.2 per cent in the second
quarter. January- July 2001 data for tea and
coconut registered decreases in output
compared to the first seven months of 2000
(growths of -1.7 per cent and -4.0 per cent
respectively), and the Maha season (Sept/Oct
- March/April) paddy production dropped by
10.2 per cent. However, rubber production
grew slightly by 1.9 per cent.
b) Manufacturing
Manufacturing regained its momentum in
2000 with a 9.2 per cent growth, after a
moderate 4.4 per cent growth in the previous
two years. Export-oriented industries
spearheaded the growth, stimulated by a
recovery in export markets and increased
competitiveness with the gradual currency
appreciation of competitor East Asian nations.
The textiles and apparel industry, grew at 16
per cent, with rubber and plastic products also
showing significant improvements. The USA
remained the biggest buyer of textiles and
garments, absorbing 56 per cent of garments
exports in 2000.
11
State of the Economy 2001
The sector has been seriously hurt by the
slowdown in the global economy in 2001 (see
chapter 3.3.2), as well as by electricity and
diesel price hikes, and high interest rates since
Q3-2000. In spite of the depreciation of the
SL Rupee and the signing of an agreement
with the EU that removes quota restrictions
for apparel exports from January 2001,
manufacturing growth slowed to a 2.4 per
cent growth in Q1-2001, and then actually
registered a negative 0.6 per cent growth in
Q2-2001. This is a dramatic slowdown from
the 12.4 and 11.4 per cent growth increases
in the first two quarters of 2000, respectively.
Not only does this affect the manufacturing
sector that made up 16 per cent of GDP in
2000, it has negative knock-on effects on the
services sector which accounts for over half
of GDP.
Using the January-June 2001 data of the
private sector industrial volume index (the
private sector accounting for 94 per cent of
industrial output), it is estimated that private
manufacturing would have grown by only 0.9
per cent over the first half of 2001. Public
sector manufacturing dropped by 26 per cent
in the same period. The leading apparel and
textiles sectors both registered drops in
production of 3 per cent, in sharp contrast to
when they increased by 20 per cent and 15
per cent in the first half of 2000. Diamond
processing also registered a notable
contraction of -4.7 per cent growth.
However, overall growth was buoyed by
production of domestic market-oriented
goods- e.g., food and beverages, plastic and
PVC products, and basic metal products.
c) Services
Value added in services grew strongly by 6.9
per cent in 2000, up from a 4.2 per cent
growth in 1999. The growth was led by
transport and communications, wholesale and
retail trade related to export and imports, and
electricity generation, although the tourist
sector weakened.
The transportation sector was buoyed by
increased bus fleets, and the improved
performance of Sri Lankan Airlines after the
acquisition of new aircraft.
The telecommunications sub-sector continued
an impressive growth of 31 per cent in 2000,
resulting from the expansion in the
communication network and infrastructure
following the sector being open to private
investment. Provision of cellular phones and
communication facilities based on modem
techniques including Internet and e-mail grew
by 75 per cent and 59 per cent respectively in
2000. The information technology sector
showed an improved growth with export
earnings reaching US $ 55 million. Nearly 50
new software development companies have
been set up generating 4000 direct
employment opportunities.
However, the tourist sector suffered a setback
in 2000 with arrivals dropping to 400
thousand after recording an all time high of
436 thousand the year earlier. Increased
flights and promotion campaigns could not
completely overcome the negative effects of
increased hostilities in the North, increased
sporadic violence in and around Colombo, and
12

Economic performance
the violence leading to Parliamentary
Elections.
Quarterly estimates of 2001 suggest the
services sector grew by 2.3 per cent in Q1-
2001 (compared to 6.6 per cent in Q1-2000),
and by 0.6 per cent in Q2-2001 (compared to
7.5 per cent in Q2-2000). This likely reflects
a reduction in export and import activities.
Port services data show a drop in vessel
traffic by 3.6 per cent, but a 5.6 per cent
increase in total container handling. January-
June 2001 figures suggest the
telecommunications sector continues to be
buoyed by growth in the provision of cell
phones and subscription to email and internet-
the increase being twice as high as the
increase in the first six months of 2000.
Further, the tourist sector looked very
promising with arrivals on track to lead to new
record levels. During January- July, tourist
arrivals reached 256 thousand in 2001, above
the 239 thousand tourists during the same
period in 2000, and even exceeding the 246
thousand arrivals in the record breaking year
of 1999.
2.3 Fiscal outturn
Fiscal consolidation in 1999 was reversed in
2000, with the overall deficit (excluding
grants) deteriorating to 9.9 per cent of GDP-
exceeding the 7.5 per cent deficit of 1999,
and significantly higher than the targeted
deficit of 7.6 per cent of GDP. Performance
reflected higher than expected security-related
expenditures, increases in interest payments,
and to a lesser extent drops in revenue.
Total current expenditure in 2000 increased to
20.3 per cent of GDP from 18.7 per cent in
1999. Heightened hostilities in the Northeast
and the country being placed on a war footing
since May increased the defence bill
substantially, to nearly Rs. 71 billion.
Increased current expenditure resulted from i)
public sector salary increases, ii) increases in
pensions and Samurdhi benefits implemented
in August 2000, and iii) higher interest
payments on domestic debt due to the
substantial amount of funds mobilized through
Treasury Bonds in 1999.
Capital expenditure was curtailed due to the
restriction imposed on non-priority capital
expenditure in May 2000, and the slow
progress of foreign funded investment
projects. Public investment was 6.4 per cent
of GDP, much lower than the targeted 8.1 per
cent of GDP.
Revenue as a percentage of GDP declined to
16.8 per cent compared to 17.7 per cent
recorded in 1999. Less than expected
revenue mobilization was a result of
exemptions from corporate tax income for
loss-making key public enterprises such as the
Ceylon Petroleum Corporation and the Ceylon
Electricity Board. Import duty collection also
fell in spite of significant import growth due to
higher import values of duty-exempt items
such as petroleum, fertilizers and textiles.
The government has increasingly relied on the
national security levy and excise duties to
compensate for revenue under performance.
13
The budget deficit was financed almost
exclusively (9.4 per cent of GDP) from
domestic sources, as anticipated foreign

State of the Economy 2001
finance through privatization proceeds and
foreign investment, fell through. About 55
per cent was from domestic non-bank
sources, thus exerting upward pressure on
interest rates and crowding out private sector
borrowing. The Central Bank's deficit
financing amounted to 3.6 per cent of GDP
and had the anticipated inflationary
consequences.
The fiscal outturn for the first half of 2001
suggests an overall deficit larger than that of
the same period in 2000, by 0.8 percentage
points (see Table 2.2). This reflects both an
increase in revenue collection and
expenditures. Interest payments have become
a huge burden on the government, resulting
from the rising interest rates of the previous
year. In fact, abstracting from interest
payments (called the primary balance), the
deficit falls to 3 per cent of GDP. Defence
expenditures have been contained, and
unfortunately capital expenditures as a share
of GDP have also dropped.
The revenue outturn mostly reflects the
success of the government's budget
proposals. The most notable development on
the revenue side is the increased importance
of the national security levy, and to a lesser
1st half 2000
1st half 2001
1st half 2000
1st half 2001
%GDP1 %GDP1 Rs.mn Rs.mn Revenue 18.6 19.5 100329 119329 Tax 15.9 17.0 86151 103740 Income taxes 2.1 2.4 11527 14382 GST/turnover taxes 4.2 4.1 22728 24842 National Security levy 2.8 3.6 14989 21799 Excise tax 3.7 4.0 19933 24318 Import duties 2.2 2.2 12064 13633 Motor vehicle and other licence fees 0.1 0.1 493 539 Non-tax 2.6 2.6 14178 15590
Expenditure 27.9 29.6 150625 180809 Current 21.6 23.4 116552 143199 Defence 4.2 3.8 22946 22928 Salary 6.0 5.9 32468 36310 Interest 6.2 7.0 33772 42977 Pension 1.9 2.0 10234 12277 Capital and lending 6.3 6.2 34073 37610
Current balance* -3.0 -3.9 -16223 -23870 Primary balance** -3.1 -3.0 -16524 -18503 Overall balance*** -9.3 -10.1 -50296 -61480
* Revenue minus current expenditure. ** Revenue minus non-interest current expenditure.
*** Revenue minus total expenditure. Note: 1
%GDP: calculates shares of GDP using GDP data for the relevant six month period. The share of GDP figures above do not correspond exactly with Central Bank annual figures, because the latter use current GDP at market prices which is not available publicly on a quarterly basis. These estimates of GDP are based on quarterly real GDP at factor prices, inflated by the consumer price index. These figures are likely to overestimate the size of the deficits slightly, but due to their consistency are useful in recognizing trends.
Source: Ministry of Finance and Planning.
14
Table 2.2Fiscal outturn – 2000/2001

Economic performance
Figure 2.2 Interest rates (%), Jan. 2000-Sept. 2001
Source: Central Bank of Sri Lanka.
0
5
10
15
20
25
2000Jan
Mar May July Sept Nov 2001Jan
Mar May July Sept
Repo RateTreasury Bill -3 monthWeighted Average Prime Lending Rate
extent, excise duties in boosting revenue.
Income taxes also increased by 0.3
percentage points of GDP. The increased
import surcharges only maintained revenue
from trade taxes due to the significant drop in
the quantity of imports.
The financing of the deficit was met, as in
2001, with domestic financing, especially
since foreign payments amounting to
US$5300 million in net terms, had to be paid
out.
The share of GDP figures above do not
correspond exactly with Central Bank annual
figures, because the latter use current GDP at
market prices which is not available publicly
on a quarterly basis. These estimates of GDP
are based on quarterly real GDP at factor
prices, inflated by the consumer price index.
These figures are likely to overestimate the
size of the deficits slightly, but due to their
consistency are useful in recognizing trends.
2.4 Interest rates and the exchange rate
Excessive borrowings of the government and
some public corporations, as well as
increasing inflationary expectations exerted
upward pressure on both short-term and long
term interest rates in 2000. The sharp rise in
the last quarter resulted from the Central
Bank's efforts to defend the managed
exchange rate in the face of a mounting
external payments deficit. Interest rates rose
to counter the effects of strong expectations
of a depreciation and the precipitous decline in
official reserves.
The repo rate and the reverse repo rate1,
which signal the Central Bank's expectation of
the future direction of interest rates were
continuously revised upward. The repo rate
15
1 The Central Bank repurchase (repo) rate is the rate at which commercial banks and primary dealers can invest their surplus funds in Treasury bills and bonds held by the Central Bank, while the Central Bank reverse repurchase (reverse repo) rate, is the rate at which commercial banks and primary dealers can obtain funds from the Central Bank against their collateral of Treasury bills and bonds.

State of the Economy 2001
(reverse repo rate) moved from 9 (13.5) per
cent in January 2000 to 13 (16) per cent by
end September, and registered a steep incline
to 17 (20) per cent in the last quarter. Similar
trends were seen in the rates of treasury bills
and treasury bonds. The three-month
Treasury Bill rate rose from 11.42 in January
2000, to 13.61 per cent in September and
then shot up to 17.91 in December. This was
despite over-subscriptions in most of the
government securities auctions. The financial
system responded with many commercial
banks increasing their lending rates, such that
the prime lending rate (which is based on the
rates offered by commercial banks to their
prime customers) increased from 13.35 per
cent In January, to 16.05 per cent in
September and to 21.21 by December.
During 2000, the rupee depreciated by 9.9
per cent against the US dollar compared to a
depreciation of 6.0 per cent in 1999. After
floating the rupee in January 2001, the
currency depreciated by a further 13.6 per
cent during the first half of the year to reach
SLRs/US$ 90.95 by end June 2001 from Rs.
80.95 at the end of December 2000.
The drain in the foreign exchange reserves
due to the increased deficit in the balance of
payments exerted immense depreciation
pressure on the exchange rate particularly
during the second half of 2000. This initiated
speculative behaviour by exporters, holding
back foreign exchange and importers
advancing their operations, further
depreciating the rupee. Official reserves
depleted as the Central Bank defended the
exchange rate. The Central Bank was forced
to increase short term interest rates to
discourage speculative holdings of foreign
currency balances, and widen the margin
between the buying and selling rate of foreign
exchange from 2 per cent to 5 per cent in
June 2000, and then to 6 per cent in
November, 8 per cent in December and 10 per
cent in January 2001. This widening of the
band increased expectation of continuous
depreciation of the rupee and further
deteriorated foreign reserves, which reached
such a low level (equivalent to only 1.5
months of imports) that floating the currency
looked the optimal option (see chapter 5 for a
deeper analysis).
After floating the currency in January 2001,
interest rates remained high to provide some
stability to an uncertain foreign exchange
market. However by June, the exchange rate
gained some stability, and interest rates
dropped slightly. The repo rate (reverse repo
rate) was revised downward in February, April
and July to move from 20 (23) per cent in
January to 16 (18.50) per cent by July, and
the prime lending rate dropped from 23.21 per
cent to 20.3 per cent over the same period.
2.5 Inflation
While overall inflation remained low in 2000,
it is going to be of greater concern in 2001.
The second half of 2000 witnessed a reversal
of the low inflation regime experienced since
1998. The average increase in prices (CCPI)
in 2000 was 6.2 per cent, slightly higher than
the 4.7 per cent in 1999. In the first six
months of 2001, the average inflation rate
rose to 15.1 per cent, compared to the same
period in 2000, while the moving average
16

Economic performance
annual figures indicate an inflation on 12.2 per
cent.
The increase in prices starting from the
second half of 2000 may be attributed to the
rise in the international price of crude oil, the
depreciation of the rupee, and high import
prices of some items like sugar and wheat
flour. These developments forced the
government to increase administered prices
several times, especially of diesel, wheat flour
and kerosene. Together with the rise in LP
gas, these price hikes had strong knock on
effects. The price increases of kerosene, LP
gas, diesel and bus fares ranged from 15-45
per cent, a surcharge on electricity was
applied, and tariffs on water and local
telephone calls were revised. Some price relief
came from increased domestic production of
rice, coconuts and some vegetables,
(Department of Census and Statistics).
The Central bank contained its monetary (M2)
expansion to 13 per cent in 2000, compared
to 13.9 per cent in 1999, to contain
aggregate demand-driven inflationary
pressures.
Higher inflationary conditions will prevail
through 2001, depending on the extent of
bank financing of the fiscal deficit. Since
much of the price increases started from June
2000, the high base of the price indices then,
will reduce the growth rates of prices in the
latter half of 2001. Prices have also been
dampened by the depressed economy and the
tight monetary policy until June 2001 (when
M2 money expansion increased by 9.4 per
cent, compared to 13.1 per cent a year
earlier), though the impact of the drought has
raised the price of some food items.
2.6 Balance of payments
The deficit in the overall balance of payments
widened to US $ 516 million in 2000 (3.1 per
cent of GDP), compared to a deficit of 1.7 per
cent of GDP in 1999 and a surplus of 4 per
cent of GDP in 1998. This triggered a
reserves crisis as official reserves dropped by
36 per cent since 1999 to about US $ 1043
million by the end of 2000, sufficient to
finance only about 1.7 months of imports.
The overall deficit reflected a massive record
level (in US dollar terms) trade deficit of US $
1763 and insufficient capital inflows.
However, in the first half of 2001, the trade
balance showed a marked improvement, the
deficit falling to US$760 million compared to
US$ 1316 million for the same period a year
earlier.
CCPI inflation (%
Source: Central Bank
02468
1012141618
2000
Jan M
arMay pt
m int
The trade deficit in 2000 reflects strong
growth in both exports and imports. The
deficit widened to 10.8 per cent of GDP (US $
Figure 2.3 ) - Jan.2000/Sept.2001
of Sri Lanka.
July
Sept
Nov
2001
Jan M
arMay Ju
lySe
oving average point-to-po
17

Table 2.3 External payments, 2000-2001 (US$ mn)
1st half 1st half % 2000 2001 change
Exports 2471 2432 -1.5
Imports 3786 3192 -15.7
Trade Balance -1316 -760 -42.3
Tourist earnings 129 144
State of the Economy 2001
Figure 2.4 Trade deficit Q1-1999/ Q2-2001 (US$ mn)
1000
800
600
400
200
0
Source: Central Bank of Sri Lanka.
1343) from 8.7 per cent in 1999. The
recovery of the world economy helped boost
national economic performance in 2000,
especially the export category of textiles and
garments, Sri Lanka's biggest export earners.
Merchandise exports grew by 19.8 per cent in
2000 after a 3.9 per cent contraction in
1999.
However, merchandise imports surged by
22.4 per cent in 2000 after 1.5 per cent
growth in 1999, due to the high cost of fuel
imports (the value of petroleum imports went
up by 76 per cent), textiles imports feeding
the growing apparel export sector, airlines
and arms imports.
The current account deficit deteriorated by a
greater degree to 6.3 per cent (from 3.6 per
cent in 1999) despite higher private transfers
from migrant workers. This was due to
declines from tourist arrivals, higher interest
payments on external debt, and a drop in
interest earnings on external reserves.
The capital and financial accounts improved in
2000 as a result of an increase in short term
1st half 1st half % 2000 2001 change Exports 2471 2432 -1.5 Imports 3786 3192 -15.7 Trade Balance -1316 -760 -42.3 Tourist earnings 129 144 11.6 Worker remittances 448 405 -9.6
Exports
Agricultural 475 479 0.8
Tea 327 359 9.8
Coconut 60 40 -33.6
Industrial 1913 1864 -2.6
Textiles and apparel 1321 1264 -4.3 Leather, Rubber products etc. 214 214 0.2 Food, Beverages and Tobacco 66 68 2.6
Mineral 45 48 7.2
Imports
Consumer goods 605 624 3.1
Intermediate goods 1936 1815 -6.3
Crude oil 234 150 -36.1
Textiles 759 692 -8.8
Investment goods 1047 617 -41.0 Note: 2000 data for investment goods includes $298
million for imports of aircraft. Source: Central Bank and Ministry of Finance and Planning.
inflows to the private sector and long term
inflows to the government. However, the
increase in capital and financial accounts were
insufficient to cover the increase in the
current account deficit, due to only little
increases in FDI and privatization proceeds. As
a result, the overall deficit in the balance of
payments deteriorated.
The trade deficit of US$760 million in the first
half on 2001 represents a 40 per cent decline
in the deficit compared to the same period a
year earlier. Imports declined by 16 per cent
reflecting the impact of the government's
18
Table 2.3 External payments, 2000‐2001 (US$ mn)
Economic performance
demand management policies, a decline in oil
prices and reduced imports of textiles that
supply the apparel sector. Unfortunately,
exports also declined (by 1.5 per cent) -- in
particular textiles and apparel exports dropped
by 4 per cent, reflecting a slowdown and thus
reduction in demand in advanced countries.
As a result, the current account is likely to
have improved, buoyed by increased tourist
earnings from US$129 million in January-June
2000 to US$144 million in 2001, during the
same period. However, worker remittances
amounting to US$405 million, declined from
US$448 during January-June 2000. The
dependency on foreign employment increased
with employment opportunities increasing to
about 150,000. In the 2001 budget many
incentives were offered to migrant workers
such as housing loans at concessionary rates,
insurance compensation and monthly pension
benefits commencing at the age of 55 for
migrant workers who return after successful
completion of employment overseas.
As a result, official reserves have been
bolstered somewhat to US$ 1114 at the end
of June 2001, up from $904 prior to the
floating of the currency in January.
2.7 Capital markets
The capital market which has been in the
doldrums since 1994 indicated little
improvement in 2000 with the All Share Price
Index (ASPI) reaching a historic low of 424.
This decline continued in 2001 and was
reflected in all sector indices. Foreign
investors continued to leave Sri Lanka
resulting in a total net foreign sales of Rs.
1848 Mn. from April 2000 to March 2001.
The bearish market sentiments did not change
even after the ruling party was re-elected in
October 2000 thus, continuing to signal the
low investor confidence in the market. At
the end of September 2001, the ASPI was
down to 403, reflecting a 21 per cent drop
over the previous year. The average daily
turnover was a paltry US$ 200,000 with
market capitalization at US$892 million.
19
State of the Economy 2001
3. International environment
The outlook for the global economy in 2001 is
pessimistic, compared to the healthy growth
rates in all major regions of the world in 2000.
The world economy posted a growth rate of
almost 5 per cent in 2000 - the fastest for 16
years. This improvement was led by the
continued strength of the US economy; robust
expansion in Europe; early yet fragile signs of
recovery underway in Japan after a decade
long recession; consolidation of recovery in
Asia; and a rebound from a 1999 slowdown
in emerging economies in Latin America, the
Middle East and Europe.
But 2001 looks much less buoyant with the
US on the brink of a recession and Japan
slipping back yet again into recession. If the
world’s two biggest economies simultaneously
fall into recession, it will be the first time
since 1974. Forecasts for global GDP growth
in 2001 range from 1.2 per cent to 2.6 per
cent, with the IMF being the most optimistic,
having revised downward the 3.2 per cent
growth estimate after the terrorist attacks in
New York City and Washington D.C. Most
analysts agree that the terrorist attacks have
mostly reinforced trends indicating a
slowdown in the global economy, but
anticipate a recovery by mid-year 2002. The
integrated nature of the global economy
implies that the shock to the US economy will
emanate deeper to the rest of the world than
before.
This section looks at developments in the
international economy and how they affect
the Sri Lankan economy. First, it looks at the
global trends prior to the external shock of the
September 11 terrorist attack. It then
discusses the possible fallout of the attack
and the key developments that will influence
global growth in the year ahead. Next, it
directly considers the impact of the global
slowdown on the Sri Lanka economy, as well
as the impact on the local economy of major
regional arrangements to which the country
does not belong, and the recent expansion of
the ocean area under the jurisdiction of the
nation.
3.1 Global trends in the pre-shock economy
3.1.1 OECD economies
After growing at 5 per cent in 2000, the
forecast for growth in the US in 2001 has
been downgraded further from 3 per cent to
1.5 per cent (IMF, 2001). GDP growth is
expected to slow down as private demand
reacts to earlier tightening of monetary policy,
negative wealth effects of declines in stock
market prices and real income effects of
higher oil prices. The US economy in recent
years has been characterized by excess
demand, and to ease inflationary risks of oil
price hikes and tight labour markets, the
Federal Reserve – the US Central Bank - has
raised interest rates by 1.5 percentage points
since mid-1999.
More recently, the Federal Reserve abandoned
its bias towards tightening monetary policy as
the risk of economic weakness in 2001 has
become greater than the risk of inflation.
Consequently, it has reversed its interest rate
20

International environment
policy by cutting interest rates seven times in
2001 prior to the September 11 terrorist
attack, by a total of 3 percentage points
taking the Federal Fund rate down to 3.25 per
cent- its lowest level in seven years. Despite
the slowing of the US economy in 2001, the
US dollar has risen in value to a 16 year high
in real trade-weighted terms and remains
strong against the major currencies.
Economic expansion in the euro area gathered
strength in 2000 registering a 3.4 per cent
GDP growth rate (IMF, 2001). However,
growth in 2001 is expected to slow down to
2.4 per cent, pulled down by a sluggish
German economy. The pick up in growth in
2000 was aided by a resurgent export growth
due to strengthening global recovery and a
highly competitive currency. It has also been
accompanied by a substantial decline in
unemployment. Price pressures have been
muted despite rising oil prices and fall in the
exchange rate, due to slack still remaining in
labour and product markets.
Despite intervention by the European Central
Bank (ECB) in the foreign exchange markets in
September (in coordination with the US
Federal Reserve) and November 2000
(unilaterally) to revive the currency, the euro
has been sliding against the dollar and most
other major currencies. The euro, which hit an
all time low of $0.82 in October 2000,
recovered slightly but has since lost on that
gain and is now trading significantly below the
value at its birth in January 1999. This is
partly due to the relative cyclical position of
the euro area, the relative interest rate
differentials and market perceptions of
differences in the underlying climate for
investment across the countries. Due to
buoyant activity, rising oil prices and the
weakness of the euro, the ECB raised interest
rates since late 1999 to 4.75 per cent to
forestall inflation and meet its inflation target
of 2 per cent or less. In November 2000,
inflation in the euro area rose to 2.9 per cent,
a six year high.
The euro is expected to rebound in 2001 as
the US economic growth slows down, below
Europe’s growth rate, and to rise to just above
parity with the dollar within a year’s time. The
yen and the pound are also tipped to gain
against the dollar but fall against the euro.
Despite signs of a moderate recovery
underway in the Japanese economy in 2000,
the economy now appears to be faltering and
growth is forecasted to grow barely over 0.5
per cent in 2001. The little momentum that
the Japanese economic recovery had
mustered in 2000 seems to have dissipated,
continuing the almost decade-long stagnation.
Deflation has dragged the economy into a
vicious circle, where falling prices encourage
households to delay spending, and thereby
push prices still lower. Meanwhile, deflation
has increased the real burden of debt, further
choking domestic demand. The Bank of Japan
in its latest move to halt deflation has eased
its monetary policy and pushed its rates back
down to zero in March 2001. The Bank has
pledged more than a rate cut; it has
abandoned targeting of interest rate altogether
and introduced what is in effect an inflation
21

State of the Economy 2001
target. The Bank said it will maintain its new
policy until inflation rises above zero.
3.1.2 Emerging economies and Russia
East Asia’s growth rate is expected to drop
from 7 per cent in 2000 to below 5 per cent
in 2001, as the US economy slows down in
2001. With the exception of China, almost
every country in the region has experienced a
sharp slowdown in the first quarter of 2001.
Over the past few years, economic growth in
the US has helped to pull along East Asia by
exporting their way out of recession, where
exports account for almost two-fifths of
regional GDP. The US is the region’s biggest
export market, with Japan securing the
second place. The region now faces a double-
edged threat. Not only is the US economy
faltering, reducing its overall demand for
imports but the economy’s demand for
information technology (IT) equipment is likely
to fall even more sharply, as business
investment slumps. As US firms slash their IT
budgets, emerging Asia is suffering a sharp
slow down in exports and GDP growth. Risks
to Asia’s economies are also coming from low
levels of investment, and high and rising levels
of government debt.
Domestic demand is weak and governments
have less scope to boost it, compared to the
time of America’s last recession in 1990-1. A
legacy of the 1997-98 Asian financial crisis is
that many countries already have swollen
budget deficits. Asian economies, excluding
China, ran an average budget deficit last year
of almost 4 per cent of GDP compared to
1997 when their budgets were close to
balance before the financial crisis hit the
region. Monetary policy is also unlikely to be
effective especially with the region’s financial
system being fragile and banks, saddled with
too many bad loans, unwilling to provide new
lending. Most of emerging Asia’s other
economies are also set for a downturn, with
the exception of India and China.
In contrast to Asia, emerging economies in
Latin America have only modest trade links
with the US, with the notable exception of
Mexico. Where Latin American economies are
more vulnerable however, is in their need for
foreign capital. While the Asian economies
have current account surpluses, Latin
American economies all have deficits. If
international investors become more risk
averse in face of a slowdown in the US, it is
the countries with the biggest external
financing needs that would suffer most.
In Russia, the economy is expected to
slowdown from its 8 per cent growth in 2000
to about 3-4 per cent in 2001. This is mainly
due to the gradual erosion of the "devaluation
effect" from 1998. The strength of
international oil prices has been a boon for the
Russian oil and gas sector, but these sectors
are limited by capacity constraints. With
rising demand, prices rose 20 per cent in
2000 and inflation is likely to drop only
slightly in 2001.
3.2 The after-shock economy
The terrorist attacks of September 11, 2001
have thrown the global economy into a period
of heightened uncertainty. All growth
forecasts for the major economies have been
revised downward, and the US economy is
22
International environment
likely to technically move from a slowdown to
a mild "recession" (defined as two
consecutive quarters of negative growth),
lasting through the first quarter of 2002.
In the current climate of uncertainty, it is
more important to pay attention to underlying
assumptions than actual point estimates.
Forecasts that suggest a 1-1.5 per cent
annual GDP growth rate for the USA in 2001
and a mild recession are based on i) no further
terrorist attacks, ii) any military action will not
be prolonged much beyond the early months
of 2002, and iii) oil prices are kept stable by
OPEC in the $22-28 per barrel range.
The direct effects of the September 11
attacks include
i) Damage to the businesses in the area
especially financial firms, huge losses to
the insurance sector, airlines (as the fear
of flying persists, 100,000 jobs have
been cut) and as a result the tourism
industry.
ii) Disruption to financial markets and stock
market decline.
iii) Declines in consumer spending driven by a
loss in consumer confidence, a national
mourning of the victims that has not been
conducive to spending, income effects of
job losses and wealth effects from the
reduced value of stock market wealth.
The latter is of greater concern because in
spite of continuous drops in industrial
production in the early part of the year,
consumer confidence had remained high and
buoyed the economy.
However, the contraction in the economy is
expected to be ameliorated by the boost in
fiscal spending, amounting to $86 billion in
emergency, defence and airline aid packages.
The Federal Reserve is also expected to
pursue active monetary management, and is
likely to cut the Federal Fund rate further to
about 2 per cent by year-end. International
monetary authorities have been active in
calming financial markets. On the re-opening
of the New York Stock Exchange, the Federal
Reserve injected liquidity into the system and
reduced the Federal Fund interest rate by half
a percentage point to 3.0 per cent. Similar
interest rate cuts were made by the European
Central Bank (the ECB refinancing rate going
down from 3.75 per cent to 3.25 per cent)
and, to a lesser extent, central banks of many
OECD countries.
The impact of the US slowdown is likely to
have stronger global implications than during
the 1990-91 recession, deepened by the Gulf
War, for two reasons. Firstly, there are
increased linkages between economies
through trade, foreign investment and
financial markets. Secondly, Japan and the
euro area are sluggish, unlike during 1990-91.
Although world trade will weaken in the
ensuing months with depressed demand and
higher transport costs, the commitment to
multilateral free trade may have gained
strength. The USA may take a leadership
role, as it is more inclined to view trade as a
source of improving living standards in poor
countries and providing prosperity to combat
internal threats to fragile democracies or
friendly governments. This is perhaps
23

State of the Economy 2001
reflected in the signing of the Jordan-US free
trade agreement, in the aftermath of the
terrorist attack.
3.3. Implications for Sri Lanka of international developments
3.3.1 Global outturn
The recovery of the world economy helped
boost national economic performance in
2000, especially the export category of
textiles and garments, Sri Lanka's biggest
export earners. Merchandise exports grew by
19.8 per cent in 2000 after a 3.9 per cent
contraction in 1999. However, merchandise
imports also surged, by 22.4 per cent due to
the high cost of fuel imports. The impact of
the weak global outlook in 2001 and early
2002 on Sri Lanka and other economies may
be viewed through three channels - trade,
exchange rates and capital flows.
Trade - The slow down in world economic
growth, in particular the US economy is likely
to lead to a fall in demand for Sri Lankan
exports. As the US economy has boomed,
imports have recorded an average annual
increase of 12 per cent in volume, and has
been a major source of growth to economies
from Europe to Asia. But if the US economy
stalls, past experience suggests that the
import growth will fall more sharply than GDP.
Some of the economies that are most
dependent on the US are Canada and Mexico
(their exports to the US account for 33 and
21 per cent, respectively of their GDPs), and
several East Asian economies such as
Malaysia, the Philippines and Thailand (which
export 10 per cent or more of their GDPs to
the US). In contrast, in Japan and Western
Europe the share is only 3 per cent of their
GDPs, so the direct impact of a fall in exports
to the US would be modest.
Countries and regions are also likely to resort
to protectionism to cushion themselves
against a global slowdown and this would be
a blow to the future of the multilateral trading
system. Some countries are expecting to
launch a new round of trade negotiations at
the next WTO Ministerial Meeting scheduled
to take place in Doha, Qatar in November
2001 - two years after the Seattle WTO
conference failed to do so. In Seattle, the EU
and the US had strong differences over
agricultural trade and developing countries
strongly resisted calls by the EU and the US to
bring minimum labour and environmental
standards onto the WTO agenda. Since
Seattle there has been a change of countries’
attitudes, and there has been a movement
away from discussing demands to
constructive suggestions of how to move
away from the present status quo. For
example, now there is talk of no labour
sanctions in the WTO, which developing
countries suspected that developed countries
would use to impose sanctions on countries
that fell below specified labour standards.
Developing countries also want to address
concerns about the implementation of prior
international trade agreements, for example
those related to agriculture and textiles and
clothing.
The US administration under President George
Bush has been touting the benefits of freer
trade and has been talking about a process of
24

International environment
‘competitive liberalization’ where the US
pushes ahead simultaneously with bilateral,
regional and global trade talks. But the true
test of how committed the US President is for
free trade will depend on whether the US
Congress will grant him “trade promotion
authority” (TPA) – formerly called fast-track –
which allows the President to negotiate trade
agreements, leaving lawmakers the option
only of voting for or against the final result.
Fast track negotiating authority lapsed in
1994 and President Clinton failed to revive it
in 1997.
Another worrying international development is
oil prices. Oil prices have been significantly
higher than expected in 2000. Although the
price of oil fell back within the OPEC target
band of $22-$28 per barrel in 2000, prices
remain volatile in the context of military
conflict extending beyond Afghanistan.
Exchange Rates - A slow down in the US
might bring a depreciation of the dollar against
other major currencies i.e., the yen and euro.
A stronger yen and euro would further
squeeze exports from Japan and Europe. A
further sharp rise in the yen could damage
Japan’s exports and hence its fragile
economy.
Capital Flows - The third source of contagion
from the US to the rest of the world is
through stock markets. The decline in the US
stock market is likely to bring down markets
everywhere and to slow the flow of capital to
emerging economies. Emerging economies
with large current account deficits and high
debt-service burdens such as Sri Lanka and
Latin America are most vulnerable.
3.3.2 Preferential liberalization initiatives
Two major preferential trade liberalization
moves by the US and the EU from which Sri
Lanka was excluded, will have negative
consequences for the country. However, Sri
Lanka did negotiate a deal with the EU to
ameliorate the situation for its garment sector.
US-Africa/Caribbean Bill: Sri Lanka’s
competitiveness in the U.S. market has been
weakened due the preferential access given to
some of her major competitors, particularly
those in the Caribbean, Africa, and Central
America under the Trade and Development Act of 2000 which was signed into US law in
May 2000. The Africa-Caribbean Bill extends
preferential treatment to a broad range of
imports from 48 sub-Saharan African nations
and 23 Caribbean Basin countries. The main
provisions concern textiles and apparel. Under
the Bill the US provides duty-free, quota-free
benefits to apparel made in Africa, the
Caribbean and Central America from US
produced yarn and fabric. In addition, apparel
shipped from Africa and made from regional
fabric and yarn will be accorded duty- and
quota-free benefits, up to a ceiling ranging
from 1.5 per cent to 3.5 per cent of all US
apparel imports over eight years. All apparel
exports from Africa currently add up to less
than one per cent of the US import market.
Apparel made in Africa from non-regional,
non-US fabric will also be given duty-and
quota-free treatment, provided that the
exporting country’s annual per capita income
is less than US$ 1,500. In fact, to take
25

State of the Economy 2001
advantage of the quota-free access to the US
provided under the Bill, a few Sri Lanka
apparel exporters have set up factories in sub-
Saharan Africa in order to produce and export
apparel to the US.
EU's "Everything but Arms" initiative:
Similarly, the EU passed the ‘Everything but
Arms’ (EBA) initiative in February 2001 that
would eliminate quotas and duties on all
products imported by the EU, except arms
from the world’s poorest 48 countries (least
developed countries-LDCs) by the year 2009.
Duty and quota elimination for essentially all
products came into effect on March 2001 but
the full liberalization of sugar, rice and
bananas will be phased in during a transition
period. Critics argue that increased exports to
the EU from the poorest countries will
substitute exports from other non-LDCs such
as those from Sri Lanka since Sri Lanka is not
in the LDC category and therefore not a
member of the 48 countries. However, a
provision permitting “regional cumulation”
allows Sri Lanka to participate.
Regional cumulation means that any of the 48
countries can export products to the EU,
which have been imported from an ASEAN or
SAARC country. However, the following
criteria apply to this trade process:
i) The product exported to the EU must
have achieved at least 100 per cent value
added to the import value;
ii) Processing in the land-locked developing
countries (LLDCs) must exceed “minimal
operations”;
iii) The import from the LLDC to the EU must
be accompanied with adequate proof of
the originating status;
iv) Rules of regional cumulation are identical
to those laid down for General System of
Preferences (GSP);
v) Each country of a regional group must
ensure the correct issue and verification
of proofs of origin.
While regional cumulation rules do allow for
the possibility for LLDCs to import Sri Lankan
raw materials for processing and re-exporting,
the main implication for Sri Lanka is that
value-added Sri Lankan goods to the EU will
likely decrease as zero duty goods from the
LLDCs will gain a competitive advantage.
Further, the agreement creates greater
incentives for foreign investment, including
from Sri Lanka, into least developing
countries.
EU-Sri Lanka apparel Agreement: The
suspension of all quantitative restrictions
currently in place with respect to the import
of textiles and clothing from Sri Lanka by the
EU in December 2000 may mitigate some of
these adverse effects. The European Union
currently buys nearly 30 per cent of garments
manufactured in Sri Lanka. The move is
expected to boost the apparel sector. The
Agreement provides for reciprocal market
opening measures and it is the first of its kind
signed by the EU with a WTO member.
Under the new facility, the EU will suspend
the application of the quantitative restrictions
currently in force with respect to imports of
26

International environment
textiles and clothing products from Sri Lanka
by 2002 in exchange for tariff reductions by
Sri Lanka and the binding of all tariffs for the
textile and garments sector. The categories
that come under the Agreement are 6,7,8 and
21, covering men’s or boys’ woven breeches,
shorts, trousers and shirts, women’s or girls’
woven trousers, slacks, blouses and shorts,
parkas, anoraks, wind cheaters and wait
jackets. The apparel sector recorded a rapid
growth in its exports to the EU in 2000 and
as a result the sector exhausted some of its
quota categories. Consequent to the lifting of
quota restrictions on Sri Lankan exports to the
EU, companies such as Marks and Spencer,
Next, British Home Stores and Tesco are
expected to triple its sourcing from Sri Lanka
over the next 2-3 years. The suspension of
quota at this juncture places Sri Lanka in an
advantageous position as buyers can now
take a long-term view in placing orders from
Sri Lanka without the hindrance of quantity
restrictions.
3.3.3 Sri Lanka’s future in the sea
The United Nations Law of the Sea
Conference brought a new dimension to the
exploitation and the utilization of the natural
resources in the oceans. Before 1994, Sri
Lanka’s jurisdiction was confined to the land
area of about 65,000 sq. km and the Internal
Waters, Historic Waters, Territorial Sea and
the Continguous Zone comprising a sea area
of nearly 51,300 sq. km. The Law of the Sea
Convention finalized in 1982, ratified and
accepted in November 1994, brought a larger
area of the ocean under the jurisdiction of Sri
Lanka – an area called the Exclusive Economic
Zone (EEZ), also referred to as Lanka
Samudra, which comprises an area of about
437,000 sq. km (approximately 7.5 times the
land area of the country).
The large area falling within the jurisdiction of
Sri Lanka could boost the economic
development of the country as it involves the
exploitation of natural resources in and below
the sea of an area much larger than the land
area of the country. Neither the immensely
rich resources, in and around the country, nor
the potential of the unknown resources south
of Sri Lanka up to the South Pole have been
properly investigated so far. It is said that the
exploration and exploitation of the resources
within this vast area could make Sri Lanka one
of the richest countries in Asia. Possible
resources in this area include: minerals,
petroleum, gas and shale, potential for energy
generation, fishery, and levies on international
shipping using the area.
In fact, a further area could be claimed under
Article 76 of the Law of the Sea, which
allows countries extensions to the 200
nautical mile limit (370.4 km) of the EEZ. This
Extended Exclusive Economic Zone (ExdEEZ)
would increase the exercise of sovereign
rights over mineral and certain biological
resources of the seabed and the subsoil, as
well as provide some jurisdiction in matters
related to the environment and conservation.
The proposal to enlarge the EEZs of India and
Sri Lanka, by extending the continental
shelves was mooted by Sri Lanka at the Third
Sessions of the United Nations Law of the Sea
Conference over a decade ago.
Sri Lanka and India under Article 76 have
claims to seabed rights for a considerably
27

State of the Economy 2001
large area of the Indian Ocean and this
comprises an area of over 2,000,000 sq. km,
which is equivalent to about 30 times the land
area of Sri Lanka (also referred to as Pra Lanka Samudra). Currently, this area has not
been delineated for claims to be accepted by
the United Nations Commission on Limits of
Continental Shelf. Claims to Pra Lanka Samudra have to be made before 14
November 2004.
India has already undertaken a massive
exercise to mark and expand its sea boundary
by an additional one million square kilometers
(400,000 square miles) beyond its existing
economic zone. India has been working
towards completing an extensive seismic
survey before 2005 to stake its claim. India,
like Sri Lanka will have to produce seismic
data before the United Nations. Among the
Indian Ocean Rim countries India is the only
one to have taken an early initiative.
In the case of conflicting claims, Sri Lanka will
have to come to an agreement with India on
the sea boundary. India has insisted that any
expansion of its sea bed boundary posed no
threat to her neighbours such as Bangladesh,
Sri Lanka and Pakistan.
So far, Sri Lanka has set up an inter-
ministerial and a technical committee, and
secured donor assistance from NORAD to
commission a research ship. However, further
Initiatives are required and must be expedited
efficiently to secure resources which may
prove to be a significant stimulus to the
country's growth potential and ability to
reduce poverty.
28

Competition, Competition Policy and Regulation

Competition policy and regulation
4. Competition policy and regulation 4.1 Introduction
The submission of the Consumer Protection
Act (2001) to Parliament signalled an attempt
to devise an effective competitive regime in
Sri Lanka. Its subsequent dormancy,
(following the dismissal of the Trade Minister
who proposed it and the proroguing of
Parliament) provides an opportunity to focus
on issues of competition, competition policy
and elements of the proposed legislation that
need attention prior to resubmission.
What is competition? Why would we want it?
What is competition policy? These are
questions that need to be addressed briefly
prior to a detailed analysis of the legislation.
The basic theoretical premise is that perfectly
competitive markets lead to increases in
economic efficiency and enhanced economic
welfare, by providing for a greater volume and
a wider range of goods, at lower prices and
higher quality. It is this reason that drives
nations towards generating greater levels of
competition in their respective markets.
It is important to recognize that high levels of
market concentration (monopolies, oligopolies)
per se do not stifle competition. As long as
markets are contestable, such that market
entry is easy, large dominant firms will act
competitively. This is because the sheer
threat of potential entry of domestic
competitors or imports, may be sufficient to
deter profit maximization by raising prices and
cutting output. However, competition can be
reduced significantly by structural
characteristics, restrictive business practices
and government regulatory policies, such as
those listed in Box 4.1. These factors act as
barriers to entry and facilitate anti-competitive
behaviour, by giving a firm market power.2
The goal of competition policy is to preserve
and promote the competitive process (as
opposed to competitors per se) through the
prevention of restrictive business practices by
firms and through addressing inefficient
government regulations. It is defined as a set
of measures and instruments used by
governments to determine, and set the
conditions of competition within the domestic
market. It is not always popular because
although consumer welfare increases with
lower prices, it is also accompanied by lower
profits for the monopoly firms.
Competition policy broadly makes use of two
avenues:
• Competition advocacy, where competition agencies encourage different branches of governments to adjust their policies to minimize interferences via regulation, as will promote competition by domestic and foreign investors.
• Competition law, (anti-trust laws), a set of legal rules applying to commercial behaviour and transactions. Competition agencies investigate, prosecute and/or prohibit agreements that either exclude competitors or substitute collusion for competition. The object of the law is to
2 An example of a structural barrier would be if there are extremely large sunk costs of entry or the minimum efficient scale of production justifies only one player in the market. A monopoly would arise as in the case of many public utilities. An example of a restrictive business practice would be collusive pricing policies by dominant players in the market.
29

State of the Economy 2001
Box 4.1 Structural, behavioural, and regulatory barriers to entry
Structural: barriers due solely to conditions outside the control of market participants
Sunk costs – costs that a firm cannot avoid by withdrawing from the market; they are a sort of entry fee
Absolute cost advantage – access to natural resources or human resources
Economies of scale – unit cost of production falls with increasing output
Large capital requirements
Network industries – firms that are competitors share some critical facility like transportation and telecommunications
Behavioural: represent abuse of dominant position where “relatively large” firms engage in anti-
competitive conduct or restrictive business practices by preventing entry or forcing exit of competitors
through various kinds of monopolistic conduct
Excess capacity
Product differentiation and advertising
Horizontal restraints – cartels or collusion (price-fixing agreements, market sharing territorial arrangements, bid rigging), price discrimination
Vertical restraints – resale price maintenance, exclusive dealing
Foreclosure and exclusion
Tactics to increase rivals’ costs
Regulatory: barriers imposed by government policies
Speed permits, licence to operate
Regulations influencing the use of some inputs
Tariffs, quotas, and other non-tariff barriers
Anti-dumping and countervailing duties
Discriminatory export practices
Exclusionary lists
Ownership restrictions
prevent firms from protecting or expanding their market share except by means of greater efficiencies in producing goods at the lowest possible prices.
Why do we need a competition policy when
we have a liberal trade regime? It is argued
that trade liberalization by facilitating
competition from imports, nullifies the need
for an explicit domestic competition strategy.
Three reasons warrant a competition policy
even in the context of a liberal trade regime
creating the need for a trade-competition
interface.
Trade liberalization initiatives have competitive effects in the tradeable sector of the economy, but do not apply to the non-tradeable sector such as telecommunications, and other utilities.
30

Competition policy and regulation
"Natural" trade protection- some tradeable industries like cement by their high-weight-to-value nature and high transportation costs get a "natural" protection from imports.
"Unnatural trade protection" - liberal trade regimes are also affected by political economy considerations and are rarely without some protectionist policies.
International organizations such as APEC (at
its meeting in 1995) and the WTO (at the
1996 Singapore meeting), have called for the
establishment of a working group on
competition policy. In addition, multilateral
and regional trade agreements have also
incorporated competition policy into their
negotiating agenda, as in the case of the
European Union/Africa Caribbean Pacific group
(EU/ACP) and the Free Trade Area of the
Americas (FTAA). Noticeably, the South
Asian regional body, SAARC has not
addressed issues of competition regimes.
The rest of this section looks briefly at
competition policy from a developing country
perspective and the development of the
competitive regime in Sri Lanka. It then
explicitly analyses the issues facing the
current competition policy legislation, arguing
that the proposed Consumer Protection Act
(2001) (henceforth the CPA) fails to redress
the weaknesses of the existing competition
regime, both legal and institutional, and
creates new problematic issues affecting the
future competition regime.
4.2. Competition policy in the Sri Lankan context: a developing country perspective
Although competition policy has been
endorsed as a method of enhancing economic
efficiency and consumer welfare by developed
nations, the incorporation of this policy within
a national development agenda by developing
nations has not been swift. In fact, many
developing countries have tended to adopt
price controls and restrictions on market
entry, as policies promoting economic welfare,
which are counter to the very basic premise of
competition theory.
Experiences with competition policy vary
since there is no consensus as to what
constitutes an "optimal" competition policy
for a given nation. For example, Malaysia
does not have a competition law, but is
currently drafting such an Act. However,
competition is emphasized in the ongoing
Malaysian privatization and de-regulation
process. The Philippines on the other hand,
has a long history of anti-monopoly laws.
However, there is no central agency to
oversee the implementation of competition
laws. There is a tendency among many
emerging economies, to emulate the US or the
UK competition regimes as benchmark laws
and policies, without paying attention to the
endemic features of the domestic policy
regime.
In the Sri Lankan context, developments in
trade policy and privatization need to be
considered. Sri Lanka currently benefits from
the pro-competitive benefits of the trade
liberalization process launched in 1977, and
31
State of the Economy 2001
has in place a fairly liberal trade and
investment regime.
However, the privatization process is
sometimes at odds with competition. The
main objective of the government privatization
initiative has been revenue generation, rather
than economic efficiency and consumer
welfare. Hence, a conflict arises because the
sale value of state enterprises is likely to be
much higher when associated with future
monopoly power.
Thus, while the government acknowledges
that competition in the long term is a central
part of the privatization process that has
created monopolies in LP gas (see case
study), flour, lubricants etc., there is no
mechanism, either by way of incentives,
regulation or contract to ensure greater
competition in recently privatized industries.
It is essential to have such a mechanism
because though private ownership promotes
administrative and financial discipline, it is
competition and rivalry among firms that
promote lower prices.
At present the Sri Lankan competition regime
consists only of a legal and an institutional
framework promoting the objectives of
competition in the domestic economy. The
boundaries of acceptable market behaviour
were detailed by the passing of the Fair
Trading Commission Act (1987) (henceforth
the FTCA). However, the mere presence of a
regime on market behaviour and consumer
interests alone is insufficient. Sri Lanka needs
to make inroads towards transforming the
existing competitive regime into an effective
competitive regime, via effective enforcement
and monitoring mechanisms, capable of
delivering the goals and objectives of the
competition law.
4.3 The competition regime in Sri Lanka:
a comparison of the old and the new
The most recent and indeed the most
substantial step in competition policy
undertaken thus far by Sri Lankan
policymakers, has been the attempt to
introduce a new competition Act, the
Consumer Protection Act (2001). The CPA is
an amalgamation of the Fair Trading
Commission Act (1987) and the Consumer
Protection Act (1979).
The substantive law with respect to fair
trading issues under Part III of the CPA is very
much an unchanged version of Part III of the
FTCA. Trade practices or anti-trust laws of
the FTCA regulating firms in the Sri Lankan
economy are limited to Sections 12, 13 and
14 of Part III which relate to monopolies,
mergers and acquisitions, and anti-competitive
conduct respectively. Under Part III of the
CPA, the corresponding sections are Sections
33, 34 and 35 respectively. (Financial
institutions are governed by the Banking Act
No. 30 (1988), and by virtue of Section 82A
of this Act, the Banking Act prevails over
other laws).
The objective of the FTCA was to establish
the "Fair Trading Commission for the control
of monopolies, mergers and anti-competitive
practices…….". The FTCA is unclear as to
the exact scope of its operation, but by virtue
of Section 11, the FTC has powers to
32

Competition policy and regulation
investigate complaints with respect to
Sections 12-14. The legality of Sections 12-
14 is based on the "public interest test" --
Section 15(1)(a) of the FTCA.
The composition of the law is such that the
process takes the following steps:
Step 1: Investigation and ruling on Sections 12-14 Determination, upon conclusion of an investigation, whether the presence of elements of monopoly, mergers or anti-competitive conduct is satisfied [if not, case closed]. If satisfied, proceed to Step 2. Step 2: Public interest test investigation. The FTC proceeds to consider whether the monopoly, merger or anti-competitive conduct is contrary to the "pubic interest" as per section 15(1)(a) of the FTCA. This common public interest test demarcating the legality of trade practices is very broad, and the FTC has the power to take into account "all matters that appear to be relevant" in determining the impact on the public interest. Special consideration is given to consumer and producer issues, maintaining, and promoting a balanced distribution of industrial activity, promoting "effective" competition in the domestic market as well as the export markets.
Step 3: Public interest test ruling. If the FTC holds that the alleged action under Sections 12-14 is contrary to the "public interest"- proceed to the remedial stage. [If the alleged action under Sections 12-14 is not contrary to the "public interest", then the FTC has the power to authorize the transaction]. Step 4: Remedial stage. This is governed by Section 15(1)(c) of the FTCA. Remedies include the division of any business by sale of any part of the undertaking, the appointment of a person to conduct such activities on terms specified by the FTC, termination of any anti-competitive practice and "any other action that the FTC may consider necessary".
Under the proposed new Bill, the CPA, the
apex body of the new competition regime is
the three member Consumer Protection
Council, (henceforth known as the Council),
supported by the nine-member Consumer
Protection Authority (henceforth known as the
Authority).3
The public interest test lies within the realm
of the Council, and public interest criteria
under Section 41(2) of the CPA are fairly
FTCA(1S11111NFT
Note:
Keeping track…. 987) Part III ection
CPA(2001) Part III Section
2 Law with respect to monopolies 33 3 Law with respect to mergers and acquisitions 34 4 Law with respect to anti-competitive behaviour 35 5(1) (a) Public interest test 41(2) 5(1) (c) Remedial procedures 41(2) (c) one Interim orders 17(4) C* Institutions Council*, Authority*
FTCA - Fair Trading Commission Act (1987); CPA - Consumer Protection Act (2001); FTC - Fair Trading Commission; Council - Consumer Protection Council; Authority - Consumer Protection Authority.
33
3 These two institutions would take over the responsibilities of the FTC (as specified in the FTCA) and the Department of Internal Trade (as specified in the Consumer Protection Act of 1973).
State of the Economy 2001
similar to those under Section 15(1)(a) of the
FTCA. However, the CPA test is preferred as
it does not require the Council to have special
regard to maintaining a balanced distribution
of industrial activity and promotion of
competitive activity in the export markets,4
which are not the core objectives of
competition.
The Authority is predominantly an
investigative body determining the elements
of Sections 33-35; it refers the determination
of the "public interest" criterion to the
Council. The Authority comprises of persons
with "wide experience and recognized
qualifications" in the areas of industry, law,
economics, commerce, administration, and
science or health as per Section 3(1) of the
CPA, which is well suited to its investigative
role. However, given that the public interest
test must be executed in accordance with
legal and economic principles, the role of the
Council would have been better served if it
comprised of a panel of commercial
lawyers/judges as opposed to another multi-
disciplined panel.5
The separation of duties between the
Authority and a Council is an attempt to
streamline and expedite the activities of the
competition regime. However, the potential
for delays in the decision making process and
the possibility of duplication of tasks between
the Authority and the Council is significant,
since the Council has to take into "account all
matters that, are relevant," when determining
whether the monopoly, merger or anti-
competitive conduct, is contrary to the public
interest. Further, it is not clear from Section
37 of the CPA, whether the Authority has the
capacity to make any recommendations to
the Council with regard to matters or
transactions under Sections 33-35.
4 Sections 15(a)(iv) and 15(a)(v) of the FTCA respectively. 5 The Council comprises of an Attorney at law, with "wide experience" in commercial law, a person with "wide experience" in the management of business enterprise, and an economist with "wide experience" in trade practices and consumer affairs as per Section 39(2) of the CPA. There is no guidance as to the exact meaning of " wide experience."
Penalties enforceable under Section 15(1)(c)(i)
are extensive, but these broad powers are
curtailed by the inability of the FTC to make
interim, or provisional orders, which bind a
party to the decisions of the FTC, for alleged
violations of Sections 12-14 of the FTCA.
Thus, the powers of the FTC are rendered
ineffective. Under the proposed CPA, the
penalty provisions, within the ambit of the
Council, are ostensibly enhanced because the
Council has the power to take whatever
action is "necessary" to remedy or prevent
adverse effects of merger, monopoly or anti-
competitive actions. However, the continued
lack of interim orders, effectively diminishes
the remedial power of the Council provided
under Section 41(2)(c).6
4.4 Competition policy in practice-the
FTC at work 1995-2000
Given that the new CPA relies heavily on the
FTCA, it is important to analyze the
performance of the FTC, as the effectiveness
of the FTC partly reflects on the effectiveness
of the FTCA.
6 However, interim orders are allowed by the Authority under section 17(4) of the CPA, only with respect to price controls.
34

Competition policy and regulation
Section 12 - monopoly power - 3 investigations • Ceylon Grain Elevators Limited (Prima)
monopoly position investigated.
Case initiated 1995; completed 1999. However, it is pending a response by Prima on a number of clarifying issues as of 2000.
• Monopoly granted to Air Lanka relating to the ground handling charges at Bandaranaike International Airport -- complaint made by M/s Sky Cabs (Pvt) Ltd.
Case initiated 1997; decision 1998. It was ruled that the case was beyond the purview of Section 12 of the FTCA, for it was not a service that was prescribed under gazette.
• A complaint by W. M Mendis and Company (Pvt) Ltd., on the possible existence of a monopoly/anti-competitive practice with respect to supply/ distribution of spirits/liquor. Case initiated 1996; still pending as of 2000.
Section 13 - mergers and acquisitions – 5 Investigations
Three mergers were authorized as of 2000,7
on the grounds that they were not contrary to
the public interest as per Section 15(1)(a) of
the FTCA, one case is still pending and the
other was deemed out of the purview of the
FTC. • Nestle Lanka Ltd. and Ceylon Nutritional
Food Ltd. (1995); Approved.
• Swadeshi Industrial Works Ltd. and Unilever Ltd. (1995); (Latter actually only purchased 2 per cent of shares of the former); Approved.
7 By virtue of Section 9A all mergers/acquisitions which may trigger Section 13 of the FTC must be notified in writing to the FTC.
• Kelani Tyres Ltd. Associated Ceat (Pvt) Ltd. and Ceat India Limited (1998); Approved.
• ACL acquisition of a 100 per cent stake on Lanka Olex Ltd. (a major shareholder of Kelani Cables Ltd.) (2000); still pending investigations.
• The acquisition of shares of Sampath Bank by Hatton National Bank (2000).
Deemed not within the jurisdiction of the
FTCA by virtue of Section 82A of the Banking
Act (1988). The Central Bank approved the
14 per cent acquisition in Sampath Bank
shares by Smart Development (Pvt) Ltd, a
subsidiary of Hatton National Bank despite the
Banking Act prohibiting any entity from
acquiring more than 10 per cent without the
approval of the Monetary Board and the
Finance Minister.
Section 14 -anti-competitive behaviour- 20
investigations
• Held to be anti competitive according to
Section 14 - 1 case
• Authorization of activity as not being anti
competitive - 1 case
• Recommendations made and cases that
were settled - 4 cases
• Lack of jurisdiction and referral to another
jurisdiction - 3 cases
• Not pursued as a result of lack of interim
orders - 1 case
• Investigations pending - 4 cases
• Commenced investigation - 2 cases
The recent inactivity of the FTC is reflected in
their under-utilization of funds. In 1998, the
total amount allocated to the FTC was
SLRs.6.4 million out of which SLRs 6.29
35

State of the Economy 2001
million was used. In 1999, SLRs 8 million
was allocated and the expenditure incurred
was only SLRs. 2.5 million.8
4.5 Limitations of the new legislation
The overview of the competition regime and
the parallel provisions under the CPA
presented above, do not highlight the
weakness of the substantive law and the
institutional weaknesses that have troubled
the FTC. The CPA has absorbed most of these
weaknesses and has introduced additional
issues that render the future competition
regime ineffective, and incapable of delivering
the objective of economic efficiency and
greater consumer welfare. Some of the
limitations of the existing regime, both
substantive and institutional are highlighted
below.
4.5.1. Limitations of the substantive law of the FTCA/CPA
Before explicitly considering Sections 12-14
(Sections 33-55), it is important to note that
the absence of cross-border applications of
the law, such that the domestic laws have no
extra territorial applications, has not been
addressed in the new Bill. Further, the lack
of guidelines interpreting the elements of the
public interest test is a limitation of the law,
which is heightened by the lack of case law.
Section 12 of the FTCA (equivalent to section 33 of the CPA)
• The five specific instances under which a monopoly is held to exist for the purposes of the FTCA are not linked to market power, but to the "prescribed percentage"
of a good or service within the market. The Minister of Internal and International Trade, Food and Commerce, (henceforth the Minister of IICF) determines whether a good is to be prescribed under gazette, upon the recommendation of the FTC.9
8 The FTC Annual Report 1999.
• The prescribed percentage itself is an arbitrary cut off point set by the Minister of IICF, which varies between 40-50 per cent. Thus, the law with respect to monopolies depends on the activism of the Minister and the FTC. For example, if the good is not prescribed under gazette, but one firm occupies 40- 50 per cent of the market share for that particular good, Section 12 does not apply by virtue of the lack of the "prescribed percentage" element. The shortcoming of the prescribed percentage has not been addressed in the CPA.
• The main element of Section12 should be the "abuse of market power " by the monopoly or a firm with monopoly power. Such a test, is applied in Section 46 of the Australian Trade Practices Law (Cth) (1974), and it places the onus on firms with market power to adhere to the objectives of competition, preventing any party with substantial degree of market power from taking advantage of such power.
Section 13(1)(a)(b) (equivalent to Section 34 (1)(a) and (b) of the CPA)
• The main elements of Section 13 is whether the proposed merger is likely to result in the acquirer being in a position "to control or dominate" a market for goods and services. Despite the emphasis placed on the elements of control and
9 The FTC takes into account the potential to eliminate or substantially damage a competitor, prevent entry, and deter competitive conduct in the market in making a recommendation on prescribing a good or service.
36

Competition policy and regulation
dominance, it is the public interest test that delimits the legality of the merger or proposed merger.
• The law on mergers/acquisitions is not flexible or sensitive to capture monopolistic behaviour arising from subsequent mergers and acquisitions. Section 13 allows for a position of control or dominance, but does not automatically trigger the application of Section 12, the monopoly provision, as a result of the prescribed percentage test in the latter.
• There are no guidelines that detail the meaning of the phrase "position to control and dominate."
• The FTCA/CPA is silent on the legal avenues open to the target company in the midst of a hostile take-over.
Section 14 of the FTCA (equivalent to Section 35 of the CPA).
The provision attempts to capture "conduct
which is or likely to have the effect of
restricting, distorting or preventing
competition". Section 14, a "catch all"
provision needs to be satisfied together with
the public interest test, Section 15(1)(a), for
the FTC to consider a remedy for the alleged
action. This section is an attempt to absorb all
potential violations under anti trust law which
are not monopolies or mergers and
acquisitions.
• Section 14 introduces flexibility to the enforcers of the law, but is too general to capture the nuances of strategic market behaviour which can be potentially anti-competitive. Lack of demarcation of the different types of anti-competitive conduct, each worthy of a different degree of culpability is a serious limitation of the competition law. For example, collusive
pricing, exclusive dealing, unconscionable conduct, price fixing as well as predatory pricing are anti-competitive conduct for the purpose of Section 14 of the FTCA.
• The lack of interim orders limits the scope of the FTC in addressing matters with respect to anti-competitive conduct.
4.5.2 Institutional limitations
The FTC was established by the FTCA No. 1
of 1987, and came into operation on the 1st
of August 1987. The objective of the FTC is
“the control of monopolies, mergers and anti-
competitive practices, and the formulation
and implementation of a national price policy;
…………….. " The overriding objective of an
investigation by the FTC is to have special
regard to the promotion of "effective
competition," promoting the interests of
consumers, and reduction of prices. The
amalgamation of the FTCA and the Consumer
Protection Act (1979), resulting in the CPA
has not remedied the existing institutional
weaknesses in the FTCA, which will thus,
continue to undermine the new regime. Some
of the institutional weaknesses of the old
regime are highlighted below:
Administrative
• Independence of the FTC is not assured due to the presence of political influence. Appointments to the FTC are under ministerial direction. For example, under provision 3 of the Schedule to the FTCA, the Minister of IICF has the power to remove any member of the FTC, by order published in the Gazette, without assigning
37

State of the Economy 2001
any reason thereof.10 This decision of the Minister does not have to be justifiable in a court of law. Further, provision 12 of the Schedule empowers the Minister to terminate an appointment of the Chairman of the FTC without giving any reasons thereof.
• Uncompetitive remuneration packages have led to a lack of appropriately qualified staff. Full time and part time members of the FTC are placed on a wage structure that corresponds with that of government officials, while the salaries of the professionals, and supporting staff are lower than the government scale, which are clearly much lower than the private sector. As a result, although the approved cadre of the FTC is 27 persons, only 13 positions have been occupied over the past four years. According to the Annual Reports of the FTC, the post of Legal Officer has been vacant from 1996 until 2000, while the post of Senior Economist was vacant from 1996-1999.
• The new Bill fails to redress the low priority to human resource management and staff recruitment, within the FTC. These have not been addressed and thus, issues with respect to attracting skilled staff will continue to influence the workings of the Council and the Authority, in the new competition regime.
Investigative
• Though the main aim of a FTC investigation is to maintain effective
competition, there are no guidelines within the FTCA on the exact meaning of “effective competition.”
10 This has been remedied to some extent in the new CPA. The power of appointments to the Council and the Authority are maintained within the realm of the Minister of IICF. Though the Minister is only empowered to remove members including the Chairman of the Authority under certain instances that are specified under Section 3 of Schedule 3(3) to the CPA, the decision of the Minister is not justifiable in any other court of law.
• Although by virtue of Section 11 of the FTCA, the FTC has the power to initiate investigations, it rarely uses this avenue. The weak supervisory role may be attributed primarily to the lack of access to accurate market information and the lack of skilled staff to initiate and pursue investigations.
• Delays are inherent in the decision making process of the FTC, as in the complaint made by W. M Mendis and Co in 1996, which is still pending a decision by the FTC in year 2000.
4.5.3. Limitations specific to the CPA
The shortcomings of the CPA are broadly twofold. Firstly, it has not addressed the existing shortcomings of the FTCA (as detailed above), and secondly, the CPA has introduced Sections 50 and 81, which effectively creates an uneven playing field and is thus contrary to the basic premise of competition. Despite several rounds of amendments to the proposed Bill, Sections 50 and 81 of the CPA have not been addressed. The main reason for the presence of these two clauses in the CPA is the privatization initiative of the government. The role of the consumer lobby and the consumer advocacy movement within this framework has also been minimal. Section 50 of the CPA
• Section 50(a) of the CPA exempts all public sector monopolies such as the Ceylon Petroleum Corporation (CPC), the Ceylon Wholesale Establishment (CWE) etc, from the purview of Part III of the CPA. Section 50(a) is a continuation of the protection granted to public sector monopolies under the FTCA. The rationale
38
Competition policy and regulation
for Section 50(a) is based on national security reasons as in the case of the CPC, and the government welfare policies as in the case of the CWE. However, given the important role that these institutions play in the economy, it is essential that these public sector monopolies also be regulated, via efficiency audits to ensure that efficiencies of economies of scale are realized.
• Section 50(b) extends exemption to any “institution or body that has been granted the exclusive right to supply such goods or services…” This section of the law is an attempt to accommodate the privatization initiatives of the government. Thus privatization initiatives, such as the Shell Gas Lanka, Lanka Lubricants and Prima, granting exclusive rights to operate in the local market are exempt from the purview of Part III of the CPA.
• Section 50(c) of the CPA, provides a concession to person(s) with whom government transactions do not involve an exclusive right, but involves the granting of a monopoly in the “interest of the national economy”. Though the concession is granted for a period of three years, it creates a situation where the first-mover advantage accrues to the established firm, which may restrict or prevent future competition in that particular market e.g., the Shell privatization initiative (see case study 1).
Section 81 of the CPA
• Section 81 of the CPA states that the provision of monopolies, mergers and anti-competitive conduct (that is Part III of the CPA) will not apply to persons who supply goods and services, under agreement entered into with the government. (government sponsored agreements). This provides added protection to government-
sanctioned agreements, (as long as the agreement is in force at the commencement of the Bill) for the full duration of the said agreement, beyond any exclusivity period. For example, the Shell privatization agreement was granted for 30 years with an exclusive monopoly period of five years, from the beginning of December 1995 to the end of December 2000. Section 81 of the CPA in its present interpretation exempts Shell from the purview of a competition authority, for the remaining 25 years of its contract. It therefore sustains monopolistic behaviour in a market as opposed to preventing it, thus running contrary to the basic principles of competition theory.
• For those government agreements that are not in force at the time of the commencement of the CPA, Section 50 provides exemptions from Part III of the CPA, either under Sections 50(b) or 50(c).
4.6 Conclusions
Competition policy remains nascent in Sri
Lanka. Though the issue of competition has
been dealt with extensively among developed
nations, developing nations such as Sri Lanka
need to consider this issue to complement
broader economic liberalization.
The use of regulation in the form of anti trust
laws do involve significant costs. However a
lack of a regulatory regime to ensure that
firms adhere to the basic rules of competition
law may lead to reduced social welfare. The
laws regulating competition must be drafted in
such a manner, which compensates for the
constraints on activities targeted by
regulation, and produce better outcomes for
society as a whole. In doing so, there is a
39

State of the Economy 2001
need to recognize the inverse relationship
between compliance and the regulation, that
is the more comprehensive the regulation and
the regulatory burden on the market
participant, the lower the level of actual
compliance.
The new Sri Lankan initiatives in competition
policy are important, but the new regime
suffers from the fact that it has been
fashioned around the existing ineffective
competition regime. Further, it has had to
accommodate the government’s priorities on
privatization at the expense of promoting
competition and increasing social welfare with
the focus falling predominantly on the basic
elements of competition policy, that is the
competition law and the competition
authority. Policymakers have attempted to
fashion the proposed new competition regime
around the existing policies promoted by the
GOSL, resulting in an ineffective competition
regime.
Anti- dumping duties, co
Sri Lanka has completed the preliminary draft o
it is an opportune moment to develop these
competition regime.
What are they?
Anti-dumping duties (AD) are taxes on impor
Dumping is defined as a practice whereby t
commerce of another country at less than the
a product at a price lower than the price it n
(price) “dumping” the product in the importing
cost in an export market. Anti-dumping dutie
which the export price is lower compared to th
dumping causes “material injury” to the domest
Countervailing duties (CVD) on imports are tax
foreign governments for goods exported to
competing firms. Subsidies cause the price of
the extent of the subsidy (subsidy margin)
manufacturers is established, a countervailing d
40
Box 4.2 untervailing duties and competition
f the Anti-Dumping and Countervailing Duties Bill, and thus
policies to be consistent with the goals of an effective
ts that are considered "dumped" into the home market.
he “the products of one country are introduced to the
normal value of the products”. Thus, if a company exports
ormally charges in its own home market, it is said to be
country. Alternatively, "cost" dumping is selling below
s are allowed only, if i) a dumping margin (the extent to
e exporter’s home market price) is established, and ii) if the
ic industry.
es assessed to counter the effects of subsidies provided by
Sri Lanka, which may cause injury to the local import-
such merchandise to become artificially low. Thus, once
is calculated, and injury or potential injury to domestic
uty may be imposed.
Competition policy and regulation
How do they relate to competition?
Both AD and CVD cases are considered "less than fair value" cases, and in this sense they aim to
remedy "unfair" competition and are not technically "anti-competitive behaviour". However, the
origins of anti-dumping duties lay in attempts to prevent anti-competitive predatory pricing, which is
temporary price discrimination by foreigners to eliminate domestic competition.
Traditional competition policy focuses on actions taken in the domestic market commonly by domestic
firms, but it is important to address actions taken by foreign-based entities, which have anti-competitive
effects in the domestic market. Thus, AD and CVD policies are closely related to, if not a part of,
competition policy. The spread of anti-dumping duties
The use of anti-dumping duties has spread significantly over the last few years. Over 50 WTO
members have adopted anti-dumping legislation, and more than half of these have initiated AD
proceedings. While the traditional users (Australia, Canada, the EU and the USA) continue in its use,
developing countries such as South Africa, India, Brazil and Mexico have also become heavy users. Although designed to promote fair trade, AD and CVD legislation have been used by industrialized
countries as the protectionist instrument of choice to restrict market access. This is mainly because
multilateral trade negotiations have reduced the scope for raising tariff barriers and resorting to other
instruments like safeguards call for compensation to trading partners. In fact, not only the imposition of
anti-dumping duties but also the mere initiation of the process has been found to restrict imports. Many
developing countries have been subjected to repeated anti-dumping investigations of the same product
after the successful fight of an initial high-cost investigation. This "harassment" effect has had a
significant dampening impact on trade.
As with most protectionist policies, consumers in the home market lose by paying higher prices, while
manufacturers gain.
For a developing country like Sri Lanka, having AD-CVD legislation may not be immediately useful due
to the high technical and financial costs generally involved in initiating an investigation. However, as Sri
Lanka pursues further trade liberalization with free trade agreements, it is important to have this
instrument if the need arises to deal with unfair competition. With this in mind, the Sri Lankan
legislation must strive to simplify the national procedures. Foreign aid should also be sought to defray
costs for small and medium enterprises facing unfair competition, but unable to launch anti-dumping
legislation. At the multilateral level, the country needs to support efforts to review and simplify the
procedures of the WTO Agreement on anti-dumping at the upcoming WTO ministerial meeting in Doha,
Qatar in November 2001.
41

State of the Economy 2001
4A. Case study I Privatization of Colombo gas company and competition in the LPG sector
Prior to 1995 one firm, the Colombo Gas
Company, (henceforth the CGC) dominated
the market for Liquefied Petroleum Gas
(henceforth LPG) in Sri Lanka. The entry of
Shell Overseas International B V/Royal Dutch
(henceforth Shell) into the local market in
1995, transferred ownership of the CGC from
the government of Sri Lanka (henceforth the
GOSL), to the large Dutch multinational
company. The thirty- year privatization
contract involved an initial five year period,
during which the private company would
enjoy monopoly status in the industry.
Despite its 123-year history, the CGC failed to
achieve economies of scale. The solution to
the rapidly rising demand for LPG prior to
1995, was met by incremental increases in
capacity, which did not take into account the
future growth of this industry. The domestic
production of LPG by the Ceylon Petroleum
Corporation (henceforth CPC) was
supplemented by LPG imports, which were
stored in Orugodawatte and Mabima. In
1995, the total storage capacity of the CGC
was approximately 1680MT. The damage and
the destruction caused to the Orugodawatte
storage unit and the subsequent
decommissioning of the plant in 1995,
resulted in a capacity crisis in the local LPG
markets, which expedited the privatization of
the CGC in November 1995.
Thus, after a competitive bidding process, the
GOSL accepted an offer by Shell to purchase
a parcel of shares of CGC. The limited
capacity at the CGC made it essential that any
reform in this industry include investment that
would resolve the capacity constraint, and
realize the long-term benefits of economies of
scale and lower long run costs. Thus, one of
the contractual conditions was that the
privatized firm would construct a storage
capacity of 4000MT at the minimum.
Five and a half years since the Shell
investment, one firm- Shell Gas Lanka Ltd.
(henceforth SGLL) - dominates all three
market segments of importation, storage and
distribution of LPG. The CPC supplies 10 per
cent of the market.
Results of the privatization
The change in ownership of CGC has brought
mixed results.
• Revenue generation - The government received US$ 37 million for a 51 per cent stake of CGC.
• Demand - SGLL has been successful in meeting rising demand.
• Price - The price of LPG has risen by over 100 per cent since privatization. After a series of price increases, including a 28 per cent price rise in June 2000 (traced by Figure 4.A.1), the most visible effect in this market has been the vulnerability of the consumer to the presence of a single firm within a small market. It is the rapidly escalating price of LPG, which has provided the impetus for policy makers to focus on promoting greater competition in this particular market.
• Competition - Six months after the liberalization of the LPG sector in January 2001, the GOSL's aim to introduce competition in the importation, storage and
42

Competition policy and regulation
distribution segments of the LPG market has been unsuccessful thus far, with very little optimism regarding the entry of potential competitors. Though a number of firms have approached the local market, there are little signs of a firm commitment to this market by an additional party.
As of April 2001, Caltex Ceylon, Laugfs Lanka and Mundogas of Brazil, in addition to Petronas of Malaysia have approached the CPC for a proposed joint venture initiative. The Board of Investment of Sri Lanka approved the former three firms to compete in the liberalized LPG market.11
There has been little or no progress in making these initiatives a reality. Negotiations between Laugfs Lanka Ltd with the CPC have encountered government resistance. It is interesting to note that the entrants are not conducting negotiations with the aim of accessing the excess storage capacity of the incumbent SGLL, but are instead focusing on the smaller player in the LPG market, the CPC.
Reasons for the failure to promote competition • Excess storage capacity
The issue at the very heart of promoting the greater participation in this market is the monopoly power wielded by Shell due to the ownership of the storage terminal by Shell Terminal Lanka Limited (STLL), a fully owned subsidiary of Shell. (In November 1996 the government turned down the option to invest towards 49 per cent of STLL). Competition by other firms is discouraged because the storage terminal is costly and wasteful to duplicate for a relatively small market, and STLL has little incentive to rent the excess capacity.
The 8000MT capacity of the terminal in Kerawalapitiya is twice the minimum capacity agreed upon by the parties to the contract, but is said to have been built to meet requirements based on growth forecasts over the next 15 years. The cost of the terminal, borne completely by STLL,
Figure 4A.1 Price variation of LPG – 1991-2000
Source: Central Bank Annual Reports 1991-2000.
11 The Mundogas investment amounts to SLRs. 650 million (US$7.9 million), Caltex investment SLRs. 670 million (US$ 8.1 million) and the Laugfs investment is SLRs. 725 million (US$ 8.8 million).
43
0
5
10
15
20
25
30
35
40
45
1991 1992 1993 1994 1995 1996 1997 1998 1999 2000
Price of LPG
19.2
40.2
SL Rs./kg

State of the Economy 2001
was SLRs.5500 million (US$85 million), and thus it appears unlikely that SGLL will pursue policies (i.e., rent out some excess capacity) that increase competition in the market and reduce its profits.
• Established distribution network
The presence of an established distributive network is an advantage derived from the earlier " five year exclusivity period" that continues into the liberalized market, and proves a substantial obstacle to real and sustained competition.
• Lack of a regulator
From the onset, the official market observer, the Fair Trading Commission (FTC), was excluded from the regulatory realm. The regulatory duty during the first five years of operation was vested in the Department of Internal Trade (DIT), whose jurisdiction focuses on prices and excludes competition issues. The activity of the DIT in the pre-liberalized LPG market was minimal, because the privatization contract allowed for market-driven price movements of LPG. Thus, in the aftermath of liberalization in 2001, the market for LPG is effectively an un-regulated market.
It is doubtful whether the proposed regulatory regime will succeed in promoting competition in this market, given the shortcomings of the Consumer Protection Act (CPA) (2001). Essentially, the CPA in its current form creates an "exclusive period" devoid of regulation, equivalent to the life of any future privatization contract. The CPA will thus effectively exempt any anti-trust laws from applying to existing privatization initiatives by virtue of section 81 of the CPA (see section 4.5.3). Future monopolies are also exempt from the ambit of the CPA for the initial three-year period by virtue of section 50 of the Bill. The practical application of
these amendments creates a fundamentally flawed new competition regime. Curtailing the powers of the Council and the Authority, via such exemptions impedes the credibility of the legal regime designed to uphold the law regulating market behaviour in an economy.
An important component of any form of policy
aimed at promoting effective competition in all
segments of a network industry such as the
LPG, is an effective regulatory environment
guaranteeing all competitors and potential
competitors, access to facilities that are too
costly to duplicate. The failure to do so tends
to increase the costs associated with losses in
economic efficiency. It is essential to provide
an incentive structure to promote competition
in the LPG sector, especially in an instance
where the incumbent firm maintains
ownership of a bottleneck facility. Within the
Sri Lankan context the issues are compounded
by the absence of an unbiased regulator who
considers the interests of the potential
entrants, the consumers as well as the
incumbent's behaviour within the LPG market.
44

Competition policy and regulation
4B. Case study II TRIPS, competition and the pharmaceutical industry
Introduction
There is an inherent tension between
competition policy and intellectual property
rights (IPRs) since IPRs effectively grant
temporary market power to inventors. IPRs
provide exclusive rights within a designated
market to produce and sell a product, process,
service or technology that results from some
form of intellectual creation and meets
specific requirements. These inventions may
be protected by patents (for novel, inventive
products and technologies with industrial
applicability), copyrights (for artistic and
literary expression), trademarks (for identifying
names and marks conveying some guarantee
of quality), trade secrets (for confidential
business information), or sui generis forms of
protection (for new plant varieties, integrated
circuits and other technologies).
They exist to solve the fundamental problem
arising from investment in information, which
is a non-rival and often non-excludable public
good. Without some exclusive rights to
exploit the developed information, inventors
might not have sufficient incentives to justify
the investment in research and product
development, which is crucial for economic
growth. Strengthening an IPR regime is
expected to bring about a positive impact
among developing countries through greater
local innovation, and additional FDI and high
quality technology transfer. However, it could
also precipitate certain negative effects,
including higher prices for protected
technologies and products, and restricted
abilities to achieve diffusion through product
imitation or copying .
However, structured properly, the two
regulatory systems can complement each
other in striking an appropriate balance
between needs for innovation, technology
transfer, information dissemination and social
welfare. The interface between competition
policy and IPRs has two dimensions:
• Although IPRs create market power by limiting static competition, they do promote investments in dynamic competition.
• Competition regulation is important in curbing excesses of market power beyond those stipulated under the IPRs.
Intellectual property legislation took on a
global perspective following the conclusion of
the Uruguay Round of multilateral trade
negotiations, via the Trade Related-Aspects
of Intellectual Property Rights (TRIPS)
Agreement. The provisions of TRIPs became
applicable to WTO member countries by the
beginning of 1996, and requires the
substantial strengthening of the protection
and enforcement of IPRs, expanding to what
constitutes intellectual property and where it
is applied.
One of the most significant developments of
TRIPS is the inclusion of pharmaceutical
products and processes within the patent
system, since at the start of the Uruguay
Round in 1986, over 50 nations did not grant
protection to pharmaceutical products under
their respective national patent laws. The
argument in favour of pharmaceutical patents
45

State of the Economy 2001
is that without a system that allows the
recovery of the high cost of the risky
investments in drug development, many drugs
including anti-AIDS drugs would not exist
today. Government regulators require that all
potential new drugs undergo intensive clinical
testing before approval for sale is granted, and
these clinical trials cost $100-300 million per
drug, with only a minority of drugs ever
entering the consumer market.
The impact of TRIPS on the pharmaceutical
industry -in particular the likely adverse price
increases in developing countries - is an
extremely sensitive issue as it strikes at the
heart of governments' efforts to provide
affordable access to essential medicines for
the nation's poor through the production and
sale of generics.12 For example, the absence
of patent protection in Thailand and India has
allowed the development of cheaper anti-
AIDS drugs for their people. Although the
patented anti-retroviral to combat AIDS/HIV
disease costs US$5,000 to keep an AIDS
patient alive for one year, a recently launched
generic drug in Thailand sells for less than a
fifth of the price of the branded version, and
several Indian companies have launched their
AIDS drugs at much lower prices- the
cheapest, Zidovudine launched by Cipla Ltd.,
costs less than US$5 a packet of 10 capsules.
12 A “generic” drug is one that does not have a trademark. For example, “paracetamol” is a chemical ingredient that is found in many brand name painkillers and is often sold as a (generic) medicine in its own right, without a brand name. This is “generic from a trademark point of view.” Alternatively, the term “generic” is used to refer to drugs that are not produced under patent — “generic from a patent point of view.” The product could be generic because i) the patent has expired, or ii) there never was a patent, or iii) the drug is being copied outside patent protection, for example in a country that still does not provide patent protection for pharmaceuticals.
This section analyses the impact of TRIPS on
the Sri Lankan pharmaceuticals industry. First,
the provisions of TRIPS as they relate to
pharmaceuticals are highlighted and this is
followed by an overview of the local
pharmaceutical industry. The ensuing section
then looks at the current patent system in Sri
Lanka, evaluates the amendment put forward
to the Sri Lankan Code of Intellectual Property
No. 42 of 1979 to make Sri Lanka TRIPS
compliant, and focuses on how this will
impact the prices and availability of drugs in
the country.
The TRIPS agreement
The main provisions of TRIPS as they relate to
pharmaceutical patents can be summarized as
follows.
• Principles of 'national treatment', (i.e., equal treatment of nationals and non- nationals) and 'most-favored-nation' (MFN) treatment (i.e., equal treatment of foreigners regardless of their country of origin) to WTO members. Articles 3 and 4 of TRIPS
• "[...] patents shall be available for any invention, whether products or processes, in all fields of technology [...]," which clearly includes pharmaceutical products. Article 27.1
• "[...] patents shall be available [...] whether products are imported or locally produced."
• Allows the use of patented subject matter without the authorization of the rights holder, e.g., through compulsory licences. Article 31
46

Competition policy and regulation
• A uniform minimum term of patent protection of 20 years counted from the filing date. Article 33
• The burden of proof in case of process patent infringement rests with the defendant, i.e., the party accused of patent infringement. Article 34.1
• Members should "[...] provide [...] a means for which patents for [pharmaceutical and agricultural chemical products] can be filed" (this ‘means' is often referred to as a mail-box). Articles 70.8 and 70.9
• Requires member governments to "[...] ensure that enforcement procedures [...] are available under their national laws so as to permit effective action against any act of infringement of intellectual property rights [...]". Article 41.1, and
• Obliges members to "[...] ensure that the procedures for grant or registration [...] permit the granting or registration of the right within a reasonable period of time so as to avoid unwarranted curtailment of the period of protection". Article 62.2
Although, TRIPS became applicable to all
signatories by the beginning of 1996, it
allowed developing countries a four-year
transition period in implementing all
obligations (except for obligations pertaining
to national and MFN treatment) and an
additional five-year transitional period for
product patents in fields of technology that
were not protected at the date of application
of TRIPS. Accordingly, all developing
countries will have to amend their patent laws
by 2005 at the latest. It must also be noted
that patents protection does not apply
retroactively- i.e., patents are to be granted
only on applications received after 1995 for
valid inventions.
Sri Lanka's patent regime
Sri Lanka already has patent protection for
pharmaceuticals in our legislation, through the
Code of Intellectual Property Act, No.52 of
1979. The patents are issued for a period of
15 years. Thus, the main adjustment required
to be TRIPS compliant is to extend the period
of patent protection to 20 years. As a
developing country with a patent law, Sri
Lanka was given a transitional period till
Code of(
to amend the Code of Int
(Issue Clause 15: This clause amends …. by enh
from the date of its grant.
Clause 17: This clause ….casts the burden
Clause 31: …defines what constitutes unfa
Clause 48: …limits the Director's discretioany other matter provided for by
Clause 49: …makes provision to protect an
Box 4B.1 intellectual property Amendment)
A Bill ellectual Property Act, No.52 of 1979
d on 14.05.2001)
ancing the period of validity of patents for twenty years
of proof on the "infringer."
ir competition. …makes provision for those…….
nary power so as not to exercise it adversely in respect of the Code.
y person whose rights under the code are infringed.
47

State of the Economy 2001
January 2000, which has been subsequently
extended till November 2001, to meet its
commitment to TRIPS. Sri Lanka has
developed an amendment to its national IPR
regime, as outlined in the box below, and it is
likely to be passed by the Parliament before
year's end.
Industry structure
Sri Lanka’s pharmaceutical requirements are
mainly met through imports. The local
pharmaceutical industry consists of an
insignificant manufacturing component,
approximately 7 per cent of the total market
(Table 4B.1). Though more than 300
pharmaceutical manufacturing companies are
registered at the Drug Registration Authority
(DRA) in Sri Lanka, only 7 companies are
involved in the manufacturing of
pharmaceuticals locally, and the rest are
companies that manufacture drugs overseas,
out of which approximately 40 per cent are of
Indian origin. Growth in the sector has
averaged about 4-5 companies per year.
Table 4B.1 Composition of pharmaceuticals by sector
(%) 1999 2000 Imports (at c.i.f. price) SPC for Dept. of Health Services 24
36
SPC for private trade 23 8 Private sector 36 49 Local manufacturing (at ex-factory price)
SPMC 6 3 Private sector 11 4
Total (Rs. million) 1,796 8,439
Note: SPC- State Pharmaceutical Corporation, SPMC- State Pharmaceutical Manufacturing Corporation.
Source: Sri Lanka National Health Accounts 1990/99 – IPS, 2001.
Imports of medical and pharmaceutical
products have increased significantly from Rs.
334 million (0.34 per cent of GDP) in 1982,
to Rs. 2806 million in 1994, and Rs. 7839
million in 2000 (0.62 per cent of GDP).
Although, most imports were from Western
Europe in the 1960s, there has a major shift
towards importation from developing countries
and in particular India (which accounts for 43
per cent of imports). This, in part, reflects the
establishment of the State Pharmaceutical
Corporation (SPC) in early 1970s, and its
policy of importing cheaper generic drugs
instead of brand name drugs.
Approximately 2200 different drugs (3000 -
3500 different dosage forms) are imported
and marketed in Sri Lanka. Government
regulations require that the importing
companies obtain approval based on clinical
evidence, from the Drug Evaluation Sub-
Committee (DESC) before placing the drug in
the market. Once a new drug is approved, the
DESC finds it difficult to prevent the approval
of many drugs with similar compositions,
manufactured under a system of reverse
engineering, generating drugs known as "me-
too drugs." On average, there are about 60 –
80 "me-too drugs" registered quarterly, for
every one new drug registered each year.
Pharmaceuticals are the only products
subjected to price control. This is to assure
the supply of drugs to the public at affordable
prices. Drug prices are also regulated in the
majority of advanced economies, but unlike
Japan and the EU, which make use of direct
negotiations between the government and the
firms, the retail price of pharmaceuticals in Sri
48

Competition policy and regulation
Share of pharmaCountry India UK Switzerland Pakistan Malaysia Netherlands Belgium Germany France Ireland Indonesia Thailand
Source: Department of Customs, Sri Lanka.
Lanka is regulated on a ‘cost-plus basis’. T
agreed maximum retail price for the priv
sector is held at 165 per cent of the CIF pri
(Table 4B.3) and at present the Natio
Security Levy of 7.5 per cent is imposed
the government. Ostensibly, this formula do
not control the price of drugs in the domes
market, for the retail price of pharmaceutic
is based on the CIF value, which is subject
change.
The price controls as well as the existence
low-price imports in SPC outlets have had
dampening impact on prices.
The slow growth of the pharmaceutical sec
in Sri Lanka is attributed to the following: .
• The smallness of the national market,
• Lack of capital to invest in research adevelopment,
• Lack of engineering and technical humresources to support a drug industry,
• The strict standards when registerpharmaceutical companies,
Table 4B.2 ceutical imports by origin (%) 1990 1995 2000 12.8 30.9 42.9 15.3 12.8 9.5 6.1 5.2 5.6 6.0 3.8 4.5 1.9 4.3 4.4 1.8 3.1 4.0 4.6 3.7 3.2
16.1 4.3 2.8 2.1 1.7 2.7 0.2 1.2 2.5 1.1 1.2 2.4 1.3 1.8 1.9
he
ate
ce,
nal
by
es
tic
als
to
of
a
tor
nd
an
ing
• Drug policies that reflected the fact that it was government doctors who were active at the policy-making level, and their concerns never extended to the development of a private pharmaceutical industry. The emphasis on health care needs and thus, on cheaper drugs hampered the growth of a private pharmaceutical manufacturing industry.
The impact of TRIPS
Implementation of the TRIPS Agreement is
likely to lead to higher drug prices, lower
access and a weakening of national
pharmaceutical industries in developing
nations. The minimum 20 year patent allows
a pharmaceutical company freedom from
competition for its patented drug and thus the
price is likely to remain high during this period.
There is also potential for drug companies to
prolong protection by applying for process
patents after the product patents expire.
Further, manufacturers of cheap generic
alternative drugs will not be allowed to do so,
until the patent expires. Since TRIPS requires
patents to be granted regardless of whether
49
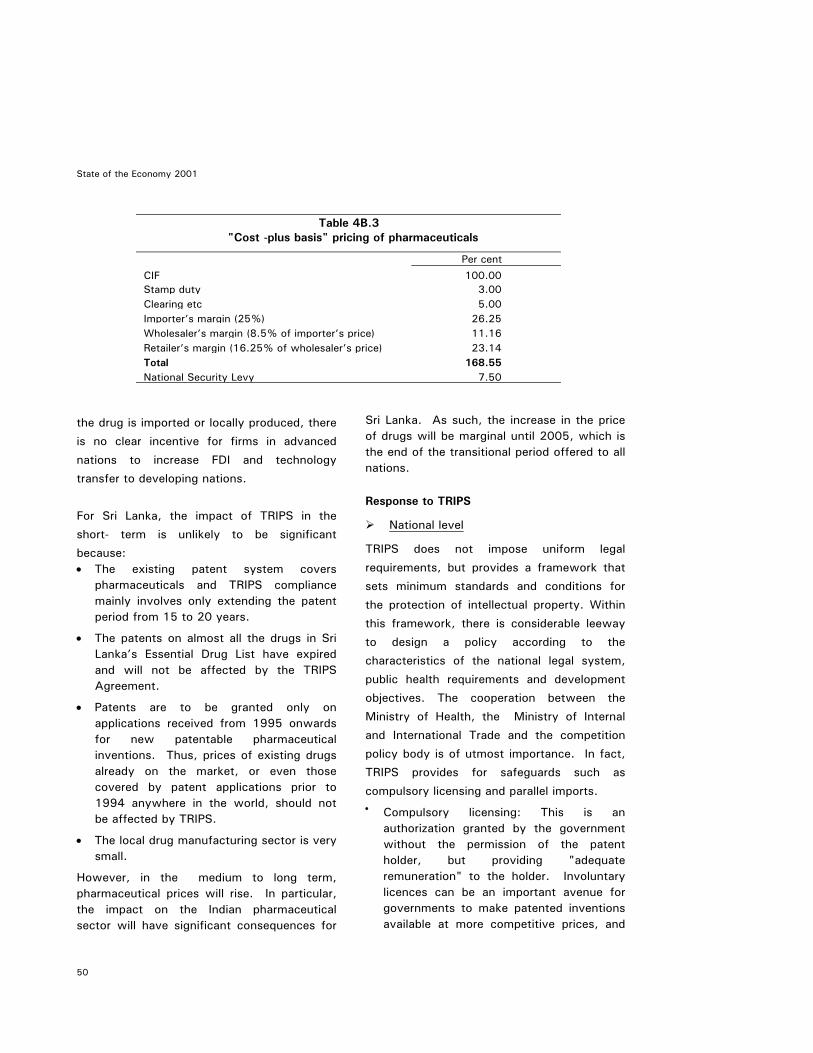
State of the Economy 2001
Table 4B.3 "Cost -plus basis" pricing of pharmaceuticals
Per cent
CIF 100.00 Stamp duty 3.00 Clearing etc 5.00 Importer’s margin (25%) 26.25 Wholesaler’s margin (8.5% of importer’s price) 11.16 Retailer’s margin (16.25% of wholesaler’s price) 23.14 Total 168.55 National Security Levy 7.50
the drug is imported or locally produced, there
is no clear incentive for firms in advanced
nations to increase FDI and technology
transfer to developing nations.
For Sri Lanka, the impact of TRIPS in the
short- term is unlikely to be significant
because: • The existing patent system covers
pharmaceuticals and TRIPS compliance mainly involves only extending the patent period from 15 to 20 years.
• The patents on almost all the drugs in Sri Lanka’s Essential Drug List have expired and will not be affected by the TRIPS Agreement.
• Patents are to be granted only on applications received from 1995 onwards for new patentable pharmaceutical inventions. Thus, prices of existing drugs already on the market, or even those covered by patent applications prior to 1994 anywhere in the world, should not be affected by TRIPS.
• The local drug manufacturing sector is very small.
However, in the medium to long term, pharmaceutical prices will rise. In particular, the impact on the Indian pharmaceutical sector will have significant consequences for
Sri Lanka. As such, the increase in the price of drugs will be marginal until 2005, which is the end of the transitional period offered to all nations.
Response to TRIPS
National level
TRIPS does not impose uniform legal
requirements, but provides a framework that
sets minimum standards and conditions for
the protection of intellectual property. Within
this framework, there is considerable leeway
to design a policy according to the
characteristics of the national legal system,
public health requirements and development
objectives. The cooperation between the
Ministry of Health, the Ministry of Internal
and International Trade and the competition
policy body is of utmost importance. In fact,
TRIPS provides for safeguards such as
compulsory licensing and parallel imports. • Compulsory licensing: This is an
authorization granted by the government without the permission of the patent holder, but providing "adequate remuneration" to the holder. Involuntary licences can be an important avenue for governments to make patented inventions available at more competitive prices, and
50

Competition policy and regulation
the very existon compulsoruseful in encMost countrcompulsory lipatent law or as in the US)actually used tthe past for mthat the currenIPR legislatioprovisions for
• Parallel impordifferences fodifferent markimportation ocheaper markwithout the holder. Whprovision is a effects of IPRothers argue price differenfactors outsidcompanies.
Thailand and Argentina have permitted parallel imports.13
In Sri Lanka, the existing regulation in the industry which allows only one importer to import a particular drug prevents parallel imports. This regulation while preventing the entry of substandard drugs into Sri Lanka, also prevents third parties from importing the drugs from cheaper markets. For instance, a brand of Ranitidine was sold in Sri Lanka by a multinational company at around Rs.66 per 300mg and Rs.38.50 per 100mg a tablet, while the same product was sold in India at Rs.7.25 and Rs.3.50 respectively.
RZantac (1
India Indonesia Malaysia Mongolia Nepal Pakistan Philippines Sri Lanka Thailand Vietnam
Source: Retail Dru
News No.
Table 4B.4 etail prices of 00 x 150 mg) in US$
2 41 55
183 3
22 63 61 37 30
g Prices: The Law of the Jungle, HAI
100, April 1998.
ence of statutory provisions y licences may, in fact, be ouraging voluntary licences. ies have provisions for censing, (either under their through anti-trust legislation, , although only Canada has his instrument extensively in edicines. It is serious flaw t amendment to the national n, does not incorporate compulsory licensing.
ts: When there are price r the same products in ets, this policy allows the f the product from the et for resale at home, permission of the patent ile some argue that this useful tool to counter the ill legislation (see Table 4B.4), against it as international
ces may be attributed to e the control of drug Currently South Africa,
• Price controls: It has been argued however, that Sri Lanka's 'cost-plus' basis pricing encourages imports with the highest CIF value, such that profits are maximized, resulting in high retail prices. Further, low-priced imports available via the SPC outlets are not a sufficient mechanism to dampen prices in the private sector.
• “Bolar” provision: This allows manufacturers of generic drugs to use the patented invention to obtain marketing approval — for example from public health authorities — without the patent owner’s permission and before the patent protection expires. The generic producers can then market their versions as soon as the patent expires.
• Promoting an informed choice in prescription medicine: The existing regulations require that a prescription is to be written in its generic name, however this is ineffective. Drug transactions are
51
13 Pharmaceutical TNCs legally challenged the South African government over its revised Medicines Act which allowed parallel imports. In spite of pressure from the US and the EU to amend its policies, the South African legislation prevailed as the multinational companies withdrew their lawsuit in April 2001, under pressure from international opinion on the urgency of dealing with Africa's AIDS crisis.

State of the Economy 2001
unlike other consumer transactions, for it is not the person who decides on the purchase (the prescriber) who pays but the patient. Thus, the onus is upon prescribers to ensure awareness of the availability of brand names as well as generic drugs, and their prices. This must also extend to the dispensing level, i.e., the pharmacy.
International level
• Differential pricing (DP): Companies charging different prices in different markets according to purchasing power, is a feasible means of increasing access to drugs in developing countries by making it more affordable. Through DP, companies would be able to recover most of its R&D expenditure from richer markets and at the same time to sell or license production at lower prices in lower income countries. This could be a win-win solution if consumers in richer countries do not face even higher prices as a result. DP has already been achieved for commodities such as vaccines, contraceptives, and condoms through a combination of high-volume purchasing, reliable and adequate financing, advocacy, and corporate responsibility. But the challenge is to
expand this to life-saving medicines. For such a strategy to be effective, it is very essential to find successful methods of preventing lower priced drugs finding their way into rich markets.
Conclusion
The average cost of developing a new drug is
estimated by the industry to be around
US$500 million, and so a patent system that
rewards companies for research risk and
innovation is required. The international
application of IPR legislation through the
TRIPS Agreement is likely to lead to drug price
increases in the order 200-300 per cent.
However, TRIPS provides instruments such as
compulsory licensing and parallel imports to
buffer these increases and meet public health
needs. These instruments have their problems
and must be used cautiously. However, the
Sri Lankan legislation completely fails to
incorporate these safeguards provided by
TRIPS. Despite pressure from outside,
developing countries need not go beyond the
minimum requirements of TRIPS.
52

Leading Issues in the Economic Development Process

Free float of the exchange rate
5. Free float of the exchange rate 5.1 Introduction
Sri Lanka undertook a fundamental change in
its exchange rate policy management on 23
January 2001 by implementing a floating rate
regime. It marked a departure from the
managed float that had been in operation
since the liberalization of the economy in
1977. The decision to float the currency was
a response to a sharp contraction in the
country’s stock of official reserves brought on
by adverse economic developments on both
the domestic and external fronts.
The benefit of a float is that in principle,
countries with floating exchange rates do not
need any foreign reserves at all, since changes
in the relative demands for domestic and
foreign currency should be accommodated via
changes in the exchange rate rather than the
level of reserves.
Sri Lanka is not unique in shifting to a floating
regime in recent years. The current consensus
is that countries need to choose between
either floating exchange rates or irrevocably
fixed rates. The intermediate regimes of 'soft
pegs', bands and crawls are considered to be
no longer viable. The East Asian financial
crises of 1997/98 lent credence to this view
as pegged exchange rates crashed across the
region, with devastating results. In Latin
America, Brazil, Chile and Colombia followed
the East Asian example, abandoning their
exchange rate targets and bands in favour of
fully floating currencies. Hence, the view that
countries are being pushed to the extremes of
either free floating or firm fixing- the so-called
corner solution or hypothesis of the missing
intermediate regime-has become conventional
wisdom remarkably quickly since its first
exposition.14
The driving attraction of floating rates is that
they are less vulnerable to sudden speculative
crises. Flexibility in exchange rates also allows
monetary authorities a greater degree of
independence in exercising control over
monetary aggregates as they become
relatively free from preoccupation with the
stability of the exchange rate when there is
significant international capital mobility.
Nevertheless, there are a number of reasons
why a country may wish to maintain a stable
exchange rate. A stable exchange rate may be
viewed as an indicator of policy credibility and
help maintain confidence in the economy, as
well as being an effective anchor against
domestic inflation. Further, a volatile
exchange rate can inhibit both trade
transactions and capital inflows, particularly in
a situation where a country lacks
sophisticated instruments for managing
currency risks.
Market based exchange rates pose new policy
issues and dilemmas for several reasons.
Market sentiment can often overshoot,
exaggerating the degree of economic
uncertainty at any particular point in time, and 14According to the International Monetary Fund (IMF) classification scheme, countries are broadly grouped into four types of exchange rate arrangements: peg, limited flexibility, managed floating and, freely floating. In 1970, 97 per cent of its member countries were classified as having a pegged exchange rate (albeit under the Bretton Woods system); by 1980, that share had declined to 39 per cent and, in 1999, it was down to 11 per cent.
53

State of the Economy 2001
leading to dramatic consequences as a result
of "herd behaviour". Market perceptions of
exchange rate risk may not always reflect
changes in underlying macroeconomic
‘fundamentals’ such as inflation, fiscal
position, external current account, interest
rates and foreign exchange reserves.
Understanding how market sentiment is
formed in the private sector, and how it can
be influenced by public policy responses
remains nebulous, and especially so in most
developing economies. For Sri Lanka, the
float of its currency raises new and complex
policy issues.
The rest of this chapter outlines the path to
taking the decision to float, evaluates to what
extent the regime is truly a float, examines
the implications of the currency float for the
economy, and then considers a possible policy
strategy for future conduct of monetary
policy.
5.2 Floating the rupee: the proximate causes
Sri Lanka’s decision to float the currency was
an admission that it had limited policy options
in the light of a significant erosion of its
external reserves position, rather than one
based on careful deliberations leading to the
conclusion that a floating exchange rate
regime was optimal for economic
development.
Sri Lanka’s stock of official reserves–
contracting steadily in the wake of the East
Asian financial crises – was not sufficient to
withstand the twin pressures of the
debilitating effects of high international oil
prices and greater than anticipated escalation
in defence expenditures in 2000. In
hindsight, it could be argued that a sharper
depreciation of the rupee earlier, to offset the
loss of competitiveness vis-à-vis Sri Lanka’s
East Asian competitors was warranted. A
significant deterioration in export earnings
growth during 1998-99 contributed to the
contraction in reserves. However, with
domestic inflation averaging 9.4 per cent in
1998 (on the heels of a government fiscal
deficit of 9.2 per cent of GDP), room for
policy manoeuvring was heavily constrained.
A near 20 per cent contraction in official
reserves from the end of 1997 to the end of
1999 was followed by an even sharper
contraction of reserves of over 35 per cent by
end 2000. The monetary authorities were
hard pressed to reverse an expectation of
devaluation in the market but such
expectations once built in, escalate as
speculators are aware that the government’s
ability/willingness to defend the exchange rate
is subject to several limitations.
Firstly, the capacity to intervene in the foreign
exchange market is limited by the stock of
accumulated or easily accessible international
reserves. A policy of raising domestic interest
rates to attract capital inflows and build up
adequate reserves is also unlikely to be
effective. Interest rate sensitive capital
inflows have been quite weak not only
because the capital account is not fully
liberalized, but also due to perceived
weaknesses in the domestic financial system
and an erosion of confidence in the country's
growth prospects. Higher interest rates also
54
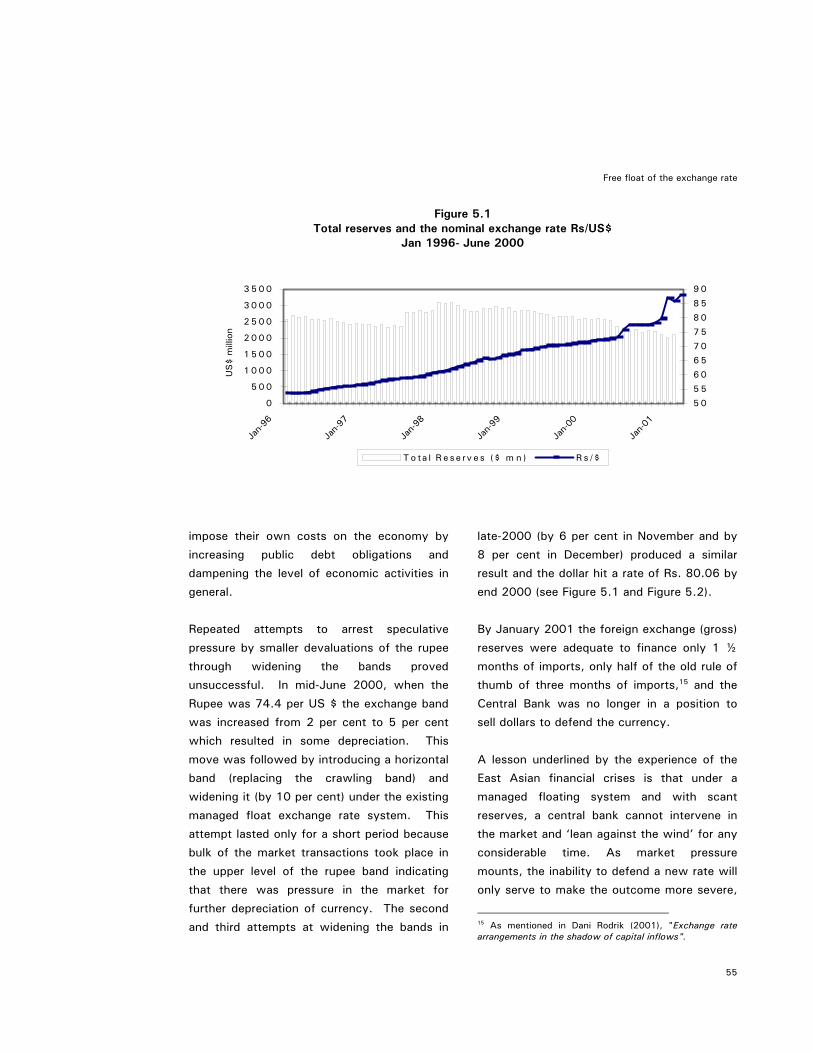
Free float of the exchange rate
Total reserves and thJan
.
0
5 0 0
1 0 0 0
1 5 0 0
2 0 0 0
2 5 0 0
3 0 0 0
3 5 0 0
Jan-96
Jan-97
Jan-98
Jan-01
5 0
5 5
6 0
6 57 0
7 5
8 0
8 5
9 0
T o ta
US$ m
illio
n
impose their own costs on the economy
increasing public debt obligations
dampening the level of economic activitie
general.
Repeated attempts to arrest specula
pressure by smaller devaluations of the ru
through widening the bands pro
unsuccessful. In mid-June 2000, when
Rupee was 74.4 per US $ the exchange b
was increased from 2 per cent to 5 per
which resulted in some depreciation.
move was followed by introducing a horizo
band (replacing the crawling band)
widening it (by 10 per cent) under the exis
managed float exchange rate system.
attempt lasted only for a short period beca
bulk of the market transactions took plac
the upper level of the rupee band indica
that there was pressure in the market
further depreciation of currency. The sec
and third attempts at widening the band
Figure 5.1 e nominal exchange rate Rs/US$
1996- June 2000
Jan-99
Jan-00
l R e se rv e s ($ m n ) R s /$
Source: Central Bank of Sri Lanka
by
and
s in
tive
pee
ved
the
and
cent
This
ntal
and
ting
This
use
e in
ting
for
ond
s in
late-2000 (by 6 per cent in November and by
8 per cent in December) produced a similar
result and the dollar hit a rate of Rs. 80.06 by
end 2000 (see Figure 5.1 and Figure 5.2).
By January 2001 the foreign exchange (gross)
reserves were adequate to finance only 1 ½
months of imports, only half of the old rule of
thumb of three months of imports,15 and the
Central Bank was no longer in a position to
sell dollars to defend the currency.
A lesson underlined by the experience of the
East Asian financial crises is that under a
managed floating system and with scant
reserves, a central bank cannot intervene in
the market and ‘lean against the wind’ for any
considerable time. As market pressure
mounts, the inability to defend a new rate will
only serve to make the outcome more severe,
55
15 As mentioned in Dani Rodrik (2001), "Exchange rate arrangements in the shadow of capital inflows".

State of the Economy 2001
even though the pace of development of such
a crisis may be slower because the capital
account in Sri Lanka is not fully liberalized. In
this situation, even a large devaluation of the
currency may have only fuelled expectations
of further currency depreciation. Hence the
only realistic alternative to a floating regime
was re-imposition of stringent exchange
controls. This was no doubt an unpalatable
option, which would have been viewed as
abandoning the country’s commitment to an
open economy.
5.3 How ‘free’ is the float?
Since the exchange rate was floated, the
volatility of the exchange rate vis-a- vis the
US dollar has increased threefold, compared
to the same time before the regime change.16
Nevertheless, the shift to a floating regime in
Sri Lanka appears to fall short of a ‘pure’
float. In addition to direct Central Bank
intervention – large government import bills
were, and still continue to be, settled outside
the foreign exchange market17 – the change
in the exchange rate regime was accompanied
by a tightening of controls on foreign
exchange and foreign trade. New restrictions
were imposed on the repatriation of export
16 Exchange rate volatility is measured as the standard deviation of changes in daily exchange rate data of the Sri Lankan rupee to the US dollar. The period January 31 (a week after the float started) - Jun 30 2001, was compared with an equivalent period ending a week prior to the regime change. During the period immediately after the regime change (January 24 - June 30, 2001) which included the increased uncertainty during the first week of the regime, the volatility was four times more under the float, compared to the same number of days prior to the float. 17 All state-owned enterprises were requested to route their import bills through the state banks, and all their import payments were deferred for three months. While giving immediate stability to the market, it made the exchange rate vulnerable to large import bills of state corporations when unloaded in the market after the three month period. For example, when the Ceylon Petroleum Corporation paid a large import bill on 4th May 2001 the dollar hit the rate of Rs. 93, and the central bank was forced to intervene by selling dollars to stop the rupee sliding.
earnings and import financing.18 A decision to
impose an additional temporary (ending
December 31, 2001) 40 per cent surcharge
on import duty rates is in reality another
means of curtailing import expenditure in
support of the currency. The Central Bank is
also known to use ‘moral suasion’ with the
banking system to maintain currency stability.
These measures are evidence of the
recognition that a developing country like Sri
Lanka cannot afford to ignore the level of the
exchange rate even under a floating rate
regime. This is validated by 1) the lack of
theoretical foundations for the corner
solutions hypothesis, and 2) the structural
differences of developing countries compared
to advanced nations that suggest a pure float
may not be appropriate.
18 The new regulations were i) Imposing limits on daily working balances maintained by commercial banks in foreign exchange, on the basis of past import and export credit transactions. This was to prevent speculative trading; ii) Instructing banks to ensure the settlement of export loans by exporters with export proceeds within 90 days (increased to 120 days for some exporters). Banks were instructed to charge an additional interest rate of 10 percentage points where the settlements were overdue by one month and 2 percentage points per month thereafter; iii) Requiring forward sales and purchases of foreign exchange to be backed by a rupee deposit of 50 per cent of the value of the contract and to be retained till the date of the maturity of the contract, in order to discourage speculative types of forward contacting; iv) Advising banks not to permit customers early or pre-payment of import bills in anticipation of a depreciation; v) Instructing banks to limit their forward market operations only to trade-based transactions of goods and services.
56

Free float of the exchange rate
Daily exchange ra(Regime cha
Indian Rupee
1.5
1.7
1.9
2.1
1/1
/99
5/1
/99
9/1
/99
1/1
/00
5/1
/00
9/1
/00
1/1
/01
5/1
/01
SL
Rup
ees.
65
75
85
95
1/1
/99
SL
Rup
ees
GBP
100
110
120
130
140
1/1
/99
5/1
/99
9/1
/99
1/1
/00
5/1
/00
9/1
/00
1/1
/01
5/1
/01
SL
Rup
ees
8
9
10
11
12
13
14
1/1
/99
4/1
/99
SL
Rup
ees
The intellectual origins of the co
hypothesis was in the context of the Europ
Exchange Rate Mechanism, when by 1
some analysts felt that the gradual reduc
of the width of the target zone was not
best avenue to monetary union. The t
main arguments offered contain valu
truths but do not provide a theore
rationale for the superiority of the co
solutions. The main arguments are The "trilemma" in monetary econom
that is, that a country cannot pusimultaneously the three goals exchange rate stability, moneindependence and financial maintegration.
Even considering just the trade between the exchange rate stability monetary independence, there is theory that prevents the trade-off of
Figure 5.2 tes per unit of foreign currency nge: January 23, 2001)
US $
5/1
/99
9/1
/99
1/1
/00
5/1
/00
9/1
/00
1/1
/01
5/1
/01
GDM
30
35
40
45
1/1
/99
5/1
/99
9/1
/99
1/1
/00
5/1
/00
9/1
/00
1/1
/01
5/1
/01
SL
Rup
ees
FFr7/1
/99
10/1
/99
1/1
/00
4/1
/00
7/1
/00
10/1
/00
1/1
/01
4/1
/01
JPY
0.5
0.55
0.6
0.65
0.7
0.75
0.8
0.85
1/1
/99
5/1
/99
9/1
/99
1/1
/00
5/1
/00
9/1
/00
1/1
/01
5/1
/01
SL
Rup
ees
rner
ean
994
tion
the
hree
able
tical
rner
ics- rsue
of tary rket
off and no
half
stability and half independence, as in a target zone of moderate width.
Prevents the dangers of unhedged dollar liabilities. The argument is that when a government establishes any sort of exchange rate target, foolhardy banks and firms obtain large unhedged dollar loans, underestimating the possibility of a drop in the local currency value. When devaluations occur, debt-servicing becomes an unmanageable burden, leading to bankruptcy. Hence, floating gives banks and firms an incentive to hedge their foreign exposures.
Although, this describes the devastating impact of East Asian devaluations, the argument is based on irrationality of banks and firms. Also, it suggests the somewhat unintuitive claim that adding extra noise to the exchange rate would make a country better off.
57

State of the Economy 2001
BoFear of
According to a recent study by Calvo and Reinhart
exchange rate policy management – hard pegs or
less than what it appears at first glance. The a
regimes are an inadequate representation of actua
means that many countries that say they allow th
to ‘pure’ floating rate regimes are to be found only
The authors analyse the behaviour of exchan
aggregates, interest rates, and commodity prices
to validate their claim. The study finds that rela
exchange rate variability is low, suggesting delib
Contrary to what would be expected under a floa
volatility is found to be very high. Interest rate v
that of the more committed floaters, suggestin
Monetary aggregates are also found to show a hig
policy aimed at smoothing exchange rate fluctuati
volatile than the exchange rate, suggesting that,
adjust as only a partial absorber of these real shock
1. Calvo, G.A., and C.M. Reinhart, 2000 (November)(Working Paper 7993).
Political difficulty of exiting a target- The idea is that governments tend to wait too long to devalue as in the case of Mexico, Thailand and Korea.
However, even though in the autumn of 1998 Brazil delayed the impending devaluation, the devaluation in January 1999 tended to improve confidence and the trade balance.
Recent evidence suggests that even
developed countries that are supposedly
pursuing a floating exchange regime intervene
with the intention of smoothing out volatile
fluctuations (see Box 5.1). Thus, it would be
58
x 5.1 Floating
(2000), the apparent trend towards the extremes of
freely floating exchange rate regimes – is in reality
uthors argue that ‘official labels’ of exchange rate
l country practices. A widespread ‘fear of floating’
eir exchange rates to float freely do not. The closest
in the US, Australia and Japan.
ge rates, foreign exchange reserves, monetary
across the spectrum of exchange rate arrangements
tive to the more committed floaters, the observed
erate policy action to stabilize the exchange rate.
ting exchange rate regime, foreign exchange reserve
olatility is also found to be significantly higher from
g that interest rate defences are commonplace.
h degree of variability, owing to procyclical monetary
ons. Finally, commodity prices are found to be more
at best, policy makers allow the exchange rate to
s.
, “Fear of Floating”, NBER Working Paper Series
unrealistic to expect that Sri Lanka would be
immune to the same constraints that demand
some measure of stability in its exchange rate
policy management.
In fact, recent studies suggest that developing
country economies are prone to conditions
that may make floating regimes less attractive
than in the case of more advanced economies.
The former are more likely to pursue outward
oriented economic policies, with significant
stress on trade as a means of generating a
growth momentum. In such a scenario,
heightened exchange rate uncertainty that
typically follows from a free float, tends to

Free float of the exchange rate
have an adverse impact on trade prospects.
Further, with illiquid or non-existent futures
markets, exporters and importers do not have
the tools to act as a hedge against exchange
rate risk. Another concern is that the
inflationary consequences of large currency
swings tend to be greater for developing
countries.
5.4 Policy implications of a floating regime
The continued erosion of international
reserves since the end of 1997 is essentially a
reflection in the monetary sphere of
fundamental imbalances in the real economy.
In the short term, the ability of the monetary
authorities to maintain a reasonably stable
rate of exchange will depend on the build up
of total reserves. An injection of US$ 25
million as part of the privatization of Sri
Lankan Airlines and support offered under the
IMF agreement will no doubt ensure a much-
needed breathing space.
The longer term impact of the floating rate
regime will depend critically on the policy
response to address fundamental imbalances
that produce persistent current account
deficits. A current account deficit essentially
implies that national expenditure (aggregate
demand) exceeds national income (output)
and that there is inadequate production of
tradeable (exports and import substitutes)
goods and services. In order to eliminate a
persistent deficit, either a cut in national
expenditures, or an increase in income has to
be forthcoming. In practice, GNP growth is
less likely to eliminate the expenditure-income
gap (because expenditure is also increasing
and productivity improvements take time), and
thus expenditure cuts are essential.
The resulting decline in aggregate demand
falls on both tradeables and non-tradeables
(home goods). The excess supply of
tradeables can be shipped abroad. The excess
supply of non-tradeables, which by definition
remain at home, leads to a drop in prices of
home goods, such as real estate. Thus, the
relative price of traded goods to non-traded
goods increase, resulting in a real depreciation
of the currency. This leads to a reduction in
consumption of tradeables as well as a
reallocation of resources towards the
production of tradeables -reducing import
intensity and expanding export capacity. To
reduce a persistent current account deficit and
a run down of reserves, domestic cost
increases must not erode the incentives to
produce more tradeables provided by higher
prices.19
In the absence of increased foreign capital
inflows to finance the deficit, a cut in national
expenditure will entail that either the
government and/or private sector (firms and
households) must cut expenditure
(consumption or investment). If the
government does not cut its expenditure, and
the currency is allowed to float freely, then the
exchange rate will depreciate to produce price
hikes. These price increases are the market
mechanism for getting the required cuts in
national expenditure. And the cuts will occur in
59
19 The Keynesian channel predicated on the assumption that prices and wages are inflexible downward, suggests that a fall in aggregate demand brings about a fall in output and employment.

State of the Economy 2001
those sectors that are compelled to respond to
market prices.
If the exchange rate is not allowed to float
freely, or the required price adjustments are
stifled, then interest rates may become the
instrument for getting the required cuts.
Interest rate increases have two key effects.
First, high interest rates can temporarily attract
foreign funds (or discourage outflows) to help
finance current account deficits. In the case of
Sri Lanka, given that its capital account is not
fully liberalised, such effects are fairly weak.
Second, high interest rates reduce domestic
expenditures by increasing the cost of credit or
restricting credit availability. Unless direct cuts
on national expenditure are made through cuts
in government expenditure, significant
exchange rate depreciation and/or interest rate
increases are inevitable. The issue of credibility
with a clear -cut anchor is likely to bias the
outcome towards lower exchange rate and
higher interest rate volatility, even at the
expense of following pro-cyclical policies.
5.5 Floating with an anchor: inflation targeting
A key monetary policy issue that emerges
from the adoption of a floating regime is the
viability of moving towards an explicit inflation
target. While the preconditions for such a
policy option may not be currently in place in
Sri Lanka, it is clearly a medium term aim that
is likely to be pursued by monetary
authorities, as identified in the recently
concluded agreement with the IMF.
Even in emerging market economies, the trend
towards freely floating currencies has been
accompanied by a policy shift to set monetary
policy through a more-or-less formal process
of inflation targeting. The goal is to keep the
flexibility of a floating currency, allied to a
rigorous monetary framework to conquer
inflation. Inflation targeting requires the
central bank – which must at least be
operationally independent – to announce a
medium term target (or range) for inflation, be
responsible for achieving those targets and
provide regular public information about its
strategy and decisions. It essentially requires
an institutional commitment to price stability
as the primary goal of monetary policy.
The openness, accountability and anti-inflation
focus that targets can instil are obvious
attractions as a medium-term strategy for
monetary policy. When international capital
mobility is high – that is, when the capital
account is reasonably open – inflation
targeting, in contrast to an exchange rate peg,
allows monetary policy to focus on domestic
considerations and to respond to shocks to
the domestic economy. This is possible even
when capital markets remain closed, but de facto remain fairly open with controls that are
circumvented (though at higher cost and with
some time lags). The greater accountability
that is placed on the central bank to meet its
stated targets can also constrain political
pressure on the Bank to undertake overly
expansionary monetary policy, thus reducing
the likelihood of the time-inconsistency trap.
How does inflation targeting operate in
practice? There are many elements that
influence inflation that are not amenable to
direct control by the central bank, such as
import prices, wages, improvements in
60

Free float of the exchange rate
productivity, supply bottlenecks, the exchange
rate and the fiscal regime. The main policy
tool available to the central bank is the
interest rate, usually the discount or repo rate,
through which liquidity in the market is
ensured and the term structure of interest
rates determined. The volume and cost of
liquidity are expected to influence a number of
different macroeconomic variables with a
bearing on inflation. Changes in the interest
rate are expected to reflect changes in the
growth rate of monetary aggregates, the yield
curve, expectations of inflation, the size and
components of the output gap, asset prices
and exchange rate forecasts. Taking all these
factors into consideration and making
allowances for the time lags in the impact of
monetary policy instruments and its imprecise
transmission mechanisms, interest rate
changes can be undertaken to target a chosen
inflation rate.
Nevertheless, inflation targeting is not easy
nor a panacea. Critics of inflation targeting
have long held the view that it is too rigid,
that it allows too much discretion, that it has
the potential to increase output instability, and
that it will lower economic growth.
Proponents of inflation targeting, however,
contend that such concerns in reality are not
serious objections to a properly designed
inflation targeting strategy. But for developing
economies, the risks are greater. They have
specific problems that make inflation targeting
more difficult.
The determinants of the inflationary process in developing countries may be markedly different to that of more industrialised economies. For example,
import prices play a more significant role in the consumer price index, making the exchange rate itself an important element in inflation. Further, the incidence of administered prices is a further complication in many developing economies.
High rates of inflation prevalent in many developing countries make predicting future inflation rates with any degree of accuracy more difficult. Thus, setting targets that cannot be achieved may actually damage central bank credibility. Moreover, if inflation were very high to begin with, significant interest rate increases would have to be entertained, with damaging output losses and unemployment, before any noticeable impact in restraining inflation.
Many developing countries are still grappling with high and persistent fiscal deficits, where deficits have often been monetized, reflecting relatively undeveloped domestic financial markets. This phenomenon plays a critical role in monetary expansion, and may not be consistent with an inflation targeting strategy. Inflation targeting may not be sufficient to ensure fiscal discipline or to prevent fiscal dominance. A key pre-requisite for inflation targeting therefore, is the absence of outright fiscal dominance.
Relatedly, securing greater independence for the central bank is crucial. A central bank, given the specific task of achieving and maintaining price stability, and appropriately empowered to do so through political consensus, is expected to be able to counter the problem of time inconsistency.
Such a strategy also focuses the debate on what a central bank can do most effectively in the long run – that is, control inflation – rather than blur its functions by
61

State of the Economy 2001
assigning it a multitude of complex tasks (for example, to raise output growth, lower unemployment, and increase external competitiveness).
While inflation in Sri Lanka has recorded a
downward trend in more recent years – in line
with developments in the global economy –
there appears to be significant inflationary
build up in 2001. Inflation targeting is likely to
be more effective if it is phased in after some
successful disinflation. This will require that
Sri Lanka address its deep-rooted fiscal
problems. In fact, inflation targeting may help
constrain fiscal policy to the extent that the
government is actively involved in setting the
inflation target (including adjustments to
administered prices). In fact new theoretical
work suggests that the role of fiscal policy is
quite critical to successful inflation targeting.
Maintaining price stability requires not only a
commitment to an appropriate monetary
policy rule, but an appropriate fiscal policy rule
as well. In any case, where international
capital mobility is restricted to any degree, its
importance increases.
It has to be kept in mind that the fashion
for floating rates and inflation targets in
developing countries also took hold just as the
global environment for emerging economies
began to improve in the aftermath of the East
Asian financial crises. In the context of a
favourable global economic environment –
characterised by rising commodity prices,
strengthened economic growth in
industrialised economies and higher private
capital flows – inflation targeting has been
politically easy, since it has meant gradually
falling interest rates. It is less clear how the
system will cope as the favourable global
economic environment erodes. The increased
flexibility given by a floating exchange rate to
manage monetary policy can be effectively
utilised only if fiscal and monetary policies can
be properly synchronised and key institutional
reforms implemented. Unless these issues are
addressed, inflation targeting will remain
merely a potentially viable option rather than
an effective strategy for medium-term
monetary policy conduct in Sri Lanka.
62
Sri Lanka-Pakistan bilateral free trade agreement
6. Between bilateralism and regionalism: Focus on the Sri Lanka – Pakistan bilateral free trade agreement
6.1 Introduction
The push for a free trade agreement with
Pakistan is gaining momentum. The
Government of Sri Lanka is currently
examining a proposal from Pakistan to enter
into a Free Trade Agreement (FTA), subject to
a Negative List. Approval has been granted
by the Cabinet of Ministers to enter into a
FTA with Pakistan, and action is now being
taken to prepare Sri Lanka’s Request and
Negative Lists, in consultation with line
Ministries, Trade Chambers and other relevant
institutions.
The development of this bilateral FTA reflects
both a frustration over stalled South Asian
regional initiatives under SAARC, and a
growing worldwide trend towards such
agreements given the failure to commence a
new round of trade negotiations under the
auspices of the WTO.
Efforts continue, without much success, to
kick start the SAARC Summit which has not
been held for the last three years due to the
tit-for-tat nuclear tests between India and
Pakistan, the military takeover in the latter
and more recently, the tragic massacre of
Nepal's royal family. Given the slow progress
made by the South Asian Free Trade
Agreement (SAFTA), there has been an
increasing trend towards signing of bilateral
trade deals in the region. In March 2000, the
Indo-Lanka Free Trade Agreement came into
operation, having been signed in December
1998. India also has bilateral FTAs with
Nepal and Bhutan.
The growth of bilateral FTAs is not restricted
to South Asia and has spread beyond. The
Latin American region witnessed a massive
spread of these agreements in the early
1990s. Given the failure of the global trade
negotiations, the EU has signed many
agreements with individual countries in North
Africa, Eastern Europe and the Middle East.
Most recently the USA signed a bilateral FTA
with Jordan, and similar agreements are either
completed or in the negotiating process
between Singapore and Mexico, Singapore
and New Zealand, India and South Africa.
Besides bilateral initiatives, Sri Lanka also
pursued regional economic cooperation
outside SAFTA, such as through the
Bangladesh, India, Myanmar, Sri Lanka and
Thailand-Economic Cooperation (BIMST-EC),
the Bangkok Agreement (consisting of
Bangladesh, Sri Lanka, Laos, India, South
Korea and China) and the Indian Ocean Rim
Association for Regional Co-operation (IOR-
ARC). The IOR-ARC was formally launched in
March 1997, and its current members include
Australia, Bangladesh, India, Indonesia, Iran,
Kenya, Madagascar, Malaysia, Mauritius,
Mozambique, Seychelles, Singapore, South
Africa, Sri Lanka, Tanzania, Thailand, United
Arab Emirates and Yemen. However, while some progress in cooperation has been noted,
none of these agreements have shown much
dynamism.
63

State of the Economy 2001
The argument against bilateralism is that it
undermines the regional arrangements already
in place. Given the current design of the
bilateral FTAs, they are also difficult to
incorporate into the regional arrangement.
Most important, multiple agreements create a
"spaghetti bowl" of trade arrangements with
overlapping preferences that hinder trade. An
additional concern is that of "insidious
regionalism"- the idea that a bilateral FTA
may promote investment that leads to being
specialized toward a partner, but being less
specialized to non-members. The implication
of the Sri Lanka-India FTA then would be that
it leads to adjustments in Sri Lanka towards
specializing vis-à-vis India, which may detract
from being specialized vis-à-vis the rest of the
world.
On the other hand, bilateralism may in fact
spur regional integration. It shows a
commitment to trade liberalization and a
determination not to be held up by political
dimensions of regional groupings.
The following sections look at the nature of
Sri Lanka-Pakistan trade, and the impact of an
FTA beyond a standard trade creation/ trade
diversion approach. The next section draws
lessons for policy design from the experience
of the Sri Lanka-India bilateral FTA, and then
offers some conclusions.
6.2 Profile of Sri Lanka-Pakistan trade
Trade with Pakistan accounted for less than 1
per cent of total Sri Lankan trade in goods in
2000. However, it is an important market for
a few agricultural products. Sri Lanka had
enjoyed a trade surplus (exports exceeded
imports) with Pakistan for several years up to
1984, due to increased exports of tea,
coconut products and betel leaves. However,
since 1985, Sri Lanka has continuously run a
trade deficit with Pakistan, albeit quite small
Total imports, exports andand Banglad
Pakistan
Imports Exports Trade Balance
I
1996 69 (1.4)
37 (0.9)
-32 (
1997 86 (1.5)
37 (0.8)
-49
1998 91 (1.6)
27 (0.6)
-64
64
1999 95 (1.8)
31 (0.7)
-64
2000 72 (1.15)
30 (0.6)
-42
Note: Numbers in parentheses reflect importotal imports/exports of Sri Lanka.
Source: Sri Lanka Customs.
Table 6.1 balance of trade with : Pakistan, India esh, 1996-2000 (US$)
India Bangladesh
mports Exports Trade Balance
Imports Exports Trade Balance
561.9 10.3)
42.9 (1.1)
-519.0
1.8 (0.03)
11.5 (0.28)
9.7
559.8 (9.5)
43.8 (0.9)
-516.0
2.0 (0.03)
10.2 (0.22)
8.2
539.2 (9.2)
37.7 (0.8)
-501.5
1.1 (0.02)
9.7 (0.20)
8.7
511.6 (8.6)
48.6 (1.1)
-463.0
4.5 (0.08)
10.8 (0.23)
6.3
600.1 (8.2)
58.0 (1.1)
-542.1
3.6 (0.06)
8.6 (0.16)
5.0
ts from/exports to Pakistan/India/Bangladesh as a per cent of

Sri Lanka-Pakistan bilateral free trade agreement
at $42 million dollars in 2000 compared to
the trade deficit with India of US$542 million.
Recently, there have been increased imports
of rice, medicaments, Bombay onions,
potatoes, fabrics, oranges, and apples that
have tilted the trade balance in Pakistan's
favour.
6.2.1 Exports
Pakistan is not an important overall export
market for Sri Lanka, accounting for only 0.6
per cent of total Sri Lankan exports.
However, the exports to Pakistan represent an
important market for a few goods. The main
exports are coconut products, tea, rubber, and
betel leaves. In particular, a little over 10 per
cent of all coconut product exports (copra,
coconut oil, brooms and ekels) go to Pakistan
and accounted for $12 million of the total $30
million worth of exports to Pakistan in 2000.
In fact, Sri Lanka is the leading supplier of
copra to Pakistan, (with more than 80 per
cent share of the total imports) followed by
Malaysia.
The main rubber product imported into
Pakistan is natural rubber latex. Rubber is
mainly imported for manufacturing tyres,
tubes etc. Sri Lanka supplies mainly smoked
sheet rubber, facing strong competition from
Thailand. As seen in Table 6.2, the two
rubber categories at the 6 digit level of the HS
code account for over 12 per cent of the
total Sri Lankan rubber exports of $ 29
million.
More than 90 per cent of Sri Lanka’s tamarind
and betel leaves exports are to Pakistan.
Pakistan imports 5000-6000 metric tons of
betel leaves annually, most of which is
supplied by Thailand and Sri Lanka, and to a
lesser extent Bangladesh and India. Pakistani
production is small at about 125-150 metric
tons, and the dominant consumption markets
are Karachi and Lahore.
The main exception to the rule of Pakistan
being an important destination for particular
exports, is tea. At the six digit level of the HS
code, tea is the single largest export to
Pakistan, valued at close to $8 million.
However, this represents a very small 1.1 per
cent of Sri Lanka's tea exports, the main
markets being the Middle East and the C.I.S.
countries. Sri Lanka is also not the major
supplier of tea to Pakistan, providing less than
5 per cent (by volume). In 2000, total tea
exports to Pakistan were 4,089 metric tons,
consisting of 4,043 metric tons of bulk tea
and smaller quantities of tea imported/re-
exported, tea in packets and tea bags.
6.2.2 Imports
Pakistan has been a traditional supplier to Sri
Lanka of rice, dried fish, raw cotton, cotton
yarn, and cotton fabrics, leather goods,
chemicals, pharmaceuticals and, fruits and
vegetables. About 30 per cent of Pakistan’s
total exports to Sri Lanka consist of primary
commodities, and the rest of semi
manufactured or manufactured products. The
major import items from Pakistan (Table 6.3)
are dried fish, Bombay onions, potatoes, rice,
textile fibres, oranges, apples, tube pipes and
hollow profiles/mechanical machinery and
parts.
65


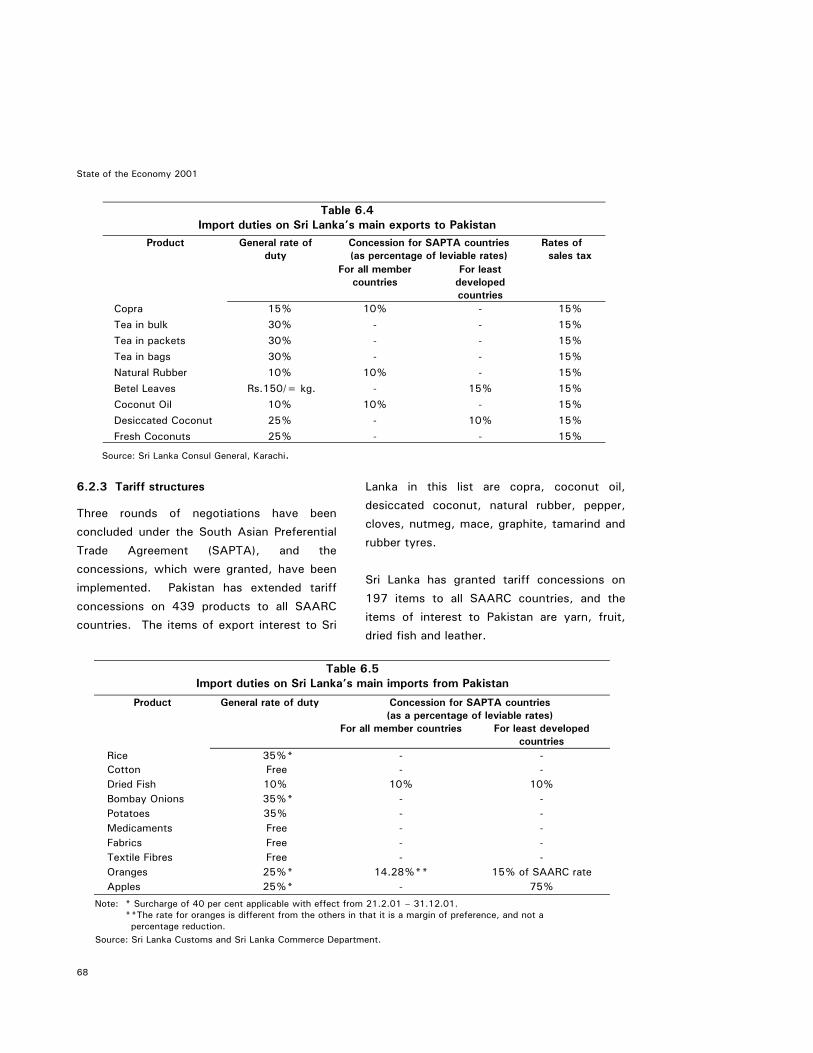
State of the Economy 2001
6.2.3 Tariff structures
Three rounds of negotiations have b
concluded under the South Asian Prefere
Trade Agreement (SAPTA), and
concessions, which were granted, have b
implemented. Pakistan has extended t
concessions on 439 products to all SA
countries. The items of export interest to
68
Import duties on Sri Product General rate of
duty
Copra 15% Tea in bulk Tea in packets Tea in bags
30% 30% 30%
Natural Rubber 10% Betel Leaves Rs.150/= kgCoconut Oil 10% Desiccated Coconut 25% Fresh Coconuts 25%
Source: Sri Lanka Consul General, Karachi.
Import duties on Sri L
Product General rate of dut
Rice 35%* Cotton Free Dried Fish 10% Bombay Onions 35%* Potatoes 35% Medicaments Free Fabrics Free Textile Fibres Free Oranges 25%* Apples 25%*
Note: * Surcharge of 40 per cent applicable with **The rate for oranges is different from the
percentage reduction. Source: Sri Lanka Customs and Sri Lanka Commer
Table 6.4 Lanka’s main exports to Pakistan
Concession for SAPTA countries (as percentage of leviable rates)
For all member countries
For least developed countries
Rates of sales tax
10% - 15% - - -
- - -
15% 15% 15%
10% - 15% . - 15% 15%
10% - 15% - 10% 15% - - 15%
een
ntial
the
een
ariff
ARC
Sri
Lanka in this list are copra, coconut oil,
desiccated coconut, natural rubber, pepper,
cloves, nutmeg, mace, graphite, tamarind and
rubber tyres.
Sri Lanka has granted tariff concessions on
197 items to all SAARC countries, and the
items of interest to Pakistan are yarn, fruit,
dried fish and leather.
a
y
e
c
Table 6.5 nka’s main imports from Pakistan
Concession for SAPTA countries (as a percentage of leviable rates)
For all member countries For least developed countries
- - - -
10% 10% - - - - - - - - - -
14.28%** 15% of SAARC rate - 75%
ffect from 21.2.01 – 31.12.01. others in that it is a margin of preference, and not a
e Department.

Sri Lanka-Pakistan bilateral free trade agreement
Sri Lankan coconut products face a 25, 15 or
10 per cent tariff depending on the specific
product, while Pakistan imposes a 30 per cent
duty on tea (Table 6.4). A recent report from
Pakistan, stated that the next Federal Budget
due in June 2001, may reduce import duty on
teas, from 25 per cent to 15 per cent, in order
to counter smuggling, which has become a
major problem recently. However, contrary to
expectations the import duty was increased
from 25 per cent to 30 per cent, possibly for
revenue purposes, and to enhance their
negotiating leverage with some of its regional
partners like Sri Lanka and Bangladesh.
Currently, Pakistan offers concessions to
Bangladesh, the Maldives, Nepal and Bhutan
as least developing countries, that creates a
competitive price advantage for these
countries in products (e.g., tea and betel
leaves vis-a-vis Bangladesh) with which Sri
Lanka competes.
Among the products currently exported by
Pakistan to Sri Lanka, textile fabrics are free
of duty. Most of the agricultural exports from
Pakistan such as rice, potatoes, and bombay
onions face a 35 per cent duty in Sri Lanka
(Table 6.5). With the liberalization of all non-
tariff barriers in the agricultural sector in
1996, changes to the duty, and imposition of
surcharges, have been the main instrument of
protection for the local agricultural sector.
Fruits, such as oranges and apples, which are
imported from Pakistan, attract a 25 per cent
duty in Sri Lanka. It has been argued that Sri
Lanka’s quarantine regulations restrict the
import of fruits from Pakistan, and this may a
negotiating concern.
6.3 Impact of a bilateral FTA
Given that Pakistan is not a major trading
partner of Sri Lanka, it is not expected that a
FTA will have a dramatic impact on the
economy.
Increased competition- A FTA will mean that
duties on Pakistan's imports will be phased to
zero, and hence lead to increased competition
for import-substituting industries. However,
there are some sectors Sri Lanka would want
to protect from competition and hence a
negative list that excludes particular products
from the FTA need to be drawn up. At a
minimum the negative list should include all
the products exempted in the India-Sri Lanka
Free Trade Agreement, which included all
agricultural products, including fisheries and
livestock products, and selected industrial
products. Further, the design could follow a
phased liberalization on the basis that certain
sectors need further time to adjust, and
should be given a longer time frame for
liberalization. India appreciated Sri Lanka’s
concerns regarding the inclusion of these
items in the negative list, and it is likely that
Pakistan would do the same.
Presumably, it is Pakistan’s intention to utilize
the proposed FTA to propel their
manufactured goods into the Sri Lankan
market. Pakistan produces a range of
manufactured goods, such as electrical
appliances, sanitary fittings, pharmaceuticals,
chemicals, cement, bicycles, which Sri Lanka
currently imports, mainly from other sources.
Last year, a Pakistani built three-wheeler by
Memon Associate Foundry, was launched in
Colombo by Shanthi Gunaratne Motor Co. Ltd.
69

State of the Economy 2001
and is expected to be competitive in the local
market because of its price and quality. Also
last year, a Sri Lankan company, Hayleys,
entered into an agreement with a Pakistani
company, World Call Payphones Ltd., which
will initially provide payphones and prepaid
card services.
Although local industries may be hurt by
some cheaper imports, the Sri Lanka-Pakistan
FTA will also mean increased competition for
Indian imports of similar quality to Sri Lanka.
This will provide variety to the local Sri
Lankan market and exert downward pressure
on prices.
Expanding export markets- The duty
concessions envisioned in an FTA are
expected to expand existing product markets
and create opportunities for new products to
enter the Pakistan market. In particular, an
FTA would seek to eliminate the advantages
that least developing countries like Bangladesh
have when they compete with Sri Lankan
goods in the Pakistan market, as in the case
of betel leaves where Sri Lanka has to pay a
duty of Pakistani Rs. 150 per kg, while
Bangladesh has a 15 per cent tariff
concession.
Besides primary commodities, Sri Lanka
recently has exported some semi-
manufactured and manufactured products,
such as plastic products, rubber tyres and
tubes, and rubber products. Every attempt
should be made to gain free trade in these
markets, and not have them placed in
Pakistan's negative list, so as to help diversify
Sri Lanka's export base.
The key to a penetration of the Pakistan
market is seen to be through the export of
tea. Being a strong source of foreign
exchange since it is not highly import-
intensive like the garments trade, Sri Lanka
is very interested in gaining access to the
huge Pakistan tea market. Pakistan is a major
importer of tea, the third largest in the world
after Britain and Russia, and has the potential
to grow further. About twenty years ago,
Pakistan imported tea mainly from Sri Lanka,
but over the years, Sri Lanka has lost ground
to cheaper CTC (Cut, Tear and Curl) teas,
particularly from Kenya. The annual tea
imports into Pakistan range from 135,000
metric tons to 140,000 metric tons, of which
about 20 -25,000 metric tons are smuggled
into Pakistan. The unofficial trade is said to
take place along Pakistan’s common border
with Iran/Afghanistan through the towns of
Quetta and Peshawar, and the smuggled teas
are said to come into big bazaars known as
the ‘Bara’ markets.
The bulk of Pakistan’s tea requirements are
supplied by Kenya, Indonesia and Tanzania, as
seen in Table 6.6. Sri Lanka supplies around
5 per cent while Kenya provides around 65
per cent of Pakistan’s tea requirements. Most
of the teas supplied to Pakistan from Sri
Lanka are tea in bulk, and any
elimination/reduction of the import duty on
bulk tea, within the framework of a FTA,
would be of considerable benefit to the local
tea industry. The potential for success is also
greater because there is no import-competing
domestic tea sector in Pakistan that would
fight to prevent entry of Sri Lankan tea, as
70

Sri Lanka-Pakistan bilateral free trade agreement
Table 6.6 World exports of tea to Pakistan
Volume (thousand tons)
Value ( thousand US$)
Price per ton (thousand US$)
1998 1999 1998 1999 1998 1999 Kenya 65.9 69.6 154,489 151,299 2.34 2.17 Indonesia 13.7 11.7 26,037 15,338 1.93 1.31 Tanzania 3.7 3.7 8,161 6,190 2.19 1.68 Bangladesh 5.1 9.8 9,822 5,618 1.94 0.57 Sri Lanka 3.9 4.4 9,127 7,439 2.4 1.68 Grand Total 111.6 107.7 246,608 210,666 2.21 1.96
Source: International Tea Committee, various issues.
was the case in India. The Pakistani
consumer also gains from lower prices of tea.
The main obstacle to penetrating the Pakistani
market is that currently the country imports
mainly CTC teas, which Sri Lanka does not
produce in large quantities. However, a low
grown grade, similar to CTC teas, is produced
in Sri Lanka, and this may prove acceptable to
the Pakistan tea trade, provided the price is
competitive. Any reduction/elimination of the
import duty on teas imported into Pakistan
from Sri Lanka could be vital in this regard,
since Pakistan is a price sensitive market.
Investment inflows- Perhaps the source of
the greatest potential benefits in terms of
employment generation and output to Sri
Lanka could be that from investment flows
into the country to produce goods to cater to
markets affected by the tension in India-
Pakistan relations. The argument works in
two directions. First, Indian investment in Sri
Lanka could produce goods mostly in Sri
Lanka (to meet rules of origin criteria) and
then export them to Pakistan under the SL-
Pakistan FTA. Similarly, Pakistani investment
in Sri Lanka can cater to the Indian market
through the Sri Lanka-India Free Trade
Agreement. Of course this potential benefit
of investing in Sri Lanka is not restricted to
investors of the two countries in question, but
given their volatile relations it is most relevant
to them.
For example, a large Indian paint company,
Asian Paints, is already moving into the Sri
Lanka paints market, through the acquisition
of a local paints company, Delmege Paints.
This company and others may well utilize the
openings in the Pakistan market, which may
not be available from India.
6.4 Lessons from the Sri Lanka-India FTA
-- a year after 6.4.1 The outturn
The short-term results of the Sri Lanka-India
Free Trade Agreement (see State of the
Economy 1999 and 2000 for details)20 have
been disappointing for Sri Lanka. Finally
implemented in March 2000, after having 20 Under the Agreement, India agreed to remove tariffs on a number of products immediately and phase-out tariffs on the remaining products over three years, subject to a negative list of items. In return, Sri Lanka has agreed to remove tariffs on a lesser number of products immediately but phase-out tariffs over a longer time frame (8 years), also subject to a negative list.
71

0904 Pepper 17.7 17.4 3.5 2.9 8703 Motor vehicles and other motor vehicles - 16.6 - 2.8 4802 Uncoated paper and paperboard 13.0 15.9 2.6 2.7 2304 Oil-cakes and other solid residues 12.5 14.6 2.4 2.4
Total 511.6 600.1 100 100
Source: Sri Lanka Customs, External Trade Statistics 2000.
State of the Economy 2001
HS Code
Table 6.7 Top 10 exports to India, US $ million, 1999-2000
Value (US$ million)
Share of total
exports
Description 1999 2000 1999 2000 0904 Pepper 10.3 10.3 21.1 17.7 2707 Oils and other products of the distillation of coal tar - 5.6 0.0 9.6 7204 Ferrous waste and scrap 4.2 5.4 8.6 9.3 4707 Recovered waste and scrap paper or paperboard 2.8 3.9 5.8 6.8 0902 Tea 2.2 3.9 4.6 6.7 3926 Other articles of plastics 2.2 2.8 4.6 4.9 0907 Cloves 2.9 2.4 6.0 4.2 1520 Glycerol 2.6 2.4 5.4 4.2 0908 Nutmeg, mace and cardamoms 1.7 2.3 3.4 3.9 5402 Synthetic filament yarn (other than sewing thread) 0.7 1.9 1.5 3.2 0813 Fruit, dried 3.1 1.7 6.4 2.9
Total 48.6 58.0 100.0 100.0 Source: Sri Lanka Customs, External Trade Statistics 2000.
been signed in December 1998, the bilateral
FTA with the country's largest neighbour has
done little in the way of promoting export
penetration of the huge Indian market.
Sri Lanka has not been able to fully exploit the
concessions agreed under the FTA so far. In
fact by the summer of 2001, it had failed to
sign the documentation that would activate
the second phase of concessions under the
FTA. Exports under the FTA amounted to a
paltry US$ 9.2 million, which was only 16 per
cent of total exports to India in 2000 (Table
6.7). The main exports using the FTA
concessions were paper and wastepaper (US$
4.3 million), copper scraps (US$ 1.65 million)
and tea (US$ 1.1million) which made up 47,
18 and 12 per cent of all exports through the
HS Code
Table 6.8 Top 10 imports from India, US $ million,1999-2000
Value ($million)
Share of total
imports
Description 1999 2000 1999 2000
5209 Woven fabrics of cotton 26.9 32.8 5.3 5.5 3004 Medicaments 20.8 31.7 4.1 5.3 0713 Dried leguminous vegetables 31.4 30.6 6.1 5.1 5205 Cotton yarn (other than sewing thread) 23.2 30.6 4.5 5.1 8702 Motor vehicles - 21.4 - 3.6 5209 3004
Onions, shallots, garlic, leeks and other alliaceous vegetables
11.4 17.8 2.2 3.0
Source: Sri Lanka Customs, External Trade Statistics 2000.
72
0904 Pepper 17.7 17.4 3.5 2.9 8703 Motor vehicles and other motor vehicles - 16.6 - 2.8 4802 Uncoated paper and paperboard 13.0 15.9 2.6 2.7 2304 Oil-cakes and other solid residues 12.5 14.6 2.4 2.4 Total 511.6 600.1 100 100

Sri Lanka-Pakistan bilateral free trade agreement
Table 6.9 Foreign direct investment projects approved under Indo-Lanka FTA
March 2000 to June 2001 Company Activity Country Value
(Rs. mn.) Employ-
ment Status
SMS Steel Stainless steel waters tanks
Sri Lanka Malaysia
40 20 In operation
Merbok MDF boards Malaysia 1800 100 In operation
I-E Technics Instant hot water showers Sri Lanka 30 40 In operation
Steel Marketing Mumbai
Copper, aluminum & zinc recycle
India 189 100 In operation
Singhal Commodi Copper, aluminum & zinc recycle
India 55 40 Under Implementation
Dinesh International Metal ingots India 30 Awaiting Implementation
Seema Investment Metal ingots metal products
India 100 Awaiting Implementation
Indian Rayon Carbon black FR tyre India 1500 90 Awaiting Agreement
Kedar Metals Metal oxide chemical India 160 Awaiting Agreement
Euro-Asia Metals Metal ingots & metal rods etc.
India 60 Awaiting Agreement
Source: FTA Secretariat, BoI.
FTA, respectively. Other exports were
modules, copper expeller cake, ice cream
machines, goraka, marble slabs and ceramic
products and pharmaceuticals.
The two main exports, tea and garments
came under a quota. Of the quota allocation
of 11.25 million kgs of tea and 6.67 million
pieces of garment exports (of which a
minimum 5 million pieces were to be made of
Indian fabrics) eligible for preferential tariffs
for the period April to December 2000, Sri
Lanka exported only 0.459 million kgs of tea
to India, which accounted for a mere 4 per
cent of the tea quota (and 28 per cent of total
tea exports to India). In the case of garments,
exports of 497 pieces amounting to only US$
30,000, represented less than 1 per cent of
the total quota allocation of garment exports
to India for the same period.
In terms of foreign investment generated by
the FTA, the outcome has also been
lacklustre. The Board of Investment (BoI)
approved 7 foreign investment projects (of which 4 are in commercial operation, one under implementation and two awaiting
implementation) with 3 more to be approved.
Most of the investments have come from
Indian companies. There are plans to expand
two existing BoI projects to cater to the Indian
market.
While the initial effects have shown no
promise, it may be too early to definitively
judge the agreement and there still may be
potential gains. India provides a large market,
and in a global recession, India is one of the
few economies expected to grow by at least 5
per cent in 2001. Further, its future potential
is excellent as long as reform continues.
73

State of the Economy 2001
6.4.2 The lessons
However, there are lessons to be learned in
terms of negotiation strategies and in the
implementation process that Sri Lanka must
apply to any agreement with Pakistan.
• Bilateral FTAs must represent deeper or
equal liberalization to any existing regional
FTA. Under the Sri Lanka-India FTA there
were some products such as cloves which
had less favourable concessions compared
to SAPTA concessions. This created much
confusion among exporters as they did not
know which agreement- SAPTA, the
Bilateral FTA with India, the Generalized
System of Preferences or the Bangkok
Agreement, - was the optimal one for them
to use when exporting to India. The lack
of transparency clearly was an example of
the adverse effect of a "spaghetti bowl" of
agreements and concessions that develops
when regionalism is pursued. Thus, it is
important to streamline the process,
particularly with bilateral agreements.
• Choice of ports is important. Sri Lanka
was particularly hurt by choosing
destination ports for tea that were in areas
of tea production (Calcutta and Cochin),
and away from tea consumption areas.
This was especially important given the
infrastructure within India.
• Require training of customs personnel
before the agreement comes into force.
Many losses were sustained by local
exporters as a result of Indian customs
officials failing to recognize and approve
the concessions of the new agreement.
Besides incurring losses, this acts to turn
away exporters from the Indian market as
administrative delays act as protectionist
devices.
• Design a dispute settlement mechanism
with designated time frames to resolve any
concerns.
• Package FTA with investment initiatives.
The failure to bring FDI was disappointing,
and more efforts need to be made to
secure foreign investment. However,
these inflows are affected by larger issues
than just a FTA- in particular the level of
uncertainty in the country.
• Prior discussion and debate on the FTA is
healthy. Not only may it help directly with
negotiations, it provides a time for
exporters to adjust prior to the agreement
such that upon implementation, immediate
results may be visible. 6.5 Conclusions
The impact of the Pakistan- Sri Lanka bilateral
FTA is not likely to be dramatic given that
appropriate negative lists are drawn up. Sri Lanka does have a potential to expand into
the world 's third largest tea market.
However, it would be unwise to follow a
general strategy of bilateral FTAs with the
sole purpose of expanding our tea export
markets. Each agreement should be analyzed
carefully for the potential impact on the
import substituting industries as well as
74

Sri Lanka-Pakistan bilateral free trade agreement
Box 6.1
Sri Lanka- Bangladesh free trade agreement ?
The idea of a Sri Lanka- Bangladesh free trade
agreement gained favour in some circles as
SAARC regional initiatives looked lacklustre.
However, a glance at the bilateral trade
relations suggests that a FTA is definitely
unwarranted. In a static sense, the size of the
trade between the two countries is so low, it
does not warrant the huge negotiation costs
involved in designing a formal document. In a
more dynamic sense, the lack of trade with
Bangladesh is attributed to inherent similarities
in industrial structure that results in a lack of
trading opportunities according to comparative
advantage, even in the presence of a FTA. Sri
Lanka and Bangladesh are basically trade
competitors- producing and exporting similar
products, with garments being the major
export in both countries.
In recent years, Sri Lanka has registered a trade
surplus with Bangladesh. However the actual trade
flows are extremely small, with total exports
amounting to only $ 8.5 million (which represents
0.16 per cent of Sri Lanka's total exports) and total
imports worth $3.6 million (accounting for 0.06 per
cent of Sri Lanka's total imports) in 2000
(Table 6.1).
The main exports to Bangladesh are coconut oil,
natural rubber, synthetic yarn, wall tiles, conch
shells and plastic products. In fact, Bangladesh is
the main export market for Sri Lanka’s coconut oil,
with Pakistan taking second place. However,
overall coconut oil production and exports have
been on a decline since 1996. Coconut oil exports
have declined as a result of increasing supplies in
the world market, the substitution to vegetable oils
such as palm oil and soya bean oil, and the
diversion of coconut to the expanding desiccated
coconut industry.
However, it is noteworthy that Sri Lanka has
been able to penetrate the Bangladesh market
even in a small way with several new
products such as ceramic products, plastic
products, diamonds, toys, soap, crown corks,
rubber tyres and tubes.
With respect to imports, the main
commodities are jute bags and sacks, woven
fabrics of jute, cotton yarn, beedi tobacco and
medicaments. A more significant development is the number
of Sri Lankan investors who have established
garment industries in Dhaka, in order to utilize
the advantages of Bangladesh's extra
preferential access to developed country
markets as a result of its least developed
country status. In fact, the Board of
Investment of Bangladesh had approved forty
investment projects from Sri Lanka, many of
them operating from Dhaka. Other Sri Lankan
investment initiatives in Bangladesh include
the establishment of financial services
operations in areas such as leasing, money
broking, and credit card services.
75

State of the Economy 2001
76
Top 10 exports fromHS
Code Description
1513 Coconut (copra), palm kernel or bab4001 Natural rubber and similar natural gu5402 Synthetic filament yarn (other than s6908 Glazed ceramic flags and paving, he3808 Insecticides, rodenticides, fungicides0508 Coral and similar materials 3926 Other articles of plastics 3507 Enzymes 7326 Other articles of iron or steel 4819 Cartons, boxes, cases and bags and
Total
Source: Sri Lanka Customs, External Trade Statisti
Top 10 imports to SHS
Code Description
6305 Sacks and bags 5310 Woven fabrics of jute or of othe2401 Unmanufactured tobacco 5205 Cotton yarn (other than sewing 5307 Yarn of jute or of other textile b8507 Electric accumulators, including3004 Medicaments consisting of two 5607 Twine, cordage, ropes and cable8438 Machinery 3003 Medicaments consisting of mixe
Total Source: Sri Lanka Customs, External Trade Statist
discussion regarding the FTA, exporters w
have time to make adjustments prior to t
implementation of the agreement, th
showing immediate benefits of the FTA. T
greatest potential benefit is throu
investment flows into Sri Lanka, catering n
only to the local market but facilitating tra
between the Indian and Pakistani market.
Table 6.10 Sri Lanka to Bangladesh, 2000
Value (US$. Mn.)
Share of total SL exports to Bangladesh
assu oil 2.1 24.08 ms 1.1 12.63 ewing thread) 0.7 7.97
arth or wall tiles 0.6 6.84 and similar products 0.5 5.63
0.4 4.93 0.4 4.39 0.3 3.96 0.3 3.10
other packaging containers 0.3 2.93 8.6 100.00
cs 2000.
Table 6.11 ri Lanka from Bangladesh, 2000
Value (US$. Mn.)
Share of total SL imports from Bangladesh
1.3 14.65 r textile based fibres 0.7 7.70
0.4 4.56 thread) 0.3 4.02 ased fibres 0.2 2.13 separator 0.2 1.92 or more constituents 0.1 1.00 s 0.1 0.69
0.1 0.63 d/unmixed products 0.0 0.55
3.6 100.00 ics 2000.
on exports. Given adequate exposure and The design of the FTA must be such that it
illhe
us
he
gh
ot
de
represents a deeper level of liberalization for
every single product category. This is to
prevent an overlapping of concessions that
reduce transparency and hamper trade.
Further, it is important to develop an anti-
dumping and countervailing duties legislation so
that if local enterprises face unfair competition
(say due to foreign government subsidization of
their exports), local industries have an avenue
of action (see Box 4.2).

Governance
7. Governance 7.1 Introduction
Effective governance is critical at this juncture
in Sri Lanka's history. Faced with intricate
political coalition management, a security
threat and a global and domestic environment
requiring strategic economic management,
slippages in governance have large negative
consequences. Thus, it is vital to address the
current inadequacies in governance structures,
processes and personnel that have contributed
to a serious level of ineffectiveness, which, in
turn, has adversely affected the country’s
development.
A major contributor to the ineffectiveness of
governance stems from the continuing
confusion as to perceptions of the role of
governance. This absence of clarity has its
roots in layers of perception that lie embedded
in the Sri Lankan polity, the economy and the
society. These perceptions are hangovers
from the different situations that prevailed in
the colonial period, in the immediate post-
Independence period, in the post-1956 period
as well as in the post-1977 period. Each
period witnessed changes in the environment
of governance and in the demands thereon as
well as in the politico-socio-economic
ideologies that conditioned the mindsets of
those who governed. However, in no period
was there a conscious attempt to understand
the required role of governance. Nor was any
attempt made to articulate anew the changed
role of governance. Overhangs from the past
periods continue to remain despite
demonstrated irrelevancies. What was
attempted – and this too half-heartedly - was
to graft fresh roles on to existing structures.
There is, thus, an urgent need for a clear
definition of the role of governance in
response to the current and medium term
demands of economic and social development
in Sri Lanka. This is a priority task that should
receive the attention of the Government –
with the participation of the opposition in the
Parliament, the institutions of the private
sector and organizations of civil society.
Clarity on the roles and functions (based on
agreement and consensus) is essential for
providing a stable base for the organization of
the structures of the polity and the
bureaucracy.
The ensuing sections look at the impact of the
prevailing public policy management,
institutional overlap, marginalization of local
governance and quality of public sector cadre
on overall governance. It concludes with an
agenda of reform.
7.2 Overlap of institutions
The Sri Lankan polity has, since 1987,
evolved into a tri-level structure comprising
the Centre, the Local Communities and
Regions. This evolution was an accidental by-
product of an attempt to cope with the ethnic
conflict rather than a comprehensive exercise
of the restructuring of governance in order to
underpin a participatory democracy. The
outcome of this reluctant attempt has been
the failure to achieve a consensus on the
specific roles and functions at each of
the three levels. The absence of such a
77

State of the Economy 2001
transparent consensus, over the past two and
a half decades, has had two negative results:
• A continued entrenchment of the culture of political and administrative centralization.
• ‘Poaching’ of roles and functions, – mainly by the Centre21 – driven by a desire on the part of political and administrative individuals and groups22 for roles and functions that would bring power and benefits to them.
The outcome of this unresolved issue has
been the rapid proliferation of public sector
institutions – each claiming overlapping roles
and functions. There has not been – as should
have happened – a demise of institutions at
the Centre. Parallel institutions that were
created, as part of the devolutionary exercise,
remain in limbo. The Local Government
institutions at the community level, that could
have undertaken micro-management
responsibilities in regard to the delivery of
public goods and services, continue to be
onlookers at the margins. Added to all this,
are instances of new public sector institutions
being created (mainly at the Centre), such as
the Vegetable Board and the Fruit Board, for perceived fresh tasks without any serious
examination of the possibilities of existing
institutions being remodelled to carry out the
new tasks.23
21 The inclusion of a ‘Concurrent List’ of functions in the Thirteenth Amendment to the Constitution provided a convenient handle for this ‘poaching’ activity. 22 The vested interests that the majority of public sector trade unions has had in the continuance of centralized cadres is evident in the trade union agitation that has been a feature in the Nineties and after. 23 More often than not, the new demands tend to be short-term whilst the institutions, when created, assume a long life of their own.
The continuance, and even proliferation, of
irrelevant public sector institutions has created
a set of problems that include:
• The costs of governance being excessively high.
• The wasteful utilization of human resources in tasks that are redundant and the locking up of a sizeable segment of the workforce in unproductive activities.
• The prevalence of time and resource consuming delays in routine, transactional processes within the apparatus of governance that contribute to disaffection on the part of citizens.
Addressing the issue of the proliferation of
irrelevant public sector institutions is a matter
that has been placed on the agenda of
governance as far back as 1987.24 Whilst
there has been no dearth of periodic
pronouncements that recognize the issue,
they have not been matched by the required
action. 7.3 Effective public policy management
At the core of effective governance is
effective public policy management. This
truism led to an articulation of the essentials
of effective public policy management in the
previous publication ‘Sri Lanka: State of the
Economy – 2000’25 Ineffectiveness of public
policy management appears to have continued
into the period under review.
The proliferation of Ministries at the level of
the Cabinet at the Centre has continued and
24 Since attention was drawn to it by the Presidential Committee on Administrative Reforms. 25 See pages 59, 60 and 62 of “Sri Lanka: State of the Economy – 2000”, Institute of Policy Studies, Colombo.
78
Governance
in fact expanded. The Cabinet constituted
after the general elections in October 2000 46
Ministries. Even after a reconstitution in
September 2001, the structure of portfolios
lacks a systematic approach. The
multiplication of Ministries has contributed to
a series of negative outcomes. • It has diminished the potential for effective
policy management by denying essential coordination needed both in analysis during the stage of policy formulation as well as in progress and impact monitoring during the stage of policy implementation. Particularly inimical to effective policy management is the splintering of sectoral responsibilities and development concerns into miniscule ministries.26
• Ministers at the level of the Cabinet have had to be made responsible for fragmented, even single Departments, leading to increased involvement of Ministers and Deputy Ministers in the minutiae of the day to day administration tasks of Departments. This has, in turn, circumscribed the management role of public officials and reduced their capacity to provide the essential checks and balances against politically driven decisions. Further, this leaves the Ministers with little time to focus on their principal function of policy formulation and implementation monitoring.
26 For example, Indigenous Medicine is a Ministry in itself, separate from the Health Ministry. Food and Marketing Development is independent from the Ministry of Internal and International Trade. Land Development and Minor Export Agriculture is separate from the Agriculture Ministry. Recently, there has been some attempt to consolidate vocational training activities under the Vocational Training and Technical Education Ministry. These activities were being carried out by the Ministry of Vocational Training, the Ministry of Higher Education (via the Technical Colleges), and the Ministry of Science and Technology (via the National Apprentice and Industrial Training Authority). However, the need to separate it from Higher Education is not immediately apparent.
• The imperative role of sectoral and trans-sectoral ministries concerning public policy management tends to be neglected or are relegated to a secondary position. This also has led imperceptibly to the gradual centralization of the policy management role in institutions such as the Secretariat of the President or to concentration of multiple roles in single individuals.
• It has also contributed to excessive costs at a time of escalating budget deficits – thus unnecessarily complicating the task of budgetary management.
• The excessive costs contribute to avoidable burdens of taxation being imposed on the economy – affecting both producers and consumers. The burdens on enterprises deter potential investors from effecting new investments with adverse effects on growth and employment.
• The requirements of manpower to staff the job-slots that are created through the multiplication of ministries have contributed to staff expansion at high costs – at a juncture when public sector reforms have focussed on economizing on public expenditure.
• Given the increasing awareness of the citizenry of issues of governance, the presence of an excessively large Cabinet contributes to a resentful apathy on the part of citizens – which could, over time, grow into an endemic state of dysfunctional trends in the society and the economy.
Many of the development objectives that
demand effective public policy management
focus on crosscutting issues such as poverty
reduction, gender equity and youth concerns.
These require an integrated focus within the
institutional arrangements at the level of the
political executive, the absence of which leads
to sub-optimal and truncated policy
79

State of the Economy 2001
approaches being adopted with poor
outcomes and excessive resource use. Thus,
in the context of the fragmentation of policy
responsibilities that emerges from an enlarged
Cabinet, it is crucial to extend additional
efforts to design integrated policy packages.
The negative impact of ineffective policy
management is vividly illustrated in the
periodic crises experienced in the power
sector in regard to matching supply and
demand27 (see Chapter 8). Careful analysis
points to these crises being the outcome of
continuing management ineffectiveness that,
in turn, has generated both a capacity crisis
as well as a financial crisis. Tardiness in
making the required policy decisions, confused
decision making structures, avoidance of
taking timely and adequate notice of medium
and long term planning recommendations and
the absence of policy stability are some of the
critical factors that have contributed to the
avoidable crises. 7.4 The community-governance nexus
Accountability, based on transparency, is an
essential underpinning of effective
governance. This becomes all the more critical
in the delivery of public goods and services
that affect the daily lives of the citizenry – a
task that, in the Sri Lankan context, is more
appropriately managed at the community level
by the institutions of local governance.28
However, in post-Independence Sri Lanka,
local governance has not only been ignored
but has even been deliberately marginalized.
27 The most recent of these crises is the ongoing one of 2001. 28 See for example, ‘Effective Local Governance – The Foundation for a Functioning Democracy In Sri Lanka’ by Shelton Wanasinghe: IPS May 1999.
The outcomes of the marginalization of local
governance have been
• The burgeoning of the Centre and of the Provincial level with institutions that are concerned with the minutiae of micro-management of the delivery of public goods and services which could be more economically managed by arrangements at the local level.
• Difficulty in enforcing transparent accountability by citizens on the delivery of such public goods and services when the management of such goods and services rests at levels far removed from them.
• The inability of citizens at the community level to influence the decisions regarding management and financing of such public goods and services – which, in turn, affect the quality of outputs.
Thus, the marginalization of local governance
has, in effect, come to be the marginalization
of the citizenry who have become objects of
governance rather than participants.
An opportunity to rectify this situation has
apparently been missed by the non-
implementation of the recommendations of
the Presidential Commission on Local
Government, which submitted its Report as far back as early 1999.29 7.5 Human resources
Advancing effective governance also entails
addressing the shortcomings with regard to
human resources in the public sector.
29 Published as Sessional Paper 1 of 1999.
80

Governance
• Excessive number of cadres in institutions in the public sector.
Overstaffing permeates those institutions that have validity in the current structure as well as those deemed superfluous, based on a rational analysis of roles and functions of governance at the three levels.
• Lackadaisical approach to cadre management in public sector institutions.
This applies to regular departments, statutory bodies and corporations. Insufficient attention appears to be paid to organizational analysis, output norms, alternative approaches to task delivery etc. in assessing staffing needs.
The net result has been a proliferation of
personnel with a direct impact on public
finance deficits. By 2000, the numbers in the
regular cadres of government agencies had
risen to 856,665 from 737,504 in 1995- a 16
per cent increase over the five year period.
When compared with 1987 (the year in which
the Administrative Reforms Committee
recommended a 20 per cent reduction in the
then workforce of 406,359) the figure for
2000 represents a 110.8 per cent increase!
The cumulative outcome has been a vicious
circle. This is seen in the combination of
excessive personnel without any meaningful
tasks, the government finding itself in a strait
jacket to pay realistic wages because of the
large unproductive cohorts of personnel, and
the resultant failure to attract high quality
personnel due to poor wage structures.
The public sector cadre is characterized by
declining quality. Public institutions appear to
be unable to compete with the private sector
for quality human capital, with the better
outputs of the education and training system
shunning the public sector.30 The high degree
of politicization of the public service through
the control of recruitment and of management
practices such as transfers and promotions
has also adversely affected the quality of the
personnel. Increasingly, public sector
employees – through experience - have
become reactive rather than proactive in their
approach to their tasks. Safeguarding their
jobs and careers till their retirement appears
increasingly to be the priority. Attempts at
reducing politicization have been characterized
by pronouncements and promises rather than
action.
Much of the qualitative malaise in the public
sector could be countered by the adoption of
a practice of induction of personnel for
specific jobs, (as in the New Zealand reforms
– see Box 7.2) rather than to the All-Island
Services that are the core of the public sector
employment structure today.31 These All-
Island Services, characterized by their rapid
spatial mobility and their centralized
management, have increasingly become
irrelevant to the requirements of the task-
specialized job requirements of a devolved
polity. However, successful implementation
of this strategy requires a reduction of political
influence.
Job-specific induction would also provide
support to the practice of a process of
continuous upgrading of personnel linked to
30 Exceptions, no doubt, are found in the case of health are cadres who see in the public sector a perch from which to develop their private practice.
81
31 This has, increasingly, become the norm in most countries – with New Zealand providing an interesting example for study and adaptation.

State of the Economy 2001
their task requirements. This would reverse
the deterioration of training and development
in the public sector, and bolster the quality of
the cadres. 7.6 Conclusion
The agenda for the reform and restructuring of
governance is both wide-ranging as well as
urgent. Priority matters include:
• Clearly defining, within the context of 2001, the role of governance at the three levels of the devolved polity and of the specific functions of the institutions at each level.
• The streamlining of the ministerial portfolios leading to a restructuring and downsizing of the Cabinet of Ministers at the Centre.
• The provision of policy analysis support to the restructured Cabinet as well as to the streamlined ministries.
• Progressively shifting to job-based recruitment of personnel.
• Planning and implementing a rigorous exercise of review, winding up of redundant institutions, and reduction of cadres.
• Undertaking a planned implementation of the recommendations of the Presidential Commission on Local Government.
Many elements of this agenda have already been highlighted in the report on the State of the Economy 2000. Implementation remains elusive due to the increasing power of the vested interests – political, bureaucratic and trade union – that surround the issues involved. The reform agenda spells, in many instances, an end to the power bases that these vested interests have acquired over the years. In a climate of delicate political coalition management, this reform has become increasingly difficult. Only determined action by policy makers in government – backed by the civil society – would be able to break through these interests and set a reform process in motion.
82
Private sector policy ag
Successive governments in Sri Lanka have calleupon the private sector to function as the enginof growth. However, at a time of increasesecurity concerns, complex politicmanoeuverings and competitive challenges frothe global economy, the need for effectivgovernance to provide an environment conducivto investment and growth has magnified. Asuch, the private sector comprising of aChambers of Commerce, industry and employorganizations developed a policy agenda knowas A Way Forward Strategy, and presented thto the government in February 2001. Whioffering support to the government in facing thcurrent challenges, as long as the government consultative, the Joint Business Forum (JBdocuments the main issues that need to baddressed in the immediate future to facilitaprivate sector development.
Box 7.1 enda – “a way forward strategy”
d 1. Partnership Networks for Development
e d al m e e s ll
er n is le e is F) e
te
Appeals to the government to adopt a consensual approach towards addressing and resolving
national issues by developing effective partnership networks among all segments of society. This includes bi-partisan relationships with the opposition groups in the Parliament, the private sector through Chambers of Commerce, industries trade association, unions, academics, professional associations and other non-governmental organizations. Through this network of partnerships, the government should develop long-term policies, agreed on a bi-partisan basis and apply them consistently over an agreed timeframe to provide a stable and predictable environment.
Of primary importance is an effective and long-term resolution to the North-East conflict within a unitary Sri Lanka. Further, initiatives to ensure rationalization of administration, ethical governance

Governance
by the elimination of corruption and political patronage, law and order, security and reduced frequency of elections are needed. It also emphasizes the need for independent judicial, police, election and bribery commissions and political non-interference in the operations of these institutions.
2. Review of Private Sector Development Issues with a Council of Ministers
Quarterly review of policy issues and reforms
affecting the private sector. 3. Networked development and implementation of
a 10 year National Economic Development Plan
Asks the government to facilitate the development of
a 10-year national development plan, supported by
three separate rolling, 3-year sectoral plans.
4. Publication of White Papers Urges the government to publish White Papers on all
key policy and legislative reforms, in order to accommodate consultation and debate, which are essential features of participatory and transparent governance.
5. Law, Order and Security
Identifies the breakdown of law and order, and the continuing escalation of crime as the greatest danger to individual businesses and to the government. Critical factors responsible for the current situation include armed army deserters, drug abuse, poverty, political patronage, delays in the administration of justice, non-summary trials, the 1978 constitution that places the President above the law, the absence of an independent Police, Judicial and Public Service Commissions, rampant corruption among police officers, and non-enforcement of existing laws.
83
6. Labour Reforms
Seeks a review of labour policy to ensure a flexible labour market consistent with efficiency and equity considerations, and supports the proposals made by the Presidential Task Force on Labour Reforms (Private Sector Employment). Urgent issues that need to be addressed include restriction on overtime hours by females under the Factory Ordinance and the Shop and Office Employees Act, uncertainties and delays in the process of retrenchment and layoffs, reviewing private sector holidays, contract labour, the law relating to the right to strike and unfair labour practices, and wage fixation.
7. Infrastructure Development
Infrastructure facilities need to be strengthened to facilitate rapid economic development. It is imperative that large scale power generation projects are implemented without further delay (see chapter 8), and the deregulation of the monopolistic power generation and distribution is pursued. Other priorities include increasing the efficiency and effectiveness of port operations, building an effective and efficient road network, improving public and freight transport and developing telecommunications.
8. Legal Reforms
Pushes for the enactment of the proposed i) Companies Bill; ii) the Anti-dumping and Countervailing Bill (see Box -Chapter 4); iii) the Consumer Protection Authority Bill without
i) Companies Bill; ii) the Anti-dumping and Countervailing Bill (see Box -Chapter 4); iii) the Consumer Protection Authority Bill without price control mechanisms, and exclusions from competition laws for the Government, public corporations and government-granted monopoly entities (see chapter 4); iv) the new Inland Revenue Act. Other laws that need defining include intellectual property with respect to the information technology field, private sector provident funds, independence in the Telecommunications Regulatory Commission, Chapter 11 type laws. The JBF also calls for the enforcement of the new Insurance Law.
9. Education Reforms Asks the government to involve the private sector in
policy formulation and allow entry of private universities. The Way Forward Strategy advocates curriculum changes along a facilitated learning model over a straight lecture teaching model, and supports the move to use English as the medium of learning. It emphasizes the need to have an institutional mechanism to ensure an accountability and performance management system in the education sector, as well as a professionally developed social marketing plan to communicate the education reforms to the public
10. Administrative Reforms
Calls for the appointment of a Director General of Revenue Services to deal with numerous problems faced with the Customs, Excise and Inland Revenue Departments, as well as clarification on tax issues related to the software industry among other proposals.

State of the Economy 2001
BoThe New Z
The public sector reforms that were introduced inserved as a model for reform efforts in other counttraditions, political imperatives and pragmatic uncompromising or extreme version of managerialism
Reform goals • Improvement of the effectiveness and efficiency of t
• Enhancing the responsiveness of public agencies to t
• Reduction of public expenditure;
• Reduction of the size of the core public sector; and
• The improvement of managerial accountability. Key principles
• The government should be involved only in thosecarried out by non-governmental bodies such as priv
• Any commercial enterprises that are retained withprivate sector companies.
• The goals of departments, corporations and indivclearly as possible.
• Responsibilities that are potentially conflicting shostructures.
• There should be a clear and publicly articulatedExecutives of departments.
• Preference should be given to governance structure
• Whenever possible, publicly funded services should
• In the interests of administrative efficiency and conlocated as close as possible to the place of impleme
In more specific policy terms, the New Zealand mode
1. A strong emphasis on the use of incentives to enhalevel. These would include short-term employmenpromotion systems etc.
2. An extensive use of incentives, explicitly written performance required and the obligations, respective
3. The development of integrated and relatively sophsystems throughout the public sector.
4. The removal, to the maximum possible, of dual or and the avoidance of joint central and local democra
5. The institutional separation of commercial and nonregulatory functions.
6. The maximum decentralization of production and m
84
x 7.2 ealand Model
New Zealand since the mid-1980s have increasinglyries. The reforms were based on a range of theoreticaljudgments by ministers and were not a radical,.
he public sector;
heir clients and customers;
activities that cannot be more efficiently and effectivelyate business and voluntary agencies.
in the public sector should be structured along the lines of
idual public employees should be stated as precisely and
uld, as far as possible, be placed in separate institutiona
separation of the responsibilities of Ministers and Chief
s that minimize agency costs and transaction costs.
be made subject to competitive tendering.
sumer responsiveness, decision-making authority should bentation.
l has now come to embrace the following elements.
nce performance both at the institutional and the individuat contracts, performance-based remuneration systems and
contracts of different kinds that specify the nature of thely, of the principals and agents. isticated strategic planning and performance management
multiple accountability relationships within the public sectortic control of public services.
-commercial functions as well as of advisory, delivery and
anagement decision-making.
Crisis in the power sector
8. Crisis in the power sector 8.1 Introduction
With the commencement of power cuts on
July 2, 2001, Sri Lanka officially faces a
power crisis for the second time in 5 years.
Although amidst high petroleum prices and
low rainfall for the second consecutive year,
many experts argue that the crisis is not the
result of unanticipated external events,
because the below average rainfall levels are
consistent with systemic cycles and early
forecasts of the Meteorological Department.
The crisis is a management crisis at the
national power utility, Ceylon Electricity Board
(CEB), that has manifested itself into a
capacity crisis and a financial crisis.
The magnitude of the crisis is similar (with
initial one and a half hour power cuts
extending to a high of seven hours),
compared to the severe crisis in 1996 which
witnessed power cuts increasing to eight
hours during the worst period. The direct
adverse economic impact is likely to be
almost as large, though ameliorated by the
increase in private standby generation
capacity.
The challenge for the power sector is to
expand capacity to meet the rising demand,
while keeping electricity tariffs (prices)
affordable with the least possible damage to
the environment. The ensuing section details
the rising demand for electricity, and tracks
the failure to develop sufficient generation
capacity and the unfolding of the financial
crisis at the CEB. It looks into approaches to
address the capacity crisis and its impact on
electricity tariffs and rural electrification. It
concludes by addressing issues of broader
reform in the power sector, and in particular
the CEB.
8.2 Profile of electricity demand
The access to a reliable, clean and affordable
source of energy is vital for the economic,
social and human development of a country.
The scope of economic activity in the
industrial and service sectors, mobility, and
access to information are increasingly
dependent on modern technology that
requires energy to drive them. Among the
different sources of energy available,
electricity -- being a clean source of energy
that can be easily transmitted to far away
places and converted to other forms of
energy with little loss -- has become an
essential pre-requisite for development.
With the growth of manufacturing and
services industries, and rising living
standards, both the quantity of electricity
demanded and the number of electricity
consumers in the country have been steadily
increasing (see Figure 8.1 and Table 8.1). In
fact, demand has tended to double every ten
years since 1970. The industrial sector is
the largest consumer of electricity, but the
greatest increase in demand has come from
the domestic sector, especially in the last
decade. The growth in demand of domestic
users reflects both an increase in per capita
85

State of the Economy 2001
Figure 8.1 Index of number of electricity consumers
by tariff category (1975=100)
consumption as well as a dramatic increase in
the number of users, which reflects the
progress of rural electrification schemes. The
CEB estimates that in the next 10 years, the
demand for electricity will grow at an average
of 10 to 12 per cent a year. That is,
currently, the demand for electricity is
increasing by approximately 650 GWh a year.
To sustain this growth, the present supply
capacity will need to be increased by about
160 MWs a year.32
32 1 Giga Watt =1,000 Mega Watts or 1,000,000 Kilo Watts.
8.3 The twin crises - the capacity crisis and the financial crisis
8.3.1 Development of electric generation
capacity
0 1995 2000
al Industrial
Hydro electric power has traditionally been
the main source of electricity generation in Sri
Lanka, and was first introduced on a large
commercial scale to the country in 1950 with
the construction of the Laxapana power
generating station. During the 1950-74
period four hydro power stations with a total
installed capacity of 275 MW were built using
two main tributaries of the Kelani River.
The Accelerated Mahaweli Development
Programme provided a major boost to hydro-
electric generating capacity during 1976-
1990. Six major power plants with a
combined capacity of 660 MW and capable
of generating 2,032 GWh of electricity
annually were constructed under this scheme.
However, additions to the national grid have
been limited since 1990. Despite the fact
that total sales grew by 50 per cent from
Electricity sales bYear Domestic Comme
1970 62 8
1975 85 11
1980 187 22
1985 337 28
1990 496 42
1995 1014 63
1999 1526 82
2000 1700 89Source: Ceylon Electricity Board.
86
Table 8.1 y consumer category (GWh) rcial Industrial Other Total
8 331 180 661
9 522 238 964
3 626 357 1393
0 850 594 2061
3 910 778 2607
1 1527 743 3915
9 1613 841 4809
5 1755 908 5258
Source: Ceylon Electricity Board.
0
500
1000
1500
2000
2500
3000
1975 1980 1985 199
Domestic Commerci

4514 3249 4152 3154
(100) (94) (74) (68) (47)
- - 3 17.8 43.1
(-) (-) (1)
Thermal - CEB 5 269 974 1396 2205
(-) (6) (22) (23) (33)
Thermal - Private Providers - - - 507 917
(8) (14)
Thermal - Hired - - 152 - 364
(3) - (5)
Wind - CEB - - - 3.5 3.4
(-) (-)
3150 4783 4378 6077 6686
Note: Shares of total generation given in parentheses, (-) indicates a negligible percentage; shares may not add up to 100 due to rounding off.
1990 to 1995, the Samanalawewa hydro
Crisis in the power sector
Table 8.2 Available capacity (MW) – selected years*
1990 1995 1996 1999 2000 Hydro - CEB 1017 1137 1137 1137 1137
(79) (81) (78) (67) (62)Hydro-Small - Private Providers - - - 6 12
(-) (1)Thermal- CEB 272 272 272 453 453
(21) (19) (19) (27) (25)Thermal -Private Providers - - - 92 174
(5) (9)Thermal- Hired - - 44 - 58
(3) - (3)Wind- CEB - - - 3
(-) 3
(-)
Total 1289 1409 1453 1691 1838 Note: *Shares of total capacity given in parentheses; (-) indicates a negligible percentage; shares may not
add up to 100 due to rounding off. Source: Ceylon Electricity Board.
Table 8.3 Gross generation (Gwh) – selected years*
1990 1995 1996 1999 2000
Hydro - CEB
Hydro - Small - Private Providers
3145
87

State of the Economy 2001
1990 to 1995, the Samanalawewa hydro
power plant with a capacity of 120 MW was
the only major power plant that was added to
the national grid during this period.
In spite of its very low power generation
costs, the CEB has made several proposals to
diversify out of hydro power (given its
vulnerability to the vagaries of weather) and
into thermal power as far back as the late
1980s. However, none were implemented
due to procedural delays, lobbying by various
interest groups (including environmentalists
and religious groups) and a lack of political
commitment. As a result, as predicted by the
CEB, when the rains failed in 1996 the
country experienced a severe power crisis,
which caused power cuts extending to eight
hours during the worst period. Estimates of
the direct costs of the power crisis are
unavailable; but in 1996 GDP growth dipped
sharply to 3.8 per cent from an average
growth rate of 5.5 per cent in the preceding
two years.
The immediate concern of increasing
generation capacity to avoid short-term
power shortages, was met in 1997 by adding
two thermal power plants using auto-diesel
with a capacity of 155 MW to the national
grid. Although coal power had been the
original recommendation of the CEB due to its
historically low prices and less volatility of
prices compared to petroleum, the coal power
plant was sidelined. This was because the
gestation period for a coal power plant was
four to six years -- compared to a less than
one year period for petroleum based power
plants.33 In the haste to construct these
plants, considerations such as generation
costs and environmental standards took a
back seat
By 1999 the country was still relying mainly
on high cost thermal power plants using diesel
for expanding generation capacity. Although
several private, small-scale mini hydro power
plants and one wind power plant have also
been added to the system in the recent past,
no attempt has been made to date to solve
the long-term power shortage problem of the
country.
The end- result in 2000 and 2001 has been
excessive operation of CEB's own expensive
thermal generating plants, extensive operation
of more expensive standby generation at
customer premises, and the expensive
purchase of energy from private developers
on short-term contracts (see Table 8.3).
8.3.2 Financial performance of CEB
Since electricity generation, transmission and
distribution in Sri Lanka is largely owned and
operated by the CEB, the power crisis has a
direct bearing on CEB finances in terms of
reduced revenue and additional expenditure
related to remedial measures. The CEB was
forced to hire smaller mobile plants from
several private suppliers on short -term
contracts at high cost. Emergency supplies
procured through hurriedly- negotiated
contracts have turned out to be very
expensive.
33 The construction or installation period can vary depending on the thermal option: gas turbines (1 year), diesel electric generators (18 months) , combined cycle (2-4 years), oil fired boilers and turbines (2 -3 years).
88

Crisis in the power sector
Currently, the CEB is facing a serious financial
crisis. At the end of 2000, it had a revenue
of Rs. 26.3 billion and operating expenses of
Rs. 33 billion resulting in a loss of Rs. 6.7
billion. The accumulated losses of the CEB
are over Rs. 12 billion, and this has been
financed by bank overdrafts at the interest
cost of Rs. 1.7 billion per year.
According to the CEB the main reasons for
this shortfall are:
a huge increase in the use of thermal power (due to low rainfall) at a time of high world oil prices; average thermal generation costs rose from 2.41 Rs./kWh in 1999 to 4.17 Rs./kWh in 2000 for the CEB, while the costs for purchases of private thermal power rose from 4.37 Rs./kWh to 5.51 Rs./kWh over the same period.
delays in implementing two thermal power plants due to government’s procedural delays.
payment delays by government organisations.
The CEB losses were also made worse in
2000 by the fact that it had changed its
contract with the Ceylon Petroleum
Corporation (CPC) to pay for diesel at world
prices, instead of at CPC administered prices
as before. The change was made when
world diesel prices were lower than
administered prices, but the contract was
binding when the situation was reversed.
However, administered diesel prices have
risen gradually and by end June 2001, they
were fairly close to world prices of diesel.
Beyond these reasons, the current crisis was
also precipitated by the hiring of private
generating plants at a very high average cost
of Rs./kWh 9.53 in 2000 (and estimated at
12.40 Rs./kWh in January 2001) from the
Aggreko International Power Projects (a firm
with Dutch links based in the UK and the
Middle East). Surrounded by allegations of
corruption, the deal at the least, reflects
immature financial and negotiation prowess.
Contentious issues include high weekly rental
rates even when the plant is not operating,
tax exemptions, CEB paying for transportation
of the plants and absorbing all risk in changes
in petroleum prices by incurring the full cost
of fuel. In fact the Committee on Public
Enterprises (COPE) investigations reveal that
many of the private power plants are second
hand and inefficient, resulting in excessively
high consumption of fuel per unit of
electricity generated.
Even the very low cost of hydro power could
not sustain the cross-subsidisation of
expensive thermal generation. In March
2001, the CEB imposed a 25 per cent
surcharge raising the average consumer price
from 4.75 Rs./kWh to 5.70 Rs./kWh.
However, this still implies a 6.70 Rs./kWh
loss per unit supplied by Aggreko, and this
deficit is likely a large contributor to the
expected Rs.12 billion loss in 2001.34
The financial performance of the CEB has been
below expectations not only due to the higher
89
34 The Aggreko contract was not renewed when it expired at the end of June 2001.

State of the Economy 2001
costs incurred during drought years, but also
as a result of
inefficiencies in billing, exacerbated by the delayed tender award of 400,000 meters,
theft,
low returns from rural electrification schemes, and
problems with restructuring and increasing tariff rates.35
8.4 Addressing the capacity crisis
Expanding electricity generation capacity
must take into consideration several
objectives.
Lowest cost generation.
Diversify 'fuel' mix- not depending on a single energy source for too large a share of total generation- this minimizes the vulnerability to vagaries in rainfall (hydro)
and highly volatile international oil prices (see Figure 8.2 and Figure 8.3).
35 See for example "Electricity Pricing Policy in Sri Lank(1997) by Tilak Siyambalapitiya, IPS.
New plants compatible with existing power generating system- most economical large plants may be destabilising to the national grid.
Effective planning and implementation- allows the use of more economical power plants that may take long gestation periods, instead of resorting to high cost, quick solutions.
Minimize environmental impact.
Most of the large-scale hydro potential of the
country has been already exhausted, though
the CEB has identified three economically
viable, large-scale hydro power plants.
Construction has begun on two plants, but
they will only solve the capacity problem in
the short-term because together they add
only about 200 MW of capacity. Although
Comparison of electricTechnology Fuel 1
Gas Turbine Diesel Combined Cycle Diesel Combined Cycle Liquefied natural gas Oil Steam Heavy Oil Coal Steam Coal Upper Kotmale Hydro Kukule Hydro Wind Power Wind Solar cells Solar
Notes: 1. Except for hydro, wind and solar power and are normally referred to as thermal pow
2. Life-cycle costs are the average cost oftotal costs include the costs of investmenrate. The price of coal and liquefied natura
Source: Calculations made by Dr. Tilak Siyambalap
90
Table 8.4 ity costs of different power plants
Life-cycle cost (Rs/unit of electricity) 2
Crude oil reference (US$/ barrel) = 25
Crude oil reference (US$/ barrel) = 20
5.86 5.02 3.99 3.40 5.10 4.32 3.87 3.39 2.62 2.62 3.86 3.86 3.44 3.44 7.84 7.84
27.71 27.71 plants, all other plants use thermal energy to generate electricity er plants.
a unit of electricity from a power plant over its lifetime, where t, maintenance and fuel costs calculated at 10 per cent interest l gas is taken to be US$46/barrel (CIF) respectively. itiya, former chief planning engineer of CEB.
a"

Crisis in the power sector
F igu re 8 .2M onsoon & to ta l annua l ra in fa ll
0
5 0 0 0
1 0 0 0 0
1 5 0 0 0
2 0 0 0 0
2 5 0 0 01990
1991
1992
1993
1994
1995
1996
1997
1998
1999
2000
mm
m onsoon to ta l
Note: Monsoon period December – February, Source: Central Bank of Sri Lanka.
Figure 8.3Average petroleum prices
(US$/barrel)
05
1015202530
90 91 92 93 94 95 96 97 98 9920
00
US$
August – October. Source: Department of Census and Statistics.
there are a number of possibilities for small-
hydro electric plants, they too will only
increase generation capacity marginally.
Their contribution would mostly be in
supplying localized energy demands and as
secondary sources of power.
Using other renewable forms of energy --
such as wind power, solar, biogas and
geothermal - is unlikely to make a large
impact since their life cycle cost of a unit of
electricity is much higher than that for hydro
and other thermal power plants (see Table
8.4). Further, the generation capacity of
most renewable energy power plants is small,
and their generation capability is variable,
thus being useful primarily as back-ups for
base load sources of power.
This limits the available options for producing
base load power to thermal power plants.
The major thermal power plants under
91
Table 8.5 Status of the CEB long-term power generation plan
Location of
Power Plant / Technology
Fuel Type Size of
plant (MW)
Required
by
Status
Kelanitissa / Combined Cycle Diesel 100 2001 Delayed (by 1 year) Kelanitissa / Combined Cycle Diesel 150 2001 100 MW expected in
2002, rest in 2003 Kelanitissa / Combined Cycle Diesel 150 2002 Delayed until 2003 Kukule Hydro 70 2003 Delayed until 2004
Kerawalapitiya/Combined cycle Diesel 150 2003 Expected in 2004 Puttalam Coal 300 2004 No decision Upper Kotmale Hydro 150 2006 Expected in 2007 Puttalam Coal 300 2008 No decision Puttalam Coal 300 2010 No decision Note: The other sites deemed appropriate for a coal plant are Trincomalee and Mawella. Source: Ceylon Electricity Board.

State of the Economy 2001
c
p
c
n
d
t
e
t
p
F
a
u
s
A
p
a
a
I
P
M
S
T
S
9
NSo
on
lan
yc
at
ies
he
nv
ec
ric
igu
va
nl
up
lth
lan
ll
id
still not scheduled to start. It faces
continuous opposition from misinformed
environmentalists, although coal plants
provide 40 per cent of the world's electricity,
and are used in the USA, UK, Germany,
Australia, Japan, Canada, India, Malaysia,
Indonesia, Thailand, the Philippines and China
(including a highly residential section of Hong
Kong). Political ambivalence stems from
Figure 8.4Steam coal prices - US$/MT
26
27
28
29
30
31
32
1994 1995 1996 1997 1998 1999
.
C
ndo
hil
al
ing
ha
ri
2
ote:urc
Source: National Energy Information Centre
sideration at present are a steam power
t using coal or heavy oil, a combined
le power plant using diesel or liquefied
ural gas (LNG), or a gas turbine using
el. Among these, the CEB has identified
coal plant as the cheapest and the most
ironmentally friendly, given the current
hnology (see Table 8.4). Further, coal
es have been on a downward trend (see
re 8.4) and supplies are expected to be
ilable for another couple of centuries,
ike the uncertainties surrounding the
ply of petroleum resources.
ough the first proposal for a coal power
t was forwarded in the late 1980s, and
feasibility studies are concluded with an
donor available, the coal power plant is
special interest lobbying, which now likely
includes the recent beneficiaries of the highly
profitable private provision of thermal power.
The best option for the country is coal power
plants, designed specifically with the
necessary security considerations.
Table 8.5, shows the projects proposed in the
CEB's long-term generation expansion plan
completed in 1999 and their progress. More
than half of the planned future expansion in
power generation comes from the proposed
coal power plants, but the work on these has
not yet commenced. Several other planned
projects are also delayed. In the short-term
the plan relies heavily on petroleum fuels,
which is likely to increase inflationary
pressure on electricity tariffs. If the decision
Table 8.6 omparison of average electricity tariffs in Asian countries: 1999 (US cts per KWh)
Domestic
Source: Ceylon Electricity Board.
Figure 8.5All inclusive average annual power
purchasing tariff (Rs.per KWh)
3.7
4.024.15
4.46 4.43 4.53 4.57
2.00
2.50
3.00
3.50
4.00
4.50
5.00
1995 1996 1997 1998 1999 2000 2001
Commercial Industrial
nesia 2.7 4.6 3.0
ippines 4.6 9.8 8.5
aysia 6.1 7.5 5.7
apore 7.7 6.8 5.8
iland 5.7 6.0 5.8
Lanka* 4.6 9.7 7.1
*Tariff rates effective from June 1, 2000. e: Ceylon Electricity Board.

Crisis in the power sector
making process regarding future power generation
plans are not streamlined so as to avoid
unnecessary delays, the present problems of
capacity shortages and high operational costs will
continue to worsen.
8.5 Outlook for tariffs and rural
electrification 8.5.1 Electricity tariffs on the rise?
Traditionally, the CEB tariff structure has
heavily cross-subsidised the domestic sector
at the expense of industrial and commercial
consumers. Given that electricity tariff rates
are already quite high in Sri Lanka (see Table
8.6) especially for commercial and industrial
consumers, a further increase in tariff rates is
likely to affect the competitiveness of the
industrial sector in the country. The tariff
revisions in the recent years have increased
tariffs for the domestic sector at a higher rate
in order to reduce the cross subsidy provided
it. Even so, the annual average tariff rates
have been allowed to increase only marginally
in the last several years (Figure 8.6).
However, power generation costs have been
increasing substantially in the late 1990s due
to increased reliance on thermal power plants,
associated repeated spells of dry weather, and
the recent increase in oil prices. The
prevailing tariff rates will not be sustainable in
the coming years because the short/medium-
term generation capacity can only be
increased through high cost thermal power
plants using petroleum products. At present,
about 50 per cent of electricity in the CEB
system is generated at prices ranging from Rs.
6 to Rs. 12 per KWh, while the selling price
is, on average, Rs. 4.75 (currently subjected
to a 25 per cent surcharge). Higher tariff
rates are likely to continue until the benefits of
cheap coal power are realized.
8.5.2. Rural electrification jeopardized?
A little over 61 per cent of households has
electricity connections. According to a recent
survey conducted by the CEB, about 95 per
cent of the urban population and 36 per cent
of rural households have electricity. Although
rural electrification projects are costly with
typically low financial returns, the CEB has
conducted several projects (about 2700
schemes completed during the 1994-2000
period) with assistance from international
donors, particularly the ADB. Traditionally,
rural households are cross-subsidized by urban
households, as longer transmission lines
needed for the supply of electricity to rural
areas make the unit costs in these areas high.
These schemes are important because access
to electricity is now widely recognized as an
effective means of reducing poverty by
lowering unemployment and improving access
to resources in rural areas. The National
Development Report (1998) confirms that the
areas of the country that perform badly on the
human poverty index are regions where
substantial proportions of the population live
without access to electricity. Many of the
poorest districts, like Moneragala, Nuwara
Eliya, Polonnaruwa, Ratnapura, Kegalle and
Hambantota, have less than 30 per cent of
their households supplied with electricity. The
richer Colombo and Gampaha districts perform
substantially better than other areas in terms
of electricity coverage, with nearly
93

State of the Economy 2001
94
Box 8.1
California dreamin’ – Lessons for Lanka? As the bright lights of Hollywood shine less
brightly amidst California's power crisis
2000-2001, the developing world is surprised
to see an economic force like the United
States grappling with similar issues as those
facing them. The experience in California has
also called into question the merits of
privatization and deregulation of power
utilities everywhere, especially as multilateral
aid agencies tend to be promoting
privatization in their reform programmes. As
in all cases when rhetoric is rampant, it is
important to clarify the issues, and gather any
lessons for the country in particular, and
developing nations in general.
The reforms of 1996 were stimulated by an
urgency to reduce the high electricity prices in
California, which were 50 per cent higher than
the US national average. This was mainly due
to expensive nuclear power and “green”
power – in particular cost overruns on two
large-scale nuclear power plants, and state-
mandated purchases of power from private
power producers using renewable
technologies at prices significantly higher than
the costs of traditional technologies.
Basic features of the reform
The reform is characterized as a process of
deregulation, and did not involve divestiture of
state-owned assets. In fact, it involved only
limited deregulation by introducing price-based
competition in a complex wholesale power
market, and it changed the way the power market
is regulated. Key features included:
• “Encouraging” the dominant three private
utilities to sell off their generating plants.
• Utilities were allowed to impose a “competitive transition charge” on electricity bills to recover “stranded costs” (anticipated above-market costs) from costly power acquisition.
• 10 per cent reduction in retail rates, with retail rates frozen for 4 years or until stranded costs were recovered.
• New institutions to operate the transmission facilities of the private utilities and to provide a market place for electricity sales. Also a new regulatory body was introduced, alongside the old one.
The crisis
Mandated rolling blackouts throughout
California since November 2000 have
seriously disrupted the state economy,
which has been the center of high
technological growth in the US. Electricity is
so important for Silicon Valley that a one-day
power shortage in June 2000 is estimated to
have cost $100 million in lost output.
Wholesale electricity prices increased three
fold between 1999 and 2000, and since there
was no mechanism for pass-through to retail
rates, the private utility descended into a
major financial crisis (incurring about $12
million in uncompensated cost since April
2000) that has threatened to spread to the
banking community.
Remedial measures
The following actions were taken to address
the crisis
• Price caps (that may deter investment).

Crisis in the power sector
• Forced sales – US Secretary of Energy
ordered electricity to be sold to non-credit
worthy California buyers.
• The government became an energy trader –
buying from suppliers and selling to almost
bankrupt utilities.
• Part of the national grid was taken over by
the state.
Why it happened?
Supply constraints
No new power generation capacity has been commissioned in California since 1992. This has been a result of (a) excessive delays in obtaining siting permits for new power stations and transmission lines, exacerbated by the ease of initiating legal challenges by consumer and environmental groups. This has added expense and uncertainty to the power investment process; (b) drop in hydropower imports from neighbouring states due to a drought and increasing demand in those states; (c) withdrawal of old plants (amounting 10,000 MW of capacity) for maintenance. Since 60 per cent of plants are over 30 years old, they tend to need more maintenance and thus longer outage periods.
Demand surge
- continuous growth in internet-based power
consumption.
- the highest temperatures for May to July
recorded in 106 years increased use of air
conditioning in 2000.
Increase in the costs of wholesale power
besides the factors above,
a) Increase in the price of natural gas.
b) Reduction in the accepted levels of nitrogen oxide
emissions (July 2000) and increase in the prices
of emission credits. At the same time, plants
were under pressure to utilize their capacity
above the level that was consistent with meeting
the emission standards. No outlet to transfer wholesale price increases to retail sector
While wholesale electricity and natural gas
prices are deregulated, retail electricity prices
are fixed until “stranded costs” are recovered
or till December 31, 2003. Hence, no way to
curtail demand.
Poor governance within sector
The politicization of the institutions in the
sector though quotas of stakeholders
representing their non interests, prevented a
concerted effort to resolve the crisis. Lessons
• All deregulation is not good deregulation.
• Investment delays in the power sector lead to
capacity crises which have a large negative
impact on economic activity.
• Environmental protection cannot be at the
expense of energy development. The public
must be educated that power supplies can be
increased with minimal environmental
degradation.
• Importance of an independent regulator.
• Beware of quick fix solutions – as they can be
inconsistent with original reform objectives.
95

State of the Economy 2001
77 per cent and 66 per cent of households
respectively, having access to electricity.
Gampaha, too does relatively well, with 66
per cent of households possessing electricity.
In all other districts, only approximately half
the population has access to electricity.
The present crisis in the power sector affects
electrification schemes in two ways:
Capacity constraints can limit the expansion of the national grid to rural areas.
Increasing pressures on electricity tariff rates, and the financial crisis of the CEB could limit the affordability of rural electricity schemes.36
Thus, it is important at this time to secure
additional donor support to continue and
bolster these efforts. A national planned
strategy should be implemented to maximize
the households that are reached. This would
also stem any inefficient politicisation of the
process where long transmission lines are
laid at high cost to supply only a few
politically targeted households.
8.6 Conclusion
Having previously faced crises in 1983,
1987, 1992 and 1996, the country finds
itself once again with power cuts in 2001.
The repeating pattern, associated with rainfall
patterns (Figure 8.2) suggests a severe
management failure at the national power
utility. Delays in project implementation and
an excessively costly response to a capacity
constraint have precipitated a financial crisis
at the CEB.
36 Although several attempts have been made to supply electricity to remote villages using local resources -- such as small water falls and solar and wind energy -- the success of these schemes have been limited due to high start-up costs and difficulties in providing maintenance services.
Given its poor track record of managing the
sector, the question arises-
"Is CEB privatization the answer? Four arguments suggest privatization may be inappropriate at this time.”
Given the high initial fixed costs and the
associated long gestation periods, the building of more economical power plants, e.g., coal power plants, is unlikely to attract the required level of investment from the private sector.
Privatization reduces the benefits of having a strategically diverse 'fuel' mix that could translate into lower prices for consumers. A national power utility can generate electricity by using the currently lowest cost fuel i.e., increasing hydro power generation and reducing thermal generation during high rainfall periods; and increasing thermal power generation during times of low oil prices and low rainfall.
Privatization may lead to the development of a monopoly in the power sector, that may reduce consumer welfare by affecting the continuity and cost of electricity.
Given the importance of the power sector for the social and economic development of the country, in particular the importance of rural electrification in reducing poverty, public provision of electricity is warranted to uphold overall national objectives. The low financial returns on some schemes may lead to their non-existence under traditional private provision.
96
Crisis in the power sector
Yet, there is a role for the private sector
especially with respect to medium to small
hydro-electric plants, and small thermal plants
(diesel and combined cycle). However, to
be consistent with least cost production, the
CEB should avoid purchase guarantees and
only offer purchase guarantees once the
private baseload operation is absolutely
required by the system.
What is needed now is reform from within the
current framework of operations. It is
essential that an authoritative proficient
institution be given the full power to evaluate
proposed power generation plans and oversee
their implementation. Power generation plans
are highly scientific as they comply with the
technical, financial, social and environmental
requirements of the country, and thus
decision-makers in the process must be
competently trained experts. The
depoliticization of the CEB, will also
ameliorate its financial position and stimulate
long-term investments by preventing
compulsory lending to the government in
profitable years, and reducing payment delays
by a fiscally -constrained government.
Appropriate institutional independence and
expertise, together with assistance from
donor agencies may provide the foundation for a solution to this power issue. The appropriate time to garner support for the
implementation of the economical power
plants is now, when the realities of inaction
face every citizen every evening.
97
State of the Economy 2001
9. Aid and aid under-utilization 9.1 Introduction
Foreign aid has been important in Sri Lanka's
development, especially since the 1977
liberalization, as a major source of
development finance and an element in
closing the foreign exchange gap. At a time
of low foreign reserves and a fiscally
constrained government cutting down on
capital and social expenditures, the role for aid
is even greater. However, in the last couple
of years there has been a significant
downward trend in aid inflows. In fact,
interest and amortization payments have
exceeded these annual aid inflows. Yet, in
this context, there remains over US$ 2500
million of unutilized aid. This chapter
investigates why so much aid is under-
utilized,37 and explores means of enhancing
the effectiveness and utilization of aid.
The issue of aid gained increased awareness
since the Paris Development Forum in
December 2000 and the IMF stand-by
arrangement for Sri Lanka in April 2001. At
the Development Forum, the donors expressed
concern about Sri Lanka's performance with
regard to the non-implementation of the Public
Service Commission, increased election
irregularities and election related violence, the
Prevention of Terrorism Act, politicization of
the Samurdhi movement and the inadequate
supply of food and medicine to the Wanni
area. The Forum, continued to push for
structural adjustments, public sector reforms,
institutional controls, accountability and
transparency, more privatization, reforms
relating to tertiary education, and devaluation
of the currency. The devaluation of the rupee
against the US dollar on the eve of the Paris
Forum was seen as a goodwill signal on the
part of the government. Additionally, major
changes are in tertiary education that will
eventually lead to the withdrawal of the
government from this sector. Notably, none
of the donors got down to consider the
quantum of aid pledged individually or
collectively.
37 Under-utilized aid refers to commitments of aid for a particular period minus disbursements of aid for the same period (in absolute terms).
However, Sri Lanka successfully negotiated a
14 month stand-by credit of US $253 million
(with $131 million immediately available) to
tide over an immediate reserves crisis. This
was a new development amidst the country's
continuing negotiations regarding a more long
term, larger (albeit with more conditions)
Poverty Reduction and Growth Facility
(PRGF).
In what follows, a brief profile of aid is
provided and the problem of under-utilization
of aid is identified. The ensuing sections
discuss the reasons for the under-utilization
and explore remedies to the current problem,
drawing particularly from results of a survey
of donors carried out by the Institute of Policy Studies.
9.2 Profile of aid in Sri Lanka
Sri Lanka like most of the developing
countries, faces difficulties meeting its
multiple development finance requirements
through domestic resources because of
widespread poverty and limited sources of tax
98
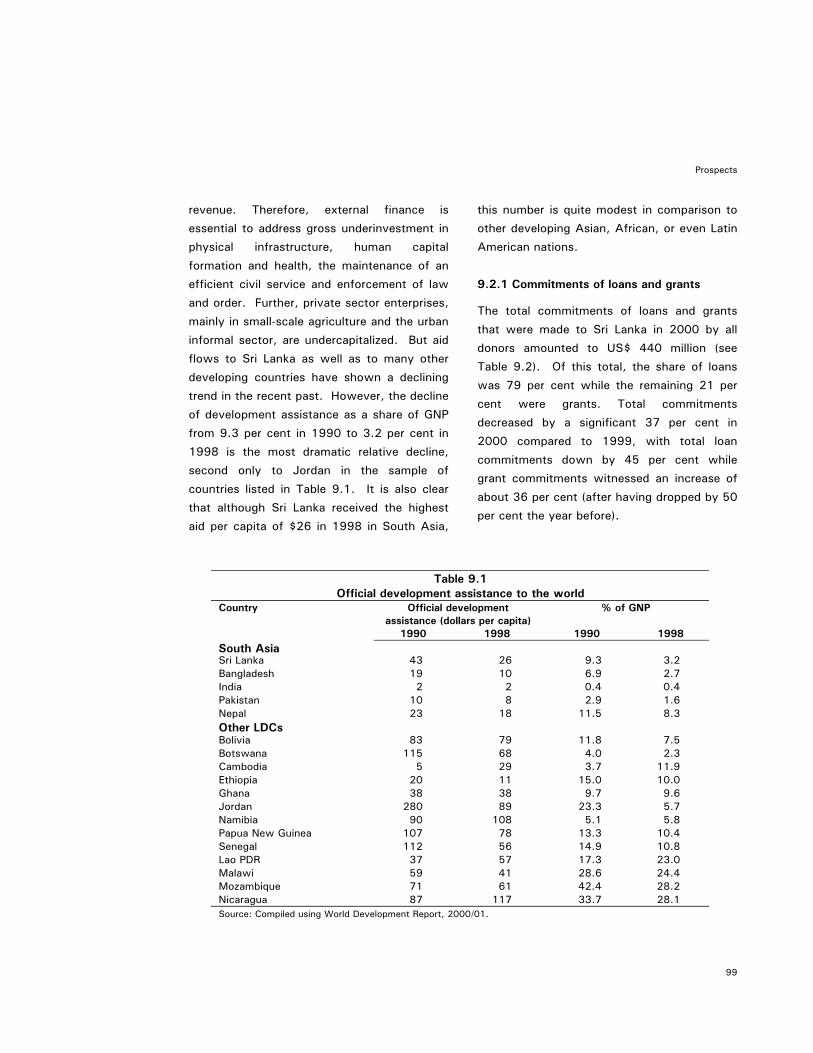
Prospects
revenue. Therefore, external finance is
essential to address gross underinvestment in
physical infrastructure, human capital
formation and health, the maintenance of an
efficient civil service and enforcement of law
and order. Further, private sector enterprises,
mainly in small-scale agriculture and the urban
informal sector, are undercapitalized. But aid
flows to Sri Lanka as well as to many other
developing countries have shown a declining
trend in the recent past. However, the decline
of development assistance as a share of GNP
from 9.3 per cent in 1990 to 3.2 per cent in
1998 is the most dramatic relative decline,
second only to Jordan in the sample of
countries listed in Table 9.1. It is also clear
that although Sri Lanka received the highest
aid per capita of $26 in 1998 in South Asia,
this number is quite modest in comparison to
other developing Asian, African, or even Latin
American nations.
9.2.1 Commitments of loans and grants
The total commitments of loans and grants
that were made to Sri Lanka in 2000 by all
donors amounted to US$ 440 million (see
Table 9.2). Of this total, the share of loans
was 79 per cent while the remaining 21 per
cent were grants. Total commitments
decreased by a significant 37 per cent in
2000 compared to 1999, with total loan
commitments down by 45 per cent while
grant commitments witnessed an increase of
about 36 per cent (after having dropped by 50
per cent the year before).
Table 9.1 Official development assistance to the world
Country Official development assistance (dollars per capita)
% of GNP
1990 1998 1990 1998 South Asia Sri Lanka 43 26 9.3 3.2 Bangladesh 19 10 6.9 2.7 India 2 2 0.4 0.4 Pakistan 10 8 2.9 1.6 Nepal 23 18 11.5 8.3 Other LDCs Bolivia 83 79 11.8 7.5 Botswana 115 68 4.0 2.3 Cambodia 5 29 3.7 11.9 Ethiopia 20 11 15.0 10.0 Ghana 38 38 9.7 9.6 Jordan 280 89 23.3 5.7 Namibia 90 108 5.1 5.8 Papua New Guinea 107 78 13.3 10.4 Senegal 112 56 14.9 10.8 Lao PDR 37 57 17.3 23.0 Malawi 59 41 28.6 24.4 Mozambique 71 61 42.4 28.2 Nicaragua 87 117 33.7 28.1 Source: Compiled using World Development Report, 2000/01.
99


1983 330.9 0.0 68.3 51.2 12.0 462.4 23.03
1984 396.1 0.0 67.6 72.4 0.0 536.1 25.50
1985 403.6 0.0 55.8 41.8 0.0 501.2 27.25
1986 444.4 0.0 53.9 48.6 0.0 546.9 28.05
1987 401.7 0.0 39.7 47.5 0.0 488.9 29.54
1988 445.6 0.0 80.4 48.6 0.0 574.6 31.89
1990 450.3 89.2 47.2 38.6 0.0 625.3 40.07
1991 464.8 274.1 34.3 37.8 0.0 811 42.51
1992 395.6 36.8 22.8 45.1 0.0 500.3 45.90
1993 392.0 116.0 35.1 75.2 18.7 637 49.50
1994 486.4 21.9 12.6 49.2 23.0 593.1 50.00
1995 563.9 12.4 35.1 22.7 23.4 657.5 54.10
1996 501.8 16.5 19 34.3 15.4 587 56.70
1997 398.9 28.1 23.2 18.7 68.1 537 61.20
1998 525 9.4 13.3 13.6 118.8 680.1 67.70
1999 396.3 9.1 14.8 5.3 28.3 453.8 72.10
2000 368 2.7 0.5 5.6 16.4 433.2 80.01
Notes: Total disbursement figures in Tables 9.3 and 9.4 vary slightly due to the alternate use of average annual exchange rates (Table 9.3) versus year-end exchange rates (Table 9.4); 1989 data unavailable.
Source: External Resources Department of Sri Lanka.
Prospects
Table 9.3 Foreign aid disbursements by type
1994-2000 (US $ mn)
Year 1994 1995 1996 1997 1998 1999 2000
Loans 416 505 455 418 590 342 378 Grants 177 182 143 125 88 95 54 Total 593 687 598 543 678 437 433 Source: External Resources Department of Sri Lanka.
political factors in the domestic and
international environment. In the domestic
front, the increased security threat and
consequent rise in military expenditures affect
aid in three ways:
• provides less opportunities for initiating aid projects,
• leaves less resources available to provide counterpart funds for development projects, and
• detracts the government's attention from such projects.
On the supply of aid, such aid has been less
forthcoming as a result of a number of
factors:
• Economic recession and budget pressures in donor countries.
• The end of the cold war created a new set of recipients in Eastern Europe, in
Table 9.4 Composition of foreign aid disbursements, 1982-2000
Year US Dollars Million Exchange rate
Project Programme Commodity Food Other Aid Total (Year end)
1982 310.7 0.0 64.2 33.1 0.0 408.0 20.80
101

State of the Economy 2001
Net in
-1500-1300-1100-900-700-500-300-100100
1996 1997 1
Net
Inflo
ws
(USD
Mn)
Net Bilateral Aid Flows
Note: Net inflows equal the total disburse2001 data is up to 31st May 2001.
Source: External Resources Department of
Aid disbursundi
Note: 2001 data is up to 31 Mayst
Source: External Resources Departm
0
500
1000
1500
2000
2500
1996 1997
USD
Mn
Bilateral d
Cumulativ
Multilater
Cumulativ
particular Russia, to share a declining pooof funds.
102
Figure 9.3 flows of foreign aid 998 1999 2000 2001
Net Multilateral Aid Flows
ments minus principal payments and interest payments;
Sri Lanka.
Figure 9.4 ements and cumulative sbursed balances
2001. ent of Sri Lanka.
1998 1999 2000 2001
isbursements
e undisbursed bilateral balance
al disbursements
e undisbursed multilateral balance
l • The donor community appears to have focussed their efforts on Africa and the least developed countries.

Prospects
Table 9.5 Utilization of aid by type*, 1996-2000
Type of Aid 1996 1997 1998 1999 2000
Total Grants 30.18 30.75 26.65 33.07 19.99
Total Loans 15.36 15.18 19.00 10.92 12.49
Note: Utilization of aid is indicated by the Disbursement Ratio, where a high ratio indicates high utilization.Disbursement Ratio=1000*(Disbursements during year x / Cumulative undisbursed balanced at the end of year x).
Source: Compiled using Foreign aid indicators, CS-DRMS Reports, External Resources Department of Sri Lanka.
• The upgrading of Sri Lanka to "lower middle-income" status in 1998 (from “low-income" country) according to World Bank classifications, makes Sri Lanka a lower priority recipient country.
The result of this decline in aid, is that Sri
Lanka recorded more outflows than inflows of
aid over the 1996-2001 period (see Figure
9.3). Outflows of aid comprise the principal
loan payments (amortization) and interest
payments, and inflows refer to the disbursed
aid for a particular year. Both bilateral and
multilateral aid outflows are greater than the
amount of aid disbursed, but multilateral net
aid outflows are significantly larger. In fact,
total net aid outflows of US$1576 million
(with US$1421 million going to multilateral
agencies) in 1999 represented 35 per cent of
export earnings and 11 per cent of GDP.
9.3 Aid utilization problem
In the same context of declining aid and net
aid outflows, is the stark reality that a large
proportion of foreign aid received by Sri Lanka
remains under-utilized. The unutilized aid is
carried forward to the following year, and thus
are again reflected in the total aid in that year.
A glance at Figure 9.4 shows that disbursed
aid in Sri Lanka, is significantly smaller
compared to the cumulative undisbursed
balance (CUB) for the same period. Although,
bilateral disbursements were higher than
multilateral loan disbursements, the gap
between disbursements and CUB is
significantly higher for the former. The level of aid utilization is calculated by
using the disbursement ratio, which captures
the disbursed aid as a share of the cumulative
undisbursed aid for a given period. A high
ratio signifies high utilization of aid. As
revealed in Table 9.5, the overall utilization is
quite low with an average utilization of 28
per cent for grants and an average of 15 per cent for loans for the 1996-2000 period. The
utilization of grants declined by a dramatic 39 per
cent in 2000.
Analyzing the utilization rates by the
composition of aid, indicates that food loans
recorded a disbursement ratio of 100 over
1996-2000 (except in 1999 where there were
no disbursements), and high disbursement
ratios were also recorded in commodity grants
(except for 2000 when there was a significant
drop).
103
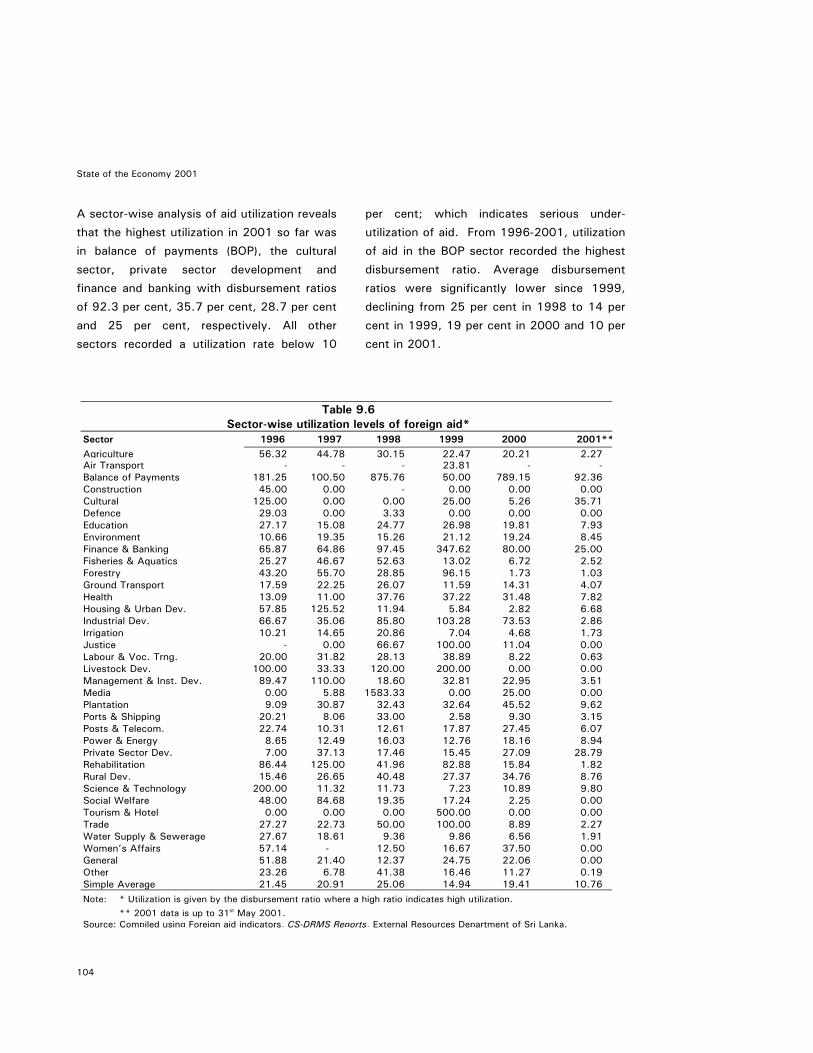
State of the Economy 2001
A sector-wise analysis of aid utilization reveals
that the highest utilization in 2001 so far was
in balance of payments (BOP), the cultural
sector, private sector development and
finance and banking with disbursement ratios
of 92.3 per cent, 35.7 per cent, 28.7 per cent
and 25 per cent, respectively. All other
sectors recorded a utilization rate below 10
per cent; which indicates serious under-
utilization of aid. From 1996-2001, utilization
of aid in the BOP sector recorded the highest
disbursement ratio. Average disbursement
ratios were significantly lower since 1999,
declining from 25 per cent in 1998 to 14 per
cent in 1999, 19 per cent in 2000 and 10 per
cent in 2001. 9.3
Sector-wise utilSector 1996 Agriculture 56.32 Air Transport - Balance of Payments 181.25 1Construction 45.00 Cultural 125.00 Defence 29.03 Education 27.17 Environment 10.66 Finance & Banking 65.87 Fisheries & Aquatics 25.27 Forestry 43.20 Ground Transport 17.59 Health 13.09 Housing & Urban Dev. 57.85 1Industrial Dev. 66.67 Irrigation 10.21 Justice - Labour & Voc. Trng. 20.00 Livestock Dev. 100.00 Management & Inst. Dev. 89.47 1Media 0.00 Plantation 9.09 Ports & Shipping 20.21 Posts & Telecom. 22.74 Power & Energy 8.65 Private Sector Dev. 7.00 Rehabilitation 86.44 1Rural Dev. 15.46 Science & Technology 200.00 Social Welfare 48.00 Tourism & Hotel 0.00 Trade 27.27 Water Supply & Sewerage 27.67 Women’s Affairs 57.14 General 51.88 Other 23.26 Simple Average 21.45 Note: * Utilization is given by the disbursement rat ** 2001 data is up to 31 May 2001. st
Source: Compiled using Foreign aid indicators, CS-DR
104
Table 9.6 ization levels of foreign aid* 1997 1998 1999 2000 2001**44.78 30.15 22.47 20.21 2.27
- - 23.81 - - 00.50 875.76 50.00 789.15 92.36 0.00 - 0.00 0.00 0.00 0.00 0.00 25.00 5.26 35.71 0.00 3.33 0.00 0.00 0.00
15.08 24.77 26.98 19.81 7.93 19.35 15.26 21.12 19.24 8.45 64.86 97.45 347.62 80.00 25.00 46.67 52.63 13.02 6.72 2.52 55.70 28.85 96.15 1.73 1.03 22.25 26.07 11.59 14.31 4.07 11.00 37.76 37.22 31.48 7.82 25.52 11.94 5.84 2.82 6.68 35.06 85.80 103.28 73.53 2.86 14.65 20.86 7.04 4.68 1.73 0.00 66.67 100.00 11.04 0.00
31.82 28.13 38.89 8.22 0.63 33.33 120.00 200.00 0.00 0.00 10.00 18.60 32.81 22.95 3.51 5.88 1583.33 0.00 25.00 0.00
30.87 32.43 32.64 45.52 9.62 8.06 33.00 2.58 9.30 3.15
10.31 12.61 17.87 27.45 6.07 12.49 16.03 12.76 18.16 8.94 37.13 17.46 15.45 27.09 28.79 25.00 41.96 82.88 15.84 1.82 26.65 40.48 27.37 34.76 8.76 11.32 11.73 7.23 10.89 9.80 84.68 19.35 17.24 2.25 0.00 0.00 0.00 500.00 0.00 0.00
22.73 50.00 100.00 8.89 2.27 18.61 9.36 9.86 6.56 1.91
- 12.50 16.67 37.50 0.00 21.40 12.37 24.75 22.06 0.00 6.78 41.38 16.46 11.27 0.19
20.91 25.06 14.94 19.41 10.76 io where a high ratio indicates high utilization.
MS Reports, External Resources Department of Sri Lanka.

Prospects
Table 9.7 Factors affecting the under-utilization of foreign aid : summary of donor survey results
Factors affecting aid under-utilization
Bilateral donors
(Average)
Multilateral donors
(Average)
All donors(Average)
Minimumscore
Maximum score
Political interference with regard to planning, implementation, and allocation of funds
7.5
7.8
7.7
1
10
Commitment of the government of Sri Lanka with regard to foreign aid projects
6.3
8.2
7.5
5
10
Failure to appoint project staff on time
6.0
7.0
6.6
2
9
Ineffective/inefficient bureaucracy at Ministerial level
6.0
6.6
6.3
2
9
North – East conflict in Sri Lanka and the resultant security problems
6.0
5.4
5.7
3
9
Delays in release of counterpart funds
3.0
7.0
5.5
2
9
Poor and unprofessional management of key development projects
4.5
6.2
5.4
2
9
Cancellation and deferment of tenders
4.3
5.4
4.9
1
8
Public lobby against certain foreign assisted projects
3.8
5.2
4.6
1
9
Sample size 4 5 9 9 9 Note: Responses range from 1-10, where a low score suggests a particular factor is not important for the under-
utilization of aid problem and a high score implies that a particular factor is very important. Average results skewed by one outlier donor who had no aid utilization problems.
9.4 Factors limiting the utilization of aid
The manner and the speed of utilization of aid
depends on a number of factors. A successful
aid utilization process requires supporting
policies, not just in recipient countries but also
in donor countries. From the recipient country
perspective, the World Bank characterized a
policy environment for the effective
functioning of aid as one with stable
macroeconomic polices, transparent,
accountable governance, and outward
oriented competitive markets.
105
To capture the elements inhibiting better
utilization of aid in Sri Lanka, a survey was
undertaken by the Institute of Policy Studies,
to ascertain the main issues from the
perspective of the donor community. Of the
fourteen donors contacted, five multilateral
donors and four bilateral donors38 responded
to the survey. Table 9.7 provides the
summary results of the survey on the major
factors affecting aid under-utilization. They
are listed in order of importance based on
donor responses, with the most important
first. Although the sample size is too small
for a formal statistical analysis, the survey
38 Individual names of the donors are not mentioned in order to maintain confidentiality.
State of the Economy 2001
remains a useful exercise in bringing attention
to the main issues inhibiting better utilization
of aid in the country.
The survey results indicate that political
interference with regard to planning,
implementation, and allocation of funds
affects aid under-utilization, most, with seven
out of nine respondents giving it a score of
eight or higher on the level of importance
scale. The donors also felt the commitment
by the GOSL with regard to foreign aided
projects is crucial for better aid utilization, as
was appointing project staff in a timely
manner.
Beyond the issues mentioned in the survey,
other important issues identified by donors
relate to the following issues:
Staffing:
• Selection of poor quality staff for project management.
• High turnover of project management staff.
• Promotions and salary increments of key project staff are not related to overall performance and delivery of outcomes.
• Lack of authority given to Project Directors to implement projects.
• Lack of motivation and incentives for quality staff to serve in the under-served areas of the country.
• Misuse of funds and ineffective management of government counterpart funds particularly with regard to staff development, and misuse of vehicles and other facilities by politicians.
Implementation
• Long procedures for land acquisition,
resettlement and payment of
compensation for infrastructure projects.
• Delayed contract awards due to cumbersome government tender procedure.
• Inordinate delays in procurement and a lack of understanding of the procurement processes and inadequate capacity for procurement management.
• Poor performance of some local contractors.
Monitoring, evaluation and overall management
• Unfocussed monitoring of project progress (inclusive of financial progress) at the ministry and departmental levels.
• Inadequate evaluation procedures within the government. Much of the evaluation processes is donor driven, hence takes on a donor perspective and not the overall national context.
• No full involvement of the government/ national counterparts at both operations and policy level in planning and formulating project documents.
• Poor co-ordination between centre and province, and between departmental staff and project management unit (PMU).
9.5 Conclusions
In the current framework, implementation of
projects need to be facilitated by streamlined
procedures, and there is a greater need for
focussed ministry level initiatives in joint
monitoring and evaluating aid projects. In
order to rectify under-utilization of aid and
106

Prospects
make most effective use of donor assistance,
the government must develop its own
comprehensive plan for donor assistance, in
the context of a national development plan.
This would also prevent fragmentation of
assistance given to a particular sector, and
give the government a better position from
which to make concrete requests from the
donor community to support efforts at poverty
alleviation and overall development of the
country.
107

Prospects
State of the Economy 2001
10. Prospects
The year ahead will be challenging times for
the economy. The outturn for 2001 is likely
to be in the vicinity of 1 per cent GDP growth,
and 4-5 per cent growth in 2002 under an
optimistic scenario. However, given the
extreme uncertainties in the current national
and international environment, point forecasts
will inevitably be under continuous review.
Thus greater emphasis should be placed on
the assumptions and analytic framework.
The slowdown in the international economy
will continue to dampen Sri Lanka's potential
to export its way out of the domestic
recession. The impact of the September 11
terrorist attacks in the US (Chapter 3) is likely
to drag the US economy into negative growth
in the 3rd quarter of 2001, and delay recovery
to the second quarter of 2002. Active
monetary and fiscal policy by the US to
stimulate the economy suggest this will not
be a protracted recession. In the post-
September 11 scenario, oil prices have
actually fallen, and the expectation is that oil
prices will remain stable. The underlying
assumptions for the above scenario is of a
limited military operation, in scale and
duration, that does not provoke greater
retaliation, and that does not place oil supplies
in jeopardy.
The ensuing outlook for the domestic
economy is based in the context of the above
international scenario. Further, it is assumed
that the December elections will improve the
precarious governing situation. Overall
growth will continue to be stifled through the
year, and the early part of 2002. In fact, the
immediate effects of the July 24th attack may
even pull overall GDP in the third quarter to
negative figures.
However, the impact of the government's
stimulus package and a possible rebound in
agriculture should bring growth back to
positive figures in the 4th quarter. Recovery in
the Sri Lankan economy is likely to follow
global trends and a more positive outlook is
likely to emerge toward the middle of 2002.
The impact of the July 24 terrorist attack on
Katunayake has been dramatic on the services
sector reflecting the i) crippling of Sri Lankan
Airlines , ii) reduced air and sea transport
activity in light of the “war risk" status placed
on Sri Lanka and the consequent hike in
insurance premiums to call on the country's
airport and seaports, and iii) the devastation
of the tourist industry, with hotel closings and
employment losses. The tourist industry
showed strong leadership in the face of the
crisis, and it is hoped that aggressive
campaigns to draw tourists towards the end
of the year will be successful. However,
given the current general anxiety associated
with air travel, and depending on the extent of
the military aspects of the global 'war of
terrorism', it may be prudent to also target
campaigns towards neighboring countries
(with India being one of the few economies
expected to show about 5 per cent GDP
growth in 2001), not only the traditional
visitors to Sri Lanka.
108

Prospects
The export-oriented manufacturing sector,
though relieved by currency depreciation,
faces a huge loss of competitiveness through
higher transport costs due to increases in
insurance premiums, disruptions to delivery as
a result of reduced air and sea transport, high
costs of power generation, and the general
rise in prices. The tax cuts should provide
some relief, but the underlying drop in global
demand facing these industries is likely to
remain until the middle of 2002.
In the context of China's proposed entry into
the WTO and the phasing out of apparel
quotas under the Multi-Fibre Agreement in
2005, the government needs to continue
initiatives to diversify the export base, to
prepare for the adjustment which is likely to
have a strong adverse impact on smaller
apparel exporters.
The government also needs to continuously
work towards eliminating the "war risk"
status of the country, imposed by insurance
firms. In the context of the September 11
terror, and coupled with an effective and non-
complacent new security regime at the
seaport and airport, there could be greater
avenues for success.
The fiscal deficit in 2001 is likely to exceed
10 per cent of GDP, with increased transfers
to loss making public enterprises, the October
2001 tax cuts, relief to sectors affected by
drought and the terrorist attacks, and election-
related spending. Tight fiscal policy in the
middle of a recession would be disastrous for
the economy, but runaway deficits are also
not the answer. The quality of government
spending has to improve.
The Central Bank has taken active steps in the
right direction towards reinvigorating the
economy by dropping interest rates. The
downward revision of the leading indicator of
short -term interest rates -the repo rate- has
accelerated, falling from 18.5 per cent in
June, to 12 per cent in October. Further
interest rate cuts are warranted to stimulate
the economy, but monetary management will
also need to heed the higher inflationary
pressures in the economy. The average
inflation (CPPI) for the first nine months of
2001 was 14.5 per cent (with a moving
average calculation suggesting a 13.1 per
cent)- more than double the average inflation
in 2000. The sustainability of low interest
rates will depend on the financing of the
budget deficit. If foreign financing does not
materialize, there will be upward pressure on
interest rates and inflation.
Meanwhile, the rupee had gained stability at
Rs/US$ 90 at the end of September, but has
depreciated with the government's monetary
and fiscal stimulus package. It is likely to
slide toward an exchange rate of Rs/US$ 93
by the end of the year, depending on the
strength of the fourth quarter and deficit
financing.
Given the domestic recessionary environment,
the trade deficit is likely to improve due to a
large reduction in imports. The current
account is likely to fall to about 4-5 per cent
of GDP from 6.4 per cent of GDP in 2000,
although hurt by drops in tourist earnings in
109
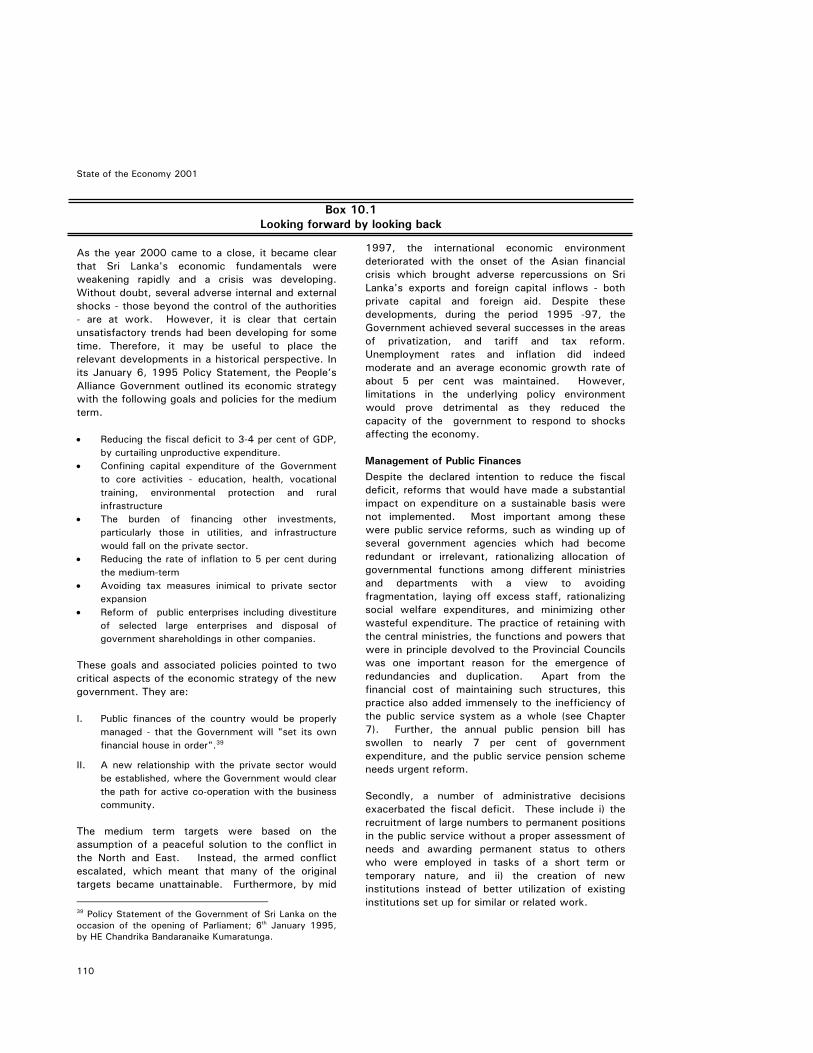
State of the Economy 2001
110
Box 10.1 Looking forward by looking back
As the year 2000 came to a close, it became clear that Sri Lanka's economic fundamentals were weakening rapidly and a crisis was developing. Without doubt, several adverse internal and external shocks - those beyond the control of the authorities - are at work. However, it is clear that certain unsatisfactory trends had been developing for some time. Therefore, it may be useful to place the relevant developments in a historical perspective. In its January 6, 1995 Policy Statement, the People’s Alliance Government outlined its economic strategy with the following goals and policies for the medium term. • Reducing the fiscal deficit to 3-4 per cent of GDP,
by curtailing unproductive expenditure. • Confining capital expenditure of the Government
to core activities - education, health, vocational training, environmental protection and rural infrastructure
• The burden of financing other investments, particularly those in utilities, and infrastructure would fall on the private sector.
• Reducing the rate of inflation to 5 per cent during the medium-term
• Avoiding tax measures inimical to private sector expansion
• Reform of public enterprises including divestiture of selected large enterprises and disposal of government shareholdings in other companies.
These goals and associated policies pointed to two critical aspects of the economic strategy of the new government. They are:
I. Public finances of the country would be properly
managed - that the Government will "set its own financial house in order".39
II. A new relationship with the private sector would be established, where the Government would clear the path for active co-operation with the business community.
The medium term targets were based on the assumption of a peaceful solution to the conflict in the North and East. Instead, the armed conflict escalated, which meant that many of the original targets became unattainable. Furthermore, by mid
1997, the international economic environment deteriorated with the onset of the Asian financial crisis which brought adverse repercussions on Sri Lanka's exports and foreign capital inflows - both private capital and foreign aid. Despite these developments, during the period 1995 -97, the Government achieved several successes in the areas of privatization, and tariff and tax reform. Unemployment rates and inflation did indeed moderate and an average economic growth rate of about 5 per cent was maintained. However, limitations in the underlying policy environment would prove detrimental as they reduced the capacity of the government to respond to shocks affecting the economy.
39 Policy Statement of the Government of Sri Lanka on the occasion of the opening of Parliament; 6th January 1995, by HE Chandrika Bandaranaike Kumaratunga.
Management of Public Finances
Despite the declared intention to reduce the fiscal deficit, reforms that would have made a substantial impact on expenditure on a sustainable basis were not implemented. Most important among these were public service reforms, such as winding up of several government agencies which had become redundant or irrelevant, rationalizing allocation of governmental functions among different ministries and departments with a view to avoiding fragmentation, laying off excess staff, rationalizing social welfare expenditures, and minimizing other wasteful expenditure. The practice of retaining with the central ministries, the functions and powers that were in principle devolved to the Provincial Councils was one important reason for the emergence of redundancies and duplication. Apart from the financial cost of maintaining such structures, this practice also added immensely to the inefficiency of the public service system as a whole (see Chapter 7). Further, the annual public pension bill has swollen to nearly 7 per cent of government expenditure, and the public service pension scheme needs urgent reform. Secondly, a number of administrative decisions exacerbated the fiscal deficit. These include i) the recruitment of large numbers to permanent positions in the public service without a proper assessment of needs and awarding permanent status to others who were employed in tasks of a short term or temporary nature, and ii) the creation of new institutions instead of better utilization of existing institutions set up for similar or related work.

Prospects
Failure to reform large state-owned enterprises such as the railways, the postal service, the Ceylon Petroleum Corporation, the Water Supply and Drainage Board and the Sri Lanka Electricity Board, have also placed a great strain on the budget. Their existing management structures, asset and staffing positions are not conducive to realizing their full income-earning potential. On the revenue side, efforts at expanding the tax base, particularly that of income taxes, and strengthening tax administration, continue to be sluggish. Consequently, increased revenue is generated by placing a greater burden on those who already pay taxes, as was the case with the surcharge of 20 per cent on corporate income tax in the Budget 2001. Development of the private sector
Several successful privatizations have been completed and a major share of domestic investment is now undertaken by the private sector. However, progress in involving private capital in infrastructure development such as highways, power and port development on a large scale has not materialized. Foreign private portfolio investment continues its outflow even after the abatement of the Asian financial crisis and thus the Colombo Share Market remains depressed. High cost of borrowing
Although, currently interest rates have been revised downward, a prime concern has been the cost of borrowing which is a problem directly connected with the growing fiscal deficit. It is also closely related to the inefficiency of the financial sector, where the two state (commercial) banks which control a large share of the commercial bank deposits suffer from serious inefficiencies. Continued reform of these institutions is needed to meet the demand for cheaper credit from the private sector. Employer – employee relations The private sector has received mixed signals from the government as it balances the rights of employees on the one hand and financial profitability of the enterprises on the other. It usually appears wary of interventions that may make them unpopular with employees. However, long-standing rigidities in the labour market associated with many restrictive laws, regulations
and practices have raised the cost of employing labour, and contributed to the persistence of unemployment.
a) Termination of employment: The present laws relating to termination of employment are intended to protect the employees and the procedures involved are cumbersome, costly and time consuming. These have the effect of preventing the adjustment of scale of operations by firms, and employers have responded by minimizing the hiring of labour. Efforts at reform have been repeatedly stalled.
b) Government intervention in dispute settlement: On the issue of industrial peace, most private employers prefer seeing the government perform a neutral, regulatory function of setting the rules and encouraging the relevant parties to settle disputes through negotiation. However, very often, the Government intervenes on behalf of the workers to draw concessions from employers. This has encouraged irresponsible elements among the workers to make unreasonable demands and to politicize issues.
c) Government intervention in wage issues: The existing laws provide for setting minimum wages (and their periodical revision) by the Government after consultation with the concerned parties. Within this framework it may be useful to encourage the employers and employees to enter into collective agreements with a view to minimizing disputes and thus preserving industrial peace. The incident when the Government imposed wage increases on the private sector, using its powers under the emergency regulations, created considerable confusion and discord, and led to a prolonged trade union action by a large section of plantation workers. This also encouraged the unions to breach the collective agreements entered into with the employers, which meant a general loss of faith in such agreements.
Thus, the economic crisis Sri Lanka is facing now is not entirely the result of an unfortunate combination of short term factors, mostly outside the control of the policy makers, but also of weaknesses in policies themselves and their implementation. Over time these have exerted a negative impact on economic growth and stability. The delays in addressing essential reforms, had the effect of making Sri Lanka’s economy vulnerable to external shocks in addition to having an adverse impact on achieving long term goals.
111

State of the Economy 2001
the second half of 2001. Although private
remittances decreased in the first half of the
year, the outlook is not pessimistic as the
overseas employment departures increased
from 84,000 during January-July 2000 to
105,000 during the same period in 2001.
However, given limited capital inflows, it is
likely the overall balance of payments will
continue to remain in deficit.
The medium term prospects for the Sri Lankan
economy are buoyed by the resilience of the
private sector. However there is an important
role for government to provide political and
policy stability. If the December 2001
elections fail to create a government in a
strong position to embark on consistent policy
reform and boost confidence in the economy,
the country could spiral downward into an
economic quagmire. Although global
integration has been embraced, it is not a
substitute for a development strategy, and the
responsibility on policy makers continue to be
strong. They must meet this challenge of
effective governance to promote a long
overdue economic take-off.
112

Appendices
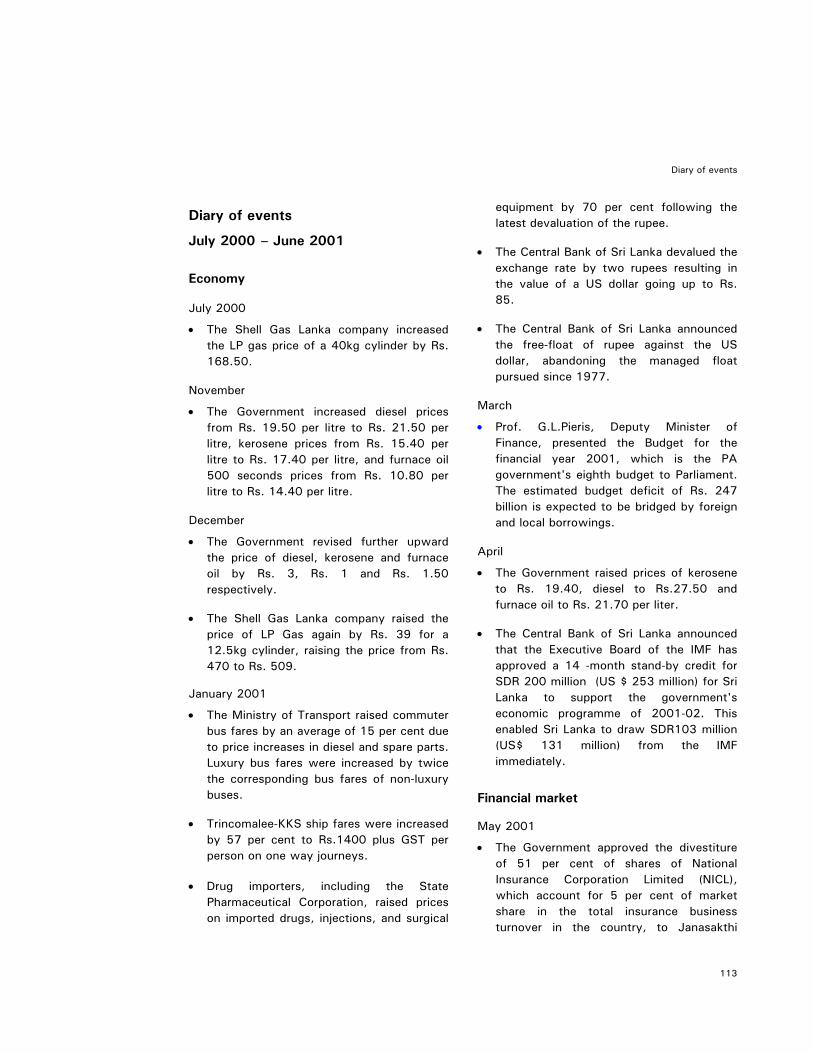
Diary of events
Diary of events
July 2000 – June 2001
Economy July 2000
• The Shell Gas Lanka company increased the LP gas price of a 40kg cylinder by Rs. 168.50.
November
• The Government increased diesel prices from Rs. 19.50 per litre to Rs. 21.50 per litre, kerosene prices from Rs. 15.40 per litre to Rs. 17.40 per litre, and furnace oil 500 seconds prices from Rs. 10.80 per litre to Rs. 14.40 per litre.
December
• The Government revised further upward the price of diesel, kerosene and furnace oil by Rs. 3, Rs. 1 and Rs. 1.50 respectively.
• The Shell Gas Lanka company raised the
price of LP Gas again by Rs. 39 for a 12.5kg cylinder, raising the price from Rs. 470 to Rs. 509.
January 2001
• The Ministry of Transport raised commuter bus fares by an average of 15 per cent due to price increases in diesel and spare parts. Luxury bus fares were increased by twice the corresponding bus fares of non-luxury buses.
• Trincomalee-KKS ship fares were increased
by 57 per cent to Rs.1400 plus GST per person on one way journeys.
• Drug importers, including the State
Pharmaceutical Corporation, raised prices on imported drugs, injections, and surgical
equipment by 70 per cent following the latest devaluation of the rupee.
• The Central Bank of Sri Lanka devalued the
exchange rate by two rupees resulting in the value of a US dollar going up to Rs. 85.
• The Central Bank of Sri Lanka announced
the free-float of rupee against the US dollar, abandoning the managed float pursued since 1977.
March
• Prof. G.L.Pieris, Deputy Minister of Finance, presented the Budget for the financial year 2001, which is the PA government's eighth budget to Parliament. The estimated budget deficit of Rs. 247 billion is expected to be bridged by foreign and local borrowings.
April
• The Government raised prices of kerosene to Rs. 19.40, diesel to Rs.27.50 and furnace oil to Rs. 21.70 per liter.
• The Central Bank of Sri Lanka announced
that the Executive Board of the IMF has approved a 14 -month stand-by credit for SDR 200 million (US $ 253 million) for Sri Lanka to support the government's economic programme of 2001-02. This enabled Sri Lanka to draw SDR103 million (US$ 131 million) from the IMF immediately.
Financial market May 2001
• The Government approved the divestiture of 51 per cent of shares of National Insurance Corporation Limited (NICL), which account for 5 per cent of market share in the total insurance business turnover in the country, to Janasakthi
113

State of the Economy 2001
Insurance Company Limited (JICL) for Rs.450 million.
Trade February 2001
The Government imposed a 40 per cent surcharge on customs duty, valid from 21st February to 31st December 2001. However, essential consumer items such as drugs, milk powder, sugar, potatoes, cooking oils, dried fish, textile and petroleum products and capital goods like tractors, and lorries were exempted.
April
• The importation of wheat grain and wheat flour was liberalized, following the Government signing a new agreement with Prima Ceylon Limited (PCL) to convert the Building, Operate, and Transfer (BOT) arrangement regarding the operation of the Prima Flour Mill, to a privately owned business enterprise. The government received Rs. 5,700 million by transferring the mill to the PCL.
May
• The Government of Sri Lanka imposed new regulations to prohibit imports of all raw and processed foods that have been subjected to genetic modification (GM).
June
• The Government of Sri Lanka removed the imposed ban on imports of GM foods for a period of three months up to September.
Labour September 2000
• The Government increased salaries of all government servants by Rs. 1,000 and pensioners by Rs. 500.
February 2001
• The Joint Plantation Trade Union Centre
(JPTUC) decided to withdraw from its
agreement with the Plantation Employers
Association on June 21st 2000 as they
failed to pay Rs.400 to the workers as
agreed. The Ceylon Workers Congress
joined the Sathyakriya (non-violent protest)
against the violation of the agreement. March
• After 23 days of protest, the estate workers' wage-hike demand was settled. The CWC, Government, and Employers Federation of Ceylon agreed on a new wage package within the framework of the collective agreement. In the terms of the agreement, the total wage package per day of plantation employees remained at Rs. 121.
April
• The Government Medical Officers’ Association (GMOA) branch union at the Chest Hospital staged a token strike in protest of the non-appointment of a permanent Medical Officer in charge of the hospital.
May
• The Society of Registered and Assistant Medical Officers staged a 'work to rule' campaign and a "sick note" campaign asking to re-implement a circular that will bring similar regulations to roster in all hospitals, and asking for disturbance allowance to be paid to medical graduates.
June
• The Transport Minister directed the reinstatement of 104 out of 131 railway workers who are under interdiction, without causing undue interference in the court cases pending against them, as well
114

Diary of events
as the disciplinary inquires conducted by the Railway Department.
Infrastructure development January 2001
• The final feasibility report of the Colombo Port Southern Harbour Development Project was handed over to the Hon. Minister of Port Development and Southern Development. According to the report, development of the Colombo South Port will cost approximately US$ 974.8 million. The Asian Development Bank financed the feasibility study.
• A Mixed Credit Loan Agreement was
signed between Sri Lanka and the Export Import Bank of China for the implementation of Muthurajawela Oil Storage Tank Project. The estimated project cost is US $ 79.5 million and the Mixed Credit Loan covers 90 per cent of the cost of the project. The completion of the project is expected to increase the storage capacity by 41per cent.
• An agreement was signed between Japan
and Sri Lanka to provide a soft loan to improve the water supply in the Greater Kandy areas, and expand a well-equipped post harvest technology laboratory for the Industrial Technology Institute, under its Counterpart Grant Aid Fund (CGAF) scheme. The total loan amounted to Rs.4 billion.
• Sri Lanka and Norway signed an agreement
to establish a National Cleaner Production Centre. Under the agreement the Centre will assist industries to find cost- effective, environmentally-friendly solutions to minimize industrial effluence and waste. The estimated cost of the project is US$ 1.4 million.
February
• A 165-megawatt generator was unloaded in Colombo port to tide over the present power shortage. The power supplied by this generator will be added to the national grid from Kelanitissa power station.
• The Government of Sri Lanka and the
German Development Bank (KfW) signed a loan agreement for a project to improve electricity distribution in the Greater Colombo area. A loan of Rs. 3.2 billion (DM 82 million) will be used by the Ceylon Electricity Board to construct three substations in the Greater Colombo area.
March
• The National Development Bank (NDB) and the Sri Lanka Standards Institute signed a Memorandum of Understanding (MOU) for development of quality and productivity standards in business enterprises.
April
• The Government of Sri Lanka and the Japan Bank signed a loan agreement for international cooperation in Colombo. The loan was for Rs.13,035 million on concessionary terms for part-financing of the Southern Highway Project. The other financiers of the project are the ADB (US$90 mn.), the Nordic Development fund (US$6.7 mn.), Swedish International Development Co-operation Agency (US$ 1 M) and GOSL (US$ 7.8 million).
• The Government of Sri Lanka and the
Asian Development Bank signed a Memorandum of Understanding on the Technical Assistance Programme, which consists of 21 technical assistance projects and 16 credit assistance projects, worth US$963.6 million for the period 2002-2004.
115

State of the Economy 2001
Foreign direct investment March 2001 • Sri Lanka and Belgium signed two
agreements to promote investment and bilateral co-operation in the field of technology and financial assistance. Belgium investment in Sri Lanka is likely to focus on diamonds, gems and jewellery, rubber goods and textile industries.
June
• AES Kelanitissa (Private) Limited signed a financing agreement with the Asian Development Bank and ANZ Investment Bank for the financing of its 183.15-megawatt combined cycle diesel fired power plant. The cost of the project is estimated at US$100 million.
Aid January 2001 • The US Department of Agriculture
announced the inclusion of Sri Lanka in the shortlist of countries receiving benefits under PL 480 Food for Peace program. Under this programme, Sri Lanka will be receiving 58,200 metric tons of wheat, valued at US$8 million.
February
• A grant for US$85,000 was signed by the Ambassador of Japan and the head of Medecins Sans Frontiers (MSF) under the "Japanese Assistance for Grassroots Projects" for the rehabilitation of the surgical theatre at the Batticaloa General Hospital.
• South Korea contributed US$200,000 toward the programme for private sector development of the Colombo Plan for the year 2001. A grant was made by the Korea International Co-operation Agency.
• An agreement was signed by the World Bank and the Government of Sri Lanka for a Japanese Social Development Fund Grant of US$750,000 to assist in developing an innovative model of community-driven development that addresses poverty alleviation among villages in Sri Lanka.
April
• Japan and Sri Lanka signed an agreement in which Japan has pledged financial assistance of Rs.11.6 million to develop low cost nutritious supplements for pregnant and lactating mothers, which will be undertaken by the Industrial Technology Institute.
May
• The Government of Sri Lanka and the Japanese Government signed an agreement with respect to a grant of US$ 800,000 to prepare a feasibility study aimed at developing the Sri Lanka's inland fisheries industry.
Cabinet decisions and governance August 2000 • Minister G. L. Peiris presented the new
draft constitution to the parliament amidst heavy interruption. Simultaneously, countrywide protest campaigns were carried out, demanding the withdrawal of the proposed new draft constitution.
• The debate on the proposed new
constitution was indefinitely postponed. • The Parliament was dissolved for the
general election. October
• The General Election was held to elect members for the 11th Parliament; 29 registered political parties and 99
116

Diary of events
independent groups contested with 5048 candidates.
• The People’s Alliance gained 107 seats
and won the election by a majority of 18 seats. It formed the new government for the second consecutive period.
January 2001
• The National Institute of Co-operative Development (Incorporation Bill) was brought before the Parliament. The bill envisaged the further strengthening of the co-operative movement of the country.
• The government decided to wind up the
Police Crime Detection Bureau (CDB). February
• The Government changed the Citizenship Act to eliminate gender discriminatory administrative action relating to the registration of foreigners married to Sri Lankan women. They can apply for citizenship under section 12 of the Act with the supplementary requirements.
• The Government Appropriation Bill for the
year 2001 was tabled in Parliament by the Deputy Finance Minister. Detailed revenue and expenditure estimates were presented to the Parliament before the budget. Sri Lanka's estimated defence expenditure for 2001 is Rs. 63 billion, up by 21 per cent from Rs.52 billion a year ago.
• The President Chandrika Kumaratunga
appointed the Salaries Commission to develop an appropriate wage policy and salary structure for public service in Sri Lanka, including the provincial public service and statutory agencies.
• The Sri Lanka Government donated US$
100,000 for earthquake victims of Gujarat, India. In addition 20 BOI garment factories donated 100,000 pieces of clothing, and
food items including milk powder to the victims of the earthquake.
• The Government amended the National
Environment Act No. 53 of 2000 with the escalation of environmental pollution due to rapid industrialization.
March
• Cabinet approved the "All Island Medical Service Act" which will nullify the government’s decision to decentralize the health services and hand over control to local governments.
• The Department of Wildlife Conservation
commenced development work of seven protected nature reserves at a cost of Rs. 277.6 million. The protected areas are Uda walawe, Horton Plains, Bundala, Peak Wilderness, Ritigala, Wasgomuwa and Minneriya.
• Premier of the State Council of the Peoples
Republic of China, Zhu Rongi, paid an official visit to Sri Lanka. He signed agreements on economic cooperation and technical cooperation.
June
• President Chandrika Kumaratunga sacked Minister Rauff Hakeem from the PA cabinet. He and six others form the National Unity Alliance (NUA) crossed over to the opposition in Parliament.
• Speaker Anura Bandaranaike declared that
the Supreme Court has no jurisdiction to issue an interim order restraining the Speaker to take decisions empowered under Standing Order 78 A.
• Ninety seven members of Parliament
placed their signatures on a 'no confidence' motion against the President, and handed it over to the Speaker.
117

State of the Economy 2001
• An amendment bill was approved by the parliament to restructure the Ceylon Hotels Cooperation.
• Prime Minister Ratnasiri Wickramanayake
was appointed to exercise the duties and functions of the office of the President, during the period when the President was away from the country.
Defence and security July
• A bomb exploded in the premises of Gangodawila Magistrate’s Court while a murder case trial was on.
September
• A suicide bomber exploded a bomb in the city of Colombo close to the Eye Hospital. Six were killed and 26 were seriously injured.
October
• Villagers clashed with terrorist suspects held in a detention camp in Bindunuwewa, and 24 inmates died while several were injured.
November
• A peace delegation from Norway held discussions with the LTTE group.
• LTTE terrorists fired mortars at the
Almanar Muslim School in Trincomalee District, and two students were killed and ten injured.
December
• The LTTE declared a unilateral cease-fire with effect from midnight December 24th.
January 2001 • US President Bill Clinton signed the
Instrument of Ratification of the US-Sri Lanka Extradition Treaty. The new treaty
replaces the pre-independence treaty concluded between the USA and Great Britain, on the mutual extradition of criminals signed in London in 1931 and extended to Ceylon at the time.
• Norway Special Envoy Eric Solheim arrived
in Colombo. He met President Kumaratunga and senior government ministers, and representatives of the Tamil and Muslim political parties and civil organizations.
February
• A demonstration was organized in front of the British Embassy in Washington DC by the Friends of Sri Lanka in the USA (FOSUS) to urge the British Government to recognize the LTTE as a terrorist organization under the new anti-terrorism legislation passed by the British Parliament in 2000.
March
• The British Government's Anti-Terrorism Act 2000 came into effect. The LTTE was included in a list of 21 international terrorist groups recommended for proscription under the new Terrorism Act 2000. The law was designed to halt funding and support for UK-based militant groups.
• Norwegian envoy Erik Solheim arrived in
Colombo to keep the ongoing peace process alive, after the British government proscribed the LTTE as a terrorist organization.
April
• The government of Sri Lanka and Russia signed a bilateral security agreement aimed at enhancing co-operation between their security services, particularly their police.
118

Diary of events
• The Government declared a three day cease-fire for the Northern war torn area during the festive season of the Sinhala and Tamil new year.
• The unilateral cease fire of the LTTE which
was announced on 23rd December 2000, came to an end as LTTE clashed with the Sri Lanka navy off the seas of Mullativue –Chellai.
• Norwegian Special envoy Erik Solheim
arrived in Colombo for talks with the President, amidst heavy fighting between the Government and the LTTE terrorists.
• The Sri Lanka Army launched "Operation
Agni Kheela" toward the position of the LTTE controlled area of Pallai in Southern Jaffna, and took control of a 8 sq. mile area. However, they returned to their original position after abandoning the
operation, amidst heavy injuries and a death toll of over 200 army personnel.
May
• The government of Sri Lanka and Croatia signed an agreement on cooperation in combating illicit drug trafficking, terrorism and organized crime, including human smuggling.
General September 2000 • The helicopter in which Minister Ashraff
was travelling crashed on to a mountain area in Urakanda, Aranayaka, killing all 16 passengers.
• Susanthika Jayasingha won a bronze
medal at the 200 metres event at the Sydney Olympics.
119

2000
1. Indicator Unit
Area: sq. km. 65606
Mid Year Population (2000): ('000) 19,359(a)
Population growth rate (2000) % 1.7(a)
Life expectancy at birth (1998) years 73.1
Infant mortality rate (1998) per 1000 live births 17
Gross school enrolment ratio (1998)(a) % 66
Adult literacy rate (1998) % 91.1
Human development index (HDI) (1998) Value 0.733
Human poverty index (HPI) (1998) Value 20.3
1996 1997 1998 1999 2000
2. Output, labour force and employment
GNP at current market prices Rs. bn. 757.3 880.0 1002.0 1090.0 1234
GDP at current market prices Rs. bn. 768.0 890.0 1018.0 1106.0 1256
GDP at current factor cost prices Rs. bn. 695.9 803.7 912.8 994.7 1125.3
GDP per capita at current market prices US$ 759.0 814.0 839.0 825.0 856
Labour force(b) mn. 6.2 6.2 6.6 6.8 6.7(c)
Labour force participation (b) % 48.7 48.7 51.7 50.7 49.4(c)
Unemployment (b) % 11.3 10.5 9.2 9.2 8.0(c)
3. Real output growth
GDP % 3.8 6.3 4.7 4.3 6.0(e)
Agriculture, forestry, and fishing % -4.6 3.0 2.5 4.5 1.8(e)
Mining and quarrying % 8.9 3.8 -5.4 4.1 4.8(e)
Manufacturing % 6.5 9.1 6.3 4.4 9.2(e)
Construction % 3.4 5.4 7.1 4.8 4.8(e)
Services % 5.8 7.1 5.2 4.2 6.9(e)
4. Prices & Wages
CCPI (annual average) % change 15.9 9.6 9.4 4.7 6.2(e)
GCCPI (annual average) % change 14.7 7.1 6.9 3.8 3.2(e)
WPI (annual average) % change 20.5 6.9 6.1 -0.3 1.7(e)
Implicit GNP deflator % change 12.2 8.7 8.4 4.4 6.7(e)
Real wage rates
Workers in wages boards trades % change -8.2 -1.7 2.7 -2.1 -3.6
Government employees % change -10.3 0.5 0.9 -4.5 1.9(e)
5. Consumption, Investment, and savings
Consumption % of GDP 84.7 82.7 81.1 80.5 82.7(e)
Gross domestic capital formation % of GDP 24.2 24.4 25.1 27.3 28.0(e)
Gross domestic savings % of GDP 15.3 17.3 19.1 19.5 17.3(e)
Gross national savings % of GDP 19.0 21.5 23.4 23.5 21.4(e)
Foreign savings % of GDP 8.9 7.1 6.0 7.8 10.7(e)
6. Government finance
Revenue % of GDP 19.0 18.5 17.2 17.7 16.8(e)
Expenditure & net lending % of GDP 28.5 26.4 26.3 25.2 26.7(e)
Current expenditure % of GDP 22.8 20.8 19.6 18.7 20.3(e)
Capital expenditure & net lending % of GDP 6.0 5.8 6.7 6.5 6.4(e)
Current A/C balance % of GDP -3.8 -2.2 -2.4 -1.0 -3.4
Budget deficit
Primary deficit % of GDP -3.1 -1.7 -3.8 -1.9 -2.1
Overall deficit (before grants) % of GDP -9.4 -7.9 -9.2 -7.5 -9.9
Public debt
External % of GDP 46.8 42.3 45.3 45.9 43.1(e)
Domestic % of GDP 45.4 43.5 45.5 49.1 53.9(e)
7. External Trade
Terms of trade % change -0.5 6.8 14.2 -5.0 -6.1
Import price index % change 12.0 2.4 -2.2 -3.5 8.1(e)
Export price index % change 11.6 9.3 11.6 -8.5 1.5(e)
Appendix A: Macroeconomic Indicators (Statistical Base)
Table A1: Socio-Economic Indicators

Import volume index % change 0.4 12.3 12.4 0.2 12.9(e)
Export volume index % change 4.1 10.6 0.1 5.0 18.3(e)
8. External finance
Trade balance % of GDP -1344.0 -1225.0 -1092.0 -1369.0 -1798.0
Current account balance % of GDP -4.9 -2.6 -1.4 -3.6 -6.4
Capital & Financial account balance % of GDP 4.2 4.2 3.4 3.8 4.8(e)
Foreign direct investments % of GDP 0.6 1.0 1.1 1.5 1.5(e)
Foreign portfolio investments % of GDP 0.0 0.1 -0.2 -0.1 -0.4
Import capacity months of imports (d) 6.0 6.4 5.9 5.2 3.5(e)
External debt % of GDP 68.6 62.3 61.6 63.5 60(e)
Debt-service ratio % of exports 15.3 13.3 13.3 15.2 14.7(e)
9. Exchange rates (year end)
U.S.A. Rs./US$ 56.7 61.3 67.8 72.1 80.1(e)
U.K. Rs./UK Pound 95.9 101.6 112.6 116.7 119.4
Japan Rs./Yen 0.5 0.5 0.6 0.7 0.7
Fed. Rep. of Germany Rs./DM 36.5 34.2 40.4 37.1 38
India Rs./Rs. Indian 1.6 1.6 1.6 1.7 1.7
SDR Rs./SDR 10.8 10.2 12.0 98.9 99.9
10. Money supply
Narrow money supply (M1) % change 4.0 9.8 12.1 12.8 9.1(e)
Broad money supply (M2) % change 11.3 15.6 13.2 13.4 12.9(e)
Domestic credit % change 15.9 7.8 11.9 19.9 26.9(e)
External banking assets % change -2.6 43.5 16.7 -3.4 -31.9
11. Interest Rates
Treasury bills
3 month % per annum, year end 17.5 10.0 12.0 11.8 17.8(e)
12 months % per annum, year end 17.4 10.2 12.6 12.8 18.2(e)
Call money rates % per annum, year end 12.8 11.0 11.3 9.3 17.0(e)
Average prime lending rate % per annum, year end 18.6 12.9 15.0 13.5 20.0(e)
Commercial banks saving % per annum, year end 12.3 10.0 9.2 9.1 9.9(e)
NSB saving % per annum, year end 12.0 10.8 10.5 9.2 8.4(e)
Commercial banks fixed deposits % per annum, year end 17.8 15.3 13.0 12.5 15.0(e)
NSB fixed deposits % per annum, year end 15.0 11.0 11.5 11.5 15.0(e)
12. Share market indicators
Annual turnover Rs. bn. 7.4 18.3 18.1 14.3 10.6(e)
Companies listed No. 235.0 239.0 240.0 237.0 239.0
Market capitalisation Rs. bn. 104.2 129.4 117.0 113.0 88.8(e)
Net purchases by non-nationals Rs. mn. 352.0 716.0 -1517.0 -902.0 -3364
Share price indices
CSE all Index, 1985=100) 603.0 702.2 597.0 573.0 447.6(e)
CSE sensitive Index, 1985=100) 897.7 1068 923 938.0(h) 698.5(e)
Notes:
a: combined first, second, and third level gross enrolment ratio.
b: Excluding Northerm and Eastern Provinces.
c: Average of first three quarters
d: Imports of goods, services, & income
e: Provisional
Sources
IPS database.
Central Bank of Sri Lanka, Annual Report 2000.
Colombo Stock Exchange, Annual Report 2000.
Human Development Report, UNDP, 2000.(not yet received)
Quarterly Report of the Sri Lanka Labour Force Survey, Dept. of Census and Statistics (Various Issues).

POPGDP PGDP Thousands GDP PGDP POP
Rs. mn. Rs.
1980 340207.8 23080.6 14740.0 - - -
1981 359864.2 24156.8 14897.0 5.8 4.7 1.1
1982 378112.9 24893.9 15189.0 5.1 3.1 2.0
1983 396867.0 25743.8 15416.0 5.0 3.4 1.5
1984 416915.0 26727.0 15599.0 5.1 3.8 1.2
1985 437582.1 27630.4 15837.0 5.0 3.4 1.5
1986 456316.2 28312.7 16117.0 4.3 2.5 1.8
1987 462949.6 28295.9 16361.0 1.5 -0.1 1.5
1988 475441.7 28665.2 16586.0 2.7 1.3 1.4
1989 486140.6 28926.6 16806.0 2.3 0.9 1.3
1990 516152.7 30335.2 17015.0 6.2 4.9 1.1
1991 539954.8 31270.9 17267.0 4.6 3.1 1.5
1992 563061.9 32311.6 17426.0 4.3 3.3 0.9
1993 602171.5 34125.1 17646.0 6.9 5.6 1.3
1994 636061.5 35552.0 17891.0 5.6 4.2 1.4
1995 670742.2 36984.0 18136.0 5.5 4.0 1.4
1996 695934.0 37954.5 18336.0 3.8 2.6 1.1
1997 739763.0 39875.1 18552.0 6.3 5.1 1.2
1998 774796.0 41269.6 18774.0 4.7 3.5 1.2
1999 808340.0(a) 42448.1 19043.0 4.3 2.8 1.4
2000 857035.0(a) 44270.6 19359.0(a) 6.0(a) 4.1 1.7
Source:
Annual Reports, Central Bank of Sri Lanka, Various issues.
Notes:
(a) provisional
Table A2: Gross Domestic Product (GDP), Mid-year Population (POP), Per Capital GDP (PGDP), and their Growth Rates, 1980-2000
Growth Rates1996 Prices
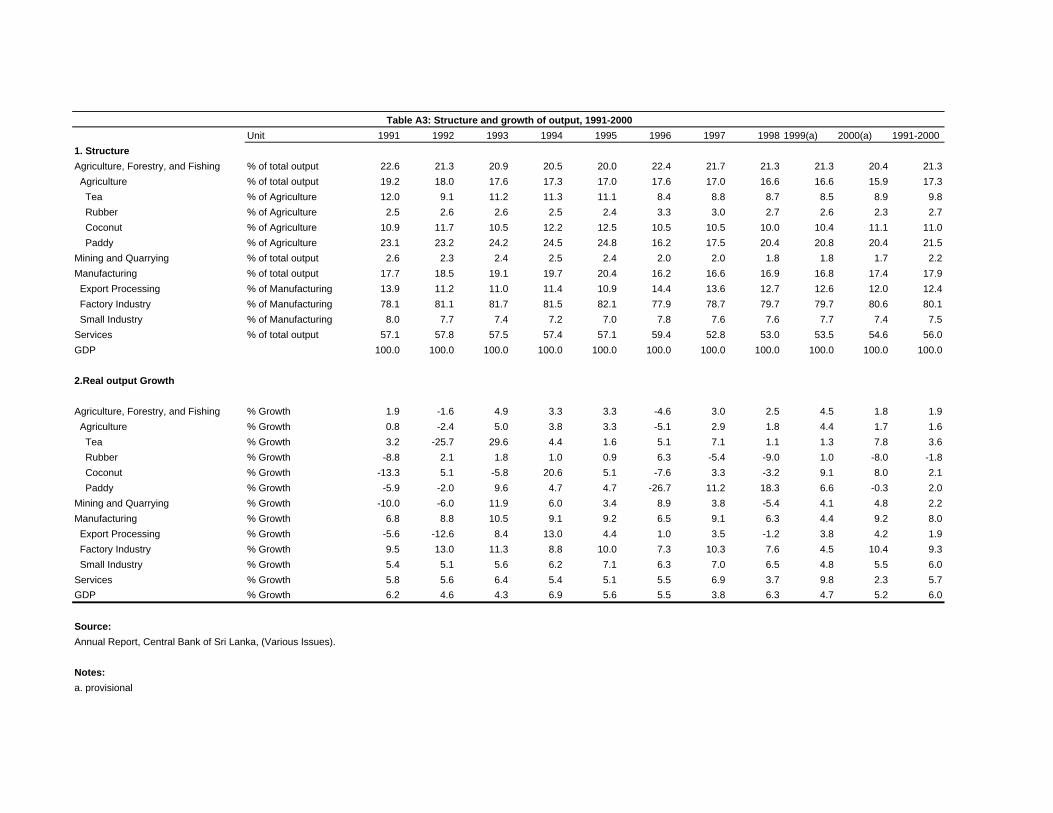
Unit 1991 1992 1993 1994 1995 1996 1997 1998 1999(a) 2000(a) 1991-2000
1. Structure
Agriculture, Forestry, and Fishing % of total output 22.6 21.3 20.9 20.5 20.0 22.4 21.7 21.3 21.3 20.4 21.3
Agriculture % of total output 19.2 18.0 17.6 17.3 17.0 17.6 17.0 16.6 16.6 15.9 17.3
Tea % of Agriculture 12.0 9.1 11.2 11.3 11.1 8.4 8.8 8.7 8.5 8.9 9.8
Rubber % of Agriculture 2.5 2.6 2.6 2.5 2.4 3.3 3.0 2.7 2.6 2.3 2.7
Coconut % of Agriculture 10.9 11.7 10.5 12.2 12.5 10.5 10.5 10.0 10.4 11.1 11.0
Paddy % of Agriculture 23.1 23.2 24.2 24.5 24.8 16.2 17.5 20.4 20.8 20.4 21.5
Mining and Quarrying % of total output 2.6 2.3 2.4 2.5 2.4 2.0 2.0 1.8 1.8 1.7 2.2
Manufacturing % of total output 17.7 18.5 19.1 19.7 20.4 16.2 16.6 16.9 16.8 17.4 17.9
Export Processing % of Manufacturing 13.9 11.2 11.0 11.4 10.9 14.4 13.6 12.7 12.6 12.0 12.4
Factory Industry % of Manufacturing 78.1 81.1 81.7 81.5 82.1 77.9 78.7 79.7 79.7 80.6 80.1
Small Industry % of Manufacturing 8.0 7.7 7.4 7.2 7.0 7.8 7.6 7.6 7.7 7.4 7.5
Services % of total output 57.1 57.8 57.5 57.4 57.1 59.4 52.8 53.0 53.5 54.6 56.0
GDP 100.0 100.0 100.0 100.0 100.0 100.0 100.0 100.0 100.0 100.0 100.0
2.Real output Growth
Agriculture, Forestry, and Fishing % Growth 1.9 -1.6 4.9 3.3 3.3 -4.6 3.0 2.5 4.5 1.8 1.9
Agriculture % Growth 0.8 -2.4 5.0 3.8 3.3 -5.1 2.9 1.8 4.4 1.7 1.6
Tea % Growth 3.2 -25.7 29.6 4.4 1.6 5.1 7.1 1.1 1.3 7.8 3.6
Rubber % Growth -8.8 2.1 1.8 1.0 0.9 6.3 -5.4 -9.0 1.0 -8.0 -1.8
Coconut % Growth -13.3 5.1 -5.8 20.6 5.1 -7.6 3.3 -3.2 9.1 8.0 2.1
Paddy % Growth -5.9 -2.0 9.6 4.7 4.7 -26.7 11.2 18.3 6.6 -0.3 2.0
Mining and Quarrying % Growth -10.0 -6.0 11.9 6.0 3.4 8.9 3.8 -5.4 4.1 4.8 2.2
Manufacturing % Growth 6.8 8.8 10.5 9.1 9.2 6.5 9.1 6.3 4.4 9.2 8.0
Export Processing % Growth -5.6 -12.6 8.4 13.0 4.4 1.0 3.5 -1.2 3.8 4.2 1.9
Factory Industry % Growth 9.5 13.0 11.3 8.8 10.0 7.3 10.3 7.6 4.5 10.4 9.3
Small Industry % Growth 5.4 5.1 5.6 6.2 7.1 6.3 7.0 6.5 4.8 5.5 6.0
Services % Growth 5.8 5.6 6.4 5.4 5.1 5.5 6.9 3.7 9.8 2.3 5.7
GDP % Growth 6.2 4.6 4.3 6.9 5.6 5.5 3.8 6.3 4.7 5.2 6.0
Source:
Annual Report, Central Bank of Sri Lanka, (Various Issues).
Notes:
a. provisional
Table A3: Structure and growth of output, 1991-2000

1980 1985 1990 1991 1992 1993 1994 1995 1996 1997 1998 1999 2000(a)
1. Value Added, Current prices (Rs. Mn.)
Food, beverages and tobacco 1795.0 6166.0 12065.0 15070.0 18668.0 21704.0 24373.0 29507.0 32891.0 35585.0 40452.0 44503.0 49031.0
Textile, wearing apparel and leather products 382.0 2594.0 7167.0 8542.0 14630.0 18994.0 19916.0 24895.0 31148.0 40581.0 47482.0 55263.0 69451.0
Wood and wood products (including furniture) 165.0 420.0 485.0 571.0 677.0 831.0 1081.0 1177.0 1250.0 1258.0 1313.0 1390.0 1554.0
Paper and paper products 305.0 543.0 1019.0 1167.0 1397.0 1912.0 2301.0 2458.0 2580.0 2633.0 2578.0 2664.0 2808.0
Chemicals, petroleum, coal, rubber and plastic products 1249.0 1402.0 2428.0 3199.0 3989.0 4723.0 5758.0 6898.0 8957.0 10745.0 14274.0 13832.0 17771.0
Nonmetallic mineral products (except petroleum and coal) 608.0 1089.0 4742.0 4905.0 5918.0 7163.0 9272.0 9726.0 10537.0 11600.0 12463.0 13817.0 14240.0
Basic metal products 80.0 38.0 194.0 248.0 263.0 279.0 356.0 347.0 450.0 598.0 710.0 777.0 959.0
Fabricated metal products, machinery and transport equipme 297.0 1055.0 2746.0 3247.0 3629.0 3608.0 4344.0 4547.0 4809.0 5924.0 6779.0 7367.0 7714.0
Manufactured products n.e.s. 12.0 59.0 138.0 1092.0 1196.0 1532.0 1838.0 2319.0 2763.0 3157.0 3426.0 3799.0 3965.0
Total 4893.0 13366.0 30984.0 38041.0 50367.0 60746.0 69239.0 81368.0 95385.0 112011.0 129477.0 143412.0 167493.0
2. Composition of Industrial Production, %
Food, beverages and tobacco 36.7 46.1 38.9 39.6 37.1 35.7 35.2 35.6 34.5 31.7 31.2 31.0 29.3
Textile, wearing apparel and leather products 7.8 19.4 23.1 22.5 29.0 31.3 28.8 30.6 32.7 36.2 36.7 38.5 41.5
Wood and wood products (including furniture) 3.4 3.1 1.6 1.5 1.3 1.4 1.6 1.4 1.3 1.1 1.0 1.0 1.0
Paper and paper products 6.2 4.1 3.3 3.1 2.8 3.1 3.3 3.0 2.7 2.4 2.0 2.0 1.7
Chemicals, petroleum, coal, rubber and plastic products 25.5 10.5 7.8 8.4 7.9 7.8 8.3 8.5 9.4 9.6 11.0 9.6 10.6
Nonmetallic mineral products (except petroleum and coal) 12.4 8.1 15.3 12.9 11.7 11.8 13.4 12.0 11.0 10.4 9.6 9.6 8.5
Basic metal products 1.6 0.3 0.6 0.7 0.5 0.5 0.5 0.4 0.5 0.5 0.5 0.5 0.6
Fabricated metal products, machinery and transport equipme 6.1 7.9 8.9 8.5 7.2 5.9 6.3 5.6 5.0 5.3 5.2 5.1 4.6
Manufactured products n.e.s. 0.2 0.4 0.4 2.9 2.4 2.5 2.7 2.9 2.9 2.8 2.6 2.6 2.4
Total 100.0 100.0 100.0 100.0 100.0 100.0 100.0 100.0 100.0 100.0 100.0 100.0 100.0
Source
Annual Reports, Central Bank of Sri Lanka. (Various Issues)
Notes:
(a) Provisional.
Table A4: Industrial Production, 1980-2000

Production Production Production Price(a) Production Price(b)
Mn. Kg. Colombo (net) Export (f.o.b.) Mn. Kg. Colombo (RSS 1) Export (f.o.b.) Mn. Kg. Rs./Nut 000 Mt Rs./Bushel (c)
Rs/Kg. Rs/Kg. Rs/Kg. Rs/Kg.
1980 191.0 17.7 33.4 133.0 10.6 21.4 2026.0 3.2 2133.0 50.0
1981 210.0 17.7 35.1 124.0 10.0 21.8 2258.0 2.5 2230.0 57.5
1982 188.0 22.5 35.0 125.0 10.2 17.7 2521.0 1.8 2156.0 57.5
1983 179.0 37.0 52.5 140.0 14.0 22.8 2312.0 2.4 2484.0 62.5
1984 208.0 46.5 77.2 142.0 14.4 26.2 1942.0 4.8 2420.0 62.5
1985 214.0 35.4 60.6 137.5 15.9 21.3 2958.0 2.6 2661.0 70.0
1986 211.0 30.3 44.5 137.8 16.6 23.8 3039.0 1.5 2588.0 70.0
1987 213.0 38.1 53.0 121.8 19.9 27.6 2291.0 2.6 2128.0 70.0
1988 227.0 41.6 56.0 122.4 24.4 37.3 1936.0 4.0 2477.0 80.0
1989 207.0 52.2 66.9 110.7 22.6 36.2 2484.0 3.4 2063.0 80.0
1990 233.0 65.7 91.8 113.1 22.9 35.5 2532.0 3.6 2538.0 110.0
1991 241.0 57.1 84.1 103.9 23.6 34.6 2184.0 4.8 2389.0 136.0
1992 179.0 60.5 82.0 106.1 29.3 37.7 2296.0 6.5 2340.0 136.0
1993 231.9 68.9 91.2 104.2 35.5 44.3 2164.0 6.3 2570.0 155.0
1994 242.2 65.1 91.3 105.3 50.4 51.8 2622.0 5.7 2684.0 155.0
1995 245.9 72.2 102.3 105.7 72.0 83.7 2755.0 6.1 2810.0 155.0
1996 258.4 103.9 139.6 112.5 67.9 79.8 2561.0 9.4 2061.0 155.0
1997 276.9 119.4 158.4 105.8 56.7 75.4 2631.0 9.6 2239.0 155.0
1998 280.1 134.3 184.9 95.7 49.7 67.7 2552.0 8.3 2692.0 155.0
1999(e) 283.7 115.3 162.4 96.6 45.3 54.0 2828.0 10.0 2868.0 155.0
2000(f) 305.8 135.5 184.4 87.2 55.0 66.2 3055.0 7.4 2859.0 155.0
Source:
Annual Reports, Central Bank of Sri Lanka, Various issues.
Notes:
a. Average export price of the three major coconut products only.
b. Guaranteed Price
c. 20.9 Kg. of paddy = 1 bushel of paddy
e. Revised
f. Provisional
Price Price
Table A5: Major Agricultural Crops, Production and Prices, 1980-2000Tea Rubber Coconut Paddy

Household Labour Labour
Population Force Force
(10 yrs. & over) No. Mn. Participation No. Mn. Rate No. Mn. Rate
No. Mn. Rate
1991
q1 11.7 6.0 51.1 5.1 85.9 0.8 14.1
q2 11.7 5.8 49.7 4.9 84.7 0.9 15.3
q3 11.8 5.8 49.1 4.9 84.5 0.9 15.5
q4 11.9 5.9 49.3 5.1 86.3 0.8 13.7
1992
q1 11.9 5.8 48.8 5.0 85.9 0.8 14.1
q2 12.1 5.8 48.1 4.9 83.4 1.0 16.6
q3 12.1 5.7 46.9 4.8 85.7 0.8 14.3
q4 12.2 5.9 48.9 5.2 86.7 0.8 13.3
1993
q1 12.3 5.9 48.4 5.1 85.3 0.9 14.7
q2 12.3 6.1 49.5 5.3 86.4 0.8 13.6
q3 12.3 6.0 49.1 5.2 87.0 0.8 13.0
q4 12.3 6.1 49.5 5.2 86.2 0.8 13.8
1994
q1 12.5 6.0 47.7 5.1 86.4 0.8 13.6
q2 12.4 6.2 49.6 5.4 87.0 0.8 13.0
q3 12.5 6.1 49.2 5.3 86.3 0.8 13.7
q4 12.6 6.0 48.1 5.3 87.9 0.7 12.1
1995
q1 12.7 6.1 47.8 5.3 87.5 0.8 12.5
q2 12.7 6.1 47.8 5.3 88.1 0.7 11.9
q3 12.8 6.1 47.9 5.3 87.3 0.8 12.7
q4 12.8 6.2 48.3 5.4 88.0 0.7 12.0
1996
q1 12.8 6.3 49.2 5.6 88.7 0.7 11.3
q2 12.8 6.2 48.5 5.5 88.5 0.7 11.5
q3 12.8 6.2 48.6 5.5 88.4 0.7 11.6
q4 12.8 6.2 48.5 5.5 88.9 0.7 11.1
1997
q1 12.9 6.2 48.5 5.6 89.3 0.7 10.7
q2 12.9 6.2 48.4 5.6 89.8 0.6 10.2
q3 12.9 6.2 48.3 5.6 89.6 0.6 10.4
q4 12.9 6.2 48.5 5.6 89.6 0.6 10.3
1998
q1 12.9 6.6 51.6 5.9 89.5 0.7 10.5
q2 12.9 6.6 51.0 6.0 90.5 0.6 9.5
q3 12.9 6.7 51.9 6.1 90.9 0.6 9.1
q4 12.9 6.6 51.4 6.0 91.2 0.6 8.8
1999
q1 12.9 6.7 52.3 6.2 91.4 0.6 8.6
q2 13.1 6.5 49.5 5.9 91.5 0.6 8.5
q3 13.2 6.7 50.8 6.1 90.9 0.6 9.1
q4 13.5 6.8 50.2 6.1 90.8 0.6 9.2
2000
q1 13.5 6.9 50.8 6.3 92.0 0.5 8.0
Source:
Quarterly Report of the Sri Lanka Labour Force, Department of Census and Statistics.
Notes
From the second quarter of 1991 to the forth quarter 1999, excluding the Northern and Eastern provinces.
Table A6: Labour Force Participation of the Household Population, All Island, 1991 - 2000
Labour Force
Employed Unemployed

Private Public Private Public Private Public Private Public
1980 16136.0 4709.0 24.3 7.1 88191.9 25737.2 44.7 4.6
1981 19153.0 4126.0 22.5 4.9 86876.0 18715.1 -1.5 -27.3
1982 25413.0 4866.0 25.6 4.9 101490.1 19433.0 16.8 3.8
1983 29379.0 5963.0 24.2 4.9 102386.4 20781.2 0.9 6.9
1984 32483.0 7075.0 21.1 4.6 96706.3 21063.2 -5.5 1.4
1985 30690.0 7767.0 18.9 4.8 90542.8 22914.5 -6.4 8.8
1986 32692.0 9634.0 18.2 5.4 91122.2 26852.8 0.6 17.2
1987 34536.0 11216.0 17.6 5.7 89958.6 29215.2 -1.3 8.8
1988 37156.0 12805.0 16.7 5.8 86801.6 29914.3 -3.5 2.4
1989 39943.0 14306.0 15.9 5.7 85114.8 30484.7 -1.9 1.9
1990 57910.0 12507.0 18.0 3.9 102852.2 22213.3 20.8 -27.1
1991 68368.0 15838.0 18.4 4.3 109412.4 25346.3 6.4 14.1
1992 86407.0 13632.0 20.3 3.2 125717.4 19833.8 13.0 -27.8
1993 105305.0 20570.0 21.1 4.1 139953.2 27338.1 10.2 27.4
1994 136649.0 17611.0 23.6 3.0 166094.3 21405.8 15.7 -27.7
1995 147280.0 23595.0 22.1 3.5 165105.2 26450.7 -0.6 19.1
1996 160181.0 23328.0 20.9 3.0 160181.0 23328.0 -3.1 -13.4
1997 186950.0 29923.0 21.0 3.4 172077.9 27553.4 6.9 15.3
1998 221754.0 33960.0 21.9 3.3 188246.2 30054.3 8.6 8.3
1999(e) 266518.0 35210.0 24.1 3.2 216505.3 28376.5 13.1 -5.9
2000(e) 311460.0 39639.0 24.8 3.2 237212.5 30189.6 8.7 6.0
Source:
Annual Reports, Central Bank of Sri Lanka, Various issues.
Notes:
a. Private Sector and Public Corporations.
b. Government and Public Enterprises.
c. Current Series deflated by GDP Deflator.
e. Provisional
Table A7: Gross Domestic Fixed Capital Formation, 1980-2000
( Current market prices) (As % of GDP) (at 1996 prices) (Growth in real terms)

1982 1983 1984 1985 1986 1987 1988 1989 1990 1991 1992 1993 1994 1995 1996 1997 1998 1999(a) 2000(a)
As % of GDP
Gross Domestic Savings 11.9 13.8 19.9 11.9 12.0 12.8 12.0 12.2 14.3 12.8 15.0 16.0 15.2 15.3 15.3 17.3 19.1 19.5 17.3
Net Factor Income From Abroa -2.0 -2.6 -2.2 -2.1 -2.2 -2.2 -2.4 -2.3 -2.1 -2.0 -1.8 -1.2 1.4 -1.1 -1.5 -1.1 -1.1 -1.6 -1.8
Net Private Transfers 5.5 5.3 4.6 4.4 4.4 4.7 4.6 4.7 4.5 4.5 4.8 5.4 5.4 5.2 5.1 5.2 5.4 5.6 5.9
Gross National Savings 15.4 16.4 22.2 14.2 14.3 15.3 14.2 14.6 16.8 15.2 17.9 20.2 19.1 19.5 19.0 21.5 23.4 23.5 21.4
Foreign Savings 15.3 12.4 3.6 9.6 9.3 8.0 8.5 7.1 5.4 7.6 6.3 5.3 7.9 10.4 8.9 7.1 6.0 7.8 10.7
Gross Domestic Investment 30.8 28.9 25.8 23.8 23.7 23.3 22.8 21.7 22.2 22.9 24.3 25.6 27.0 25.7 24.2 24.4 25.1 27.3 28
Sources:
IPS database.
Annual Reports, Central Bank of Sri Lanka, Various issues.
Notes:
a. provisional
b. not imports of goods and non factor services
Table A8: Saving and Investment, 1982 - 2000

(% of GDP)1989 1990 1991 1992 1993 1994 1995 1996 1997 1998 1999 2000(b)
Revenue 21.4 21.1 20.5 20.2 19.7 19.0 20.4 19.0 18.5 17.3 17.7 16.8
Grants 2.5 2.1 2.1 1.9 1.6 1.4 1.4 1.0 0.8 0.7 0.6 0.4
Expenditure
Current expenditure 22.6 22.3 22.5 21.1 20.5 21.9 23.1 22.8 20.8 19.6 18.7 20.3
Capital & net lending 10.0 8.7 9.6 6.4 7.6 7.5 7.4 5.7 5.7 6.7 6.5 6.5
Current account balance -1.2 -1.2 -2.0 -0.9 -0.8 -2.9 -2.7 -3.8 -2.2 -2.4 -1.0 -3.4
Primary deficit -5.5 -3.5 -5.7 -1.2 -2.4 -3.9 -4.3 -3.1 -1.7 -3.8 -1.9 -4.2
Overall deficit (before grants) -11.2 -9.9 -11.6 -7.3 -8.4 -10.5 -10.1 -9.4 -7.9 -9.2 -7.5 -9.9
Financing budget deficit
Foreign financing 4.9 5.7 7.3 3.7 3.6 3.5 4.5 2.3 1.9 1.7 0.7 0.4
Net borrowings 2.4 3.6 5.2 1.7 2.0 2.0 3.2 1.3 1.1 1.0 0.1 0
Grants 2.5 2.1 2.1 1.9 1.6 1.4 1.4 1.0 0.8 0.7 0.6 0.4
Domestic financing 6.3 4.2 4.3 3.7 4.9 6.5 5.1 6.5 3.4 7.1 6.8 9.4
Market borrowings 5.2 4.1 4.2 4.4 4.4 6.6 5.0 5.1 4.5 7.1 6.8 9.2
Bank -0.2 0.1 0.0 -0.5 -1.2 0.2 1.1 1.7 -0.2 1.9 2.4 4.3
Non-bank 5.5 4.0 4.1 5.0 5.7 6.4 3.9 3.4 4.7 5.3 4.5 4.9
Other borrowings 1.1 0.1 0.2 -0.8 0.4 -0.1 0.1 1.3 -1.1 -0.1 -0.1 0.3
Privatisation proceeds - - - - - 0.5 0.4 0.6 2.5 0.4 _ _
Source:
Annual Reports, Central Bank of Sri Lanka, Various issues.
Notes:
a: Since 1994, privatisation proceeds have been shifted from the capital expenditure and net lending
category to the financing section.
b. Provisional
Table A9: Summary of Government Fiscal Operations, 1989 -2000

Unit 1982 1983 1984 1985 1986 1987 1988 1989 1990 19911. Financial Depth
Narrow Money Supply M1/GDP 11.9 12.1 10.9 11.6 11.8 12.8 14.6 14.0 12.3 12.5
Broad Money Supply M2/GDP 30.7 30.6 28.2 29.8 28.3 29.7 30.6 30.3 28.1 29.7
2. Monetary Expansion/Contraction
Narrow Money Supply % growth 17.3 25.4 14.1 11.5 12.9 18.4 29.1 9.1 12.1 17.7
Broad Money Supply % growth 24.8 22.1 16.6 11.5 5.1 14.7 16.5 12.5 18.5 22.1
3. Causal Factors
3.1 External Banking Assets Rs. Mn. 2450.1 3154.7 9950.9 9183.2 9180.2 9291.2 7058.5 4732.0 3419.0 12258.0
% growth -16.7 28.8 215.4 -7.7 0.0 1.2 -24.0 -33.0 -27.7 258.5
3.2 Domestic Credit Rs. Mn. 42397.6 49293.0 49926.2 59226.1 64108.5 75565.5 96867.0 102321.2 115964.3 127751.2
% growth 24.8 16.3 1.3 18.6 8.2 17.9 28.2 5.6 13.3 10.2
3.2.1 to Government Rs. Mn. 17150.2 17533.1 14554.4 20347.6 22546.1 27047.9 36064.5 36118.0 35358.0 35392.0
% growth 34.1 2.2 -17.0 39.8 10.8 20.0 33.3 0.1 -2.1 0.1
3.2.2 to Private Sector Rs. Mn. 25247.4 31759.9 35371.8 38878.5 41562.4 48517.6 60802.5 66203.2 80606.3 92359.2
% growth 19.2 25.8 11.4 9.9 6.9 16.7 25.3 8.9 21.8 14.6
3.3 Other Liabilities Rs. Mn. -14337.8 -15190.9 -16449.8 -20000.4 -22428.5 -26521.9 -35979.6 -30619.8 -28838.0 -29435.0
% growth 15.1 6.0 8.3 21.6 12.1 18.3 35.7 -14.9 -5.8 2.1
Contd…
Unit 1991 1992 1993 1994 1995 1996 1997 1998 1999 20001. Financial Depth
Narrow Money Supply M1/GDP 12.5 11.8 11.9 12.2 11.3 10.2 10.7 10.5 10.9 10.5
Broad Money Supply M2/GDP 29.7 30.5 32.1 33.1 34.2 33.0 35.9 34.6 36.0 36.0
2. Monetary Expansion/Contraction
Narrow Money Supply % growth 17.7 7.4 18.6 18.7 6.7 4.0 9.8 12.1 12.8 9.1
Broad Money Supply % growth 22.1 17.4 23.4 19.7 19.2 10.8 13.8 9.7 13.3 13.0
3. Causal Factors
3.1 External Banking Assets Rs. Mn. 12258.0 20940.0 48119.0 64467.0 66532.0 61861.0 89292.0 93724.0 83892.0 59448.0
% growth 258.5 70.8 129.8 34.0 3.2 -7.0 44.3 5.0 -10.5 -29.1
3.2 Domestic Credit Rs. Mn. 127751.2 144003.0 150696.9 173795.6 223798.3 252317.0 272733.0 311626.0 374120.0 469084.0
% growth 10.2 12.7 4.6 15.3 28.8 12.7 8.1 14.3 20.1 25.4
3.2.1 to Government Rs. Mn. 35392.0 33065.0 26993.0 28148.0 35214.0 48537.0 46365.0 58591.0 85881.0 134484.0
% growth 0.1 -6.6 -18.4 4.3 25.1 37.8 -4.5 26.4 46.6 56.6
3.2.2 to Private Sector Rs. Mn. 92359.2 110938.0 123703.9 145647.6 188352.0 203780.0 226368.0 253035.0 288239.0 334600.0
% growth 14.6 20.1 11.5 17.7 29.3 8.2 11.1 11.8 13.9 16.1
3.3 Other Liabilities Rs. Mn. -29435.0 -35150.0 -38679.0 -46590.0 -61794.0 -60978.0 -73768.0 -89176.0 -99936.0 -123863.0
% growth 2.1 19.4 10.0 20.5 32.6 -1.3 21.0 20.9 12.1 23.9
Source:
Annual Reports, Central Bank of Sri Lanka, Various issues.
* Data have been reclassified starting from 1990. For more information, see Annual Report 1995, Central Bank of Sri Lanka.
Table A10: Money Supply and Underlying Factors, 1982-2000

1987 1988 1989 1990 1991 1992 1993 1994 1995 1996 1997 1998 1999 2000Bank rate 10.0 10.0 14.0 15.0 17.0 17.0 17.0 17.0 17.0 17.0 17.0 17.0 16.0 25.0
Treasury Bills, Yield rates
3 Month 10.8 18.9 18.1 17.4 16.3 17.7 18.1 18.7 19.3 17.5 10.0 12.0 12.1 17.8
12 Month - - 19.1 18.4 17.4 19.0 19.4 19.4 19.0 17.4 10.2 12.6 12.8 18.2
Repurchase rate - - - - - - 16.5 20.0 16.5 12.8 11.0 11.3 9.3 17.0
Call Money rate
Maximum 14.0 21.0 25.0 32.0 19.0 27.0 28.0 28.0 102.0 31.0 20.0 16.5 14.3 32.0
Minimum 11.0 16.0 13.0 10.0 14.0 13.0 16.5 14.0 16.0 13.0 9.0 11.3 9.8 20.3
Weighted Average Prime Lending Rate 18.0 16.9 18.0 18.6 19.6 20.2 20.4 17.8 20.0 18.4 14.2 15.1 15.2 21.5
Commercial Bank Saving
Maximum 11.0 11.0 14.0 14.0 14.0 14.0 14.0 13.0 13.0 13.0 11.0 10.0 10.0 11.0
Minimum 6.0 5.0 5.0 5.0 6.5 6.5 5.5 5.5 5.0 4.5 3.0 2.0 2.0 2.0
NSB Saving 12.0 12.0 14.0 16.2 14.0 14.0 14.0 14.0 12.0 12.0 10.8 10.5 9.2 8.4
Commercial Bank Fixed Deposit (One year)
Maximum 14.0 15.5 20.5 21.0 20.0 20.0 17.0 17.0 17.0 17.8 15.3 13.0 12.5 15.0
Minimum 8.5 9.0 11.0 11.0 10.0 13.5 13.5 10.0 10.0 12.0 8.5 9.0 9.0 9.0
NSB Fixed Deposit (One year, paid on maturity) 13.0 13.0 15.0 17.0 17.0 17.0 16.0 14.0 16.0 15.0 11.0 11.5 11.5 15.0
Source
Annual Report, Central Bank of Sri Lanka, Various Issues.
Bulletin, Central Bank of Sri Lanka, Various Issues.
Table A11: Interest Rates, 1987-2000 (%, end of period)
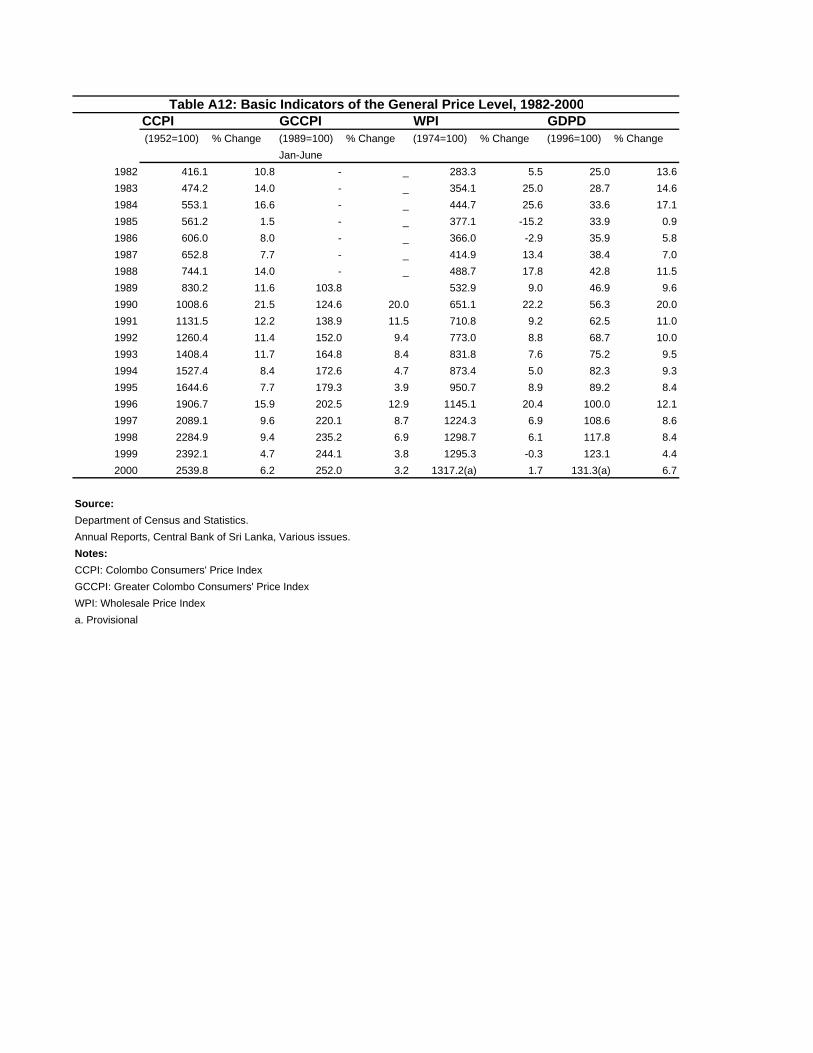
CCPI GCCPI WPI GDPD (1952=100) % Change (1989=100) % Change (1974=100) % Change (1996=100) % Change
Jan-June
1982 416.1 10.8 - _ 283.3 5.5 25.0 13.6
1983 474.2 14.0 - _ 354.1 25.0 28.7 14.6
1984 553.1 16.6 - _ 444.7 25.6 33.6 17.1
1985 561.2 1.5 - _ 377.1 -15.2 33.9 0.9
1986 606.0 8.0 - _ 366.0 -2.9 35.9 5.8
1987 652.8 7.7 - _ 414.9 13.4 38.4 7.0
1988 744.1 14.0 - _ 488.7 17.8 42.8 11.5
1989 830.2 11.6 103.8 532.9 9.0 46.9 9.6
1990 1008.6 21.5 124.6 20.0 651.1 22.2 56.3 20.0
1991 1131.5 12.2 138.9 11.5 710.8 9.2 62.5 11.0
1992 1260.4 11.4 152.0 9.4 773.0 8.8 68.7 10.0
1993 1408.4 11.7 164.8 8.4 831.8 7.6 75.2 9.5
1994 1527.4 8.4 172.6 4.7 873.4 5.0 82.3 9.3
1995 1644.6 7.7 179.3 3.9 950.7 8.9 89.2 8.4
1996 1906.7 15.9 202.5 12.9 1145.1 20.4 100.0 12.1
1997 2089.1 9.6 220.1 8.7 1224.3 6.9 108.6 8.6
1998 2284.9 9.4 235.2 6.9 1298.7 6.1 117.8 8.4
1999 2392.1 4.7 244.1 3.8 1295.3 -0.3 123.1 4.4
2000 2539.8 6.2 252.0 3.2 1317.2(a) 1.7 131.3(a) 6.7
Source:
Department of Census and Statistics.
Annual Reports, Central Bank of Sri Lanka, Various issues.
Notes:
CCPI: Colombo Consumers' Price Index
GCCPI: Greater Colombo Consumers' Price Index
WPI: Wholesale Price Index
a. Provisional
Table A12: Basic Indicators of the General Price Level, 1982-2000

Nominal Real Nominal Real1982 175.8 101.1 187.8 108.0
1983 188.8 95.5 215.7 109.0
1984 228.8 98.8 246.6 106.6
1985 247.9 105.8 284.3 121.2
1986 261.3 103.2 297.4 117.5
1987 277.7 101.8 297.4 109.1
1988 335.8 107.9 390.9 125.4
1989 338.1 112.0 421.8 121.9
1990 453.5 107.6 476.8 113.2
1991 518.8 109.7 534.6 113.2
1992 590.0 112.0 557.6 106.0
1993 685.8 116.6 675.5 114.8
1994 712.4 111.7 735.5 115.4
1995 740.3 107.8 792.5 115.4
1996 801.7 100.7 818.2 103.5
1997 849.1 97.3 906.5 104.0
1998 953.3 99.9 1001.4 104.9
1999 977.6 97.8 1001.4 100.2
2000(c) 1000.4 94.3 1084.7 102.1
Source:
Annual Reports, Central Bank of Sri Lanka, Various issues.
Notes:
The wage rates used in the calculation of index numbers are minimum wages.
a. Combined index for workers in agriculture, industry and commerce, and services.
b. Combined index for non-executive officers and minor employees.
c. Provisional
Table A13: Wage Rate Indices, 1982-2000 (December 1978= 100)
Workers in Wages Boards Trades (a) Government Employees (b)

Unit 1983 1984 1985 1986 1987 1988 1989 1990 1991
1.Exports to Selected Countries and Groupings
U.S.A US$Mn. 186.6 280.9 283.2 318 355.2 367.3 400 492.5 559
U.K. US$Mn. 53.5 86.1 82.6 69.8 75.2 80.9 88.4 115.1 126.2
Germany US$Mn. 65.6 70.9 69.9 83.3 101.1 104.3 95.4 126.7 148.8
Japan US$Mn. 48.5 62.4 65.4 67.1 67.2 84.9 89 102.4 101.6
EC % of total exports 20 17.3 20 23.7 21.7 23.7 25.4 25 27
Germany % of exports to EC 30.8 28 26.6 29.1 33.4 29.8 24.1 25.5 27
UK % of exports to EC 25.2 34 31.4 24.4 24.9 23.1 22.3 23.2 22.9
ASEAN % of total exports 4.7 1.9 4.5 3.3 3.2 4.7 3.9 3.9 5.5
singapore % of exports to ASEAN 74.7 75 74.5 78.4 72.2 63.8 59.6 63.7 59.8
Malaysia % of exports to ASEAN 17.9 12.9 20 11.7 2.7 3.1 2.3 3.3 23.6
SAARC % of total exports 6.3 4.6 4.1 4.9 3.9 6.2 5.5 3.6 3
of which India % of exports to SAARC 41.5 19 12.4 20.6 11.6 20.9 11.5 29.1 20.8
NAFTA % of total exports 19.5 21.6 24 28.7 27.8 27.2 28.4 27.2 30
of which USA % of exports to NAFTA 89.8 89 89.7 91.7 91.6 91.3 90.3 91.3 91.4
Canada % of exports to NAFTA 9 9.3 7.8 6.6 6.3 5.6 5.8 5.4 5.2
APEC % of total exports 33 32.1 37.3 41.8 40.5 42.5 41.2 39.5 43.7
of which, USA % of exports to APEC 53.1 59.8 57.7 62.8 62.8 58.5 62.4 62.8 62.7
Japan % of exports to APEC 13.8 13.3 13.3 13.2 11.9 13.5 13.9 13.1 11.4
Singapore % of exports to APEC 1.7 1.2 1.1 1 0.9 0.7 0.6 0.5 0.4
2. Imports from Selected Countries and Groupings
Japan US$Mn. 317.1 307.6 282.3 318.9 304.2 305.1 295.4 325.4 358.4
India US$Mn. 115.1 111.4 74.7 79.3 83.5 91 64.2 118.1 220.1
Hong Kong US$Mn. 54.1 59.1 57.5 85.5 129.8 116.6 109.9 120.4 212.5
U.S.A US$Mn. 114.7 164.2 129 117.5 114.1 152.7 137 207.7 174.5
U.K. US$Mn. 121.5 86.9 96.4 102.9 140.4 126.5 125.2 137 166.3
Taiwan US$Mn. 45.8 50.5 57.3 95.3 106.1 105.3 116.1 1555.8 207.4
EC % of total Imports 16.5 13.9 14.2 14.7 17.6 17.5 16 14.4 15.2
Germany % of Imports from EC 23.7 32.7 33.9 29.6 24.7 26.2 20 21.7 22
UK % of Imports from EC 38.3 32.3 33.2 35.5 38.5 32.3 35.2 35.5 36
ASEAN % of total Imports 12.2 8.8 6.7 8.6 10.8 10.1 12.7 12.8 13.8
singapore % of Imports from ASEAN 63.6 59.6 54.1 42.2 44.8 41.1 33.4 29.7 32.3
Malaysia % of Imports from ASEAN 25.1 25.8 20.8 24.6 26.3 27.4 21.5 33.2 33.4
SAARC % of total Imports 6.8 6.8 5.7 7.3 6.7 8.1 5.5 6.9 10.3
of which India % of Imports from SAARC 87.8 85.4 63.5 54.9 60.2 50.1 52.1 64.1 70.3
NAFTA % of total Imports 7.7 9.9 8 7 6.4 8.6 6.8 8.5 6.3
of which USA % of Imports from NAFTA 77.2 85.8 79 84.5 86.3 78.8 90.1 91.4 91.3
Canada % of Imports from NAFTA 22.7 14 20.9 15.2 13.2 21 9.7 8.3 8.3
APEC % of total Imports 47.4 46.1 43.5 51.3 51.8 53.1 52.9 55.7 58.5
of which, USA % of Imports from APEC 12.6 18.5 14.5 11.6 10.6 12.8 11.6 13.9 9.8
Japan % of Imports from APEC 16.5 16 13.8 16.2 14.7 13.6 11.7 12.1 11.8
Singapore % of Imports from APEC 16.3 11.4 8.3 7.1 9.3 7.8 8 6.9 7.6
Table A 14: Sri Lanka's direction of foreign trade

Cont../
Unit 1992 1993 1994 1995 1996 1997 1998 1999 2000
1.Exports to Selected Countries and Groupings
U.S.A US$Mn. 837.6 1006.8 1115.3 1353.5 1395.8 1666.4 1890.2 1791.8 2192.5
U.K. US$Mn. 170.2 203.5 285.4 345.3 388.6 525.4 530.4 604.2 736.7
Germany US$Mn. 211.8 227.5 222.5 254.3 239.3 230 231.9 215.7 230.2
Japan US$Mn. 128 148 165.3 200.4 256.4 234.2 196.1 159.1 229.7
EC % of total exports 32.8 31.2 31.3 31 29.4 35 33.6 35.3 33.4
Germany % of exports to EC 26.3 25.5 22.2 21.6 19.8 17.1 17.9 16.2 15.2
UK % of exports to EC 21.1 22.8 28.4 29.3 32.2 39 41 45 48.5
ASEAN % of total exports 2.4 2.9 3.9 3.7 2.8 3.4 3 3.1 3.5
singapore % of exports to ASEAN 56.5 58.6 60.6 52.3 52 43.7 38.1 37.9 38.7
Malaysia % of exports to ASEAN 7.7 4 4.6 15.7 23.5 16.6 10.1 6 5
SAARC % of total exports 2.3 2.5 2.7 2.7 2.6 3.1 3 3.8 4.2
of which India % of exports to SAARC 20.3 27.6 27.2 31.3 39.6 37 33.2 33.7 30.6
NAFTA % of total exports 36.4 37.1 36.8 37.3 35.6 45.5 51.5 49.8 50.5
of which USA % of exports to NAFTA 93.5 94.9 94.4 95.4 95.6 95.3 95.4 95.1 95.4
Canada % of exports to NAFTA 4.3 3.4 4.3 3.5 3.1 3.2 3.1 3.1 3.1
APEC % of total exports 47.6 48.7 49.6 50.1 48.7 59.8 63.7 61.4 62.9
of which, USA % of exports to APEC 71.5 72.3 70.1 71 69.8 72.4 77.8 78.1 77.5
Japan % of exports to APEC 10.9 10.6 10.4 10.5 12.8 10.2 8.1 6.9 8.1
Singapore % of exports to APEC 0.3 0.2 0.2 0.1 0.1 0.1 1.8 1.9 2.2
2. Imports from Selected Countries and Groupings
Japan US$Mn. 415.6 452.6 526.6 498.6 497.3 479.3 5559 560.9 646
India US$Mn. 301.9 342.9 404.4 469.2 561.9 559.8 539.4 511.6 600.1
Hong Kong US$Mn. 241 312.4 316.6 357.4 354.1 411.3 411 459.1 515.9
U.S.A US$Mn. 159.4 131.3 284.7 172.7 198.3 186.6 229.5 216.2 254.9
U.K. US$Mn. 172.8 184.8 247.6 242.6 251.7 282.4 304.8 251.1 311.4
Taiwan US$Mn. 214 225.7 250.2 286.4 287.8 372.1 378.7 347.1 390.1
EC % of total Imports 14.7 15.8 16.3 15.3 15.4 17.6 23.3 19.4 18.8
Germany % of Imports from EC 24.7 21.9 21.8 20.5 18.4 20.5 20.2 15.8 16.5
UK % of Imports from EC 33.5 29.2 31.8 29.8 30.1 31.6 30.3 29.1 32.6
ASEAN % of total Imports 15.1 14.5 13.2 12.8 12.6 14.7 19.6 21.1 21
singapore % of Imports from ASEAN 44.8 35.8 37.2 36.6 37.7 38.3 36.8 48.2 46.7
Malaysia % of Imports from ASEAN 24.1 29.5 28.8 31.1 26.7 22.3 22.8 18 20.5
SAARC % of total Imports 11.8 10.7 10.3 10.2 11.9 13.1 15.1 14.2 14
of which India % of Imports from SAARC 72.7 80.1 82.7 86.1 86.9 83.9 83.3 81.4 84.8
NAFTA % of total Imports 5.2 3.7 6.3 3.6 4.3 5.7 7.1 5.5 6
of which USA % of Imports from NAFTA 87 89.4 95 91.3 84.6 64.7 75 89 84.1
Canada % of Imports from NAFTA 11.6 10.1 4.6 7.9 10 19 13.6 9.3 15.6
APEC % of total Imports 57.1 55.7 55.4 50.2 50.4 61.9 77.1 73.1 74.8
of which, USA % of Imports from APEC 8 5.9 10.8 6.5 7.3 5.9 8.9 7.5 7.5
Japan % of Imports from APEC 11.9 11.3 11 9.4 9.2 9.4 21.5 19.4 19
Singapore % of Imports from APEC 11.9 9.3 8.8 9.3 9.5 9.1 12 15.6 14.6
Sources: Direction of Trade Statistics, International Monetary Fund, Various Issues. Annual Report, Central Bank of Sri Lanka, Various Issues.

1981 1982 1983 1984 1985 1986 1987 1988 1989 19901.Consumer Goods
Value (US$ Mn.) 357.7 309.9 378.9 317.6 385.2 437.4 469.1 548.2 581.5 709.4
Growth -29.9 -13.4 22.3 -16.2 21.3 13.6 7.2 16.9 6.1 22.0
% of Total Imports 18.8 15.4 19.6 17.0 19.4 22.5 22.8 24.6 26.1 26.4
1.1 Food
Value (US$ Mn.) 254.0 171.1 228.4 196.0 217.4 240.8 253.4 321.1 364.4 390.0
Growth -34.5 -32.6 33.5 -14.2 10.9 10.7 5.2 26.7 13.5 7.0
% of Total Imports 13.4 8.5 11.8 10.5 10.9 12.4 12.3 14.4 16.4 14.5
1.2 Other
Value (US$ Mn.) 103.8 138.8 150.5 121.6 167.7 196.7 215.7 227.1 217.1 319.4
Growth -15.4 33.7 8.4 -19.2 38.0 17.3 9.7 5.3 -4.4 47.1
% of Total Imports 5.5 6.9 7.8 6.5 8.4 10.1 10.5 10.2 9.8 11.9
2. Intermediate Goods
Value (US$ Mn.) 880.2 935.7 1039.2 1050.5 1079.8 1021.5 1175.7 1267.8 1255.4 1391.7
Growth 5.5 6.3 11.1 1.1 2.8 -5.4 15.1 7.8 -1.0 10.9
% of Total Imports 46.3 46.4 53.7 56.2 54.3 52.5 57.2 56.8 56.4 51.8
2.1 Petroleum
Value (US$ Mn.) 517.4 589.8 468.5 419.9 404.4 224.6 296.0 246.5 232.4 358.7
Growth 5.7 14.0 -20.6 -10.4 -3.7 -44.5 31.8 -16.7 -5.7 54.4
% of Total Imports 27.2 29.3 24.2 22.5 20.3 11.5 14.4 11.0 10.4 13.3
2.2 Textiles
Value (US$ Mn.) 121.3 104.1 115.8 116.9 139.9 226.8 274.6 276.5 276.9 335.8
Growth 16.5 -14.1 11.2 1.0 19.6 62.1 21.1 0.7 0.1 21.3
% of Total Imports 6.4 5.2 6.0 6.3 7.0 11.6 13.4 12.4 12.4 12.5
3. Investment Goods
Value (US$ Mn.) 413.4 556.9 513.3 478.4 382.4 376.8 384.9 379.8 333.4 584.4
Growth -16.1 34.7 -7.8 -6.8 -20.1 -1.5 2.2 -1.3 -12.2 75.3
% of Total Imports 21.7 27.6 26.5 25.6 19.2 19.3 18.7 17.0 15.0 21.7
4. Total Imports
Value (US$ Mn.) 1900.8 2015.5 1936.2 1868.9 1989.8 1947.4 2055.6 2233.2 2225.6 2689.0
Growth -7.4 6.0 -3.9 -3.5 6.5 -2.1 5.6 8.6 -0.3 20.8
Contd…./
1991 1992 1993 1994 1995 1996 1997 1998 1999 2000(a)1.Consumer Goods
Value (US$ Mn.) 782.1 734.6 774.5 930.6 982.0 1030.0 1084.0 1128.0 1131.0 1261.0
Growth 10.3 -6.1 5.4 20.1 5.6 5.2 4.9 4.0 0.3 11.5
% of Total Imports 25.5 21.0 19.3 19.5 18.5 19.0 18.5 19.2 18.9 17.3
1.1 Food
Value (US$ Mn.) 404.9 419.7 415.9 483.9 522.0 597.0 642.0 596.0 551.0 566.0
Growth 3.8 3.7 -0.9 16.4 7.8 14.3 7.5 -7.2 -7.6 2.7
% of Total Imports 13.2 12.0 10.4 10.2 9.8 11.0 11.0 10.1 9.2 7.8
1.2 Other
Value (US$ Mn.) 377.2 314.9 358.7 446.6 461.0 433.0 442.0 532.0 581.0 696.0
Growth 18.1 -16.5 13.9 24.5 3.1 -5.8 1.8 20.6 9.2 19.8
% of Total Imports 12.3 9.0 8.9 9.4 8.7 8.0 7.5 9.0 9.8 9.5
2. Intermediate Goods
Value (US$ Mn.) 1553.3 1884.4 2154.4 2425.0 2900.0 2971.0 3235.7 3108.0 3168.0 3916.0
Growth 11.6 21.3 14.3 12.6 19.6 2.6 8.9 -3.9 1.9 23.6
% of Total Imports 50.7 53.8 53.7 50.9 54.6 54.6 55.2 52.8 53.0 53.5
2.1 Petroleum
Value (US$ Mn.) 311.5 318.0 309.2 296.3 386.9 479.9 539.5 345.0 500.0 901.0
Growth -13.2 2.1 -2.8 -4.2 30.6 24.1 12.4 -36.1 44.9 80.2
% of Total Imports 10.2 9.1 7.7 6.2 7.3 8.8 9.2 5.9 8.4 12.3
2.2 Textiles
Value (US$ Mn.) 498.2 765.5 865.1 1038.1 1158.5 1168.8 1386.9 1397.0 1320.0 1471.0
Growth 48.3 53.7 13.0 20.0 11.6 0.9 18.7 0.6 -5.5 11.4
% of Total Imports 16.3 21.9 21.6 21.8 21.8 21.5 23.6 23.7 22.4 20.1
3. Investment Goods
Value (US$ Mn.) 720.1 850.9 1046.8 1366.5 1189.0 1203.0 1324.0 1477.0 1565.0 1737.0
Growth 23.2 18.2 23.0 30.5 -13.0 1.5 10.0 11.3 5.9 11.0
% of Total Imports 23.5 24.3 26.1 28.7 22.4 22.1 22.6 25.1 26.2 23.6
4. Total Imports
Value (US$ Mn.) 3061.1 3503.4 4011.3 4767.3 5311.1 5439.0 5864.0 5889.0 5979.0 7320.0
Growth 13.8 14.5 14.5 18.8 11.4 2.6 7.7 0.4 1.5 22.4
Sources:
Central Bank of Sri Lanka, Annual Report, various issues.
IPS database
Notes:
a. Provisional
Table A15: Structure of Commodity Imports, 1981-2000

1981 1982 1983 1984 1985 1986 1987 1988 1989 1990
1. Agricultural Exports
Value (US$ Mn.) 632.3 560.1 618.6 887.5 700.4 562.7 592.2 632.1 611.7 721.0
Growth -3.8 -11.4 10.4 43.5 -21.1 -19.7 5.2 6.7 -3.2 17.9
% of Total Exports 57.8 54.3 58.0 60.4 52.5 46.3 42.4 42.8 39.3 36.3
1.1 Plantation Crops
Value (US$ Mn.) 537.4 464.5 533.6 810.5 624.1 481.3 509.6 531.3 518.7 617.7
Growth -6.6 -13.6 14.9 51.9 -23.0 -22.9 5.9 4.3 -2.4 19.1
% of Total Exports 49.2 45.1 50.0 55.2 46.8 39.6 36.5 36.0 33.3 31.1
1.1.1 Tea
Value (US$ Mn.) 334.8 304.7 352.5 619.7 441.9 330.3 361.8 386.7 379.1 494.8
Growth -10.3 -9.0 15.7 75.8 -28.7 -25.3 9.6 6.9 -2.0 30.5
% of Total Exports 30.6 29.6 33.1 42.2 33.2 27.2 25.9 26.2 24.3 24.9
1.1.2 Rubber
Value (US$ Mn.) 150.1 111.6 121.2 129.8 94.5 93.6 99.5 116.5 86.3 76.9
Growth -4.2 -25.6 8.6 7.1 -27.2 -0.9 6.3 17.1 -25.9 -10.9
% of Total Exports 13.7 10.8 11.4 8.8 7.1 7.7 7.1 7.9 5.5 3.9
1.1.3 Coconut Kernel Products
Value (US$ Mn.) 52.5 48.2 59.9 61.0 87.7 57.4 48.3 28.2 53.3 46.0
Growth 15.2 -8.3 24.3 1.9 43.7 -34.5 -15.9 -41.7 89.2 -13.7
% of Total Exports 4.8 4.7 5.6 4.2 6.6 4.7 3.5 1.9 3.4 2.3
1.2. Minor Agricultural Crops
Value (US$ Mn.) 72.6 71.8 63.1 54.7 50.2 53.5 58.2 80.5 66.8 79.9
Growth 36.7 -1.1 -12.1 -13.4 -8.1 6.6 8.8 38.3 -17.0 19.5
% of Total Exports 6.6 7.0 5.9 3.7 3.8 4.4 4.2 5.5 4.3 4.0
2. Mineral Exports
Value (US$ Mn.) 41.2 41.3 48.1 32.8 31.8 42.2 61.3 82.2 74.7 87.0
Growth -15.5 0.3 16.6 -31.9 -3.0 32.6 45.3 34.1 -9.1 16.4
% of Total Exports 3.8 4.0 4.5 2.2 2.4 3.5 4.4 5.6 4.8 4.4
3. Industrial Exports
Value (US$ Mn.) 379.1 397.4 374.9 507.8 526.3 566.7 679.4 712.9 789.8 1036.1
Growth 7.8 4.8 -5.7 35.5 3.6 7.7 19.9 4.9 10.8 31.2
% of Total Exports 34.7 38.6 35.1 34.6 39.5 46.6 48.6 48.3 50.7 52.2
3.1 Textile & Garments
Value (US$ Mn.) 157.0 168.3 201.4 297.4 293.0 343.7 438.0 448.3 489.1 628.1
Growth 42.1 7.2 19.7 47.7 -1.5 17.3 27.4 2.4 9.1 28.4
% of Total Exports 14.4 16.3 18.9 20.3 22.0 28.3 31.4 30.4 31.4 31.7
3.2 Petrolium Products
Value (US$ Mn.) 175.4 157.6 114.0 129.3 142.7 84.2 88.0 71.2 62.2 99.2
Growth -7.2 -10.1 -27.7 13.4 10.4 -41.0 4.6 -19.1 -12.7 59.5
% of Total Exports 16.0 15.3 10.7 8.8 10.7 6.9 6.3 4.8 4.0 5.0
4. Manufacturing
Value (US$ Mn.) 225.9 262.2 282.7 400.8 409.7 510.4 615.7 661.9 753.8 960.4
Growth 17.8 16.1 7.8 41.8 2.2 24.6 20.6 7.5 13.9 27.4
% of Total Exports 20.7 25.4 26.5 27.3 30.7 42.0 44.1 44.9 48.4 48.4
5. Total Commodity Exports Inc. Petroleum
Value (US$ Mn.) 1093.4 1030.8 1066.6 1468.2 1333.0 1216.1 1396.9 1475.4 1558.4 1983.9
Growth 2.7 -5.7 3.5 37.6 -9.2 -8.8 14.9 5.6 5.6 27.3
6. Total Commodity Exports Excl. Petroleum
Value (US$ Mn.) 918.0 873.2 952.6 1338.9 1190.2 1132.0 1308.9 1404.2 1496.2 1884.7
Growth 4.9 -4.9 9.1 40.6 -11.1 -4.9 15.6 7.3 6.6 26.0
Table A16: Structure of Commodity Exports, 1981-2000
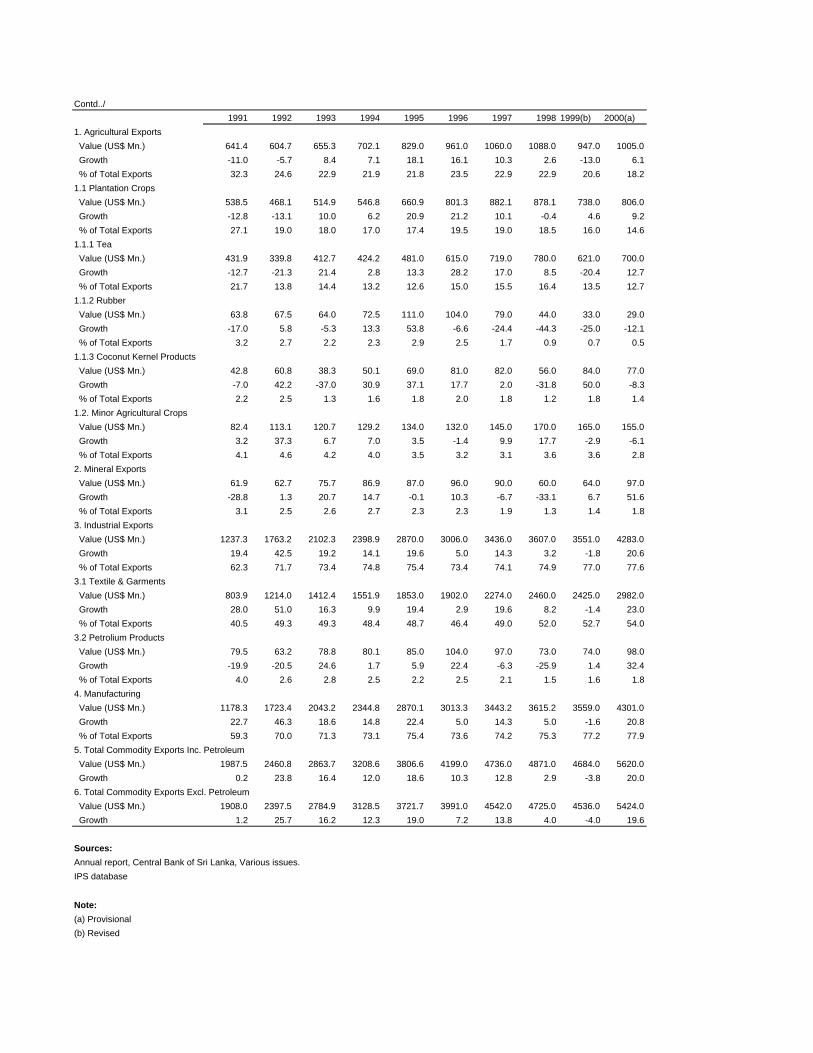
Contd../
1991 1992 1993 1994 1995 1996 1997 1998 1999(b) 2000(a)
1. Agricultural Exports
Value (US$ Mn.) 641.4 604.7 655.3 702.1 829.0 961.0 1060.0 1088.0 947.0 1005.0
Growth -11.0 -5.7 8.4 7.1 18.1 16.1 10.3 2.6 -13.0 6.1
% of Total Exports 32.3 24.6 22.9 21.9 21.8 23.5 22.9 22.9 20.6 18.2
1.1 Plantation Crops
Value (US$ Mn.) 538.5 468.1 514.9 546.8 660.9 801.3 882.1 878.1 738.0 806.0
Growth -12.8 -13.1 10.0 6.2 20.9 21.2 10.1 -0.4 4.6 9.2
% of Total Exports 27.1 19.0 18.0 17.0 17.4 19.5 19.0 18.5 16.0 14.6
1.1.1 Tea
Value (US$ Mn.) 431.9 339.8 412.7 424.2 481.0 615.0 719.0 780.0 621.0 700.0
Growth -12.7 -21.3 21.4 2.8 13.3 28.2 17.0 8.5 -20.4 12.7
% of Total Exports 21.7 13.8 14.4 13.2 12.6 15.0 15.5 16.4 13.5 12.7
1.1.2 Rubber
Value (US$ Mn.) 63.8 67.5 64.0 72.5 111.0 104.0 79.0 44.0 33.0 29.0
Growth -17.0 5.8 -5.3 13.3 53.8 -6.6 -24.4 -44.3 -25.0 -12.1
% of Total Exports 3.2 2.7 2.2 2.3 2.9 2.5 1.7 0.9 0.7 0.5
1.1.3 Coconut Kernel Products
Value (US$ Mn.) 42.8 60.8 38.3 50.1 69.0 81.0 82.0 56.0 84.0 77.0
Growth -7.0 42.2 -37.0 30.9 37.1 17.7 2.0 -31.8 50.0 -8.3
% of Total Exports 2.2 2.5 1.3 1.6 1.8 2.0 1.8 1.2 1.8 1.4
1.2. Minor Agricultural Crops
Value (US$ Mn.) 82.4 113.1 120.7 129.2 134.0 132.0 145.0 170.0 165.0 155.0
Growth 3.2 37.3 6.7 7.0 3.5 -1.4 9.9 17.7 -2.9 -6.1
% of Total Exports 4.1 4.6 4.2 4.0 3.5 3.2 3.1 3.6 3.6 2.8
2. Mineral Exports
Value (US$ Mn.) 61.9 62.7 75.7 86.9 87.0 96.0 90.0 60.0 64.0 97.0
Growth -28.8 1.3 20.7 14.7 -0.1 10.3 -6.7 -33.1 6.7 51.6
% of Total Exports 3.1 2.5 2.6 2.7 2.3 2.3 1.9 1.3 1.4 1.8
3. Industrial Exports
Value (US$ Mn.) 1237.3 1763.2 2102.3 2398.9 2870.0 3006.0 3436.0 3607.0 3551.0 4283.0
Growth 19.4 42.5 19.2 14.1 19.6 5.0 14.3 3.2 -1.8 20.6
% of Total Exports 62.3 71.7 73.4 74.8 75.4 73.4 74.1 74.9 77.0 77.6
3.1 Textile & Garments
Value (US$ Mn.) 803.9 1214.0 1412.4 1551.9 1853.0 1902.0 2274.0 2460.0 2425.0 2982.0
Growth 28.0 51.0 16.3 9.9 19.4 2.9 19.6 8.2 -1.4 23.0
% of Total Exports 40.5 49.3 49.3 48.4 48.7 46.4 49.0 52.0 52.7 54.0
3.2 Petrolium Products
Value (US$ Mn.) 79.5 63.2 78.8 80.1 85.0 104.0 97.0 73.0 74.0 98.0
Growth -19.9 -20.5 24.6 1.7 5.9 22.4 -6.3 -25.9 1.4 32.4
% of Total Exports 4.0 2.6 2.8 2.5 2.2 2.5 2.1 1.5 1.6 1.8
4. Manufacturing
Value (US$ Mn.) 1178.3 1723.4 2043.2 2344.8 2870.1 3013.3 3443.2 3615.2 3559.0 4301.0
Growth 22.7 46.3 18.6 14.8 22.4 5.0 14.3 5.0 -1.6 20.8
% of Total Exports 59.3 70.0 71.3 73.1 75.4 73.6 74.2 75.3 77.2 77.9
5. Total Commodity Exports Inc. Petroleum
Value (US$ Mn.) 1987.5 2460.8 2863.7 3208.6 3806.6 4199.0 4736.0 4871.0 4684.0 5620.0
Growth 0.2 23.8 16.4 12.0 18.6 10.3 12.8 2.9 -3.8 20.0
6. Total Commodity Exports Excl. Petroleum
Value (US$ Mn.) 1908.0 2397.5 2784.9 3128.5 3721.7 3991.0 4542.0 4725.0 4536.0 5424.0
Growth 1.2 25.7 16.2 12.3 19.0 7.2 13.8 4.0 -4.0 19.6
Sources:
Annual report, Central Bank of Sri Lanka, Various issues.
IPS database
Note:
(a) Provisional
(b) Revised
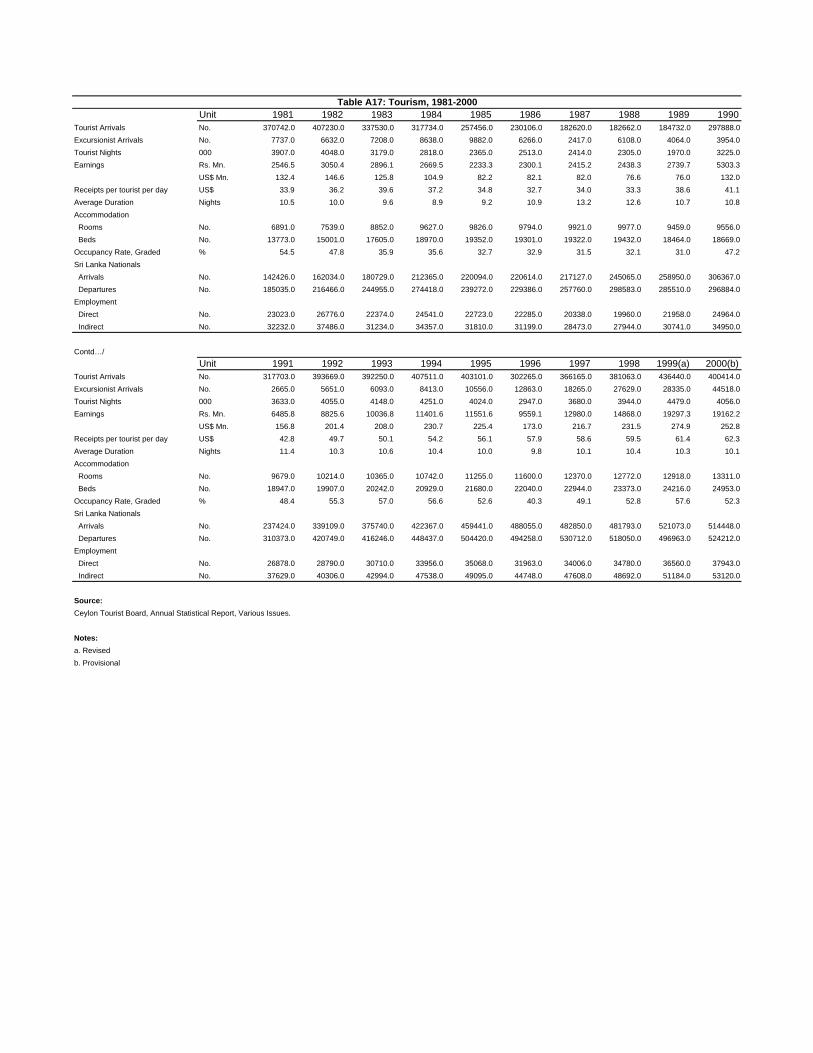
Unit 1981 1982 1983 1984 1985 1986 1987 1988 1989 1990Tourist Arrivals No. 370742.0 407230.0 337530.0 317734.0 257456.0 230106.0 182620.0 182662.0 184732.0 297888.0
Excursionist Arrivals No. 7737.0 6632.0 7208.0 8638.0 9882.0 6266.0 2417.0 6108.0 4064.0 3954.0
Tourist Nights 000 3907.0 4048.0 3179.0 2818.0 2365.0 2513.0 2414.0 2305.0 1970.0 3225.0
Earnings Rs. Mn. 2546.5 3050.4 2896.1 2669.5 2233.3 2300.1 2415.2 2438.3 2739.7 5303.3
US$ Mn. 132.4 146.6 125.8 104.9 82.2 82.1 82.0 76.6 76.0 132.0
Receipts per tourist per day US$ 33.9 36.2 39.6 37.2 34.8 32.7 34.0 33.3 38.6 41.1
Average Duration Nights 10.5 10.0 9.6 8.9 9.2 10.9 13.2 12.6 10.7 10.8
Accommodation
Rooms No. 6891.0 7539.0 8852.0 9627.0 9826.0 9794.0 9921.0 9977.0 9459.0 9556.0
Beds No. 13773.0 15001.0 17605.0 18970.0 19352.0 19301.0 19322.0 19432.0 18464.0 18669.0
Occupancy Rate, Graded % 54.5 47.8 35.9 35.6 32.7 32.9 31.5 32.1 31.0 47.2
Sri Lanka Nationals
Arrivals No. 142426.0 162034.0 180729.0 212365.0 220094.0 220614.0 217127.0 245065.0 258950.0 306367.0
Departures No. 185035.0 216466.0 244955.0 274418.0 239272.0 229386.0 257760.0 298583.0 285510.0 296884.0
Employment
Direct No. 23023.0 26776.0 22374.0 24541.0 22723.0 22285.0 20338.0 19960.0 21958.0 24964.0
Indirect No. 32232.0 37486.0 31234.0 34357.0 31810.0 31199.0 28473.0 27944.0 30741.0 34950.0
Contd…/
Unit 1991 1992 1993 1994 1995 1996 1997 1998 1999(a) 2000(b)Tourist Arrivals No. 317703.0 393669.0 392250.0 407511.0 403101.0 302265.0 366165.0 381063.0 436440.0 400414.0
Excursionist Arrivals No. 2665.0 5651.0 6093.0 8413.0 10556.0 12863.0 18265.0 27629.0 28335.0 44518.0
Tourist Nights 000 3633.0 4055.0 4148.0 4251.0 4024.0 2947.0 3680.0 3944.0 4479.0 4056.0
Earnings Rs. Mn. 6485.8 8825.6 10036.8 11401.6 11551.6 9559.1 12980.0 14868.0 19297.3 19162.2
US$ Mn. 156.8 201.4 208.0 230.7 225.4 173.0 216.7 231.5 274.9 252.8
Receipts per tourist per day US$ 42.8 49.7 50.1 54.2 56.1 57.9 58.6 59.5 61.4 62.3
Average Duration Nights 11.4 10.3 10.6 10.4 10.0 9.8 10.1 10.4 10.3 10.1
Accommodation
Rooms No. 9679.0 10214.0 10365.0 10742.0 11255.0 11600.0 12370.0 12772.0 12918.0 13311.0
Beds No. 18947.0 19907.0 20242.0 20929.0 21680.0 22040.0 22944.0 23373.0 24216.0 24953.0
Occupancy Rate, Graded % 48.4 55.3 57.0 56.6 52.6 40.3 49.1 52.8 57.6 52.3
Sri Lanka Nationals
Arrivals No. 237424.0 339109.0 375740.0 422367.0 459441.0 488055.0 482850.0 481793.0 521073.0 514448.0
Departures No. 310373.0 420749.0 416246.0 448437.0 504420.0 494258.0 530712.0 518050.0 496963.0 524212.0
Employment
Direct No. 26878.0 28790.0 30710.0 33956.0 35068.0 31963.0 34006.0 34780.0 36560.0 37943.0
Indirect No. 37629.0 40306.0 42994.0 47538.0 49095.0 44748.0 47608.0 48692.0 51184.0 53120.0
Source:
Ceylon Tourist Board, Annual Statistical Report, Various Issues.
Notes:
a. Revised
b. Provisional
Table A17: Tourism, 1981-2000

1985 1990 1991 1992 1993 1994No. No. No. Growth No. Growth No. Growth No. Growth
January 28814 26592 28932 8.8 35730 23.5 42726 19.6 45402 6.3 2000February 27012 26368 28080 6.5 38859 38.4 40116 3.2 41067 2.4 No. GrowthMarch 29886 26946 27153 0.8 33399 23.0 37953 13.6 41277 8.8 43311 -2.4
April 19778 22788 20541 -9.9 28410 38.3 29589 4.1 28080 -5.1 43287 4.2
May 14014 18286 17745 -3.0 21024 18.5 22368 6.4 21777 -2.6 40110 -2.2
June 11092 18050 17394 -3.6 23157 33.1 20412 -11.9 21399 4.8 333642 -2.3
July 18362 26410 30645 16.0 33771 10.2 32904 -2.6 35370 7.5 23404 -7.2
August 20138 26786 28824 7.6 40143 39.3 32796 -18.3 32817 0.1 21825 -16.6
September 15242 22438 24762 10.4 29838 20.5 27495 -7.9 31062 13.0 33267 -0.1
October 18176 23060 25173 9.2 32079 27.4 30621 -4.5 33216 8.5 34422 -11.9
November 23218 24596 28272 14.9 35967 27.2 35103 -2.4 33306 -5.1 31035 -8.5
December 31724 35568 40182 13.0 41292 2.8 40167 -2.7 42738 6.4 26658 -24.1
Total 257456 297888 317703 6.7 393669 23.9 392250 -0.4 407511 3.9 32469 -22.6
36984 -8.3
Cont../ 400414 -8.3
1995 1996 1997 1998 1999 2000No. Growth No. Growth No. Growth No. Growth No. Growth No. Growth
January 45987 1.3 30957 -32.7 32652 5.5 37224 14.0 44379 19.2 43311 -2.4
February 42591 3.7 29550 -30.6 35010 18.5 35283 0.8 41526 17.7 43287 4.2
March 40074 -2.9 26442 -34.0 34098 29.0 32256 -5.4 41022 27.2 40110 -2.2
April 33756 20.2 20376 -39.6 26907 32.1 25578 -4.9 34443 34.7 333642 -2.3
May 24672 13.3 17655 -28.4 22407 26.9 20394 -9.0 25212 23.6 23404 -7.2
June 22416 4.8 19668 -12.3 23160 17.8 22410 -3.2 26184 16.8 21825 -16.6
July 35994 1.8 25380 -29.5 30867 21.6 29529 -4.3 33288 12.7 33267 -0.1
August 35814 9.1 24765 -30.9 32034 29.4 31446 -1.8 39081 24.3 34422 -11.9
September 30828 -0.8 23211 -24.7 29793 28.4 31653 6.2 33915 7.1 31035 -8.5
October 30603 -7.9 23511 -23.2 28314 20.4 31767 12.2 35112 10.5 26658 -24.1
November 28365 -14.8 24921 -12.1 31995 28.4 38421 20.1 41952 9.2 32469 -22.6
December 32001 -25.1 35829 12.0 38928 8.6 45102 15.9 40326 -10.6 36984 -8.3
Total 403101 -1.1 302265 -25.0 366165 21.1 381063 4.1 436440 14.5 400414 -8.3
Source:
Ceylon Tourist Board, Annual Statistical Report, Various Issues. .
Table A18 Monthly Tourist Arrivals

No. Growth No. Growth No. Growth No. Growth No. Growth
North America 9615 18.9 12615 31.2 13635 8.1 15612 14.5 14565 -6.7
Canada 3306 35.9 4104 24.1 4062 -1.0 4920 21.1 5469 11.2
U.S.A. 6039 6.8 8511 40.9 9573 12.5 10692 11.7 9096 -14.9
Western Europe 192054 13.4 246393 28.3 251934 2.2 253899 0.8 250152 -1.5
Germany 65226 10.3 85443 31.0 95430 11.7 93528 -2.0 79698 -14.8
United Kingdom 31011 42.2 34602 11.6 42474 22.8 47766 12.5 63582 33.1
France 36801 11.1 40227 9.3 34779 -13.5 30522 -12.2 30996 1.6
Italy 18897 -1.8 25572 35.3 18267 -28.6 18069 -1.1 18378 1.7
Netherlands 11244 29.1 17538 56.0 15387 -12.3 12219 -20.6 14274 16.8
Asia 96654 -3.3 114162 18.1 106668 -6.6 116352 9.1 118323 1.7
Japan 23403 4.5 28797 23.0 20421 -29.1 19497 -4.5 18180 -6.8
India 20352 55.9 25941 27.5 32433 25.0 44142 36.1 47448 7.5
Pakistan 10392 36.7 11481 10.5 12369 7.7 10188 -17.6 11325 11.2
Australasia 9747 9.3 12363 26.8 11823 -4.4 12033 1.8 10254 -14.8
Australia 8802 8.3 10995 24.9 10242 -6.8 9681 -5.5 9066 -6.4
Other(a) 9633 -16.9 8136 -15.5 8190 0.7 9615 17.4 9807 2.0
Total 317703 6.7 393669 23.9 392250 -0.4 407511 3.9 403101 -1.1
Contd…/
No. Growth No. Growth No. Growth No. Growth No. Growth
North America 12462 -14.4 15951 28.0 17529 9.9 18477 5.4 17319 -6.3
Canada 4689 -14.3 6477 38.1 7542 16.4 7905 4.8 7503 -5.1
U.S.A. 7773 -14.5 9474 21.9 9987 5.4 10572 5.8 9816 -7.2
Western Europe 167343 -33.1 212052 26.7 238959 12.7 275796 15.4 260824 -5.4
Germany 45075 -43.4 59814 32.7 74058 23.8 77259 4.3 70584 -8.6
United Kingdom 52095 -18.1 62997 20.9 66432 5.5 80919 21.8 84693 4.7
France 21480 -30.7 25392 18.2 26874 5.8 34458 28.2 25992 -24.6
Italy 11988 -34.8 14424 20.3 15867 10.0 19815 24.9 16833 -15.0
Netherlands 10995 -23.0 15957 45.1 22977 44.0 29670 29.1 22618 -23.8
Asia 102558 -13.3 113565 10.7 99702 -12.2 114375 14.7 91521 -20.0
Japan 11724 -35.5 13374 14.1 13785 3.1 16332 18.5 10226 -37.4
India 42822 -9.7 47010 9.8 37356 -20.5 42315 13.3 31860 -24.7
Pakistan 11748 3.7 11439 -2.6 10782 -5.7 11421 5.9 10005 -12.4
Australasia 8763 -14.5 11712 33.7 12159 3.8 15159 24.7 18228 20.2
Australia 7626 -15.9 10392 36.3 10329 -0.6 13218 27.9 16443 24.4
Other(a) 11139 13.6 12912 15.9 13092 1.4 12633 -3.5 12522 -0.9
Total 302265 -25.0 366165 21.1 381063 4.1 436440 14.5 400414 -8.3
Source:
Ceylon Tourist Board, Annual Statistical Report, Various Issues.
Notes:
(a) Latin America & the Caribbean, East Europe, Africa, and Middle East.
(b) Revised
(c) Provisional
1995
2000(c)1996 1997 1998 1999(b)
Table A19: Tourist Arrivals by Country of Residence, 1991-2000
1991 1992 1993 1994

Unit 1990 1991 1992 1993 1994 1995 1996 1997 1998 1999 2000(a)
1. Trade Balance US$ Mn. -702.5 -997.1 -1044.6 -1147.6 -1558.7 -1504.5 -1343.8 -1225.0 -1092.0 -1369.0 -1798.0
% of GDP -8.7 -11.1 -10.8 -11.1 -13.3 -11.5 -9.7 -8.1 -6.9 -8.7 -10.8
2. Services Balance US$ Mn. 69.2 88.2 145.8 162.6 179.8 152.1 105.0 159.1 145.0 147.0 38.0
% of GDP 0.9 1.0 1.5 1.6 1.5 1.2 0.8 1.1 0.9 0.9 0.2
3. Income, net US$ Mn. -166.6 -179.4 -178.4 -124.9 -162.0 -170.0 -197.0 -160.0 -180.0 -254.0 -304.0
% of GDP -2.1 -2.0 -1.8 -1.2 -1.4 -1.1 -1.5 -1.1 -1.1 -1.6 -1.8
4. Net private transfers US$ Mn. 362.0 398.6 459.2 557.3 622.6 675.0 709.8 788.1 849.0 887.0 974.0
% of GDP 4.5 4.4 4.7 5.4 5.3 5.2 5.1 5.2 5.4 5.6 5.9
5. Net official transfers US$ Mn. 62.4 71.1 64.1 56.2 58.5 60.8 49.0 44.5 52.0 26.0 25.0
% of GDP 0.8 0.8 0.7 0.5 0.5 0.5 0.4 0.3 0.3 0.2 0.2
6. Current Account Balance US$ Mn. -378.1 -618.6 -553.9 -496.4 -867.1 -753.9 -677.0 -393.0 -226.0 -563.0 -1065.0
% of GDP -4.7 -6.9 -5.7 -4.8 -7.4 -5.8 -4.9 -2.6 -1.4 -3.6 -6.4
7. Capital and Financial A/C US$ Mn. 516.2 858.9 661.8 1106.2 1077.1 699.0 459.0 602.0 413.0 373.0 568.0
% of GDP 6.4 9.5 6.8 10.7 9.2 5.7 4.2 4.2 2.6 2.4 3.4
Capital Account(Rs Mn.) US$ Mn. 118.7 135.3 121.9 108.6 113.1 117.2 95.6 87.1 80.0 80.0 51.0
Financial Account US$ Mn. 397.5 723.6 539.9 997.6 964.0 581.0 363.0 515.0 334.0 293.0 516.0
8. Long-Term US$ Mn. 405.5 543.3 410.0 635.9 745.5 502.0 381.0 716.0 398.0 435.0 428.0
Foreign Direct Investment US$ Mn. 42.0 63.7 121.3 188.8 158.2 19.7 86.0 128.6 137.0 177.0 173.0
Private Long-Term (net) US$ Mn. -45.8 -24.3 26.5 186.5 316.3 91.0 2.0 47.0 2.0 196.0 82.0
Government Long-Term US$ Mn. 405.0 504.0 262.2 260.7 271.1 358.0 259.0 239.0 203.0 62.0 171.0
9. Short-term US$ Mn. -8.0 180.3 129.9 361.7 218.5 79.0 -18.0 -201.0 -64.0 -142.0 88.0
Foreign portfolio investment US$ Mn. 0.0 32.1 25.6 67.8 27.0 -1.7 6.4 13.0 -24.0 -13.0 -45.0
10 Other (a) US$ Mn. -33.6 71.6 113.0 37.2 67.2 157.4 98.1 27.3 -116.1 - -
11. Overall balance US$ Mn. 119.0 311.9 220.9 647.0 277.2 152.4 0.2 268.6 213.6 -263.0 -516.0
% of GDP 1.3 3.5 2.3 6.2 2.4 1.2 0.0 1.8 1.4 -1.7 -3.1
Source:
Annual report, Central Bank of Sri Lanka, 1999,2000.
Notes:
a. Valuation adjustments, errors, and ommissions
b. Provisional
Table A20: Balance of Payments, 1990-2000

Currency Unit 1990 1991 1992 1993 1994 1995 1996 1997 1998 1999 2000Nominal Exchange Rates
U.S.A. S.L. Rs. per US$ 40.2 42.6 46.0 49.6 50.0 54.0 56.7 61.3 67.8 72.1 80.1
Japan S.L. Rs. per Yen 0.3 0.3 0.4 0.4 0.5 0.5 0.5 0.5 0.6 0.7 0.7
U. K. S.L. Rs. per Pound 75.6 79.6 69.4 73.5 78.1 84.2 95.9 101.6 112.6 116.7 119.4
Germany, Federal Rep. Of S.L. Rs. per DM 26.2 28.0 28.6 28.7 32.2 37.8 36.5 34.2 40.4 37.1 38
India S.L. Rs. per Ind. Rs. 2.2 1.6 1.8 1.6 1.6 1.5 1.6 1.6 1.6 1.7 1.7
Real Exchange Rates
U.S.A. Index, 1990=100 100.0 94.5 92.2 90.3 85.0 88.4 81.9 80.8 79.6 81.6 -
Japan Index, 1990=100 100.0 89.3 105.3 90.6 102.4 94.2 81.3 75.3 81.4 87.7 -
U. K. Index, 1990=100 100.0 99.4 80.7 77.7 78.0 80.7 81.2 81.1 84.9 85.4 -
Germany, Federal Rep. Of Index, 1990=100 100.0 97.3 90.5 81.4 84.7 93.9 77.9 67.4 72.5 62.9 -
India Index, 1990=100 100.0 73.6 83.2 71.1 72.5 69.0 67.2 64.5 63.1 66.3 -
Source:
Annual Reports, Central Bank of Sri Lanka, Various issues.
International Financial Statistics Yearbook, 1998, International Monetary Fund.
Table A21: Exchange Rates Behaviour, 1990-2000 (End of period values)

Unit 1988 1989 1990 1991 1992 1993 1994 1995 1996 1997 1998 1999 2000Annual Turnover Rs. Mn. 319.1 225.8 1563.0 5542.0 6159.0 22124.0 34505.0 11249.0 7403.0 18315.0 18232.0 14842.0 11049.0
Domestic Rs. Mn. - - - 3383.0 4687.0 14449.0 20699.0 5915.0 3355.0 10455.0 11807.0 9317.0 7922.0
Foreign Rs. Mn. - - - 2159.0 1472.0 7675.0 13806.0 5434.0 4048.0 7860.0 6425.0 5525.0 3127.0
Daily Turnover Rs. Mn. 1.3 1.1 6.6 22.9 25.0 91.0 146.0 47.0 31.0 76.0 76.0 62.0 46.0
Shares Traded No. Mn. 12.3 12.2 41.7 110.1 113.0 424.0 506.0 316.0 227.0 515.0 634.0 486.0 449.0
Trades No. '000 13.0 16.8 48.3 91.6 109.9 232.3 404.4 186.3 98.2 206.3 329.0 205.7 160.0
Domestic No. '000 103.5 206.4 364.2 165.3 87.8 189.8 312.0 193.6 150.0
Foreign No. '000 6.5 25.9 40.2 21.0 10.4 16.5 17.0 12.1 10.0
Companies Listed No. 176.0 176.0 175.0 178.0 190.0 201.0 215.0 226.0 235.0 239.0 240.0 237.0 239.0
Market Capitalisation Rs. Bn. year end 15.7 17.7 36.9 81.8 66.2 124.1 143.7 106.9 104.2 129.4 117.0 112.8 89.0
Market Price Earning Ratio times, year end - - - 20.9 12.5 19.6 16.3 11.2 10.7 12.5 9.0 6.6 5.2
Price Indices
All Share 1985 = 100 172.4 179.5 384.4 837.9 605.3 979.0 986.7 663.7 603.0 702.2 597.3 572.5 447.6
Growth % Change -20.9 4.1 114.2 118.0 -27.8 61.7 0.8 -32.7 -9.1 16.5 -14.9 -4.2 -21.8
Sensitive 1985 = 100 309.6 341.7 680.3 1198.7 826.6 1442.4 1438.8 990.5 897.7 1068.0 923.0 1000.0 937.5
Growth % Change -19.4 10.4 99.1 76.2 -31.0 74.5 -0.2 -31.2 -9.4 19.0 -13.6 -6.2 -25.4
Non-national Activity
Net Purchases Rs. Mn. - - 390.7 1125.5 818.0 3240.0 1334.0 -90.0 352.0 716.0 -1560.0 -950.8 -3364.6
Purchases Rs. Mn. - - 397.9 1561.1 1836.0 9295.0 14473.0 5389.0 4224.0 8218.0 5645.0 5050.1 1445.0
Sales Rs. Mn. - - 7.2 435.6 1018.0 6055.0 13139.0 5479.0 3872.0 7502.0 7205.0 6000.9 4809.0
Source: .
Colombo Stock Exchange, Annual Report, Various Issues.
Annual Report, Securities and exchange commission of Sri Lanka, 1998.
Table A22: Developments in the Share Market

1997 1998 1999 2000
1. Equity Market:
Market Capitalization 129,400 117,000 112,782 89,000
of which active trading 57,400 48,400 51,270 40,416
2. Debt Market: 377,233 441,582 519,003 634,497
(1) private 13,150 22,100 26,424 30,854
(11) public 364,083 419,482 492,579 603,643(a)
(a) Short-term(TBs) 115,000 120,000 125,000 135,000(a)
(b) Medium& Long term 249,083 299,482 367,579 468,643(a)
3. Total 506,643 558,582 631,785 514,284
4. Percentage of GDP 56.90% 55.00% 57.12% 41.00%
a. Provisional
source: Colombo Stock Exchange, Annual Report,Central Bank Annual Report
Table B1: Sri Lanka's Capital Market Structure
Appendix B: Capital Market (Statistical Base)

1997 1998 1999 2000
(Rs. Million) (Rs. Million) (Rs. Million) (Rs. Million)
1. Private:
(a) Market Capitalization 129,400 117,000 112.782 89,000
(b) of which, Central Depository 57,400 48,400 51,271 40,416
II. (a) Debentures 150 3,700 4,584 5,803
(b) Commercial paper 1,200 4,300 4,356 3,963
© Certificates of Deposit 11,200 14,100 17,484 21,088
(d) Total 12,550 22,100 26,424 30,854
Total: 141,950 139,100 139,206 119,854
2. Public Debt
i. Short-term
(a) Central Bank Securities 10
(b) Treasury Bills 115,000 120,000 125,000 135,000
ii. Medium & Long-term
(a) Rupee Securities 239,475 250,570 262,056 263,888
(b) Treasury Bonds 10,000 48,915 104,867 204,124
(c) Treasury Certificates of Deposit 83 12 11 11
Total: 364,093 419,482 491,934 603,023(a)
3. Grand Total 506,043 558,582 631,140 722,877
As percentage of GDP ('56.9) ('55.0) ('57.12) ('41.0)
of which actually traded through the Central 58,150 52,700 55,627 44,379
Depository
As a share of Grand Total (%) (11.3) ('9.4) ('8.8) ('6.1)
4. Foreign participation in the Central Depository 20 16 15 11
as a per cent of market capitalization (%)
a. provisional
Source: Annual report, Central Bank of Sri Lanka, various issues. Colombo Stock Exchange Annual report Various Issues.
Table B2: Sri Lanka's Capital Market -An Overview
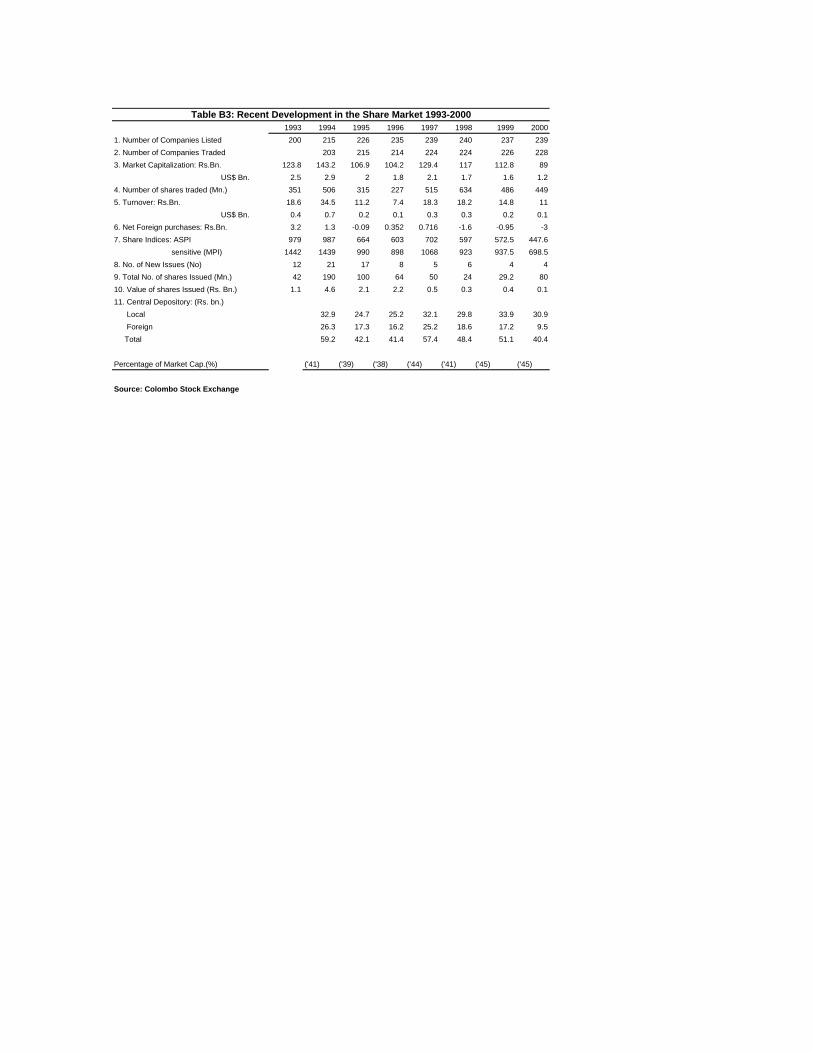
1993 1994 1995 1996 1997 1998 1999 2000
1. Number of Companies Listed 200 215 226 235 239 240 237 239
2. Number of Companies Traded 203 215 214 224 224 226 228
3. Market Capitalization: Rs.Bn. 123.8 143.2 106.9 104.2 129.4 117 112.8 89
US$ Bn. 2.5 2.9 2 1.8 2.1 1.7 1.6 1.2
4. Number of shares traded (Mn.) 351 506 315 227 515 634 486 449
5. Turnover: Rs.Bn. 18.6 34.5 11.2 7.4 18.3 18.2 14.8 11
US$ Bn. 0.4 0.7 0.2 0.1 0.3 0.3 0.2 0.1
6. Net Foreign purchases: Rs.Bn. 3.2 1.3 -0.09 0.352 0.716 -1.6 -0.95 -3
7. Share Indices: ASPI 979 987 664 603 702 597 572.5 447.6
sensitive (MPI) 1442 1439 990 898 1068 923 937.5 698.5
8. No. of New Issues (No) 12 21 17 8 5 6 4 4
9. Total No. of shares Issued (Mn.) 42 190 100 64 50 24 29.2 80
10. Value of shares Issued (Rs. Bn.) 1.1 4.6 2.1 2.2 0.5 0.3 0.4 0.1
11. Central Depository: (Rs. bn.)
Local 32.9 24.7 25.2 32.1 29.8 33.9 30.9
Foreign 26.3 17.3 16.2 25.2 18.6 17.2 9.5
Total 59.2 42.1 41.4 57.4 48.4 51.1 40.4
Percentage of Market Cap.(%) ('41) ('39) ('38) ('44) ('41) ('45) ('45)
Source: Colombo Stock Exchange
Table B3: Recent Development in the Share Market 1993-2000

1993 1994 1995 1996 1997 1998 1999 2000
1. Listed Companies 201.0 215.0 226.0 235.0 239.0 240.0 237.0 239.0
Net Listings 12.0 15.0 14.0 9.0 6.0 6.0 4.0 5.0
De-Listings 1.0 1.0 3.0 0.0 2.0 5.0 7.0 3.0
2. Market Cap. (Rs. Billion) 124.1 144.0 107.0 104.0 129.0 117.0 112.7 89.0
% Change 16.0 -0.3 0.0 0.2 -0.1 0.0 -21.2
3. All Share Index 979.0 986.7 663.7 603.0 702.2 597.3 572.5 447.6
% Change 0.0 -0.3 -0.1 0.2 -0.2 -4.2 -21.8
4. Traded Value (Rs. Billion) 22.1 34.5 11.3 7.4 18.3 18.2 14.8 11.0
% Change 0.6 -0.7 -0.4 0.1 0.0 -0.2 -25.6
Domestic (Rs. Billion) 14.4 20.7 5.8 3.4 10.5 11.8 9.3 7.9
Foreign (Rs. Billion) 7.1 13.8 5.4 4.1 7.9 6.4 5.5 3.1
Foreign % 0.3 0.4 0.5 0.6 0.4 0.4 0.4 -43.6
5. Shares Traded (Mn.) 424.0 506.0 316.0 227.0 515.0 634.0 486.0 449.0
% Change 0.2 -0.4 -0.3 0.1 0.2 -0.2 -7.6
Domestic (Rs.Bn.) 300.0 335.0 185.0 133.0 337.0 425.0 357.0 350.0
Foreign (Rs.Bn.) 124.0 171.0 131.0 94.0 178.0 208.0 129.0 99.0
Foreign % 0.3 0.3 0.4 0.4 0.4 0.3 0.3 -20.1
6. Liquidity - As Measured 17.8 24.0 10.5 7.1 14.1 15.5 13.1 12.3
By Turnover (Turnover to
Market Cap. Ratio (%)
Note: As at YE 2000 ten of the 239 listed companies comprised nearly 31% of total market capitalization including the companies listed in Table B5.
Source: Colombo Stock Exchange, Annual Report, various issues.
Table B4: Equity Market Indicators 1993-2000

Table B5: Market ConcentrationCompany 1999 2000
John Keells Holdings 8.60% 7.67%
HNB 3.70% 2.61%
DFCC Bank 3.40% 3.18%
NDB 3.40% 2.55%
Hayleys 2.90% 3.19%
Ceylon Tobacco 4.80% 6.24%
Commercial Bank 3.10% 3.41%
Nestle Lanka 2.80% 4.00%
Aitken Spence 2.80% 2.54%
Pure Beverages 2.04% 2.05%
Note: The top 30 companies comprised more than 60% of market capitalization.
Source: Colombo Stock Exchange , Annual Report, various issues.

Company No. of shares Issue price No. of shares No. of Shares Date Listed
offered Rs. subscribed Devolved to
by public Underwriters
1. New Listings 1998:
Hapugastenne Plantations Ltd. 4,000,000 10 4,000,000 Nil 25.03.98
Udapussellawa Plantations Ltd. 1,900,000 10 1,900,000 Nil 04.05.98
Royal palm Beach Hotels Ltd. 10,000,000 11 10,000,000 Nil 15.06.98
Balangoda Plantations Ltd. 4,000,000 20 4,000,000 Nil 03.06.98
Madulsima Plantations Ltd.. 4,000,000 15 4,000,000 Nil 06.07.98
Kahawatte Plantations Ltd.. 4,000,000 10 4,000,000 Nil 02.12.98
Value (Rs.) 349,000,000
Issuse (No.) 6
Nations Trust Bank Ltd 19,499,993 12 19,499,993 03.05.1999
Metropolitan Resource Holdings 6,285,111 25 277,600 3,027,800 12.05.1999
Ruhunu Hotels & Travels Ltd 4,500,000 10 2,404,400 30.03.1999
Namunukula Plantations Ltd 4,000,000 15 3,998,000 2,000 10.03.1999
Value (Rs) : 400,678,916
Issues (No) : 4
2. New Listing 1999 by Sector No .of Issues No. of shares Value (Rs.)
Banks, Finance& Insurance 1 19,499,993 233,999,916
Hotels & Travels 1 2,404,400 24,044,000
Plantations 2 7,305,400 142,635,000
Total 4 29,209,793 400,678,916
3. New Listings 2000 :
Celinco Insurance Co.Ltd. 4,200,000 15 4,200,000 _ 14.09.2000
Hapugastenne Plantations Ltd. 20,000,000 10 10,246,021 9,753,979 18.08.2000
Hayles Ltd. 3,000,000 10 3,000,000 _ 23.10.2000
Hayles Photoprint Ltd. 1,000,000 10 1,000,000 _ 15.09.2000
Hotel Sigiriya Ltd. 1,116,000 10 1,116,000 _ 19.04.2000
Mercantile Leasing Ltd. 9,559,669 15 3,495,263 6,064,406 27.06.2000
Metropolitan Resource Holdings Ltd. 6,610,800 20 6,610,800 _ 07.02.2000
Sunshine Travels Ltd. 2,850,000 10 2,850,000 _ 07.09.2000
Udapussellawa Plantations Ltd. 7,600,000 12.50 3,910,238 3,689,762 18.08.2000
Value (Rs.): 713,271,035
Issues (No.) : 9
New Listings 2000 by sector: No. of Issues No. of shares Value(Rs.)
Banks, Finance & Insurance 2 13,759,669 206,395,035
Diversified 1 3,000,000 30,000,000
Hotels & Travels 2 3,966,000 39,660,000
Plantations 3 34,210,800 427,216,000
Trading 1 1,000,000 10,000,000
Total 9 55,936,469 713,271,035
Source: Colombo Stock Exchange Annual report Various Issues.
Table B6: New Equity Listings -1998, 1999 &2000

(Rupess Billion)
(Rupees billion)
1997 1998 1999 2000(a)
1. Private Debt:
(a) Commercial paper 1.2 4.3 4.4 4.0
(b) Certificates of Deposit 11.2 14.1 17.5 21.1
(I) Commercial Banks 10.7 13.2 16.5 18.9
(ii) Finance Companies 0.5 0.9 1 2.2
(c) Debentures (Listed) 0.2 3.7 4.5 5.8
Total 12.6 22.1 26.4 30.9
2. Public Debt:
(a) Short Terms
(I) Treasury Bills 115 120 125 135.0(a)
(b) Long & Medium Terms
(I) Treasury Bonds 10 48.9 104.9 204.1(a)
© Rupee Loans 239.5 250.6 262.1 263.9(a)
(d) Certificates of Deposit
Total 364.5 419.5 492.0 603.0
3. Total Debt 377.1 441.6 518.4 633.9
Note: (a) Provisional
Source: Central Bank of Sri Lanka, Annual Report , various issues.
Table B7: Sri Lanka Structure of Debt Market

Issuer Issued Par Value Interest No.of Debt Date Listed
(No.) (Issue price) (p a) Subscribed
1. Listings 1998
Vanik incorporation Ltd 8,852,048 100 15% 9,389,832 08.01.98
Vanik Inc. Limited 9,504,656 100 15% 88,520 08.01.98
Ceylinco Securities & Financial Services Ltd 1,000,000 100 17.50% 1,182,550 02.06.98
Hatton National Bank Ltd 2,544,620 100 13.50% 2,544,620 12.08.98
Hatton National Bank Ltd 7,455,380 100 14.20% 7,455,380 12.08.98
Ceylon Glass Company 500,000 100 13.50% 683,390 26.08.98
Commercial Bank Ltd 250,000 1000 13.50% 488,019 10.09.98
Commercial Bank Ltd 250,000 1000 12.28% 304,350 27.11.98
Seylan Bank 2,083,150 100 13.50% 2,083,150 07.12.98
Seylan Bank 3,680,300 100 14.37% 3,680,300 07.12.98
Ceylinco Securities 1,000,000 100 17.50% 11,826 02.06.98
HNB 10,000,000 100 14.20% 7,455,380
Commercial Bank 250,000 1000 13.50% 250,000 10.09.98
Seylan Bank 3,000,000 100 13.50% 2,083,150
Seylan Bank 100 14.37% 3,680,300
Seylan Bank 236,550 100 13.98% 236,550 07.12.98
Commercial Bank 250,000 1000 13.01% 250,000 24.11.98
Ceylon Glass 500,000 100 13.50% 500,000 26.08.98
Vanik 4,000,000 100 15% 3,630,160
Vanik 4,000,000 100 14.20% 369,840
2. Listings 1999
Vanik incorporation Ltd 3,630,160 100 15.00% 14.01.99
Vanik incorporation Ltd 369,840 100 14.20% 14.01.99
Mercantile Leasing Ltd 2,200,000 100 14.00% 2,249,634 09.04.99
People's Merchant Bank 1,500,000 100 13.50% 1,500,000 08.06.99
Sampath Bank 49,307 1000 13.50% 49,307 10.09.99
Sampath Bank 423,971 1000 14.20% 423,971 10.09.99
National Development Bank 500,000 1000 13.45% 573,810 29.10.99
3. Listings 2000
Sampath Bank 26,722 1000 12.32% 26,722 06.01.00
Seylan Bank Ltd 1,139,050 100 13.35% 1,139,050 18.01.00
Seylan Bank Ltd 2,860,950 100 14.20% 2,860,950 18.01.00
Eagle Insurance Ltd 10,000,000 10 14.50% 10,000,000 14.01.00
Sri Lanka Telecom Ltd. 261,241 1000 14.00% 05.05.00
Sri Lanka Telecom Ltd. 1,226,779 1000 14.50% 05.05.00
Sri Lanka Telecom Ltd. 11,980 1000 13.00% 05.05.00
Eagle Insurance Ltd 3,00,000 10 14.50% 3,000,000 11.04.00
4. Listings 2001
Suntel Ltd 7,000,000 1000 22.00% 759,000 19.01.01
Suntel Ltd 150,000 1000 22.25% 157,120 19.01.01
Suntel Ltd 150,000 1000 22.50% 152,630 19.01.01
Eagle Insurance Ltd 9,000,000 10 23.00% 9,000,000 26.03.01
Seylan Bank Ltd 6,000,000 100 15.00% 803,900 21.06.01
Seylan Bank Ltd 6,000,000 100 16.00% 3,703,250 21.06.01
Seylan Bank Ltd 6,000,000 100 19.88% 883,450 21.06.01
Source: Colombo Stock Exchange.
Table B 8: Listed Debentures 1998-2001
2,145,718
4,000,000