colombo, sri lanka - GARI International Journal of ...
111
GLOBAL ACADEMIC RESEARCH INSTITUTE COLOMBO, SRI LANKA GARI International Journal of Multidisciplinary Research ISSN 2659-2193 Volume: 06 | Issue: 02 On 30 th September 2020 http://www.research.lk
-
Upload
khangminh22 -
Category
Documents
-
view
1 -
download
0
Transcript of colombo, sri lanka - GARI International Journal of ...

GLOBAL ACADEMIC RESEARCH INSTITUTE
COLOMBO, SRI LANKA
GARI International Journal of
Multidisciplinary Research
ISSN 2659-2193
Volume: 06 | Issue: 02
On 30th September 2020
http://www.research.lk

GARI PUBLISHER
87/23A, KohilaKotuwa Road, Neelammahara,
Maharagama, Colombo, Sri Lanka
Tel: +94-112-849-268 / Fax: +94-112-849-426
Mobile: +94-773-940-838 / +94-715-279-696
For Paper Submission: [email protected]
For Help: [email protected]
WhatsApp / Viber: +94-773-940-838
Skype: gari.conference
Web: http://globalacademicresearchinstitute.com
Journal Brief
GARI International Journal of Multidisciplinary Research is an international peer-reviewed
journal that publishes original and high-quality research papers in all areas of Multidisciplinary.
An Open Access Double Blind Peer Reviewed Quarterly Publish E-Journal, with a strong
Editorial Board and a tested rapid peer review system. As an important academic exchange
platform, scientists and researchers can know the most up-to-date academic trends and seek
valuable primary sources for reference.
This E-journal publish 04 times per annually
DISCLAIMER
The responsibility for opinions expressed, in articles, studies and other contributions in this
publication rests solely with their authors, and this publication does not constitute an endorsement
by the Global Academic Research Institute of the opinions so expressed in them.

Volume: 06 | Issue: 02
ISSN 2659-2193
GARI AUGUST MULTIDISCIPLINARY SYMPOSIUM on 27th August 2020 @ Galle
Face Hotel, Colombo, Sri Lanka
Edited by Global Academic Research Institute Publication Department
EDITOR | REVIEW TEAM
A.M.G.S. Priyankara – Sri Lanka (Chief Editor)
Rajaram Gurusamy - St.Joseph University, Tanzania
Dr. Chandana Kasturi Arachchi, University of Colombo, Sri Lanka
Dr. Rami Salem - University of Central Lancashire, United Kingdom
Dr. Jamil Abedalrahim Jamil Alsayaydeh – Universiti Teknikal Malaysia
Dr. Narendra P. Parchure - Symbiosis Center for Distance Learning, India
Prof. Soufiane Belhouideg - Université Sultan Moulay Slimane, France
Prof. Hend Ezzeldin - Ain Shams University, Egypt
Prof. Dr. Ugur Demiray - Anadolu University, Turkey
Prof. Dhaval M. Dave - Bentley University, USA
Dr. Larissa Noury - ITECOM Art & Design, France
Dr. Damayanthie Eluwawalage - Albright College, USA
Caroline Gilbey - SFHEA, England
Dr. Raisal Ismail - South Eastern University of Sri Lanka
Dr. Kuldeep Kumar - Bond University, Australia
Dr. Husna Leila Yusran - Trisakti University, Indonesia
111 Pages
All right are reserved according to the code of intellectual property act of Sri Lanka, 2003
Publish by: Global Academic Research Institute Publication Department
http://www.research.lk

Table of Contents
1. Motivation to Learn English via Online during Novel COVID 19 Period
(Prasangani K.S.N) 05 - 14
2. Learning online in the wake of COVID-19
(U. Thulasivanthana) 15 - 21
3. Economic Forecasting of Demographic Dividend of India
(Dr. Arzoo Mustafi) 22 - 34
4. Does Creative Tourism Contributes to Creative Economy of a Country?
A Review of Recent Research
(Preethi Gunaratne, Dillina Herath) 35 - 55
5. Use of Information Communication Technology for Business Management
in Mining & Mineral Industry
(Tharika Chalani Weerakoon, Sumith Gamage, Sampath Kokila) 56 - 66
6. The Influence of Customer Perception on Loyalty towards an Organization.
A special reference to the FMCG and Banking Sectors in Sri Lanka
(Gopikrishna S) 67 - 84
7. HS 87 exports behavior of Germany, Japan and United States of
America from 2015 to Quarter One 2020
(Lilanka De Silva) 85 - 95
8. An Inquiry into the Dramatic Art in Sri Lanka from the Pre-Buddhist
Period to the Kandyan Period
(C. M. Ramith Preshal Chandrasekara) 96 - 111

ISSN 2659-2193 | Volume: 06 | Issue: 02 | 30-09-2020
MOTIVATION TO LEARN ENGLISH VIA ONLINE DURING NOVEL COVID 19
PERIOD
Prasangani K.S.N.
Department of English Language Teaching, Faculty of Social Sciences & Languages,
Sabaragamuwa University of Sri Lanka, Sri Lanka
ABSTRACT
The current study examined the motivation to learn English language via
online during the COVID 19 period.
Dramatic change has occurred in online
learning due to the fall of COVID 19 in Sri
Lanka. Thus, this study aimed to find the
motivation of Sri Lankan learners to learn
English via online. Mixed method
approach was applied to collect data from
the participants of secondary and tertiary
levels. Adapted online motivation
questionnaire consisted with 60 items was
used to collect data from 150 participants. Interviews were conducted for randomly
selected participants to examine the
motivation profile further. SPSS
correlation analysis was applied to find the
core relationships of L2 Motivational Self
System. The results have shown that Sri
Lankan learners’ ideal L2 self is highly
stronger than the ought to L2 self and L2
learning experiences. In contrast to earlier
findings this study found strong positive
correlations between the motivation and the ought to L2 self and learning
experiences. Surprisingly, Sri Lankan
learners highly motivated to learn from
formal English classroom than the online
English learning classroom. This is an
important issue for future research.
Furthermore, these learners use internet
for self-English learning purposes, using
social media in English, and entertainment
purposes. Finally, this study suggests the
importance of having a proper policy for
online learning in Sri Lanka to facilitate the learners for better learning.
Keywords: L2 motivation, Online English Learning, Novel Covid 19, L2
Motivational Self System
INTRODUCTION
Sri Lanka education system had faced
several challenges during the period of civil war, tsunami, natural disasters and
terrorist activities (Bitter & Edirisinghe,
2016). Anyhow, until the spread of
COVID 19 Sri Lankan education system
did not identify the importance of distance
learning, specially the online teaching and
learning. Online teaching and learning has
become a new challenge to the Sri Lankan
education system due to the lack of
connectivity, knowledge, devices, and
cost of data;(“Distance education for
school children in Sri Lanka in the time of COVID-19,” 2020;Li & Lalani,
2020;Vincent & Kitnasamy, 2020).
Teachers and students started to use
WhatsApp, Viber, Facebook, YouTube,
Learning Management System (LMS),
Zoom, Google classroom, Microsoft
Teams, WebEx and etc. for their learning
and teaching at different levels. At this
juncture it is worthwhile to investigate the
learners’ motivation for online learning.
Background of the Study
Education in Emergencies in Sri Lanka

ISSN 2659-2193 | Volume: 06 | Issue: 02 | 30-09-2020
Sri Lanka faced two major emergencies in the history. Such as thirty years of civil
war which was ended in 2009 and tsunami
in 2004. During the civil war hundreds of
thousands of people displaced, injured or
killed and during tsunami 35,000 people
killed and over a million of people
displaced. Among the tsunami victims
there were 200,000 school children and university students, and 3000 of teachers
(Bitter & Edirisinghe, 2016;Uyangoda,
2013). During the period of civil war Sri
Lankan government had to continue the
education in the LTTE controlled areas in
north and east of Sri Lanka. That was a
great challenge, because the government
had to ensure the safety of educational
officers, teachers and students. Similarly,
due to the tsunami, 182 schools were
damaged and 287 schools were converted
as camps for the tsunami victims. In fact, classroom teaching was halted for many
weeks (Bitter & Edirisinghe,
2016;Uyangoda, 2013). These two major
emergencies created the need of policies
and regulations in Sri Lankan education
system, because continuation of education
system in the country was challenged
during the two emergencies.
Furthermore, drought in 2001, landslides in 2006, flooding in
2008,cyclone in 2010 and Easter Sunday
Attack in 2019 highlighted the necessity of
preparedness of the education system during the emergencies (Uyangoda, 2013).
It was a great challenge for the country to
implement a common policy by protecting
the right of free education and providing
equal access. Anyhow, during the civil
war period Sri Lankan education system
was able to conduct all government
examinations of Ordinary Level,
Advanced Level, and Grade Five
Scholarship Examination in the LTTE
controlled areas with the support of teachers and education officers
simultaneously with the other parts of the
country (Uyangoda, 2013).
Majorly, during the civil war and tsunami periods Sri Lankan education
system adopted teaching methods of
Accelerated Learning Programme (ALP),
Catch up Education (CUE), and home-
based teaching in the areas of north, east,
and coastal areas to continue the education
without disruption (Uyangoda, 2013).
ALP helps the students those who face the long-term disruption of education. It
facilitates the multi-level and multi grade
teaching. In fact, students were able to
reach the expected competency levels
without considering the physical age. ALP
was applied in the North during the civil
war period (Uyangoda, 2013). CUE
focuses on the students of short-term
education disruption. This was practiced
after the tsunami disaster to prepare the
students for public examinations. Catch up
classes were conducted by the teachers in the afternoons and students were rejoined
to the normal classes once they reached the
required competencies (Uyangoda, 2013).
Home based teaching was introduced after
2005 to the war affected areas of Sri
Lanka. Under this teacher in the nearby
locations of the students taught and guided
the students based on the self-study
materials. This was also targeted to
prepare the students for government
examinations (Uyangoda, 2013). Anyhow, the unexpected spread of the
COVID-19 disease has caused to sudden
shut of schools and higher educational
institutes in all over the country by
disrupting the education system. This is
the very first time Sri Lankan education
system experienced a long closure of the
educational institutes with uncertainty. In
addition to that it is a great challenge for
the country to ensure the safety of the
teachers and students and equal access of education.
Ministry of Education (MOE) and
University Grant Commission (UGC) initiated the online teaching as a solution
during the pandemic period. The sudden

ISSN 2659-2193 | Volume: 06 | Issue: 02 | 30-09-2020
initiation of online teaching in education
system created certain problems in the
country. It has widened the educational
inequality among the students, because
number of students have no wealth to
purchase the necessary devices to connect
with the lessons, there are lot of electricity
and internet disruptions in the country.
Only 40% of the school going households in Sri Lanka have internet connection and
90% of them access via mobile networks.
On the other hand, teachers faced a big
embarrassment due to the sudden
conversion of online teaching, because
they were not ready to use it due to the lack
of knowledge (Kadiragamar &
Thiruvarangan, 2020; Vincent &
Kitnasamy, 2020;“Distance education for
school children in Sri Lanka in the time of
COVID-19,” 2020). This condition will
lead the poor user experiences in the education, but some believe the new
hybrid model of education will lead for the
betterment of the students in the long run,
because online learning helps to retain
information, save the time (Li & Lalani,
2020).
Motivation for Online English
Learning
Motivation is a key impetus for learning English. Several studies were conducted to
examine factors related to the formal
English language classrooms and self-
learning (outside classroom). Several
researches were conducted to examine the
motivation of English learners in different Asian contexts based on L2 Motivational
Self System (Dornyei, 2009). According
to Prasangani (2014a; 2014b) Malaysian
learners’ ideal L2 self is the strongest
contributory factor of their English
learning. Furthermore, interestingly their
social goals strongly contribute to form
their ideal L2 self. The similar pattern
appears among the Sri Lankan
undergraduates(Prasangani & Nadarajan,
2015). In the Sri Lankan context it is somewhat surprising that among the rural
English learners ideal L2 self is stronger
than the urban learners in their English
learning motivation (Prasangani &
Nadarajan, 2015;Prasangani, 2018b).
Although, among Chinese and Indonesian
rural English learners ideal L2 self was
weak due to the lack of exposure and
facilities (Lamb, 2012;You & Dornyei,
2014). On the other hand, learning
experiences are the most contributory factor of English learning motivation
among the Pakistani learners (Islam,
Lamb, & Chambers, 2013). This finding is
parallel with Iranian, Japanese and
Indonesian learners, because attitudes to
learn English seemed as the strongest
contributory factor of motivation in
English learning (Taguchi, Magid, & Papi,
2009; Lamb, 2012). Added to that the
recent motivation study by Shahbaz,
Islam, & Malik (2017) emphasized the
high motivation based on ideal L2 self of the girls in Pakistani context.
More recent attention has focused on motivation to learn English via online.
Recent studies of Lamb and Arisandy
(2019) and Prasangani, (2019) discussed
certain aspects of learner motivation in
learning via online. Lamb & Arisandy
(2019) found high level of English use for
entertainment among Indonesian
cosmopolitan learners. Added to that
Prasangani (2019) emphasized the Sri
Lankan English learners’ high motivation
to use English in digital devices, internet, and social media. These studies indicated
the preliminary findings of motivation to
learn English via online. Anyhow,
dramatic change has occurred in online
English teaching with the fall of COVID
19 in the world. Until recently, there has
been very little attention paid for the
motivation to learn English via online
during the COVID 19 period. Thus, the
current study aimed to investigate how Sri
Lankan English learners motivate to learn English via online during the COVID 19
period. The major objective of this study
was to investigate the motivational profile
and recommend some suggestions to

ISSN 2659-2193 | Volume: 06 | Issue: 02 | 30-09-2020
improve online English teaching in Sri
Lanka and similar contexts in the world.
Based on that the current study aimed to
answer the following research questions;
1. What is the nature of motivation among Sri Lankan English learners?
2. What is the nature of motivation to use English outside of the formal
classroom environment?
METHODOLOGY
In most recent studies of motivation was
examined based on the mixed method.
This study also adopted the mixed method
to collect data. Mixed method is
appropriate for this study, because through
quantitative only it is difficult to gain the
opinions of the learners. Thus, mixed
method will provide a balance picture of
motivation. The questionnaire was
adapted from Lamb and Arisandy (2019)
and Prasangani (2018). Questionnaire
consisted with 60 items and 5-point Likert scale. Interviews were conducted with
randomly selected two participants. 150
participants participated the online
voluntary questionnaire survey. The link
for the online survey was sent via emails
and WhatsApp groups. Table 1 shows the
participant profile of the study.
Table 1: Participant Profile
Age 14-20 30%
20-26 70%
Gender Male 19%
Female 81%
Residence Urban 47%
Rural 53%
Only participants aged between 14 and
20 years were included in the study. 30% of the participants were between the age of
14 years and 20 years and 70% of the
participants were between 20 years and 26
years. Further, 30% of the participants
were secondary students and 70% of the
participants were undergraduates. The
majority of the participants were females
(81%). In addition, sample consisted with
almost equal urban and rural participants
(47% and 53%). Collected data analysis
was performed by using SPSS. After the questionnaire adaptation pilot study was
conducted among five participants.
Correlation analysis was conducted to
examine the relationships between the
independent and dependent variables.
The reliability of the questionnaire can be
seen in Table 2.
Table 2: Reliability of the Items
Cronbach's Alpha
Cronbach's Alpha Based on
Standardized
Items
N of Items
.973 .975 60
The Cronbach’s Alpha scores in Table 2 and Table 3 were above 0.7 which is in
accordance with the accepted Cronbah’s
Alpha requirement (Pallant, 2007).
Table 3: Reliability of the variables of the questionnaire

ISSN 2659-2193 | Volume: 06 | Issue: 02 | 30-09-2020
Variables Cronbach's Alpha N of Items
Use English Outside
Classroom
.938 20
Use internet for studying .931 7
Motivated Learning
Behavior
.948 10
Ideal L2 Self .918 8
Ought to L2 Self .860 4
Formal English Class .921 5
Online English Class .863 6
The Cronbach's Alpha values proved the reliability of the items and variables.
RESULTS AND DISCUSSION
What is the nature of motivation among
Sri Lankan English learners?
Correlation analysis was used to examine the relationships between the
dependent variable of motivated learning and independent variables of
ideal L2 self, ought to L2 self, formal classroom learning, and online classroom
learning. Table 4 provides the correlations
between the variables.
Table 4: Nature of Motivation
Dependent Variable Independent
Variable
Pearson
Correlation
Sig. (2-
tailed)
N
Motivated Learning
Behaviour
Ideal L2 Self .836** .000 150
Ought to L2 Self .601** .000
Formal Classroom Learning
.757** .000
Online Classroom Learning
.569** .000
**Correlation is significant at the 0.01 level (2-tailed)
It is apparent from Table 4 that Sri Lankan English learners’ ideal L2 self is
highly correlated with the motivated
learning. This study further confirms the
findings of Prasangani (2018a;b) which
confirmed the strongest contribution of
ideal L2 self to the motivated learning. It may be that these learners benefitted from
English. Further, English is the medium
instruction in most of the higher education
institutes. As well as due to the fall of
COVID 19 students identified the
importance English to learn via online. In
fact, it can be suggested that Sri Lankan
learner’s ideal L2 self is stronger in their
English learning motivation. Anyhow, this result is different from previous
motivation studies, because they found
classroom learning as the strongest
correlative factor in English learners’
motivation (Islam et al., 2013;Martin
Lamb, 2012;Lamb & Arisandy,
2019;Taguchi et al., 2009). Sri Lankan
learners’ ideal L2 self can be discussed
further through Table 5.

ISSN 2659-2193 | Volume: 06 | Issue: 02 | 30-09-2020
Table 5: Ideal L2 Self Descriptive Analysis
Questionnaire Item Agree
I can imagine myself studying in a Sri Lankan university where all my courses are taught in English and spoken in English
74%
I can imagine myself writing e-mails/letters fluently in English. 82%
The things I want to do in the future involve English. 92%
I often imagine myself as someone who’s able to speak good English. 83%
I want to be the kind of Sri Lankan who speaks English fluently 88%
I see myself one day communicating in English with western speakers. 90%
Studying English is important to me because I would like to become close to L1(US/British/Australian &etc) speakers of English.
83%
Studying English is important to me because I would like to become close to L2 (Sri Lankan/Malaysians/Indians &etc) speakers of English.
71%
In accordance with Table 5 it is visible
that Sri Lankan learners highly visualize
their future career in English. It is
interesting that their aim to be fluent
English speakers and move with the western world. This finding is parallel
with Prasangani (2018a) which found a
greater desire of Sri Lankan and
Malaysian learners to communicate in
English with western speakers.
In contrast to earlier findings of motivation studies (Prasangani &
Nadarajan, 2015;Putri & Hadisantosa,
2018) ought to L2 self has a significant
positive correlation to the motivated
learning. This might be because the
sample consisted with secondary school
students and their parents play a special
role in the Sri Lankan education system. Sri Lankan students always try to fulfill
their parents’ dreams. However, this
finding should be studied further to
generalize. Learning experiences or
classroom learning is a major component
in L2 Motivational Self System. In this
study learning experiences were divided
into two as formal classroom learning and
online classroom learning. Online
classroom learning became popular in the
Sri Lankan education with the spread of COVID 19. According to the data of Table
4 formal classroom learning has a high
significant positive correlation to the
motivated learning than the online
classroom learning. This can be explained via the difficulties faced by the students
via online learning. In Sri Lankan context
lot of students have no wealth to purchase
necessary devices to connect with the
lessons, and there are lot of electricity and
internet disruptions in the country
(Kadiragamar & Thiruvarangan, 2020;
Vincent & Kitnasamy, 2020). In addition
to that Sri Lankan students used to depend
on the teachers heavily. They expect
personal attention and close relationship from the English teacher (Prasangani,
2019b). It is difficult to create such a
background in a virtual environment with
lack of technological knowledge and
experiences. In fact, online platform seems
less popular among them. Anyhow, this
situation can be changed in the future once
the teachers and students get used to the
online platform. However, with a small
sample size caution must be applied when
applying the results to future studies.

ISSN 2659-2193 | Volume: 06 | Issue: 02 | 30-09-2020
Learning experiences or classroom learning was further examined through the
interviews of the students. Through the
interviews the two learners explained
their real-life classroom experiences.
Learner 1
I like the online classroom, because it is very easy for us. We can learn
from anywhere and at any time, but lot
of my friends have connection
problems and they don’t have
smartphones or laptops. Some friends
have no suitable place to study…
Learner 2
Online classroom is good, but I can’t continue the lessons. Sometimes I lose the
connection or sometimes teacher lose the connection. There were some instances
that I did not have electricity during the
rainy time…
In accordance with the interview data it is visible that learners like online
classroom, but they have certain problems
on it. They have connectivity problems, no
devices, and no education friendly
environment at home. Those reasons may
cause to the high favour for formal
language learning classroom, because
learners are comfortable with the formal
learning environment in the school or university.
What is the nature of motivation to use
English outside of the formal classroom environment?
With the expansion of the technology smartphones and tablets became very
famous among the learners. This
automatically created an informal English
learning environment for the learners via
certain apps. Further, during the COVID
19 period government and internet
providing companies offer free packages
and promotions to promote online
learning. Table 6 shows Sri Lankan
learners’ motivation for using internet for
informal learning or incidental learning.
Table 6: Motivation for Using Internet for Informal Learning
**Correlation is significant at the 0.01 level (2-tailed)
What is interesting in this data is use
internet to learn English has a significant
positive strong correlation to the
motivated learning than use internet in
English for other activities. This can be
further discussed through Table 7 and
Table 8.
Table 7: Use Internet to Learn English
Questionnaire Item Agree
Study English grammar and vocabulary online
69%
Read articles related to my subject area or my work in English
70%
Purposely develop my English language skills online
66%
Do online quizzes in English. 55%
Use Wikipedia in English 66%
Use the internet to learn about the English language
71%
Follow online English courses like Coursera
52%
In accordance with Table 7 it is apparent
that learn about English language, reading
related to subject area and learn grammar
and vocabulary are popular online learning
activities among Sri Lankan learners. This
indicates that these learners are eager to
develop their English via internet. In
Dependent
Variable
Independent
Variables
Pearson
Correlation
Sig.
(2-
tailed)
N
Motivated
Learning
Behavior
Use internet to learn English
.665** .000 150
Use internet in English for
other activities
.642** .000

ISSN 2659-2193 | Volume: 06 | Issue: 02 | 30-09-2020
addition to that it is visible that online
courses are not yet popular among Sri
Lankan learners.
Table 8: Use Internet for other activities
Questionnaire Item Agree
Watch English language TV shows (news, sports,
entertainment)
70%
Watch YouTube videos in English
76%
Read websites in English 77%
Read English song lyrics online
62%
Play digital games in English
50%
Listen to English language songs
77%
Book accommodation or travel tickets in English
45%
Watch films in English without Sinhala/Tamil
subtitles
72%
Read comic strips in English
50%
Online shopping is in English
64%
Watch foreign films with English subtitles
69%
Write blogs or fan fiction in English
54%
Use English for my social media’s (Facebook’s,
WhatsApp, etc.)
80%
Contribute to online English language forums
related to my hobbies.
60%
Write photo captions on Instagram in English
49%
Write Facebook or Twitter posts in English
59%
Communicate with foreign friends in English
online (through email,
WhatsApp etc.)
54%
Follow Twitter posts in English
42%
Talk with foreigners in English on Skype
33%
Make videos in English
(e.g. on Snapchat, FB)
53%
Table 8 shows that how Sri Lankan learners use internet in English for their
other activities. In accordance with data it
is apparent that they use English highly for social media. In addition to that they prefer
to listen English songs, read English
websites, watch YouTube videos, watch
films and TV shows respectively.
Anyhow, Skype is the least popular online
activity among these learners. This might
be because Skype is not a popular web-
based activity among the younger
generation in Sri Lanka. Further, during
the COVID 19 period internet providers
provide free or extra data for social media, YouTube and educational websites.
CONCLUSION AND
RECOMMENDATION
This study investigated the motivation
to learn English via online during the
COVID 19 period. The results have shown
that Sri Lankan learners’ ideal L2 self is
stronger than the ought to L2 self and
learning experiences. The study was also
shown the great desire of Sri Lankan
learners to be fluent English speakers. In
contrast to earlier findings this study found
strong positive correlations between the motivation and the ought to L2 self and
learning experiences. Further research is
required to establish the findings on ought
to L2 self and learning experiences.
Surprisingly, Sri Lankan learners
motivated to learn from the formal English
classroom than the online English learning
classroom. This is an important issue for
future research. Furthermore, these
learners use internet for self-English
learning purposes, using social media in

ISSN 2659-2193 | Volume: 06 | Issue: 02 | 30-09-2020
English, and entertainment purposes.
Although, the current study is based on a
small sample, the findings suggest the
importance of paying attention to improve
the facilities and resources for online
English learning. Finally, this study
suggests the importance of having a proper
policy for online learning in Sri Lanka to
facilitate the learners for better learning.
REFERENCES
Bitter, P., & Edirisinghe, S. (2016). Education in Conflict and Emergencies Introduction of Disaster Safety in the Sri Lankan Education system : Factors for success. In UKFIET International Conference on
Education and Development – Education & Development Post 2015.
Distance education for school children in Sri Lanka in the time of COVID-19. (2020, May 14). DailyFT.
Dörnyei, Z. (2009). The L2 Motivational Self System. In Z. Dörnyei & E. Ushioda (Eds.), Motivation, language identity
and the L2 self (pp. 9–42). Bristol,UK: Multilingual matters.
Islam, M., Lamb, M., & Chambers, G. (2013). The L2 Motivational Self System and National Interest: A Pakistani perspective. System, 41(2), 231–244. https://doi.org/10.1016/j.system.2013.01.025
Kadiragamar, N., & Thiruvarangan, M. (2020). Learning lessons : The COVID-19 challenge to education. DailyFT.
Lamb, M., & Arisandy, F. E. (2019). The impact of online use of English on motivation to learn. Computer Assisted Language Learning, 1–24.
https://doi.org/10.1080/09588221.2018.1545670
Lamb, Martin. (2012). A Self System Perspective on Young Adolescents ’ Motivation to Learn English in Urban and Rural Settings. Language Learning, 62(4), 997–1023. https://doi.org/10.1111/j.1467-
9922.2012.00719.x
Li, C., & Lalani, F. (2020). The COVID-19 pandemic has changed education forever . This is how. Retrieved July
17, 2020, from https://www.weforum.org/agenda/2020/04/coronavirus-education-global-covid19-online-digital-learning/
Pallant, J. (2007). SPSS Survival Manual A Step by Step Guide to Data Analysis using SPSS for Windows. Berkshire:
Open University Press. Prasangani, K. S. N. (2014). Malaysian L2
learners’ English learning motivation: A study of goals, attitudes and self. Issues in Language Studies, 3(1), 24–35.
Prasangani, K. S. N. (2018a). IMPACT OF GLOBAL ENGLISH TO FORM THE
IDEAL L2 SELF AND MOTIVATION OF ASIAN RURAL L2 UNDERGRADUATES. The Online Journal of New Horizons in Education, 8(4), 81–86.
Prasangani, K. S. N. (2018b). Investigation of L2 Motivational Self System : A Comparative Study of
Undergraduates from Displaced and Resettled Regions in Sri Lanka. Sabaragamuwa University Journal, 16(1), 58–67.
Prasangani, K. S. N. (2019a). Digital Platforms to Motivate English Learning among Young Learners in Sri Lanka. GARI International Journal of Multidisciplinary
Research, 5(3), 1–5. Prasangani, K. S. N. (2019b). L2 L earners ’
expected ideal English as a Second Language ( ESL ) Teacher. The Asian Journal of English Language & Pedagogy, 7(2), 10–17.
Prasangani, K. S. N., & Nadarajan, S. (2015). Sri Lankan Urban and Rural
Undergraduates ’ Motivation to Learn English. International Journal of Technical Research and Applications, (18), 26–33.
Putri, X. C. J., & Hadisantosa, N. (2018). THE
L2 MOTIVATIONAL SELF SYSTEM AMONG INDONESIAN LEARNERS
OF ENGLISH: A CASE STUDY. Unika Atma Jaya, (April), 508–511.

ISSN 2659-2193 | Volume: 06 | Issue: 02 | 30-09-2020
Shahbaz, M., Islam, M., & Malik, M. A. (2017). Role of Gender Differences and Parents ’ Education in Shaping L2
Motivation of Pakistani Students. Journal of Research and Reflections in Education, 2, 210–223.
Taguchi, T., Magid, M., & Papi, M. (2009). The L2 Motivational Self System among Japanese , Chinese and Iranian Learners of English : A Comparative Study. In Z. Dörnyei & E. Ushioda
(Eds.), Motivation, language identity and the L2 self (pp. 66–97). Bristol: Multilingual Matters.
Uyangoda, D. (2013). Education in Emergencies in Sri Lanka (2001–2010). Norway.
Vincent, B. M., & Kitnasamy, P. (2020). It is time to change the narrative -
Measuring the devastating impact of COVID-19 on the education of children in tea plantation communities in Sri Lanka. Retrieved July 18, 2020, from https://reliefweb.int/report/sri-lanka/it-time-change-narrative-measuring-devastating-impact-
covid-19-education-children You, C., & Dornyei, Z. (2014). Language
Learning Motivation in China: Results of a Large-Scale Stratified Survey. Applied Linguistics, 1–26. https://doi.org/10.1093/applin/amu046

ISSN 2659-2193 | Volume: 06 | Issue: 02 | 30-09-2020
LEARNING ONLINE IN THE WAKE OF COVID-19
U. Thulasivanthana
Swamy Vipulananda Institute of Aesthetic Studies, Eastern University
ABSTRACT
The COVID-19 outbreak has caused many unprecedented challenges and
restructured higher education in the world.
Many countries have imposed emergency protocols such as quarantines, lockdowns,
curfews, travel restrictions and social
distancing measures and closed
educational institutions temporarily in an
attempt to minimize the risk of spreading
COVID-19. In many countries education
continues online rather than face-to-face
due to this global disaster. Countries
around the world are striving to ensure the
progression of learning. Shifting
education from face-to-face to online in
response to a global public health emergency is an indispensable solution,
but it comes with a lot of challenges. This
paper seeks to explore and describe the
attitudes and perceptions of undergraduate
students of an institution towards online
learning during COVID-19 pandemic,
how the transition from face-to-face
learning to online learning is going on and
what kind of assistance leaners think they
require at this moment. Data was collected
through survey and interviews. The findings of this study will be useful to
mitigate the loss of learning and well-
being during crisis by identifying the
difficulties encountered by learners in
online learning during the COVID-19
pandemic.
Keywords: Attitudes, Online learning, COVID-19, Learners
INTRODUCTION
The COVID-19 was initially identified
in Wuhan, China. It has been quickly spreading across the world since
December 2019. The World Health
Organization declared that the outbreak
was a pandemic on 11 March 2020. As of
6 August 2020, about 18 million
individuals have been infected and
approximately 700000 have died. To slow
down the spread of pandemic many
countries have closed their educational
institutions. As a result, similar to many
other fields, the education field has also
been affected (Adnan & Anwar 2020). Several countries have implemented
various solutions to continue the teaching
and learning process. Unprecedented
attention has been focused on learning
online after the temporary closure of
educational institutions.
On 10 March 2020, the first Sri Lankan local resident confirmed positive for
COVID-19. In reaction to this public
health emergency, Sri Lankan government
temporarily closed all educational
institutions around the nation prioritizing
learners. The Ministry of Higher Education announced that university
teaching will move online. In an attempt to
assist all the undergraduate learners in Sri
Lankan state universities to follow their
academic programmes without
interruption all internet service providers
are offering free access to University
Hosted Webservers until the nation returns
to normalcy. The COVID-19 pandemic
has changed learners’ learning potency
and process of acquiring knowledge, skills
and attitudes. Shifting all the courses from

ISSN 2659-2193 | Volume: 06 | Issue: 02 | 30-09-2020
face-to-face learning to online learning is
totally new to leaners in Sri Lanka. As they
are suddenly compelled to learn online, it
is vital to know about their attitudes and
perceptions regarding learning online.
LITERATURE REVIEW
Many terms have been used to denote
the idea of online learning. This makes it
hard to develop a common definition.
(Ally, 2011; Singh & Thurman, 2019).
Khan (1997) indicates online learning as a
new method for delivering education to
distant learners deploying the web as the
means of communication. Curtain (2002) points out that online learning
incorporates both synchronous and
asynchronous types of learning which
intends to improve the interaction between
teacher and student. Filling the void
between learner and teacher utilizing web-
based technology is considered as online
learning (Lee, 2017; Moore et al., 2011).
Online leaning is “the use of the Internet
to access learning materials; to interact
with the content, instructor, and other
learners; and to obtain support during learning process, in order to acquire
knowledge, to construct personal
meaning, and to grow from the learning
experience”(Ally, 2011,p.17). A host of
terms such as E-Learning, Online
education, Internet Learning, Tele-
Learning, Virtual Learning, Distance
Education, Web-enhanced Learning,
Web-based Learning, Computer assisted
learning, Computer-assisted instruction,
E-tutoring have been used to explain online learning (Ally 2004; Singh &
Thurman 2019).
In a systemic literature review of definitions of online learning (1988-
2018), Singh & Thurman (2019) identifies
forty-six definitions of online learning
with eighteen similar words. All the
definitions and terminologies indicate that
online learning takes place in an online
setting where learning content is delivered
either synchronously or asynchronously
and learners use technology to
communicate with teachers or classmates.
Several studies focus on some instances of using online learning during uncertain
(Basilaia & Kvavadze 2020). Layne
(2015) reiterates on the necessity for
preparedness of educational institutions to
survive and thrive in the cases of natural
disasters, global health threats, wars,
vandalism and other unprecedented events. Learning online has become an
important means of accessing higher
education in the world due to harsh
realities of the biggest global educational
lockdown. Adsul (2020) demonstrates that
learning online has become essential to
ensure uninterrupted education during the
spread of the COVID-19 pandemic.
While some scholars believe online learning will provide many advantages
and others argue that the unplanned and
quick transition from face-to-face learning
to learning online without proper preparation and professional training will
cause unfavorable effects. Adnan &
Anwar (2020) suggest that learning online
cannot be effective in developing
countries due to issues such as inadequate
resources, digital divide, technical
glitches, absence of face-to-face
communication and financial problems.
Undergraduate education is free in Sri Lankan state universities. Most courses in
state universities rely on traditional
method of teaching which consists of
lectures, tutorials, workshops and other
face-to-face forms of learning. Liyanagunawardena et al.(2014) indicate
that The Distance Education Modernizing
project introduced fully online or blended-
online programmes in Sri Lankan
education system for the first time in 2003
but Liyanage & Strachan (2014) points out
the following: The level of acceptance and
people’s reluctance to accept this new
methodology is the major bottleneck in
popularizing the online concept in Sri
Lanka. Overall as a nation, it requires

ISSN 2659-2193 | Volume: 06 | Issue: 02 | 30-09-2020
policies and procedures recognizing
online learning credentials as being
equivalent to credentials earned in
traditional ways (p.9) In response to the
COVID-19 crisis face-to-face learning has
been cancelled and several educational
institutions have introduced online
learning. Many teachers and learners
experience online education for the first time. Suraweera (2020) describes that
learning online is still at early stage in Sri
Lankan higher education sector.
Previous studies offer no similar historical evidence of lengthy educational
crisis. While learning online in the wake of
COVID-19 has been studied recently in
other countries, only a few have been
conducted in a developing higher
educational institution like Swami
Vipualananda Institute of Aesthetic
Studies (SVIAS). Some researchers
suggest that the concept of online learning may prolong in post-pandemic period. “If
designed properly, online learning
systems can be used to determine learners’
needs and current level of expertise, and to
assign appropriate materials for learners to
select from, to achieve their desired
learning outcomes.” (Ally, 2011, p.17).
Therefore, it is essential to know about the
attitudes and perceptions of learners who
study in SVIAS to increase the quality and
success of online learning.
METHODOLOGY
This paper attempts to answer the
following questions:
1. What are the attitudes and perceptions of first the first year
undergraduate students of SVIAS
regarding sudden and unexpected
transition from face-to face learning to learning online?
2. What are the challenges encountered by the first year
undergraduate students of SVIAS
regarding sudden and unexpected
transition from face-to face learning to
learning online?
This study aims to describe the overall attitudes and perceptions of the first year
undergraduate learners of SVIAS towards
learning online. This research is based on
a survey which seeks to identify learners’
attitudes and perceptions regarding the
shift from face-to-face learning to online
learning. The online survey was conducted
from 1st July 2020 to 15th July 2020. A Google form was developed and
administered through Learning
Management System and WhatsApp
group. The Google form contained
questions for responses on Likert scale of
1-5 (ranging from “Strongly agree” to
“Agree”) and closed questions. It elicited
information related to gender, reading
news related to the COVID-19,
participants’ anxiety about the negative
impacts of the COVID-19, communication with others during the
COVID-19, learning efficacy process of
acquiring knowledge, previous exposure
to online learning, readiness to shift from
face-to-face learning to online learning,
devices for accessing the internet, course
works, preference to participate in live
sessions and overall satisfaction about
online learning.
Then, unstructured interviews were conducted online to elucidate the learners’
attitudes and perceptions about shifting
from face-to-face learning to online
learning. An invitation was sent to first year undergraduate students through
WhatsApp group. Ten learners
volunteered to participate. During the
interviews the participants were asked
about their biggest challenges regarding
online learning. Three tables were
developed and a descriptive analysis was
carried out. To find out the common
aspects in the interview data all the
interviews were transcribed and a thematic
analysis was done. The respondents live in different parts in Sri Lanka. All of them
voluntarily participated in this survey.

ISSN 2659-2193 | Volume: 06 | Issue: 02 | 30-09-2020
RESULTS & DISCUSSION
Table1.1
Table 1.2
Table 1.3
Q Desktop Laptop Tablet Smartphone No device
Q 8
NOR P NOR P NOR P NOR P NOR P
0 0% 3 2.6% 6 5.3% 103 90.4% 2 1.8%
One hundred and fourteen responses
were received. About 82.5% of the
respondents were female and 17.5% were
male. According to second question in the
survey the participants were asked
whether they read news related to COVID-
19 every day. 55.3% of the participants
agreed that they read news related to the
COVID-19 regularly. The third question
focused on the participants’ anxiety about the negative impacts of COVID-19 on
them and their family members. 40.4% of
the learners agreed that they are worried
about the negative impacts of COVID-19.
Fourthly, they were asked whether they
communicate with family
members/relatives/friends who they no
longer meet in person due to the COVID-
19 lockdown. 50% of the respondents agreed. Fifth question dealt with learning
efficacy and mode of accessing education.
62.3% participants strongly agreed that the
COVID-19 outbreak has been disruptive
Question (Q) Gender Number of
respondents (NOR) Percentage (P)
Q 1 Female 94 82.5%
Male 20 17.5%
Q Strongly agree Agree
Neither agree nor disagree
Disagree Strongly
disagree
NOR P NOR P NOR P NOR P NOP P
Q 2 45 39.5% 63 55.3% 5 4.4% 1 0.9%
Q 3 28 24.6% 46 40.4% 28 24.6% 9 7.9% 3 2.6%
Q 4 30 26.3% 57 50% 12 10.5% 6 5.3% 9 7.9%
Q 5 71 62.3% 37 32.5% 2 1.8% 3 2.6% 1 0.9%
Q 6 11 9.6% 40 35.1% 28 24.6% 27 23.7% 8 7%
Q 7 15 13.2% 50 43.9% 30 26.3% 18 15.8% 1 0.9%
Q 9 45 39.5% 66 57.9% 3 2.6%
Q 10 27 23.7% 69 60.5% 14 12.3% 4 3.5%
Q 11 16 14% 38 33.3% 41 36.3% 16 14% 3 2.6%

ISSN 2659-2193 | Volume: 06 | Issue: 02 | 30-09-2020
to their usual learning efficacy and process
of acquiring knowledge. Results of the
sixth question indicated that only 35.1% of
the respondents had previous online
learning experience. 43.9% of the
participants exhibited their readiness to
move to an online learning environment.
About 98.3% of the participants have
devices for accessing internet and it seemed that almost all the participants use
smartphones (90.4%) rather than laptops
to access the internet. Approximately,
57.9% of the participants agreed that
course works are still being assigned while
they are at home. Most students (60.5%)
stated that they are interested in live
classes where all the students and lecturer
meet at the same time online for learning.
Finally, the participants were asked about
their overall satisfaction about online
learning. The responses were as follow: Strongly agree (14%), Agree (33.3%),
Neither agree nor disagree (36.3%),
Disagree (14%), Strongly disagree (2.6%).
The key findings from the interviews
are thematically analyzed below.
Availability of devices
Most learners possess smartphones that can be used for accessing the internet.
There are significant differences in the
learner attitudes and perceptions of
learning online on smartphone versus a
desktop or laptop because viewing
resources on small smartphone screen is
completely different from viewing the
same resources on desktop or laptop. In
addition, the quality of online learning is
related to the suitability of digital devices. Alternative arrangements should be made
for learners who do not possess
compatible devices to access online
learning platforms.
Internet connection
Access to the internet is a prerequisite aspect for online learning. Therefore, each
leaner must have access to high-speed
internet. The learners who live in
metropolitan areas have good internet
connectivity, while those who reside in
remote parts often have poor and patchy
internet connection or bandwidth issues.
Mostly, they have to find a location that
has stable internet connection. So,
asynchronous methods to accommodate
the leaners who have problems in
attending synchronous sessions.
Lack of experience
Efficient online learning process depends on the learners’ need to possess
strong technical skills and computer
knowledge. Some learners have minimal
experience about using online platforms. They lack the skills and training required
for learning online. Offering learners
guidelines on how to use the online
learning platforms can improve their
learning experience. Lack of formal
training and support create serious issues
for some students.
Cost of data
During the interviews some leaners expressed their deep concerns about the
cost of accessing the internet has
significant impact on their learning
because they belong to families with
underprivileged backgrounds. They are
battling with the means of securing the basic needs due to the COVID-19
lockdown. The cost of accessing the
internet poses additional economic burden
for them.
CONCLUSION
The COVID-19 has been causing
detrimental effects on all educational
institutions and learning process in the
world and Sri Lanka is not an exception to
this public health emergency. The
complete eradication of the COVID-19
pandemic cannot be achieved in near
future but learners deserve an online
learning experience that is comparable to
face-to-face learning. Therefore, it is vital
for policy makers and educational
institutions to know how learners are feeling and assist them to identify ways to

ISSN 2659-2193 | Volume: 06 | Issue: 02 | 30-09-2020
minimize the problems they are
encountering.
REFERENCES
Ally, M. (2004). Foundations of educational
theory for online learning. Anderson Terry (Ed.), The theory and practice of online learning (2nd ed), Athabasca University, Athabasca, AB, pp. 3–31
Adnan, M., & Anwar, K. (2020). Online learning amid the COVID-19 pandemic: Students' perspectives.
Journal of Pedagogical Sociology and Psychology, 2(1),. https://doi.org/10.33902/JPSP. 2020261309
Adsul, M.S. (2020). Digital Learning as a Solution to Combat COVID-19 Crisis: An Indian Perspective. Mallaya.D & D’Silv.R (Eds), Proceedings of Impact Of Covid – 19
Crisis On The Global Economy And Other Sectors Worldwide.(pp.111-119).(n.p.): Idea Publishing
Anderson, T. (2011). The theory and practice of online learning. Edmonton, Alberta: AU Press.
Basilaia, G., & Kvavadze, D. (2020). Transition to Online Education in
Schools during a SARS-CoV-2 Coronavirus (COVID-19) Pandemic in Georgia. Pedagogical Research, 5(4). doi:10.29333/pr/7937
Curtain, R. (2002). Online delivery in the vocational education and training sector: Improving cost effectiveness. Leabrook S Aust: NCVER.
Dhawan, S. (2020). Online Learning: A Panacea in the Time of COVID-19 Crisis. Journal of Educational Technology Systems, 49(1), 5-22. doi:10.1177/0047239520934018
First ever COVID 19 patient identified in Sri Lanka. (2020, March 12). Retrieved July 25, 2020, from
http://www.dailymirror.lk/print/front_page/First-ever-COVID-19-patient-identified--in-Sri-lanka/238-184765
Globokar, J. (2010). Introduction to online learning: A guide for students. London: SAGE.
Layne, P. C. (2015). Global Innovation of Teaching and Learning in Higher Education: Transgressing
Boundaries. Cham: Springer. Liyanage, L., & Strachan, R. (2014).
Effectiveness of Technology to Support Online Work Based Learning: Can Sri Lanka Adopt it? Retrieved August 08, 2020, from https://core.ac.uk/download/pdf/9304414.pdf
Liyanagunawardena, R.T, Adams, A.A., Rassol, N. & Williams , A.S. (2014). Blended Learning in Distance Education: Sri Lankan Perspective. (n.d.). Retrieved August 08, 2020, from https://www.researchgate.net/publication/267453241_Blended_Learnin
g_in_Distance_Education_Sri_Lankan_Perspective
Lee, K. (2017). Rethinking the accessibility of online higher education: a historical review. The Internet and Higher Education, 33, 15–23. doi:10.1016/j.iheduc.2017.01.001
Moore, J., Dickson-Deane, C., & Galyen, K.
(2011). E-learning, online learning and distance learning environments: Are they the same?. The Internet and Higher Education, 14(2), 129135.doi:10.1016/j.iheduc.2010.10.001
Mozelius, P., Hewagamage, K. P., & Hansson, H. (1970, January 01). Towards e-learning for all in Sri Lanka -
progress and problems in some selected Sri Lankan 21st century initiatives. Retrieved August 08, 2020, from https://core.ac.uk/display/147494104
Singh, V., & Thurman, A. (2019). How Many Ways Can We Define Online
Learning? A Systematic Literature Review of Definitions of Online Learning (1988-2018). American Journal of Distance Education, 33(4), 289–306. doi:10.1080/08923647.2019.1663082
Suraweera, D. (. (2020, March 30). E-Learning
for Continuing University Education. Retrieved August 08,

ISSN 2659-2193 | Volume: 06 | Issue: 02 | 30-09-2020
2020, from http://www.dailynews.lk/2020/03/30/local/215408/e-learning-
continuing-university-education WHO Director-General's opening remarks at
the media briefing on COVID-19 - 11
March 2020. (2020, March 11). Retrieved August 06, 2020, from https://www.who.int/dg/speeches/det
ail/who-director-general-s-opening-remarks-at-the-media-briefing-on-covid-19---11-march-2020

ISSN 2659-2193 | Volume: 06 | Issue: 02 | 30-09-2020
ECONOMIC FORECASTING OF DEMOGRAPHIC DIVIDEND OF INDIA
Dr. Arzoo Mustafi
Patna University, India
ABSTRACT
Many social scientists and demographers have analyzed and
concluded that the catalyst behind the
demographic dividend in the developing countries was sudden fluctuations in the
age structure in those countries. This phase
opens a window of a demographic
opportunity as it results is an increase in
the share of young adults in the population
leading to a ‘youth bulge’ together with
rapidly declining infant mortality. In this
background, this research paper attempts
to study how economic growth of India
gets influenced by its demographic
dividend. India, has been chosen to see this
relationship between two variables economic growth and demographic
dividend using fixed effect model
covering a period of 2000–2011. The
results show that a substantial fraction of
the growth acceleration that India has
experienced since the 1980s—sometimes
ascribed exclusively to economic
reforms—is attributable to changes in the
country’s age structure. Moreover, the
demographic dividend could add about 2
percentage points per annum to India’s per capita GDP growth over the next two
decades.
The impact of India’s dividend will eventually uplift the growth rate of the
potential labor force along with the growth
of younger population. The results from
regression equation exhibit that
relationship between GDP growth rate and
demographic dividend is positive thus,
validating our hypothesis that
demographic dividend has a positive
impact on economic growth. However
India needs to ensure timely
implementation of effective policies to
realize the dividend.
Keywords: Demographic Dividend;
Economic Forecasting; Population Projection
INTRODUCTION
Changes in the population age structure
have led to growth in the per capita income
and economic growth in many developing countries around the world (Kelley &
Schmidt, 2001; Mason & Lee, 2004). This
has largely occurred because changes in
age structure lead to a divergence between
population growth and growth of the
working age population. The phenomenon
is beginning to work in India as well as we
see an increase in the population growth
within the young cohort since past ten
years (2014 Census Report, Office of
Registrar General of India) and in the
coming years (2017 U.N. Medium of Population Projection). As this occurs, the
demographic dividend may push the per
capita income growth up together with a
positive growth in labor productivity.
India has become, in the last two decade one of the most dynamic and fastest-
growing economies in the world. In less
than twenty years' time, count in between
1982 and 2000, real GDP per capita for the
Indian population, adjusted for purchasing
power parity (PPP) rose – a record
unmatched elsewhere in the world. At the
start of these historical transformations, India's leaders made raising the standard
living of the Indian population its new
political mandate and the basis for
political legitimacy. They accordingly

ISSN 2659-2193 | Volume: 06 | Issue: 02 | 30-09-2020
formulated two basic national policies:
developing the economy and controlling
population growth. The Indian
Government announced its population
policy in 1952, an unprecedented act of
governmental intervention in population.
The rationale for India’s population policy
was a neo-Malthusian 1 perspective on the
relationship between population and development—a view largely dismissed
by mainstream economists.
The focus on India’s Demographic Dividend is motivated by several factors,
the most important being, a latecomer
relative to advanced Western nations and
East Asian economies; India is in the midst
of a major demographic transition. That
transition started about 40 years ago and
will likely last another 30 years.
(1 Neo-Malthusian advocates the present
and future human population planning)
Quantitatively, according to the United Nations report of 2009, India will go
through a huge transition phase in the
years 2010-2040 where almost one quarter
of the increment could be seen in the
global population amongst the age group
15–64 years. Faster economic growth and
development: Indian population is
polygenic and is a unique combination of
mixed races and culture too. The working-
age ratio in the country is set to rise from
about 64 percent currently to 69 percent in 2040, reflecting the addition of just over
300 million working-age adults. This
would make India—by an order of
magnitude—the largest single positive
contributor to the global workforce over
the next three decades.
Hypothetical Forecast of Demographic Dividend
Hypothesis I: The ratio of the working age group on dependents is more relevant
to analyze than those in the non-working
age group.
The combination of a sharp decline in mortality rates and decline in the birth
rates is what that create the demographic
transition and which further creates a
bulge in the population in the younger age
groups. And as time passes, this result
enlarges its share of working-age group
which is in the range of 15-56 years in
general but for India this age group lies in the range of 15–59 years and this would
happen especially when the ‘baby
boomers’ join this group. And hence, the
ratio of depended people gets reduced on
the working population. This expected
decline in the ratio of non-working to the
working population is an indisputable
statistical fact. As all countries undergo
demographic transition at some point or
the other, they experience these changes in
the age structure of their population as
well. However, the positive consequences of this trend are not welcoming which
means that it is not always necessary that
all of the working age groups would be
able to join the work force and contribute
to the national output simultaneously even
though the working age groups in a
population in higher.
Hypothesis II: A finite part of the demographic dividend may not get
materialised even though insufficient
women join the workforce.
There is another source of increase in the working age group which is the female
workforce which is followed by the
decline in the fertility rate. But such an increase does not solely depend on just
having a lower number of children. There
may also be other social, cultural and
economic factors which differ from one
country to another. For example, there are
very low female workers in Spain and Italy
even though these countries have low
fertilely rate. Another example is Sweden,
where the higher rates of women’s
employment are as much as is the higher
fertility rates. Another interesting fact is that in those countries whose slope of
graph of female work participation rate is

ISSN 2659-2193 | Volume: 06 | Issue: 02 | 30-09-2020
in downward stage i.e. U-shaped, where
tan increase in household incomes would
decrease the female workers. After
combining all these theories on women
participation in work, it is rightly said by
some demographers that if women do not
join the workforce, a sizeable part of the
demographic dividend may not get
materialised.
Hypothesis III: The young and the old
age group consume more than they produce, whereas working-age group
thrives to save more.
This is the third critical assumption of the demographic dividend hypothesis
which explains that the positive changes in
the age structure of younger age groups
and the reduction in the dependency ratio
increases saving in the economy. In 1986,
Modigliani’s life cycle hypothesis also
supported this assumption. The life cycle
hypothesis states that the young and the
old age group consume more than they
produce, whereas working-age group thrives to save more. The increased
savings in a house can provide the capital
required for the financial growth. Many
empirical studies on life cycle also
supported this hypothesis.
However, this hypothesis may not always be accepted as the assumption that
the decline in the dependency ratio results
in a higher saving may not hold true in
every situation. For instance, in a country
where most of the working age group in
the population is engaged in low-
productivity agriculture and other
informal activities, the higher saving may not even arise there. Also, higher savings
cannot be seen amongst the middle class
family as their savings may be disturbed
by the high inflation rate and an increasing
cost of education and health care as the
privatization of these services are
increasing days by day. Moreover,
household savings are affected by a
number of other factors like the
availability of financial institutions to
deploy the savings. The expected savings
may not be regulated, if a large part of the
population remains out of the scene
financially.
Hypothesis IV: The increased savings may be automatically invested.
The increased savings may be automatically invested if and only if the
household savings are used productively
used and are not departed away by
unproductive uses like purchase of gold
and land, shares or on other unnecessary
activities. Investment may also be affected
negatively by other factors like the policies related to government regulations,
the availability of infrastructure and the
economic expectations.
Hypothesis V: Demographic transition encourages investments in human capital.
As argued by Bloom in his book on ‘The Demographic Dividend: A New
Perspective on the Economic
Consequences of Population Change’: “a
longer life expectancy causes fundamental
changes in the lifestyle of people. The
angels related to the education, family,
retirement, women’s role, and work all
tend to displace.” As a result of these
changes, parents tend to spend more on the education of their children. Thus, the
working population becomes more
productive as they are younger as well as
more educated and healthier which would
definitely promote higher wages and a
better standard of living. However, none
of the theoretical assumption would ever
prove the impacts of such changes on the
demographic transition to be true and
hence a demand of an empirical
investigation is required. It can now be
concluded that demographic transition encourages investments in human capital.
Hypothesis VI: The supply- side factors are considered and the demand-side
factors are ignored in the demographic
dividend.
As observed by Shankar Acharya in his article on ‘India’s Growth Prospects
Revisited’: The demographic dividend

ISSN 2659-2193 | Volume: 06 | Issue: 02 | 30-09-2020
considers only the labor supply and the
demand side is never considéred. Therein
lay the fact. The extra labor supply creates
the potential for employment and growth.
In a well-running economy with
competitive product and its factor
constructs the demand of labor which
would match supply and hence create
more jobs and output. But such a good results can’t be promised. It all depends on
how well the economy is functioning; and
especially how well labor markets are
working.
Can India Garner the Demographic Dividend?
One may wonder this question anytime whether India can garner the demographic
dividend. There isn’t any guarantee that
the demographic dividend may last long.
A good number of developed countries
like USA, Europe and Japan experienced
low birth rates and low mortality rates in
the 1980s and had ageing populations.
Today India’s most competitive advantage is its demographic dividend. The recent
statistical data on India’s populations
shows that India consists of the population
of working age group form 15-59 years
which largely consists of young cohort
from 15-34 years. This means that India’s
economy has the potential to grow more
rapidly than that of many other countries,
including China. India is passing through
a phase of unrivalled demographic
changes. These demographic changes are
likely to harness the increased labor force in the country. The census projection
report shows that the proportion of
working age population between 15 and
59 years is likely to increase > 64% by
2021. Furthermore, this bulk of increment
is likely to take place in the relatively
younger age group of 20-35 years. The
proportion of youth in India is projected to
peak at 484.86 million in the next ten
years.
Such a trend would make India one of the youngest nations in the world. In
2020, the average Indian will be only 29
years old. Comparable figures for China
and the US are 37, 45 for West Europe,
and 48 for Japan. This ‘demographic
dividend’ provides India with immense
opportunities, but it also comes with some
known challenges. It will benefit India
only if our population is healthy, educated
and appropriately skilled. Therefore,
greater focus on human and inclusive development is necessary to best utilize
the demographic dividend. Let me now
introduce with the statistical data on the
trends of population in different age
groups in India. Table 1 below explains
the major vital statistic in the demographic
Transition happening in India from 1951–
2011.

ISSN 2659-2193 | Volume: 06 | Issue: 02 | 30-09-2020
Table 1: Demographic Transition in India (1951-2011)
Demographic Variable 1951 1961 1971 1981 1991 2001 2011
Crude death rate (CDR)
22.8 19 15 12.5 9.2 7.4 7
Infant mortality rate
(IMR) 148 146 129 110 80 66 44
Crude birth rate (CBR) 41.7 41.2 37.2 33.9 29.5 25.4 21.6
Total fertility rate
(TFR) 6 5.5 5.2 4.2 3.6 3.1 2.4
Population (millions) 361 439 548 683 846 1028 1210
Compound annual growth rate of population
(%) ----- 1.98 2.24 2.23 2.16 1.97 1.64
Life expectancy at birth (years)
39 44.5 49.7 55.5 60.3 63 66.1
(1951
-1956) (1961-
1966) (1970-
1975) (1981-
1985) (1991-
1995) (2000-
2004) (2006-
2010)
Source: Compiled from Census of India reports; Extracted from Singh, A. K. (2016). India’s Demographic Dividend: A Sceptical Look, p. 14.
During the first two decades of post-
independence development, while infant
mortality rates fell significantly, the
fertility rate was more or less stagnant.
This would have increased the population
of young people significantly, merely
because of greater child survival. In the
three decades since then, though the
fertility rate has been declining, the infant mortality rate has fallen quite sharply, with
possibly the same effect. The life
expectancy over the period has recorded
marked improvement, going up from 39
years during 1951–1956 to 66.1 years
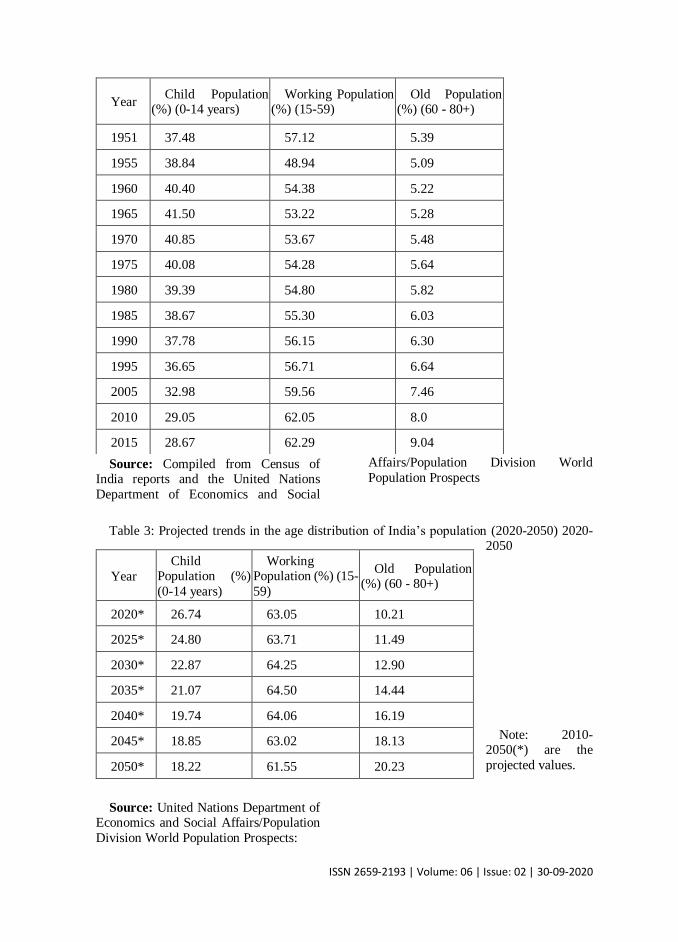
during 2006–2010. Table 2 and Table 3
exhibits the actual trends in the age
distribution of India’s population from
1951-2015 (COI 2015-data) and Projected
trends in the age distribution of India’s population from 2020-2050 (UN 2013-
data) respectively.
Table 2: Actual Trends in the Age distribution of India’s population (1951-
2015)
ISSN 2659-2193 | Volume: 06 | Issue: 02 | 30-09-2020
Source: Compiled from Census of India reports and the United Nations
Department of Economics and Social
Affairs/Population Division World
Population Prospects
Table 3: Projected trends in the age distribution of India’s population (2020-2050) 2020-2050
Source: United Nations Department of
Economics and Social Affairs/Population
Division World Population Prospects:
Note: 2010-2050(*) are the
projected values.
Year Child Population
(%) (0-14 years) Working Population
(%) (15-59) Old Population
(%) (60 - 80+)
1951 37.48 57.12 5.39
1955 38.84 48.94 5.09
1960 40.40 54.38 5.22
1965 41.50 53.22 5.28
1970 40.85 53.67 5.48
1975 40.08 54.28 5.64
1980 39.39 54.80 5.82
1985 38.67 55.30 6.03
1990 37.78 56.15 6.30
1995 36.65 56.71 6.64
2005 32.98 59.56 7.46
2010 29.05 62.05 8.0
2015 28.67 62.29 9.04
Year
Child Population (%)
(0-14 years)
Working Population (%) (15-
59)
Old Population (%) (60 - 80+)
2020* 26.74 63.05 10.21
2025* 24.80 63.71 11.49
2030* 22.87 64.25 12.90
2035* 21.07 64.50 14.44
2040* 19.74 64.06 16.19
2045* 18.85 63.02 18.13
2050* 18.22 61.55 20.23

ISSN 2659-2193 | Volume: 06 | Issue: 02 | 30-09-2020
The demographic data has important implications on the labour market.
According to official data on the Indian
labour force, the labour group in the year
2006 was 472 million, 529 million in 2011
and is expected to be around 653 million
in 2031. It is also predicted that the labour
force will continue to grow and by 2025,
300 million youth would enter the labour force.
The recent statistics reveals the total population of India to be 1.3 billion in
numbers and India accounts for nearly
1/6th of global population. Even though
the growth rate of India’s population
declined consistently, India’s population
increased at its highest peak globally
during 2001-2011 approximately by 180
million in absolute terms. According to the
UNDP population projections in India, the
proportion of working age group will
continue to increase in the coming decades, reaching the peak of 64.5 per cent
in 2035 (Table 3). And more interestingly
this huge increment happening in the year
2035 would also see many developed
countries like Japan and Western
European experiencing a decline in the
proportion of their working age group in
the total population. India will be
contributing 25 per cent of the world’s
new workers in the next decade. Now,
these statistics for sure shows a bright
future of India as we are going to have boom in the working age group of the total
population.
Empirical Estimation of Demographic Dividend
The empirical Estimation of Demographic Dividend focus the impact
of the share of working age ratio on
economic growth and using this
estimation, the economic growth of India
can be analysed using the set of data of
Indian states with different economic
indicators for the specified time periods. In
doing so we will be using the following
equation (1.1) and from this equation we
are going to estimate various
specifications:
Where;
g _ yi,t
is the dependant variable
defined as the annual average growth rate
of per capita income in state i over the
decade beginning in year t.
The main regressors in this equation are:
In is the log of initial per capita income;
In is the log of the initial working age ratio; and
g _ is the average annual growth rate of the working age ratio over the
decade;
Also, in the above Equation,
Xi,t
is a vector of explanatory variables
that might impact steady state labor
productivity;
fi
is a time-invariant fixed effect,
capturing state- specific effects; and
nt
is a time dummy, capturing effects
unique to the decade beginning in year t
Equation (1.1) forms the basis of
mathematical results in conducting the
empirical estimation to estimate the
demographic dividend. Many
international and national demographers
have conducted such empirical estimation
using highly computerized software’s.
Forecasting the Demographic Dividend using Employability prospects of India

ISSN 2659-2193 | Volume: 06 | Issue: 02 | 30-09-2020
In this section, data analysis has been done for the leaders and the laggard states
of India to judge the prospects of
economic development in India. This is
done by analyzing the past performance of
those Indian states which are expected to
experience the largest WAR and a rapid
growth in their WAR in the near future.
The data used in doing so will then judge whether the states will be able to harness
the impending demographic dividend. The
baseline for this analysis will be the latest
National Human Development Report
(2001) by the Planning Commission,
Government of India which will further
analyze the conditions of the policies and
institutions in these particular States on the
basis of the employment and
unemployment data as depicted in Tables
4 and 5. The reason for choosing the
employment data is only because it fits well within those critical policies which
can capitalize the demographic dividend.

ISSN 2659-2193 | Volume: 06 | Issue: 02 | 30-09-2020
Table 4: Age-specific Employment Status in the Selected States
2000 2011
age group (in years)
15-19 20-24 25-29 all (0+) 15-19 20-24 25-29 all (0+)
Leaders
Gujarat 206 454 543 333 213 512 666 384
Karnatak
a 239 417 541 359 138 378 626 376
Kerala 122 333 549 337 90 376 555 363
Tamil
Nadu 286 452 584 382 130 409 561 392
Simple
Average 352.7 378.7
Employment Rate or WPR*
Laggards
Bihar 147 241 377 258 98 310 442 253
Madhya
Pradesh 193 406 523 311 118 324 543 325
Rajastha
n 198 396 536 301 184 375 548 326
Uttar
Pradesh 238 426 483 288 240 393 507 317
Simple
Average 289.5
305.25

ISSN 2659-2193 | Volume: 06 | Issue: 02 | 30-09-2020
Source: NSS 55th and 68th Round Report: Employment Situation in India
*Note: The number of persons/person-days employed per thousand persons/
person-days is known as worker-
population ratio (WPR).
As we can see from Table 4, for the period between 2000 and 2011, the
Leaders states shows an overall of approx
7% increment in its employment rate
while the laggards states shows a mere
increment of 5%. This implies that the rate
of growth of employment is not much
lower in the laggards states as compared to
the leader states in the present era which is
shows the laggard states is in development
stage and one may expect an equality in
both types of states in terms of job market
in the coming decades.
Next, we analyze the table 5, to understand the unemployment pattern
within these states.
Table 5: Age-specific Unemployment Status in the Selected States
2000 2011
States age group (in years)
15-19 20-24 25-29 (15-29) 15-19 20-24 25-29 (15-29)
Leaders
Gujarat 68 72 23 53 34 29 15 24
Karnataka 48 126 37 73 139 157 41 96
Kerala 453 353 164 288 407 256 131 210
Tamil
Nadu 166 141 47 108 95 157 50 95
Simple
Average 130.5 106.25
Unemployment Rate or UR**
Laggards
Bihar 205 283 192 227 280 191 127 178

ISSN 2659-2193 | Volume: 06 | Issue: 02 | 30-09-2020
Madhya
Pradesh 90 121 71 94 136 125 42 83
Rajasthan 143 64 39 74 0 109 27 53
Uttar
Pradesh 109 97 101 102 138 117 91 113
Simple
Average 124.25 106.75
Source: NSS 55th and 68th Round Report: Employment Situation in India
**Note: Unemployment rate (UR) is defined as the number of persons/person-
days unemployed per 1000
persons/person-days in the labour force.
Despite the growth of employment, unemployment rates have also been
increasing, and are now the highest ever recorded. The 1990’s era saw a slight more
of the unemployment rate in the leader
states as compared to the laggards states
but slowly and gradually got stood in the
same position as are the laggards states
and we can see both has a quite similar rate
for the recent year which is apron 106 per
1000 persons. However, few states like
Bihar and UP whose unemployment rates
were also high compared to the other states
still experiencing the same condition until now. This aggregate increase in
unemployment rate also indicates a
declining rate of labour force participation
among the youth, that is the age group 15-
29 years.
It is certainly possible that this decline in labour force participation among the
youth is the result from their delayed entry
into the workforce, partly because they are
extending their years of education or
because as some are actively engaged in
work, others who are unemployed are still
looking for work. If this is a true
description of labour markets in India at present, it has significant implications.
One concern relates to the possibility of
missing the window of opportunity provided by a large young population,
because the economic growth process
simply does not generate enough jobs to
employ them productively. Another
important concern follows from this, in
terms of the negative social impact of
growing numbers of young unemployed.
If the economy does not generate adequate
employment of a sufficiently attractive
nature, the demographics could deliver not
a dividend but anarchy.
The principal problem is that participation in gainful economic activity
is typically less for the labour force in the laggard states than in the leader states. So,
strict actions and timely executions of
policies needs to be implemented by the
state government before the Demographic
Dividend turns into a curse rather than a
gift for India.
CONCLUSION
The age Structure is vital statistics
which plays a very important role in the
expansion of the economic growth of a
country as economic growth is directly
proportional to the increase in the ratio of
the working age population. But such a
growth is possible if and only if a country
has an actively running good policies and
institutions. India is experiencing an unexpected increase in the working age
ratio and this pushes India to experience a

ISSN 2659-2193 | Volume: 06 | Issue: 02 | 30-09-2020
more fast growth. The result and analysis
done in this research paper shows that the
age structure is not homogenous in any of
these states. If the BIMARU2 states
succeed in reforming their economy in a
fruitful and healthy way, then there is no
doubt for India in capitalising its
favourable age structure.
India is in the midst of a grabbing a shining window of opportunity called the
demographic dividend. India ha experienced a significant downfall in its
mortality rates and simultaneously a more
or less stagnancy in its fertility rate during
the first two decades of post-independence
development, which therefore resulted in a
rapid growth in the population of the
young cohort, which was also
complimented with greater child survival
rates. India’s potential to exploit the
dividend thus depends on the result of the
more open, export-oriented strategy adopted by the Indian government.
Today India dose have strategies in order to exploit the demographic window
of opportunity however, the single need is
its implementation. In addition, there
exists some challenges in the education
and health sector as well as India still lacks
to improve the quality of its education and
health system.
2 Abbreviated terms of the leader and the laggard states
All these challenges that the current phase of the demographic transition has
brought needs and extra effort to
overcome over it and India need to focus
on those automatic “gains” which can be
delivered by the demographic dividend.
More specifically, the current liberal and open-door policies in India and the
excessive fiscal prudence need a
replacement by some appropriate policies.
As we have already seen that during the
liberalization years in India, the markets
didn't have any proper policies enplane
which could ensure that these problems
are resolved. And if this continues to be
the case till today, then this can result in
wasting of the opportunities that the
demographic transition phase of India is
temporarily offering today.
ACKNOWLEDGEMENT
This research aims to predict that, on
average, demographic dividend will
adversely influence per capita income
growth in India in the coming decades.
This paper and the research behind it
would not have been possible without the
exceptional support of my Ph.D.
supervisor, Dr. Shreekant Singh. His
enthusiasm, knowledge and exacting
attention to detail have been an inspiration and kept my work on track.
I am also grateful for the insightful comments offered by the anonymous peer
reviewers at Books & Texts. The
generosity and expertise of one and all
have improved this research in
innumerable ways.
REFERENCES
Acharya, Shankar. “India's Growth Prospects
Revisited.” Economic and Political Weekly, vol. 39, no. 41, 2004, pp. 4537–4542. JSTOR, www.jstor.org/stable/4415648.Copy
Aiyar, S., & Mody, A. (2011). The demographic dividend: Evidence from the Indian states. IMF Working Paper No. 11/28. Washington: International Monetary Fund.
Bloom, David E., et al. The Demographic Dividend: A New Perspective on the Economic Consequences of Population Change. 1st ed., RAND Corporation, 2003. JSTOR, www.jstor.org/stable/10.7249/mr1274wfhf-dlpf-rf-unpf
Census of India reports. New Delhi: Office of
the Registrar General and Census Commissioner, http://censusindia.gov.in/
Chandrashekhar C.P., Ghosh, J. & Roychoudhury, A. (2006). The ‘Demographic Dividend’ and young India’s economic future. Economic

ISSN 2659-2193 | Volume: 06 | Issue: 02 | 30-09-2020
and Political Weekly, 41(49), 5055–5064.
Roy, S.K. and Roy, S. (2014) ‘Demographic
Dividend in India: A Synoptic View’, Research paper IJBARR ISSN No. 2347 – 856X.
Gupta, R. (2010) ‘Emerging Demographic and Talent-Pool Challenges: Implications for Outsourcing to India’, MANAGEMENT AND LABOUR STUDIES, p. 267.
National Commission on Population (2006). Population projections for India and states 2001–2026. Report of the Technical Group on Population Projections constituted by the National Commission on Population, Office of the Registrar General and Census Commissioner, New Delhi.
Planning Commission. (2012). Twelfth five year plan. New Delhi: Government of India.
Registrar General of India (2011). Census of India Data (Online). Available at http://censusindia.gov.in/
Kulkarni P.M. (2014). Demographic Transition in India. Office of
Registrar General of India and CSRD, SSN, J.N. University, Government of India, New Delhi.
United Nations. (2009). World population prospects: The 2008 revision. New York: Department of Economic and Social Affairs, Population Division.
World Population Prospects The 2012 Revision. Volume I: Comprehensive
Tables; Department of Economic and Social Affairs, Population Division

ISSN 2659-2193 | Volume: 06 | Issue: 02 | 30-09-2020
DOES CREATIVE TOURISM CONTRIBUTES TO CREATIVE ECONOMY OF A
COUNTRY? A REVIEW OF RECENT RESEARCH
1Preethi Gunaratne, 2Dillina Herath
1IIC University of Technology, Cambodia, 2ESOFT Metro Campus, School of Business
Management, Sri Lanka
[email protected], [email protected]
ABSTRACT
The world economy continues to evolve and the ‘creative economy’ a word coined
by John Howkins is considered a
phenomenon of the 21st century’s economy having both commercial and
cultural value. The creative economy is
made up of ‘creative industries’: art,
culture, design, entertainment, media and
innovation and ‘tourism’ is also
considered one such creative industry. The
term ‘creative tourism’ introduced by
Richards and Raymond is often seen as a
form of or an extension of cultural
tourism. The predominant feature
differentiating creative tourism is ‘active participation’ of travellers in the culture of
the host community in comparison to
cultural tourism that is passive. Though
countries around the world continue to
embrace creative tourism, its contribution
towards a creative economy of a country is
yet to discover. By conducting a
‘systematic review’ of recent papers on
creative tourism, authors of this paper
attempts to assess whether creative
tourism contributes to creative economy.
The specific research questions addressed in this review are; (a) what is the
contribution of creative tourism towards a
creative economy of a country? (b) Which
creative industries facilitate the
development of creative tourism in a
country? The review found that creative
tourism contributes some way to all four
dimensions of a creative economy:
Economic, Social, Cultural and Sustainable development and creative
industries that fall under the UNCTAD
categories of Heritage (traditional cultural
expressions, and cultural sites), Art (visual
art and performing art), and Functional
creations (design) predominantly facilitate
creative tourism development of a
country.
Keywords: Creative Economy, Creative Tourism, Creative Industries
INTRODUCTION
With the recognition of ‘creativity’ as
an economic engine of the twenty-first
century, the phrase ‘creative economy’
coined by Howkins (2001) emerged
demonstrating the relationship between
creativity and economy. The creative
economy is made up of creative industries and tourism is also considered a creative
industry (Richards, 2011). Richards and
Raymond coined ‘creative tourism’ by
establishing the connection between
creativity and tourism (Richards and
Raymond, 2000). Despite the differences
in the definition of creative tourism, many
countries have embraced creative tourism,
both on the world market (Santa Fe, New
Zealand, etc.), the European tourism
market (Creative Austria - creative arts,
crafts and culinary holidays in Austria,

ISSN 2659-2193 | Volume: 06 | Issue: 02 | 30-09-2020
Barcelona creative tourism, Creative
Paris, etc.) and the international
organization Creative Tourism Network.
Though practiced in many countries, the
contribution of creative tourism in the
development of creative economy of a
country and the creative industries
facilitating such a development has not
received much attention from researchers. Therefore, this review tries to bridge this
knowledge gap by reviewing twenty four
research papers published during the
period of 2007 to 2019 to find answers to
two objectives; (a) what is the contribution
of creative tourism towards a creative
economy of a country? (b) Which creative
industries facilitate the development of
creative tourism in a country?
LITERATURE REVIEW
Tourism and its contribution to an
economy
Tourism is one of the fastest growing industries in the world and its strength as
an economic activity and its contribution
towards sustaining the development of
national, regional and local economies is
well recognized (Kärrholm, 2011; Ramos
et al., 2014). Tourism’s contribution to Gross Domestic Product (GDP), direct,
indirect and induced employment
generation, visitor exports and
investments is well documented in annual
reports of World Travel & Tourism
Council (WTTC). Furthermore, Petkovic
Pindzo (2012) reports tourism’s impact as
the main initiator of economic growth,
investments, general improvement in the
society and environmental sustainability
and Richardson (2014) reports tourism’s ability to alleviate poverty and advance
food security.
Emergence of creative economy and
creative tourism
Starting from early 90s the words 'creative' and 'creativity' have gained
tremendous popularity and by now
creativity is considered an economic
engine of the twenty-first century. While
Chartrand (1990) cited in Lindroth et
al.(2007) defines individual creativity as
‘something that occurs when an individual
steps beyond traditional ways of doing,
knowing and making’, Tiemann et al.
(2009) cited in Srbuhi (2016) observes
creativity as having many definitions with many subtle differences, but most of those
definitions centre on newness — the
creation of something new.
The word ‘creativity’ is used in all spheres as cited in Gordin and Matetskaya
(2012); creative city (Landry, 2000);
creative tourism (Richards and Raymond,
2000), creative economy (Howkins,
2001), creative jobs and creative class
(Florida, 2002) and creative industries
(Pratt, 2009). Smith (2005) cited in
Lindroth et al. (2007) discusses the
increasing importance of using creativity in the development of cities and
destinations.
Creative economy
The ‘creative economy’ shows the relationship between creativity and
economics and many definitions are
found; ‘new way of thinking and doing.
The primary inputs are our individual
talent or skill’ (Howkins, 2001); a specific
approach to development of the economy
based on the synergy of economy, culture
and technology (Radović, and Piper,
2016). UNCTAD Report (2008)
recognizes the contribution of creative
economy towards national GDP,
economic diversification, achievement of sustainable development goals, income
generation, job creation, and export
earnings while promoting social inclusion,
cultural diversity and human
development.
Due to the growing importance of the creative economy and its occupations,
certain countries have taken giant strides
in this direction. The examples include;
Thailand launching Creative Thailand
policy in 2009 and creative economy

ISSN 2659-2193 | Volume: 06 | Issue: 02 | 30-09-2020
becoming a priority sector
(Wattanacharoensil & Schuckert, 2014)
and Indonesia forming Ministry of
Tourism and Creative Economy in the
belief that the economy, culture, arts and
heritage are indivisibly connected
(Nirwandar, 2012, cited in Nikica & Piper,
2016). The creative economy is made up
of creative industries and tourism is considered a creative industry (Richards,
2011 p.1; Boston Redevelopment
Authority, 2005).
Creative tourism
Creative tourism demonstrates the relationship between creativity and
tourism.
The concept of creative tourism dates back to 1993 when it was recognized as a
potential form of tourism by Pearce and
Butler though they did not define the term
clearly (Richards, 2011 cited in Siow-Kian
Tan et al. 2013). Though creative tourism
was initially defined as ‘an extension or a
reaction to cultural tourism’ (Richards and
Raymond) or as a form of cultural tourism
(Ohridska-Olson, 2010), many definitions
emerged thereafter.
In 2003, Raymond redefined creative
tourism as a development from cultural tourism, which involves learning a skill on
holiday that is part of the culture of the
country or community being visited; it
offers visitors the opportunity to develop
their creative potential through active
participation in courses and learning
experiences which are characteristic of the
holiday destination where they are
undertaken and UNESCO defined creative
tourism as travel directed towards an
engaged and authentic experience with participative learning in the arts, heritage,
or special character of a place, and it
provides a connection with those who
reside in this place and create this living
culture (UNESCO: Creative Cities
Network, 2006:3).
With regard to the nature of creative tourism, it is not so place-bound as cultural
tourism in general is, because creative
tourism utilizes tourist resources that are
processes in essence – like dances,
singing, crafts, painting, festivals
(Prentice and Andersen, 2003) and is,
therefore, more sustainable in nature than
traditional cultural tourism based on the consumption of built environments
(Richards and Wilson, 2006).
Relationship between creative
economy and creative tourism
Creative economy is all about ‘new way of thinking and doing’ (Howkins, 2001).
Therefore tourism can no longer rely
solely on the traditional tourism products
such as ‘Sun, Sea and Sand’ (3Ss). The
new product opportunities emerges as
creative tourism is considered the ‘next
generation of cultural tourism’. This shift
is necessary and justified from both
tourism demand and tourism supply point
of view.
From the point of view of tourism demand, ‘creative tourists’ are no longer
satisfied with pure observation of cultural spectacles but look for active participation
– they travel to Argentina to learn to dance
tango, to Russia to paint icons, to France
to cook traditional provincial dishes
(Rossitza, & Stanislav, n.d). The visitors
are expecting an opportunity to develop
their creative potential through active
participation in courses and learning
experiences typical of the destination
(Richards & Raymond, 2000). The
‘creative tourists’ seek unique experiences
that bring them closer to the local residents’ way of life and develop
empathic relationships with them
(Prentice & Andersen, 2007; Richards &
Wilson, 2006). The development of
creative, experience-based tourism
products can be regarded as part of ‘new
tourism’, which is a response to changing
tourism demand (Alsos et al. 2014;
Clausena Madsen 2014; Fernandes 2011).

ISSN 2659-2193 | Volume: 06 | Issue: 02 | 30-09-2020
From the point of view of tourism supply, creative tourism is beneficial as
acknowledged by many authors; ability to
meet the desire of tourists for 'experiential
tourism' (Prentice, 2001: 2005; Smith
2006), opportunity for small creative
enterprises to develop new markets and a
creative means of using existing
resources; ability to differentiate and
strengthen identity and distinctiveness of
destinations in saturated markets
(Richards and Marques, 2012).
Duxbury and Richards (2019) observe that creative tourism idea was taken up in
so many places, but they are surprised with
the creative diversity of the different forms
of creative tourism that emerged around
the world as cited in Table 1 below;
Table 1: Practice of Creative Tourism by Regions
Region Country Practices of creative tourism
Australasia New Zealand
Europe
(apparent ‘cradle’ of creative tourism)
Barcelona
Became the inspiration and home base for the international Creative
Tourism Network (CTN)
Asia China Creative districts - 798 Art Zone in Beijing and M50 in Shanghai (Sep,
2015)
Korea ‘Korean Wave’ (Hallyu)
Thailand First creative tourism destination in Asia’ in support of developing creative
economy under the theme ‘Discover
the Other You’
Africa
Mali Range of creative experiences in the village of Siby (Marques, 2012)
The Americas
Santa Fe in New Mexico
Designation of Creative City by UNESCO
Montreal in
Canada
A Guide to Creative Montreal was
published in 2013, bringing together many attractions related to the creative
economy
Latin America Brazil Porto Alegre, launched an extensive series of workshops around local
Gaúcho culture and hosted a major
international conference on creative
tourism (Richards, 2013)
Source: Compiled by Authors

ISSN 2659-2193 | Volume: 06 | Issue: 02 | 30-09-2020
Looking back at last 20 years, they identified four distinct types of creative
tourism; Creative tourism 1.0 (2000) being
active learning experiences developed in a
workshop or more formal learning setting
(Richards and Raymond, 2000); Creative
Tourism 2.0 (2005) being the creation of
destination-based networks, such as
Creative Tourism Barcelona and Creative
Tourism Austria (Couret, 2012); Creative
Tourism 3.0 (2010) being the recognition of growing links between tourism and the
creative industries (OECD, 2014) and
Creative Tourism 4.0 (2015) being
developed by Airbnb in their new
programme of experiences.
Uncontestably tourism industry is a major contributor for national economies
and considered a $3-billiona-day business
(UNCTAD, 2018). It has become a main
source of foreign exchange accounting for
up to 40% of GDP for one-third of
developing countries and one-half of least
developed countries. However, being considered a creative industry, does
creative tourism contributes to a creative
economy of a country? Despite having a
clear answer to this question, the countries
all over the world seem to embrace
creative tourism at different levels;
national, local and rural. Therefore
authors attempt to address this question
based on the papers reviewed.
Link between creative industries and
creative tourism development
The creative economy is made up of creative industries and the Department for
Digital, Culture, Media & Sport (UK)
defines creative industries as ‘those
industries which have their origin in
individual creativity, skill and talent and
which have a potential for wealth and job
creation through the generation and
exploitation of intellectual property’. In naming the specific industries that fall
under creative economy, Howkins (2001)
broadly identified art, culture, design,
entertainment, media and innovation as
relevant sectors. However, both Boston
Redevelopment Authority (BRA) (2005)
and Richards (2011) included ‘tourism’ as
a creative industry. Going one step further,
BRA (2005) tries to establish the specific
link between creative industries and
tourism by seeing them as reciprocal and
further explains the connection stating that tourists provide a potential market for
many creative industries and hence are
revenue generators, and the industries
themselves may also be part of a package
that attracts people to a destination.
Currently there are four different models of the creative industry; UK
DCMS Model, Concentric Circles Model,
UNCTAD Model and Thailand Model
(Wattanacharoensila & Schuckertb,
2014). The UNCTAD (2010)
classification of creative industries is
depicted in Figure 1 below;
Figure 1: UNCTAD Classification of Creative Industries
Source: UNCTAD Report (2010 .p8)

ISSN 2659-2193 | Volume: 06 | Issue: 02 | 30-09-2020
The creative element in tourism refers to the active participation of both tourists
and the local community, encouraged to
share their traditions and customs with
visitors (Hwang, Chi, & Lee, 2016;
Woosnam & Aleshinloye, 2018).
According to Krajnovic and Gortan-Carlin
(2007), the experience gained in creative
tourism represents a sort of ‘mental
souvenir’ for tourists, usable in everyday
life, and as a way of building their identity.
This paper predominantly addresses
Creative Tourism 3.0 (2010) that recognizes growing links between tourism
and the creative industries (OECD, 2014).
Though many studies around the world
provide evidence for such links as
presented in their findings, creative
industries facilitating the development of
creative tourism in support of a creative
economy is scarce. Therefore, this paper
attempts to address the question ‘which
creative industries facilitate the
development of creative tourism in support of a creative economy’?
METHODOLOGY
The authors adopted ‘systematic
review’ approach for the analysis. A
systematic review is defined as a clearly formulated question that uses systematic
and explicit methods to identify, select,
and critically appraise relevant research,
and to collect and analyze data from the
studies that are included in the review
(Cochrane Collaboration, 2014 cited in
Siddaway et al 2019). Systematic reviews
are considered to be a methodical,
replicable, and transparent approach. Prior
to conducting a systematic review, authors
need to decide the ‘type of review’ most
appropriate. There are two types; qualitative and quantitative and the
appropriateness will depend on the nature
and state of the existing literature, research
question(s), and theoretical and empirical
issues. The authors conducted a
‘qualitative review’ as the questions are
open ended. There are two types of
qualitative research synthesis: a narrative
review and a meta-synthesis. A meta-
synthesis or qualitative meta-analysis
(Schreiber, Crooks & Stern, 1997) is
considered appropriate when a review
aims to integrate qualitative research and
synthesize qualitative studies on a
particular topic in order to locate key themes, concepts, or theories that provide
novel or more powerful explanations for
the phenomenon under review (Thorne,
Jensen, Kearney, Noblit & Sandelowski,
2004 cited in Siddaway et al 2019). The
authors used meta-synthesis as the review
aims to synthesize qualitative studies
related to creative tourism.
To conduct systematic review, the authors followed stages cited in Siddaway
et al. (2019). The process started by
identifying clear, specific, and answerable
research questions related to ‘creative economy’ and ‘creative tourism’ and
breadth of the review was confined to 24
articles considering time-constraints. The
authors searched for a similar review
already done in this area but found none.
By familiarizing with the literature,
authors came up with two research
objectives and identified the relevant
concepts with the area of review;
dimensions of creative economy and types
of creative industries. As authors could not
find a criteria originating from previous studies to address research objective 1,
main dimensions of a creative economy
and the sub elements that fall under each
main dimension were borrowed from
UNCTAD Creative Economy Report
(2010, p.23). To address research
objective 2, out of the four frameworks
defining creative industries named above,
UNCTAD (2010) definition of creative
industries cited in Figure 1 was used. The
reasons for selecting this framework is twofold. First reason being its continued
engagement in reporting the creative
industries’ performance worldwide and
the second reason being the need to

ISSN 2659-2193 | Volume: 06 | Issue: 02 | 30-09-2020
maintain consistency between the
frameworks used for the analysis of this
paper (research objective 1 used
UNCTAD definition of the dimensions of
a creative economy).
Thereafter authors considered preliminary inclusion and exclusion
criteria considering research questions
(topic and scope) and time frame and
identified relevant articles using search
terms creative economy, creative tourism and creative industries using electronic
databases. To minimize bias and errors in
the study selection process, articles from
any country adopting creative tourism in
the recent past were considered.
Thereafter Title, Abstract, Discussion and
Conclusion of chosen journal articles were
reviewed and extracted all potentially
relevant information. Tables were
constructed to summarize the findings
with regard to each research objective and results are cited below;
ANALYSIS OF ARTICLES
What is the contribution of creative
tourism towards a creative economy of a
country?
The review of articles related to research question 1 above was conducted using the criteria for creative economy
suggested by UNCTAD Creative
Economy Report (2010, p.23). It
recognizes that creative economy is deeply
rooted in national economies and
identifies four dimensions of a creative
economy; Economic, Social, Cultural and
Sustainable development. The assumption
made by the author is, if creative tourism
is capable of contributing to the
dimensions of a creative economy, the
adoption of creative tourism by national economies can be justified. The outcome
of the analysis follows;
Economic Aspects
An ‘economic’ aspects relate to producing economic and employment
benefits in related services and
manufacturing sectors. The economic
benefits include; promoting economic
diversification, revenues, trade and
innovation and other benefits include; help
reviving declining urban areas, opening up
and developing remote rural areas, and
promoting the conservation of countries’
environmental endowments and cultural heritage (UNCTAD report 2010, p. 23).
Out of the 24 papers reviewed, following
articles confirm the contribution of
creative tourism towards an ‘economic
aspects’ of creative economy.
Jelinčić and Zuvela (2012) study in Croatia found that creative tourism can be
a ‘development driver’ for both cities; one
over-developed with heritage resources
and the other under-developed with
cultural/creative industries. Della Lucia
and Segre (2017) study in Italy identified
tourism as an important driver of ‘local development’ (inter-municipal level)
based on cultural tourism and made-in-
Italy, and innovative paths based on the
co-agglomeration of cultural heritage and
content and information industries.
Kostopoulou (2013) study identifies the
role of historic revitalized urban
waterfronts in becoming a catalysts for
‘urban economic regeneration’. Lee, Wall,
Kovacs and Kang (2016) study in Canada
found the ability to develop creative
economy of ‘rural municipalities’ using culinary tourism-focused strategy.
Wattanacharoensila & Schuckertb (2014)
study in Thailand identified tourism as an
important driver for ‘national level
development’. Rewal (2018) study in
India confirms ability of creative tourism
to ‘uplift the economy’ of the place and
Booyens & Rogerson (2015) study in
Cape Town confirms ‘urban regeneration’
and ‘innovation’ through creative tourism.
Table 2 summarizes the contribution of creative tourism towards an economic
aspects of creative economy.

ISSN 2659-2193 | Volume: 06 | Issue: 02 | 30-09-2020
Table 2: Contribution of creative tourism towards an economic aspects of creative economy
Economic Aspects
Criteria Country Author/s
Promoting economic
diversification
Croatia Jelinčić and Zuvela (2012)
- Kostopoulou (2013)
Thailand Wattanacharoensila & Schuckertb (2014)
Revenues
Thailand
Wattanacharoensila & Schuckertb (2014)
India Sushma Rewal Chugh (2018)
Trade -
Innovation Italy Della Lucia and Segre (2017)
Thailand Wattanacharoensila & Schuckertb (2014)
Cape Town Booyens & Rogerson (2015)
Reviving declining urban areas
Croatia Jelinčić and Zuvela (2012)
- Kostopoulou (2013)
Thailand Wattanacharoensila & Schuckertb (2014)
Cape Town Booyens & Rogerson (2015)
Open up and develop remote rural
areas
Italy Della Lucia and Segre (2017)
Canada Lee, Wall, Kovacs and Kang (2016)
Thailand Wattanacharoensila & Schuckertb (2014)
Promote conservation of
countries’
environmental
endowments and
cultural heritages
Croatia Jelinčić and Zuvela (2012)
- Kostopoulou (2013)
Italy Della Lucia and Segre (2017)
Canada Lee, Wall, Kovacs and Kang (2016)
Thailand Wattanacharoensila & Schuckertb
(2014)
Portugal Carvalho, Ferreira, and Figueira, (2016)
Source: Compiled by Authors
Table 2 above shows that the highest contribution is towards promoting
conservation of countries’ environmental
endowments and cultural heritages
followed by revival of declining urban areas. Promoting economic
diversification, innovation, and opening
up and developing remote rural areas are
other contributions with equal share. The
contribution towards revenue generation is
also observed to a lesser extent. The contribution to trade is not observed as
trade may not be a dimension relevant to
creative tourism as the consumption takes
place at the destination.

ISSN 2659-2193 | Volume: 06 | Issue: 02 | 30-09-2020
Social Aspects
The ‘social’ aspects refer to the contribution towards employment
generation (UNCTAD, 2010, p.24). As
creative industries rely on the creative
inputs (knowledge) and specific skills of
the employees, the contribution of the
creative industries to employment seems
significant and account for around 2 to 8
per cent of the workforce in the economy
depending on the scope of the sector (UNCTAD, 2010, p.24). As a result,
creative industries are a way of boosting
employment. Another aspect of social
dimension is the quality of jobs created by
the creative economy leading to greater
levels of employee satisfaction. Yet
another important social aspect of the
creative industries is its role in fostering
social inclusion. Creative activity is also
considered important for individual health
and psychological well-being (UNCTAD, 2010, p.24). As many women are
employed in creative industries such as art
crafts, fashion-related areas etc. creative
economy can be a catalyst for promoting
gender balance in the creative workforce.
The other social aspects include;
facilitation of greater absorption of some
categories of marginalized talented
workers involved in creative activities into
the formal national economies and
facilitating educational systems in culture
and the arts. Out of the 24 studies
reviewed, following articles confirm the
contribution of creative tourism towards
‘social aspects’ of creative economy.
Bakas et al. (2019) study in Portugal
found the contribution of small-scale art festivals in creating social value by
increasing the host community’s pride and
reinforcing the social fabric of the
festival’s ‘portable’ community in part
through these creative tourism activities.
Macfarland et al. (2019) study in rural
Mexico found community and community
participation as a vital factor for Agro
tourism as the tourists are looking for
novelty by connecting to local people.
Wattanacharoensila & Schuckertb (2014) study in Thailand confirms contribution
towards employment generation. Table 3
summarizes the contribution of creative
tourism towards social aspects of creative
economy.
Table 3: Contribution of Creative tourism towards social aspects of creative economy
Social Aspects
Criteria Country of
origin
Author
Employment generation
India Sushma Rewal Chugh (2018)
Mexico Macfarland et al. (2019)
Canada Lee, Wall, Kovacs and Kang (2016)
Thailand Wattanacharoensila & Schuckertb (2014)
Quality of jobs leading to greater employee
satisfaction
- -
Fostering social inclusion
Portugal Bakas et al. (2019)
- Kostopoulou (2013)
Mexico Macfarland et al. (2019)

ISSN 2659-2193 | Volume: 06 | Issue: 02 | 30-09-2020
Thailand Wattanacharoensila & Schuckertb (2014)
Individual health and psychological well-being
- -
Promoting gender balance
India Sushma Rewal Chugh (2018)
Saint Petersburg Gordin and Matetskaya (2012)
Thailand Wattanacharoensila & Schuckertb (2014)
Facilitation of greater absorption of some
categories of
marginalized talented
workers involved in
creative activities into the
formal national economies
Thailand Wattanacharoensila & Schuckertb (2014)
Facilitating
educational systems in culture and the arts
Thailand Wattanacharoensila &
Schuckertb (2014)
Source: Compiled by Authors
Table 3 shows that creative tourism is capable of contributing towards the social
dimension of a creative economy especially through employment
generation and fostering social inclusion.
Similarly contribution towards promoting
gender balance can be assumed due to high
employment of women in creative
industries such as art crafts. Both
absorption of some categories of
marginalized talented workers and
facilitating educational systems in culture
and the arts are confirmed by the study
from Thailand. However, the contribution
towards balance social aspects cited in Table 3 cannot be confirmed without
evidence.
Cultural Aspects
Culture simply refers to the shared values and traditions that identify a
community or a nation. Cultural activities
give rise to both economic and cultural
value and the latter can provide a
distinctive contribution to individuals, to the economy and to society (UNCTAD,
2010, p.25). The cultural value of identity
at the level of a nation, region, city, town
or community and the role of the creative
industries in promoting cultural diversity
are two important cultural aspects.
UNESCO World Report (2009) examines
cultural diversity in four areas languages,
education, communication and cultural
content, as well as creativity and the
marketplace. Both cultural value of
identity and role of the creative industries in promoting cultural diversity are
observed in majority of studies reviewed.
Table 4 summarizes the contribution of
creative tourism towards cultural aspects
of creative economy.
Table 4: Contribution of creative tourism towards a cultural aspects of creative economy

ISSN 2659-2193 | Volume: 06 | Issue: 02 | 30-09-2020
Cultural Aspects
Criteria Country of origin &
Level of identity
Author
Cultural value of identity
Alqueva Region/ Portugal
Dias-Sardinha et al. (2019)
City level/ Croatia Jelinčić and Zuvela (2012)
National or Regional level/ Republic of
Macedonia
Dimeska (2017)
Inter-municipal level/ Italy
Della Lucia and Segre (2017)
Urban areas Kostopoulou (2013)
City/ Saint Petersburg Valery Gordin and Marina Matetskaya (2012)
National/Thailand Wattanacharoensila & Schuckertb (2014)
Small cities and rural areas/ Portugal
Bakas et al. (2019)
City of Loulé in the region of the Algarve/
Portugal
Carvalho, Ferreira, and Figueira, (2016)
City/Cape Town Booyens and Rogerson
(2015)
City (Bangkok)/ Thailand
Srihirun, and Sawant (2018)
Rural municipalities/ Canada
Lee, Wall, Kovacs and Kang (2016)
Rural/ Mexico Macfarland et al. (2019)
Region/ Portugal Jorge Ramos, Veronika Rosová, Ana Cláudia
Campos (2018)
Himachal Pradesh / India Sushma Rewal Chugh (2018)
Promoting cultural diversity
All countries cited above All the studies cited above
Source: Compiled by Authors
Table 4 shows that creative tourism is capable of contributing towards the
cultural dimension of a creative economy.
The cultural value of identity has the
highest contribution due to the uniqueness
of cultural value of identity irrespective of
whether it is a nation, region, city, town or
community, rural or any other. The role of
the creative industries in promoting
cultural diversity is also applicable to
majority of studies due to the differences
in languages, education, communication
and cultural content, as well as creativity
and the marketplace in each of the studies.
Apart from criteria specified by
UNCTAD, in Table 4, the study of

ISSN 2659-2193 | Volume: 06 | Issue: 02 | 30-09-2020
Carvalho, Ferreira, and Figueira, (2016) in
Portugal reports the contribution of music
festivals (MED festival) in ‘repositioning’
the city as a touristic destination.
Sustainable development Aspects
The contribution of creative industries towards sustainable development is
recognized (UNCTAD, 2010, p.26). The
‘cultural sustainability’ refers to a
development process that maintains all
types of cultural assets, from minority
languages and traditional rituals to
artworks, artefacts and heritage buildings
and sites (UNCTAD, 2010, p.26). One aspect of sustainable development is its
compatibility with rules and objectives of
‘environmental protection and
preservation’ achieved due to usually less
dependence on heavy industrial
infrastructure in creative industries
production. The next aspect of sustainable
development is creative industries’ ability
to offer a vast platform to an ‘ethical
business’. Yet another aspect is
encouraging ‘innovation’ to ensure
sustainability in ethical trade. Out of the
24 studies reviewed, following articles
confirm the contribution of creative
tourism towards ‘sustainable development
aspects’ of creative economy.
Gordin and Matetskaya (2012) study identifies new approaches for creative
tourism development in St. Petersburg as
an important tool for the sustainable
development of the industry. The focus is
on using the creative potential in the sphere of the arts and culture as a basis for
cultural heritage development. The other
studies confirming contribution of creative
tourism through innovation include;
Wattanacharoensila & Schuckertb (2014)
study in Thailand, Booyens & Rogerson
(2015) study in Cape Town and Gordin
and Matetskaya (2012) study in Saint
Petersburg. Table 5 summarizes the
contribution of creative tourism towards
sustainable development aspects of creative economy.
Table 5: Contribution of creative tourism towards sustainable development
aspects of creative economy
Sustainable development
Criteria Country of
origin
Author
Environmental protection and
preservation
Thailand Wattanacharoensila & Schuckertb (2014)
Platform to an ‘ethical business’
Saint Petersburg Valery Gordin and Marina Matetskaya (2012)
Encouraging ‘innovation’
Saint Petersburg Valery Gordin and Marina Matetskaya (2012)
Thailand Wattanacharoensila & Schuckertb (2014)
Cape Town Booyens & Rogerson (2015)
Italy Della Lucia and Segre (2017)
Source: Compiled by Authors
Table 5 shows that creative tourism is capable of contributing towards the
sustainable development aspects of
creative economy. The encouragement of

ISSN 2659-2193 | Volume: 06 | Issue: 02 | 30-09-2020
innovation has the highest contribution
followed by environmental protection and
preservation and platform to an ‘ethical
business’ with lesser contribution.
Which creative industries facilitate creative tourism development in a
country?
The article review related to research question 2 above was conducted using
UNCTAD (2010) classification of creative
industries that recognizes Heritage, Art,
and Functional creations as three of the
main categories of creative industries as cited in Figure 1. The categories of
creative industries facilitating the
development of creative tourism identified
though the review follows;
Heritage
Out of the 24 papers reviewed, most number of creative industries facilitating
creative tourism fall in to the category of
‘Heritage’. UNCTAD classifies heritage
in to two categories; traditional cultural
expressions and cultural sites. Traditional
cultural expressions are of different types
and ‘art crafts’ were used for creative
tourism development in Rewal (2018)
study in India that focuses on art of
pottery, leather craft, embroidered silk handkerchiefs, wooden articles, and
woollen articles; Gordin and Matetskaya
(2012) study in Saint Petersburg focusing
on glassworks, decorative and applied
arts, ceramics and tapestry and St.
Petersburg’s espalier etc; Robert (2014)
study in Mali emphasising promotion of
arts and crafts products, including indigo
and mud dyed cloth, wood carvings, gold
and silver work, and ethnic musical
instruments and Wattanacharoensil & Schuckert (2014) in Thailand focusing on
crafts and weaving.
Both studies of Bakas et al. (2019) and Carvalho et al. (2016) from Portugal,
Booyens and Rogerson (2015) study in
Cape Town and Robert (2014) study in
Mali were based on creative industries
associated with ‘traditional cultural
expressions’ emphasising ‘festivals’ and
included either one or more of the festival
categories; arts, music, culture, history,
urban spaces and social dynamics.
Another set of studies; Srihirun, and Sawant (2018) from Thailand, Lee, Wall,
Kovacs Kang (2016) study from Canada,
Rewal (2018) study from India and
Wattanacharoensil & Schuckert (2014)
study from Thailand focusing on ‘traditional cultural expressions’ were
based on creative industries associated
with ‘culinary tourism’.
Macfarland et al. (2019) study in Mexico used ‘agro tourism’ for
developing creative tourism and the study
of Ramos, Rosová and Campos (2018) in
Portugal used traditional industry of ‘salt
production’. The ‘cultural sites’ category
of heritage were used for creative tourism
development in Dias-Sardinha et al.
(2019) study in Portugal, Jelinčić and
Zuvela (2012) study in Croatia, Dimeska (2017) study in Republic of Macedonia,
Della Lucia and Segre (2017) study in
Italy, Gordin and Matetskaya (2012) study
in Saint Petersburg, Kostopoulou (2013)
study on revitalized urban waterfronts and
the study of Mali by Robert (2014). The
creative industries associated with these
studies used either one or more of heritage
resources, other local resources (natural
and cultural resources), cultural/creative
industries and cultural tourism.
Arts
The next main category of creative industry identified by UNCTAD falls in to
‘Arts’ that are of two types; visual arts and
performing arts. The studies of Rewal (2018) study in India and Gordin and
Matetskaya (2012) study in Saint
Petersburg included painting and
porcelain painting respectively that falls
under ‘visual art’ category. The
performing art category emphasising local
music was found in Rewal (2018) study in
India and Thai boxing, massage and
performing arts classes and lessons in rice

ISSN 2659-2193 | Volume: 06 | Issue: 02 | 30-09-2020
farming, and the Thai language were
found in the study of Wattanacharoensil &
Schuckert (2014) in Thailand.
Functional creations
This is another category of creative industries identified by UNCTAD and
jewellery and doll making in Gordin and
Matetskaya (2012) study in Saint
Petersburg falls in to this category as well.
Table 6 summarizes the creative industries facilitating creative tourism
development based on the analysis above.
Table 6: Creative industries facilitating creative tourism development
Author Country Creative industry
Heritage – Traditional cultural expressions
Sushma Rewal Chugh (2018) India
Art crafts
Gordin and Matetskaya (2012) St Petersburg
Robert Richardson (2014) Mali
Wattanacharoensil & Schuckert (2014) Thailand
Booyens and Rogerson (2015) Cape Town
Festivals
Bakas et al. (2019) Portugal
Carvalho, Ferreira, and Figueira, (2016) Portugal
Robert Richardson (2014) Mali
Srihirun, and Sawant (2018) Thailand
Food (culinary) tourism
Lee, Wall, Kovacs and Kang (2016) Canada
Sushma Rewal Chugh (2018) India
Wattanacharoensil & Schuckert (2014) Thailand
Macfarland et al. (2019) Mexico Agro tourism
Jorge Ramos, Veronika Rosová, Ana Cláudia Campos (2018)
Portugal Salt production (traditional industries)
Heritage - Cultural sites
Dias-Sardinha et al. (2019) Portugal Heritage resources
Other local resources (natural and cultural
resources)
Jelinčić and Zuvela (2012) Croatia Heritage resources
Cultural/creative industries
Dimeska (2017)
Republic of Macedonia
Cultural tourism

ISSN 2659-2193 | Volume: 06 | Issue: 02 | 30-09-2020
Maria Della Lucia and Giovanna Segre (2017)
Italy Cultural tourism
Made-in-Italy
Cultural heritage
Content and information industries
Gordin and Matetskaya (2012) St Petersburg
Cultural heritage
Kostopoulou (2013) - Historic revitalized urban waterfronts
Robert Richardson (2014) Mali Heritage resources, Cultural heritage
Art – Visual arts
Sushma Rewal Chugh (2018) India Painting
Gordin and Matetskaya (2012) St Petersburg
Art – Performing arts
Sushma Rewal Chugh (2018) India local music
Wattanacharoensil & Schuckert (2014) Thailand Performing arts classes and lessons in rice
farming, and the Thai
language
Functional creations
Gordin and Matetskaya (2012) St Petersburg
jewellery, doll making
Source: Compiled by Authors
Table 6 above shows that out of the creative industries identified by
UNCTAD, ‘Heritage’ and ‘Arts’ are
mostly used for creative tourism
development in respective countries.
Irrespective of the country of origin,
creative industries based on Heritage was
used for creative tourism development by
most (58%) of the studies. Within the
Heritage category, under ‘Traditional
cultural expressions’, art crafts, various
types of festivals and culinary tourism were used by 4 studies each and agro and
traditional salt production was used by 1
study each. Under ‘cultural sites’ category
of Heritage, 29% of the studies were found
and heritage resources, cultural tourism
and creative industries were used for
creative tourism development.
Within the ‘Art” category, two studies each were found under both visual arts and
performing arts. Only one study focused
on Functional creations and jewellery, doll
making were cited as creative industries
supporting creative tourism development.
DISCUSSION
The systematic review attempted to achieve two objectives and the findings
relating to each objective are being
presented in the next sections.

ISSN 2659-2193 | Volume: 06 | Issue: 02 | 30-09-2020
Contribution of creative tourism towards a creative economy of a country
The first objective of the review was to ‘assess the contribution of creative
tourism towards a creative economy of a
country’. The assessment was based on
four dimensions of a creative economy;
Economic, Social, Cultural and
Sustainable development suggested by
UNCTAD (2010).
Table 2 summarizes the results of the analysis with regard to ‘economic’
dimension. Out of the criteria used for assessing economic dimension, the
highest economic contribution of creative
tourism is towards promoting
conservation of countries’ environmental
endowments and cultural heritages that
was confirmed by six studies followed by
reviving of declining urban areas was
observed in four studies, promotion of
economic diversification, opening up and
developing remote rural areas and
innovation was confirmed by three studies each. The revenue related information was
found in two studies and no contribution
was found with regard to ‘trade’. Overall,
54% of the studies reviewed show that
creative tourism is capable of contributing
towards an ‘economic’ dimension of a
creative economy.
Table 3 summarizes the results of the analysis with regard to ‘social’ dimension.
Out of the criteria used for assessing the
social dimension, the highest social
contribution of creative tourism is through
employment generation and fostering
social inclusion confirmed by four studies each. Promoting gender balance is the next
social contribution from creative tourism
due to the employment of many women in
art crafts that was observed in three
studies. The facilitation of greater
absorption of some categories of
marginalized talented workers involved in
creative activities into the formal national
economies and facilitating educational
systems in culture and the arts were found
in mere one study each that was focusing
on national development in Thailand.
Though creative tourism may directly or
indirectly contribute to other criteria;
quality of jobs leading to greater employee
satisfaction, and individual health and
psychological well-being, the reviewed
papers do not provide evidence in support
of these criteria. Overall, 54% of the
studies reviewed show that creative tourism is capable of contributing towards
a ‘social’ dimension of a creative
economy.
Table 4 summarizes the results of the analysis with regard to ‘cultural’
dimension. Out of the criteria used for
assessing the cultural dimension,
contribution of creative tourism towards
both criteria; cultural value of identity and
role of the creative industries in promoting
cultural diversity is observed in 62.5%
reviewed papers. The potential of creative
tourism to provide ‘cultural value of identity’ is observed in all levels and areas;
region, city, national, inter-municipal,
urban, rural and so on. Apart from
contribution to dimensions in UNCTAD
criteria, one study from Portugal
confirmed contribution towards
‘repositioning’ the city through music
festivals. Overall, the studies reviewed
show that creative tourism is highly
capable of contributing towards a
‘cultural’ dimension of a creative
economy.
Table 5 summarizes the results of the
analysis with regard to ‘sustainable development’ dimension. Out of the
criteria used for assessing the sustainable
development dimension, encouraging
innovation was confirmed by four studies
especially Gordon and Matetskaya (2012)
study in Saint Petersburg. The
environmental protection and preservation
and becoming a platform to an ‘ethical
business’ was found in mere one reviewed
paper. Overall, 17% of the studies
reviewed show that creative tourism is capable of contributing towards a
‘sustainable development’ dimension of a

ISSN 2659-2193 | Volume: 06 | Issue: 02 | 30-09-2020
creative economy. It is also observed that
‘innovation’ is a criteria common to both
economic and sustainable development
dimensions of creative economy.
Creative industries facilitating creative tourism development
After recognizing the contribution of creative tourism towards a creative
economy, second objective attempted to
identify creative industries facilitating
creative tourism development in support
of creative economy. The identification of
high potential creative industries was based on the UNCTAD classification of
creative industries (Figure 1) and Table 6
summarizes the results of the analysis.
The results show that creative industries falling under three categories are of
particular importance for creative tourism
development irrespective of the country
(destination). Heritage provides the
highest contribution towards developing
creative tourism in a country followed by
Art and Functional creations.
Heritage
Out of the two sub categories of Heritage, ‘traditional cultural expressions’
had the highest contribution for creative
tourism development in their respective
country as 58% of the studies confirmed
its practice and usage of ‘cultural sites’ was confirmed by 29% of the studies.
Under ‘traditional cultural expressions’, ‘art crafts’, festivals’ and ‘culinary
tourism’ were equally popular creative
industries as confirmed by 4 studies each.
The ‘traditional industries’ in a respective
country (e.g. salt production in Portugal)
and ‘agro tourism’ are other traditional
cultural expressions used for creative
tourism development. Under ‘cultural
sites’, ‘heritage resources’ were the most
popular followed by ‘cultural tourism’ and
‘creative industries’.
CONCLUSION
The countries all over the world
continue to embrace creative tourism
either as a means of supporting their
creative economy or for economic
development of the respective country.
But the studies attempting to ascertain
whether creative tourism has the capacity
to contribute towards creative economy of
a country and the creative industries facilitating such contribution are scarce.
This systematic review was conducted to
address these objectives and findings
show the possible contribution of creative
tourism towards a creative economy of a
country and the creative industries
facilitating the contribution.
Tourism being a global industry, this review ignored the boundaries and
through a review of 24 articles from
around over the world, similarities were
observed in terms of both contribution
towards a creative economy of a country and the creative industries facilitating the
creative tourism development. The
findings confirm creative tourism’s
contribution towards following
dimensions and the sub areas of UNCTAD
(2010).
Economic dimension
Promoting conservation of countries’ environmental endowments and cultural
heritages, reviving declining urban areas,
promotion of economic diversification,
opening up and developing remote rural
areas and potential for innovation
Social dimension
Employment generation, fostering social inclusion and promoting gender
balance
Cultural dimension
Cultural value of identity and promoting cultural diversity through
creative industries
Sustainable development dimension
Encouraging innovation

ISSN 2659-2193 | Volume: 06 | Issue: 02 | 30-09-2020
The findings also show the contribution to creative tourism to creative economy
through ‘repositioning’ of the destination.
The findings also confirm the ability of following creative industries in facilitating
creative tourism development;
Heritage
Traditional cultural expressions - culinary tourism, art crafts, festivals
traditional industries, and agro tourism.
Cultural sites: heritage resources, cultural tourism and creative industries
Art - Visual art and performing art
Functional creations - Design
The review expands the knowledge base of the creative tourism field and stimulates
the debate among scholars, by offering
three main contributions.
First, it proposes a substantial view of the existing literature on the topic, by
identifying two main strands of study: one
addressing the dimensions of a creative economy that creative tourism can
contribute to; another identifying the
creative industries capable of facilitating
creative tourism development in support
of creative economy of a country.
Second, the article provides an eye opener for any country that intends to
adopt creative tourism or have adopted
tourism with regard to the dimensions to
emphasize in support of strengthening
creative economy of a country and
creative industries to be nurtured
depending on the heritage, cultural
resources and/or creative industries the country possesses.
Third, review has enabled authors to identify several directions for future
research in the study area; the contribution
of creative tourism towards other sub
elements of economic, social, cultural and
sustainable dimensions of a creative
economy that was not found through the
review, other possible creative industries
that could facilitate creative tourism
development and ability to ‘reposition’
destinations through ‘traditional cultural
expressions’ in support of creative
economy.
Despite few contributions made, limitations cannot be ignored. The main
limitation of this study lies in the analysis
of mere 24 articles around the world due
to time constraints despite tourism being a
global industry. The next limitation is
restricting dimensions of creative
economy and creative industry
classifications to UNCTAD (2010) definitions. The final limitation is the
interpretation of findings of previous
studies by the authors.
REFERENCES
Booyens, I. & Rogerson , C. M., 2015. Creative Tourism in Cape Town: An Innovation Perspective, s.l.: Springer Science+Business Media Dordrecht 2015. [Online] Available at: https://www.academia.edu/12013336/Creative_Tourism_in_Cape_Town
_An_Innovation_Perspective. [Accessed 15 Apr. 2020].
Carvalho, R., Ferreira, A. and Figueira, L. (2016). Cultural and Creative tourism in Portugal. PASOS Revista de turismo y patrimonio cultural, 14(5), pp.1075-1082. [Online] Available at: http://mail.pasosonline.org/Publica
dos/14516/PS516_01.pdf [Accessed 9 Aug. 2019].
Dias-Sardinha, I., Ross, , . D. & Gomes, C. A., 2019. The clustering conditions for managing creative tourism destinations: the Alqueva region case, Portugal. Journal of Environmental Planning and
Management, pp. 1-16. [Online] Available at:
https://ore.exeter.ac.uk/repository/bitstream/handle/10871/35504/artg%20cluster%20alqueva%202rev%20dias%20sardinha%20et%20al%2021fev2017.pdf;jsessionid=3A5626F8D4D1FB9D4CE35920DB00914D?sequence=
2. [Accessed 28 Nov. 2019].

ISSN 2659-2193 | Volume: 06 | Issue: 02 | 30-09-2020
Ernst & Young. (2015). Cultural Times: The first global map of cultural and creative industries. Retrieved August
27, 2016 from http://www.ey.com/Publication/vwLUAssets/ey-cultural-times-2015/$FILE/ ey-cultural-times-2015.pdf
Eva, B. F., Duxbury, N., Remoaldo, P. & Matos, O., 2019. Social utility of small-scale art festivals with creative
tourism in Portugal. International Journal of Event and Festival Management, -(-), pp. 1-22. [Online] Available at: https://estudogeral.sib.uc.pt/bitstream/10316/87362/1/Bakas-Duxbury-Remoaldo-Matos_Festivals [Accessed 28 Nov. 2019].
Greg, R., 2018. Panorama of Creative Tourism Around the World (Panorama do turismo criativo no mundo), s.l.: Seminário Internacional de Turismo Criativo, Cais do Sertão, Recife, Brazil. [Online] Available at: ile:///D:/PhD/PhD/LR/LR%20articles/Creative%20toursim%20related/
Panorama_of_Creative_Tourism_Around_the.pdf. [Accessed 12 Dec. 2019].
Hristina, D., 2017.Creative Tourism as a new paradigm in the development of Cultural Tourism in the Republic of Macedonia. s.l., s.n. [Online] Available at:
https://www.academia.edu/35459006/Creative
_Tourism_as_a_New_Paradigm_in_the_Development_of_Cultural_Tourism_in_the_Republic_of_Macedonia [Accessed 16 Mar. 2020].
Jelinčić, D. A. & Žuvel, . A., 2013. Facing the Challenge? Creative Tourism in Croatia. Journal of Tourism Consumption and Practice , 5(1), pp.
78-90. [Online] Available at: https://pearl.plymouth.ac.uk/handle/10026.1/1
1694. [Accessed 16 Mar. 2020]. Jenasama, S. & Sawant , M., 2018. Creative
Tourism through food activities in Thailand. International Journal of Management and Economics, November , 1(26), pp. 25-31.
[Online] Available at: https://www.academia.edu/4083403
7/Creative_Tourism_through_food_activities_in_Thailand?email_work_card=view-paper [Accessed 17 Mar.
2020]. Kostopoulou, S., 2013. On the Revitalized
Waterfront: Creative Milieu for Creative Tourism. Sustainability , pp. 4578-4593;. [Online] Available at: https://www.mdpi.com/2071-1050/5/11/4578. [Accessed 28 Nov. 2019]
Lee, A. H. J., Wall, G., Kovacs, Kang, S. Y. (2016). Food clusters and creative tourism development: A conceptual framework. The Journal of Rural and Community Development, 11(2), 72-88.
Lindroth Kaija, Ritalahti Jarmo, & Soisalon-Soininen, T., 2007. Creative Tourism
in Destination Development. Tourism Review, Volume 3+4, pp. 53-58. [Online] Available at: https://search-proquest-com.access.library.unisa.edu.au/docview/1012272550/fulltextPDF/3302B53E9CCC4543PQ/19?accountid=14649 [Accessed 28 Nov.2019].
Lucia, M. D. & Segre, G., 2017. Intersectoral local development in Italy: the cultural, creative and tourism industries. International JournaL of Culture, Tourism and Hospitality Research , 11(3), pp. 450-462. [Online] Available at: https://search-proquest-com.access.library.unisa.edu.au/doc
view/1935252825/fulltextPDF/3302B53E9CCC4543PQ/49?accountid=14649. [Accessed 28 Nov. 2019].
Macfarland, A. C. G., Macfarland, H. G. & Thompson, R. R., 2019. Journal of Applied Business and Economics, 21(2), pp. 111 - 116. [Online] Available at: https://search-
proquest-com.access.library.unisa.edu.au/docview/2230818719/fulltextPDF/3302B53E9CCC4543PQ/24?accountid=14649 [Accessed 28 Nov. 2019].
Marco, G. & Giaccone , S. C., 2019. Mapping Creative Tourism Research: Reviewing the Field and Outlining
Future Directions. Journal of Hospitality & Tourism Research,

ISSN 2659-2193 | Volume: 06 | Issue: 02 | 30-09-2020
43(8), p. 1256 –1280. [Online] Available at: https://journals-sagepub
com.access.library.unisa.edu.au/doi/pdf/10.1177/1096348019862030. [Accessed 28 Nov.2019].
Matetskaya, Gordin V., 2012. Creative tourism in Saint Petersburg: the state of the art. Journal of Tourism Consumption and Practice, 4(2). [Online] Available at:
https://www.researchgate.net/publication/265672276_Creative_tourism_in_Saint_Petersburg_the_state_of_the_art. [Accessed 30 May 2020].
Michael, O. C. & Harrington , R. J., 2011. A Case Study of a Culinary Tourism Campaign in Germany: Implications for Strategy Making and Successful
Implementation. Journal of Hospitality & Tourism Research , 37(1), pp. 3-28. . [Online] Available at: http://jht.sagepub.com/content/37/1/3.[Accessed 30 May .2020].
Nácher, J. M. & ToMás, P. S., 2015. Creativity and City Tourism Repositioning: The
Case of Valencia, Spain. CAB International 2015. Destination Competitiveness, the Environment and Sustainability: , pp. 40-50. [Online] Available at: https://www.academia.edu/15208243/Chapter_4_Creativity_and_City_Tourism_Repositioning_The_Case_of_Valencia_Spain?auto=download
. [Accessed 27 Mar. 2020] Nikica, R. & Piper, D. . Č., 2016. Tourism as a
Puzzle in the process of improvement of cretaive economy. SITCON. [Online] Available at: https://www.researchgate.net/publication/309210193. [Accessed 30 May. 2020].
Ramos, J., Rosová , V. & Campos , A. C., 2018. Sunny, Windy, Muddy and Salty Creative Tourism Experience in a Salt Pan. s.l., s.n. [Online] Available at: https://www.academia.edu/40391080/Sunny_Windy_Muddy_and_Salty_Creative_Tourism_Experience_in_a
_Salt_Pan_1_Uma_Soalheira_Ventosa_Lamacenta_e_Salgada_Experi
%C3%AAncia_de_Turismo_Criativo_Numa_Salina?auto=download. [Accessed 27 Mar. 2020]
Rewal, C. S., 2018. Creative Tourism: An Endogenous Approach to Developing Culturally and Environmentally Sustainable Tourism. International Journal of Hospitality & Tourism Systems , 11(1), pp. 60-66. [Online] Available at:
https://www.academia.edu/40487463/Creative_Tourism_An_Endogenous_Approach_to_Developing_Culturally_and_Environmentally_Sustainable_Tourism?email_work_card=view-paper [Accessed 17th March 2020].
Robert, R. B., 2014. The Contribution of
Tourism to Economic Growth and Food Security, Michigan: Researchgate. [Online] Available at: https://www.researchgate.net/publication/254388044_The_Contribution_of_Tourism_to_Economic_Growth_and_Food_Security.[Accessed 22 July 2020]
Rossitza, O.-O. & Stanislav, I., n.d. Creative Tourism Business Model And Its Application In Bulgaria [Online] Available at:
https://papers.ssrn.com/sol3/papers.cfm?abstract_id=1690425. [Accessed 29 Nov.2019]
Saunders, M., Lewis, P. and Thornhill, A. (2016). Research methods for
business students. 7th ed. Harlow: Pearson Education Limited.
Rewal, C. S., 2018. Creative Tourism: An Endogenous Approach to Developing Culturally and Environmentally Sustainable Tourism. International Journal of Hospitality & Tourism Systems ,
11(1), pp. 60-66. Tan, S.-K., Shiann-Far, K. & Ding-Bang, L.,
2013. A Model of 'Creative Experience' in Creative Tourism. Annals of Tourism Research , 41(-), pp. 153-174. [Online] Available at:
https://www.researchgate.net/publication/256
987322_A_model_of_'creative_expe

ISSN 2659-2193 | Volume: 06 | Issue: 02 | 30-09-2020
rience'_in_creative_tourism. [Accessed 25 July. 2019]
Srbuhi, M., 2016. The Influence of Creative
Tourism on Sustainable Development of Tourism and Reduction of Seasonality – , s.l.: Institute o Polytechnic f Leiria.
UNCTAD Creative Economy Outlook and Country Profile Report (2018). [Online] Available at: https://unctad.org/en/PublicationsLi
brary/ditcted2018d3_en.pdf [Accessed 3 Aug. 2019].
Wattanacharoensil & Schuckert , Current
Issues in Tourism (2014): Reviewing Thailand's master plans and policies: implications for creative tourism?, Current Issues in Tourism,
DOI: 10.1080/13683500.2014.882295. [Online] Available at:
http://dx.doi.org/10.1080/13683500.2014.882295 [Accessed 31 May. 2020].
P, S. A., Wood , A. M. & Hedges , L. V., 2019 . How to do a systematic review: A best practice guide for conducting
and reporting narrative reviews, meta-analyses, and meta-syntheses. Annual Review of Psychology . [Online] Available at: https://www.researchgate.net/publication/326910386 [Accessed 3 August 2020].

ISSN 2659-2193 | Volume: 06 | Issue: 02 | 30-09-2020
USE OF INFORMATION COMMUNICATION TECHNOLOGY FOR BUSINESS
MANAGEMENT IN MINING & MINERAL INDUSTRY
1Tharika Chalani Weerakoon, 2Sumith Gamage, 3Sampath Kokila
1Department of Physical Sciences & Technology, Faculty of Applied Sciences,
Sabaragamuwa University of Sri Lanka, 2Managing Director, Aasa IT Solutions, 3Mining
Engineer, GSMB, 2,3Sri Lanka
ABSTRACT
For a business to sustain its functionalities should manage throughout
the lifespan of the business. To facilitate
effectiveness, the technology can assist.
The mining and mineral industry regulated
by Geological Survey and Mines Bureau
(GSMB) is a technologically unattained
industry. It is not easy to track transactions in real-time using manual bookkeeping in
rural, rustic environments. Hence, the
GSMB introduced the Mining & Mineral
Production (mmPro) Monitoring Solution
which can be operated using Web, Mobile
Application and SMS. This solution keeps
records, verifies and validates sand
dispatch data against issued mining
licenses. The pilot started by GSMB
Technical Services (GSMB/TS) at 210
mining sites alone two Mahaweli river
banks closer to Manampitiya Bridge still run with 100% track of all transport
vehicles. The officers of both GSMB and
GSMB/TS now oversee the site that
operates more than 400 lorries at peak.
The use of mmPro has leveraged to
perform better pattern analytics, such as
where the dispatch loads are going, what
are the most demanding days and hours of
the operation. With this initiative, GSMB
has gained the viability to the royalty
payment in real-time. This solution can be
extended to effective queue management
at the sites. With evolution, GSMB can
upgrade mmPro to serve on-demand
orders letting end customers to reserve and receive sand with the fullest reliability
through their own transportation. Hence,
deploying technologies within the mining
and mineral industry increase its calibre
and sustainability as an industry.
Keywords: Business Management, Information Communication Technology,
Mineral & Mining Industry
INTRODUCTION
With the industrial revolution and up
until now business organizations keen on
generating seamless profits and cash
flows. This nature of businesses
continuously ensues from centuries and to
foresee promising profits businesses try to
formulate different strategies and
academia attached to business
management work on researches which introduce effective business management
techniques, concepts and models over the
time. Over this time, science and

ISSN 2659-2193 | Volume: 06 | Issue: 02 | 30-09-2020
technology got evolved and the
technological tools, procedures facilitate
every industry in every kind of economy
across the world. Information
Communication Technology (ICT) is such
advancement in science and with ICT
many industries have gained the best
efficiency and effectiveness in the
industries. ICT has facilitated with variety of technological implementations such as
World Wide Web, Database Management
Systems, mobile technologies, cloud
computing and many more, which boost
and manage the core-business
functionalities of business entities
(Karahan, 2016). Also, it should be noted
that the supportive functions for
businesses are managed as same as the
core functionalities using the ICT.
ICT has influenced in almost every industry, including medical, education,
entertainment and logistics. Moreover, ICT is now considered to be a factor which
make organizations to obtain competitive
edge within rivalry (Chukwunonso and
Ribadu, 2011). In Sri Lankan context,
many industries used and get aid of ICT
effectively. The industries such as
communication, tourism, entertainment
and mass media effectively use ICT. Also,
policy makers encourage other industries
to implement ICT driven tools and
techniques to progress in the business.
Hence, it can be noted that in Sri Lanka there are technically unattained industries
(Gunawardana, 2017).
Mining and Mineral industry is such a technically unattained industry, but the
industry which drives total local
construction projects. Mineral mining for
the construction is very vital and mining
needs to be in very sustainable manner, as
this industry highly correlates and
sensitive with nature. Also the mining and
mineral industry functions in rurality and
rustic environmental conditions where it is
hard to manage ICT facilitated tools and techniques within the industry
(Opensignal, 2020).
Moreover, this industry is much sensitive industry in Sri Lanka which
always holds its business proceedings due
to external environment and as well as
being an industry which closely
interrelated with natural resources, the
sustainability of the both industry and the
nature should be considered. So when
formulating solution from ICT, it should consider all possible factors which drive
the industry. This study was conducted to
acknowledge the stakeholders of mining
and mineral industry about the viability of
implementing ICT based tools and
technologies in businesses for better
management in business functions. During
this study the industry regulatory body,
Geological Survey and Mines Bureau
(GSMB) was took the initiative to
implement Mining & Mineral Production
(mmPro) Monitoring Solution in the sand mining sites in Sri Lanka and this solution
runs over multiple platforms web, mobile,
SMS. This solution records, verifies and
validates sand dispatching records against
the license issued by GSMB. According to
the results from the solution pilot run at
Manampitiya sand mining site, total
business operations at the site was
governed by this application with much
efficiency than that of previous situations
dealing manual systems of record keeping.
LITERATURE REVIEW
Ever since the industrial revolution,
industries evolved with the aid through
different technological eras up to digital
industrial revolution. Variety of industries adopted different technological
advancements in order to gain more
productivity and efficiency. Followed by
industrial revolution during 19th century,
the evolution got hyped to industry 4.0.
Industry 4.0 is encompassing more
advanced ICT driven technologies for
smart internal and external logistics, smart
production mechanisms, smart business
management and marketing and smart

ISSN 2659-2193 | Volume: 06 | Issue: 02 | 30-09-2020
business governance (Tupa and Steiner,
2019). Almost every industry has gone
through or about to go for the industry 4.0.
When considering the industry 4.0,
businesses in different industries adopted
high-end ICT aided systems and
procedures for end to end business process
management. Industry 4.0 encourages
technologies which are into mobile computing, cloud computing and Internet
of Things (IoT) along with more concepts
of data mining, machine learning and
artificial intelligence. E-commerce and
Enterprise Resource Planning (ERP) is a
novel trend in industry 4.0 (Tassel, 2020),
(Jayatilake, Lanka and Withanaarachchi,
2016).
In global context every industry has influenced by industry 4.0, and when the
focus drives to Sri Lankan industries, they
are in verge of embracing the industry 4.0.
Many industries; banking and financing, health, transportation, education,
administration, manufacturing, apparel
and publication have considered to
revolutionized using novel technologies.
The apparel industry of Sri Lanka has
managed to implement the industry 4.0
aspects within the industry and apparel
industry has recognized as one of the
leading industries in Sri Lanka (Jayatilake,
Lanka and Withanaarachchi, 2016).
Furthermore, with industry 4.0 adoption
Sri Lank can gain the leverage to access global leading markets pertaining to each
industry (Island, 2020).
Of all industries in Sri Lanka, mineral and mining industry is the least
technologically exposed industry which
has not accessed the industry 3.0. There
are several reasons for the technological
lagging in this industry. The main reason
is that the geographical locations of
mining sites being rural and rustic.
According to the network coverage in Sri
Lanka, the most rural areas do not have a
proper connectivity for newest technologies. Hence, the technological
exposure within the industry conciliations
and mining and mineral industry is lacking
the technical backup to enhance its
efficiency, effectiveness and
sustainability. The other reason which
creates resistance to the technological
utilization at the industry is the reluctance
towards technological tools within the
direct stakeholder community. The
owners show resistance solely due to the initial capital expenditure for adopting a
technological solution for the business
management. Usually, adopting a such
tools yields many economic advantages
and competitive edge to the business and
hence the owners should be more aware
about the business potentials in use of
technological advancements (Cavalcante,
2013), (Pirzada and Ahmed, 2013).
Moreover, with this mmPro technological implementation GSMB can
foresee sustainable future within mining
and mineral industry. Using this technology will GSMB to eliminate illegal
mining and transportation in the long run,
which contrary enhances the nature and
the habitats of all living organisms.
Execution the mmPro will increase the
transparency in governance at industry as
well.
a. Environmental impact due to
mineral mining
Minerals are considered to be the foundation for the human civilization.
From the ancient times to the modern era,
all aspects attached to civilizations
evolved with the earth and earthy
minerals. The high end machinery,
skyscrapers and most of the technological advancements that can be witnessed
during this period of time are made with
the minerals being raw materials.
The minerals which need for the variety of projects are natural resources and
extraction needs to be carry out. Many
countries engage in mineral extraction and
production while engaging in exporting as
well. Minerals are in different types and
categories such as native elements, oxides,
hydroxides, sulfides, sulfates, carbonates,

ISSN 2659-2193 | Volume: 06 | Issue: 02 | 30-09-2020
phosphates, halides, silicates,
orthosilicates, ring silicates, chain
silicates, sheet silicates and framework
silicates (Queensland, 2020).
When considering the contemporary context in the world, minerals are highly
consumed for variety of reasons. Minerals
are highly inevitable for construction,
energy and metal production as well as for
other industries (MineralsUK, 2020). With
the exponential development in economy around world, mineral consumption also
booming aggressively, meaning that the
mineral extraction and production needed
to be increased as well to match up the
demand (Menzie, 2020), (Menzie, 2009).
Figure 1 - Different mineral consumptions around globe by
Bundesanstalt für Geowissenschaften und
Rohstoffe (BGR) in Hannover [Federal
Institute for Geosciences and Natural
Resources]
Whilst mineral consumption booming
up due to bellicose development of
different industries a major environmental
concerns have emerged. With excessive
natural mineral extraction red alerts are
indicating, that these extractions have
caused adverse environmental
implications. Mining, quarrying,
dredging, drilling and extracting from wells when obtaining minerals impact on
both landscape and environment.
Distruption of land which are suitable for
agriculture, urban and recreational use,
detorioration of immediate environment
via noise and air borne dust, hazardous
outcome for habitants within the habitats
in ore creation sites are several adverse
influences to the nature due to the
exploitative extraction of minerals.
Moreover, mining done on landscapes
may distort the distribution and chemistry of surface and as well as the ground water.
Also due to the acidic nature in mines, the
waters origin form mines will get acidified
and can cause pollution in rivers, streams
and springs. Dredging for ocean minerals
does not cause mechanical pollution, but
results in dispersion of fine sand sediments
and thereby affects on fisheries and wild
life within the habitat. Even the wave
currents and sedimentation patterns get
distorted (Kaya, 2001), (Bauer and Shea, 2020), .
The same situation applies to Sri Lankan mining and mineral industry. Sri
Lankan construction industry shows a
boosting perk due to the contemporary
huge constructions projects happening in
Sri Lankan suburbs. The mining and
mineral industry is directly attached
industry to construction industry, as
mining and mineral industry produces the
all raw materials for the construction
purposes. Mining and mineral industry
predominantly consumes the natural
reserves of minerals for the production of

ISSN 2659-2193 | Volume: 06 | Issue: 02 | 30-09-2020
raw material needed for construction. Due
to the previously mentioned direct
correlation between the construction
industry and mining and mineral industry,
the mineral mining increases as the
construction projects get escalated. When
mineral mining increases exponentially,
the nature is being compromised which
resulting potential ripple effects on human existence and as well as other living
organisms (GWP, 2018). In the Sri Lankan
context, the more tendency towards illegal
extraction and mining happens with sand.
Hence according to the researches due to
this excessive extractions happening in Sri
Lankan rivers, intrusion of sea water to
inland waters, river bank collapses
,riparian land losses have occurred
(Piyadasa, 2009).
Considering all the driven factors within the of mining and mineral industry
a proper governance was an utmost importance. Hence, the governing body
for mining and mineral industry was
incepted by the statutory of Sri Lanka as
Geological Survey and Mines Bureau
(GSMB) (Parliament, 1992). GSMB has
vested with the power of exercising
adequate measures to reduce and mitigate
illegal mining happening all across the
island. As a measure GSMB uses a
licensing approach to track how minerals
are mined, processed and transported
Figure 2 - Mineral Map of Sri Lanka by www.mapsofworld.com
b. Licensing process and
inefficiencies
As mentioned, mining and mineral industry directly correlates with external
environment which fluctuates the stability
of the industry. The stakeholders; general
public, environmental activists draw the
attention towards the unfavorable
circumstances invoked due to illegal
mineral extraction in mining and mineral
industry. The riots and petitions holds the entire process in the industry, resulting the
downfall in the attaching industries as well
(Piyadasa, 2009), (Wickrmasinghe, 2020).
GSMB as the governing body had to pay
more attention toward the sustainable and
smooth functioning in the industry of
mineral mining. As a solution GSMB
introduced a licensing process for mineral
mining and transportation mainly with the
intention to manage the continuous raw
material supply to construction industry and to ensure environment is conserved
with the approach (Parliament, 2009),
(Parliament, 1992).
GSMB issues 3 types of licenses under the Mines and Mineral Act No. 33 of 1992.
The licenses are in types of Exploration,
Mining and Trading and Transport.
Exploration Licenses (EL) grant the
exclusive rights to carry out mineral
explorations. The Mining Licenses (ML)
have three sub-categories as Artisanal,
Industrial and Reserved. The Artisanal
Mining License (AML) grants the
authority to license-holder to mine, process and carry out trading, but all the
activities pre-mentioned only can be done
to the exclusively specified minerals in the
license. Also AML specifies the maximum
area of operations as 10 hectares and depth
of 25m. Furthermore, AML has two
categories as A and B based on the
authorizing criteria. The Industrial Mining
License (IML) provides rights to explore,
mine, process and trade minerals specified
in the license. IML also has three sub-

ISSN 2659-2193 | Volume: 06 | Issue: 02 | 30-09-2020
categories as A, B, and C. The Reserved
Mining License (RML) allows the license
holder to explore, mine, process and trade
reserved minerals with the granted
approval of the Minister. The Trading
License (TDL) grants non-exclusive right
to purchase, store, trade in and can engage
in exporting minerals with a special
authorization of Director. TDL also has 3 types of sub-categories as A, B, and C.
Transport Licenses issued to transport
mineral-bearing substances or minerals
and has a specified quantity and validity
duration. All EL, ML and TDL should
have transport licenses to transport
minerals and the bearing materials
(GSMB, 2020).
Obtaining and maintaining the licensing cycle is a tedious aspect for both GSMB
and the mining site owners. The
processing of licenses general requires
weeks and manual processing takes considerable roll out time. Moreover, even
with the licenses, mining site owners try to
bypass the law and process illegal raw
material supplies to matchup the demand
from the construction industry.
There are several reasons which cause mal-practice and exploitation in GSMB
mineral licensing process. Obtaining a
license for the legal mineral mining and
transportation contains a tedious process
with a considerable amount of lag time.
This demotivates the owners at mineral
mining sites as their investments in the
industry is high and more time means loss of profits. Moreover, GSMB cannot track
instantaneous license details from its
regional offices or headquarters, as the
total licensing process manually managed.
These increase the license exploitations,
illegal mining and ultimately nature is at a
greater unfavorable state. Hence, GSMB
wanted to formulate a solid and sound
process for efficient monitoring and
controlling in mineral and mining industry
(Gamage, Weerakoon and Kokila, 2020). With that intention GSMB developed an
online real-time system Mining & Mineral
Production (mmPro) Monitoring Solution
to manage the licensing process and to
reduce the illegal sand mining in long
term. GSMB first incorporated the mmPro
with sand mining sites as a pilot run.
c. Scope of Requirement for the solution
Concerning the fact that complexity and inefficiency in obtaining and maintaining
licenses which permit exploring, mining,
processing and transportation, GSMB
initiated incorporation of software toolkits
to their operations. This attempt can be considered as inauguration of stepping
into industry 4.0 within the mining and
mineral industry.
According to the GSMB, the solution which intended to develop should meet the
objectives listed below.
1. Tracking and monitoring all types of licenses issued by GSMB should
be effective and thereby, existing licenses
maintenance should be productive to the
organization as well as the license holders.
2. The intended system should interactive with all stakeholders attached
to the mining and mineral industry in the
means of real-time communications and
data exchange, then thereby improve
crowdsourcing for sustainable industry.
3. The retrospective benchmarking
should distinguishably depict the scale of efficiencies in terms of tracking in illegal
mineral explorations, mining,
transportations
4. The curbing within the industry should be smooth and leveraged, so that at
the end the throughput and the profits
should circulate back to general public and
nature.
GSMB’s scope of requirement is very concerned on the above mentioned four
objectives and the solution should readily
provide the expected outcome with quality
being the key factor. The high-level scope
for the system as follows.
1. There should be access controlled user base to handle all license

ISSN 2659-2193 | Volume: 06 | Issue: 02 | 30-09-2020
related transactions within the system. The
users should be clearly defined and
authentication keys and related
mechanisms need to be provided for better
security.
2. The system which intends to develop should be able to track license
oriented data such as license issued date,
license type, license reference number,
license real-time status, license site
information, license-holder information, license capacity, license validity period.
3. After the system deployment the officers at GSMB headquarters and
regional branches should be able to
monitor license oriented transactions and
respond interactively with general public
and police inquiries.
4. Furthermore, system should be centralized and in case of network failures
the transactions should be recorded in
asynchronous approach and once the
network is well established the data should
be synched with the centralized system.
METHODOLOGY OF
EXECUTION
When GSMB stepping towards
achieving first glimpse of industry 4.0 the system implementations had carried out in
methodical manner. Mainly due to couple
of reasons such as the reluctance within
the user base or stakeholders to get into the
digitalization process, initial capital
expenditure crisis for internet and other
hardware infrastructure and furthermore
the need of adequate training within the
user base. Hence, GSMB and the mmPro
development entities followed a strategic
approach to deploy the mmPro within the mining and mineral industry by choosing
the means of pilot running. The pilot run
was initiated basing 3 sand mining sites
and as mentioned in Sri Lanka the most
prominent illegal mining happens with the
sand mining.
Before the mmPro design the feasibility analysis was carried out in order to
understand whether it is profitable to
invest on software system. Here a
benchmark analysis was carried out to
understand the real sand consumption
against the quantity of sand tracked at
GSMB data. Then because of the drastic
difference which derived from the calculation (difference between the
consumption and the supply done with
GSMB is the sand quantity which
marketed untraceably to GSMB), it was
decided to formulate efficient and
effective procedures to trace how minerals
are marketed within the industry.
Followed by the feasibility study, the solution was developed and the developed
solution was deployed in the manner of
pilot run at three sand mining sites. The
sites were chosen considering the capacity
of mining and transporting at every mining site island wide. The site Manampitiya is
considered to be the largest and the
analysis data were obtained from the site
operations. The pilot run was composed of
hands – on workshop of using the mobile
application, limited user pilot for User
Acceptance Testing, bug fix rollout and
steady release.
Figure 3 Pilot run kickoff
The collected data were processed to measure how much efficiency can be
achieved at the mining sites operations and
as well as backend operations with the
introduction of ICT tools; a mobile based

ISSN 2659-2193 | Volume: 06 | Issue: 02 | 30-09-2020
ERP platform for the sites as well as the
back office operations.
Results
Initiation and incorporation of ICT tools within mining and mineral industry of Sri
Lanka has shown tremendous opportunity
of growth and potential to evolve the
industry with industry 4.0.
The data for the analysis were accumulated from the database designated
to the mmPro solution. The data have
accumulated since January 2020 real time
data of the pilot run. This data contains
dispatch data, license data and operational
data related to the mineral mining and transportation. This data also consists of
crowdsourced data which aggregated
through the contribution from general
public and the legal authorities such as
police on checking dispatch legality.
The mmPro solution tracks the license usage and license oriented information in
effective and real time manner where the
officers of GSMB can track the dispatches
very efficiently and effectively.
Table 1 License capacity distribution
license_pref
ix
license_cou
nt
total_capaci
ty
AL/B/KLT 9 250
AL/B/KU 2 50
TDL/B/KU 9 2142
With the data accumulated the GSMB can easily generate the information
regarding the license capacity distribution
where it will be advantageous to back
track the illegal mining in minerals.
Table 2 Load Dispatch
license_prefix load_count total_cubes
AL/B/KLT 22 39.00
AL/B/KU 1 3.00
AL/B/TEST 16 48.00
IML/B/TEST 92 262.10
TDL/B/KU 57 185.00
TDL/B/TEST 30 93.75
Figure 5 show how the load dispatches distributed categorized under the different
license types.
Table 3 Dispatch Load Checks
Check
status
check_cou
nt
load_cou
nt valid_cou
nt
Check
295 124 63
Through the data analysis the from mmPro accumulated data the validity of
each load can be identified.

ISSN 2659-2193 | Volume: 06 | Issue: 02 | 30-09-2020
Table 4 Validity check based on users of mmPro
User Type Check Count
Load Count
Valid Count
Admin 5 2 0
General Public 75 7 0
GSMB License Officer
4 1 0
GSMB Management
12 8 0
Lorry Driver 2 1 0
Mining License Owner
123 55 16
Police Officer 74 50 47
Figure 7 illustrates how the dispatches are being validated by the users attached to
the application.
DISCUSSION & CONCLUSION
As mentioned previously, total Sri
Lankan consumption for minerals, specifically sand is at higher rates that of
supplied by the GSMB. The huge
difference of the demand and supply in
legal terms covered by the illegal mining
of minerals and predominantly causes
several sever impacts to the nature and the
natural habitats of the organisms.
GSMB has incepted with statutory act to maintain the ecosystem attached to the
mineral mining and to ensure that the
industry of mineral mining evolve in
sustainable manner. But with the current
lethargic technologies the business operation management at mineral sites,
GSMB offices are not effective and
efficient, which have compromised the
environmental endangers and illegal
functioning within the industry.
The mmPro is modern technology facilitated application which GSMB
executed to enhance their controlling and
monitoring capacity within their authority
of mining sites, especially to reduce illegal
mining. mmPro incorporation is a striving
step towards achieving industry 4.0 within
the mineral and mining industry, as in the Sri Lankan context this industry is hardly
exposed to the technology and it advanced
tools.
Yet, during the pilot run it did notice that there are burning concerns on
implementing the mmPro, such as
technological barriers and getting
accustomed to change within the work
force. But the results proven that this
approach of monitoring is viable and
effective for proper business management
and governance in mineral and mining
industry.
REFERENCES

ISSN 2659-2193 | Volume: 06 | Issue: 02 | 30-09-2020
Bauer, A. and Shea, E. (2020) Environmental Risks of Mining, Mission 2016 by MIT. Available at:
https://web.mit.edu/12.000/www/m2016/finalwebsite/problems/mining.html.
Cavalcante, S. (2013) ‘Understanding the impact of technology on firms ’ business models’, European Journal of Innovation Management (2013), 16(May 2013), pp. 285–300. doi:
10.1108/EJIM-10-2011-0085. Chukwunonso, F. and Ribadu, M. B. (2011)
‘MANAGEMENT OF INFORMATION TECHNOLOGY FOR COMPETITIVE ADVANTAGE : A SAVVY CASE STUDY’, Journal of Scientific Research, 1(2), pp. 121–129.
Gamage, S., Weerakoon, T. and Kokila, S. (2020) ‘Case Study : A Mobile ERP to Handle Multiple Sand Mining Sites ( Welithota App )’, International Journal of Sciences: Basic and Applied Research (IJSBAR), 50(1), pp. 1–10. Available at:
https://www.gssrr.org/index.php/JournalOfBasicAndApplied/article/view/10923.
GSMB (2020) 5/28/2020 Licenses & Procedures search..., Geological Survey and Mines Bureau. Available at: http://www.gsmb.gov.lk/web/index.php?option=com_content&view=arti
cle&id=100&Itemid=68&lang=en. Gunawardana, K. D. (2017) ‘Current Status of
Information Technology And Its Issues in Sri Lanka’, International Journal of The Computer, the Internet and Management, 15(3), pp. 1–25. Available at: https://www.researchgate.net/public
ation/316383091_Current_Status_of_Information_Technology_And_Its_Issues_in_Sri_Lanka.
GWP (2018) IMPACT STORY Curbing Unregulated River Sand Mining in Sri Lanka, Global Water Partnership. Available at: https://www.gwp.org/globalassets/gl
obal/activities/impact-stories/sri-
lanka-impact-story_final.pdf (Accessed: 20 March 2020).
Island, T. (2020) ‘Industry expert introduces ’
fourth ’ industrial revolution to Sri Lanka’, The Island, pp. 25–26. Available at: http://www.island.lk/index.php?page_cat=article-details&page=article-details&code_title=193483.
Jayatilake, H., Lanka, S. and Withanaarachchi, A. (2016) ‘Industry 4 . 0 in the
Apparel-Manufacturing Sector : Opportunities for Sri Lanka Industry 4 . 0 In The Apparel-Manufacturing Sector : Opportunities For Sri Lanka’, in 1st Interdisciplinary Conference of Management Researchers, At Sabaragamuwa University of Sri Lanka.
https://www.researchgate.net/publication/310466591_Industry_40_in_the_Apparel-Manufacturing_Sector_Opportunities_for_Sri_Lanka.
Karahan, O. (2016) ‘The Impact of ICT-Producing and ICT-Using Industries on Economic Growth in 5th
International Conference on Trade ’, in 5th International Conference on Trade, Business, Economics and Law (ICTBEL2016 (Oxford) Conference Proceedings). FLE Learning, pp. 14–23.
Kaya, M. (2001) ‘Environmental Impacts of Mineral Resource Exploitation and Use’, in 17th International Mining
Congress and Exhibition of Turkey. Available at: http://www.maden.org.tr/resimler/ekler/78c347465f47754_ek.pdf.
Menzie, W. D. (2009) Mineral Supply and Consumption — Searching for Twenty-First Century Balance, Government - University - Industry
Research Roundtable The National Academies. Available at: http://sites.nationalacademies.org/cs/groups/pgasite/documents/webpage/pga_054533.pdf (Accessed: 29 May 2020).
Menzie, W. D. (2020) Global Mineral Consumption, U.S. Department of
the Interior. Available at: https://www.doi.gov/ocl/global-

ISSN 2659-2193 | Volume: 06 | Issue: 02 | 30-09-2020
mineral-consumption (Accessed: 29 May 2020).
MineralsUK (2020) What are minerals ?,
MInera UK Centre for Mineral Development. Available at: https://www.bgs.ac.uk/mineralsuk/mineralsYou/whatAre.html (Accessed: 29 May 2020).
Opensignal (2020) Sri lanka Mobile Network Experience Report - Fabruary 2020. Available at:
https://www.opensignal.com/reports/2020/02/srilanka/mobile-network-experience.
Parliament, S. (1992) AN ACT TO PROVIDE FOR THE ESTABLISHMENT OF THE GEOLOGICAL SURVEY. Parliament of the Democratic Socialist Republic of Sri Lanka.
Available at: http://extwprlegs1.fao.org/docs/pdf/srl91267.pdf.
Parliament, S. (2009) PARLIAMENT OF THE DEMOCRATIC SOCIALIST REPUBLIC OF MINES AND MINERALS ( AMENDMENT ). Parliament of the Democratic
Socialist Republic of Sri Lanka. Available at: https://www.parliament.lk/uploads/acts/english/2664.pdf.
Pirzada, K. and Ahmed, M. (2013) ‘The Effect of New technology on a firm business objective : A Case Study of Pak- Effect of New Technology on Firms Business Objectives : A Case Study
of Pak-Suzuki Company’, International Journal of Business Administration, 4(3). doi: 10.5430/ijba.v4n3p95.
Piyadasa, R. U. K. (2009) ‘River sand mining and associated environmental problems in Sri Lanka River sand mining and associated
environmental problems in Sri Lanka’, in Sediment Problems and Sediment Management in Asian River Basins, pp. 148–153. Available at: https://www.researchgate.net/publication/308786452_River_sand_mining_and_associated_environmental_p
roblems_in_Sri_Lanka.
Queensland, M. (2020) Types of minerals, Queensland Museum. Available at: https://www.qm.qld.gov.au/Find+ou
t+about/Rocks/Types+of+minerals#.XtBWSTozbIU (Accessed: 29 May 2020).
Tassel, L. (2020) Why strive for Industry 4 . 0, World Economic Forum. Available at: https://www.weforum.org/agenda/2019/01/why-companies-should-strive-
for-industry-4-0/. Tupa, J. and Steiner, F. (2019) ‘Industry 4 . 0
and business process management’, TEHNIČKI GLASNIK, 13(December), pp. 349–355. doi: 10.31803/tg-20181008155243.
Wickrmasinghe, K. (2020) ‘Illegal sand mining ; Dismay as sand seeps
through legal system’, Daily Mirror, pp. 1–6. Available at: http://www.dailymirror.lk/news-features/Illegal-sand-mining-Dismay-as-sand-seeps-through-legal-system/131-182672.

ISSN 2659-2193 | Volume: 06 | Issue: 02 | 30-09-2020
THE INFLUENCE OF CUSTOMER PERCEPTION ON LOYALTY TOWARDS AN
ORGANIZATION. A SPECIAL REFERENCE TO THE FMCG AND BANKING
SECTORS IN SRI LANKA
Gopikrishna S
Esoft Metro Campus, School of Business
ABSTRACT
The customer perception is a concept that mainly includes the customer’s
impression, the awareness of the customer
and the consciousness of the customer’s towards the goods and the services
provided by the organization. The paper
mainly investigates how the brand, price,
usability and stability, promotional
activities and the quality of the products
and service influences the customer
loyalty in an organization. The main
problem which is been identified by the
study is the loss of customer base
gradually over the years very specially for
the FMCG sector and the Banking sectors
in Sri Lanka. Keells Pvt Ltd is been selected to delineate the FMCG sectors in
Sri Lanka and Sampath Bank Plc is been
considered in the study to epitomize the
Banking Sectors in Sri Lanka. The study
mainly addresses the factors such as the
price, quality and the promotional
activities which acts as the determinants of
the customer perception as the gap notified
from previous researchers. The study is
been conducted for 300 customers
selected through simple random sampling using pragmatic philosophical stance
along with a deductive approach. The data
are been collected through a mixed
method approach. The study confirms that
the brand, price, usability, quality, and
promotional activities has an impact
towards the customer loyalty within the
firm. The paper is been concluded with
key recommended approaches which mainly includes the modern management
styles and Marketing tactics which are
applicable for most of the organizations
operated in the in the Developing Nations.
Keywords: Perception, Loyalty, Brand, Usability, Stability
INTRODUCTION
The paper hereby mainly investigates
the perceptions of the customers towards
the organizations that they seek services.
The research is been carried out by the
author based on two different types of
service sectors. The major service sectors
are the supermarket chains for the FMCG
products and the banking sectors. The
major examples for the above-mentioned
service sectors are the Keells super for the
supermarket chain and the Sampath bank for the banking sector. The study
conducted clearly provides a brief
understanding regarding the brand and the
loyalty that exist in order to attract the
customer base, the price and the ways how
the price impacts the loyalty for a product
or a service, the usability and the stability
of the products and the services that are
been offered. The promotional activities
that are been carried out by the
organization in order to enchase the
loyalty and the way through which the

ISSN 2659-2193 | Volume: 06 | Issue: 02 | 30-09-2020
quality of the product and the services can
be used as a key elements to attract the
customers. Overall, the influence of
customer perceptions had been very well
analyzed and the influence of the customer
perception towards the customer loyalty is
been well articulated.
Background of Study
Keells Super is one of the leading supermarket chains that is been owned by
the John keels group. The supermarket
mainly trades different types of products
which can be commonly categorized as the beverages, chilled, frozen foods, fruits,
grocery, households, liquors, meat, fish,
vegetables, and home ware. There are
more than 24 million customers on board
with Keells super (Nadarajah, et al., 2014).
There are nearly more than 20
supermarket chains that are available
throughout the nation.
As per Perera (2018), the Sampath bank is one of the leading banking sectors
originated in the year of 1986. The bank
has nearly about 224 branches along with
360 ATM Island wide. There are nearly about 12 super branches available
throughout the island. The bank had been
ranked as the third largest private bank in
Sri Lanka with Rs. 453 billion deposit. The
bank had been rewarded with many of the
unique awards such as the bank of the year
and the national business excellence
award. There are some other unique
features that highlights the brand and the
services provided by the banks such as the
presence of the Sri Lanka auto mated
clearing house, the cheque imagine & truncating, the credit approval system and
the Electronic money transfer.
Research gap
As per Folkes (1988), the product awareness is been considered as one of a
key determinants influencing the customer
loyalty within an organization. The level
of after sales services and the interest put
on by the management towards the
problem analysis are been the factors that
influence the customer loyalty towards an
organization (Parasuraman, et al.,1985).
Xu, et al. (2007), state that the customer
perceived service value in the presence of
the customer satisfaction as the mediating
factor influences the customer loyalty. The
call quality, price structure, mobile
devices, value added services,
convenience in procedure, customer
support, attitude, social influence, switching cost, prior switching behavior,
variety seeking, trust, familiarity and
partnering are been considered as the
factors that determine the customer loyalty
within an organization (Segoro, 2013).
Hence the study conducted clearly concludes the fact that the previous
researchers have failed to analyze the
Brand, Pricing, Usability and the Stability
of the products and the Promotional
activities as the determinants under the
customer perception which influence the
customer loyalty within an organization. Thus, the paper hereby mainly focusses on
the gap identified from the previous
researchers.
Research problem
The empirical study performed on a sample of 25 customers selected from each
FMCG sector and Banking sector clearly
showed that the main problems faced by
the consumers are; lack of innovation
within the firms, price instability within
the firm, least availability of the certain
demanded goods within the firm. The
problems identified have a direct and an
indirect impact over the loyalty of
consumers towards the organization.
Objectives of the study
To identify the impact of the brand towards the customer loyalty in the service
sectors.
To identify the influence of the price
scales for the products and services towards the customers loyalty in the
service sectors
To know the usability of the products and the services towards the customers

ISSN 2659-2193 | Volume: 06 | Issue: 02 | 30-09-2020
loyalty in the service sectors in an
organization
To identify the influence of the promotional activities towards the
customers loyalty in the service sectors in
an organization
Research Question
The study is been based on the identifying the relationship in between the
customer perception and the customer
loyalty within an organization. The
research question is been mainly focused
whether the brand, price margin, usability
and stability, promotional activities of the
product and the services influences the loyalty of the customers within an
organization.
Significance of the study
The research conducted by the author helps the other researchers to get more
knowledge regarding the impact of the
customer perceptions towards loyalty
within FMCG and Banking Sectors in Sri
Lanka. The research findings by the author
will help the existing business and the
other third party business people to know
how the customer’s satisfaction can be
achieved and the ways in which the
organizations can adopt themselves to full
fill the customers’ perceptions and to develop the loyalty of the customers
towards the organization. The research
findings by the author supports the policy
makers and the administrators of Keells
super, Sampath bank to identify the ways
in which the customers can be attracted
and the ways in which those customers
perceptions can be fulfilled and the ways
the organizations can conduct loyalty
programs and customer satisfaction survey
in order to attract the customer and to position their market accordingly.
LITERATURE REVIEW
Introduction
In this research the author clearly had analyzed the impact of the customer’s
perception which mainly affects their
loyalty towards the organization. The
main reason for the research is to find out
the ways how the key elements in the
customer’s perceptions can be improved
and the strategies that can be followed in
order to improve the performance of the
service sectors specially the FMCG and
the banking sector.
Customer’s perception
In line with the Barsky (1992), consumer Perception is a concept that
mainly includes the customer’s impression, the awareness of the customer
and the consciousness of the customer’s
towards the goods and the services
provided by the organization. The
customer perception is considered as one
of the important elements in the current
digital world. The customer perception or
the interpretation that is been created by
the customer towards the goods and
services offered by an organization are
determined by the brand, pricing strategies that are been used by the organization, the
usability of the goods and the services that
are been offered and the promotional
activities that are been carried out to
advertise the products or services (Flavian
& Guinalíu, 2006).
Theory Associated with the organization
The customer perception is been a key determinant in an organization to
benchmark the loyalty of the customers
towards the firm. Upon discussing about
the customer perception, it is been
observed that the most organization within
the sectors identified in the study follows
the application of the dissonance theory. Hence the author hereby through the study
had evaluated the model and the paper
concludes with the most appropriate
strategy that can be implied in place.
Dissonance theory
The theory says that if the consumer seeks for a high value product instead
receives the low value product would

ISSN 2659-2193 | Volume: 06 | Issue: 02 | 30-09-2020
experience a disparity and lead to the
cognitive dissonance. The variance
observed leads to a state of dissonance or
the psychological discomfort. The
adjustment over the perceived disparity
that exist among the individuals can lead
to the reduction over the pressure which is
been built a result of the dissonance
developed. The prevalence of variance in between the expectation of the product and
the performance of the product brings
physiological tension in consumers which
would later be reduced by the consumers
through altering their perception with
respect to the product consumed. The cost
of the products consumed against the
perceived worth of the product by the
individuals acts as the determinant of the
performance.
Major determinants of customer
perceptions
Branding
The brand is the name, term, design, symbol, or other feature that helps to
differentiate an organization or a product
from its competitors in the view of the
customers (Collins,2003). The brand plays an important role in the business,
marketing and advertising. The brand act
as the point which helps to give an
organization a voice, identity, value,
awareness among the consumers. Hosany,
et al. (2006) says that the brand is
considered as the asset of an organization.
The concept of branding mainly involves
different theories. The main theories are
the Brand identity by the organization,
Brand equity and Brand personality. These
elements act as the major key component of the organization when considering
about the branding. As per De Chernatony
(1999), the brand identity is one of the
basic foundation in Branding in which the
organization chooses its design, loo, uses,
color, shape and the other visual elements
for the product, services and the
promotions. The brand image is the result
of the effort, successfulness and the
unsuccessfulness of the brand identity.
The brand equity is another important
concept which mainly specifies the value
premium that is been generated through
the name which can mainly be created
through the memorable, easily
recognizable and superior quality and
reliability of the product or the service
(Aaker, 2009). As per Azoulay & Kapferer (2003), the brand personality act as a
framework that helps an organization to
shape the way the people feel about the
product, services and the mission. The
company’s brand personality elicits an
emotional response in a specified
consumer segment which indirectly leads
the organization to achieve a positive
benefit. The general classifications of the
brand personalities considered by an
organization are excitement, sincerity,
ruggedness, competence and the sophistication.
Pricing
The pricing is been a critical component in marketing as well in the competitive
strategy in determining the performance of
an organization (Hao & Papalexopoulos,
1997). The price is been considered to be
a brim used by both the commercial as
well the industrial customers to judge the
standards and the values of the offerings
and plays a key role in determining the
brands among varied types of alternatives
(Shipley and Jobber, 2001). The pricing
reveals the true worth that the product or
service captures in the real competitive market (Yeoman and McMahon, 2004). In
line with Paul, et al. (2013), the pricing
acts as the key component in the marketing
mix that helps in the inflow of revenue to
the organization and also helps an
organization to come up with quick
decision for varying micro and macro
environmental conditions
(Diamantopoulos, 1991). The company's
functions with respect to the objectives are
multifaceted in that the sustainability of businesses depends on a mixture of
different objectives of pricing (Shipley

ISSN 2659-2193 | Volume: 06 | Issue: 02 | 30-09-2020
and Jobber, 2001). These objectives are
instable which changes over the time due
to various micro and macro environmental
fluctuations. The pricing objectives could
either be supportive or conflictual in
nature. The sales increase vs. market share
increase could be termed to be a
supportive component whereas on the
other hand the sales maximization vs. profit maximization could be termed as the
conflictual component (Myers, et al.,
2002).
Usability
The usability of the product and services are an important element in the
customer perception. The process mainly
includes the evaluation of the product or
service by testing it with the users who
represents the whole consumer segment
where the company seek services (Casalo
& Flavian, 2008). The usability act as the
important key component during the
testing in the internet sector where user
interface and the user experience are very much hard to stimulate during the
development stage of a product or the
services (Adellia & Prasetio, 2016). The
main aim of the usability is to identify the
problems that are been faced by the
consumers related to the individual
products or services. The usability testing
is been mainly done through three main
procedures that is initially the company
develops the usability test plan, recruit the
participant who fits the consumer profile
and finally analyzes and reports the usability test findings (Lidwell, et al.,
2010). In accordance to the Mithas, et al.
(2006), the usability test helps the
organization to identify whether the
participants can complete the tasks
successfully, identify the capability of the
sample audience to adopt to the product or
services, analyses the satisfaction level of
the individual consumers, identify and
analyses the changes that has to be
implemented in order to modify the products and services, analyses the
performance of the products and services
(Dewi & Darma, 2014). The consideration
of usability process helps the organization
to get a clear and a broader picture of the
customer perception towards the
organization and also supports an
organization in evaluating the
performance with respect to the product
and services (Kim & Moon, 1998).
Promotional Activities
The business promotion is a key aspect in an organization through which the
organization communicate with the public
and influence them to buy the product and services that are been offered by the
organization (Liu, 2002). There are
different types of strategies been involved
in the product promotion such as social
media, mail order marketing, product
giveaways, point of sale promotion and
end cap marketing, the customer referral
incentive program, causes and charity,
branded promotional gifts, customer
appreciation events and the aftersales
customer survey (Narasimhan,1988). Regardless of the product and services
offered by an organization, it is necessary
for an entity to have a proper promotional
strategy in order position the products and
services against the other competitors. The
presence of the promotional activities
helps an organization to create a network
of potential customers who view the
organization through different
perspectives. Along with the globalization
the technology implied with internet has
become the present trend among most firms to showcase their promotional
activities in value creation (Van Doren, et
al., 2000). The mail order marketing is a
key promotional tool utilized by many
firms in general; where the loyal
customers are been provided with an
alternative product as an exchange of the
personal information that are been
provided by the customers, hence such
actions helps to create more influence
among the customers to positions the products and services much effectual
manner (Aliata, et al., 2012). Tuten &

ISSN 2659-2193 | Volume: 06 | Issue: 02 | 30-09-2020
Ashley (2011), says that the customer
referral incentives, as a promotional tool
helps the entities to grab new customers
through existing customers. Thus, the
action brings more reliability among the
new customers as the promotion is highly
based on word of mouth. In general, the
presence of an effective promotional tools
within a firm is a depiction of the effective communication process established by the
firm among both the internal and external
stakeholders (Pizarro Milian, 2017).
Customer Loyalty
Dick & Basu (1994) says that the customer loyalty is a process which
includes the positive emotional
experience, physical attributes-based
satisfaction and perceived value of an
experience which mainly includes the
products and services. The customer
loyalty act as the key component to
establish the relationship between
customer and companies, persons,
products or brands. The loyalty of the customer is a depiction of the longevity of
purchase towards the products and
services made by the customers from the
familiar and trusted vendors. The risk of
retaining an existing customer on board is
more than bringing a new customer on
board. The customer loyalty in physical
marketplace is mainly the superior quality
over the service provided and the trust that
is been developed by such services (Gefen,
2002). The customer loyalty is considered
to be a profitable component for an organization; the profitability is thought to
be generated from the reduced servicing
costs, low price sensitivity, gradual
increase over the spending pattern and the
favorable recommendations which ever
been conveyed to the other potential
customers by the these loyal customers
(Hallowell, 1996). With the growth of the
technological era the loyal customers in
the market are been viewed with the aid of
the computerized database technology which provides the detailed analog of the
customer behavior. These techniques at
present are highly been practiced by the
retailors and many other packaged goods
manufacturers which helps those entities
to allocate the appropriate market
resources to attain a maximum return
(Dick & Kunal, 1994). The customer
profitability analysis (Uncles, et al., 2003)
which is been conducted in the modern
corporate era by analyzing the lifetime value of a customer is considered as a
determinant in consumer loyalty
(Kandampully & Suhartanto, 2000).
Loyalty being an important milestone for
varied types of industries in the market;
the loyalty programs had become a vital
topic in the lifecycle of an organization in
order to bring out a defensive move to
protect the existing customer base (Griffin
& Herres, 2002), an offensive approach to
improve the sales (Heskett, 2002), margin
and profit and also to motivate a cross product buying by the prevailing customer
base within an organization (Innis & La
Londe, 1994).
Critical Evaluation of the theory applied to the Customer Perception
Reviewing the application of the Dissonance theory to the customer
perception which is been identified by the
author hereby states that the approach of
dissonance theory assume that the
consumers generally create a perception
that the product mostly get deviated from
the expectation or the effort expenditure
and in such case the cognitive
repositioning become necessary in action. The theory cannot be accepted purely to
the study as the there are many number of
contradictions exists with respect to the
actions of the customers whether the
consumers would engage in the
discrepancy adjustments quoted in the
model as the consumption situation in real
time would vary depending on situations.
For an example the satisfaction is been
termed to be a magnitude and the direction
of the difference in between the customers expectation and the product performance
which affects one’s post decision affect

ISSN 2659-2193 | Volume: 06 | Issue: 02 | 30-09-2020
level. As the customers are no under any
pressures to identify and resolve the
difference that exist in between the
customers expectation and product
performance hence it can be concluded
that the satisfaction or the dissatisfaction is
something which mainly arises through
the recognition and acknowledgment of
dissonance with respective to brand and usability standards of a product and
services rendered.
On the other hand upon looking into the perspective of the model treated to be true
enough, the companies holds a
responsibility to raise the expectation of a
product or a service eventually more than
the product performance in order to obtain
a higher level of an evaluation for the
product or services. The uplift of the
expectations can be made possible through
stressing more on the promotional
activities conducted by the firm, utilizing new pricing strategies to grab more market
share and through new branding strategies
into the play. Upon reviewing most of the
sectors discussed in the paper the
dissonance theory is been applied to hold
the market share and to penetrate more
into the market. But the application of
dissonance theory for an effective
management style is always questionable
as the application of levering the
expectation up can sometime back fire if
the company fails to meet the expectations which ever been raised up through the
branding, promotion and pricing strategies
implied. The application of this type of
practices could result in small
discrepancies to arise most frequently and
thus the accumulated scale of
discrepancies can result in the formation
of a negative evaluation. The model also
fails to consider the ‘tolerance level’ into
the account. Where the application of
tolerance level suggest that the consumers are willing to accept the performance in
range around an estimated point as far as
the range which is been suggested is
reasonably expected. If perceptions of a
brand, price, promotional activities and
usability performance that are close to the
standard (initial expectation) are within
the latitude of acceptable performance and
can then be assimilated to the standard.
The dissonance theory which is been applied and been practiced by most of the
FMCG Sectors and the Banking sectors
fails to complete the explanation which
ever been associated with the customer
satisfaction. Also, the study helps in reaching the understanding and a clarity
over the fact that the expectations
associated with a consumer are never
static and expectations fluctuate
significantly with the consumer
experience. For an instance the
expectations of a consumer before
reaching a FMCG outlet would be
different from the moment the consumer
reaches the outlet and seek the service
from the retail outlet.
RESEARCH METHODOLOGY
Chapter Introduction
In this context the author clearly explains the methods that are been used by
the author to collect the information that
are needed to make the project successful.

ISSN 2659-2193 | Volume: 06 | Issue: 02 | 30-09-2020
Proposed Hypothesis
Upon the analysis it is been hypothesized that the Branding, Pricing,
Usability and Promotional Activities have
a positive impact towards the Customer
Loyalty. To validate the statement, the
below hypothesis are been formulated.
H1: The Branding has a significant influence on customer loyalty to their
preferred FMCG and Banking Sectors
H2: Pricing has a significant influence on customer loyalty to their preferred
FMCG and Banking Sectors
H3: Usability has a significant influence on customer loyalty to their preferred
FMCG and Banking Sectors
H4: Promotional Activities has a significant influence on customer loyalty
to their preferred FMCG and Banking
Sectors
Research Design
In general, the main purpose of a research is been divided into exploration,
explanation and description. The study
conducted by the author mainly focus of the exploration and description research.
The exploration research mainly focusses
on areas which are unexamined or with
varied type interest than the other
researchers. The selection of an
exploration research for the purpose of
analysis in the study is that FMCG and
Banking Sectors are in a growth trends
over the observation for a period of a
decade. Also, on the other hand most of
the researchers have examined the customer perception along with the loyalty
for tobacco industry, ecommerce, hotel
industries etc. There is a limited number of
research are been conducted in the FMCG
and Banking Industry in general. Besides
everything the study conducted also
utilizes the description research as the
approach helps to define the situations and
events. The author selection of the topic
mainly analyses the customer’s perception
on how well the customers are loyal to
their preferred FMCG and Banking
Sectors.
The study is been mainly based on mixed method along with a deductive
approach. The research question is been
based upon deriving the relationship in
between the variables identified. Thus, the
study mainly investigates the pragmatic
philosophical stance. The survey was
conducted based on 150 self-administrated
questionnaires for respondents from both the sectors mainly through physical survey
and least through online survey. The brief
explanation on the objective of the
research will be provided by the
researchers before initiating the survey.
Out of the 300 questionnaires which ever
been circulated only 285 returned. From
285 questionnaires which ever been
returned only 242 questionnaires were
found to be free of response error and was
suitable for the data analysis. The non-probability sampling is been used upon the
collection of data samples. As per the
approach the study was conducted from
the members of the population who ever
are conveniently been available to provide
the necessary information. Due to the high
restrain over the time and cost, this
technique brings more efficiency and
accuracy over the data collection.
Questionnaires were distributed among
the respondents in the Kohuwala,
Kalubowila, Dehiwala-Mount Lavinia, Nugegoda and Wellawatta during both
Weekdays and Weekends. The
questionnaire which is been designed was
being pretested to determine the feasibility
and reliability of the questionnaire. The
pilot test was conducted for 45
respondents. At the time of the pilot test,
the respondents were evaluated through
interviews as well. The pilot test conducts
twice which eventually means that the
respondents must answer the questionnaire twice to test the feasibility
and reliability. The survey results which
ever been collected will be analyzed
through the SPSS Software analysis.

ISSN 2659-2193 | Volume: 06 | Issue: 02 | 30-09-2020
DATA ANALYSIS
The chapter hereby clearly analyses the data that are been collected the by the
author. The quantitative data which ever
been collected by the author are tested for
the validity and the reliability. All kinds of
variables which ever been presented
through the conceptual framework has
been briefly described and analyzed.
Through the analysis performed the results
of the hypothesis are been proved. The
data reduction method is been used for the
purpose of qualitative analysis.
Reliability
Reliability Analysis towards the
Quantitative data analysis
The reliability test was conducted by the author to evaluate the internal consistency
of the measures conducting the aspects of the inter-item consistency reliability
through the aid of the Cronbach’s
coefficient of alpha. The overall summary
of the test that is been conducted are given
in the table below.
Table 5 Reliability Statistics
Reliability Statistics
Cronbach's Alpha
Cronbach's Alpha Based
on
Standardize
d Items
N of Items
.974 .979 5
The reliability test performed shows us
that the composite score generated by the
05 items which are been submitted to the
analysis to be 97.4%. The score value
which is greater than the threshold of 70%
proves that 97.4% of the variance in the score is the true score variance or
internally consistent and reliable variance.
Reliability Analysis towards the
Qualitative data analysis
The Qualitative data is been obtained from consumers who ever seek services
from Sampath Bank and Keells super
outlets around Kohuwala, Kalubowila,
Dehiwala-Mount Lavinia, Nugegoda and
Wellawatta. The consumers were selected
based on non-probability sampling. Semi
structured interviews were conducted for
the selected consumers within a given
time, providing the respondents with an
ethical point of view, thus the respondents are been assured with the high level of
confidentiality over the data collected.
This perspective had eventually resulted
with the valid and the transparent
responses provided in return. In
accordance with Braun and Clarke (2006),
the analysis conducted in a qualitative way
had been concluded through a thematic
way of analysis in which the step by step
sequential approach was followed. The
recognized themes evaluations are been
validated in every individual stage of the approach to ensure a high level of the
validity and the reliability over the
analysis performed. Thus, it can be
assured with respect to the credibility and
reliability over results derived from the
research. It is been made clear that the
results that are been repeatedly been
depicted with the assurance of the
dependability and the consistency. With
accordance to the thematic analysis, the
individual units which ever been responsible for the corresponding
respondent were taken and been shown
separately to each respondent who ever
been considered under the analysis which
allows them to verify the contents. The
results obtained had met the criteria
illustrated by Braun & Clarke (2006) and
the results too successfully accomplished
the indicators stipulated by Lincoln &
Guba (1985) such as credibility,
transferability, dependability and conformability. Thereby proceeding in
continuing the analysis.
Demographic Presentation
The sample clearly shows that most of the purchasing and service seeking is done
by females than the males. The total of the
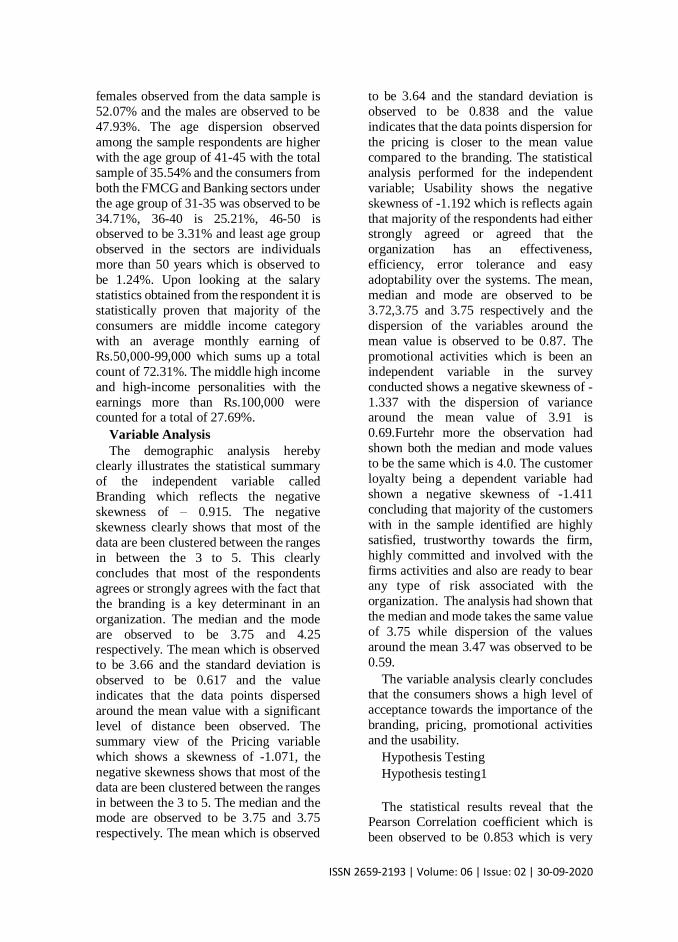
ISSN 2659-2193 | Volume: 06 | Issue: 02 | 30-09-2020
females observed from the data sample is
52.07% and the males are observed to be
47.93%. The age dispersion observed
among the sample respondents are higher
with the age group of 41-45 with the total
sample of 35.54% and the consumers from
both the FMCG and Banking sectors under
the age group of 31-35 was observed to be
34.71%, 36-40 is 25.21%, 46-50 is observed to be 3.31% and least age group
observed in the sectors are individuals
more than 50 years which is observed to
be 1.24%. Upon looking at the salary
statistics obtained from the respondent it is
statistically proven that majority of the
consumers are middle income category
with an average monthly earning of
Rs.50,000-99,000 which sums up a total
count of 72.31%. The middle high income
and high-income personalities with the
earnings more than Rs.100,000 were counted for a total of 27.69%.
Variable Analysis
The demographic analysis hereby clearly illustrates the statistical summary
of the independent variable called
Branding which reflects the negative
skewness of – 0.915. The negative
skewness clearly shows that most of the
data are been clustered between the ranges
in between the 3 to 5. This clearly
concludes that most of the respondents
agrees or strongly agrees with the fact that
the branding is a key determinant in an
organization. The median and the mode
are observed to be 3.75 and 4.25 respectively. The mean which is observed
to be 3.66 and the standard deviation is
observed to be 0.617 and the value
indicates that the data points dispersed
around the mean value with a significant
level of distance been observed. The
summary view of the Pricing variable
which shows a skewness of -1.071, the
negative skewness shows that most of the
data are been clustered between the ranges
in between the 3 to 5. The median and the mode are observed to be 3.75 and 3.75
respectively. The mean which is observed
to be 3.64 and the standard deviation is
observed to be 0.838 and the value
indicates that the data points dispersion for
the pricing is closer to the mean value
compared to the branding. The statistical
analysis performed for the independent
variable; Usability shows the negative
skewness of -1.192 which is reflects again
that majority of the respondents had either strongly agreed or agreed that the
organization has an effectiveness,
efficiency, error tolerance and easy
adoptability over the systems. The mean,
median and mode are observed to be
3.72,3.75 and 3.75 respectively and the
dispersion of the variables around the
mean value is observed to be 0.87. The
promotional activities which is been an
independent variable in the survey
conducted shows a negative skewness of -
1.337 with the dispersion of variance around the mean value of 3.91 is
0.69.Furtehr more the observation had
shown both the median and mode values
to be the same which is 4.0. The customer
loyalty being a dependent variable had
shown a negative skewness of -1.411
concluding that majority of the customers
with in the sample identified are highly
satisfied, trustworthy towards the firm,
highly committed and involved with the
firms activities and also are ready to bear any type of risk associated with the
organization. The analysis had shown that
the median and mode takes the same value
of 3.75 while dispersion of the values
around the mean 3.47 was observed to be
0.59.
The variable analysis clearly concludes that the consumers shows a high level of
acceptance towards the importance of the
branding, pricing, promotional activities
and the usability.
Hypothesis Testing
Hypothesis testing1
The statistical results reveal that the Pearson Correlation coefficient which is
been observed to be 0.853 which is very

ISSN 2659-2193 | Volume: 06 | Issue: 02 | 30-09-2020
much closer to +1.0; shows that the
independent variable has a strong positive
relationship with the dependent variable.
Along with that the observations clearly
shows that the P value observed in the
analysis which is 0.000 is less than the ‘α’
value 0.01, hence it is statistically proven
the branding has a positive effect on the
customer loyalty. The relationship that is been occupied in between the independent
and dependent variable in presentation
through a linear equation of Y = b0 + b1 X
is as below.
Customer Loyalty = 0.457+0.822(Branding). (1)
Table 6 Model Summary of Branding Vs. Customer Loyalty
Model Summary
Model
R R Square
Adjusted R Square
Std. Error of the
Estimate
1 .853a
.727
.726 .31158
a. Predictors: (Constant), Branding
Table 7 Coefficient Breakdown of Branding Vs. Customer Loyalty
Coefficientsa
Model Unstandardized
Coefficients
Standard
ized
Coeff
icient
s
t Sig.
B Std.
Error
Beta
1 (Constant
)
457 .121 3.785
.00
0
Branding
.822
.033 .853 25.27
4
.000
a. Dependent Variable: Customer Loyalty
Hypothesis testing 2
Pearson Correlation coefficient which is been observed to be 0.898 which is very
much closer to +1.0; shows that the
independent variable has a strong positive
relationship with the dependent variable.
Along with that the observations clearly
shows that the P value observed in the
analysis which is 0.000 is less than the ‘α’
value 0.01, hence it is statistically proven
the Pricing has a positive effect on the
customer loyalty. The relationship that is
been occupied in between the independent and dependent variable in presentation
through a linear equation of Y = b0 + b1 X
is as below.
Customer Loyalty = 1.15 +0.637(Pricing) (2)
Table 8 Model Summary of Pricing Vs. Customer Loyalty
Model Summary
Mod
el
R R Squa
re
Adjusted R
Square
Std. Error of
the Estimat
e
1 .898a
.806
.805 .26259
a. Predictors: (Constant), Pricing
Table 9 Coefficient Breakdown of Pricing Vs. Customer Loyalty
Coefficientsa
Model
Unstandardized
Standardi
zed
t Sig.

ISSN 2659-2193 | Volume: 06 | Issue: 02 | 30-09-2020
Coefficien
ts
Coef
ficie
nts
B Std. Erro
r
Beta
1 (Consta
nt)
1.150
.075 15.2
63
.00
0
Pricin
g
.63
7
.020
.898
31.
58
0
.00
0
a. Dependent Variable: Customer Loyalty
Hypothesis Testing 4
Pearson Correlation coefficient through statistical analysis was observed to be
0.956 which is very much closer to +1.0;
shows that the independent variable has a
strong positive relationship with the
dependent variable. Adding to that the P
value observed in the analysis was 0.000
which is less than the ‘α’ value 0.01, hence
it is statistically proven the Promotional
Activity has a positive effect on the
customer loyalty. The relationship that is
been occupied in between the independent and dependent variable in presentation
through a linear equation of Y = b0 + b1 X
is as below.
Customer Loyalty = 0.267+0.819 (Promotional Activity) (4)
Table 10 Model Summary of Promotional Activities Vs. Customer
Loyalty
Model Summary
Model
R R Squar
e
Adjusted R
Square
Std. Error of
the Estimate
1 .95
6a
.914 .913 .17519
a. Predictors: (Constant), Promotional Activities
Table 11 Coefficient Breakdown of Promotional Activities Vs. Customer
Loyalty
Coefficientsa
Model Unstandardized
Coefficien
ts
Standard
ized
Coef
ficie
nts
t Sig.
B Std.
Err
or
Beta
1 (Constant)
.267
.064
4.1
46
.00
0
Promotion
al
Activiti
es
.819
.016
.956
50.
3
9
7
.00
0
a. Dependent Variable: Customer Loyalty

ISSN 2659-2193 | Volume: 06 | Issue: 02 | 30-09-2020
DISCUSSION AND CONCLUSION
Introduction
This research was set to find out the
impact of customer perception on loyalty towards the organizations. A special
reference to the service sectors in Sri
Lanka. The study was mainly done in two
main organizations. The one is the
Sampath bank representing the banking
sector and the Keells super representing
the FMCG sector. Initially the research
regarding the customer perception by the
previous research were studied properly
with the help of the previous literature.
The findings clearly explains us that the management of the Keells super and the
Sampath bank has to properly restructure their functions in a way such that they give
importance to the brand of the
organization, the usability of the products
and the services, the pricing of the services
offered and the promotional activities that
are been followed by the organization. The
customer’s expectations are not static, the
expectation changes depending on the
experience earned by the consumers. It is
a primary duty of an organization to
understand the pulse of the customers and
act accordingly. The branding of the organization must be revised minimal by
every quarter. The study clearly confirms
that the majority of the sample
respondents mainly look into the
determinants such as product market
characteristics, firm-based characteristics
and underlying market dynamics to
evaluate the branding in an organization
which finally influence the loyalty of the
customers towards the organization. Also,
the study proves that the usability being a component considered under the customer
perception plays an important role in
determining the loyalty of the customers.
The usability in general benchmarked by
the consumers through the easiness over
the adoptability of the practices, error
tolerance, effectiveness and efficiency of
the systems involved. Pricing being a
factor under marketing mix plays a major
role in grabbing the attention of the
consumers. The variability in prices,
demand of the market and the government
regulations are some common
consideration taken into account by the
consumers to seek out the product and
services from a defined entity. The study
too has concluded that the promotional activities through the determinants such as
the buyer readiness to seek the goods and
services, presence of varied types of
promotional tactics by consumers reflects
their loyalty towards an organization.
Finally, the study has evaluated the
customer loyalty through the satisfaction,
trust, commitment, and involvement of the
consumers along with the perceived risk
involved with the purchase. The
management theory (dissonance theory)
which is been practiced by both the Keells Super and Sampath Bank are lack with
agility. The theories are not well adoptive
to the changing interest of the consumers.
The study had finally proved that the
branding, pricing, promotional activities,
and the usability influence the customer
loyalty positively and hence the objectives
of the research hereby are successfully
been achieved.
RECOMMENDATIONS
To rebuilt and develop customer loyalty
towards the firms, the both the Keells and
Sampath bank must focus more towards
the branding and promotional activities
along with the new management theory to
be put in place.
Upon looking into the branding, the management of both the Sampath Bank
and Keells Super needs to focus more on
revising the branding strategy. On
overview it is been observed most
common branding tactics used by keells is
Brand extension where the focus of the
company is to produce new products under
the same brand. The practice can be

ISSN 2659-2193 | Volume: 06 | Issue: 02 | 30-09-2020
changed by shifting the focus into new
products with new brands which even
makes the consumers to feel new upon
looking into the products or services.
Hence to bring a refreshment over the
traditional approaches there must be a
change needed in the strategies in place.
Rather focusing more on pricing and usability which are considerably on the
safe zone for the period, the importance
needs to be given more on promotional activities conducted. The Keells needs
much more focus over diversifying the
promotional strategies focusing more on
running up promotional campaigns along
with online marketing. Adding to that in
case of Keells utilizing the application
platform to reach out customers can result
in bringing more customers on board as
the global trend is been progressing to the
application era.
Upon looking at the general management theory approach practiced by
the firms, it is been critically evaluated that presence of dissonance theory within
the management is considered to be
ineffective due to the primary reason that
the theory closes the boundaries of
changes and give a common framework
for all situations rather treating each and
every situation differently and also the
theory fails to consider the possibility of
changes related to the customer
expectation. In case of FMCG sector and
the Banking sector it is been
recommended to apply the Expectancy Disconfirmation Paradigm (EDP) as the
framework to assess the customer
satisfaction. The model mainly implies
that the purchase made by the consumers
are with the pre purchase expectations
about the anticipated performance. The
expectation level of these consumers
becomes a standard in which the product
is been judged. The outcomes yielded by
either the product or services are been
compared against the expectation. Hence the theory investigates the expectation and
perceived performance the theory can
buffer the expectation changes of the
customer with varying experiences.
REFERENCES
Aaker, D. A., 2009. Managing brand equity.
Simon and Schuster, pp. 121-135. Abratt, R. & Pitt, L. F., 1985. Pricing practices
in two industries. Industrial Marketing Management, 14(4), pp. 301-306.
Adellia, N. & Prasetio, A., 2016. Customer perception mapping analysis of Indonesian e-commerce marketplace
sites based on attributes usability, site design, information quality, trust, and empathy (Case study of Tokopedia, Bukalapak, Elevenia, Qoo10, and Rakuten).. 4th International Conference on Cyber and IT Service Management, pp. 1-7.
Aliata, V. L. et al., 2012. Influence of promotional strategies on banks
performance. International Journal of Business, Humanities and Technology, 2(5), pp. 169-178.
Amaranayake, R., 2017. An Automated Guidance for Supermarket Consumers: Supermarket e Helper., Colombo : VG Printers (Pvt) Ltd.
Amin, K. I., 2008. Pricing options on risky
assets in a stochastic interest rate economy. In Financial Derivatives Pricing: Selected Works of Robert Jarrow, pp. 327-347.
Association, A. M., 2016. Building Employee Confidence , New-York : s.n.
Azoulay, A. & Kapferer, J. N., 2003. Do brand personality scales really measure
brand personality?. The Journal of Brand Management,, 11(2), pp. 143-155.
Barsky, j. d., 1992. Customer satisfaction in the hotel industry: meaning and measurement. Hospitality Research Journal, 1(51-73), p. 16.
Braun, V. & Clarke, V., 2006. sing thematic
analysis in psychology. Qualitative research in psychology, 3(2), pp. 77-101.
Casalo, L. & Flavian, C., 2008. The role of perceived usability, reputation, satisfaction and consumer familiarity on the website loyalty

ISSN 2659-2193 | Volume: 06 | Issue: 02 | 30-09-2020
formation process. Computers in Human behavior, 24(2), pp. 325-345.
Cebollero, C., 2014. Type of motivation.
IV(http://www.leadership-central.com/types-of-motivation.html#axzz4VnlaBGTS), pp. 10-16.
Cherry, K., 2016. Intrensic Motivation. Volume IV, pp. 24-32.
Collins, D., 2003. The branding of management knowledge: rethinking
management. Journal of organizational change management, 16(2), pp. 186-204.
De Chernatony, L., 1999. Brand management through narrowing the gap between brand identity and brand reputation. Journal of marketing management, 15(1-3), pp. 157-179.
Dewi, C. R. & Darma, G. S., 2014. Website Usability, Satisfaction, Loyalty, Security Perception, Trust And Word Of Mouth In E-Commerce Business.. Journal Management Business, 11(2), pp. 1-30.
Diamantopoulos, D., 1991. Pricing: theory and evidence – a literature review.(Eds)
Perspectives on Marketing Management,, Chichester: Wiley.
Dick, A. S. & Basu, K., 1994. Customer loyalty: toward an integrated conceptual framework. Journal of the academy of marketing science, 22(2), pp. 99-113.
Dick, A. S. & Kunal, B., 1994. Customer Loyalty: Toward an Integrated
Conceptual Framework. Journal of the Academy of Marketing Science, 22(2), pp. 100-110.
Dinar, A., 2017. The relative efficiency and implementation costs of alternative methods for sampath bank , Colombo: VG Printers (Pvt) Ltd.
Dolan, R. J. & Jeuland, A. P., 1981. Experience
curves and dynamic demand models: Implications for optimal pricing strategies. The Journal of Marketing, pp. 52-62.
Enabou, R. B., 2003. Volume 70, pp. 489-503. Flavián, C. & Guinalíu, M., 2006. Consumer
trust, perceived security and privacy policy and other basic elements of
loyalty. Industrial Management & Data Systems, 106(5), pp. 601-620.
Folkes, V. S., 1988. Recent attribution research in consumer behavior:A review and new directions. Journal of consumer
research, 14(4), pp. 548-565. Foundation, R. I. S. o. B., 2015. Ivey business
journal. IV(12), pp. 35-50. Gefen, D., 2002. Customer loyalty in e-
commerce. Journal of the association for information systems, 3(1), pp. 2-24.
Gopalakrishnan, R., 2015. A Push on Job
Anxiety for Employees on Managing Recent Difficulties. Volume III, pp. 10-15.
Griffin, J. & Herres, R. T., 2002. Customer loyalty: How to earn it, how to keep it, San Francisco, CA: Jossey-Bass.
Hallowell, R., 1996. The relationships of customer satisfaction, customer
loyalty, and profitability: an empirical study. International journal of service industry management.
Hanson, W. & Martin, R. K., 1990. Optimal bundle pricing. Management Science, 36(2), pp. 155-174.
Hao, S. & Papalexopoulos, A., 1997. Reactive
power pricing and management. IEEE transactions on Power Systems, 12(1), pp. 95-104.
Hayes, J., 2011. Dealing with Anxiety and Depression in the Workplace. Volume II, pp. 45-65.
Heskett, J. L., 2002. Beyond customer loyalty. Managing Service Quality. An International Journal.
H, F., 2014. Low selfesteem evaluation. In: M. Stephon D, ed. s.l.:Falcon writers press, pp. 40-52.
Hosany, S., Ekinci, Y. & Uysal, M., 2006. Destination image and destination personality: An application of branding theories. Journal of business research, 59(5), pp. 638-
642. Hoyer, W. D. & Brown, S. P., 1990. Effects of
brand awareness on choice for a common, repeat-purchase product. Journal of consumer research, 17(2), pp. 141-148.
Hurt, K., 2016. Ways to build the employees Self-Confidence. Volume VI, pp. 25-
32.
ISSN 2659-2193 | Volume: 06 | Issue: 02 | 30-09-2020
Innis, D. E. & La Londe, B. J., 1994. Customer service: the key to customer satisfaction, customer loyalty, and
market share. Journal of business Logistics, 15(1), pp. 1-12.
Jayamanna, P., Jongwanich, J. & Joonas, K., 2016-2017. Branding Strategies in Keells Super market chains, Colombo: Just in time holdings (Pvt)Ltd.
Juran, J. M., 1992. Juran on quality by design:
the new steps for planning quality into goods and services. Simon and Schuster, pp. 154-168.
Kandampully, J. & Suhartanto, D., 2000. Customer loyalty in the hotel industry: the role of customer satisfaction and image. International journal of contemporary hospitality
management, pp. 1-15. Kim, J. & Moon, J. Y., 1998. Designing
towards emotional usability in customer interfaces—trustworthiness of cyber-banking system interfaces. Interacting with computers, 10(1), pp. 1-29.
Leigh, J. H., 2017. The impact of the
promotional activities towards the performance of the sampath bank, Colombo: VG Printers (Pvt) Ltd.
Libery, B. & Kneafsey, M., 1998. Product and place: promoting quality products and services in the lagging rural regions of the European Union. European Urban and Regional Studies, 5(4), pp. 329-341.
Lidwell, W., Holden, K. & Butler, J., 2010. Universal principles of design, revised and updated: 125 ways to enhance usability, influence perception, increase appeal, make better design decisions, and teach through design, Beverly, USA: Rockport Publishers Inc.
Lincoln, Y. S. & Guba, E. G., 1985. Establishing trustworthiness. Naturalistic inquiry, 289(331), pp. 289-327.
Liu, C. M., 2002. The effects of promotional activities on brand decision. Journal of Product & Brand Management, 11(1), pp. 42-51.
McMahon-Beattie, U., Yeoman, I., Palmer, A. & Mudie, P., 2002. Customer
perceptions of pricing and the maintenance of trust. Journal of Revenue and Pricing Management,
1(1), pp. 25-34. Mithas, S., Ramasubbu, N. & Krishnan, M. S.,
2006. Designing web sites for customer loyalty across business domains: A multilevel analysis. Journal of management information systems, 23(3), pp. 97-127.
Monroe, K. B., 1973. Buyers' subjective
perceptions of price. Journal of marketing research, pp. 70-80.
Myers, M. B., Cavusgil, S. D. & Diamantopoulos, A., 2002. Antecedents and actions of export pricing strategy: a conceptual framework and research propositions. European Journal of
Marketing, 36(1/2), pp. 159-188. Nadarajah, S., Chanaka, U. & Achchuthan, S.,
2014. Dimensions of supermarket service quality: A Sri Lankan perspective. Asian Journal of Empirical Research, 4(7), pp. 381-396.
Narasimhan, C., 1988. Competitive
promotional strategies. Journal of business, pp. 427-449.
Nelson, B., 2016. Performance metrics for the business. Volume II, pp. 30-41.
Parasuraman, A., Zeithaml, V. A. & Berry, L. L., 1985. A conceptual model of service quality and its implications for future research. the Journal of Marketing, pp. 41-50.
Paul, T., Ivo, A. & Van, L., 2013. Relating price strategies and price-setting practices. European Journal of Marketing, 47(1/2), pp. 27-48.
Perera, A. S. A., 2018. The Factors Influencing on the Customer Adoption of Internet Banking System Special Reference to the Sampath Bank in Colombo
District.. International Journal of Scientific and Research Publications, 8(2), pp. 83-107.
Pizarro Milian, R., 2017. What's for sale at Canadian universities? A mixed‐methods analysis of promotional strategies. Higher Education Quarterly, 71(1), pp. 53-74.
Rahman, M., 2017. Deposit product survey and brand elements of sampath bank,

ISSN 2659-2193 | Volume: 06 | Issue: 02 | 30-09-2020
Colombo : Just In Time Holdings (Pvt) Ltd.
Rangone, A., 1999. A resource-based approach
to strategy analysis in small-medium sized enterprises. Small Business Economics, 12(3), pp. 233-248.
Ratnam, U., 2017. Usability practices in Sampath Bank , Colombo : VG Printers (Pvt) Ltd.
Ronald, 2011. Building Business Solutions. Volume V, pp. 200-304.
Ryan, R. M., 2000. Intrensic and Extrensic motivation. Issue 25, pp. 54-67.
Sampath, R. K., 2017. The quality of the product and services in banking sectors , Padukka: State Printing Corporation.
Segoro, W., 2013. The influence of perceived service quality, mooring factor, and
relationship quality on customer satisfaction and loyalty. Procedia-Social and Behavioral Sciences, Volume 81, pp. 306-310.
Shipley, D. D. & Jobber, D., 2001. Integrative Pricing via the Pricing Wheel. Industrial Marketing, Volume 30, pp. 301-314.
Tuten, T. L. & Ashley, C., 2011. Promotional strategies for small businesses: group buying deals. Small Business Institute Journal, 7(2), pp. 15-29.
Uncles, M. D., Dowling, G. R. & Hammond, K., 2003. Customer loyalty and customer loyalty programs. Journal of consumer marketing, pp. 22-45.
Van Doren, D. C., Fechner, D. L. & Green-
Adelsberger, K., 2000. Promotional strategies on the world wide web. Journal of marketing communications, 6(1), pp. 21-35.
Weerasiri, R. A., 2017. The summary of the promotional strategies by Keells super , Colombo: VG Printers (Pvt) Ltd.
Wijeratne, A. W., 2017. Quality of the products, services and the management role in it, Colombo : VG Printers (Pvt) Ltd.
Xu, Y., Goedegebuure, R. & Van der Heijden, B., 2007. Customer perception, customer satisfaction, and customer loyalty within Chinese securities
business: towards a mediation model for predicting customer behavior. Journal of relationship marketing,
5(4), pp. 79-104. Yeoman, I. & McMahon-Beattie, U., 2004.
Revenue Management and Pricing: Case Studies and Applications, London : Thompson Learning.

ISSN 2659-2193 | Volume: 06 | Issue: 02 | 30-09-2020
HS 87 EXPORTS BEHAVIOR OF GERMANY, JAPAN AND UNITED STATES OF
AMERICA FROM 2015 TO QUARTER ONE 2020
Lilanka De Silva
IIC University of Technology, Cambodia
ABSTRACT
Exporting Vehicles and their parts, accessories is a key component in world
exports market. Harmonized commodity
description and coding system discusses about Vehicles other than railway or
tramway rolling stock, and parts and
accessories under 87th chapter. As
vehicles and their parts and accessories
vital in world economy this study
discusses about the exports behavior HS
87 exports of Germany, Japan and United
States of America from 2015 to 2019.
Further the study focuses about the
behavior HS 87 exports behavior of
Germany, Japan and United States of America during quarter one in 2020 in
which Covoid-19 negatively impacted to
world economy. Mathematical
calculations are used in the analysis to
observe the behavior of exports
categorized under HS 87 of Germany,
Japan and United States of America.
According to the findings Germany, Japan
and United States are the top three
exporters under HS87 from 2015 to 2019
and they owns more than 35% of share
with respect to the total world exports of HS 87. Germany has declined HS87
exports by 14.70%, Japan has declined
HS87 exports by 6.89% and United States
of America has declined HS87 exports by
7.95% during quarter one quarter one,
2020. HS8705, HS8702 and HS8711
products own the highest decline rates for
Japan, Germany and United States of
America respectively in quarter one 2020.
HS 8703 does the highest contribution to
the decline reported under HS87 for Japan and Germany and HS 8708 does the
highest contribution to the decline
reported under HS87 for United States of
America during first quarter 2020.
Keywords: HS87 exports, vehicle exports of Germany Japan United States of
America, Vehicle exports during
COVOID-19
ABBREVIATIONS
HS: Harmonized commodity
description and coding system
USD: United States Dollar
Q1: Quarter one
8701 Tractors (other than works trucks of heading 8709)
8701 Tractors (other than works trucks of heading 8709)
8703 Motor cars & vehicles for transporting persons
8703 Motor cars & vehicles for transporting persons
8704 Motor vehicles for transport of goods
8705 Special purpose motor vehicles
8707 Bodies (including cabs), for specific motor vehicles
8708 Parts & access for motor vehicles (head 8701-8705)
8708 Parts & access for motor vehicles (head 8701-8705)

ISSN 2659-2193 | Volume: 06 | Issue: 02 | 30-09-2020
8711 Motorcycles & cycles with aux motor
8712 Bicycles & cycles, no motor
8713 Carriages for disabled persons, motorized or not
8714 Parts & access for cycles & invalid carriages
8715 Baby carriages and parts thereof
8716 Trailers and semi-trailers, other vehicles, not mechanically propelled, parts
thereof
INTRODUCTION
Harmonized commodity description
and coding system 87
The Harmonized commodity description and coding system (HS) is
identified as an internationally used
categorization of products. Classification
of products is done through HS helps
different countries to categorize products
in a prevailing approach. HS is a
classification method that comes in a six-
digit coding approach according to the
international platform (WCO, 2020).
Under HS 87 code vehicles other than railway or tramway rolling stock, and parts
and accessories are listed. This chapter
covers all the vehicles other than railway
and tramway rolling stock and parts and
accessories which is produced for running
on rails (Customs.gov.lk. 2020). The
automobile industry of a country plays a
vital role in the development of socio-
economic development in the country.
The year 2020 negatively impacted the world automobile export industry. At the
beginning of 2020 there were many
difficulties for automobile production industry such as implementation of strong
environment protection policies. The
banking industry is also careful in lending
money for automobile export firms.
COVID-19 negatively impacted to the
automobile industry severely. Both strict
environment protection policies and
COVID-19 fumbled the development of
the automobile industry in the year 2020
(Counterpoint Research, 2020).
LITERATURE REVIEW
Germany HS 87 chapter
Germany is identified as the top country in the vehicle export industry with 18.8%
out of the total car exports of the world in
the year 2019 (Workman, 2020). The
production level of cars in Germany was
about 6 million in the year 2018 with an
increment of 2.1% compared to the year
2017 (David, 2019). German is recognized
as a branded car exporter around the
world. The main importer of German cars
is the United States. Leading brands in the
world such as BMW, Volkswagen, and Mercedes are export products of Germany.
Volkswagen brand produced by Germany
is a world leading brand earning around 11
USD million sales units around the world
in 2019 (Statista, 2020). 2020 January
sales have increased from 5.0% compared
to the same month last year
(Marklines.com. 2020) But due to
COVOID 19; 50% of the sales of vehicles
and vehicle accessories dropped in the
month of May, 2020 during the lockdown period (Counterpoint Research, 2020). Car
exports of 17,600,000 units in April and
240,304,000 in March 2020 are reported.
April car export units of Germany has
reduced compared to the March sales units
(Ceicdata, 2020).
Japan HS 87 chapter
Japan secured its ranking among the top three car manufacturing countries in the
world since the year 1960. The automobile
industry of Japan developed rapidly from
the year 1970s to the 1990s. Leading
vehicle brands exported from Japan are
Nissan, Mazda, Honda, Toyota,
Mitsubishi, Daihatsu, Lexus, Fuso, and Subaru. 89% of the manufacturing
industry in the country is production of the
automobiles. More than 5.5 million
Japanese people are occupied in the

ISSN 2659-2193 | Volume: 06 | Issue: 02 | 30-09-2020
automobile manufacturing industry and it
covers more than 8.7% of the employment
in Japan. Japan produces raw materials for
automobile production and also produces
basic equipments for automobile
production. Japan made Vehicle
accessories and parts are highly significant
in automobile market. Japan's automobile
exports show a development until 2012 and a slight negative movement after
2012. The reason for this is recognized as
downfall of yen and other leading
automobile brand development in the
world. Major vehicle exporters of Japan
are Toyota, Nissan, and Honda. Japan's
automobile industry diversifies its
business in various sectors. Along with
vehicles they produce vehicle accessories
and vehicle parts. Denso is recognized as
the largest vehicle accessory and parts
manufacturer in Japan and also in the world. Denso Company produces
electronic systems for automobiles which
they are specialized with. Japan exports
and accessories mainly go to European
countries, North America and China.
Vehicle parts manufacturers identified as
tier-1 suppliers are in a leading place
internationally (Nelly, 2016).
Vehicle production of Japan significantly stated from the year 1955.
Japan government also barred vehicle
imports from other countries to develop
Japan vehicle, accessory and parts exports and manufacturing market. Under the
guidance of Ministry of International
Trade & Industry Japan diminished small
scaler manufacturers through merging and
developing the automobile industry into
the current stage. In beginning of 1970s
Japan exported vehicles more than one
million units. Major importer of Japan
vehicles of 1970s was United States. One
reason for the gradual increment of Japan
vehicle exports was Japan sell cars for a lower price range and the value of Yen of
those days was also in a low level though
the reputation of Japan cars were not in a
high status. Japan vehicle exports
increased with these reasons
(Crosscurrents, 2020).
Japan exported around 4.8 million vehicles in the year 2018. Which is
significantly higher than 3.6 million
compared to year 2009. The exports from
Japan automobile industry most of the
times consists of passenger cars.
Passenger cars owns 4.4 million USD in
value from 2018 exports (Mann, 2020).
The exports of motor vehicles from Japan in the year 2019 dropped down and limited
to 120,500 buses, 325,000 trucks, and 4.4
million passenger cars. Japan's vehicle
exports dropped down to 4.8 million
vehicles in 2019 (Statista, 2020).
In 2020 the automobile export industry of Japan had to face another decline.
COVID-19 was the reason for this
decrease in automobile industry. Biggest
Challenge faced by Japan is managing the
production level of automobile
companies. Toyota one of the main vehicle
exporter of Japan told that it’s unpredictable how the world can change in
a moment due to this kind of situation
because the whole market of vehicle
exports was changed entirely due to the
COVID-19 virus. And Toyoda also said
that they cannot predict the future vehicle
export market for Japan. Europe
production plant dropped down its
production due to lockdown. Swindon
production was stopped until April 5th by
Honda vehicle manufacturing company in
Japan. Money allocated for research and development became a waste of money for
autonomous driving because of this
COVID-19 (hindustantimes, 2020).
United States of America HS 87 chapter
The United States is one of the largest vehicle manufacturers and exporters in the
world. More than 3000 vehicle
manufacturers are in the industry of
automobiles in United States (Woutat,
1985). Ford, Chrysler, and General Motors
were the leading vehicle manufacturers in
the United States in the 1900s. Thorstein

ISSN 2659-2193 | Volume: 06 | Issue: 02 | 30-09-2020
Veblen has stated a theory which conveys
the social status of people is represented
by their wealth. GM and Ford focused on
a target market which was created by the
wealthy social statuses of the country.
Ford Company manufactured Model T in
1913 which dropped down the cost. Model
T increased its sales amount by up to 15
million which made Ford one of the leading vehicle exporters and
manufacturers in the United States. In
1908 General Motors were recognized as
the world-famous vehicle exporter and
manufacturer (Campanella, 2005).
In the year 2018 USA export light vehicles reached up to 17.2 million vehicle
units. The United States secured its
position as the second-largest vehicle
manufacturer in the world. Honda vehicle
Production Company opened in the United
States in the year 1982. Major vehicle
production companies from Japan, Europe, and Korea invested around $75
billion in the United States. These foreign
vehicle manufacturing companies help the
United States economy by providing over
400,000 jobs. These foreign vehicle
producers use engines produced in the
United States. In the year 2018, the United
States exports new light vehicles around
1.8 million and along with that of 131,200
heavy and medium trucks which worth
more than $60 billion. The exports of the
United States cover above 200 markets around the world. The United States also
exported vehicle parts worth more than
$88.5 billion. The United States is well
recognized as a vehicle part exporter in the
world (Selectusa, 2020).
In the year 2019, the USA reported a vehicle export of 192,210 units of new
passenger vehicles and also light trucks for
China. China is recognized as the second-
largest passenger vehicle exporting
country after the USA (Statista. 2020).
The vehicle exports and manufacturing
industry of the United States dropped in the year 2020. Export was down from
38%. Light vehicle export of the United
States was predicted to range between 14.5
million and 16.4 million light vehicle
units. This drop-down is recognized as an
impact of COVID-19. In the year 2019, 17
million light vehicles were sold from the
United States. Main vehicle producers of
the United States are General Motors,
Ford, Detroit Three, and Chrysler LLC. In
the 2020 first quarter, General Motors had the highest market share with respect to
other vehicle exporters. Ford and Toyota
had the highest market share after that
(Statista. 2020).
In the year 2014 General Motors, Toyota, Ford, and Chrysler is recognized
as the major vehicle exporters of the
United States. These four produce the
most number of vehicles in the United
States. Chrysler leading vehicle
manufacturers in the United States created
Ram trucks and SUV Cherokee jeeps
which developed a huge amount of sales in the year 2014 (Gutenberg, 2020). General
Motors vehicle exporters and
manufacturers sold its brand names
Vauxhall, European, and Opel regarding
the low level of profit earned from those
brands (thestar.com. 2020, 2020). In the
year 2015, General Motors closed down its
five plants (IndustryWeek, 2020).
Coronavirus impacted all the industries in the world including vehicle , accessory,
and parts exports and manufacturing
industry. Because of the production
process of these vehicles, accessories, and
parts being stopped due to lockdown, the export level of vehicles was dropped down
(Ltd., 2020). COVID-19 virus impacted
the export level of vehicles and also the
demand level for vehicles.
Macroeconomic center team forecasted
that the export level of vehicles,
accessories, and parts will reduce between
14%- 22% in the United States and other
vehicle export countries in the year 2020
(BCG, 2020). 2020 1st quarter General
motor vehicle exports value shows a drop comparing with the 1st quarter of 2019.
United States exports 43,900 units of

ISSN 2659-2193 | Volume: 06 | Issue: 02 | 30-09-2020
Buick vehicles in the 2020 1st quarter
(Statista, 2020). Compared to the 2019 1st
quarter, Ford-badged vehicles exports has
dropped down to 515,000 units from
583,000 units in 2020 1st quarter. The
exports level of Ford-badged of the United
States declined from 12% in the 2020 1st
quarter. Lincoln-badged vehicle exports
has gained an increment compared to 2019 1st quarter by manufacturing 700 Lincoln-
badged vehicle units in 2020 1st quarter.
Ford brand of the United States introduced
a program allowing the vehicle system to
postpone the payment need of customers
because of the impact of coronavirus to the
demand for vehicle exports. The loss
resulted due to coronavirus is forecasted
around two billion by Ford brand of the
United States (Statista, 2020).
Research objectives
This study intends to study yearly trade behavior of HS87 exports of Germany,
Japan and United States of America from
2015 to 2019. Furthermore it is expected to find out the behavior of HS87 exports
and main HS exports categories of
relevant countries during quarter one in
2020.
METHODOLOGY
HS87 products’ exports value data of
Germany, Japan and United States of America is collected from ITC
TRADE MAP to explore the
behavior.
To study the behavior of HS87 export products in relevant
countries in from 2015 to 2019,
yearly e xports data is analyzed
and studied. To investigate the
behavior in the2020 first quarter, HS87
products’ quarter one exports data from
2015 to 2019 is compared and studied
against 2020 quarter one data.
To identify the growth rate of a relevant year and quarter following formulas are
selected.
Growth rate in current year = (Current year exports value -Previous year exports
value)/ (Previous year exports value)*100
Growth rate in current quarter = (Current year exports value of the quarter
-Previous year exports value of the
relevant quarter)/ (Previous year exports
value)*100
Contribution of a certain export product category to total HS87 export value
decline during relevant quarter of a
particular country following formula is
selected.
Contribution of a major category to
HS87 exports value decline during relevant quarter = (Previous year major
categories’ exports value in the relevant
quarter - Current year major categories’
exports value in the quarter)/ (Previous
year HS 87 products’ exports value in the
relevant quarter -Current year HS87
products’ exports value of the
quarter)*100
If the relevant major product category of HS87 has increased it is not considered
as a contribution to the decline and
mentioned as increased.
ANALYSIS AND DISCUSSION
Table 1- Top 3 exporters of HS87
products from 2015 to 2019
From 2015 to 2019 Germany is the leading exporter of vehicles and their parts
other than railway or tramway rolling
stock, and parts and accessories. Japan is
the second largest exporter and United
2019 2018 2017 2016 2015
Germany Germany Germany Germany Germany
Japan Japan Japan Japan Japan
United States of
America
United States of
America
United States of
America
United States of
America
United States of
America

ISSN 2659-2193 | Volume: 06 | Issue: 02 | 30-09-2020
States of America is the third largest
exporter consecutively during 2015 to
2019 time period. Hence selected
countries in this study are significant in
term of export values and impact they can
do to the world HS87 market.
Table 2- HS 87 exports values of Germany, Japan and United States of
America from 2015 to 2019
Exporters
Exported value in
2015
(USD
billions)
Exported value in
2016
(USD
billions)
Exported value in
2017
(USD
billions)
Exported value in
2018
(USD
billions)
Exported value in
2019
(USD
billions)
Germany 241.45 244.15 256.94 263.87 243.68
Japan 134.04 141.94 146.21 154.05 148.85
United States of America
127.39 124.70 130.39 130.73 133.04
According to the table 2 Germany is maintaining more than 90 USD billions
gap with respect to both Japan and United
states in between 2015 and 2019. But the
gap of export value between Japan and
United States of America is narrow that it
is less than 25 Billion.
Table 3- HS 87 total exports share of Germany, Japan and United States of
America from 2015 to 2019 with respect
to world

ISSN 2659-2193 | Volume: 06 | Issue: 02 | 30-09-2020
Exporters
Exported value in 2015
(USD
billions)
Exported value in 2016
(USD
billions)
Exported value in 2017
(USD
billions)
Exported value in 2018
(USD
billions)
Exported value in 2019
(USD
billions)
World 1325.76 1351.76 1452.50 1536.77 1495.53
Top 3 502.89 510.79 533.54 548.65 525.57
Percentage 37.93% 37.79% 36.73% 35.70% 35.14%
Considering total exports values of Germany, Japan and United States of
America they own more than 500 Billion
USD by exporting under HS 87 during 2015-2019. As a percentage with respect
to world exports value, Germany, Japan
and United States of America own more
than 35%. Hence the world supply of
Vehicles and parts highly relay on
Germany, Japan and United States of
America
Table 4- HS 87 exports values of
Germany, Japan and United States of America from 2015 to 2020 during Q1
Exporters
Exported value in
2015-Q1
(USD
billions)
Exported value in
2016-Q1
(USD
billions)
Exported value in
2017-Q1
(USD
billions)
Exported value in
2018-Q1
(USD
billions)
Exported value in
2019-
Q1(USD
billions)
Exported value in
2020-Q1
(USD
billions)
Growth rate
2020-Q1
Germany 60.76 59.70 61.35 71.56 64.28 56.04 -
14.70%
Japan 31.52 33.13 34.50 38.97 37.15 34.76 -6.89%
United States of
America 34.00 29.48 31.11 33.15 32.82 30.41 -7.95%
Considering the quarter one exports values of Germany from 2015 to 2019
lowest value recorded in 2020. For all the
years in the given time period export value
was over 59 USD billion. With respect to
2019 quarter one export value has reduced
by 14.7%
Japan had a continuous growth from 2015 up to 2018 quarter one. But in 2019
quarter one exports value decreased to
37.15 USD billion from 38.97 USD billion
recorded in 2018. Even in 2020 quarter one the exports value has declined by
6.69% with respect to 2019 quarter one.
United Nation of America has fluctuations in exports value during
quarter one from 2015 to 2020. In 2020
quarter one the second lowest export value
is recorded. Also In 2020 quarter one
7.95% decline has occurred with respect to
2019.
Highest collapse of exports value percentage growth during quarter one in
2020 is from Germany. And the lowest is
from Japan. The decline percentage of
Germany With respect to Japan is more
than two times.
Table 5- Analysis for export product categories under HS87 of Japan from 2019
to 2020 during Q1

ISSN 2659-2193 | Volume: 06 | Issue: 02 | 30-09-2020
Code
Exported value in 2019-Q1 (USD
billions)
Exported value in 2020-
Q1 (USD
billions)
Growth rate 2020-Q1
Contribution to decline of total
HS 87
'8703 24488515 22852005 -6.68% 68.31%
'8708 8152021 7508606 -7.89% 26.85%
'8704 2152976 1898594 -11.82% 10.61%
'8711 753296 787809 4.58% Increased
'8702 501736 666298 32.80% Increased
'8701 449174 437727 -2.55% 0.47%
'8714 407036 390184 -4.14% 0.70%
'8706 84721 85271 0.65% Increased
'8707 85420 69413 -18.74% 0.66%
'8705 43883 27817 -36.61% 0.67%
'8709 11239 13281 18.17% Increased
'8716 14016 11956 -14.70% 0.08%
'8712 11450 11218 -2.03% 0.01%
'8713 797 586 -26.47% 0.01%
'8715 118 83 -29.66% 0.001%
'8710 0 0 - -
In Japan the top five exports products under HS code 87 during quarter one 2020
are HS 8703 products, HS 8708 products,
HS 8704 products, HS 8711 products and
HS 8702 products. Out of the sixteen
products eleven products have negative
growth rates.
Highest individual decline rate is
recorded for HS 8705 product category and it is 36.61%. HS 8703 and HS 8708
are having the highest contributions to
Japan’s decline recorded in 2020 quarter
one with respect to 2019 quarter one for
HS 87 product category. 68.31% and
26.85% are the relevant contributions.
Out of the positively grown exports HS 8702 is the most significant product that it
owns 32.08% individual growth rate in
2020 quarter one.
Table 6- Analysis for export product categories under HS87 of Germany from
2019 to 2020 during Q1

ISSN 2659-2193 | Volume: 06 | Issue: 02 | 30-09-2020
Code
Exported value in 2019-
Q1 (USD
billions)
Exported value in 2020-
Q1 (USD
billions)
Growth rate 2020-
Q1 (USD
billions)
Contribution to decline of total HS
87
'8703 37368222 32766872 -12.31% 55.83%
'8708 16392191 14146274 -13.70% 27.25%
'8704 3031347 2444975 -19.34% 7.12%
'8701 2343430 1921998 -17.98% 5.11%
'8716 1830276 1276840 -30.24% 6.72%
'8705 961896 852920 -11.33% 1.32%
'8711 695857 708703 1.85% Increased
'8707 376396 287925 -23.50% 1.07%
'8714 238659 227296 -4.76% 0.14%
'8702 281442 188965 -32.86% 1.12%
'8712 172420 155620 -9.74% 0.20%
'8709 39249 34196 -12.87% 0.06%
'8713 39991 33979 -15.03% 0.07%
'8715 27270 31884 16.92% Increased
'8706 26805 26445 -1.34% 0.00%
'8710 0 0 - 0.00%
The top five export products of Germany in 2020 quarter one are HS8703
products, HS8708 products, HS8704
products, HS87166 products and HS8701
products. Out of the sixteen products
under HS87, thirteen products have
declined with respect to quarter one export values in 2019.
Highest individual decline rate is recorded with HS8702 products. The
decline rate for HS8702 is 32.86%. HS
8716 is having a significant decline rate of
30.24%. HS8703 and HS8708 are having
the highest contributions to the decline
under HS87 reported in 2020 quarter one
with respect 2019 quarter one. 55.83% and
27.25% are the relevant contributions.
HS8715 products have increased their exports values by 16.92% during first
quarter in 2020 with respect to 2019
quarter one.
Table 7- Analysis for export product categories under HS87 of United States of
America from 2019 to 2020 during Q1

ISSN 2659-2193 | Volume: 06 | Issue: 02 | 30-09-2020
Code
Exported value in 2019-
Q1 (USD
billions)
Exported value in 2020-
Q1 (USD
billions)
Growth rate 2020-Q1
Contribution to decline of
total HS 87
'8703 13116723 12778231 -2.58% 14.00%
'8708 10954542 9593721 -12.42% 56.29%
'8704 4407115 4429954 0.52% Increased
'8701 1642079 1114982 -32.10% 21.80%
'8716 956466 784567 -17.97% 7.11%
'8705 475230 448239 -5.68% 1.12%
'8710 215313 248847 15.57% Increased
'8707 180363 241198 33.73% Increased
'8702 199245 220679 10.76% Increased
'8711 324631 207906 -35.96% 4.83%
'8714 213636 200224 -6.28% 0.55%
'8709 79188 85827 8.38% Increased
'8712 24279 19563 -19.42% 0.20%
'8713 17463 19050 9.09% Increased
'8706 14945 9738 -34.84% 0.22%
'8715 7654 8455 10.47% Increased
Top five products under HS87 category
for United States of America in 2020
quarter one are HS8703 products, HS8708
products, HS8704 products, HS8701
products and HS8716 products. Out of
sixteen export products of HS87 category
nine have declined during 2020 quarter
one.
HS8711 has the highest individual
decline rate with 35.96%. Decline rates of HS8706 and HS8701 are significant that
they have decline rates 34.84% and
32.10% respectively. The highest
contribution to the decline amount under
HS87 products occurred because of
HS8708 products. The contribution is
56.29%. HS8701 gives 21.8%
contribution to the decline amount under
HS87.
Though nine products have lost their values during 2020 quarter one, HS8707
products have gained a significant growth
of 33.73%.
CONCLUSION
From 2015 to 2019 Germany, Japan and
United States are the leading world
exporters in HS87 products. Germany is
the largest HS87 product exporter in the
world. Second and third are consecutively
Japan and Units States of America. The
contribution of the top three countries is significant that for five years 35% of world
HS87 exports relay on them.
During quarter one in 2020 HS87 exports values of three countries have
declined from significant amount.
Germany has the largest decline rate of
exports value with respect to 2019 quarter
one which is 14.70% Japan has declined
by 6.89% and United States of America by
7.95%
ISSN 2659-2193 | Volume: 06 | Issue: 02 | 30-09-2020
Top five HS87 Japanese export products in quarter one 2020 are HS 8703
products, HS 8708 products, HS 8704
products, HS 8711 products and HS 8702
products. Eleven major product categories
have declined out of sixteen and the
highest rate is for HS8705 with 36.61%.
HS8703 products contribute to the HS87
exports value decline by 68.315%.
The top five German HS87 export
products in 2020 quarter one are HS8703 products, HS8708 products, HS8704
products, HS87166 products and HS8701
products. Out of sixteen major product
categories of HS87, thirteen have
declined. HS8702 has the highest declined
rate of 32.86%. HS8703 precuts contribute
55.83% of the HS87 exports value decline
in Germany.
Top five American HS87 export products in 2020 quarter one are HS8703
products, HS8708 products, HS8704
products, HS8701 products and HS8716
products. Out of sixteen export products of HS87 category nine have declined during
2020 quarter one. HS8711 has the highest
decline rate of 35.96%. HS8708 products
contribute from 56.29% to the HS87
product exports decline in United States of
America.
REFERENCE
BCG.com. (2020). COVID-19’S Impact On The Automotive Industry | BCG. [online]
Available at: <https://www.bcg.com/publications/2020/covid-automotive-industry-forecasting-scenarios.aspx> [Accessed 14 June 2020].
Ceicdata.com. (2020). Germany | Motor Vehicle Exports: Car | Economic Indicators. [online] Available at: <https://www.ceicdata.com/en/germ
any/motor-vehicle-exports-the-german-association-of-the-automotive-industry/motor-vehicle-exports-car> [Accessed 12 June 2020].
Counterpoint Research. (2020). Weekly Update: COVID-19 Impact On Global Automotive Industry.
[online] Available at: <https://www.counterpointresearch.com/weekly-updates-covid-19-impact-global-automotive-industry. [Accessed 12 June 2020].
Crosscurrents.hawaii.edu. (2020). The Rise Of The Japanese Auto Industry And Auto Exports. [online] Available at:
<http://www.crosscurrents.hawaii.edu/content.aspx?lang=eng&site=japan&theme=work&subtheme=INDUS&unit=JWORK065> [Accessed 14 June 2020].
Customs.gov.lk. (2020). [online] Available at: <http://www.customs.gov.lk/public/files/classification/tariff/Ch87.pdf>
[Accessed 12 June 2020]. Gutenberg, P., (2020). Automotive Industry In
The United States | Project Gutenberg Self-Publishing - Ebooks | Read Ebooks Online. [online] Self.gutenberg.org. Available at: <http://self.gutenberg.org/articles/Automotive_industry_in_the_United_
States> [Accessed 14 June 2020]. Hindustantimes.com. (2020). How
Coronavirus May Have Damaged Japan's Thriving Auto Industry. [online] Available at: <https://auto.hindustantimes.com/auto/news/how-coronavirus-may-have-damaged-japan-s-thriving-auto-industry-
41584590707277.html> [Accessed 13 June 2020].
IndustryWeek. (2020). GM To Close 4 U.S. Plants, 1 In Canada. [online] Available at: <https://www.industryweek.com/leadership/article/22026732/gm-to-close-4-us-plants-1-in-canada>
[Accessed 14 June 2020]. Ltd., M., (2020). Impact Of Covid-19 On Food
Automation Market: Meticulous Research® Viewpoint. [online] GlobeNewswire News Room. Available at: <https://www.globenewswire.com/news-
release/2020/06/08/2044658/0/en/Impact-of-Covid-19-on-Food-

ISSN 2659-2193 | Volume: 06 | Issue: 02 | 30-09-2020
Automation-Market-Meticulous-Research-Viewpoint.html> [Accessed 14 June 2020].
Marklines.com. (2020). German Passenger Car Sales Fall 7.3% In January 2020 - Marklines Automotive Industry Portal. [online] Available at: <https://www.marklines.com/en/news/235620> [Accessed 12 June 2020].
Neely, C., (2020). The Japanese Automotive Industry - Japan Industry News.
[online] Japanindustrynews.com. Available at: <https://www.japanindustrynews.com/2016/03/japanese-automotive-industry/> [Accessed 20 July 2020].
Thestar (2020). GM Selling European Brands Vauxhall-Opel To Peugeot. [online] Available at:
<https://www.thestar.com/business/2017/03/06/gm-selling-european-brands-vauxhaull-opel-to-peugeot.html> [Accessed 14 June 2020].
Selectusa.gov. (2020). Automotive Industry Spotlight | Selectusa.Gov. [online] Available at:
<https://www.selectusa.gov/automotive-industry-united-states#:~:text=Automotive%20Spotlight&text=The%20United%20States%20has%20one,or%20surpassed%2017%20million%20units.&text=The%20automotive%20industry%20is%20also%20at%20the%20forefront%20of%20innovation.> [Accessed
14 June 2020] Statista. (2020). China: U.S. Vehicle Exports
2019 | Statista. [online] Available at: <https://www.statista.com/statistics/244488/vehicle-exports-from-the-united-states-to-china/#:~:text=Vehicle%20export%20volume%20from%20the%20Unite
d%20States%20to%20China%202004%2D2019&text=In%202019%2C%20the%20United%20States,and%20light%20trucks%20to%20China.> [Accessed 14 June 2020].
Statista. (2020). Ford Motor Co. - Vehicle Sales In The United States 2020 | Statista. [online] Available at:
<https://www.statista.com/statistics/239967/ford-motors-vehicle-sales-
in-the-united-states-by-segment/> [Accessed 14 June 2020].
Statista. (2020). General Motors - Vehicle
Sales In The United States | Statista. [online] Available at: <https://www.statista.com/statistics/239968/general-motors-vehicle-sales-in-the-united-states-by-segment/> [Accessed 14 June 2020].
Statista. (2020). Topic: Automobile Industry In Germany. [online] Available at:
<https://www.statista.com/topics/3202/automobile-industry-in-germany/> [Accessed 12 June 2020].
Statista. (2020). Topic: Automotive Industry In The United States. [online] Available at: <https://www.statista.com/topics/17
21/us-automotive-industry/> [Accessed 14 June 2020].
Workman, D., (2020). Automotive Parts Exports By Country. [online] World's Top Exports. Available at: <http://www.worldstopexports.com/automotive-parts-exports-country/> [Accessed 20 July 2020].
Woutat, D (1985). "High Tech: Auto Makers' History Revisited". Los Angeles Times. ISSN 0458-3035. Retrieved July 3, 2017
Unstats.un.org. (2020). Harmonized Commodity Description And Coding Systems (HS) (Classifications, Commodity Codes, Commodity Description, HS, HS Code Search,
WCO). [online] Available at: <https://unstats.un.org/unsd/tradekb/Knowledgebase/50018/Harmonized-Commodity-Description-and-Coding-Systems-HS#:~:text=The%20Harmonized%20System%20is%20an,a%20six%2Ddigit%20code%20system. [Accessed
12 June 2020].

ISSN 2659-2193 | Volume: 06 | Issue: 02 | 30-09-2020
AN INQUIRY INTO THE DRAMATIC ART IN SRI LANKA FROM THE PRE-
BUDDHIST PERIOD TO THE KANDYAN PERIOD
C. M. Ramith Preshal Chandrasekara
University of Kelaniya, Sri Lanka
ABSTRACT
There is evidence that has been an advanced art in Sri Lanka since ancient
times. The source provides evidence that dance and instrumental art existed in Sri
Lanka from the pre-Buddhist era. In
addition to the arts of dance and music,
there is evidence that drama has existed in
Sri Lanka since pre-Buddhist times. The
question of this research is whether there
was a drama art in Sri Lanka from the pre-
Buddhist era to the Kandyan era. Literary
and archaeological sources were used as
the methodology for this research.
Primary and secondary sources were used under literary sources and inscriptions,
ruins, etc. were investigated under archeological sources. The names drama,
dance, theater, choreographer, dancer,
dancer and poet were used in connection
with literary and archeological sources.
Searching for the meaning of those names
confirmed that it meant drama. These
names have been used in connection with
a source in Sri Lanka since pre-Buddhist
times. Accordingly, it was confirmed that
there was a drama in Sri Lanka from the
pre-Buddhist era to the Kandyan era.
Keywords - Drama, Pre-Buddhist, Kandy
DESCRIPTION
There is evidence that there has been an
advanced aesthetic art in Sri Lanka since
ancient times. Among these, the source
bears witness to the fact that the art of
drama has existed in Sri Lanka since pre-
Buddhist times. The direct evidence for the existence of drama in the pre-Buddhist
period can be traced back to the reign of
Pandukabhaya. King Pandukabhaya was
moved to make sacrifices for the demons
who had helped him to build the kingdom
of Anuradhapura and gain state power.
The Mahavamsa states that the play was
watched during those festival days.
"Sacrificing to them and others every year, on the days of the festival, that
Pandukabhaya sat in the same seat with
the demon Chittaraja of the kingdom and
made the divine man play with the Rati
Krida ..."1
According to the Mahavamsa, King Pandukabhaya watched divine and human
dramas during the festival. Accordingly, a
clear information can be obtained here that
there was a certain dramatic art in that
period.
According to Bharatamuni's dramas, the
plays created by God were used by Bharatamuni for the benefit of mankind.
Hence it may have been called
Dibbamanusa drama. (Also, please note
that Sanskrit is referred to as the Divine
Language and the Sanskrit alphabet as
Nagari.) This is a good indication that the
Aryans who came to Lanka from India
enjoyed theatrics from the very beginning

ISSN 2659-2193 | Volume: 06 | Issue: 02 | 30-09-2020
of their history. This shows that Buddhism
was a theatrical art even in the Lakdiva
Raja Sabha from the time before it came to
Sri Lanka.
King Pandukabhaya along with a local leader of Chittaraja watching
Dibbamanusa plays at a state ceremony
shows that drama was a prominent
aesthetic feature of Sinhala culture even in
the pre-Buddhist era.2
ANURADHAPURA ERA
The Dhathuwamsa states that during the
reign of King Mahanama Magama in the Anuradhapura period, there were women
dramatists in those areas as well. It is
mentioned in the Dhathuwamsa that the
women of the drama also paid homage to
the Tooth Relic in various ways during the
procession of the Tooth Relic to Magama
from Haththotta Danawwe.
"The king instructed the king to 'slowly kill all the creatures in the temple,' and
instructed the dramatists to take the relics
and worship the relics at their royal
palace in the inner city. The women of the
play, dressed in various costumes, came out of the royal palace, worshiped the
relics, played the panchadgika band in
their hands and performed great
sacrifices...”3
According to the Dhatuwamsa, King Kavantissa left Soma Nuwara and went to
the Seru Nuwara pool, where he also
engaged in theatrical female dance.
“... The king came out of the city of Soma, near the pool called Seru, and
brought out various perfumes, and dressed
in other paraphernalia, and danced, sang,
and played musical instruments. It was as
if the earth were breaking apart, the rocks
of the Saptha caste were being swept away by it, and the great sea was crossing the
shores."4
The word drama also means drama. Accordingly, the inclusion of the term
'drama women' in these two events in the
Dhatuwamsa confirms that there were
women associated with drama at that time
and that there was a theatrical art. Since
there was a connection to the play, it can
be concluded that these women may have
been referred to as drama women.
It is said that the play was performed in the Magama area in the past in the estate
of
Dhammasutha Upasika which is included in Rasavahini.
"…Lankādīpe rōhana janapadē bhikkhu bhikkhuni satha samākinnan
anēka satha viharan hirañña suvanna ādī
anēka vibhawa samākinnan issara jana samūha samākulan nachchan gītha
vādithehi ehi nachcha jana mano
nandanan niranthara duk kela pasuna
anēka jana kulan vaththuththaya
pūjāparēhi saddha kulēhi anū
savarithan..."5
Rasavahini provides etymology for the word dance in this paragraph as an actor.6
What makes sense as an actor is what the play is about. This story which was
included in the Rasavahini which was
close to the people in the past 7 is also
included in the Saddharmalankara as the
Dhammasavanopasika object. This story
can be seen in more detail in Saddharmalankara than in Rasavahini.
"…This Lakdiva Ruhuna Colony is
home to hundreds of thousands of monks and nuns, hundreds of temples and a host
of treasured treasures such as gold, pearls
and gems. The floor is lined with a variety
of floors ranging from two storeys to three
storeys, adorned with a variety of artefacts
hundreds of adorned street performers
adorned with a series of three million
home performances were constantly
entertained by theatrical performances by
theatrical actors…"8
Nachcha Jana in Rasavahini is referred to as Nataka Jana in the
Saddharmaratnavaliya. By referring to the

ISSN 2659-2193 | Volume: 06 | Issue: 02 | 30-09-2020
drama people, it can be inferred that there
may have been a separate group of people
associated with the play at that time. The
Chulagalla estate included in the
Saddharmaratnakara also contains
descriptions of the play.
"... And with a pair of sapphires, like Kemmel, and with beautiful limbs like the
calves of Divaran Thisara, and with the
trembling trembling of those limbs, the
lilopetha sigu vilag, and the long, broad, sunny eyes like the divine Nilupul petals,
and all the limbs were adorned with
splendor." Hundreds of beauties like
eyecatching rasadun pidu graced the
stage with their ornate ornaments and
performed in the midst of drum beats
played by skilled musicians Kindness,
Heroism, Mystery, Humor, Horror,
Silence, Horror, Rodra are some of the
new dramas that go on and on. The
worshipers of Lord Maliyadeva, who saw the Son of God coming with great divine
glory, with their entourage of divine
people who did not leave alone for about
sixteen days…"9
According to this description, the dance was performed by beauties. The new play
has been included in the section on Drama
Code and Taste Commentaries included in
Bharathamuni's Drama Shastra. Accordingly, it is confirmed that the
drama that existed in
Sri Lanka was widespread based on the drama of Bharatamuni.10
The Gotaimbara genre included in the Saddharmalankara also contains a
description of the play.
"…the wives also put a toddy-filled toddy mud on their right hand, like a
goddess, adorned with various ornaments,
such as the dukkavalaya dudkavalaya
thisarapata kondamal, and the eight paths
with hundreds of similarly adorned women and various armor-bearing vases
and incense. All the drunken boards were
summoned and ordered to sing theatrical
songs as they wished…"11
The Gotaimbara type is a good example of the fact that the play was performed in
the homes of different people, depending
on their personal needs.
The Mahavamsa states that after the death of King Dutugemunu, the crown of
the king was saved by a dramatic woman.
"…To show the public, he got out of the car, rode the Great Seya three yalas and
the Seya and the Sangha went to
Thusithapura. Even though the women of
the theater escaped at some point here, the
halls they built here were called Tomo
Makuta Muktha Hall…"12
According to this evidence it can be
confirmed that the art of Lakdiva drama was very advanced during the
Anuradhapura period.
POLONNARUWA ERA
Literary sources confirm that there was a drama in the Polonnaruwa period as
well.
In the past, it was compulsory for the children of kings to master the arts. Drama
is one of the sixty arts. The Mahavamsa
states that King Parakramabahu I learned
the arts of dance as well as the arts he
learned as a child.
"... The prince himself came to the area of his own accord... By virtue of his
diamondlike wisdom, he mastered many of
the various arts in the immediate vicinity
of the Guru, and became proficient in the
various disciplines of jurisprudence, as
well as in phonology, in the art of
lexicography, and in many disciplines, such as bows and swords…"13
According to the Mahavamsa, the masters mastering these arts during their
childhood was an integral part of the
Polonnaruwa period.
It is said that King Parakramabahu who came to the kingdom kept the children of

ISSN 2659-2193 | Volume: 06 | Issue: 02 | 30-09-2020
his relatives and nobles in his abode and
educated them.
"... And that king is the son of the noble's brothers and grandsons in handicrafts,
horse crafts, in foreign languages, in
dance songs, successfully stopped and
explored in his mansion without the
knowledge of the numerous royalty…"14
King Parakramabahu united the country and chose the city of Polonnaruwa as his
kingdom and built a grand palace called
Vaijayantha Palace in its grandest style.
The Mahavamsa also states that a pavilion
called Saraswati Mandapa was built among the various Mahavamsa, Chapter
64, Stanzas 3-5temples there. It was used
for the enjoyment of fine arts during the
king's recess.
"…then Narendra was illuminated near the satellite hall from the Golden Pillar for
listening to the various Gadoya and for
performing the beautiful sceneries, the
main events of his character, illuminated
by Hath, are expressed in a charming
manner. Named the Saraswati
Mandapa…He also built a beautiful hall
called Saraswati Mandapa…"15
It is said that the king, who was thus
engaged in the enjoyment of the fine arts, was also an expert in the acting which he
had mastered in his childhood. The
Mahavamsa states that the king was the
foremost among those who enjoyed the
new drama.
"…then Parakumba with the conquered enemy kings and living in the city of
Pulasthi with the enemy chaos that has
vanished. what is being done is to listen to
the relic pairs…"16
This is how the Mahavamsa describes King Parakramabahu's chief queen, who
mentions how even caste women engaged
in the aesthetic arts during the
Polonnaruwa period.
"…The goddess Rupavathi, who was forever enchanted by the subtle and
intelligent kindness of grace, like
Kusatana Ag, who was delighted with the
other virtues such as the devotional rites
of the father who uttered those naughty
words, behaved like those good
minds…like this…"17
The Mahavamsa states that the drama women also lived in the royal palace built
by
King Parakramabahu in Polonnaruwa.
"…Statues of the Buddha, adorned with ornate robes and adorned with a series of
images of the Almighty, are to be placed
here by hand, to pay homage to the
Buddha and to recite the Anutthara Dhamma by composing the divine music
composed by Rajendra the people who
started the dance and started dancing with
the women who were singing and dancing
sweetly were amazed…"18
Thus, it is confirmed that not only King Parakramabahu but also his chief queen
was a man of great talent in acting and
singing. King Parakramabahu was
inspired not only to build religious shrines
but also to build theaters for the
development of the arts. The Mahavamsa
describes it as a meritorious deed.
The Mahavamsa mentions the various
buildings made by the king in his native land.
"…The king was a master of charitable
work and made other industries in the villages of Ruhuna. Or he made a stupa
called Ratnavali which is one hundred and
twenty cubits in size at his mother's
crematorium in the dairy village… and a
theater hall…"19
King Parakramabahu the Great built five theaters in his native Rohana colony,
indicating that advanced theatrical art
existed in Sri Lanka at that time. Theaters
are needed not only to perform classical
plays but also to perform folk dramas.
Therefore, it is clear that this drama may
have been used in theaters as it was

ISSN 2659-2193 | Volume: 06 | Issue: 02 | 30-09-2020
without a doubt a classic drama of the real
era.20
DAMBADENIYA ERA
During the Polonnaruwa Dambadeniya period, Sanskrit literature was influenced
by Sinhala classical works. Inspired by the
Sanskrit language and literary traditions,
Chandas created beautiful and
grammatical books such as Piyumlakuna,
Siyabaslakara and Sidath and wrote lyric
poems such as Kawsilumina,
Muwadevdawa and Sasadava. Eternal
literary works of the Tathagata period
were also inspired by classical Sanskrit drama literature. Excerpts from Sanskrit
plays such as Ratnavali, Shakuntala,
Balaramayana and Nagananda can be
found in Polonnaruwa literature. This is
evident from the writings of other authors,
including Gurulugomi, a prominent
scholar of the day. Excerpts from the
Balaramayana play on the full praise of the
Sasadavana Sannaya and the praise of the
winter season are also taken from the
Shakuntala of the summer season praise.21 Excerpts from Ratnavali Natya
are found in Gurulugomin's
Dharmapradeepika's Sulukaligu Katha
and the author has used quotations from
Nagananda's play in compiling the
Mahaboi Granthipada. 22 This shows that
Sanskrit drama was closely associated
with local folklore and that there was a
good understanding of the art of Sanskrit
drama at that time.
It is clear from the literary works written during the reign of Dambadeniya that the
play was performed as a necessity of the
daily life of the society at that time. The author of the Saddharmaratnavaliya, Ven.
Dharmasena Thera, used illustrations from
his listener's familiar environment in
creating the book. Ven. Dharmasena's
attention is drawn to
Komaline, a regular character in Kavinaluwa, a popular drama tradition of
the past. This parable appears several
times in that book.
"…Because the pavilion, which had been left in a state of mourning, was blown
away by the wind, and the glory of the sun
was not glorified, but the glory of the sun,
and the glory of the sun, and the glory of
the sun, and the glory of the sun, and the
glory of the sun, The lost hand ran away…"23
He portrays the caricatures of disaster and humiliated theorists by comparing
them to the polytheists of a play. There is
no doubt that the disciples of Ven.
Dharmasena used this parable as they
knew about the Komalins. Another
example of how theatrical art was rooted
among the Sinhalese at that time is the
parable of 'a man who weaves an anvil out
of a dirty cloth like a man in a hat and
walks around until the evening…'
Puramattu Panava Yatu is acting. Ven. Dharmasena thero who had performed in
the theaters of the Tathagata era, tried to
emphasize the facts through an experience
that was closer to his audience by
presenting the occasion in the form of a
parable.
In addition to this, when Ven. Dharmasena describes the character of
Gautama Buddha, at the time of attaining
Enlightenment, the Son of God came with
his demons to defeat the Bodhisattvas, and
he cited a clown parable to indicate that
you came in the form of a barren
caricature, even though you created many horrible images all around.
"…Except for the deadly crowd and the various weapons such as swords and rods,
the Komalins who came to drink the
Buddha's Magulai Puramattu, imagining
a monster-like form of a monster,
surrounded the Bodhisattvas…"24
Puramattu Panava is the act of acting in a play. The parables presented in the
ISSN 2659-2193 | Volume: 06 | Issue: 02 | 30-09-2020
Saddharmaratnavaliya and the
Saddhamalankara do not appear in the
Dhammapadattakatha or the Rasavahini,
the original Pali works on which these two
works are based. They are just Sinhala
works.
These are the parables that the monks of that time used to include in their
experiences. It can be deduced from the
theatrical traditions prevalent in the
contemporary society. Komali is defined in the Sri Sumangala Dictionary as
Konangiya or the joker.25 Konangiya is the
comedian in a play.26 This is what Bishop
Edmund Peiris calls Komalin.
"…Komali, Konangiya or Kolam Vu is a regular character in the play. His job is
to keep the audience awake with funny
words and rags. He was loved by the
audience. His role is generally described
as that of a greedy, greedy man with a pot-
like stomach. However, he treats life and
death equally and is ridiculed and
ridiculed."27
In this way, it is certain that the character of the comedian in a play is
mentioned in the Saddharmaratnavali and the Saddharmalankara. This shows how
theatrical art provides ample evidence of
the prevalence of planetarium among the
Sinhalese people during the Dambadeniya
Kingdom. After this, various information
about the art of drama during the Gampola
period can be studied through
contemporary literary works. This is a
wonderful illustration of the use of drama
in the Saddharmalankara written during
that period.
"One day, when Rihal Tissa was spending his days rowing, the Sakra
Devendras, knowingly inquiring about their wealth of devotion, turned the
umbrella into an umbrella and leaned
forward, imagining a very old Brahmin
Vesak as a caricature taken by the
dramatists to make fun of him. They came
and got into the boat ... "28
Here it is clear how the author Saddharmalankara used his listener's
knowledge of the costumes used to portray
the characters in the play. In view of these
facts, the conclusion that Lakdiva drama
did not arise in the past due to Theravada
Buddhism should be rejected as a
conclusion reached without any
justification.
Information on what is thought to be a
Wessanthara play during or after the reign of Dambadeniya can also be revealed in
association with a Pali literary work.
Subodhalankaraya, a beautiful Pali book
written during the reign of Dambadeniya,
is one of the examples used to describe the
taste of the play.
"Dukkha rūpeyamāno - Kathananu karunādike
Siyā Sothunamānō - Sōko Wessantharassahi…"
"…One should not think of how this emotional form of happiness, which is a
symptom of misery, tastes so cruel. That is
why the mourners who heard the grief over
the demise of the sons of the universal
sabodhisattvas are happy…"29
The aforesaid illustration is a good indication that Wessantara was a play.
Here it is important to illustrate the story
of Wessanthara on the one hand because it was a popular story among the Sinhalese.
In this illustration, the audience is
delighted to hear that in the past, watching
a play was known as "hearing".30
We can get a lot of information about the art of drama by examining the literary
sources of the Dambadeniya period. The
most important factor for this is
Dambadanikathikavatha. The Dambadeniya Dialogue Kalikala Sahitya
was enacted by King Sarvajna Panditha
Parakramabahu. One of the points in the
constitutional system regarding the
discipline of monks is rooted in the art of
ISSN 2659-2193 | Volume: 06 | Issue: 02 | 30-09-2020
drama. There the monks are commanded
to ‘make ignorant of the poetic dramatic
science, and to make others ignorant’.31
The reason for imposing a discourse on the
monks to separate themselves from the use
of arts such as poetry and drama is because
the monks entered the art of drama during
this period. This is to prevent you from
harming the Sasana. The Bhikkhu has been banned from performing in the
Dambadeniya discourse.
During the reign of the Dambadeniya dynasty, there was a discourse forbidding
the teaching of theatrical arts to the monks,
led by King Parakramabahu II. This is a
very important document written about the
daily routine of King Parakramabahu II
who enacted the Constitution. This
document, which is currently in the library
of the Great Museum of Great Britain, is
called Camp Customs. This document
provides information on how the children
of the Sinhala kings lived their daily lives and gives us a better understanding of how
they taste the fine arts on a daily basis. The
ministers and parliamentarians who
witnessed King Parakramabahu II's daily
activities are in a state of ecstasy. After
lunch, he was brought to the Kokila
Bhovili bed in the erotic pavilion, brought
to the watchtower during the day, played
games, got up on the floor, put on the
Rajapala oil, sat down on the Ranyahan
oil, sat down thoughtfully, got up and sat
on it for twenty-two hours… Then, before dinner, he engaged in other government
work. Let them be happy with the dance
and song they received' the camp tradition
states that. Even before 50 years have
passed since the discourse, the monks have
focused on the play, and Dalada Siritha
testifies that he was engaged in the study
and education of the play. This reveals that
there was a teaching of drama at the
Parakumba Pirivena in Kurunegala. The
author of the book, Devradasagina, also mentions his teachers in the introduction.
When mentioning his name, Devradadam
Pasagina mentions the name of his teacher
before his name with reverence:
"Saku Magada Helu Nalu Kiwisata Egathu Aduru Etherindu Parakumba
Piravadena Somiguna Sarana Sikara
Tusva Saladakuluneni
Devradadampasagina Van Sitha."32
This shows how Ven. Parakumba Pirivena Adhipati Thera was well known
for his knowledge of drama. This reveals
how even the orders contained in the
discourse established by the state order
were rendered ineffective by
contemporary membership requirements. This shows that drama was an essential
part of the educational process as it was an
essential part of people's lives. Although
Parakumba Pirivena is a religious
educational institution, the laity were also
educated here.
The needs of the laity could not be ignored either. For this reason, it was
essential that the monks, as lecturers, be
knowledgeable about the art of drama.
Although forbidden by discourse, the law
is confined to a document and can be seen
in this age and in later eras.
It is reported that various professionals and dramatists accompanied the princes
who came to Sri Lanka from South India during the reign of Kurunegala. The
Wannipuwatha, a collection of Hugh
Neville pamphlets in the British Museum
Library, tells the story of five princes who
claimed the kingdom of Madras at the time
and sought political asylum in Sri Lanka.
Those who arrived were traditionally
accompanied by their escorts. It is said that
there were craftsmen of various
professions among the entourage. The
mention of a Nadagam (poet) artist among them reveals information about the art of
Lakdiva drama. The princes mentioned in
the Wannipuvatha came to Sri Lanka in
the 13th century. Although it is believed
that the first playwrights came here with

ISSN 2659-2193 | Volume: 06 | Issue: 02 | 30-09-2020
this arrival during the reign of King
Bhuvanekabahu I (1272 - 1284), it is clear
that the history of Lakdiva drama goes
back nearly 700 years.
"…It is also said that during the reign of King Bhuvanekabahu I, some of the
Pagukara Paksa princes, descendants of
the royal family of Madras, came to
Ceylon due to the crime of those kings. An
elephant and several pentatonic deities
came to the sea in a ship. They were
Kalukumara Bandara, Ilangasinghe Bandara, Divakara Bandara, Wanaviraja
Bandara, Ilangasinghe Divakara
Bandara, the Kalukapu Golle Hathdenai,
the Rathachariya, the Pallankara Thotiya,
the Delisamanna, the Mevallakkara, the
Vahunvalan, the Kalinagavara, the
Sankanada Guru, the Suddhahaluwa, the
Sunnankhuva, the Sittanchariya, the
Baligosakaya, the Nadagamguruva, the
Viduusamukkara, the Manampei
Arachchila, the Yakkudinaide came aboard a ship for three months. King
Bhuvanekabahu gave the proper offerings
to it, handed over the Nindaganga and the
Gabadaganga and ordered the god
Ayyana to the east of Kataragama and to
the west…"33
There is another evidence similar to the arrival of the aforesaid playwright in the
Puskola book called Wannikadaimpotha.
"…From this the Venerable Bhuvanekabanu descended to this Sinhala
island. After that 7 relatives joined to the
Vihara in Malwa Rata. It was a hostile
country. Since they could not serve without
ransom, they went out of the Bodhi
Mandala Vihara and boarded ships. The
carpenter of Kotta King Pasamesinghe of Telugu made the Samban, the carpenter of
Paliguirugal, the carpenter who built the
Samukkava, Abaranabadala,
Kapuruhettiya, Pakkuhettiya,
Wettilahettila, Sunnombi hettila,
Sandunhettila, Wahunwalan karumantha
metiliyana pandithaya, Sankanadaguruva,
Thalavirindu, Suddhanada bali viridu,
Nadagam Panikkiya, Dalisamanna,
Suddhahaluwa etc. when my people saw
these names, they took the gifts one by one
and ran down to the swamps where the
clouds started blowing more and more.
The Tamil Hetti Hamba landed at Kuragala and came to Karaduwa and sat
on the Welparappu…"34
The aforesaid Wannikadaimpotha also tells of a group of migrants who came to
Sri Lanka from South India during the
reign of King Bhuvanekabahu. These were
the aristocrats of the Mallaraja dynasty.
It is said that they too came to Sri Lanka to get rid of the state fear that had befallen
them. Otherwise, it may be based on a
work based on a single story, or later
writers may have documented something
in folklore. However, the peculiarity of
both books is that they included
dramatists. These facts play a significant
role in acknowledging the arrival of
playwrights in Sri Lanka during the reign of King Bhuvanekabahu, and literary
evidence suggests that there was a
knowledge of the art of drama in Sri Lanka
even before that period and that it was a
very popular art form among the common
people. (In the Saddharmaratnavali of
Ven. Dharmasena written during the
Dambadeniya period which has come to
our notice earlier 35 in the
Saddharmalankara of the Gampola
period.36 Not to mention the comedy
about the comalian in the play.)
Mukkarahatana is a book about
aesthetics from India during the Kotte Kingdom. Mukkarahatana is the story of a
support army brought from Kanchipura,
Kaveri Pattanam and Keelakkarai in
southern India to drive out the invaders
from Punnala during the reign of

ISSN 2659-2193 | Volume: 06 | Issue: 02 | 30-09-2020
Parakramabahu VI. It is said that five
thugs were among those who came with
the support forces. Today, thovilkars are
the craftsmen who are engaged in the
rituals of machinery, balitovil etc.
However, in the Battle of Mukkara and
contemporary writings, the thug is used in
an even broader sense. Traditional martial
artists, including prehistoric craftsmen, have also been known by the common
name of thugs. This may be due to the fact
that in the ancient Sinhala social system,
astrology, pacifism, drumming, dance,
drama, etc., were largely entrusted to a
particular caste. Therefore, it can be said
that those who were engaged in all forms
of pacifism and performing arts may have
been tempted to call themselves Thugs,
considering the work done by any caste.
Evidence can be cited by the old
Sabaragamuwa Secretariat, a contemporary document of the Mukkara
battle, to illustrate how those engaged in
the performing arts were generally
referred to as thugs, regardless of caste.
According to this ancient state register, all
the performing arts artists were known as
thugs. The names of the thugs of the
aforesaid secretariat are named as
Marapana Kolakkara, Balangoda
Naiyandikara, Emagama Weerasangilia
and Emagama Hulawaliya Naiyandikara.37 It should be noted here
that these personal names were formed
based on their occupation, and in
particular the personal family name had a
relationship with the job.
The Sri Sumangala Dictionary refers to the kolakkaraya as the clown Konangiya
of a play38 and the nayyandi as a dance
performed during temple processions.39
The columnist is Konangiya. Otherwise
the comedian in a play. According to Ven.
Soratha Thero, this is a word that came
into use in the Sinhala language along with
the Teligu language. Nayandi is a Tamil name derived from Saradama.40 Gayfod
in Tamil means joke or sarcasm.
(Nayyandi can also be described as a
comedy for fun.) Performing artists of the
Sabaragamuwa Province are classified as
thugs according to the aforesaid code
names. This proves that Hulawalain, the
temple performers and the kolam
dramatists are all commonly known as
thugs. This shows that the fine arts were
not limited to one caste, but from the royal palace to the saddle hut.
KOTTE ERA
The most detailed information on the art of drama can be found in the literary works
written during the period of Sri Jayawardenapura in Kotte. It often
mentions a type of theater called
Kavinaluwa. Kavinaluwa Kotte was one
of the most popular performing arts during
the reign of Sri Jayawardenapura. The
statement made by the Venerable
Veedagama Maha Maitreya about the
beauty of the Buddha is about Kavinaluwa
as it provides information to make it clear
that Kavinalu is one of the two genres of
poetry and drama.
Dusiri maga newathi
Silwath danan se nithi
Kavinaluva rasa niwithi
Natana natawana ayek namnethi (98)
It is clear from this verse that kavinalu is not a subject of poetry and drama but a
kind of drama called kavinalu. This is a
good example of the fact that 'Tath
Kavinalu' required actors and producers to
perform in a special genre, 'there is no
dancer', which is a direct, theatrical tradition. Gira Sandesha also mentions
instances of this drama being mentioned in
the tradition. The writer Gira Sandesha
choose an ambalama for the passenger to
spend the night with his angel. The angel
listens to the conversations of the
passengers who stay there at night and
hears information about the daily
happenings in the society. It is said that
there was a drama called Lakdiva

ISSN 2659-2193 | Volume: 06 | Issue: 02 | 30-09-2020
Kavinalu at that time in the conversation
that took place in Ambalama and
Ramaseetha stories were presented in a
dramatic manner in association with it.
Ayek misadituga th
Noyek kavinalu rasa da th
Pera thama thamuga th
Ramaseetha katha thepalath (114)
In addition, King Parakramabahu VI, who held the throne of Sri
Jayawardenapura Kotte, was also noted to
have visited Kavinalu. This is stated in the
Gira sandesha.
Viridun hera da rama
Weda rada neethi asa rama
Dena awisip sa rama
Siyal kavinalu esi nohe rama (153)
This statement in the Gira sandesha is based on the truth. King Parakramabahu
VI was well versed in the art of drama. In
the Selalihini Sandesha of Thotagamuwa
Sri Rahula Thero, King Parakumba knew
the Tripitaka, abandoned corruption,
strategically suppressed the arrogance of
violent enemies, united the whole of
Lanka, and ended up as the master of all
weapons and poetry.
Hala dusiri dana thevala munidu bana
Kela path siyal awsip kavinalu sathana
Ola mola rupun dapa meda pee upanena
Kala mulu lakdiwa eka sesath sewana (97)
The King himself has mentioned his knowledge of poetry. The following is the
reference to the author of the book
Namruwanmal written by him.
Geburu noyek thaku – wiyarana sayuru thera path
Aththevalada nalu kawu – siyal lakdiw muluye (747)
Sanaha lo sawan – kiwikam kan rasanen
Dasavamiyanata koda – sudukiwikath bisew othuye (749)
Wiyatha perakumba – sirisagabo nara pawara
Siyabas namrewanmal – peheyum wan kele mee (750)
Many lay clergymen of the time of Sri Jayewardenepura were well versed in the
king as well as the poet. Its opening vocals
show that the play Sinhavalli, believed to
have been written by Philip Cinco, is not
his own work. An examination of the
opening vocals reveals that he later edited
a script written by a Buddhist writer in the
past. This is confirmed by the poet's predecessors' refuge as the Guru's
Saranina, who was virtuous and had a pre-
existing ancestry. Its final verses are as
follows.
"thimirayata pehedimaya dipamen eluwadana
Mratha therunta sihipariksha gena ne na
Pemethi thuta pera pevathi puwatha dena
Sawan di mahath wu man Priya wadawa na
Elupadawa Prathama kith widagama thotagama
Da kawiswara pabada wu wadane na
Natakasayawa serasu kaviragayen
sinhavalli
Natharestha vanami sabe bethiye na"41
Despite the weaknesses of the language used in the composition of the poem, its
meaning can be stated as follows.
"…Like a lamp to receive light in darkness, the poetic wisdom of the
glorious sages is remembered with creative wisdom, the news from the past,
which brings great joy to the heart with joy
and love by the famous Ven. Veedagama,
Thotagamuwe and Kaviswara Theras
commend the play which was composed in
Sinhala verse in a dramatic manner under
the name of Sinhavalli adorned with
Kaviragas…"
An important point that is clear from this is that the Sinhavalli play or the fiction

ISSN 2659-2193 | Volume: 06 | Issue: 02 | 30-09-2020
associated with it was fabricated by the
forerunners of Thotagamuwe, Veedagama
and Kaveeswara. If not, they were
involved in the creation of the play.
Here is a connection between the Veedagama, Thotagamu and Kaveeswara
Theras and the poet. It is said that the
Parivenadhipatis who presided over the
Thotagamu Vijayaba Pirivena and the
Keragala Padmawathi Depiriwana, two of
the foremost academies in the island which were famous and highly regarded at
that time, were well versed in the tradition.
Ven. Siri Rahal Thero of Thotagamuwa
himself said this in the Parawi Sandesha.
Kadawuru kula upan redi thotagamu piyasa
Seda dath siyal kavinalu magada saku basa
Kada kumaridu waralath pasalos wayasa
Wadahala rahal wedi then kalarev sadeda (208)
Dominated the Keragala Padmawathi Pirivena, a science institute in the forest
tradition ven. Vinaratana Thera carefully
examined the taste and depth of the poems
and discarded them as a precaution. It is
clear that you saw the kavinaluva well and
therefore rejected it.
Kala seta sathara ki isivaran guru
Nola dosak sadalakarin kara soduru
Gala rasei pewasu kavinalu geburu
Bala palapayakei nokale ya garu
However, the Hansa Sandesha states that the students who were educated at the
Padmawathie Parivenasthana in Keragala
studied Kavinaluwa. This shows that even
though he Tat Parivenadhipati Thero
rejected the play religiously, he had given
the necessary permission to study the art
of drama in his institution as a member
requirement.
Asesa desa parasidu porana kiviyara
Wisesasayen pewasu noyeka manahara
Dose duralamini sada wiyarana lakara
Ese kiyanu wisithuru kavinalu sathara (182)
According to the Gira Sandeshaya, the group of scholars who followed the
earlierpoets of the Vijayaba Pirivena
Wenuma and were well versed in the
aesthetics and grammar of Chandasa read
Sanskrit, Magadha, Tamil and Kavinalu.
Sirimath soduru e vehera thena thena
lakulu
Ida sith lesata pera kivyara siri rukulu
Denagath sadalakara wiyarana wiyath mulu
Pawa sath saku magada helu demala kavinalu (227)
Thus, it is clear that the poet who came to the attention of the distinguished monks
who worked during the reign of Sri
Jayawardenapura Kotte studied in the
academies headed by them.
Apart from this, the Venerable Veedagama Maitreya Thero of
Mahanetraprasadamula also says that he
has a good understanding of poetry.
"Pasan lakdiw sada – muva madala men hobana
Palam aram siri piri – widagama wehera redi
Pasak thun losidu – idu budu radun wadahala
Thewala sayura kubuyon – sirini gath niya athlen
Noyek kavinalu sada – wiyarana lakara wiyathun
Muduna sedu methmahaneth – pamula maha theridu sada"42
It is further stated in this work that poetic drama is a blessing to the poet and
others, as some say, that poetry is not a
term confined to the textbook. Another
thing that should not be forgotten here is
the interest shown by the monks and their
lay clergy who were prominent in the field
of study during the Sri Jayewardenepura
period. The lamp was written by the poet
Dedigamuwe Divakara of the Thotagamu

ISSN 2659-2193 | Volume: 06 | Issue: 02 | 30-09-2020
dynasty.43 It was written by a monk
named Buwaneka who lived in the
Kelaniya Rajamaha Viharaya44 and was a
student of the Ven. Dankatinaya is an
essay by the great Maitreya
Thero45 and the Pathasa,46 Ambavidamana47 and Madevikathawa48
were written by a poet named Ekaviraja
Panditha. He was also a student of the
Maitreya Thero. The story of Gajaba is
also a creation of Ven. Veedagama.49 Amarasaya is an essay by Sallayale
Thera.50 The story of Ganaruwa included
in the Panthiskolmura is an essay by a
grandson of Maliya Mahatherindu
Pajayaveda Panditha.51 As we have seen
above, it is clear from the Seventh Elusilo
that the nobles, kings as well as the
aristocracy of the time were well versed in
poetry. Panikki, who invited the author to
write this book, had a good knowledge.
rath sath path eka yuth suugath pada mudun
Dun mal kadak men nithin
Yuth meth sath gunayen sathan reki
Nenin dath sip siyal kavnaluth
Sathkith yuth me panikki nam
Methithumek aradhanawen mahath
Seth ath path wanu was siyak elu
Silo kimen thilona wadim (101)
Alagiyawanna Mukavetti, who lived in the Seethawaka period, states in his Savul
Sandeshaya that he was knowledgeable about poetry in the author's
recommendation.
Geburu saku magada kavinalu sidu kim dee
Mithuru novana kavigajasiha sirith dee
Seduru alagiyawanna mukuveti nemathi sudde
Miyuru pada rasethi me sevul asna yedee (206)
In the Mayura Sandeshaya, which is believed to have been written during the
reign of Gampola around 1378 AD, it is
mentioned in the praise of Galle that there
were poets trained from an early age. This
shows that in the past women also used to
act in poems.
Balle purudu kavinalu siyalle
Iille wadan dena ladunudulle
Nelle kothenakath lowa mululle
Galle sirida daku noma pekille (81)
Commenting on this verse, Ven. Baddegama Wimalawansa Thero says:
According to the poem, poets have been practicing everything since childhood
(since childhood). There is no doubt that
the name of the actor mentioned here is the
play… This certainly suggests that
Kavinalu had been involved in children's
education since childhood.52
Kolama was another advanced drama that was popular during the Sri
Jayawardenapura period in Kotte.
Since the Kolam acting was a popular drama at that time, Ven. Vidagama
Maitreya Thero had to explain things to his
readers, the Kolam was used as an
illustration in Loweda Sagarava.
Kala rasa musu bojana kara pem
Gala suwadethi sadunuth manaram
Lala abarana risi lesa selasum
Pala giya veni bahuruu kolam (51)
Considering the foregoing, it is clear that Sarachchandra's view that 'the art of
Lakdiva drama did not come into being
due to Theravada Buddhism' is a
controversial concept. In addition,
Sarachchandra's depiction of Sinhala rural
culture reveals the contradiction in his
view of the birth of Lakdiva drama. Believing that Buddhist rituals are devoid
of collectivism, he says that in folk beliefs,
people gather to perform dances, songs,
drums and trumpets, and to perform
dramatic scenes and masks. But at one
point he tried to say that there was a clear
distinction between village culture and
Buddhist culture in his interpretation of
dance and drama, and that 'music does not
escape' from this culture because the
rituals that characterize dance and singing are not part of the Buddhist faith.

ISSN 2659-2193 | Volume: 06 | Issue: 02 | 30-09-2020
Sometimes he tries to divide the cultures
in a straight line. Such a simple parallel
separation can never be seen in Sinhala
culture or any other culture and it is clear
that there was a harmonious relationship
with each other. However, the writer has
to admit that they were dramatic elements
of the Sinhala rural culture. It has been
acknowledged that folk dramas and dramas have been used in Buddhist rituals
on an earlier occasion, but this work has
created an unnecessary problem by
interpreting and analyzing even though
they should be accepted as correlations of
the same culture. This is due to the fact
that Theravada Buddhism sought to
establish that theatrical art had lost its
potential. Sarachchandra sometimes
refutes his own arguments to substantiate
his arguments.
"…The following quote is a factor. Other examples are that the folk arts sought the glory of the great tradition.
Kandyan dancers associate with the
character of the Buddha in Vannam. At
some religious festivals, they sing and
dance to the Sufi commentary. Horseback
riding is the process by which Prince
Siddhartha ascended on horseback as
Kanthaka. The song of the Tooth Relic is a
lyrical composition composed by
Pranama Oral. Buddhist stories such as
Sandakinduru Jataka and Maname
Kathawa (Chulladhanugga Jataka) were used as news objects for Gaminatika. But
these examples show that the villagers
took possession of the great tradition, but
that the Chula tradition was not indebted
to the great tradition in terms of artistic
form. With regard to the music and dance
of the Chula tradition, it seems that these
arts flourished when they came in contact
with the more advanced Duvida arts and
when they were considered by scholars
and Buddhists.53
ARCHAEOLOGICAL SOURCE
Evidence can be found that Sri Lankan drama has existed in the past under
archeological sources as well. Evidence
from inscriptions and ruins can also be
used to provide information on ancient
drama in Sri Lanka. Cree. BC Several
inscriptions from the first to the third
century were in charge of several
administrative divisions of the regime at
that time mention has been made of
several officers who held the posts of Aga Adeka, Ati Adeka, Pakara Adeka, Nava
Adeka, Pana Adeka, Nrutaya Adeka, Rupa
Adeka and Sivika Andaka. Mr.
Paranavithana states that the term Adaka
or Adeka mentioned in these inscriptions
is similar to the directorial posts included
in Kautilya Economics identified as Horse
Director, Hand Director, Co-Director,
Road Director, Choreographer, Drama
Director, Commodore Director or
Commercial Director, Director of Coin
Issuance and Director of Hidolu.54 Thus Cray. BC In the first and third centuries,
the performing arts were associated with
the ruling class. The existence of a
separate post as Drama Director confirms
that the art of drama was at a very
advanced level at that time. In addition to
the name of the author unknown, the
inscription is also referred to as
Tachadapa. Andaka is another name used
to describe the play's director.
Archaeological sources confirm that there were directors in the past who created the
play.
In addition to the name Nritya Adaka, it is also referred to as Nachadaka in
inscriptions Nachadaka is another name
used to describe a play director.
Archaeological sources confirm that there
were directors in the past who created the
play. Ancient cave inscriptions confirm
that they were professional dramatists
even during the period when Buddhism
was spreading in Lanka. These cave
inscriptions are written above the drip of
stone caves donated by the contributors for the residence of the monks.

ISSN 2659-2193 | Volume: 06 | Issue: 02 | 30-09-2020
The articles mention the names of the donors who made offerings to the Bhikku
Sangha in the relevant cave. It seems that
from the early days of Mahinda Thera until
much later, monks used to live in such
caves.
Articles in such caves also mention donations made by dramatists.
Korawela.Among the inscriptions written
during the Anuradhapura period in
Medagama, Periyakaduwa and Sasseruwa are some caves which contain such
information.
•"Thotayamiya gapathi okdhaka thisha putha upashaka nata thishasha daran
shagasha dine"
(Korawakgala)
(Thotayamiya householder Majaka Tissa's son Upasaka dramatist Tissa's alms
is restored to the Sangha.)55
• "Nada thishaha bariya parumakali bramanaya lene medagama viharaya"
(The wife of the playwright Tissa is the cave of the leading Bhramana.)56
• "Gapathi rupadaka thishaha lene" (Periyakadu Viharaya)
• "Gapathi nata wudaha gapathatha shamudaya nata waluya kaditha"
(Sesseruva) (Housewife Natyakara
Woodage Gahapathini Natyakara Chaluge
Daughter Samudda's Cave)57
• "Shobikana aga ka(mi)na marumakana nata chulaha lene athatha
anagatha
chathudisa shahasha shobamath wuwan gen aga pemini kaminage" (Kamini) (The
cave of the grandson of the playwright
Chula was offered to the four-
leggedmonks who did not come.)58
• "Nata chulabha jitha dama kdhaya shamudaya (1016) (Sesseruwa)
(Dramatist Chula's Daughter Dramatist Dhamma's Wife Samudda's Cave)59
Details related to the art of drama can be found by focusing on the cave inscriptions
above. This cave drama can be confirmed
as a cave dedicated to the Bhikku Sangha
by the chiefs. The names Nata Nisha, Nadi
Thiha, Rupadaka Gaha, Nata Vuha, Nata
Vulaha used in the inscriptions mean
playwright, playwright and illustrator.
Based on that source,60 it is possible to
confirm that there was a drama in the past.
An inscription found during excavations in the Rajagala area provides
information about a theater. According to
the inscription, rations are charged for
admission to the performing arts.61 The charging of rations in the past for watching
the play also confirms the development of
the art of drama in that era. If rations were
charged for watching the play in the
Rajagala area, there is no doubt that an
advanced drama tradition existed in the
area in the past. In addition to the
inscriptions, the ruins also provide
information that the past was a theatrical
art. Here you can see stone carvings,
buildings and statues in the category of ruins. A statue of actress has also been
found in connection with the inscription
found during excavations in the Rajagala
area. Researchers conclude that the statue
depicts a playwright at the time. The statue
can be seen in the costume belonging to a
playwright.62
There is evidence that there were theaters in the past associated with the
Ruhunu Maha Vehera or Magul Maha
Vihara. Built according to the Egyptian
style of architecture, the Magul Maha
Viharaya also houses the Bhakna Hall,
Pratima Hall, Bheri Hall, Sabha Hall, Sacrifice Hall, Yakshadhruma and Dance
Hall. Accordingly, it is confirmed that this
drama was also performed in the temples
and monasteries of that period.63
Sculptures found near the Ramba Vihara in Ruhuna also provide
information on the existence of a dramatic
art. The statue is 18 cm long and 10 cm
wide. One sculpture depicts a drumming
scene and the other sculpture depicts

ISSN 2659-2193 | Volume: 06 | Issue: 02 | 30-09-2020
acting. A large number of such carved
plaques have been found in association
with the 23-11 builds. Thus, it is possible
to confirm that there were dramatic arts in
the past.64 Based on the literary and
archeological sources mentioned above, it
can be confirmed that the play existed
from the pre-Buddhist era to the
Anuradhapura and Polonnaruwa eras.
REFERENCE
1 Most Venerable Sri Sumangala Nayaka Thero, Hikkaduwe., Scholar of Batuwanthuda, Abeyratne, D. M. S.,
Dr. Wijesekera, Nandadeva. (2015). Mahavamsa. ed. Dehiwala: Buddhist Cultural Center. Chapter 10 Stanzas
84 – 87. 2 Dela Bandara, Gamini. Sinhala Drama and
Cultural Background. Sambhavaya Publications. Page 23.
3 Moratuwagama, H. M. (2017). Dhatu Vamsaya. ed. Colombo 10: Ratna Book Publishers. page 47.
4 Dhatuvamsa. page 100.
5 Panditha Vanarathana, Ranjith. (2001). Rasavahiniya. Colombo 10: Samayawardena Publishers. page 2.
6 Rasavahini. page 14. 7 Sinhala Dictionary Compilation Institute.
(2018). Sinhala Spelling Dictionary. Colombo 7: Department of
Cultural Affairs. Page 124. 8 Pangaloka Thero, Migoda. (2017).
Saddharmalankara. ed. Dehiwala: Buddhist Cultural Center. page 484.
9 Saddharmalankara. page 842. 10 Saddharmalankara. page 605. 11 Mahavamsa. Chapter 32. Stanzas 77-78. 12 Mahavamsa. Chapter 64. Stanzas 3-5. 13 Mahavamsa. Chapter 69. Stanzas 23-25. 14 Mahavamsa. Chapter 70. Stanzas 85-88.
15 Mahavamsa. Chapter 34. Stanzas 183-485. 16 Mahavamsa. Chapter 73. Stanzas 142-144. 17 Mahavamsa. Chapter 73. Stanzas 10-12. 18 Mahavamsa. Chapter 71. Stanzas 71,72,77. 19 Sinhala Drama and Cultural Background.
page 110. 20 Dharmapala Thero, Athuruwelle. (1931).
Sanna sahitha Sasadavatha or
Kawya Thilakaya. Compilation. Colombo. page 12, page 37 and page 16.
21 Dharmarama Thero, Ratmalane. (1951). Dharmapradeepika. ed. Kelaniya. page 900.
22 Dharmarama Thera, Ratmalane. (1910). Commentary on the Mahabodhivansa Bibliography. ed. Colombo.
page 129. 23 Saddharmaratnavaliya. page 813. 24 Saddharmaratnavaliya. page 1193. 25 Soratha Thera. (1952). (first half). page 279
26 Soratha Thera. (1952). (first half). page 283 27 Peiries, Edmund. (1978). Syudied Historical
and Cultural. Colombo. page 245. 28 Saddharmalankara. page 600. 29 Subodhalankara. page 353. 30 Bandarala, Dela. (2005). page 140-142. 31 Jayathilaka, D. B. (1984). Conversation
Magazine. ed. Colombo. page 19.
32 Dalada Siritha. 33 Wannipuwatha. or 6006 (140) (a palm-leaf
book). British Museum Library. 34 Wanni Bar Book. 35 Saddharmaratnavaliya. page 813. 36 Saddharmalankara. pages 1934, 278, 283,
312. 37 Gnanavimala Thero, Kiriella. (1942).
Ancient Documents of Sabaragamuwa. Kiriella. page 191.
38 Soratha Thero, Welivitiye. (1952). Dictionary of Sri Sumangala. (First Half). Colombo. page 279.
39 Soratha Thero, Welivitiye. (1952). (First Half). page 284.
40 Karunathilaka, W. S. (2002). Tamil-Sinhala Alphabet. Colombo. page 487.
41 Copies of Ancient Sinhala Drama. (D.H) page 27.
42 Kavlakunu Minimal. page 84 – 86. 43 Kolmura Poems. page 17. 44 Kolmura Poems. page 47. 45 Kolmura Poems. page 27,28. 46 Kolmura Poems. page 95, 96. 47 Kolmura Poems. page 134.
48 Kolmura Poems. page 265. 49 Kolmura Poems. page 484. 50 Kolmura Poems. page 98. 51 Kolmura Poems. page 49. 52 Wimalawansa Thero. (1988). page 100. 53 Sarachchandra. (1968). page 27. 54 Paranavithana, S. (1959). University of
Ceylon History of Ceylon, 2 part.
Colombo. page 233.

ISSN 2659-2193 | Volume: 06 | Issue: 02 | 30-09-2020
55 Mudiyanse, Nandasena. (2016). Collection of Sinhala Inscriptions. Colombo 10: S. Godage & Brothers.
Colombo 10. page 119. 56 Code of Sinhala Inscriptions. page 151. 57 That. page 161. 58 That. page 170. 59 That. page 162. 60 Sinhala Inscription Words Alphabetical.
page 154. 61 Interview with Prof. Karunaratne
Attanayake, University of Sri Jayewardenepura on 04.12.2013
62 That. 63 Kumara Sugath, Mahinda. (2017). Magul
Maha Viharaya or Ruhunu Maha
Vehera. Colombo 10: S. Godage And brothers. page 172. 64 Karunaratne, Asoka H. H. (2016). An
Inquiry into the Semi - High Clay Pottery Boards Found at Manavulu
Ramba Vihara, Kumara Pushpa Janaka, Colombo 10: Godage Bookshop. page 356.