Additional Environmental Studies Sri Lanka - Asian ...
312
Additional Environmental Studies February 2014 Sri Lanka: Green Power Development and Energy Efficiency Improvement Investment Program Prepared by Ceylon Electricity Board, Ministry of Power and Energy, Democratic Socialist Republic of Sri Lanka for the Asian Development Bank. Reports 1-6
-
Upload
khangminh22 -
Category
Documents
-
view
3 -
download
0
Transcript of Additional Environmental Studies Sri Lanka - Asian ...
Additional Environmental Studies
February 2014
Sri Lanka: Green Power Development and Energy
Efficiency Improvement Investment Program
Prepared by Ceylon Electricity Board, Ministry of Power and Energy, Democratic Socialist Republic of Sri
Lanka for the Asian Development Bank.
Reports 1-6
Table of Contents
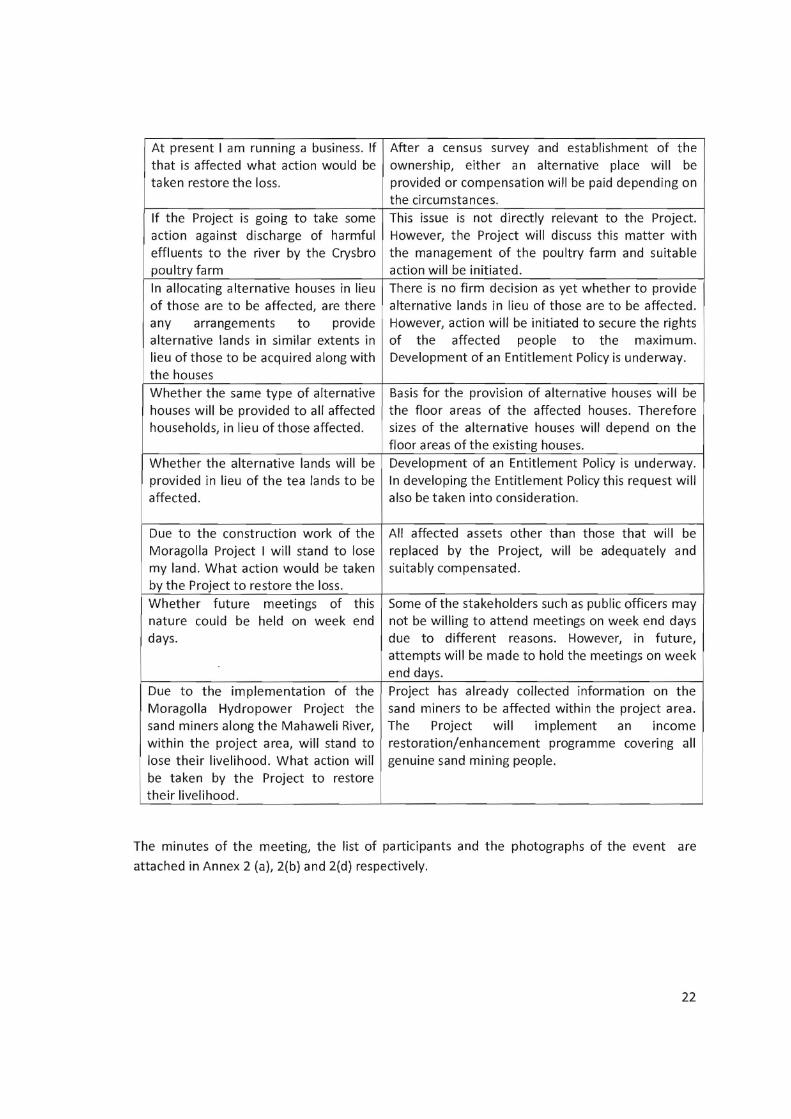
Report 01 : Water Quality in the Mahaweli Ganga Upstream and Downstream of the Proposed Dam at Moragolla
Report 02 : Aquatic Ecology in the Mahaweli Ganga
Report 03 : Groundwater Distribution and Quality Along the Proposed Tunnel Route of the Moragolla Hydropower Project
Report 04 : Updated Land Use Map
Report 05 : Study of the Rationale and Suitability of the Proposed Environmental Flow
Report 06 : the Stakeholder Consultation and Disclosure Process
This Additional Environmental Studies is a document of the borrower. The views expressed herein do
not necessarily represent those of ADB's Board of Directors, Management, or staff, and may be
preliminary in nature. Yラ┌ヴ ;デデWミデキラミ キゲ SキヴWIデWS デラ デエW さデWヴマゲ ラa ┌ゲWざ ゲWIデキラミ ラa デエキゲ ┘WHゲキデWく
In preparing any country program or strategy, financing any project, or by making any designation of or
reference to a particular territory or geographic area in this document, the Asian Development Bank
does not intend to make any judgments as to the legal or other status of any territory or area.

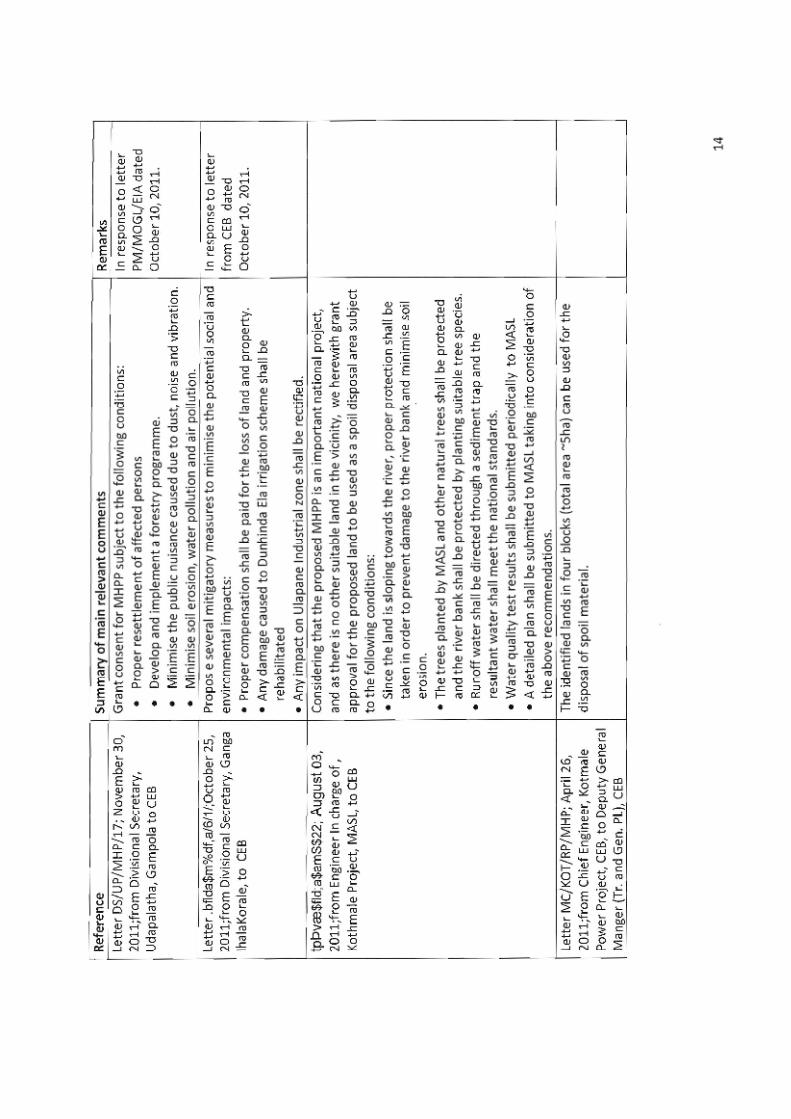
ADDITIONAL STUDIES ON NATURAL ENVIRONMENT
FOR REVIEW OF FEASIBILITY STUDY AND
PREPARATION OF DETAILED DESIGN AND BIDDING
DOCUMENTS
MORAGOLLA HYDROPOWER PROJECT, SRI LANKA
Final Report 1
Water quality in the Mahaweli Ganga - upstream and
downstream of the proposed dam at Moragolla
Prepared by
The National Building Research Organization
Prepared for
NIPPON KOEI Co Ltd - Moragolla Hydropower Project
July 2013
National Building Research OrganizationMinistry of Disaster Management
99/1, Jawatte Road, Colombo 05, Sri Lanka
Contents
Executive Summary i
1. Introduction 1
2. Scope of the study 1
3. Justification for selection of sampling points 2
4. The river uses and potential pollution sources 5
5. Sample collection, transportation and preservation 5
6. Analysis of samples for water quality parameters 6
7. Existing water quality 6
8. Anticipated impacts on river water quality 9
9. Proposed mitigation measures 11
Annexure
Annex1 - Terms of Reference
Annex 2 - Study team
Annex 3 - Map of river water quality sampling locations
Annex 4 - Photographs of pollution sources, river uses and river degradation photographs
Annex 5 - GPS reference, descriptions and photographs of sampling locations
Annex 6 - Analytical Methods and Quality Control procedures
Annex 7 - The river water quality (low flow season and high flow season)
Annex 8 - Analytical data of Crysbro Broiler Farm wastewater outfall

List of Figures
Figure Page
Fig. 1 Map of survey area and sampling locations 3
Fig. 2 Downhill collection point of Crysbro Broiler Farm wastewater 4
Fig. 3 Seasonal variations in surface water quality parameters 7
Executive Summary
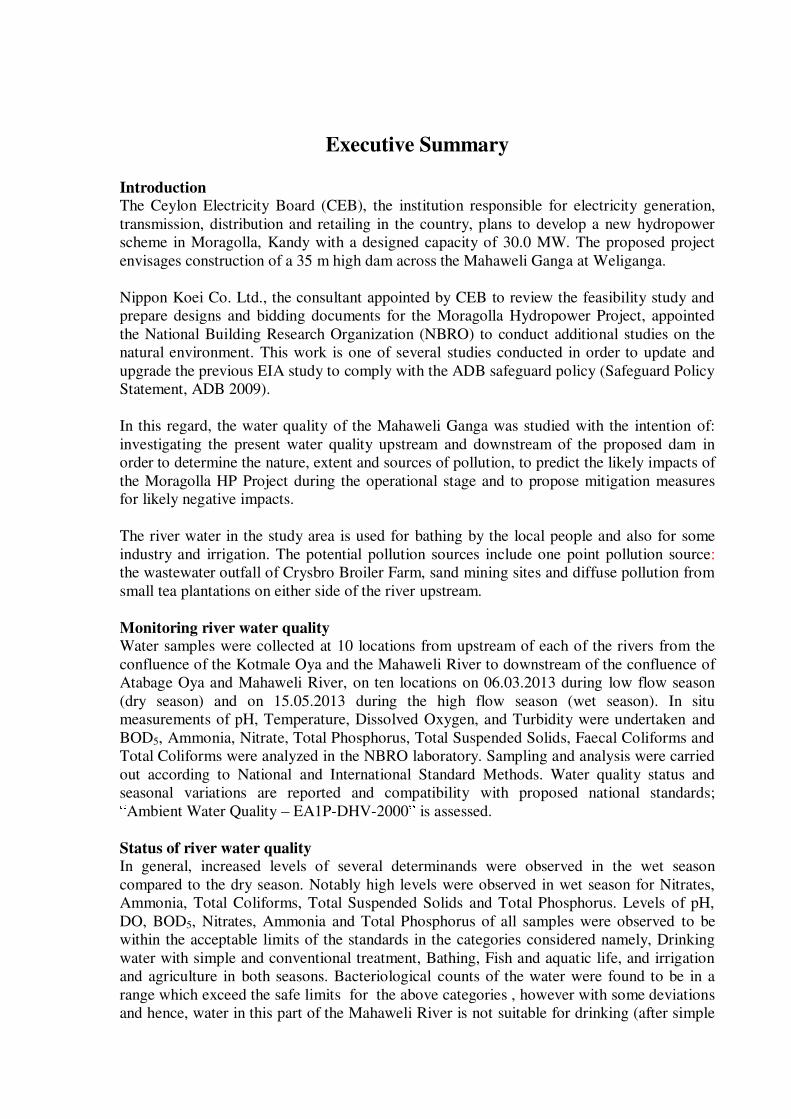
IntroductionThe Ceylon Electricity Board (CEB), the institution responsible for electricity generation,
transmission, distribution and retailing in the country, plans to develop a new hydropower
scheme in Moragolla, Kandy with a designed capacity of 30.0 MW. The proposed project
envisages construction of a 35 m high dam across the Mahaweli Ganga at Weliganga.
Nippon Koei Co. Ltd., the consultant appointed by CEB to review the feasibility study and
prepare designs and bidding documents for the Moragolla Hydropower Project, appointed
the National Building Research Organization (NBRO) to conduct additional studies on the
natural environment. This work is one of several studies conducted in order to update and
upgrade the previous EIA study to comply with the ADB safeguard policy (Safeguard Policy
Statement, ADB 2009).
In this regard, the water quality of the Mahaweli Ganga was studied with the intention of:
investigating the present water quality upstream and downstream of the proposed dam in
order to determine the nature, extent and sources of pollution, to predict the likely impacts of
the Moragolla HP Project during the operational stage and to propose mitigation measuresfor likely negative impacts.
The river water in the study area is used for bathing by the local people and also for some
industry and irrigation. The potential pollution sources include one point pollution source:
the wastewater outfall of Crysbro Broiler Farm, sand mining sites and diffuse pollution from
small tea plantations on either side of the river upstream.
Monitoring river water qualityWater samples were collected at 10 locations from upstream of each of the rivers from the
confluence of the Kotmale Oya and the Mahaweli River to downstream of the confluence of
Atabage Oya and Mahaweli River, on ten locations on 06.03.2013 during low flow season
(dry season) and on 15.05.2013 during the high flow season (wet season). In situ
measurements of pH, Temperature, Dissolved Oxygen, and Turbidity were undertaken and
BOD5, Ammonia, Nitrate, Total Phosphorus, Total Suspended Solids, Faecal Coliforms and
Total Coliforms were analyzed in the NBRO laboratory. Sampling and analysis were carried
out according to National and International Standard Methods. Water quality status and
seasonal variations are reported and compatibility with proposed national standards;
Ambient Water Quality EA1P-DHV-2000 is assessed.
Status of river water qualityIn general, increased levels of several determinands were observed in the wet season
compared to the dry season. Notably high levels were observed in wet season for Nitrates,
Ammonia, Total Coliforms, Total Suspended Solids and Total Phosphorus. Levels of pH,
DO, BOD5, Nitrates, Ammonia and Total Phosphorus of all samples were observed to be
within the acceptable limits of the standards in the categories considered namely, Drinking
water with simple and conventional treatment, Bathing, Fish and aquatic life, and irrigation
and agriculture in both seasons. Bacteriological counts of the water were found to be in a
range which exceed the safe limits for the above categories , however with some deviations
and hence, water in this part of the Mahaweli River is not suitable for drinking (after simple
ii
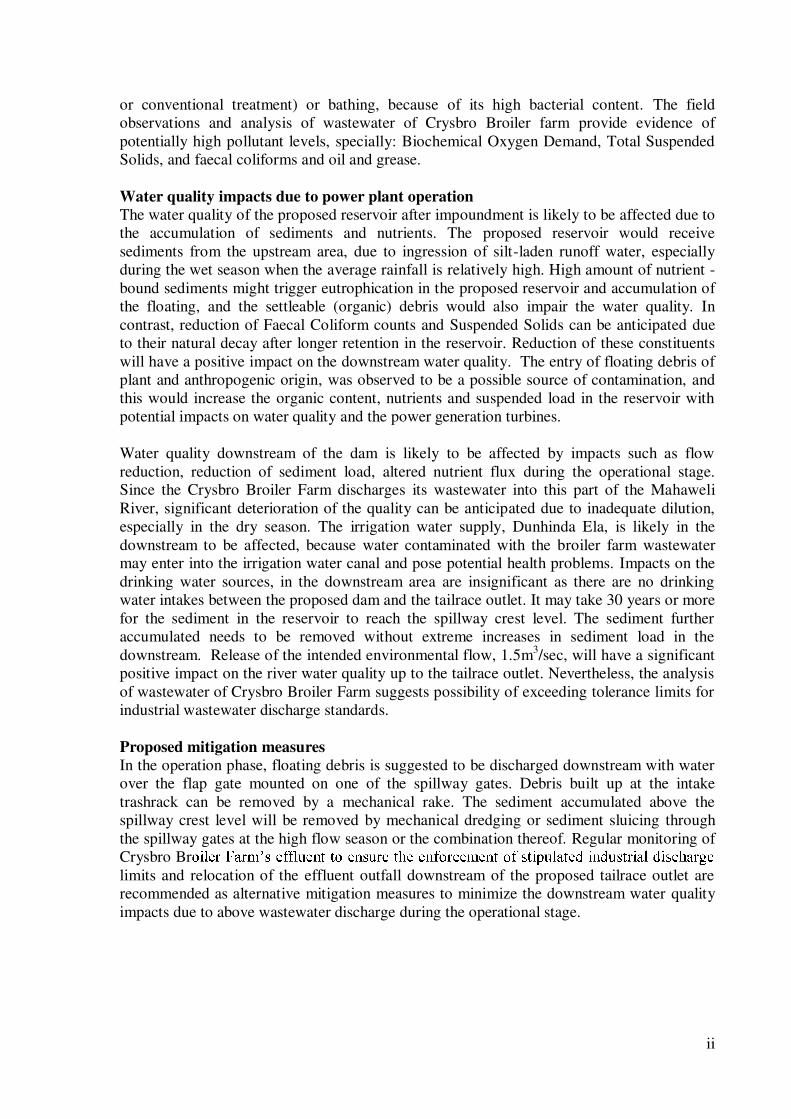
or conventional treatment) or bathing, because of its high bacterial content. The field
observations and analysis of wastewater of Crysbro Broiler farm provide evidence of
potentially high pollutant levels, specially: Biochemical Oxygen Demand, Total Suspended
Solids, and faecal coliforms and oil and grease.
Water quality impacts due to power plant operation
The water quality of the proposed reservoir after impoundment is likely to be affected due to
the accumulation of sediments and nutrients. The proposed reservoir would receive
sediments from the upstream area, due to ingression of silt-laden runoff water, especially
during the wet season when the average rainfall is relatively high. High amount of nutrient -
bound sediments might trigger eutrophication in the proposed reservoir and accumulation of
the floating, and the settleable (organic) debris would also impair the water quality. In
contrast, reduction of Faecal Coliform counts and Suspended Solids can be anticipated due
to their natural decay after longer retention in the reservoir. Reduction of these constituents
will have a positive impact on the downstream water quality. The entry of floating debris of
plant and anthropogenic origin, was observed to be a possible source of contamination, and
this would increase the organic content, nutrients and suspended load in the reservoir with
potential impacts on water quality and the power generation turbines.
Water quality downstream of the dam is likely to be affected by impacts such as flow
reduction, reduction of sediment load, altered nutrient flux during the operational stage.Since the Crysbro Broiler Farm discharges its wastewater into this part of the Mahaweli
River, significant deterioration of the quality can be anticipated due to inadequate dilution,
especially in the dry season. The irrigation water supply, Dunhinda Ela, is likely in the
downstream to be affected, because water contaminated with the broiler farm wastewatermay enter into the irrigation water canal and pose potential health problems. Impacts on the
drinking water sources, in the downstream area are insignificant as there are no drinking
water intakes between the proposed dam and the tailrace outlet. It may take 30 years or more
for the sediment in the reservoir to reach the spillway crest level. The sediment further
accumulated needs to be removed without extreme increases in sediment load in the
downstream. Release of the intended environmental flow, 1.5m3/sec, will have a significant
positive impact on the river water quality up to the tailrace outlet. Nevertheless, the analysis
of wastewater of Crysbro Broiler Farm suggests possibility of exceeding tolerance limits for
industrial wastewater discharge standards.
Proposed mitigation measures
In the operation phase, floating debris is suggested to be discharged downstream with water
over the flap gate mounted on one of the spillway gates. Debris built up at the intake
trashrack can be removed by a mechanical rake. The sediment accumulated above the
spillway crest level will be removed by mechanical dredging or sediment sluicing through
the spillway gates at the high flow season or the combination thereof. Regular monitoring of
Crysbro Br
limits and relocation of the effluent outfall downstream of the proposed tailrace outlet are
recommended as alternative mitigation measures to minimize the downstream water quality
impacts due to above wastewater discharge during the operational stage.

1
1. Introduction
The Ceylon Electricity Board (CEB) plans to develop a new 30.0 MW hydropower project at
Moragolla in Kandy District. The scheme involves construction of a 35 m high concrete gravity
dam (with a 5-gate spillway) across the Mahaweli Ganga at Weliganga, to create a 38.5 ha (1.98
MCM) reservoir with a Full Supply Level (FSL) at 548 msl. The water from the reservoir will be
diverted through a 3.1 km underground tunnel, surge shaft and penstock on the left bank of the
river, to a powerhouse and outfall located opposite the confluence with the Atabage Oya.
The CEB intend seeking international financial support for the project implementation and
potential funders include the Asian Development Bank (ADB). For this purpose, CEB has
appointed Nippon Koei Co. Ltd in joint venture with Nippon Koei India Pvt Ltd to review the
Feasibility Study and prepare detailed designs and bidding documents for the project. Review of
the EIA indicated that further studies were needed in order to update and amend the document to
comply with ADB safeguard policy (Safeguard Policy Statement, ADB 2009).
The Nippon Koei Co. Ltd, Moragolla Hydropower Project appointed the National Building
Research Organization (NBRO) to conduct the following additional studies on natural
environment:
Water quality of the Mahaweli Ganga
Aquatic ecology of the Mahaweli Ganga
Groundwater quality and distribution along the proposed tunnel route
Updated land-use mapping
This report presents the study conducted for river water quality as described in Terms of
Reference (ToR) shown in Annex 1, which addresses following aspects:
Water quality in the river upstream and downstream of the proposed dam site at
Moragolla during the low flow season in March 2013 and May 2013; at the start of high
flow season
Sampling, analysis and Quality Control procedures
Local and seasonal variations in the water quality in the Mahaweli Ganga
Likely water quality impacts in the reservoir during and after impoundment, with a
discussion of likely seasonal variations
Likely water quality impacts downstream during scheme operation
Mitigation measures
2. Scope of the study
The ToR required river water quality to be monitored in two seasons namely, dry season- low
flow condition and wet season- high flow condition. Accordingly, two sampling events were
planned. Monitoring in dry and wet seasons was conducted in March and May, 2013
respectively.
In the sampling program, 10 locations were employed for the collection of water samples at
approximately 500 m intervals along the river. These extended from 500 m above the confluence
between the Kotmale Oya and Mahaweli Ganga (one station at the confluence and one station

2
500 m upstream in both rivers) to 500 m downstream of the confluence with the Atabage Oya.
The locations were chosen with the intention to capture baseline water quality of the river
immediately upstream and downstream of the proposed Moragolla dam and the reservoir.
Duplicate samples were supposed to be collected from all 10 locations within a day.
3. Justification for selection of sampling points
The project staff of NBRO (refer Annex 2) visited the study area on the 1st, 2
ndand 5
thMarch
2013 to decide sampling locations. In these site visits, it was found that access to some sampling
locations indicated in the ToR was difficult due to steep terrain conditions. It was also noticed
that proposed upstream locations around the confluence inundate during high-flow conditions as
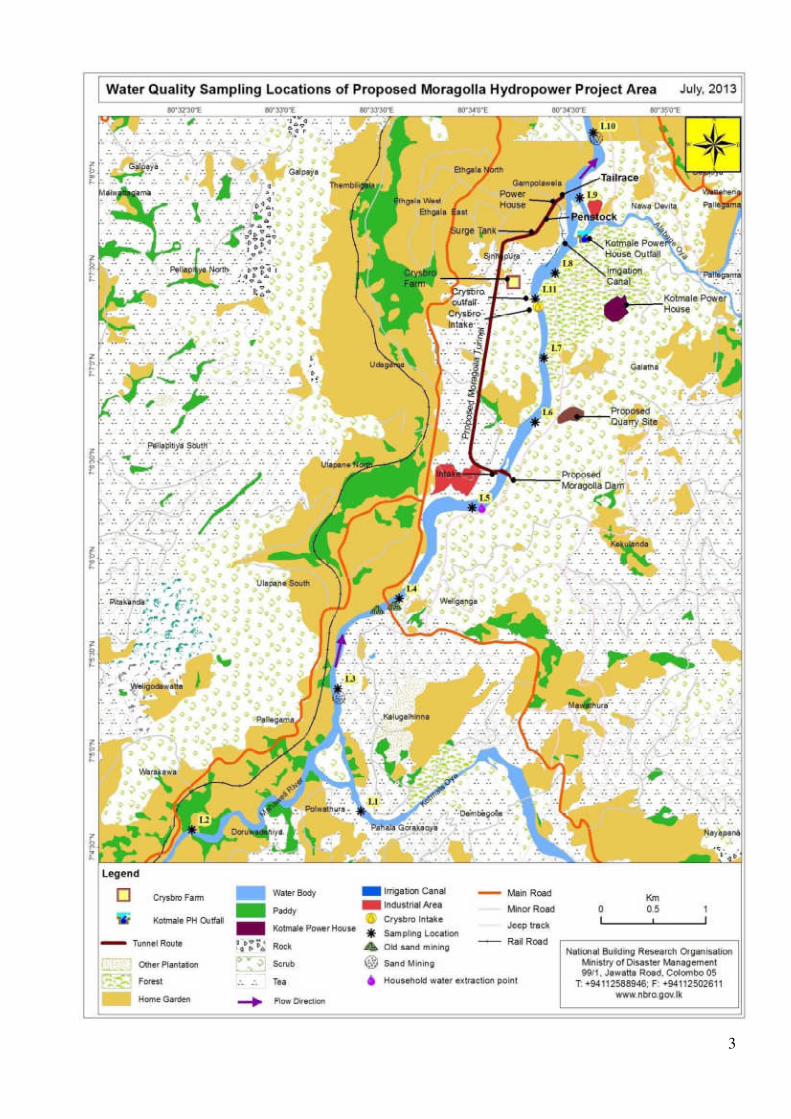
floodplain is wide in this river section. The sampling points 1, 2 and 3 specified in the ToR were
changed accordingly (refer Fig.1, Annex 3: L1, L2 and L3). The water quality at these sampling
points can be considered representative of those specified in the ToR, as there were no major
inputs from tributaries between the two.
Although, the ToR specified a sampling point at Crysbro Broiler Farm wastewater outfall, this
could not be established due to the following site-specific reasons (a) the Crysbro Broiler Farm
has installed a pipeline to divert its wastewater directly into the river, down a very steep slope
and this line was observed to be severely damaged during the days of sampling (b) during allsampling sessions there was no discharge from this outfall although it was observed in the initial
survey (refer Annex 4). A new sampling point replacing the one specified in the ToR (point L8)
was then established in the river immediately downstream of the Crysbro wastewater outfall to
capture the effects of any discharge from it.
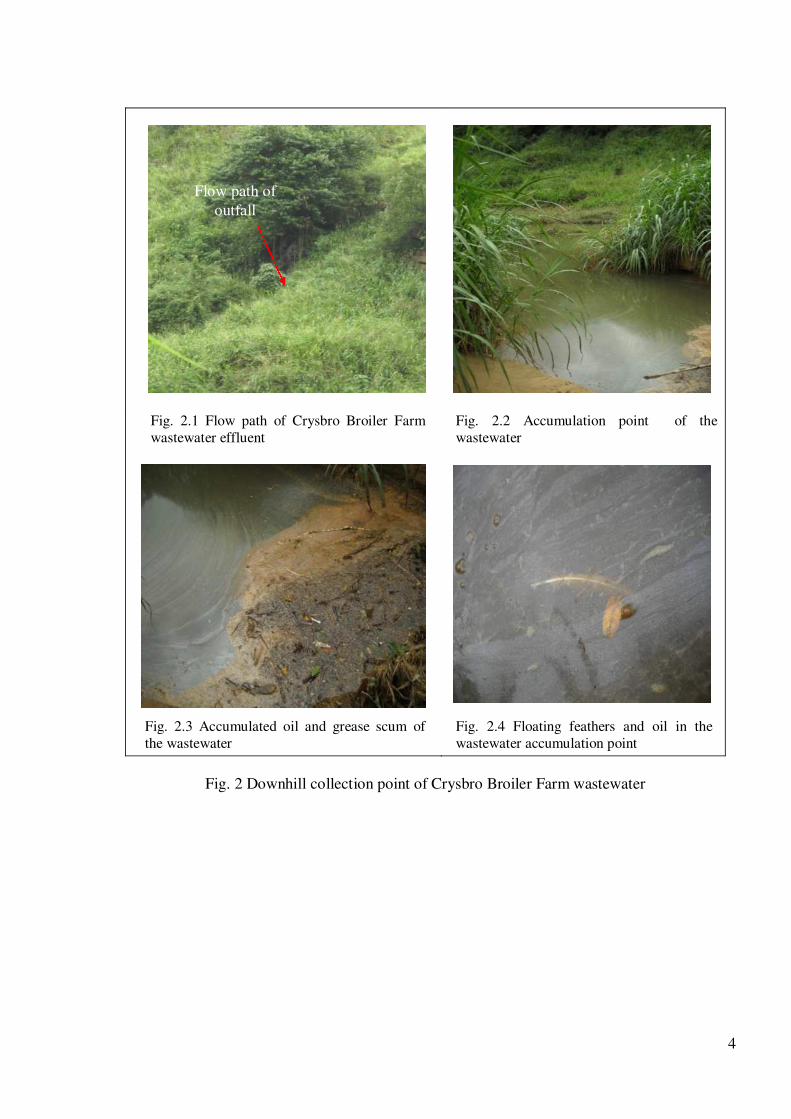
Considering the expected influence of wastewater released from Crysbro Broiler Farm on water
quality in the river, an additional visit was made on 2nd
July 2013 to locate the wastewater outfall
of this farm as there were no indications of any discharge to the waterways from the outfall
during previous visits. In this visit, the NBRO team observed a small path carrying wastewater
from the farm (refer Fig. 2) getting collected downhill (refer Fig. 2.2). Water samples from this
downhill location were collected as access to uphill is very unsafe. This location is assigned, L11
(refer Fig.1 and Annex 3).
3
4
Fig. 2 Downhill collection point of Crysbro Broiler Farm wastewater
Fig. 2.1 Flow path of Crysbro Broiler Farm
wastewater effluent
Fig. 2.2 Accumulation point of the
wastewater
Fig. 2.3 Accumulated oil and grease scum of
the wastewater
Fig. 2.4 Floating feathers and oil in the
wastewater accumulation point
Flow path of
outfall

5
4. The river uses and potential pollution sources
4.1 The river uses
The river water is used for several purposes in the length covered by this survey. These include
bathing (local people), industrial use and irrigation. Two bathing spots were observed in the
proposed reservoir area during surveys. The water intake of the Crysbro Broiler Farm
(abandoned during field surveys) and an irrigation supply named Dunhida Ela are located about
2 km downstream of the proposed dam site. (Refer Fig. 1, Annex 3).
4.2 Potential pollution sources
Wastewater dischargesThe only point pollution source in the study area near stations L3 and L10 (Fig.1) is the
wastewater discharge from the Crysbro Broiler Farm (refer Annex 3).
Sand mining activities
There are two active sand mining sites in the study area. The sand is mined manually by using a
locally fabricated basin like device fixed to a long bamboo pole. The river bed is scooped using
this device, the collected sand is then loaded into floating barges made of bamboo and taken
elsewhere. The sand mining activity causes: (a) increased short-term turbidity at the mining sitedue to re-suspension of sediment during sand removal operations, (b) alteration to river
morphology and river bank erosion in the long run. Sand mining activities were not observed
during the initial water quality sampling work.
Tea plantations
Isolated small scale plots of tea plantations were observed alongside and adjacent to the river
bank, around sampling locations L1, L2, L3 and L8. These plantations use agrochemicals1
such
as fertilizers and pesticides. The runoff contaminated with agrochemicals may pollute the river.
5. Sample collection, transportation and preservation
To reflect the low and high flow water quality conditions, samples were collected on 06.03.2013
(during dry season) and 15.05.2013 (after recent rainfall). All samples were collected between
7.30 am and about 4.00 pm because river flow conditions could change in a short period of time
depending on precipitation in the upper catchment. The samples of wastewater discharge from
Crysbro Broiler Farm were collected on 02.07.2013. It was done during the high low season and
the point of collection was location L1. Figure 1 and Annex 3 show the sampling locations and
Annex 5 provides the GPS reference and a description of each site.
Sample collection, preservation, transportation and analysis for physicochemical parameters
were carried out according to the Standard Methods2. The bacteriology (Faecal Coliforms and
Total Coliforms) sampling and analysis were done according to the Specification for Potable
Water3. Different devices were used in sampling depending on the method requirement.
Accordingly, samples for general water quality parameters were collected by flinging a clean
1The recommended Nitrogen and Phosphorus fertilizer applications for tea plantations are: Nitrogen, 10kg/ha , P2O5 60kg/ha ,
Source:www.fertilizer.org/ifa/content/download/9002/1338932 Standard Methods for the Examination of Water and Wastewater, American Public Health Association, AWWA, WEF, 20thEdition, 1998.3
Specification for potable water, bacteriological requirement, Sri Lanka Standards,614:1983, part 2

6
plastic bucket, tied to a rope, to the flowing water stream. Bottles having a ground-glass stopper
and flared mouth were used for the collection of water samples for the determination of
Dissolved Oxygen (DO) and Biochemical Oxygen Demand (BOD) whilst pre sterilized bottles
were used for the collection of samples for bacteriological analysis. Duplicate water samples
were collected from each location within 10 minutes from the collection of first sample.
Accordingly, the sampling covered collection of 22 samples from 11 locations.
The water samples collected for water quality parameters except for DO, BOD and
bacteriological analysis were transferred securely into clean plastic screw-top containers, and
those collected for Dissolved Oxygen were fixed at site by adding MnSO4 and alkali-iodize
azide reagents. All samples were labelled with location No, date and specific parameter to be
analysed. Carefully packed samples in separate cooler boxes with ice were then transported to
the NBRO laboratory, Colombo on the same day. A temperature of 4 -100
C was maintained
during transportation. In the laboratory, the samples were stored at 40
C until analysis was
performed.
6. Analysis of samples for water quality parameters
The ToR instructs that the water should be analyzed for the total of nine water quality
parameters, namely, Total Suspended Solids, Biochemical Oxygen Demand (BOD5), Nitrate,Phosphate, Total Coliforms, Faecal Coliforms, Temperature, Dissolved Oxygen and Turbidity.
Considering the presence of forest river cover4, the slow stream flow in certain sections, rock
pools and the nature of anthropogenic pollution sources, Ammonia4
content in the water was also
measured. Instead of Phosphates, samples were analyzed for Total Phosphorus5. The pH,
Temperature and Turbidity were measured at site using calibrated meters. The analysis was
commenced on the following day of the sampling event of each session and continued 7 days.
Annex 6 presents the methodology followed in sampling and analysis.
7. Existing water quality
7.1 Seasonal variation of water quality
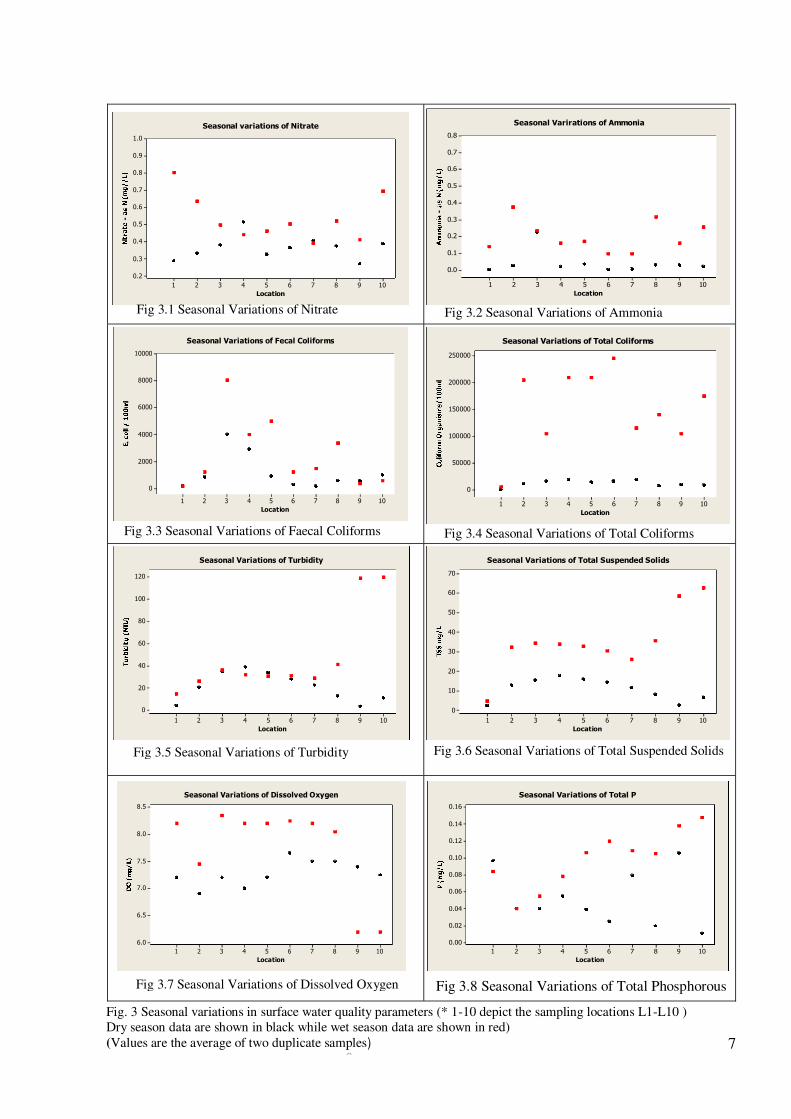
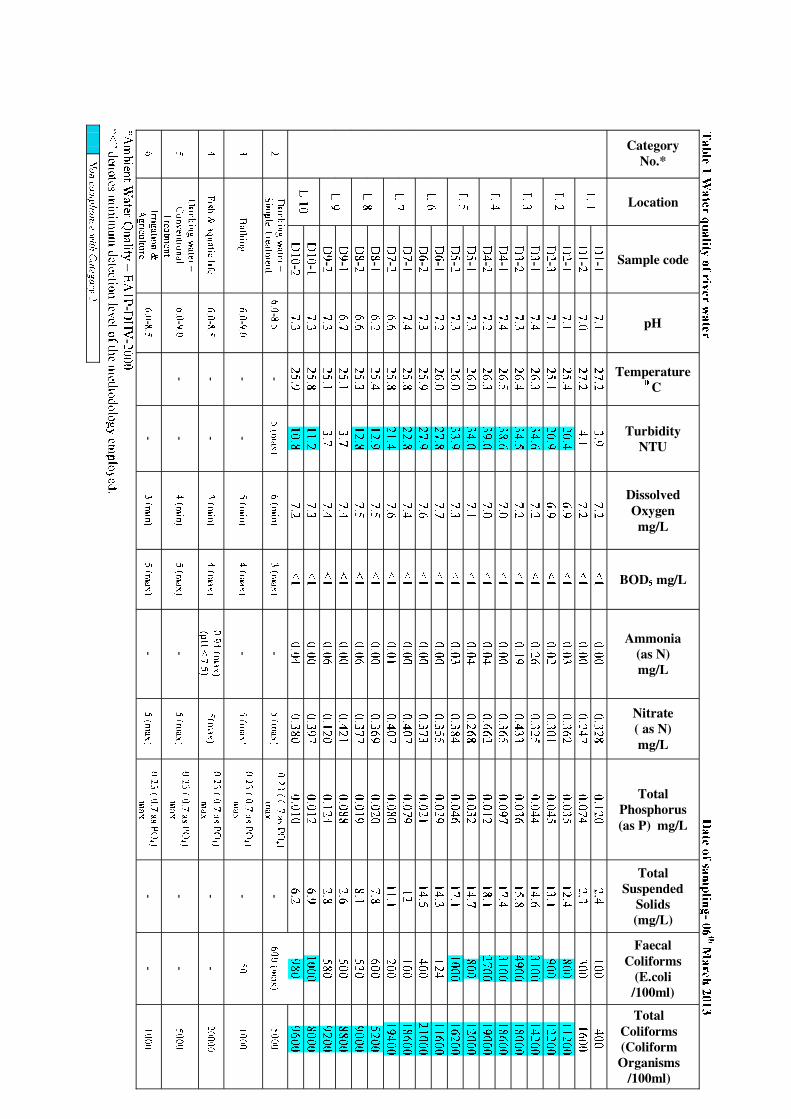
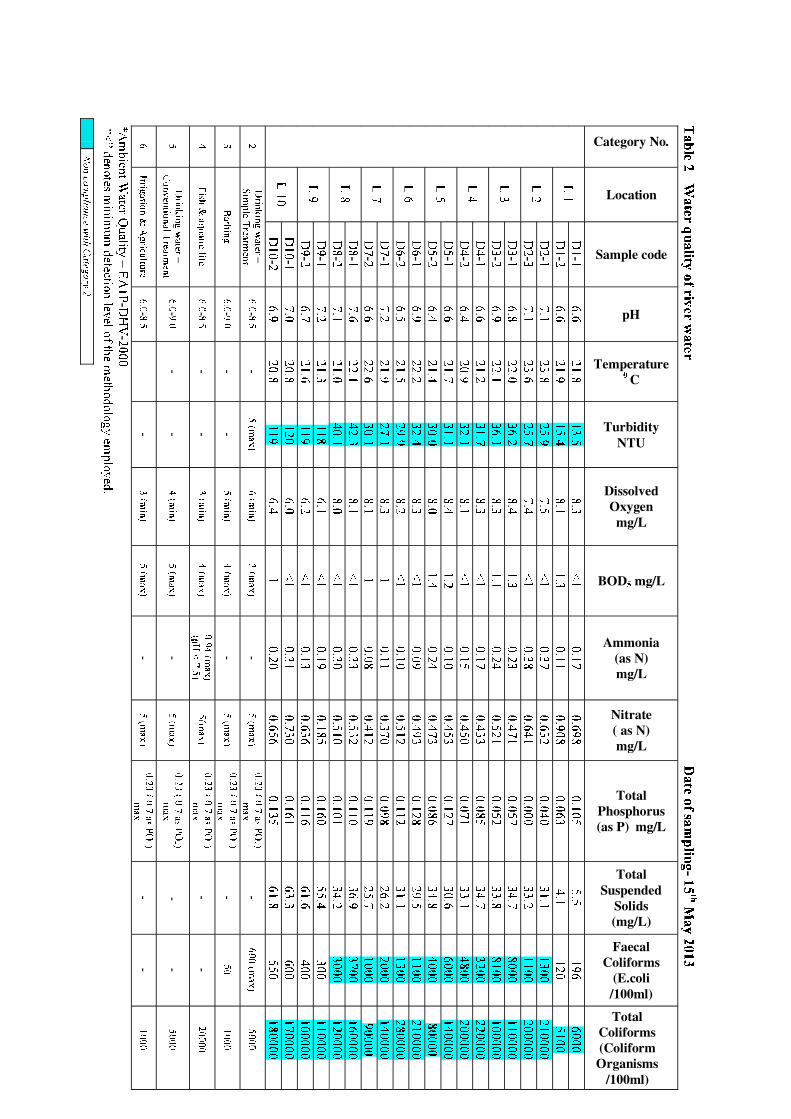
Tables 1 and 2 of Annex 7 contain the results of the analysis of river water quality in the wet and
dry seasons, and the data are shown graphically in Fig 3. This shows that at most stations the
concentration of most of the analysed parameters increases quite significantly in the wet season,
in comparison with the dry. Thus values of dissolved oxygen are generally higher under high
flow conditions because of increased atmospheric exchange caused by high surface turbulence.
However values of suspended solids, plant nutrients (nitrate and phosphate) and other
contaminants such as ammonia and faecal and total coliform bacteria are also higher in the wet
season, most likely because of runoff of soil containing fertilizers and other material of
anthropogenic origin. The significantly higher counts of total coliform than faecal coliforms
4 Water draining from forest catchment generally contains high ammonia levels. Most of the nitrogen found in forest runofforiginates from the decay of plants and animals waste products including animal urine. Ammonia Nitrogen is the early form ofnitrogen resulting from biological breakdown of biological waste products. Since it is readily oxidized to either nitrite or nitrate
under aerobic conditions, high amounts of this pollutant may indicate a fairly fresh or recent pollution event.5 Phosphorus occurs in dissolved organic and inorganic forms or attached to sediment particles. Phosphate is an inorganicdissolved form and readily taken by aquatic flora, but other forms can be used when phosphates are unavailable.
7
Location
10987654321
1.0
0.9
0.8
0.7
0.6
0.5
0.4
0.3
0.2
Seasonal variations of Nitrate
Location
10987654321
0.8
0.7
0.6
0.5
0.4
0.3
0.2
0.1
0.0
Seasonal Varirations of Ammonia
Location
10987654321
10000
8000
6000
4000
2000
0
Seasonal Variations of Fecal Coliforms
Location
10987654321
250000
200000
150000
100000
50000
0
Seasonal Variations of Total Coliforms
Location
10987654321
120
100
80
60
40
20
0
Seasonal Variations of Turbidity
Location
10987654321
70
60
50
40
30
20
10
0
Seasonal Variations of Total Suspended Solids
Location
10987654321
8.5
8.0
7.5
7.0
6.5
6.0
Seasonal Variations of Dissolved Oxygen
Location
10987654321
0.16
0.14
0.12
0.10
0.08
0.06
0.04
0.02
0.00
Seasonal Variations of Total P
Fig 3.2 Seasonal Variations of AmmoniaFig 3.1 Seasonal Variations of Nitrate
Fig 3.4 Seasonal Variations of Total ColiformsFig 3.3 Seasonal Variations of Faecal Coliforms
Fig 3.6 Seasonal Variations of Total Suspended SolidsFig 3.5 Seasonal Variations of Turbidity
Fig 3.7 Seasonal Variations of Dissolved Oxygen Fig 3.8 Seasonal Variations of Total Phosphorous
Fig. 3 Seasonal variations in surface water quality parameters (* 1-10 depict the sampling locations L1-L10 )
Dry season data are shown in black while wet season data are shown in red)
(Values are the average of two duplicate samples)
6
8
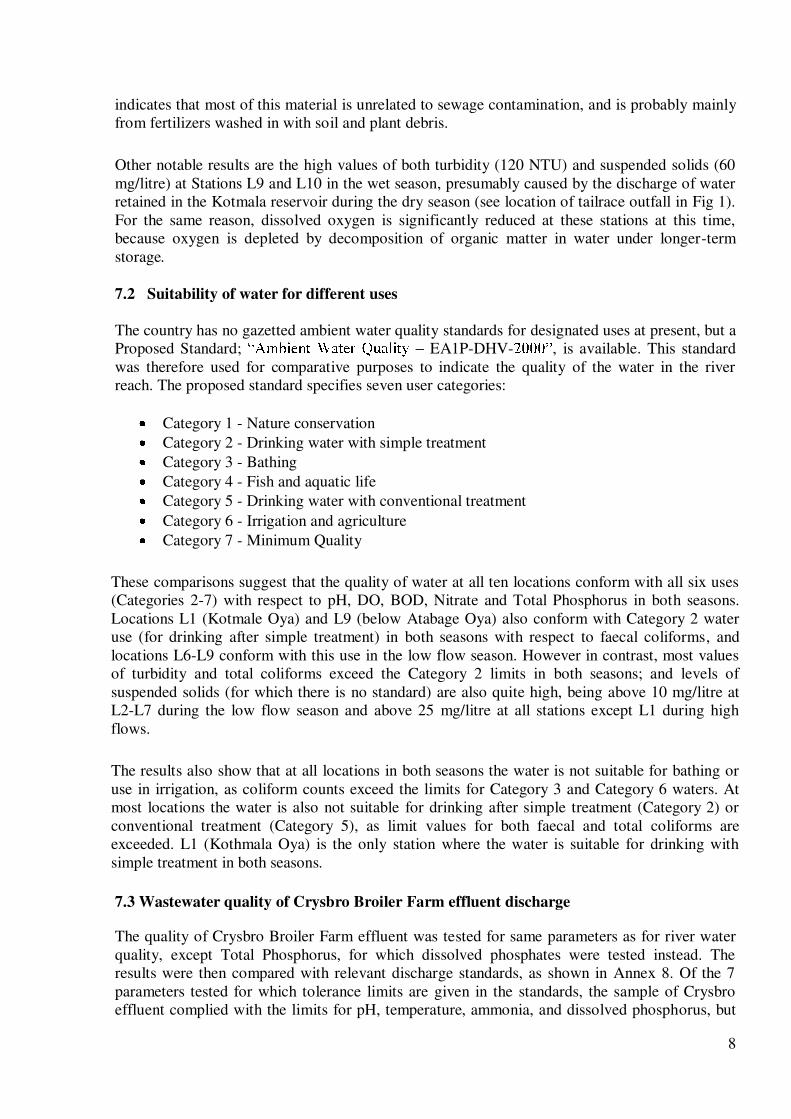
indicates that most of this material is unrelated to sewage contamination, and is probably mainly
from fertilizers washed in with soil and plant debris.
Other notable results are the high values of both turbidity (120 NTU) and suspended solids (60
mg/litre) at Stations L9 and L10 in the wet season, presumably caused by the discharge of water
retained in the Kotmala reservoir during the dry season (see location of tailrace outfall in Fig 1).
For the same reason, dissolved oxygen is significantly reduced at these stations at this time,
because oxygen is depleted by decomposition of organic matter in water under longer-term
storage.
7.2 Suitability of water for different uses
The country has no gazetted ambient water quality standards for designated uses at present, but a
Proposed Standard; EA1P-DHV- , is available. This standard
was therefore used for comparative purposes to indicate the quality of the water in the river
reach. The proposed standard specifies seven user categories:
Category 1 - Nature conservation
Category 2 - Drinking water with simple treatment
Category 3 - Bathing
Category 4 - Fish and aquatic life
Category 5 - Drinking water with conventional treatment
Category 6 - Irrigation and agriculture
Category 7 - Minimum Quality
These comparisons suggest that the quality of water at all ten locations conform with all six uses
(Categories 2-7) with respect to pH, DO, BOD, Nitrate and Total Phosphorus in both seasons.
Locations L1 (Kotmale Oya) and L9 (below Atabage Oya) also conform with Category 2 water
use (for drinking after simple treatment) in both seasons with respect to faecal coliforms, and
locations L6-L9 conform with this use in the low flow season. However in contrast, most values
of turbidity and total coliforms exceed the Category 2 limits in both seasons; and levels of
suspended solids (for which there is no standard) are also quite high, being above 10 mg/litre at
L2-L7 during the low flow season and above 25 mg/litre at all stations except L1 during high
flows.
The results also show that at all locations in both seasons the water is not suitable for bathing or
use in irrigation, as coliform counts exceed the limits for Category 3 and Category 6 waters. At
most locations the water is also not suitable for drinking after simple treatment (Category 2) or
conventional treatment (Category 5), as limit values for both faecal and total coliforms are
exceeded. L1 (Kothmala Oya) is the only station where the water is suitable for drinking with
simple treatment in both seasons.
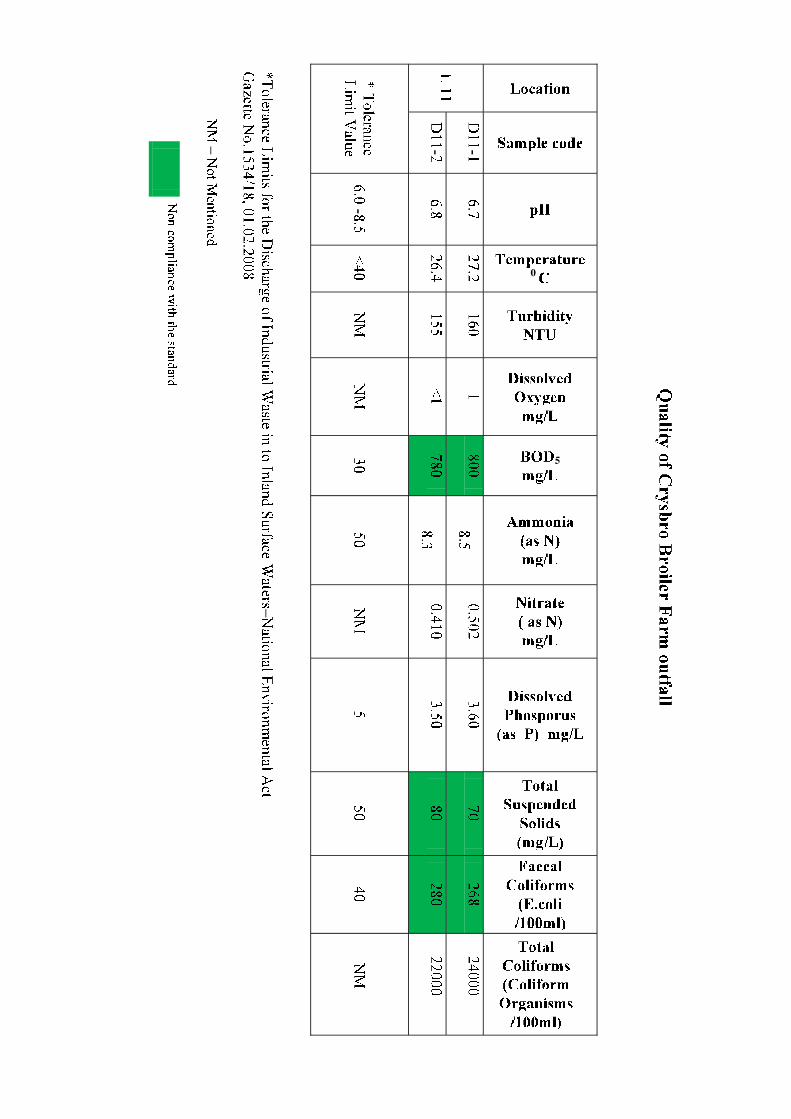
7.3 Wastewater quality of Crysbro Broiler Farm effluent discharge
The quality of Crysbro Broiler Farm effluent was tested for same parameters as for river water
quality, except Total Phosphorus, for which dissolved phosphates were tested instead. The
results were then compared with relevant discharge standards, as shown in Annex 8. Of the 7
parameters tested for which tolerance limits are given in the standards, the sample of Crysbro
effluent complied with the limits for pH, temperature, ammonia, and dissolved phosphorus, but
9
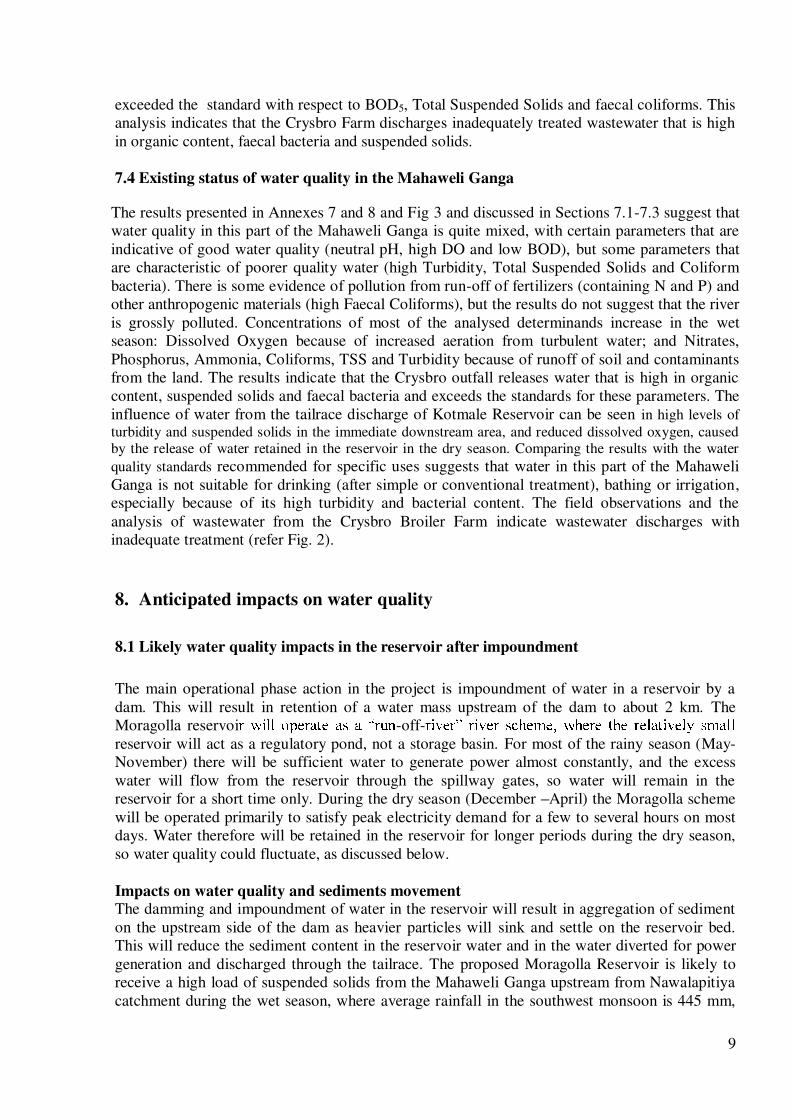
exceeded the standard with respect to BOD5, Total Suspended Solids and faecal coliforms. This
analysis indicates that the Crysbro Farm discharges inadequately treated wastewater that is high
in organic content, faecal bacteria and suspended solids.
7.4 Existing status of water quality in the Mahaweli Ganga
The results presented in Annexes 7 and 8 and Fig 3 and discussed in Sections 7.1-7.3 suggest that
water quality in this part of the Mahaweli Ganga is quite mixed, with certain parameters that are
indicative of good water quality (neutral pH, high DO and low BOD), but some parameters that
are characteristic of poorer quality water (high Turbidity, Total Suspended Solids and Coliform
bacteria). There is some evidence of pollution from run-off of fertilizers (containing N and P) and
other anthropogenic materials (high Faecal Coliforms), but the results do not suggest that the river
is grossly polluted. Concentrations of most of the analysed determinands increase in the wet
season: Dissolved Oxygen because of increased aeration from turbulent water; and Nitrates,
Phosphorus, Ammonia, Coliforms, TSS and Turbidity because of runoff of soil and contaminants
from the land. The results indicate that the Crysbro outfall releases water that is high in organic
content, suspended solids and faecal bacteria and exceeds the standards for these parameters. The
influence of water from the tailrace discharge of Kotmale Reservoir can be seen in high levels of
turbidity and suspended solids in the immediate downstream area, and reduced dissolved oxygen, causedby the release of water retained in the reservoir in the dry season. Comparing the results with the water
quality standards recommended for specific uses suggests that water in this part of the Mahaweli
Ganga is not suitable for drinking (after simple or conventional treatment), bathing or irrigation,especially because of its high turbidity and bacterial content. The field observations and the
analysis of wastewater from the Crysbro Broiler Farm indicate wastewater discharges with
inadequate treatment (refer Fig. 2).
8. Anticipated impacts on water quality
8.1 Likely water quality impacts in the reservoir after impoundment
The main operational phase action in the project is impoundment of water in a reservoir by a
dam. This will result in retention of a water mass upstream of the dam to about 2 km. The
Moragolla reservoi -off-
reservoir will act as a regulatory pond, not a storage basin. For most of the rainy season (May-
November) there will be sufficient water to generate power almost constantly, and the excess
water will flow from the reservoir through the spillway gates, so water will remain in the
reservoir for a short time only. During the dry season (December April) the Moragolla scheme
will be operated primarily to satisfy peak electricity demand for a few to several hours on most
days. Water therefore will be retained in the reservoir for longer periods during the dry season,
so water quality could fluctuate, as discussed below.
Impacts on water quality and sediments movementThe damming and impoundment of water in the reservoir will result in aggregation of sediment
on the upstream side of the dam as heavier particles will sink and settle on the reservoir bed.
This will reduce the sediment content in the reservoir water and in the water diverted for power
generation and discharged through the tailrace. The proposed Moragolla Reservoir is likely to
receive a high load of suspended solids from the Mahaweli Ganga upstream from Nawalapitiya
catchment during the wet season, where average rainfall in the southwest monsoon is 445 mm,

10
compared with 147 mm6
in the dry season. The results from the present survey show increased
Suspended Solids in water in the wet season in comparison to dry season (refer Fig 3.6), most
probably due to ingression of silt-laden runoff water into the river. Furthermore, a reduction in
Faecal and Total Coliform bacteria counts in the tailrace discharge can be anticipated due to
natural decay after retention of water in the reservoir. The reduction in both sediments and
Faecal Coliform bacteria will have positive impact on the downstream water quality. The
accumulation of sediment, however, should be taken into account in planning, design and
operation of the reservoir.
The accumulated sediments may also contain organic and nutrient-bound particles, especially
Phosphorus (the limiting nutrient for algal growth), and there is therefore a likelihood of
increased levels of these nutrients in the reservoir as well as in the tailrace discharge.
The above mentioned impacts of eutrophication and low oxygen levels are not expected to be
highly significant however, and will depend on several factors such as hydraulic retention,
reservoir circulation, inputs of organic matter, nutrients, rainfall, wind conditions, reservoir
sediment m - of -
water will have low retention in both seasons and will not be subjected to sufficient retention to
cause the above mentioned impacts.
Entry of debris into reservoirDuring the survey, heavy loads of debris were observed trapped in natural depressions along
either side of the river. They consist of dead plant material, plastic bottles, polythene and other
anthropogenic matter (refer Annex 4) left stranded after the previous high flow season. The
floating and settable organic material may decompose and impair the water quality by increasedBOD and Suspended Solids, and lower Dissolved Oxygen levels. Furthermore, influx of plastics
and other inert debris into the reservoir may hamper power generation operations if left
unattended.
8.2 Likely downstream water quality impacts during scheme operation
The river reach downstream of dam is likely to be affected by impacts such as flow reduction,
reduction in sediment load, altered nutrient flux due to presence of the physical barrier imposed
by the dam and the upstream impoundment. The water quality impacts specific to this project are
indicated below.
As explained in Section 8.1 above, throughout most of the wet season, water will be retained in
the reservoir area for a relatively short time, so there are unlikely to be major changes in water
quality, apart from small improvements that may arise from reductions in the sediment and
bacterial content as a result of natural settlement and decay respectively. Throughout the dry
season however, water will be retained for longer periods, so there could be changes in water
quality, the nature and extent of which will depend on the factors mentioned above. In general
the water flowing downstream at this time is expected to be lower in sediment and bacterial
content, but also lower in oxygen because of the decay of organic matter in the reservoir and
limited atmospheric replenishment at the surface. There will also be reductions in the quantity of
water flowing downstream in the dry season, when water will flow through the tailrace and into
the river only when power is generated (ie a few to several hours on most days). The only water
flowing from the dam at this time will be the 1.5m3/s environmental flow.
6 Revised Feasibility Study Report (Draft) Moragolla Hydropower Project Volume 1- Main Report-Nippon Koei Co., Ltd inJoint venture with Nippon Koei India Pvt. Ltd
11
Water quality impacts due to reduction in river flow between proposed dam and the
tailrace
The impoundment will reduce natural stream flow along the river reach of 3 km from the
proposed dam to the tailrace outfall. The reduced flow is likely to have an impact on the river
water quality as wastewater from the Crysbro Broiler Farm is discharged in to the river reach to
be affected by low flow during generation of hydropower. In the dry season, the low stream
discharge may be inadequate to dilute the pollutants in the wastewater. The BOD, Suspended
Solids, Oil and grease from the wastewater will increase the levels of these pollutants in the
river, and may cause a reduction in dissolved oxygen from the decomposition process.
Furthermore, Faecal Coliform counts in the river reach up to the tailrace are likely to rise.
Impact on the irrigation water
The likely impacts noted above could be significant on the water in the irrigation canal (Dunhida
Ela) because the river water contaminated with waste from Crysbro Broiler Farm may enter the
irrigation water supply posing potential health problems for people who come into contact with
the water. The impacts however, may not be highly significant during wet season because
-of-
Impacts on downstream drinking water sourcesThe likely impacts on the drinking water sources are insignificant as there are no drinking water
intakes between proposed dam and the tailrace outlet. The Crysbro Broiler Farm water intake islocated downstream of the dam above their wastewater discharge location. This location is
abandoned at present and therefore there is no impact.
Impacts on aquatic faunaThe river water contaminated with pollutants will have an impact on the natural aquatic fauna
and flora downstream. The water quality impacts on aquatic fauna are discussed in the ecology
report.
9. Proposed mitigation measures
The impact analysis above revealed some impacts that are significant on water quality and water
uses. They include impacts due to: entry of debris into reservoir, sediment management activities
and downstream water quality impacts and those on downstream water quality due to Crysbro
Broiler Farm wastewater. The mitigation measures are proposed in this section to minimise these
impacts.
9.1 Mitigation of likely water quality impacts in the reservoir after impoundment
Mitigation of impacts due to entry of debris into reservoirThe Moragolla dam will be equipped with a flap gate on the top of one of the spillway gates. The
floating debris in the vicinity of the dam will be discharged with water over the flap gate. Debris
built up at the intake trashrack can be removed by a mechanical rake equipped at the intake.
Mitigation of impacts due to sediment management activities
The design of the Moragolla dam does not have a facility for the flushing of retained sediment. It
may take 30 years or more for the sediment in the reservoir to reach the spillway crest level
which is 8m below the minimum operation level of the reservoir. The sediment further
accumulated will then be removed by mechanical dredging or sediment sluicing through the
spillway gates at the high flow season or the combination thereof.

12
9.2 Mitigation of likely downstream water quality impacts
The following mitigation measures are proposed to minimize likely downstream water quality
impacts due to project actions in the operation phase.
Release of Environmental flow
A release of 1.5m3/sec Environmental flow has been considered in the project feasibility to
compensate downstream water uses. This environmental flow will provide some dilution for
incoming pollutants including those from Crysbro Broiler Farm wastewater. The analysis of
wastewater however, suggests that this industry might discharge wastewater containing pollutants
exceeding stipulated tolerance limits. The dilution to be provided by the above environmental
release and other inputs from tributaries therefore may not be adequate to maintain good water
quality in the river reach up to the tailrace. Mitigation options indicated below are proposed to
minimize potential impacts of Broiler farm wastewater on water quality in the river.
Alternative 1 - Monitoring to ensure enforcement of stipulated discharge limits for
Crysbro Broiler Farm wastewaterAction by the project agencies in coordination with the Central Environmental Authority is
suggested to ensure that the Crysbro industry discharges treated wastewater in compliance with
stipulated discharge standards at all times. This option is considered reasonable due to the
following: a) the wastewater of Crysbro Broiler Farm is the only point pollution source in thearea with potentially high impact on downstream water quality; b) the water quality in the river
is not heavily impaired at present so it has an assimilation capacity for pollutants; and c) more
importantly, the river reach that will be most affected by reduced flow (between the dam and the
tailrace) has no highly sensitive water uses such as drinking and bathing, although it does
support sensitive aquatic organisms. Establishment of a sound monitoring plan is therefore
suggested to ensure that the wastewater discharges comply with the appropriate legal standards.
The actions in the event of violation of the stipulated standards will be determined by CEA,
which is the legally responsible body.
Alternative 2- Relocation of Crysbro Broiler Farm outfall downstream of the proposed
tailrace outlet
The project design has considered this option as a viable alternative and the option suggests
conveying wastewater of this industry and locating its outfall downstream of the proposed
tailrace outlet. This option, however may be costly and also require proper design and operation
to ensure that the volume of wastewater is within the design capacity of the conveyance system.

Annexure_______________________________________________________________

Annex 1_______________________________________________________________
Terms of Reference (ToR)
TOR FOR WATER QUALITY IN THE MAHAWELI GANGA
Objective
Data presented in the EIAI
report provided some evidence of water quality issues in the
Mahaweli Ganga, including possible contamination with faecal bacteria from the outfall of
the Crysbro Broiler Farm.
This is downstream of the dam in the 3 km reach that will be subjected to lower flows during
scheme operation, so pollution impacts could be exacerbated by reduced dilution and
dispersion. This survey will: a) investigate the present quality of water in the river upstream
and downstream of the proposed dam site; b) determine the nature, extent and likely sources
of any pollution; and c) predict the quality of water impounded in the Moragolla reservoir,
and discharged downstream when the scheme is operating.
Scope of work
The Contractor shall collect duplicate water samples from the Mahaweli Ganga at 10 stations
located at approximately 500m intervals, from 500m above the confluence between the
Kothmale Oya and Mahaweli Ganga (one station at the confluence and one station 500 m
upstream in both rivers) and 500m downstream of the confluence with the Atabage Oya. One
station shall be located directly in the outflow from the Crysbro Broiler Plant.
Water samples shall be collected at midday, from the centre of the river at each station,
during the low flow season in February/March 2013 and at the start of the high flow season
at the end of May 2013. Samples shall be transported promptly to a Government-accredited
laboratory, under controlled temperature conditions as prescribed by the laboratory. In the
laboratory, samples shall be analysed for total suspended solids, BOD5, nitrate, phosphate,
total coliforms and faecal coliforms. Temperature, dissolved oxygen and turbidity shall be
measured on site, using accurately calibrated meters.
___________________________________1 Moragolla Hydropower Project, Feasibility Study. Final Report: Volume Environmental Impact Assessment (CentralEngineering Consultancy Bureau, Sri Lanka and AI-Habshi Consultants Office, Kuwait).

Programme and ReportingThe Contractor shall submit a draft Interim Report on 31 March 2013 and a draft Final
Report on 7 June 2013. Both reports will be reviewed by the Study Team and the Contractor
shall amend the reports to address all comments and shall submit final reports within two
weeks of receipt of comments.
The Interim Report shall present and discuss all data collected in the first survey and the
Final Report shall present all data from both surveys and shall include the following:
Map of the sampling stations, site photographs and appropriate tables and illustrations of
key data
Written descriptions of all sampling and analysis methods (full details) and quality
control procedures operated by the laboratory
A detailed discussion of the results, including but not necessarily limited to
o Water quality in this part of the Mahaweli Ganga and local and seasonal variations;
o Evidence of any pollution, comparing data with appropriate national and international
standards; and likely pollution sources;
o Likely water quality in the reservoir during and after impoundment, with reasons;
o Likely water quality downstream during scheme operation (flow characteristics will be
shown by a hydrological simulation study to be conducted in January 2013)
o Suitable mitigation for any negative impacts of scheme operation on water quality
Tables showing all data should be provided in an appendix.

Annex 2
________________________________________________________
Study team

Study team
Key staff
Name Designation
Ms S V Dias Senior Scientist
Water Quality Specialist
Mr IAVP Iddamalgoda
Ms S A M S Dissanayake
Senior Scientist
Senior Scientist
Mr HDS Premasiri Senior Scientist
Mr Vimukthi Sumanasekara Scientist
Ms H.T.J. Seneviratne Scientist
Laboratory analysis team
Name Designation
Ms P D C Pathiraja Technical Assistant
Ms P H D Silva Technical Assistant
Ms Thilangika Gunawardena Project Assistant
Support staff
Name Designation
Mr N Krishnamoorthi Field Assistant
Mr Chamath Vithanage Field Assistant
Mr WA Weerasinghe Field Assistant
Mr A Premaratne Field Assistant

Annex 3
_______________________________________________________________
Map of river water quality sampling locations

Proposed
Moragolla Dam
Power
House
Tailrace
Intake
Surge Tank
Penstock
Kotmale Power
House Outfall
Kotmale Power
HouseCrysbro
Intake
Crysbro
outfall
Proposed
Quarry Site
Crysbro
Farm
Irrigation
Canal
L2
L1
L3
L4
L5
L6
L7
L8
L9
L11
L10
Galatha
Mawathura
Udagama
Kekulanda
Pellapitiya North
Ulapane South
Pallegama
Pellapitiya South
Kalugalhinna
Weliganga
Ulapane North
Sinhapura
Warakawa
Pitakanda
Nawa Devita
DambagollaPolwathura
Thembiligala Gampolawela
Weligodawatta
Delpitiya
Doruwadeniya Nayapana
Ethgala West
Ethgala East
Pallegama
Malwattagama
Ethgala North
Pahala Gorakaoya
Wattehena
GalpayaGalpaya
Pallegama
80°35'0"E80°34'30"E80°34'0"E80°33'30"E80°33'0"E80°32'30"E
Water Quality Sampling Locations of Proposed Moragolla Hydropower Project Area July, 2013
National Building Research Organisation
Ministry of Disaster Management99/1, Jawatta Road, Colombo 05
T: +94112588946; F: +94112502611
www.nbro.gov.lk
®
Legend
Crysbro Farm
Kotmale PH Outfall
Tunnel Route
Other Plantation
Forest
Home Garden
Water Body
Paddy
Kotmale Power House
Rock
Scrub
Tea
Main Road
Minor Road
Jeep track
Rail Road
Irrigation Canal
Industrial Area
[p Crysbro Intake
k Sampling Location
43 Old sand mining
-Í Sand Mining
po Household water extraction point
0 10.5
Km
Flow Direction

Annex 4_______________________________________________________________
Photographs of pollution sources, river uses and river degradation
Pollution sources, River uses and river degradation
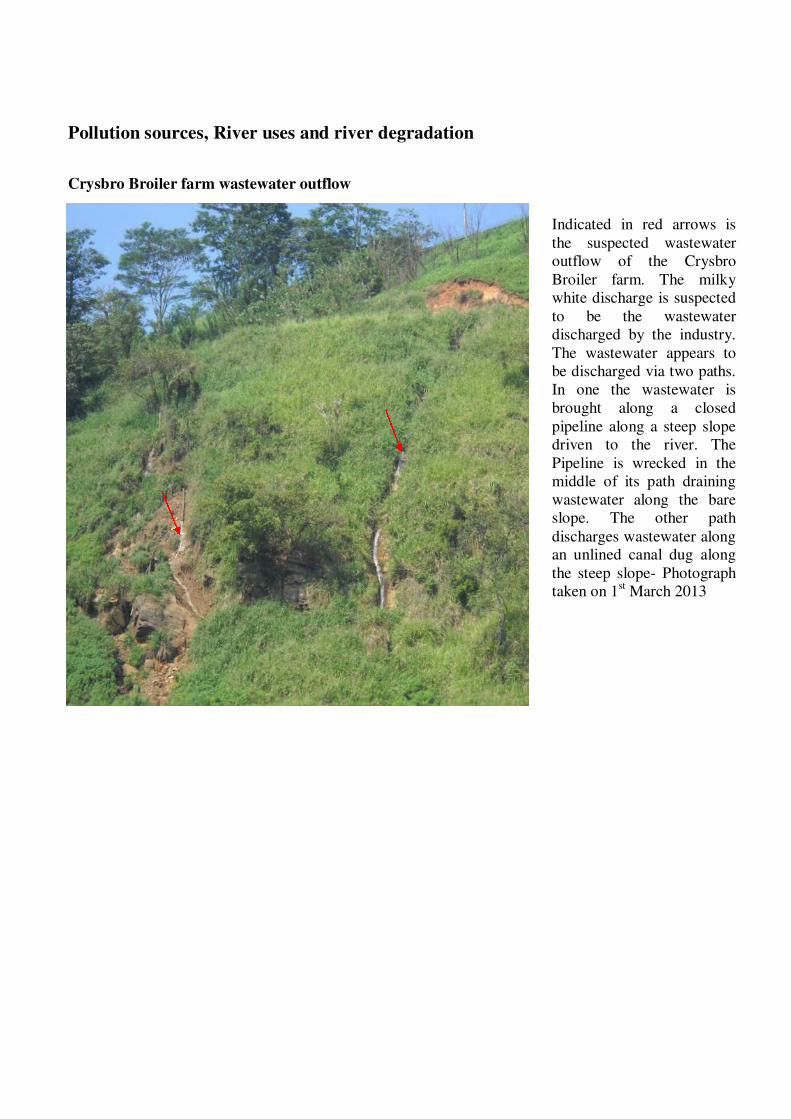
Crysbro Broiler farm wastewater outflow
Indicated in red arrows is
the suspected wastewater
outflow of the Crysbro
Broiler farm. The milky
white discharge is suspected
to be the wastewater
discharged by the industry.
The wastewater appears to
be discharged via two paths.
In one the wastewater is
brought along a closed
pipeline along a steep slope
driven to the river. The
Pipeline is wrecked in the
middle of its path draining
wastewater along the bare
slope. The other path
discharges wastewater alongan unlined canal dug along
the steep slope- Photograph
taken on 1st
March 2013

Some river uses
River degradation
Accumulation of trash in rock pools - observed in
locations 5.6.7.8
Water intake Crysbro Broiler Farm-
above location 8
Sand mining Between Locations 6-7
Water intake irrigation canal- bellow
location 7

Annex 5______________________________________________________________
GPS reference, descriptions and photographs of sampling locations
GPS reference of sampling locations and descriptions
Sample location
referenceGPS reference Description of location
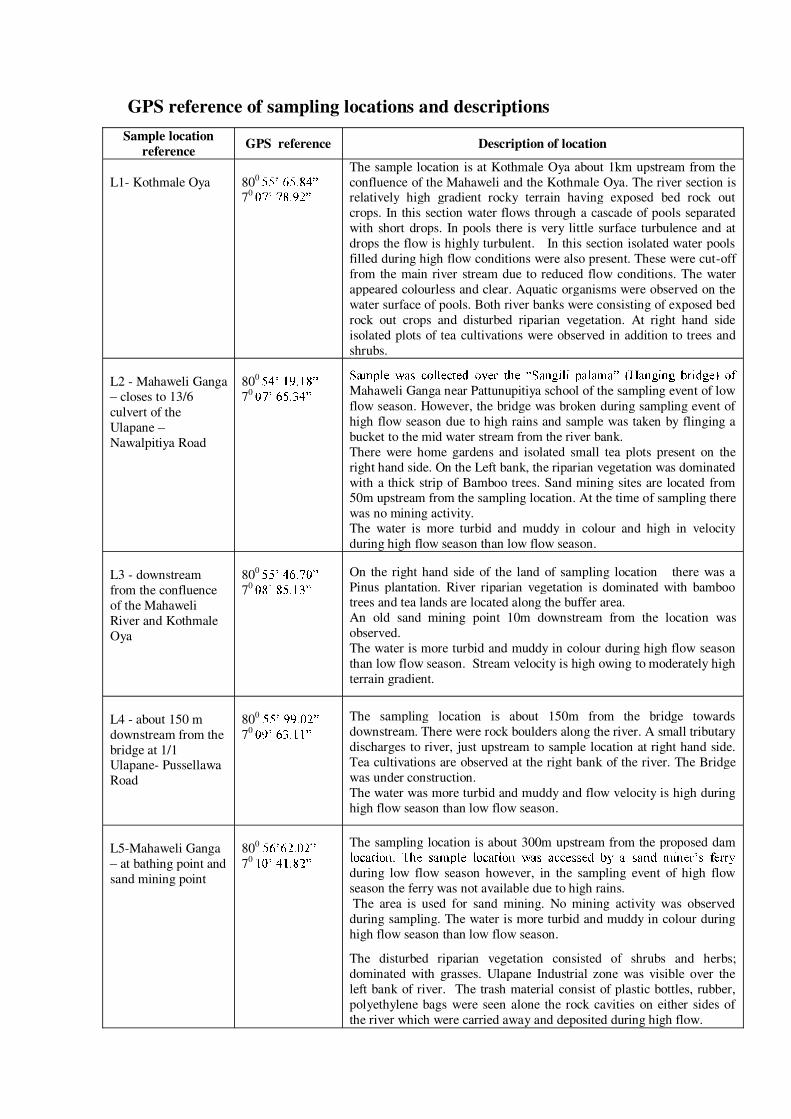
L1- Kothmale Oya 800
70
The sample location is at Kothmale Oya about 1km upstream from the
confluence of the Mahaweli and the Kothmale Oya. The river section isrelatively high gradient rocky terrain having exposed bed rock out
crops. In this section water flows through a cascade of pools separated
with short drops. In pools there is very little surface turbulence and at
drops the flow is highly turbulent. In this section isolated water pools
filled during high flow conditions were also present. These were cut-off
from the main river stream due to reduced flow conditions. The water
appeared colourless and clear. Aquatic organisms were observed on the
water surface of pools. Both river banks were consisting of exposed bed
rock out crops and disturbed riparian vegetation. At right hand side
isolated plots of tea cultivations were observed in addition to trees and
shrubs.
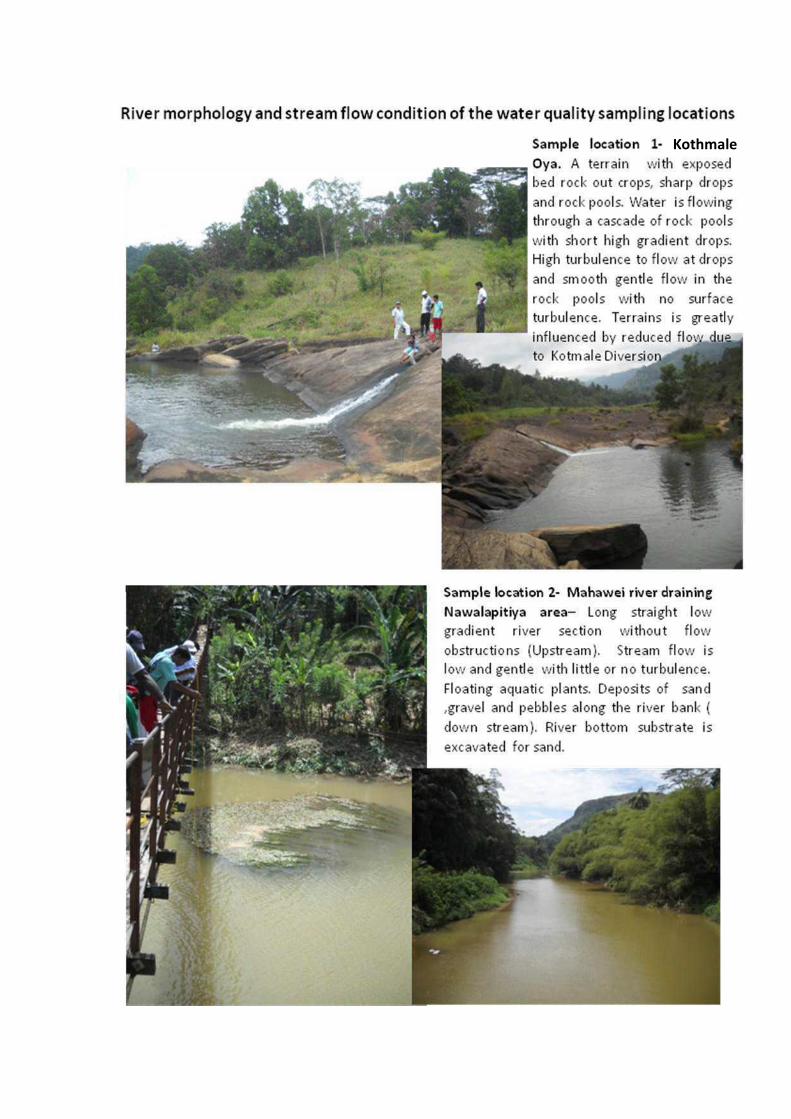
L2 - Mahaweli Gangacloses to 13/6
culvert of the
Ulapane
Nawalpitiya Road
800
70 Mahaweli Ganga near Pattunupitiya school of the sampling event of low
flow season. However, the bridge was broken during sampling event of
high flow season due to high rains and sample was taken by flinging a
bucket to the mid water stream from the river bank.
There were home gardens and isolated small tea plots present on the
right hand side. On the Left bank, the riparian vegetation was dominated
with a thick strip of Bamboo trees. Sand mining sites are located from50m upstream from the sampling location. At the time of sampling there
was no mining activity.The water is more turbid and muddy in colour and high in velocity
during high flow season than low flow season.
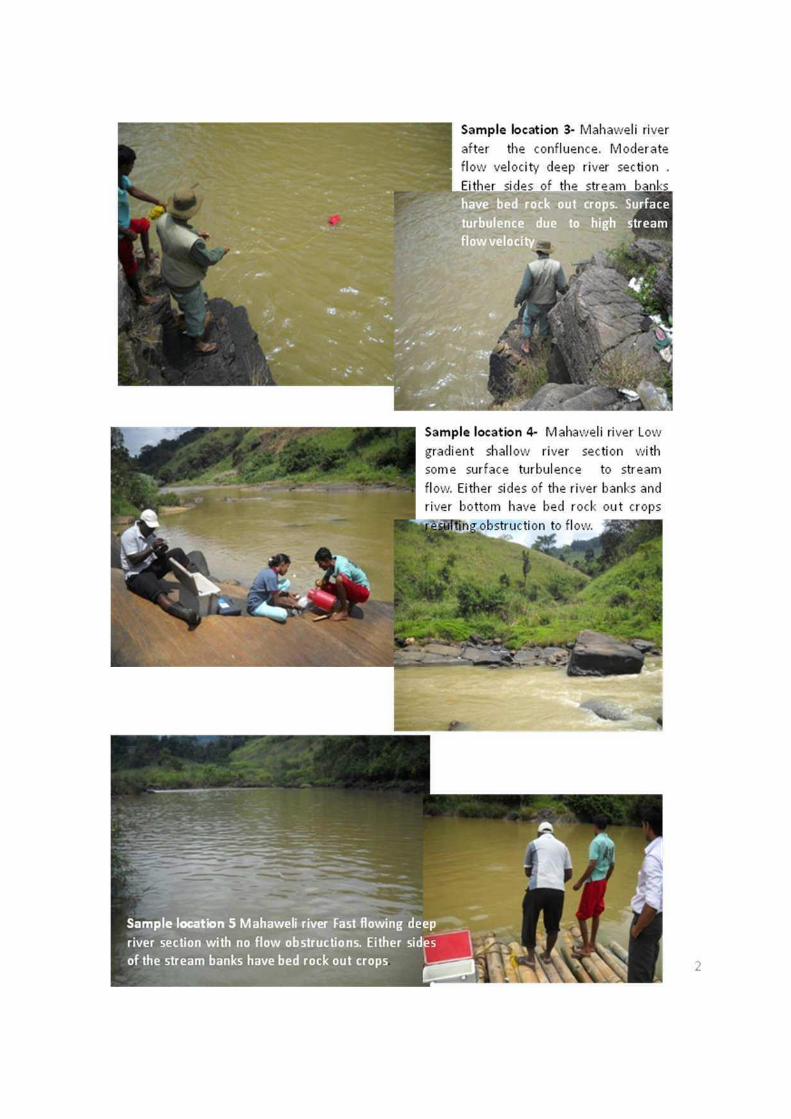
L3 - downstream
from the confluence
of the Mahaweli
River and Kothmale
Oya
800
70
On the right hand side of the land of sampling location there was a
Pinus plantation. River riparian vegetation is dominated with bambootrees and tea lands are located along the buffer area.
An old sand mining point 10m downstream from the location was
observed.
The water is more turbid and muddy in colour during high flow season
than low flow season. Stream velocity is high owing to moderately high
terrain gradient.
L4 - about 150 m
downstream from the
bridge at 1/1Ulapane- Pussellawa
Road
800
70
The sampling location is about 150m from the bridge towards
downstream. There were rock boulders along the river. A small tributary
discharges to river, just upstream to sample location at right hand side.
Tea cultivations are observed at the right bank of the river. The Bridge
was under construction.
The water was more turbid and muddy and flow velocity is high during
high flow season than low flow season.
L5-Mahaweli Ganga
at bathing point and
sand mining point
800
70
The sampling location is about 300m upstream from the proposed dam
during low flow season however, in the sampling event of high flow
season the ferry was not available due to high rains.
The area is used for sand mining. No mining activity was observed
during sampling. The water is more turbid and muddy in colour during
high flow season than low flow season.
The disturbed riparian vegetation consisted of shrubs and herbs;
dominated with grasses. Ulapane Industrial zone was visible over the
left bank of river. The trash material consist of plastic bottles, rubber,
polyethylene bags were seen alone the rock cavities on either sides of
the river which were carried away and deposited during high flow.

GPS reference of sampling locations and descriptions contd...Sample location
referenceGPS reference Description of location
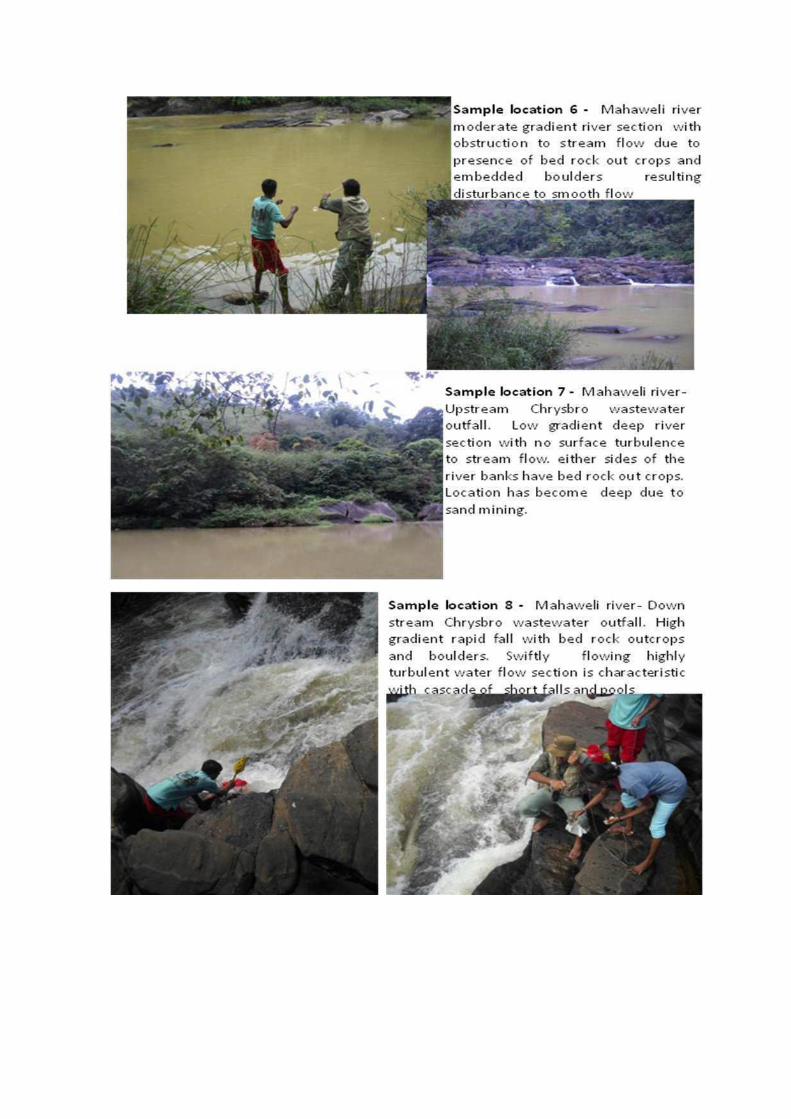
L6 - Mahaweli Ganga
250 m downstream
from the proposed
Dam
800
70The sampling location is about 250 m downstream from the proposed
dam. Water flows through terrain dominated with bed rock out crops
which result formation of cascade of wide pools. Water drain into these
pools through the exposed bed rock. The water flowing velocity is very
low in the pool like river sections. The reservation land area along the
both river banks consist forest riparian vegetation.
The water was more turbid and muddy and flow velocity is high during
high flow season than low flow season.
L7 - Mahaweli Ganga
- sand mining site
800
70The sampling location is about 1km from the proposed dam towards
downstream. The river bottom substrate is excavated for sand miningbut no mining activity at the collection of sample. The reservation land
area along both river banks consists of forest riparian vegetation
The water was more turbid and muddy and flow velocity is high duringhigh flow season than low flow season.
L8 - Mahaweli Ganga
- about 50 m
downstream from theCrysbro effluent
outlet
800
70The terrain is dominated with large exposed bed rock out crops to form
a cascade of short falls and pools. The stream flow is fast and highly
turbulent at drops where sample was collected. Outlet of the Crysbroeffluent plant was just upstream. Zero effluent flow was observed from
wastewater outlet at the time of sampling in both seasons. The water
was more turbid and muddy and flow velocity is high during high flowseason than low flow season.
There were forest vegetation on the right bank side and on the left handside there were scrubland and pathana.
Note: Refer annexure 6
L9 - Mahaweli
Ganga- near the
confluence of
Mahaweli Ganga and
Atabage Oya
800
70The sampling location is about 50 m upstream from the confluence of
point. Kothmale HPP tailrace outfall was located upstream to this
location. There was no outflow during the sampling event of low flow
season (March 2012).
However, the tailrace released high flow of water with high turbulence
and muddy colour during the sampling event of high flow season (May2013).
The stream bottom substrate consists of large to moderate size boulders.
Left hand side of the riparian vegetation consist of shrubs and herbs,
dominated with grasses. Right hand side is consisted of shrubs and
stream bank dominated with Bamboo trees.
L10 - Mahaweli
Ganga about 500 m
from the confluence
of Mahaweli Gangaand Kothmale tail race
with Atabage Oya
800
70The sampling location is about 500m downstream from the confluence
of the Mahaweli Ganga and Atabage Oya. The area is used for sand
mining but no mining activity during sampling. There was some aquatic
flora in the water. The river width was about 20m at this location.Riparian vegetation consisted of shrubs and herbs, dominated with
low
velocity is high during high flow season than low flow season.
Kothmale


Sample location 2 - Mahawei River
draining Nawalapitiya area
Sample location 3 - Mahaweli River after
the confluence
Sample location 4 - downstream from
the bridge Mahaweli River
Sample location 1 Kotmale Oya
Photographs of sampling event high flow season
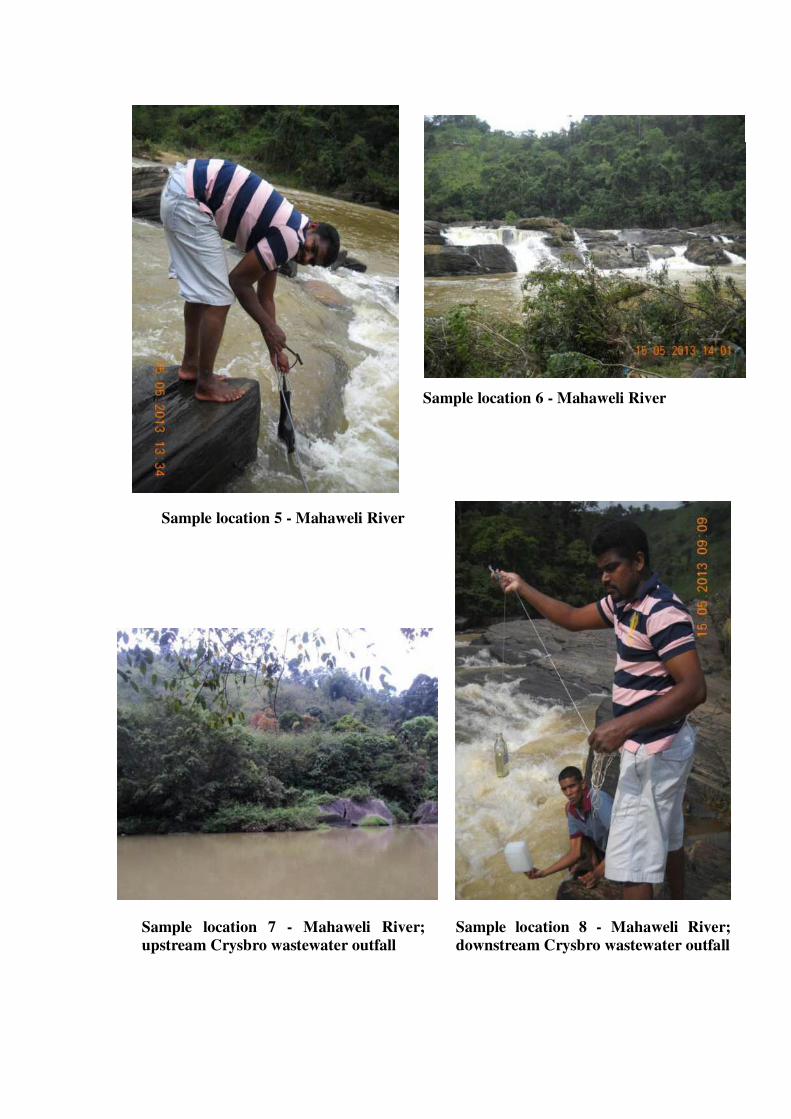
Sample location 5 - Mahaweli River
Sample location 6 - Mahaweli River
Sample location 7 - Mahaweli River;
upstream Crysbro wastewater outfall
Sample location 8 - Mahaweli River;
downstream Crysbro wastewater outfall
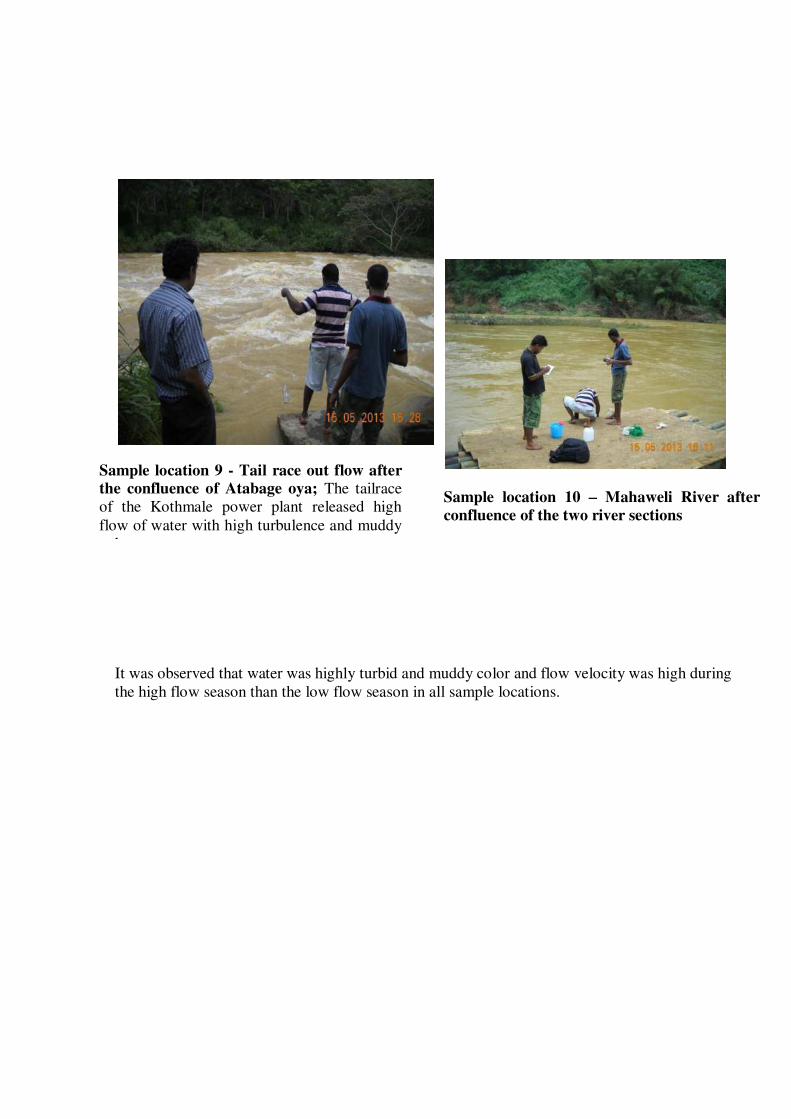
It was observed that water was highly turbid and muddy color and flow velocity was high during
the high flow season than the low flow season in all sample locations.
Sample location 9 - Tail race out flow after
the confluence of Atabage oya; The tailrace
of the Kothmale power plant released high
flow of water with high turbulence and muddy
colour.
Sample location 10 Mahaweli River after
confluence of the two river sections

Annex 6_______________________________________________________
Analytical Methods and Quality Control procedures
1. Analytical Methods
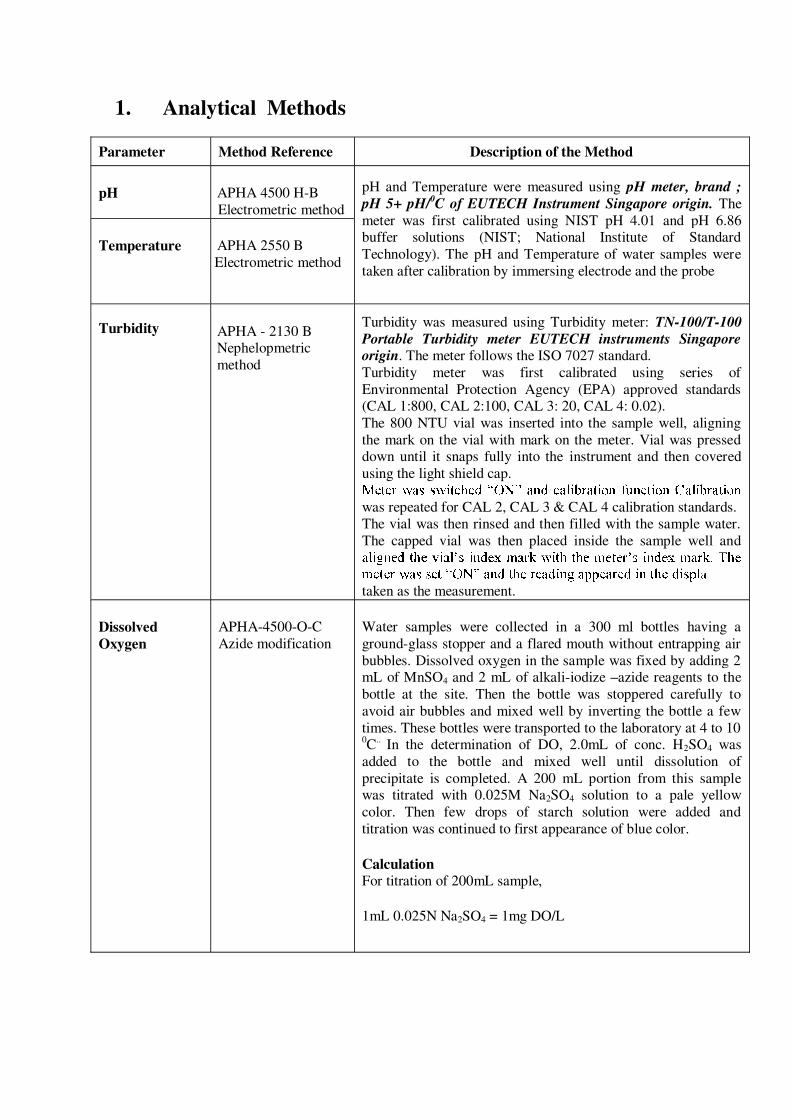
Parameter Method Reference Description of the Method
pH APHA 4500 H-B
Electrometric method
pH and Temperature were measured using pH meter, brand ;
pH 5+ pH/0C of EUTECH Instrument Singapore origin. The
meter was first calibrated using NIST pH 4.01 and pH 6.86buffer solutions (NIST; National Institute of Standard
Technology). The pH and Temperature of water samples were
taken after calibration by immersing electrode and the probe
Temperature APHA 2550 B
Electrometric method
Turbidity APHA - 2130 BNephelopmetric
method
Turbidity was measured using Turbidity meter: TN-100/T-100
Portable Turbidity meter EUTECH instruments Singaporeorigin. The meter follows the ISO 7027 standard.
Turbidity meter was first calibrated using series of
Environmental Protection Agency (EPA) approved standards(CAL 1:800, CAL 2:100, CAL 3: 20, CAL 4: 0.02).
The 800 NTU vial was inserted into the sample well, aligning
the mark on the vial with mark on the meter. Vial was presseddown until it snaps fully into the instrument and then covered
using the light shield cap.
was repeated for CAL 2, CAL 3 & CAL 4 calibration standards.
The vial was then rinsed and then filled with the sample water.
The capped vial was then placed inside the sample well and
taken as the measurement.
Dissolved
Oxygen
APHA-4500-O-C
Azide modification
Water samples were collected in a 300 ml bottles having a
ground-glass stopper and a flared mouth without entrapping air
bubbles. Dissolved oxygen in the sample was fixed by adding 2mL of MnSO4 and 2 mL of alkali-iodize azide reagents to the
bottle at the site. Then the bottle was stoppered carefully to
avoid air bubbles and mixed well by inverting the bottle a few
times. These bottles were transported to the laboratory at 4 to 100C
..In the determination of DO, 2.0mL of conc. H2SO4 was
added to the bottle and mixed well until dissolution of
precipitate is completed. A 200 mL portion from this samplewas titrated with 0.025M Na2SO4 solution to a pale yellow
color. Then few drops of starch solution were added and
titration was continued to first appearance of blue color.
Calculation
For titration of 200mL sample,
1mL 0.025N Na2SO4 = 1mg DO/L
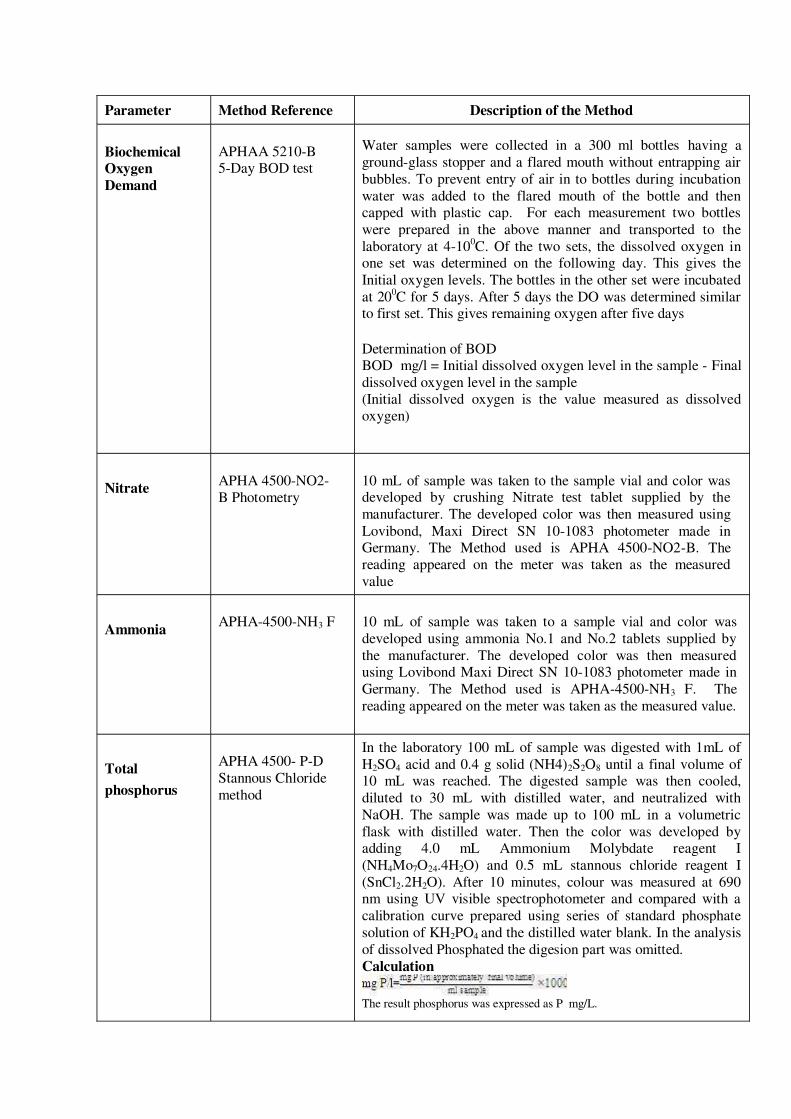
Parameter Method Reference Description of the Method
Biochemical
Oxygen
Demand
APHAA 5210-B5-Day BOD test
Water samples were collected in a 300 ml bottles having a
ground-glass stopper and a flared mouth without entrapping air
bubbles. To prevent entry of air in to bottles during incubation
water was added to the flared mouth of the bottle and thencapped with plastic cap. For each measurement two bottles
were prepared in the above manner and transported to the
laboratory at 4-100C. Of the two sets, the dissolved oxygen in
one set was determined on the following day. This gives the
Initial oxygen levels. The bottles in the other set were incubated
at 200C for 5 days. After 5 days the DO was determined similar
to first set. This gives remaining oxygen after five days
Determination of BODBOD mg/l = Initial dissolved oxygen level in the sample - Final
dissolved oxygen level in the sample
(Initial dissolved oxygen is the value measured as dissolved
oxygen)
NitrateAPHA 4500-NO2-
B Photometry
10 mL of sample was taken to the sample vial and color wasdeveloped by crushing Nitrate test tablet supplied by the
manufacturer. The developed color was then measured using
Lovibond, Maxi Direct SN 10-1083 photometer made inGermany. The Method used is APHA 4500-NO2-B. The
reading appeared on the meter was taken as the measured
value
AmmoniaAPHA-4500-NH3 F 10 mL of sample was taken to a sample vial and color was
developed using ammonia No.1 and No.2 tablets supplied by
the manufacturer. The developed color was then measuredusing Lovibond Maxi Direct SN 10-1083 photometer made in
Germany. The Method used is APHA-4500-NH3 F. The
reading appeared on the meter was taken as the measured value.
Total
phosphorus
APHA 4500- P-D
Stannous Chloride
method
In the laboratory 100 mL of sample was digested with 1mL of
H2SO4 acid and 0.4 g solid (NH4)2S2O8 until a final volume of10 mL was reached. The digested sample was then cooled,
diluted to 30 mL with distilled water, and neutralized with
NaOH. The sample was made up to 100 mL in a volumetric
flask with distilled water. Then the color was developed byadding 4.0 mL Ammonium Molybdate reagent I
(NH4Mo7O24.4H2O) and 0.5 mL stannous chloride reagent I
(SnCl2.2H2O). After 10 minutes, colour was measured at 690nm using UV visible spectrophotometer and compared with a
calibration curve prepared using series of standard phosphate
solution of KH2PO4 and the distilled water blank. In the analysis
of dissolved Phosphated the digesion part was omitted.
Calculation
The result phosphorus was expressed as P mg/L.

Parameter Method Reference Description of the Method
Total
Suspended
Solids
APHA 2540 D Glass-fibre filter papers were used in the determination of
suspended solids. First, the filter papers were washed withdistilled water and dried in an oven at 103
oC to 105
oC for 1hour.
Then the initial measurements were taken to 0.001g accuracy
until constant weight is reached.The sample was then stirred with a magnetic stirrer at a speed to
shear larger particles, if practical, to obtain a more uniform
particle size. While stirring, a measured volume (100ml) waspipetted onto the pre weighed filter paper seated on glass-fibre
filter. Vacuum suction was applied to filter the sample. The
trapped suspended solids in the filter paper were dried in an
oven at 103oC to 105
oC for 1hour and cooled in desiccators to
balance temperature and then weighed to 0.001g accuracy. This
cycle of drying cooling, desiccating and weighing was repeated
until a constant weight was obtained.The suspended solids content in the sample was then determined
using following calculation.
Calculation
Mg Total Suspended Solids/L = (A-B) x 1000Sample volume, mL
Where:
A = weight of filter + dried residue, mg
B = weight of filter, mg
Faecal
Coliforms
and
Total
Coliforms
SLS 614: 1983 Part2 Membrane
filtration
method
250 ml capacity sterilized glass bottles with attached twin thread
were used for the collection of samples for analysis of Faecaland Total Coliforms.
In the sampling, first the bottle was lowered to the water by
unwinding the cord slowly. The bottle was immersed in thewater completely, and once the bottle was judged to be
sufficiently filled, the thread was rewound and bottle was
brought up. Some water was discarded if the bottle wascompletely filled.
In the laboratory, for the analysis of Faecal Coliforms, 100 ml of
sample was filtered through a 0.45 µm grid marked membrane
filter paper and the filter was placed in MFC agar and incubatedat 44.5
0C for 24 hours.
For the Total Coliforms, 100 mL of sample was filtered and
filter was placed on M-Endo agar LES (Sigma origin) media andincubated at 36
0C for 24 hours. Colonies which showed a
characteristic appearance of blue colour on the filter paper
counted as Faecal Coliforms. No confirmation was done to
Faecal Coliforms since MFC agar was used as the medium andit is specific for Faecal Coliforms (especially E.coli) as per SLS
(1983). In detecting Total Coliform counts, colonies with
metallic yellow sheen in M- Endo agar LES medium were subcultured to phenol red lactose broth and all tubes showing acid
and gas production were recorded as confirmed Total Coliforms
after incubation of 360C for 48 hours.
Confirmed Coliforms were expressed as Total Coliform counts
per 100 ml. Confirmed Faecal Coliforms were expressed as
Faecal Coliform counts per 100 ml.
2. Quality Control procedures
The NBRO is registered in the Central Environmental Authority (CEA)- Laboratory as
Consultant/ Specialist for Technical Guidance (Reg. No. 07/LM/Cons/10/2008).
Copy of certificate - 2013 and a Letter indicating participation in Proficiency testing
programs with CEA are given below. .
Quality Control for the analysis of all the parameters was carried as per the procedures
given in the Standard Methods for the Examination of Water and Wastewater, APHA,
AWWA, WEF- 20th
edition (APHA).
All chemicals used in the analysis were of Analytical Grade (AR).
The pH meter was calibrated before commencing the sample measurements using pH
4.01 and pH 6.86 buffer solutions (traceable to National Institute of Standards and
Technology - NIST).
Turbidity meter was calibrated using a series of Environmental Protection Agency (EPA)
approved) calibration standards of 800 NTU, 200 NTU, 20 NTU and 2 NTU before
commencing sample measurements.
Dissolved Oxygen and BOD analysis - Glucose Glutamic acid (GGA) standard check
solution was checked for reliability of the sample analysis. The GGA control is a
standardized solution to determine the quality of the seed, where its recommended BOD5
concentration is 198 mg/l ± 30.5 mg/l. The dilution water blank was used to confirm the
quality of the dilution water that was used to dilute the samples. This is necessary
because impurities in the dilution water may cause significant alterations in the results.
In the Nitrates analysis, standard KNO3 (strength was 1.00 mL= 100 µg NO3-) was
prepared as per APHA and 0.1 mg/L solution as a known sample and deionized water
was checked for an each set of sample analysis.
In the Ammonia testing standard solution of NH4Cl was used as the standard (1.00 mL
=1.22 mg NH3). For each set of sample analysis 0.01 mg NH3/L solution as a known
sample and deionized water as a blank were checked.
For the Total Phosphates analysis, standard phosphate solution of KH2PO4 was used to
prepare the calibration curve (The strength was 1.00 mL=50.0 g PO43-
P). In each set of
analysis, 6 samples at a time; 3 water samples, 1 known standard sample, 1 spiked
sample and a blank sample (deionized water) were digested and analyzed.
In the Faecal Coliforms and Total Coliforms quality control procedures were carried out
according to APHA.
This includes:
Checking incubator temperatures:
o Faecal Coliforms - 44.50
C Total Coliform - 370C
o Performance of Autoclaves Sterilization using sterilization tapes -
temperature 1210C, pressure 15 lbs)
Blank sample testing - Dilution water (KH2PO4 buffer) blanks were analyzed during the
sample analysis. Three dilution blanks were filtered during the sample analysis for each
set of analysis (beginning/ middle and at the end) and tested for Faecal and Total
Coliforms.
The Balance (electronic top loading balance AUW 120 D, Shimazdu, Japan) used for the
preparation of reagents was calibrated from an accredited institution. (Calibration date -
15 08.2012 - Copy given below.
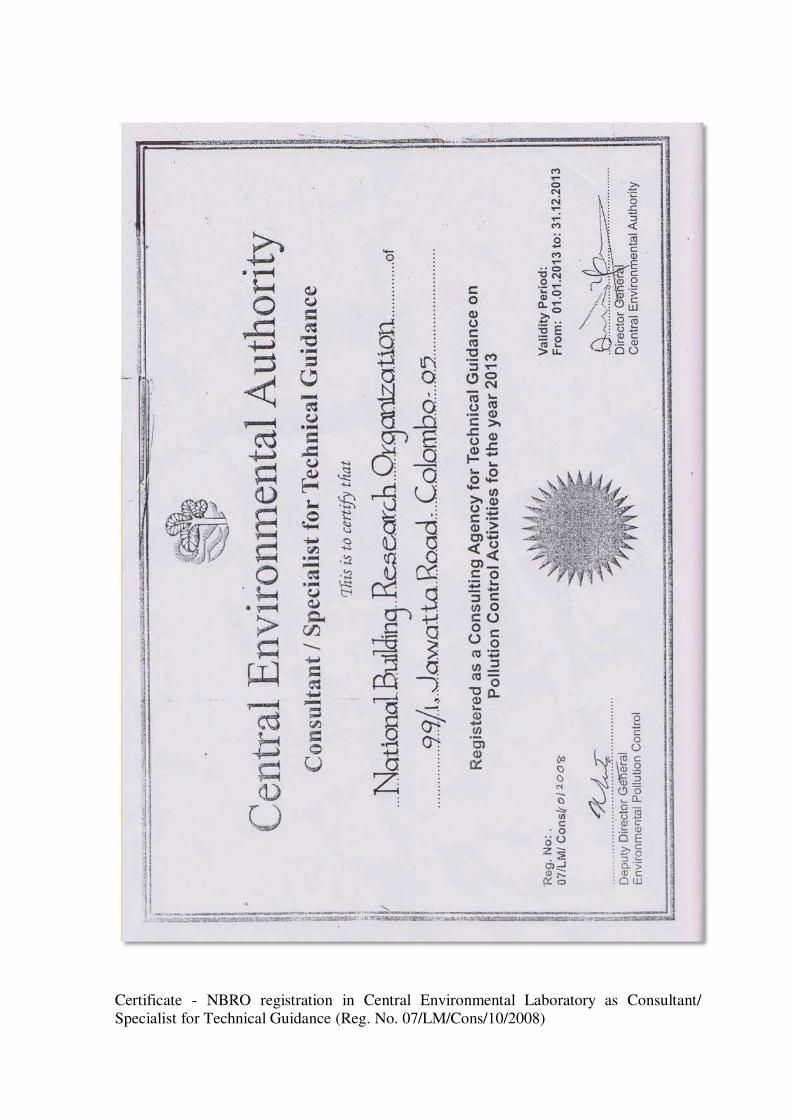
Certificate - NBRO registration in Central Environmental Laboratory as Consultant/
Specialist for Technical Guidance (Reg. No. 07/LM/Cons/10/2008)
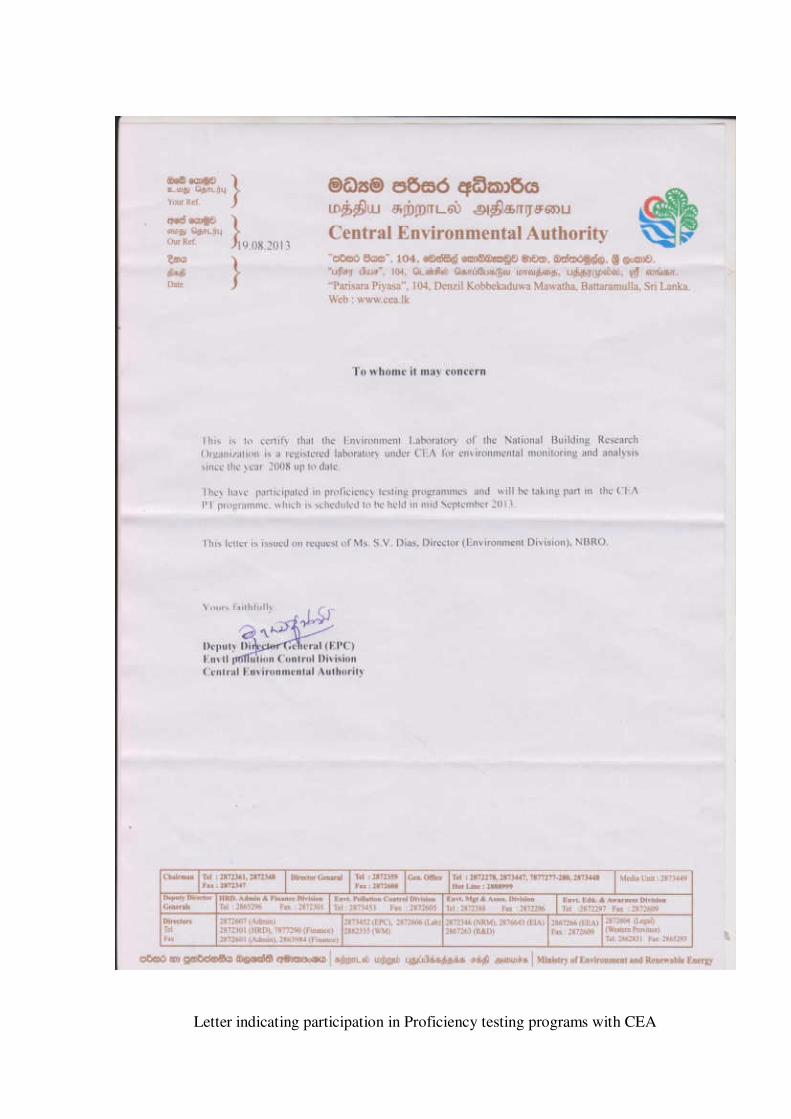
Letter indicating participation in Proficiency testing programs with CEA
Calibration certificate Balance; AUW 120 D, Shimazdu, Japan

Annex 7________________________________________________________
The river water quality (low flow season and high flow season)
Category
No.*
Location
Sample code
pH
Temperature
C
Turbidity
NTU
Dissolved
Oxygen
mg/L
BOD mg/L
Ammonia
(as N)
mg/L
Nitrate
( as N)
mg/L
Total
Phosphorus
(as P) mg/L
Total
Suspended
Solids
(mg/L)
Faecal
Coliforms
(E.coli
/100ml)
Total
Coliforms
(Coliform
Organisms
/100ml)
Category No.
Location
Sample code
pH
Temperature
C
Turbidity
NTU
Dissolved
Oxygen
mg/L
BOD mg/L
Ammonia
(as N)
mg/L
Nitrate
( as N)
mg/L
Total
Phosphorus
(as P) mg/L
Total
Suspended
Solids
(mg/L)
Faecal
Coliforms
(E.coli
/100ml)
Total
Coliforms
(Coliform
Organisms
/100ml)

Annex 8_______________________________________________________________
Analysis data of Crysbro Broiler Farm outlet
0
5
ADDITIONAL STUDIES ON NATURAL ENVIRONMENT FOR
REVIEW OF FEASIBILITY STUDY AND PREPARATION OF
DETAILED DESIGN AND BIDDING DOCUMENTS
MORAGOLLA HYDROPOWER PROJECT, SRI LANKA
Final Report 2
Aquatic ecology in the Mahaweli Ganga
Prepared by
The National Building Research Organization
Prepared for
NIPPON KOEI Co Ltd - Moragolla Hydropower Project
July 2013
National Building Research OrganizationMinistry of Disaster Management
99/1, Jawatte Road, Colombo 05, Sri Lanka
Contents
Executive Summary i
1. Aquatic ecology of Mahaweli Ganga 1
2. Scope of the study 2
3. Overview of aquatic ecology of the Mahaweli Ganga between 2
the project site and Polgolla diversion weir
4. Aquatic ecology of the project site 5
5. Potential Impacts 11
6. Proposed mitigation measures 22
Annexure
Annex 1- Terms of Reference
Annex 2- Satellite image of the proposed Morogolla Hydropower project
Annex 3 – Map - Aquatic ecological survey sites of Moragolla Hydro Power Project
Annex 4 - Photographs of habitats
Annex 5 - River habitat assessment criteria
Annex 6 - River habitat assessment results of each study site - Mahaweli River
Annex 7 - Aquatic plants in the study sites in Mahaweli River
Annex 8 - Taxonomic groups of plankton in the study sites in Mahaweli River
Annex 9 - Taxonomic groups of fauna in the study sites in Mahaweli River
Annex 10 Photographs of fauna and flora at the project site
Annex 11 – Photographs of Peterson grab and a net
Annex 12 - References

List of Tables
Table Page
Table 6.1 Summary of possible impacts during construction 22
Table 6.2 Summary of possible impacts during operation 26

List of Figures
Figure Page
Fig. 1 Variation in relative volume (Spirogyra cells/ml) of different taxonomic groups 8
of phytoplankton
Fig. 2 Variation in the relative volume of different zooplankton taxa (Spirogyra cells/ml) 9
at each study site (in April: low water level and in May: high water level)
Fig. 3 Variation in abundance (CPUE: Catch Per Unit Effort) of the some endemic fish 11
species recorded in Moragolla project site in 2013
i
Executive Summary
Introduction
The Ceylon Electricity Board (CEB), the institution responsible for electricity generation,
transmission, distribution and retailing in Sri Lanka, plans to develop a new hydropower scheme in
Moragolla, in Kandy District with a designed capacity of 30.0 MW. The proposed project envisages
construction of a 35 m high dam across the Mahaweli Ganga at Weliganga. Nippon Koei Co. Ltd,
Ltd., the consultant appointed by CEB to review the feasibility study and prepare designs and
bidding documents for the Moragolla Hydropower Project, appointed the National Building
Research Organization (NBRO) to conduct additional studies on the natural environment. This work
is one of several studies conducted in order to update and upgrade the previous EIA study to comply
with the ADB safeguard policy (Safeguard Policy Statement, ADB 2009).
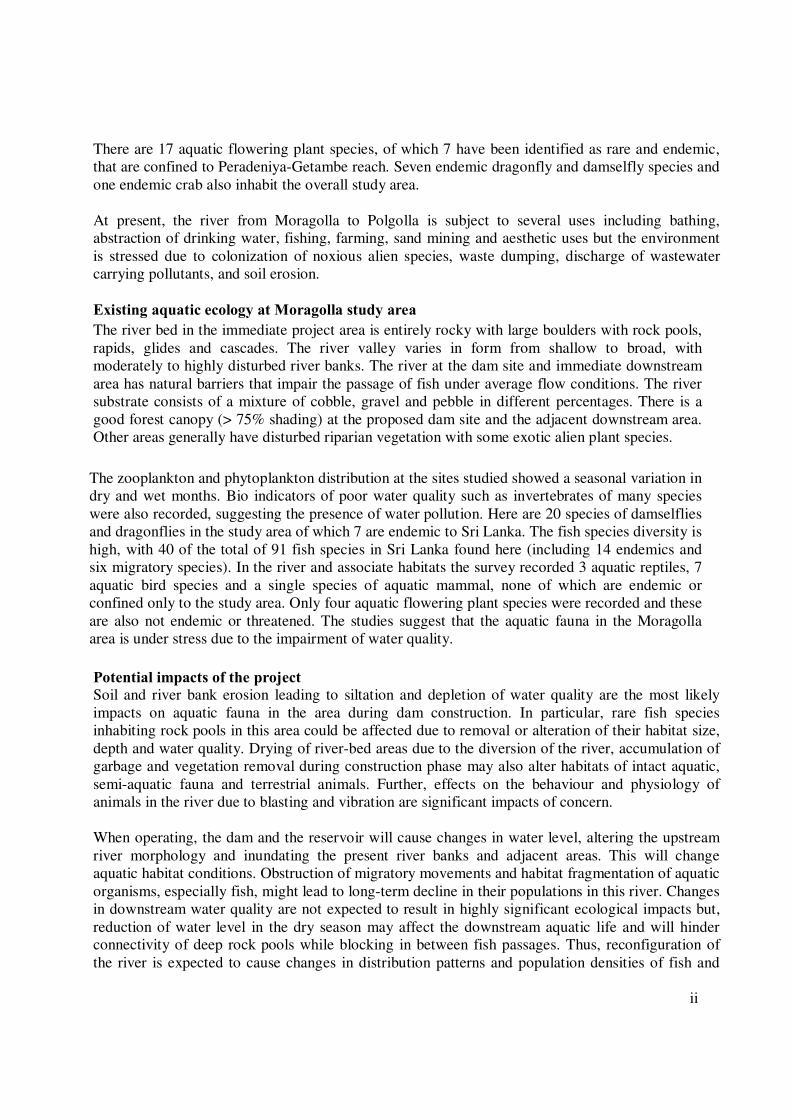
In this study, surveys were conducted to provide a) an overview of the aquatic ecology downstream
of the proposed dam, and b) a detailed account of the ecology at the project site. The objective was
to determine the present status and importance of aquatic ecology, identify the likely impacts of
constructing and operating the project, and propose suitable mitigation for any negative impacts.
Information and data collection
An overview of the aquatic ecology in Mahaweli River from the Moragolla project area to Polgolla
weir 30 km downstream was prepared by referring to satellite images, published literature,
conducting interviews and discussions with local people and experts, and this was followed by field
visits and surveys in March and May 2013.
The detailed aquatic ecological assessment conducted in the Mahaweli River covered the area from
upstream of the Kotmale Oya confluence to 500 m downstream of the Atabage Oya confluence. The
survey involved investigation of 17 sites in the study area in March and May 2013 representing both
low flow (dry) and high flow (wet) seasons. In situ studies on riparian vegetation, features of the
river valley and river banks, presence of different habitats, river bed and substrate forms were done
via the line-transect method and by referring to accepted international criteria for river habitat
assessment. The macro/micro aquatic fauna and flora were studied qualitatively and quantitatively
following standard ecological techniques. The fish were captured with cast nets, trammel nets and
gill nets.
Overview of the aquatic ecology in Mahaweli River
The Mahaweli River at Moragolla is a diverse aquatic ecosystem, which flows through different
valleys consisting of disturbed environments with only scattered natural habitats left. The river
morphology is diverse and channel condition varies from rock pools, rapids, riffles to runners. River
bed substrate is largely rocky in this area, but it is sandy to muddy further downstream in the
Kalugamuwa-Getambe and Katugastota-Polgolla reaches. The Katugastota to Polgolla reach of the
river has changed to a slow moving reservoir due to construction of a wire at Polgolla.
Biological diversity from Moragolla to Polgolla weir is generally high and this provides habitat to a
recorded total of 49 fish species (14 endemics), 3 indigenous aquatic reptile species, 12 aquatic bird
species and a semi-aquatic indigenous mammal. None of these are confined only to this river stretch.
ii
There are 17 aquatic flowering plant species, of which 7 have been identified as rare and endemic,
that are confined to Peradeniya-Getambe reach. Seven endemic dragonfly and damselfly species and
one endemic crab also inhabit the overall study area.
At present, the river from Moragolla to Polgolla is subject to several uses including bathing,
abstraction of drinking water, fishing, farming, sand mining and aesthetic uses but the environment
is stressed due to colonization of noxious alien species, waste dumping, discharge of wastewater
carrying pollutants, and soil erosion.
Existing aquatic ecology at Moragolla study area
The river bed in the immediate project area is entirely rocky with large boulders with rock pools,
rapids, glides and cascades. The river valley varies in form from shallow to broad, with
moderately to highly disturbed river banks. The river at the dam site and immediate downstream
area has natural barriers that impair the passage of fish under average flow conditions. The river
substrate consists of a mixture of cobble, gravel and pebble in different percentages. There is a
good forest canopy (> 75% shading) at the proposed dam site and the adjacent downstream area.
Other areas generally have disturbed riparian vegetation with some exotic alien plant species.
The zooplankton and phytoplankton distribution at the sites studied showed a seasonal variation in
dry and wet months. Bio indicators of poor water quality such as invertebrates of many species
were also recorded, suggesting the presence of water pollution. Here are 20 species of damselflies
and dragonflies in the study area of which 7 are endemic to Sri Lanka. The fish species diversity is
high, with 40 of the total of 91 fish species in Sri Lanka found here (including 14 endemics and
six migratory species). In the river and associate habitats the survey recorded 3 aquatic reptiles, 7
aquatic bird species and a single species of aquatic mammal, none of which are endemic or
confined only to the study area. Only four aquatic flowering plant species were recorded and these
are also not endemic or threatened. The studies suggest that the aquatic fauna in the Moragolla
area is under stress due to the impairment of water quality.
Potential impacts of the project
Soil and river bank erosion leading to siltation and depletion of water quality are the most likely
impacts on aquatic fauna in the area during dam construction. In particular, rare fish species
inhabiting rock pools in this area could be affected due to removal or alteration of their habitat size,
depth and water quality. Drying of river-bed areas due to the diversion of the river, accumulation of
garbage and vegetation removal during construction phase may also alter habitats of intact aquatic,
semi-aquatic fauna and terrestrial animals. Further, effects on the behaviour and physiology of
animals in the river due to blasting and vibration are significant impacts of concern.
When operating, the dam and the reservoir will cause changes in water level, altering the upstream
river morphology and inundating the present river banks and adjacent areas. This will change
aquatic habitat conditions. Obstruction of migratory movements and habitat fragmentation of aquatic
organisms, especially fish, might lead to long-term decline in their populations in this river. Changes
in downstream water quality are not expected to result in highly significant ecological impacts but,
reduction of water level in the dry season may affect the downstream aquatic life and will hinder
connectivity of deep rock pools while blocking in between fish passages. Thus, reconfiguration of
the river is expected to cause changes in distribution patterns and population densities of fish and

iii
other organisms, but is unlikely to result in the loss of any species. Sediment build-up behind the
dam may cause a decline in downstream habitat conditions, by reducing the amount of soft-sediment
habitats and the oxygen content of water retained in the reservoir and flowing downstream. The
likely risk of erosion, bank failures and undercuts leading to land degradation, land slippages and
increased reservoir sedimentation from the steeply sloping new reservoir banks with little natural
vegetation may also occur also expected during the operation stage.
Proposed mitigation measures
During construction work, adherence to basic soil conservation practices are proposed to minimize
soil erosion and reduce the entry of sediment laden runoff into the river. Formulating and
implementing a proper waste management plan covering all construction sites including
accommodation camps, is recommended to minimize the entry of litter, organic matter and debris
from vegetation clearance, fuel, oil or other toxic materials from accidental spills. Dynamite blasting
should be avoided in areas in or close to the river and restricted only to necessary areas.
The proposed mandatory environmental flow of 1.5m3/s, should be released and channelized to
supply enough water to deep rock pool areas continuously. The stream Thismada Ela, an additional
source of perennial flow to the immediate downstream area of the dam, should not be blocked to
maintain quality of the ecosystem. Translocation of the already stressed threatened endemic fish
Labeo fisheri and other sensitive aquatic species that will be trapped in isolated pools below the dam
to a suitable relief point is strongly recommended over much more costly fish ladder option. Regular
monitoring of Crysbro Broiler Farm’s effluent to ensure the enforcement of stipulated industrial
discharge limits or relocation of the effluent outfall downstream of the proposed tailrace outlet are
recommended to minimize the impacts on downstream aquatic ecology and water quality during the
operational stage.
The dam and the reservoir across the river will act as an excellent sediment and debris trap that
prevents downstream transportation of both. This, together with the proposed management efforts to
maintain the effluent discharge of Crysbro Broiler Farm within stipulated pollutant discharge limits
or its relocation downstream of proposed tailrace outfall will significantly benefit already stressed
downstream water quality and aquatic ecology.
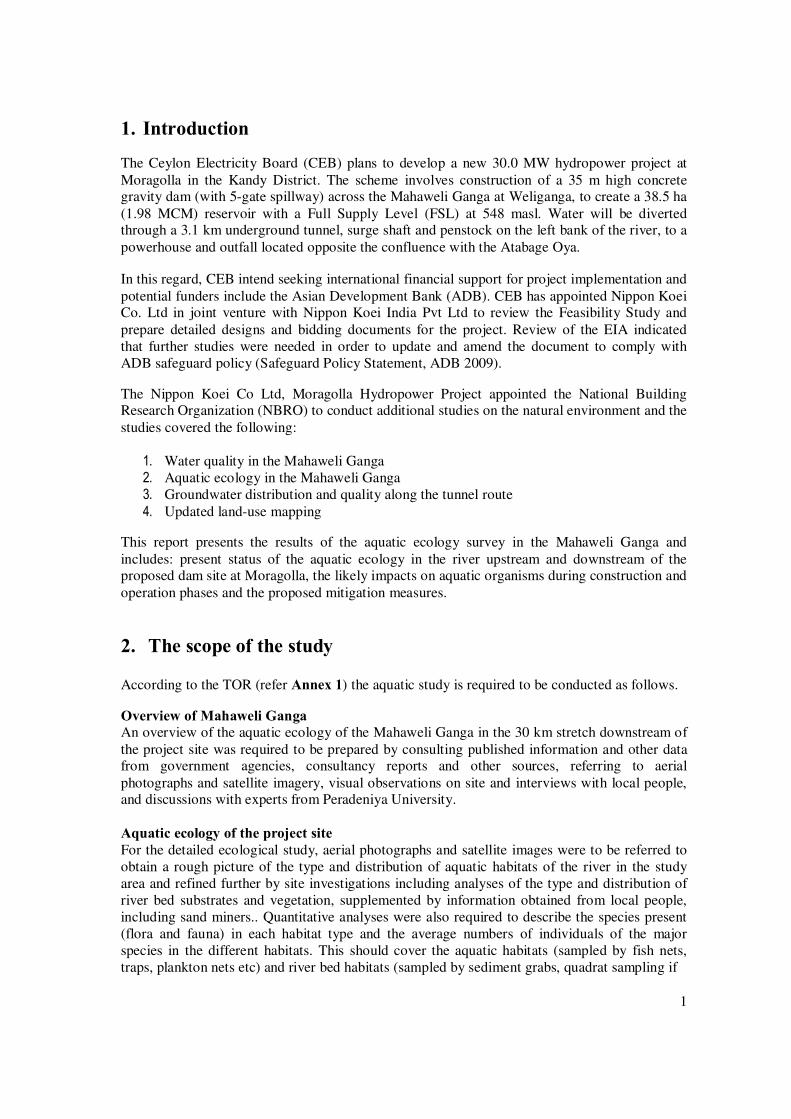
1
1. Introduction
The Ceylon Electricity Board (CEB) plans to develop a new 30.0 MW hydropower project at
Moragolla in the Kandy District. The scheme involves construction of a 35 m high concretegravity dam (with 5-gate spillway) across the Mahaweli Ganga at Weliganga, to create a 38.5 ha
(1.98 MCM) reservoir with a Full Supply Level (FSL) at 548 masl. Water will be divertedthrough a 3.1 km underground tunnel, surge shaft and penstock on the left bank of the river, to a
powerhouse and outfall located opposite the confluence with the Atabage Oya.
In this regard, CEB intend seeking international financial support for project implementation and
potential funders include the Asian Development Bank (ADB). CEB has appointed Nippon KoeiCo. Ltd in joint venture with Nippon Koei India Pvt Ltd to review the Feasibility Study and
prepare detailed designs and bidding documents for the project. Review of the EIA indicated
that further studies were needed in order to update and amend the document to comply with
ADB safeguard policy (Safeguard Policy Statement, ADB 2009).
The Nippon Koei Co Ltd, Moragolla Hydropower Project appointed the National BuildingResearch Organization (NBRO) to conduct additional studies on the natural environment and the
studies covered the following:
1. Water quality in the Mahaweli Ganga
2. Aquatic ecology in the Mahaweli Ganga
3. Groundwater distribution and quality along the tunnel route
4. Updated land-use mapping
This report presents the results of the aquatic ecology survey in the Mahaweli Ganga and
includes: present status of the aquatic ecology in the river upstream and downstream of theproposed dam site at Moragolla, the likely impacts on aquatic organisms during construction and
operation phases and the proposed mitigation measures.
2. The scope of the study
According to the TOR (refer Annex 1) the aquatic study is required to be conducted as follows.
Overview of Mahaweli Ganga
An overview of the aquatic ecology of the Mahaweli Ganga in the 30 km stretch downstream of
the project site was required to be prepared by consulting published information and other datafrom government agencies, consultancy reports and other sources, referring to aerial
photographs and satellite imagery, visual observations on site and interviews with local people,and discussions with experts from Peradeniya University.
Aquatic ecology of the project site
For the detailed ecological study, aerial photographs and satellite images were to be referred to
obtain a rough picture of the type and distribution of aquatic habitats of the river in the study
area and refined further by site investigations including analyses of the type and distribution of
river bed substrates and vegetation, supplemented by information obtained from local people,
including sand miners.. Quantitative analyses were also required to describe the species present
(flora and fauna) in each habitat type and the average numbers of individuals of the major
species in the different habitats. This should cover the aquatic habitats (sampled by fish nets,
traps, plankton nets etc) and river bed habitats (sampled by sediment grabs, quadrat sampling if
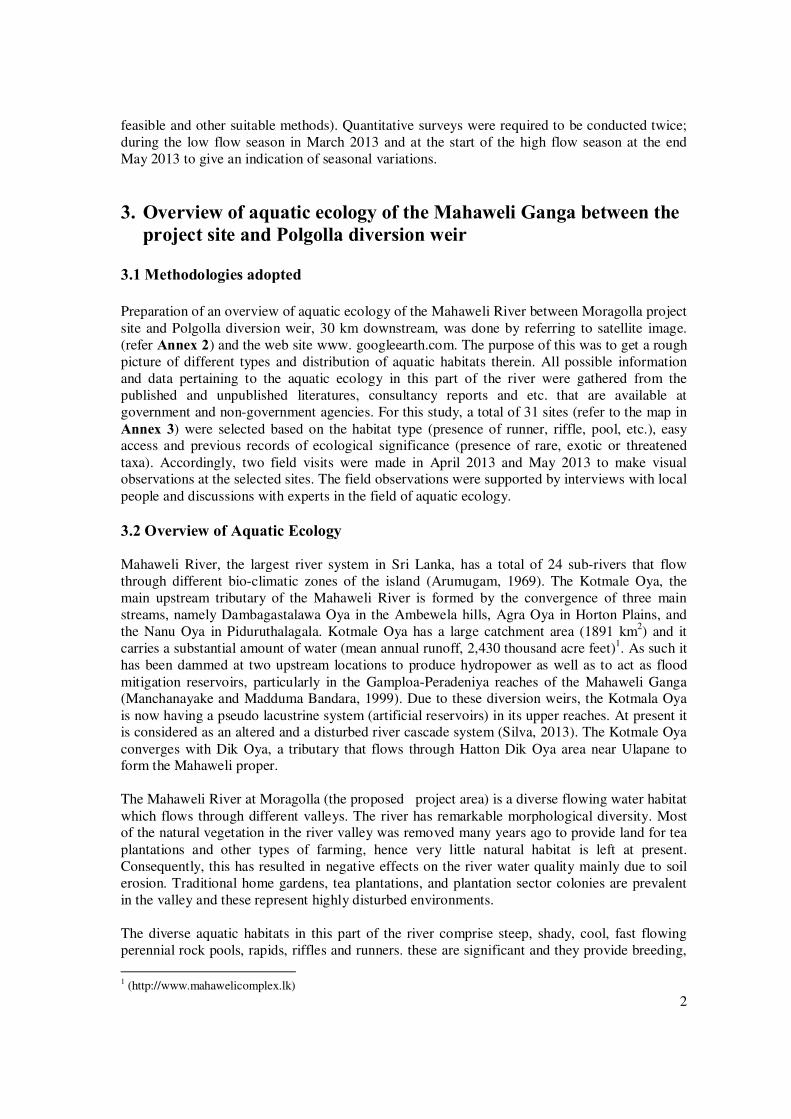
2
feasible and other suitable methods). Quantitative surveys were required to be conducted twice;
during the low flow season in March 2013 and at the start of the high flow season at the end
May 2013 to give an indication of seasonal variations.
3. Overview of aquatic ecology of the Mahaweli Ganga between the
project site and Polgolla diversion weir
3.1 Methodologies adopted
Preparation of an overview of aquatic ecology of the Mahaweli River between Moragolla project
site and Polgolla diversion weir, 30 km downstream, was done by referring to satellite image.
(refer Annex 2) and the web site www. googleearth.com. The purpose of this was to get a rough
picture of different types and distribution of aquatic habitats therein. All possible information
and data pertaining to the aquatic ecology in this part of the river were gathered from the
published and unpublished literatures, consultancy reports and etc. that are available at
government and non-government agencies. For this study, a total of 31 sites (refer to the map in
Annex 3) were selected based on the habitat type (presence of runner, riffle, pool, etc.), easyaccess and previous records of ecological significance (presence of rare, exotic or threatened
taxa). Accordingly, two field visits were made in April 2013 and May 2013 to make visualobservations at the selected sites. The field observations were supported by interviews with local
people and discussions with experts in the field of aquatic ecology.
3.2 Overview of Aquatic Ecology
Mahaweli River, the largest river system in Sri Lanka, has a total of 24 sub-rivers that flow
through different bio-climatic zones of the island (Arumugam, 1969). The Kotmale Oya, the
main upstream tributary of the Mahaweli River is formed by the convergence of three main
streams, namely Dambagastalawa Oya in the Ambewela hills, Agra Oya in Horton Plains, and
the Nanu Oya in Piduruthalagala. Kotmale Oya has a large catchment area (1891 km2) and it
carries a substantial amount of water (mean annual runoff, 2,430 thousand acre feet)1. As such it
has been dammed at two upstream locations to produce hydropower as well as to act as flood
mitigation reservoirs, particularly in the Gamploa-Peradeniya reaches of the Mahaweli Ganga(Manchanayake and Madduma Bandara, 1999). Due to these diversion weirs, the Kotmala Oya
is now having a pseudo lacustrine system (artificial reservoirs) in its upper reaches. At present itis considered as an altered and a disturbed river cascade system (Silva, 2013). The Kotmale Oya
converges with Dik Oya, a tributary that flows through Hatton Dik Oya area near Ulapane toform the Mahaweli proper.
The Mahaweli River at Moragolla (the proposed project area) is a diverse flowing water habitat
which flows through different valleys. The river has remarkable morphological diversity. Mostof the natural vegetation in the river valley was removed many years ago to provide land for tea
plantations and other types of farming, hence very little natural habitat is left at present.
Consequently, this has resulted in negative effects on the river water quality mainly due to soil
erosion. Traditional home gardens, tea plantations, and plantation sector colonies are prevalent
in the valley and these represent highly disturbed environments.
The diverse aquatic habitats in this part of the river comprise steep, shady, cool, fast flowing
perennial rock pools, rapids, riffles and runners. these are significant and they provide breeding,
1(http://www.mahawelicomplex.lk)
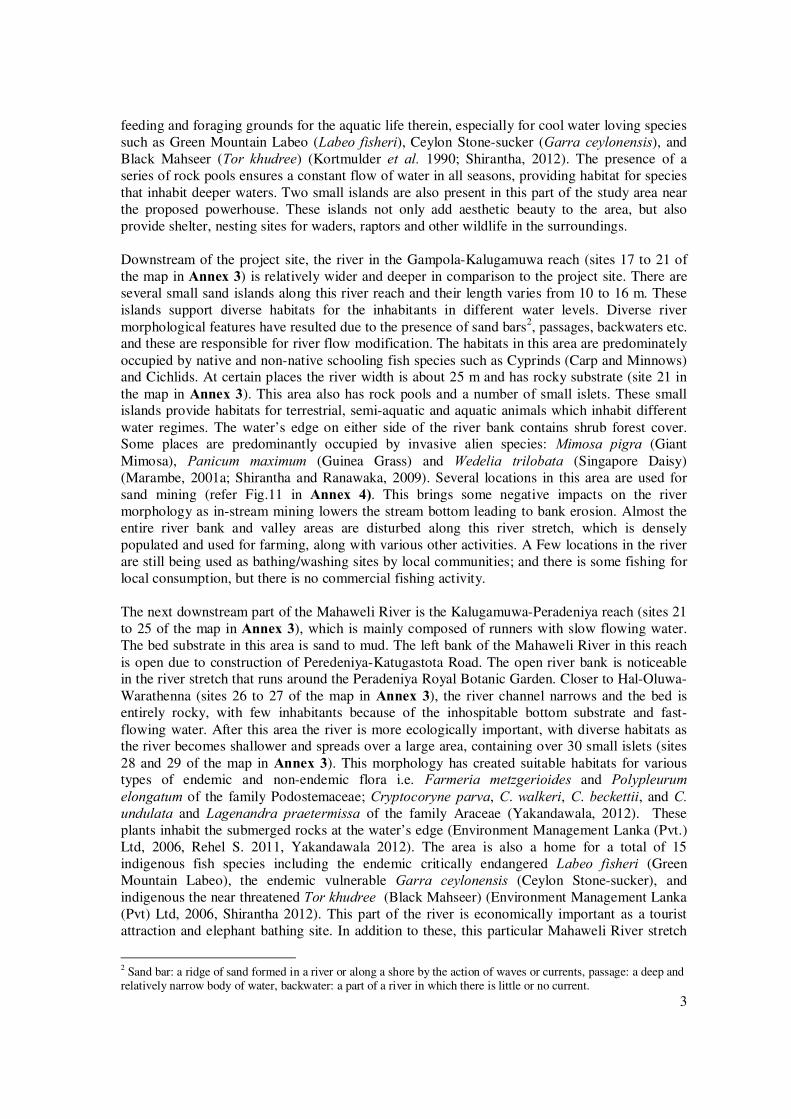
3
feeding and foraging grounds for the aquatic life therein, especially for cool water loving species
such as Green Mountain Labeo (Labeo fisheri), Ceylon Stone-sucker (Garra ceylonensis), and
Black Mahseer (Tor khudree) (Kortmulder et al. 1990; Shirantha, 2012). The presence of a
series of rock pools ensures a constant flow of water in all seasons, providing habitat for species
that inhabit deeper waters. Two small islands are also present in this part of the study area near
the proposed powerhouse. These islands not only add aesthetic beauty to the area, but also
provide shelter, nesting sites for waders, raptors and other wildlife in the surroundings.
Downstream of the project site, the river in the Gampola-Kalugamuwa reach (sites 17 to 21 of
the map in Annex 3) is relatively wider and deeper in comparison to the project site. There are
several small sand islands along this river reach and their length varies from 10 to 16 m. These
islands support diverse habitats for the inhabitants in different water levels. Diverse river
morphological features have resulted due to the presence of sand bars2, passages, backwaters etc.
and these are responsible for river flow modification. The habitats in this area are predominately
occupied by native and non-native schooling fish species such as Cyprinds (Carp and Minnows)and Cichlids. At certain places the river width is about 25 m and has rocky substrate (site 21 in
the map in Annex 3). This area also has rock pools and a number of small islets. These smallislands provide habitats for terrestrial, semi-aquatic and aquatic animals which inhabit different
water regimes. The water’s edge on either side of the river bank contains shrub forest cover.Some places are predominantly occupied by invasive alien species: Mimosa pigra (Giant
Mimosa), Panicum maximum (Guinea Grass) and Wedelia trilobata (Singapore Daisy)
(Marambe, 2001a; Shirantha and Ranawaka, 2009). Several locations in this area are used for
sand mining (refer Fig.11 in Annex 4). This brings some negative impacts on the river
morphology as in-stream mining lowers the stream bottom leading to bank erosion. Almost the
entire river bank and valley areas are disturbed along this river stretch, which is densely
populated and used for farming, along with various other activities. A Few locations in the river
are still being used as bathing/washing sites by local communities; and there is some fishing for
local consumption, but there is no commercial fishing activity.
The next downstream part of the Mahaweli River is the Kalugamuwa-Peradeniya reach (sites 21
to 25 of the map in Annex 3), which is mainly composed of runners with slow flowing water.
The bed substrate in this area is sand to mud. The left bank of the Mahaweli River in this reach
is open due to construction of Peredeniya-Katugastota Road. The open river bank is noticeablein the river stretch that runs around the Peradeniya Royal Botanic Garden. Closer to Hal-Oluwa-
Warathenna (sites 26 to 27 of the map in Annex 3), the river channel narrows and the bed is
entirely rocky, with few inhabitants because of the inhospitable bottom substrate and fast-
flowing water. After this area the river is more ecologically important, with diverse habitats asthe river becomes shallower and spreads over a large area, containing over 30 small islets (sites
28 and 29 of the map in Annex 3). This morphology has created suitable habitats for varioustypes of endemic and non-endemic flora i.e. Farmeria metzgerioides and Polypleurum
elongatum of the family Podostemaceae; Cryptocoryne parva, C. walkeri, C. beckettii, and C.
undulata and Lagenandra praetermissa of the family Araceae (Yakandawala, 2012). These
plants inhabit the submerged rocks at the water’s edge (Environment Management Lanka (Pvt.)
Ltd, 2006, Rehel S. 2011, Yakandawala 2012). The area is also a home for a total of 15
indigenous fish species including the endemic critically endangered Labeo fisheri (Green
Mountain Labeo), the endemic vulnerable Garra ceylonensis (Ceylon Stone-sucker), and
indigenous the near threatened Tor khudree (Black Mahseer) (Environment Management Lanka
(Pvt) Ltd, 2006, Shirantha 2012). This part of the river is economically important as a tourist
attraction and elephant bathing site. In addition to these, this particular Mahaweli River stretch
2Sand bar: a ridge of sand formed in a river or along a shore by the action of waves or currents, passage: a deep and
relatively narrow body of water, backwater: a part of a river in which there is little or no current.

4
receives runoff water from urban and agricultural lands, which carry urban pollutants and
agrochemicals into the river (Environment Management Lanka (Pvt) Ltd, 2006). This part of the
river has been proposed for the Getambe mini hydropower project, which will be implemented
in the near future.
The river in Katugastota reach (sites 30 and 31 of the map in Annex 3) shows some reservoir
features due to river modification. About 1 km downward, the river is totally modified and has
become a reservoir, with a very low flow rate due to Polgolla weir, constructed in 1976. This
area is largely colonized by some exotic fish species such as Oreochromis spp. (Tilapia),
Cyprinus carpio (Common Carp), Cirrhinus mrigala (Mrigal), Labeo rohita (Rohu) and Catla
catla (Catla) introduced for aquaculture development of the country in the late 1950s
(Pethiyagoda, 1991). There are some native fish species such as Systomus spilurus (Sri Lanka
Olive Barb), Ompok bimaculatus (Butter Catfish), Wallago attu (Shark Catfish) and Clariasbrachysoma (Walking Catfish), which are important as food fish. This artificial reservoir plays a
vital role as an economically important water segment in the Central Province providing groundsfor sand mining, eco-tourism, hydropower generation as well as for a capture-based inland
fishery (De Silva and Wansapura, 1991).
One of the remarkable features of aquatic life in the Mahaweli River from the Moragolla project
site to the Polgolla weir is its invertebrate diversity. Various taxa of macro invertebrates such as
Ephemeropterans (mayflies), Odonates (dragonflies and damselflies), Crustaceans (crabs and
shrimps), Coleopterans (beetles) and Dipterans (true flies) have been recorded from this part of
the river (Environment Management Lanka (Pvt.) Ltd, 2006; Shirantha et al. 2010). However,
little can be said about the invertebrate species present in this area, or their density and
importance, as there have been no previous studies.
Of the vertebrate faunal groups, the river from Moragolla to Polgolla harbours a total of 49
freshwater fish species belonging to 18 families (Pethiyagoda, 1991; Shirantha and
Amarasinghe, 2005) (see table 3 in Annex 9). Of these, the presence of the critically endangered
Labeo fisheri (Green Mountain Labeo) is significant as it is only found in the middle catchment
of the Mahaweli River (Pethiyagoda 1991; Senanayake, and Moyle 1982; Shirantha 2012).
Other inhabitants of this area include the aquatic reptilian Water Monitor (Varanus salvator) andsome aquatic bird species namely, the Indian Cormorant (Phalacrocorax fuscicollis), Little
Cormorant (P. niger), Common Kingfisher (Alcedo atthis), White Breasted Water-hen(Amaurornis phoenicurus), Little Egret (Egretta garzetta), Cattle Egret (Bubulcus ibis), Pond
Heron (Ardeola grayii), Intermediate Egret (Mesophoyx intermedia) and White-throatedKingfisher (Halcyon smyrnensis) (Environment Management Lanka (Pvt) Ltd, 2006). The
Eurasian Otter (Lutra lutra) also shows a wide distribution in this area (De Silva, 1997), butthere is no published record on any endemic faunal taxon that is confined only to this river
stretch.
As mentioned above, the aquatic plant species diversity is high in the Mahaweli River from
Moragolla to Polgolla weir. There are some rare endemic species belonging to the families
Podostemaceae (Farmeria metzgeniodes and Polypleurum elongatum) and Araceae
(Cryptocoryne becketti, C. parva, C. undulata, C. walkeri and C. willisii) that are restricted to
this area (Wijesundara and Shantha Siri, 2004; Yakandawala, 2012). However, at present their
existence is threatened due to development activities and rapid colonization of noxious aquatic
species such as Water Hyacinth, Giant Mimosa and Giant Salvinia (Yakandawala, 2012).
The aquatic ecological integrity of this part of the river is degraded as a result of the many
human activities in the area. The water pollution threat in the upper reach, particularly upstream
of Gampola, mainly arises through soil erosion, use of agrochemicals and fertilizer and direct
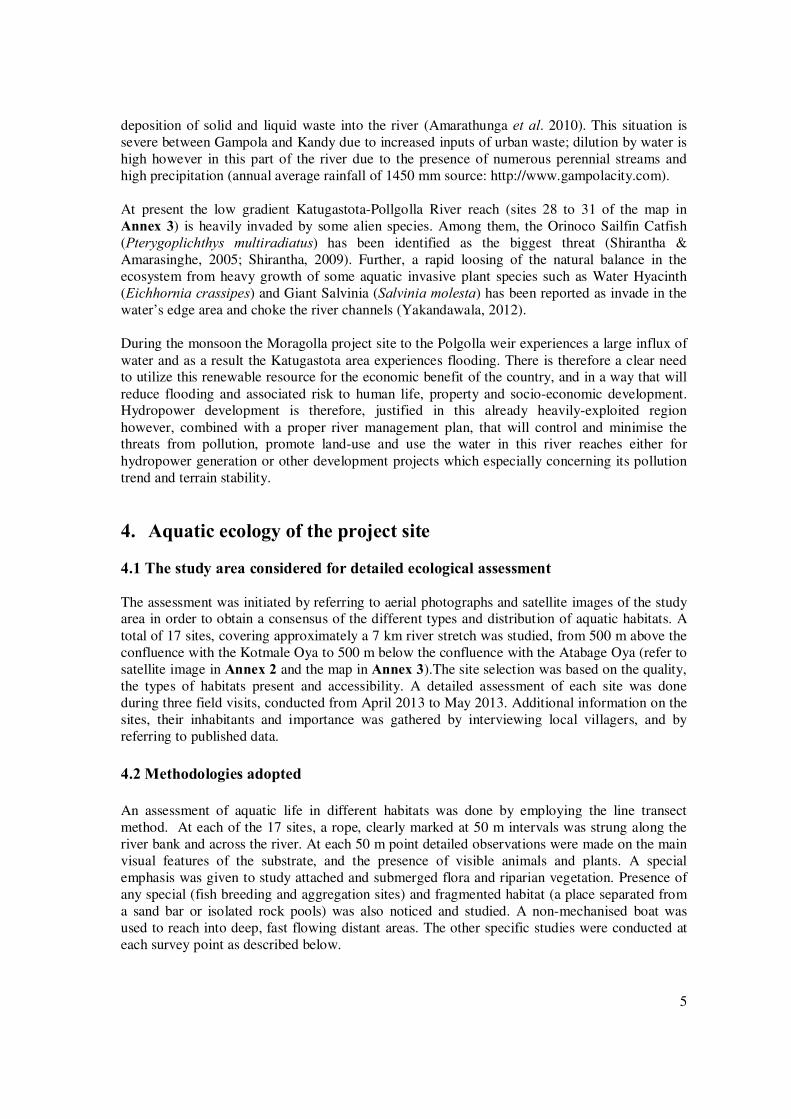
5
deposition of solid and liquid waste into the river (Amarathunga et al. 2010). This situation is
severe between Gampola and Kandy due to increased inputs of urban waste; dilution by water is
high however in this part of the river due to the presence of numerous perennial streams and
high precipitation (annual average rainfall of 1450 mm source: http://www.gampolacity.com).
At present the low gradient Katugastota-Pollgolla River reach (sites 28 to 31 of the map in
Annex 3) is heavily invaded by some alien species. Among them, the Orinoco Sailfin Catfish
(Pterygoplichthys multiradiatus) has been identified as the biggest threat (Shirantha &
Amarasinghe, 2005; Shirantha, 2009). Further, a rapid loosing of the natural balance in the
ecosystem from heavy growth of some aquatic invasive plant species such as Water Hyacinth
(Eichhornia crassipes) and Giant Salvinia (Salvinia molesta) has been reported as invade in the
water’s edge area and choke the river channels (Yakandawala, 2012).
During the monsoon the Moragolla project site to the Polgolla weir experiences a large influx of
water and as a result the Katugastota area experiences flooding. There is therefore a clear needto utilize this renewable resource for the economic benefit of the country, and in a way that will
reduce flooding and associated risk to human life, property and socio-economic development.Hydropower development is therefore, justified in this already heavily-exploited region
however, combined with a proper river management plan, that will control and minimise thethreats from pollution, promote land-use and use the water in this river reaches either for
hydropower generation or other development projects which especially concerning its pollution
trend and terrain stability.
4. Aquatic ecology of the project site
4.1 The study area considered for detailed ecological assessment
The assessment was initiated by referring to aerial photographs and satellite images of the studyarea in order to obtain a consensus of the different types and distribution of aquatic habitats. A
total of 17 sites, covering approximately a 7 km river stretch was studied, from 500 m above the
confluence with the Kotmale Oya to 500 m below the confluence with the Atabage Oya (refer to
satellite image in Annex 2 and the map in Annex 3).The site selection was based on the quality,
the types of habitats present and accessibility. A detailed assessment of each site was done
during three field visits, conducted from April 2013 to May 2013. Additional information on the
sites, their inhabitants and importance was gathered by interviewing local villagers, and by
referring to published data.
4.2 Methodologies adopted
An assessment of aquatic life in different habitats was done by employing the line transect
method. At each of the 17 sites, a rope, clearly marked at 50 m intervals was strung along the
river bank and across the river. At each 50 m point detailed observations were made on the main
visual features of the substrate, and the presence of visible animals and plants. A special
emphasis was given to study attached and submerged flora and riparian vegetation. Presence of
any special (fish breeding and aggregation sites) and fragmented habitat (a place separated from
a sand bar or isolated rock pools) was also noticed and studied. A non-mechanised boat was
used to reach into deep, fast flowing distant areas. The other specific studies were conducted at
each survey point as described below.
6
Plankton sampling and analysis
Plankton samples were collected from each sampling site using 50 たm mesh plankton net. Two
samples were collected by lowering the net vertically into the water until the bottle at the end of
the net is filled with water. Then pull until the net is extended and begin to tow. After about 5
minutes, the net was taken out and let it hang for a 1 to 2 minutes. Then all the plankton washed
into the bottle by running freshwater from the outside of the net. One sample was collected in a
plastic bottle and 3 to 5 drops of Lugol’s solution3
were added to preserve the samples for
phytoplankton analysis in the laboratory. Another sample was preserved in 5% formalin for
zooplankton analysis. In the laboratory, the plankton sample collected from each site was shaken
well and 1 ml was transferred into a Sedgwick rafter cell (a counting cell) using a small dropper,
Then the sample was covered with the glass cover without air bubbles. Later the plankton were
examined under the mid power (10×10) of a light microscope and were identified using Needham
and Needham (1962), Mendis and Fernando (1962) and Abewickrama (1979). The relative
volume of each plankton in one transect along the Sedgwick rafter cell at 100x was measuredfollowing the method described in Vollenweider et al. (1974). Here, a cell of Spirogyra was
selected as an arbitrary unit as it was the common phytoplankton in the samples collected.
Benthos sampling and analysis
On each sampling occasion, five benthic samples using a Peterson grab of 1250 cm3 capacity
(see Fig. 1 in Annex 11) were randomly collected at all sites, except the sites with rocky
substrate. The sample was placed in a polythene bag and preserved immediately in 10 %
formalin with Rose Bengal4
and transported to laboratory for further analysis. In rocky sites, a
30 cm × 30 cm quadrat was placed. The animals found within the quadrat were collected into a
container, identified in situ to the lowest possible taxonomic level using Mendis and Fernando
(1962) and Needham and Needham (1962). Their number also recorded. The animals that
needed further taxonomic confirmation were preserved in 5 % formalin and transported to the
laboratory. This quadrat sampling procedure, however, could not be followed in higher waterlevels in May 2013.
In the laboratory, benthic samples collected from each of the sites were subjected to the wet
sieving (sieving with water) method as described by Southwood (1966). The mesh sizes ofsieves ranged from 2.00 mm to 250 µm. The collected benthic fauna were then placed in a white
enamel tray and observed under a 1 × 10 magnifying lens. The benthos were identified to thelowest possible taxonomic level using Mendis and Fernando (1962) and Needham and Needham
(1962) and their abundance was calculated as follows: Population density = number of
individuals/sample volume.
Other aquatic macro fauna sampling and analysis
Various non-quantitative sampling methods, including visual observations and digital
photographing were used to assess aquatic life in the river bed area, river banks, and peripheral
areas. The aquatic macro fauna such as crabs, snails, damselfly and dragonfly larvae were
captured with a hand net and a scoop net. The free-living nymphs and larvae of aquatic insects
which live attached to river substrate (e.g. caddis flies) in the river were dislodged with a fine
paint brush and subsequently collected into a white enamel tray. Some animals were picked up
with fine-tipped forceps. They were then identified to the possible lowest taxa using Needham
and Needham (1962) and Mendis and Fernando (1962). The animals that needed to have further
3Lugol’s solution is a solution of 5% iodine dissolved in 10% potassium iodide. It acts as a preservative and stains
the plant tissues.
4Rose Bengal is a vital stain that colours animal tissue pink and therefore it aids to recognize the animals in
sediment samples
7
taxonomic confirmation were transferred into plastic bottles, preserved in 10% formalin and
transported to the laboratory. In the laboratory, their taxonomic confirmation was done under the
low power of a light microscope.
Fish sampling
At each sampling site, fish were caught using the cast nets of 1 cm (1.5 m height), 2.5 cm (2.5 m
height) and 3.5 cm (3.5 m height) stretched mesh hauling 5 times at each site. The small hand
nets, made up of the mosquito netting were used as drag nets or scoop nets grab (see Fig. 2 in
Annex 11) to catch fish at the water’s edges. A 15 m long trammel net with three layers of 3.0,
4.5, 6.0 cm netting and a 20 m long gill net of 3.5 cm stretched mesh were laid and kept 1 to 2
hours in large rock pools. The entangled fish were identified up to species level in situ using
Pethiyagoda (1991). The Catch Per Unit Effort (CPUF) was calculated as follows:
CPUF = number of individuals caught/number of hauling
Assessing the occurrence of large animalsSurvey work was supplemented by direct visual observations where possible, and by obtaining
indirect evidence of the presence of certain animals, via bird calls, pugmarks (mammals), scat(carnivorous mammals), dung (herbivores), egg masses (amphibians), and discarded fur, seeds,
flowers or fruit. In addition, local people were also interviewed regarding the presence of certainspecies and habitats, and sand miners were employed to collect additional samples of flora and
fauna in locations with difficult access. The conservation status of each taxon was determined
referring to The National Red List 2012 of Sri Lanka (MOE, 2012).
River habitat assessment
At present different river habitat assessment criteria have been developed by several countries to
assess river habitat quality. Among them, River Habitat Audit Procedure (Anderson, 1993a)
AUSRIVAS (Parsons et al., 2001) and Index of Stream Conditions (Ladson and White, 1999)
are largely utilised in different countries (Ravena et al., 1998).These methods enable
straightforward classification of rivers and streams based on their principal physical and
biological features. They have been utilized successfully in many countries to assess river
habitats (http://www.environment.gov.au). In Sri Lanka, the AUSRIVAS assessment criteria
have been successfully utilized to assess site-specific river quality in the uppermost catchments
of the Mahaweli River (Shirantha et al., 2010). The river habitat assessment criteria derivedfrom River Habitat Audit Procedure (Anderson, 1993a), AUSRIVAS, Index of stream
conditions (Ladson and White, 1999) and Stream Ecology and function (David Allen, 1998)
were therefore used to assess the river habitat at each study site. Those criteria are given in
Annex 5.
The river habitat assessment was done with the study conducted at each of the 17 surveylocations and noted on pre-prepared recording sheets. Observations were made on each of the 22
assessment criteria by referring to the associated list of specified features. Decisions were made
based on previous experience of using this assessment methodology in rivers similar to the
Mahaweli Ganga. The decisions on percentage cover and other features were made by visual
observations.
4.3 Aquatic ecology of the project site
4.3.1 River habitat variation
The results of the river habitat assessment at the study sites are given in Annex 6. According to
the adapted assessment criteria, the river valley in this area varies widely, from “shallow” to“broad” and “gorge”. The riparian vegetation cover along the river banks at the proposed dam site
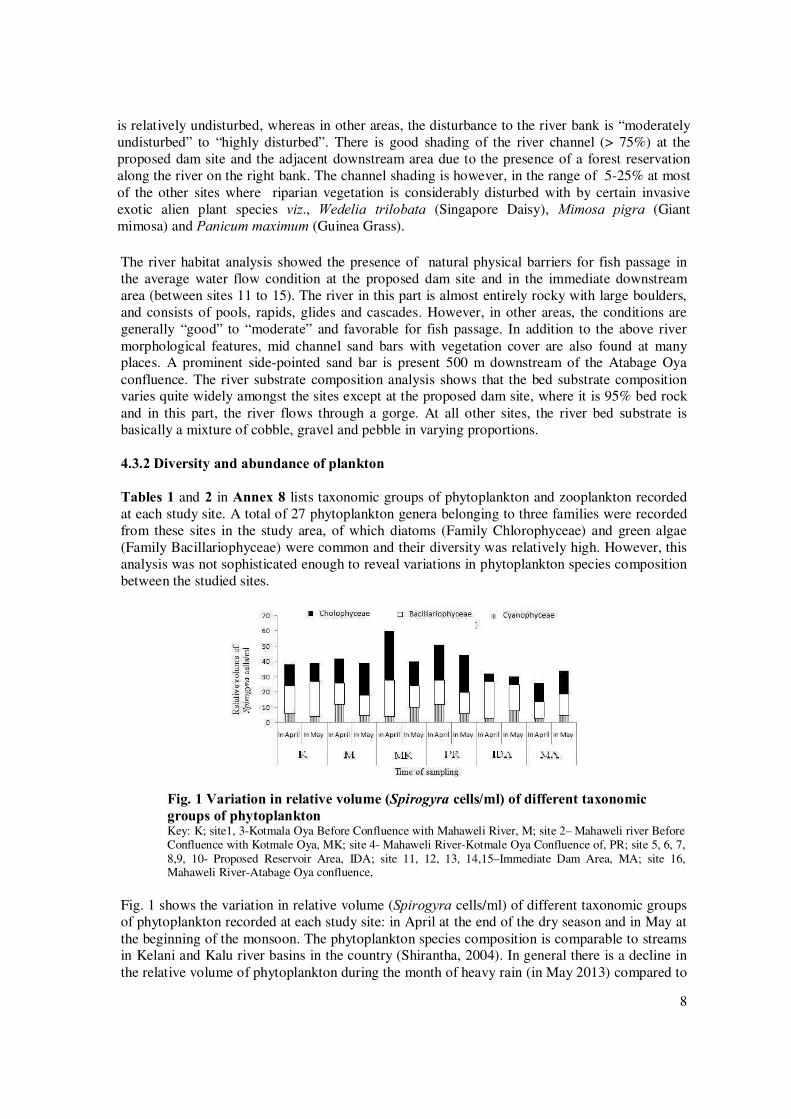
8
is relatively undisturbed, whereas in other areas, the disturbance to the river bank is “moderately
undisturbed” to “highly disturbed”. There is good shading of the river channel (> 75%) at the
proposed dam site and the adjacent downstream area due to the presence of a forest reservation
along the river on the right bank. The channel shading is however, in the range of 5-25% at most
of the other sites where riparian vegetation is considerably disturbed with by certain invasive
exotic alien plant species viz., Wedelia trilobata (Singapore Daisy), Mimosa pigra (Giant
mimosa) and Panicum maximum (Guinea Grass).
The river habitat analysis showed the presence of natural physical barriers for fish passage in
the average water flow condition at the proposed dam site and in the immediate downstream
area (between sites 11 to 15). The river in this part is almost entirely rocky with large boulders,
and consists of pools, rapids, glides and cascades. However, in other areas, the conditions are
generally “good” to “moderate” and favorable for fish passage. In addition to the above river
morphological features, mid channel sand bars with vegetation cover are also found at manyplaces. A prominent side-pointed sand bar is present 500 m downstream of the Atabage Oya
confluence. The river substrate composition analysis shows that the bed substrate compositionvaries quite widely amongst the sites except at the proposed dam site, where it is 95% bed rock
and in this part, the river flows through a gorge. At all other sites, the river bed substrate is
basically a mixture of cobble, gravel and pebble in varying proportions.
4.3.2 Diversity and abundance of plankton
Tables 1 and 2 in Annex 8 lists taxonomic groups of phytoplankton and zooplankton recorded
at each study site. A total of 27 phytoplankton genera belonging to three families were recorded
from these sites in the study area, of which diatoms (Family Chlorophyceae) and green algae
(Family Bacillariophyceae) were common and their diversity was relatively high. However, this
analysis was not sophisticated enough to reveal variations in phytoplankton species composition
between the studied sites.
Fig. 1 shows the variation in relative volume (Spirogyra cells/ml) of different taxonomic groups
of phytoplankton recorded at each study site: in April at the end of the dry season and in May at
the beginning of the monsoon. The phytoplankton species composition is comparable to streamsin Kelani and Kalu river basins in the country (Shirantha, 2004). In general there is a decline in
the relative volume of phytoplankton during the month of heavy rain (in May 2013) compared to
Fig. 1 Variation in relative volume (Spirogyra cells/ml) of different taxonomic
groups of phytoplanktonKey: K; site1, 3-Kotmala Oya Before Confluence with Mahaweli River, M; site 2– Mahaweli river BeforeConfluence with Kotmale Oya, MK; site 4- Mahaweli River-Kotmale Oya Confluence of, PR; site 5, 6, 7,
8,9, 10- Proposed Reservoir Area, IDA; site 11, 12, 13, 14,15–Immediate Dam Area, MA; site 16,Mahaweli River-Atabage Oya confluence,

9
the dry month (in April 2013). This variation is common for flowing waters in the island which
show seasonal variation in flow and water quality (Silva, 1996).
The zooplankton at each study site consists mainly of larval stages of aquatic insects,
crustaceans, rotifers and protozoa. Most of the species in their larval form could not be
identified to generic or species level, as the identification of larval stages of many aquatic insects
and crustaceans in Sri Lanka is still at a neonate stage. Fig. 2 shows the observed variation in the
diversity and composition of zooplankton in the dry and wet months. The zooplankton show
seasonal variation in their relative volumes in dry and wet months similar to the phytoplankton
and this is common to other rivers in the country (Silva, 1996).
4.3.3 Diversity and abundance of the aquatic invertebrates
Tables 1 and 2 in Annex 9 (see also photographs in Annex 10 - Figs 1-12) show the estimatedpopulation densities (individuals/cm3) of all invertebrates recorded throughout the study area.
This shows the presence of a variety of worms, molluscs, crustaceans and insects, with a similar
taxonomic composition to those found elsewhere in upland areas of the Mahaweli River
(Shirantha et al. 2009, 2010). Cladocerans and Copepods were the most numerous groups, and
Caridina sp. is the most widespread species, being found at most stations, possibly because of
its omnivorous habit. Most other species are quite low in abundance, which is likely to be a
product of several factors, including the capture methods, the difficulty of sampling a fast-
flowing river in May, and the limited coverage of particulate sediments in the study area.
Some of the species present have been suggested as being indicative of poor water quality,
including the free-living turbellarian flatworms (Dudgeon, 1999) and the gastropod molluscs
Paludomus chilinoides, P. loricatus and Melanoides tuberculata (Shirantha et al., 2009); sowater quality could have a limiting effect on invertebrate density, especially during the first
survey period, at the end of the dry season. In contrast, Table 2 of Annex 9 shows that there wasquite a good diversity of dragonflies and damselflies, comprising 20 species, of which 7 are
Fig. 2 Variation in the relative volume of different zooplankton taxa (Spirogyra
cells/ml) at each study site (in April: low water level and in May: high water
level)Key: K; site1, 3-Kotmala Oya Before Confluence with Mahaweli River, M; site 2– Mahaweli riverBefore Confluence with Kotmale Oya, MK; site 4- Mahaweli River-Kotmale Oya Confluence of, PR;
site 5, 6, 7, 8,9, 10- Proposed Reservoir Area, IDA; site 11, 12, 13, 14,15–Immediate Dam Area, MA;site 16, Mahaweli River-Atabage Oya confluence,
10
endemic to Sri Lanka, and two are Near Threatened according to MOE 2012 i.e. Indothemis
carnatica and Paragomphus henryi.
4.3.4 Diversity and abundance of aquatic plants
The list of aquatic plants and their occurrence in each study site are given in Table 1 in Annex
7. The study reveals that the aquatic plant diversity is very low at the project site compared to
the Mahaweli River at the Getambe area where there are some rare, endemic and non-endemic
aquatic plant species such as Cryptocoryne parva, C. walkeri, C. beckettii, C. undulata and
Lagenandra praetermissa (Yakandawala, 2012). None of these species were found in the project
area, possibly because of the rapid flow of the river and the presence of rocky substrate, which
does not support the growth of such submerged plants. The only similar species recorded wasLagenandra ovata (Malayan Sword), which is present in a small patch at the proposed reservoir
area. Some other very rare plant species i.e. Farmeria metzgerioides and Polypleurumelongatum of the family Podostemaceae, were recorded in the submerged rocky substrate at
Getambe but were absent from the project site. In contrast, certain common exotic andindigenous submerged aquatic plant species such as Hydrilla verticillata (Hydrilla), Vallisneria
spiralis (Mini Twister) and Blyxa aubertii (Roundfruit Blyxa) were found at the water’s edge atall the sites studied. There was also a dense growth of Potamogeton pectinatus (Sago Pondweed)
in the Kotmale Oya and at the Atabage Oya confluence.
4.3.5 Diversity and abundance of fish fauna
Table 3 in Annex 9 gives the list of fish species recorded in the project area. This shows that the
fish diversity in the study area is relatively high. The survey recorded a total of 40 fish species out
of 91 species in Sri Lanka (MOE, 2012). These species belong to 17 families, representing 14
endemics, 21 indigenous and 5 exotics. Of these, eight species are nationally threatened according
to the current Red Data List of Sri Lanka (MOE, 2012). They include, Channa ara (Giant
Snakehead), Labeo fisheri (Green Mountain Labeo), Channa orientalis (Smooth-breasted
Snakehead), Garra ceylonensis (Ceylon Stone-sucker), Pethia melanomaculata (Fire fin barb),
Pethia reval (Red fin barb), Pethia nigrofasciata (Black ruby barb) and Wallago attu (Shark
catfish). Further, there are six migratory fish; Anguilla bicolor (Level fined eel) and A. nebulosa(Long finned eel), Labeo fisheri (Green Mountain labeo), Tor khudree (Black Mahseer), Garra
ceylonensis (Ceylon Stone Sucker) and Wallago attu (Shark catfish), which swim upstream to
spawn in the breeding season (Silva & Davies, 1986). Figure 3 shows the abundance of some
endemic fish in the project area calculated as Catch Per Unit Effort (CPUE). The figure 3 showsthat Dawkinsia singhala was the most abundant endemic fish species (5.75 CPUE) in the project
area whereas the others were all relatively low in density (<1.5 CPUE). The CPUF of Belontiasignata and Clarias brachysoma was very low <0.01 and therefore, not included in the figure 3.
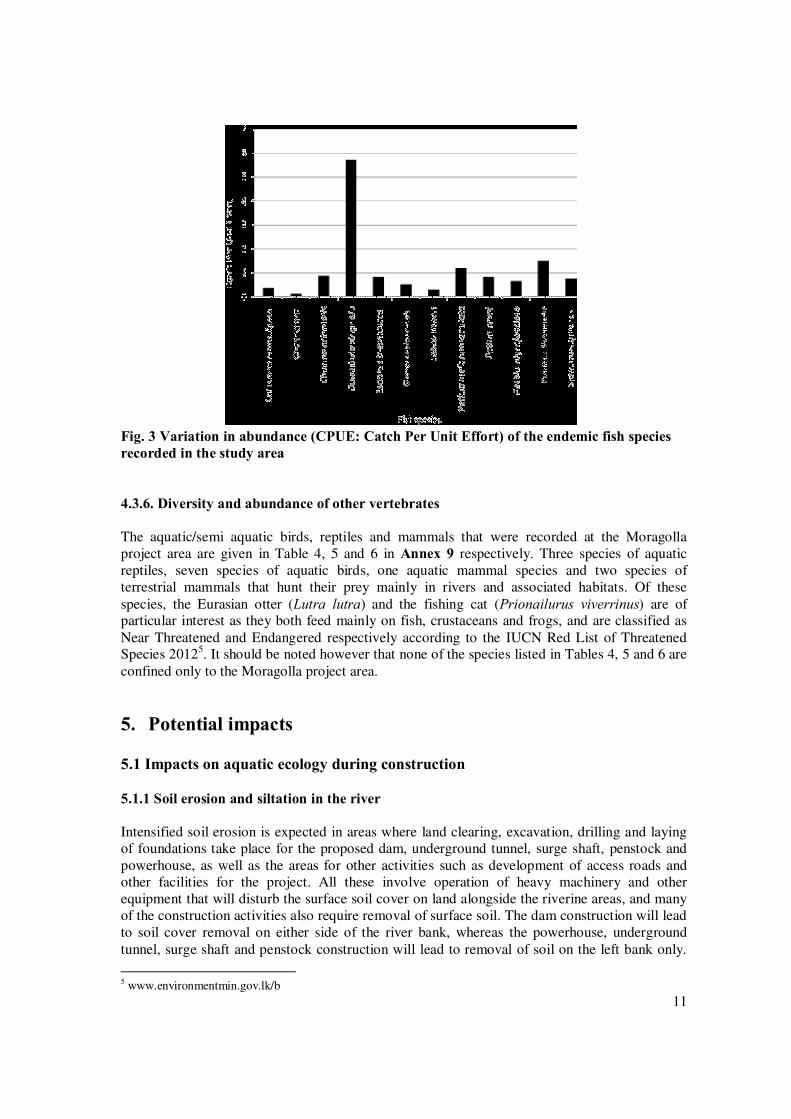
11
Fig. 3 Variation in abundance (CPUE: Catch Per Unit Effort) of the endemic fish species
recorded in the study area
4.3.6. Diversity and abundance of other vertebrates
The aquatic/semi aquatic birds, reptiles and mammals that were recorded at the Moragolla
project area are given in Table 4, 5 and 6 in Annex 9 respectively. Three species of aquatic
reptiles, seven species of aquatic birds, one aquatic mammal species and two species of
terrestrial mammals that hunt their prey mainly in rivers and associated habitats. Of these
species, the Eurasian otter (Lutra lutra) and the fishing cat (Prionailurus viverrinus) are ofparticular interest as they both feed mainly on fish, crustaceans and frogs, and are classified as
Near Threatened and Endangered respectively according to the IUCN Red List of ThreatenedSpecies 20125. It should be noted however that none of the species listed in Tables 4, 5 and 6 are
confined only to the Moragolla project area.
5. Potential impacts
5.1 Impacts on aquatic ecology during construction
5.1.1 Soil erosion and siltation in the river
Intensified soil erosion is expected in areas where land clearing, excavation, drilling and laying
of foundations take place for the proposed dam, underground tunnel, surge shaft, penstock and
powerhouse, as well as the areas for other activities such as development of access roads and
other facilities for the project. All these involve operation of heavy machinery and other
equipment that will disturb the surface soil cover on land alongside the riverine areas, and many
of the construction activities also require removal of surface soil. The dam construction will lead
to soil cover removal on either side of the river bank, whereas the powerhouse, underground
tunnel, surge shaft and penstock construction will lead to removal of soil on the left bank only.
5www.environmentmin.gov.lk/b
12
During construction the drilling of the bed rock and the uprooting of large woody trees and
others vegetation will be inevitable. These and other activities during the construction phase of
the project will cause disturbance to soil cover in the riparian area that will lead to soil erosion
during rainfall and entry of silt-laden water into the river. This could be severe in the rainy
season as the bank of the entire river stretch concerned is already disturbed, having little natural
vegetation cover. Excessive soil erosion is therefore already a very common environmental
degradation issue in this area, and the anticipated additional disturbances caused by the
construction process may also cause earth slippages if surfaces from which vegetation has beencleared are exposed to heavy rain. This may be more severe in the steep areas of silt or muddy
substrate, and may be more of a risk on the left bank, where there are abandoned tea plantations,an industrial area and home gardens that are susceptible to heavy surface runoff. Removal of
riparian vegetation along the river bank will also reduce the stability of the banks, and increase
insolation and raise the temperature of the water, especially during the low flow season.
Bedrock and boulders may have to be removed for the dam foundations and other structures, and
this may exacerbate soil erosion in these areas. The anticipated soil erosion will deliver
sediments into the river channel, which may cause detrimental effects on in-stream habitats and
inhabitants.
Soil erosion usually causes high siltation in the river, producing highly turbid water from the
increased amount of suspended loads. In these circumstances, gills of fish and invertebrates
could become clogged, impairing respiration, and if the condition becomes severe, the more
sensitive life forms, including larvae of fish and other aquatic animals could die (Kerr, 1995).
Motile animals may move to avoid highly turbid waters so distribution patterns could change,and if light penetration is impeded, photosynthesis by macroscopic plants and phytoplankton
would be reduced, leading to reduced overall productivity of the ecosystem. Increasing thesediment input in the river could therefore have a variety of impacts in the project area and
downstream, depending on the extent and duration of any siltation issue. It should be borne inmind however that little soil disturbance is anticipated on the right bank, where there is less
construction activity and a relatively good riverine forest cover, and that these anticipatedimpacts will occur mainly in the construction phase.
5.1.2 River bank erosion
Construction work in the river channel will be required in order to build the dam and the tailrace
outfall, and the river will be diverted temporarily in the area of the dam to enable safe access for
the riverbed construction. There will be changes therefore in flow patterns in the river, whichcould cause erosion of the river banks, and this could be exacerbated by any damage caused by
heavy machinery operating alongside river banks in these and other locations. There is a directand indirect interconnection between the substrate and the biota in river banks as the substrate
provides a surface to cling to or burrow in, shelter from the current, materials for construction of
cases and tubes, and refuge from predators. Thus if banks were allowed to erode significantly,
any inhabiting plants, together with fauna such as crabs, molluscs, some aquatic insects
(mayflies, caddis flies, etc), and annelid worms would be dislodged. The natural morphology of
the river in the project area however provides quite stable bedrock (see Annex 4) and banks that
are naturally protected by rock boulders, so it may not be necessary to have specific mitigation
measures for these impacts. Particularly in the tailrace construction area the river consists of
mainly riffles where the water flow rate is rather high, and any changes in flow patterns will be
dissipated by the presence of the small islands and good woody plant cover and rock boulders,
described in Section 4 above. This will minimize erosion of the river bank as they act as a
barrier to break up the energy of the flow.
13
5.1.3 Water quality depletion in the river
There are several ways in which the water quality in the river could be reduced during
construction. The principal risks include: direct contamination by cement and other construction
waste, or by spillage of fuel and other materials into the water; indirect contamination due to
spillage of these materials onto soil, which washes into the river; and increased inputs of silt (as
described above), which then settle out in quiet waters, causing siltation and sedimentation. Any
impacts resulting from these factors would be greatest at and immediately downstream of the
construction sites, after which any pollutants will gradually be diluted by water from inflowing
rivers downstream.
5.1.4 Impacts on aquatic fauna and flora in the river
Impacts on fish
The immediate project area (from site 6 to 16) is home to a total of 32 native species fish, out ofwhich 11 are endemic (refer Table 3 in Annex 9). Of the endemics, the presence of Labeo
fisheri, locally known as “Kalu Gadeya”, a critically endangered species (MOE, (2012), is ofparticular interest as it is only found in the middle catchments of the Mahaweli river system
(Pethiyagoda, 1991; Shirantha, 2012). During the present survey it was recorded at Ethgala“Hath-wala” (7°07´.453N and 80°34´.476E); site 15 (Fig.7 in Annex 4) and site 16 where the
river provides a series of large, cool, dark rock pools (>10 m depth) of ever-present water,
approximately 1.5 km downstream of the proposed dam site. L. fisheri is a species that shows
reproductive migration, moving upstream to spawning sites to breed (Senanayake and Moyle,
1982; Silva and Davies, 1986, Silva, 1993; Shirantha 2012). If it is present in this area there is
then a risk that this very rare species could be affected by dam construction, if rock pools in this
area dry out or become severely reduced in size, depth and water quality, or removed by rock
blasting and excavation of the dam foundations. It will be important therefore, that adequate care
is taken to adopt the mitigation measures described below (see Section 6) and not to exceed the
approved limits for rock blasting.
Notwithstanding the above, it is not considered that the presence of the endemic and endangered
Green Mountain Labeo in the project area is a major conservation issue or a severe
environmental problem. The proposed mitigating measures given elsewhere in this report willalmost certainly minimize the anticipated impacts, so CEB along with their consultants and
contractors should ensure that these actions are implemented carefully and in full. It should also
be stressed that this species is currently recorded at more than 10 other locations within the
Mahaweli river system (Shirantha, 2012). Recent studies and surveys have shown that the fishfauna of this part of Sri Lanka is quite secure in some fast flowing waters in reserved and legally
protected areas of the sub-catchments of Loggal Oya, Beli-ul Oya, Badulu Oya, WasgamuwaOya, Nicola Oya, Heen Ganga, Theligamuwa Oya and Kalu Ganga (Shirantha, 2012).
Project construction could also adversely affect breeding and feeding grounds of some other
endemic fish species, such as Garra ceylonensis, Belontia signata, Channa orientalis and
Schistura notostigma as they lay eggs or build their nests at the water’s edge. However this is
unlikely to be of major significance, as they are common endemic fish species and there areenough nesting sites in both upstream and downstream areas for them. Furthermore they will
probably adapt to the river morphological changes and seek alternative places to survive and
breed within a very short period of time.
The presence of some other threatened endemic fish species in the project area, such as Pethianigrofasciata and Pethia reval is a result of translocation practices that took place in the late
14
1980s as a conservation strategy (Wickremanayake, 1990). At present these fish species are well
established in the Gamploa, Nawalapitiya and Ginigathena area (Wickremanayake, 1990,
Pethiyogoda 1991, Shirantha, 2004). The construction process is therefore unlikely to cause
severe population declines in these species within the Mahaweli river catchments.
The largest Cyprinid in Sri Lanka, Tor khudree (Black Mahseer) was found in this part of the
river particularly around the river convergence with the Atabage Oya. This species is unlikely to
be significantly affected although the river channel will be temporarily diverted during the
construction period, as the water from the Atabage Oya will facilitate them to move into a more
secure area in the downstream.
There could be some effect on the fish fauna from the changes in water quality as stated above
(pollution from spillage of oil, cement and other materials; and increased turbidity andsedimentation) and the species most at risk are the small Cyprinid fishes such as Rasbora
dandia, Devario malabaricus and Dawkinsia singhala. If there are substantial and prolongedchanges in water quality, the more delicate younger stages of these and other species may die,
and adults could also succumb, or alter their distribution to avoid the worst affected areas.
Impacts on other aquatic vertebrates
The other vertebrate fauna recorded in the immediate project area includes three mammals that
are of conservation importance according to the National Red List of Sri Lanka 2012 (MOE,
2012): the Eurasian otter Lutra lutra is categorised as vulnerable; the rusty spotted cat
Prionailurus rubiginosus is endangered; and the fishing cat Prionailurus viverrinus is
endangered. Most of the other aquatic vertebrates recorded are relatively common in aquatic
habitats throughout the country. It should also be noted that none of the endemic or endangered
mammalian, reptilian or aquatic bird species are confined only to this part of the Mahaweli river
system.
During the construction period the feeding grounds of some of the rare and important species
(including L. lutra, P. rubiginosus, P. viverrinus, Varanus salvator (Water monitor) and
Haliaeetus leucogaster (White-bellied sea eagle)) could be altered and disturbed by ground
clearance, construction work and other activities. This is unlikely to be a major impact however,
as these are all highly mobile animals that can move into alternative areas to find their prey, inboth aquatic and terrestrial environments.
Impacts on aquatic/semi aquatic flora
As shown by the description in Section 3 and 4 above, very few endemic or rare aquatic flora
have been found in this reach of the river. The project area is generally characterised by fast
flowing water and with a predominance of rocky substrates. As such this part of the river is not a
conducive habitat for extensive growth of rooting, submerged or floating aquatic plants. A few
plants of Lagenandra ovata (Malayan Sword) were recorded at the water’s edge, but they are
already disturbed due to prevailing river bank erosion. It is not expected therefore that the project
will have significant impacts on macroscopic aquatic plants.
Impacts on aquatic invertebrates
Various insects and other macroscopic invertebrates, including aquatic bivalves and gastropods
were recorded from the project area during the surveys (see Table 1 in Annex 9), and most were
relatively common and none are threatened or endangered, or confined only to the Moragolla
project area. As mentioned above, there have been no detailed studies on the presence,
distribution, conservation and taxonomic status of most of the aquatic invertebrates in Sri Lanka,
so it is very difficult to make definitive statements on the potential impacts of the project on

15
these organisms or their likely significance. It can be said however that invertebrates will be
susceptible to some of the construction activities as they tend to be aggregated in water-edge
areas. They could therefore be removed by excavation in these areas for construction of the dam
and tailrace outfall, crushed by any vehicles or machinery that is operated in or outside such
areas, or washed away if there is any bank erosion. They might also be affected by any pollutants
that are spilled in the water (especially toxins like vehicle oil), and increase of sediment content
could clog their respiratory surfaces, impeding oxygen uptake and causing metabolic stress. Most
probably less mobile animals such as aquatic worms, shellfish and bivalves will be most affected
by any such impacts as others can move into less disturbed areas as they are very sensitive to
even slight changes in their environments. Some of the dragonfly and damselfly species are
endemic to the island but none of them are restricted only to this part of the river. All taxa shown
in Annex 9 Tables 1 and 2 are very common in all riverine habitats in the wet zone of Sri Lanka.
Impacts on invertebrates are therefore unlikely to be of major significance.
5.1.5 Impacts on associated terrestrial fauna and flora in riparian area
According to the project design very little of the riparian area will be cleared of vegetation for
the construction work. Some woody trees and shrubs will be removed, but the total cleared area
will be less than 2 ha. This vegetation supports some terrestrial fauna, especially underground
dwellers such as mongoose and shrews, and small numbers may be killed during this process, orthey may move to other areas, including the riparian shrub cover along the right river bank
where there is a forest reservation agro gardens. None of the animals found in the areas of
riparian vegetation are rare or endangered, and most will move into other similar areas nearby
once vegetation removal begins; so these will not be major impacts and no special mitigation is
required. Keeping vegetation removal to the minimum is however necessary as it helps conserve
these species in situ. During the construction period the migratory paths of some carnivorous
animals such as wild cats and otters may be blocked or disturbed temporarily, but this will also
not be a major impact as these are highly mobile animals that will avoid the construction site
anyway, and will utilise undisturbed areas in the vicinity or elsewhere.
Some plant cover at the water’s edge may also be damaged or destroyed during site clearance,
and due to movement of machinery and other heavy equipment. Most of these species are alien
invasive e.g. Wedelia trilobata (Singapore Daisy) and Panicum maximum (Guinea grass), so
they are of no special floral value. They play an important role however, in controlling soilerosion and providing shelter for the animals that live at the water’s edge (adult dragonflies and
damselflies, crabs, etc.). This is therefore another reason for keeping the damage and loss ofbank-side and in-river vegetation to the minimum possible.
5.1.6 Impact due to recruitment of labour force for construction activities
The project contractors will employ some people from outside the project area in their workforce
and this may require provision of an accommodation camp, closer to the dam site. This could be
a source of water pollution that could affect aquatic ecology, for example if raw sewage from the
camp was discharged into the river, causing reductions in oxygen under low flow conditions as
the waste decomposes. Solid waste could also be a problem if it is discarded into the river, as it
could damage habitats and cause the death or injury of aquatic mammals, fish or invertebrates
from contact with or ingestion of the waste. This will need to be avoided by proper wastemanagement procedures at the accommodation camp, as described below.
There is also the risk that workers may capture fish for consumption, especially as the project
area supports some large food fish species that are of high consumer preference including the
16
Black Mahseer, Green Mountain labeo, Common carp, Shark catfish and some other large
Cyprinds such as Olive barb and Long-snouted barb. During periods of low flow in the
construction period these fish will tend to congregate in the large rock pools that are common
around the dam site and downstream near the tailrace outfall. These pools will be accessible
because of the low water levels and workers may attempt to kill the fish by the use of dynamite
or poisons. This is quite a common occurrence in river diversion projects and it causes
detrimental effects on the fish populations as these agents indiscriminately kill all stages,
including young individuals, and also other aquatic animals in the vicinity. It will be very
important that prompt actions are taken to avoid this.
5.1.7 Removal of riparian vegetation and loss of shade
For the road construction, machinery movement and excavation of on-land foundations for thedam and powerhouse some trees, grass cover and non-woody plants will have to be cut and
removed. This may lead to more debris and leaf/woody material entering the river, which couldcause sudden changes in river water quality from eutrophication if this material accumulates in
low flow areas and decomposes. It could also promote microbial activity and create new microhabitats, and could clog water channels, etc. These impacts could affect aquatic life by impeding
migration or limiting feeding and breeding areas, or if reductions in water quality impederespiration and cause metabolic stress. Proper measures should therefore be taken to minimize
these impacts.
Vegetation removal, especially trees, will cause loss of shade, and where this occurs close to the
river, the increased action of the sun on the water could lead to temporary increases in water
temperature, especially during the low flow season. Tree and shrub removal will also lead to
increased soil erosion during rainfall, and will also reduce the nesting, foraging and feeding
grounds for the aquatic and semi-aquatic fauna as well as for the terrestrial animals. These will
be relatively small-scale impacts as removal of vegetation will not affect large areas, and the
project site anyway does not contain very much natural habitat. Nevertheless, as explained
above, vegetation removal should be minimised as much as possible, as the impacts could be
more serious if combined with other impacts, e.g. reduction in water quality and loss or
disturbance of aquatic habitats.
5.1.8 Construction in the river bed
The project will involve significant construction in the river bed, to build the dam and the
tailrace outfall. The river will be diverted to allow most of this work to be done, so some river-bed areas in the vicinity will dry out and their inhabiting plants and animals will die. This will
affect relatively small areas in which none of the aquatic plants or invertebrates are known to berare, so no special mitigation measures will be needed to protect these organisms. Some of the
rare and locally important food fish however might become trapped in rock pools, so to avoidthose impacts, a small scale capture and relocation programme should be conducted.
If any construction is conducted directly in the river in these and other areas, the associated
disturbance of the river bed could increase the sediment load in the river, and contribute to
increases in turbidity and downstream siltation from other sources, and associated impacts on
fish and other fauna and flora as described above. Measures will therefore be required to
minimise any such disturbance, and in particular to avoid the spillage of potentially toxic
materials into the river, e.g. oil and cement.

17
5.1.9 Other construction hazards
In relation to the various other construction activities, the key concern regarding impacts on the
aquatic ecology is the effect of blasting and vibration. There may be some blasting in the river
itself to break up and remove bedrock at the dam site, and there is likely to be other detonationson either side of the river bank, and along the underground tunnel. Depending on the frequency
of blasting, its location and the severity and penetration of the related shockwaves, there couldbe effects on the behaviour and physiology of animals in the river. Fish and other motile animals
may move away from areas where there are vibration impacts, but these will not be permanentchanges and any displaced individuals may return once the disturbance is over. There could
however be more permanent impacts on organisms inhabiting pools in the riverbed during thedry season, as severe vibration from blasting nearby could cause stress and even death. The
programme of capture and relocation mentioned above should therefore also encompass rock-
pools in the vicinity of any proposed blasting.
5.1.10 Waste disposal and accumulation in the river and riparian area
The river is already subject to an unsightly and unnecessary accumulation of garbage of
anthropogenic origin as described above and shown in Fig. 6 in Annex 4, and this can affect
aquatic habitats and inhabitants as described in Section 5.1.6 above. This pollution load and its
ecological impacts could be increased significantly through used snack wrappers, bottles, etc.
discarded by construction workers, and there could also be inputs of organic waste, fromdefecation/urination, discarded food and cut vegetation. These will add some more organic and
inorganic pollutants to the river of the project area. Since this is an existing threat, the impacts
would be amplified by the construction work. This can be minimized if proper mitigating actions
are taken, including a proper waste disposal program that is implemented with the local
government.
5.2 Impacts of dam, reservoir and hydropower scheme operation on aquatic ecology
5.2.1 Impacts of dam creation
Changes in river morphology
The dam will both streamline and distribute the river flows, as in the rainy season water willflow over the crest through the discharge gates, and through the headrace tunnel 3.1 km
downstream. The deflection of water through the tunnel and over the sloping crest of the damwill reduce the flow turbulence, and as the river section here is rocky and deep, with large pools
and riffles, there should be few impacts on downstream river morphology, as the rocky terrain isnot easily susceptible to such changes.
The dam will also divide the river into two and instead of the steep and fast flowing rhithron
upstream and the sluggish and flat potamon downstream, there will be a new and largerinundated area upstream and reduced flow downstream in the dry season (January, February and
March). This will lead to sudden changes in river morphology upstream, due to the changes in
water levels. The relatively narrow river channel will be converted into a wider and deeper man-
made lake, and the water surface will be higher and exposed to new and potentially unstable
bank areas, with muddy to sandy substrate. It is expected therefore that bank erosion may occur
in the proposed reservoir area from the increased surface turbulence in the rainy season. This
will require mitigation measures to avoid excessive silt and turbidity in the water, and resulting
reduced storage capacity.

18
Changes in water flow and quality
The presence of the dam and the usage of water for power generation will alter both the
downstream water flow in the river and its physical, chemical and biological characteristics. The
aquatic environment will therefore change, both upstream and downstream of the dam.
The Moragolla reservoir will operate as a “run-of-river” scheme, where the relatively small
reservoir acts as a regulating pond, not a storage basin. During the wet season (May -
November) there will be sufficient water to generate power almost constantly, and the excess
water will flow from the reservoir through the spillway gates. This will maintain an almost
normal rate of downstream flow in the river. Water will be retained by the dam for only a short
time (<1 day) so major changes in water quality during this period are unlikely, apart from
possibly small reductions in sediment content as the reduced flow speeds in the reservoir will
allow some suspended particles to settle onto the bed.
During the dry season (December - April) the Moragolla scheme will be operated primarily tosatisfy peak electricity demand, so power will be generated between 6-9 pm each day. For the rest
of the time power will be generated when there is sufficient water in the reservoir, which isexpected to be for a few hours on most days. Water will therefore be retained in the reservoir for
longer periods during the dry season, so water quality could fluctuate. The main changes inquality of the impounded water are expected to be: a) increased temperature from the action of
the sun on the surface of the reservoir b) decreased oxygen, especially in the lower water levels,from microbial breakdown of dead and decaying plants and animals and organic debris entering
from on land and c) decreased sediment content as particles settle on the reservoir bed. Water
flowing downstream at this time will therefore be warmer and slightly lower in oxygen content
than normal, and somewhat less turbid. These differences will gradually be reduced by inflows
from other rivers downstream, including the “Thismada Ela” a perennial stream that enters the
Mahaweli River immediately below the dam. Downstream flow will also be augmented by a
continuous release of 1.5m3/s from the dam, which is the “environmental flow”, intended to
maintain the downstream aquatic ecosystem.
Increase in upstream water levels
The proposed dam is 35 m high and it will create a 38.5 ha, 1.98 MCM reservoir with a fullsupply level at 548 msl. This will inundate the present upstream river bank and parts of the
adjacent on-land riparian areas. This in turn will change habitat conditions in these areas and a
different set of dynamics will begin impacting the species that traditionally grow, nest, feed, or
spawn in these areas until a new equilibrium emerges. Since the dam site valley is a gorge (see
Annex 6) the presence of the dam is unlikely to cause floods in its immediate vicinity, but there
will be a significant increase in water level upstream in the area that covers the study sites 5, 6, 7,
8, 9 and 10 (refer Annex 3) as the river valleys here vary at different sites from a broad and
asymmetrical floodplain to a shallow valley. The proposed dam will therefore inundate a
significant area and it will affect a longer section of the upstream profile. The potential ecological
impacts of these changes both upstream and downstream are discussed below.
Impacts on aquatic fauna and flora
The dam will block the movement patterns of migratory aquatic organisms, especially fish. This
part of the Mahaweli River supports at least six migratory fish species, all of which were
recorded during this survey, namely, Anguilla bicolor (Level finned eel) and A. nebulosa (Longfinned eel), Labeo fisheri (Green Mountain labeo), Tor khudree (Black mahseer), Garra
ceylonensis (Ceylon Stone-sucker) and Wallago attu (Shark catfish). All these species moveupstream cooler waters or downstream (i.e. Eels) to spawn particularly with the onset of the
monsoon rain (Senanayake and Moyle 1982; Silva and Davies 1986; Silva 1993; Shirantha

19
2012). The dam will therefore block their movement as well as the subsequent downstream
passage of juvenile fish to the waters where they will spend their adult lives. During the breeding
season, adults of some of these species will migrate upstream as far as the dam, and on reaching
the barrier may try to pass through it, or remain in the vicinity. This may cause stress and injury,
and the individuals may become disoriented, and may die because of contact with the walls of the
dam, or deflection screens. They will also congregate in a relatively small area below the dam or
around the tailrace outfall, where their exposure to predators will be increased. In such
circumstances the breeding success of these and other species is likely to be greatly reduced,
which might then lead to long-term decline of the populations in this river. This is of particular
concern in the case of the rarer species, in particular the endemic critically endangered Labeo
fisheri.
The survey results presented in Annex 9 show that at least eight endemic fish species i.e. Garraceylonensis, Labeo fisheri, Pethia nigrofasciata, Pethia reval, Channa orientalis, Dawkinsia
singhala, Belontia signata and Schistura notostigma are found around the dam site and thehabitats of these species will become fragmented due to the construction of the dam. There is
therefore a possibility of dilution of the gene pool, which could reduce the biological fitness andsurvival ability of these populations over the longer term. This impact can be minimized if
species translocation will be implemented during the construction period as proposed in Section6.
The changes in the quality of water flowing downstream (described above), are not expected to
result in significant ecological impacts, because they will only occur during the relatively short
dry season, and will not extend far downstream because of dilution by other river inputs. The
reductions in downstream water flow will be more significant however, especially in the dry
season, as this could reduce the connectivity and passage of fish between the deep rock pools in
this area during this time. This may lead to their population decline due to alteration of their
reproductive cycle, which is largely dependent on river hydrology and food availability. This
negative impact can be minimised with some additional mitigation measures given in the Section
6.
The reduction in water level will also affect aquatic flora in the river, as plants in areas that dry
out will die from desiccation in the dry season. This will inevitably reduce the coverage andrichness of habitats in the downstream area, but these will not be severe impacts, because as
explained above the reductions in flow will mainly affect the area between the dam and the
tailrace outfall, where there is a predominance of rocky substrates. There are also no known rare
or endangered plant species in the area.
Adequacy of the proposed environmental flow
During the dry season (December - April) there is expected to be sufficient water in the reservoir
to allow power generation during the peak demand period, and for a few additional hours eachday. There is unlikely to be an excess of water discharged through the spillway gates, so for much
of this time the only water released from the dam will be the environmental flow of 1.5 m3/sec.
This will be discharged continuously, and it will be augmented by inflows from other rivers and
streams, in particular the “Thismada-Ela” immediately downstream of the dam. However these
streams will also be under low flow conditions at this time, and as the e-flow is around 42% of the
average annual minimum natural flow, it is inevitable that areas of the river bed between the damand the tailrace will dry out. As a result, plants in these areas will die, along with any animals that
are unable to move into areas of flowing or standing water. Fish and other animals that do survivewill be subjected to reduced water quality in the remaining pools.
20
The environmental flow will therefore not be sufficient to maintain the aquatic ecology unaltered
in the area between the dam and the tailrace. However the evidence from this study does not
justify increasing the environmental flow in order to protect the ecology of this area. This is
because:
(a) The area affected by significant reductions in flow will be mainly limited to the 3 km length
between the dam and the tailrace, in which this study has found no rare, endangered or
otherwise ecologically significant habitats, aquatic plants or invertebrate animals.
(b) Impacts on the rare and endangered fish and aquatic and terrestrial mammals that inhabit this
area will be reduced by a series of mitigation measures outlined in Section 6 below, which
are expected to ensure the conservation of these species, and may even lead to the growth of
their overall populations.
(c) The energy generated will be reduced with the increase of the environmental flow, which
will result in an increase of fossil fuelled energy generation.
5.2.2 Impacts resulting from the reservoir
Impacts on fish and other aquatic fauna
The future changes in river morphology and habitats particularly marked in the area of the
reservoir where the retained water will inundate extensive areas of land flanking the main
channel. This will increase living space for the aquatic flora and fauna, and the release of plant
nutrients from newly-submersed soil may produce a surge of primary productivity from growth of
phytoplankton and macroscopic plants, followed by an expansion in biomass of certain animal
communities. The individual species that prefer lacustrine water bodies, would be expected to
adapt quickly to these conditions e.g. fish species like Oreochromis mossambicus and Cyprinus
carpio and aquatic plant species like Potamogeton pectinatus. Their adaptations are not only
morphological but also behavioural. This could lead to the development of a good fishery,
particularly culture-based, in the near future. Some species however may move upstream to avoidconditions that are unfavourable for their breeding or feeding. These species may move upstream,
out of the inundated area. The reconfiguration of this running water body into a pseudo lacustrineone is therefore expected to cause changes in the populations of fish and other animals and plants,
as different species will react differently to the new conditions. Those that prefer deeper and slow-moving water are expected to thrive in the reservoir, and those that prefer faster moving water,
and are intolerant of lower levels of oxygen may move into the upstream area. Thesereadjustments will alter the distribution patterns and population densities, but are not expected to
cause any species to die out, so no special mitigation measures are proposed.
Impacts due to sediment accumulation
River water typically contains suspended particles of organic and inorganic materials, erodedfrom the land or riverbed upstream. These particles tend to settle out where current speeds are
low, forming areas of fine sediment on the riverbed. In reservoirs these particles accumulate onthe bed behind the dam because the dam itself is a physical barrier. The upstream area at the
Moragolla site is surrounded by steeply sloping land containing plantations and home gardens, sothere will be man-made as well as natural erosion of lands adjacent to the reservoir, especially
during the rainy season. This will probably lead to sediment build-up behind the dam. Once
sediments collect, the aquatic ecosystem may be affected in three main ways: downstream habitat
conditions may decline because these sediments no longer provide important organic and
inorganic nutrients; the amount of soft-sediment habitat may also decline as there is less sediment
flowing down the river to replace substrates that are eroded away during the high-flow season;
and finally, the nutrient loading may deplete the supply of oxygen in the reservoir due to the
increase of sediment-dwelling animals, and from microbial breakdown of dead organisms and
21
waste products that accumulate on the reservoir bed. River gravel is transported downstream
under high-flow conditions, so this may also be trapped behind the dam in the same way as finer
sediments, so areas of gravel habitat downstream may also decline.
Periodic release of sediments entrapped by reservoirs can have significant impacts on aquatic
organisms, as those living in the sediment will be washed downstream and probably killed, and
those living downstream will be exposed to highly turbid water, which may clog their gills and
hamper respiration and smother and kill animals and plants living on the river bed. The level of
impact however, depends greatly on the type of sediment and intended management practice. The
Moragolla dam does not include valves or any other mechanism to permit the regular flushing of
silt. It may take 30 years or more for the sediment in the reservoir to reach the spillway crest level
which is 8 m below the minimum operation level of the reservoir. The sediment further
accumulated will then be removed by mechanical dredging at the low flow season or sedimentsluicing through the spillway gate at the high flow season. It will be important to manage this
process carefully to reduce adverse impacts from sudden increases in the downstream sedimentload.
The heavy upland soil degradation including erosion at present transport substantial sediment
load in the river this if get accumulated behind the dam, the reservoir may fill its storage earlierthan expected. It would be prudent therefore to take additional action to prevent the entry of
sediments into the reservoir and the river upstream, through improved land management. This
could include: planting a reserve area around the reservoir with species that are known to bind
and conserve the surface soil; improving land drainage in this area; incorporating silt traps or
other filters to capture sediment before water drains into the reservoir; plus possibly
implementing some form of wider study and improvement of land management in the overall
Mahaweli Ganga catchment.
Impacts on debris movement
During the survey it was observed that in some areas potholes at the margins of the river, which
are habitat for certain fish and other macro fauna, are filled with materials of anthropogenic
origin, including plastic bottles, polythene and other non-degradable and degradable organic
waste. These materials enter the river from its upland catchments during high flow conditions,and can be a threat to sensitive species, from ingestion of or contact with inert or toxic material,
and from damage to their habitats. Construction of the dam and reservoir will greatly reduce
downstream movement of these materials, and in this respect, the hydropower project should be
beneficial for downstream ecology, provided that these materials are managed in anenvironmentally sound manner by CEB.
Bank erosion
As explained above, almost the entire natural river bank in the immediate project area comprises
primarily rocky material, so river bank erosion is not expected to be a significant additional
source for the entry of silt into the reservoir. However, as noted above, once the reservoir is
impounded, the upstream water level will rise well above the natural water channel and the edges
of the new water body will be in contact with land that is presently cultivated (home gardens or
tea plantations) or abandoned (unworked plantations). There is little natural vegetation in this
area, so there is a risk of erosion from the new reservoir bank areas. This is compounded by the
fact that many of these areas are steeply sloping, and the likely operation of the power plant,
whereby water levels in the reservoir will fluctuate regularly, during drawdown and subsequent
refilling. This could cause bank failures, erosion, and undercuts leading to land degradation, land
slippages and increased reservoir sedimentation. This impact may not be as severe as in certain

22
other reservoirs because at Moragolla it is proposed to have an optimum drawdown of only 6 m.
These impacts will therefore be mitigated by land management at the reservoir margins, and other
proposed mitigating measures that will be discussed in Section 6.
Reduced dilution of pollutants
The River water quality study has shown evidence of water pollution from the Crysbro Broiler
Farm (poultry industry), which discharges wastewater from the left bank approximately 2 km
below the proposed dam site. The water quality analysis and the field observations suggest
discharge of inadequately treated wastewater (see Report 1: Water quality in the Mahaweli Ganga
- upstream and downstream of the proposed dam at Moragolla). The reduced flow during
operation of the Moragolla scheme may reduce the dilution and dispersion of this effluent, which
contains high levels of Biochemical Oxygen Demand, Suspended Solids and animal oils and fats.
These pollutants will decompose in the water, reducing levels of Dissolved Oxygen, which may
hinder the respiration of sensitive fish and other aquatic organisms. Mitigation measures to
minimize these impacts will therefore be needed.
6. Proposed mitigation measures
6.1 Mitigation measures to minimise impacts during construction
This section summarises the potential impacts on aquatic ecology during project construction; and
mitigation measures are proposed below for those impacts considered likely to be significant.
Table 6.1 Summary of possible impacts during construction
Project action Possible negative impacts RemarksSoil erosion after
vegetation clearance and
use of machinery
Increased silt in the river, which may
clog the gills of fish and invertebrates
causing changes in distribution oreven death and reducing plant
photosynthesis
Significant
Mitigation measures should be taken
River bank erosion Inhabiting plants and associated fauna
may become dislodged and washedaway
Unlikely to be significant
TemporaryMitigation measures are not proposed as
explained in 5.1.2
Water pollution from
spills of oil, cement and
other toxins (into the
water or onto land)
Toxins may kill plants and animals or
affect respiration, metabolism,
breeding, etc.
Significant
Temporary
Some mitigation measures should be taken
River diversion causes
an increase in theriverbed area that dries
out in the dry season
Reductions in populations of L.
fisheri and other fish species
Significant
PermanentSome mitigation measures should be taken
Damage and disturbance
of the riverine area byconstruction activity
Altered and disturbed feeding grounds
and habitats of some importantterrestrial species; damage and
dislodgement of aquatic and semi-
aquatic flora and invertebrates
Less significant
TemporaryMitigation measures are not proposed
as explained in 5.1.4
Sewage, solid waste andother pollution may enter
the river from the workeraccommodation camp
and construction sites
Reductions in oxygen and metabolicstress to any inhabitants if organic or
inorganic waste accumulates in quietwaters in the dry season
Inert waste could also damage habitats
SignificantTemporary
Some mitigation measures should be taken
23
and injure or kill animals and plants ifit enters the river
Increased fishing
pressure on rare or
popular food fish species
Fish species when isolated in pools in
the dry season become more
susceptible to predation and captureby fishing. These and other species
could also be damaged significantlyby the use of dynamite or poison
Significant
Temporary
Some mitigation measures should be taken
Increased inputs oforganic matter and debris
into the river duringvegetation clearance
May injure animals from directcontact or cause stress from oxygen
reductions caused by decomposition
SignificantTemporary
Some mitigation measures should be taken
Disturbance of the river
bed due to construction
Adding to the sediment load in the
river
Significant
Temporary
Some mitigation measures should be taken
Bed rock blasting Changes in the distribution of fish and
other motile animals and may evencause the death of inhabitants of rock
pools
Significant
TemporarySome mitigation measures should be taken
6.1.1 Minimize soil erosion after vegetation clearance and use of machinery, and damage to
river banks
The most basic and simplest mitigation measure that can minimize the potential negative
impacts of soil erosion is to conduct as much construction work as possible in the relatively dryperiod between January and March. The ground soil erosion should be further minimized by
paving or grass turfing of the cut slopes, and terracing any cut hill slopes.
It is expected that the Project Approving Agency (Mahaweli Authority of Sri Lanka) will require
CEB to prepare a soil conservation action plan for the project area as one of the conditions
attached in granting the necessary construction permits; so this should be adhered very carefully
by all contractors involved in the construction work.
The damage caused due to excavation of soil for the footings and to lay the foundations of the
dam and other structures is unavoidable. Any other damage to river banks and slopes should be
rehabilitated concurrently, by replacing boulders and reinstating any damaged vegetation and
areas of soft sediment on the river bed, which are relatively scarce habitats in the project area.
To reduce the amount of silt-laden runoff entering the river, excavated soil from the dam
foundations should be transported for disposal as soon as possible and any soil that is stockpiledat the site should be compacted and protected using rip-rap or rubble pitching to prevent the soil
being blown or washed into the river.
The slope cuts and filled embankments should also be protected by adopting appropriatemethods of covering, such as gabion protection, coir matting, rubble mounds, vegetation
planting and turfing with grass. The best and most effective method should be decided by thesite staff depending on the specific site conditions. In any areas of severe erosion an appropriate
soil textile should be laid on the surface to prevent further depletion.
An area becomes prone to erosion when vegetation is removed prior to topsoil stripping during
initial site clearance. Every care should therefore be taken not to excavate or uproot trees or
other vegetation beyond the specified footprint of the works.
24
Some topsoil will be stockpiled on site for use to rehabilitate the same area or any other area that
has been disturbed. Soil stockpiles should be located in cleared areas away from drainage paths,
and protected from rainfall to avoid runoff as noted above.
All possible care should be taken not to directly discharge heavy flows from pumps and runoff
diversions to natural gullies and drainage paths that are susceptible to erosion. The outlets of all
pipes that discharge water from dewatering sites, flow diversions, etc. at each construction
location should be placed away from erodible areas and provided with appropriate provisions to
avoid erosion by dissipating energy and flow velocities. This can be done by instillation of ‘cut
off drains’ i.e. drainage ditches dug specifically to drain water and control water runoff speed.
The runoff from areas outside construction sites should be diverted away from the site by
constructing perimeter drains, diversion banks and other measures prior to starting work at thesite.
Use of heavy machinery on steep slopes should be strictly restricted to only that which is
absolutely necessary and should be closely monitored. The machinery operation should be doneby skilled operators, and before commencement of the work they should be trained in the risks
of excessive soil erosion and avoidance measures.
Apart from the above measures the negative impact of soil erosion that will affect river quality
should be further minimized via properly erected silt traps in appropriate places to arrest the
sediment flux that carries into the river.
6.1.2 Minimize water pollution from spills of oil, cement and other toxins into the water or
onto land
Wherever possible, all construction plant, material stockpiles, vehicle parks, labour camps etc.,
should not be located alongside the river banks to prevent soil erosion and other pollution of the
river. Before beginning work, all site workers and staff should be made aware of measures of
water conservation and waste minimization in order to stop the entry of mud-laden sediments
and other pollutants into the river.
The storage of fuel, oil or other toxic materials on site should be prohibited, ensuring they are
stored offsite at premises with appropriate pollution control procedures, including oil separators
on drains; and vehicle refuelling and maintenance on site should be prohibited except in an
emergency situation.
6.1.3 Conservation of fish fauna
The anticipated impacts on the rare endemic fish species including Labeo fisheri in the project
area can be minimized by translocation. L. fisheri and other species that become trapped in
isolated pools below the dam when the river is diverted may be captured and translocated to a
suitable relief point. Several such relief points with favourable conditions are present in the
Mahaweli river catchment, in both upstream and downstream areas, with undisturbed rock pools,
which could be ideal for these species to live no harm (e.g. main tributaries of Mahaweli River:
Loggal Oya, Heen ganga, Kalu ganga, Nicola Oya, Hasalaka Oya, Wasgomu Oya, Dunuwila
Oya and Badulu Oya). If this is done it should be commenced with a pilot project since there is
no such action that has been taken previously for a large habitat-specific fish species in Sri
Lanka.
25
6.1.4 Minimize impacts from river diversion
The Ceylon Electricity Board should take all necessary actions to ensure that the mandatory
environmental flow is provided continuously, for 24 hours a day. As mentioned in Section 5
discharge of the “Thismada-Ela” will supplement this environmental flow to sustain a reduced
aquatic ecology in the 3 km between the dam and the tailrace outfall, so this stream must be kept
flowing and free of obstruction or pollution throughout the construction period.
6.1.5 Prevent discharge of sewage and other pollution into the river from construction sites
and the accommodation camp
The contractor should provide adequate toilets for workers at the accommodation camp and at
all construction sites and should ensure that all waste is treated to Sri Lankan legal standards andthat no effluent is discharged to the river.
6.1.6 Minimize the increased fishing pressure on rare or popular food fish species, isolated
in pools
Illegal fishing in the project area should be avoided by incorporating preventative action in site
security procedures. The main contractor should be tasked with informing their appointed
security contractors that no fishing is to be allowed in the designated project area by any persons
(including the workforce), and requiring the security contractors to take appropriate preventative
action, via security patrols, etc.
6.1.7 Minimize increased inputs of organic matter and debris into the river during
vegetation clearance, causing injury and stress to animals from oxygen reductions
All cut vegetation and other debris produced during site clearance should be taken to a licenced
site for disposal immediately after the removal or cutting. This licenced site should be located
away from the river to ensure no seepage of decomposition products.
6.1.8 Minimize harmful effect of bedrock blasting on river inhabitants
The construction constructor should take action to keep the amount of dynamite blasting to the
minimum necessary, and avoiding blasting in areas that are in or close to the river channel as far
as possible. The contractors should strictly adhere to the standards on vibration for blastingactivities established by Central Environmental Authority.
6.1.9 Minimize water pollution from defecation/urination or solid waste discarded by
workers
The main contractors should set up and implement a waste management plan covering all
construction sites and accommodation camps. The plan should prohibit littering, ensure
provision of adequate litter bins and waste receptacles, and ensure that solid waste is taken for
disposal at a licenced site twice a week.
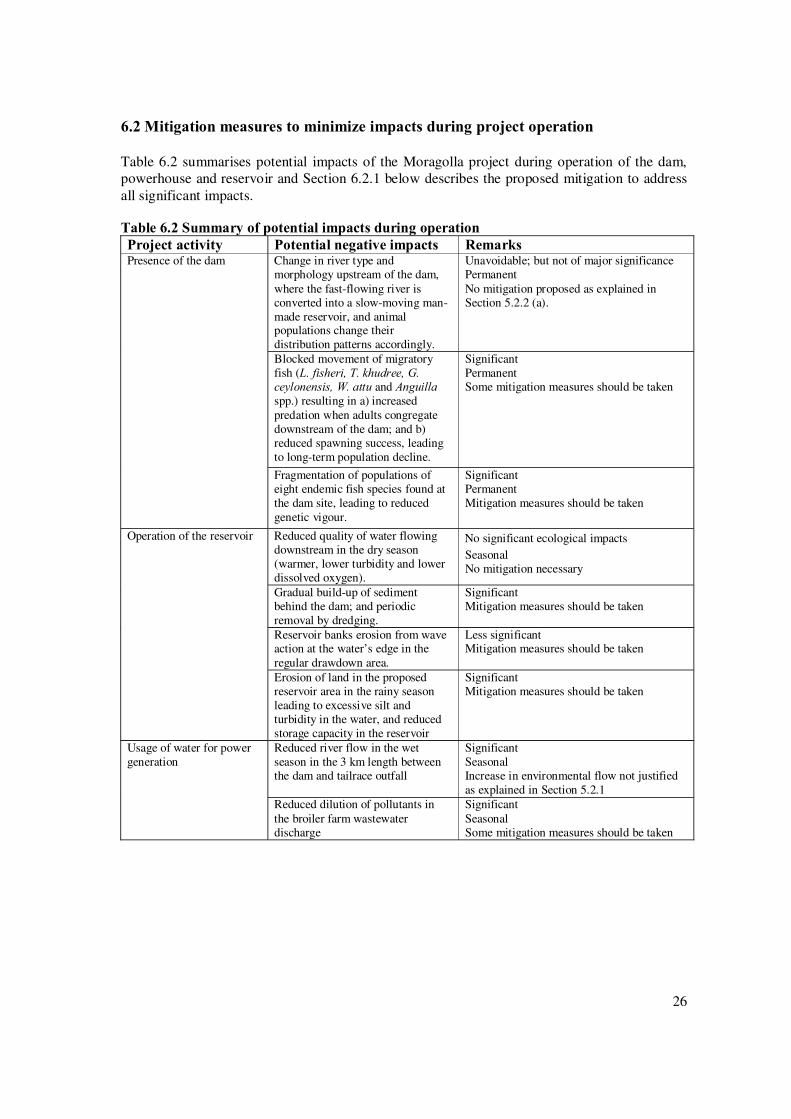
26
6.2 Mitigation measures to minimize impacts during project operation
Table 6.2 summarises potential impacts of the Moragolla project during operation of the dam,
powerhouse and reservoir and Section 6.2.1 below describes the proposed mitigation to address
all significant impacts.
Table 6.2 Summary of potential impacts during operation
Project activity Potential negative impacts RemarksPresence of the dam Change in river type and
morphology upstream of the dam,
where the fast-flowing river isconverted into a slow-moving man-
made reservoir, and animalpopulations change their
distribution patterns accordingly.
Unavoidable; but not of major significancePermanent
No mitigation proposed as explained inSection 5.2.2 (a).
Blocked movement of migratory
fish (L. fisheri, T. khudree, G.ceylonensis, W. attu and Anguilla
spp.) resulting in a) increased
predation when adults congregate
downstream of the dam; and b)reduced spawning success, leading
to long-term population decline.
Significant
PermanentSome mitigation measures should be taken
Fragmentation of populations ofeight endemic fish species found at
the dam site, leading to reduced
genetic vigour.
SignificantPermanent
Mitigation measures should be taken
Operation of the reservoir Reduced quality of water flowingdownstream in the dry season
(warmer, lower turbidity and lowerdissolved oxygen).
No significant ecological impacts
SeasonalNo mitigation necessary
Gradual build-up of sedimentbehind the dam; and periodic
removal by dredging.
SignificantMitigation measures should be taken
Reservoir banks erosion from waveaction at the water’s edge in the
regular drawdown area.
Less significantMitigation measures should be taken
Erosion of land in the proposedreservoir area in the rainy season
leading to excessive silt andturbidity in the water, and reduced
storage capacity in the reservoir
SignificantMitigation measures should be taken
Usage of water for power
generation
Reduced river flow in the wet
season in the 3 km length betweenthe dam and tailrace outfall
Significant
SeasonalIncrease in environmental flow not justified
as explained in Section 5.2.1
Reduced dilution of pollutants in
the broiler farm wastewaterdischarge
Significant
SeasonalSome mitigation measures should be taken
27
6.2.1 Mitigation measures
Soil conservation and erosion control
Soil erosion is a pervading problem throughout this catchment and elsewhere in Sri Lanka, which
reduces the quality of agricultural land and river water, and affects aquatic ecology in a number of
ways as explained above. As noted in Section 5.2.2 it could also affect the Moragolla scheme by
reducing the quality of water in the reservoir, and filling the dead storage capacity more quickly
than the currently estimated 30 year period. Various actions described in Section 6.1 will be taken
to reduce soil erosion during the construction period to ensure that the project does not exacerbate
this problem during site clearance, excavation and other activities. It will be important that good
practice is also extended into the period when the completed scheme is operating, in order to
provide more lasting improvements in water quality and aquatic ecology in the project area and
downstream.
CEB should therefore ensure that the Soil Conservation Action Plan (see Section 6.1.1) also
includes measures to be adopted in the operational phase, and that these are implemented in the
areas around the reservoir and at the project sites downstream that are owned by CEB. This could
include:
a) Structural measures: terracing; flood interception and diversion works; gully head protection;
bank protection structures; silt traps; etc.
b) Vegetative measures: reforestation of the reservoir buffer and other areas; planting soil-
retaining shrubs and grasses; etc.
Under Sri Lankan law the on-land area at the edge of the reservoir is demarcated as a buffer
zone, in which construction, farming and other usage of the land for purposes not related to thereservoir or power generation is prohibited. Soil conservation is improved if this area is
designated as a green belt, and planted with species that are known to promote soil conservationin steep valleys. This should therefore be done in the buffer zone for the Moragolla reservoir. In
addition to this the entire area should be declared as a protected area under the control of CeylonElectricity Board.
Mitigation of impacts due to sediment management activities
The Moragolla dam does not have a facility for the flushing of retained sediment. It may takemore than 30 years for the sediment in the reservoir to reach the spillway crest level which is 8m
below the minimum operation level of the power generation. It is anticipated that at the end ofthis time the sediment may be removed by mechanical dredging in the dry season or sediment
sluicing through the spillway gates in the rainy period. The removal of sediment by hydraulicdredging and downstream pumping would cause sudden very large increases in the suspended
sediment content of the river water, which could have very deleterious impacts on ecology bysmothering and killing bottom-dwelling species and impairing the respiration of fish and other
organisms, which could also lead to death. Properly-managed on-land disposal of the silt, or
using it in agriculture if feasible, would be better options in terms of protecting aquatic ecology,
so these should be investigated during the planning of any silt-removal operation. If these are not
feasible, then the downstream release of silt should be done gradually over a long period, to
avoid sudden large-scale increases of suspended sediment; and this should be done in the rainy
season to ensure maximum dilution and dispersal of the material.
Minimize impacts on aquatic ecology
A mandatory environmental flow 1.5m3/s should be released from the dam at all times with the
aim of maintaining the sustainability of the aquatic ecosystem downstream. This E-flow should
be channelized to supply enough water to deep rock pool areas. At the same time care should be
28
taken not to dam or block the water flow that comes through Thismada Ela, as this will provide
an additional perennial flow to the area immediately below the dam and therefore assist in
maintaining the ecosystem. However, it was noted during the field surveys that this water is
currently pumped for some local usages, so it would be beneficial if CEB could investigate
whether it would be possible to provide water from the reservoir for these purposes, to allow the
full flow of this stream to flow into the river.
In reservoir projects, the anticipated impacts due to prevention of spawning migrations is often
minimized by including in the dam an appropriate fish ladder or similar structure. In the case of
the Moragolla project it must be borne in mind however, that good populations of all the
migratory fish species are well established elsewhere within the same river catchments, and this
reduces the significance of these impacts. For example the Knuckles forest range in the
Mahaweli River catchments that come under Forest Department of Sri Lanka harbours viablepopulations of Garra ceylonensis, Labeo fisheri, Systomus spilurus, Dawkinsia singhala,
Belontia signata and Schistura notostigma (Pethiyagoda 1991; Shirantha 2012).This area givesenough protection for the above endemic fish species. As such, construction of a fish ladder at
this dam site is not considered to be compulsory.
The sensitive aquatic species in the proposed project area are already stressed due to excesssediment and debris in the water, water pollution from upper catchment anthropogenic activities,
waste disposal and fishing pressure, and hence translocation of these important species to one of
the secure sites mentioned in Section 5.1.4 or another suitable location.
A limited capture, relocation and release programme was suggested in Section 5.1.8 as a means
of ensuring survival of fish trapped in rock pools when the river is diverted to enable
construction of the dam. As a less costly alternative to provision of a fish pass, consideration
could be given to extending the capture and release programme over the long-term to
incorporate fish that are migrating upstream to breed. Adults could be captured at the toe of the
dam and released above the reservoir, from where they would be able to continue their
migration, at least to the next upstream barrier, which is the Kotmale dam, about 6 km upstream
from the Moragolla reservoir tail.
Minimize reduced dilution of pollutants discharged from the broiler farm
The issue of pollution from the Crysbro poultry factory is discussed in detail in the final report of
the water quality study. Two mitigation measures are proposed: monitoring to ensure enforcementof stipulated discharge limits for Crysbro Broiler Farm wastewater; and relocation of Crysbro
Broiler Farm outfall downstream of the proposed tailrace outlet to ensure effective dilution of the
effluent once river flow is interrupted by the Moragolla scheme. At present, potential impacts on
downstream water quality and ecology could be high due this wastewater discharge.
Implementation of the above mitigation measures therefore will have a very significant positive
impact on both river water quality and aquatic ecology.

Annexure
_______________________________________________________

Annex 1__________________________________________________________________
Terms of Reference (ToR)
TOR FOR AQUATIC ECOLOGY IN THE MAHAWELI GANGA
Objective
The EIA study described the ecology of the river, but descriptions consisted largely of lists of
species and there was little discussion of the different types of habitats present in the river, their
local distribution, the importance of the habitats and species, and how they may be affected by
construction and operation of the dam, reservoir and power generation facility. Aquatic ecology
is one of the environmental issues that can be most affected by hydropower schemes, so theseissues need to be investigated in more detail.
Scope of work
The Contractor shall use a combination of methods to prepare. a) an overview of the aquatic
ecology of the Mahaweli Ganga between the project site and Polgolla Diversion Weir, 30 km
downstream; and b) a detailed account of the aquatic ecology of the Mahaweli Ganga in the
immediate project area, from 500m above the confluence with the Kothmale oya (in both rivers)
to 500m below the confluence with the Atabage Oya. The Contractor shall draw conclusions
regarding the importance of the aquatic ecology in both areas (with reasons) and the likely
impacts of constructing and operating the project.
a) Overview of Mahaweli Ganga
The Contractor shall obtain an overview of the aquatic ecology of the Mahaweli Ganga in the 30km stretch downstream of the project site, by consulting published information and other data
from government agencies, consultancy reports and other sources. This should be supplementedby reference to aerial photographs and satellite imagery (see b below), visual observations on
site, interviews with local people, and discussions with experts from Peradeniya University.
b) Aquatic ecology of the project site
For the detailed ecological study, the Contractor shall first consult aerial photographs and
satellite imagery to obtain a rough picture of the type and distribution of aquatic habitats in the
river in the project area. This will be refined by site investigations, including analyses of the
type and distribution of river bed substrates and vegetation, supplemented by information
obtained from local people, including sand miners.
Quantative analyses will then be conducted to describe the species present (flora and fauna) in
each habitat type and average numbers of individuals of the major species in the different
habitats. This will cover the aquatic habitats (sampled by fish nets, traps, plankton nets, etc) and
river bed habitats (sampled by sediment grabs, quadrat sampling if feasible and other suitable
methods). Quantitative surveys will be conducted twice; during low flows in February 2013 and
at the start of the high flow season at the end of May 2013, to give an indication of seasonal
variations.
Programme and Reporting
· The Contractor shall submit a draft Interim Report on 31st March 2013 and a draft Final
Report on 7 June 2013. Both reports will be reviewed by the Study Team and the
Contractor shall amend the reports to address all comments and shall submit final reports
within two weeks of receipt of comments.
· The Interim Report shall present and discuss all data collected up to that time and the
Final Report shall present all data and shall include the following:
· A map of the survey area showing sampling stations; site photographs, aerialphotographs and satellite imagery; and appropriate tables and illustrations of key data,
including a map showing the distribution of habitats and species in area b;
· Written descriptions of all sampling, analysis and species identification methods;
· A detailed discussion of the results, including but not necessarily limited to:
i) The aquatic ecology of the Mahaweli Ganga (area a) and its importance (with
reasons);
ii) Potential impacts of operation of the completed hydropower scheme on aquatic
ecology in area a (flow characteristics will be shown by a hydrological simulation
study to be conducted in January 2013).
iii) The aquatic ecology of the immediate project area (area b) including the distributionand importance (with reasons) of the main habitats and species and seasonal
variations.iv) The manner in which the habitats and species are likely to be affected by construction
and operation of the dam, reservoir and hydropower scheme (operational conditionsshown by the January 2013 hydrological simulation);
v) Suitable mitigation for any negative impacts of construction and operation of the
project on aquatic ecology in areas a and b;
· Discussions shall refer to published literature where relevant and the importance of
species, habitats and overall ecology shall be assessed on the basis of conservation status,
abundance elsewhere in Sri Lanka, the local economy and other relevant criteria.
· Discussions should describe existing conditions, then potential impacts of construction
and proposed mitigation, and then potential impacts of scheme operation and proposedmitigation;
· Tables showing all data should be provided in an appendix.

Annex 2__________________________________________________________________
Satellite image of the proposed Morogolla Hydropower project
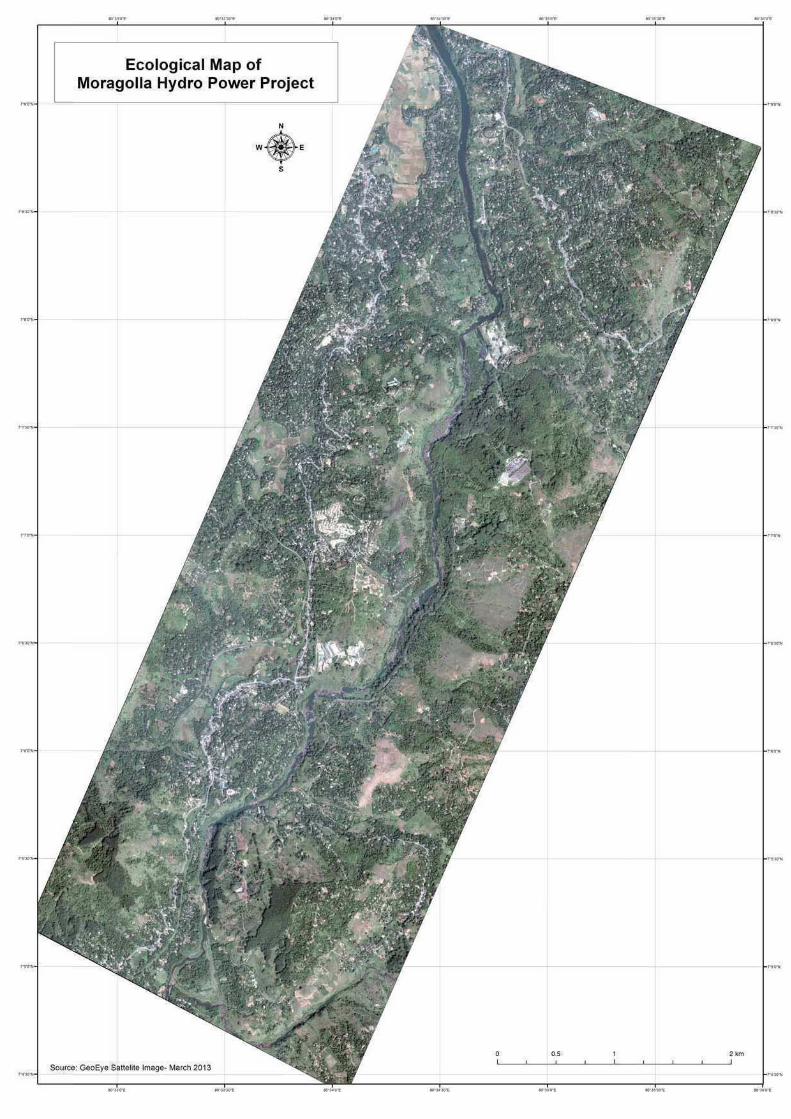

Annex 3
_________________________________________________________________
Map - Aquatic ecological survey sites of Moragolla Hydro Power Project
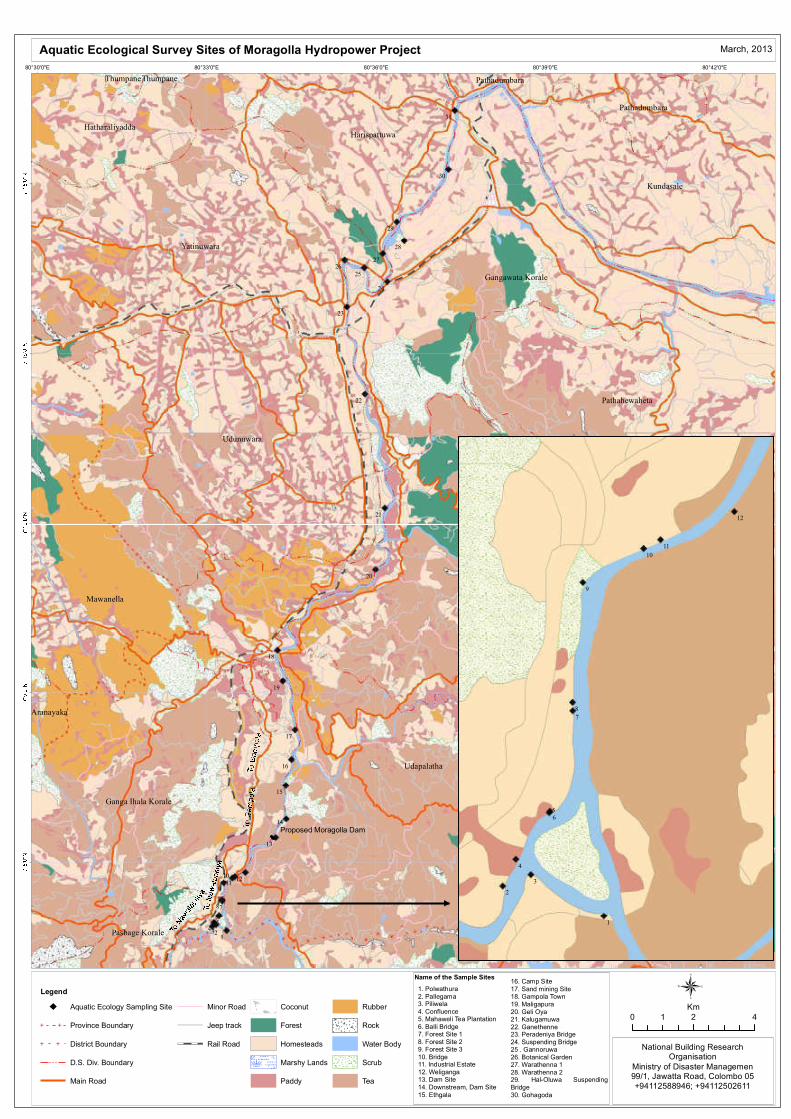
Proposed Moragolla Dam
Doluwa
Udapalatha
Udunuwara
Yatinuwara
Delthota
Kothmale
Kundasale
Pathahewaheta
Gangawata Korale
Ganga Ihala Korale
Mawanella
HarispattuwaHatharaliyadda
Pathadumbara
Pasbage Korale
Hanguranketha
Pathadumbara
Aranayaka
ThumpaneThumpane
9
87
65432
1
31
30
29
28
2726
25
24
23
22
21
20
19
18
17
16
15
14
13
121110
80°42'0"E80°39'0"E80°36'0"E80°33'0"E80°30'0"E
Aquatic Ecological Survey Sites of Moragolla Hydropower Project
Legend
Aquatic Ecology Sampling Site
E E Province Boundary
E E District Boundary
D.S. Div. Boundary
Main Road
Minor Road
Jeep track
Rail Road
Coconut
Forest
Homesteads
Marshy Lands
Paddy
Rubber
Rock
Water Body
Scrub
Tea
®0 2 41
Km
March, 2013
National Building ResearchOrganisation
Ministry of Disaster Managemen99/1, Jawatta Road, Colombo 05
+94112588946; +94112502611
9
8
7
65
4
3
2
1
12
11
10
1. Polwathura2. Pallegama3. Piliwela4. Confluence5. Mahaweli Tea Plantation6. Balli Bridge7. Forest Site 18. Forest Site 29. Forest Site 310. Bridge11. Industrial Estate12. Weliganga13. Dam Site14. Downstream, Dam Site15. Ethgala
16. Camp Site17. Sand mining Site18. Gampola Town19. Maligapura20. Geli Oya21. Kalugamuwa22. Ganethenne23. Peradeniya Bridge24. Suspending Bridge25 . Gannoruwa26. Botanical Garden27. Warathenna 128. Warathenna 229. Hal-Oluwa SuspendingBridge30. Gohagoda
Name of the Sample Sites

Annex 4__________________________________________________________________
Photographs of habitats
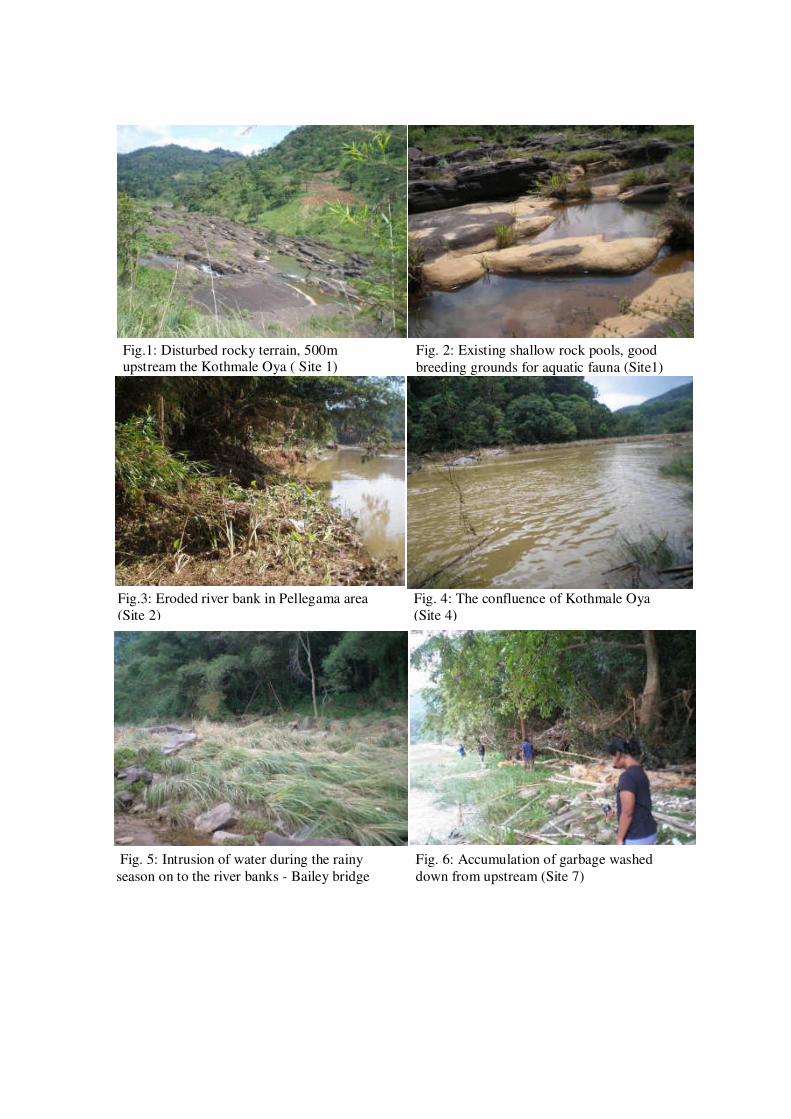
Fig.1: Disturbed rocky terrain, 500mupstream the Kothmale Oya ( Site 1)
Fig. 2: Existing shallow rock pools, good
breeding grounds for aquatic fauna (Site1)
Fig.3: Eroded river bank in Pellegama area
(Site 2)
Fig. 4: The confluence of Kothmale Oya
(Site 4)
Fig. 5: Intrusion of water during the rainy
season on to the river banks - Bailey bridge
Fig. 6: Accumulation of garbage washed
down from upstream (Site 7)

Fig. 9: Small islets in the river (Site 14) Fig.10: River narrowing and forest area
Fig.7:Typical habitat of Labeo fisheri (Site 8) Fig. 8: Rock pool with small riffle (Site 9)
Fig. 11: Sand mining site (Site 17 ) Fig. 12: Flowing water between Kalugamuwa
and Peradeniya (Site 21)

Fig.13: Rocky river – Gatembe/ Warathenna
(Site 28)
Fig.14:Rocky river – Gohagoda (Site 30)

Annex 5________________________________________________________
River habitat assessment criteria
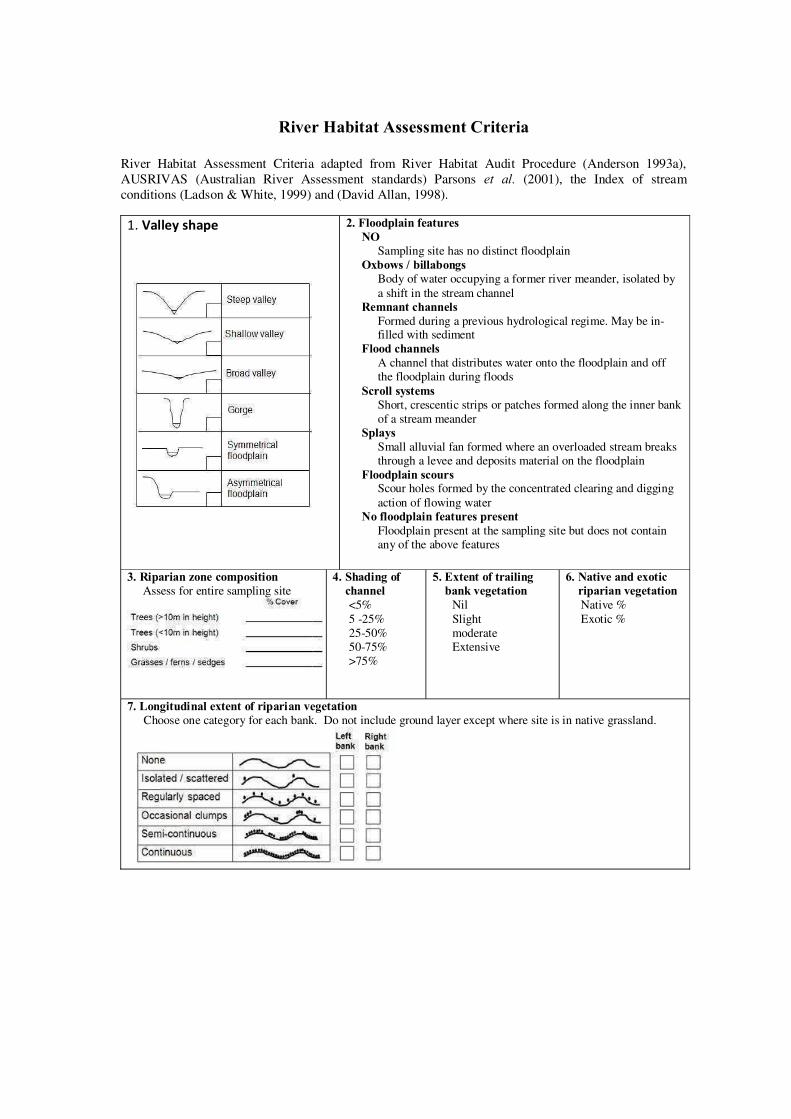
River Habitat Assessment Criteria
River Habitat Assessment Criteria adapted from River Habitat Audit Procedure (Anderson 1993a),
AUSRIVAS (Australian River Assessment standards) Parsons et al. (2001), the Index of stream
conditions (Ladson & White, 1999) and (David Allan, 1998).
1. Valley shape 2. Floodplain features
NO
Sampling site has no distinct floodplain
Oxbows / billabongs
Body of water occupying a former river meander, isolated by
a shift in the stream channelRemnant channels
Formed during a previous hydrological regime. May be in-filled with sediment
Flood channels
A channel that distributes water onto the floodplain and offthe floodplain during floods
Scroll systems
Short, crescentic strips or patches formed along the inner bank
of a stream meanderSplays
Small alluvial fan formed where an overloaded stream breaksthrough a levee and deposits material on the floodplain
Floodplain scoursScour holes formed by the concentrated clearing and digging
action of flowing waterNo floodplain features present
Floodplain present at the sampling site but does not containany of the above features
3. Riparian zone composition
Assess for entire sampling site4. Shading of
channel
<5%
5 -25%
25-50%50-75%
>75%
5. Extent of trailing
bank vegetation
Nil
Slight
moderateExtensive
6. Native and exotic
riparian vegetation
Native %
Exotic %
7. Longitudinal extent of riparian vegetation
Choose one category for each bank. Do not include ground layer except where site is in native grassland.

8. Overall vegetation disturbance rating
Sites with valley vegetation cleared on BOTH sides, but with riparian vegetation in good condition should be
scored in the high disturbance category. Words within the drawings summaries the detailed text about the stateof the riparian and valley vegetation for each category.
9. Physical barriers to local fish passage
each flow condition10. Type of bars
11. Dominant particle size on bars
Boulder
>256 mm
Cobble
64-256 mm
Pebble 32-64 mm Gravel 4-16 mm Sand 0.126-1 mm Silt/clay < 0.063 mm
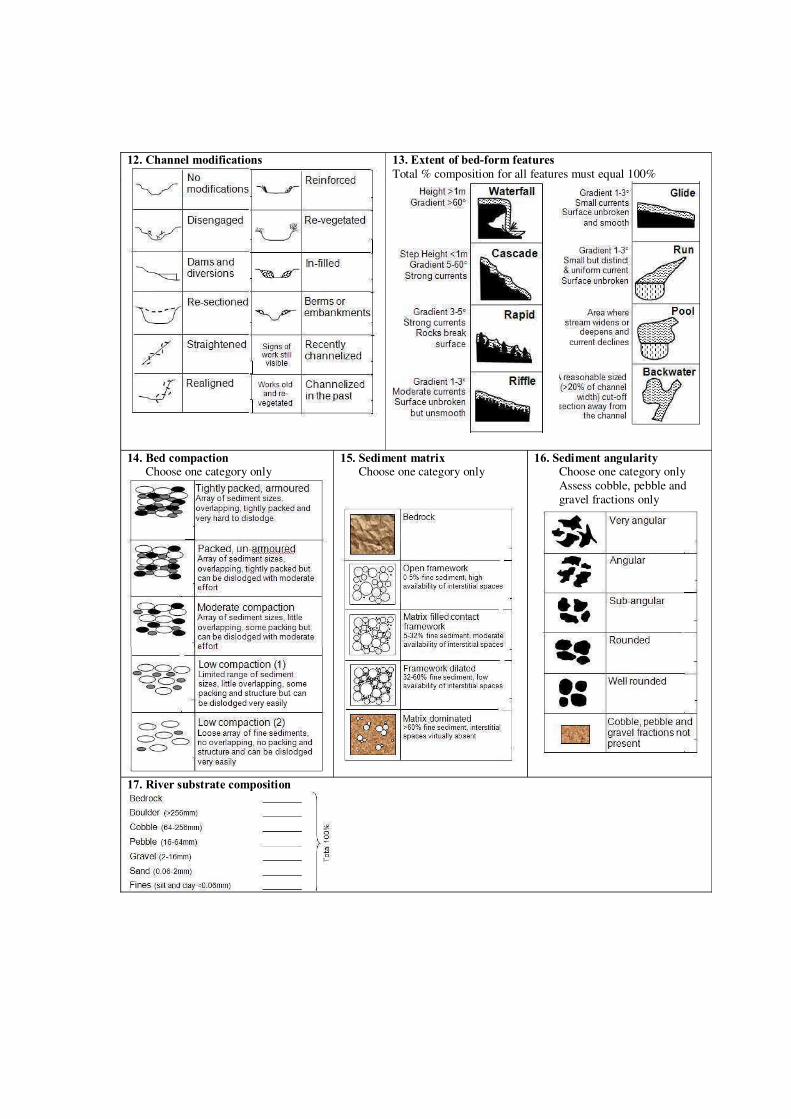
12. Channel modifications 13. Extent of bed-form features
Total % composition for all features must equal 100%
14. Bed compactionChoose one category only
15. Sediment matrixChoose one category only
16. Sediment angularityChoose one category only
Assess cobble, pebble andgravel fractions only
17. River substrate composition

18. Bed stability rating
Severe erosion
Streambedscoured of finesediments.
Signs of channel
deepening.
Bare, severelyeroded banks.
Erosion heads.
Steep streambedcaused by
erosion.
Moderate erosion
Little fine sedimentpresent. Signs ofchannel deepening.
Eroded banks.
Streambed deep and
narrow. Steepstreambed
comprised of
unconsolidated(loosely arranged
and unpacked)material
Bed stable
A range of sediment sizespresent in the streambed.Channel is in a 'relatively
natural' state (not
deepened or infilled).
Bed and bar sediments areroughly the same size.
Banks stable. Streambed
comprised of consolidated(tightly arranged and
packed) material.
Moderate
deposition
Moderate build-upof fine sediments
at obstructions and
bars. Streambed
flat and uniform.Channel wide and
shallow.
Severe deposition
Extensive build up offine sediments toform a flat bed.
Channel blocked, but
wide and shallow.
Bars large andcovering most of the
bed or banks.
Streambed comprisedof unconsolidated
(loosely arranged andunpacked) material.
19. Bank shape
Choose one category for each bank
20. Bank slope
Choose one category for each bank
21. Bank material Assess % composition for
each
22. Macrophyte cover in bank
Overall % cover of native macrophyteOverall % cover of exotic macrophyte

Annex 6__________________________________________________________________
River habitat assessment Results of each study site - Mahaweli River
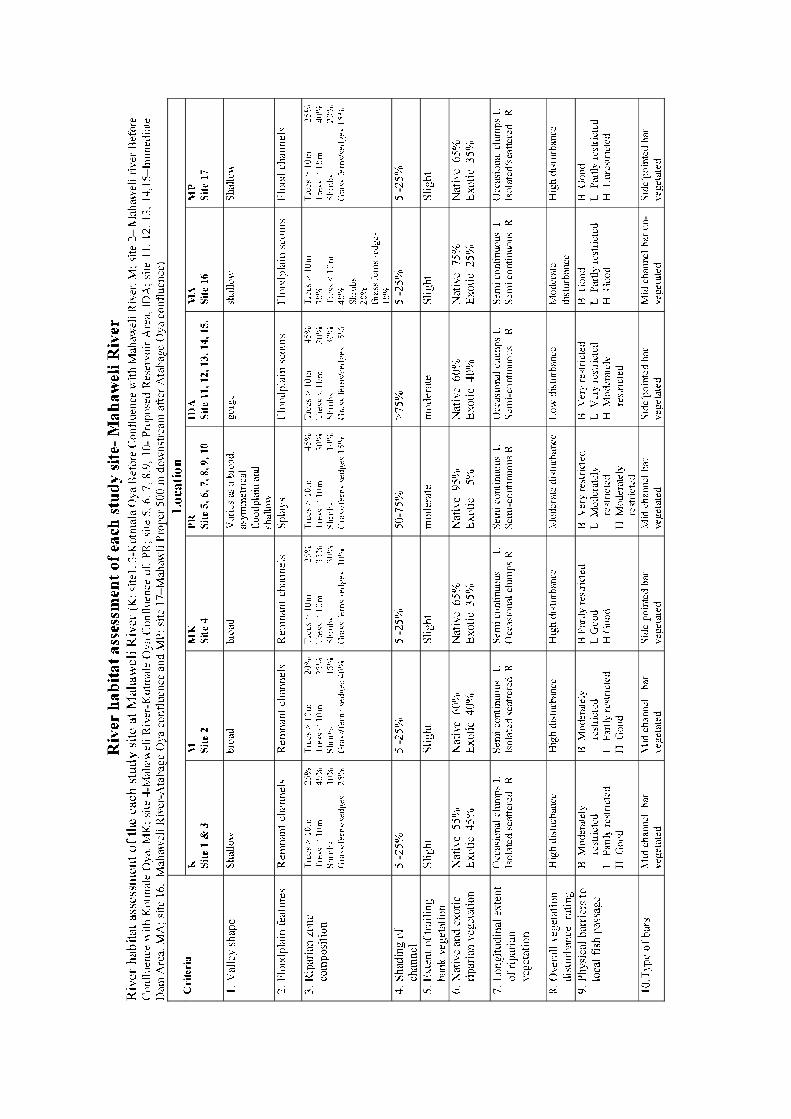


Annex 7____________________________________________________________________
Aquatic plants in the study sites in Mahaweli River


Annex 8____________________________________________________________
Taxonomic groups of plankton in the study sites in Mahaweli River
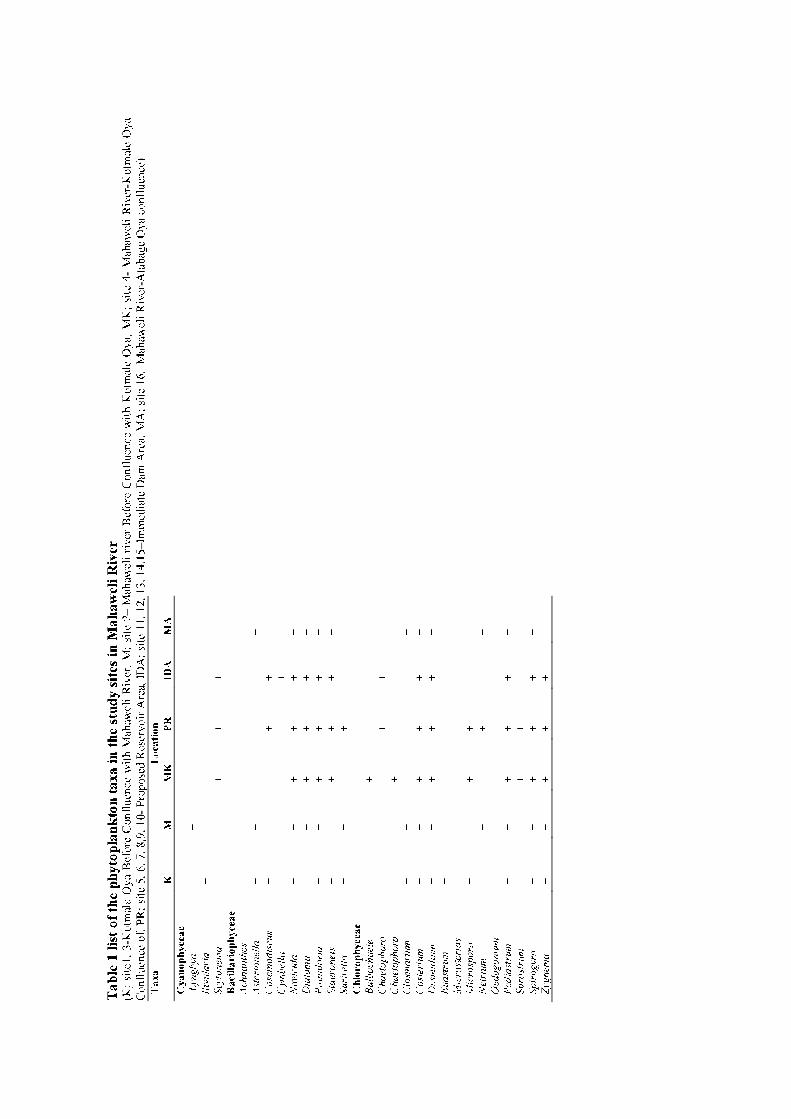
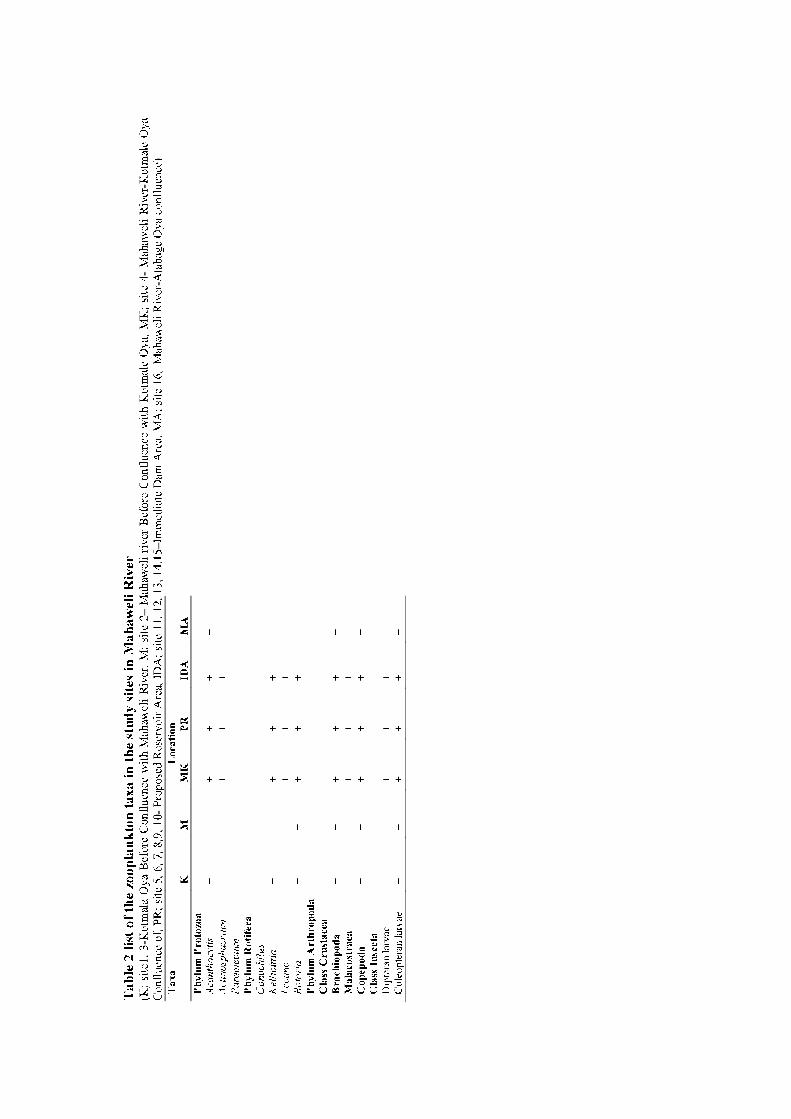

Annex 9____________________________________________________________________
Taxonomic groups of fauna in the study sites in Mahaweli River
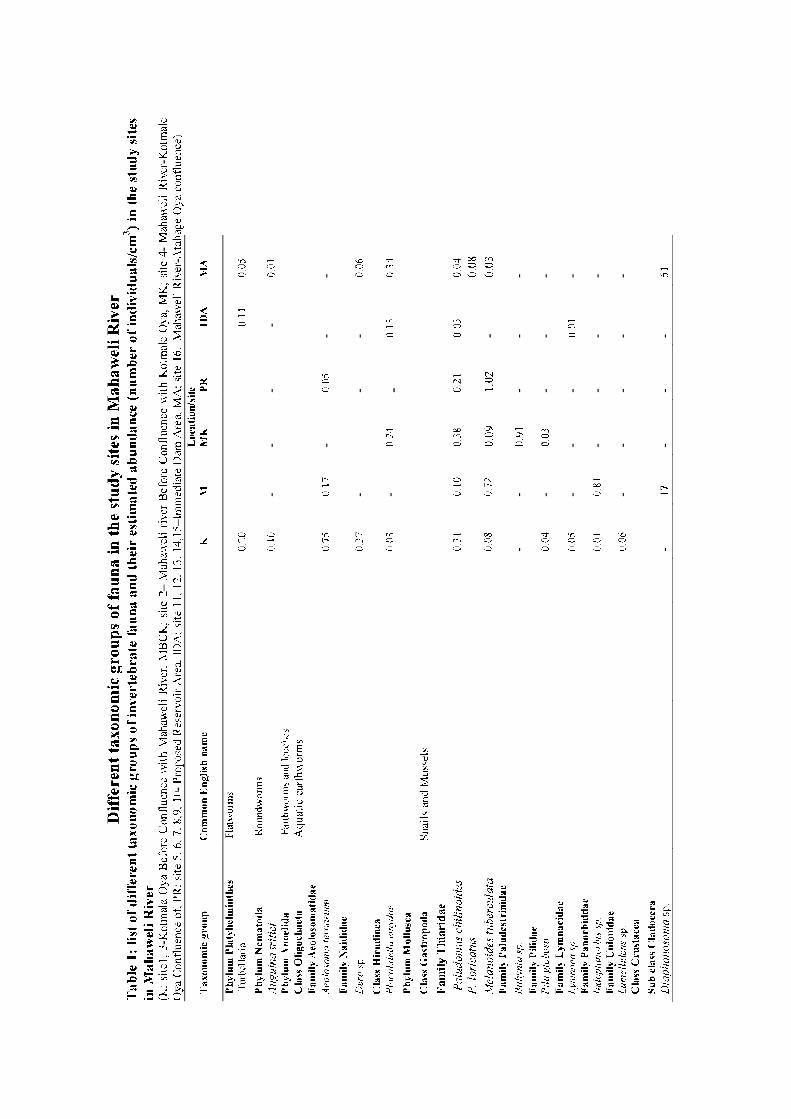
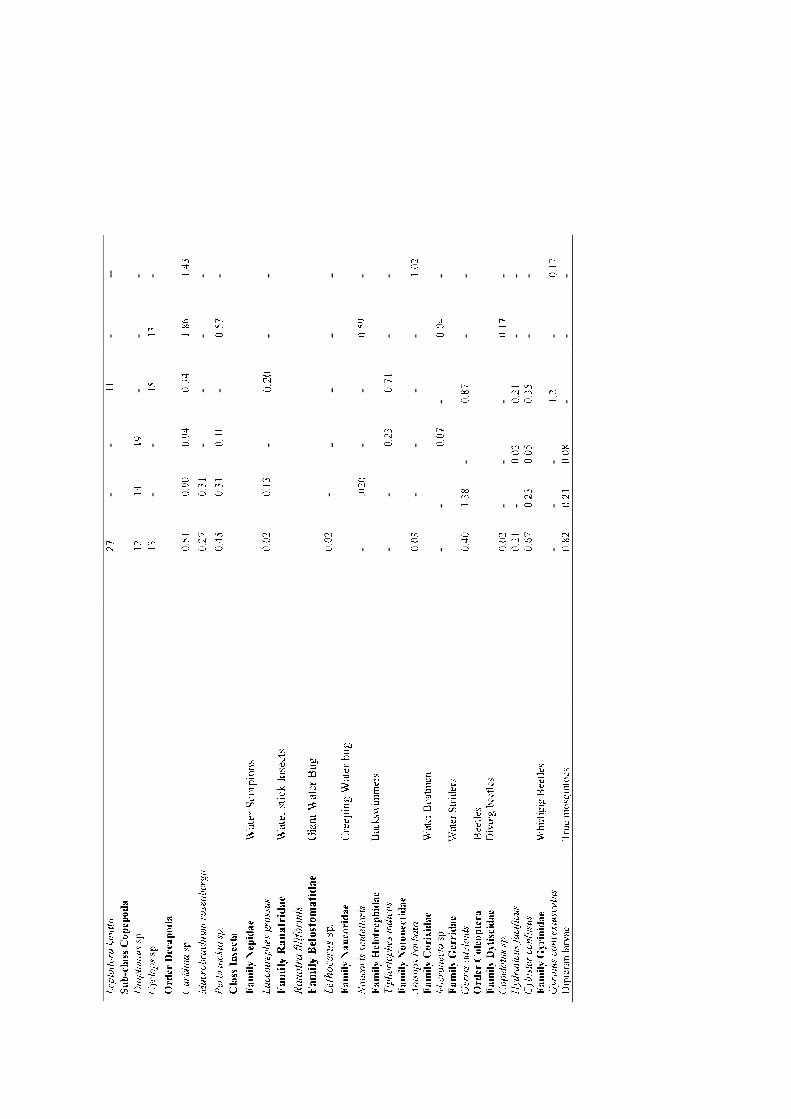
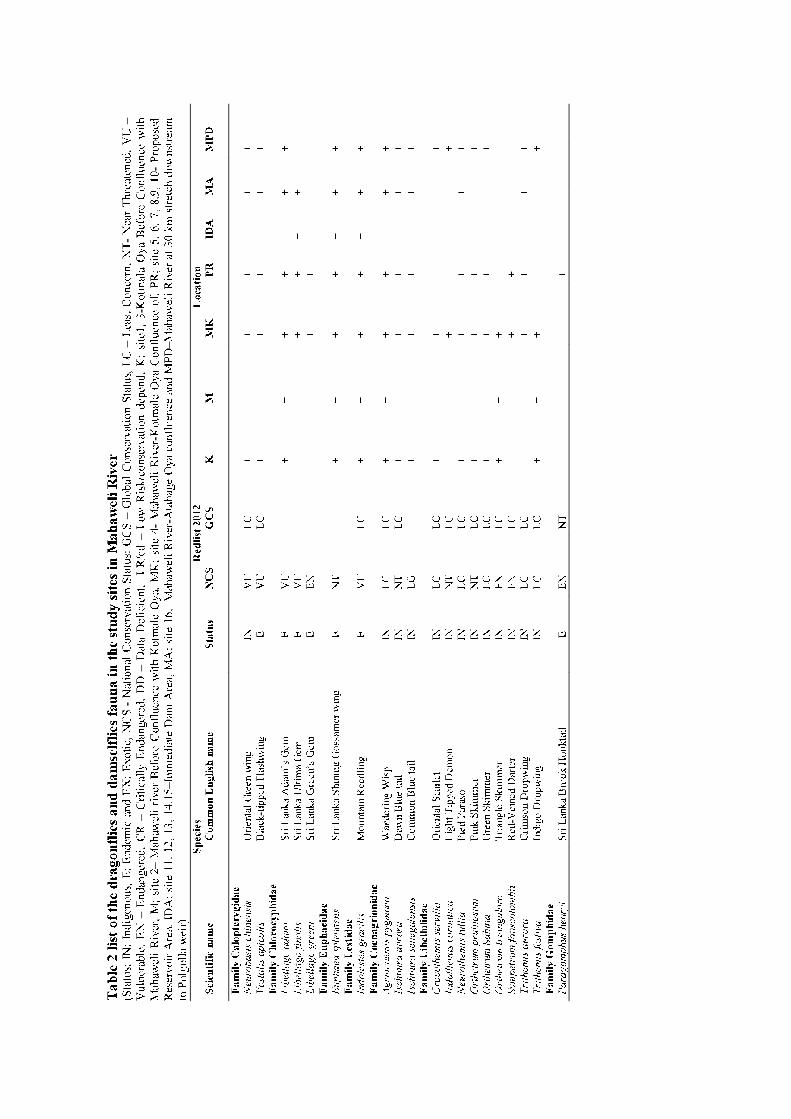

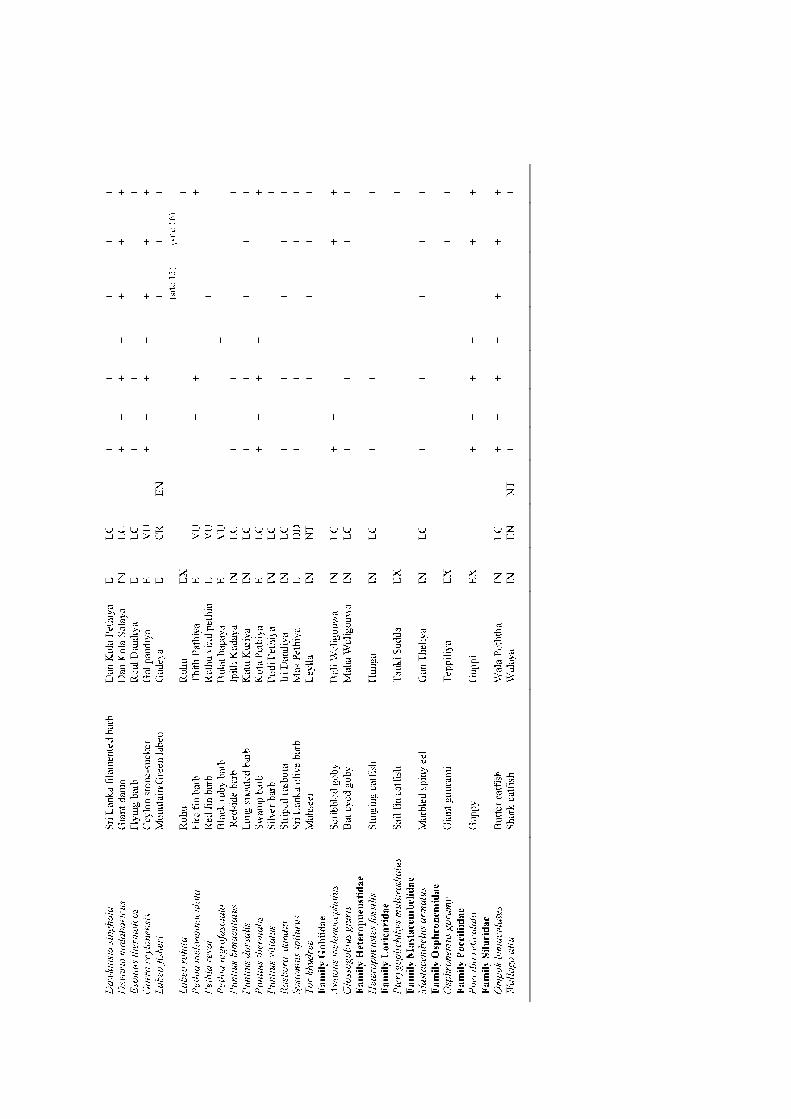


Annex 10____________________________________________________________
Photographs of some fauna and flora at the project site
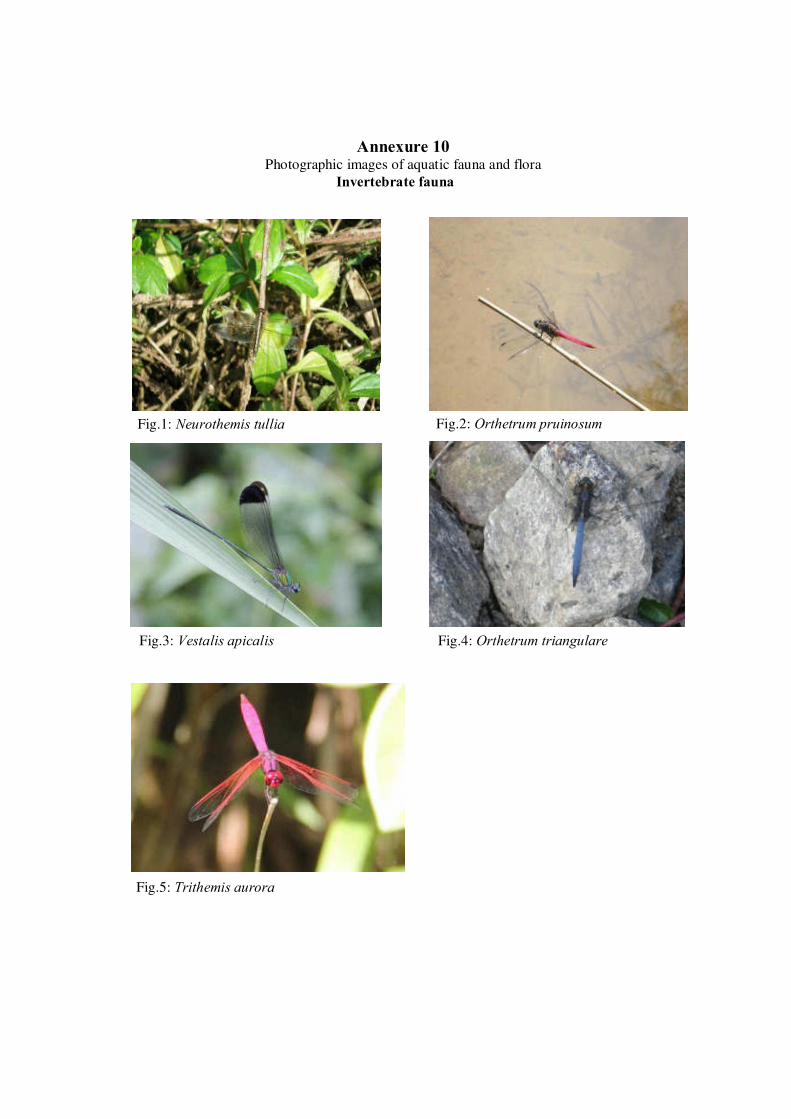
Annexure 10Photographic images of aquatic fauna and flora
Invertebrate fauna
Fig.1: Neurothemis tullia Fig.2: Orthetrum pruinosum
Fig.3: Vestalis apicalis Fig.4: Orthetrum triangulare
Fig.5: Trithemis aurora
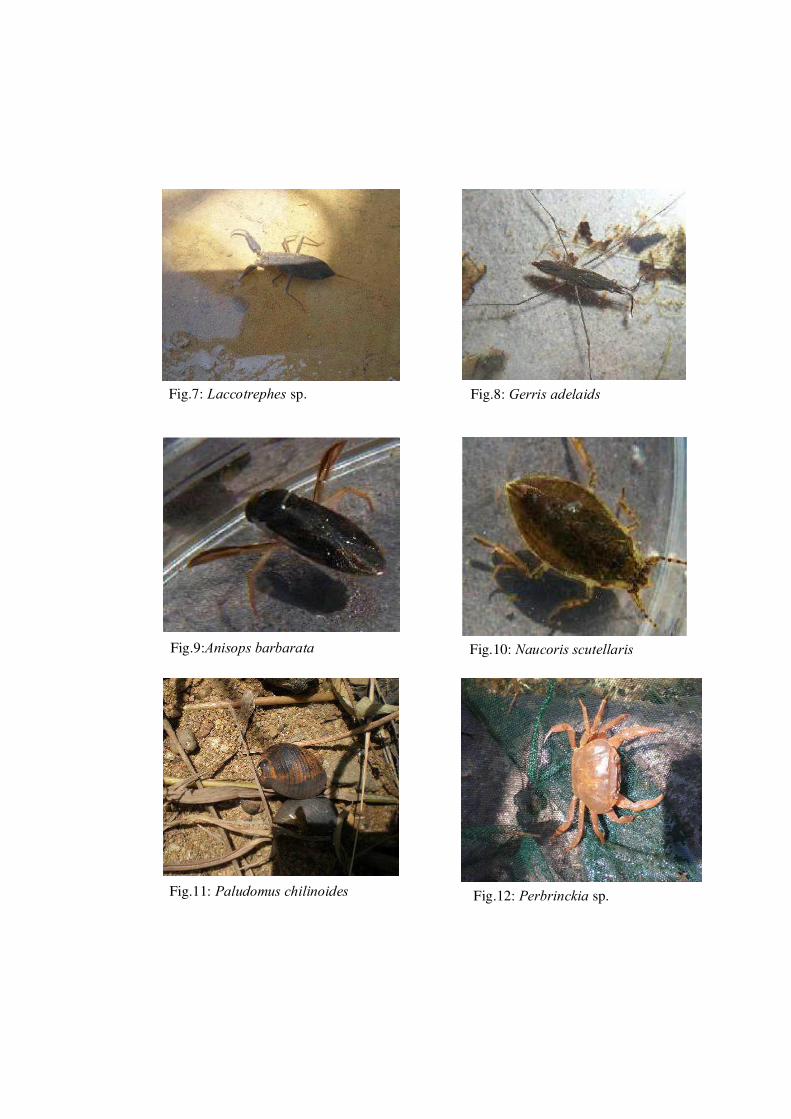
Fig.10: Naucoris scutellarisFig.9:Anisops barbarata
Fig.7: Laccotrephes sp. Fig.8: Gerris adelaids
Fig.11: Paludomus chilinoides Fig.12: Perbrinckia sp.
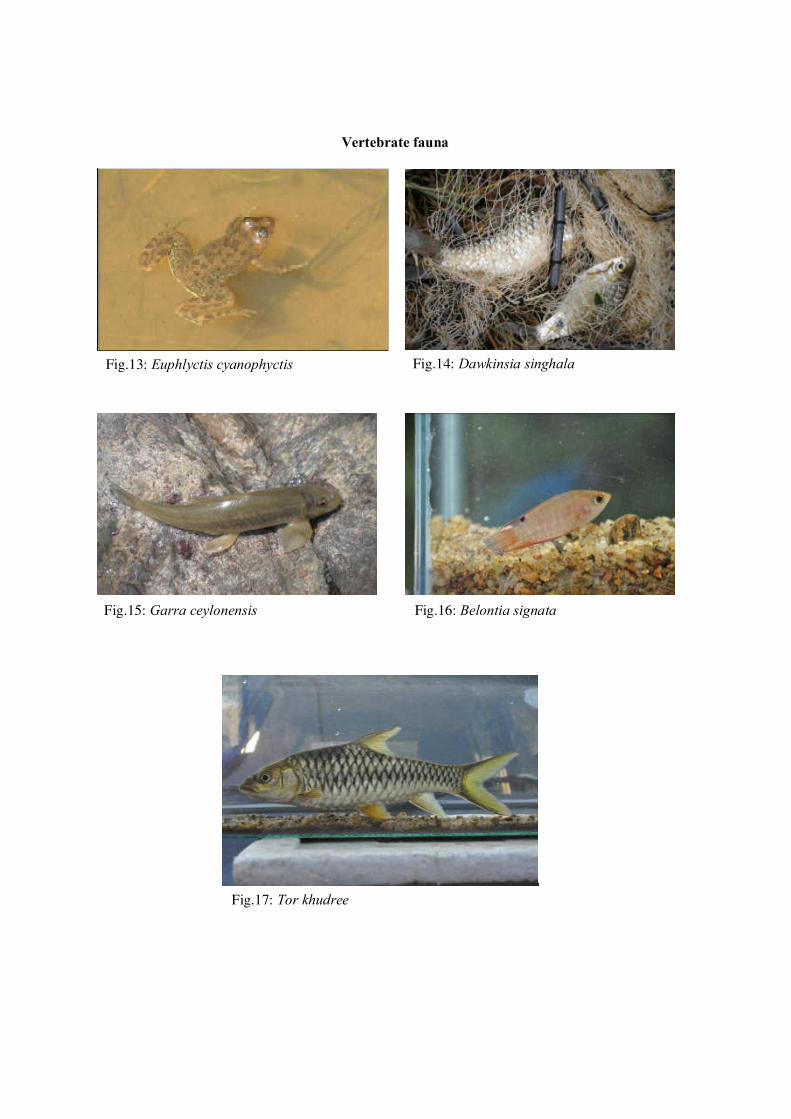
Vertebrate fauna
Fig.13: Euphlyctis cyanophyctis
Fig.15: Garra ceylonensis Fig.16: Belontia signata
Fig.14: Dawkinsia singhala
Fig.17: Tor khudree

Fig.18: Labeo fisheri
Indirect Signs of Mammals
Fig.19: Scat of an otter

Flora
Fig.20: Vallisneria spiralis
Fig.22: Potamogeton pectinatus
Fig.21: Potamogeton pectinatus

Annex 11____________________________________________________________
Photographs of a Peterson grab and a hand net
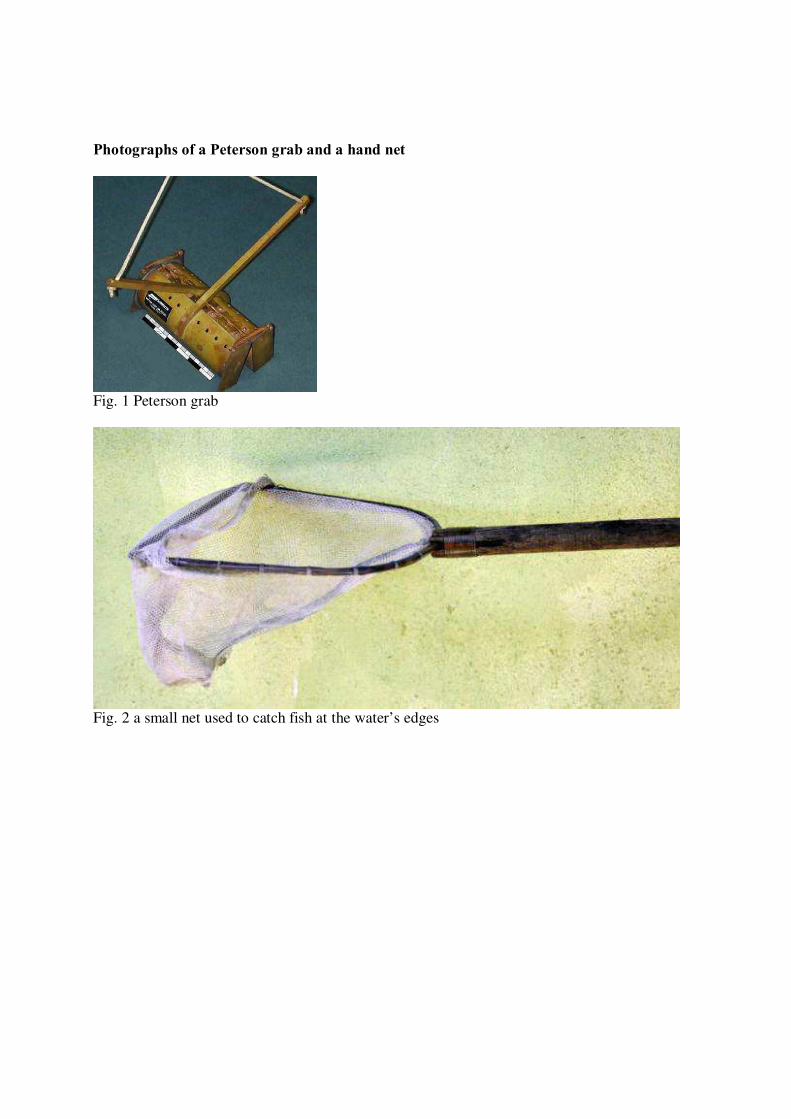
Photographs of a Peterson grab and a hand net
Fig. 1 Peterson grab
Fig. 2 a small net used to catch fish at the water’s edges

Annex 12____________________________________________________________
References
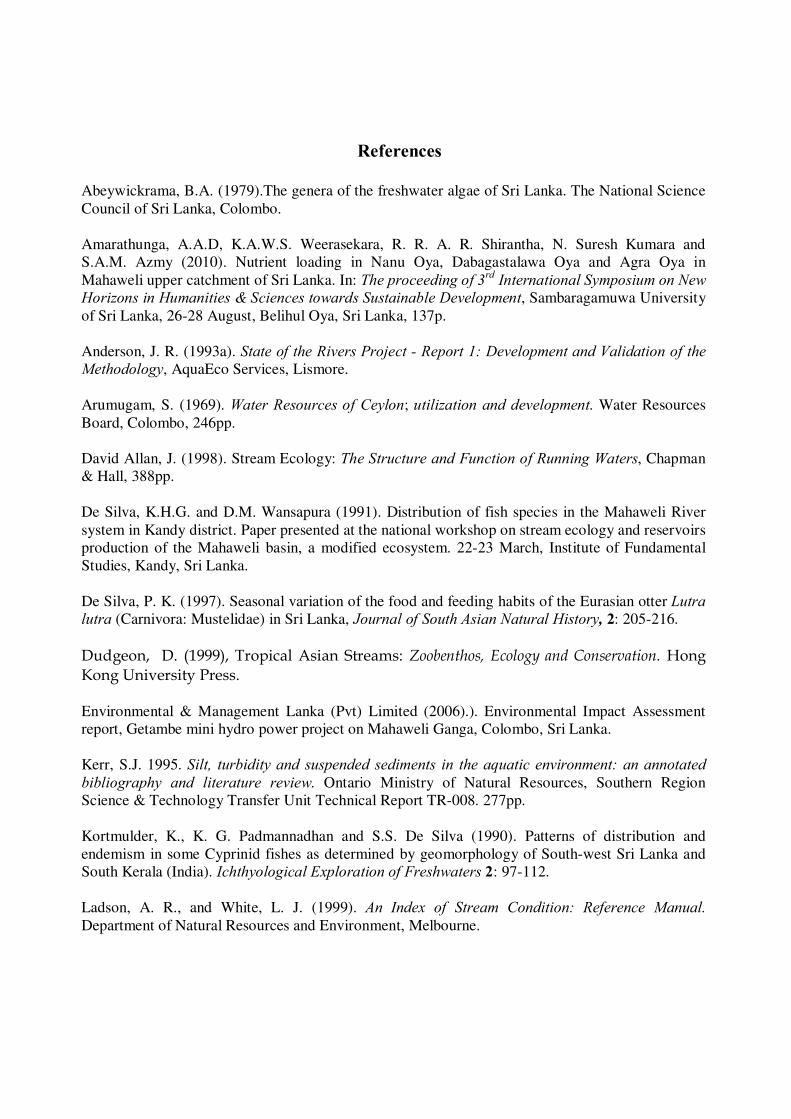
References
Abeywickrama, B.A. (1979).The genera of the freshwater algae of Sri Lanka. The National Science
Council of Sri Lanka, Colombo.
Amarathunga, A.A.D, K.A.W.S. Weerasekara, R. R. A. R. Shirantha, N. Suresh Kumara and
S.A.M. Azmy (2010). Nutrient loading in Nanu Oya, Dabagastalawa Oya and Agra Oya in
Mahaweli upper catchment of Sri Lanka. In: The proceeding of 3rdInternational Symposium on New
Horizons in Humanities & Sciences towards Sustainable Development, Sambaragamuwa University
of Sri Lanka, 26-28 August, Belihul Oya, Sri Lanka, 137p.
Anderson, J. R. (1993a). State of the Rivers Project - Report 1: Development and Validation of the
Methodology, AquaEco Services, Lismore.
Arumugam, S. (1969). Water Resources of Ceylon; utilization and development. Water Resources
Board, Colombo, 246pp.
David Allan, J. (1998). Stream Ecology: The Structure and Function of Running Waters, Chapman
& Hall, 388pp.
De Silva, K.H.G. and D.M. Wansapura (1991). Distribution of fish species in the Mahaweli River
system in Kandy district. Paper presented at the national workshop on stream ecology and reservoirs
production of the Mahaweli basin, a modified ecosystem. 22-23 March, Institute of Fundamental
Studies, Kandy, Sri Lanka.
De Silva, P. K. (1997). Seasonal variation of the food and feeding habits of the Eurasian otter Lutra
lutra (Carnivora: Mustelidae) in Sri Lanka, Journal of South Asian Natural History, 2: 205-216.
Dudgeon, D. (1999), Tropical Asian Streams: Zoobenthos, Ecology and Conservation. HongKong University Press.
Environmental & Management Lanka (Pvt) Limited (2006).). Environmental Impact Assessment
report, Getambe mini hydro power project on Mahaweli Ganga, Colombo, Sri Lanka.
Kerr, S.J. 1995. Silt, turbidity and suspended sediments in the aquatic environment: an annotated
bibliography and literature review. Ontario Ministry of Natural Resources, Southern Region
Science & Technology Transfer Unit Technical Report TR-008. 277pp.
Kortmulder, K., K. G. Padmannadhan and S.S. De Silva (1990). Patterns of distribution and
endemism in some Cyprinid fishes as determined by geomorphology of South-west Sri Lanka and
South Kerala (India). Ichthyological Exploration of Freshwaters 2: 97-112.
Ladson, A. R., and White, L. J. (1999). An Index of Stream Condition: Reference Manual.
Department of Natural Resources and Environment, Melbourne.
Manchanayake, P. and C.M. Madduma Bandara (1999). Water Resources of Sri Lanka. National
Science Foundation, Colombo.
Marambe, B. (2001a). Alien invasive plants in the central province of Sri Lanka. Sri Lanka
Biodiversity Review 1:21-30.
Mendis, A.S. & C.H. Fernando (1962). A guide to the freshwater fauna of Ceylon, Fisheries
Research Station, Ceylon.
MOE, (2012). The National Red List 2012 of Sri Lanka; Conservation Status of the Fauna and
Flora, Ministry of Environment, Colombo.
Moyle, P.B. and F.R. Senanayake, (1984). Resource partitioning among the fishes of rainforests
stream in Sri Lanka. Journal o Zoology, London. 203: 195-223.
Needham, J.G. & P.R. Needham (1962). A guide to the freshwater biology. 5th
edition, Holden-Day
Inc. San Francisco.
Parsons, M., Thoms, M., Norris, R. (2001). AUSRIVAS Physical Assessment Protocol. Cooperative
Research Centre for Freshwater Ecology, University of Canberra.
Pethiyagoda, R. (1991). Freshwater fishes of Sri Lanka. The Wildlife Heritage Trust of Sri Lanka,
Sri Lanka. 362pp.
Ravena, P.J., N.T.H. Holmes, F.H. Dawson and M. Everard (1998). Quality assessment using River
Habitat Survey data, Aquatic Conservation inMarine Freshwater Ecosystems. 8: 477–499.
Rehel, S. 2011. Farmeria metzgerioides. In: IUCN 2013. IUCN Red List of Threatened Species.
Version 2013.1. <www.iucnredlist.org>. Downloaded on 13 July 2013.
Senanayake, F.R and P.B. Moyle (1982). Conservation of freshwater fishes of Sri Lanka. Biological
Conservation, 22: 181-185.
Shirantha R. R. A. R. and U. S. Amarasinghe (2005). Alien ichthyofauna and aquatic biodiversity in
torrential riverine habitats of Sri Lanka. In: Proceeding of the International Conference on Tropical
Humid Ecosystems: Challenges, Changes and Opportunities, (MAB) Committee, National ScienceFoundation Sri Lanka, 4-9 December, Kandy, Sri Lanka. 51p.
Shirantha, R. R. A. R. (2004). Some aspects of biology and population dynamics of selected
endemic fish species inhabiting two river basins in Sri Lanka. Unpublished M. Phil. Thesis,
Department of Zoology, University of Kelaniya, Sri Lanka, 241 pp.
Shirantha, R. R. A. R. (2009). Ecology, biology and socio-economic features of Pterygoplichthyesmultiradiatus (Osteichthyes; Loricarridae) in the Mahaweli middle catchment of Sri Lanka. In: The
proceeding of National Symposium on Invasive Alien Species, Biodiversity Secretariat, Ministry of
Environment and Natural Resources, Agricultural Education Unit (AEU), of University of
Peradeniya and Institute of Biology (Sri Lanka), 21-22 May 2009, Browns Beach Hotel, Negombo,
Sri Lanka, 14p.
Shirantha, R. R. A. R., A. A. D. Amarathunga and K. A. W. S. Weerasekara (2009). Assessment of
ecological integrity through a study on invertebrate communities in Kotmale uppermost catchment
of Sri Lanka In: The proceeding of First National Symposium on Natural Resources Management
NRM 2009, Department of Natural Resources, Sambaragamuwa University of Sri Lanka, 29-30
August 2009, Belihul Oya, Sri Lanka, Abstract 56p.
Shirantha, R. R. A. R., and N. K. Ranawaka (2009). Life history and feeding bahaviour of a natural
enemy of Mimosa pigra in Sri Lanka. In: The proceeding of National Symposium on Invasive AlienSpecies, Biodiversity Secretariat, Ministry of Environment and Natural Resources, Agricultural
Education Unit (AEU), of University of Peradeniya and Institute of Biology (Sri Lanka), 21-22 May
2009, Browns Beach Hotel, Negombo, Sri Lanka, 5p.
Shirantha, R.R.A.R. (2012). Socio-ecological dimension on Labeo fisheri (Family: Cyrinidae) in
Mahaweli middle catchments of Sri Lanka; an endemic fish species of enigmatic population decline.
Paper presented at The OMICS group International Symposium on Biodiversity and Energy
Development, HITEC City, 14-15 September, Hyderabad, India.
Shirantha, R.R.A.R., A. A. D. Amarathunga and K. A. W. S. Weerasekara, (2010). Existing
challenge to succeed a sustainable built aqua-environment in misty green valleys in the hill country
of Sri Lanka; a case study. In: Proceeding of the International Conference on Sustainable Built
Environment (ICSBE-2010), (M.R.T. Jayasinghe, P.A. Mendis and R. Dissanayala eds.) Vol:2 Pp.
344-354, 13th
-14th
December, Kandy, Sri Lanka.
Silva, E.I.L and R.W. Davies (1986). Movement of some indigenous riverine fish in Sri Lanka.
Hydrobiologia, 137 : 263-270.
Silva, E.I.L. (1993). Discontinusm of the Mahaweli River and it impacts on the distribution and
diversity of indigenous riverine fish fauna. In: Proceeding of the international and inter disciplinary
symposium Ecology and Landscape Management Sri Lanka”, (W. Erdelin, C. Preu, N . Ishvaram
and C. M. Madduma Bandara (eds.) Pp. 397-414. Sri Lanka.
Silva, E.I.L. (1996). Water quality of Sri Lanka; a review on twelve water bodies. Institute of
Fundamental Studies, Kandy.
Silva, E.I.L. (2013). “Our Common Feature Conservation and Management of Aquatic Resources”,
Key note address of the 19th
Annual session of Sri Lanka Association for Fisheries and Aquatic
Resources (SLAFA), Colombo, Sri Lanka. 16th
May 2013.
Southwood, T.R.E. (1966). Ecological Methods, Butler & Tanner Ltd. London.
Vollenweider, R.A., M. Munawar and P. Stadelmann (1974). A comparative Review of
Phytoplankton and Primary Production in the Laurentian Great Lakes. Journal of the Fisheries
Research Board of Canada, 31(5): 739-762.

Wickremanayake, E.D. (1990). Conservation of endemic rain forest fishes of Sri Lanka; Results of
translocation experiment. Conservation Biology, 4 (1): 32-37.
Wijesundara, D.S.A. & J.G. Shantha Siri (2004). Some Selected aquatic ornamental plants of Sri
Lanka. National Science Foundation, Colombo. 95p.
Yakandawala, D. (2012). Present status of fresh water aquatic flora in Sri Lanka. In: The National
Red List 2012 of Sri Lanka: Conservation Status of Fauna and Flora. Weerakoon, D.K. & S.
Wijesundara Eds., Ministry of Environment, Colombo, Sri Lanka.186-196pp.
Electronic references
http://www.environment.gov.au/water/publications/environmental/rivers/nrhp/protocol1/pubs/proto
col-1.pdf (accessed on 12 July 2013).
http://www.mahawelicomplex.lk/kotdam.htm (accessed on 28 June 2013).
http://www.google.earth.org (accessed on 28 March 2013).
ADDITIONAL STUDIES ON NATURAL ENVIRONMENT FOR
REVIEW OF FEASIBILITY STUDY AND PREPARATION OF
DETAILED DESIGN AND BIDDING DOCUMENTS
MORAGOLLA HYDROPOWER PROJECT SRI LANKA
Final Report 3
GROUNDWATER DISTRIBUTION AND QUALITY ALONG THE PROPOSED
TUNNEL ROUTE OF THE MORAGOLLA HYDROPOWER PROJECT
Prepared by
The National Building Research Organization
Prepared for
NIPPON KOEI Co Ltd - Moragolla Hydropower Project
July 2013
National Building Research OrganizationMinistry of Disaster Management
99/1, Jawatte Road, Colombo 05, Sri Lanka

Contents
Executive Summary i
1. Introduction 1
2. Scope of the study 2
3. Description of the study area 3
4. Mapping locations of wells in the study area 6
5. Monitoring ground water level and quality 7
6. Sample collection, preservation, transportation for water quality testing 8
7. Analysis of groundwater distribution, aquifer characteristics and recharge
potential of the study area 9
8. Seasonal variations of groundwater in the study area 10
9. Anticipated impacts 13
10. Mitigation measures 14
Annexure
Annex 1 - Terms of Reference
Annex 2 - Geology map of proposed Moragolla Hydropower project area
Annex 3 - Glossary of terms
Annex 4 - Map; Location of existing wells and sample locations for groundwater level and
quality monitoring
Annex 5 - Location description of all wells in the survey area
Annex 6 - Study team
Annex 7 - Location description, water level and the height of the water column of the water
sampled during the survey
Annex 8 - Methods of analysis and Quality Control procedures
Annex 9 - Groundwater quality of the wells monitored in March and May
Annex 10 - Photographs of sampled well

List of Figures
Fig. 1- Map of the study area 4
Fig. 2 -Main litho-tectonic subdivisions of Sri Lanka 6
Fig. 3 -Front view and side view of Dip meter 7
Fig. 4 - Sterilized sample bottle used for the collection of water samples for 9
bacteriological analysis
Fig. 5 -Depth sampler used for the collection of groundwater samples from wells 9
Fig. 6 -Water level measured in wells in March and May in 2013 10
Fig. 7 -Seasonal variations in groundwater quality in 20 wells in the study area 12
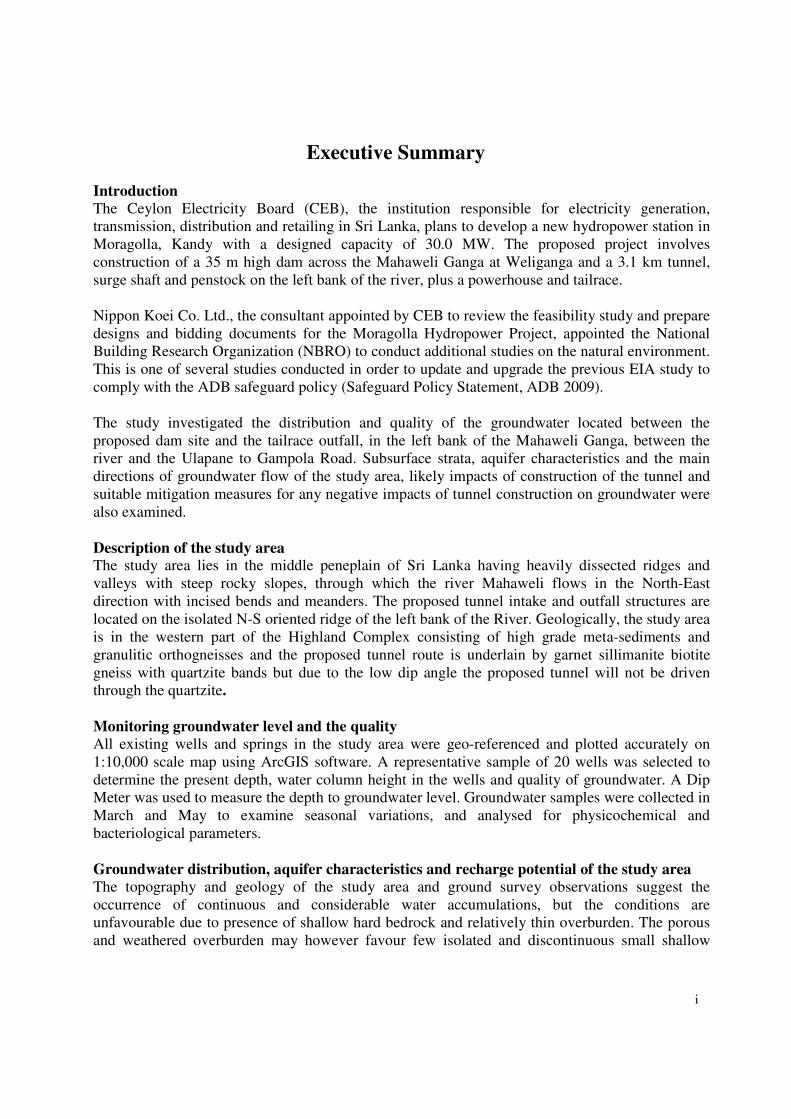
i
Executive Summary
Introduction
The Ceylon Electricity Board (CEB), the institution responsible for electricity generation,
transmission, distribution and retailing in Sri Lanka, plans to develop a new hydropower station in
Moragolla, Kandy with a designed capacity of 30.0 MW. The proposed project involves
construction of a 35 m high dam across the Mahaweli Ganga at Weliganga and a 3.1 km tunnel,
surge shaft and penstock on the left bank of the river, plus a powerhouse and tailrace.
Nippon Koei Co. Ltd., the consultant appointed by CEB to review the feasibility study and prepare
designs and bidding documents for the Moragolla Hydropower Project, appointed the National
Building Research Organization (NBRO) to conduct additional studies on the natural environment.
This is one of several studies conducted in order to update and upgrade the previous EIA study to
comply with the ADB safeguard policy (Safeguard Policy Statement, ADB 2009).
The study investigated the distribution and quality of the groundwater located between the
proposed dam site and the tailrace outfall, in the left bank of the Mahaweli Ganga, between the
river and the Ulapane to Gampola Road. Subsurface strata, aquifer characteristics and the main
directions of groundwater flow of the study area, likely impacts of construction of the tunnel and
suitable mitigation measures for any negative impacts of tunnel construction on groundwater were
also examined.
Description of the study areaThe study area lies in the middle peneplain of Sri Lanka having heavily dissected ridges and
valleys with steep rocky slopes, through which the river Mahaweli flows in the North-East
direction with incised bends and meanders. The proposed tunnel intake and outfall structures are
located on the isolated N-S oriented ridge of the left bank of the River. Geologically, the study area
is in the western part of the Highland Complex consisting of high grade meta-sediments and
granulitic orthogneisses and the proposed tunnel route is underlain by garnet sillimanite biotite
gneiss with quartzite bands but due to the low dip angle the proposed tunnel will not be driven
through the quartzite.
Monitoring groundwater level and the quality
All existing wells and springs in the study area were geo-referenced and plotted accurately on
1:10,000 scale map using ArcGIS software. A representative sample of 20 wells was selected to
determine the present depth, water column height in the wells and quality of groundwater. A Dip
Meter was used to measure the depth to groundwater level. Groundwater samples were collected in
March and May to examine seasonal variations, and analysed for physicochemical and
bacteriological parameters.
Groundwater distribution, aquifer characteristics and recharge potential of the study area
The topography and geology of the study area and ground survey observations suggest the
occurrence of continuous and considerable water accumulations, but the conditions are
unfavourable due to presence of shallow hard bedrock and relatively thin overburden. The porous
and weathered overburden may however favour few isolated and discontinuous small shallow
ii
aquifers. Recharge potential of groundwater is very poor since the percolation of rain water into
deep aquifers is hindered by the tight joints in the bedrock.
Seasonal variation of ground water quality and suitability for drinking
The difference in variation of water quality between two seasons appears to be marginal with
respect to many determinands and generally reflect conditions similar to rural residential setting.
The Faecal and Total Coliform counts in several wells although do not comply with Sri Lanka
Standard (SLS) for potable water in both seasons, their relatively low numbers suggest that this
water would be suitable for drinking after boiling.
Anticipated impactsSince the tunnel will be drilled through the solid bedrock, no loss of water from wells situated in
shallow aquifers is anticipated during construction. Seepage into the tunnel could take place in
areas where fracture intensity of bedrock is high. However the tunnel is located within the intact
bedrock so seepage into the excavated area is unlikely and therefore no significant impact on the
surrounding groundwater bodies is expected. Tunnel construction is unlikely to have any direct
impact on groundwater quality, because there should be no major contact between the tunnelling
activities and the surface aquifers. Ingression of contaminants such as waste oil, sanitary waste and
organic matter into groundwater may result if the waste generated from construction and other
project activities is not properly managed.
Mitigation measures
The following are recommended as mitigation measures during the construction phase: regular
monitoring of groundwater level during tunnel construction, and provision of an alternative water
supply for affected communities if reductions in well water level occur; formulation of an
environmental management plan to minimize potential deterioration of groundwater quality due to
seepage of waste oils and fuel, and human waste from insanitary practices.
1
1. Introduction
The Ceylon Electricity Board (CEB) plans to develop a new 30.0 MW hydropower project at
Moragolla in Kandy District. The scheme involves construction of a 35 m high concrete gravity
dam (with a 5 -gate spillway) across the Mahaweli Ganga at Weliganga, to create a 38.5 ha, 1.98
MCM reservoir with a Full Supply Level (FSL) at 548 masl. Water will be diverted through a 3.1
km underground tunnel, surge shaft and penstock on the left bank of the river, to a powerhouse
and outfall located opposite the confluence with the Atabage Oya.
In this regard, CEB intend seeking international financial support for project implementation and
potential funders include the Asian Development Bank (ADB). CEB has appointed Nippon Koei
Co. Ltd in joint venture with Nippon Koei India Pvt. Ltd to review the feasibility study and
prepare detailed designs and bidding documents for the project. Review of the EIA indicated that
further studies were needed in order to update and amend the document to comply with ADB
safeguard policy (Safeguard Policy Statement, ADB 2009).
The Nippon Koei Co, Ltd, Moragolla Hydropower Project appointed the National Building
Research Organization (NBRO) to conduct additional studies the on natural environment as
described in Terms of Reference (ToR) shown in Annex 1. These studies covered the following:
Water quality in the Mahaweli Ganga
Aquatic ecology in the Mahaweli Ganga
Groundwater distribution and quality along the proposed tunnel route
Updated land-use mapping
The aspects covered by this report are outlined as follows:
Description of geology and hydrogeology of the survey area
Distribution of groundwater extraction sources, groundwater level and quality along the
proposed tunnel route of the Moragolla Hydropower Project
A detailed map showing all wells in the survey area
Photographs of sampling locations
Sampling and analysis methods
Quality Control procedures operated by the laboratory
Discussion of the likely impacts of construction of the headrace tunnel
Proposed mitigation for any likely negative impacts
2
2. Scope of the study
According to the ToR (Annex 1) the survey required following:
Mapping well locations
Locate and map all wells in the survey area, which is the left bank of the Mahaweli Ganga,
between the proposed dam site and the tailrace outfall, between the river and the Ulapane to
Gampola Road. Well locations shall be obtained from information provided by the Mahaweli
Authority and Irrigation Department, if available, and by interviews with property owners and
occupiers on site. All well locations to be geo-referenced via GPS receivers and plotted
accurately on the map.
Monitoring groundwater quality
A sample of 20 wells to be selected at locations covering the whole survey area and with
permission from the owners, for the measurement of present depth and water quality1.
Samples are to be transported to a government-accredited laboratory under controlled
temperature conditions prescribed by the laboratory. In the laboratory samples are to be analysed
for: Conductivity, Total Suspended Solids, BOD5, Nitrate, Phosphate, Total Coliforms, Faecal
Coliforms and likely pesticides2. This survey shall be conducted twice; during February, 2013
and at the end of May, 2013, to give an indication of seasonal variations.
Examine the geology and hydrogeologyThe geology and hydrogeology of the survey area are required to be studied using available data
and prepare a description of the subsurface strata and aquifer characteristics and the main
directions of groundwater flow.
1 The requirement of duplicate samples mentioned in the ToR of Bid invitation document was later amended as to collect and
analyze 1 sample from each location at the meeting held on 15.02.2013 between NBRO and Nippon Koei Pvt Ltd2 Agreed to exclude pesticide analysis at the meeting held on 15.02.2013 between NBRO and Nippon Koei Pvt Ltd
3
3. Description of the study area
3.1 General
The study area, which is located between Ethgala Junction and Ulapane Industrial Park, can be
reached through Gampola – Nawalapitiya (A 113) Road. This area is situated within Grama
Niladhari Divisions of Ulapane, Thembiligala and Ethgala of Ganga Ihala Divisional Secretary
Division.
3.2 Topography
Morphologically, the area belongs to the middle peneplain3
of Sri Lanka. The general
topography consists of ridges and valleys with steep slopes. The ridges are heavily dissected by
1st
and 2nd
order streams. The streams flow in a dendritical pattern and join the Mahaweli River,
which flows in North-East direction. In the study area, the River Mahaweli flows in a steep-sided
valley with incised bends and meanders. The maximum relief of the study area is about 230 m.
The local topography consists of the northerly flowing River Mahaweli with steep rocky
embankments and meanders with an island close to the proposed tailrace outlet. The slope
steepness of the river bank varies from 35º to 50º. The slope angle of the land area varies
between 30º and 70º and the steepness is high along the Gampola – Nawalapitiya main road. The
river shows typical youthful stage characteristics with steep ‘V’ shaped valleys, potholes and
rapids. A few cross-cutting shallow valleys, which are oriented along the NW-SE direction, are
situated on the slope. These valleys are the surface expressions of regional lineaments and they
are located at much higher elevation in relation to the river bed level (data extracted from the
1:10,000 scale ABMP map; sheet number 61/13, published by the Survey Department of Sri
Lanka).
The proposed tunnel intake and outfall structures are located on the isolated ridge of the left bank
of Mahaweli River. The orientation of the ridge is North to South. The highest elevation of the
ridge is 700 m. The elevations at the intake area (river level) and the power house area are 520 m
and 470 m respectively.
3 All technical terms are explained in the glossary in Annex 3
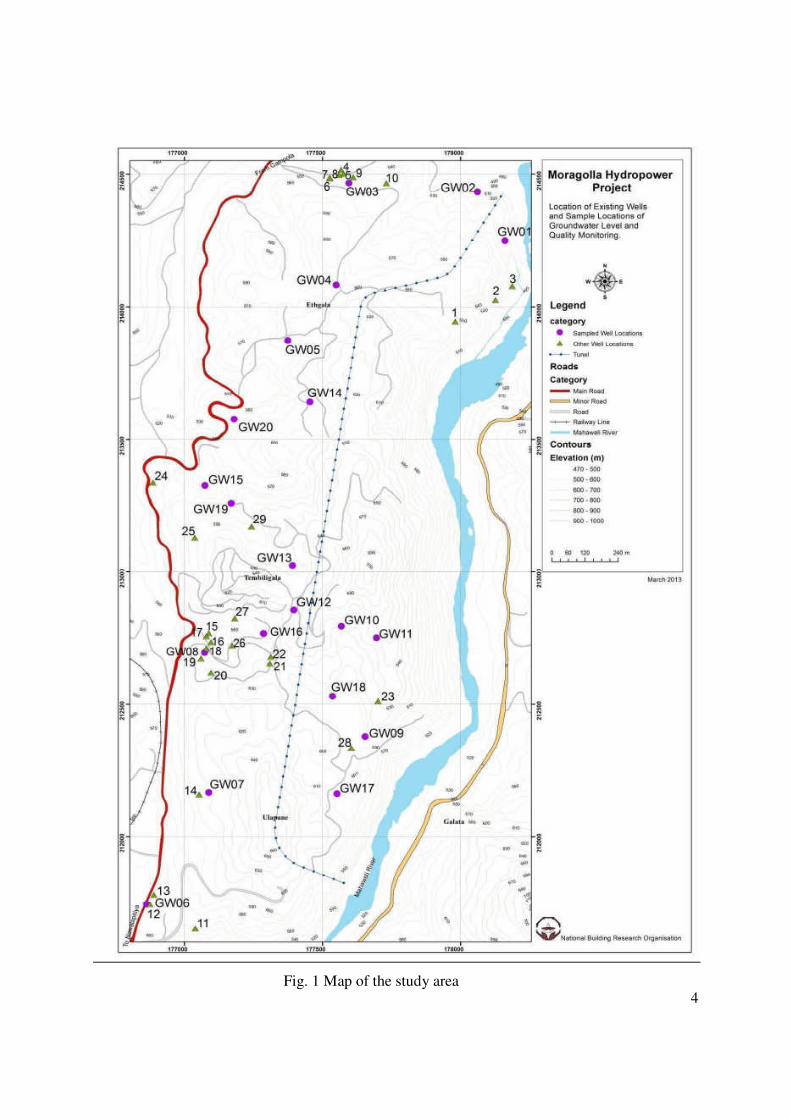
4Fig. 1 Map of the study area
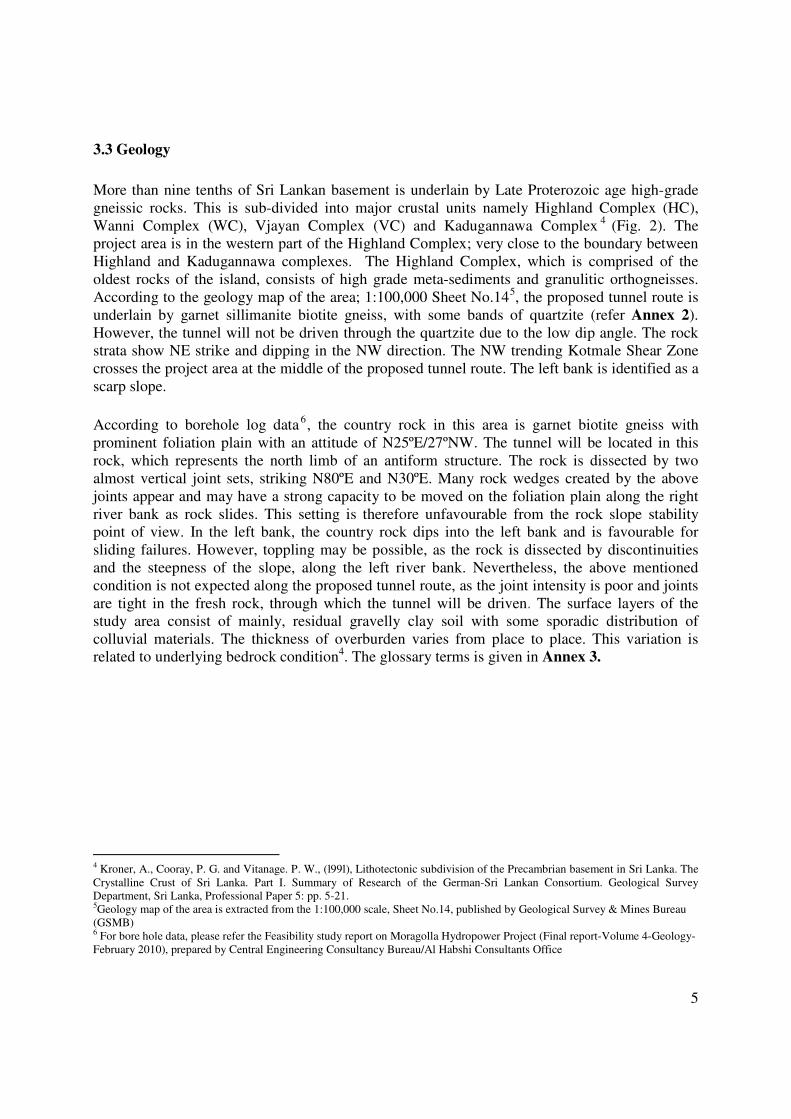
5
3.3 Geology
More than nine tenths of Sri Lankan basement is underlain by Late Proterozoic age high-grade
gneissic rocks. This is sub-divided into major crustal units namely Highland Complex (HC),
Wanni Complex (WC), Vjayan Complex (VC) and Kadugannawa Complex4
(Fig. 2). The
project area is in the western part of the Highland Complex; very close to the boundary between
Highland and Kadugannawa complexes. The Highland Complex, which is comprised of the
oldest rocks of the island, consists of high grade meta-sediments and granulitic orthogneisses.
According to the geology map of the area; 1:100,000 Sheet No.145, the proposed tunnel route is
underlain by garnet sillimanite biotite gneiss, with some bands of quartzite (refer Annex 2).
However, the tunnel will not be driven through the quartzite due to the low dip angle. The rock
strata show NE strike and dipping in the NW direction. The NW trending Kotmale Shear Zone
crosses the project area at the middle of the proposed tunnel route. The left bank is identified as a
scarp slope.
According to borehole log data6, the country rock in this area is garnet biotite gneiss with
prominent foliation plain with an attitude of N25ºE/27ºNW. The tunnel will be located in this
rock, which represents the north limb of an antiform structure. The rock is dissected by two
almost vertical joint sets, striking N80ºE and N30ºE. Many rock wedges created by the above
joints appear and may have a strong capacity to be moved on the foliation plain along the right
river bank as rock slides. This setting is therefore unfavourable from the rock slope stability
point of view. In the left bank, the country rock dips into the left bank and is favourable for
sliding failures. However, toppling may be possible, as the rock is dissected by discontinuities
and the steepness of the slope, along the left river bank. Nevertheless, the above mentioned
condition is not expected along the proposed tunnel route, as the joint intensity is poor and joints
are tight in the fresh rock, through which the tunnel will be driven. The surface layers of the
study area consist of mainly, residual gravelly clay soil with some sporadic distribution of
colluvial materials. The thickness of overburden varies from place to place. This variation is
related to underlying bedrock condition4. The glossary terms is given in Annex 3.
4 Kroner, A., Cooray, P. G. and Vitanage. P. W., (l99l), Lithotectonic subdivision of the Precambrian basement in Sri Lanka. The
Crystalline Crust of Sri Lanka. Part I. Summary of Research of the German-Sri Lankan Consortium. Geological Survey
Department, Sri Lanka, Professional Paper 5: pp. 5-21.5Geology map of the area is extracted from the 1:100,000 scale, Sheet No.14, published by Geological Survey & Mines Bureau
(GSMB)6 For bore hole data, please refer the Feasibility study report on Moragolla Hydropower Project (Final report-Volume 4-Geology-
February 2010), prepared by Central Engineering Consultancy Bureau/Al Habshi Consultants Office
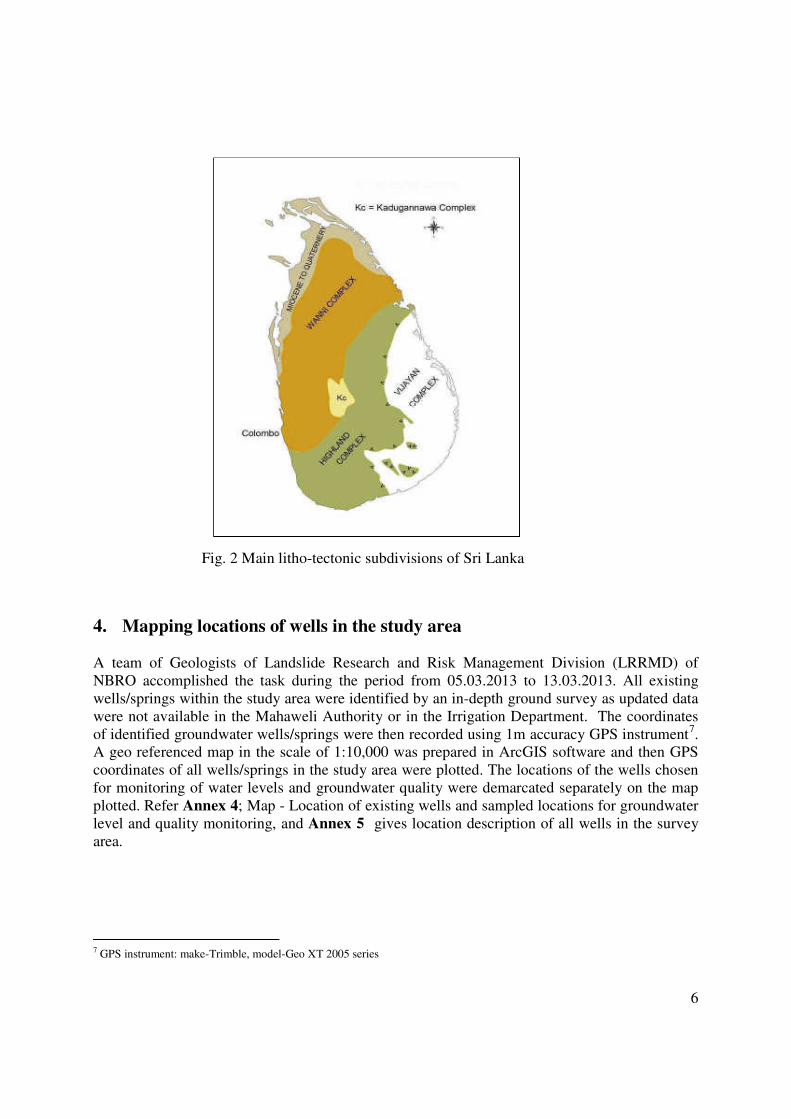
6
4. Mapping locations of wells in the study area
A team of Geologists of Landslide Research and Risk Management Division (LRRMD) of
NBRO accomplished the task during the period from 05.03.2013 to 13.03.2013. All existing
wells/springs within the study area were identified by an in-depth ground survey as updated data
were not available in the Mahaweli Authority or in the Irrigation Department. The coordinates
of identified groundwater wells/springs were then recorded using 1m accuracy GPS instrument7.
A geo referenced map in the scale of 1:10,000 was prepared in ArcGIS software and then GPS
coordinates of all wells/springs in the study area were plotted. The locations of the wells chosen
for monitoring of water levels and groundwater quality were demarcated separately on the map
plotted. Refer Annex 4; Map - Location of existing wells and sampled locations for groundwater
level and quality monitoring, and Annex 5 gives location description of all wells in the survey
area.
7 GPS instrument: make-Trimble, model-Geo XT 2005 series
Fig. 2 Main litho-tectonic subdivisions of Sri Lanka

7
5. Monitoring ground water levels and quality
The initial survey revealed that in this area the people use groundwater from two different
sources: from dug wells and from springs. Shallow pits have been excavated to tap the spring
water at the foot of slope cuts. The majority of the population uses dug wells and only a few
residents use springs with excavated shallow pits.
The depth to groundwater level from the ground surface and present water quality of the selected
wells/springs were then determined as follows. A total of twenty (20) wells were selected by
obtaining permission from the owners to represent the ground water quality in the study area.
Selection of wells was based on their construction type (protected or not), accessibility for
sampling and existence for future reference. Accordingly, wells sealed with concrete slabs and
those abandoned were not considered. More monitoring wells were selected above or in the
vicinity of the proposed route of the underground tunnel since the groundwater regime can be
disturbed specially during the construction of the tunnel.
The groundwater survey team (refer Annex 6) visited the site on 13th
March 2013 to take
measurements of ground water level and for the collection of water samples for water quality
monitoring. The same was repeated on 21st
May 2013 after showers.
The device called “Dip Meter” (Water Level Indicator –model BFK 200, Made in Italy (Fig. 3))
was used to measure the depth of groundwater level. Using this device the measurements were
taken in a day. The Dip Meter consists of a long wire cord marked in metres with cm and mm
divisions and a sensor connected to the rear end of the cord. During the measurement, the sensor
was slowly dipped into the well and a “beep” sound was heard when the sensor touches the water
surface. At this point the reading on the wire cord at the ground surface level was recorded as
the depth to the groundwater level. Annex 7 gives the location descriptions, water level and
height of the water column of wells sampled during the survey.
Fig. 3 : Front view and side view of Dip meter
8
6. Sample collection, preservation and transportation for water quality testing
As instructed by the ToR, the samples were analysed for Conductivity, Total Suspended Solids,
BOD5, Nitrate, Phosphates, Total Coliforms, and Faecal Coliforms. In addition, Dissolved
Oxygen (DO), Ammonia and Total Iron were also measured as low water levels in wells could
lower redox conditions leading to: leaching of Iron, high levels of Ammonia and occurrence of
low DO.
Sample collection, preservation, transportation and analysis for physicochemical parameters
were carried out as per the international standards8
. The bacteriological analysis (Faecal
Coliforms, Total Coliforms) were done according to the Specification for potable water9.
Accordingly, water samples were collected using specially wrapped sterilized sample bottles (Fig.
4). The bacteriology sample collection bottle is a narrow mouth bottle to which a sterile nylon
cord is tied. The sample was collected by dipping the bottle up to the required water level by
unwinding a nylon cord. Once the bottle was judged to be filled the thread was rewound to bring
the bottle up. After collection, one third of the water in the bottle was discarded to leave
sufficient air for microorganisms for their respiration. The groundwater samples for other
parameters were collected from wells using a Depth Sampler: Lamotte water sampler – code
1060 (Fig. 5). The purpose of using this device is to collect representative samples from the mid water
column. The sampler was lowered to a desired depth and immersed in the water completely, once the
bottle was sufficiently filled, the cord was rewound and sampler was brought up. Water sample was
transferred to a clean plastic beaker and pH, temperature, Conductivity and DO were measured on-site.
Bottles having a ground-glass stopper and flared mouth were filled with water samples for the
determination of Dissolved Oxygen (DO) and Biochemical Oxygen Demand (BOD), and bottles with
samples for Dissolved Oxygen were fixed at site by adding MnSO4 and alkali-iodize – azide reagents.
The water samples collected for water quality parameters except for DO, BOD and bacteriological
analysis were transferred securely into pre- cleaned screw-top plastic containers, All samples were
labelled with location No, date and specific parameter to be analysed. Carefully packed samples in
separate cooler boxes with ice were then transported to the NBRO laboratory, Colombo on the same day.
A temperature of 4 -100
C was maintained during transportation. In the laboratory, the samples were
stored at 40
C until analysis was performed. The analysis was commenced on the following day of sample
collection and continued up to10 days.
8 Standard Methods for the Examination of Water and Wastewater, American Public Health Association, 20th Edition, 19989 Specification for potable water SLS 614,1983, Bacteriological requirements (Part 2)

9
Fig. 4 - Sterilized sample bottle used for
the collection of water samples for
bacteriological analysis
Fig. 5 – Depth sampler used for the collection
of groundwater samples from wells
7. Analysis of groundwater distribution, aquifer characteristics and
recharge potential of the study area
The above analysis of the topography and geology of the study area, and observations made
during the survey work suggest that in general, favourable conditions do not exist in the study
area for the occurrence of continuous and considerable water accumulations. This is due to
following factors:
Presence of shallow hard bedrock in the majority of the area
Presence of discontinuous shallow overburden with restricted extent
Steep topographical nature of slopes of the area
Nevertheless, the existence of localized porous weathered overburden with gravelly and sandy
nature at some places can create favourable conditions for a few isolated and discontinuous small
shallow aquifers in the overburden. In addition, the presence of small low valleys and
depressions also facilitate water accumulation on the ridges. Because of this, several springs can
be observed in depressions at valley bottoms, discharging groundwater from their shallow
aquifers. These springs prove the existence of bed rock at a shallow level, though it is not
exposed in any of these valley bottoms. The presence of shallow solid bedrock forces
groundwater to discharge at the surface as springs, restricting downward percolation. The
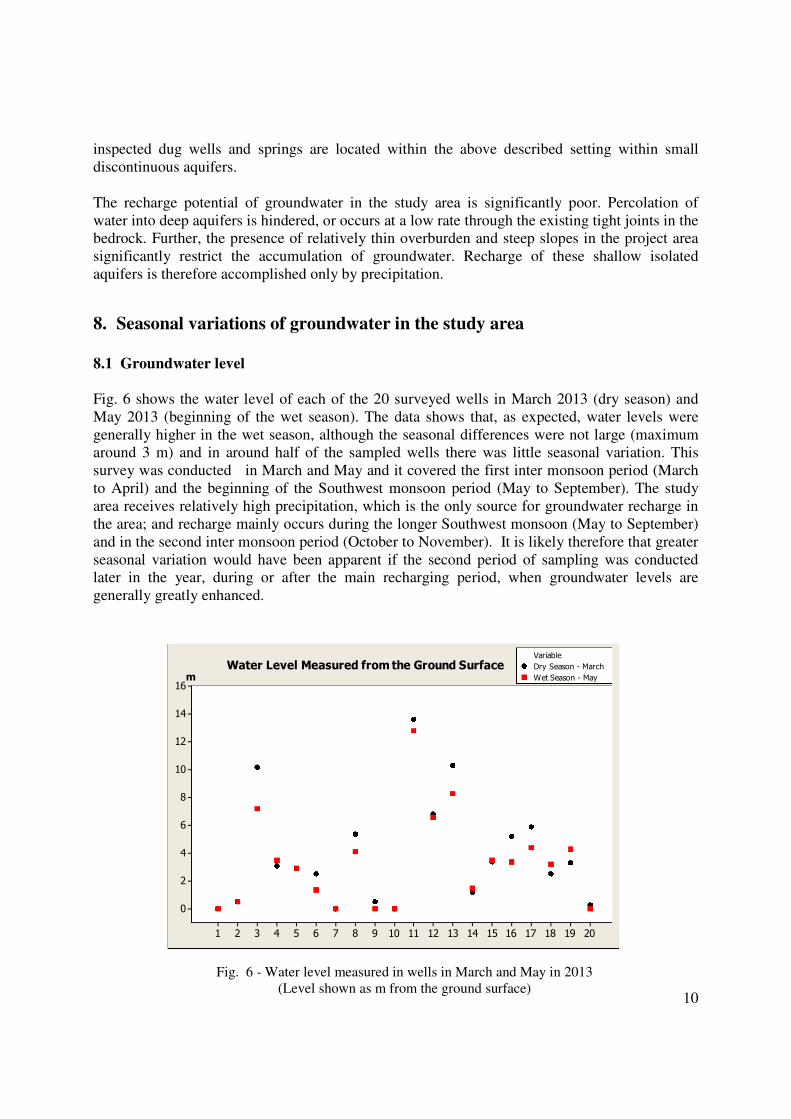
10
inspected dug wells and springs are located within the above described setting within small
discontinuous aquifers.
The recharge potential of groundwater in the study area is significantly poor. Percolation of
water into deep aquifers is hindered, or occurs at a low rate through the existing tight joints in the
bedrock. Further, the presence of relatively thin overburden and steep slopes in the project area
significantly restrict the accumulation of groundwater. Recharge of these shallow isolated
aquifers is therefore accomplished only by precipitation.
8. Seasonal variations of groundwater in the study area
8.1 Groundwater level
Fig. 6 shows the water level of each of the 20 surveyed wells in March 2013 (dry season) and
May 2013 (beginning of the wet season). The data shows that, as expected, water levels were
generally higher in the wet season, although the seasonal differences were not large (maximum
around 3 m) and in around half of the sampled wells there was little seasonal variation. This
survey was conducted in March and May and it covered the first inter monsoon period (March
to April) and the beginning of the Southwest monsoon period (May to September). The study
area receives relatively high precipitation, which is the only source for groundwater recharge in
the area; and recharge mainly occurs during the longer Southwest monsoon (May to September)
and in the second inter monsoon period (October to November). It is likely therefore that greater
seasonal variation would have been apparent if the second period of sampling was conducted
later in the year, during or after the main recharging period, when groundwater levels are
generally greatly enhanced.
m
2019181716151413121110987654321
16
14
12
10
8
6
4
2
0
Variable
Dry Season - March
Wet Season - May
Water Level Measured from the Ground Surface
Fig. 6 - Water level measured in wells in March and May in 2013
(Level shown as m from the ground surface)
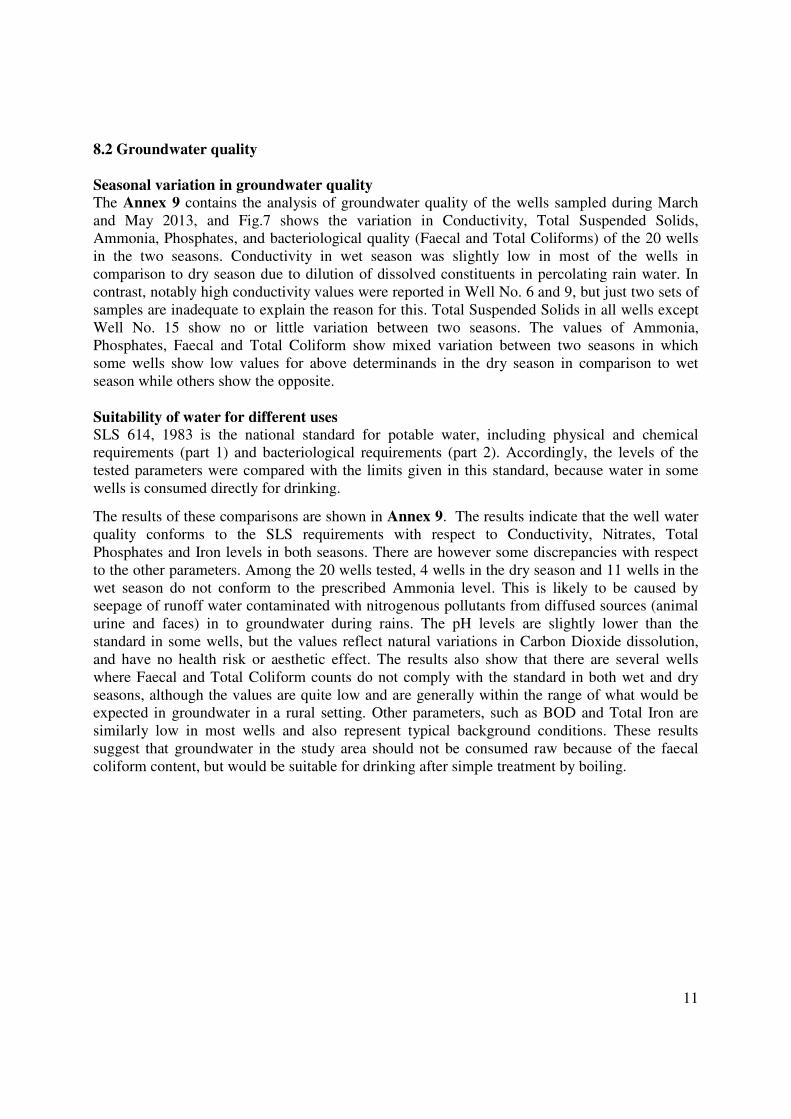
11
8.2 Groundwater quality
Seasonal variation in groundwater quality
The Annex 9 contains the analysis of groundwater quality of the wells sampled during March
and May 2013, and Fig.7 shows the variation in Conductivity, Total Suspended Solids,
Ammonia, Phosphates, and bacteriological quality (Faecal and Total Coliforms) of the 20 wells
in the two seasons. Conductivity in wet season was slightly low in most of the wells in
comparison to dry season due to dilution of dissolved constituents in percolating rain water. In
contrast, notably high conductivity values were reported in Well No. 6 and 9, but just two sets of
samples are inadequate to explain the reason for this. Total Suspended Solids in all wells except
Well No. 15 show no or little variation between two seasons. The values of Ammonia,
Phosphates, Faecal and Total Coliform show mixed variation between two seasons in which
some wells show low values for above determinands in the dry season in comparison to wet
season while others show the opposite.
Suitability of water for different uses
SLS 614, 1983 is the national standard for potable water, including physical and chemical
requirements (part 1) and bacteriological requirements (part 2). Accordingly, the levels of the
tested parameters were compared with the limits given in this standard, because water in some
wells is consumed directly for drinking.
The results of these comparisons are shown in Annex 9. The results indicate that the well water
quality conforms to the SLS requirements with respect to Conductivity, Nitrates, Total
Phosphates and Iron levels in both seasons. There are however some discrepancies with respect
to the other parameters. Among the 20 wells tested, 4 wells in the dry season and 11 wells in the
wet season do not conform to the prescribed Ammonia level. This is likely to be caused by
seepage of runoff water contaminated with nitrogenous pollutants from diffused sources (animal
urine and faces) in to groundwater during rains. The pH levels are slightly lower than the
standard in some wells, but the values reflect natural variations in Carbon Dioxide dissolution,
and have no health risk or aesthetic effect. The results also show that there are several wells
where Faecal and Total Coliform counts do not comply with the standard in both wet and dry
seasons, although the values are quite low and are generally within the range of what would be
expected in groundwater in a rural setting. Other parameters, such as BOD and Total Iron are
similarly low in most wells and also represent typical background conditions. These results
suggest that groundwater in the study area should not be consumed raw because of the faecal
coliform content, but would be suitable for drinking after simple treatment by boiling.
12
Fig 7.1 Seasonal Variations of Conductivity Fig 7.2 Seasonal Variations of Total Suspended Solids
Fig 7.3 Seasonal Variations of Ammonia Fig 7.4 Seasonal Variations of Total Phosphates
Fig 7.5 Seasonal Variations of Faecal Coliforms Fig 7.6 Seasonal Variations of Total Coliforms
2019181716151413121110987654321
200
150
100
50
0
Seasonal Variations of Conductivity
2019181716151413121110987654321
70
60
50
40
30
20
10
0
Seasonal Variations of Total Suspended Solids
2019181716151413121110987654321
0.8
0.7
0.6
0.5
0.4
0.3
0.2
0.1
0.0
Seasonal Variations of Ammonia (as N)
2019181716151413121110987654321
70
60
50
40
30
20
10
0
Seasonal Variations of Fecal Coliforms
2019181716151413121110987654321
140
120
100
80
60
40
20
0
Seasonal Variations of Total Coliforms
2019181716151413121110987654321
0.5
0.4
0.3
0.2
0.1
0.0
Seasonal Variations of Total Phosphates
Fig. 7 Seasonal variations in groundwater quality in 20 wells in the study area
(1-20 depicts the sampling locations GW1 – GW20.
Dry season data are shown in black and wet season data are shown in red)
13
9. Anticipated impacts
9.1 Groundwater level
Borehole log data6
revealed that the natural groundwater level in the shallow discontinuous
isolated aquifers located along the tunnel route is always above the proposed tunnel elevation
and the full supply level of the reservoir. Since the tunnel will be driven through the intact
bedrock, no loss of water from wells situated in shallow aquifers is anticipated during
construction. However, seepage could take place into the tunnel during construction in areas
where fracture intensity is high in the basement rock.
According to the drilling data, depths to the sound bedrock from the surface along three
differently oriented sections of the tunnel route are: 10 m, 20 m and 25 m (at the surge chamber),
and 10 m (at the outfall) respectively. The proposed tunnel route runs almost 50 m vertically
below the crest line of the ridge on the left bank along most of the route. The tunnel is therefore
located well below the bedrock, so there is very unlikely to be major seepage into the excavated
area, and therefore the expected impact on the surrounding shallow isolated groundwater bodies
will be insignificant.
9.2 Groundwater quality
The wells in the study area exploit percolating rainwater from discontinuous and relatively
shallow aquifers near the surface and as explained above, the tunnel will be located below the
layers of bedrock. Tunnel construction is therefore unlikely to have any direct impact on
groundwater quality, because there should be no major contact between the tunnelling activities
and the surface aquifers.
Nevertheless materials used or produced during the construction process (such as fuel oil,
sanitary waste, and other organic matter) could enter and pollute groundwater if disposed of
under poor waste management practices.

14
10 Mitigation measures
10.1 Mitigation of impacts of reduction in well water yield
As local communities depend almost entirely on groundwater for their potable supplies, it is
recommended that water levels of existing dug wells are monitored during the tunnel
construction period so that alternative water could be provided by tanker if any changes were to
happen.
10.2 Mitigation of ground water quality impacts
Measures should be included in the project Environmental Management Plan to ensure that the
aquifers and wells here and elsewhere in the project area are protected from potential sources of
pollution, including disposal of construction waste, storage and usage of chemicals (including fuel,
oils and waste oil) and waste from insanitary practices by workers.

Annexure____________________________________________________________

Annex 1____________________________________________________________
Terms of Reference
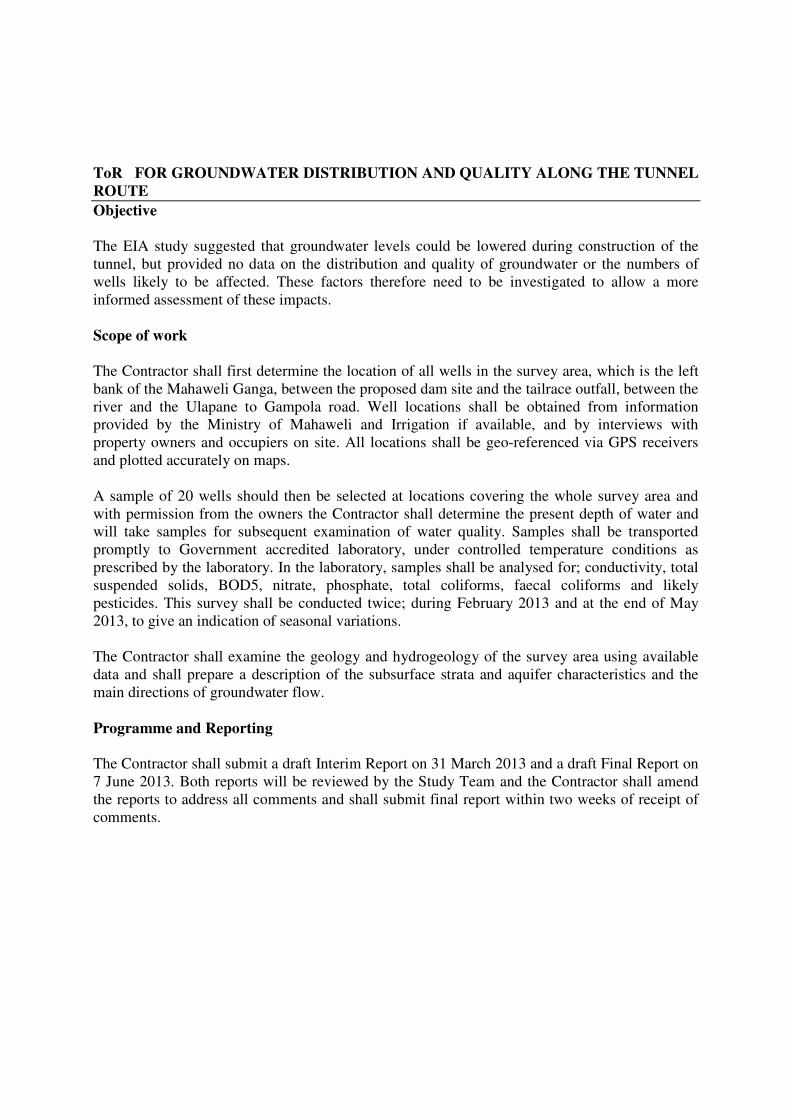
ToR FOR GROUNDWATER DISTRIBUTION AND QUALITY ALONG THE TUNNEL
ROUTE
Objective
The EIA study suggested that groundwater levels could be lowered during construction of the
tunnel, but provided no data on the distribution and quality of groundwater or the numbers of
wells likely to be affected. These factors therefore need to be investigated to allow a more
informed assessment of these impacts.
Scope of work
The Contractor shall first determine the location of all wells in the survey area, which is the left
bank of the Mahaweli Ganga, between the proposed dam site and the tailrace outfall, between the
river and the Ulapane to Gampola road. Well locations shall be obtained from information
provided by the Ministry of Mahaweli and Irrigation if available, and by interviews with
property owners and occupiers on site. All locations shall be geo-referenced via GPS receivers
and plotted accurately on maps.
A sample of 20 wells should then be selected at locations covering the whole survey area and
with permission from the owners the Contractor shall determine the present depth of water and
will take samples for subsequent examination of water quality. Samples shall be transported
promptly to Government accredited laboratory, under controlled temperature conditions as
prescribed by the laboratory. In the laboratory, samples shall be analysed for; conductivity, total
suspended solids, BOD5, nitrate, phosphate, total coliforms, faecal coliforms and likely
pesticides. This survey shall be conducted twice; during February 2013 and at the end of May
2013, to give an indication of seasonal variations.
The Contractor shall examine the geology and hydrogeology of the survey area using available
data and shall prepare a description of the subsurface strata and aquifer characteristics and the
main directions of groundwater flow.
Programme and Reporting
The Contractor shall submit a draft Interim Report on 31 March 2013 and a draft Final Report on
7 June 2013. Both reports will be reviewed by the Study Team and the Contractor shall amend
the reports to address all comments and shall submit final report within two weeks of receipt of
comments.

The Interim Report shall present and discuss all data collected in the first survey and the Final
Report shall present all data from both surveys and shall include the following:
A detailed and accurate map showing all wells in the survey area, plus site photographs
and appropriate tables and illustrations of key data;
Written descriptions of all survey and analysis methods (full details), quality control
procedures operated by the laboratory, and all other methods of data collection and
analysis;
A detailed discussion of the results, including but not necessarily limited to:
± A description of the geology and hydrology of the survey area, including the distribution
and flow in aquifers, recharge characteristics, water depths and quality, and local and
seasonal variations;
± The likely impact of construction of the 3.1 km long, 4.5 m diameter tunnel, at an
elevation of 528.25 msl (intake) and 510m as (outfall);
± Suitable mitigation for any negative impacts of tunnel construction on groundwater;
± Discussions of impacts shall explain the reasons for all conclusions and impacts shall be
quantified to the extent possible.
± Tables showing all data should be provided in an appendix.

Annex 2______________________________________________________
Geology map of proposed Moragolla Hydropower project area

Geology map of Moragolla Hydropower project

Annex 3
_________________________________________________
Glossary of terms
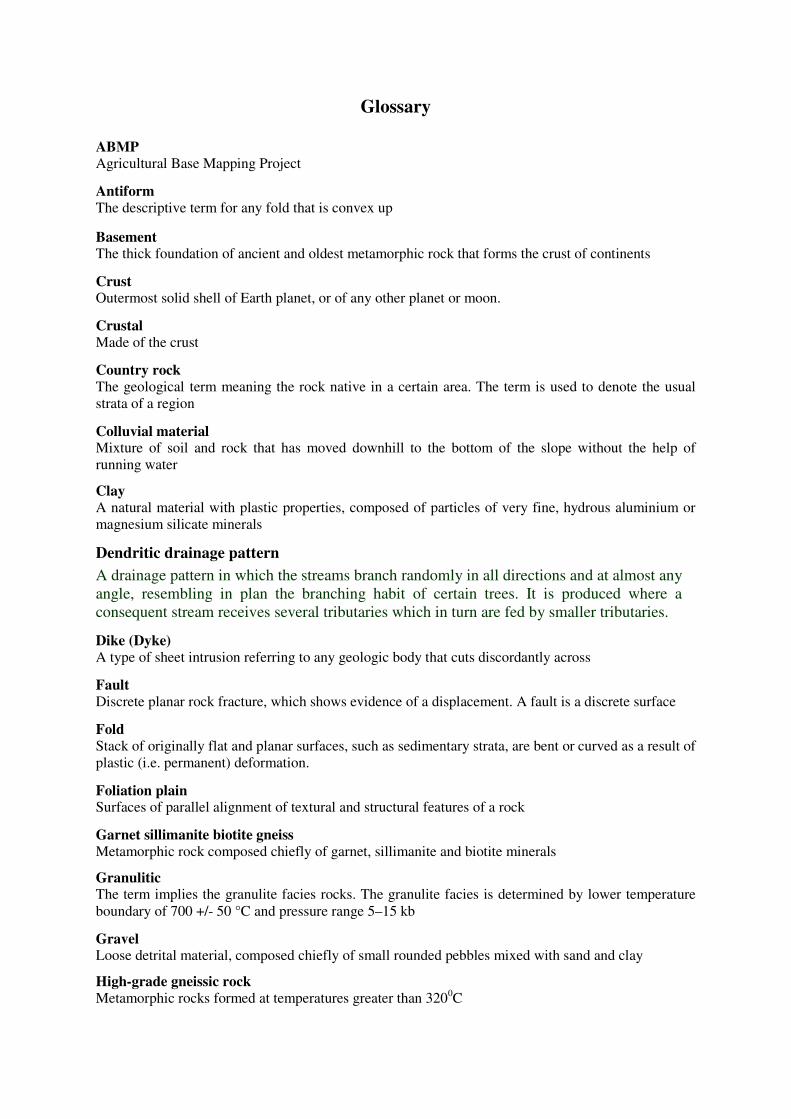
Glossary
ABMPAgricultural Base Mapping Project
Antiform
The descriptive term for any fold that is convex up
BasementThe thick foundation of ancient and oldest metamorphic rock that forms the crust of continents
CrustOutermost solid shell of Earth planet, or of any other planet or moon.
Crustal
Made of the crust
Country rock
The geological term meaning the rock native in a certain area. The term is used to denote the usual
strata of a region
Colluvial materialMixture of soil and rock that has moved downhill to the bottom of the slope without the help of
running water
Clay
A natural material with plastic properties, composed of particles of very fine, hydrous aluminium or
magnesium silicate minerals
Dendritic drainage pattern
A drainage pattern in which the streams branch randomly in all directions and at almost any
angle, resembling in plan the branching habit of certain trees. It is produced where a
consequent stream receives several tributaries which in turn are fed by smaller tributaries.
Dike (Dyke)
A type of sheet intrusion referring to any geologic body that cuts discordantly across
Fault
Discrete planar rock fracture, which shows evidence of a displacement. A fault is a discrete surface
Fold
Stack of originally flat and planar surfaces, such as sedimentary strata, are bent or curved as a result of
plastic (i.e. permanent) deformation.
Foliation plainSurfaces of parallel alignment of textural and structural features of a rock
Garnet sillimanite biotite gneiss
Metamorphic rock composed chiefly of garnet, sillimanite and biotite minerals
GranuliticThe term implies the granulite facies rocks. The granulite facies is determined by lower temperature
boundary of 700 +/- 50 °C and pressure range 5–15 kb
GravelLoose detrital material, composed chiefly of small rounded pebbles mixed with sand and clay
High-grade gneissic rock
Metamorphic rocks formed at temperatures greater than 3200C

LineamentA linear feature in a landscape, which is an expression of an underlying geological structure such as a
fault. Typically a lineament will comprise a fault-aligned valley, a series of fault or fold-aligned hills,
a straight coastline or indeed a combination of these features. Fracture zones, shear zones and igneous
intrusions such as dykes can also give rise to lineaments. Lineaments are often apparent in geological
or topographic maps and can appear obvious on aerial or satellite photographs.
Metamorphic rocksRocks formed by the solid state re-crystallization of pre-existing rocks due to changes in heat and/or
pressure and/or introduction of fluids i.e. without melting.
Meta-sedimentsSediment or sedimentary rock that shows evidence of having been subjected to metamorphism. The
overall composition of a meta-sediment can be used to identify the original sedimentary rock, even
where they have been subject to high-grade metamorphism and intense deformation
MetamorphismSolid state re-crystallization of pre-existing rocks due to changes in heat and/or pressure and/or
introduction of fluids i.e. without melting
OrthogneissesMetamorphic rocks formed by the metamorphism of igneous rocks
OverburdenThe material that lies above the rock
PeneplainA nearly flat surface of country produced by long period of subaerial erosion; almost a plain
Proterozoic ageThe era of geologic time, 2.5 billion to 570 million years ago, during which sea plants and animals
Quartz
SiO2, crystalline silica or oxide of silicon
QuartziteMetamorphosed sandstone consisting of an interlocking mosaic of quartz crystals
Residual gravelly clayIn-situ clay soil formed by weathering of the parent rock rich in gravel
Scarp slopeThe face of a ridge, facing in an opposite direction to the dip of the rock strata
Shear ZoneA tabular to sheet like, planar or curviplanar zone composed of rocks that are more highly strained
than rocks adjacent to the zone.
Stream orderNumbering begins at the top of a catchment with headwater (‘new’) flow paths being assigned the
number 1(first order). Where two flow paths of first order join, the section downstream of the
junction is referred to as a second order stream. Where two second order streams join, the waterway
downstream of the junction is referred to as a third order stream, and so on. Where a lower order
stream (e.g. first order) joins a higher order stream (e.g. third order), the area downstream of thejunction will retain the higher number (i.e. it will remain a third order stream).
StrikeBearing of the foliation plain of a rock

Annex 4______________________________________________________________
Map-Location of existing wells and sample locations for groundwater level
and quality monitoring
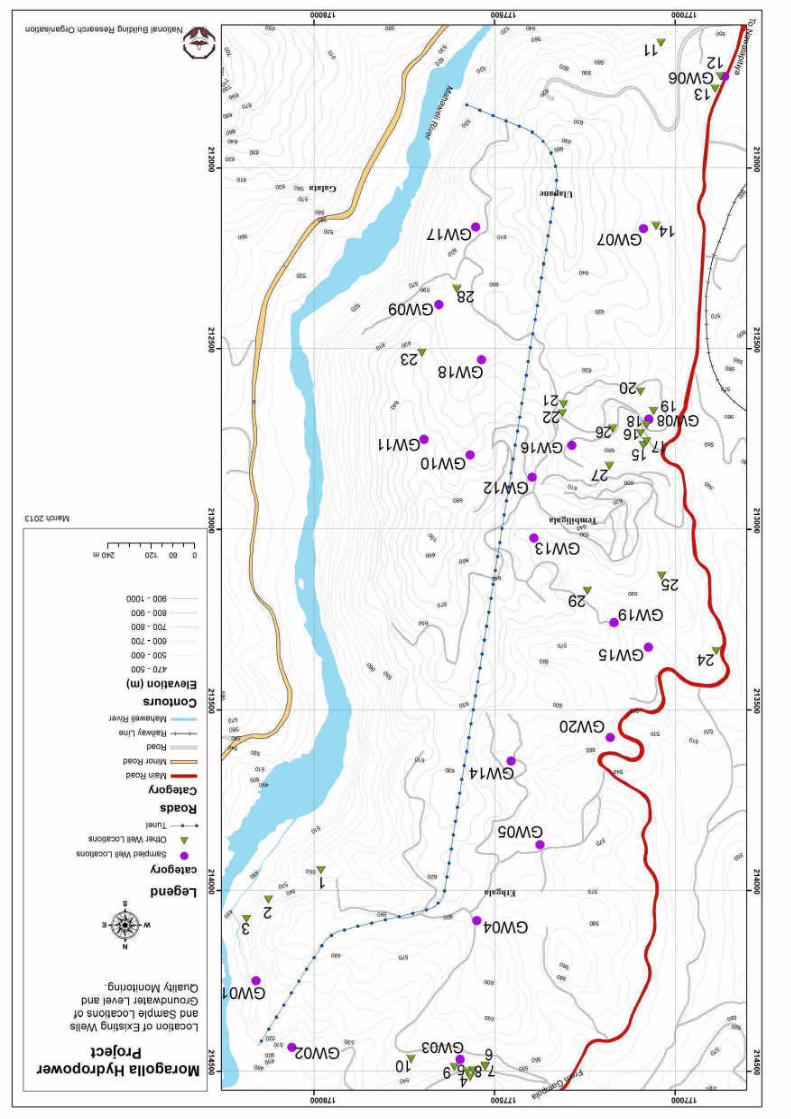

Annex 5______________________________________________________________
Location description of all wells in the study area

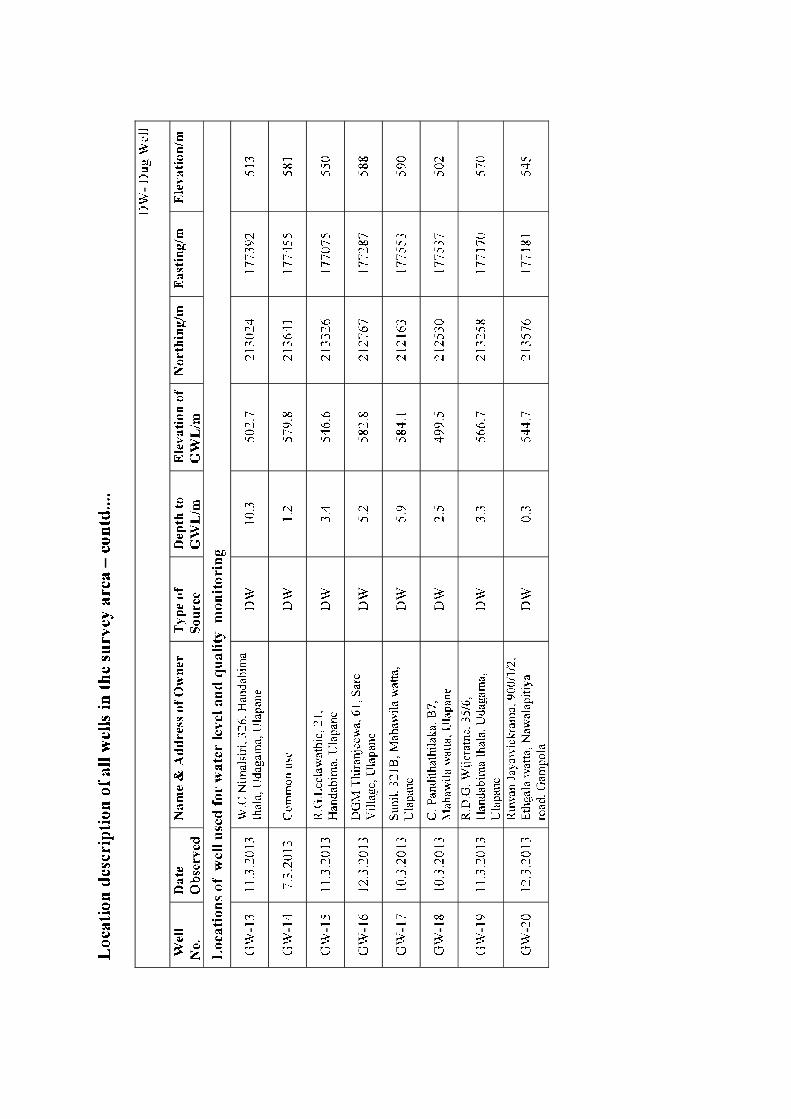


Annex 6__________________________________________________________
Study team

Study team
Key staff
Name DesignationMs S V Dias Senior Scientist / Water Quality Specialist
Mr Mahesh Somaratne
Mr NIC Peiris
Senior Geologist
Senior Geologist
Mr IAVP Iddamalgoda
Ms S A M S Dissanayake
Senior Scientist
Senior Scientist
Mr HDS Premasiri Senior Scientist
Mr Vimukthi Sumanasekara Scientist
Ms H.T.J. Seneviratne Scientist
Laboratory analysis team
Name Designation
Ms P D C Pathiraja Technical Assistant
Ms P H D Silva Technical Assistant
Ms Thilangika Gunawardena Project Assistant
Support staff
Name DesignationMr N Krishnamoorthi Field Assistant
Mr Chamath Vithanage Field Assistant
Mr WA Weerasinghe Field Assistant
Mr A Premaratne Field Assistant
Annex 7__________________________________________________________
Location description, water level and the height of the water column of the
wells sampled during the survey
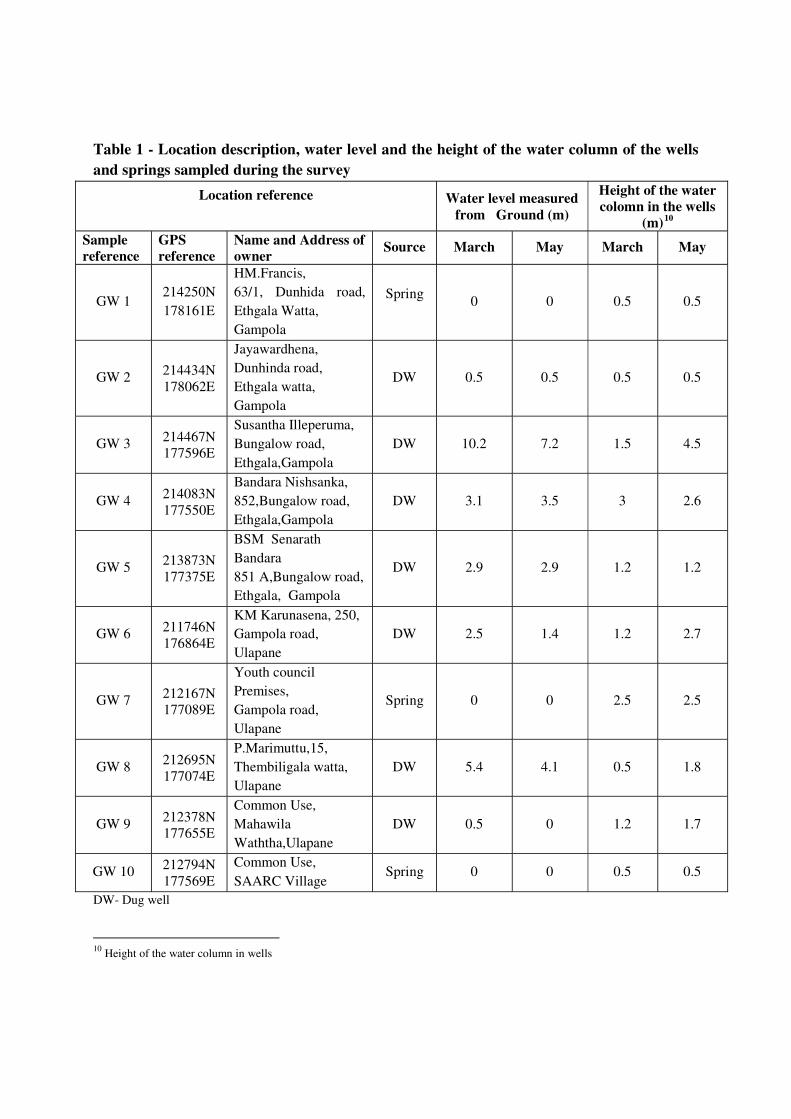
Table 1 - Location description, water level and the height of the water column of the wells
and springs sampled during the survey
Location reference Water level measured
from Ground (m)
Height of the water
colomn in the wells
(m)10
Sample
reference
GPS
reference
Name and Address of
ownerSource March May March May
GW 1214250N
178161E
HM.Francis,
63/1, Dunhida road,
Ethgala Watta,
Gampola
Spring0 0 0.5 0.5
GW 2214434N
178062E
Jayawardhena,
Dunhinda road,
Ethgala watta,
Gampola
DW 0.5 0.5 0.5 0.5
GW 3214467N
177596E
Susantha Illeperuma,
Bungalow road,
Ethgala,Gampola
DW 10.2 7.2 1.5 4.5
GW 4214083N
177550E
Bandara Nishsanka,
852,Bungalow road,
Ethgala,Gampola
DW 3.1 3.5 3 2.6
GW 5213873N
177375E
BSM Senarath
Bandara
851 A,Bungalow road,
Ethgala, Gampola
DW 2.9 2.9 1.2 1.2
GW 6211746N
176864E
KM Karunasena, 250,
Gampola road,
Ulapane
DW 2.5 1.4 1.2 2.7
GW 7212167N
177089E
Youth council
Premises,
Gampola road,
Ulapane
Spring 0 0 2.5 2.5
GW 8212695N
177074E
P.Marimuttu,15,
Thembiligala watta,
Ulapane
DW 5.4 4.1 0.5 1.8
GW 9212378N
177655E
Common Use,
Mahawila
Waththa,Ulapane
DW 0.5 0 1.2 1.7
GW 10212794N
177569E
Common Use,
SAARC VillageSpring 0 0 0.5 0.5
DW- Dug well
10Height of the water column in wells
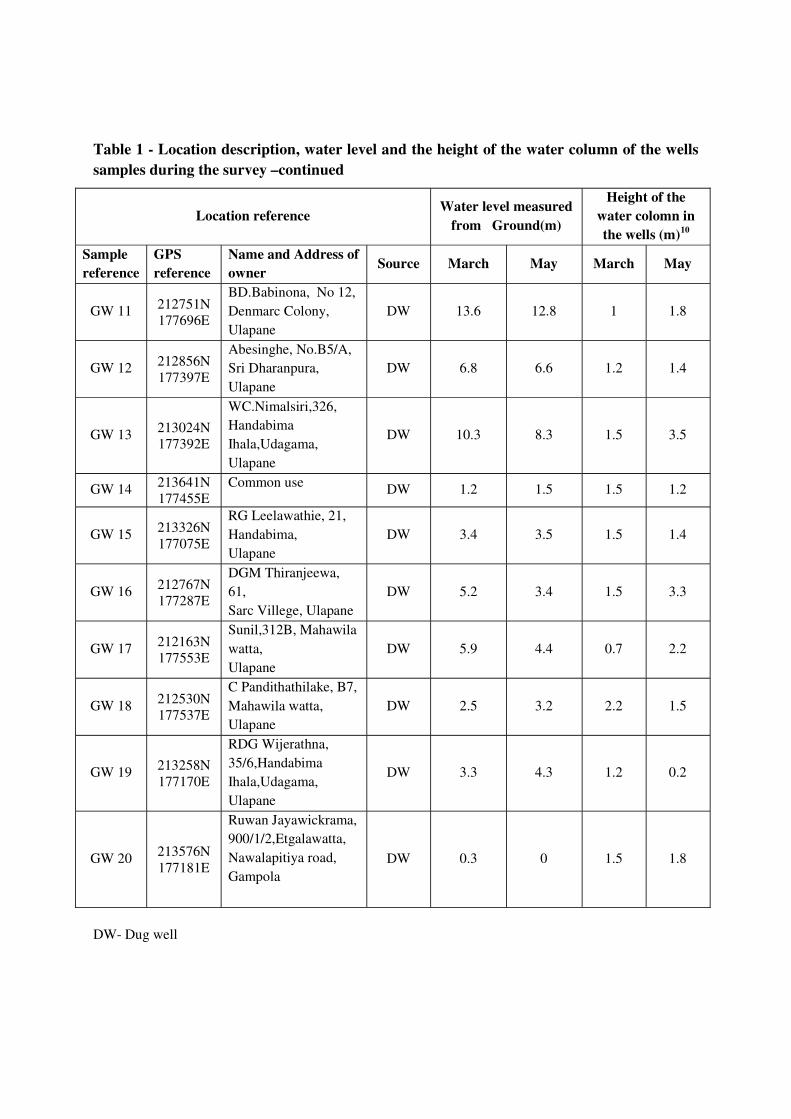
Table 1 - Location description, water level and the height of the water column of the wells
samples during the survey –continued
Location referenceWater level measured
from Ground(m)
Height of the
water colomn in
the wells (m)10
Sample
reference
GPS
reference
Name and Address of
ownerSource March May March May
GW 11212751N
177696E
BD.Babinona, No 12,
Denmarc Colony,
Ulapane
DW 13.6 12.8 1 1.8
GW 12212856N
177397E
Abesinghe, No.B5/A,
Sri Dharanpura,
Ulapane
DW 6.8 6.6 1.2 1.4
GW 13213024N
177392E
WC.Nimalsiri,326,
Handabima
Ihala,Udagama,
Ulapane
DW 10.3 8.3 1.5 3.5
GW 14213641N
177455E
Common useDW 1.2 1.5 1.5 1.2
GW 15213326N
177075E
RG Leelawathie, 21,
Handabima,
Ulapane
DW 3.4 3.5 1.5 1.4
GW 16212767N
177287E
DGM Thiranjeewa,
61,
Sarc Villege, Ulapane
DW 5.2 3.4 1.5 3.3
GW 17212163N
177553E
Sunil,312B, Mahawila
watta,
Ulapane
DW 5.9 4.4 0.7 2.2
GW 18212530N
177537E
C Pandithathilake, B7,
Mahawila watta,
Ulapane
DW 2.5 3.2 2.2 1.5
GW 19213258N
177170E
RDG Wijerathna,
35/6,Handabima
Ihala,Udagama,
Ulapane
DW 3.3 4.3 1.2 0.2
GW 20213576N
177181E
Ruwan Jayawickrama,
900/1/2,Etgalawatta,
Nawalapitiya road,
Gampola
DW 0.3 0 1.5 1.8
DW- Dug well
Annex 8
____________________________________________________________
Methods of analysis and quality control procedures

Method of Analysis
Parameter Method Reference Description of the Method
pH APHA 4500 H-B
Electrometric method
pH and Temperature were measured using pH meter, brand ; pH 5+
pH/0C of EUTECH Instrument Singapore origin. The meter was
first calibrated using NIST pH 4.01 and pH 6.86 buffer solutions
(NIST; National Institute of Standard Technology). The pH and
Temperature of water samples were taken after calibration by
immersing electrode and the probe.Temperature APHA 2550 B
Electrometric method
Conductivity APHA - 2510 B
Electrometric
method
Conductivity was measured using potable multi parameter
instrument; HORIBA U-50 Multiparameter; Water Quality
Checker Japan origin. The meter was first calibrated using standard
of 0.005mol/L KCl solution (conductivity =0.718mS/cm) to match
with the measuring conductivity range. Initially zero point
calibration was conducted. The sensor probes were then washed 2 or
3 times in deionized water and all moisture was removed.
Calibration of the instrument-The “Cond” mode was selected in the
parameter selection screen. Then the number of calibration points
was set and, “Cond” value was set into 0.000 mS/cm. After the
“Measurement value” has been stabilized the calibration was started
by pressing ENTER key.
Taking measurements- The transparent calibration cup was washed
2 to 3 times with deionized water and filled to the reference line
with 0.718mS/cm standard solution. The sensor probe wassubmerged in the transparent calibration cup. The “Cond” value was
set to 0.718 mS/cm and the calibration was started. After the
calibration was completed the calibration cup was washed again
with deionized water and filled with sample. Then the measurement
was taken after “Measurement value” was stabilized.
Dissolved
Oxygen
APHA-4500-O-C
Azide modification
Water samples were collected in a 300 ml bottles having a ground-
glass stopper and a flared mouth without entrapping air bubbles.
Dissolved oxygen in the sample was fixed by adding 2 mL of
MnSO4 and 2 mL of alkali-iodize –azide reagents to the bottle at the
site. Then the bottle was stoppered carefully to avoid air bubbles and
mixed well by inverting the bottle a few times. These bottles were
transported to the laboratory at 4 to 100C. In the determination of
DO, 2.0mL of conc. H2SO4 was added to the bottle and mixed well
until dissolution of precipitate is complete. A 200 mL portion from
this sample was titrated with 0.025M Na2SO4 solution to a pale
yellow color. Then few drops of starch solution were added and
titration was continued to first appearance of blue color.
Calculation
For titration of 200mL sample,
1mL 0.025N Na2SO4 = 1mg DO/L

Parameter Method ReferenceDescription of the Method
Biochemical
Oxygen
Demand
APHAA 5210-B
5-Day BOD test
Water samples were collected in a 300 ml bottles having a ground-
glass stopper and a flared mouth without entrapping air bubbles. To
prevent entry of air in to bottles during incubation water was added
to the flared mouth of the bottle and then capped with plastic cap.
For each measurement two bottles were prepared in the above
manner and transported to the laboratory at 4-100C. Of the two sets,
the dissolved oxygen in one set was determined on the following
day. This gives the Initial oxygen levels. The bottles in the other set
were incubated at 200C for 5 days. After 5 days the DO was
determined similar to first set. This gives remaining oxygen after
five days
Determination of BOD
BOD mg/l = Initial dissolved oxygen level in the sample - Final
dissolved oxygen level in the sample
(Initial dissolved oxygen is the value measured as dissolved oxygen)
NitrateAPHA 4500-NO2-
B Photometry
10 mL of sample was taken to the sample vial and color was
developed by crushing Nitrate test tablet supplied by the
manufacturer. The developed color was then measured usingLovibond, Maxi Direct SN 10-1083 photometer made in Germany.
The Method used is APHA 4500-NO2-B. The reading appeared on
the meter was taken as the measured value
AmmoniaAPHA-4500-NH3 F 10 mL of sample was taken to a sample vial and color was
developed using ammonia No.1 and No.2 tablets supplied by the
manufacturer. The developed color was then measured using
Lovibond Maxi Direct SN 10-1083 photometer made in Germany.
The Method used is APHA-4500-NH3 F. The reading appeared on
the meter was taken as the measured value.
Total Iron Photometric
method
A disk type Lovibond comparator was used in the determination.
First, two comparator cells were rinsed twice with deionized water
and then deionized water and the sample were filled to each of the
cells separately. For both cells Iron Low Range tablets supplied by
the manufacturer were added, crushed and dissolved completely and
allowed to develop color. Then the two cells were placed in the
comparator. The color disc prepared with different color intensities
was rotated while holding the comparator, facing good natural light
until the colour of the sample marches with that of the sample. The
iron level was expressed as mg/l.
The value for concentration of the color standard in mg/l was taken
as Total iron concentration of the test sample.
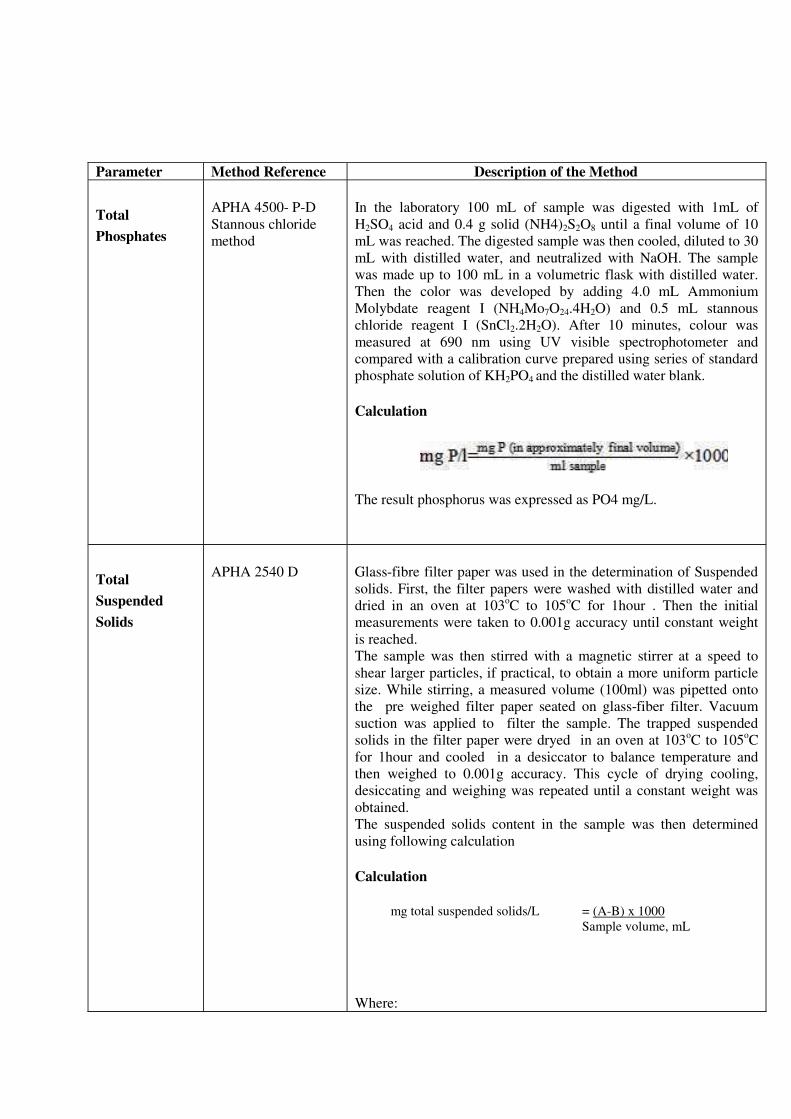
Parameter Method Reference Description of the Method
Total
Phosphates
APHA 4500- P-D
Stannous chloride
method
In the laboratory 100 mL of sample was digested with 1mL of
H2SO4 acid and 0.4 g solid (NH4)2S2O8 until a final volume of 10
mL was reached. The digested sample was then cooled, diluted to 30
mL with distilled water, and neutralized with NaOH. The sample
was made up to 100 mL in a volumetric flask with distilled water.
Then the color was developed by adding 4.0 mL Ammonium
Molybdate reagent I (NH4Mo7O24.4H2O) and 0.5 mL stannous
chloride reagent I (SnCl2.2H2O). After 10 minutes, colour was
measured at 690 nm using UV visible spectrophotometer and
compared with a calibration curve prepared using series of standard
phosphate solution of KH2PO4 and the distilled water blank.
Calculation
The result phosphorus was expressed as PO4 mg/L.
Total
Suspended
Solids
APHA 2540 D Glass-fibre filter paper was used in the determination of Suspended
solids. First, the filter papers were washed with distilled water and
dried in an oven at 103oC to 105
oC for 1hour . Then the initial
measurements were taken to 0.001g accuracy until constant weight
is reached.
The sample was then stirred with a magnetic stirrer at a speed to
shear larger particles, if practical, to obtain a more uniform particle
size. While stirring, a measured volume (100ml) was pipetted onto
the pre weighed filter paper seated on glass-fiber filter. Vacuum
suction was applied to filter the sample. The trapped suspended
solids in the filter paper were dryed in an oven at 103oC to 105
oC
for 1hour and cooled in a desiccator to balance temperature and
then weighed to 0.001g accuracy. This cycle of drying cooling,
desiccating and weighing was repeated until a constant weight was
obtained.
The suspended solids content in the sample was then determined
using following calculation
Calculation
Where:
mg total suspended solids/L = (A-B) x 1000
Sample volume, mL
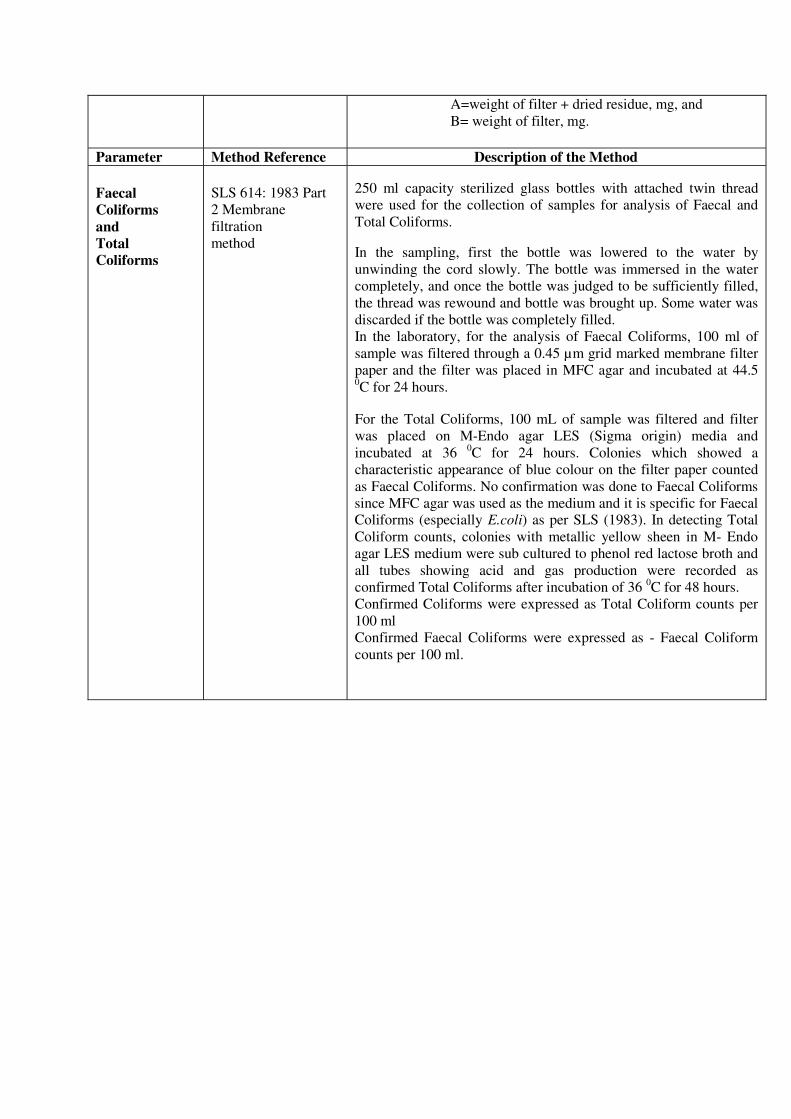
A=weight of filter + dried residue, mg, and
B= weight of filter, mg.
Parameter Method Reference Description of the Method
Faecal
Coliforms
and
Total
Coliforms
SLS 614: 1983 Part
2 Membrane
filtration
method
250 ml capacity sterilized glass bottles with attached twin thread
were used for the collection of samples for analysis of Faecal and
Total Coliforms.
In the sampling, first the bottle was lowered to the water by
unwinding the cord slowly. The bottle was immersed in the water
completely, and once the bottle was judged to be sufficiently filled,
the thread was rewound and bottle was brought up. Some water was
discarded if the bottle was completely filled.
In the laboratory, for the analysis of Faecal Coliforms, 100 ml of
sample was filtered through a 0.45 µm grid marked membrane filter
paper and the filter was placed in MFC agar and incubated at 44.50C for 24 hours.
For the Total Coliforms, 100 mL of sample was filtered and filter
was placed on M-Endo agar LES (Sigma origin) media and
incubated at 360C for 24 hours. Colonies which showed a
characteristic appearance of blue colour on the filter paper counted
as Faecal Coliforms. No confirmation was done to Faecal Coliforms
since MFC agar was used as the medium and it is specific for FaecalColiforms (especially E.coli) as per SLS (1983). In detecting Total
Coliform counts, colonies with metallic yellow sheen in M- Endo
agar LES medium were sub cultured to phenol red lactose broth and
all tubes showing acid and gas production were recorded as
confirmed Total Coliforms after incubation of 360C for 48 hours.
Confirmed Coliforms were expressed as Total Coliform counts per
100 ml
Confirmed Faecal Coliforms were expressed as - Faecal Coliform
counts per 100 ml.

Quality Control procedures
The NBRO is registered in the Central Environmental Authority (CEA)- Laboratory
as Consultant/ Specialist for Technical Guidance (Reg. No. 07/LM/Cons/10/2008).
Copy of certificate - 2013 and a Letter indicating participation in Proficiency testing
programs with CEA are given below.
Quality control for the analysis of all the parameters was carried as per the procedures
given in the Standard methods for the Examination of water and wastewater, APHA,
AWWA, WEF- 20th
edition (APHA).
The pH meter was calibrated before commencing the sample measurements using pH 4.01
and pH 6.86 buffer solutions (traceable to National Institute of Standards and Technology-
NIST).
The conductivity meter HORIBA U-50 Multiparameter; Water Quality Checker Japan
origin. The meter was calibrated using prepared standard of 0.005mol/L KCl solution
(conductivity = 0.718 mS/cm) to match with the measuring conductivity range.
Dissolved Oxygen and BOD analysis -Glucose Glutamic acid (GGA) standard check
solution was checked for reliability of the sample analysis. The GGA control is a
standardized solution to determine the quality of the seed, where its recommended BOD5
concentration is 198 mg/l ± 30.5 mg/l. The dilution water blank was used to confirm the
quality of the dilution water that was used to dilute the samples. This is necessary because
impurities in the dilution water may cause significant alterations in the results.
In the Nitrates analysis, standard KNO3 (strength was 1.00 mL= 100 µg NO3-) was prepared
as per APHA and 0.1 mg/L solution as a known sample and deionized water was checked for
an each set of sample analysis.
In the ammonia testing standard solution of NH4Cl was used as the standard (1.00 mL =1.22
mg NH3). For each set of sample analysis 0.01 mg NH3/L solution as a known sample and
deionized water as a blank were checked.
For the total phosphates analysis, standard phosphate solution of KH2PO4 was used to
prepare the calibration curve (The strength was 1.00 mL=50.0 g PO43-
P). In each set of
analysis, 6 samples at a time; 3 water samples, 1 known standard sample, 1 spiked sample
and a blank sample (deionized water) were digested and analyzed.
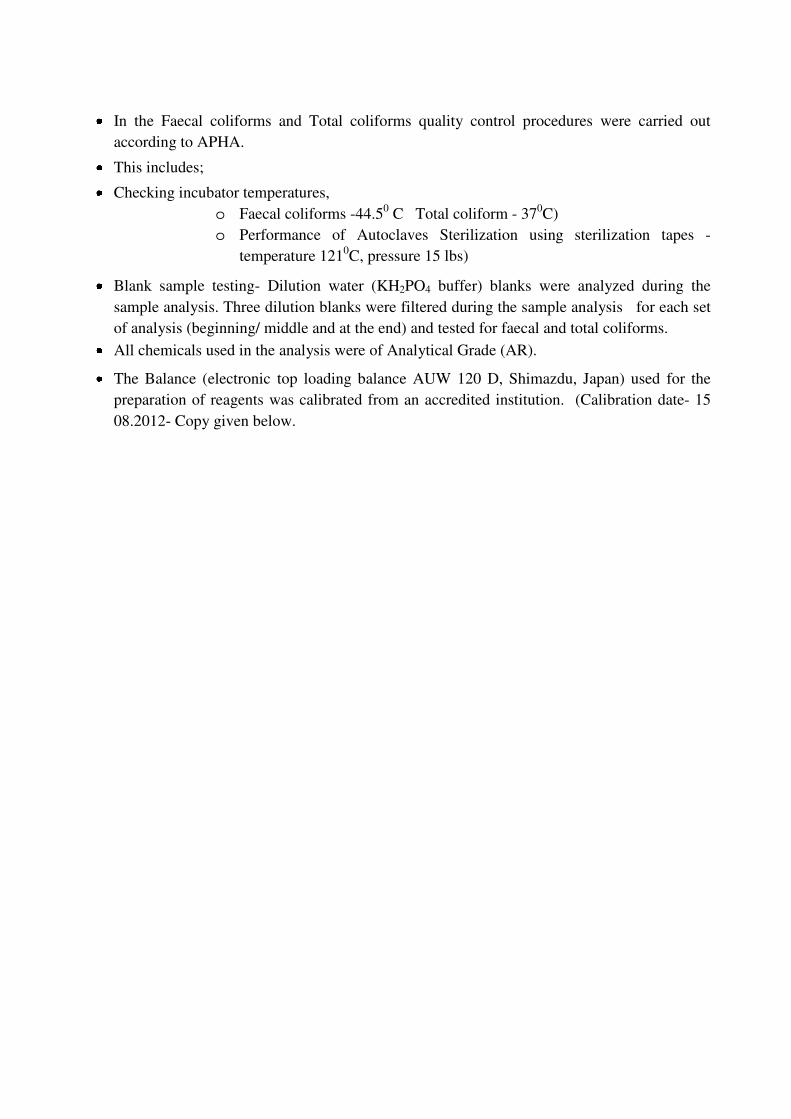
In the Faecal coliforms and Total coliforms quality control procedures were carried out
according to APHA.
This includes;
Checking incubator temperatures,
± Faecal coliforms -44.50
C Total coliform - 370C)
± Performance of Autoclaves Sterilization using sterilization tapes -
temperature 1210C, pressure 15 lbs)
Blank sample testing- Dilution water (KH2PO4 buffer) blanks were analyzed during the
sample analysis. Three dilution blanks were filtered during the sample analysis for each set
of analysis (beginning/ middle and at the end) and tested for faecal and total coliforms.
All chemicals used in the analysis were of Analytical Grade (AR).
The Balance (electronic top loading balance AUW 120 D, Shimazdu, Japan) used for the
preparation of reagents was calibrated from an accredited institution. (Calibration date- 15
08.2012- Copy given below.
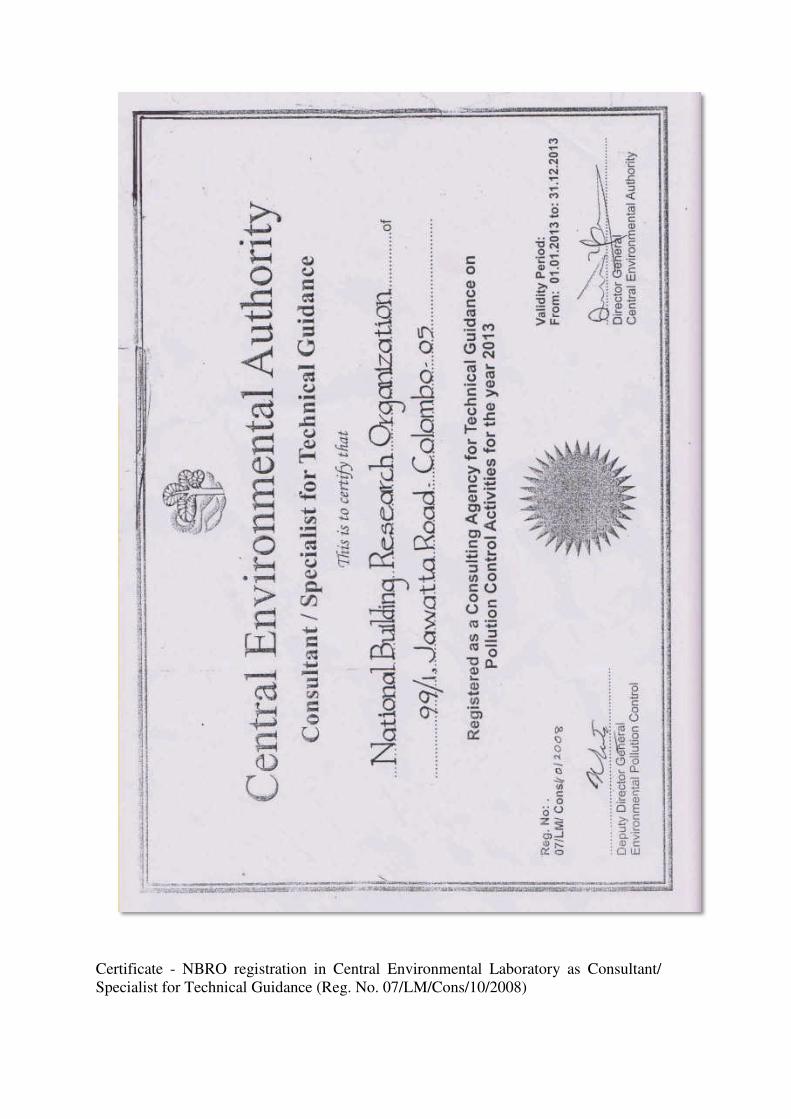
Certificate - NBRO registration in Central Environmental Laboratory as Consultant/
Specialist for Technical Guidance (Reg. No. 07/LM/Cons/10/2008)
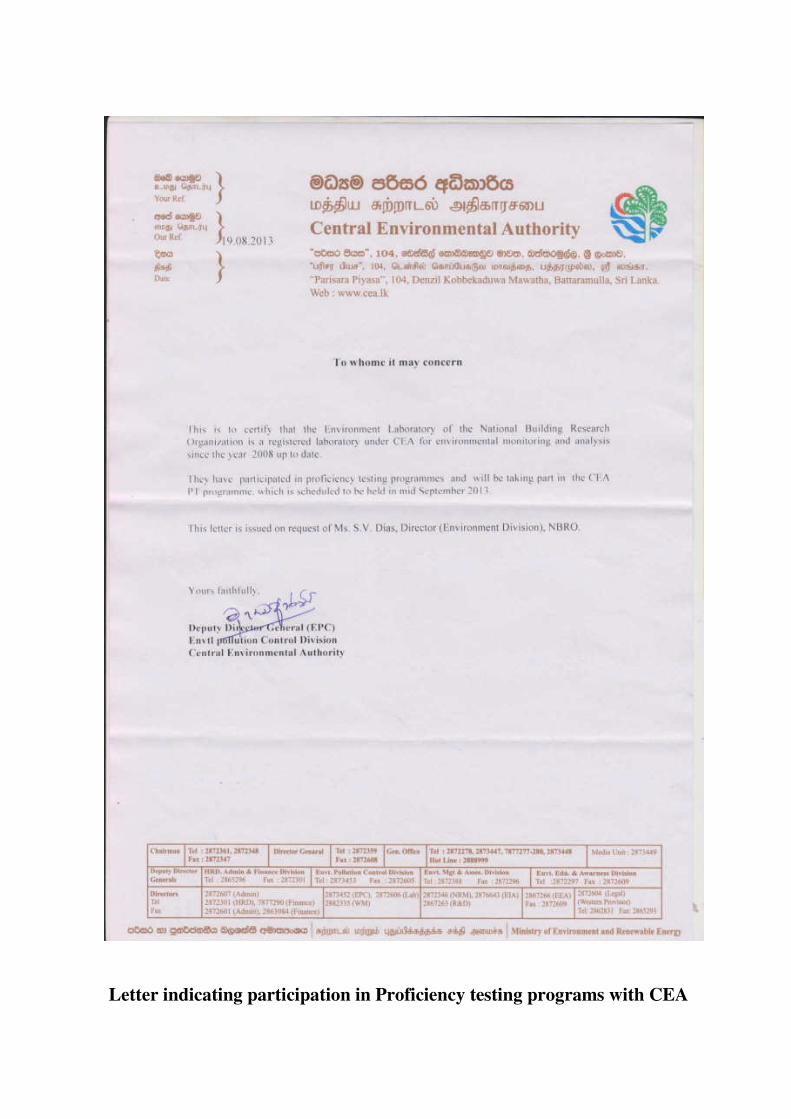
Letter indicating participation in Proficiency testing programs with CEA
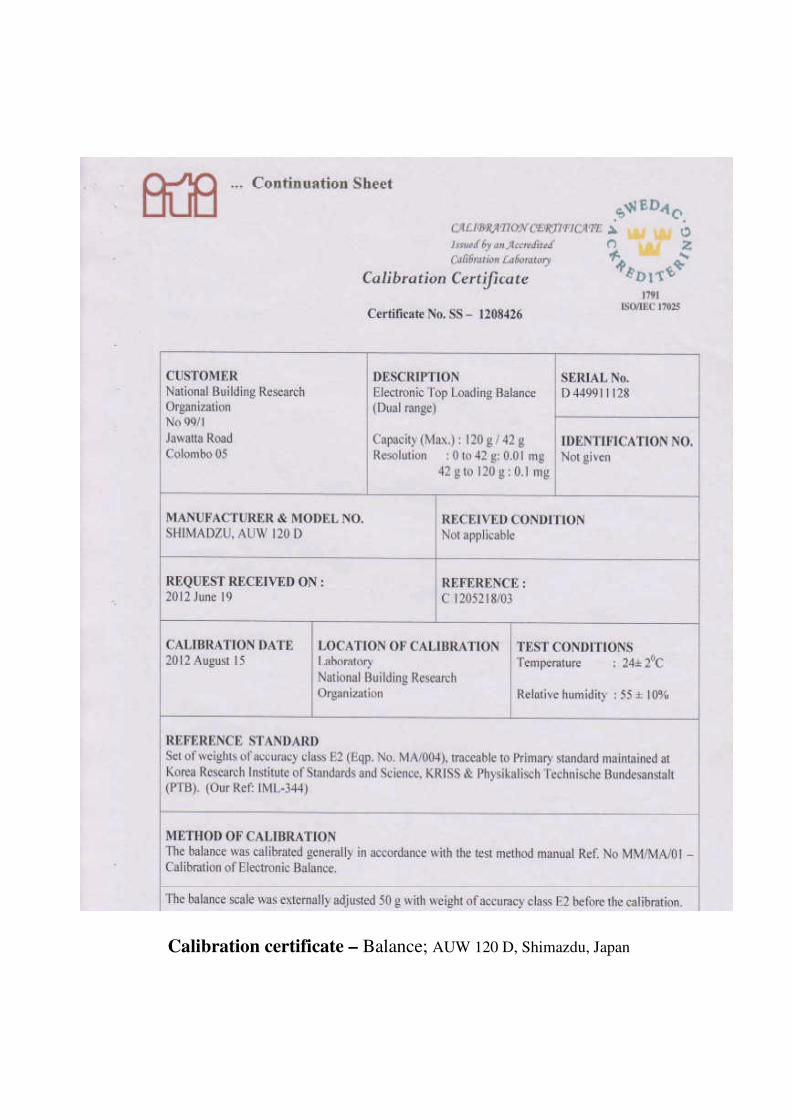
Calibration certificate – Balance; AUW 120 D, Shimazdu, Japan

Annex 9_____________________________________________________
Groundwater quality of the wells monitored during March and May

Sample
Reference
pH
Temperature
(0
C)
Conductivity
(µS/cm)
Dissolved Oxygen
(mg/L)
BOD at 200
C
BOD5, mg/L
Ammonia
(as N
mg/L)
Nitrate
( as N)
mg/L
Total Iron
(as Fe
mg/L)
Total phosphates
( as PO43-
, mg/L)
Total Suspended
Solids
mg/L
Fecal Coliforms
(E.coli /100ml)
Total Coliforms
(Coliform
Organisms /100ml)

Sample
Reference
pH
Temperature0 C
Conductivity
µS/cm
Dissolved
Oxygen
(mg/L)
BOD at 200
C
BOD5 mg/L
Ammonia
(as N, mg/L)
Nitrate
( as N, mg/L)
Total Iron
(as Fe, mg/L)
Total phosphates
( as PO43- ,
mg/L)
Total Suspended
Solids
mg/L
Fecal Coliforms
(E.coli /100ml)
Total Coliforms
/00ml
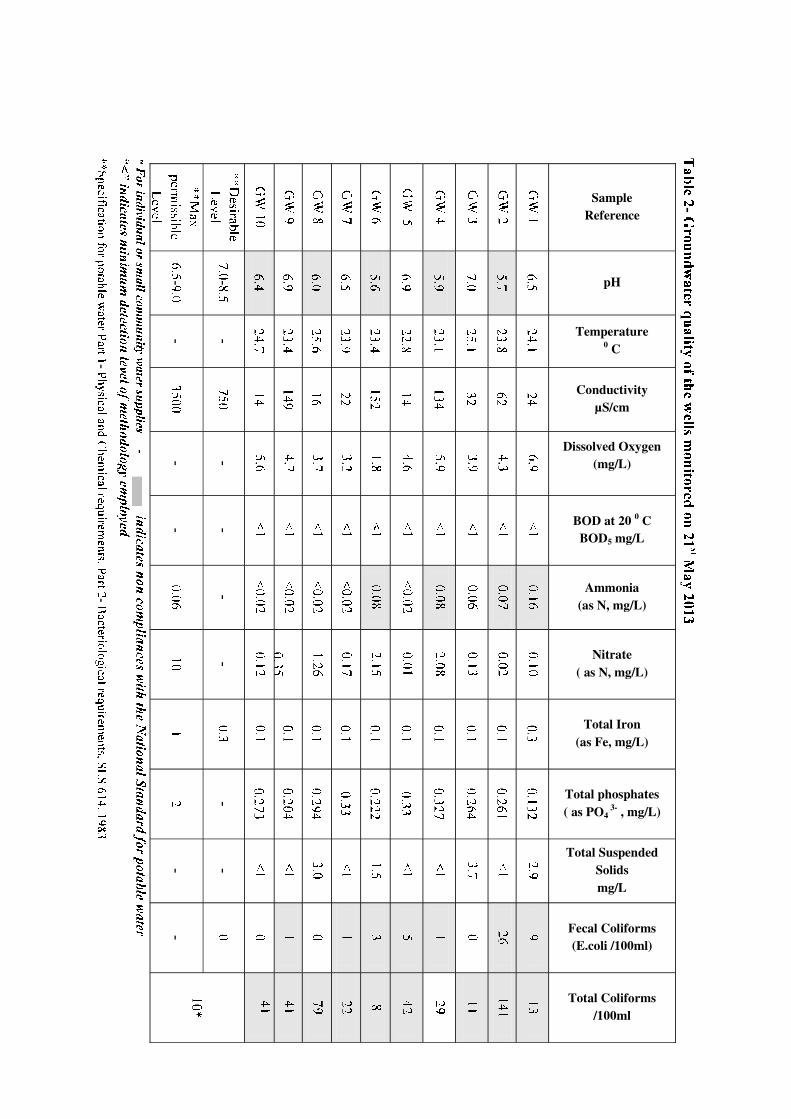
Sample
Reference
pH
Temperature0
C
Conductivity
µS/cm
Dissolved Oxygen
(mg/L)
BOD at 200
C
BOD5 mg/L
Ammonia
(as N, mg/L)
Nitrate
( as N, mg/L)
Total Iron
(as Fe, mg/L)
Total phosphates
( as PO43-
, mg/L)
Total Suspended
Solids
mg/L
Fecal Coliforms
(E.coli /100ml)
Total Coliforms
/100ml
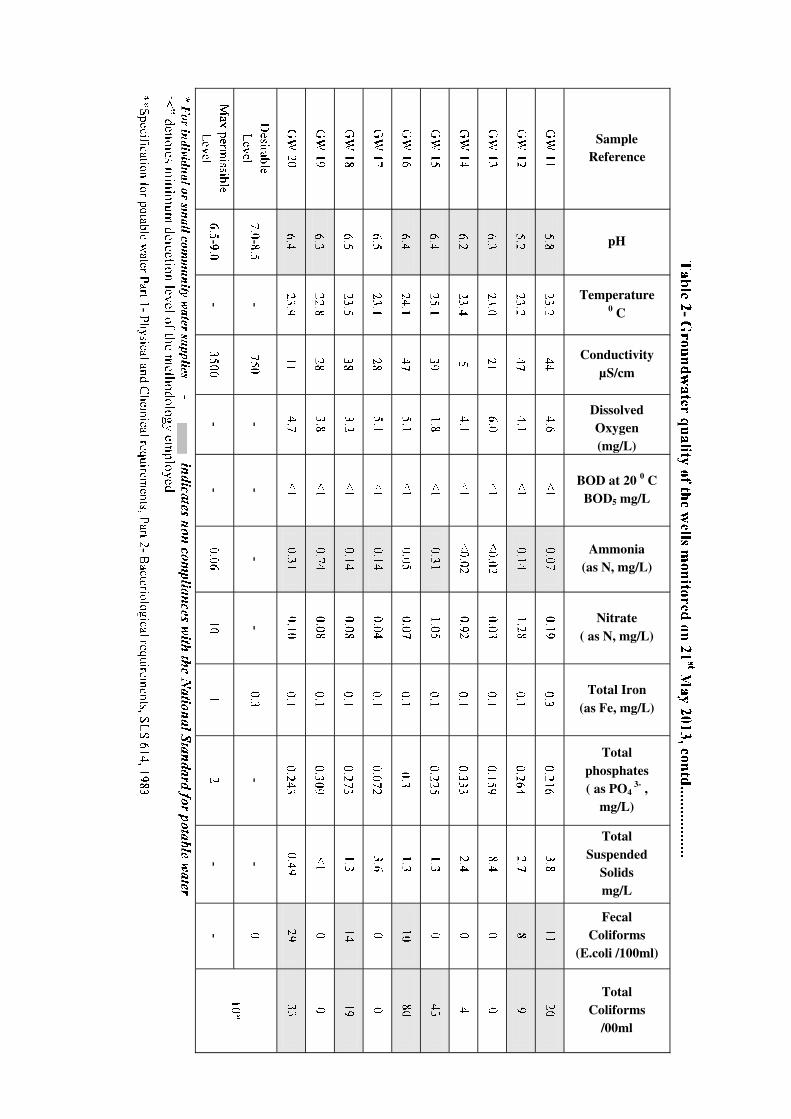
Sample
Reference
pH
Temperature0
C
Conductivity
µS/cm
Dissolved
Oxygen
(mg/L)
BOD at 200
C
BOD5 mg/L
Ammonia
(as N, mg/L)
Nitrate
( as N, mg/L)
Total Iron
(as Fe, mg/L)
Total
phosphates
( as PO43-
,
mg/L)
Total
Suspended
Solids
mg/L
Fecal
Coliforms
(E.coli /100ml)
Total
Coliforms
/00ml

Annex 10
_____________________________________________________________
Photographs of sampled wells

Photographs of sampled wells
GW 1- spring GW 2- Dug well
GW 3- Dug well GW 4- Dug well
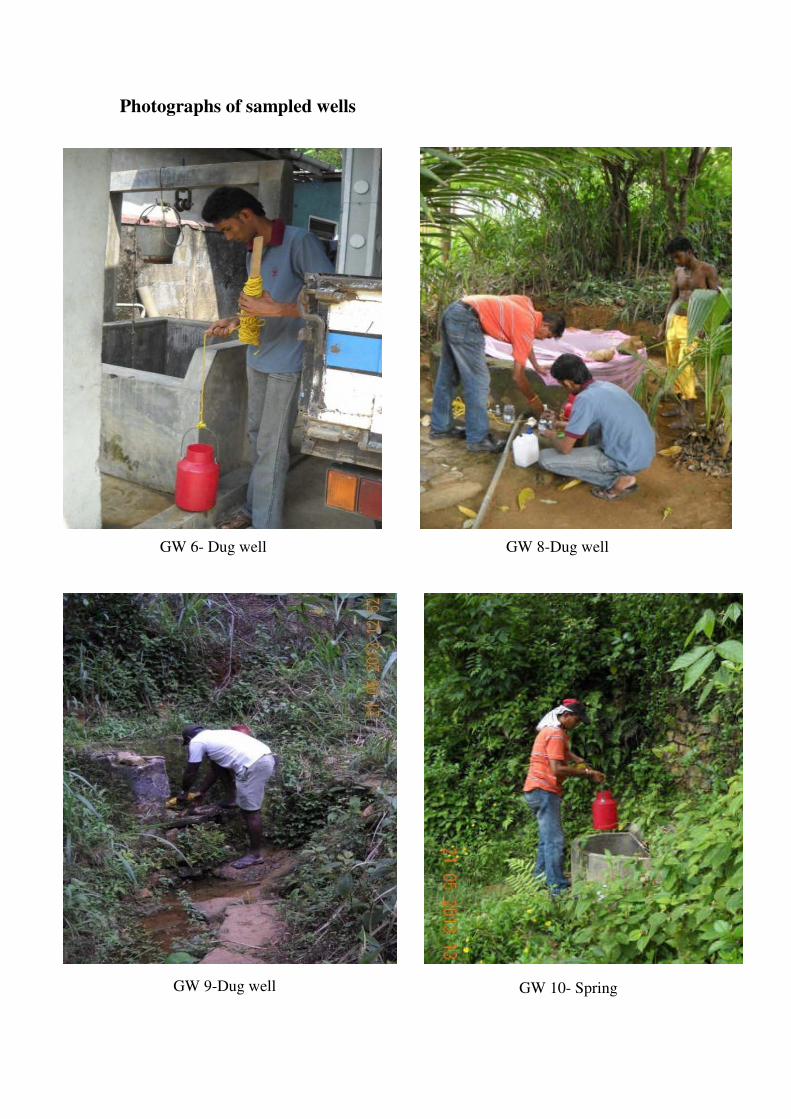
Photographs of sampled wells
GW 6- Dug well GW 8-Dug well
GW 9-Dug well GW 10- Spring

Photographs of sampled wells
GW 11-Dug well GW 13- Dug well
GW 16-Dug wellGW 14-Dug well

ADDITIONAL STUDIES ON NATURAL ENVIRONMENT
FOR REVIEW OF FEASIBILITY STUDY AND
PREPARATION OF DETAILED DESIGN AND BIDDING
DOCUMENTS
MORAGOLLA HYDROPOWER PROJECT, SRI LANKA
Updated Land use Map
Prepared by
The National Building Research Organization
Prepared for
NIPPON KOEI Co Ltd - Moragolla Hydropower Project
July 2013
↵←·±″↵× ⇒↔·×¼·″≠ ∈≈↑≈↵→÷ ∇→≠↵″·¦↵←·±″·″·↑←→♣ ±≡ ⇐·↑↵↑←≈→ ↵″↵≠≈≥≈″←
⟩ √↵♥↵←←≈ ∈±↵¼ ⇑±×±≥± ð ⊆→· ↵″∝↵


Moragolla Hydropower Project
Study of the Rationale and Suitability of the Proposed Environmental Flow
November 2013
Contents
1. Introduction 3

2. Approach 4
3. Results 5
3.1. Historical Precedents 5
3.2. Methods used in e flow assessment (EFA) 7
3.3. Application of Environmental Flow Assessment formulae for Moragolla HPP 9
3.4. Ecological Sensitivity of the study area 11
3.5. Impact on downstream hydrology and water levels in the Mahaweli Ganga
due to power plant operations. 12
4. Discussion 20
5. Conclusion and Recommendations 20
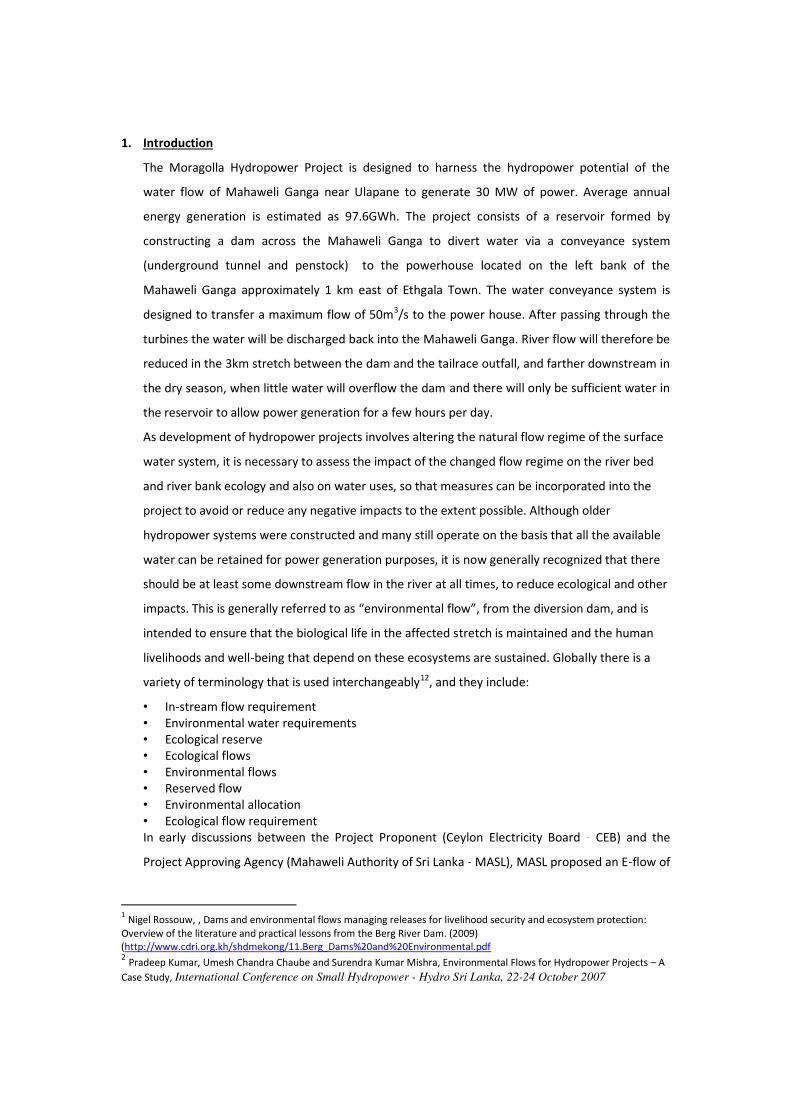
1. Introduction
The Moragolla Hydropower Project is designed to harness the hydropower potential of the
water flow of Mahaweli Ganga near Ulapane to generate 30 MW of power. Average annual
energy generation is estimated as 97.6GWh. The project consists of a reservoir formed by
constructing a dam across the Mahaweli Ganga to divert water via a conveyance system
(underground tunnel and penstock) to the powerhouse located on the left bank of the
Mahaweli Ganga approximately 1 km east of Ethgala Town. The water conveyance system is
designed to transfer a maximum flow of 50m3/s to the power house. After passing through the
turbines the water will be discharged back into the Mahaweli Ganga. River flow will therefore be
reduced in the 3km stretch between the dam and the tailrace outfall, and farther downstream in
the dry season, when little water will overflow the dam and there will only be sufficient water in
the reservoir to allow power generation for a few hours per day.
As development of hydropower projects involves altering the natural flow regime of the surface
water system, it is necessary to assess the impact of the changed flow regime on the river bed
and river bank ecology and also on water uses, so that measures can be incorporated into the
project to avoid or reduce any negative impacts to the extent possible. Although older
hydropower systems were constructed and many still operate on the basis that all the available
water can be retained for power generation purposes, it is now generally recognized that there
should be at least some downstream flow in the river at all times, to reduce ecological and other
impacts. This is generally referred to as さWミ┗キヴラミマWミデ;ノ aノラ┘ざが from the diversion dam, and is
intended to ensure that the biological life in the affected stretch is maintained and the human
livelihoods and well being that depend on these ecosystems are sustained. Globally there is a
variety of terminology that is used interchangeably12, and they include:
• In stream flow requirement
• Environmental water requirements
• Ecological reserve
• Ecological flows
• Environmental flows
• Reserved flow
• Environmental allocation
• Ecological flow requirement
In early discussions between the Project Proponent (Ceylon Electricity Board CEB) and the
Project Approving Agency (Mahaweli Authority of Sri Lanka MASL), MASL proposed an E flow of
1Nigel Rossouw, , Dams and environmental flows managing releases for livelihood security and ecosystem protection:
Overview of the literature and practical lessons from the Berg River Dam. (2009)
(http://www.cdri.org.kh/shdmekong/11.Berg_Dams%20and%20Environmental.pdf2Pradeep Kumar, Umesh Chandra Chaube and Surendra Kumar Mishra, Environmental Flows for Hydropower Projects に A
Case Study, International Conference on Small Hydropower - Hydro Sri Lanka, 22-24 October 2007

4 m3/s. However CEB advised that a rate in excess of 1.5 m
3/s would render the project
financially non viable, so this was agreed as the proposed E flow.
The Environmental Impact Assessment (EIA) report3of the project, suggests that an E flow of 1.5
m3/s is sufficient for present uses by the Dunhinda Irrigation Canal (0.28 m
3/s) and the Crysbro
Broiler Plant (0.01 m3/s) and to maintain flora, fauna and biodiversity in the 3 km stretch of river
between the dam and the tailrace outfall, which is the area in which flows will be reduced most
significantly. There was however no clear explanation of the reasons for this conclusion
regarding ecology and biodiversity, and no consideration of potential impacts farther
downstream. Hence as part of the FS review, the consultants examined the appropriateness of
the proposed environmental flow and the results are presented in this report.
2. Approach
This analysis draws on a variety of sources of information as follows:
a) Information in consultancy reports and other available documents detailing the flow regimes
and environmental flows adopted in other large hydropower schemes in Sri Lanka and
elsewhere in South Asia;
b) Information from the design team hydrologists on the proposed downstream flow regime
for this project during operation, and the existing flow regime in the river, showing in each
case the seasonal variations;
c) Information from additional aquatic ecology studies4carried out during March に July, 2013
on the distribution, extent and importance of the aquatic habitats in the 3 km of river
downstream of the proposed dam site and in a 30 km downstream length, which also may
receive reduced flows during non operation hours of the power plant.
d) Published information on the topic of environmental flows, their methods of calculation, and
the degree of success in maintaining biodiversity under altered flow regimes.
e) Information obtained from the EIA consultant (Central Engineering Consultancy Bureau) and
the client (CEB) regarding the background and rationale for the present proposal of 1.5 m3/s
(which is 41% of the seasonal minimum natural flow (Q95) in the Mahaweli Ganga に EIA
report Table 3.6 (d)).
3Ceylon Electricity Board (November 2012): Moragolla Hydropower Project, Feasibility Study, Final Report: Volume 3
Environmental Impact Assessment (Central Engineering Consultancy Bureau, Sri Lanka and Al Habshi Consultants Office,
Kuwait).4Additional studies on natural environment carried out for review of feasibility study and preparation of detailed design
and bidding documents: Report No 2; Aquatic ecology in the Mahaweli Ganga, Prepared by the National Building Research
Organization, July 2013

3. Results
While in principle the concept of environmental flows is now generally accepted uniformly,
the methodologies for establishing the levels of environmental flows vary considerably
amongst experts, environmental agencies or countries. In Sri Lanka, there is no specific
legislation, ruling or instruction from relevant statutory bodies or regulatory agencies to
establish a specific framework or methodology for determining environmental flow.
Consequently, in development of hydropower projects, where the level of environmental
flows has to be established, consultants rely mainly on existing precedents or use their own
experience and understanding to propose such flow requirements
3.1. Historical Precedents
Flow regimes and environmental flows adopted in large hydropower projects in Sri Lanka
and some other South Asian countries are presented in the table below.
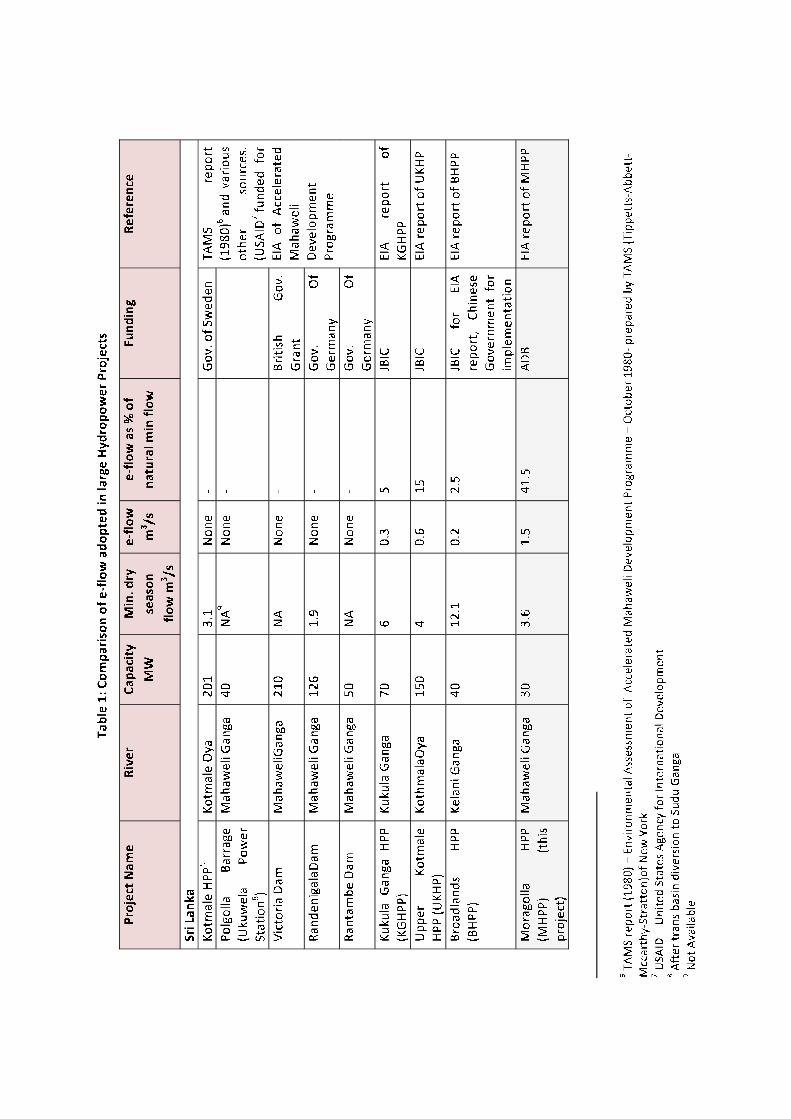
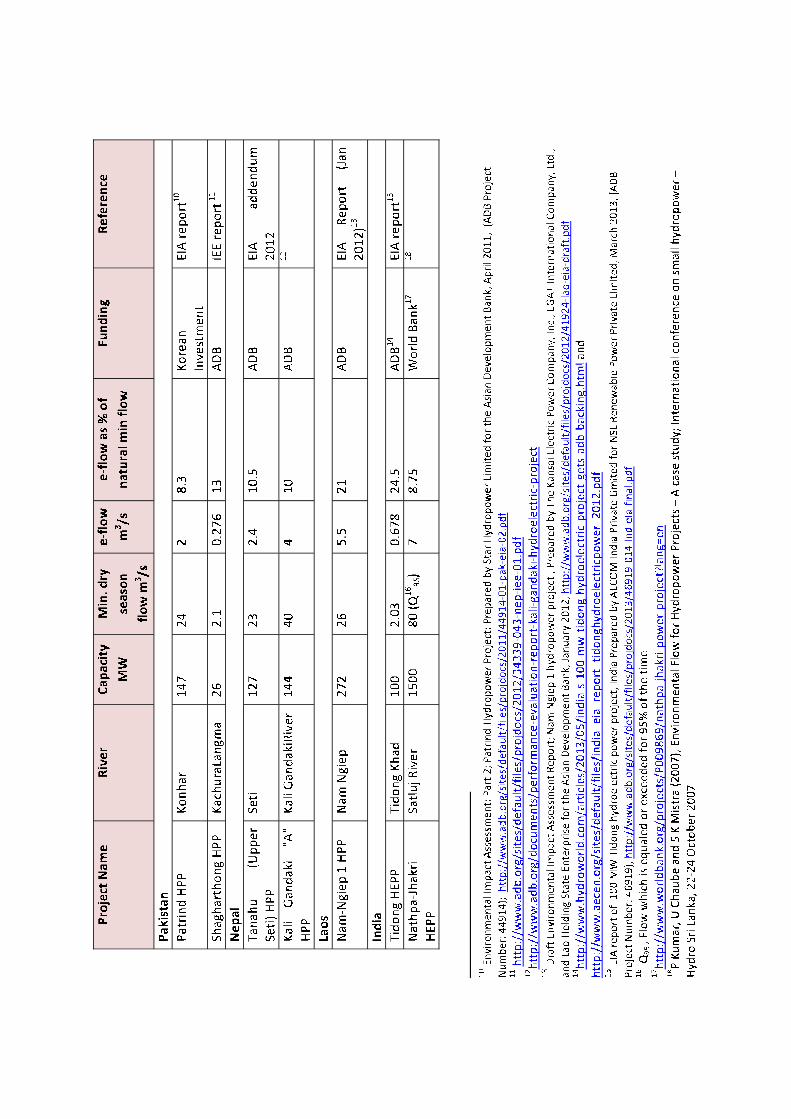
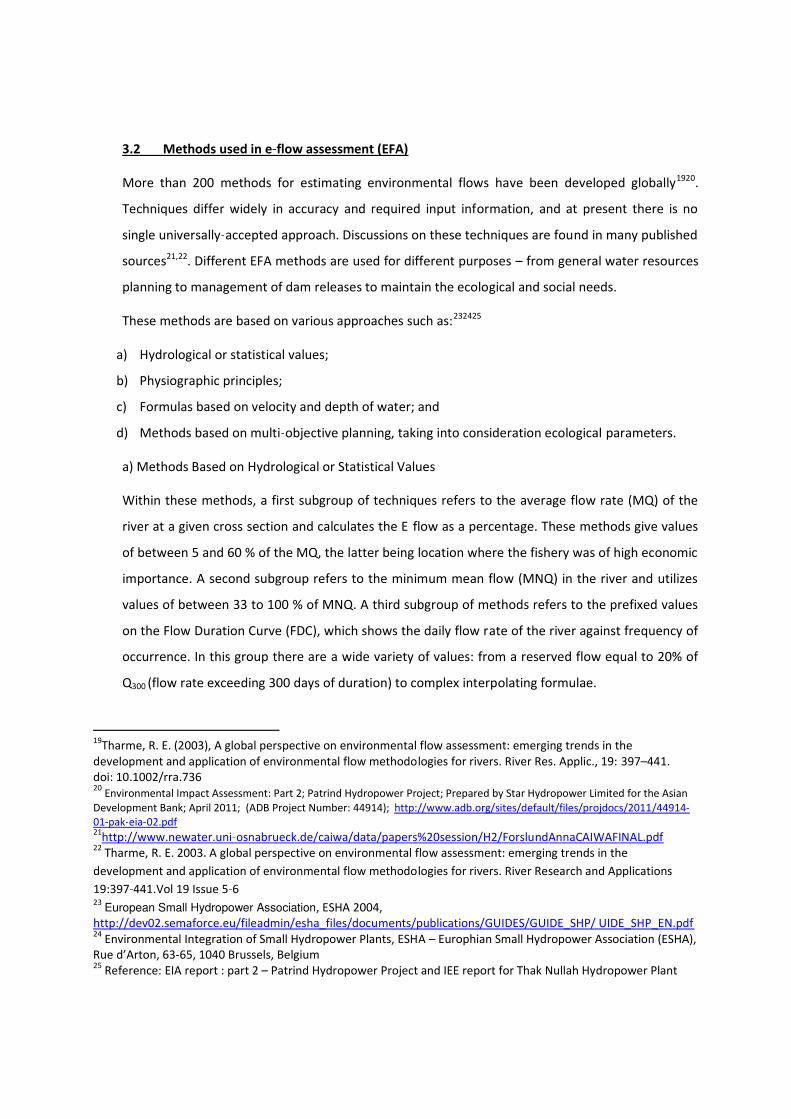
3.2 Methods used in e flow assessment (EFA)
More than 200 methods for estimating environmental flows have been developed globally1920
.
Techniques differ widely in accuracy and required input information, and at present there is no
single universally accepted approach. Discussions on these techniques are found in many published
sources21,22
. Different EFA methods are used for different purposes に from general water resources
planning to management of dam releases to maintain the ecological and social needs.
These methods are based on various approaches such as:232425
a) Hydrological or statistical values;
b) Physiographic principles;
c) Formulas based on velocity and depth of water; and
d) Methods based on multi objective planning, taking into consideration ecological parameters.
a) Methods Based on Hydrological or Statistical Values
Within these methods, a first subgroup of techniques refers to the average flow rate (MQ) of the
river at a given cross section and calculates the E flow as a percentage. These methods give values
of between 5 and 60 % of the MQ, the latter being location where the fishery was of high economic
importance. A second subgroup refers to the minimum mean flow (MNQ) in the river and utilizes
values of between 33 to 100 % of MNQ. A third subgroup of methods refers to the prefixed values
on the Flow Duration Curve (FDC), which shows the daily flow rate of the river against frequency of
occurrence. In this group there are a wide variety of values: from a reserved flow equal to 20% of
Q300 (flow rate exceeding 300 days of duration) to complex interpolating formulae.
19Tharme, R. E. (2003), A global perspective on environmental flow assessment: emerging trends in the
development and application of environmental flow methodologies for rivers. River Res. Applic., 19: ンΓΑにヴヴヱくdoi: 10.1002/rra.73620Environmental Impact Assessment: Part 2; Patrind Hydropower Project; Prepared by Star Hydropower Limited for the Asian
Development Bank; April 2011; (ADB Project Number: 44914); http://www.adb.org/sites/default/files/projdocs/2011/44914
01 pak eia 02.pdf21http://www.newater.uni osnabrueck.de/caiwa/data/papers%20session/H2/ForslundAnnaCAIWAFINAL.pdf
22Tharme, R. E. 2003. A global perspective on environmental flow assessment: emerging trends in the
development and application of environmental flow methodologies for rivers. River Research and Applications
19:397 441.Vol 19 Issue 5 623
European Small Hydropower Association, ESHA 2004,
http://dev02.semaforce.eu/fileadmin/esha_files/documents/publications/GUIDES/GUIDE_SHP/ UIDE_SHP_EN.pdf24Environmental Integration of Small Hydropower Plants, ESHA に Europhian Small Hydropower Association (ESHA),
Rue SげAヴデラミが 63 65, 1040 Brussels, Belgium25Reference: EIA report : part 2 に Patrind Hydropower Project and IEE report for Thak Nullah Hydropower Plant

The results obtained from these methods may not precise but they can be obtained in a short time
and this method is normally considered acceptable for use in the planning stage of a water related
projects. The mostly widely used approach is the Tennant (or modified Tennant) method (see
below).
b) Methods Based on Physiographic Principles
These methods basically refer to a prefixed specific flow rate expressed as l/s/km2of catchment
area. Values can vary from 1.6 to 9 or more l/s/km2. The latter applies to rivers having excellent
abundance of fish . These methods are easily applicable presuming there is good basic data.
However no hydraulic parameters are considered and neither the effect of tributaries nor the
length of the diversion reach is taken into account.
c) Formulae Based on Velocity and Depth of Water
In this group of methods there is also a wide range of variation. For example one study26suggests
that water velocity in the case of reserved flow may not fall below a prefixed threshold value of
0.3 0.5 m/s and the minimum depth of water must be greater than a prefixed value of 10 cm.
Another suggests 1.2 に 2.4 m/s and 12 24 cm water depth; and so on.
The great advantage of these formulae is that the shape of the river bed profile is included in the
calculation and there is no need for hydrological data. Nevertheless diversion length and tributaries
are again not considered.
e) Methods Based on Multi Objective Planning Taking into Consideration Ecological Parameters.
These methods are generally very complex in their application and require considerable expertise
to be used successfully. They require site specific flow observations and take into account
hydrological, hydraulic, ecological, and meteorological data, embracing both ecological and
economic parameters. Methods are expensive in data collection and mathematical computing, and
are suitable only for particular types of rivers. Their transferability is doubtful27.
26http://dev02.semaforce.eu/fileadmin/esha_files/documents/publications/publications/reserved_flow_
methods_of_Calculation.pdf27Environmental Integration of Small Hydropower Plants, ESHA に European Small Hydropower Association. Rue
SげAヴノラミが 63 65, 1040 Brussels
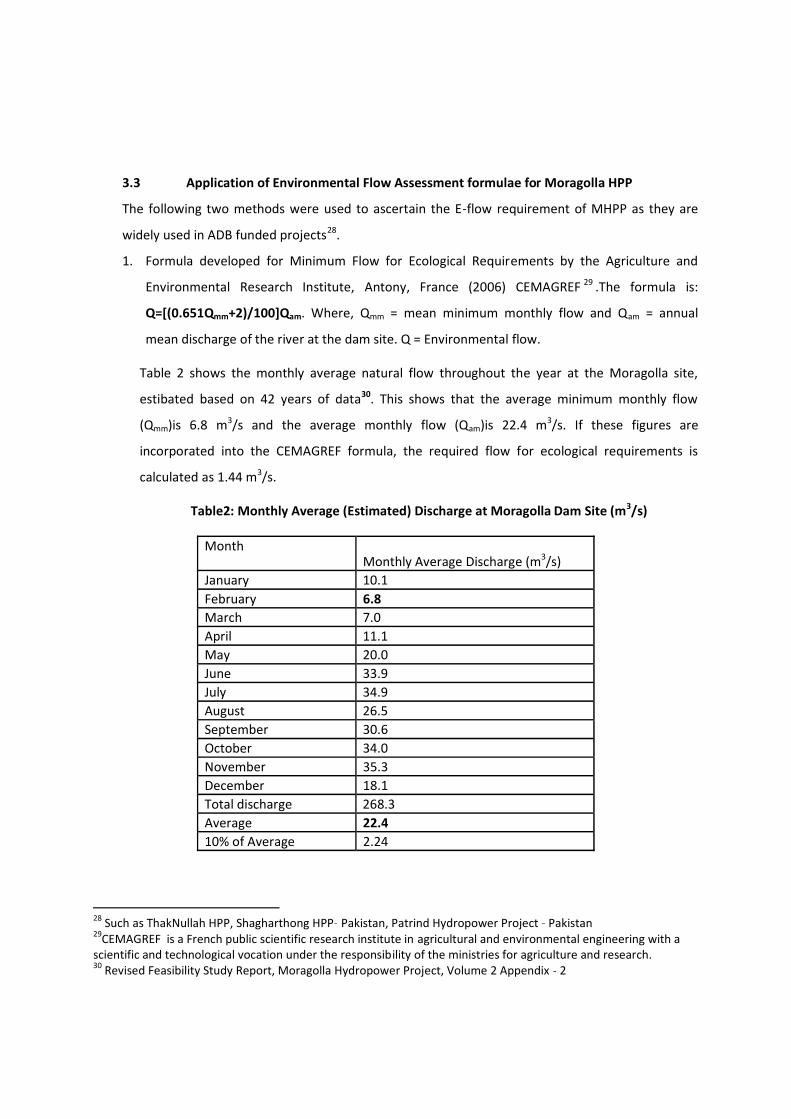
3.3 Application of Environmental Flow Assessment formulae for Moragolla HPP
The following two methods were used to ascertain the E flow requirement of MHPP as they are
widely used in ADB funded projects28.
1. Formula developed for Minimum Flow for Ecological Requirements by the Agriculture and
Environmental Research Institute, Antony, France (2006) CEMAGREF29.The formula is:
Q=[(0.651Qmm+2)/100]Qam. Where, Qmm = mean minimum monthly flow and Qam = annual
mean discharge of the river at the dam site. Q = Environmental flow.
Table 2 shows the monthly average natural flow throughout the year at the Moragolla site,
estibated based on 42 years of data30. This shows that the average minimum monthly flow
(Qmm)is 6.8 m3/s and the average monthly flow (Qam)is 22.4 m
3/s. If these figures are
incorporated into the CEMAGREF formula, the required flow for ecological requirements is
calculated as 1.44 m3/s.
Table2: Monthly Average (Estimated) Discharge at Moragolla Dam Site (m3/s)
MonthMonthly Average Discharge (m
3/s)
January 10.1
February 6.8
March 7.0
April 11.1
May 20.0
June 33.9
July 34.9
August 26.5
September 30.6
October 34.0
November 35.3
December 18.1
Total discharge 268.3
Average 22.4
10% of Average 2.24
28Such as ThakNullah HPP, Shagharthong HPP Pakistan, Patrind Hydropower Project Pakistan
29CEMAGREF is a French public scientific research institute in agricultural and environmental engineering with a
scientific and technological vocation under the responsibility of the ministries for agriculture and research.30Revised Feasibility Study Report, Moragolla Hydropower Project, Volume 2 Appendix 2
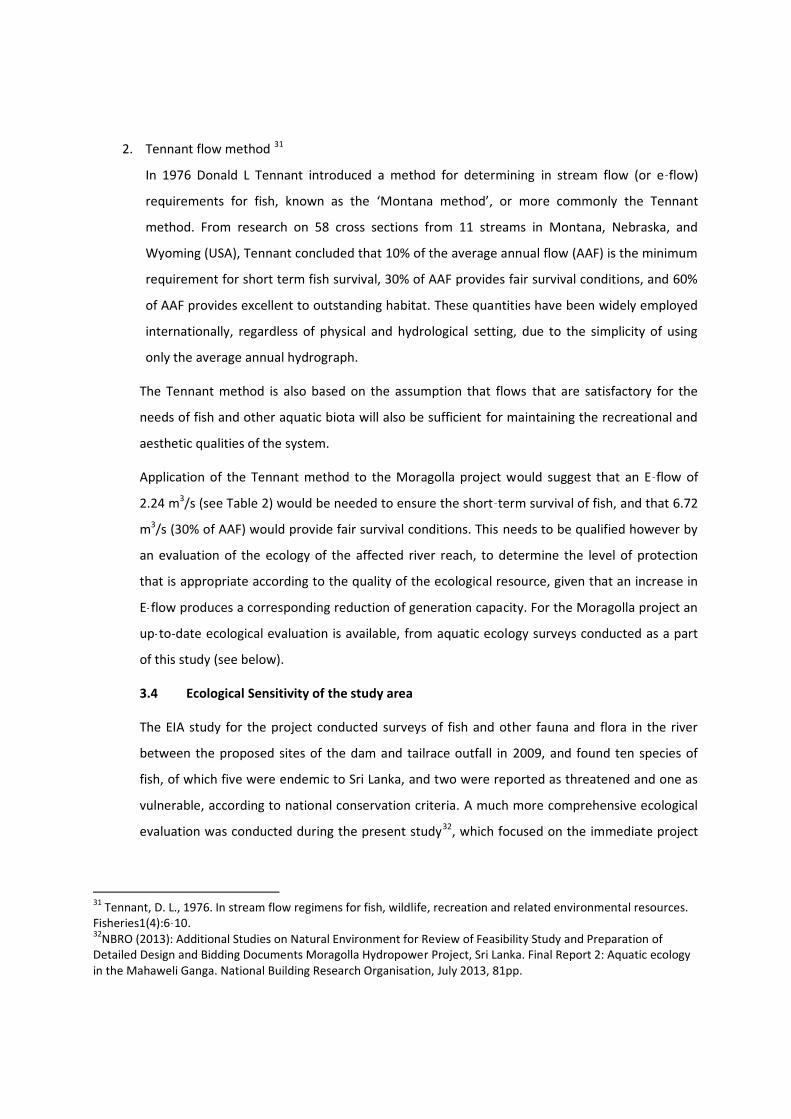
2. Tennant flow method31
In 1976 Donald L Tennant introduced a method for determining in stream flow (or e flow)
requirements for fish, known as the けMラミデ;ミ; マWデエラSげが or more commonly the Tennant
method. From research on 58 cross sections from 11 streams in Montana, Nebraska, and
Wyoming (USA), Tennant concluded that 10% of the average annual flow (AAF) is the minimum
requirement for short term fish survival, 30% of AAF provides fair survival conditions, and 60%
of AAF provides excellent to outstanding habitat. These quantities have been widely employed
internationally, regardless of physical and hydrological setting, due to the simplicity of using
only the average annual hydrograph.
The Tennant method is also based on the assumption that flows that are satisfactory for the
needs of fish and other aquatic biota will also be sufficient for maintaining the recreational and
aesthetic qualities of the system.
Application of the Tennant method to the Moragolla project would suggest that an E flow of
2.24 m3/s (see Table 2) would be needed to ensure the short term survival of fish, and that 6.72
m3/s (30% of AAF) would provide fair survival conditions. This needs to be qualified however by
an evaluation of the ecology of the affected river reach, to determine the level of protection
that is appropriate according to the quality of the ecological resource, given that an increase in
E flow produces a corresponding reduction of generation capacity. For the Moragolla project an
up to date ecological evaluation is available, from aquatic ecology surveys conducted as a part
of this study (see below).
3.4 Ecological Sensitivity of the study area
The EIA study for the project conducted surveys of fish and other fauna and flora in the river
between the proposed sites of the dam and tailrace outfall in 2009, and found ten species of
fish, of which five were endemic to Sri Lanka, and two were reported as threatened and one as
vulnerable, according to national conservation criteria. A much more comprehensive ecological
evaluation was conducted during the present study32, which focused on the immediate project
31Tennant, D. L., 1976. In stream flow regimens for fish, wildlife, recreation and related environmental resources.
Fisheries1(4):6 10.32NBRO (2013): Additional Studies on Natural Environment for Review of Feasibility Study and Preparation of
Detailed Design and Bidding Documents Moragolla Hydropower Project, Sri Lanka. Final Report 2: Aquatic ecology
in the Mahaweli Ganga. National Building Research Organisation, July 2013, 81pp.

area, but also investigated the ecology of the river up to 30 km downstream, some of which will
also be affected by reduced river flows.
The 2013 surveys found 49 fish species in the 30 km length (14 endemics), plus 3 indigenous
aquatic reptiles, 12 aquatic bird species and one semi aquatic indigenous mammal. There were
also 17 aquatic flowering plant species (7 rare and endemic), 20 dragonfly/damselfly species (7
endemic), and one endemic crab. In the area between the dam and tailrace there were 40
species of fish (including two that are endangered and two near threatened, according to the
IUCN Red Data List33), 3 aquatic reptile species, 7 aquatic birds and the semi aquatic mammal.
This is clearly an area with a quite diverse fish fauna; and because of the rarity and international
importance of some of the species, the project will implement a specific conservation program
to mitigate potential impacts on these and other species. This will involve habitat management
in the upper Mahaweli catchment to protect and enhance the fish populations as an offset
measure, along with translocation to mitigate additional construction related impacts.
The other ecological features of the area are not especially sensitive, as the river and adjacent
on land areas are already greatly affected by the activities of man, in particular farming and
power generation. None of the species and habitats recorded in the surveys are restricted only
to this river; and the habitats in the immediate project area are relatively barren, comprising
rock and boulders and with relatively few aquatic plants (four species).Impacts on fish will be
mitigated by the habitat management and translocation program, which will be planned and
conducted in cooperation with IUCN34. In the light of this and the limited sensitivity of the
remainder of the ecological resource, this is not considered to be an area that requires
additional protection by a relatively high rate of E flow. The lower rate as calculated by the
Tennant method or other formulae would therefore seem to be the most appropriate in this
case.
3.5 Impact on downstream hydrology and water levels in the Mahaweli Ganga due to power
plant operations.
Figure 1 shows the monthly variability in water release from the dam (environmental flow and
spill releases), indicating the minimum expected in the lean season (when accumulating storage
33http://www.iucnredlist.org/
34IUCN (2013): Moragolla Hydropower Project. Additional studies in the natural environment: Expert report on
mitigating the impacts of the Moragolla Hydropower Project on fish. International Union for Conservation of
Nature, Sri Lanka Country Office, August 2013, 59 pp (Draft).
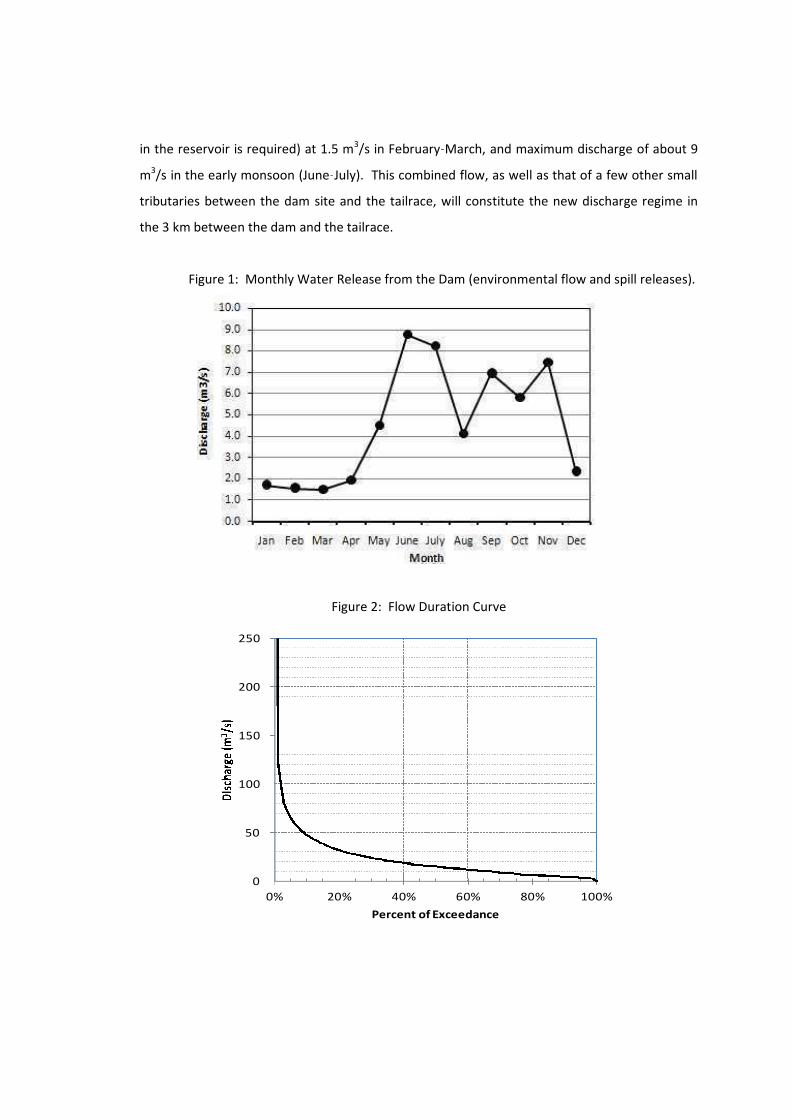
in the reservoir is required) at 1.5 m3/s in February March, and maximum discharge of about 9
m3/s in the early monsoon (June July). This combined flow, as well as that of a few other small
tributaries between the dam site and the tailrace, will constitute the new discharge regime in
the 3 km between the dam and the tailrace.
Figure 1: Monthly Water Release from the Dam (environmental flow and spill releases).
Figure 2: Flow Duration Curve
0
50
100
150
200
250
0% 20% 40% 60% 80% 100%
Percent of Exceedance

The combined effects of the Moragolla tailrace discharge, the environmental flow and spill
releases, and also the Kotmale tailrace discharge will create variability in both the discharge
rates and the water levels in the downstream section of the Mahaweli Ganga. However, this is
not so different from the current annual variability, which indicates a one order of magnitude
natural variability in discharge rates between dry and wet years, from 4 to about 66 m3/s (see
Figure 2 and Table 3). The combined effects of the Moragolla project and residual flow in the
Mahaweli Ganga (from the Atabage Oya and the Kotmale tailrace) on discharge rates and water
levels in the immediate downstream section of the Mahaweli Ganga are shown in Figures 3 6,
and discussed subsequently.
Table 3: Percentage exceedance of Mahaweli Ganga discharge (95% of the time, the discharge in
the river exceeds 3.6 m3/s).
Percent of Exceedance Discharge (m3/s)
95% 3.60
90% 4.46
85% 5.34
80% 6.28
75% 7.33
70% 8.99
65% 10.43
60% 11.91
55% 13.31
50% 14.80
45% 16.49
40% 18.76
35% 21.12
30% 23.74
25% 27.19
20% 31.99
15% 38.47
10% 47.97
5% 66.07
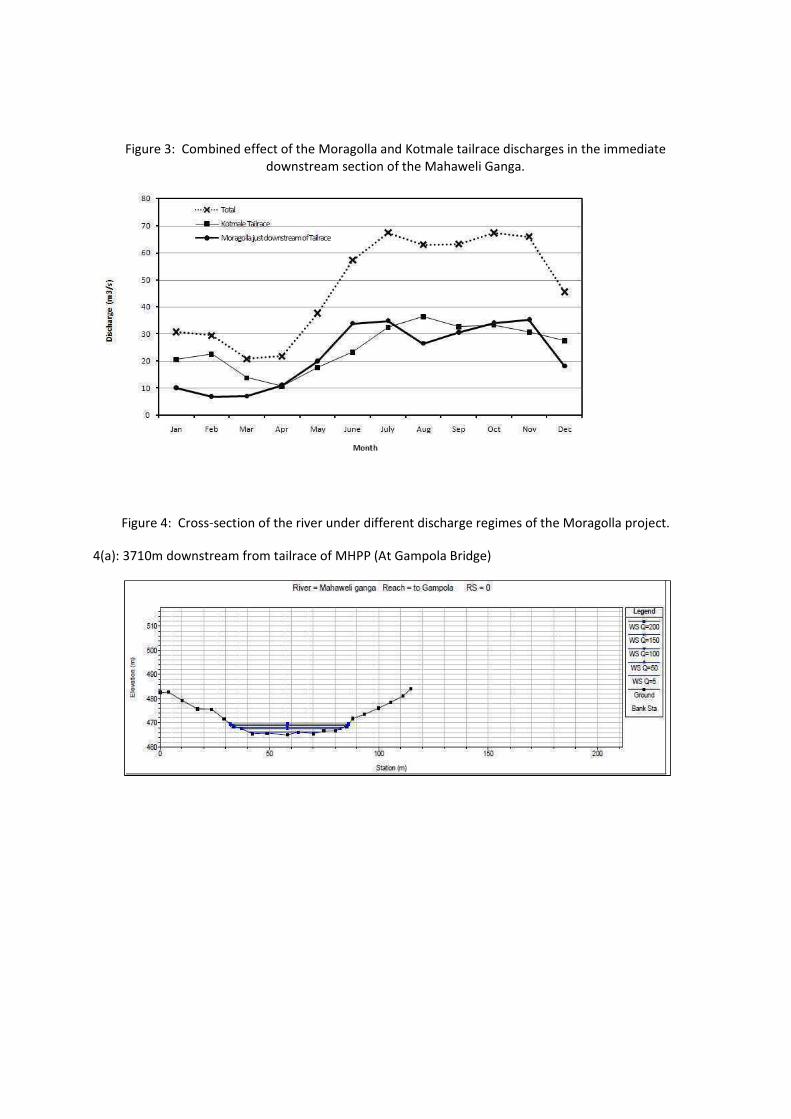
Figure 3: Combined effect of the Moragolla and Kotmale tailrace discharges in the immediate
downstream section of the Mahaweli Ganga.
Figure 4: Cross section of the river under different discharge regimes of the Moragolla project.
4(a): 3710m downstream from tailrace of MHPP (At Gampola Bridge)

4(b): 3260m downstream from tailrace of MHPP
4(c): 2660m downstream from tailrace of MHPP
4d): 2250m downstream from tailrace of MHPP
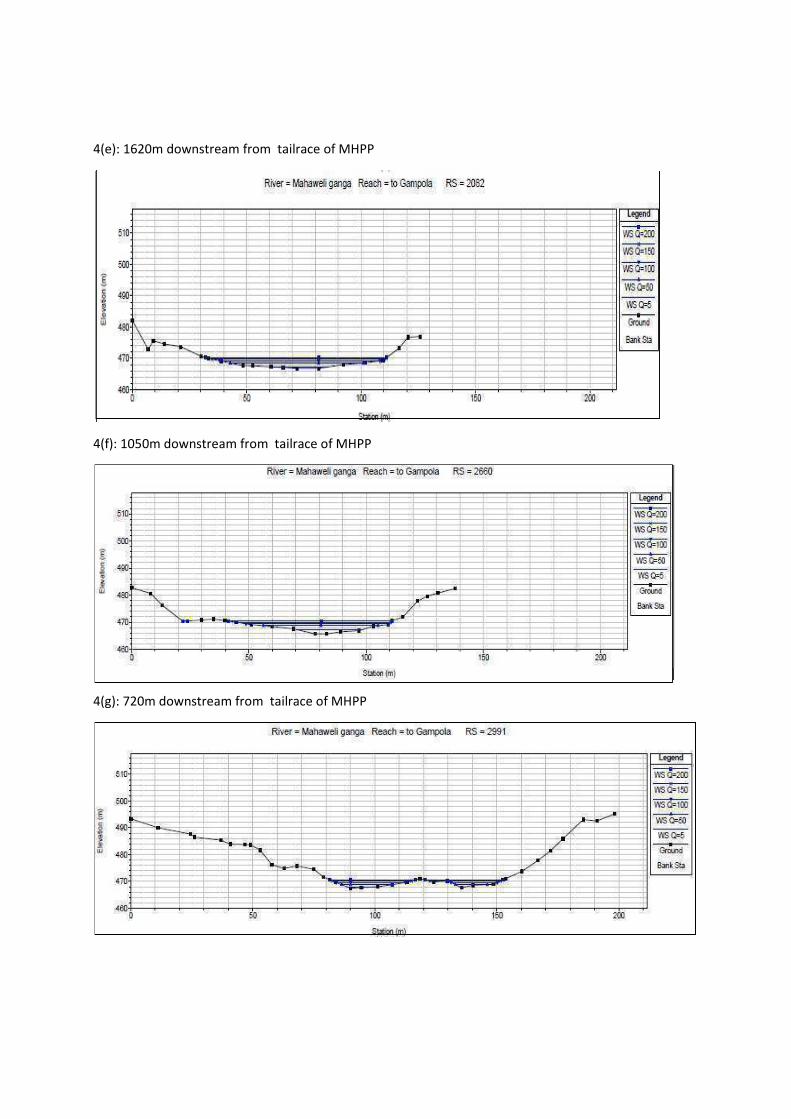
4(e): 1620m downstream from tailrace of MHPP
4(f): 1050m downstream from tailrace of MHPP
4(g): 720m downstream from tailrace of MHPP
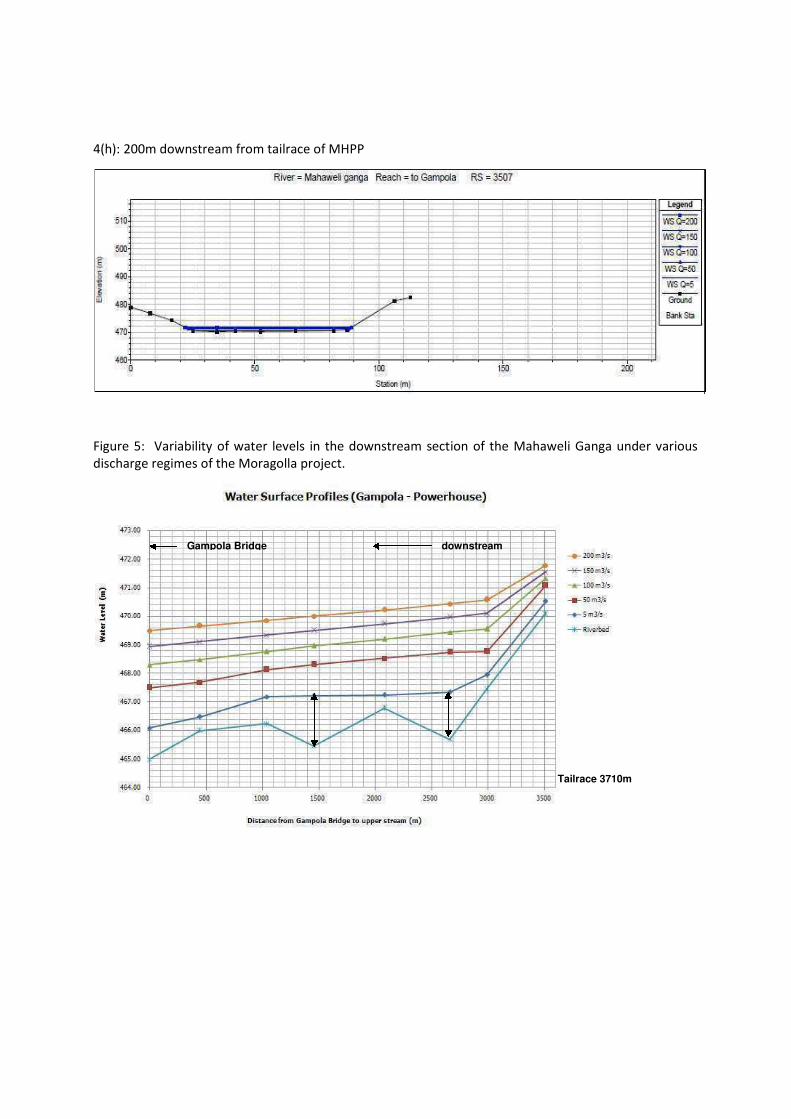
4(h): 200m downstream from tailrace of MHPP
Figure 5: Variability of water levels in the downstream section of the Mahaweli Ganga under various
discharge regimes of the Moragolla project.
Tailrace 3710m
downstreamGampola Bridge
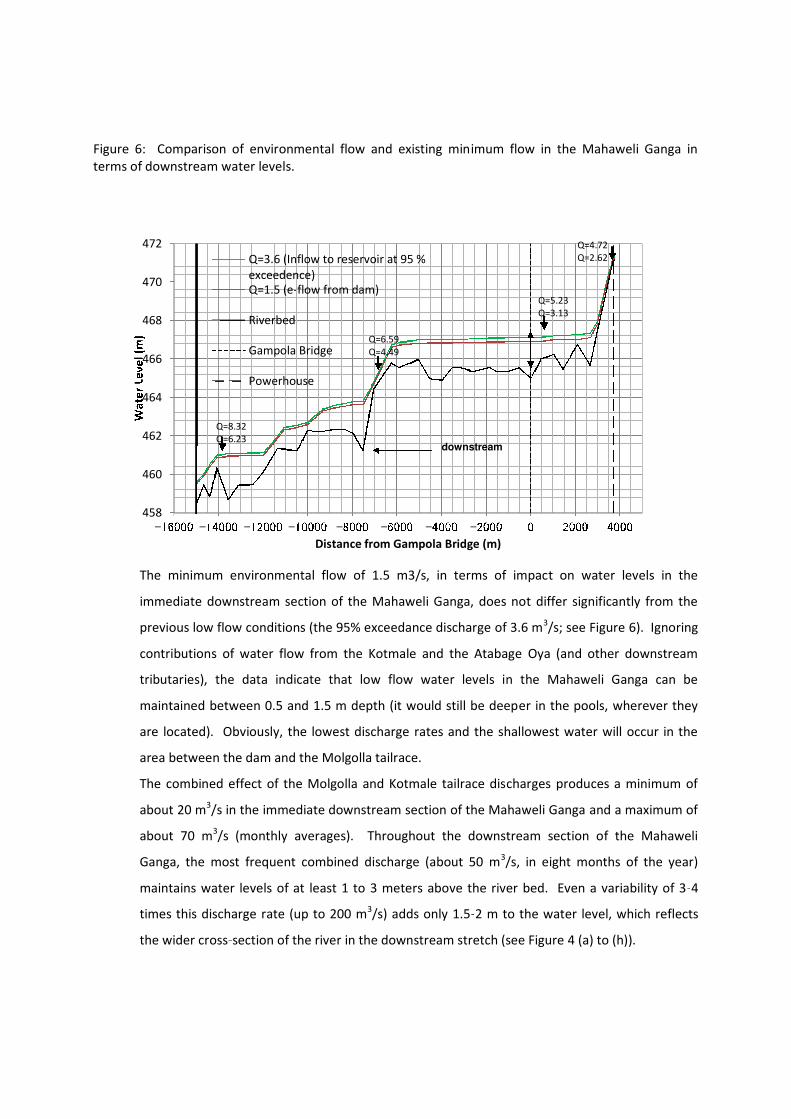
Figure 6: Comparison of environmental flow and existing minimum flow in the Mahaweli Ganga in
terms of downstream water levels.
The minimum environmental flow of 1.5 m3/s, in terms of impact on water levels in the
immediate downstream section of the Mahaweli Ganga, does not differ significantly from the
previous low flow conditions (the 95% exceedance discharge of 3.6 m3/s; see Figure 6). Ignoring
contributions of water flow from the Kotmale and the Atabage Oya (and other downstream
tributaries), the data indicate that low flow water levels in the Mahaweli Ganga can be
maintained between 0.5 and 1.5 m depth (it would still be deeper in the pools, wherever they
are located). Obviously, the lowest discharge rates and the shallowest water will occur in the
area between the dam and the Molgolla tailrace.
The combined effect of the Molgolla and Kotmale tailrace discharges produces a minimum of
about 20 m3/s in the immediate downstream section of the Mahaweli Ganga and a maximum of
about 70 m3/s (monthly averages). Throughout the downstream section of the Mahaweli
Ganga, the most frequent combined discharge (about 50 m3/s, in eight months of the year)
maintains water levels of at least 1 to 3 meters above the river bed. Even a variability of 3 4
times this discharge rate (up to 200 m3/s) adds only 1.5 2 m to the water level, which reflects
the wider cross section of the river in the downstream stretch (see Figure 4 (a) to (h)).
458
460
462
464
466
468
470
472
Distance from Gampola Bridge (m)
Q=3.6 (Inflow to reservoir at 95 %
exceedence)
Q=1.5 (e flow from dam)
Riverbed
Gampola Bridge
Powerhouse
Q=6.59
Q=4.49
Q=5.23
Q=3.13
Q=4.72
Q=2.62
Q=8.32
Q=6.23downstream
4. Discussion
Table 1 shows that there are no E flow releases from older hydropower schemes in Sri Lanka (and
elsewhere), including several located on the Mahaweli Ganga. However most of the more recent
schemes do include some provision for continuous downstream releases, and Table 1 shows that
for the larger dams in Sri Lanka and elsewhere in Asia, E flow ranges from 2.5% to 25% of the
minimum dry season rate. The proposed release of 1.5 m3/s from the Moragolla scheme (41% of
the minimum dry season flow) therefore compares favourably with other schemes and is the
highest of the sixteen examples given.
Of the very many methods that have been used elsewhere to calculate the appropriate level of E
flow, two of the more common approaches were used to examine the validity of the proposed
Moragolla rate. According to the CEMAGREF Formula, a flow of 1.44 m3/s would be required to
maintain the ecology of the downstream area; and based on the Tennant method the required
release to allow the short term survival of fish is 2.24 m3/s. Ecological studies conducted for this
project suggest that the area that will be most affected by changes in river flow is not especially
sensitive, and providing impacts on the fish fauna are mitigated (which will be done as outlined
above) then there is no justification for adopting a relatively high rate of E flow (such as provided
by the Tennant 30% calculation for example).
If the Moragolla project was not realized, CEB would have to forgo 97.6 GWh of renewable energy
annually, which is sufficient to supply over 100,00035households of average consumption. In the
absence of a project of this nature, the forgone amount of energy will have to be fulfilled by other
generation methods which would probably involve thermal power options, which not only absorb
foreign currency but also cause greater environmental impacts than hydropower. Both thermal
alternatives of oil fired and coal fired generation would result in long term emissions of Carbon
Dioxide(CO2), Oxides of Nitrogen (NOx), Oxides of Sulphur (SOx) and particulate matter.
5. Conclusion and Recommendations
The e flow proposed for the Moragolla HPP is significantly greater than the e flow releases of
other hydropower plants in Sri Lanka and many other Asian countries, when expressed as a
35Total consumers in domestic sector = 4,391,445 (Statistical Digest 2012 published by CEB )
Total annual energy consumption by the domestic sector = 3,522GWh (Statistical Digest 2012 published by CEB )
Annual per capita energy consumption = 3,522,000,000/4.391,445 kWh = 802.5kWh
Number of households (Consumers) which could be supplied with energy using 97.6GWh =
97,600,000/802=121,697
percentage of the minimum dry season flow. E flow calculated using two widely applied
methods suggests that the flow required to sustain minimal ecological resources is between
1.44 and 2.24 m3/s, which confirms the broad acceptability of the proposed rate of 1.5 m
3/s.
Ecological studies for this project provided no justification for adopting a higher rate on
ecological grounds, especially as impacts on fish will be mitigated by other action recommended
by IUCN.
The environmental flow of 1.5 m3/s is widely quoted in the EIA report of the MHPP, which
assesses the impacts of the changes in river flow in detail. This EIA report was opened for public
comments in April 2013 and no comments were received. Environmental approval for the
Project was granted by the Project Approving Agency (MASL) on 13 August 2013, subject to
several terms and conditions, including release of 1.5m3/s as environmental flow through an
unregulated opening to maintain the ecology and to fulfil the requirements of the downstream
users.
The proposed E flow of 1.5 m3/s has therefore been subject to a great deal of scrutiny, both
expert and public, and no objections have been raised. It has also been subject to considerable
investigation, during the original Feasibility Study, and in the present FS Review and Detailed
Design study, and no case for changing the E flow has been made. The additional investigation
presented in this report examines further evidence, including widely used E flow calculation
methods and current ecological studies in the project area, and also finds no case for amending
the proposed rate. The conclusion is therefore that the proposed E flow of 1.5 m3/s is
acceptable and is in line with the limited ecological sensitivity of the project area, providing the
impacts on fish are mitigated by the habitat management and translocation measures
recommended by IUCN.