State-of-the-Art Review of Railway Track Resilience ... - MDPI
18
infrastructures Review State-of-the-Art Review of Railway Track Resilience Monitoring Chayut Ngamkhanong 1,2, * ID , Sakdirat Kaewunruen 1,2 ID and Bruno J. Afonso Costa 3 ID 1 Department of Civil Engineering, The University of Birmingham, Birmingham B15 2TT, UK; [email protected] 2 Birmingham Centre for Railway Research and Education, The University of Birmingham, Birmingham B15 2TT, UK 3 EVOLEO Technologies Lda., Porto 4425-656, Portugal; [email protected] * Correspondence: [email protected]; Tel.: +44-753-263-0572 Received: 29 December 2017; Accepted: 26 January 2018; Published: 28 January 2018 Abstract: In recent years, railway systems have played a significant role in transportation systems due to the demand increase in conveying both cargo and passengers. Due to the harsh environments and severe loading conditions, caused by the traffic growth, heavier axles and vehicles and increase in speed, railway tracks are at risk of degradation and failure. Condition monitoring has been widely used to support the health assessment of civil engineering structures and infrastructures. In this context, it was adopted as a powerful tool for an objective assessment of the railway track behaviour by enabling real-time data collection, inspection and detection of structural degradation. According to relevant literature, a number of sensors can be used to monitor track behaviour during the train passing under harsh environments. This paper presents a review of sensors used for structural monitoring of railway track infrastructure, as well as their application to sense the performance of different track components during extreme events. The insight into track monitoring for railways serving traffic with extreme features will not only improve the track inspection and damage detection but also enable a predictive track maintenance regime in order to assist the decision-making process towards more cost-effective management in the railway industry. Keywords: railway track; condition monitoring; wired sensor; wireless sensor network (WSN) 1. Introduction Railway systems play a vital role in modern transportation systems by quickly and safely conveying large amounts of cargo and passengers. Not only the increase in passengers and freights but also the change of world climate have become the reasons that compel railway infrastructure to frequently undertake maintenance operations [1–4]. Extreme events, generally rare occurrences, may take place once a year or every 100 years. Normally, the extreme events are of high intensity with a short duration. Nonetheless, the number of extreme events is very likely to increase in magnitude and frequency, which generate impacts that can cause damage or problems to any transportation system, namely, concerning the infrastructures, operations, freights, and passengers. The effects of climate change cause slight deterioration of rail infrastructure and may affect significantly its performance when extreme events occur [5,6]. Some of the common damages in rail assets subjected to such extreme events include damaged components, track buckling, shear crack of tunnelling, and many others. These could potentially lead to progressive failure of key rail systems such as railway bridges and tunnels, turnouts and crossings, and even open tracks. It appears that about 5–10% of all failures are weather related, being mostly caused by high temperature, icing, and storms [1,3]. An increase in the frequency of high temperature Infrastructures 2018, 3, 3; doi:10.3390/infrastructures3010003 www.mdpi.com/journal/infrastructures
-
Upload
khangminh22 -
Category
Documents
-
view
1 -
download
0
Transcript of State-of-the-Art Review of Railway Track Resilience ... - MDPI

infrastructures
Review
State-of-the-Art Review of Railway TrackResilience Monitoring
Chayut Ngamkhanong 1,2,* ID , Sakdirat Kaewunruen 1,2 ID and Bruno J. Afonso Costa 3 ID
1 Department of Civil Engineering, The University of Birmingham, Birmingham B15 2TT, UK;[email protected]
2 Birmingham Centre for Railway Research and Education, The University of Birmingham,Birmingham B15 2TT, UK
3 EVOLEO Technologies Lda., Porto 4425-656, Portugal; [email protected]* Correspondence: [email protected]; Tel.: +44-753-263-0572
Received: 29 December 2017; Accepted: 26 January 2018; Published: 28 January 2018
Abstract: In recent years, railway systems have played a significant role in transportation systemsdue to the demand increase in conveying both cargo and passengers. Due to the harsh environmentsand severe loading conditions, caused by the traffic growth, heavier axles and vehicles and increasein speed, railway tracks are at risk of degradation and failure. Condition monitoring has been widelyused to support the health assessment of civil engineering structures and infrastructures. In thiscontext, it was adopted as a powerful tool for an objective assessment of the railway track behaviourby enabling real-time data collection, inspection and detection of structural degradation. Accordingto relevant literature, a number of sensors can be used to monitor track behaviour during the trainpassing under harsh environments. This paper presents a review of sensors used for structuralmonitoring of railway track infrastructure, as well as their application to sense the performance ofdifferent track components during extreme events. The insight into track monitoring for railwaysserving traffic with extreme features will not only improve the track inspection and damage detectionbut also enable a predictive track maintenance regime in order to assist the decision-making processtowards more cost-effective management in the railway industry.
Keywords: railway track; condition monitoring; wired sensor; wireless sensor network (WSN)
1. Introduction
Railway systems play a vital role in modern transportation systems by quickly and safelyconveying large amounts of cargo and passengers. Not only the increase in passengers and freightsbut also the change of world climate have become the reasons that compel railway infrastructure tofrequently undertake maintenance operations [1–4].
Extreme events, generally rare occurrences, may take place once a year or every 100 years.Normally, the extreme events are of high intensity with a short duration. Nonetheless, the numberof extreme events is very likely to increase in magnitude and frequency, which generate impacts thatcan cause damage or problems to any transportation system, namely, concerning the infrastructures,operations, freights, and passengers. The effects of climate change cause slight deterioration of railinfrastructure and may affect significantly its performance when extreme events occur [5,6]. Some ofthe common damages in rail assets subjected to such extreme events include damaged components,track buckling, shear crack of tunnelling, and many others. These could potentially lead to progressivefailure of key rail systems such as railway bridges and tunnels, turnouts and crossings, and evenopen tracks. It appears that about 5–10% of all failures are weather related, being mostly causedby high temperature, icing, and storms [1,3]. An increase in the frequency of high temperature
Infrastructures 2018, 3, 3; doi:10.3390/infrastructures3010003 www.mdpi.com/journal/infrastructures
Infrastructures 2018, 3, 3 2 of 18
occurrences will lead to more track buckling problems, which can induce hazardous derailments andother dangerous accidents.
The deterioration of rail infrastructure is a significant issue throughout the world [7]. Railwayinspection is normally conducted periodically every year or several months. It may take too much timeto rapidly detect faults in the track that may cause collapse or huge loss, as is the case in the promptidentification of rail defects. The railway industry needs to improve the process and decision thinkingof track maintenance. Hence, condition monitoring of rail infrastructure has become importantfor setting proper predictive maintenances before defect and failure take place. Structural healthmonitoring (SHM) has been widely developed over the past decade with many civil engineeringapplications, such as building, bridge, off-shore structure [8,9], in order to enhance the safety andreliability [10]. Condition monitoring can reduce maintenance and its costs by detecting the faultsbefore they can cause damage or prevent rail operations [11].
In addition, visual inspection requirements can be reduced through automated monitoring.Several sensors may be adopted for railway monitoring such as accelerometers, strain gauges, acousticemission and inclinometers. Apart from detecting defects in rail infrastructure, other benefits of amonitoring system integrating these sensors are to determine the number of axles, number of trains,their speed, acceleration and weight, which are important for adequate management.
Wired sensor systems have been widely used for a long time in SHM. It is noted that wired systemsseem to be commonly used at large scales. However, due to their own limitations, this techniquerequires high cost and complex installation processes that are inconvenient [12] and have led to theadoption of wireless sensor networks (WSNs) as an alternative approach [13]. Besides providing realtime monitoring and alert for preventing damage and failure [14], this technique can improve thedecision making process in maintenance based on failure prediction rather than on routine operationsor execution of work after failure. In addition, the lower power consumption and relatively lowcosts of theses sensors when compared to traditional sensor technology can reduce the impact ofdamaged or lost equipment [15]. Moreover, WSNs have proved that they can be used under severeweather conditions, such as strong wind, storms and snow, whilst the wired traditional technique isvulnerable to damage (e.g., corrosion), vandalism (e.g., cut wire), dirt and nature elements [16]. It isalso worth mentioning that WSNs offer many possibilities previously unavailable with traditionalsensor technology. In terms of time, the wireless sensing units can be installed with ease andcompleted in approximately half the time of the wired monitoring system because they requireless labor-intensive work and no special care to ensure safe placement of wires on the structure [17].However, it is preferable to combine periodic visual inspection and a WSN condition monitoringsystem for maintaining railway structures, as this enables an effective periodic inspection of structuresdepending on the degree of importance of each monitored component based on the detailed datasupplied by the WSN [13].
In this paper, the sensors that can be used in rail infrastructure monitoring are reviewed,and the benefits and drawbacks of different sensors are compared and summarized. The insightinto the rail infrastructure health monitoring can assist the decision-making process for improvingpredictive maintenance through real time inspection. Furthermore, this will help move from scheduledpreventative maintenance to a more rational predictive maintenance approach. The outcome of thisstudy will not only improve the understanding of railway track structural monitoring but also enhancethe need for future research.
2. Railway Track Resilience
2.1. Railway Resilience Assessment
Railway infrastructure is a valuable asset throughout the world as the increase of capacity isrequired and the investment in railway infrastructure improvement is growing. It is interesting to notethat the sudden increase of rail traffic is also a major challenge as an approximate 10% reduction in
Infrastructures 2018, 3, 3 3 of 18
road traffic means a 100% increase in railway traffic [18]. As for existing tracks, railway traffic togetherwith the age and poor construction of railway tracks are compounded with the effects of extremeevents. These lead to frequent and severe disruptions to the railway system [19]. The specific potentialimpacts on railway tracks caused by extreme events are as follows.
• Rail buckling due to extreme heat [5].• Embankment and cutting slope failure caused by low temperature, earthquakes, heavy
precipitation, and flooding [1,18,20].• Rising sea level and storm surge may cause disruption to railway tracks near coastal areas [21].• Washing away ballast by flash floods [22].
Hence, long-term preparation for managing the impacts of extreme weather events on railwayinfrastructure needs to be addressed [22]. An assessment of weather-related infrastructure problemsduring previous events needs to be identified and conducted. Condition monitoring is essential tomaintaining the resilience and performance of railway infrastructure assets. This is important tomaintain asset condition and create reliable train services for passengers integrated with weatherforecasts to improve the weather resilience of railway infrastructure.
Moreover, there are a number of actions need to be taken following events in order to return tothe normal schedule and operation as soon as possible [22].
• Critical locations should be identified.• Assessment of damage to railway track and vehicles. Damaged components of infrastructure
should be upgraded to improve resilience to future extreme events.• Adapt and enhance the performance and capacity of future railway infrastructure according to
lessons learned from previous extreme events.
Track maintenance needs to be carried out to maintain a railway asset. Even though preventivemaintenance has been regularly used to determine defects and prevent damage, condition monitoringcan help move from preventive maintenance to predictive maintenance as its approaches providecost saving over routine maintenance. Predictive maintenance has been used to detect the start of afailure by forecasting using condition monitoring. To understand the behaviour and performance ofrailway tracks under different conditions, data obtained through condition monitoring along withcomputer simulations can develop the resilient design, maintenance and repair regimes in railwayindustry. In addition, these will help railway tracks to withstand the effects of extreme events [18].
2.2. Resilience Index
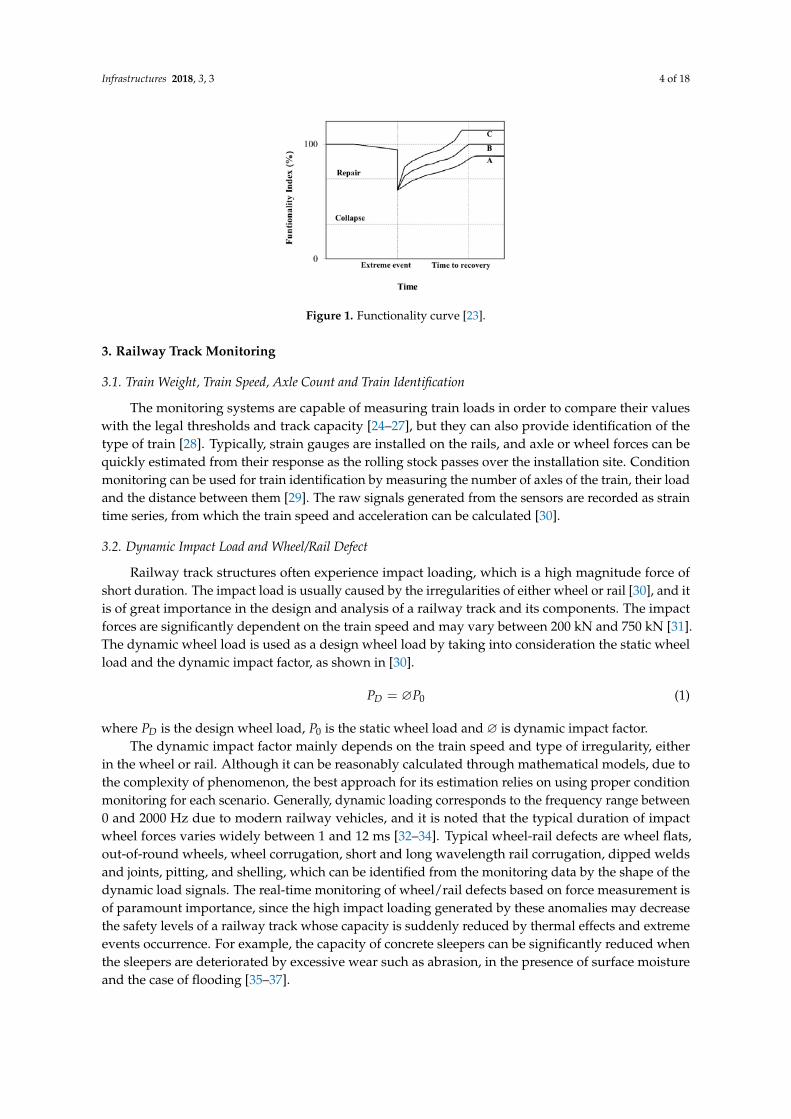
The degradation of infrastructure due to aging and rapid change in performance due to extremeevents causes a sudden decrease in functionality index [23]. After this stage, the structure needs to berecovered by strengthening and maintenance to obtain the desired functionality index. It is possibleto recover the structure as a new structure with higher performance to improve resilience to futureextreme events as seen in curve C in Figure 1 by fixing pre-existing problems inside the system itself asseen in A. On the other hand, the structure may also have permanent losses below the pre-disasterbaseline performance (curve A in Figure 1). It is noted that resilient systems need to be designedproperly to increase capacity and robustness to an acceptable level after experiencing extreme events.During aging and extreme events, condition monitoring becomes an effective way to monitor thefunctionality index and help predictive maintenance of a structure.
Infrastructures 2018, 3, 3 4 of 18Infrastructures 2018, 3, 3 4 of 17
Figure 1. Functionality curve [23].
3. Railway Track Monitoring
3.1. Train Weight, Train Speed, Axle Count and Train Identification
The monitoring systems are capable of measuring train loads in order to compare their values with the legal thresholds and track capacity [24–27], but they can also provide identification of the type of train [28]. Typically, strain gauges are installed on the rails, and axle or wheel forces can be quickly estimated from their response as the rolling stock passes over the installation site. Condition monitoring can be used for train identification by measuring the number of axles of the train, their load and the distance between them [29]. The raw signals generated from the sensors are recorded as strain time series, from which the train speed and acceleration can be calculated [30].
3.2. Dynamic Impact Load and Wheel/Rail Defect
Railway track structures often experience impact loading, which is a high magnitude force of short duration. The impact load is usually caused by the irregularities of either wheel or rail [30], and it is of great importance in the design and analysis of a railway track and its components. The impact forces are significantly dependent on the train speed and may vary between 200 kN and 750 kN [31]. The dynamic wheel load is used as a design wheel load by taking into consideration the static wheel load and the dynamic impact factor, as shown in [30]. = ∅ (1)
where is the design wheel load, is the static wheel load and ∅ is dynamic impact factor. The dynamic impact factor mainly depends on the train speed and type of irregularity, either
in the wheel or rail. Although it can be reasonably calculated through mathematical models, due to the complexity of phenomenon, the best approach for its estimation relies on using proper condition monitoring for each scenario. Generally, dynamic loading corresponds to the frequency range between 0 and 2000 Hz due to modern railway vehicles, and it is noted that the typical duration of impact wheel forces varies widely between 1 and 12 ms [32–34]. Typical wheel-rail defects are wheel flats, out-of-round wheels, wheel corrugation, short and long wavelength rail corrugation, dipped welds and joints, pitting, and shelling, which can be identified from the monitoring data by the shape of the dynamic load signals. The real-time monitoring of wheel/rail defects based on force measurement is of paramount importance, since the high impact loading generated by these anomalies may decrease the safety levels of a railway track whose capacity is suddenly reduced by thermal effects and extreme events occurrence. For example, the capacity of concrete sleepers can be significantly reduced when the sleepers are deteriorated by excessive wear such as abrasion, in the presence of surface moisture and the case of flooding [35–37].
3.3. Track Subgrade Monitoring
Railway tracks are generally laid on a bed of ballast and sub-ballast, commonly referred as track bed, placed above a prepared subgrade layer. It is interesting to note that track bed can significantly
Figure 1. Functionality curve [23].
3. Railway Track Monitoring
3.1. Train Weight, Train Speed, Axle Count and Train Identification
The monitoring systems are capable of measuring train loads in order to compare their valueswith the legal thresholds and track capacity [24–27], but they can also provide identification of thetype of train [28]. Typically, strain gauges are installed on the rails, and axle or wheel forces can bequickly estimated from their response as the rolling stock passes over the installation site. Conditionmonitoring can be used for train identification by measuring the number of axles of the train, their loadand the distance between them [29]. The raw signals generated from the sensors are recorded as straintime series, from which the train speed and acceleration can be calculated [30].
3.2. Dynamic Impact Load and Wheel/Rail Defect
Railway track structures often experience impact loading, which is a high magnitude force ofshort duration. The impact load is usually caused by the irregularities of either wheel or rail [30], and itis of great importance in the design and analysis of a railway track and its components. The impactforces are significantly dependent on the train speed and may vary between 200 kN and 750 kN [31].The dynamic wheel load is used as a design wheel load by taking into consideration the static wheelload and the dynamic impact factor, as shown in [30].
PD = ∅P0 (1)
where PD is the design wheel load, P0 is the static wheel load and ∅ is dynamic impact factor.The dynamic impact factor mainly depends on the train speed and type of irregularity, either
in the wheel or rail. Although it can be reasonably calculated through mathematical models, due tothe complexity of phenomenon, the best approach for its estimation relies on using proper conditionmonitoring for each scenario. Generally, dynamic loading corresponds to the frequency range between0 and 2000 Hz due to modern railway vehicles, and it is noted that the typical duration of impactwheel forces varies widely between 1 and 12 ms [32–34]. Typical wheel-rail defects are wheel flats,out-of-round wheels, wheel corrugation, short and long wavelength rail corrugation, dipped weldsand joints, pitting, and shelling, which can be identified from the monitoring data by the shape of thedynamic load signals. The real-time monitoring of wheel/rail defects based on force measurement isof paramount importance, since the high impact loading generated by these anomalies may decreasethe safety levels of a railway track whose capacity is suddenly reduced by thermal effects and extremeevents occurrence. For example, the capacity of concrete sleepers can be significantly reduced whenthe sleepers are deteriorated by excessive wear such as abrasion, in the presence of surface moistureand the case of flooding [35–37].
Infrastructures 2018, 3, 3 5 of 18
3.3. Track Subgrade Monitoring
Railway tracks are generally laid on a bed of ballast and sub-ballast, commonly referred as trackbed, placed above a prepared subgrade layer. It is interesting to note that track bed can significantlyinfluence the performance of the track, especially the ride quality of passenger services [38]. Thus, apartfrom condition monitoring of track superstructure, the track bed and subgrade layer also need to bemonitored as they play important roles in providing track stability and a smooth train ride [39].
The subgrade failures in railway may arise from a variety of mechanisms, and progressive shearfailure caused by high magnitude of repeated loading is the dominant factor. This can gradually leadto the large deformation and squeezing near the subgrade surface [40,41]. Another important typeof subgrade failure is subgrade attrition with mud pumping. This failure causes muddy ballast andinadequate sub-ballast [42]. Mud pumping frequently occurs at spots containing fine materials andaccess to water, with their migration to the ballast through the voids [43,44]. This can lead to cloggingof the ballast, decreasing its drainage and stress reduction capabilities.
4. Wired and Wireless Systems
Several condition monitoring systems have been implemented in civil engineering applicationscapable of measuring, among others key parameters, strain, displacement, acceleration, temperature,humidity and defects [16]. The periodic monitoring of the railway infrastructure is aimed at ensuringits safety. For that purpose, the conventional wired technique is still the standard method in whichwires connect sensors to the acquisition units and are directly attached to the structure. Typically,the results obtained with this technique are accurate, and defects can be properly detected. However,this approach requires periodic maintenance, which added to the hard-labour installation work canlead to significant costs, resulting in the wireless techniques being more competitive with increasingpopularity [12]. In fact, this alternative technology strategy can reduce the number of sensors, timefor deployment, installation and maintenance costs and power consumption. Nonetheless, in general,the results obtained with wireless systems do not present the same level of accuracy when comparedto those provided by wired techniques. The comparison between wired and wireless conditionmonitoring systems, regarding their main features, is shown in Table 1.
Table 1. Comparison between wired and wireless monitoring systems.
Wired Wireless
Sensors are physically in contact with the structure,hence the determination of the exact position ofdamage is expected.
Sensors are not in contact with the structure, thusdamage detection is accomplished with less accuracythan for wired systems
Greater number of sensors is needed. The wiredsystem can become significantly complex.
Number of sensors is minimized, and theirinstallation can be easier.
Cables can be damaged easily due to human errors orweather conditions. Hence, long-term maintenancecosts can be high.
Initial cost is higher but within a life time analysis itbecomes lower and regular monitoring canbe achieved.
Inflexible when changes are needed, thus presentinga high time consumption when cables are tobe redeployed.
Provide an easier way to physically deploy theequipment requiring shorter periods of time.
5. Wireless Sensor Network Framework
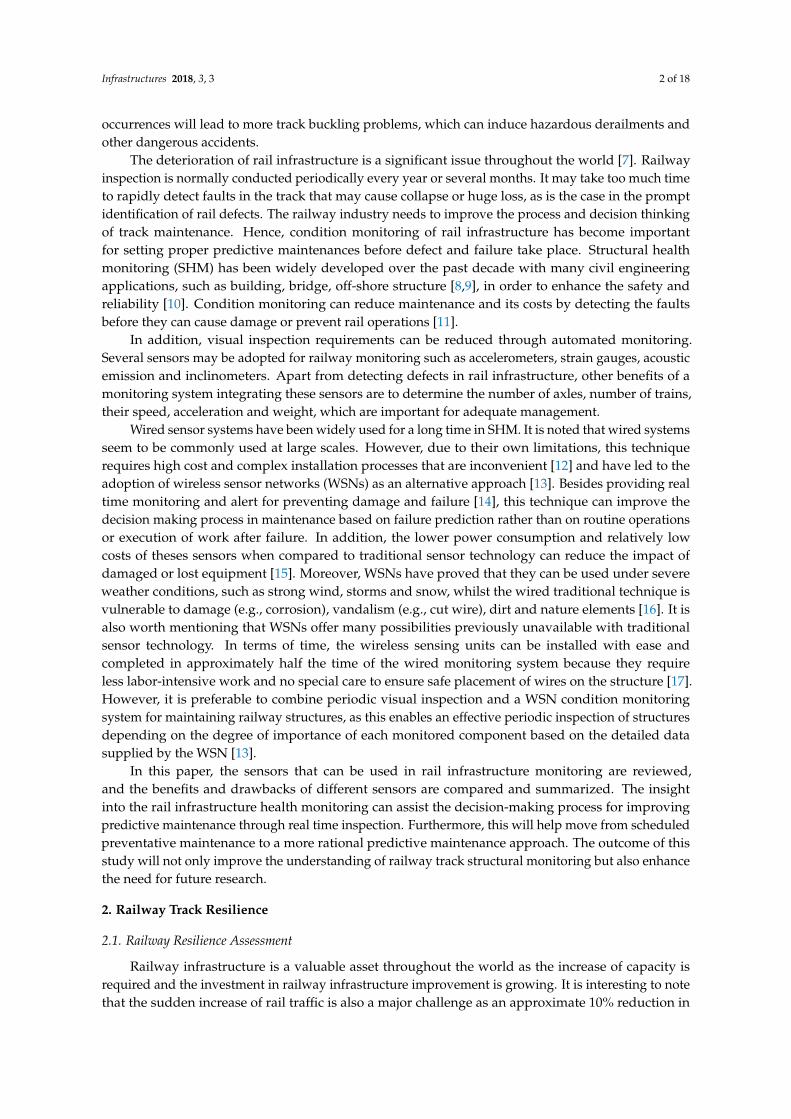
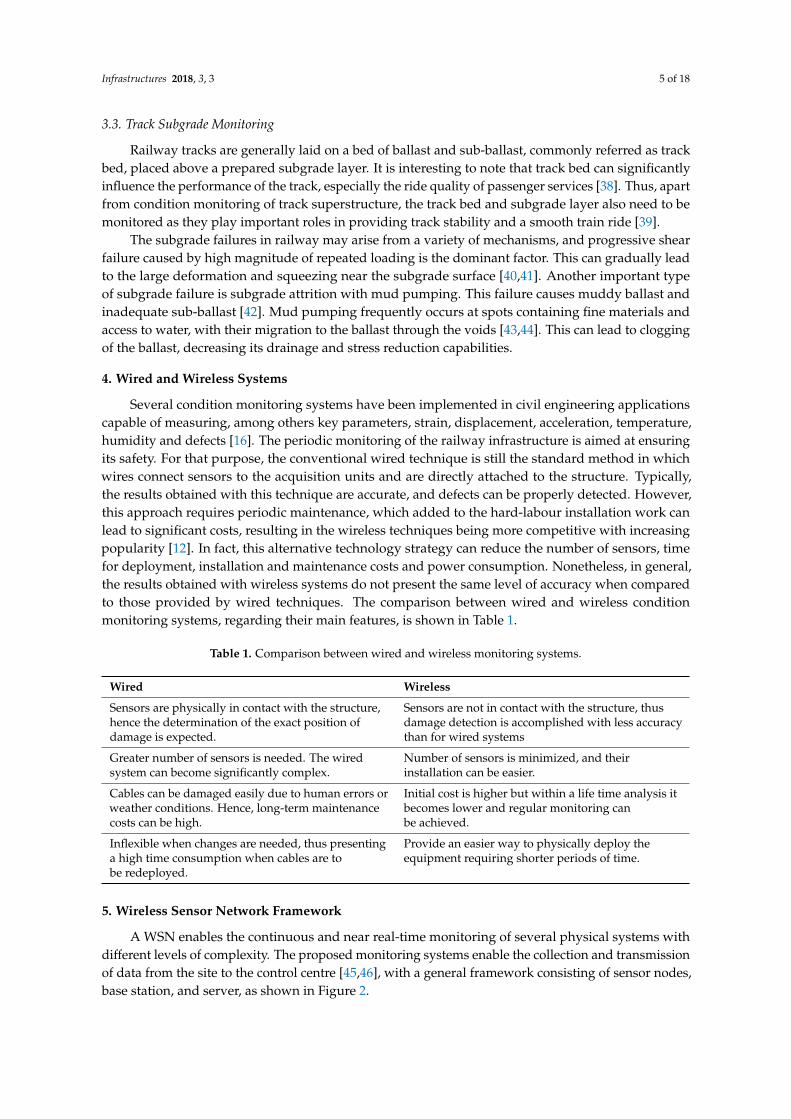
A WSN enables the continuous and near real-time monitoring of several physical systems withdifferent levels of complexity. The proposed monitoring systems enable the collection and transmissionof data from the site to the control centre [45,46], with a general framework consisting of sensor nodes,base station, and server, as shown in Figure 2.

Infrastructures 2018, 3, 3 6 of 18Infrastructures 2018, 3, 3 6 of 17
Figure 2. WSN framework [46].
5.1. Sensor Node
The sensor node generally contains a sensor, an analog-to-digital converter, a micro controller, a transceiver, power and memory [46]. One or more sensor devices embedded in different elements are mounted on boards to be attached to the monitored object, materializing strain gauges, displacement transducers, accelerometers, inclinometers, acoustic emission, thermal detectors, among others. The analog signal outputs generated by the sensors are converted to digital signals that can be processed by digital electronics, which requires a resolution of at least 16-bits to ensure results of minimum quality for structural monitoring applications [47]. The data are then transmitted to a base station by a microcontroller through a radio transceiver. All devices are electric or electronic components supported by power supply, which can be provided through batteries or by local energy generation, the latter mandatory at locations far away from energy supplies.
5.2. Base Station
The base station acts as a gateway for information transmission with the remote server. The data collected from the sensor nodes are transferred to the base station using wireless communication technology such as CAN, FlexRay, Wi-Fi or bluetooth. For example, the ZigBee network is a kind of wireless short distance communication that consumes less power [46]. On the other hand, for transmitting the data from the base station to the server at the control centre, long-range communication such as GPRS, EDGE, UMTS, LTE or satellite can be used. Due to the short transmission range, communications from sensor nodes may not reach the base station, a problem that can be overcome by adopting relay nodes to pass the data from the sensor nodes to the base station [48]. Some of the transmission data techniques available are as follows:
• Standard mobile telephony (Bluetooth, GSM, GPRS) [13], which can provide enough communication bandwidth (few hundreds Kb/s) to transmit life signals, alarm messages and possibly camera screenshots, whenever available;
• Broadband technique Wi-Fi (IEEE 802.11) [13], wireless personal area network (WPANs (IEEE 802.15.4), ZigBee (IEEE 802.15.4)) [49] or WiMAX (IEEE 802.16) [50] have higher speed and bandwidths but lower coverage and range than standard mobile telephony review;
• UMTS (Universal Mobile Telecommunications System) or Satellite links (few Mb/s bandwidth) [51] can additionally transmit a few video streams from neighbour cameras when the faults on tracks are detected by sensors in order to verify early warning in real-time;
• Fibre Optics geographic networks along the line [51,52] (only possible for fixed sites), which provide a very high bandwidth (in the Gb/s range), also allowing transmission of
Figure 2. WSN framework [46].
5.1. Sensor Node
The sensor node generally contains a sensor, an analog-to-digital converter, a micro controller,a transceiver, power and memory [46]. One or more sensor devices embedded in different elements aremounted on boards to be attached to the monitored object, materializing strain gauges, displacementtransducers, accelerometers, inclinometers, acoustic emission, thermal detectors, among others.The analog signal outputs generated by the sensors are converted to digital signals that can beprocessed by digital electronics, which requires a resolution of at least 16-bits to ensure results ofminimum quality for structural monitoring applications [47]. The data are then transmitted to abase station by a microcontroller through a radio transceiver. All devices are electric or electroniccomponents supported by power supply, which can be provided through batteries or by local energygeneration, the latter mandatory at locations far away from energy supplies.
5.2. Base Station
The base station acts as a gateway for information transmission with the remote server. The datacollected from the sensor nodes are transferred to the base station using wireless communicationtechnology such as CAN, FlexRay, Wi-Fi or bluetooth. For example, the ZigBee network is a kindof wireless short distance communication that consumes less power [46]. On the other hand,for transmitting the data from the base station to the server at the control centre, long-rangecommunication such as GPRS, EDGE, UMTS, LTE or satellite can be used. Due to the short transmissionrange, communications from sensor nodes may not reach the base station, a problem that can beovercome by adopting relay nodes to pass the data from the sensor nodes to the base station [48]. Someof the transmission data techniques available are as follows:
• Standard mobile telephony (Bluetooth, GSM, GPRS) [13], which can provide enough communicationbandwidth (few hundreds Kb/s) to transmit life signals, alarm messages and possibly camerascreenshots, whenever available;
• Broadband technique Wi-Fi (IEEE 802.11) [13], wireless personal area network (WPANs (IEEE802.15.4), ZigBee (IEEE 802.15.4)) [49] or WiMAX (IEEE 802.16) [50] have higher speed andbandwidths but lower coverage and range than standard mobile telephony review;
• UMTS (Universal Mobile Telecommunications System) or Satellite links (few Mb/s bandwidth) [51]can additionally transmit a few video streams from neighbour cameras when the faults on tracksare detected by sensors in order to verify early warning in real-time;
Infrastructures 2018, 3, 3 7 of 18
• Fibre Optics geographic networks along the line [51,52] (only possible for fixed sites), whichprovide a very high bandwidth (in the Gb/s range), also allowing transmission of high-resolutionvideos at very high frame rates (e.g., 25 FPS) for a superior situational awareness at thecontrol rooms.
5.3. Server
The collected data are transmitted to the control centre server through long-range communicationssuch as GPRS, EDGE, UMTS, LTE or satellite. The sensor node may communicate directly with thecontrol centre server without requiring the use of the base station as a gateway. Yet, for securityreasons, the generated data should also be transferred to and stored at the base station where they canbe accessed by the user.
6. Sensors
In terms of sensor placement, condition monitoring can be divided into two types: fixedmonitoring and movable monitoring (on-board). The sensors used for fixed monitoring are installedon the railway track. The sensors can measure the condition of the whole passing train at the specificarea. As for movable monitoring, the sensors attached to the train (either the vehicles or the machines)such as on the wheel, bogie, wagon, engine, etc., monitor the whole track but only at specific pointsof the train. The key issue with movable sensor monitoring is communication as the sensors haveto move with the train along the track. The data are transmitted from the movable nodes to thefixed nodes which are in the range of transmission via satellite or GSM. However, to understand thewhole section of railway track at the specific area, fixed monitoring can be used for monitoring ethersuperstructure or substructure. Hence, this section provides the sensor used for both track and trackbed measurements.
6.1. Track Measurement
6.1.1. Strain Gauge
The most common sensor for measuring the response of structure is the strain gauge and, as itsname suggests, is a device used for measuring the strain experienced by the instrumented material.This sensor is normally used in railway infrastructure for acquiring data indirectly related to trainparameters such as the vehicle loads, impact forces, moving speed, axle count, identification and wheeldefects [53,54]. The strain gauge can be used either for sensing the bending normal strain of the railfoot or the shear strain of the rail web. The data are converted into the loads applied at the rail headby assuming a linear elastic response under certain measurement conditions. In addition, the straingauge is also applied for capturing lateral loads on the rail, thus enabling the quantification of lateralto vertical load ratio for train derailment early warning [55–57].
It is worth mentioning that in the study carried out by Stratman et al. [58] for detecting faultywheels, 64 strain gauges were applied in each rail of the track, half of them for measuring the verticalload and the other half for capturing the lateral loads applied to the rail. The average force, referred toas the nominal force, and peak force were extracted from the time series data, and the ratio betweenthese two forces was adopted as an indicator of the presence of a defect in the wheel.
Presently, optical fibre sensors are widely used as an alternative for structural sensing and healthmonitoring applications in composites, aerospace, marine and civil engineering [59–61]. One of thenewest application areas for their use is in the railway industry. Fibre brag grating (FBG) is an opticalfibre sensor capable of sensing changes in either strain or temperature of the instrumented material.The formation of permanent gratings in an optical fibre was first demonstrated by Hill et al. [62],and Meltz et al. [63] used the first interference pattern of ultraviolet laser light to create the periodicperturbation of the refractive index along the fibre length (grating). When compared to electrical straingauges, FBGs present clear advantages such as long life time (more than 30 years), electrical immunity,
Infrastructures 2018, 3, 3 8 of 18
ease and cost of installation. One of the first applications of FBG sensors in railways was accomplishedin the monitoring system of the Tsing Ma Bridge [64,65], for measuring the temperature and structuralresponse of cables, girders and bearings during train crossings. Another pioneer railway industryproject in successfully adopting this sensing technology was carried out at the KCRC railway line inHong Kong for detecting trains and measuring their speed and weight. The results compared wellwith the data supplied by a parallel electrical based monitoring system, and it was concluded that FBGsensors benefited from a simpler installation procedure.
The use of conventional strain gauge sensors can be used as guidance in instrumenting structuralelements with FBG sensors, namely regarding their positioning, and assist in the analysis of theresulting signals. The position and orientation of FBG sensors can be determined from the extensiveexperience gained by applying their electric counterparts for measuring local deformation [66].
6.1.2. Accelerometer
An accelerometer is a sensor capable of measuring the rate of change of velocity in theinstrumented body, and it can use a great number of sensing principles and technologies suchas the capacitance, piezoelectricity, laser based, magnetic induction, optical, electromechanicalservo-hydraulics, resonance, among others [67]. In railway applications, the vibration monitored bythe accelerometer in the track can be converted into force, and then be used for detecting wheel defectsor counting the number of axles (in this case a supplementary method is needed) [68,69]. Field testinghas been extensively executed for validating the ability of accelerometer based condition monitoringsystems to capture several train features for different passing speeds from the track vibration [70].
The accelerometers can be bonded to the web of the rail or fastened to its foot, and even attachedunderneath the rail itself, for sensing the passing trains. These sensors are generally placed at the railmidspans between consecutive sleepers covering an instrumented length up to 12 m or one revolutionof a wheel. The main benefit of using accelerometers over strain gauges for detecting wheel defects istheir ability to detect impact across the entire length of the rail between two sleepers, thus providinga more effective condition monitoring for the entire circumference of the wheel [71]. Nevertheless,a limited performance regarding repeatability for detecting damage has been identified for someconventional accelerometer-based systems [70]. However, the advantage of these systems over strainbased systems is that the magnitude of the response depends in part on the wheel/rail associated withthe unsprung mass [68]. Therefore, the response is independent of the vehicle mass [70].
The vast majority of conventional accelerometers are based on piezoelectric crystals, usuallya major drawback because of their large size. In order to overcome this problem, a new type ofsensor, named “Micro electromechanical systems (MEMS)”, was first developed in 1979 to replace theconventional sensor [67]. A MEMS accelerometer is composed of a movable proof mass with platesthat are connected through a mechanical suspension system to a reference frame [72]. The advantagesof this type of sensor are its small dimensions, integrated devices or systems that combine electricaland mechanical components that could be produced at relatively low cost [73]. The use of MEMSin wireless monitoring system can reduce the cost significantly when compared with traditionalwired sensor technologies [74–76]. It can be now concluded that previously expensive sensors cannow be replaced with inexpensive, efficient, low-consuming power alternatives. Moreover, MEMSsensors are capable of operating in harsh environments for safety critical applications, characterizedby extreme temperature, vibrations or shock conditions [77,78]. However, these sensors present somedrawbacks [79]. Firstly, each sensor node must be battery powered, and the replacement periodshould be based on specific industry requirements. Secondly, the power consumption can be affectedby the data transmission bandwidth which varies depending on the chosen radio frequency andtransmission power. Thus, the type of data monitored and how often they are transmitted should bedecided carefully.
Infrastructures 2018, 3, 3 9 of 18
6.1.3. Acoustic Emission
To identify crack growth, remaining life, and fatigue life of the track components, an acousticemission (AE) sensor has been proposed as an alternative method which is very useful [73].This provides cumulative damage information for a particular area such as inside the structure, hiddeneffect, micro structure, etc. The AE sensor has been widely used in many engineering applications [80]due to its capability to detect crack growth, damage accumulation and AE source localizations in manyconcrete structures and infrastructures. In railway applications, AE have been applied to detect faultsin wheels and rails. However, only a limited number of AE tests on site have been conducted. The useof AE tests in railways has been carried out in laboratories as seen in the literature [81].
The AE technique was used for steel rail crack detection [82]. The cyclic 3-point and 4-pointfatigue loadings were applied to the steel rails in laboratories. The frequency bandwidth range of AEsensors between 150 kHz and 750 kHz was used. This paper clearly confirmed that the waveformsgenerated by AE were related to crack propagation in rail steel [83]. In field measurements, the rollingnoise produced from wheel irregularities may affect the AE waveform which had similar amplitude ascrack growth. To avoid the effect of rolling noise, the wideband sensor with a bandwidth of 100 kHz–1MHz with different gains was employed.
The AE waveform shape depends on the mode of failure. In case of tension failure, the elasticenergy carrier arrives quickly, leading to waveform with a low rise time (RT), high rising angle (RA)and frequency, whereas shear failure typically occurs in a longer rise time, with lower rising angle andfrequency due to the delay of the waveform energy. This is because of the rapid change in volumetricnear the crack tip in the case of tension failure.
The AE technique was then adopted to a railway site for continuous monitoring [84]. The AEsensors were placed on rails continuously under different moving trains and trams located in Portugaland UK to detect wheel abnormalities. The different types and frequencies of AE sensors have beeninvestigated; specifically, frequencies of 30 kHz, 150 kHz, 300 kHz and 500 kHz. It was noted that thedistance between the first sensor and last sensor was the perimeter of the wheel. It was also noted thatthe low frequency sensor was mounted to detect any transient and the high frequency sensor was usedfor detecting waves in noisy environments. The defected and non-defected wheels were comparedto ensure that the AE sensor had the potential to identify defects of wheels properly. The resultsshowed that the periodic spikes in the graph of the AE waveform were observed in the case of awheel flat whereas a smooth curve was observed for non-defected wheels. It was noted that AE is adiagnostic tool.
6.1.4. Inclinometer
The inclinometer is an instrument for measuring inclination or tilt. The inclinometer can beinstalled horizontally on the sleeper or ballast to measure the tilt [85]. In addition, an inclinometer canbe mounted parallel with the track on the sleeper to measure settlement. In addition, the inclinationdata recorded can be used to predict the actual deflections of the track. The track movements over time,particularly where nearby construction work or where the track passes through vulnerable areas suchas regions prone to landslides may affect the track settlement [45]. Moreover, inclinometers have beenused to measure the tilt of the slab phase to help operators install the slab track in the right positionand to periodically monitor the slab behavior in the monitoring phase [86].
6.2. Track Bed and Subgrade Measurement
In the track bed, water is expected to play a significant role in track bed failure mechanismssuch as mud pumping, simply because the absence of water may prevent mud pumping. The majorfactors that can affect subgrade problems in the railway track are pore water pressure and watercontent [38,43,44]. The increase in pore water pressure results in a decrease of effective stress and thesafety factor in the subgrade layer. Subgrade layers with low permeability such as clays, may have
Infrastructures 2018, 3, 3 10 of 18
a sudden increase in pore pressure (called “excess pore pressure”). The excess pore pressure cannotreadily dissipate, and this behaviour can lead to the failure of soil. Pore pressure can cause thedevelopment of mud pumping near the interface between ballast and subballast during train passage.Another factor is water content. The water content (also called “moisture content” or “soil content” insoil) is the quantity of water contained in the soil. In the subgrade layer, increased water content cansignificantly influence the decrease in resilient modulus. An increase in the water content from 27.1% to30.1% can reduce the subgrade modulus by almost 50% [87]. A high water content in the subgrade latercan lead to progressive shear failure. In terms of subgrade deformation, Multidepth deflectometersconsisting of a number of linear variable displacement transformers (LVDTs) are installed in a boreholeto measure subgrade deformation at various depths. Also, settlement probes can be used by measuringthe changes in fluid pressure.
6.2.1. Water Pressure Sensors
The fluid pressure in the ground, ballast, sub-ballast, and sub-grade can be measured using waterpressure sensors [38,88]. Firstly, a conventional piezometer installed below the ground water table hasbeen used for measuring positive water pressure. A piezometer is widely used in geotechnicalengineering for measuring pore pressure, determining the ground water level and the rate ofgroundwater flow. A piezometer is a device used to measure liquid pressure by measuring theheight to which a column of the liquid rises against gravity [89]. The benefit of a piezometer is to havea fast short-term performance so that this is capable of measuring the pore pressure during the trainpassage. There are a number of piezometers used for measuring the pore water pressure as follows.
The first piezometers in geotechnical engineering were open standpipes (sometimes calledCasagrande piezometers) [90] consisting of a filter tip and a riser pipe. The piezometer is installed in aborehole. The intake zone in a borehole is backfilled with sand and bentonite seal. The advantage ofthis type is its simplicity of measurement as the pore pressure obtained can be read easily via the waterlevel in the riser pipe. However, there are drawbacks of using this type of piezometer. It is difficult toinstall under an existing sleeper, which is the location of high pore pressure, because the piezometerrequires a vertical borehole. In addition, the borehole can affect subgrade deformation due to the largediameter of the borehole. Although the casagrande piezometer has a good long-term reliability, it maytake a long time to saturate for fine-grained ground.
The vibrating wire piezometer [91], which is suitable for most applications, is the most commonlydeployed type of piezometer. The results obtained are converted from water pressure to a frequencyof vibrating wire. Hence, the change of pore water pressure causes the diaphragm to extend orrelax, causing changes in the wire stress and natural frequencies. The advantages of a vibrating wirepiezometer are the high accuracy of results and the immunity against noise while transferring dataover a long cable. Nevertheless, this is not immune to electrical problems normally associated withelectronic instruments. The water pressure obtained can be read by data loggers or portable readoutunits, allowing faster or more frequent readings than standpipe piezometers.
Apart from these piezometers, there are a number of piezometers used in geotechnical engineeringsuch as pneumatic piezometers, hydraulic piezometers, and titanium piezometers [92] that providedifferent benefits and drawbacks. However, the piezometers used for subgrade monitoring in railwayapplication are standpipes piezometer and a vibrating piezometer.
Secondly, a water pressure sensor called a “tensiometer” measures the negative pressure or watertension in partially saturated zones [38]. This sensor can be installed over the ground water table.The device consists of a tube with a porous ceramic cup and is filled with water. A WSN early warningsystem was developed for landslides using tensiometers [93]. Tensiometers are able to detect changesin pore pressure rapidly to warn of slope instability, whereas reflectometers detect water contentchanges over time to warn of wet soil slippages.
The piezometer has to be installed in the critical area that contains high stress such as near theinterface between the ballast and subgrade. However, even though the sensors were placed at 5 cm

Infrastructures 2018, 3, 3 11 of 18
below the interface, the sensors could be destroyed by high traffic stress [88]. The precipitation, soilwater content and pore pressure were monitored continuously over a year in order to provide an earlywarning system for landslides related to weather conditions for rail traffic between Seattle and Everett,Washington, USA. It was noted that pore pressure had a greater influence on the slope instability thanthe water content so water pressure sensors were used for measurement. Piezometers provide littleuseful information in unsaturated zones. Therefore, a tensiometer can provide better results in thechange of pore pressure in partially saturated and unsaturated zones [93].
6.2.2. Multidepth Deflectometers (MDDs)
The technology of Multidepth deflectometers (MDDs) was first introduced to measure thedeformations in pavement under truck loading [94]. MDDs consisting of a number of linear variabledisplacement transformers (LVDTs) are installed in a borehole drilled vertically to measure thedeformation of sub-structure layers at various depths. The MDD anchor needs to be fixed in thenon-deformable soil layer which is normally located at a depth of 3 m below the top of the sleeper.According to previous studies [95], to monitor the deformations of each layer of railway track, LVDTswere placed in the borehole at various depths: at the top of the ballast layer, top of the subgrade layer,top of the embankment fill layer, top of the upper subgrade layer and top of the lower subgrade layer,and the anchor was placed in the lower subgrade layer. However, the installation of MDDs is difficultunder a railway track as the size of MDDs is large [38].
6.2.3. Settlement Probes
The measurement of the vertical deformation is made by measuring the changes in fluid pressurein the sensor end relative to a fixed fluid head datum (reservoir) [38,88]. The settlement probe consistsof a reservoir on one end and a pressure transducer which connects to the reservoir via small tubingembedded in the ground. The settlement probe applications are to monitor settlement in subsoils,foundations, and embankments.
The benefits of liquid-based settlement probes are that they are small and cost effective. Moreover,this has a high flexibility for installation and placement because the probe can be installed at any depthand orientation while the head datum is fixed. Hence, this can be easily installed in the subgrade layerwhile maintaining a reliable point of reference on the ground. However, the selection of a pressuretransducer is important as it indicates the performance of the settlement probe. Hence, long-termoffset stability and temperature sensitivity transducers are needed to deal with the long-term drift inrailway tracks [88].
A number of improved sensors were installed in the subgrade layers [38]. Piezometers, accelerometers,liquid-based settlement probes and temperature sensors were installed at a busy high speed NortheastCorridor (NEC) railway site. The track degradation can be measured from the increase of peakacceleration response of the subgrade layer during train passage. The track acceleration can indirectlyrepresent the maximum force induced by a train. It was noted that the track deterioration had a greateracceleration response than newly aligned ones.
The piezometers measured the long-term variation of pore pressures and train-induced porepressures. The MEM accelerometers installed at the sleeper and top subgrade were used to measurehigh-frequency wheel induced acceleration response using a high frequency data acquisition system(10 kHz sampling rate). The liquid-based settlement probe installed at the top of the sleeper was usedto measure the vertical deformation in the subgrade layer. The temperature sensors installed at the topsubgrade, deep subgrade and sleeper were useful for investigating the effect of temperature, freezingand thawing on track degradation. The objectives of each sensor are outlined in Table 2, and theplacements of each sensor are discussed in detail in the next section.
Infrastructures 2018, 3, 3 12 of 18
Table 2. The objectives of the sensors for railway track monitoring.
Objective Sensor Placement
Train speed, acceleration Strain gauge RailAccelerometer Rail, sleeper, railbed
Train load, dynamic load Strain gauge RailAccelerometer Rail, sleeper, railbed
Settlement Inclinometer Rail, sleeper, railbedLVDT Rail, sleeper, railbed
Settlement probe Railbed
Wheel-rail defect Strain gauge RailAccelerometer Rail
Acoustic emission Rail
Soil water content, pore pressure Piezometer RailbedTensiometer Railbed
7. Sensor Placement
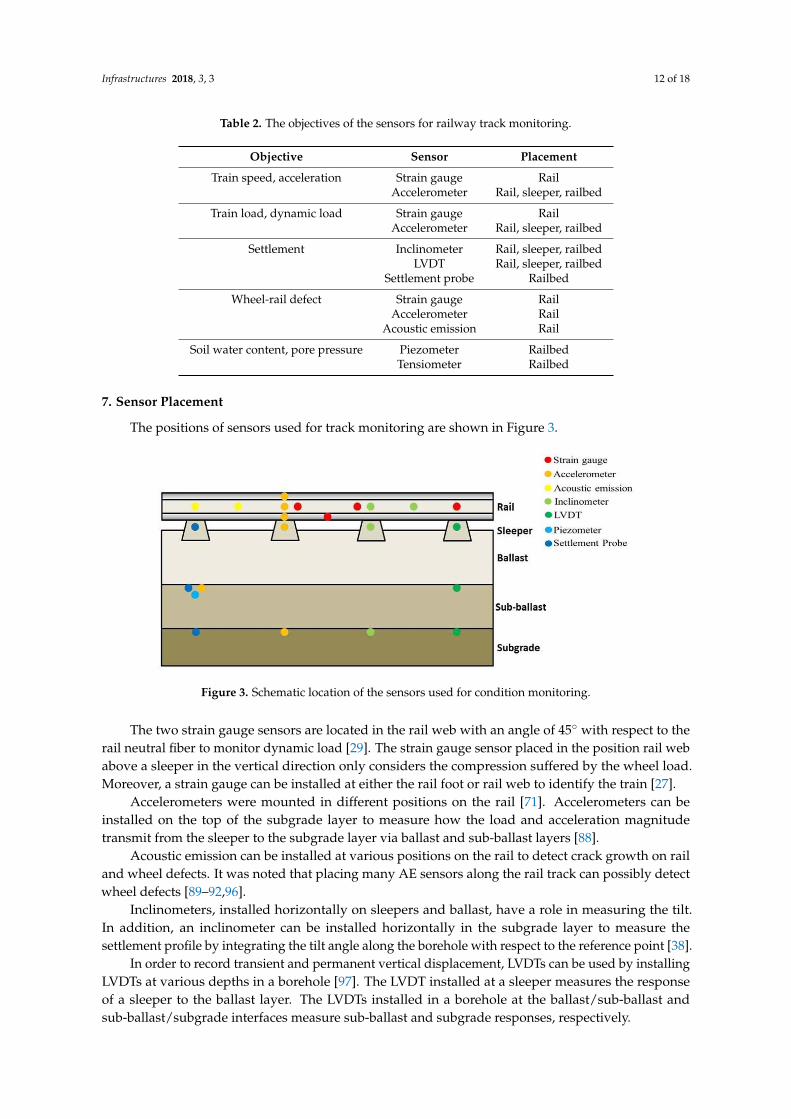
The positions of sensors used for track monitoring are shown in Figure 3.
Infrastructures 2018, 3, 3 12 of 17
LVDT Rail, sleeper, railbed Settlement probe Railbed
Wheel-rail defect Strain gauge Rail Accelerometer Rail Acoustic emission Rail
Soil water content, pore pressure Piezometer Railbed Tensiometer Railbed
7. Sensor Placement
The positions of sensors used for track monitoring are shown in Figure 3.
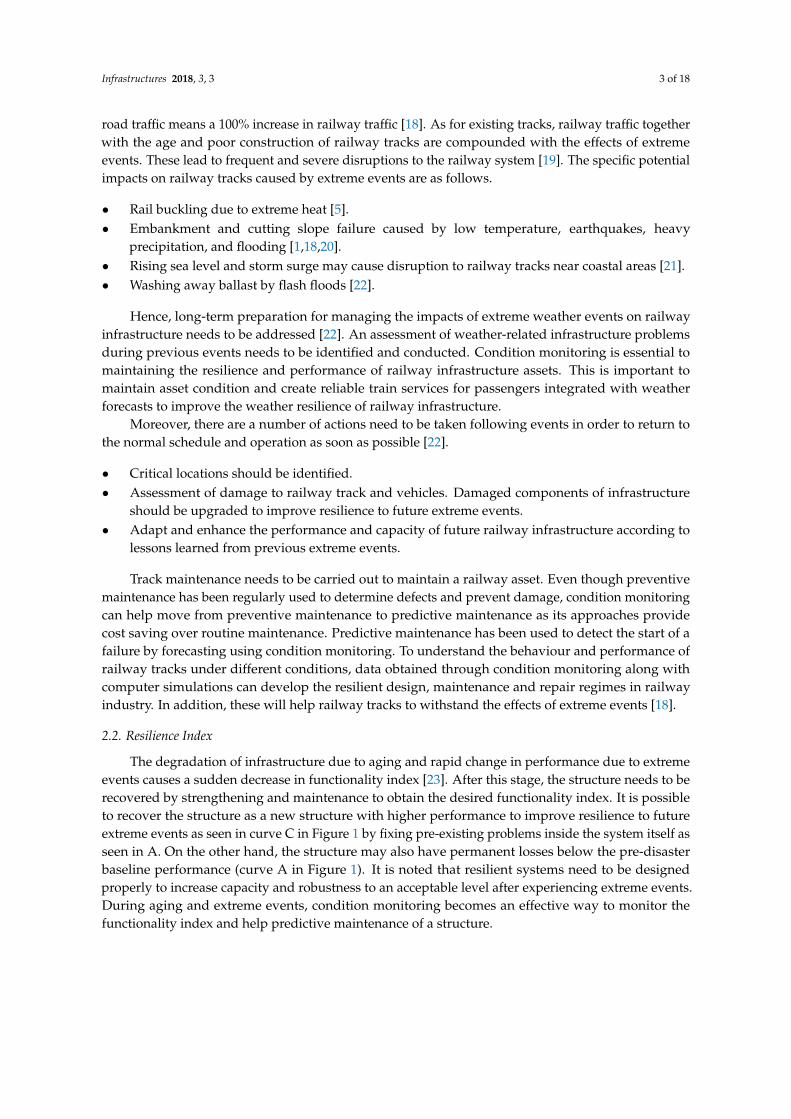
Figure 3. Schematic location of the sensors used for condition monitoring.
The two strain gauge sensors are located in the rail web with an angle of 45° with respect to the rail neutral fiber to monitor dynamic load [29]. The strain gauge sensor placed in the position rail web above a sleeper in the vertical direction only considers the compression suffered by the wheel load. Moreover, a strain gauge can be installed at either the rail foot or rail web to identify the train [27].
Accelerometers were mounted in different positions on the rail [71]. Accelerometers can be installed on the top of the subgrade layer to measure how the load and acceleration magnitude transmit from the sleeper to the subgrade layer via ballast and sub-ballast layers [88].
Acoustic emission can be installed at various positions on the rail to detect crack growth on rail and wheel defects. It was noted that placing many AE sensors along the rail track can possibly detect wheel defects [89–92,96].
Inclinometers, installed horizontally on sleepers and ballast, have a role in measuring the tilt. In addition, an inclinometer can be installed horizontally in the subgrade layer to measure the settlement profile by integrating the tilt angle along the borehole with respect to the reference point [38].
In order to record transient and permanent vertical displacement, LVDTs can be used by installing LVDTs at various depths in a borehole [97]. The LVDT installed at a sleeper measures the response of a sleeper to the ballast layer. The LVDTs installed in a borehole at the ballast/sub-ballast and sub-ballast/subgrade interfaces measure sub-ballast and subgrade responses, respectively.
The piezometer can be installed at any depth of soil. However, the top of the sub-grade was considered as a good place for the sensor because this is the critical location that contained peak pore pressure [91,98]. The pore pressure can easily dissipate from the subgrade to the ballast layer during the train passage. After installation, the hole was backfilled by in situ soil [38] Moreover, a settlement probe can be installed easily through a diameter hole by auger at any depth and orientation. This has a high flexibility for installation and placement [88].
Figure 3. Schematic location of the sensors used for condition monitoring.
The two strain gauge sensors are located in the rail web with an angle of 45◦ with respect to therail neutral fiber to monitor dynamic load [29]. The strain gauge sensor placed in the position rail webabove a sleeper in the vertical direction only considers the compression suffered by the wheel load.Moreover, a strain gauge can be installed at either the rail foot or rail web to identify the train [27].
Accelerometers were mounted in different positions on the rail [71]. Accelerometers can beinstalled on the top of the subgrade layer to measure how the load and acceleration magnitudetransmit from the sleeper to the subgrade layer via ballast and sub-ballast layers [88].
Acoustic emission can be installed at various positions on the rail to detect crack growth on railand wheel defects. It was noted that placing many AE sensors along the rail track can possibly detectwheel defects [89–92,96].
Inclinometers, installed horizontally on sleepers and ballast, have a role in measuring the tilt.In addition, an inclinometer can be installed horizontally in the subgrade layer to measure thesettlement profile by integrating the tilt angle along the borehole with respect to the reference point [38].
In order to record transient and permanent vertical displacement, LVDTs can be used by installingLVDTs at various depths in a borehole [97]. The LVDT installed at a sleeper measures the responseof a sleeper to the ballast layer. The LVDTs installed in a borehole at the ballast/sub-ballast andsub-ballast/subgrade interfaces measure sub-ballast and subgrade responses, respectively.
Infrastructures 2018, 3, 3 13 of 18
The piezometer can be installed at any depth of soil. However, the top of the sub-grade wasconsidered as a good place for the sensor because this is the critical location that contained peak porepressure [91,98]. The pore pressure can easily dissipate from the subgrade to the ballast layer duringthe train passage. After installation, the hole was backfilled by in situ soil [38] Moreover, a settlementprobe can be installed easily through a diameter hole by auger at any depth and orientation. This has ahigh flexibility for installation and placement [88].
8. Conclusions
This paper presents an overview of railway track condition monitoring and the definition andfunctions of sensor requirements. The main aims of railway track monitoring are to identify thepossible damage, provide real time condition, improve safety and reliability, and help move fromscheduled maintenance and preventative maintenance to future predictive maintenance. The recentresearch advances on the use of sensors for railway track measurement have been reviewed. Presently,wireless sensor networks have sometimes been being used instead of conventional wired systems asthey provide more benefits in terms of cost and ease of installation process. Moreover, this techniqueshows good performance in extreme events. However, the difficultly with the wireless system isthe transmission process from sensor to base station and then to server as it consumes high energy.The comparisons between wired and wireless systems have been discussed. The sensors used in boththe structure and sub-structure of railway tracks, such as strain gauge, accelerometer, piezometeretc., have been reviewed. It can be seen that the sensing technology has been developed in order totackle the effect of the environment. The sensors for subgrade measurement have also been discussedbecause this area also has a significant effect on track behaviour. Due to the increase in traffic andload demands, damage detection in railway track will become more significant because railway tracksand its vulnerable components will have more sensitivity to train load and harsh environments.In the future, more data will be collected and the number of sensors used might increase due tothe increase in extreme events in the wider area. Therefore, the energy efficiency and transmissionmechanisms must be developed in order to provide reliable and consistent communication for furtherrequirements. The insight information can be used to improve track monitoring for condition-basedtrack maintenance.
Acknowledgments: The first author gratefully appreciates the School of Engineering and Birmingham Centre forRailway Research and Education for his Ph.D. scholarship. The authors are sincerely grateful to the EuropeanCommission for the financial sponsorship of the H2020-RISE Project No. 691135 “RISEN: Rail InfrastructureSystems Engineering Network”, which enables a global research network that tackles the grand challenge ofrailway infrastructure resilience and advanced sensing in extreme environments (www.risen2rail.eu) [99].
Author Contributions: C.N. wrote the manuscript in consultation with S.K. and B.J.A.C. All authors providedcritical feedback and helped shape the manuscript.
Conflicts of Interest: The authors declare no conflict of interest.
References
1. Oslakovic, I.S.; Maat, H.T.; Hartmann, A.; Dewulf, G. Climate Change and Infrastructure Performance:Should We Worry About? Procedia Soc. Behav. Sci. 2012, 48, 1775–1784. [CrossRef]
2. Koetse, M.J.; Rietveld, P. The Impact of Climate Change and Weather on Transport: An Overview of EmpiricalFindings. Transp. Res. Part D 2009, 14, 205–221. [CrossRef]
3. Leviäkangas, P.; Tuominen, A.; Molarius, R.; Kojo, H.; Schabel, J.; Toivonen, S.; Keränen, J.; Ludvigsen, J.;Vajda, A.; Tuomenvirta, H.; et al. Extreme Weather Impacts on Transport Systems; EWENT Project DeliverableD1; VTT Technical Research Centre of Finland: Espoo, Finland, 2011.
4. Wenzel, H. Health Monitoring of Bridges; John Wiley & Sons: New York, NY, USA, 2009.5. Dobney, K.; Baker, C.J.; Quinn, A.D.; Chapman, L. Quantifying the effects of high summer temperatures due
to climate change on buckling and rail related delays in south-east United Kingdom. Methorol. Appl. 2009,16, 245–251. [CrossRef]

Infrastructures 2018, 3, 3 14 of 18
6. Sogabe, M.; Asanuma, K.; Nakamura, T.; Kataoka, H. Deformation behaviour of ballasted track duringearthquakes. Q. Rep. RTRI 2013, 54, 104–111. [CrossRef]
7. Ferreira, L.; Murray, M.H. Modelling rail track deterioration and maintenance: Current practices and futureneeds. Transp. Rev. 1997, 17, 207–221. [CrossRef]
8. Chang, P.C.; Flatau, A.; Liu, S.C. Review Paper: Health Monitoring of Civil Infrastructure. Struct. Health Monit.2003, 2, 257–267. [CrossRef]
9. Cullington, D.W.; MacNeil, D.; Paulson, P.; Elliot, J. Continuous acoustic monitoring of groutedpost-tensioned concrete bridges. In Proceedings of the 8th International Structural Faults and RepairConference, London, UK, 13–15 June 1999.
10. Aktan, A.E.; Catbas, F.N.; Grimmelsman, K.A.; Tsikos, C.J. Issues in infrastructure health monitoring formanagement. J. Eng. Mech. 2009, 126, 711–724. [CrossRef]
11. Charles, R.F.; Worden, K. An introduction to structural health monitoring. Philos. Trans. R. A Soc. 2007, 365,303–315. [CrossRef]
12. Yun, C.B.; Min, J. Smart Sensing, Monitoring, and Damage Detection for Civil Infrastructures. KSCE J. Civ. Eng.2011, 15, 1–14. [CrossRef]
13. Hodge, V.J.; O’Keefe, S.; Weeks, M.; Moulds, A. Wireless Sensor Networks for Condition Monitoring in theRailway Industry: A Survey. IEEE Trans. Intell. Transp. Syst. 2015, 16, 1088–1106. [CrossRef]
14. Goodall, R.; Roberts, C. Concepts and techniques for railway condition monitoring. In Proceedings of theIET International Conference Railway Condition Monitoring, Birmingham, UK, 29–30 November 2006.
15. Zhao, F.; Guibas, L.J. Wireless Sensor Networks: An Information Processing Approach; Morgan KaufmanPublishers: San Francisco, CA, USA, 2004.
16. Dhakal, D.R.; Neupane, K.; Thapa, C.; Ramanjaneyulur, G.V. Different techniques of structural healthmonitoring. IJCSEIERD 2013, 3, 55–66.
17. Lynch, J.P.; Sundararajan, A.; Law, K.H.; Kiremidjian, A.S.; Carryer, E.; Sohnd, H.; Farrard, C.R. Fieldvalidation of a wireless structural monitoring system on the Alamosa Canyon Bridge. In Proceedings ofthe SPIE’s 10th Annual International Symposium on Smart Structures and Materials, San Diego, CA, USA,2–6 March 2003.
18. Powrie, W. On track: The future for rail infrastructure systems. Civ. Eng. Spec. Issue 2014, 167, 177–185.[CrossRef]
19. Armstrong, J.; Preston, J. Adapting railways to provide resilience and sustainability. Eng. Sustain. 2017, 170,225–234. [CrossRef]
20. Leviäkangas, P.; Hautala, R. Benefits and value of meteorological information services—The case of theFinnish Meteorological Institute. Meteorol. Appl. 2009, 16, 369–379. [CrossRef]
21. Dawson, D.; Shaw, J.; Gehrels, W.R. Sea-level rise impacts on transport infrastructure: The notorious case ofthe coastal railway line at Dawlish, England. J. Transp. Geogr. 2016, 51, 97–109. [CrossRef]
22. Jaroszweski, D.; Quinn, A.; Baker, C.; Hooper, E.; Kochsiek, J.; Schultz, S.; Silla, A. Guidebook for EnhancingResilience of European Railway Transport in Extreme Weather Events; The MOWE-IT Project; Management ofWeather Events in the Transport System: Espoo, Finland, 2014.
23. Cimellaro, G.P.; Reinhorn, A.M.; Bruneau, M. Framework for analytical quantification of disaster resilience.Eng. Struct. 2010, 32, 3639–3649. [CrossRef]
24. Kołakowski, P.; Szelazek, J.; Sekuła, K.; Swiercz, A.; Mizerski, K.; Gutkiewicz, P. Structural health monitoringof a railway truss bridge using vibration-based and ultrasonic method. Smart Mater. Struct. 2011, 20.[CrossRef]
25. Sala, D.; Motylewski, J.; Koaakowsk, P. Wireless transmission system for a railway bridge subject to structuralhealth monitoring. Diagnostyka 2009, 50, 69–72.
26. Sekula, K.; Kolakowski, P. Piezo-based weigh-in-motion system for the railway transport. Struct. ControlHealth Monit. 2012, 19, 199–215. [CrossRef]
27. Balas, V.; Jain, L. World knowledge for sensors and estimators by models and internal models. J. Intell.Fuzzy Syst. 2010, 21, 79–88.
28. Filograno, M.L.; Guillen, P.C.; Rodriguez-Barrios, A.; Martin-Lopez, S.; Rodriguez-Plaza, M.; Andres-Alguacil, A.;Gonzalez-Herraez, M. Real-time monitoring of railway traffic using fiber Bragg grating sensors. IEEE Sens. J.2012, 12, 85–92. [CrossRef]
Infrastructures 2018, 3, 3 15 of 18
29. Belotti, V.; Crenna, F.; Michelini, R.; Rossi, G. Wheel-flat diagnostic tool via wavelet transform. Mech. Syst.Signal Process. 2006, 20, 1953–1966. [CrossRef]
30. Remennikov, A.M.; Kaewunruen, S. A review on loading conditions for railway track structures due towheel and rail vertical interactions. Struct. Control Health Monit. 2008, 15, 207–234. [CrossRef]
31. Kaewunruen, S.; Minoura, S.; Watanabe, T.; Remennikov, A.M. Remaining service life of railway prestressedconcrete sleepers. In Proceedings of the International RILEM Conference on Materials, Systems andStructures in Civil Engineering, Lyngby, Copenhagen, 21–24 August 2016.
32. Kaewunruen, S.; Chamniprasart, K. Damage analysis of spot replacement sleepers interspersed in ballastedrailway tracks. In Proceedings of the 29th Nordic Seminar on Computational Mechanics, Gotenburg, Sweden,26–28 October 2016.
33. Esveld, C. Modern Railway Track; Delft University of Technology: Delft, The Netherlands, 2001.34. Kaewunruen, S.; Remennikov, A.M. On the residual energy toughness of prestressed concrete sleepers in
railway track structures subjected to repeated impact loads Electronic. J. Struct. Eng. 2013, 13, 41–61.35. Kaewunruen, S.; Remennikov, A.M. Dynamic flexural influence on a railway concrete sleeper in track system
due to a single wheel impact. Eng. Fail. Anal. 2009, 16, 705–712. [CrossRef]36. Kaewunruen, S.; Remennikov, A.M. Dynamic properties of railway track and its components: Recent
findings and future research direction. Insight-Non-Destr. Test. Cond. Monit. 2010, 52, 20–22. [CrossRef]37. Ngamkhanong, C.; Li, D.; Kaewunruen, S. Impact capacity reduction in railway prestressed concrete sleepers
with surface abrasions. In Proceedings of the World Multidisciplinary Civil Engineering-Architecture-UrbanPlanning Symposium, Prague, Czech Republic, 12–16 June 2017.
38. Aw, E.S. Low Cost Monitoring System to Diagnose Problematic Rail Bed: Case Study of Mud Pumping Site.Ph.D. Thesis, Massachusetts Institute of Technology, Cambridge, MA, USA, 2007.
39. Ngamkhanong, C.; Kaewunruen, S.; Baniotopoulos, C. A review on modelling and monitoring of railwayballast. Struct. Monit. Maint. 2017, 4, 195–220.
40. Glendinning, S.; Hall, J.; Manning, L. Asset-management strategies for infrastructure embankments. Proc. ICEEng. Sustain. 2009, 162, 111–120. [CrossRef]
41. Ghataora, G.S.; Rushton, K. Movement of Water through Ballast and Subballast for Dual-Line Railway Track.Transp. Res. Rec. 2012, 2289, 78–86. [CrossRef]
42. Li, D.; Selig, E. Method for Railway Track Foundation Design. J. Geotech. Geoenviron. Eng. 1998, 124, 316–329.[CrossRef]
43. Ayres, D.J. Geotextiles or Geomembranes in Track? British Railways’ Experience. Geotext. Geomembr. 1986, 3,129–142. [CrossRef]
44. Blacklock, J.R. Night ‘n’ Day Track Study to Cure Subgrade Woes. Railw. Track Struct. 1984, 25–30.45. Shafiullah, G.M.; Gyasi-Agyei, A.; Wolfs, P. Survey of Wireless Communications Applications in the Railway
Industry. In Proceedings of the 2nd International Conference on Wireless Broadband and Ultra WidebandCommunications, Piscataway, NJ, USA, 27–30 August 2007.
46. Bolle, V.; Banoth, S.K. Review on railway bridge & track condition monitoring system. Int. J. Adv. Res. IdeasInnov. Technol. 2016, 2, 1–5.
47. Lynch, J.P. An overview of wireless structural health monitoring for civil structures. Philos. Trans. R. Soc. A2007, 365, 345–372. [CrossRef] [PubMed]
48. Lloyd, E.L.; Xue, G. Relay Node Placement in Wireless Sensor Networks. IEEE Trans. Comput. 2006, 56,134–138. [CrossRef]
49. Baronti, P.; Pillai, P.; Chook, V.W.C.; Chessa, S.; Gotta, A.; Hu, Y.F. Wireless sensor networks: A survey on thestate of the art and the 802.15.4 and ZigBee standards. Comput. Commun. 2007, 30, 1655–1695. [CrossRef]
50. Aguado, M.; Onandi, O.; Agustin, P.S.; Higuero, M.; Jacob Taquet, E. WiMax on rails: A broadbandcommunication architecture for CBTC systems. IEEE Veh. Technol. Mag. 2008, 3, 47–56. [CrossRef]
51. Flammini, F.; Gaglione, A.; Ottello, F.; Pappalardo, A.; Pragliola, C.; Tedesco, A. Towards Wireless SensorNetworks for Railway Infrastructure Monitoring. In Proceedings of the Electrical Systems for Aircraft,Railway and Ship Propulsion (ESARS), Bologna, Italy, 19–21 October 2010.
52. Casas, J.R.; Cruz, P.J.S. Fiber Optic Sensors for Bridge Monitoring. J. Bridge Eng. 2003, 8, 362–373. [CrossRef]53. Askarinejad, H.; Dhanasekar, M.; Colel, C. Assessing the effects of track input on the response of insulted
rail joins using field experiments. J. Rail Rapid Transit 2012, 227, 176–187. [CrossRef]

Infrastructures 2018, 3, 3 16 of 18
54. Lagnebäck, R. Evaluation of Wayside Condition Monitoring Technologies for Condition-Based Maintenanceof Railway Vehicles. Master’s Thesis, Luleâ University of Technology, Luleâ, Sweden, 2007.
55. Barke, D.; Chiu, W. Structural health monitoring in the railway industry: A review. Struct. Health Monit.2005, 4, 81–93. [CrossRef]
56. Cortis, D.; Bruner, M.; Malavasi, G.; Rossi, S.; Catena, M.; Testa, M. Estimation of the wheel-rail lateralcontact force through the analysis of the rail web bending strains. Measurement 2017, 99, 23–35. [CrossRef]
57. Kaewunruen, S.; Wang, Y.; Ngamkhanong, C. Derailment-resistant performance of modular composite railtrack slabs. Eng. Struct. 2018, 160, 1–11. [CrossRef]
58. Stratman, B.; Liu, Y.; Mahadevan, S. Structural Health Monitoring of Railroad Wheels Using Wheel ImpactLoad Detectors. J. Fail. Anal. Prev. 2007, 7, 218–255. [CrossRef]
59. Luyckx, G.; Voet, E.; Lammens, N.; Degrieck, J. Strain measurements of composite laminates with embeddedfibre Bragg gratings: Criticism and opportunities for research. Sensors 2011, 11, 384–408. [CrossRef] [PubMed]
60. Kinet, D.; Mégret, P.; Goossen, K.W.; Qiu, L.; Heider, D.; Caucheteur, C. Fiber Bragg Grating sensors towardstructural health monitoring in composite materials: Challenges and solutions. Sensors 2014, 14, 7394–7419.[CrossRef] [PubMed]
61. Ye, X.W.; Su, Y.H.; Han, J.P. Structural health monitoring of civil infrastructure using optical fiber sensingtechnology: A comprehensive review. Sci. World J. 2014, 2014, 652329. [CrossRef] [PubMed]
62. Hill, K.O.; Fujii, Y.; Johnson, D.C.; Kawasaki, B.S. Photosensitivity in optical fiber waveguides: Applicationto reflection fiber fabrication. Appl. Phys. Lett. 1978, 32, 647–649. [CrossRef]
63. Meltz, G.; Morey, W.W.; Glenn, W.H. Formation of Bragg gratings in optical fibers by a transverse holographicmethod. Opt. Lett. 1989, 14, 823–825. [CrossRef] [PubMed]
64. Tam, H.Y.; Liu, S.Y.; Guan, B.O.; Chung, W.H.; Chan, T.H.T.; Cheng, L.K. Fiber Bragg Grating Sensors forStructural and Railway Applications. In Advanced Sensor Systems and Applications II 5634, Proceedings of theSPIE on CD-ROM, Photonics Asia, Beijing, China, 8–12 November 2004; Society of Photo-Optical InstrumentationEngineers: Bellingham, WA, USA, 2005.
65. Tam, H.Y.; Lee, T.; Ho, S.L.; Haber, T.; Graver, T.; Méndez, A. Utilization of Fiber Optic Bragg Grating SensingSystems for Health Monitoring in Railway Applications. In Proceedings of the 6th International Workshopon Structural Health Monitoring, Stanford, CA, USA, 11–13 September 2007.
66. Kouroussis, G.; Caucheteur, C.; Kinet, D.; Alexandrou, G.; Verlinden, O.; Moeyaertm, V. Review of TracksideMonitoring Solutions: From Strain Gages to Optical Fibre Sensors. Sensors 2015, 15, 20115–20139. [CrossRef][PubMed]
67. Lee, I.; Yoon, G.H.; Park, J.; Seok, S.; Chun, K.; Lee, K. Development and analysis of the vertical capacitiveaccelerometer. Sens. Actuators A 2005, 119, 8–18. [CrossRef]
68. Ohtani, T. Development of a wheel-flat detection system. In Proceedings of the 11th International WheelsetConference, Paris, France, 18–22 June 1995.
69. Barke, D.W.; Chiu, W.K. A review of the effects of out-of-round wheels on track and vehicle components.J. Rail Rapid Transit 2005, 219, 151–175. [CrossRef]
70. Alemi, A.; Corman, F.; Lodewijks, G. Condition monitoring approaches for the detection of railway wheeldefects. J. Rail Rapid Transit 2017, 231, 961–981. [CrossRef]
71. Kalay, S.; Tajaddini, A.; Stone, D.H. Detecting Wheel Tread Surface Anomalies; American Society of MechanicalEngineers, Rail Transportation Division: New York, NY, USA, 1992.
72. Matej Andrejašic, M. MEMS Accelerometers; Department of Physics, Faculty for Mathematics and PhysicsUniversity of Ljubljana: Ljubljana, Slovenia, 2008.
73. Grosse, C.U.; Kruger, M. Wireless acoustic emission sensor networks for structural health monitoring incivil engineering. In Proceedings of the European Conference Non Destructive Testing, Berlin, Germany,25–29 September 2006.
74. Grosse, C.U.; Finck, F.; Kurz, J.H.; Reinhardt, H.W. Monitoring techniques based on wireless AE sensors forlarge structures in civil engineering. In Proceedings of the EWGAE 2004 Symposium in Berlin, BB90, Berlin,Germany, 15–17 September 2004; pp. 843–856.
75. Glaser, S.D. Some Real-World Applications of Wireless Sensor Nodes. In Proceedings of the SPIE Symposiumon Smart Structures & Materials, San Diego, CA, USA, 14–18 March 2004.
76. Glaser, S.D. Advanced Sensors for Monitoring Our Environment. In Proceedings of the 1st InternationalSymposium on Advanced Technology of Vibration and Sound, Miyajima, Japan, 1–3 June 2005.
Infrastructures 2018, 3, 3 17 of 18
77. Yu, Y.; Ou, J.; Zhang, J.; Zhang, C.; Li, L. Development of wireless MEMS inclination sensor system for swingmonitoring of large-scale hook structures. IEEE Trans. Ind. Electron. 2009, 56, 1072–1078.
78. Krebs, P. High Performances MeMs Accelerometers Are Used in Railway Applications; Railway TechnologyInternational; Advanced Electronics: Neuchâtel, Switzerland, 2015.
79. Hoult, N.; Bennett, P.J.; Stoianov, I.; Soga, K. Wireless sensor networks: Creating ‘smart infrastructure’.Civ. Eng. 2009, 162, 136–143. [CrossRef]
80. Björn Paulsson, B.; Olofsson, J.; Elfgren, L.; Holm, G. Sustainable Bridges—Assessment for Future TrafficDemands and Longer Lives; Integrated Project in the Sixth Framework Programme on Research, TechnologicalDevelopment and Demonstration of the European Union, FP6-PLT-001653; Dolnoslaskie WydawnictwoEdukacyjne: Wrocław, Poland, 2006.
81. Thakkar, N.A.; Steel, J.A.; Reuben, R.L. Rail–wheel interaction monitoring using Acoustic Emission:A laboratory study of normal rolling signals with natural rail defects. Mech. Syst. Signal Process. 2010, 24,256–266. [CrossRef]
82. Yılmazer, P.; Amini, A.; Papaelias, M. The Structural health condition monitoring of rail steel using acousticemission techniques. In Proceedings of the 51st Annual Conference of the British Institute of Non-DestructiveTesting (NDT 2012), Northamptonshire, UK, 11–13 September 2012.
83. Thakkar, N.A.; Steel, J.A.; Reuben, R.L.; Knabe, G.; Dixon, D.; Shanks, R.L. Monitoring of rail-wheelinteraction using Acoustic Emission (AE). J. Adv. Mater. Res. 2006, 13–14, 161–167. [CrossRef]
84. Anastasopoulos, A.; Bollas, K.; Papasalouros, D.; Kourousis, D. Acoustic Emission On-Line Inspection ofRail Wheels. In Proceedings of the 29th European Conference on Acoustic Emission Testing, Vienna, Austria,8–10 September 2010.
85. Aboelela, E.; Edberg, W.; Papakonstantinou, C.; Vokkarane, V. Wireless sensor network based model forsecure railway operations. In Proceedings of the 25th IEEE International Performance Computing andCommunication Conference, Phoenix, AZ, USA, 10–12 April 2006.
86. Cañete, E.; Chen, J.; Daíz, M.; Llopis, L.; Rubio, B. Sensor4PRI: A Sensor Platform for the Protection ofRailway Infrastructures. Sensors 2015, 15, 4996–5019. [CrossRef] [PubMed]
87. Drumm, E.C.; Reeves, J.S.; Madgett, M.R.; Trolinger, W.D. Subgrade Resilient Modulus Correction forSaturation Effects. J. Geotech. Geoenviron. Eng. 1997, 123, 663–670. [CrossRef]
88. Aw, E.S. Novel Monitoring System to Diagnose Rail Track Foundation Problems. Master’s Thesis, MassachusettsInstitute of Technology, Cambridge, MA, USA, 2004.
89. Dunnicliff, J. Geotechnical Instrumentation for Monitoring Field Performance; Wiley: Hoboken, NJ, USA, 1988.90. Casagrande, A. Soil Mechanics in the design and Construction of the Logan Airport. J. Boston Soc. Civ. Eng.
1949, 36, 192–221.91. Wong, R.; Thomson, R.; Choi, R. In situ pore pressure responses of native peat and soil under train load:
A case study. J. Geotech. Geoenviron. Eng. 2006, 132, 1360–1369. [CrossRef]92. Deardorff, G.B.; Lumsden, A.M.; Hefferon, W.M. Pneumatic piezometers: Multiple and single installations
in vertical and inclined boreholes. Can. Geotech. J. 1980, 17, 313–320. [CrossRef]93. Baum, R.L.; Godt, W.; Harp, E.L.; McKenna, I.P.; McMullen, S.R. Early warning of landslides for rail
traffic between Seattle and Everett. In Proceedings of the Landslide Risk Manage, Washington, DC, USA,31 May–3 June 2005.
94. Scullion, T.; Briggs, R.C.; Lytton, R.L. Using the multidepth deflectometer to verify modulus backcalculationprocedures. In Nondestructive Testing of Pavements and Back Calculation of Moduli; ASTM International:West Conshohocken, PA, USA, 1989.
95. Mishra, D.; Qian, Y.; Huang, H.; Tutumluer, E. An integrated approach to dynamic analysis of railroad tracktransitions behaviour. Transp. Geotech. 2014, 1, 188–200. [CrossRef]
96. Bollas, K.; Papasalouros, D.; Kourousis, D.; Anastasopoulos, A. Acoustic emission inspection of rail wheels.J. Acoust. Emiss. 2010, 28, 215–228.
97. Stark, T.D.; Wilk, S.T. Root cause of differential movement at bridge transition zones. J. Rail Rapid Transit2015, 230, 1257–1269. [CrossRef]
Infrastructures 2018, 3, 3 18 of 18
98. Alobaidi, I.; Hoare, D.J. Development of Pore Water Pressure at the Subgrade Subbbase interface of aHighway Pavement and its Effect on Pumping of Fines. Geotext. Geomembr. 1996, 14, 111–135. [CrossRef]
99. Kaewunruen, S.; Sussman, M.J.; Akira, M. Grand Challenges in Transportation and Transit Systems.Front. Built Environ. 2016, 2. [CrossRef]
© 2018 by the authors. Licensee MDPI, Basel, Switzerland. This article is an open accessarticle distributed under the terms and conditions of the Creative Commons Attribution(CC BY) license (http://creativecommons.org/licenses/by/4.0/).