State of the Art in the 3D Cardiovascular Visualization
24
Table of Contents 1. INTRODUCTION ................................................................................................................ 2 2. OVERVIEW OF FLOW VISUALIZATION ....................................................................... 3 3. VISUALIZATION PIPELINE ............................................................................................. 4 3.1. Data Acquisition ........................................................................................................... 4 3.2. Data Enrichment/Enhancement .................................................................................... 5 3.2.1. Filtering..................................................................................................................... 5 3.2.2. Data Selection ........................................................................................................... 5 3.2.3. Interpolation .............................................................................................................. 5 3.3. Visualization Mapping .................................................................................................. 5 3.4. Rendering and Display.................................................................................................. 7 3.5. Visualization Pipeline Summary................................................................................... 7 4. FLOW VISUALISATION CLASSIFICATION .................................................................. 8 4.1. Research in Flow Visualization .................................................................................... 9 4.1.1. Integration-based and Geometric flow visualization technique ................................ 9 4.1.2. Dense and Texture Based technique ....................................................................... 13 5. ANALYSIS AND DISCUSSION....................................................................................... 18 6. APPLICATIONS AND AVAILABLE SYSTEMS............................................................ 22 7. CONCLUSION ................................................................................................................... 22 REFERENCES ........................................................................................................................... 23
-
Upload
teknologimalaysia -
Category
Documents
-
view
1 -
download
0
Transcript of State of the Art in the 3D Cardiovascular Visualization

Table of Contents 1. INTRODUCTION ................................................................................................................ 2
2. OVERVIEW OF FLOW VISUALIZATION ....................................................................... 3
3. VISUALIZATION PIPELINE ............................................................................................. 4
3.1. Data Acquisition ........................................................................................................... 4
3.2. Data Enrichment/Enhancement .................................................................................... 5
3.2.1. Filtering ..................................................................................................................... 5
3.2.2. Data Selection ........................................................................................................... 5
3.2.3. Interpolation .............................................................................................................. 5
3.3. Visualization Mapping .................................................................................................. 5
3.4. Rendering and Display .................................................................................................. 7
3.5. Visualization Pipeline Summary ................................................................................... 7
4. FLOW VISUALISATION CLASSIFICATION .................................................................. 8
4.1. Research in Flow Visualization .................................................................................... 9
4.1.1. Integration-based and Geometric flow visualization technique ................................ 9
4.1.2. Dense and Texture Based technique ....................................................................... 13
5. ANALYSIS AND DISCUSSION....................................................................................... 18
6. APPLICATIONS AND AVAILABLE SYSTEMS ............................................................ 22
7. CONCLUSION ................................................................................................................... 22
REFERENCES ........................................................................................................................... 23

STATE OF THE ART IN THE 3D CARDIOVASCULAR VISUALIZATION
Yusman Azimi Yusoff 1, Farhan Mohamed 1, Mohd Shahrizal Sunar 1, Sanjiv Joshi Hari
Chand 2
1 UTM-IRDA Digital Media Centre, Media and Game Innovation Centre of Excellence,
Universiti Teknologi Malaysia, Skudai, Malaysia
2 National Heart Institute (IJN), Kuala Lumpur, Malaysia
[email protected], [email protected], [email protected], [email protected]
1. INTRODUCTION
The area of knowledge in scientific visualization applicable in many research field.
Scientific visualization is known with the ability to graphically illustrate the data and enable the
researchers to understand the information hidden in the datasets. This knowledge is actively
studied and applied in most of the research area including automotive industry, meteorological,
medical and engineering. Methods of visualizing datasets are dependent on the researchers’
interest. Scientific visualization can be divided into two more topics which are surface or
volume visualization and flow visualization. The taxonomy of flow visualization is shown in
Error! Reference source not found.. Surface volume visualization focuses on visualizing
scalar information inside the datasets while flow visualization is focusing on visualizing vector
data.
Both the surface volume visualization and flow visualization are widely used in biomedical
engineering especially in research related to cardiovascular. Currently, bio-medical researchers
are using engineering methods to find and solve problems related to the cardiovascular system.
In this case, researchers apply the knowledge in computer graphic as well as computational
fluid dynamic to solve the problem related to the blood flow analysis, myocardium and the
arteries network in the cardiovascular system. Scientific visualization becomes handy in these
areas because the traditional methods of finding region of interest in cardiovascular is by
studying and interpreting the medical images with bare eyes. Scientific visualization is able to
extend the medical data by constructing a virtual heart and arteries in a virtual environment.
Surface and volume visualization are used to visualize the wall and the tissue of the heart, while
flow visualization is used to visualize the blood flow. Along the pipeline, there are several
processes that are required to be followed before the final visualization result can be produced.
This chapter describes the process and method of flow visualization used in 3D
cardiovascular study. Some of the terms used in the explanation are derived from the computer
science and medical body of knowledge. The first section will detail out the taxonomy of the
flow visualization from computer science perspective. The second section will cover the
overview of flow visualization. The third section will explain the concept and framework of
data visualization along with the component inside the framework. The fourth section will
classify flow visualization method based on the spatial resolution. The fifth section will discuss
the impact and future direction of flow visualization in the cardiovascular research. The sixth
section will describe some of the readily available software on the market that applied flow
visualization knowledge to assist the cardiovascular studies. The last section will conclude the
content as well as the future work related with the cardiovascular visualisation.

Computing Methodologies
...Simulation,
Modeling, and Visualization
... Visualization
Flow visualization
Information visualization
Volume visualization
Figure 1. Domain Hierarchy/Structured Taxonomy of flow visualization [1]
2. OVERVIEW OF FLOW VISUALIZATION
Before going further into the domain of flow visualization, it is good to have a short
explanation about some of the important information about the flow visualization itself.
Traditionally, flow visualization was important in the physical experimental approach to study
the fluid behaviour due to several reasons:
• to imitate real cases without any calculation
• to test and new model or theory
Although experimental approach is able to simulate the situation in real time, there are
some problems raised in this approach. The result of the experimental approach usually affected
by the probe used to show the flow phenomena. Secondly, there are also flow phenomena such
as dynamic turbulent that are not possible to be visualised by using the experimental approach.
Conducting this approach consumes which is unaffected by the size of the experiments either in
small or large scale of experiments.
The research in flow visualization has becoming rapidly active after computer
simulation was introduced to simulate the flow phenomena. The increasing computational
capability allows researchers to use computer to execute complex numerical calculation and
simulation in flow visualisation. This technique is known as computer-aided visualization and is
used widely until today in various research field. There are several benefits of using computer-
aided visualisation compared to experimental visualization. The simulation process does not
require any physical resources since it is done virtually. The calculation time is dependent on
the complexity of the flow problem it’s solving. The model and setup for the simulation is done
virtually thus no inherent problem in finding and preparing the experiment materials.

Computer-aided visualization also allows in-depth exploration within the simulation
result. This feature allows researchers to focus clearly on the critical area without disturbing the
flow structure. Different techniques in flow visualization also allow visualising different type
flow patterns. Flow can be represented with visual representation such as hedgehog, glyphs,
streamlines, time lines, and stream surface. Each of the techniques has its own advantage in
highlighting the important feature of the fluid structure. Flow visualization technique will be
discussed extensively in the following section.
Practically, both experimental and computer-aided visualization are used to support
each other. In most of the industry that study the fluid dynamics, computer-aided visualization
is used to assist the creation of a suitable engineering prototype. The prototype is then produced
physically and tested with the experimental visualization. The result of experimental
visualization is then compared with computer-aided visualization result for verification. There
are also conditions where researchers used experimental visualization to verify their numerical
formula to solve fluid simulation problems.
3. VISUALIZATION PIPELINE
Flow visualization pipeline consist of series of phases. Haber and McNabb [2] present
three main transformation of a process in conceptual visualization. The pipeline converts raw
data acquired from the simulation result into an informative image. Those three phases start
with Data Enrichment or Enhancement, following with Visualization Mapping and end with
Rendering process. The pipeline has been improved in [3] by adding one more stage of Data
Acquisition phase. Figure 2 shows the complete visualization pipeline commonly used in
visualising scientific data.
Figure 2. Flow visualisation framework
3.1. Data Acquisition
The first phase in the visualization pipeline is called data acquisition. Flow data can be
generated by instrument measurement, numerical simulation or roughly direct observation.
Instrument measurement is used to acquire flow data in experimental visualization. The result of
flow data in the experimental visualization can be derived either by measuring the flow or
Data Acquisition
Data Enrichment/Enhancement
Visualization Mapping
Rendering and Display

analysing series of images through image processing. Numerical flow simulation is able to
produce vector and scalar data. Vector data in this case is the velocity field itself and scalar data
is referring to the density, pressure or temperature. On the other hand, volume visualization
used different technique in extracting the desired data from the raw. Further explanation about
volume visualization is discussed in the following section.
3.2. Data Enrichment/Enhancement
The data acquired will be enriched or enhanced in the second phase. The aim of this phase is to
improve the content of information. Not all data acquired can be directly visualized since it is
usually not possible to be used in the next phase. Methods such as sampling, filtering,
interpolation, and domain transformation are used to enrich or enhance the data before proceed
to the next phase.
3.2.1. Filtering
Data measured in the first phase often comes with the undesired information and noises. These
elements will disturb the process of visualization mapping and leads to visible error and poor
interpretation of the data. Thus, filtering operation is required to remove these disturbances in
the data acquired. Furthermore, certain filters are useful in highlighting important features in the
data, while other filters are used to dampened unrelated information.
3.2.2. Data Selection
Data selection operations are done to improve the upcoming result by selecting region of
interest portion of the data. In most cases, data acquired from the simulation result is in large
spaces where some of the area in the simulation are not related. Data selection is carried out by
removing the area of non-important parts of the data. There are also advance methods in data
selection in order to achieve a better visualization. For example, the important feature of the
flow field can be highlighted by choosing the area which the velocity change rapidly. This kind
of task requires further calculation in order to select a part of the data.
3.2.3. Interpolation
Simulation positioned the flow data in a grid arrangement so each grid points has the velocity
information. An interpolation operation is required in finding and generating new velocity data
to fill in the points between the grid points. The order of the interpolation depends on the
accuracy desired before executing the operation.
3.3. Visualization Mapping
The third phase in the pipeline focuses on converting the flow data into a visual representation.
Visual Mapping can be consider as the core in the visualization pipeline. This phase cover the
process of preparing the data into the desired visual presentation including other features such
as lights and colours. One of the ways to choose the visualization method is by knowing the
formula that compute the numerical simulation. In flow visualization, there are two types of
well-known formula used to calculate the flow features which are the Eulerian and the
Lagrangian functions. Eulerian can be described as observing the motion of fluid at a specific
position in an area as the fluid flows throughout the time. This type of flow can be represent
using arrow plot which able to show the flow velocity at each grid point. On the other hand,
Lagrangian can be describe as observing the motion of the fluid where a parcel of fluid is track

as it flow along the space and time. The visualization results by using Lagrangian is usually
presented as an animation of particular particle which shows the particle flow path through
time.
The enhanced data be will represented by the standard visualization mapping. In the
experimental flow visualization, flow is commonly represented with velocity arrow,
streamlines, streak lines, path lines and contour. These methods are also known as direct
method since it can be shown during the experimental process is carried out. Other primitive
method of visualizing flow also can be used such as points, lines and surfaces. There are pros
and cons for every visualization mapping method. Therefore, it is prefer to have a clear
understanding for each technique ability before using the method to visualize the flow.
This chapter focuses on the integration-based and dense/texture-based flow
visualizations. Primarily all vector visualizations are visualised by using the simple direct
visualization approach. Direct visualization uses glyphs to represent vector information. Glyphs
are usually in the form of arrow, icon or shape that able to show the direction and magnitude of
the vector. Each grid point will be placed by a glyph and the direction and size is dependent on
the vector and magnitude. This is one of the example of Eulerian formulation result. Glyph able
to show the global representation of flow pattern and is suitable to be used in 2 dimensional
(2D) flow data. Direct method is not suitable to be used with 3 dimensional (3D) flow data
because of several visual perception problems such as occlusion and confusion. More
explanation will be discuss in the rendering section.
Integration-based flow visualization is introduced to convey richer information from the
visualization. First, flow data is integrated using integrated-based approach and geometric
object is used as the foundation to visualize the flow. Examples of geometric-based
visualization are streamlets, streamlines, streak lines, and path lines. Streamlets is the result of
flow vector integration in a short period of time. Streamlets able to show the flow pattern
progression along the flow data. Streamlines is the extensions of streamlets through integration
of multiple streamlets features. In a 3D incompressible flow, streamlines are curve that satisfy
the equation , (1):
𝑑𝑥
𝑢=
𝑑𝑦
𝑣=
𝑑𝑧
𝑤, (1)
Where the velocity component of 𝑥- , 𝑦- and 𝑧- directions are represented by 𝑢, 𝑣, and 𝑤. This
method cover longer flow pattern and convey more information. These two methods are usually
used with steady flow data.
Streaklines, timelines and pathlines are much better method in studying unsteady flow
data. Unlike streamlets and streamlines, these three methods are able to show the flow pattern
along the time. Streaklines is the method of tracing a sets of particles that passes through a
position in the space. Another ways of understanding streaklines is by releasing particles into a
fluid flow continuously. The pattern shown by the particles along the flow space is the example
of streaklines. Timelines approach involves integrated lines from a set of particles that are
released at different position within the same time step. The generated line is perpendicular to
the direction of the particle movement but move with the particles. Lastly, pathlines or also
known as particle trace is the temporal path of the particle in the fluid flow. The generated line
is the trajectory of particle through time.

Another approach of visualizing the flow is known as dense or texture-based flow
visualization. This approach is different from integration-based where it provide global flow
pattern by blurring noise texture along the vector field. One of the earliest work related with this
approach is the Line Integral Convolution (LIC) which will be covered in Section 4. Figure 3
shows the input required in order to produce the visualization result using LIC. The selection of
input noise also plays an important role in constructing the visualization result. Improvements
made for this approach, which improved the texture-based result with additional features are
discussed in Section 4.
Figure 3. Input required in Line Integral Convolution [4].
3.4. Rendering and Display
After the data is successfully mapped, it will be transformed images that will be display
to the viewers. This process require computer graphic knowledge in order to carry out numbers
of operation such as setting up the viewing angle and backface culling. The scene of the mapped
visualization will be rendered to become a displayable image. The viewing frustum controls the
viewing angle and the region that will be showed as the visualization images. The hidden or
obstructing object in the scene will also be removed in the process. Other additional operation
such as anti-aliasing, shading, ray tracing are also implemented in this process. After the
mapped visualization is rendered, it will be displayed on the display device. Pixels of the
rendered images will be loaded into the frame buffer. Further operations are required to
generate animation for interactive and animated visualization display. The visualization is pre-
rendered and the images are organised accordingly to tailor it with the display properties.
3.5. Visualization Pipeline Summary
Figure 4 shows the processes involved for different visualization approaches.. Not
discussed in this chapter are the Feature- and topology-based approaches. These two approaches
have similar processes and results with integration-based visualization. The key difference is
that these two approaches highlight the critical point of flow pattern. In conclusion, each flow
visualization approaches has each own benefits and drawbacks. The choice of visualization
approach depend on the flow data properties and perspective required by the viewer.

Figure 4. Approach available flow from data acquisition process to display.
4. FLOW VISUALISATION CLASSIFICATION
This section is intended to share with readers on important flow visualization works.
Some of key paper related to 3D cardiovascular visualization are detailed out before going deep
into classifying flow visualization work. This classification allows the reader to focus and
understand the related works which introduced different flow visualization methods. The
classification is based on the data dimension involved in flow visualization approaches.
Generally, flow visualization works can be classified into 2D and 3D flow data. This
categorisation will allow readers to focus the works streamed to the input data domain.
The source most of scientific visualization data is based on the spatial resolution. For
example, wind tunnel produced a 3D vector dataset while cloud movement can be transformed
into a 2D vector dataset. Figure 5 shows the example of 2D air stremlets from [5] and 3D air
flows [6] visualizations. Researchers implement different algorithms and optimize it based on
the data before producing the flow visualization. The algorithm used to generate the
visualization is the main focus of this paper. These algorithms may change the way of
positioning the seed point, flow presentation and visualization focus area.
Display
Data Acquisition
Direct
Visualization
Geometry
Extraction
Visualization
Dense texture-
based
visualization
Feature
Extraction
Visualization
Geometry
Extraction

Figure 5 (a) Flow visualization using Streamlet on a 2D plane [5]. (b) Interactive flow
visualization with different visualization technique with locally define Cartesian grid [6].
In medical domain, most of the patient data are acquired from CT-Scan or MRI
machine during screen process to identify the patient health problem. These machines are able
to produce patient data from three different views. Each view consists of layer of images that
made up the data. Volume visualization can be used to extract and generate graphical
representation of the medical data based on the specific parameters. In general, there are two
types of flow visualization, which are the indirect and direct volume rendering. Indirect volume
visualization approach used algorithm such as contour tracing, cuberille, and marching cube [7]
to process and reconstruct the surface on an object from the volume data. Meanwhile, direct
volume visualization used techniques such as law of physics approach (e.g., emission,
absorption, and scattering).
4.1. Research in Flow Visualization
Most of the work done in flow visualization fall into visualization mapping phase
because this stage is crucial in transforming raw data to informative, graphical flow
representations. In the early days, flow visualization work were focused on improving 2D flow
visualization. Apparently, 3D flow data availablily through simulations and research in fluid
mechanics has made 3D visualization an important research field. These complex multi-
dimensional data have encouraged the development of new algorithms in visualizing flow data.
4.1.1. Integration-based and Geometric flow visualization technique
Seed Placement Strategy
Most of the research in integration based visualization focus of the seed placement
strategy and curve or geometric object generation process. These two areas highlight different
important properties from the flow features. The sub-sections will focus on seed placement
strategy and the followed by the geometric object generation process.
An improved method for streamlines placement is proposed in [8]. They used image-
guided technique to place streamlines in a proper place and gap by using low-pass filter in the
energy function. This will show the visual density difference between the current and the target
images. The approach reduces the density, thus improving the placement of streamlines by
altering the position and length of streamlines, combining the near adjacent lines and creating
a b

new streamlines to fill the large gap. The result manifests a better hand-placed appearance than
a regular or randomly–placed streamlines.
In order to generate an evenly spaced streamlines, an algorithm developed in [9] to
visualize 2D steady flow. The contribution of the work was to compute a wide range of flow
field sources (texture based up to hand-drawing style). The result produced clean, long, and
evenly-spaced streamlines with accurate control of visual density. The visualization lines are
less cluttered, making it easier to convey the flow information. However, this technique has
difficulties in visualizing small turbulence in large flow field due to the property of the method.
Another seeding strategy was presented in [10] to improve the seed placement by using
the information from the flow features in the data sets. The aim of the approach is to identify the
flow pattern in the critical points even when the density of the streamlines is reduced. They also
emphasised streamlines placements at the non-critical regions with varies streamlines length to
make a clear visualization through out the dataset. The advantages of this method is that the
flow pattern close to the critical point can be visualized. The drawback of this method is it does
not handle higher order critical points but it can be extend to place seed correctly in the area of
higher order critical points.
A novel algorithm focusing on high quality placement to generate long streamlines is
proposed. The algorithm focuses on placement of streamlines based on the 2D steady flow
vector or direction field [11]. The goal of the algorithm is to produce a high quality placement
by favouring long streamlines, while retaining the uniform pattern with increasing density. This
can be achieve by placing one streamlines at a time with the help of numerical integration
starting at the furthest away from all previous placed streamlines. This technique manage to
achieve the simplicity, robustness and efficiency by applying the Delaunay triangulation to
generate the streamlines.
An advance evenly-spaced streamlines placement algorithm is presented in [12] was
introduced as improvement of work done in [9]. They employed a fourth-order Runge-Kutta
integrator and adaptive step size error control to acquire rapid accurate streamlines advection. In
order to reduce the amount of distant checking, they adopt Cubic Hermite polynomial
interpolation with large sample spacing to create fewer evenly-spaced sample along the
streamlines. They also propose an ideal loop detection strategy to handle spiralling and closed
streamlines. The results shows the algorithm perform faster than algorithm in [9] based on the
order-of-magnitude.
Encouraged by the idea of abstract drawing which focuses on the explanatory quality in
art, a new seeding strategy is proposed in [13] to generate illustrative 2D streamlines that
focuses on visual clarity and evidence. The basic idea of the algorithm is to highlight the flow
field effectively with a minimum set of streamlines. In order to produce the result, 2D distance
filed is generated to identify the distance between each grid point to the nearby streamlines.
Local metric is derived to calculate the dissimilarity between the original fields to the
approximate field based on the distance field. Global metric assist the process of identifying the
dissimilarity of the streamlines pattern based on the local metric result and decide whether to
generate new seed point at the local point. The process is repeated until there is no more
dissimilarity found in the flow field. There are 3 benefits of this technique firstly, the density of
streamlines is related to the natural flow features of the vector field. Secondly, the technique do
not rely on the detecting the critical point. Lastly, the most important point is the result reduce

the visual cluttering problem. The drawback of this technique is that the performance is lesser
that the technique proposed in [12] which is faster and do not depend on the flow field feature.
Animation
Animating the streamlines can improve the viewers’ understanding about the flow
visualization. This concept is implemented in [14] where they developed a unique technique to
animate streamlines based on the data structure called Motion Map. This data structure valuable
information such as flow field dense representation and motion information required to animate
the flow. The advantage of using method is that computing the Motion Map does not consume
more time than computing a single flow image and this step only required to execute once. The
result is much better if compare to LIC-based technique. The main drawback of the technique is
that it only able to be used with 2D steady flow. Future work will address the issues of
animating the unsteady flow and add another dimension to become 3D flow.
Method of animating streamlines is improved in [15] by using a new approach to
produce a complete cyclic with variable-speed animation for 2D steady vector fields based on
work in [8], [9]. The animation frames are encoded in a single image and played using colour
table animation technique. The cyclic effect can be produced as well and then encoded in a
common animation format or used it for texture mapping on 3D objects. The advantages of this
technique is that the animation produce is smoother and optimize in term of memory
requirement and the computation duration.
Another work related to the animation in flow visualization is presented in [16] which
also focusing in unsteady flow. Streamlines generation method is modified in order to visualize
unsteady flow by using specialized Navier-Stoke equation. The unsteady flow input is integrate
in the time domain as the flow field temporal resolution increased. A grid hierarchy is
implement to the seed point in order to produce evenly spaced streamlines and control the
densities of the streamlines. Figure 6 shows the pseudo code on implementation of grid
hierarchy in streamlines generation. The algorithm successfully reduce the amount of sample
calculated while maintaining the accuracy of the streamlines tracing process.

Figure 6. Pseudo code for streamlines generation algorithm [16]
Optimization
Optimization is important in flow visualization because of the high computational
process in visualizing flow data. A system is develop in [17] to improve 3D flow visualization.
The aim of the work is to overcome the limitation of bandwidth between CPU and GPU as well
as the computation capability. The work presented used particle system to visualize flow
interactively by accelerating the particle integration process and avoid the rendering process for
transferring targeted particle sets. They utilize the capability of the graphic processing unit of
GPU in order to fasten the particle advection process. Data transfer between CPU and GPU is
nearly avoided caused some essential APIs call is required from CPU side to start the GPU
operation. The position of the particle is stored in the graphic memory to ease of access of
obtaining images in the frame buffer. This system allow millions of particle to be rendered and
streamed interactively with the virtual exploration features.
The computation cost used to visualize flow has increase from time to time as the
simulation capability improved in producing complex result. Since then, parallel computing is
used in flow visualization to distribute the computational cost among connected node but there
are less work focusing on partitioning the flow datasets. Motivated by this problem, a work on
optimizing the parallel performance for flow visualization is presented in [18]. They able to
repartition the flow data based in the flow direction and the features for large unstructured flow
data. The partitioned data will be stored in the distributed-memory and each processor able to
focus on specific streamlines without passing streamlines generation process back and forth to
other processors. Conventional method of partitioning the flow data does not focus on the flow
visualization process. This will lead to increasing in time and computational cost. By assigning
the partition based on the seed point and the flow feature, the process is able to obtain good load
balance among the processors.
Similar work also done in [19] to improve time and streak surfaces generation process
for large unsteady flow data sets. A novel algorithm is proposed in solving the problem of
generating surfaces for unsteady flow. Surface advection and adaptation is separated which
proc hierarchical_streamline()
{
create_multilevel_grids(numLevel,grids);
for(each level)
do {
trace_one_level_streamlines(level);
if(level<MAX) filter_short_streamlines(level);
if(level<MAX) set_next_level_flag(level+1);
if(level<MAX) extend_streamlines(level+1);
}
}
proc trace_one_level_streamlines(level)
{
for(each cell)
do {
if(unmarked(cell)=True){ seed = create_seed(cell);
if(is_valid(seed)==True) trace_streamline(seed); }
}
}
improve the surface tracking method by executing both of the process at the same time at
different CPU core. The algorithm able to produce high quality rendering result with interactive
visualization of time and streak surface. Their work also able to show the temporal evolution of
the surface. This method also able to solve some of the obstacles of seeding placement for
surface in large flow dataset by pre-compute the path of the seed curve.
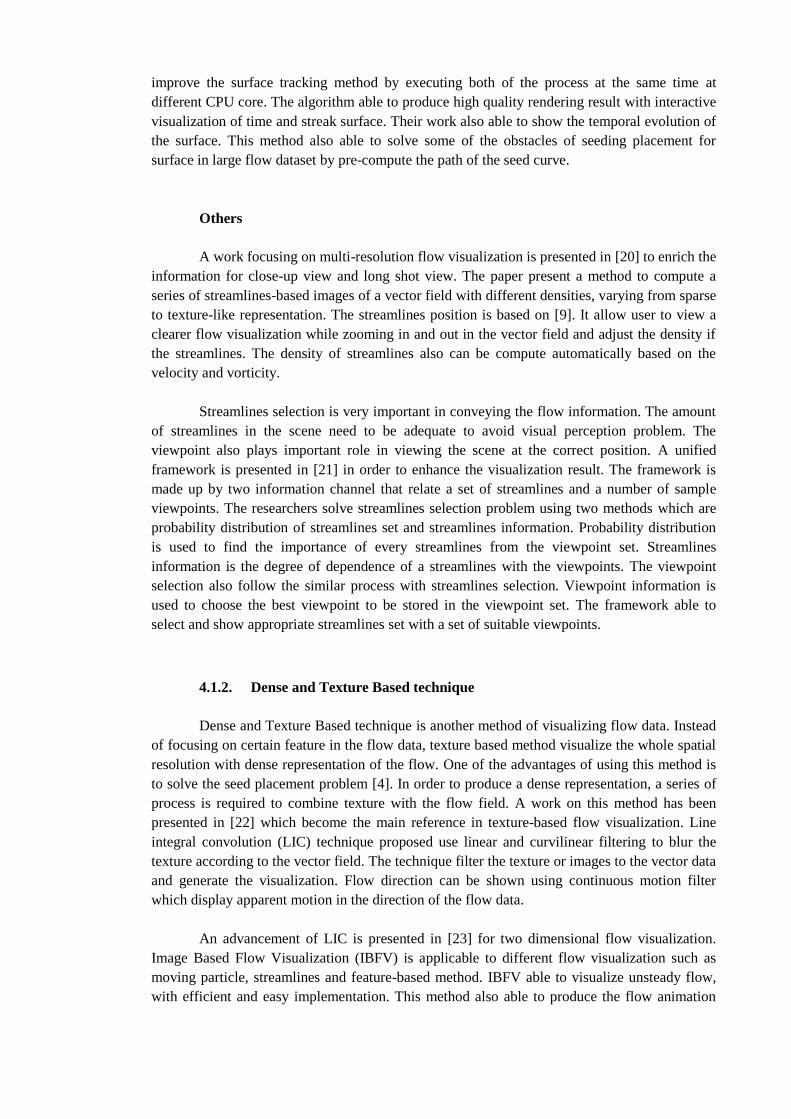
Others
A work focusing on multi-resolution flow visualization is presented in [20] to enrich the
information for close-up view and long shot view. The paper present a method to compute a
series of streamlines-based images of a vector field with different densities, varying from sparse
to texture-like representation. The streamlines position is based on [9]. It allow user to view a
clearer flow visualization while zooming in and out in the vector field and adjust the density if
the streamlines. The density of streamlines also can be compute automatically based on the
velocity and vorticity.
Streamlines selection is very important in conveying the flow information. The amount
of streamlines in the scene need to be adequate to avoid visual perception problem. The
viewpoint also plays important role in viewing the scene at the correct position. A unified
framework is presented in [21] in order to enhance the visualization result. The framework is
made up by two information channel that relate a set of streamlines and a number of sample
viewpoints. The researchers solve streamlines selection problem using two methods which are
probability distribution of streamlines set and streamlines information. Probability distribution
is used to find the importance of every streamlines from the viewpoint set. Streamlines
information is the degree of dependence of a streamlines with the viewpoints. The viewpoint
selection also follow the similar process with streamlines selection. Viewpoint information is
used to choose the best viewpoint to be stored in the viewpoint set. The framework able to
select and show appropriate streamlines set with a set of suitable viewpoints.
4.1.2. Dense and Texture Based technique
Dense and Texture Based technique is another method of visualizing flow data. Instead
of focusing on certain feature in the flow data, texture based method visualize the whole spatial
resolution with dense representation of the flow. One of the advantages of using this method is
to solve the seed placement problem [4]. In order to produce a dense representation, a series of
process is required to combine texture with the flow field. A work on this method has been
presented in [22] which become the main reference in texture-based flow visualization. Line
integral convolution (LIC) technique proposed use linear and curvilinear filtering to blur the
texture according to the vector field. The technique filter the texture or images to the vector data
and generate the visualization. Flow direction can be shown using continuous motion filter
which display apparent motion in the direction of the flow data.
An advancement of LIC is presented in [23] for two dimensional flow visualization.
Image Based Flow Visualization (IBFV) is applicable to different flow visualization such as
moving particle, streamlines and feature-based method. IBFV able to visualize unsteady flow,
with efficient and easy implementation. This method also able to produce the flow animation

with the frame rates up to 50 on a conventional graphic hardware and feature. Error!
Reference source not found. visualizes the process for the image based flow visualization.
Figure 7. Image based flow visualization processes [23]
Assume the image set that usually has the similar features is ready to process. The animation
process is achieve by projecting the image onto rectangular meshes and move the mesh point to
a distance based on the local flow. The process continue by render and distort the images. There
are several problem of the process is repeated. The deformation accumulated will produce a
cells with different shape from the initial shape. This can be solve by repeating the same step on
the same rectangular shape mesh. The flow advection also will cause the initial image will be
distorted and hidden from the viewport. In order to solve this problem, the new image is blend
with the distorted image to preserve the result for the next iteration.
The work on IBFV is extended in [24]. They introduce image based flow visualization
for curved surface (IBFVS) method which based on image warping and blending based on a
single framework. The use mesh of triangular to create the geometric model for the surface.
This allow the model to be cover mostly by the texture because of property of triangle mesh
which is a generic format. Increasing the number of the triangle also will increase the level of
detail of the result. The algorithm also perform faster by exploiting the ability of graphic
processor. Figure 8 show the pipeline for IBFVS. The method start by initializing the texture to
the model with specific background colour. Texture coordinate is calculated for all vertices
before it is render and mapped without shading. Then, noise is blend on the surface. The blend
result is stored to be used for the next cycle before the shaded is rendered and blend together for
the final result. IBFVS inherit the advantages of its predecessor which can be implemented and
able to produce different kind of effect.

Figure 8. Image based flow visualization for curved surface [24].
Another similar work presented in [25] which also focus on dense representation of
flow field on the surface. They come out with new algorithm that able to generate dense
representation of fluid flow on complex surface from the computational fluid dynamics named
Image Space Advection (ISA). The algorithm also can be used to visualize other flow data
related with surface. The conventional method of texture-based is start by mapping the 2D
texture to the surface geometry in the 3D space. The mapped textured is then rendered to the
image space. The algorithm operate differently than the conventional method by projecting the
surface geometry first before applying the texture. This method allow texture advection to be
done in the image space, resulting a well flow visualization using dense representation. It can
visualize flow on a sophisticated surface which consist more than 200,000 polygons. User
interaction also is enable for operation such as translation, zooming and rotation. This method
also able to animate the visualization up to 20 frame per second on robust meshes with time-
dependent geometry. A detail comparison of ISA and IBFVS is discuss in [26] which highlight
the strength and weakness of both methods. The paper also suggest the appropriate situation to
use each methods.
Transfer function is usually used in volume visualization in arranging the colour and the
opacity of the volume in the scalar field. One of the effective ways of assigning these features is
by using Multi-Dimensional Transfer Function (MDTF). As the texture-based visualization
method for 3D flow data is capturing researchers attention, it is important to introduce a similar
MDTF that can be implement to steady and unsteady flow data. driven by this cause, a work is
presented in [27] that develop MDTFs for 3D flow visualization. Vector field properties derived
from vector field calculus is used to map with the transfer function. Vector calculus can provide
transfer function with properties such as velocity magnitude, velocity, curl magnitude, gradient
tensor determinant, divergence and helicity based on the 3D flow field. These properties is
combined to form the new MDTF. It allow viewers to explore and highlight flow features
interactively in 3D flow field. they implement MDTF with 3D IBFV method in [28] in order to
produce image based flow visualization for 3D flow dataset. Figure 9 show the interface to
control the MDFT and apply it on tornado dataset. Each component can be adjust to highlight
certain feature of the flow visualization. For example, Figure 9(a) show the option to show flow

features with high curl magnitude with orange to red colour while separate the region of high
positive and high negative of divergence value with blue and white colour. One of the major
advantages of applying MDTF into the 3D flow dataset is it able to overcome the occlusion
problem which has been the major drawback of flow visualization in 3D.
Figure 9(a). Five component which are vector magnitude, velocity gradient tensor determinant,
curl magnitude, helicity and divergence that used to control MDTF. Figure 9(b). The flow
visualization result of 3D IBFV with MDTF [27].
One of the problems that is left aside in flow visualization research is the uncertainties
of data that caused by various factors, such as noises from data acquisition process and
properties in display process [29]. A work related to with uncertainty in flow visualization is
presented in [30]. They present two new methods in order to visualize the uncertainty in 2D
unsteady flow dataset. The first error filtering method used cross advection method which
applies perpendicularly to the flow direction. The basic concept of this method is to move the
particle towards the flow direction literally and then generate streaklines before smearing the
particle. This will produce a one dimensional convolution which looks like the conventional
texture-based flow visualization. The second method is error diffusion which implement
Gaussian filtering that employs 2D isotropic filter kernel. Unlike the first method, it does not
depend on the flow direction and the effect of the diffusion filter is blurs in all direction. Linear
interpolation between a complete Gaussian kernel and an identity mapping is used to construct
the filter. The uncertainty value is used as a weightage for the constructed filter. This will
produce a variety of result from an identity mapping in region with no uncertainty value up to
the standard Gauss filter with highest uncertainty value. Error! Reference source not found.
shows the flow visualization result of uncertainty for both methods. The difference between
both methods is show in Figure 1, notice that the smear and blur effect is obvious when the
streaklines have high uncertainty value.
(a) (b)

Figure 90. (a) Result of the cross advection method. (b) Result using Gaussian error
diffusion method [30].
As the hardware performance improved, the rendering performance for texture-based
flow visualization also increased. But some of the methods are not high spatial-correlated cause
by messy flow direction in the visualization and low intensity contrast between streamlines. A
work in [31] has presented an algorithm to enhance unsteady flow visualization using texture-
based method with the ability to produce high spatial-temporal coherence animation at
interactive rates. The input texture for the initial LIC convolution used random noise that
represent the massless particle. 1D high-pass filtering flow texture is used to enhance
streamlines along the orthogonal flow direction. This process allow spatial coherence for every
image frames to reveal the pattern that represent the flow structure of the vector data. User able
to identify the motion consistency in the flow pattern due to high quality of temporal coherence
which is achieved by convoluting the texture property iteratively. Error! Reference source not
found.Error! Reference source not found. show the comparison of result between FastLIC
method and the presented method. The streamlines produced much clearer thus provide better
information about the flow pattern. The algorithm also implement on the surface with several
improvement in vector projection on surface, texture convolution edge detection and
supplement [32]. The result of the algorithm is a well rendered texture with the presence of
streamlines showing the flow pattern.
(a) (b)
Figure 81. Comparison of cross advection (left) and error diffusion (right) effect on the
streaklines [30].

Figure 12. Comparison result of FastLIC (left) and result of proposed algorithm (right) [31].
Another similar work that produce streamlines-like texture-based flow visualization is
presented in [33]. They develop a thickness function of streamline and wave source. These
function are used to process and generate an image with a coherent wave interference pattern.
This works is motivated by the advantage of texture-based method which able to show global
flow structure and streamlines able to produce high contrast result with simple (computation for
integral and rendering of lines) and low computational cost. They come out with an ideal
framework based on fully-automated eigenvalue computation scheme. This framework only
require two parameter which are base streamlines thickness and thickness variation. The method
start by using affinity function between image pixels corresponding to the streamlines thickness.
The intensity of each pixels is presented in the visualization image as a total of coherent
sinusoidal wave. The wave is propagated from its neighbourhood in the space induced by the
function. The result of the texture-based visualization is neat, free from fuzzy and able to be
converted to black and white vector graphic if required for further processing.
Image-space method able to generate dense representation of flow pattern with better
performance compared to surface parameterization method. This is because it only focus on the
visible surface from a given viewpoint. Technically, the method project the vector field and
geometry of the surface to the viewing screen and then apply texture advection in the image
space. But it face a problem when the user change the viewpoint. This method cannot maintain
the texture consistency when user rotate or change the viewpoint distance. This is because the
noise textured generated independently for every frames on the image space during viewpoint is
moved. In order to solve this problem, a novel image-space visualization technique is presented
in [34] to handle texture inconsistency by proposing a fix texture position to each vertex with a
triangular-texture matching method. This technique will hold the texture in place at different
viewpoint position and angle thus avoiding the texture inconsistency.
5. ANALYSIS AND DISCUSSION
We have classified the approaches in flow visualization into two categories of 2D and
3D data which include integration-based and dense or texture-based methods. There are other
approaches which are not included in the classification such as feature and topology based
methods. Although both approaches show different ways of visualizing the flow pattern, the
focus of developing new visualizing method share the same goal which is to solve issues such
as visual artefacts, occlusion and perception problems, computing performance, visualization
quality, as well as optimization of the rendering process to achieve interactive frame rates. Each

approach has each own advantages and disadvantages. So, knowing the approach capabilities
will help in choosing the proper method to visualize the flow.
Integration-based approach in known with the ability to provide local flow pattern
information. The seed placement process is important in highlighting the crucial information in
the vector dataset. There are many well-developed algorithms for seed placement including the
reviewed algorithm in the section 4. Result produced by integration-based is also high in
contrast which clearly show the flow pattern. The core operation from computing the integral
curve up to rendering lines is basically low. The wide range of method available in this
approach give the choice to the researcher to implement it based on the dataset and visualization
requirement. Most of the integration-based approach do not has problem in visualizing 2D and
3D flow dataset as the approach is straightforward and only require vector data and seed point
positon to visualize the flow.
While integration-based approach is focusing on local flow pattern, texture-based able
show the global flow pattern by applying and convoluting the noise texture on the whole area of
the vector data. The process of implementing this approach is quite straightforward and has high
flexibility in generating different visualization output. It can produce a native texture-based
visualization up to resemble geometric lines for flow visualization. The output result can easily
be changed by adjusting the kernel and the input noise texture. This method is also GPU
friendly since most of the operations developed can be implemented on the GPU. Executing the
algorithm to the parallel processing on GPU with correct setting will boost the performance of
the algorithm.
There are different research of interest in flow visualization body of knowledge.
Researchers can contribute to various part of flow visualization pipeline in order to improve the
quality and performance of the visualization. Research focus that related with flow visualization
also depend on the approach discussed in section 4 of this chapter. Some of the focus area such
as optimization and animation are sometimes overlapping each others. Understanding the core
process of implementing these approaches will help to identify the domain of interest and the
possible contribution to flow visualization knowledge. Figure 1 shows the process in blue
colour border where researchers can improve in flow visualization. There are also shared
interests for the approaches that may or may not have the same implementation strategies.

Seed placement is the starting point of integration-based approach. It will determine the
characteristic of the flow visualization. The streamlines density is directly correlated to the seed
placement method. A dense streamlines does not mean the visualization is better because the
visual complexity also increase thus limiting the information that can be obtain by the viewer.
Same goes to texture-based flow visualization. The control parameters that affect the
visualization result are the input noise and the kernel. Any input noise texture can be used in
this approach but different kind of noises may highlight the flow pattern differently. The choice
of kernel gives a major visual effect in texture-based flow visualization. The length of the kernel
controls the streamlines length. The shape of the kernel decides the feature of the streamlines
and the characteristic of the filter. Usually, the kernel is preferable to have the features of a low-
pass filter that allow the viewer to recognize the line in the texture. Researchers can develop
new or improve current kernel in order to obtain clearer flow visualization by using texture-
based approach.
Research in solving the problem related visual artefacts are also becoming one of the
focuses in flow visualization domain. Occlusion and visual perception become major challenge
in visualizing the flow especially in 3D flow dataset. Occlusion often occur when the
visualization dense with visualization object or texture. Identifying the method to control the
density of the visualization as well as highlighting only the important part of the flow feature
will reduce the occlusion problem. Visual perception causes viewer to confuse in understanding
the visualization result. Error! Reference source not found. show an example of visual
perception. An arrow in the 3D space can be misinterpreted as pointing backward or forward.
The problem also can be found in flow visualization using streamlines where curve lines are
twirling at the same area. This open another research interest in flow visualization as there are
number of problems in this area available to be solved.
Flow Visualization
Integration-Based Texture-Based
Seed Placement
Share research interest in optimization
Animation Algorithm Resource
Management Rendering
Kernel Visual Artifact
Figure 103. Field of research interest in flow visualization

Figure 114. Visual perception problem occur in 3D space [3].
Flow visualization plays around with large datasets before come out with beautiful flow
visualization. The complexity of flow visualization increases if the dataset involved time-
dependent flow field. In many unsteady flow cases, finding a proper seed placement for
integration-based visualization can be a tedious task and costly to compute. Similar problem in
texture-based where series of post-processing is required to achieve good contrast and with
distinct flow feature. The increasing spatial and temporal resolution of the dataset also consume
a lot of machine memory. All of these problems require optimization algorithms that can solve
and improve the visualization process. Optimization also can be done to improve the usage of
hardware resources such as memory, CPU and GPU. For example, parallel processing able to
increase the performance of the process but it need to be implement in the correct way.
Rendering process and animation process also shared by both flow visualization
approach. Rendering cover a number of process before displaying the result. One of the
processes that can be improved is the view transformation process. Viewpoint help to enhance
the result by displaying the flow pattern at a position and angle which capture the important
information. Finding a proper viewpoint will leads to a better understanding about the flow
information. Other processes that can be improved such as hidden surface removal, filtering
(motion blur and anti-aliasing), and lighting also fall into rendering process.
Researchers can also look into problems in animating flow visualization. Animation can
reveal more information about the flow pattern by pre-computing series of frames and play it
back together. Real time animation can be achieve by rendering the frames during display. Both
methods have its own advantages and disadvantages. Pre-computed frame can produce
smoother animation but require longer time to process. Real-time and fast animated
visualization display is achievable but highly dependent on the data and visualization
complexity. The viewpoint is required to be properly placed in getting the best view of the flow
pattern before producing the animation. Animating unsteady flow also a tedious task because
the content of each frame is different. The velocity field needs to be computed for each frame in
tracing the particle position. For example, a total of 300 frames is required to be computed in
order to produce an animation with duration of 10 second with 30 frame per second. Optimizing
the velocity field computation will assist by shortening the time taken to produce the animation.
Algorithms for identifying proper viewpoints and paths between them are also useful in
increasing the information comprehension from the animated visualization.

6. APPLICATIONS AND AVAILABLE SYSTEMS
Flow visualization has been used widely in scientific visualization especially in the
study of aerodynamics, meteorology, oceanography, fluid mechanics as well as medical. In this
section, two applications related to flow visualization in cardiovascular will be described. In
general, most of the clinician or medical practitioners do not prefer flow visualization as a
method in supporting the decision making process related to cardiovascular diseases. Flow
visualization in cardiovascular only provides the flow of blood inside the heart and related
vessel. Doppler ultrasound is being used as one of the convenient ways to study the blood flow
inside the heart. The result is much more reliable and accepted by medical practitioner. Recent
research on flow visualization in cardiovascular has improved a lot in term of quality and
performance. They also come out with software that available for research and commercial use.
One of the software that available for researchers is FourFlow. FourFlow is an open
source, clinically applicable and user friendly software developed by researchers from Cardiac
MR Group in Department of Clinical Physiology / Clinical Sciences, Lund University. The
software is able to do quantitative visualization of 3D time dependent including three
directional blood flow inside the heart. The software is based on ParaView which is a well-
developed application for scientific visualization. Some of the scientific visualization operation
that can be done using this software are particle trace, streamlines, animation and isosuface
visualization. One of the work that related with the software has been publish in [35] which
study a volume tracking method for qualitative assessment and visualization of blood flow
inside the heart.
Morpheus Imaging, Inc., one of member of StartX network, a Stanford acceleration
program for entrepreneur has developed a 4D flow MRI imaging technology to assess and
visualize the blood flow within the heart. The process is done by using real time cloud
technology to achieve an accurate 4D intracardiac flow data from conventional MRI scanner.
The technology connects several machines in the cloud to compute and produce the result using
an advanced processing algorithm. The product has received market clearance from the
European Union and US FDA which means that the result of the system is trusted and reliable.
7. CONCLUSION
Flow visualization has become one of the most active research fields within the
scientific visualization community. General knowledge about flow visualization and related
researches has been reviewed. One of the research fields that benefited from flow visualization
is the cardiovascular blood flow study. The use of flow visualization in cardiovascular study is
increasing as there is potential to use flow visualization to solve problem related to blood flow
circulations. There are few research conducted on blood flow analysis which apply the flow
visualization knowledge to study and identify the flow pattern behaviour for patients with heart
problem. The study has the potential in helping the clinicians by showing the position of
irregular blood flow. The study also can be used to check the blood flow of a patient before and
after cardiovascular related operation.
The development of future Ventricular Assist Device (VAD) requires flow analysis in
identifying the best design in assisting the heart functions. Research related to VAD is
increasing. VAD is known to be one of the methods in treating patients with heart problem.

VAD design is very important because the device will be attached directly to the human heart.
Optimizing the flow inlet and outlet will ensure the device works as a healthy heart. There are
many other scientific applications of flow visualization where researchers are encouraged to
explore where flow visualization extends the common visual representations. Flow visualization
studies cover the importance of conveying vector information in a proper way, assisting viewers
to identify region of interests and assisting in the information comprehension from the
visualization.
REFERENCES
[1] “The ACM Computing Classification System (CCS).” [Online]. Available:
http://dl.acm.org/ccs.cfm. [Accessed: 14-Jan-2015].
[2] R. B. Haber and D. A. McNabb, “Visualization Idioms: A Conceptual Model for Scientific
Visualization Systems,” IEEE Computer Society Press, 1990. [Online]. Available:
http://helios.siggraph.org/education/materials/HyperVis/concepts/idio_sh.htm.
[Accessed: 18-Dec-2014].
[3] F. H. Post and T. van Walsum, Focus on Scientific Visualization. Berlin, Heidelberg:
Springer Berlin Heidelberg, 1993, pp. 1–40.
[4] R. Netzel and D. Weiskopf, “Texture-Based Flow Visualization,” Comput. Sci. Eng., vol.
15, no. 6, pp. 96–102, Nov. 2013.
[5] X. Mao, Y. Hatanaka, H. Higashida, and A. Imamiya, “Image-Guided Streamline Placement
on Curvilinear Grid Surfaces,” in Proceedings Visualization ’98 (Cat. No.98CB36276),
1998, vol. 98, pp. 135–142.
[6] M. Schulz, F. Reck, W. Bertelheimer, and T. Ertl, “Interactive Visualization of Fluid
Dynamics Simulations in Locally Refined Cartesian Grids,” in Proceedings
Visualization ’99 (Cat. No.99CB37067), pp. 413–553.
[7] W. Lorensen and H. Cline, “Marching cubes: A high resolution 3D surface construction
algorithm,” ACM Siggraph Comput. Graph., vol. 21, no. 4, pp. 163–169, 1987.
[8] G. Turk and D. Banks, “Image-Guided Streamline Placement,” in Proceedings of the 23rd
annual conference on Computer graphics and interactive techniques - SIGGRAPH ’96,
1996, pp. 453–460.
[9] B. Jobard and W. Lefer, Creating Evenly-Spaced Streamlines of Arbitrary Density. 1997,
pp. 43–55.
[10] V. Verma, D. Kao, and A. Pang, “A Flow-Guided Streamline Seeding Strategy,” in
Proceedings Visualization 2000. VIS 2000 (Cat. No.00CH37145), 2000, pp. 163–170.
[11] A. Mebarki, P. Alliezy, and O. Devillers, “Farthest Point Seeding for Efficient Placement
of Streamlines,” in VIS 05. IEEE Visualization, 2005., 2005, pp. 479–486.
[12] Z. Liu, R. J. Moorhead, and J. Groner, “An Advanced Evenly-Spaced Streamline
Placement Algorithm.,” IEEE Trans. Vis. Comput. Graph., vol. 12, no. 5, pp. 965–72,
2006.
[13] L. Li, H.-H. Hsieh, and H.-W. Shen, “Illustrative Streamline Placement and Visualization,”
in 2008 IEEE Pacific Visualization Symposium, 2008, pp. 79–86.
[14] B. Jobard and W. Lefer, “The Motion Map: Efficient Computation of Steady Flow
Animations,” in Proceedings. Visualization ’97 (Cat. No. 97CB36155), 1997, pp. 323–
328.
[15] W. Lefer, B. Jobard, and C. Leduc, “High-Quality Animation of 2D Steady Vector
Fields.,” IEEE Trans. Vis. Comput. Graph., vol. 10, no. 1, pp. 2–14, 2004.
[16] S.-K. Ueng and W.-Y. Sun, “Multi-resolution Unsteady Flow Visualization,” in Third
International Conference on Intelligent Information Hiding and Multimedia Signal
Processing (IIH-MSP 2007), 2007, no. 2, pp. 357–360.

[17] J. Krüger, P. Kipfer, P. Kondratieva, and R. Westermann, “A particle system for interactive
visualization of 3D flows.,” IEEE Trans. Vis. Comput. Graph., vol. 11, no. 6, pp. 744–
56, 2005.
[18] I. Fujishiro, “Optimizing Parallel Performance of Streamline Visualization for Large
Distributed Flow Datasets,” 2008 IEEE Pacific Vis. Symp., pp. 87–94, Mar. 2008.
[19] H. Krishnan, C. Garth, and K. I. Joy, “Time and streak surfaces for flow visualization in
large time-varying data sets.,” IEEE Trans. Vis. Comput. Graph., vol. 15, no. 6, pp.
1267–74, 2009.
[20] B. Jobard and W. Lefer, “Multiresolution Flow Visualization,” in International Conference
in Central Europe on Computer Graphics and Visualization, 2001.
[21] J. Tao, J. Ma, C. Wang, and C.-K. Shene, “A unified approach to streamline selection and
viewpoint selection for 3D flow visualization.,” IEEE Trans. Vis. Comput. Graph., vol.
19, no. 3, pp. 393–406, Mar. 2013.
[22] L. C. Leedom and L. Livermore, “Imaging Vector Fields Using Line Integral
Convolution,” pp. 263–270, 1993.
[23] J. J. van Wijk, “Image based flow visualization,” in Proceedings of the 29th annual
conference on Computer graphics and interactive techniques - SIGGRAPH ’02, 2002, p.
745.
[24] J. J. van Wijk, “Image based flow visualization for curved surfaces,” in IEEE Transactions
on Ultrasonics, Ferroelectrics and Frequency Control, pp. 123–130.
[25] R. S. Laramee, “Image Space Based Visualization of Unsteady Flow on Surfaces,” pp.
131–138, 2003.
[26] R. S. Laramee, J. J. van Wijk, B. Jobard, and H. Hauser, “ISA and IBFVS: image space-
based visualization of flow on surfaces.,” IEEE Trans. Vis. Comput. Graph., vol. 10, no.
6, pp. 637–48, 2004.
[27] S. W. Park, B. Budge, L. Linsen, B. Hamann, and K. I. Joy, “Multi-dimensional transfer
functions for interactive 3D flow visualization,” in 12th Pacific Conference on
Computer Graphics and Applications, 2004. PG 2004. Proceedings., 2004, pp. 177–185.
[28] A. Telea and J. J. van Wijk, “3D IBFV: hardware-accelerated 3D flow visualization,” in
IEEE Transactions on Ultrasonics, Ferroelectrics and Frequency Control, 2003, pp.
233–240.
[29] S. K. Lodha, A. Pang, R. E. Sheehan, and C. M. Wittenbrink, “UFLOW: Visualizing
Uncertainty in Fluid Flow,” in Proceedings of Seventh Annual IEEE Visualization ’96,
1996, pp. 249–254,.
[30] R. P. Botchen, D. Weiskopf, and T. Ertl, “Texture-Based Visualization of Uncertainty in
Flow Fields,” VIS 05. IEEE Vis. 2005., pp. 647–654, 2005.
[31] D. Zhou, K. Wang, and Y. Zheng, “Enhanced Unsteady Flow Visualization,” Second Int.
Multi-Symposiums Comput. Comput. Sci. (IMSCCS 2007), pp. 292–298, Aug. 2007.
[32] D. Zhou, K. Wang, Y. Zheng, and Y. Wang, “High-quality Texture-based Flow
Visualization on Surfaces,” no. 60225009, 2007.
[33] V. Matvienko and J. Kruger, “Dense flow visualization using wave interference,” in 2012
IEEE Pacific Visualization Symposium, 2012, pp. 129–136.
[34] J. Huang, Z. Pan, G. Chen, W. Chen, and H. Bao, “Image-space texture-based output-
coherent surface flow visualization.,” IEEE Trans. Vis. Comput. Graph., vol. 19, no. 9,
pp. 1476–87, Sep. 2013.
[35] J. Töger, M. Carlsson, G. Söderlind, H. Arheden, and E. Heiberg, “Volume Tracking: A
new method for quantitative assessment and visualization of intracardiac blood flow
from three-dimensional, time-resolved, three-component magnetic resonance velocity
mapping.,” BMC Med. Imaging, vol. 11, no. 1, p. 10, Jan. 2011.