State of Stress and Modern Deformation of the Northern Basin and Range Province
24
JOURNAL OF GEOPHYSICAL RESEARCH, VOL. 94, NO. B6, PAGES 7105-7128, JUNE 10, 1989 State of Stress and Modern Deformation of the Northern Basin and Range Province MARY LOU ZOBACK U.S. Geological Survey, Menlo Park, California Constraints on the current stress regime of the actively extending northern Basin and Range province are provided by deformation data (focal mechanisms and fault slip studies), hydraulic fracturing in situ stressmeasurements, borehole elongation ("breakouts") analyses, and alignment of young volcanic vents. The integrated data indicate significant variations both in principal stress orientations and magnitudes. An approximately E-W least principal stress direction appears to characterize both the eastern and western margins of the Basin and Range province, whereas in the active interior parts of the province extension occurs in response to a least principal stress oriented NW to N60øW. The contrast in stressorientations between the province boundaries and in the interior suggests that along the margins the least principal stress direction may be locally controlled by the generally northerly trending profound lithospheric discontinuities associated with these margins. Active deformation along the southeastern and western province margins is characterized by a combination of strike-slip and normal faulting. Focal mechanisms along northeastern province margin (Wasatch front) and in central Nevada indicate a combination of normal and oblique-normal faulting. Temporal, regional, and depth-dependent variations in the relative magnitudes of the vertical and maximum horizontal stresses can explain much of the observed variations in deformation styles. However, some depth variation in faulting style inferred from focal mechanismsmay be apparent and simply a function of the attitude of fault planes being reactivated. Evidence for significant temporal variation (or multiple cycles of variation) in relative stress magnitude comes from the Sierran front-Basin and Range boundary region where recent earthquakes are predominantly strike slip, whereas the profound relative vertical relief across the Sierra frontal fault zone in the last 9-10 m.y. implies a normal faulting stress regime. Using the best data on stress orientation, relative stress magnitudes are constrained from slip vectors of major earthquakes and young fault displacements. Analysis of well-constrained slip vectors in the Owens Valley, California, area indicate that large temporal variations in the magnitude of the approximately N-S oriented maximum horizontal stress are required to explain dominantly dip-slip and strike-slip offsets on subparallel faults. Similar faulting relations are observed throughout much of the boundary zone between the Basin and Range-Sierra Nevada (including the Walker Lane belt). Along the eastern province margin in the Wasatch front area in Utah, available data suggest that the maximum and minimum horizontal stresses may be approximately equal at depths of <4-5 km. Earthquake focal mechanismsin this area suggest more variability in relative magnitude of the two horizontal stresses with depth. Furthermore, superimposed sets of young fault striae along a segment of the Wasatch fault also indicate temporal variations of relative stressmagnitudes. Sources of regional and temporal variations in the stressfield may be linked to variable shear tractions applied to the base of the brittle crust related to intrusion, thermally induced flow, and the influence of the San Andreas plate boundary. Although difficult to date accurately, the fault slip data suggest that the temporal variations in relative magnitudes stress may occur on the time scale of both a single major earthquake cycle (1000-5000 years) and multiple earthquake cycles (10,000+ years). INTRODUCTION An episode of approximately E-W directed extensional tectonism beginning approximately 10 Ma [Stewart, 1978; M. L. Zoback et al., 1981] is responsible for the generally N-S trending modern range blocks within the northern Basin and Range province (Figure 1). This tectonism continues to the present time as indicated by seismicity and young fault scarps. A compilation of principal stress orientations in- ferred from earthquake focal mechanisms, geologic studies, and in situ stress measurements [Zoback and Zoback, 1980] indicated that the regional stress field in the northern Basin and Range province is that of a normal faulting stressregime with principal stresses in approximately horizontal and ver- tical planes with the least principal stressS3 oriented NW- SE to E-W. Different stress indicators yield similar and consistent stress orientations, and as they sample vastly different depths (near surface to depths of --•15 km), it This paper is not subject to U.S. copyright. Published in 1989 by the American Geophysical Union. Paper number 89JB00235. appears that the orientation of the principal stress field is relatively uniform throughout the brittle upper crust. The actual pattern and style of deformation within the province, however, is more complex than the relatively simple regional structural grain might suggest. Earthquake focal mechanisms and fault slip data indicate a wide varia- tion in the style of faulting from pure dip slip to pure strike slip and including a wide range of oblique-normal slip, both right lateral and left lateral. Understanding of the processes associatedwith deformation of a region requires information on both the orientation and magnitudes of the principal stresses responsible for that deformation. The best tech- nique for constraining absolute stressmagnitudesat depth is hydraulic fracturing. This technique estimates the magnitude of stress components in planes perpendicular to the bore- hole. Because this plane is typically approximately horizon- tal, the vertical stress may be estimated from the weight of the overburden. The available hydrofracture data on stress magnitudes in the northern Basin and Range province indi- cate that ambient stress differences (S1 - S3) are near the 7105
-
Upload
independent -
Category
Documents
-
view
3 -
download
0
Transcript of State of Stress and Modern Deformation of the Northern Basin and Range Province
JOURNAL OF GEOPHYSICAL RESEARCH, VOL. 94, NO. B6, PAGES 7105-7128, JUNE 10, 1989
State of Stress and Modern Deformation of the Northern
Basin and Range Province
MARY LOU ZOBACK
U.S. Geological Survey, Menlo Park, California
Constraints on the current stress regime of the actively extending northern Basin and Range province are provided by deformation data (focal mechanisms and fault slip studies), hydraulic fracturing in situ stress measurements, borehole elongation ("breakouts") analyses, and alignment of young volcanic vents. The integrated data indicate significant variations both in principal stress orientations and magnitudes. An approximately E-W least principal stress direction appears to characterize both the eastern and western margins of the Basin and Range province, whereas in the active interior parts of the province extension occurs in response to a least principal stress oriented NW to N60øW. The contrast in stress orientations between the province boundaries and in the interior suggests that along the margins the least principal stress direction may be locally controlled by the generally northerly trending profound lithospheric discontinuities associated with these margins. Active deformation along the southeastern and western province margins is characterized by a combination of strike-slip and normal faulting. Focal mechanisms along northeastern province margin (Wasatch front) and in central Nevada indicate a combination of normal and oblique-normal faulting. Temporal, regional, and depth-dependent variations in the relative magnitudes of the vertical and maximum horizontal stresses can explain much of the observed variations in deformation styles. However, some depth variation in faulting style inferred from focal mechanisms may be apparent and simply a function of the attitude of fault planes being reactivated. Evidence for significant temporal variation (or multiple cycles of variation) in relative stress magnitude comes from the Sierran front-Basin and Range boundary region where recent earthquakes are predominantly strike slip, whereas the profound relative vertical relief across the Sierra frontal fault zone in the last 9-10 m.y. implies a normal faulting stress regime. Using the best data on stress orientation, relative stress magnitudes are constrained from slip vectors of major earthquakes and young fault displacements. Analysis of well-constrained slip vectors in the Owens Valley, California, area indicate that large temporal variations in the magnitude of the approximately N-S oriented maximum horizontal stress are required to explain dominantly dip-slip and strike-slip offsets on subparallel faults. Similar faulting relations are observed throughout much of the boundary zone between the Basin and Range-Sierra Nevada (including the Walker Lane belt). Along the eastern province margin in the Wasatch front area in Utah, available data suggest that the maximum and minimum horizontal stresses may be approximately equal at depths of <4-5 km. Earthquake focal mechanisms in this area suggest more variability in relative magnitude of the two horizontal stresses with depth. Furthermore, superimposed sets of young fault striae along a segment of the Wasatch fault also indicate temporal variations of relative stress magnitudes. Sources of regional and temporal variations in the stress field may be linked to variable shear tractions applied to the base of the brittle crust related to intrusion, thermally induced flow, and the influence of the San Andreas plate boundary. Although difficult to date accurately, the fault slip data suggest that the temporal variations in relative magnitudes stress may occur on the time scale of both a single major earthquake cycle (1000-5000 years) and multiple earthquake cycles (10,000+ years).
INTRODUCTION
An episode of approximately E-W directed extensional tectonism beginning approximately 10 Ma [Stewart, 1978; M. L. Zoback et al., 1981] is responsible for the generally N-S trending modern range blocks within the northern Basin and Range province (Figure 1). This tectonism continues to the present time as indicated by seismicity and young fault scarps. A compilation of principal stress orientations in- ferred from earthquake focal mechanisms, geologic studies, and in situ stress measurements [Zoback and Zoback, 1980] indicated that the regional stress field in the northern Basin and Range province is that of a normal faulting stress regime with principal stresses in approximately horizontal and ver- tical planes with the least principal stress S3 oriented NW- SE to E-W. Different stress indicators yield similar and consistent stress orientations, and as they sample vastly different depths (near surface to depths of --•15 km), it
This paper is not subject to U.S. copyright. Published in 1989 by the American Geophysical Union.
Paper number 89JB00235.
appears that the orientation of the principal stress field is relatively uniform throughout the brittle upper crust.
The actual pattern and style of deformation within the province, however, is more complex than the relatively simple regional structural grain might suggest. Earthquake focal mechanisms and fault slip data indicate a wide varia- tion in the style of faulting from pure dip slip to pure strike slip and including a wide range of oblique-normal slip, both right lateral and left lateral. Understanding of the processes associated with deformation of a region requires information on both the orientation and magnitudes of the principal stresses responsible for that deformation. The best tech- nique for constraining absolute stress magnitudes at depth is hydraulic fracturing. This technique estimates the magnitude of stress components in planes perpendicular to the bore- hole. Because this plane is typically approximately horizon- tal, the vertical stress may be estimated from the weight of the overburden. The available hydrofracture data on stress magnitudes in the northern Basin and Range province indi- cate that ambient stress differences (S1 - S3) are near the
7105
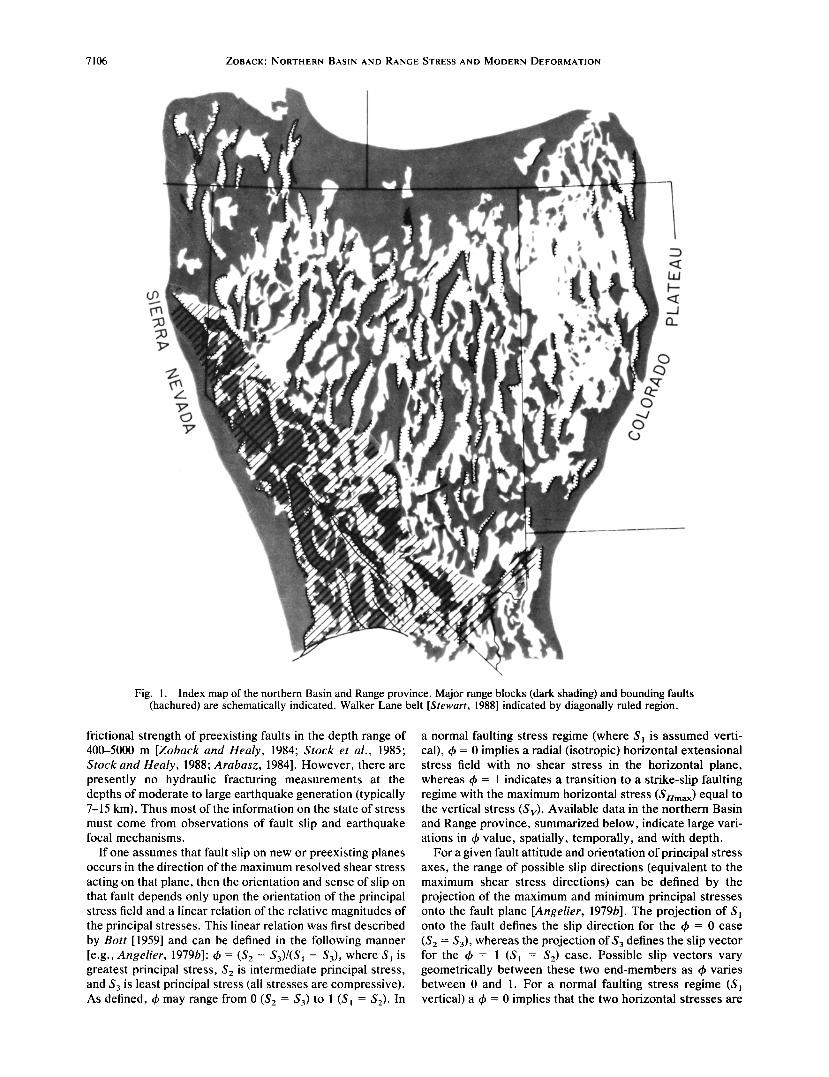
7106 ZOBACK.' NORTHERN BASIN AND RANGE STRESS AND MODERN DEFORMATION
Fig. 1. Index map of the northern Basin and Range province. Major range blocks (dark shading) and bounding faults (hachured) are schematically indicated. Walker Lane belt [Stewart, 1988] indicated by diagonally ruled region.
frictional strength of preexisting faults in the depth range of 400-5000 m [Zoback and Healy, 1984; Stock et al., 1985; Stock and Healy, 1988; Arabasz, 1984]. However, there are presently no hydraulic fracturing measurements at the depths of moderate to large earthquake generation (typically 7-15 km). Thus most of the information on the state of stress must come from observations of fault slip and earthquake focal mechanisms.
If one assumes that fault slip on new or preexisting planes occurs in the direction of the maximum resolved shear stress
acting on that plane, then the orientation and sense of slip on that fault depends only upon the orientation of the principal stress field and a linear relation of the relative magnitudes of the principal stresses. This linear relation was first described by Bott [1959] and can be defined in the following manner [e.g., Angelier, 1979b]: •b = (S2- S3)/(S1 - S3), where S• is greatest principal stress, S2 is intermediate principal stress, and S3 is least principal stress (all stresses are compressive). As defined, •b may range from 0 (S2 = S3) to 1 (S• = S2). In
a normal faulting stress regime (where S 1 is assumed verti- cal), 4• = 0 implies a radial (isotropic) horizontal extensional stress field with no shear stress in the horizontal plane, whereas 4• = 1 indicates a transition to a strike-slip faulting regime with the maximum horizontal stress (Soma,,) equal to the vertical stress (Sv). Available data in the northern Basin and Range province, summarized below, indicate large vari- ations in •b value, spatially, temporally, and with depth.
For a given fault attitude and orientation of principal stress axes, the range of possible slip directions (equivalent to the maximum shear stress directions) can be defined by the projection of the maximum and minimum principal stresses onto the fault plane [Angelier, 1979b]. The projection of S• onto the fault defines the slip direction for the 4• = 0 case (Se = S3), whereas the projection of S3 defines the slip vector for the 4• = 1 (S• = Se) case. Possible slip vectors vary geometrically between these two end-members as 4• varies between 0 and 1. For a normal faulting stress regime (S• vertical) a 4• = 0 implies that the two horizontal stresses are
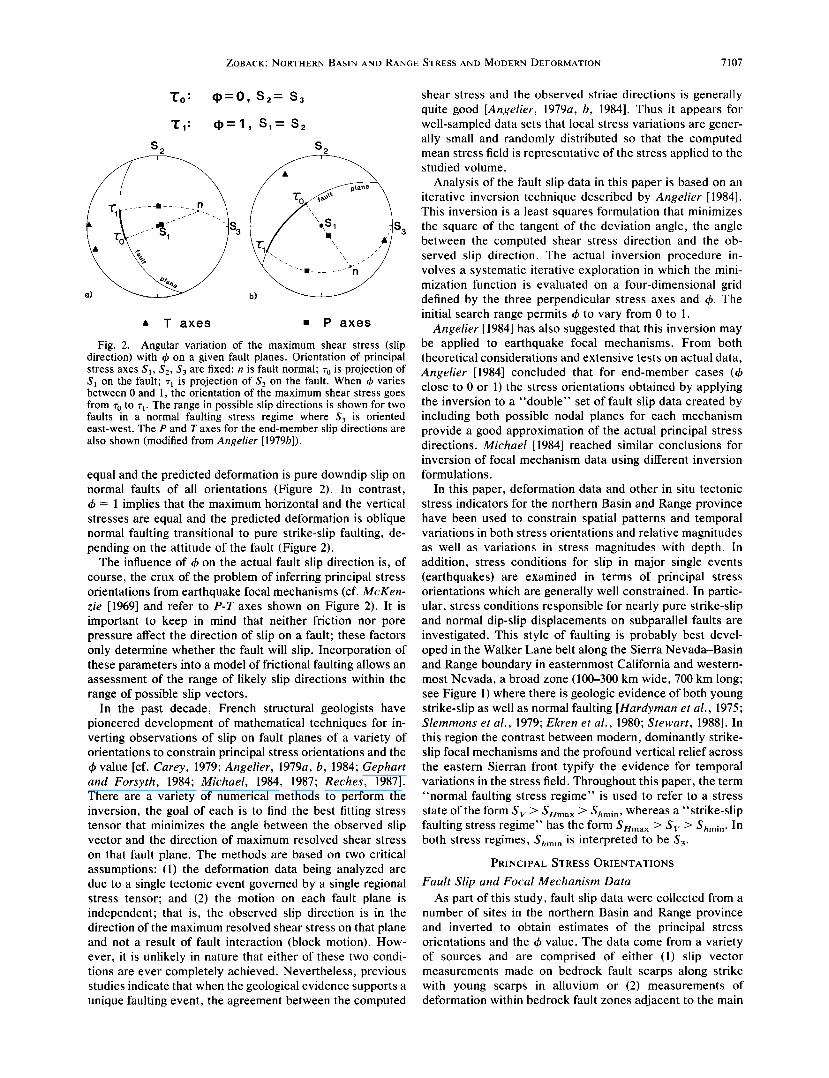
ZOBACK: NORTHERN BASIN AND RANGE STRESS AND MODERN DEFORMATION 7107
I'o: q)=O, S:,= So
'['1: q)-- 1, S1= S2
s s
S 3
a) b)
ß T axes ß P axes
Fig. 2. Angular variation of the maximum shear stress (slip direction) with 0 on a given fault planes. Orientation of principal stress axes S•, S2, S3 are fixed: n is fault normal; ro is projection of S• on the fault; r• is projection of S3 on the fault. When 0 varies between 0 and 1, the orientation of the maximum shear stress goes from ro to r•. The range in possible slip directions is shown for two faults in a normal faulting stress regime where S3 is oriented east-west. The P and T axes for the end-member slip directions are also shown (modified from Angelier [1979b]).
equal and the predicted deformation is pure downdip slip on normal faults of all orientations (Figure 2). In contrast, O = 1 implies that the maximum horizontal and the vertical stresses are equal and the predicted deformation is oblique normal faulting transitional to pure strike-slip faulting, de- pending on the attitude of the fault (Figure 2).
The influence of O on the actual fault slip direction is, of course, the crux of the problem of inferring principal stress orientations from earthquake focal mechanisms (cf. McKen- zie [1969] and refer to P-T axes shown on Figure 2). It is important to keep in mind that neither friction nor pore pressure affect the direction of slip on a fault; these factors only determine whether the fault will slip. Incorporation of these parameters into a model of frictional faulting allows an assessment of the range of likely slip directions within the range of possible slip vectors.
In the past decade, French structural geologists have pioneered development of mathematical techniques for in- verting observations of slip on fault planes of a variety of orientations to constrain principal stress orientations and the • value [cf. Carey, 1979; Angelier, 1979a, b, 1984; Gephart and Forsyth, 1984; Michael, 1984, 1987; Reches, 1987]. There are a variety of numerical methods to perform the inversion, the goal of each is to find the best fitting stress tensor that minimizes the angle between the observed slip vector and the direction of maximum resolved shear stress
on that fault plane. The methods are based on two critical assumptions: (1) the deformation data being analyzed are due to a single tectonic event governed by a single regional stress tensor; and (2) the motion on each fault plane is independent; that is, the observed slip direction is in the direction of the maximum resolved shear stress on that plane and not a result of fault interaction (block motion). How- ever, it is unlikely in nature that either of these two condi- tions are ever completely achieved. Nevertheless, previous studies indicate that when the geological evidence supports a unique faulting event, the agreement between the computed
shear stress and the observed striae directions is generally quite good [Angelier, 1979a, b, 1984]. Thus it appears for well-sampled data sets that local stress variations are gener- ally small and randomly distributed so that the computed mean stress field is representative of the stress applied to the studied volume.
Analysis of the fault slip data in this paper is based on an iterative inversion technique described by Angelier [1984]. This inversion is a least squares formulation that minimizes the square of the tangent of the deviation angle, the angle between the computed shear stress direction and the ob- served slip direction. The actual inversion procedure in- volves a systematic iterative exploration in which the mini- mization function is evaluated on a four-dimensional grid defined by the three perpendicular stress axes and &. The initial search range permits & to vary from 0 to 1.
Angelier [1984] has also suggested that this inversion may be applied to earthquake focal mechanisms. From both theoretical considerations and extensive tests on actual data, Angelier [1984] concluded that for end-member cases (& close to 0 or 1) the stress orientations obtained by applying the inversion to a "double" set of fault slip data created by including both possible nodal planes for each mechanism provide a good approximation of the actual principal stress directions. Michael [1984] reached similar conclusions for inversion of focal mechanism data using different inversion formulations.
In this paper, deformation data and other in situ tectonic stress indicators for the northern Basin and Range province have been used to constrain spatial patterns and temporal variations in both stress orientations and relative magnitudes as well as variations in stress magnitudes with depth. In addition, stress conditions for slip in major single events (earthquakes) are examined in terms of principal stress orientations which are generally well constrained. In partic- ular, stress conditions responsible for nearly pure strike-slip and normal dip-slip displacements on subparallel faults are investigated. This style of faulting is probably best devel- oped in the Walker Lane belt along the Sierra Nevada-Basin and Range boundary in easternmost California and western- most Nevada, a broad zone (100-300 km wide, 700 km long; see Figure 1) where there is geologic evidence of both young strike-slip as well as normal faulting [Hardyman et al., 1975; Slemmons et al., 1979; Ekren et al., 1980; Stewart, 1988]. In this region the contrast between modern, dominantly strike- slip focal mechanisms and the profound vertical relief across the eastern Sierran front typify the evidence for temporal variations in the stress field. Throughout this paper, the term "normal faulting stress regime" is used to refer to a stress state of the form Sv > Sttmax ) Shmin, whereas a "strike-slip faulting stress regime" has the form 8ttma x ) S V ) Shmin. In both stress regimes, Shmin is interpreted to be S3.
PRINCIPAL STRESS ORIENTATIONS
Fault Slip and Focal Mechanism Data
As part of this study, fault slip data were collected from a number of sites in the northern Basin and Range province and inverted to obtain estimates of the principal stress orientations and the •b value. The data come from a variety of sources and are comprised of either (1) slip vector measurements made on bedrock fault scarps along strike with young scarps in alluvium or (2) measurements of deformation within bedrock fault zones adjacent to the main
7108 ZOBACK: NORTHERN BASIN AND RANGE STRESS AND MODERN DEFORMATION
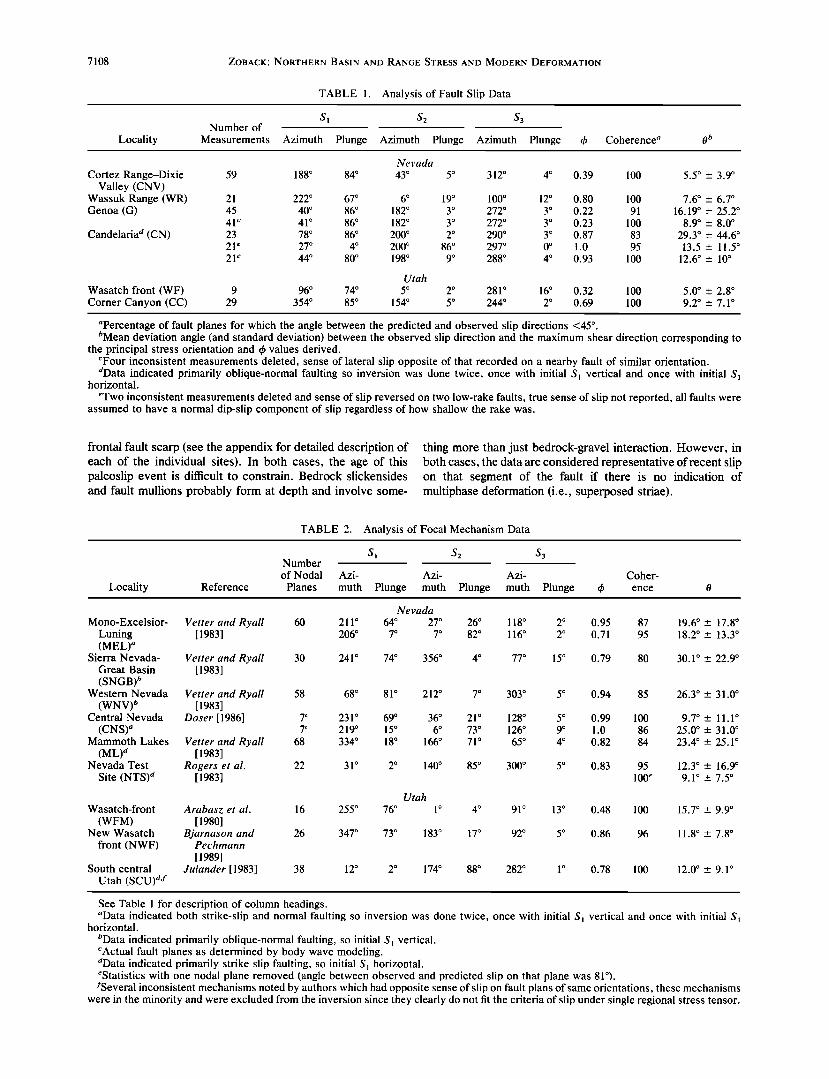
TABLE 1. Analysis of Fault Slip Data
Locality
S I 82 83 Number of
Measurements Azimuth Plunge Azimuth Plunge Azimuth Plunge Coherence a 0 t'
Cortez Range-Dixie Valley (CNV)
Wassuk Range (WR) Genoa (G)
Candelaria a (CN)
59
21
45
41 c
23
21 e
21 e
Wasatch front (WF) 9 Corner Canyon (CC) 29
Nevada
188 ø 84 ø 43 ø 5 ø 312 ø 4 ø 0.39 100 5.5 ø -+ 3.9 ø
222 ø 67 ø 6 ø 19 ø 100 ø 12 ø 0.80 100 7.6 ø _+ 6.7 ø 40 ø 86 ø 182 ø 3 ø 272 ø 3 ø 0.22 91 16.19 ø -+ 25.2 ø 41 ø 86 ø 182 ø 3 ø 272 ø 3 ø 0.23 100 8.9 ø -+ 8.0 ø 78 ø 86 ø 200 ø 2 ø 290 ø 3 ø 0.87 83 29.3 ø + 44.6 ø 27 ø 4 ø 200 ø 86 ø 297 ø 0 ø 1.0 95 13.5 _+ 11.5 ø 44 ø 80 ø 198 ø 9 ø 288 ø 4 ø 0.93 100 12.6 ø _+ 10 ø
Utah
96 ø 74 ø 5 ø 2 ø 281 ø 16 ø 0.32 100 5.0 ø _+ 2.8 ø 354 ø 85 ø 154 ø 5 ø 244 ø 2 ø 0.69 100 9.2 ø _+ 7.1 ø
"Percentage of fault planes for which the angle between the predicted and observed slip directions <45 ø . •'Mean deviation angle (and standard deviation) between the observed slip direction and the maximum shear direction corresponding to
the principal stress orientation and (3 values derived. CFour inconsistent measurements deleted, sense of lateral slip opposite of that recorded on a nearby fault of similar orientation. aData indicated primarily oblique-normal faulting so inversion was done twice, once with initial S• vertical and once with initial S•
horizontal.
eTwo inconsistent measurements deleted and sense of slip reversed on two low-rake faults, true sense of slip not reported, all faults were assumed to have a normal dip-slip component of slip regardless of how shallow the rake was.
frontal fault scarp (see the appendix for detailed description of each of the individual sites). In both cases, the age of this paleoslip event is difficult to constrain. Bedrock slickensides and fault mullions probably form at depth and involve some-
thing more than just bedrock-gravel interaction. However, in both cases, the data are considered representative of recent slip on that segment of the fault if there is no indication of multiphase deformation (i.e., superposed striae).
TABLE 2. Analysis of Focal Mechanism Data
Sl S 2 S3 Number
of Nodal Azi- Azi- Azi-
Locality Reference Planes muth Plunge muth Plunge muth Plunge Coher-
ence 0
Nevada
Mono-Excelsior- Vetter and Ryall 60 211 ø 64 ø 27 ø 26 ø 118 ø 2 ø 0.95 Luning [1983] 206 ø 7 ø 7 ø 82 ø 116 ø 2 ø 0.71 (MEL)"
Sierra Nevada- Vetter and Ryall 30 241 ø 74 ø 356 ø 4 ø 77 ø 15 ø 0.79 Great Basin [ 1983] (SNGB) t'
Western Nevada Vetter and Ryall 58 68 ø 81 ø 212 ø 7 ø 303 ø 5 ø 0.94 (WNV) t' [ 1983]
Central Nevada Doser [1986] 7' 231 ø 69 ø 36 ø 21 ø 128 ø 5 ø 0.99 (CNS)" 7" 219 ø 15 ø 6 ø 73 ø 126 ø 9 ø 1.0
Mammoth Lakes Vetter and Ryall 68 334 ø 18 ø 166 ø 71 ø 65 ø 4 ø 0.82 (ML) a [1983]
Nevada Test Rogers et al. 22 31 ø 2 ø 140 ø 85 ø 300 ø 5 ø 0.83 Site (NTS) a [ 1983]
Wasatch-front Arabasz et al. 16 255 ø (WFM) [1980]
New Wasatch Bjarnason and 26 347 ø front (NWF) Pechmann
[1989] South central Julander [1983] 38 12 ø
Utah (SCU) a'•
87 19.6 ø -+ 17.8 ø
95 18.2 ø _+ 13.3 ø
80 30.1 ø _+ 22.9 ø
85 26.3 ø _+ 31.0 ø
100 9.7 ø _+ 11.1 ø 86 25.0 ø _+ 31.0 ø
84 23.4 ø -+ 25.1 ø
95 12.3 ø _+ 16.9 ø
100 e 9.1 ø _+ 7.5 ø
Utah
76 ø 1 ø 4 ø 91 ø 13 ø 0.48 100 15.7 ø _+ 9.9 ø
73 ø 183 ø 17 ø 92 ø 5 ø 0.86 96 11.8 ø - 7.8 ø
2 ø 174 ø 88 ø 282 ø 1 ø 0.78 100 12.0 ø _+ 9.1 ø
See Table 1 for description of column headings. "Data indicated both strike-slip and normal faulting so inversion was done twice, once with initial Si vertical and once with initial S•
horizontal.
•'Data indicated primarily oblique-normal faulting, so initial S l vertical. CActual fault planes as determined by body wave modeling. aData indicated primarily strike slip faulting, so initial Si horizontal. eStatistics with one nodal plane removed (angle between observed and predicted slip on that plane was 81ø). JSeveral inconsistent mechanisms noted by authors which had opposite sense of slip on fault plans of same orientations, these mechanisms
were in the minority and were excluded from the inversion since they clearly do not fit the criteria of slip under single regional stress tensor.
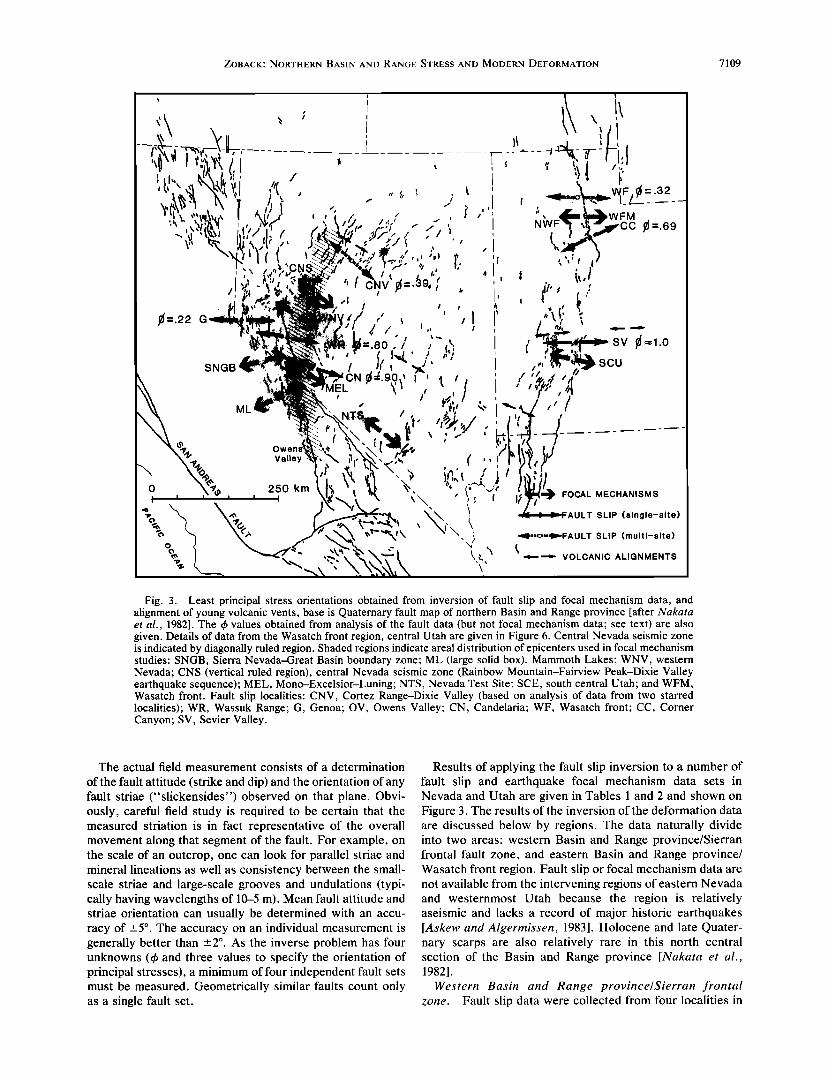
ZOBACK: NORTHERN BASIN AND RANGE STRESS AND MODERN DEFORMATION 7109
•=.22 G
Fig. 3. Least principal stress orientations obtained from inversion of fault slip and focal mechanism data, and alignment of young volcanic vents, base is Quaternary fault map of northern Basin and Range province [after Nakata et al., 1982]. The (3 values obtained from analysis of the fault data (but not focal mechanism data; see text) are also given. Details of data from the Wasatch front region, central Utah are given in Figure 6. Central Nevada seismic zone is indicated by diagonally ruled region. Shaded regions indicate areal distribution of epicenters used in focal mechanism studies: SNGB, Sierra Nevada-Great Basin boundary zone; ML (large solid box), Mammoth Lakes; WNV, western Nevada; CNS (vertical ruled region), central Nevada seismic zone (Rainbow Mountain-Fairview Peak-Dixie Valley earthquake sequence); MEL, Mono-Excelsior-Luning; NTS, Nevada Test Site; SCE, south central Utah; and WFM, Wasatch front. Fault slip localities: CNV, Cortez Range-Dixie Valley (based on analysis of data from two starred localities); WR, Wassuk Range; G, Genoa; OV, Owens Valley; CN, Candelaria; WF, Wasatch front; CC, Corner Canyon; SV, Sevier Valley.
The actual field measurement consists of a determination
of the fault attitude (strike and dip) and the orientation of any fault striae ("slickensides") observed on that plane. Obvi- ously, careful field study is required to be certain that the measured striation is in fact representative of the overall movement along that segment of the fault. For example, on the scale of an outcrop, one can look for parallel striae and mineral lineations as well as consistency between the small- scale striae and large-scale grooves and undulations (typi- cally having wavelengths of 10-5 m). Mean fault attitude and striae orientation can usually be determined with an accu- racy of -+5 ø . The accuracy on an individual measurement is generally better than ___2 ø . As the inverse problem has four unknowns (•b and three values to specify the orientation of principal stresses), a minimum of four independent fault sets must be measured. Geometrically similar faults count only as a single fault set.
Results of applying the fault slip inversion to a number of fault slip and earthquake focal mechanism data sets in Nevada and Utah are given in Tables 1 and 2 and shown on Figure 3. The results of the inversion of the deformation data are discussed below by regions. The data naturally divide into two areas: western Basin and Range province/Sierran frontal fault zone, and eastern Basin and Range province/ Wasatch front region. Fault slip or focal mechanism data are not available from the intervening regions of eastern Nevada and westernmost Utah because the region is relatively aseismic and lacks a record of major historic earthquakes [Askew and Algermissen, 1983]. Holocene and late Quater- nary scarps are also relatively rare in this north central section of the Basin and Range province [Nakata et al., 1982].
Western Basin and Range province/Sierran frontal zone. Fault slip data were collected from four localities in
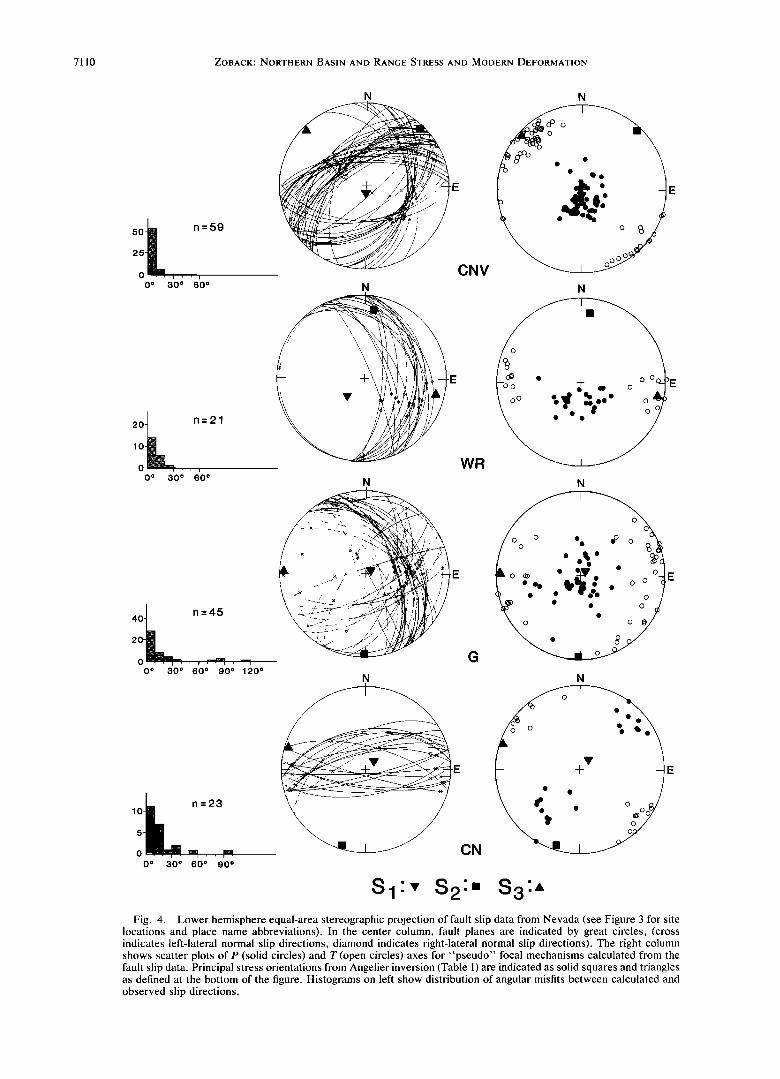
7110 ZOBACK; NORTHERN BASIN AND RANGE STRESS AND MODERN DEFORMATION
5o n:59
25
0 i , , i 0 o 30 ø 60 ø
20 t n= 21
0 o 30 ø 60 ø
40 n=45
20
0 • 30 • 60 • 90 • 120 •
I n:23 lO
0 o 30 ø 60 ø 90 ø
N N
E E
CNV
-E
WR
N
ß
N N
E E
Sl'V S2'. S3',, Fig. 4. Lower hemisphere equal-area stereographic projection of fault slip data from Nevada (see Figure 3 for site
locations and place name abbreviations). In the center column, fault planes are indicated by great circles, (cross indicates left-lateral normal slip directions, diamond indicates right-lateral normal slip directions). The right column shows scatter plots of P (solid circles) and T (open circles) axes for "pseudo" focal mechanisms calculated from the fault slip data. Principal stress orientations from Angellet inversion (Table 1) are indicated as solid squares and triangles as defined at the bottom of the figure. Histograms on left show distribution of angular misfits between calculated and observed slip directions.
ZOBACK: NORTHERN BASIN AND RANGE STRESS AND MODERN DEFORMATION 7111
western Nevada (see CNV, WR, G, and CN on Figure 3 and the appendix for detailed description of sites). The measured fault planes and slip orientations are plotted in the center column of Figure 4 together with the principal stress orien- tations obtained from the Angelier inversion. The results of the inversion of the fault slip data are given in Table 1 along with an indication of the goodness of fit, •, the mean deviation angle between observed and computed slip direc- tions. The distribution of the individual deviation angles for the entire data set are shown on the histograms in the left-hand column. Shown in the right-hand column of Figure 4 are lower hemisphere P and T axis scatter plots obtained by treating each measured fault plane and slip direction as a focal mechanism. The stress axes obtained from the inver-
sion are also plotted on the P-T scatter plots. Note that the computed principal stress orientations lie close to the mean P and T directions, lending support to the suggestion of Zoback and Zoback [1980] that mean P and T axes from a small geographic region provide a good approximation of the mean regional principal stress orientations.
The inversion was also performed on eight sets of well- constrained focal mechanisms from the western Basin and
Range. Justification for applying the inversion to these data is based on the fact that all groups of mechanisms exhibited both nearly pure strike-slip and oblique-slip normal faulting with consistent T axes. The significance of the mix of strike-slip and normal faulting events is discussed at length in the next section on relative magnitudes of stresses. The particular groupings of focal mechanisms analyzed were selected primarily based on spatial proximity. For the Vetter and Ryall [1983] data the subsets used were those made by the authors. The central Nevada data set is composed of focal mechanisms of events in the 1954-1959 Rainbow
Mountain-Fairview Peak-Dixie Valley earthquake se- quence. Five events of M > 6.0 occurred during the first 6 months of the sequence and three 5.5 -< M -< 6.5 events occurred in the region in 1959 [Doser, 1986]. Figure 5 compares the stress orientations computed from inversion of the focal mechanisms nodal planes with the scatter plots of P and T axes. The actual computed principal stress orienta- tions are given in Table 2.
The inversion was done twice for several of the fault slip and focal mechanism data sets which indicated a combination of
strike-slip and normal faulting. One inversion used an initial S1 vertical (normal faulting regime) and the second used an initial S• horizontal (strike-slip faulting regime). The results of both inversions are given in Tables 1 and 2. In each case the "best" solution was selected as the one with the smallest mean
deviation angle. However, comparison of S3 orientations ob- tained from both solutions indicated very small differences. Thus, while Sv and Sr•max are approximately equal in these cases (4• • 1), the Shmin (83) direction is well determined.
Inspection of Tables 1 and 2 reveals that in most cases the computed stress axes for both the fault slip and focal mechanism data lie within approximately horizontal and vertical planes. The large values of the mean deviation angle • for some of the earthquake focal mechanism data sets reflect the fact that half of the fault planes included in the data set were the auxiliary planes, not the true fault planes. The inferred stress orientations from focal mechanisms and
nearby fault slip data are quite consistent (Figure 3) and suggest significant regional variations in the orientation of S3. In general, the orientation of S3 varies from approxi-
mately E-W (results range from N77øE to N80øW) along the Sierra Nevada-northern Basin and Range boundary zone to NW to N60øW in the interior of Nevada along the central Nevada seismic zone and at the Nevada Test Site.
The N65øE least principal horizontal stress orientation de- termined from focal mechanisms in the Mammoth Lakes
region appears to be a local anomaly in the regional stress pattern. Savage and Cockerham [1984] and Savage and Lisowski [1984] have interpreted seismic and geodetic data in this region and have attributed this deformation to an active intrusive event.
Eastern Basin and Range province/Wasatch front re- gion. Figure 6 shows earthquake focal mechanisms for north central Utah along with the locations of fault slip data sites and wells which contain some information on principal stress orientations and magnitudes. The fault slip data were collected from bedrock fault scarps primarily exposed by excavation of gravel along the faults (see the appendix). All sites sampled were within fault zones containing late Qua- ternary or Holocene scarps in alluvium. Data from the Warm Springs fault (site 5, Figure 6) located just north of Salt Lake City indicate two distinct slip episodes [Pavlis and Smith, 1980]. Superposition of striae permitted a determination of the relative age of the two sets. The significance of the two sets of striae are discussed in the next section.
Figure 7 shows lower hemisphere sterographic projections of deformation data from north central Utah. Included are
(1) regional fault slip data along the Wasatch front (including one measurement made along the fault bounding the Oquirrh Mountains, the first range west of the Wasatch fault zone near Salt Lake City); (2) a detailed fault slip data set from a single site along the Wasatch fault zone, Corner Canyon (site CC, Figure 3); and (3) nodal planes of Wasatch front focal mechanisms [Arabas:: et al., 1980; Bjarnason and Pech- mann, 1989]. On the right-hand column of Figure 7 are P-T scatter plots of these data. The principal stress orientations calculated by the Angelier inversion (see Tables 1 and 2) are also plotted.
The results of the inversion of both the regional fault slip (WF) data and the "double" fault sets created from the focal mechanisms (WFM, NWF) are very similar and yield ap- proximately horizontal E-W orientations for S3 (Tables 1 and 2 and Figure 7). Analysis of a detailed set of fault slip data collected from a single site along the Wasatch front, Corner Canyon (Figures 3 and 6, site CC) yields a distinct N64øE S3 direction. However, this locality occurs in a structurally complex region where the main strand of the Wasatch fault is making roughly a 90 ø bend in strike. Slip in such a complex structural setting may be constrained to be nearly down plunge of the bend in the fault [Bruhn et al., 1987] and may not accurately reflect the regional stress field.
Fault-slip and focal mechanism data from south central Utah (Sevier Valley area, SV, Figure 3) show a combination of normal and strike-slip deformation. Anderson and Barnhard [1984] analyzed a large set of slip data from small and interme- diate displacement faults in the Sevier Valley area and consis- tently found evidence for both nearly pure dip-slip and pure strike-slip deformation. Analysis of both dip-slip and strike-slip subsets of the data indicates a nearly invariant horizontal E-W orientation for S3 [Anderson and Barnhard, 1984]. Similarily, analysis of primarily strike-slip focal mechanisms of mi- croearthquakes (m -< 2.0) from the same region [Arabasz and
7112 ZOBACK: NORTHERN BASIN AND RANGE STRESS AND MODERN DEFORMATION
N N
N
SN-GB
N
N N
+ •. o
CNS
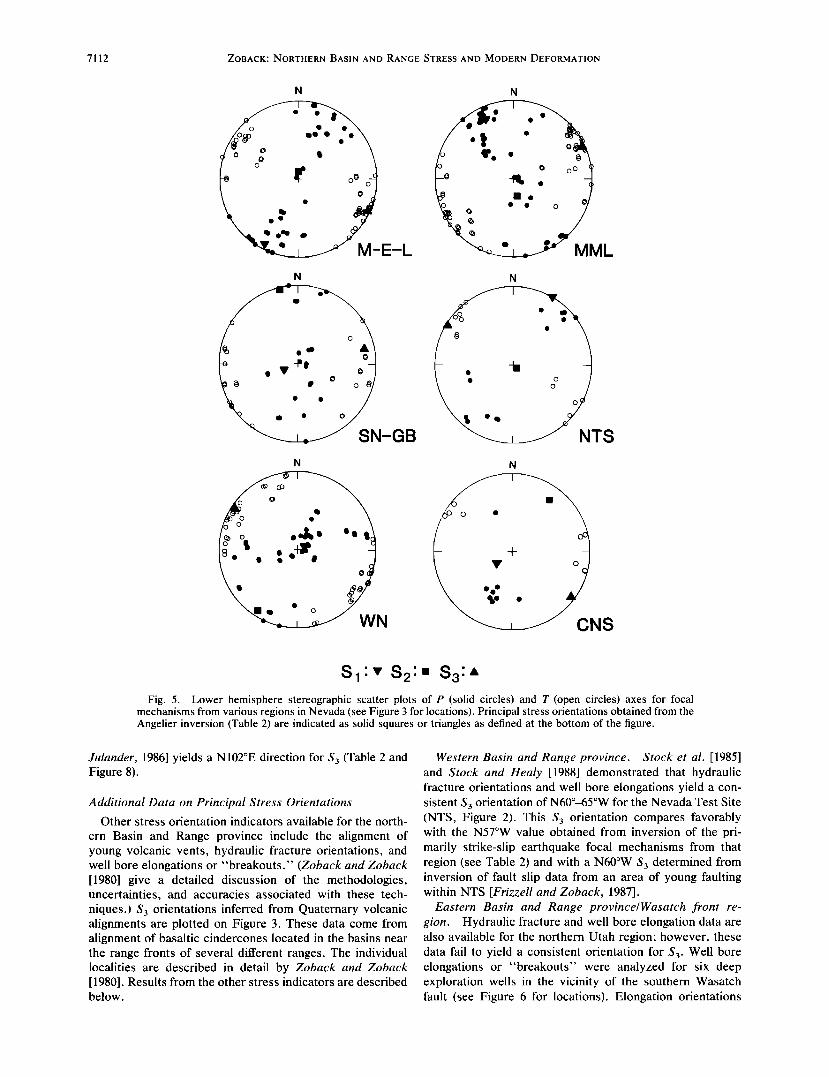
S1'• S2'- S 3 Fig. 5. Lower hemisphere stereographic scatter plots of P (solid circles) and T (open circles) axes for focal
mechanisms from various regions in Nevada (see Figure 3 for locations). Principal stress orientations obtained from the Angelier inversion (Table 2) are indicated as solid squares or triangles as defined at the bottom of the figure.
Julander, 1986] yields a N 102øE direction for S 3 (Table 2 and Figure 8).
Additional Data on Principal Stress Orientations
Other stress orientation indicators available for the north-
ern Basin and Range province include the alignment of young volcanic vents, hydraulic fracture orientations, and well bore elongations or "breakouts." (Zoback and Zoback [1980] give a detailed discussion of the methodologies, uncertainties, and accuracies associated with these tech- niques.) S3 orientations inferred from Quaternary volcanic alignments are plotted on Figure 3. These data come from alignment of basaltic cindercones located in the basins near the range fronts of several different ranges. The individual localities are described in detail by Zoback and Zoback [1980]. Results from the other stress indicators are described below.
Western Basin and Range province. Stock et al. [1985] and Stock and Healy [1988] demonstrated that hydraulic fracture orientations and well bore elongations yield a con- sistent S3 orientation of N60ø-65øW for the Nevada Test Site (NTS, Figure 2). This S3 orientation compares favorably with the N57øW value obtained from inversion of the pri- marily strike-slip earthquake focal mechanisms from that region (see Table 2) and with a N60øW S3 determined from inversion of fault slip data from an area of young faulting within NTS [Frizzell and Zoback, 1987].
Eastern Basin and Range province/Wasatch front re- gion. Hydraulic fracture and well bore elongation data are also available for the northern Utah region; however, these data fail to yield a consistent orientation for S3. Well bore elongations or "breakouts" were analyzed for six deep exploration wells in the vicinity of the southern Wasatch fault (see Figure 6 for locations). Elongation orientations
ZOBACK' NORTHERN BASIN AND RANGE STRESS AND MODERN DEFORMATION 7113
I i i I
I v' ,,3, \
t/, 7 s / + .(/ FW--+ _
ß in situ stress
ß breakouts
• fault slip
ODelta ßd
b•/ ti; e i\ & CU / / /
I I I I1•ø I1• ø 112 ø III ø
if
0 50 KM I , , I i I
42 ø
41 ø
40 ø
39 ø
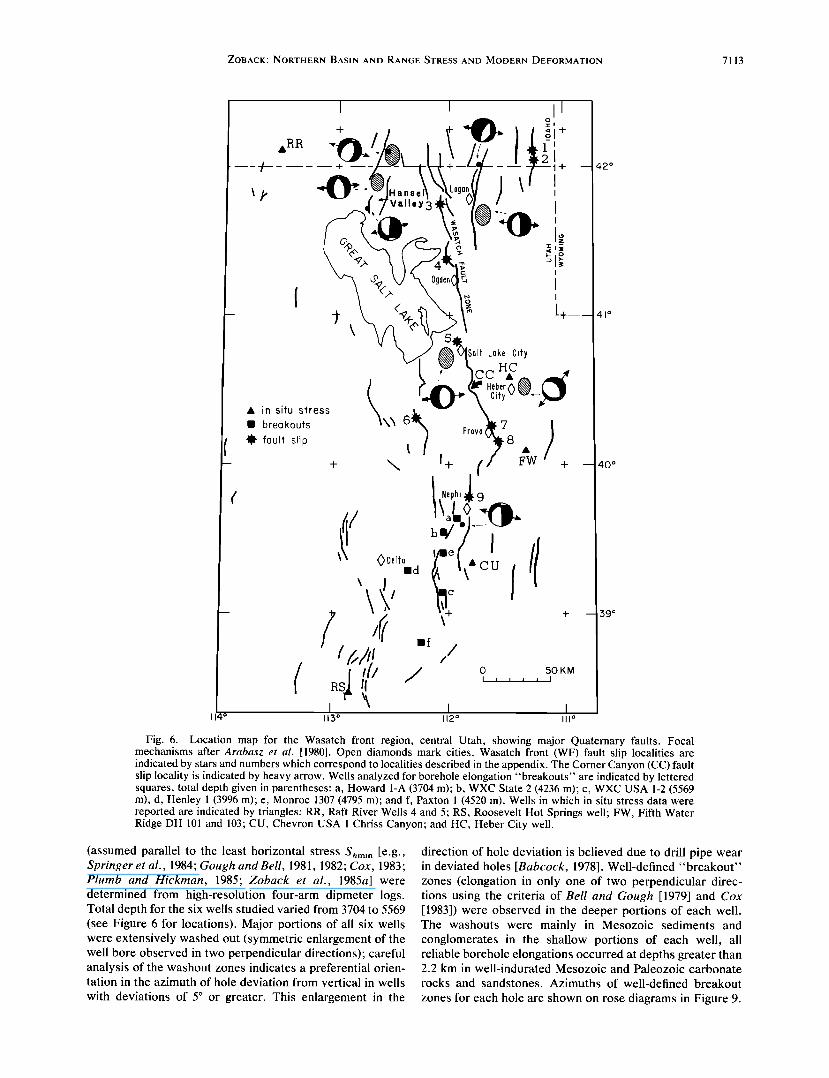
Fig. 6. Location map for the Wasatch front region, central Utah, showing major Quaternary faults. Focal mechanisms after Arabasz et al. [1980]. Open diamonds mark cities. Wasatch front (WF) fault slip localities are indicated by stars and numbers which correspond to localities described in the appendix. The Corner Canyon (CC) fault slip locality is indicated by heavy arrow. Wells analyzed for borehole elongation "breakouts" are indicated by lettered squares, total depth given in parentheses: a, Howard 1-A (3704 m); b, WXC State 2 (4236 m); c, WXC USA 1-2 (5569 m), d, Henley 1 (3996 m); e, Monroe 1307 (4795 m); and f, Paxton 1 (4520 m). Wells in which in situ stress data were reported are indicated by triangles: RR, Raft River Wells 4 and 5; RS, Roosevelt Hot Springs well; FW, Fifth Water Ridge DH 101 and 103; CU, Chevron USA 1 Chriss Canyon; and HC, Heber City well.
(assumed parallel to the least horizontal stress Shmin [e.g., Springer et al., 1984; Gough andBell, 1981, 1982; Cox, 1983; Plumb and Hickman, 1985; Zoback et al., 1985a] were determined from high-resolution four-arm dipmeter logs. Total depth for the six wells studied varied from 3704 to 5569 (see Figure 6 for locations). Major portions of all six wells were extensively washed out (symmetric enlargement of the well bore observed in two perpendicular directions); careful analysis of the washout zones indicates a preferential orien- tation in the azimuth of hole deviation from vertical in wells
with deviations of 5 ø or greater. This enlargement in the
direction of hole deviation is believed due to drill pipe wear in deviated holes [Babcock, 1978]. Well-defined "breakout" zones (elongation in only one of two perpendicular direc- tions using the criteria of Bell and Gough [1979] and Cox [1983]) were observed in the deeper portions of each well. The washouts were mainly in Mesozoic sediments and conglomerates in the shallow portions of each well, all reliable borehole elongations occurred at depths greater than 2.2 km in well-indurated Mesozoic and Paleozoic carbonate rocks and sandstones. Azimuths of well-defined breakout
zones for each hole are shown on rose diagrams in Figure 9.
7114 ZOBACK.' NORTHERN BASIN AND RANGE STRESS AND MODERN DEFORMATION
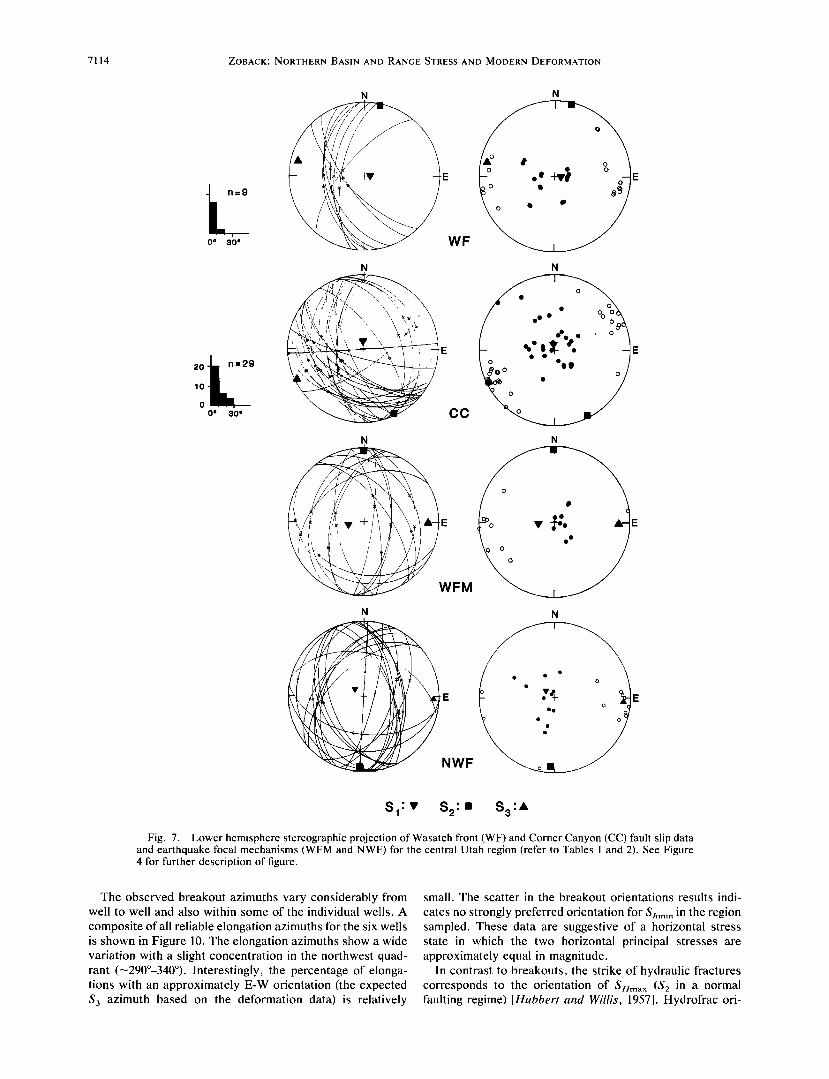
=9
0 o 30 o
N N
20 '5,
lO
o
oo •oo CC
N
N N
-E E
WFM
N N
E E
NWF
S 1' ß S2' ß S3' ß
Fig. 7. Lower hemisphere stereographic projection of Wasatch front (WF) and Corner Canyon (CC) fault slip data and earthquake focal mechanisms (WFM and NWF) for the central Utah region (refer to Tables 1 and 2). See Figure 4 for further description of figure.
The observed breakout azimuths vary considerably from well to well and also within some of the individual wells. A
composite of all reliable elongation azimuths for the six wells is shown in Figure 10. The elongation azimuths show a wide variation with a slight concentration in the northwest quad- rant (---290ø-340ø). Interestingly, the percentage of elonga- tions with an approximately E-W orientation (the expected S3 azimuth based on the deformation data) is relatively
small. The scatter in the breakout orientations results indi-
cates no strongly preferred orientation for S hmin in the region sampled. These data are suggestive of a horizontal stress state in which the two horizontal principal stresses are approximately equal in magnitude.
In contrast to breakouts, the strike of hydraulic fractures corresponds to the orientation of S ttma x (S 2 in a normal faulting regime) [Hubbert and Willis, 1957]. Hydrofrac ori-
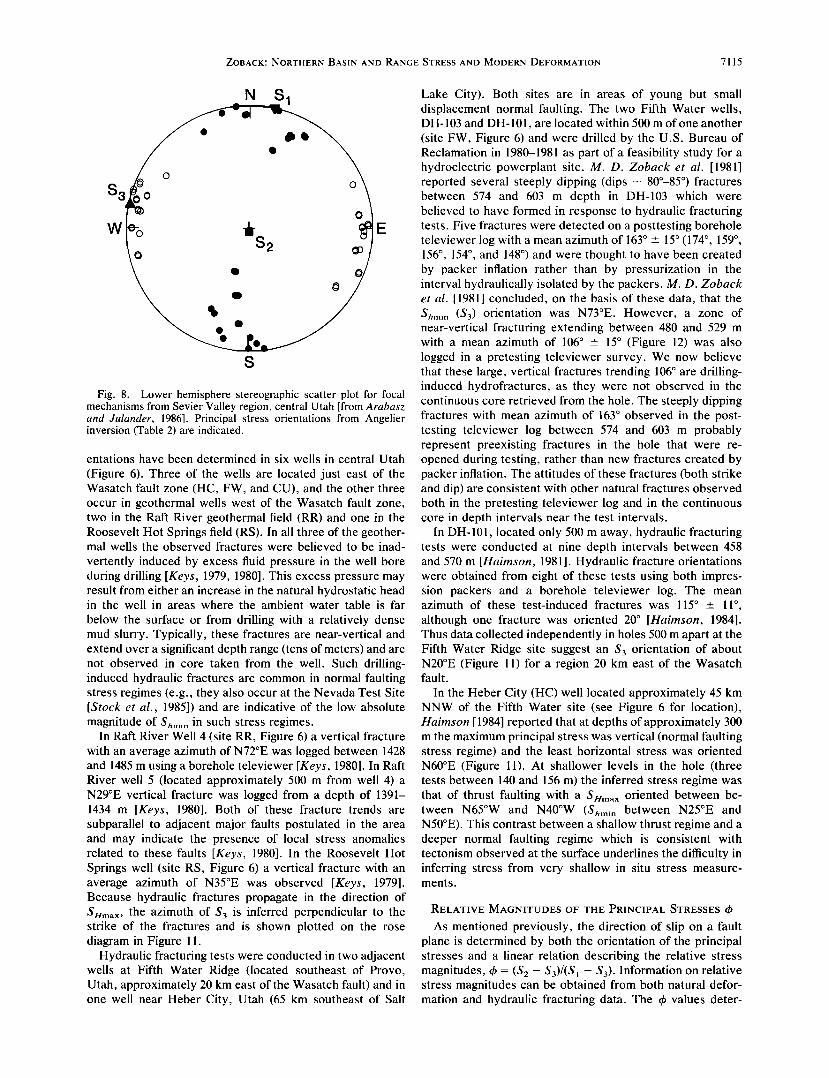
ZOBACK: NORTHERN BASIN AND RANGE STRESS AND MODERN DEFORMATION 7115
N S 1
S 3
w i[ E ,,.0) 2
s
Fig. 8. Lower hemisphere stereographic scatter plot for focal mechanisms from Sevier Valley region, central Utah [from Arabasz and dulander, 1986]. Principal stress orientations from Angelier inversion (Table 2) are indicated.
entations have been determined in six wells in central Utah
(Figure 6). Three of the wells are located just east of the Wasatch fault zone (HC, FW, and CU), and the other three occur in geothermal wells west of the Wasatch fault zone, two in the Raft River geothermal field (RR) and one in the Roosevelt Hot Springs field (RS). In all three of the geother- mal wells the observed fractures were believed to be inad-
vertently induced by excess fluid pressure in the well bore during drilling [Keys, 1979, 1980]. This excess pressure may result from either an increase in the natural hydrostatic head in the well in areas where the ambient water table is far
below the surface or from drilling with a relatively dense mud slurry. Typically, these fractures are near-vertical and extend over a significant depth range (tens of meters) and are not observed in core taken from the well. Such drilling- induced hydraulic fractures are common in normal faulting stress regimes (e.g., they also occur at the Nevada Test Site [Stock et al., 1985]) and are indicative of the low absolute magnitude of S hmin in such stress regimes.
In Raft River Well 4 (site RR, Figure 6) a vertical fracture with an average azimuth of N72øE was logged between 1428 and 1485 m using a borehole televiewer [Keys, 1980]. In Raft River well 5 (located approximately 500 m from well 4) a N29øE vertical fracture was logged from a depth of 1391- 1434 m [Keys, 1980]. Both of these fracture trends are subparallel to adjacent major faults postulated in the area and may indicate the presence of local stress anomalies related to these faults [Keys, 1980]. In the Roosevelt Hot Springs well (site RS, Figure 6) a vertical fracture with an average azimuth of N35øE was observed [Keys, 1979]. Because hydraulic fractures propagate in the direction of Su .... the azimuth of S3 is inferred perpendicular to the strike of the fractures and is shown plotted on the rose diagram in Figure 11.
Hydraulic fracturing tests were conducted in two adjacent wells at Fifth Water Ridge (located southeast of Provo, Utah, approximately 20 km east of the Wasatch fault) and in one well near Heber City, Utah (65 km southeast of Salt
Lake City). Both sites are in areas of young but small displacement normal faulting. The two Fifth Water wells, DH-103 and DH-101, are located within 500 m of one another (site FW, Figure 6) and were drilled by the U.S. Bureau of Reclamation in 1980-1981 as part of a feasibility study for a hydroelectric powerplant site. M.D. Zoback et al. [1981] reported several steeply dipping (dips - 800-85 ø) fractures between 574 and 603 m depth in DH-103 which were believed to have formed in response to hydraulic fracturing tests. Five fractures were detected on a posttesting borehole televiewer log with a mean azimuth of 163 ø _ 15 ø (174 ø, 159 ø, 156 ø, 154 ø, and 148 ø) and were thought to have been created by packer inflation rather than by pressurization in the interval hydraulically isolated by the packers. M.D. Zoback et al. [1981] concluded, on the basis of these data, that the Shmin (S3) orientation was N73øE. However, a zone of near-vertical fracturing extending between 480 and 529 m with a mean azimuth of 106 ø + 15 ø (Figure 12) was also logged in a pretesting televiewer survey. We now believe that these large, vertical fractures trending 106 ø are drilling- induced hydrofractures, as they were not observed in the continuous core retrieved from the hole. The steeply dipping fractures with mean azimuth of 163 ø observed in the post- testing televiewer log between 574 and 603 m probably represent preexisting fractures in the hole that were re- opened during testing, rather than new fractures created by packer inflation. The attitudes of these fractures (both strike and dip) are consistent with other natural fractures observed both in the pretesting televiewer log and in the continuous core in depth intervals near the test intervals.
In DH-101, located only 500 m away, hydraulic fracturing tests were conducted at nine depth intervals between 458 and 570 m [Haimson, 1981]. Hydraulic fracture orientations were obtained from eight of these tests using both impres- sion packers and a borehole televiewer log. The mean azimuth of these test-induced fractures was 115 ø + 11 ø, although one fracture was oriented 20 ø [Halresort, 1984]. Thus data collected independently in holes 500 m apart at the Fifth Water Ridge site suggest an S3 orientation of about N20øE (Figure 11) for a region 20 km east of the Wasatch fault.
In the Heber City (HC) well located approximately 45 km NNW of the Fifth Water site (see Figure 6 for location), Halresort [1984] reported that at depths of approximately 300 m the maximum principal stress was vertical (normal faulting stress regime) and the least horizontal stress was oriented N60øE (Figure 11). At shallower levels in the hole (three tests between 140 and 156 m) the inferred stress regime was that of thrust faulting with a S um•x oriented between be- tween N65øW and N40øW (S•min between N25øE and N50øE). This contrast between a shallow thrust regime and a deeper normal faulting regime which is consistent with tectonism observed at the surface underlines the difficulty in inferring stress from very shallow in situ stress measure- ments.
RELATIVE MAGNITUDES OF THE PRINCIPAL STRESSES •b
As mentioned previously, the direction of slip on a fault plane is determined by both the orientation of the principal stresses and a linear relation describing the relative stress magnitudes, & = (S2 - S3)/(S• - S3). Information on relative stress magnitudes can be obtained from both natural defor- mation and hydraulic fracturing data. The & values deter-
7116 ZOBACK: NORTHERN BASIN AND RANGE STRESS AND MODERN DEFORMATION
o o
18o
o
e 330 .... I ...... , 30
• .... • ...... 1 /' , • • •...( ' ;,• .•
a40 ", ..... • / "; ....... • ..... • -:• ...... • ' , "v " ........ • ...... • • 0 :,., ,.' ...... /:....: / ': ',¾._.:,, ........... ,,,., .......
9O
9O
180 180
Fig. 9. Rose diagrams of breakout azimuths (assumed equivalent to azimuth of least horizontal stress S3) from wells in the southern Wasatch front region (see Figure 6 for locations and well names). Total number of elongation determinations for each well is given by n' radius for each diagram is five breakouts.
mined by hydraulic fracturing can be considered to be only approximate. While the magnitude of S•,mi. (S3 in a normal or strike-slip faulting regime) is well determined by this method, the magnitude of Sumax is typically poorly con-
strained [Zoback and Healy, 1984; Stock et al., 1985], and the magnitude of the third principal stress is assumed equal to the weight of the overburden. In addition, complete sets of measurements are available for depths of at most 2 km;
ZOBACK: NORTHERN BASIN AND RANGE STRESS AND MODERN DEFORMATION 7117
210
180
n=44
r=5
N
30
90 W E
SHmax
120
150 S
Fig. 12. Rose diagram of drilling-induced hydraulic fractures in Fifth Water well DH-103. Azimuth equivalent to orientation of SHmax.
Fig. 10. Composite rose diagram of all breakout azimuths shown in Figure 8.
there are no direct measurements at seismogenic depths >5 km.
The mean values of & determined from analysis of fault slip and focal mechanism data are summarized in Tables 1 and 2. Recall that the & values obtained from application of the fault slip analysis to "double" sets of earthquake focal mechanism nodal plane groups are not considered reliable simply because half of the data in those sets are auxiliary planes, not true fault planes. For such an inversion to be valid the regional & value must be either close to 0 or 1, as discussed previously.
While the results plotted on Figure 3 show generally good agreement between the various data sets on the orientation of S3, there is considerable variability in the & value. However, once regional stress orientations have been de- fined (keeping uncertainties in mind), these orientations combined with detailed slip vectors for major earthquakes place strong constraints on the & values responsible for the observed slip.
W
iii// HC •
E
West of Wasatch Front
East of Wasatch Front
Fig. 11. Least horizontal principal stress (S3) orientations from drilling- and testing-induced hydraulic fractures in wells shown on Figure 6.
Western Basin and Range Province/Sierran Frontal Zone
High & values (close to 1.0, implying a transition to strike-slip faulting) were determined for two fault slip local- ities (WR and CN, see Table 1 and Figure 3) along the Walker Lane belt. However, just to the northwest, deforma- tion along the Sierran frontal fault zone near Genoa, Ne- vada, yields a relatively low value of 4> = 0.22. Inferred S3 orientations for all three localities are all quite similar, ranging between N80øW and N88øW.
Further evidence for major variations in 4> values within the Walker Lane belt comes from an analysis of well- constrained young fault slip in the Owens Valley region, eastern California (see Figure 3). Owens Valley was the site of a M = 7.7 earthquake in 1872 which was associated with an -100 km long north to NNW trending surface rupture [Beanland and Clark, 1987] including prominent east facing vertical scarps near Lone Pine (typically 1 m high and locally up to 4 m high [Lubetkin and Clark, 1988]). However, a significant component of right-lateral offset has been re- ported for the 1872 event by various workers [Bateman, 1961] (also see Bonilla [1968] for a summary of early obser- vations). Careful field investigation of the entire rupture zone by S. Beanland documents that for most of the fault trace the dominant sense of offset was right-lateral strike- slip, with an estimated ratio of lateral to vertical offset during the 1872 event ranging from 4:1 to as great as 10:1, and averaging 6:1 [Beanland and Clark, 1987; Lubetkin and Clark, 1988]. Morphology of the fault trace and the fact that the relatively uplifted block locally occurs on either the eastern or the western side of the fault, indicate a very steep dip for the fault (we have estimated --•85 ø E [Zoback and Beanland, 1986]). For much of its length the fault runs through the middle of Owens Valley and is located 5-15 km east of the subparallel Independence fault, a normal fault which is a part of the Sierran frontal fault zone. Late Quaternary slip on the Independence fault has been domi- nantly dip slip; no evidence of lateral slip has been detected [Gillespie, 1982]. Exposures of the Sierran frontal fault zone
7118 ZOBACK: NORTHERN BASIN AND RANGE STRESS AND MODERN DEFORMATION
SHmax
N8
ß RANGE OF OBSERVED SLIP
I--IRANGE OF ALLOWABLE SLIP
o FAULT NORMAL
Fig. 13. Lower hemisphere projection of observed fault slip vectors (limits on observed slip vectors indicated by large dots) in the Owens Valley area. Slip range predicted by a normal faulting stress regime (S• vertical, S3 oriented N60øW) with (3 varying between 0 and I is indicated by thick bars on the fault plane (refer to Figure 2 for analysis of slip vectors).
to the north suggest dips of about 55øE [Clark et al., 1984]. The average attitudes for both fault planes are shown in Figure 13.
The two contrasting styles of offset on these subparallel faults in the Owens Valley area have been analyzed using a forward approach of assuming principal stress orientations and then calculating the & value required to produce the observed slip. Using horizontal and vertical principal stresses with an S3 orientation of N80øW (based on nearby fault slip and focal mechanism analyses) and assuming that the slip vectors are in the direction of maximum resolved shear stress on these two, subparallel fault planes, then a very large fluctuation in the & value (relative stress magni- tudes) is required to explain the observations. Both slip vectors can be produced in a normal faulting stress regime (Figure 13). For the nearly pure normal dip slip on the Independence fault, S•,max must be close in magnitude to Shmin ((/) •' 0); whereas the Owens Valley fault zone in 1872 appears to have slipped under a regime in which S•vmax and Sv were approximately equal (& • 1.0).
Three 1872-type (primarily strike slip) events have been inferred along the Owens Valley fault zone in Holocene time [Clark et al., 1984; Beanland and Clark, 1987; Lubetkin and Clark, 1988]. The late Quaternary horizontal slip rate along the Owens Valley fault zone is at least an order of magnitude greater than the vertical slip rate along the adjacent Sierran boundary fault (Independence fault) during Holocene time [Clark et al., 1984]. Thus slip data from Owens Valley suggest that the modern state of stress in this region is characterized by an S3 orientation of N80ø-85øW and a stress regime transitional between strike-slip and normal faulting
(S v • SHmax or O = 1.0). This stress state may be represen- tative of much of Holocene time.
This inference concerning the modern state of stress can be tested with earthquake focal mechanisms. Focal mecha- nisms for m = 2.0 to 5.0 events along the Walker lane belt-Sierra Nevada boundary zone indicate a combination of normal dip-slip, oblique-slip, and nearly pure strike-slip deformation [Vetter and Ryall, 1983]. There is a general pattern of primarily strike-slip deformation at depths less than about 9 km and predominantly normal or oblique- normal slip at greater depths [Vetter and Ryall, 1983]. However, strike-slip events are not uncommon at depths greater than 9.0 km, whereas dip-slip events were not observed at depths less than 7.0 km. Inversion of regional subsets of these focal mechanisms yield a consistent, near- horizontal orientation for S3 which generally coincides with the mean T axes within each region studied (Figure $). A strike-slip stress regime provided the best fit for the Mam- moth Lake and Mono-Excelsior-Luning data sets and a normal faulting regime was determined for the Sierra Neva- da-Great Basin boundary zone and western Nevada data sets (Table 2). All these earthquakes, with the exception of a few events in the western Nevada and Sierra Nevada sub-
sets, occur within the Walker Lane belt. The Angelier inversion on the subsets of data indicated
that nearly all of the focal mechanisms have slip on one nodal plane consistent with the stress axes determined by the inversion and with acceptable O values (between 0.0 and 1.0). The actual O values for individual events calculated from the best fitting stress orientation, however, show no clear depth dependence but are all generally greater than 0.5.
Vetter and Ryall [1983] explained the increase in dip-slip movement in formal mechanisms at depths greater than 9 or 10 km depths as a result of a variation in relative stress magnitudes with depth; specifically, they postulated that Sv increases with depth more rapidly than S,m,x. However, the lack of a clear variation of O values with depth suggests that the observed focal mechanism pattern may not be simply due to depth-dependent variations in stress magnitude.
The dependence of slip direction (faulting style) on rela- tive stress magnitude is shown on Figure 14. For the fixed principal stress axes orientations shown (horizontal, N-S and E-W; and vertical), slip directions for varying values of O in stress fields in which S• alternates between vertical and horizontal (N-S) are indicated. Figure 14 clearly demon- strates that depending on fault attitude, very small variations in the O value can result in very different slip vectors. Note that for fault A, a strike-slip stress regime with 4' = 0.8 and S• oriented N-S produces a very low angle rake (11 ø) whereas the predicted slip on fault B for the same stress conditions has a rake of 51 ø. Similarly, a normal faulting stress regime with a 4' = 0.8 and S2 oriented N-S results in a rake of 27 ø on fault A and a 63 ø rake on fault B. Clearly, both the O value and the attitude of the fault planes being activated are complicating factors in attempting to infer stress regime from focal mechanisms. Note, however, that this simple analysis deals only with the direction of slip; more information on stress magnitudes are needed to deter- mine if the fault planes are frictionally likely to slip under the stress regimes indicated.
The above analysis suggests that the depth variation in faulting style observed by Vetter and Ryall may be as much a function of the attitude of fault planes being reactivated as
ZOBACK: NORTHERN BASIN AND RANGE STRESS AND MODERN DEFORMATION 7119
s Hmax
I
0.6
\
0.4 0.8
0.6
0 0.4
0.2 Sv 0.2 o.o o.o
s hmin •
Fig. 14. Predicted slip directions on fault planes for a range of 4> values (indicated by numbers). Slip directions for normal faulting stress regime (S• vertical) are in the heavy solid region and slip directions for a strike-slip faulting stress regime (S• horizontal) are in the heavy dashed region. The end-member case 4> = 1 in a strike-slip faulting regime is equivalent to a normal faulting regime with 4> = 1 (in both cases, S• = S2). Refer to Figure 2 for further details.
uniform, depth-dependent variations in the relative magni- tudes of Sv and SHmax with depth. Furthermore, any depth- dependent variation in relative stress magnitude may not be regionally or temporally consistent. The 1872 Owens Valley event probably nucleated at depths of 10-15 km similar to other major Basin and Range earthquakes [Smith et al., 1989]. As discussed above, the slip vector for this event suggests a tb value close to 1.0, consistent with the stress regime Vetter and Ryall attribute to the shallow (<9 km) strike-slip earthquakes.
A preliminary focal mechanism for the main shock of the ML = 6.4 July 21, 1986, Chalfant Valley earthquake (located directly NNE of Owens Valley) showed pure right-lateral faulting on a 60 ø dipping plane [Cockerham and Corbett, 1987]. With an assumed S3 orientation of N80øW, this slip implies a strike-slip faulting regime with rather low tb values (close to reverse faulting). If however, as suggested by the
geodetic data, the slip vector was oblique with components of both right-lateral and normal slip (rake = 28ø), the implied (3 value for an S 3 orientation of N80øW is about 1.0 (Sttma x .• Sv).
Thus, in general, the earthquake focal mechanism data are consistent with the recent fault slip data and imply a modern stress regime along the Walker Lane belt-Sierran boundary zone in which SHmax • S V and with an S 3 orientation of N80ø-90øW. If a stress regime similar to the modern one has persisted in this region throughout much of Holocene time, it may explain the order of magnitude decrease in slip rates along the Sierran normal dip-slip frontal fault compared to the strike-slip rates along the Owens Valley fault.
Central Nevada
Fault slip data from central Nevada (site CNV, Figure 3) suggest an intermediate tb value (tb = 0.39), a result in accord
7120 ZOBACK; NORTHERN BASIN AND RANGE STRESS AND MODERN DEFORMATION
with primarily oblique-normal slip focal mechanisms in this region. The most extensive pattern of surface faulting in the northern Basin and Range province occurs in central Nevada and was produced by the 1954-1959 Rainbow Mountain- Fairview Peak-Dixie Valley earthquake sequence men- tioned previously. The largest two events of the sequence occurred on December 16, 1954, and were separated by 4 min, the Fairview Peak (M = 7.1) and the Dixie Valley (M = 6.8) earthquakes. These two events are particularly signifi- cant because they occur in the same area (Dixie Valley) as the set of central Nevada fault slip data.
Doser [1986, 1987] has carefully analyzed all of the major earthquakes in this sequence using first motions and teleseis- mic body wave and Pnl waveform modeling. Because of extensive surface faulting, true fault planes were selected from the nodal planes for each event. Inversion of the slip data set inferred from the focal mechanisms of these events
yielded a stress regime transitional between normal and strike-slip faulting in which Sv '• SHmax ((/1 = 0.99). How- ever, no single stress orientation and O value could explain all of the observed slip vectors in this sequence. At least one or two of the events were aftershocks with somewhat
anomalous slip vectors which may be controlled more by local stress variations related to block motion [Pavlis and Smith, 1980]. Unfortunately, because of the overlap in coda of the two largest events on December 16, 1954, a focal mechanism could only be determined for the first (largest) event, the M = 7.1 Fairview Peak event. Forward modeling of the oblique-normal slip vector for this event indicates a normal faulting stress regime with a O value between 0.87 and 1.0 for an S3 orientation between N50 ø and 60øW. Using the S3 orientation of N53øW obtained from the inversion, five events in this sequence (including the three largest with focal mechanisms, M = 7.1, 6.6, 6.8) were consistent with a normal faulting regime with the O values between 0.4 and 1.0. The remaining two events of the sequence both required a strike-slip stress regime with a O value of 0.69. Thus the inferred slip vectors for these events indicate some variabil- ity in relative stress magnitude and suggest overall a transi- tional stress regime (Sv • Su .... ) for this earthquake se- quence.
In a careful study of scarps formed during the 1915 (M = 7.2) Pleasant Valley Nevada earthquake (epicenter about 100 km NNE of Rainbow Mountain-Fairview Peak-
Dixie Valley area, CNS on Figure 3), Wallace [1984] deter- mined a mean extension direction of N65øW, orthogonal to the overall N25øE trend of the surface rupture. Pure normal dip slip on this fault is inconsistent with a Shmi, orientation of N50ø-55øW and a stress regime in which $v • SHmax as inferred for the 1954-1959 earthquake sequence discussed above. To explain the Pleasant Valley slip vector, either the S_• orientation must be closer to N65øW and/or the relative stress magnitudes must change so that S,m•x approaches ShEin in magnitude (•-• 0 in a normal faulting regime). Slip in the 1915 Pleasant Valley event is, however, consistent with the fault slip data from Dixie Valley which also record a deformation phase in which slip was less oblique than that recorded in the 1954-1959 events and • values were lower.
Nevada Test Site
Stock and Healy [1988] reviewed all available hydraulic fracture data for the Nevada Test Site (NTS) and concluded that the stress regime to depths of---2 km was one of normal
faulting (S• = Sv) with an S_• oriented N60øW and a O value between 0.25 and 0.7, with the highest O values determined at the deepest structural levels. However, the results of the Angelier inversion on 11 focal mechanisms (all primarily strike slip) from the NTS region [Rogers et al., 1983] indicate a best fitting stress field also with S3 oriented about N60øW but with S2 = Sv and a high O value (0.83) (Table 2).
Stock et al. [1985] and J. M. Stock (written communica- tion, 1985) showed that when the normal faulting stress field determined from in situ stress studies (with intermediate O values, 0.5-0.7) was resolved on nodal planes of the NTS region focal mechanisms, the calculated maximum shear stress orientations were nearly parallel to the approximately horizontal slip vectors indicated by the primarily strike-slip focal mechanisms (see Figure 5). Similarly, Harmsen and Rogers [1986] explain the coexistence of normal, oblique, and strike-slip focal mechanisms in the 3-12 km depth range in the NTS region as a result of slip on preexisting faults in an "axisymmetric" stress regime (transitional between nor- mal and strike-slip faulting with S Hmax = S V). The contrast between the modern stress regime inferred from the stress measurements and that inferred from the focal mechanisms
suggests a depth-dependent variation in relative stress mag- nitudes in the upper 3-4 km. Below that depth the relative magnitudes of S/•E•X and S v may remain fixed and approx- imately equal to one another.
Fault slip data from an area of young faulting within NTS suggest temporal variations in relative stress magnitudes. Data from Hampel Wash exhibited a bimodal distribution of rakes (nearly pure dip-slip and pure strike-slip) [Frizzell and Zoback, 1987]. Inversion of the entire data set yielded a normal faulting stress regime with an S3 oriented N60øW and a • = 0.5. This solution fit all the data well except for a subset of strike-slip subparallel to the majority of the normal faults of the data set. Thus here, as in Owens Valley, subparallel normal and strike-slip faults provide evidence for temporally varying stresses. All available data for stress orientation on NTS indicate a consistent S3 direction of N60ø-70øW, suggesting that most of the temporal variation must occur in relative stress magnitudes (0 values).
Eastern Basin and Range Province/Wasatch Front Region
Another area of strike-slip focal mechanisms within the Basin and Range province is the Sevier Valley region along the Basin and Range-Colorado Plateau transition in central Utah (see location, Figure 3). Well-constrained focal mech- anisms for microearthquakes (M < 2.0) in this area (Figure 8) indicate nearly pure strike-slip faulting events (Figure 8) over the entire depth range, from near surface to 10 km depth [Arabasz and dulander, 1986]. Two larger events in the region (M = 4.0 and M = 5.2) exhibited oblique-normal slip. Slip data collected from small faults in this area by Anderson and Barnhard [1984] indicate a nearly bimodal distribution of steep (dip slip) and shallow (strike slip) rakes. Typically, the strike-slip and dip-slip deformation occurs on faults of similar orientation. This style of deformation is similar to that in Owens Valley, and these data are similarly interpreted to indicate a relatively constant E-W Shmin orientation accompanied by large changes in relative magni- tude of S v and SHmax. Arabasz and dulander [ 1986] analyzed focal mechanisms throughout the Basin and Range- Colorado Plateau transition in central and southern Utah and
ZOBACK: NORTHERN BASIN AND RANGE STRESS AND MODERN DEFORMATION 7121
suggest that the entire transition zone is currently character- ized by a stress regime transitional between strike-slip and normal faulting (similar to the Owens Valley area along the Sierra Nevada-Basin and Range transition to the west).
However, farther to the north along the Basin and Range- Colorado Plateau transition zone the fault slip and earth- quake focal mechanisms data in the Wasatch front region are characterized by primarily dip-slip movement, despite a wide range in strike of the active fault planes. An S3 orientation of N85øW and an average (3 value of 0.32 results from the Angelier inversion of the regional Wasatch front fault slip data set (Table 1). Fault slip data from Corner Canyon which, as discussed previously, were collected from a structurally complex right-angle bend in the Wasatch fault zone yield an S3 orientation of Nl16øW (N64øE) and an average 0 value of 0.69.
No single stress tensor can explain all the fault slip vectors from the regional data set along the Wasatch front. Forward modeling of slip at individual sites for a range of S3 orienta- tions indicates that all slip vectors are consistent with a normal faulting stress regime, a horizontal S3 orientation of E-W _+ 10 ø , and with a spectrum of 0 values between approximately 0.0 and 0.85. Slip at four of the eight localities requires a very low 0 value (0 -< 0.1): two of the localities indicate a 0 between 0.3 and 0.4, and two other localities (including two distinct yet presumably contemporaneous slip vectors at the Bear Lake site, see the appendix) suggest 0 values of 0.85. Thus, while the S3 orientation may have remained relatively constant (_+ 10ø), there appears to have been substantial variation in relative stress magnitudes. Because the age of the deformation recorded on the bedrock scarps is poorly constrained, it is unknown whether these differences represent temporal or regional variations.
The Wasatch fault zone proper, despite abundant late Quaternary scarps, is largely aseismic. Similar to the fault slip data, earthquake focal mechanisms of moderate-sized events (magnitude 3.0-6.0) in the Wasatch front region suggest primarily dip-slip movement, in contrast to the primarily strike-slip mechanisms in both the southeastern, southern, and western portions of the Basin and Range province described previously. Inversion of nodal planes determined for single events (magnitude 4.0-6.0) occurring in a 100-kin-wide zone along the Wasatch front between 1960 and 1976 [Arabasz et al., 1980; Smith and Lindh, 1978] yields a N81øW S3 orientation and an average 0 value of 0.5. A more recent analysis of focal mechanisms for digitally re- corded events along the Wasatch front (magnitude range 2.7-4.4) using a revised crustal structure model and a com- puterized grid search technique yielded primarily oblique- slip events [Bjarnason and Pechmann, 1989]. Inversion of all events which occurred north of 40øN yields a normal faulting stress regime with an S 3 oriented N88øW and a 0 = 0.86. In all but one of the 12 events analyzed, at least one of the two nodal planes had a slip vector that agreed within 14 ø of the predicted slip for this solution, and most had one plane with a slip vector with a discordance of less than 9 ø. Unfortu- nately, since the true fault plane was not known for any of the events in either of these data sets (there were no surface ruptures associated with any of the events), the 0 value determined from both sets of focal mechanism data must be
considered with caution.
The largest historic event in Utah occurred in 1934 in Hansel Valley located in northwestern Utah some 40 km
west of the Wasatch front (see Figure 6). This M - 6.6 event produced a series of N-S trending en echelon fractures with vertical displacements of 5-50 cm [Shenon, 1936]. Previous first motions studies for this event yielded two different solutions, one a normal dip slip and the other a combination of strike-slip and reverse faulting [Dewey et al., 1973]. In a recent reanalysis of the first motion data combined with body waveform analysis, Doser [1989] determined that the 1934 main shock was best modeled as left-lateral, slightly oblique normal slip (rake = 12 ø) on a N42øE striking, steeply dipping fault plane (89 ø dip). Because the inferred fault plane is so steep, even a 12 ø rake is somewhat surprising. For principal stresses lying in horizontal and vertical planes, the predicted slip on a vertical plane is pure strike slip (rake = 0ø). The observed 12 ø rake requires a normal faulting stress regime (S, = Sv) and a very low 0 (0 = 0.15-0.16) for principal stresses lying in horizontal and vertical planes and with an S3 orientation of N90 ø ___ 10øE. Frictionally, it is unlikely that such a steep fault would have been reactivated in such a stress regime and may indicate that the causative stresses at depth did not conform to near horizontal and vertical planes.
Thus available earthquake and fault slip data suggest a normal faulting stress regime for the Wasatch front with broad variability 0 values. In contrast, in situ stress mea- surements and well bore breakouts suggest that the modern 0 value is quite low (S/-/max • Shmin). Hydraulic fracturing measurements in Fifth Water hole DH-101 yielded upper bound limits on 0 values between 0.08 and 0.35 between 1500 and 1870 m in depth [Haimson, 1981]. These 0 values were calculated using estimates of the vertical stress, mea- sured values of S hmin (S3) , and upper bound estimates for S nmax resulting from subhydrostatic conditions in the hole and surface pressure monitoring. The 0 values calculated from two tests in the Heber City well were 0.21 and 0.04 [Haimson, 1984, 1985]. These measured 0 values as well as the wide range in azimuth of all of the hydraulic fractures measured throughout central Utah (Figure 11) are consistent with a nearly isotropic horizontal stress field Hamison [1984, 1985]. Similarly, the lack of well-defined, preferred breakout data in wells in central Utah discussed previously is also suggestive of small differences in horizontal stress magni- tudes. Thus the in situ stress and well bore elongation measurements indicate a low 0 value for the upper 4 km of the Earth's crust sampled by these data.
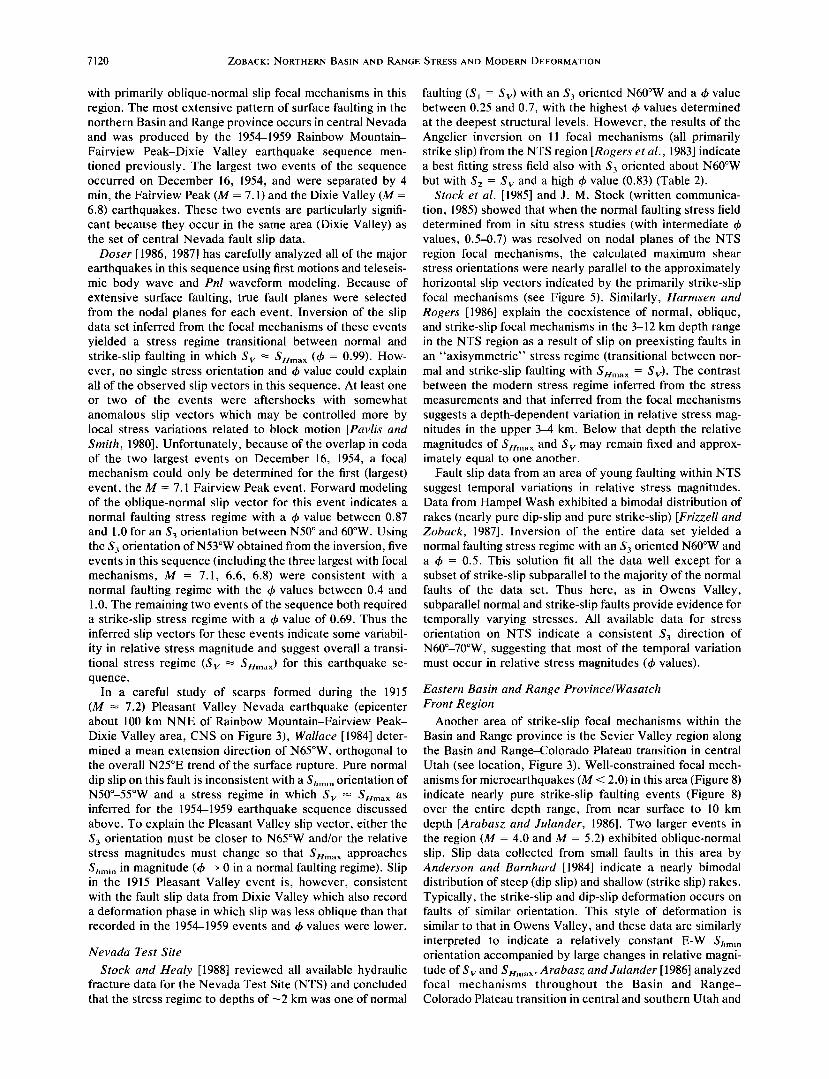
Slip data from a 5-km-long bedrock fault plane exposed by gravel excavation along the Warm Springs fault zone, part of the Wasatch fault zone north of Salt Lake City, Utah (fault slip locality 5, Figure 6), indicated two distinct superposed striae sets [Pavlis and Smith, 1980]. Similarily, the azimuth of large-scale undulations of the fault surface with wave- lengths from 1 to 10 m also showed a bimodal grouping. The superposition of the striae allowed a determination of rela- tive age of the two slip events. Pavlis and Smith interpreted the two striae sets as records of the slip directions during the last two major seismic events on the fault. Because the average recurrence interval for major events along a given segment of the Wasatch fault varies between 1700 and 3000 years [Schwartz and Coppersmith, 1984], the time frame for these two events is likely within the Holocene (last 10,000 years). The two mean measured slip directions on the Warm Springs fault are designated by "O" (older) and "Y" (younger) on Figure 15. The younger offset is nearly pure dip
7122 ZOBACK: NORTHERN BASIN AND RANGE STRESS AND MODERN DEFORMATION
N
N45ow • S3 •younger C•olaer 47 ø 1.00 --
58 ø 0.14 1.00
60 ø 0.12 0.87
70 ø 0.08 0.54
80 ø 0.06 0.42
W 90 ø 0.06 0.38
100 ø 0.06 0.37
110 ø 0.07 0.40
120 ø 0.11 0.40
S
Fig. 15. Mean attitude and measured slip directions ("O," older; "Y," younger) for the Warm Springs fault (locality 5 on Figure 6). Also shown are computed •b values corresponding to the two observed slip vectors for various horizontal orientations of the principal stresses.
slip, with a rake of 85øN. The older set records a substantial component of right-lateral motion, with a rake of 56øN.
A forward modeling approach was used to determine the range of likely stress fields which could produce the two observed, oblique-slip vectors on the Warm Springs fault. As indicated in Figure 15, S• was assumed to be vertical, orientation of the horizontal stresses was allowed to vary, and the corresponding 4> value was computed. Since both slip directions were oblique, end-member limits on horizon- tal stress orientations correspond to the case when 4> = 1.0. For the younger slip direction this corresponds to an orientation of N46øE. The orientation of S_• corresponding to 4> = 1.0 for the older slip direction was N58øE. The com- puted 4> values for a wide range of horizontal stress orienta- tions are shown in Figure 15. Based on the deformation data presented above, likely S.• orientations for this region were considered to lie in the range of N90 ø + 20 ø. Note that the computed 4> values to explain the two different slip vectors are distinct over almost the entire range of orientations considered. Throughout this range the younger slip direction requires a very low 4> value, 4> < 0.10, whereas the computed value for the older slip direction over the same range of possible stress orientations suggests a substantially larger value, 4> > 0.40.
Alternately, the two observed slip directions could have been produced by small changes of S3 from near the limiting stress orientations (approximately N60øE to N50øE from the older to the younger slip event) and correspondingly small changes in 4> values (4> • 0.8-0.9 in both cases). Such a northeasterly orientation for S3 seems inconsistent with other regional data on the modern stress field from this region. However, the Warm Springs locality occurs at the northern end of the Salt Lake segment of the Wasatch fault [Schwartz and Coppersmith, 1984]. Although no major bend in the Wasatch fault trace has been mapped in this area, it is possible that the inferred variations in the stress field re- quired to explain the two slip vectors may be related to local stress anomalies near the end of a major fault segment. However, these data were interpreted by Pavlis and Smith [1980] as recording the slip directions along the fault segment
during the last two major seismic events, this inference was, in part, based on highly oblique striae observed on an E-W trending, steeply dipping fault within the Wasatch fault zone south of the Warm Springs fault. The striae on the E-W fault recorded the same two slip events, suggesting that these two slip episodes were extensive, not just local anomalies near the end of the Salt Lake segment.
DISCUSSION
Temporal, Regional, and Depth-Dependent Variation in c3 Values
Wright [1976] noted contrasting patterns and styles of deformation within the Basin and Range and subdivided the province into two deformational fields each having a similar WNW least principal stress direction' a northern field (northern and central part of the northern Basin and Range) characterized by a vertical maximum principal stress and a southern field (including the southeastern and the western margins of the northern Basin and Range province) in which the maximum horizontal and the vertical stress locally exchange magnitudes. The data presented above support this general pattern and suggest that a modern stress regime transitional between strike-slip and normal faulting (Sv • S/•max) appears to characterize nearly all of the seismically active portions of the Basin and Range including much of the Sierra Nevada-Basin and Range transition, the Nevada Test Site in southern Nevada, the central Nevada seismic belt, and the Basin and Range-Colorado Plateau transition in southern and central Utah. However, in all these areas, paleoslip data include observations of nearly pure dip-slip and strike-slip displacements on subparallel faults (in some cases nearly orthogonal striae have been found superim- posed on the same fault plane); these observations indicate temporal variation in relative stress magnitudes and/or prin- cipal stress orientations. Most of the data suggest that principal stress orientations remain relatively constant with the primary variation influencing slip vectors occurring in relative stress magnitudes.
Nearly pure dip-slip and strike-slip displacements on subparallel faults characterize deformation along of much of the Sierran boundary zone/Walker lane belt [Stewart, 1988]. Several significant inferences can be drawn from well- constrained fault slip data from the Owens Valley area within this zone. The contemporary state of stress in this region (and possibly representative of much of Holocene time) appears characterized by an S3 orientation of N80 ø- 85øW and a stress regime transitional between strike-slip and normal faulting (Sv • Sr•max or (b • 1.0). This regime favors primarily lateral offset on steeply dipping preexisting fault planes, consistent with the observation of possibly three major Holocene strike-slip events on the Owens Valley fault zone [Beanland and Clark, 1987; Lubetkin and Clark, 1988]. The Holocene slip rate along the adjacent, more shallowly dipping Sierran normal fault zones (Independence fault) is at least an order of magnitude lower than along the Owens Valley fault zone [Clark et al., 1984]. Both Holocene and major late Pleistocene displacement on the Independence fault zone appears to be purely dip slip, with no evidence of lateral or oblique offset [Gillespie, 1982]. However, as indi- cated in Figure 13, slip on the more shallowly dipping faults in the inferred modern stress regime should be highly oblique (rakes 50ø-55ø). Thus, if the S3 orientation has remained
ZOBACK: NORTHERN BASIN AND RANGE STRESS AND MODERN DEFORMATION 7123
about N80ø-85øW (as suggested by the nearby focal mecha- nism and fault slip data), the late Pleistocene dip-slip dis- placement on the Sierran faults requires a very low (3 value ((3 • 0). Interestingly, the one paleofault slip data set available along the Sierran frontal zone at Genoa (-125 km to the north of Owens Valley) yielded a (3 = 0.22. Thus temporal variations in (3 values are implied for the Sierra boundary zone/Walker Lane belt region, with modern values rather high, (3 • 1.0, and a suggestion that the Holocene stress regime is substantially different from that in late Pleistocene time.
Similarily, deformation in seismically active central Ne- vada indicates a modern stress regime with an S3 orientation of N45øW and a (3 value • 1.0; however, fault slip data record an earlier phase of deformation where slip was less oblique and (3 values were lower (0.3-0.4). Forward model- ing of slip vectors for several events occurring within the 1954-1959 Fairview Peak-Dixie Valley-Rainbow Mountain earthquake sequence in central Nevada indicates that rela- tive stress magnitudes ((3 values) vary laterally within a very short time period along a zone of active deformation. How- ever, slip vectors in this case may be more controlled by block motion constraints rather than truly reflecting the orientation of the maximum shear stress resolved on that
plane from the regional tectonic stress tensor. Breakout and in situ stress data from northern Utah and
the Nevada Test Site suggest that the relative stress magni- tudes measured at relatively shallow crustal levels may not be totally representative of those at seismogenic depths. This is best demonstrated in north central Utah where the
stress regime at shallow crustal levels (to depths of-4 km) is one of normal faulting with an inferred (3 • 0, whereas earthquake data suggest a deeper stress regime with a more intermediate (3 value. An explanation of this phenomena is that S•max increases more rapidly with depth than Shmin below depths of about 4 kin.
Depth-dependent variations in relative stress magnitudes inferred from focal mechanism data alone must be viewed
with caution. As demonstrated in Figure 14 and discussed in detail by Harmsen and Rogers [1986], in a stress regime transitional between normal and strike-slip faulting (Sr•max • S hmin) a variety of faulting styles ranging between pure dip slip, oblique normal and pure strike slip are possible. The attitude of preexisting fault planes being reactivated has a strong influence on the style of faulting inferred from focal mechanisms.
Significance of Low c• Values in a Normal Faulting Regime
Because the results of available in situ stress measure-
ments in the Basin and Range province indicate that the magnitude of the least principal stress is close to the critical (faulting equilibrium) value for frictional faulting on opti- mally oriented faults, the case of rk = 0 (as suggested during major slip events along the Sierran frontal fault zone) implies that the intermediate principal stress S2 must also be close to this faulting equilibrium value. Hence normal faults of any favorable dip (relative to S1) could potentially be active. This condition of approximately isotropic horizontal stress with a magnitude near the critical value for slip on optimally oriented faults has been measured at shallow depths (<2 km) at three sites 20 km east of the Wasatch fault.
The rk • 0 condition carries important implications for earthquake hazard assessment in that under this condition, faults of a wide variety of azimuths are potentially active. Following a major stress release event (large earthquake), for example, it is possible that the previous intermediate stress S2 might become the new minimum stress; that is, even the small stress drops of earthquakes (typically 30-100 bars) may be enough to cause an exchange in the relative magnitudes of the two horizontal stresses. In this case a major earthquake on a roughly N-S trending normal fault could be followed by a minor event on an E-W trending normal fault. Such E-W striking faults are present and typically delineate the northern or southern ends of individ- ual basins or major fault segments. Temporal variations of the horizontal stress field (magnitude and/or orientation) may be strongly influenced by the earthquake cycle itself, complicating the search for any sort of precursory phenom- ena.
Sources of Regional and Temporal Variations in the Stress Tensor
A major temporal change in regional S 3 orientations from WSW to approximately WNW is inferred to have occurred in the northern and southern Basin and Range and Rio Grande rift region approximately 10 Ma based on dike trends and faulting patterns [Zoback and Thompson, 1978; Eaton et al., 1978; M. L. Zoback et al., 1981; Lipman, 1980; Golombek et al., 1983]. This province-wide change probably coincided with major shear coupling along the western edge of the continent related to development of the San Andreas transform. Such broad scale changes in plate tectonic regime are not so likely as sources for temporal changes in the stress field described below for the Basin and Range province that appear to have occurred on time scales of less than a million years (the time scale of a single earthquake cycle (1000-5000 years) for Warm Springs fault, Utah, or multiple earthquake cycles (10,000-100,000) in Owens Valley, California).
Major fluctuations in relative stress magnitudes are be- lieved due primarily to variation in the absolute magnitude of Sr•max (the generally N-S trending stress). This inference is based on available in situ stress measurements which indi-
cate that principal stress differences (S• - S3) in the shallow part of the Earth's crust remain close to the critical (faulting equilibrium) value which is controlled by the frictional strength of optimally oriented preexisting faults [Arabasz, 1984; Zoback and Healy, 1984; Stock et al., 1985] and the fact that the magnitude of S• (Sv) is tied to the weight of the overburden.
Potential sources of regional and temporal variations in the stress tensor include the following: (1) Stress refraction is related to the geometry of preexisting zones of weakness and/or lateral variations in lithospheric structure; the data suggest that this may be the case along the eastern Basin and Range-Colorado Plateau margin [Zoback, 1983; Arabasz and Julander, 1986]. (2) Isostatic rebound of the late Pleis- tocene lakes Lake Bonneville and Lake Lahontan generates stresses oriented normal to the old shorelines. This source of
stress, however, should have little effect on the magnitude of the apparent time-varying N-S horizontal stress in both the Wasatch front and the northern Sierran front regions where the shorelines run approximately N-S. (3) Possible long-time scale (greater than a single major earthquake cycle) varia- tions in motion along the San Andreas transform boundary
7124 ZOBACK.' NORTHERN BASIN AND RANGE STRESS AND MODERN DEFORMATION
may result in fluctuations in the magnitude of the approxi- mately north trending horizontal stress. The Owens Valley area and much of the Walker Lane belt lie directly north of the big bend region of the San Andreas (see Figure 3). (4) Nonuniform ductile or plastic deformation in the lower crust results in localized zones of upper crustal deformation (e.g., Nevada seismic belt [Wallace, 1979, 1984]).
McGarr [1982] proposed a model to explain stress differ- ences between the Basin and Range Northern Rocky Moun- tains/Colorado Plateau provinces in which thermally induced flow in the lower crust applied tractions to the base of the brittle crust. This flow is perpendicular to the province boundary and should primarily affect the magnitude of the E-W stress, S3, not the N-S stress. Localized zones of intrusion into the lower crust may also induce shear tractions on the base of the brittle layer. Major historic deformation within the northern Basin and Range province has occurred along the north trending central Nevada seismic belt (ex- tending approximately from Owens Valley, California, on the south to Pleasant Valley, Nevada, on the north; see Figure 1 for location). This belt has been the site of repeated moderate to large earthquakes (M 6.8 to -8) occurring at intervals of minutes up to a few decades [Ryall et al., 1966; Wallace and Whitney, 1984]. Interestingly, this loci of de- formation trends somewhat oblique to the trend of range blocks in the region and, in fact, in several of the events surface ruptures occur on fault segments along several distinct ranges [Wallace, 1979, 1984] suggestive of an under- lying localized zone of extension possibly related to a narrow zone of intrusion at depth.
CONCLUDING REMARKS
New data on fault slip measurements, earthquake focal mechanisms, hydraulic fracturing stress measurements, well bore elongations, and young volcanic alignments help to constrain the state of stress in the northern Basin and Range province. These data allow characterization not only of principal stress orientations but also relative stress magni- tudes. They indicate significant regional variations in both stress orientations and relative magnitudes of the modern stress field. The least horizontal stress (S3) is oriented approximately E-W along both the eastern and western margins of the northern Basin and Range province (N70 ø- 100øW Basin and Range-Sierra Nevada boundary; N90 ø- 110øW Wasatch front region, and N75ø-90øW along Basin and Range-Colorado Plateau transition zone in south and central Utah). However, the active, interior regions of the Basin and Range province, as inferred from data analyzed for central Nevada and NTS, are characterized by a more northwesterly orientation for S3, N45ø-60øW.
Most seismically active areas of the province (with the possible exception of the Wasatch front) indicate a combi- nation of strike-slip, normal dip-slip, and oblique-slip fault- ing and suggest a stress regime transitional between normal and strike-slip faulting, where S/•max • Sv. Temporal vari- ations in stress regime due to variations in relative stress magnitudes ((3 value) are indicated by paleoslip data. Obser- vations of nearly pure normal dip-slip and strike-slip events on subparallel faults are common within the Sierra Nevada- Basin and Range transition (including the Walker Lane belt) and in the Basin and Range-Colorado Plateau transition in southern and central Utah. The variations in (3 value are best explained by large fluctuation in the magnitude of the N-S
horizontal principal stress (from •Sv to •Shmin ). In some areas, temporal variations in (3 value are suggested by variation in degree of obliquity of fault rakes or superposed striae.
Depth-dependent variations in relative stress magnitudes are indicated by contrasts in stress regime between relatively shallow crustal levels (<4 km) (inferred from in situ stress measurements and breakout data) and deeper structural levels (as inferred from earthquake focal mechanisms). However, caution must be exercised when inferring depth- dependent (3 value variations from focal mechanism data alone since the attitude of preexisting fault planes being reactivated has a strong influence on the faulting style suggested by those focal mechanisms.
Sources of regional variations of the modern stress field are not obvious. Contrasts between S3 orientations in the interior of the province with those along its margin suggest that preexisting structural grain (and/or major lateral varia- tion in lithospheric structure) may influence stress orienta- tions, locally resulting in relatively minor reorientations (<25 ø ) of principal stresses parallel and perpendicular to structural boundaries. Possible sources of temporal fluctua- tions of relative stress magnitudes (probably largely related to variations in the magnitude of the approximately north trending maximum horizontal stress) are even more elusive. Stresses generated by the isostatic rebound of Pleistocene lakes probably primarily affect the E-W stress magnitude, not that of the N-S tectonic stress. Relative stress magni- tudes along the Sierra Nevada-Basin and Range boundary zone may be influenced by fluctuations in the regional stress related to proximity of this region to the "big bend" in the San Andreas transform system. Nonuniform strain in the ductile lower crust may be responsible for much of the regional variations in relative stress magnitude; this nonuni- form strain could result from zones of igneous intrusion or from strain localization along preexisting lower crustal duc- tile shear zones [e.g., Zoback et al., 1985b].
APPENDIX: DETAILED DESCRIPTION
OF FAULT SLIP LOCALITIES
Genoa, Nevada
The normal fault zone sampled is part of the Sierran frontal fault zone. A prominent bedrock escarpment is exposed along State Highway 206 just south of the town of Genoa. Distinct fault slip data sets were collected separately by R. C. Bucknam (U.S. Geological Survey (USGS), Den- ver) and G. A. Thompson (Stanford University). Bucknam measured slip on small fault planes within the footwall block behind the main bedrock escarpment (exact locality un- known) and Thompson measured slip on various segments along a 2-km stretch of the bedrock fault escarpment (T 13N, R 19E, sec. 15 and 22). The distribution of fault planes in the Thompson data set was insufficient to perform the inversion of that data set alone. The Bucknam data were run alone; then the two data sets were combined. The results from both
runs were nearly identical, and the Thompson data were well fit with the stress field obtained from the Bucknam fault zone
data. The results given in Table 1 are for the combined data set.
Candelaria, Nevada
Fault slip data were collected from the Candelaria Hills region by R. C. Speed and A. H. Cogbill (R. C. Speed,
ZOBACK: NORTHERN BASIN AND RANGE STRESS AND MODERN DEFORMATION 7125
written communication, 1984). The data analyzed came from bedrock escarpments along two major fault zones, the Can- delaria fault zone (T 4N, R 35E, not divided into sections, measurements made in mines from a point due south of Candelaria townsite to the west for 2 km) and the Douglas fault (T 6N, R 34E, exact section unknown). Both the Candelaria fault and Camp Douglas fault zones strike N75 ø- 90øE and exhibit a significant component of left-lateral oblique slip. Faults within the Candelaria zone cut talus and a 2.8 Ma basalt yet have no surface expression. The Camp Douglas fault cuts 15-m.y.-old rocks but has no scarps in alluvium. Modern activity is suggested by microearthquakes near both fault traces. The tectonics of the region have been described in detail by Speed and Cogbill [1979]. Data from the two fault zones were analyzed together because data from each fault set lacked sufficient variability in fault attitude to perform the inversion separately.
Wassuk Range, Nevada
Data were collected by R. C. Buckman from a site along the frontal fault zone on the eastern side of the Wassuk
Range. The data were measured near the mouth of Deadman Canyon (T 11N, R 29E, sec. 19) and represent deformation on small planes within the fault zone proper, rather than along a major bedrock escarpment.
Central Nevada
This data set is a combination of measurements made on
major bedrock escarpments along two different range- bounding fault zones. Approximately half the measurements (24 out of 59) were made by D. B. Burke and G. A. Thompson [Thompson and Burke, 1973; G. A. Thompson, written communication, 1985] at nine sites along a 24-km stretch of a NE striking, east dipping fault zone bounding the west side of Dixie Valley. The sites were between Coyote Canyon (T 19N, R 34E, Sec. 6, NW 1/4) and a locality west of Boyer Ranch (T 24N, R36E, sec. 16). A magnitude 6.8 earthquake occurred in 1954 along the Dixie Valley fault zone; however, most but not all of these measurements came from older bedrock escarpments exposed in the fault zone. The remainder of the measurements were made by G. A. Thompson and M. L. Zoback [Zoback, 1978] 120 km to the northeast along a 5-km segment of the ENE trending fault zone bounding the northern edge of the Cortez Range (T 28N, R 49E, sec. 17, 16 and 2). The data from these two studies were combined because the individual data sets
lacked sufficient variability in fault attitudes to perform separate inversions. Justification for combining the two data sets comes from the fact that both fault zones show repeated evidence of Holocene movement and lie within an identified
more-or-less continuous zone of relatively high levels of Quaternary tectonism in central Nevada [Wallace, 1979; Wallace and Whitney, 1984]. The excellent fit of the data to the calculated stress tensor (more than 90% of the slip measurements were less than 10 ø different from the predicted orientations) provides further support for combining the data sets.
Wasatch Front, Utah
This regional fault slip data set represents mean fault attitudes and slip orientations measured at seven exposed bedrock escarpments along the Wasatch fault zone proper,
one site along the main range front fault bounding the Oquirrh Range (the first range west of the Wasatch Front near Salt Lake City), and one site along the Bear Lake fault zone in southernmost Idaho which lies approximately 50 km east of the northern end of the Wasatch fault. Sites are
described from north to south.
Site 1: Bear Lake 1 (T15S, R44E, sec. 1, NW1/4). Data come from the fault zone at the western edge of Merkeley Mountain, Idaho, and the eastern margin of Bear Lake. Measurements were made on an approximately 100-m-long bedrock fault surface exposed in a gravel pit along strike of fault zone in alluvium exhibiting 2-3 m of Holocene displace- ment (A. J. Crone, (written communication, 1985). Mean fault attitude: N3øW, 53øW; rake: 81øN.
Site 2: Bear Lake 2 (T15S, R44E, sec. 12, NW1/4). Data come from a well-preserved bedrock fault surface exposed by gravel excavation along range front scarp. Locality is approximately 2 km south of Bear Lake 1. Mean fault attitude: NSøE, 57øW; rake: 87øS.
Site 3: Deweyville (TllN, R2w, sec. 9, Swl/4). Slip measurements were collected along a brecciated bedrock fault surface exposed in a gravel quarry along the western front of the Wellsville Mountains. This fault zone is along strike with scarps in alluvium of probable late Pleistocene age [Cluff et al., 1974; Anderson and Miller, 1979]. Mean fault attitude: N10øE, 65øW; rake: 73øS.
Site 4: Utah Hot Springs (T7N, R2W, sec. 14, SE1/ 4). Data came from a brecciated bedrock fault surface exposed in a road cut along the Wasatch fault zone north of Ogden. This segment of the fault zone has evidence of Holocene movement [Cluff et al., 1970; Anderson and Miller, 1979]. Mean fault attitude: N35øW, 70øW; rake: 79øS.
Site 5: Warm Springs (TIN, R1W, sect. 23, El/ 2). Measurements by T. L. Pavlis [Pavlis and Smith, 1980] along a 1-km segment of a bedrock fault surface exposed by gravel excavation. Offsets in alluvium on strike with the bedrock fault indicate 12 m [Gilbert, 1890] of post-Lake Bonneville displacement (14,000-15,000 years B.P. [Scott et al., 1983]). Two distinct striae sets were frequently super- posed which allowed a determination of relative age. Mean fault attitude: N45øW, 70øW; rake: 85øN younger, 56øN older.
Site 6: Mercur mine (T6S, R4W, sec. 3, NW1/4). A single striae measurement was made on a bedrock fault surface of
the West Mercur fault exposed in an inclined mine shaft along the bedrock-alluvium contact. The measurement made at a depth of 40 m by B. L. Everitt [Everitt and Kaliser, 1980, p. 16]. Displacements in alluvium attest to late Pleistocene faulting on this zone with the most recent event occurring either preceding [Bucknam, 1978] or post [Everitt and Ka- liser, 1980] the Bonneville shoreline (14,000-15,000 years B.P. [Scott et al., 1983]). Mean fault attitude: N10øW, 46.5øW; rake: 82øN.
Site 7: Rock Canyon (T6S, R3E, sec. 32, NE1/4). Striae measurements made on a bedrock fault surface exposed by excavation for a water tank. Locality is along a segment of the Wasatch fault just north of Provo with prominent alluvial scarps of late Pleistocene and Holocene age [Anderson and Miller, 1979]. Mean fault attitude: N3øW, 44øW; rake: 82øS.
Site 8: Springville (T7S, R3E, sec, 35, SW1/4). Striae measured on a sheared and brecciated fault surface in
limestone containing mafic dikes subparallel to the fault surface. Age of dikes is unknown. Exposure in a roadcut
7126 ZOBACK: NORTHERN BASIN AND RANGE STRESS AND MODERN DEFORMATION
within a zone of alluvial scarps of probable Holocene age. This site is just 1 km north of the Hobble Creek trench site where Swan et al. [1980] reported six to seven surface faulting events post-13,500 years BP. Mean fault attitude: N20øW, 51øW; rake: 86øS.
Site 9: Little Birch Canyon (T12S, R1E, sec. 21, NWI/ 4). Excellent striae were measure along a 100-m-long bed- rock fault surface exposed by gravel excavation. This bed- rock scarp is part of a range front fault scarp. The scarp is a continuation of the scarp at North Creek where a fan dated at 4580 14C years B.P. [Buckham, 1978] has been offset by the three large-displacement surface faulting events, with the most recent having occurred only 300-500 years ago [Schwartz and Coppersmith, 1984]. Mean fault attitude: N35øE, 68øW; rake: 85øS.
Corner Canyon (CC), Utah
Measurements were made along a 0.5-km stretch of road- cut exposures of hydrothermally altered and structurally deformed quartz monzonite along the Wasatch fault south- east of Salt Lake City (T4S, R1E, sec. 3, SW1/4). Cataclasite and phyllonite formed from alteration and mechanical defor- mation of the quartz monzonite at depth comprise a partially preserved footwall carapace up to 100 m thick along the southern and western margins of the Little Cottonwood stock [Parry and Bruhn, 1986]. The Wasatch fault zone makes nearly a 90 ø bend around the margin of the stock rather than cut through it. Locally, remnants of the catacla- site carapace are penetrated by small-scale faults (offsets of the order of centimeters, meters, and hundred meters) which are commonly coated with epidote, chlorite, and sericite [Parry and Bruhn, 1986] and exhibit excellent slickensides. Age of the deformation recorded by the slickensides is unclear, the deformation associated with the chlorite, epi- dote, and sericite alteration has been dated at 10-24 Ma [Parry and Bruhn, 1986]. This locality lies along the Salt Lake City segment of the Wasatch fault zone which has experienced multiple Holocene events [&'hwartz and Cop- persmith, 1984].
Acknowledgments. Numerous people provided fault slip data and geologic expertise which made this paper possible. The contri- butions of George Thompson, Ernie Anderson, Bob Buckham, Sarah Beanland, Jack Stewart, Bob Speed, and Malcolm Clark are gratefully appreciated. Thoughtful reviews by Dave Hill, David Oppenheimer, and R. Ernest Anderson greatly improved the paper. JGR reviews by Diane Doser and Ray Fletcher helped focus my thoughts. Special thanks are due Jacques Angelier, who provided both the original version of the fault slip inversion program and his insight and experience in how these data are best interpreted.
REFERENCES
Angelier, J., Neotectonic de l'arc egeen, Publ. Sec. Geol. Nord, 3, 418 pp., 1979a.
Angelier, J., Determination of the mean principal directions of stresses for a given fault population, Tectenephysics, 56, T17- T26, 1979b.
Angelier, J., Tectonic analysis of fault slip data sets, J. Geophys. Res., 89, 5835-5848, 1984.
Anderson, L. W., and D. G. Miller, Quaternary fault map of Utah, scale 1:500,000, Utah Geol. and Miner. Surv., Salt Lake City, 1979.
Anderson, R. E., and T. P. Barnhard, Extensional and compres- sional paleostresses and their relationship to paleoseismicity and seismicity, central Sevier Valley, Utah, U.S. Geol. Surv. Open File Rep., 84-763, 515-546, 1984.
Arabasz, W. J., Swarm seismicity and deep hydraulic fracturing within 10 km of the southern Wasatch fault, Earthquake Notes, 55, 30-31, 1984.
Arabasz, W. J., and D. R. Julander, Geometry of seismically active faults and crustal deformation within the Basin and Range- Colorado Plateau transition in Utah, Spec. Pap. Geol. Sec. Am., 208, 43-74, 1986.
Arabasz, W. J., R. B. Smith, and W. D. Richins, Earthquake studies along the Wasatch front, Utah: Network monitoring, seismicity, and seismic hazards, Bull. Seismel. Sec. Am., 70, 1479-1499, 1980.
Askew, B., and S. T. Algermissen, An earthquake catalog for the Basin and Range province 1803-1977, U.S. Geol. Surv. Open File Rep., 83-86, 21 pp., 1983.
Babcock, E. A., Measurement of subsurface features from dipmeter logs, Am. Assoc. Pet. Geol. Bull., 62, 1111-1116, 1978.
Bateman, P. C., Willard D. Johnson and the strike-slip component of fault movement in the Owens Valley, California earthquake of 1872, Bull. Seismel. Sec. Am., 51,483-493, 1961.
Beanland, S., and M. M. Clark, The Owens Valley fault zone, eastern California, and surface rupture associated with the 1872 earthquake, Seismel. Res. Lett., 58, 32, 1987.
Bell, J. S., and D. I. Gough, Northeast-southwest compressive stress in Alberta: Evidence from oil wells, Earth Planet. Sci. Lett., 45,475-482, 1979.
Bjarnason, I. T., and J. C. Pechmann, Contemporary tectonics of the Wasatch front region, Utah, from earthquake focal mecha- nisms, Bull. Seismel. Sec. Am., in press, 1989.
Bonilla, M. G., Evidence for right-lateral movement on the Owens Valley, California, fault zone during the earthquake of 1872, and possible subsequent fault creep, Proceedings of Conference on Geological Problems of the San Andreas Fault System, Stanford Univ. Publ. Geol. Sci., 11, 4-5, 1968.
Bott, M. H. P., The mechanism of oblique slip faulting, Geol. Mag., 96, 109-117, 1959.
Bruhn, R. L., P. R. Giblet, and W. T. Parry, Rupture characteristics of normal faults: an example from the Wasatch fault zone, Utah, Continental Extensional Tectonics, edited by M.P. Coward, J. F. Dewey, and P. L. Hancock, Spec. Publ. Geol. Sec. London, 28, 337-353, 1987.
Bucknam, R. C., Northwestern Utah seismotectonic studies, in Summaries of Technical Reports, National Earthquake Hazards Reduction Program, vol. VIII, p. 64, U.S. Geological Survey, Reston, Va., 1978.
Carey, E., Recerche des directions principales de contraintes asso- ciees au jeu d'une population de failles, Rev. Geegr. Phys. Geol. Dyn., 21, 57-56, 1979.
Clark, M. M., et al., Preliminary slip-rate table and map of late- Quaternary faults of California, U.S. Geol. Surv. Open File Rep., 84-106, 1984.
Cluff, L. S., G. E. Brogan, and C. E. Glass, Wasatch fault, northern portion, earthquake fault and investigation evaluation, 27 pp., prepared for the Utah Geological and Mineralogical Survey by Woodward-Lundgren & Associates, Oakland, Calif., 1970.
Cluff, L. S., C. E. Glass, and G. E. Bfogran, Investigation of the Wasatch fault north of Brigham City and Cache Valley faults, Utah and Idaho, A Guide to Land-Use Planning With Recommen- dations for Seismic Safety, 147 pp., prepared for the U.S. Geological Survey by Woodward-Lundgren & Associates, Oak- land, Calif., 1974.
Cockerham, R. S., and E. J. Corbett, The July 1986 Chalfant Valley, California, earthquake sequence, Bull. Seismel. Sec. Am., 77, 280-289, 1987.
Cox, J. W., Long axis orientation in elongated boreholes and its correlation with rock stress data, Society of Professional Well Log Analysts, Houston, Tex., 1983.
Dewey, J. W., W. H. Dillinger, J. Taggatt, and S. T. Algermissen, A technique for seismic zoning, Analysis of Earthquake Loca- tions and Mechanisms in Northern Utah, Wyoming, Idaho and Montana, NOAA Tech. Rep., ERL267-ESL30, 28-48, 1973.
Doser, D. I., Earthquake processes in the Rainbow Mountain- Fairview Peak-Dixie valley, Nevada, region 1954-1959, J. Gee- phys. Res., 91, 12,572-12,586, 1986.
Doser, D. I., Modeling the Pnl waveforms of the Fairview Peak-
ZOBACK: NORTHERN BASIN AND RANGE STRESS AND MODERN DEFORMATION 7127
Dixie Valley, Nevada, U.S.A. earthquake sequence (1954-1959), Phys. Earth Planet. Inter., 48, 64-72, 1987.
Doser, D. i., Extensional tectonics in northern Utah-southern Idaho, U.S.A., and the 1934 Hansel Valley sequence, Phys. Earth Planet. Inter., in press, 1989.
Eaton, G. P., R. R. Wahl, H. J. Prostka, D. R. Mabey, and M.D. Kleinkopf, Regional gravity and tectonic patterns: Their relation to Cenozoic epeirogeny and lateral spreading in the western Cordillera, Mere. Geol. Soc. Am., 152, 51-91, 1978.
Ekren, E. B., F. M. Byers, Jr., R. F. Hardyman, R. F. Marvin, and M. L. Silberman, Stratigraphy, preliminary petrology, and some structural features of Tertiary volcanic rocks in the Gabbs Valley and Gillis Ranges, Mineral County, Nevada, U.S. Geol. Surv. Bull., 1464, 54 pp., 1980.
Everitt, B. L., and B. N. Kaliser, Geology for assessment of seismic risk in the Tooele and Rush valleys, Tooele County, Utah, Spec. Stud. Utah Geol. Mineral. Surv., 51, 33 p., 1980.
Frizzell, V. A., and M. L. Zoback, Stress orientation determined from fault slip data in Hampel Wash area, Nevada, and its relation to contemporary regional stress field, Tectonics, 6, 89-98, 1987.
Gephart, J. W., and D. W. Forsyth, An improved method for determining the regional stress tensor using earthquake focal mechanism data: Application to the San Fernando earthquake sequence, J. Geophys. Res., 89, 9305-9320, 1984.
Gilbert, G. K., Lake Bonneville, U.S. Geol. Surv. Monogr., 1,438 pp., 1890.
Gillespie, A. R., Quaternary glaciation and tectonics in the south- eastern Sierra Nevada, Inyo County, California, Ph.D. thesis, 695 pp., Calif. Inst. of Technol., Pasadena, 1982.
Golombeck, M.P., G. E. McGill, and L. E. Brown, Tectonic and geologic evolution of the Espanola Basin, Rio Grande rift: Struc- ture, rate of extension, and relation to the state of stress in the western United States, Tectonophysics, 94, 483-507, 1983.
Gough, D. I., and J. S. Bell, Stress orientations from oil well fractures in Alberta and Texas, Can. J. Earth Sci., 18, 638-645, 1981.
Gough, D. I., and J. S. Bell, Stress orientation from borehole wall fractures with examples from Colorado, east Texas, and northern Canada, Can. J. Earth Sci., 19, 1358-1370, 1982.
Haimson, B.C., Hydrofracturing studies drillhole DH-101, Fifth Water underground power plant site, Diamond Fork Power Sys- tem-Bonneville unit, Central Unit Project, report, 29 pp., Bur. of Reclam., Provo, Utah, 1981.
Haimson, B. C., Stress measurements in the Wasatch hinterland complement existing tectonic and seismic data, Eos Trans. AGU, 65, 1118-1119, 1984.
Haimson, B. C., Stress measurements at the Jordanelle Dam site, central Utah, using wireline hydrofracturing, final technical re- port, contract 14-08-0001-21890, 34 pp., U.S. Geol. Surv., Reston, Va., 1985.
Hardyman, R. F., E. B. Ekren, and F. M. Byers, Jr., Cenozoic strike-slip, normal, and detachment faults in northern part of Walker Lane, west-central Nevada, Geol. Soc. Am. Abstr. Pro- grams, 7, 1100, 1975.
Harmsen, S. C., and A.M. Rogers, inferences about the local stress field from focal mechanisms: Applications to earthquakes in the southern Great Basin of Nevada, Bull. Seismol. Soc. Am., 76, 1560-1572, 1986.
Hubbert, M. K., and D. G. Willis, Mechanics of hydraulic fractur- ing, J. Petrol. Technol., 9, 153-168, 1957.
Julander, D. R., Seismicity and correlation with fine structure in the Sevier Valley area of the Basin and Range-Colorado Plateau transition, southcentral Utah, M.S. thesis, 142 pp., Univ. of Utah, Salt Lake City, 1983.
Keys, W. S., Borehole geophysics in igneous and metamorphic rocks, in 20th Annual Symposium, pp. OO1-OO26, Society of Professional Well Log Analysts, Houston, Tex., 1979.
Keys, W. S., The application of the acoustic televiewer to the characterization of hydraulic fractures in geothermal wells, Raft River Well Stimulation Experiments, DOERep. DOE/ALl 10563-T7, pp. A1-A11, Dep. of Energy, Washington, D.C., 1980.
Lipman, P. W., Cenozoic volcanism in the western United States: implications for continental tectonics, in Continental Tectonics, pp. 161-174, National Research Council, Washington, D.C., 1980.
Lubetkin, L. K. C., and M. M. Clark, Late Quaternary activity
along the Lone Pine fault, eastern California, Geol. Soc. Am. Bull., 100, 755-766, 1988.
McGarr, A., Analysis of states of stress between provinces of constant stress, J. Geophys. Res., 87, 9279-9288, 1982.
McKenzie, D. P., The relationship between fault plane solutions for earthquakes and the directions of the principal stresses, Bull. Seismol. Soc. Am., 59, 591-601, 1969.
Michael, A. J., Determination of stress from slip data: Faults and folds, J. Geophys. Res., 89, 11,517-11,526, 1984.
Michael, A. J., The use of focal mechanisms to determine stress: A control study, J. Geophys. Res., 92, 357-368, 1987.
Nakata, J. K., C. M. Wentworth, and M. N. Machette, Quaternary fault map of the Basin and Range and Rio Grande provinces, western United States--1978, U.S. Geol. Surv. Open File Rep., 82-579, 1982.
Parry, W. T., and R. L. Bruhn, Pore fluid and seismogenic charac- teristics of fault rock at depth on the Wasatch fault, Utah, J. Geophys. Res., 91,730-744, 1986.
Pavlis, T. L., and R. B. Smith, Slip vectors on faults near Salt Lake City, Utah from Quaternary displacements and seismicity, Bull. Seismol. Soc. Am., 70, 1521-1526, 1980.
Plumb, R. A., and S. H. Hickman, Stress-induced borehole elonga- tion: A comparison between the four-arm dipmeter and the borehole televiewer in the Auburn geothermal well, J. Geophys. Res., 90, 5513-5521, 1985.
Reches, Z., Determination of the Tectonic stress tensor from slip along faults that obey the Coulomb yield condition, Tectonics, 6, 849-861, 1987.
Rogers, A.M., S.S. Harmsen, W. J. Carr, and W. Spence, Southern Great Basin seismological data report for 1981 and preliminary data analysis, U.S. Geol. Surv. Open File Rep., 83-699, 240 pp., 1983
Ryall, A., D. B. Slemmons, and L. D. Gedney, Seismicity, tecto- nism, and surface faulting in the western United States during historic time, Bull. Seismol. Soc. Am., 56, 1105-1135, 1966.
Savage, J. C., and R. S. Cockerham, Earthquake swarm in Long Valley caldera, California, January 1983: Evidence for dike infla- tion, J. Geophys. Res., 89, 8315-8324, 1984.
Savage, J. C., and M. Lisowski, Deformation in the White Mountain seismic gap, California, 1972-1982, J. Geophys. Res., 89, 7671- 7687, 1984.
Schwartz, D. P., and K. J. Coppersmith, Fault behavior and characteristic earthquakes: Examples from the Wasatch and San Andreas fault zones, J. Geophys. Res., 89, 5681-5698, 1984.
Scott, W. E., W. D. McCoy, R. R. Shroba, and M. Rubin, Reinterpretation of the exposed record of the last two cycles of Lake Bonneville, western United States, Quat. Res., 20,261-285, 1983.
Shenon, P. J., The Utah earthquake of March 12, 1934 (extracts from unpublished report), in United States Earthquakes, 1934, edited by F. Neumann, U.S. Coast Geod. Surv. Set., 593, 43-48, 1936.
Slemmons, D. B., D. Van Wormer, E. J. Bell, and M. L. Silberman, Recent crustal movements in the Sierra Nevada-Walker Lane
region of California-Nevada, part I, Rate and style of deforma- tion, Tectonophysics, 52,561-570, 1979.
Smith, R. B., and A. G. Lindh, A compilation of fault plane solutions of the western United States, Mere. Geol. Soc. Am., 152, 107-109, 1978.
Smith, R. B., W. C. Nagy, K. A. Julander, J. J. Viveiros, C. A. Barker, W. W. Bashore, and D. G. Gants, Geophysical and tectonic framework of the eastern Basin Range-Colorado Pla- teau-Rocky Mountain transition, Geophysical Framework of the Continental United States, edited by L. C. Pakiser and W. Mooney, Mere. Geol. Soc. Am., in press, 1989.
Speed, R. C., and A. H. Cogbill, Candelaria and other left-oblique slip faults of the Candelaria region, Nevada, Geol. Soc. Am. Bull., 90, 149-163, 1979.
Springer, J. E., R. K. Thorpe, and H. L. McKague, Borehole elongation and it relation to tectonic stress at the Nevada Test Site, Rep. UCRL-53528, 43 pp., Lawrence Livermore Natl. Lab., Livermore, Calif., 1984.
Stewart, J. H., Basin-range structure in western North America, a review, Mere. Geol. Soc. Am., 152, 1-13, 1978.
Stewart, J. H., Tectonics of the Walker Lane belt, western Great Basin--Mesozoic and Cenozoic deformation in a zone of shear, in
7128 ZOBACK: NORTHERN BASIN AND RANGE STRESS AND MODERN DEFORMATION
Metamorphism and Crustal Evolution of the Western United States, Rubey, vol. VII, pp. 683-713, Prentice-Hall, Englewood Cliffs, N. J., 1988.
Stock, J. M., and J. H. Healy, Stress field at Yucca Mountain, Nevada, U.S. Geol. Surv. Bull., 1790, 87-93, 1988.
Stock, J. M., J. Healy, and J. Svitek, Hydraulic fracturing stress measurements at Yucca Mountain, Nevada, and relationship to the regional stress field, J. Geophys. Res., 90, 8691-8706, 1985.
Swan, F. H., III, D. P. Schwartz, and L. S. Cluff, Recurrence of moderate to large magnitude earthquakes produced by surface faulting on the Wasatch fault, Utah, Bull. Seismol. $oc. Am., 70, 1431-1462, 1980.
Thompson, G. A., and D. B. Burke, Rate and direction of spreading in Dixie Valley, Basin and Range province, Nevada, Geol. $oc. Am. Bull., 84, 627-632, 1973.
Vetter, U. R., and A. S. Ryall, Systematic change of focal mecha- nisms with depth in western Great Basin, J. Geophys. Res., 88, 8237-8250, 1983.
Wallace, R. E., Map of young fault scarps related to earthquakes in north-central Nevada, U.S. Geol. Surv. Open File Rep., 79-1554, 1979.
Wallace, R. E., Fault scarps formed during the earthquakes of October 2, 1915, Pleasant Valley, Nevada and some tectonic implications, U.S. Geol. Surv. Prof. Pap., 1274A, 33 pp., 1984.
Wallace, R. E., and R. A. Whitney, Late Quaternary history of the Stillwater seismic gap, Nevada, Bull. Seismol. Soc. Am., 74, 301-314, 1984.
Wright, L., Late Cenozoic fault patterns and stress fields in the Great Basin and westward displacement of the Sierra Nevada block, Geology, 4,489-494, 1976.
Zoback, M.D., and J. H. Healy, Friction, faulting, and in-situ stress, Ann. Geophys., 2,689-698, 1984.
Zoback, M.D., M. L. Zoback, J. Svitek, and R. Liechti, Hydraulic- fracturing stress measurements near the Wasatch fault, central Utah, Eos Trans. AGU, 62, 394, 1981.
Zoback, M.D., Moos, D., L. Mastin, and R. N. Anderson, Well bore breakouts and in situ stress, d. Geophys. Res., 90, 5523- 5530, 1985a.
Zoback, M.D., W. H. Prescott, and S. W. Krueger, Crustal deformation in southern New York: Possible evidence for lower crustal ductile strain localization, Nature, 317, 705-707, 1985b.
Zoback, M. L., Mid-Miocene rifling in north-central Nevada: A detailed study of late Cenozoic deformation in the northern Basin and Range, Ph.D. thesis, 247 pp., Stanford Univ., Stanford, Calif., 1978.
Zoback, M. L., Structure and Cenozoic tectonism along the Wa- satch fault zone, Utah, Mere. Geol. $oc. Am., 183, 3-27, 1983.
Zoback, M. L., and S. Beanland, Temporal variations in stress magnitude and style of faulting along the Sierran frontal fault system, Geol. $oc. Am. Abstr. Programs, 18, 801, 1986.
Zoback, M. L., and G. A. Thompson, Basin and Range rifling in northern Nevada: Clues from a mid-Miocene riff and its subse-
quent offsets, Geology, 6, 111-116, 1978. Zoback, M. L., and M.D. Zoback, State of stress in the contermi-
nous United States, 2. Geophys. Res., 85, 6113-6156, 1980. Zoback, M. L., R. E. Anderson, and G. A. Thompson, Cenozoic
evolution of the state of stress and style of tectonism in the western United States, Philos. Trans. R. $oc. London, Set. A, 300, 407-434, 1981.
M. L. Zoback, Branch of Seismology, U.S. Geological Survey, 345 Middlefield Road, MS 977, Menlo Park, CA 94025.
(Received April 20, 1988; revised January 27, 1989;
accepted February 1, 1989.)