Stark broadening for simultaneous diagnostics of the electron density and temperature in atmospheric...
11
Stark broadening for simultaneous diagnostics of the electron density and temperature in atmospheric microwave discharges J. Torres a , M.J. van de Sande b , J.J.A.M. van der Mullen a,c , A. Gamero a , A. Sola a, * a Departamento de Fı ´sica, Universidad de Co ´rdoba, Campus Universitario de Rabanales (ed. C2), E-14071 Co ´rdoba, Spain b Philips CFT, P.O. Box 218 5600 MD Eindhoven, The Netherlands c Department of Applied Physics, Eindhoven University of Technology, P.O. Box 513 5600 MD Eindhoven, The Netherlands Received 5 July 2005; accepted 27 November 2005 Available online 18 January 2006 Abstract In this paper we delimitate the use of the Stark broadening of lines spontaneously emitted by atmospheric-pressure plasmas as an indirect method to determine both the electron density and temperature in discharges produced by microwaves. This method, previously presented in a recent paper (J. Torres et al., J. Phys. D: Appl. Phys. 36 (2003), L55-59), allows us to obtain experimental results for these two parameters in argon discharges in good agreement with other experimental results previously reported. The possibility of extending its use to a plasmogenic gas other than argon is discussed, and the limitations of the method are pointed out. D 2005 Elsevier B.V. All rights reserved. Keywords: Stark broadening; High-pressure discharge diagnostics; Electron density and temperature diagnostics; Microwave discharges 1. Introduction Among the different aspects concerning Plasma Physics, one of the most important deals with the possibility of obtaining information about the principal characteristics in the discharge. The knowledge of its relevant magnitude or parameter values is achieved by means of experimental methods or techniques as well as by any other available tools (namely computational models). This field of Plasma Physics, which receives the wide denomination of Plasma Diagnostic, was developed from the beginning of the plasma studies together with the Plasma Theory. Optionally, the methods of Plasma Diagnosis can be organized in Electric and Magnetic Probes (static or dynamic, simple or double) methods, Electromagnetic (propagating, interferometric, resonant and polarizing) methods, and Optical and Spectroscopic methods (mass spectroscopy included). A much updated review on these methods can be found in [1]. 1.1. Direct and indirect techniques in Spectroscopic Plasma Diagnostics (SPD) Particularly, in Spectroscopic Plasma Diagnostics (SPD), direct methods or techniques determine the electron density, n e , and the electron temperature, T e , in plasmas without needing any hypothesis about the type and degree of equilibrium existing in the discharge. On the contrary, indirect methods or techniques base their determination on hypotheses concerning the particles that constitute the plasma, namely some specific distributions for their different ionization and/or excitation stages/states, as well as the distribution of the radiation involved in these mechanisms [2,3]. Some qualitative differences affecting these two groups of diagnostic techniques or methods can be pointed out in terms of advantages and disadvantages. The advantages of the first group of (direct) techniques versus the second group (indirect ones) in SPD are quite evident. Except for a few occasions, the distributions invoked above (i.e. distributions of translational, excitation, ionization and radiation states) are not known accurately enough or are only partially known, which could invalidate their use. As examples, the well-known Boltzmann- plot method to determine the excitation temperature, T exc , for 0584-8547/$ - see front matter D 2005 Elsevier B.V. All rights reserved. doi:10.1016/j.sab.2005.11.002 * Corresponding author. E-mail address: [email protected] (A. Sola). Spectrochimica Acta Part B 61 (2006) 58 – 68 www.elsevier.com/locate/sab
-
Upload
independent -
Category
Documents
-
view
4 -
download
0
Transcript of Stark broadening for simultaneous diagnostics of the electron density and temperature in atmospheric...
w.elsevier.com/locate/sab
Spectrochimica Acta Part B
Stark broadening for simultaneous diagnostics of the electron density and
temperature in atmospheric microwave discharges
J. Torres a, M.J. van de Sande b, J.J.A.M. van der Mullen a,c, A. Gamero a, A. Sola a,*
a Departamento de Fısica, Universidad de Cordoba, Campus Universitario de Rabanales (ed. C2), E-14071 Cordoba, Spainb Philips CFT, P.O. Box 218 5600 MD Eindhoven, The Netherlands
c Department of Applied Physics, Eindhoven University of Technology, P.O. Box 513 5600 MD Eindhoven, The Netherlands
Received 5 July 2005; accepted 27 November 2005
Available online 18 January 2006
Abstract
In this paper we delimitate the use of the Stark broadening of lines spontaneously emitted by atmospheric-pressure plasmas as an indirect
method to determine both the electron density and temperature in discharges produced by microwaves. This method, previously presented in a
recent paper (J. Torres et al., J. Phys. D: Appl. Phys. 36 (2003), L55-59), allows us to obtain experimental results for these two parameters in argon
discharges in good agreement with other experimental results previously reported. The possibility of extending its use to a plasmogenic gas other
than argon is discussed, and the limitations of the method are pointed out.
D 2005 Elsevier B.V. All rights reserved.
Keywords: Stark broadening; High-pressure discharge diagnostics; Electron density and temperature diagnostics; Microwave discharges
1. Introduction
Among the different aspects concerning Plasma Physics,
one of the most important deals with the possibility of
obtaining information about the principal characteristics in
the discharge. The knowledge of its relevant magnitude or
parameter values is achieved by means of experimental
methods or techniques as well as by any other available tools
(namely computational models). This field of Plasma Physics,
which receives the wide denomination of Plasma Diagnostic,
was developed from the beginning of the plasma studies
together with the Plasma Theory. Optionally, the methods of
Plasma Diagnosis can be organized in Electric and Magnetic
Probes (static or dynamic, simple or double) methods,
Electromagnetic (propagating, interferometric, resonant and
polarizing) methods, and Optical and Spectroscopic methods
(mass spectroscopy included). A much updated review on these
methods can be found in [1].
0584-8547/$ - see front matter D 2005 Elsevier B.V. All rights reserved.
doi:10.1016/j.sab.2005.11.002
* Corresponding author.
E-mail address: [email protected] (A. Sola).
1.1. Direct and indirect techniques in Spectroscopic Plasma
Diagnostics (SPD)
Particularly, in Spectroscopic Plasma Diagnostics (SPD),
direct methods or techniques determine the electron density, ne,
and the electron temperature, Te, in plasmas without needing
any hypothesis about the type and degree of equilibrium
existing in the discharge. On the contrary, indirect methods or
techniques base their determination on hypotheses concerning
the particles that constitute the plasma, namely some specific
distributions for their different ionization and/or excitation
stages/states, as well as the distribution of the radiation
involved in these mechanisms [2,3].
Some qualitative differences affecting these two groups of
diagnostic techniques or methods can be pointed out in terms
of advantages and disadvantages. The advantages of the first
group of (direct) techniques versus the second group (indirect
ones) in SPD are quite evident. Except for a few occasions, the
distributions invoked above (i.e. distributions of translational,
excitation, ionization and radiation states) are not known
accurately enough or are only partially known, which could
invalidate their use. As examples, the well-known Boltzmann-
plot method to determine the excitation temperature, Texc, for
61 (2006) 58 – 68
ww
J. Torres et al. / Spectrochimica Acta Part B 61 (2006) 58–68 59
the excitation balance among atomic levels of the species in the
plasma, or the Saha-jump method to determine the ionization
temperature, Tion, for the ionization-recombination balance.
Both temperatures permit an estimation of the electron
temperature, Te, in the discharge and the use of these methods
requires the plasma to be close enough to the so-called Local
Thermodynamic Equilibrium (LTE). In this situation, proper
balances between microscopic processes at the same temper-
ature are guaranteed by the detailed balance principle. Also, the
method of molecular species rotational bands to determine the
so-called rotational temperature, Trot, (which is identified with
the heavy particle or gas temperature, Th or Tgas) implies a
certain special type of molecular excited state distribution as a
consequence of a particular excitation balance. And so do other
indirect methods such as measurement of the continuum part of
the plasma spectrum (for instance, the line-to- continuum ratio
method). Moreover, the use of Collisional-Radiative Models
(CRM) as complementary indirect tools is useful to determine
the populations of species in the plasma and their temperatures.
On the other hand, spectroscopic diagnostic techniques in
SPD exist which do not need any previous knowledge about
any distribution of particles or radiation in the discharge, or any
other requirement about particular balances among them to
determine the magnitudes or parameters of interest, ne and Te.
In this paper, we deal with these two groups of techniques.
Particularly, for determining both the electron density and the
electron temperature–probably the two main parameters in the
plasma–in the same experiment (that here is to say simulta-
neously), we invoke here two methods: a) the Thomson
scattering, or scattering of light by free electrons in the plasma
(an active and direct technique) and (b) the Stark broadening
of lines spontaneously emitted by the plasma (a passive and
indirect technique), these phenomena being affected by both
the electron density and the electron temperature.
1.2. Thomson scattering versus Stark broadening
The spectroscopic diagnostics method for determining at
the same time ne and Te known as Thomson scattering (in
both its versions coherent or incoherent) is a quite expensive
method and of critical implementation. This method has
numerous experimental difficulties, although it provides some
enviable performances such as precision, accuracy and spatial
and temporal definition [4–6]. An interesting review on
Thomson scattering can be found in Ref [7]. In turn, the Stark
broadening of certain spectral lines spontaneously emitted by
the plasma allows the determination of the electron density in
a rapid and non-expensive way provided the electron
temperature is known, although this emission spectroscopic
technique deals with a line of sight and not a particular
location in the plasma.
The basis of the diagnostic method determining at the same
time ne and Te by Stark broadening rests on the idea of the
study of two or more lines broadened under the same work
conditions. The results of applying this method of diagnosis to
one particular case were previously presented in a recent paper
[8] although the first idea about that was raised earlier [9]. By
superposing the information obtained for such lines, it is
possible to determine not only ne, but also Te in the discharge,
which in the end is a diagnostic equivalent to Thomson
scattering. In fact, it is a first, rapid and approximated
estimation of these magnitudes that can be sufficient for a
large number of cases in which only a rough value of these
magnitudes is needed. So, advantages and disadvantages are
reasonably balanced in this discharge diagnostic method versus
the more complicated, expensive and slow Thomson scattering.
However, for some specific cases in which accuracy and
precision in the measurements is needed, Thomson Scattering
will prevail over Stark broadening for the simultaneous
determination of ne and Te. A wider consideration about this
point can be found in the Introduction paragraph of the
previously mentioned paper [8].
In gaseous high-pressure discharges, microwave discharges
have been used more and more because such discharges are
very reproducible and stable, of easy handling and low cost
in most cases. In this paper we shall study the experiments
performed on the discharge produced by a TIA (Torch a
Injection Axiale) device [10] using argon and helium at
2.45 GHz at moderated HF powers (300–1000 W) in order
to compare with the already studied discharge produced by a
surfatron launcher [11] (surface-wave discharge, SWD) in a
capillary plasma column of argon at low HF powers, typically
less than 100 W [8]. It should be noted that in this kind of
microwave discharge we have a two-temperature (2-T) plasma,
that is characteristic of a non-equilibrium situation. The heavy
particle (gas) temperature, Tgas, is much less than the electron
temperature, Te. Of course, it is also possible to try our
diagnostic method in high-pressure discharges other than
microwave ones. In this way, the simultaneous measuring of
ne and Te by Stark broadening of spectral lines is extended to a
wider range of work conditions. This alternative direct method
presents not only advantages and disadvantages versus the
Thomson scattering, but also important limitations in its use
that will be pointed out and discussed.
Prior to the description of the experiments, we briefly
review the theories of the Stark broadening in the next section.
After that, we present the experimental aspects of the work
(setup and data treatment), the results and discussion for argon
and helium TIA discharges, and finally the conclusions.
2. Brief review on the Stark broadening theories
The profile of an emission line spontaneously emitted by
plasmas is broadened by different broadening causes, mainly
natural, Doppler, collisional (Stark) broadening as well as by
the instrumental function of the apparatus [2]. The Stark
broadening has its basis on the Stark effect and is a
consequence of radiating atoms interacting with free electrons
and ions in the plasma, through electric fields that these
particles create. The interaction between an atom emitting
electromagnetic radiation and an external electric field was
discovered in 1913 by the German scientist Johannes Stark in
the course of experiments on Doppler Effect. The occurrence of
the Stark effect is inherent to plasmas, since radiating atoms in
J. Torres et al. / Spectrochimica Acta Part B 61 (2006) 58–6860
plasmas are always subjected to the electric fields of the
charged particles that constitute the plasma.
The first statistical approach to explain the phenomenon,
initially developed by Holtsmark [12], is a quasi-static theory.
This theory mainly pays attention to the interaction caused by
the ions, of a more intense effect than that provoked by the
electrons during the time in which the emission takes place.
Historically, different theories have been developed later to
explain this broadening mechanism quantitatively better. Such
theories took into account the influence of the static ions and
also of the electron collisions. Some of them have a semi-
empirical character and/or apply to some specific spectral lines.
As an example, this was the case for the Hh line of the
hydrogen Balmer series. At present, the most important models
for this line are the merely quasi-static approach due to Hill
[13,14], as well as later approaches that also keep in mind the
electron impact contribution to some extent, namely the GKS
theory [15], the Greig’s theory [16], and the VCS theory [17].
For a measured Stark broadening concerning a line emitted by
the plasma, the different theories explaining this broadening
mechanism provide us different values for the electron density neat a given electron temperature Te in the discharge. If those values
of ne are historically sorted in the theories that provide them, the
result is a list of decreasing values. That is to say, the theoretical
values are refined with each new theoretical contribution taking
into account more and more causes of perturbation. In effect, by
adding the perturbation effect of the plasma free electrons to the
quasi-static theory, less density of ions will be necessary to
produce the same effect (broadening) on the same profile shape.
More recent microfield model methods (MMM) take into
account the ionic dynamics, which has supposed a new correction
and improvement of the theoretical predictions comparedwith the
experimental data. As was expected, by considering that the ions
also move during the interaction time, the result obtained for the
ion density is even lower. In this work, we use the computational
simulation (CS) theory due to Gigosos et al. (orGig-Card theory,
[18,19]), which includes the more relevant processes in the
plasma and constitutes one of themore accurate approximations at
the moment. It becomes a method for calculating line shapes with
the scheme of MMM, but with the electric microfield more
correctly obtained from an ideal experiment [20]. In this approach
the calculations have beenmade for three of the hydrogen Balmer
series lines, namely Ha, Hh and Hg, and their analogous lines of
the Lyman series. This ion-dynamic correction has not the same
relevance for each particular line.
In short, the Gig-Card model is based on the computational
numerical simulation of the behavior of all the particles in the
plasma. The electric field created by the charged particles,
electrons and ions, perturbing the emission of a hydrogen atom
is obtained. The plasma is considered as a globally neutral,
homogeneous and isotropic system in thermal equilibrium.
Atoms, ions and electrons are moving (quasi-) randomly in the
plasma, with rectilinear and uniform velocities given by the
Maxwell-Boltzmann distribution. These particles move in a
Debye sphere centered in the emitter, this sphere size being
related to the average distance between electrons, which is
controlled by the electron density. Inside this sphere of electric
influence that surrounds the central (emitter) atom, the position
(impact parameter) and the velocity (related to the temperature)
of each particle with respect to the central hydrogen atom are
calculated at each instant. In this situation, the time-dependent
electric microfield EY
tð Þ is obtained and introduced in the
evolution quantum equations of the system. The evolution in
time of the system is controlled by the evolution operator U(t)
obeying the time-dependent Schrodinger equation
ihd
dtU tð Þ ¼ V tð ÞIU tð Þ; ð1Þ
where V tð Þ ¼ H0 þ EY
tð ÞIdY
tð Þ is the Hamiltonian operator
including both the structure of the undisturbed states, H0, and
the effect of the charged perturbers on the emitters through the
dipole-field interaction energy term. The dipole moment
operator of the emitter atom dY
tð Þ ¼ qRY
tð Þ contains all the
information dealing with the considered electronic transition.
The emission profile of a spectral line concerning this transition
is obtained by the Fourier transform [21]:
I xð Þ ¼ 1
pRe
Z V
0
dtIeixtbC tð Þ�average
¼ 1
pRe
Z V
0
dtIeixtTr dY
tð ÞIdY
0ð Þqqh i
; ð2Þ
with dY
tð Þ ¼ Uþ tð ÞIdY
0ð ÞIU tð Þ, where U(t) is the already
mentioned evolution operator and Tr is the trace operation
calculating the average of the autocorrelation function C tð Þ ¼dY
tð ÞIdY
0ð Þ over the possible quantum states (statistic ensemble)
characterized by the density (matrix) operator q. All the
equations are numerically solved for given intervals of time
by means of numerical discretizing techniques under the
conditions described in [18,19]. Finally, the computational
Gig-Card model provides full emission profiles and data
concerning the Stark broadening of the studied line for certain
concrete conditions of electron temperature, electron density,
and mass of the perturbing ions.
The common way to determine ne by Stark broadening is to
experimentally measure the broadening of a line, and by
knowing approximately the value of Te (usually thanks to some
other complementary method of plasma diagnostics), to obtain
the corresponding value of ne. It is not easy to know Te in the
discharge accurately and, as a consequence, the calculated
values for ne are also affected by uncertainty. To some extent,
the temperature is a free parameter in the conventional Stark
broadening diagnostic method, i.e. once its value is fixed, ne is
determined.
The broadening of different spectral lines depends differ-
ently on ne and Te. Generally, the experimental broadening of
different lines corresponds to slightly different electron
densities depending on an arbitrary fixed Te. However, we
shall show that is possible to obtain coherent results (same
electron density) using different Balmer lines, by varying the
free parameter (electron temperature). In this way, all the nevalues related to different broadenings of different spectral
lines coincide at a specific Te. Finally we get a diagnosis of
these magnitudes in the plasma simultaneously from these
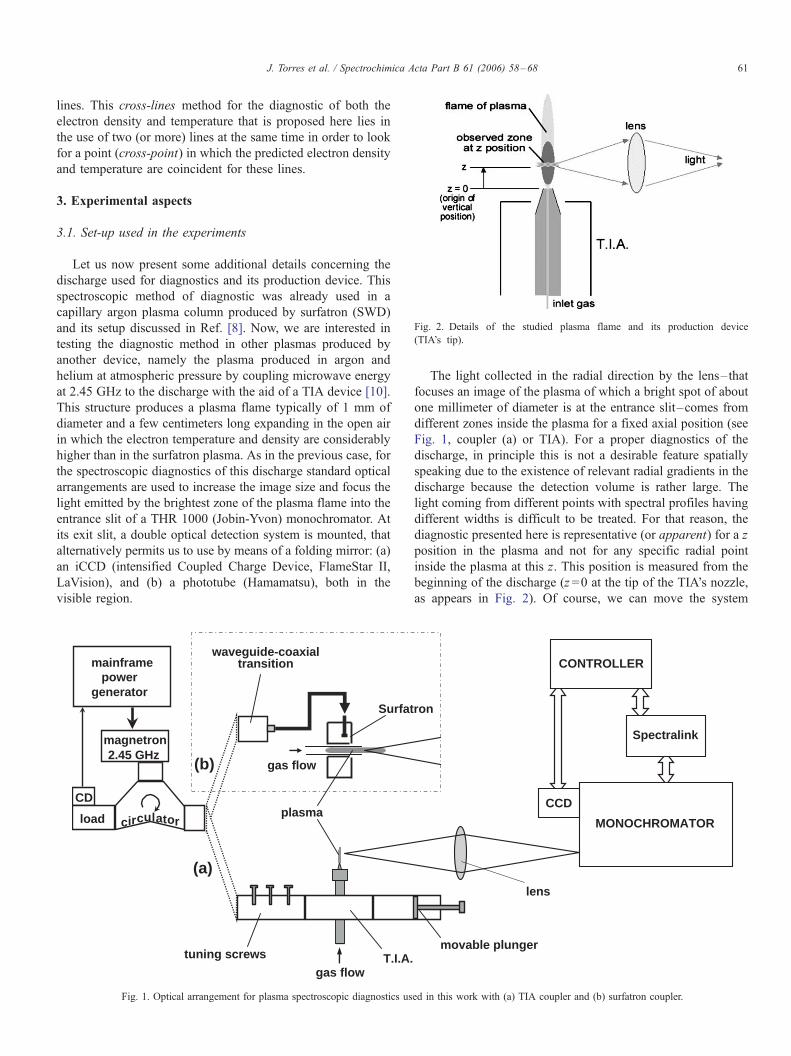
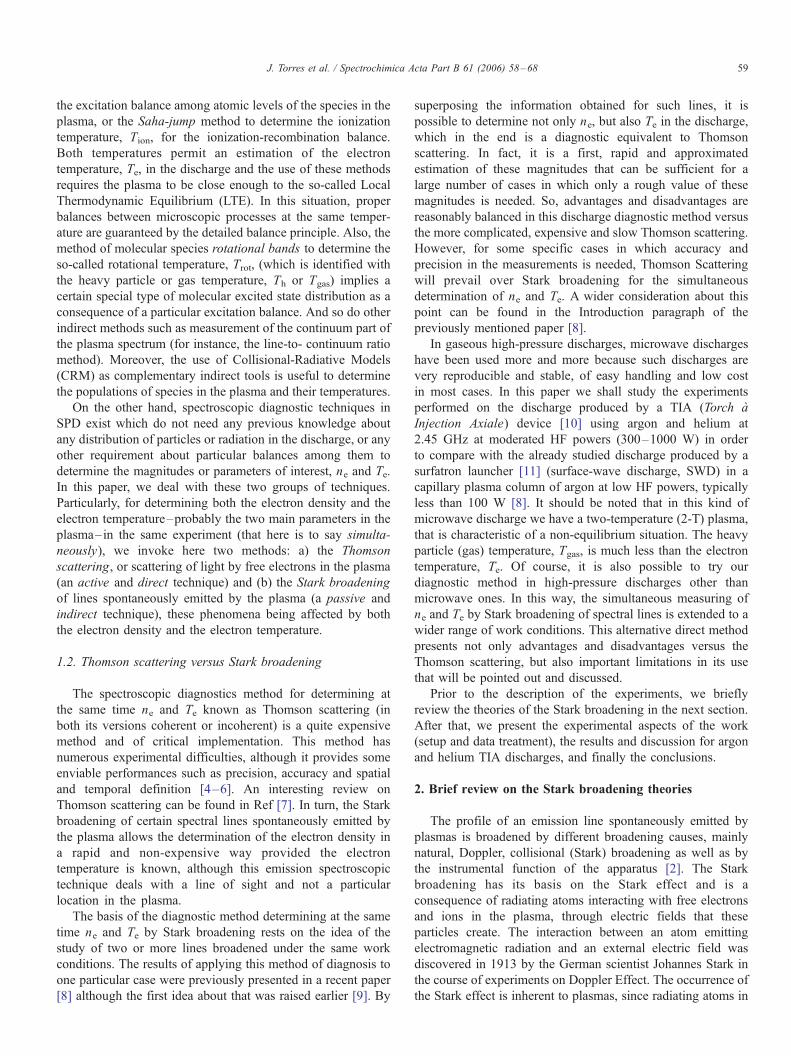
Fig. 2. Details of the studied plasma flame and its production device
(TIA’s tip).
J. Torres et al. / Spectrochimica Acta Part B 61 (2006) 58–68 61
lines. This cross-lines method for the diagnostic of both the
electron density and temperature that is proposed here lies in
the use of two (or more) lines at the same time in order to look
for a point (cross-point) in which the predicted electron density
and temperature are coincident for these lines.
3. Experimental aspects
3.1. Set-up used in the experiments
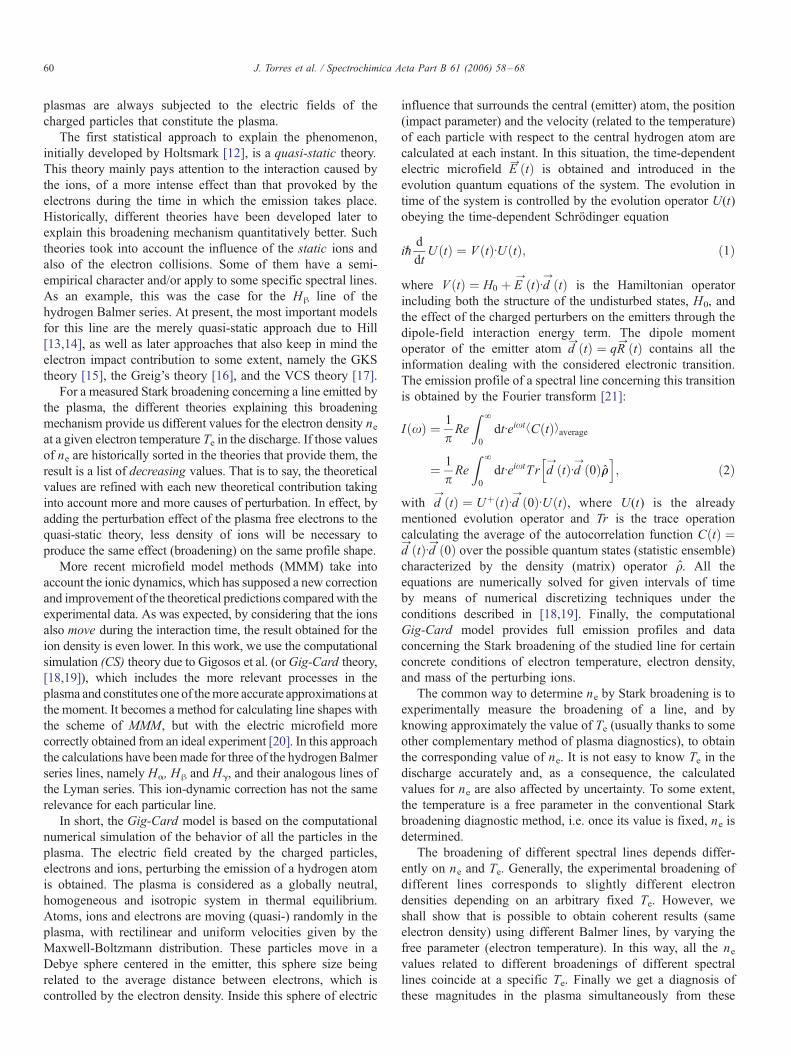
Let us now present some additional details concerning the
discharge used for diagnostics and its production device. This
spectroscopic method of diagnostic was already used in a
capillary argon plasma column produced by surfatron (SWD)
and its setup discussed in Ref. [8]. Now, we are interested in
testing the diagnostic method in other plasmas produced by
another device, namely the plasma produced in argon and
helium at atmospheric pressure by coupling microwave energy
at 2.45 GHz to the discharge with the aid of a TIA device [10].
This structure produces a plasma flame typically of 1 mm of
diameter and a few centimeters long expanding in the open air
in which the electron temperature and density are considerably
higher than in the surfatron plasma. As in the previous case, for
the spectroscopic diagnostics of this discharge standard optical
arrangements are used to increase the image size and focus the
light emitted by the brightest zone of the plasma flame into the
entrance slit of a THR 1000 (Jobin-Yvon) monochromator. At
its exit slit, a double optical detection system is mounted, that
alternatively permits us to use by means of a folding mirror: (a)
an iCCD (intensified Coupled Charge Device, FlameStar II,
LaVision), and (b) a phototube (Hamamatsu), both in the
visible region.
swercsgninut
wolf sag
daol
nortengamzHG 54.2
DC
circulator
emarfniamrewop
rotareneg
.A.I.T
wolf sag
tafruS
laixaoc-ediugevawnoitisnart
(a)
(b)
amsalp
Fig. 1. Optical arrangement for plasma spectroscopic diagnostics us
The light collected in the radial direction by the lens–that
focuses an image of the plasma of which a bright spot of about
one millimeter of diameter is at the entrance slit–comes from
different zones inside the plasma for a fixed axial position (see
Fig. 1, coupler (a) or TIA). For a proper diagnostics of the
discharge, in principle this is not a desirable feature spatially
speaking due to the existence of relevant radial gradients in the
discharge because the detection volume is rather large. The
light coming from different points with spectral profiles having
different widths is difficult to be treated. For that reason, the
diagnostic presented here is representative (or apparent) for a z
position in the plasma and not for any specific radial point
inside the plasma at this z. This position is measured from the
beginning of the discharge (z =0 at the tip of the TIA’s nozzle,
as appears in Fig. 2). Of course, we can move the system
regnulpelbavom
ROTAMORHCONOM
RELLORTNOC
knilartcepS
snel
DCC
nor
ed in this work with (a) TIA coupler and (b) surfatron coupler.
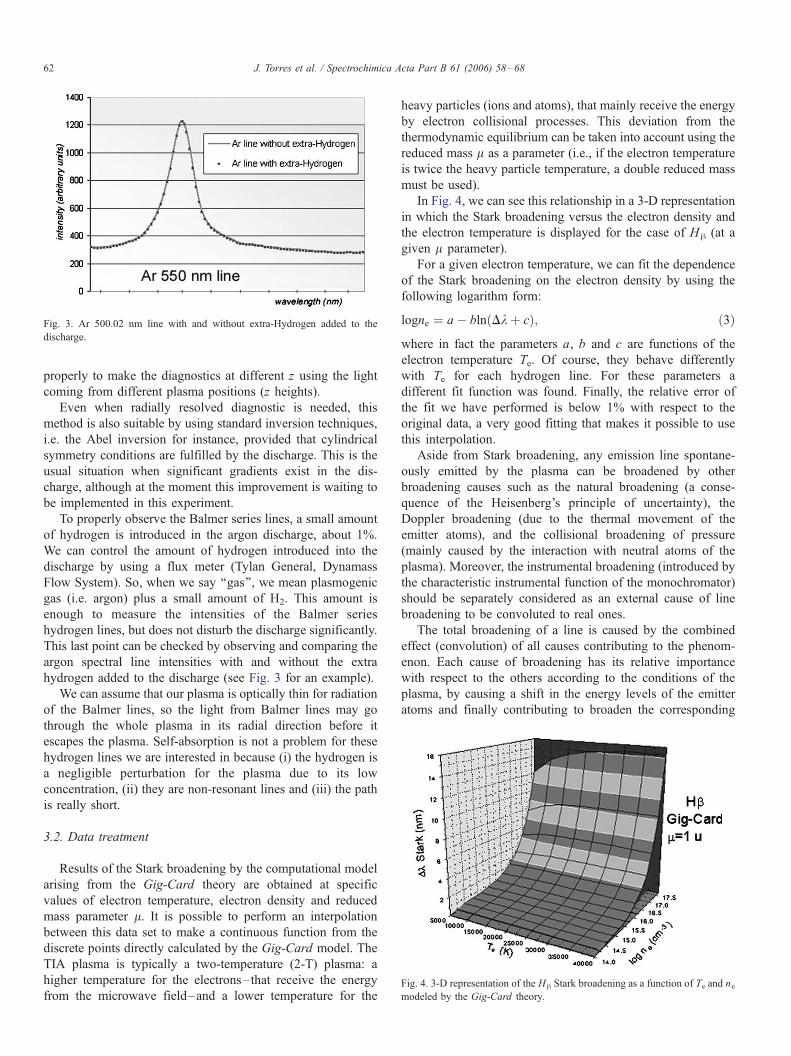
Fig. 3. Ar 500.02 nm line with and without extra-Hydrogen added to the
discharge.
Fig. 4. 3-D representation of the Hh Stark broadening as a function of Te and nemodeled by the Gig-Card theory.
J. Torres et al. / Spectrochimica Acta Part B 61 (2006) 58–6862
properly to make the diagnostics at different z using the light
coming from different plasma positions (z heights).
Even when radially resolved diagnostic is needed, this
method is also suitable by using standard inversion techniques,
i.e. the Abel inversion for instance, provided that cylindrical
symmetry conditions are fulfilled by the discharge. This is the
usual situation when significant gradients exist in the dis-
charge, although at the moment this improvement is waiting to
be implemented in this experiment.
To properly observe the Balmer series lines, a small amount
of hydrogen is introduced in the argon discharge, about 1%.
We can control the amount of hydrogen introduced into the
discharge by using a flux meter (Tylan General, Dynamass
Flow System). So, when we say ‘‘gas’’, we mean plasmogenic
gas (i.e. argon) plus a small amount of H2. This amount is
enough to measure the intensities of the Balmer series
hydrogen lines, but does not disturb the discharge significantly.
This last point can be checked by observing and comparing the
argon spectral line intensities with and without the extra
hydrogen added to the discharge (see Fig. 3 for an example).
We can assume that our plasma is optically thin for radiation
of the Balmer lines, so the light from Balmer lines may go
through the whole plasma in its radial direction before it
escapes the plasma. Self-absorption is not a problem for these
hydrogen lines we are interested in because (i) the hydrogen is
a negligible perturbation for the plasma due to its low
concentration, (ii) they are non-resonant lines and (iii) the path
is really short.
3.2. Data treatment
Results of the Stark broadening by the computational model
arising from the Gig-Card theory are obtained at specific
values of electron temperature, electron density and reduced
mass parameter l. It is possible to perform an interpolation
between this data set to make a continuous function from the
discrete points directly calculated by the Gig-Card model. The
TIA plasma is typically a two-temperature (2-T) plasma: a
higher temperature for the electrons–that receive the energy
from the microwave field–and a lower temperature for the
heavy particles (ions and atoms), that mainly receive the energy
by electron collisional processes. This deviation from the
thermodynamic equilibrium can be taken into account using the
reduced mass l as a parameter (i.e., if the electron temperature
is twice the heavy particle temperature, a double reduced mass
must be used).
In Fig. 4, we can see this relationship in a 3-D representation
in which the Stark broadening versus the electron density and
the electron temperature is displayed for the case of Hh (at a
given l parameter).
For a given electron temperature, we can fit the dependence
of the Stark broadening on the electron density by using the
following logarithm form:
logne ¼ a� bln Dk þ cð Þ; ð3Þ
where in fact the parameters a, b and c are functions of the
electron temperature Te. Of course, they behave differently
with Te for each hydrogen line. For these parameters a
different fit function was found. Finally, the relative error of
the fit we have performed is below 1% with respect to the
original data, a very good fitting that makes it possible to use
this interpolation.
Aside from Stark broadening, any emission line spontane-
ously emitted by the plasma can be broadened by other
broadening causes such as the natural broadening (a conse-
quence of the Heisenberg’s principle of uncertainty), the
Doppler broadening (due to the thermal movement of the
emitter atoms), and the collisional broadening of pressure
(mainly caused by the interaction with neutral atoms of the
plasma). Moreover, the instrumental broadening (introduced by
the characteristic instrumental function of the monochromator)
should be separately considered as an external cause of line
broadening to be convoluted to real ones.
The total broadening of a line is caused by the combined
effect (convolution) of all causes contributing to the phenom-
enon. Each cause of broadening has its relative importance
with respect to the others according to the conditions of the
plasma, by causing a shift in the energy levels of the emitter
atoms and finally contributing to broaden the corresponding
J. Torres et al. / Spectrochimica Acta Part B 61 (2006) 58–68 63
line profile to a greater or lesser extent. The information needed
for our purposes is the part of the broadening profile only
corresponding to the broadening caused by Stark effect. This
part will be obtained by separating (deconvolution) the Stark
broadening from the total broadened profile, for which the
knowledge of broadening profiles other than the Stark one is
needed. But, under our working conditions (plasma at
atmospheric pressure with a moderate electron density and
temperature), the only relevant sources of broadening are the
Stark (FWHM around 1–10�1 nm), the instrumental (FWHM
around 10�1–10�2 nm) and the Doppler broadening (FWHM
around 10�2 nm). The effects of other less important causes of
broadening are neglected in our case [22] (the pressure
broadening FWHM is below 10�3 nm, and the natural
broadening and the effect of Van der Waals’ dipolar forces,
the resonant broadening induced by emissions of other similar
atoms and the broadening by reabsorption are even minor).
As good approximation, these profiles are of typically
Gaussian or Lorentzian forms and the combined contribution of
all of them (convolution) is a Voigt profile. The most useful
parameter used to measure the line broadening independently
of its intensity is the full width at half-maximum (FWHM) or
simply half-width. For two Gaussian profiles whose convolu-
tion product is a Gaussian profile too, the total FWHM is
Dktotal2 =Dk1
2+Dk22; in turn, for two Lorentzian profiles whose
convolution product is a Lorentzian profile too, the total
FWHM is simply Dktotal =Dk1+Dk2. However, the half-width
of the Voigt profile as a result of the convolution product of
Gaussian and Lorentzian profiles does not have a simple
analytic form in terms of the original profile FWHMs in the
convolution, although the following approach is considered
valid with high precision [23]:
DkVoigt,DkLorentz
2
� �2
þ Dk2Gauss
" #1=2
þ DkLorentz2
: ð4Þ
This equation allows us to obtain for example the Ha Stark
broadening, which is supposed to be a Lorentzian profile,
provided that both the Doppler and the instrumental broad-
enings are known. For determining the Doppler broadening,
the following equation is used:
DkDoppler ¼ 7:16I10�7k0ITgas
Matom
� �1=2
nmð Þ; ð5Þ
where Tgas is given in Kelvin and Matom in atomic mass units,
and k0 in nm is the central wavelength of the studied line.
This gas temperature is necessary to correctly evaluate the
Doppler broadening and can be measured by means of
different techniques. Its value is known under our working
conditions by previous works although its effect is relatively
unimportant for the gas temperature range characteristic of the
discharge (around 2000–3000 K). The instrumental broaden-
ing, being measured with a laser using the same experimental
set-up conditions, is finally assumed to be Gaussian (the
experimental broadening value is around 20% relative to the
total broadening).
4. Results and discussion
The experiments have been carried out repeatedly with two
different plasmogenic gases, namely argon and helium. As it
has already been explained before, it has been necessary to
add a controlled quantity of hydrogen to the discharge to
make the used lines of the hydrogen Balmer series
sufficiently visible. The gas flow remained constant at a liter
per minute with the addition of 1% of hydrogen into the main
gas flow.
Two different positions in the discharge have been checked:
(a) at approximately one centimeter above the tip of the TIA’s
nozzle, and (b) just above this tip, in order to compare the
results spatially. Since a radial study of the lines emitted by the
plasma has not been carried out, the obtained measurements are
apparent radial averages of the whole plasma in that position—
an adjusted average in which higher Te zones in the plasma are
more important, because there the emission are higher too. Two
different microwave powers, 600 and 800 W, have been used in
the experiments too.
After repeatedly recording spectral profiles of Ha, Hh and
Hg lines under given experimental conditions (HF power and
position in the flame), the different broadening mechanisms
other than Stark broadening were eliminated from the total
experimental profiles by using simplified de-convolution,
where Gaussian profiles were assumed for the non-Stark
contributions (thermal Doppler and instrumental broadening).
By applying the Gig-Card theory to the Stark broadenings
determined by this way, concerning the different studied lines
of the hydrogen Balmer series, we have obtained tables of
values for the electron density as a function of the electron
temperature. As was explained previously, from these points
we have performed a fit in order to interpolate more points, to
produce an almost continuous line of points (a parametric
function of the electron density vs. the electron temperature,
where the parameter is the full-width at half-maximum,
FWHM, Stark broadening).
This has been possible for the three first Balmer series
lines used in our study, but some problems have arisen with
Hg. Due to its intensity being very low, we have had a very
high dispersion in the Stark broadening values of Hg (that is
because its profile is not sufficiently different from the
background signal of the spectrum). The different measure-
ments concerning this line were not reproducible and they did
not arise as a set of homogeneous broadening values but
rather as a set of different values. Due to this difficulty, at
best we are able to obtain not a crossing point among these
three Balmer series lines (which is the ideal situation) but
rather a triangular-shaped crossing zone. This crossing zone
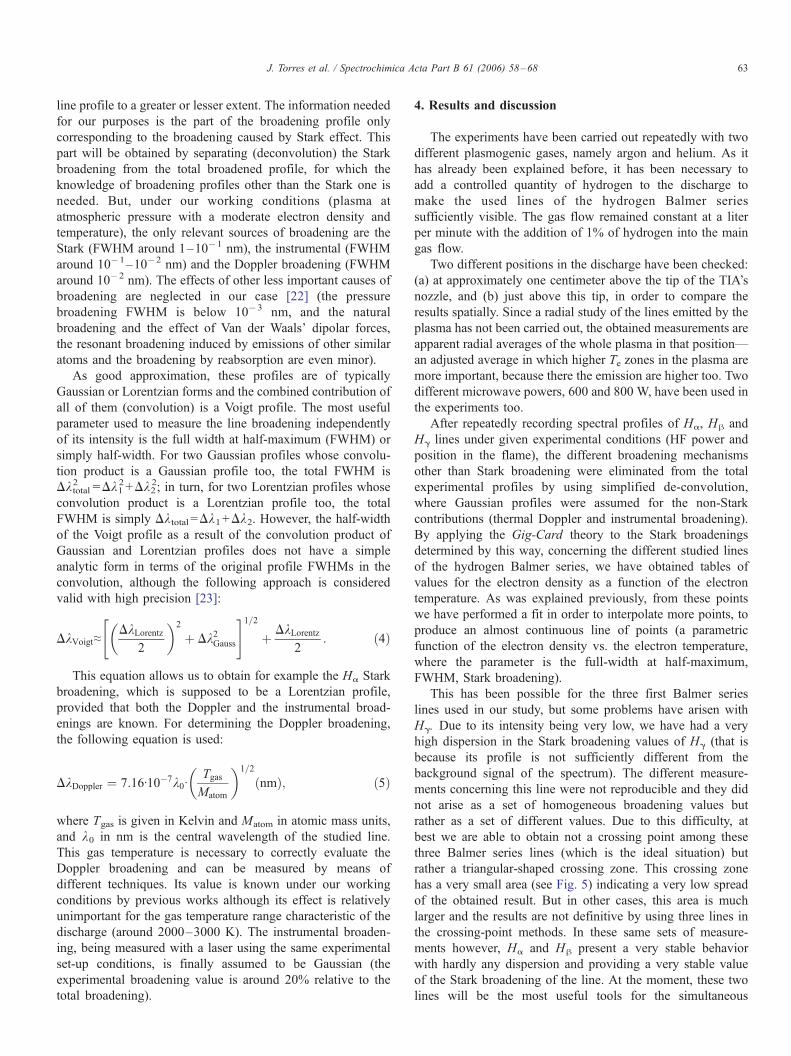
has a very small area (see Fig. 5) indicating a very low spread
of the obtained result. But in other cases, this area is much
larger and the results are not definitive by using three lines in
the crossing-point methods. In these same sets of measure-
ments however, Ha and Hh present a very stable behavior
with hardly any dispersion and providing a very stable value
of the Stark broadening of the line. At the moment, these two
lines will be the most useful tools for the simultaneous
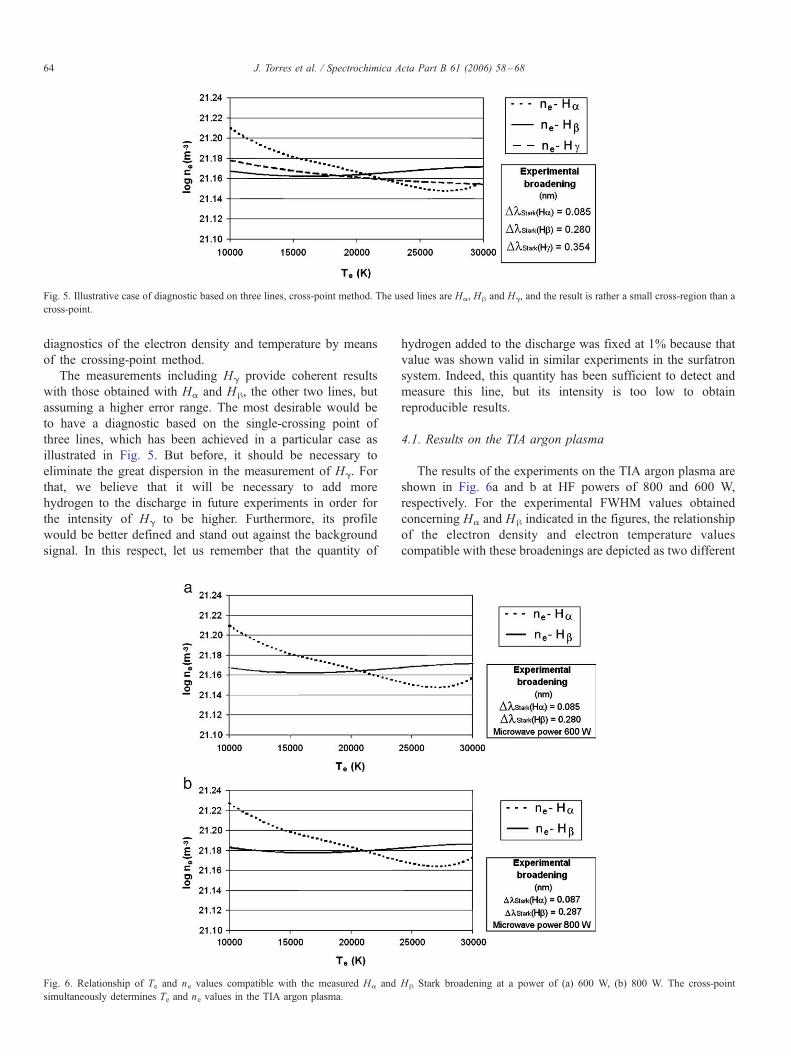
Fig. 5. Illustrative case of diagnostic based on three lines, cross-point method. The used lines are Ha, Hh and Hg, and the result is rather a small cross-region than a
cross-point.
J. Torres et al. / Spectrochimica Acta Part B 61 (2006) 58–6864
diagnostics of the electron density and temperature by means
of the crossing-point method.
The measurements including Hg provide coherent results
with those obtained with Ha and Hh, the other two lines, but
assuming a higher error range. The most desirable would be
to have a diagnostic based on the single-crossing point of
three lines, which has been achieved in a particular case as
illustrated in Fig. 5. But before, it should be necessary to
eliminate the great dispersion in the measurement of Hg. For
that, we believe that it will be necessary to add more
hydrogen to the discharge in future experiments in order for
the intensity of Hg to be higher. Furthermore, its profile
would be better defined and stand out against the background
signal. In this respect, let us remember that the quantity of
Fig. 6. Relationship of Te and ne values compatible with the measured Ha and
simultaneously determines Te and ne values in the TIA argon plasma.
hydrogen added to the discharge was fixed at 1% because that
value was shown valid in similar experiments in the surfatron
system. Indeed, this quantity has been sufficient to detect and
measure this line, but its intensity is too low to obtain
reproducible results.
4.1. Results on the TIA argon plasma
The results of the experiments on the TIA argon plasma are
shown in Fig. 6a and b at HF powers of 800 and 600 W,
respectively. For the experimental FWHM values obtained
concerning Ha and Hh indicated in the figures, the relationship
of the electron density and electron temperature values
compatible with these broadenings are depicted as two different
Hh Stark broadening at a power of (a) 600 W, (b) 800 W. The cross-point
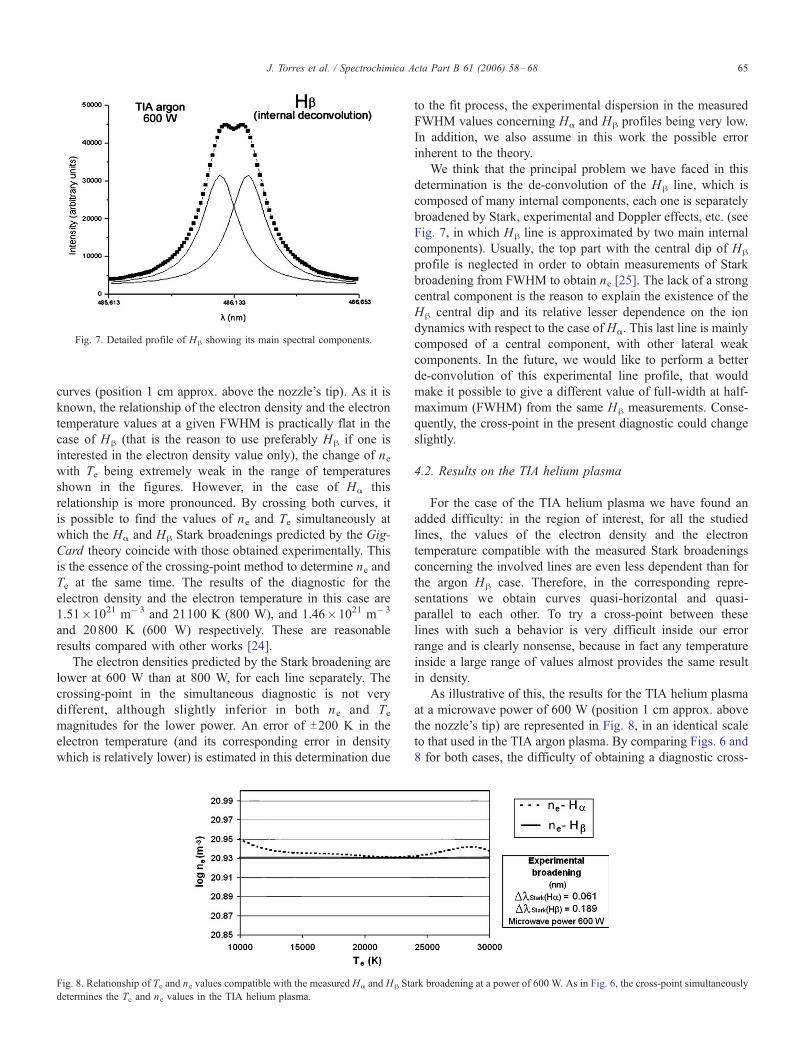
Fig. 7. Detailed profile of Hh showing its main spectral components.
J. Torres et al. / Spectrochimica Acta Part B 61 (2006) 58–68 65
curves (position 1 cm approx. above the nozzle’s tip). As it is
known, the relationship of the electron density and the electron
temperature values at a given FWHM is practically flat in the
case of Hh (that is the reason to use preferably Hh if one is
interested in the electron density value only), the change of newith Te being extremely weak in the range of temperatures
shown in the figures. However, in the case of Ha this
relationship is more pronounced. By crossing both curves, it
is possible to find the values of ne and Te simultaneously at
which the Ha and Hh Stark broadenings predicted by the Gig-
Card theory coincide with those obtained experimentally. This
is the essence of the crossing-point method to determine ne and
Te at the same time. The results of the diagnostic for the
electron density and the electron temperature in this case are
1.51�1021 m�3 and 21100 K (800 W), and 1.46�1021 m�3
and 20800 K (600 W) respectively. These are reasonable
results compared with other works [24].
The electron densities predicted by the Stark broadening are
lower at 600 W than at 800 W, for each line separately. The
crossing-point in the simultaneous diagnostic is not very
different, although slightly inferior in both ne and Temagnitudes for the lower power. An error of T200 K in the
electron temperature (and its corresponding error in density
which is relatively lower) is estimated in this determination due
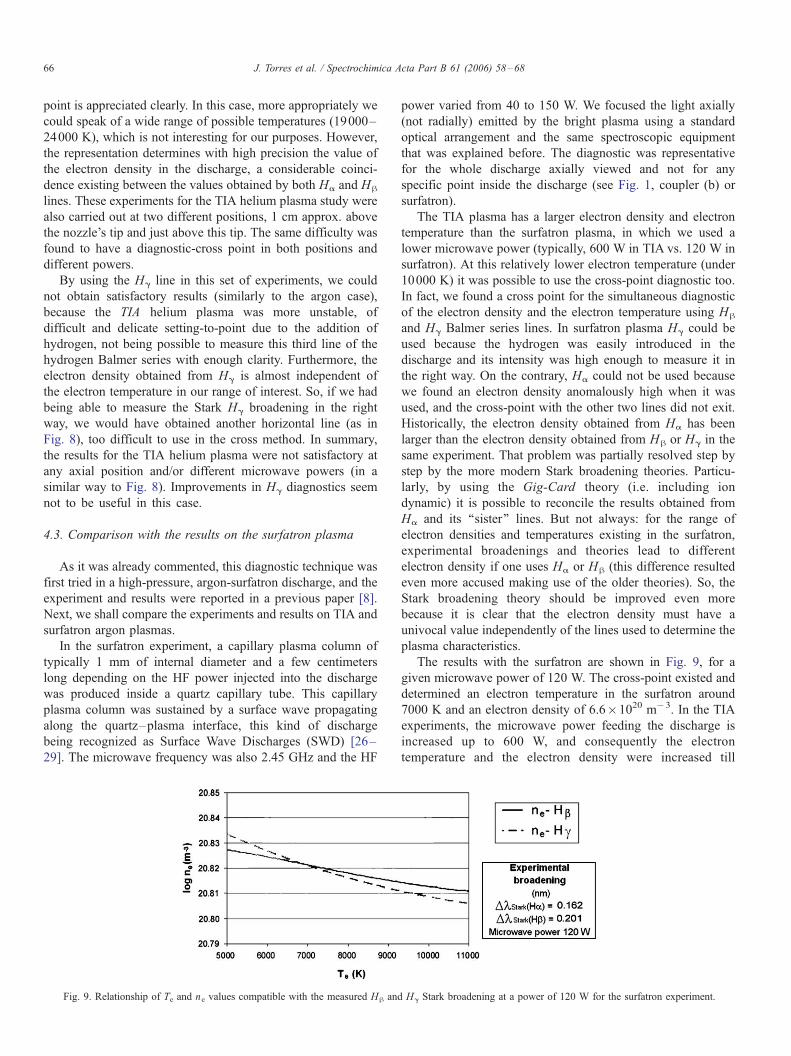
Fig. 8. Relationship of Te and ne values compatible with the measured Ha and Hh Sta
determines the Te and ne values in the TIA helium plasma.
to the fit process, the experimental dispersion in the measured
FWHM values concerning Ha and Hh profiles being very low.
In addition, we also assume in this work the possible error
inherent to the theory.
We think that the principal problem we have faced in this
determination is the de-convolution of the Hh line, which is
composed of many internal components, each one is separately
broadened by Stark, experimental and Doppler effects, etc. (see
Fig. 7, in which Hh line is approximated by two main internal
components). Usually, the top part with the central dip of Hh
profile is neglected in order to obtain measurements of Stark
broadening from FWHM to obtain ne [25]. The lack of a strong
central component is the reason to explain the existence of the
Hh central dip and its relative lesser dependence on the ion
dynamics with respect to the case of Ha. This last line is mainly
composed of a central component, with other lateral weak
components. In the future, we would like to perform a better
de-convolution of this experimental line profile, that would
make it possible to give a different value of full-width at half-
maximum (FWHM) from the same Hh measurements. Conse-
quently, the cross-point in the present diagnostic could change
slightly.
4.2. Results on the TIA helium plasma
For the case of the TIA helium plasma we have found an
added difficulty: in the region of interest, for all the studied
lines, the values of the electron density and the electron
temperature compatible with the measured Stark broadenings
concerning the involved lines are even less dependent than for
the argon Hh case. Therefore, in the corresponding repre-
sentations we obtain curves quasi-horizontal and quasi-
parallel to each other. To try a cross-point between these
lines with such a behavior is very difficult inside our error
range and is clearly nonsense, because in fact any temperature
inside a large range of values almost provides the same result
in density.
As illustrative of this, the results for the TIA helium plasma
at a microwave power of 600 W (position 1 cm approx. above
the nozzle’s tip) are represented in Fig. 8, in an identical scale
to that used in the TIA argon plasma. By comparing Figs. 6 and
8 for both cases, the difficulty of obtaining a diagnostic cross-
rk broadening at a power of 600 W. As in Fig. 6, the cross-point simultaneously
J. Torres et al. / Spectrochimica Acta Part B 61 (2006) 58–6866
point is appreciated clearly. In this case, more appropriately we
could speak of a wide range of possible temperatures (19000–
24000 K), which is not interesting for our purposes. However,
the representation determines with high precision the value of
the electron density in the discharge, a considerable coinci-
dence existing between the values obtained by both Ha and Hh
lines. These experiments for the TIA helium plasma study were
also carried out at two different positions, 1 cm approx. above
the nozzle’s tip and just above this tip. The same difficulty was
found to have a diagnostic-cross point in both positions and
different powers.
By using the Hg line in this set of experiments, we could
not obtain satisfactory results (similarly to the argon case),
because the TIA helium plasma was more unstable, of
difficult and delicate setting-to-point due to the addition of
hydrogen, not being possible to measure this third line of the
hydrogen Balmer series with enough clarity. Furthermore, the
electron density obtained from Hg is almost independent of
the electron temperature in our range of interest. So, if we had
being able to measure the Stark Hg broadening in the right
way, we would have obtained another horizontal line (as in
Fig. 8), too difficult to use in the cross method. In summary,
the results for the TIA helium plasma were not satisfactory at
any axial position and/or different microwave powers (in a
similar way to Fig. 8). Improvements in Hg diagnostics seem
not to be useful in this case.
4.3. Comparison with the results on the surfatron plasma
As it was already commented, this diagnostic technique was
first tried in a high-pressure, argon-surfatron discharge, and the
experiment and results were reported in a previous paper [8].
Next, we shall compare the experiments and results on TIA and
surfatron argon plasmas.
In the surfatron experiment, a capillary plasma column of
typically 1 mm of internal diameter and a few centimeters
long depending on the HF power injected into the discharge
was produced inside a quartz capillary tube. This capillary
plasma column was sustained by a surface wave propagating
along the quartz–plasma interface, this kind of discharge
being recognized as Surface Wave Discharges (SWD) [26–
29]. The microwave frequency was also 2.45 GHz and the HF
Fig. 9. Relationship of Te and ne values compatible with the measured Hh and
power varied from 40 to 150 W. We focused the light axially
(not radially) emitted by the bright plasma using a standard
optical arrangement and the same spectroscopic equipment
that was explained before. The diagnostic was representative
for the whole discharge axially viewed and not for any
specific point inside the discharge (see Fig. 1, coupler (b) or
surfatron).
The TIA plasma has a larger electron density and electron
temperature than the surfatron plasma, in which we used a
lower microwave power (typically, 600 W in TIA vs. 120 W in
surfatron). At this relatively lower electron temperature (under
10000 K) it was possible to use the cross-point diagnostic too.
In fact, we found a cross point for the simultaneous diagnostic
of the electron density and the electron temperature using Hh
and Hg Balmer series lines. In surfatron plasma Hg could be
used because the hydrogen was easily introduced in the
discharge and its intensity was high enough to measure it in
the right way. On the contrary, Ha could not be used because
we found an electron density anomalously high when it was
used, and the cross-point with the other two lines did not exit.
Historically, the electron density obtained from Ha has been
larger than the electron density obtained from Hh or Hg in the
same experiment. That problem was partially resolved step by
step by the more modern Stark broadening theories. Particu-
larly, by using the Gig-Card theory (i.e. including ion
dynamic) it is possible to reconcile the results obtained from
Ha and its ‘‘sister’’ lines. But not always: for the range of
electron densities and temperatures existing in the surfatron,
experimental broadenings and theories lead to different
electron density if one uses Ha or Hh (this difference resulted
even more accused making use of the older theories). So, the
Stark broadening theory should be improved even more
because it is clear that the electron density must have a
univocal value independently of the lines used to determine the
plasma characteristics.
The results with the surfatron are shown in Fig. 9, for a
given microwave power of 120 W. The cross-point existed and
determined an electron temperature in the surfatron around
7000 K and an electron density of 6.6�1020 m�3. In the TIA
experiments, the microwave power feeding the discharge is
increased up to 600 W, and consequently the electron
temperature and the electron density were increased till
Hg Stark broadening at a power of 120 W for the surfatron experiment.
J. Torres et al. / Spectrochimica Acta Part B 61 (2006) 58–68 67
20000 K and 1.4�1021 m�3, respectively. Although it is not
the main purpose of this experimental work, these results
indicate that the argon plasma produced by TIA is closer to the
local equilibrium than the produced by surfatron. This
comparison has not been possible with the TIA helium plasma
because this plasmogenic gas was not used with the surfatron:
the capillary quartz tube melted with helium and its study was
not possible.
5. Conclusions
We have studied an experimental method to diagnose both
the electron density and temperature simultaneously in a high-
pressure, microwave-excited plasma. Compared with other
direct methods of simultaneous diagnostics (Thomson scatter-
ing, for instance), this method is really simpler and low-cost,
spectroscopic tools are used. It is based on an easy idea and
there are no assumptions about the plasma equilibrium state
and/or the distribution of the species existing in it. By studying
simultaneously different spectral lines spontaneously emitted
by the plasma in terms of their Stark broadenings, we have
shown that it is possible to determine the two main magnitudes
in the discharge (the electron density and the electron
temperature) at the same time, according to the Stark
broadening theories existing in the bibliography, namely one
of the most recent (the Gig-Card theory). This theory takes the
ion dynamics into account, whereas previous theories do not,
and that fact affects and is reflected in the results.
The experiments have been carried out to diagnose two
different discharges, namely the TIA plasma and the surfatron
plasma, and have been satisfactory in both cases. The method
is suitable under different working conditions and the results
are consistent if they are compared with previous works,
although a further comparison of this method with Thomson
scattering should be made in the future. Hydrogen gas must be
present in the discharge in order to make the Stark broadening
of Balmer series lines intense enough. We have shown that the
necessary amount of hydrogen gas is very low (around 1% of
the main gas flux in the plasma discharge), and does not change
the plasma conditions drastically.
It would be desirable to use more than two lines in order to
gain coherence in the diagnostics, which could cause the
existence of a small cross-region instead of a unique cross-
point, but at the moment we have found some difficulties to
obtain this in every case. This is an evident improvement in
which we shall continue working on. In this article, it has been
shown that such a possibility has been successfully performed in
a particular case.
No other elements are so well studied as the Balmer series
of hydrogen lines with respect to the Stark broadening of lines
spontaneously emitted by plasmas. Therefore, the possibility of
using any other lines (isolated argon or helium lines, for
example) is discarded at present. So, we are restricted to
hydrogen lines, but here we could have a future possibility with
the ultraviolet Lyman series of hydrogen lines, namely the
analogous Lyman-Ha, -Hh and -Hg lines which are also well
modeled by the Gig-Card theory.
Acknowledgments
The authors acknowledge Dr. Marco A. Gigosos for
valuable discussion on Stark broadening modeling. The
Bilateral Collaboration Framework signed between the Tech-
nical University of Eindhoven (NL) and the University of
Cordoba (E) to develop common research in Plasma Physics is
acknowledged too. Also, the Spanish Ministry of Science and
Technology for partially supporting this research under grant/
project No PPQ2001-2537, as well as the III PAI (Government
of Andalusia, Spain) and the University of Cordoba for
supporting the Group FQM136.
References
[1] I.H. Hutchinson, Principles of Plasma Diagnostics, 2nd edR, Cambridge
University Press, Cambridge, UK, 2002.
[2] J.M. Mermet, Spectroscopic diagnostics: basic concepts, in: P.M.W.
Boumans (Ed.), Inductively Coupled Plasma Emission Spectrometry Part
II (Chap. X), Wiley-Interscience, Amsterdam, NL, 1987.
[3] A. Sola, Spectroscopic techniques for high-pressure microwave
plasma diagnostics, Recent Research Developments in Physics,
vol. 3, Transworld Research Network, Trivandrum, India, 2002,
pp. 269–285.
[4] J. Jonkers, L.J.M. Selen, J.A.M. van der Mullen, E.A.H. Timmermans,
D.C. Schram, Steep plasma gradients studied with spatial resolved
Thomson scattering measurements, Plasma Sources Sci. Technol. 6
(1997) 533–539.
[5] M.J. van de Sande, J.J.A.M. van der Mullen, Thomson scattering on a
low-pressure, inductively-coupled gas discharge lamp, J. Phys. D. Appl.
Phys. 35 (2002) 1381–1391.
[6] M. Huang, K. Warner, S. Lehn, G.M. Hieftje, A simple approach to
deriving an electron energy distribution from an incoherent Thomson
scattering spectrum, Spectrochim. Acta Part B 55 (2000) 1397–1410.
[7] M. Huang, G.M. Hieftje, Thomson scattering from an ICP, Spectrochim.
Acta Part B 40 (1985) 1387–1400.
[8] J. Torres, J. Jonkers, M.J. van de Sande, J.J.A.M. van der Mullen, A.
Gamero, A. Sola, An easy way to determine simultaneously the electron
density and temperature in high-pressure plasmas by using Stark
broadening, J. Phys. D. Appl. Phys. 36 (2003) L55–L59.
[9] A. Sola, A. Gamero, J. Cotrino, M. Saez, C. Lao, M.D. Calzada, M.C.
Quintero, J. Ballesteros ‘‘Simultaneous determination of the electron
density and temperature using Balmer lines Stark broadening in argon
microwave-induced-plasmas (MIP) at atmospheric pressure’’. XX
ICPIG (Barga, Italy July 5th–12th 1991). Book of Contributed Papers
1147–1148, ed. by V. Palleschi and M. Vaselli 1991 (Felice-Editore,
Pisa).
[10] M. Moisan, G. Sauve, Z. Zarkrzewski, J. Hubert, An atmospheric pressure
waveguide-fed microwave plasma torch: the TIA design, Plasma Sources
Sci. Technol. 3 (1994) 584.
[11] M. Moisan, Z. Zarkrzewski, R. Pantel, The theory and characteristics of an
efficient surface wave launcher (surfatron) producing long plasma
columns, J. Phys. D. Appl. Phys. 12 (1979) 219–237.
[12] J. Holtsmark, Uber die Verbreiterung von Spektrallinien, Ann. der Physik
58 (1919) 577–630.
[13] R.A. Hill, Tables of electron density as a function of the half-width of
Stark-broadened hydrogen lines, J. Quant. Spectrosc. Radiat. Transfer 4
(1964) 857–861.
[14] R.A. Hill, Fractional-intensity widths and Stark-broadening formulas for
the hydrogen Balmer lines, J. Quant. Spectrosc. Radiat. Transfer 7 (1967)
401–410.
[15] P. Kepple, H.R. Griem, Improved Stark Profile Calculations for the
Hydrogen lines H-alpha, H-beta, H-gamma and H-delta, Phys. Rev. 173
(1968) 317–325.
J. Torres et al. / Spectrochimica Acta Part B 61 (2006) 58–6868
[16] J.R. Greig, C. Lim, G.A. Moo-Youring, G. Palumpo, H.R. Griem,
Measurements of the stark broadening of two neutral helium lines in a
plasma, Phys. Rev. 172 (1968) 148–153.
[17] E.W. Smith, J. Cooper, C.R. Vidal, Unified classical-path treatment of
stark broadening plasmas, Phys. Rev. 185 (1969) 140–151.
[18] M.A. Gigosos, V. Cardenoso, New plasma diagnosis tables of hydrogen
Stark broadening including ion dynamics, J. Phys. B. At. Mol. Opt. Phys.
29 (1996) 4795–4838.
[19] M.A. Gigosos, M.A. Gonzalez, V. Cardenoso, Computer simulated
Balmer -alpha, -beta and -gamma Stark line profiles for non-equilibrium
plasmas diagnostics, Spectrochim. Acta Part B 58 (2003) 1489–1504.
[20] M.A. Gigosos, M.A. Gonzalez, Computer simulation of one- and two-
photon hydrogen Stark profiles, in: J. Seidel (Ed.), Invited Lecture in 15th
ICSLS, American Institute of Physics, Conference Proceeding, vol. 559,
Melville, New York, 2001, pp. 65–72.
[21] P.W. Anderson, Pressure broadening in the Microwave and Infra-Red
regions, Phys Rev. 76 (1949) 646–661.
[22] A. Ricard, ‘‘Spectroscopie des plasmas atomiques et ioniques’’ Labor-
atoire de Physique des Gaz et des Plasmas (Laboratoire associee au
CNRS) 1981 (Rapport interne L.P. no.186).
[23] M. Miller, in: A. Montaser, D.W. Golightly (Eds.), Inductively Coupled
Plasmas in Analytical Spectrometry, VCH, New York, 1987.
[24] J. Jonkers, J.M. de Regt, J.A.M. van der Mullen, H.P.C. Vos, F.P.J. de
Groote, E.A.H. Timmermans, On the electron temperature and densities in
plasmas produced by the FTorche a Injection Axiale_, Spectrochim. Acta
Part B 51 (1996) 1385–1392.
[25] R. Zikic, M.A. Gigosos, M. Ivkovic, M.A. Gonzalez, N. Konjevic, A
program for the evaluation of electron density from experimental hydrogen
Balmer beta line profiles, Spectrochim. Acta Part B 57 (2002) 987–998.
[26] M. Moisan, J. Pelletier, Microwave Excited Plasma, Elsevier, Amsterdam,
NL, 1992.
[27] M.D. Calzada, A. Rodero, A. Sola, A. Gamero, Excitation kinetic in an
argon plasma column produced by a surface wave at atmospheric pressure,
J. Phys. Soc. Jpn. 65 (1996) 948–954.
[28] M.C. Garcıa, A. Rodero, A. Sola, A. Gamero, Spectroscopy study of
a stationary surface-wave sustained argon plasma column at atmo-
spheric pressure, Spectrochim. Acta Part B 55 (2000) 1733–1745.
[29] M.C. Garcıa, A. Rodero, A. Sola, A. Gamero, Experimental study of the
creation of a surface-wave-sustained argon plasma column at atmo-
spheric pressure, Spectrochim. Acta Part B 57 (2002) 1727–1737.